As filed with the U.S. Securities and Exchange Commission on February 23, 2024
Securities Act File No. 33-19228
Investment Company Act File No. 811-05443

UNITED STATES
SECURITIES AND EXCHANGE COMMISSION
Washington, D.C. 20549
________________________
FORM N-1A
REGISTRATION STATEMENT
UNDER
THE SECURITIES ACT OF 1933
|
|
|
Post-Effective Amendment No. 150 |
|
☒ |
|
and/or
REGISTRATION STATEMENT
UNDER
|
|
|
THE INVESTMENT COMPANY ACT OF 1940 |
|
☒ |
|
Amendment No. 152
(Check appropriate box or boxes)
________________________
Calamos Investment Trust/IL
(Exact Name of Registrant as Specified in Charter)
________________________
2020 Calamos Court
Naperville, Illinois
(Address of Principal Executive Offices)
Registrant's Telephone Number, including Area Code: (630) 245-7200
John P. Calamos, Sr.
Calamos Advisors LLC
2020 Calamos Court
Naperville, Illinois 60563
(Name and Address of Agent for Service)
________________________
With Copies to:
Paulita A. Pike
Ropes & Gray LLP
191 North Wacker Drive, 32nd Floor
Chicago, Illinois 60606
Rita Rubin
Ropes & Gray LLP
191 North Wacker Drive, 32nd Floor
Chicago, Illinois 60606
________________________
Approximate Date of Proposed Public Offering: As soon as practicable following the effectiveness of the Registration Statement.
It is proposed that this filing will become effective:
☐ immediately upon filing pursuant to paragraph (b)
☒ on March 1, 2024 pursuant to paragraph (b)
☐ 60 days after filing pursuant to paragraph (a)(1)
☐ on pursuant to paragraph (a)(1)
☐ 75 days after filing pursuant to paragraph (a)(2)
☐ on pursuant to paragraph (a)(2) of Rule 485.
If appropriate, check the following box:
☐ This post-effective amendment designates a new effective date for a previously filed post-effective amendment.
Amending Parts A, B and C and filing exhibits.


|
|
|
CLASS A |
|
CLASS C |
|
CLASS I |
|
CLASS R6 |
|
|
Alternative |
|
|
Calamos Market Neutral Income Fund |
|
CVSIX |
|
CVSCX |
|
CMNIX |
|
CVSOX |
|
|
Calamos Hedged Equity Fund |
|
CAHEX |
|
CCHEX |
|
CIHEX |
|
|
|
|
Calamos Phineus Long/Short Fund |
|
CPLSX |
|
CPCLX |
|
CPLIX |
|
|
|
|
Calamos Merger Arbitrage Fund |
|
CMRAX |
|
CMRCX |
|
CMRGX |
|
|
|
|
Convertible |
|
|
Calamos Convertible Fund |
|
CCVIX |
|
CCVCX |
|
CICVX |
|
|
|
|
Calamos Global Convertible Fund |
|
CAGCX |
|
CCGCX |
|
CXGCX |
|
|
|
|
U.S. Equity |
|
|
Calamos Timpani Small Cap Growth Fund |
|
CTASX |
|
CTCSX |
|
CTSIX |
|
CTSOX |
|
|
Calamos Timpani SMID Growth Fund |
|
CTAGX |
|
|
|
CTIGX |
|
CTOGX |
|
|
Calamos Growth Fund |
|
CVGRX |
|
CVGCX |
|
CGRIX |
|
|
|
|
Calamos Growth and Income Fund |
|
CVTRX |
|
CVTCX |
|
CGIIX |
|
CGIOX |
|
|
Calamos Dividend Growth Fund |
|
CADVX |
|
CCDVX |
|
CIDVX |
|
|
|
|
Calamos Select Fund |
|
CVAAX |
|
CVACX |
|
CVAIX |
|
|
|
|
Global Equity |
|
|
Calamos International Growth Fund |
|
CIGRX |
|
CIGCX |
|
CIGIX |
|
CIGOX |
|
|
Calamos Evolving World Growth Fund |
|
CNWGX |
|
CNWDX |
|
CNWIX |
|
|
|
|
Calamos Global Equity Fund |
|
CAGEX |
|
CCGEX |
|
CIGEX |
|
CGEOX |
|
|
Calamos Global Opportunities Fund |
|
CVLOX |
|
CVLCX |
|
CGCIX |
|
|
|
|
Calamos International Small Cap Growth Fund |
|
CAISX |
|
CCISX |
|
CSGIX |
|
CISOX |
|
|
Fixed Income |
|
|
Calamos Total Return Bond Fund |
|
CTRAX |
|
CTRCX |
|
CTRIX |
|
|
|
|
Calamos High Income Opportunities Fund |
|
CHYDX |
|
CCHYX |
|
CIHYX |
|
|
|
|
Calamos Short-Term Bond Fund |
|
CSTBX |
|
|
|
CSTIX |
|
|
|
Prospectus March 1, 2024
The Securities and Exchange Commission has not approved or disapproved these securities or determined whether this prospectus is truthful or complete. Any representation to the contrary is a criminal offense.
|
The Funds
|
|
|
Alternative
|
|
Calamos Market Neutral Income
Fund
|
|
|
1
|
|
|
|
Calamos Hedged Equity Fund
|
|
|
8
|
|
|
|
Calamos Phineus Long/Short Fund
|
|
|
15
|
|
|
|
Calamos Merger Arbitrage Fund
|
|
|
22
|
|
|
|
Convertible
|
|
|
Calamos Convertible Fund
|
|
|
31
|
|
|
|
Calamos Global Convertible Fund
|
|
|
37
|
|
|
|
U.S. Equity
|
|
Calamos Timpani Small Cap Growth
Fund
|
|
|
44
|
|
|
Calamos Timpani SMID Growth
Fund
|
|
|
49
|
|
|
|
Calamos Growth Fund
|
|
|
54
|
|
|
|
Calamos Growth and Income Fund
|
|
|
59
|
|
|
|
Calamos Dividend Growth Fund
|
|
|
65
|
|
|
|
Calamos Select Fund
|
|
|
71
|
|
|
|
Global Equity
|
|
Calamos International Growth
Fund
|
|
|
76
|
|
|
Calamos Evolving World Growth
Fund
|
|
|
81
|
|
|
|
Calamos Global Equity Fund
|
|
|
87
|
|
|
Calamos Global Opportunities
Fund
|
|
|
92
|
|
|
Calamos International Small Cap
Growth Fund
|
|
|
98
|
|
|
|
Fixed Income
|
|
|
Calamos Total Return Bond Fund
|
|
|
104
|
|
|
Calamos High Income Opportunities
Fund
|
|
|
111
|
|
|
|
Calamos Short-Term Bond Fund
|
|
|
118
|
|
|
Other Important Information
Regarding Fund Shares
|
|
|
125
|
|
|
Additional Information About
Investment Strategies and Related
Risks
|
|
|
127
|
|
|
|
Fund Facts
|
|
|
142
|
|
|
|
Who manages the Funds?
|
|
|
142
|
|
|
What classes of shares do the Funds
offer?
|
|
|
149
|
|
|
|
How can I buy shares?
|
|
|
159
|
|
|
|
How can I sell (redeem) shares?
|
|
|
162
|
|
|
|
Transaction information
|
|
|
168
|
|
|
|
Distributions and taxes
|
|
|
173
|
|
|
|
Other Information
|
|
|
174
|
|
|
|
Financial Highlights
|
|
|
176
|
|
|
|
Appendix
|
|
|
|
|
For More Information
|
|
back cover
|
|
Calamos Market Neutral Income Fund
Investment Objective
Calamos Market Neutral Income Fund's investment objective is high current income consistent with stability of principal.
Fees and Expenses of the Fund
The following table describes the fees and expenses that you may pay if you buy, hold and sell shares of the Fund. Investors may pay other fees, such as brokerage commissions and/or other forms of compensation to a financial intermediary, which are not reflected in the tables or the examples below. You may qualify for sales charge discounts on purchases of Class A shares if you and your family invest, or agree to invest in the future, at least $100,000 in Calamos Funds. More information about these and other discounts is available from your financial professional and under "Fund Facts — What classes of shares do the Funds offer?" on page 149 of the Fund's prospectus, in the Appendix to this prospectus and "Share Classes and Pricing of Shares" on page 67 of the Fund's statement of additional information.
Shareholder Fees (fees paid directly from your investment):
|
|
|
CLASS A |
|
CLASS C |
|
CLASS I |
|
CLASS R6 |
|
Maximum Sales Charge (Load) Imposed on Purchases (as a percentage of
offering price) |
|
|
2.75 |
% |
|
|
None |
|
|
|
None |
|
|
|
None |
|
|
Maximum Deferred Sales Charge (Load) (as a percentage of the lesser of the
redemption price or offering price) |
|
|
None |
|
|
|
1.00 |
% |
|
|
None |
|
|
|
None |
|
|
Annual Fund Operating Expenses (expenses that you pay each year as a percentage of the value of your investment):
|
|
|
CLASS A |
|
CLASS C |
|
CLASS I |
|
CLASS R6 |
|
|
Management Fees |
|
|
0.66 |
% |
|
|
0.66 |
% |
|
|
0.66 |
% |
|
|
0.66 |
% |
|
|
Distribution and/or Service (12b-1) Fees |
|
|
0.25 |
% |
|
|
1.00 |
% |
|
|
None |
|
|
|
None |
|
|
|
Dividend Expense on Short Positions |
|
|
0.17 |
% |
|
|
0.17 |
% |
|
|
0.17 |
% |
|
|
0.17 |
% |
|
|
Other Expenses |
|
|
0.13 |
% |
|
|
0.13 |
% |
|
|
0.13 |
% |
|
|
0.04 |
% |
|
|
Acquired Fund Fees and Expenses1 |
|
|
0.01 |
% |
|
|
0.01 |
% |
|
|
0.01 |
% |
|
|
0.01 |
% |
|
|
Total Annual Fund Operating Expenses |
|
|
1.22 |
% |
|
|
1.97 |
% |
|
|
0.97 |
% |
|
|
0.88 |
% |
|
1
Example
This example is intended to help you compare the cost of investing in the Fund with the cost of investing in other mutual funds. The example assumes that you invest $10,000 in the Fund for the time periods indicated and then either redeem or do not redeem your shares at the end of the reflected time periods. The example also assumes that your investment has a 5% return each year, that all dividends and capital gain distributions are reinvested, that you pay a maximum initial or contingent deferred sales charge and that the Fund's operating expenses remain the same. Although your actual performance and costs may be higher or lower, based on these assumptions, your costs would be:
You would pay the following expenses if you redeemed your shares at the end of the period:
|
|
|
One Year |
|
Three Years |
|
Five Years |
|
Ten Years |
|
|
Class A |
|
|
396 |
|
|
|
652 |
|
|
|
927 |
|
|
|
1,712 |
|
|
|
Class C |
|
|
300 |
|
|
|
618 |
|
|
|
1,062 |
|
|
|
2,296 |
|
|
|
Class I |
|
|
99 |
|
|
|
309 |
|
|
|
536 |
|
|
|
1,190 |
|
|
|
Class R6 |
|
|
90 |
|
|
|
281 |
|
|
|
488 |
|
|
|
1,084 |
|
|
PROSPECTUS | March 1, 2024
1
Calamos Market Neutral Income Fund
You would pay the following expenses if you did not redeem your shares:
|
|
|
One Year |
|
Three Years |
|
Five Years |
|
Ten Years |
|
|
Class A |
|
|
396 |
|
|
|
652 |
|
|
|
927 |
|
|
|
1,712 |
|
|
|
Class C |
|
|
200 |
|
|
|
618 |
|
|
|
1,062 |
|
|
|
2,296 |
|
|
|
Class I |
|
|
99 |
|
|
|
309 |
|
|
|
536 |
|
|
|
1,190 |
|
|
|
Class R6 |
|
|
90 |
|
|
|
281 |
|
|
|
488 |
|
|
|
1,084 |
|
|
Portfolio Turnover
The Fund pays transaction costs, such as commissions, when it buys and sells securities (or "turns over" its portfolio). A higher portfolio turnover rate may indicate higher transaction costs and may result in higher taxes when Fund shares are held in a taxable account. These costs, which are not reflected in the annual fund operating expenses or in the example, affect the Fund's performance. During the most recent fiscal year, the Fund's portfolio turnover rate was 28% of the average value of its portfolio.
Principal Investment Strategies
The Fund's investment strategy can be characterized as "market neutral" because it seeks to achieve maximum current income while maintaining a low correlation to the fluctuations of the U.S. equity market as a whole. The Fund (i) invests in equities, (ii) invests in convertible securities (including synthetic convertible securities) of U.S. companies without regard to market capitalization, and (iii) employs short selling and enters into total return swaps to enhance income and hedge against market risk. The convertible securities in which the Fund invests may be either debt securities or preferred stocks that can be exchanged for common stock. The average term to maturity of the convertible securities purchased by the Fund will typically range from two to ten years.
A synthetic convertible instrument is designed to simulate the economic characteristics of a convertible security through the combined features of a debt instrument, or loan, and a security providing an option on an equity security. The Fund may establish a synthetic convertible instrument by combining a fixed-income security with the right to acquire an equity security. The fixed-income and equity option components may have different issuers, and either component may change at any time.
The Fund may seek to generate income from option premiums by writing (selling) options. This would include the use of both call and put options. The Fund may write call options (i) on a portion of the equity securities (including securities that are convertible into equity securities) in the Fund's portfolio and (ii) on broad-based securities indexes (such as the S&P 500 or MSCI EAFE) or ETFs (exchange traded funds).
In addition, to seek to offset some of the risk of a potential decline in value of certain long positions, the Fund may also purchase put options on individual securities, broad-based securities indexes (such as the S&P 500), or ETFs.
The Fund may invest without limit in high yield fixed-income securities (often referred to as "junk bonds"). The Fund may invest up to 10% of its total assets in stock, rights, warrants, and other securities of special purpose acquisition companies or similar special purpose entities (collectively, "SPACs"). In addition, the Fund may obtain certain private rights and other interests issued by a SPAC (commonly referred to as "founder shares"), which may be subject to forfeiture or expire worthless and which generally have more limited liquidity than SPAC shares issued in an initial public offering. In addition, the Fund may engage in active and frequent trading of portfolio securities. The Fund may also invest in ETFs. The Fund's investment adviser seeks to lower the risks of investing in stocks by using a "top-down approach" of diversification by company, industry, sector, country and currency and focusing on macro-level investment themes.
Principal Risks
An investment in the Fund is subject to risks, and you could lose money on your investment in the Fund. There can be no assurance that the Fund will achieve its investment objective. The risks associated with an investment in the Fund can increase during times of significant market volatility. Your investment in the Fund is not a deposit in a bank and is not insured or
CALAMOS FAMILY OF FUNDS
2
Calamos Market Neutral Income Fund
guaranteed by the Federal Deposit Insurance Corporation or any other government agency. The principal risks are presented in alphabetical order to facilitate finding particular risks and comparing them with other funds. Each risk summarized below is considered a "principal risk" of investing in the Fund, regardless of the order in which it appears. The principal risks of investing in the Fund include:
• Convertible Hedging Risk — If the market price of the underlying common stock increases above the conversion price on a convertible security, the price of the convertible security will increase. The Fund's increased liability on any outstanding short position would, in whole or in part, reduce this gain.
• Convertible Securities Risk — The value of a convertible security is influenced by changes in interest rates, with investment value declining as interest rates increase and increasing as interest rates decline. The credit standing of the issuer and other factors also may have an effect on the convertible security's investment value.
• Covered Call Writing Risk — As the writer of a covered call option on a security, the Fund foregoes, during the option's life, the opportunity to profit from increases in the market value of the security covering the call option above the sum of the premium and the exercise price of the call.
• Debt Securities Risk — Debt securities are subject to various risks, including interest rate risk, credit risk and default risk.
• Interest Rate Risk — The value of debt securities generally decreases in periods when interest rates are rising. In addition, interest rate changes typically have a greater effect on prices of longer-term debt securities than shorter term debt securities. Changes in interest rates by the Federal Reserve Board, and other events affecting fixed-income markets, may subject a Fund to heightened interest rate risk as a result of a rise in interest rates.
• Credit Risk — A debt security could deteriorate in quality to such an extent that its rating is downgraded or its market value declines relative to comparable securities. Changes in actual or perceived creditworthiness may occur quickly. If the Fund holds securities that have been downgraded, or that default on payment, the Fund's performance could be negatively affected.
• Default Risk — A company that issues a debt security may be unable to fulfill its obligation to repay principal and interest. The lower a bond is rated, the greater its default risk. To the extent the Fund holds securities that have been downgraded, or that default on payment, its performance could be negatively affected.
• Derivatives Risk — Derivatives are instruments, such as futures and forward foreign currency contracts, whose value is derived from that of other assets, rates or indices. The use of derivatives for non-hedging purposes may be considered more speculative than other types of investments. Derivatives can be used for hedging (attempting to reduce risk by offsetting one investment position with another) or non-hedging purposes. Hedging with derivatives may increase expenses, and there is no guarantee that a hedging strategy will work. While hedging can reduce or eliminate losses, it can also reduce or eliminate gains. In addition, derivative instruments are subject to counterparty risk, meaning that the party with whom the Fund enters into a derivative transaction may experience a significant credit event and/or may be unwilling or unable to make timely settlement payments or otherwise honor its obligations. Changes in the value of a derivative may not correlate perfectly with the underlying asset, rate or index, and the Fund could lose more than the principal amount invested.
• Equity Securities Risk — The securities markets are volatile, and the market prices of the Fund's securities may decline generally. The price of equity securities fluctuates based on changes in a company's financial condition and overall market and economic conditions. If the market prices of the securities owned by the Fund (i.e., the Fund's long position) fall, the value of your investment in the Fund will decline.
• Foreign Securities Risk — Risks associated with investing in foreign securities include fluctuations in the exchange rates of foreign currencies that may affect the U.S. dollar value of a security, the possibility of substantial price volatility as a result of political and economic instability in the foreign country, less public information about issuers of securities, different securities regulation, different accounting, auditing and financial reporting standards and less liquidity than in U.S. markets.
PROSPECTUS | March 1, 2024
3
Calamos Market Neutral Income Fund
• High Yield Risk — High yield securities and unrated securities of similar credit quality (commonly known as "junk bonds") are subject to greater levels of credit and liquidity risks. High yield securities are considered primarily speculative with respect to the issuer's continuing ability to make principal and interest payments.
• Liquidity Risk — Liquidity risk exists when particular investments are difficult to purchase or sell. The Fund's investments in illiquid securities may reduce the returns of the Fund because it may be unable to sell the illiquid securities at an advantageous time or price.
• Options Risk — The Fund's ability to close out its position as a purchaser or seller of an over-the-counter or exchange- listed put or call option is dependent, in part, upon the liquidity of the options market. There are significant differences between the securities and options markets that could result in an imperfect correlation among these markets, causing a given transaction not to achieve its objectives. The Fund's ability to utilize options successfully will depend on the ability of the Fund's investment adviser to predict pertinent market movements, which cannot be assured.
• Other Investment Companies (including ETFs) Risk — The Fund may invest in the securities of other investment companies to the extent that such investments are consistent with the Fund's investment objective and the policies are permissible under the 1940 Act. Investments in the securities of other investment companies, including ETFs, may involve duplication of advisory fees and certain other expenses. Additionally, if the investment company or ETF fails to achieve its investment objective, the value of the Fund's investment will decline, adversely affecting the Fund's performance. In addition, closed end investment company and ETF shares potentially may trade at a discount or a premium and are subject to brokerage and other trading costs, which could result in greater expenses to the Fund. In addition, the Fund may engage in short sales of the securities of other investment companies. When the Fund shorts securities of another investment company, it borrows shares of that investment company which it then sells. The Fund closes out a short sale by purchasing the security that it has sold short and returning that security to the entity that lent the security.
• Portfolio Selection Risk — The value of your investment may decrease if the investment adviser's judgment about the attractiveness, value or market trends affecting a particular security, issuer, industry or sector or about market movements is incorrect.
• Portfolio Turnover Risk — The portfolio managers may actively and frequently trade securities or other instruments in the Fund's portfolio to carry out its investment strategies. A high portfolio turnover rate increases transaction costs, which may increase the Fund's expenses. Frequent and active trading may also cause adverse tax consequences for investors in the Fund due to an increase in short-term capital gains.
• Rule 144A Securities Risk — The Fund may invest in securities that are issued and sold through transactions under Rule 144A of the Securities Act of 1933. Under the supervision of its board of trustees, the Fund will determine whether Rule 144A Securities are illiquid. If qualified institutional buyers are unwilling to purchase these Rule 144A Securities, the percentage of the Fund's assets invested in illiquid securities would increase. Typically, the Fund purchases Rule 144A Securities only if the Fund's adviser has determined them to be liquid. If any Rule 144A Security held by the Fund should become illiquid, the value of the security may be reduced and a sale of the security may be more difficult.
• Sector Risk — To the extent the Fund invests a significant portion of its assets in a particular sector, a greater portion of the Fund's performance may be affected by the general business and economic conditions affecting that sector. Each sector may share economic risk with the broader market, however there may be economic risks specific to each sector. As a result, returns from those sectors may trail returns from the overall stock market and it is possible that the Fund may underperform the broader market, or experience greater volatility.
• Securities Lending Risk — The Fund may lend its portfolio securities to broker-dealers and banks in order to generate additional income for the Fund. Any such loan must be continuously secured by collateral in cash or cash equivalents maintained on a current basis in an amount at least equal to the market value of the securities loaned by the Fund. In the event of bankruptcy or other default of a borrower of portfolio securities, the Fund could experience both delays in liquidating the loan collateral or recovering the loaned securities and losses, including (a) possible decline in the value of the collateral or in the value of the securities loaned during the period while the Fund seeks to enforce its rights thereto, (b) possible subnormal levels of income and lack of access to income during this period, and (c) expenses of enforcing its rights. In an effort to reduce these risks, the Fund's securities lending agent monitors, and reports to Calamos Advisors
CALAMOS FAMILY OF FUNDS
4
Calamos Market Neutral Income Fund
on, the creditworthiness of the firms to which a Fund lends securities. The Fund may also experience losses as a result of a diminution in value of its cash collateral investments.
• Short Sale Risk — The Fund may incur a loss (without limit) as a result of a short sale if the market value of the borrowed security (i.e., the Fund's short position) increases between the date of the short sale and the date the Fund replaces the security. The Fund may be unable to repurchase the borrowed security at a particular time or at an acceptable price.
• Small and Mid-Sized Company Risk — Small and mid-sized company stocks have historically been subject to greater investment risk than large company stocks. The prices of small and mid-sized company stocks tend to be more volatile than prices of large company stocks.
• Special Purpose Acquisition Companies Risk — The Fund may invest in special purpose acquisition companies ("SPACs") or similar special purpose entities. Because SPACs and similar entities have no operating history or ongoing business other than seeking acquisitions, the value of their securities is particularly dependent on the ability of the entity's management to identify and complete a profitable acquisition. Some SPACs may pursue acquisitions only within certain industries or regions, which may increase the volatility of their prices. A SPAC will not generate any revenues until, at the earliest, after the consummation of a transaction. An attractive acquisition or merger target may not be identified at all, in which case the SPAC will be required to return any remaining monies to shareholders, and the Fund may be subject to opportunity costs to the extent that alternative investments would have produced higher return. While a SPAC is seeking a transaction target, its stock may be thinly traded and/or illiquid. The proceeds of a SPAC IPO that are placed in trust are subject to risks, including the risk of insolvency of the custodian of the funds, fraud by the trustee, interest rate risk and credit and liquidity risk relating to the securities and money market funds in which the proceeds are invested. The private rights or other interests issued by a SPAC that the Fund may obtain generally have more limited liquidity than SPAC shares issued in an IPO and may be subject to forfeiture or expire worthless.
• Synthetic Convertible Instruments Risk — The value of a synthetic convertible instrument will respond differently to market fluctuations than a convertible security because a synthetic convertible instrument is composed of two or more separate securities, each with its own market value. In addition, if the value of the underlying common stock or the level of the index involved in the convertible component falls below the exercise price of the warrant or option, the warrant or option may lose all value.
• Tax Risk — The federal income tax treatment of convertible securities or other securities in which the Fund may invest may not be clear or may be subject to recharacterization by the Internal Revenue Service. It could be more difficult to comply with the tax requirements applicable to regulated investment companies if the tax characterization of investments or the tax treatment of the income from such investments were successfully challenged by the Internal Revenue Service. Any such failure to comply with the rules applicable to regulated investment companies could cause the Fund to fail to qualify as such.
• Total Return Swap Risk — A total return swap is a contract in which one party agrees to make periodic payments to another party based on the change in market value of the assets underlying the contract, which may include a specified security, basket of securities, or securities indices during the specified period, in return for periodic payments based on a fixed or variable interest rate or the total return from other underlying assets. Total return swap agreements may be used to obtain exposure to a security or market without owning or taking physical custody of such security or investing directly in such market. Total return swap agreements may effectively add leverage to a fund's portfolio because, in addition to its total net assets, the fund would be subject to investment exposure on the notional amount of the swap. The primary risks associated with total return swaps are credit risk (if the counterparty fails to meet its obligations) and market risk (if there is no liquid market for the agreement or unfavorable changes occur to the underlying asset).
PROSPECTUS | March 1, 2024
5
Calamos Market Neutral Income Fund
Fund Performance
The following bar chart and table indicate the risks of investing in the Fund by showing changes in the Fund's performance from calendar year to calendar year and how the Fund's average annual total returns compare with those of a broad measure of market performance. All returns include the reinvestment of dividends and distributions. As always, please note that the Fund's past performance (before and after taxes) cannot predict how it will perform in the future. Updated performance information is available at no cost by visiting www.calamos.com or by calling 800.582.6959.
CLASS I* ANNUAL TOTAL RETURN FOR YEARS ENDED 12.31

|
Highest Quarterly Return: |
|
|
5.08 |
% (6.30.2020) |
|
Lowest Quarterly Return: |
|
|
-5.71 |
% (6.30.2022) |
|
* Annual returns for Class I are provided because Class I shares represent the largest percentage of assets in the Calamos Family of Funds.
Average Annual Total Returns as of 12.31.23
The following table shows how the Fund's average annual performance (before and after taxes) for the one-, five- and ten-year periods ended December 31, 2023 and since the Fund's inception compared with broad measures of market performance. "Since Inception" returns shown for each index are returns since the inception of the Fund's Class A shares, or since the nearest subsequent month end when comparative index data is available only for full monthly periods. The after-tax returns show the impact of assumed federal income taxes on an investment in the Fund. "Return After Taxes on Distributions" shows the effect of taxable distributions, but assumes that you still hold the Fund shares at the end of the period and so do not have any taxable gain or loss on your investment. "Return After Taxes on Distributions and Sale of Fund Shares" shows the effect of taxable distributions and any taxable gain or loss that would be realized if the Fund shares were purchased at the beginning and sold at the end of the specified period.
The after-tax returns are shown only for Class I shares, and are calculated using the historical highest individual federal marginal income tax rates and do not reflect the impact of state and local taxes. Actual after-tax returns depend on an investor's tax situation and may differ from those shown, and the after-tax returns shown are not relevant to investors who hold their Fund shares through tax-advantaged arrangements, such as 401(k) plans or individual retirement accounts. After-tax returns for classes other than Class I will vary from returns shown for Class I. "Return After Taxes on Distributions and Sale of Fund Shares" may be higher than other returns for the same period due to a tax benefit of realizing a capital loss on the sale of Fund shares.
CALAMOS FAMILY OF FUNDS
6
Calamos Market Neutral Income Fund
AVERAGE ANNUAL TOTAL RETURNS — FOR THE PERIODS ENDED 12.31.23
|
|
|
INCEPTION
DATE OF CLASS |
|
ONE YEAR |
|
FIVE YEAR |
|
TEN YEAR |
|
SINCE
INCEPTION |
|
|
Class A |
|
|
9.4.90 |
|
|
|
|
|
|
|
|
|
|
|
Load Adjusted Return before taxes |
|
|
|
|
6.47 |
% |
|
|
3.56 |
% |
|
|
2.89 |
% |
|
|
5.67 |
% |
|
|
Class C |
|
|
2.16.00 |
|
|
|
|
|
|
|
|
|
|
|
Load Adjusted Return before taxes |
|
|
|
|
7.14 |
% |
|
|
3.27 |
% |
|
|
2.63 |
% |
|
|
3.46 |
% |
|
|
Class I |
|
|
5.10.00 |
|
|
|
|
|
|
|
|
|
|
|
Return before taxes |
|
|
|
|
9.17 |
% |
|
|
4.30 |
% |
|
|
3.65 |
% |
|
|
4.40 |
% |
|
|
Return after taxes on distributions* |
|
|
|
|
7.00 |
% |
|
|
3.67 |
% |
|
|
2.87 |
% |
|
|
3.15 |
% |
|
Return after taxes on distributions and sale of
Fund shares* |
|
|
|
|
5.76 |
% |
|
|
3.16 |
% |
|
|
2.65 |
% |
|
|
3.06 |
% |
|
|
Class R6 |
|
|
6.23.20 |
|
|
|
|
|
|
|
|
|
|
|
Load Adjusted Return before taxes |
|
|
|
|
9.25 |
% |
|
|
N/A |
|
|
|
N/A |
|
|
|
4.02 |
% |
|
|
Bloomberg U.S. Government/Credit Index |
|
|
|
|
5.72 |
% |
|
|
1.41 |
% |
|
|
1.97 |
% |
|
|
4.14 |
% |
|
|
Bloomberg Short Treasury 1-3 Month Index |
|
|
|
|
5.14 |
% |
|
|
1.88 |
% |
|
|
1.24 |
% |
|
|
1.66 |
% |
|
*
The Bloomberg Short Treasury 1-3 Month Index is generally considered representative of the performance of short-term money market investments and is provided to show how the Fund's performance compares to public obligations of the U.S. Treasury with maturities of 1-3 months.
Investment Adviser
Calamos Advisors LLC
PORTFOLIO MANAGER/
FUND TITLE (IF APPLICABLE) |
|
PORTFOLIO MANAGER
EXPERIENCE IN THE FUND |
|
PRIMARY TITLE
WITH INVESTMENT ADVISER |
|
|
John P. Calamos, Sr. (President, Chairman) |
|
since Fund's inception |
|
Founder, Chairman, and Global CIO |
|
|
Jason Hill |
|
11 years |
|
SVP, Sr. Co-Portfolio Manager |
|
|
David O'Donohue |
|
8.5 years |
|
SVP, Sr. Co-Portfolio Manager |
|
|
Eli Pars |
|
10 years |
|
SVP, Sr. Co-Portfolio Manager |
|
|
Jimmy Young |
|
5 years |
|
SVP, Co-Portfolio Manager |
|
|
Anthony Vecchiolla |
|
since February 2023 |
|
VP, Co-Portfolio Manager |
|
Other Important Information Regarding Fund Shares
For important information about purchase and sale of Fund shares, tax information, and financial intermediary compensation, please turn to "Other Important Information Regarding Fund Shares" on page 125 of the prospectus.
PROSPECTUS | March 1, 2024
7
Calamos Hedged Equity Fund
Investment Objective
Calamos Hedged Equity Fund's investment objective is to seek total return with lower volatility than equity markets.
Fees and Expenses of the Fund
The following table describes the fees and expenses that you may pay if you buy, hold and sell shares of the Fund. Investors may pay other fees, such as brokerage commissions and/or other forms of compensation to a financial intermediary, which are not reflected in the tables or the examples below. You may qualify for sales charge discounts on purchases of Class A shares if you and your family invest, or agree to invest in the future, at least $50,000 in Calamos Funds. More information about these and other discounts is available from your financial professional and under "Fund Facts — What classes of shares do the Funds offer?" on Page 149 of the Fund's prospectus, in the Appendix to this prospectus and "Share Classes and Pricing of Shares" on Page 67 of the Fund's statement of additional information.
Shareholder Fees (fees paid directly from your investment):
|
|
|
CLASS A |
|
CLASS C |
|
CLASS I |
|
|
Maximum Sales Charge (Load) Imposed on Purchases (as a percentage of offering price) |
|
|
4.75 |
% |
|
|
None |
|
|
|
None |
|
|
Maximum Deferred Sales Charge (Load) (as a percentage of the lesser of the redemption price or
offering price) |
|
|
None |
|
|
|
1.00 |
% |
|
|
None |
|
|
Annual Fund Operating Expenses (expenses that you pay each year as a percentage of the value of your investment):
|
|
|
CLASS A
|
|
CLASS C
|
|
CLASS I
|
|
|
Management Fees
|
|
|
0.74
|
%
|
|
|
0.74
|
%
|
|
|
0.74
|
%
|
|
|
Distribution and/or Service Fees (12b-1)
|
|
|
0.25
|
%
|
|
|
1.00
|
%
|
|
|
None
|
|
|
|
Other Expenses
|
|
|
0.18
|
%
|
|
|
0.18
|
%
|
|
|
0.18
|
%
|
|
|
Total Annual Fund Operating Expenses
|
|
|
1.17
|
%
|
|
|
1.92
|
%
|
|
|
0.92
|
%
|
|
Example
This example is intended to help you compare the cost of investing in the Fund with the cost of investing in other mutual funds. The example assumes that you invest $10,000 in the Fund for the time periods indicated and then either redeem or do not redeem your shares at the end of the reflected time periods. The example also assumes that your investment has a 5% return each year, that all dividends and capital gain distributions are reinvested, that you pay a maximum initial or contingent deferred sales charge and that the Fund's operating expenses remain the same. Although your actual performance and costs may be higher or lower, based on these assumptions, your costs would be:
You would pay the following expenses if you redeemed your shares at the end of the period:
|
|
|
One Year |
|
Three Years |
|
Five Years |
|
Ten Years |
|
|
Class A |
|
|
589 |
|
|
|
829 |
|
|
|
1,088 |
|
|
|
1,828 |
|
|
|
Class C |
|
|
295 |
|
|
|
603 |
|
|
|
1,037 |
|
|
|
2,243 |
|
|
|
Class I |
|
|
94 |
|
|
|
293 |
|
|
|
509 |
|
|
|
1,131 |
|
|
CALAMOS FAMILY OF FUNDS
8
Calamos Hedged Equity Fund
You would pay the following expenses if you did not redeem your shares:
|
|
|
One Year |
|
Three Years |
|
Five Years |
|
Ten Years |
|
|
Class A |
|
|
589 |
|
|
|
829 |
|
|
|
1,088 |
|
|
|
1,828 |
|
|
|
Class C |
|
|
195 |
|
|
|
603 |
|
|
|
1,037 |
|
|
|
2,243 |
|
|
|
Class I |
|
|
94 |
|
|
|
293 |
|
|
|
509 |
|
|
|
1,131 |
|
|
Portfolio Turnover
The Fund pays transaction costs, such as commissions, when it buys and sells securities (or "turns over" its portfolio). A higher portfolio turnover rate may indicate higher transaction costs and may result in higher taxes when Fund shares are held in a taxable account. These costs, which are not reflected in the annual fund operating expenses or in the example, affect the Fund's performance. During the Fund's most recent fiscal year, the Fund's portfolio turnover rate was 19% of the average value of its portfolio.
Principal Investment Strategies
The Fund seeks to achieve total return with lower volatility than equity markets. Under normal circumstances, the Fund invests at least 80% of its net assets (plus any borrowings for investment purposes) in equity securities and securities with economic characteristics similar to stock or the equity markets. The Fund invests in a broadly diversified portfolio of equity securities while also writing (selling) index call and put options and/or entering into other options strategies on equity securities and/or broad based indices. The Fund may write call options (i) on a portion of the equity securities in the Fund's portfolio and (ii) on broad- based securities indexes (such as the S&P 500 or MSCI EAFE) or ETFs (exchange traded funds).
In addition, to seek to offset some of the risk of a potential decline in value of certain long positions, the Fund may also purchase put options on individual securities, broad-based securities indexes (such as the S&P 500), or ETFs. The Fund may also engage in active and frequent trading of portfolio securities.
Equity securities purchased by the Fund may include U.S. exchange-listed common stocks, options on equities, and American Depositary Receipts (ADRs). The Fund may also invest in fixed-income securities. The Fund may also invest in ETFs.
The Fund may use derivatives for hedging (attempting to reduce risk by offsetting one investment position with another) or non-hedging purposes. In particular, the Fund may hedge some or all of the currency exposure of foreign securities by entering into forward foreign currency contracts, futures or other derivatives.
The Fund's investment adviser seeks to lower the risks of investing in stocks by using a "top-down approach" of diversification by company, industry, sector, country and currency and focusing on macro-level investment themes. The Fund intends that its option-based risk management strategy will reduce the volatility inherent in investments in equity securities over time.
Principal Risks
An investment in the Fund is subject to risks, and you could lose money on your investment in the Fund. There can be no assurance that the Fund will achieve its investment objective. The risks associated with an investment in the Fund can increase during times of significant market volatility. Your investment in the Fund is not a deposit in a bank and is not insured or guaranteed by the Federal Deposit Insurance Corporation or any other government agency. The principal risks are presented in alphabetical order to facilitate finding particular risks and comparing them with other funds. Each risk summarized below is considered a "principal risk" of investing in the Fund, regardless of the order in which it appears. The principal risks of investing in the Fund include:
• American Depositary Receipts Risk — The stocks of most foreign companies that trade in the U.S. markets are traded as ADRs. U.S. depositary banks issue these stocks. Each ADR represents one or more shares of foreign stock or a fraction of a share. The price of an ADR corresponds to the price of the foreign stock in its home market, adjusted to the ratio of
PROSPECTUS | March 1, 2024
9
Calamos Hedged Equity Fund
the ADRs to foreign company shares. Therefore while purchasing a security on a U.S. exchange, the risks inherently associated with foreign investing still apply to ADRs.
• Convertible Securities Risk — The value of a convertible security is influenced by changes in interest rates, with investment value declining as interest rates increase and increasing as interest rates decline. The credit standing of the issuer and other factors also may have an effect on the convertible security's investment value.
• Correlation Risk — The effectiveness of the Fund's index option-based risk management strategy may be reduced if the performance of the Fund's equity portfolio does not correlate to that of the indices underlying its option positions.
• Covered Call Writing Risk — As the writer of a covered call option on a security, the Fund foregoes, during the option's life, the opportunity to profit from increases in the market value of the security covering the call option above the sum of the premium and the exercise price of the call.
• Currency Risk — To the extent that the Fund invests in securities or other instruments denominated in or indexed to foreign currencies, changes in currency exchange rates bring an added dimension of risk. Currency fluctuations could negatively impact investment gains or add to investment losses. Although the Fund may attempt to hedge against currency risk, the hedging instruments may not always perform as the Fund expects and could produce losses. Suitable hedging instruments may not be available for currencies of emerging market countries. The Fund's investment adviser may determine not to hedge currency risks, even if suitable instruments appear to be available.
• Debt Securities Risk — Debt securities are subject to various risks, including interest rate risk, credit risk and default risk.
• Interest Rate Risk — The value of debt securities generally decreases in periods when interest rates are rising. In addition, interest rate changes typically have a greater effect on prices of longer-term debt securities than shorter term debt securities. Changes in interest rates by the Federal Reserve Board, and other events affecting fixed-income markets, may subject a Fund to heightened interest rate risk as a result of a rise in interest rates.
• Credit Risk — A debt security could deteriorate in quality to such an extent that its rating is downgraded or its market value declines relative to comparable securities. Changes in actual or perceived creditworthiness may occur quickly. If the Fund holds securities that have been downgraded, or that default on payment, the Fund's performance could be negatively affected.
• Default Risk — A company that issues a debt security may be unable to fulfill its obligation to repay principal and interest. The lower a bond is rated, the greater its default risk. To the extent the Fund holds securities that have been downgraded, or that default on payment, its performance could be negatively affected.
• Derivatives Risk — Derivatives are instruments, such as futures and forward foreign currency contracts, whose value is derived from that of other assets, rates or indices. The use of derivatives for non-hedging purposes may be considered more speculative than other types of investments. Derivatives can be used for hedging (attempting to reduce risk by offsetting one investment position with another) or non-hedging purposes. Hedging with derivatives may increase expenses, and there is no guarantee that a hedging strategy will work. While hedging can reduce or eliminate losses, it can also reduce or eliminate gains. In addition, derivative instruments are subject to counterparty risk, meaning that the party with whom the Fund enters into a derivative transaction may experience a significant credit event and/or may be unwilling or unable to make timely settlement payments or otherwise honor its obligations. Changes in the value of a derivative may not correlate perfectly with the underlying asset, rate or index, and the Fund could lose more than the principal amount invested.
• Equity Securities Risk — The securities markets are volatile, and the market prices of the Fund's securities may decline generally. The price of equity securities fluctuates based on changes in a company's financial condition and overall market and economic conditions. If the market prices of the securities owned by the Fund (i.e., the Fund's long position) fall, the value of your investment in the Fund will decline.
• Foreign Securities Risk — Risks associated with investing in foreign securities include fluctuations in the exchange rates of foreign currencies that may affect the U.S. dollar value of a security, the possibility of substantial price volatility as a result of political and economic instability in the foreign country, less public information about issuers of securities, different securities regulation, different accounting, auditing and financial reporting standards and less liquidity than in U.S. markets.
CALAMOS FAMILY OF FUNDS
10
Calamos Hedged Equity Fund
• Forward Foreign Currency Contract Risk — Forward foreign currency contracts are contractual agreements to purchase or sell a specified currency at a specified future date (or within a specified time period) at a price set at the time of the contract. The Fund may not fully benefit from, or may lose money on, forward foreign currency transactions if changes in currency exchange rates do not occur as anticipated or do not correspond accurately to changes in the value of the Fund's holdings.
• Futures and Forward Contracts Risk — Futures contracts provide for the future sale by one party and purchase by another of a specific asset at a specific time and price (with or without delivery required). Futures contracts are standardized contracts traded on a recognized exchange. An option on a futures contract gives the purchaser the right, in exchange for a premium, to assume a position in a futures contract at a specified exercise price during the term of the option. Futures and forward contracts are subject to counterparty risk, meaning that the party with whom the Fund enters into the derivatives transaction (the clearinghouse or the broker holding the Fund's position for a futures contract or the counterparty for a forward contract) may experience a significant credit event and/or may be unwilling or unable to make timely settlement payments or otherwise honor its obligations.
• Options Risk — The Fund's ability to close out its position as a purchaser or seller of an over-the-counter or exchange- listed put or call option is dependent, in part, upon the liquidity of the options market. There are significant differences between the securities and options markets that could result in an imperfect correlation among these markets, causing a given transaction not to achieve its objectives. The Fund's ability to utilize options successfully will depend on the ability of the Fund's investment adviser to predict pertinent market movements, which cannot be assured. The Fund may also purchase or write over-the-counter put or call options, which involves risks different from, and possibly greater than, the risks associated with exchange-listed put or call options. In some instances, over-the-counter put or call options may expose the Fund to the risk that a counterparty may be unable or unwilling to perform according to a contract, and that any deterioration in a counterparty's creditworthiness could adversely affect the instrument. In addition, the Fund may be exposed to a risk that losses may exceed the amount originally invested.
• Other Investment Companies (including ETFs) Risk — The Fund may invest in the securities of other investment companies to the extent that such investments are consistent with the Fund's investment objective and the policies are permissible under the 1940 Act. Investments in the securities of other investment companies, including ETFs, may involve duplication of advisory fees and certain other expenses. Additionally, if the investment company or ETF fails to achieve its investment objective, the value of the Fund's investment will decline, adversely affecting the Fund's performance. In addition, closed end investment company and ETF shares potentially may trade at a discount or a premium and are subject to brokerage and other trading costs, which could result in greater expenses to the Fund. In addition, the Fund may engage in short sales of the securities of other investment companies. When the Fund shorts securities of another investment company, it borrows shares of that investment company which it then sells. The Fund closes out a short sale by purchasing the security that it has sold short and returning that security to the entity that lent the security.
• Portfolio Selection Risk — The value of your investment may decrease if the investment adviser's judgment about the attractiveness, value or market trends affecting a particular security, issuer, industry, or sector or about market movements is incorrect.
• Portfolio Turnover Risk — The portfolio managers may actively and frequently trade securities or other instruments in the Fund's portfolio to carry out its investment strategies. A high portfolio turnover rate increases transaction costs, which may increase the Fund's expenses. Frequent and active trading may also cause adverse tax consequences for investors in the Fund due to an increase in short-term capital gains.
• Rule 144A Securities Risk — The Fund may invest in securities that are issued and sold through transactions under Rule 144A of the Securities Act of 1933. Under the supervision of its board of trustees, the Fund will determine whether Rule 144A Securities are illiquid. If qualified institutional buyers are unwilling to purchase these Rule 144A Securities, the percentage of the Fund's assets invested in illiquid securities would increase. Typically, the Fund purchases Rule 144A Securities only if the Fund's adviser has determined them to be liquid. If any Rule 144A Security held by the Fund should become illiquid, the value of the security may be reduced and a sale of the security may be more difficult.
PROSPECTUS | March 1, 2024
11
Calamos Hedged Equity Fund
• Sector Risk — To the extent the Fund invests a significant portion of its assets in a particular sector, a greater portion of the Fund's performance may be affected by the general business and economic conditions affecting that sector. Each sector may share economic risk with the broader market, however there may be economic risks specific to each sector. As a result, returns from those sectors may trail returns from the overall stock market and it is possible that the Fund may underperform the broader market, or experience greater volatility.
• Securities Lending Risk — The Fund may lend its portfolio securities to broker-dealers and banks in order to generate additional income for the Fund. Any such loan must be continuously secured by collateral in cash or cash equivalents maintained on a current basis in an amount at least equal to the market value of the securities loaned by the Fund. In the event of bankruptcy or other default of a borrower of portfolio securities, the Fund could experience both delays in liquidating the loan collateral or recovering the loaned securities and losses, including (a) possible decline in the value of the collateral or in the value of the securities loaned during the period while the Fund seeks to enforce its rights thereto, (b) possible subnormal levels of income and lack of access to income during this period, and (c) expenses of enforcing its rights. In an effort to reduce these risks, the Fund's securities lending agent monitors, and reports to Calamos Advisors on, the creditworthiness of the firms to which a Fund lends securities. The Fund may also experience losses as a result of a diminution in value of its cash collateral investments.
• Short Sale Risk — The Fund may incur a loss (without limit) as a result of a short sale if the market value of the borrowed security (i.e., the Fund's short position) increases between the date of the short sale and the date the Fund replaces the security. The Fund may be unable to repurchase the borrowed security at a particular time or at an acceptable price.
• Tax Risk — The federal income tax treatment of convertible securities or other securities in which the Fund may invest may not be clear or may be subject to recharacterization by the Internal Revenue Service. It could be more difficult to comply with the tax requirements applicable to regulated investment companies if the tax characterization of investments or the tax treatment of the income from such investments were successfully challenged by the Internal Revenue Service. Any such failure to comply with the rules applicable to regulated investment companies could cause the Fund to fail to qualify as such.
Fund Performance
The following bar chart and table indicate the risks of investing in the Fund by showing changes in the Fund's performance from calendar year to calendar year and how the Fund's average annual total returns compare with those of a broad measure of market performance. All returns include the reinvestment of dividends and distributions. As always, please note that the Fund's past performance (before and after taxes) cannot predict how it will perform in the future. Updated performance information is available at no cost by visiting www.calamos.com or by calling 800.582.6959.
CLASS I* ANNUAL TOTAL RETURN FOR YEARS ENDED 12.31

|
Highest Quarterly Return: |
|
|
10.84 |
% (6.30.2020) |
|
Lowest Quarterly Return: |
|
|
-10.28 |
% (6.30.2022) |
|
* Annual returns for Class I are provided because Class I shares represent the largest percentage of assets in the Calamos Family of Funds.
CALAMOS FAMILY OF FUNDS
12
Calamos Hedged Equity Fund
Average Annual Total Returns as of 12.31.23
The following table shows how the Fund's average annual performance (before and after taxes) for the one- and five-year periods ended December 31, 2023 and since the Fund's inception compared with broad measures of market performance. "Since Inception" returns shown for each index are returns since the inception of the Fund's Class A shares, or since the nearest subsequent month end when comparative index data is available only for full monthly periods. The after-tax returns show the impact of assumed federal income taxes on an investment in the Fund. "Return After Taxes on Distributions" shows the effect of taxable distributions, but assumes that you still hold the Fund shares at the end of the period and so do not have any taxable gain or loss on your investment. "Return After Taxes on Distributions and Sale of Fund Shares" shows the effect of taxable distributions and any taxable gain or loss that would be realized if the Fund shares were purchased at the beginning and sold at the end of the specified period.
The after-tax returns are shown only for Class I shares, and are calculated using the historical highest individual federal marginal income tax rates and do not reflect the impact of state and local taxes. Actual after-tax returns depend on an investor's tax situation and may differ from those shown, and the after-tax returns shown are not relevant to investors who hold their Fund shares through tax-advantaged arrangements, such as 401(k) plans or individual retirement accounts. After-tax returns for classes other than Class I will vary from returns shown for Class I. "Return After Taxes on Distributions and Sale of Fund Shares" may be higher than other returns for the same period due to a tax benefit of realizing a capital loss on the sale of Fund shares.
AVERAGE ANNUAL TOTAL RETURNS — FOR THE PERIODS ENDED 12.31.23
|
|
|
INCEPTION
DATE OF CLASS |
|
ONE YEAR |
|
FIVE YEAR |
|
SINCE
INCEPTION |
|
|
Class A |
|
|
12.31.14 |
|
|
|
|
|
|
|
|
|
Load Adjusted Return before taxes |
|
|
|
|
10.11 |
% |
|
|
6.61 |
% |
|
|
5.23 |
% |
|
|
Class C |
|
|
12.31.14 |
|
|
|
|
|
|
|
|
|
Load Adjusted Return before taxes |
|
|
|
|
13.69 |
% |
|
|
6.88 |
% |
|
|
5.04 |
% |
|
|
Class I |
|
|
12.31.14 |
|
|
|
|
|
|
|
|
|
Return before taxes |
|
|
|
|
15.88 |
% |
|
|
7.94 |
% |
|
|
6.08 |
% |
|
|
Return after taxes on distributions* |
|
|
|
|
15.55 |
% |
|
|
7.71 |
% |
|
|
5.74 |
% |
|
|
Return after taxes on distributions and sale of Fund shares* |
|
|
|
|
9.39 |
% |
|
|
6.20 |
% |
|
|
4.78 |
% |
|
|
S&P 500 Index |
|
|
|
|
26.29 |
% |
|
|
15.69 |
% |
|
|
11.85 |
% |
|
|
Bloomberg U.S. Aggregate Bond Index |
|
|
|
|
5.53 |
% |
|
|
1.10 |
% |
|
|
1.36 |
% |
|
*
The Bloomberg U.S. Aggregate Bond Index shows how the Fund's performance compares to an index that covers the U.S.-denominated, investment-grade, fixed-rate, taxable bond market of SEC-registered securities. The index includes bonds from the Treasury, Government-Related, Corporate, MBS (agency fixed-rate and hybrid ARM pass-throughs), ABS, and CMBS sectors.
PROSPECTUS | March 1, 2024
13
Calamos Hedged Equity Fund
Investment Adviser
Calamos Advisors LLC
PORTFOLIO MANAGER/
FUND TITLE (IF APPLICABLE) |
|
PORTFOLIO MANAGER
EXPERIENCE IN THE FUND |
|
PRIMARY TITLE
WITH INVESTMENT ADVISER |
|
|
John P. Calamos, Sr. (President, Chairman) |
|
since Fund's inception |
|
Founder, Chairman, and Global CIO |
|
|
Jason Hill |
|
since Fund's inception |
|
SVP, Sr. Co-Portfolio Manager |
|
|
David O'Donohue |
|
8.5 years |
|
SVP, Sr. Co-Portfolio Manager |
|
|
Eli Pars |
|
since Fund's inception |
|
SVP, Sr. Co-Portfolio Manager |
|
|
Jimmy Young |
|
5 years |
|
SVP, Co-Portfolio Manager |
|
|
Anthony Vecchiolla |
|
since February 2023 |
|
VP, Co-Portfolio Manager |
|
Other Important Information Regarding Fund Shares
For important information about purchase and sale of Fund shares, tax information, and financial intermediary compensation, please turn to "Other Important Information Regarding Fund Shares" on Page 125 of the prospectus.
CALAMOS FAMILY OF FUNDS
14
Calamos Phineus Long/Short Fund
Investment Objective
Calamos Phineus Long/Short Fund's investment objective is to seek strong, risk-adjusted and absolute returns in the context of prevailing market conditions across the global equity universe.
Fees and Expenses of the Fund
The following table describes the fees and expenses that you may pay if you buy, hold and sell shares of the Fund. Investors may pay other fees, such as brokerage commissions and/or other forms of compensation to a financial intermediary, which are not reflected in the tables or the examples below. You may qualify for sales charge discounts on purchases of Class A shares if you and your family invest, or agree to invest in the future, at least $50,000 in Calamos Funds. More information about these and other discounts is available from your financial professional and under "Fund Facts — What classes of shares does the Fund offer?" on Page 149 of the Fund's prospectus, in the Appendix to this prospectus and "Share Classes and Pricing of Shares" on Page 67 of the Fund's statement of additional information.
Shareholder Fees (fees paid directly from your investment):
|
|
|
CLASS A |
|
CLASS C |
|
CLASS I |
|
|
Maximum Sales Charge (Load) Imposed on Purchases (as a percentage of offering price) |
|
|
4.75 |
% |
|
|
None |
|
|
|
None |
|
|
Maximum Deferred Sales Charge (Load) (as a percentage of the lesser of the redemption price or
offering price) |
|
|
None |
|
|
|
1.00 |
% |
|
|
None |
|
|
Annual Fund Operating Expenses (expenses that you pay each year as a percentage of the value of your investment):
|
|
|
CLASS A
|
|
CLASS C
|
|
CLASS I
|
|
|
Management Fees
|
|
|
1.23
|
%
|
|
|
1.23
|
%
|
|
|
1.23
|
%
|
|
|
Distribution and/or Service Fees (12b-1)
|
|
|
0.25
|
%
|
|
|
1.00
|
%
|
|
|
None
|
|
|
|
Dividend and Interest Expense on Short Sales1
|
|
|
0.74
|
%
|
|
|
0.74
|
%
|
|
|
0.74
|
%
|
|
|
Other Expenses
|
|
|
0.16
|
%
|
|
|
0.16
|
%
|
|
|
0.16
|
%
|
|
|
Total Annual Fund Operating Expenses
|
|
|
2.38
|
%
|
|
|
3.13
|
%
|
|
|
2.13
|
%
|
|
1
Example
This example is intended to help you compare the cost of investing in the Fund with the cost of investing in other mutual funds. The example assumes that you invest $10,000 in the Fund for the time periods indicated and then either redeem or do not redeem your shares at the end of the reflected time periods. The example also assumes that your investment has a 5% return each year, that all dividends and capital gain distributions are reinvested, that you pay a maximum initial or contingent deferred sales charge and that the Fund's operating expenses remain the same. Although your actual performance and costs may be higher or lower, based on these assumptions, your costs would be:
You would pay the following expenses if you redeemed your shares at the end of the period:
|
|
|
One Year |
|
Three Years |
|
Five Years |
|
Ten Years |
|
|
Class A |
|
|
705 |
|
|
|
1,182 |
|
|
|
1,685 |
|
|
|
3,062 |
|
|
|
Class C |
|
|
416 |
|
|
|
966 |
|
|
|
1,640 |
|
|
|
3,439 |
|
|
|
Class I |
|
|
216 |
|
|
|
667 |
|
|
|
1,144 |
|
|
|
2,462 |
|
|
PROSPECTUS | March 1, 2024
15
Calamos Phineus Long/Short Fund
You would pay the following expenses if you did not redeem your shares:
|
|
|
One Year |
|
Three Years |
|
Five Years |
|
Ten Years |
|
|
Class A |
|
|
705 |
|
|
|
1,182 |
|
|
|
1,685 |
|
|
|
3,062 |
|
|
|
Class C |
|
|
316 |
|
|
|
966 |
|
|
|
1,640 |
|
|
|
3,439 |
|
|
|
Class I |
|
|
216 |
|
|
|
667 |
|
|
|
1,144 |
|
|
|
2,462 |
|
|
Portfolio Turnover
The Fund pays transaction costs, such as commissions, when it buys and sells securities (or "turns over" its portfolio). A higher portfolio turnover rate may indicate higher transaction costs and may result in higher taxes when Fund shares are held in a taxable account. These costs, which are not reflected in the annual fund operating expenses or in the example, affect the Fund's performance. During the Fund's most recent fiscal period, the Fund's portfolio turnover rate was 194% of the average value of its portfolio.
Principal Investment Strategies
Under normal circumstances, the Fund aims to achieve its investment objective primarily by investing globally in publicly listed equity securities, including common stock and American Depositary Receipts ("ADRs"), of issuers of all market capitalizations that operate in the knowledge-based sectors such as technology, communications and media, as well as financial services and healthcare, and other investment companies, including exchange-traded funds ("ETFs"), that track or otherwise provide exposure to such sectors. The Fund's investment adviser (the "Advisor") believes that the heterogeneous, disruptive and volatile nature of many of these sectors is well suited for long/short equity investing. Long investing generally involves buying a security expecting to profit from an increase in its price. Short investing generally involves selling a security that the Fund does not own expecting to profit from a decline in its price at a later time. The Advisor will also consider investing in other sectors if, in the Advisor's opinion, such long and short exposures have favorable potential for contributing value. The Fund may maintain long and short positions through the use of derivative instruments, such as options, futures and forward contracts, without investing directly in the underlying asset. The Fund may also use derivative instruments to attempt to both increase the return of the Fund and hedge (protect) the value of the Fund's assets. The Fund may also invest in cash and cash equivalents.
The Advisor pursues a fundamental, global approach that incorporates a blend of top-down and bottom-up considerations. The advantages of its investment process are based upon: 1) a comprehensive assessment of what drives share prices; 2) how companies and industries are analyzed; and 3) the flexible management of style, capitalization and country factors. The Advisor believes that flexible asset allocation across the global equity universe, with less emphasis upon the traditional role of benchmarks, provides the potential for excess returns.
The Advisor's approach is primarily derived from its assessment of corporate and economic fundamentals. Equally, the Fund's strategy allows for all investment styles (for example, growth versus value, small versus large capitalization) to be considered depending upon a company's business model, prevailing market conditions and the economic cycle. The Advisor believes that stocks with common style characteristics can behave similarly, often in response to the economic cycle, and that these characteristics are an additional source of return that should be identified.
Principal Risks
An investment in the Fund is subject to risks, and you could lose money on your investment in the Fund. There can be no assurance that the Fund will achieve its investment objective. The risks associated with an investment in the Fund can increase during times of significant market volatility. Under certain conditions, even if the value of the Fund's long positions are rising, this could be offset by declining values of the Fund's short positions. Conversely, it is possible that rising values of the Fund's short positions could be offset by declining values of the Fund's long positions. In either scenario the Fund may experience losses. In a market where the value of both the Fund's long and short positions are declining, the Fund may experience substantial losses. Your investment in the Fund is not a deposit in a bank and is not insured or guaranteed by the Federal Deposit Insurance Corporation or any other government agency. The principal risks are presented in alphabetical order to
CALAMOS FAMILY OF FUNDS
16
Calamos Phineus Long/Short Fund
facilitate finding particular risks and comparing them with other funds. Each risk summarized below is considered a "principal risk" of investing in the Fund, regardless of the order in which it appears. The principal risks of investing in the Fund include:
• American Depositary Receipts Risk — The stocks of most foreign companies that trade in the U.S. markets are traded as ADRs. U.S. depositary banks issue these stocks. Each ADR represents one or more shares of foreign stock or a fraction of a share. The price of an ADR corresponds to the price of the foreign stock in its home market, adjusted to the ratio of the ADRs to foreign company shares. Therefore while purchasing a security on a U.S. exchange, the risks inherently associated with foreign investing still apply to ADRs.
• Cash Holdings Risk — To the extent the Fund holds cash positions, the Fund risks achieving lower returns and potential lost opportunities to participate in market appreciation which could negatively impact the Fund's performance and ability to achieve its investment objective.
• Currency Risk — To the extent that the Fund invests in securities or other instruments denominated in or indexed to foreign currencies, changes in currency exchange rates bring an added dimension of risk. Currency fluctuations could negatively impact investment gains or add to investment losses. Although the Fund may attempt to hedge against currency risk, the hedging instruments may not always perform as the Fund expects and could produce losses. Suitable hedging instruments may not be available for currencies of emerging market countries. The Fund's investment adviser may determine not to hedge currency risks, even if suitable instruments appear to be available.
• Derivatives Risk — Derivatives are instruments, such as futures, options, and forward foreign currency contracts, whose value is derived from that of other assets, rates, or indices. The use of derivatives for non-hedging purposes may be considered more speculative than other types of investments. Derivatives can be used for hedging (attempting to reduce risk by offsetting one investment position with another) or non-hedging purposes. Hedging with derivatives may increase expenses, and there is no guarantee that a hedging strategy will work. While hedging can reduce or eliminate losses, it can also reduce or eliminate gains. In addition, derivative instruments are subject to counterparty risk, meaning that the party with whom the Fund enters into the derivatives transaction may experience a significant credit event and/or may be unwilling or unable to make timely settlement payments or otherwise honor its obligations. Changes in the value of a derivative may not correlate perfectly with the underlying asset, rate or index, and the Fund could lose more than the principal amount invested.
• Emerging Markets Risk — Emerging market countries may have relatively unstable governments and economies based on only a few industries, which may cause greater instability. The value of emerging market securities will likely be particularly sensitive to changes in the economies of such countries. These countries are also more likely to experience higher levels of inflation, deflation or currency devaluations, which could hurt their economies and securities markets.
• Equity Securities Risk — The securities markets are volatile, and the market prices of the Fund's securities may decline generally. The price of equity securities fluctuates based on changes in a company's financial condition and overall market and economic conditions. If the market prices of the securities owned by the Fund (i.e., the Fund's long position) fall, the value of your investment in the Fund will decline.
• Foreign Securities Risk — Risks associated with investing in foreign securities include fluctuations in the exchange rates of foreign currencies that may affect the U.S. dollar value of a security, the possibility of substantial price volatility as a result of political and economic instability in the foreign country, less public information about issuers of securities, different securities regulation, different accounting, auditing and financial reporting standards and less liquidity than in U.S. markets.
• Forward Foreign Currency Contract Risk — Forward foreign currency contracts are contractual agreements to purchase or sell a specified currency at a specified future date (or within a specified time period) at a price set at the time of the contract. The Fund may not fully benefit from, or may lose money on, forward foreign currency transactions if changes in currency exchange rates do not occur as anticipated or do not correspond accurately to changes in the value of the Fund's holdings.
• Futures and Forward Contracts Risk — Futures contracts provide for the future sale by one party and purchase by another of a specific asset at a specific time and price (with or without delivery required). Futures contracts are
PROSPECTUS | March 1, 2024
17
Calamos Phineus Long/Short Fund
standardized contracts traded on a recognized exchange. An option on a futures contract gives the purchaser the right, in exchange for a premium, to assume a position in a futures contract at a specified exercise price during the term of the options. Forward contracts involve a negotiated obligation to purchase or sell an asset at a future date (with or without delivery required), which may be any fixed number of days from the date of the contract agreed upon by the parties, at a price set at the time of the contract. Forward contracts are not traded on exchanges; rather, a bank or dealer will act as agent or as principal in order to make or take future delivery of a specified lot of a particular security or currency for the Fund's account. Futures and forward contracts are subject to counterparty risk, meaning that the party with whom the Fund enters into the derivatives transaction (the clearinghouse or the broker holding the Fund's position for a futures contract or the counterparty for a forward contract) may experience a significant credit event and/or may be unwilling or unable to make timely settlement payments or otherwise honor its obligations.
• Geographic Concentration Risk — Investments in a particular country or geographic region may be particularly susceptible to political, diplomatic, or economic conditions and regulatory requirements. To the extent the Fund concentrates its investments in a particular country, region or group of regions, the Fund may be more volatile than a more geographically diversified fund.
• Leveraging Risk — Leverage is the potential for the Fund to participate in gains and losses on an amount that exceeds the Fund's investment. Leveraging risk is the risk that certain transactions of the Fund may cause the Fund to be more volatile and experience greater losses than if it had not been leveraged. The Fund's use of short sales and investments in derivatives subject the Fund to leveraging risk.
• Liquidity Risk — Liquidity risk exists when particular investments are difficult to purchase or sell. The Fund's investments in illiquid securities may reduce the returns of the Fund because it may be unable to sell the illiquid securities at an advantageous time or price.
• Options Risk — The Fund's ability to close out its position as a purchaser or seller of an over-the-counter or exchange- listed put or call option is dependent, in part, upon the liquidity of the options market. There are significant differences between the securities and options markets that could result in an imperfect correlation among these markets, causing a given transaction not to achieve its objectives. The Fund's ability to utilize options successfully will depend on the ability of the Fund's investment adviser to predict pertinent market movements, which cannot be assured. The Fund may also purchase or write over-the-counter put or call options, which involves risks different from, and possibly greater than, the risks associated with exchange-listed put or call options. In some instances, over-the-counter put or call options may expose the Fund to the risk that a counterparty may be unable or unwilling to perform according to a contract, and that any deterioration in a counterparty's creditworthiness could adversely affect the instrument. In addition, the Fund may be exposed to a risk that losses may exceed the amount originally invested.
• Other Investment Companies (including ETFs) Risk — The Fund may invest in the securities of other investment companies to the extent that such investments are consistent with the Fund's investment objective and the policies are permissible under the 1940 Act. Investments in the securities of other investment companies, including ETFs, may involve duplication of advisory fees and certain other expenses. Additionally, if the investment company or ETF fails to achieve its investment objective, the value of the Fund's investment will decline, adversely affecting the Fund's performance. In addition, closed end investment company and ETF shares potentially may trade at a discount or a premium and are subject to brokerage and other trading costs, which could result in greater expenses to the Fund. In addition, the Fund may engage in short sales of the securities of other investment companies. When the Fund shorts securities of another investment company, it borrows shares of that investment company which it then sells. The Fund closes out a short sale by purchasing the security that it has sold short and returning that security to the entity that lent the security.
• Portfolio Selection Risk — The value of your investment may decrease if the investment adviser's judgment about the attractiveness, value or market trends affecting a particular security, issuer, industry or sector or about market movements is incorrect.
• Portfolio Turnover Risk — The portfolio manager may actively and frequently trade securities or other instruments in the Fund's portfolio to carry out its investment strategies. A high portfolio turnover rate increases transaction costs, which
CALAMOS FAMILY OF FUNDS
18
Calamos Phineus Long/Short Fund
may increase the Fund's expenses. Frequent and active trading may also cause adverse tax consequences for investors in the Fund due to an increase in short-term capital gains.
• Sector Risk — To the extent the Fund invests a significant portion of its assets in a particular sector, a greater portion of the Fund's performance may be affected by the general business and economic conditions affecting that sector. Each sector may share economic risk with the broader market, however there may be economic risks specific to each sector. As a result, returns from those sectors may trail returns from the overall stock market and it is possible that the Fund may underperform the broader market, or experience greater volatility.
• Securities Lending Risk — The Fund may lend its portfolio securities to broker-dealers and banks in order to generate additional income for the Fund. Any such loan must be continuously secured by collateral in cash or cash equivalents maintained on a current basis in an amount at least equal to the market value of the securities loaned by the Fund. In the event of bankruptcy or other default of a borrower of portfolio securities, the Fund could experience both delays in liquidating the loan collateral or recovering the loaned securities and losses, including (a) possible decline in the value of the collateral or in the value of the securities loaned during the period while the Fund seeks to enforce its rights thereto, (b) possible subnormal levels of income and lack of access to income during this period, and (c) expenses of enforcing its rights. In an effort to reduce these risks, the Fund's securities lending agent monitors, and reports to Calamos Advisors on, the creditworthiness of the firms to which a Fund lends securities. The Fund may also experience losses as a result of a diminution in value of its cash collateral investments.
• Short Sale Risk — The Fund may incur a loss (without limit) as a result of a short sale if the market value of the borrowed security (i.e., the Fund's short position) increases between the date of the short sale and the date the Fund replaces the security. The Fund may be unable to repurchase the borrowed security at a particular time or at an acceptable price.
• Small and Mid-Sized Company Stock Risk — Small to mid-sized company stocks have historically been subject to greater investment risk than large company stock. The prices of small to mid-sized company stocks tend to be more volatile and less liquid than large company stocks. Small and mid-sized companies may have no or relatively short operating histories, or be newly formed public companies. Some of these companies have aggressive capital structures, including high debt levels, or are involved in rapidly growing or changing industries and/or new technologies, which pose additional risks.
Fund Performance
The following bar chart and table indicate the risks of investing in the Fund by showing changes in the Fund's performance from calendar year to calendar year and how the Fund's average annual total returns compare with those of a broad measure of market performance. All returns include the reinvestment of dividends and distributions. The performance shown in the bar chart and performance table for the years prior to 2017 is that of another investment vehicle (the "Phineus Predecessor Fund") prior to the commencement of the Fund's operations. The Phineus Predecessor Fund was reorganized into Class I shares of the Fund on April 6, 2016. On October 1, 2015, the parent company of Calamos Advisors purchased Phineus Partners LP ("Phineus"), the prior general partner and investment manager to the Phineus Predecessor Fund and investment manager to the Phineus Predecessor Fund's master fund. Calamos Advisors served as the investment manager to the Phineus Predecessor Fund's master fund from October 1, 2015 to April 5, 2016 and the general partner and investment manager of the Phineus Predecessor Fund from February 25, 2016 and April 5, 2016. The Phineus Predecessor Fund commenced operations on May 1, 2002 and, since that time, has had various periods where it implemented its investment strategy directly on a stand-alone basis or indirectly through its investment in a master fund, which had the same investment policies, objectives, guidelines and restrictions as the Phineus Predecessor Fund.
Regardless of whether the Phineus Predecessor Fund operated as a stand-alone fund or invested indirectly through a master fund, Phineus and Calamos Advisors managed the Phineus Predecessor Fund's assets using investment policies, objectives, guidelines and restrictions that were in all material respects equivalent to those of the Fund. The Phineus Predecessor Fund performance information in the bar chart and table has been adjusted to reflect Class I share, and with respect to the table, Class A and Class C share expenses. However, the Phineus Predecessor Fund was not a registered mutual fund and so it was
PROSPECTUS | March 1, 2024
19
Calamos Phineus Long/Short Fund
not subject to the same investment and tax restrictions as the Fund. If it had been, the Phineus Predecessor Fund's performance may have been lower. As always, please note that the Fund's past performance (before and after taxes) cannot predict how it will perform in the future. Updated Fund performance information is available at no cost by visiting www.calamos.com or by calling 800.582.6959.
CLASS I* ANNUAL TOTAL RETURN FOR YEARS ENDED 12.31

|
Highest Quarterly Return: |
|
|
24.69 |
% (12.31.2020) |
|
Lowest Quarterly Return: |
|
|
-11.48 |
% (3.31.2020) |
|
* Annual returns for Class I are provided because Class I shares represent the largest percentage of assets in the Calamos Family of Funds.
Average Annual Total Returns as of 12.31.23
The following table shows how the Fund's average annual performance (before and after taxes) for the one-, five-, and ten- year periods ended December 31, 2023 and since the Phineus Predecessor Fund's inception compare with broad measures of market performance. "Since Inception" returns shown for each index are returns since the inception of the Phineus Predecessor Fund, or since the nearest subsequent month end when comparative index data is available only for full monthly periods. The after-tax returns show the impact of assumed federal income taxes on an investment in the Fund. "Return After Taxes on Distributions" shows the effect of taxable distributions, but assumes that you still hold the Fund shares at the end of the period and so do not have any taxable gain or loss on your investment. "Return After Taxes on Distributions and Sale of Fund Shares" shows the effect of taxable distributions and any taxable gain or loss that would be realized if the Fund shares were purchased at the beginning and sold at the end of the specified period.
The after-tax returns are shown only for Class I shares, and are calculated using the historical highest individual federal marginal income tax rates and do not reflect the impact of state and local taxes. Actual after-tax returns depend on an investor's tax situation and may differ from those shown, and the after-tax returns shown are not relevant to investors who hold their Fund shares through tax-advantaged arrangements, such as 401(k) plans or individual retirement accounts. After-tax returns for classes other than Class I shares will vary from returns shown for Class I shares. "Return After Taxes on Distributions and Sale of Fund Shares" may be higher than other returns for the same period due to a tax benefit of realizing a capital loss on the sale of Fund shares.
CALAMOS FAMILY OF FUNDS
20
Calamos Phineus Long/Short Fund
AVERAGE ANNUAL TOTAL RETURNS — FOR THE PERIODS ENDED 12.31.23
|
|
|
INCEPTION
DATE OF CLASS |
|
ONE YEAR |
|
FIVE YEAR |
|
TEN YEAR |
|
SINCE
INCEPTION |
|
|
Class A |
|
|
5.1.02 |
|
|
|
|
|
|
|
|
|
|
|
Load Adjusted Return before taxes |
|
|
|
|
2.56 |
% |
|
|
6.16 |
% |
|
|
4.99 |
% |
|
|
9.29 |
% |
|
|
Class C |
|
|
5.1.02 |
|
|
|
|
|
|
|
|
|
|
|
Load Adjusted Return before taxes |
|
|
|
|
5.91 |
% |
|
|
6.38 |
% |
|
|
4.71 |
% |
|
|
8.73 |
% |
|
|
Class I |
|
|
5.1.02 |
|
|
|
|
|
|
|
|
|
|
|
Return before taxes |
|
|
|
|
8.04 |
% |
|
|
7.46 |
% |
|
|
5.77 |
% |
|
|
9.82 |
% |
|
|
Return after taxes on distributions* |
|
|
|
|
7.23 |
% |
|
|
7.26 |
% |
|
|
5.45 |
% |
|
|
9.67 |
% |
|
Return after taxes on distributions and sale of
Fund shares* |
|
|
|
|
4.76 |
% |
|
|
5.78 |
% |
|
|
4.48 |
% |
|
|
8.57 |
% |
|
|
S&P 500 Index |
|
|
|
|
26.29 |
% |
|
|
15.69 |
% |
|
|
12.03 |
% |
|
|
9.23 |
% |
|
|
MSCI World Index |
|
|
|
|
24.42 |
% |
|
|
13.37 |
% |
|
|
9.18 |
% |
|
|
8.21 |
% |
|
*
The MSCI World Index is designed to measure the equity market performance of developed markets. The MSCI World Index is provided to show how the Fund's performance compares with the returns of an index of securities similar to those in which the Fund invests.
Investment Adviser
Calamos Advisors LLC
PORTFOLIO MANAGER/
FUND TITLE (IF APPLICABLE) |
|
PORTFOLIO MANAGER
EXPERIENCE IN THE FUND |
|
PRIMARY TITLE
WITH INVESTMENT ADVISER |
|
|
Michael Grant |
|
since Fund's inception |
|
SVP, Sr. Co-Portfolio Manager |
|
Other Important Information Regarding Fund Shares
For important information about purchase and sale of Fund shares, tax information, and financial intermediary compensation, please turn to "Other Important Information Regarding Fund Shares" on Page 125 of the prospectus.
PROSPECTUS | March 1, 2024
21
Calamos Merger Arbitrage Fund
Investment Objective
Calamos Merger Arbitrage Fund's investment objective is long-term capital appreciation.
Fees and Expenses of the Fund
The following table describes the fees and expenses that you may pay if you buy, hold and sell shares of the Fund. Investors may pay other fees, such as brokerage commissions and/or other forms of compensation to a financial intermediary, which are not reflected in the tables or the examples below. You may qualify for sales charge discounts on purchases of Class A shares of the Fund if you and your family invest, or agree to invest in the future, at least $50,000 in Calamos Funds. More information about discounts is available from your financial professional and under "Fund Facts — What classes of shares does the Fund offer?" on page 149 of the Fund's prospectus, in the Appendix to this prospectus and "Share Classes and Pricing of Shares" on page 67 of the Fund's statement of additional information.
Shareholder Fees (fees paid directly from your investment):
|
|
|
CLASS A |
|
CLASS C |
|
CLASS I |
|
|
Maximum Sales Charge (Load) Imposed on Purchases (as a percentage of offering price) |
|
|
2.75 |
% |
|
|
None |
|
|
|
None |
|
|
Maximum Deferred Sales Charge (Load) (as a percentage of the lesser of the redemption price or
offering price) |
|
|
None |
|
|
|
1.00 |
% |
|
|
None |
|
|
Annual Fund Operating Expenses (expenses that you pay each year as a percentage of the value of your investment):
|
|
|
CLASS A |
|
CLASS C |
|
CLASS I |
|
|
Management Fees |
|
|
1.00 |
% |
|
|
1.00 |
% |
|
|
1.00 |
% |
|
|
Distribution and/or Service Fees (12b-1) |
|
|
0.25 |
% |
|
|
1.00 |
% |
|
|
None |
|
|
|
Other Expenses1 |
|
|
4.81 |
% |
|
|
4.81 |
% |
|
|
4.81 |
% |
|
|
Total Annual Fund Operating Expenses |
|
|
6.06 |
% |
|
|
6.81 |
% |
|
|
5.81 |
% |
|
|
Expense Reimbursement2 |
|
|
(4.56 |
)% |
|
|
(4.56 |
)% |
|
|
(4.56 |
)% |
|
|
Total Annual Fund Operating Expenses After Reimbursement |
|
|
1.50 |
% |
|
|
2.25 |
% |
|
|
1.25 |
% |
|
1
2
Example
This example is intended to help you compare the cost of investing in the Fund with the cost of investing in other mutual funds. The example assumes that you invest $10,000 in the Fund for the time periods indicated and then either redeem or do not redeem your shares at the end of the reflected time periods. The example also assumes that your investment has a 5% return each year that all dividends and capital gain distributions are reinvested, that you pay a maximum initial or contingent deferred sales charge and that the Fund's operating expenses remain the same. Any applicable fee waivers and/or expense reimbursements are reflected in the below examples for the period through October 31, 2026. Although your actual performance and costs may be higher or lower, based on these assumptions, your costs would be:
You would pay the following expenses if you redeemed your shares at the end of the period:
|
|
|
One Year
|
|
Three Years
|
|
|
Class A
|
|
|
423
|
|
|
|
893
|
|
|
|
Class C
|
|
|
328
|
|
|
|
861
|
|
|
|
Class I
|
|
|
127
|
|
|
|
559
|
|
|
CALAMOS FAMILY OF FUNDS
22
Calamos Merger Arbitrage Fund
You would pay the following expenses if you did not redeem your shares:
|
|
|
One Year
|
|
Three Years
|
|
|
Class A
|
|
|
423
|
|
|
|
893
|
|
|
|
Class C
|
|
|
228
|
|
|
|
861
|
|
|
|
Class I
|
|
|
127
|
|
|
|
559
|
|
|
Portfolio Turnover
The Fund pays transaction costs, such as commissions, when it buys and sells securities (or "turns over" its portfolio). A higher portfolio turnover rate may indicate higher transaction costs and may result in higher taxes when Fund shares are held in a taxable account. These costs, which are not reflected in the annual fund operating expenses or in the example, affect the Fund's performance. During the period from September 29, 2023 (commencement of operations) through October 31, 2023, the Fund's portfolio turnover rate was 13% of the average value of its portfolio.
Principal Investment Strategies
The Fund utilizes an actively managed merger arbitrage strategy by establishing long and short positions in the securities of companies that are involved in significant corporate events or transactions, such as mergers, acquisitions and other buy-out transactions. The Fund seeks to achieve its investment objective by generating absolute, uncorrelated returns to equity and fixed income markets. Under normal market conditions, the Fund will invest at least 80% of its net assets (plus the amount of any borrowings for investment purposes) in common stock, convertible securities, special purpose acquisition companies or similar special purpose entities (collectively, "SPACs"), preferred stock, corporate bonds, warrants and options of U.S. and non-U.S. companies (including in emerging markets) which are involved, or which Calamos Advisors believes will be involved, in a variety of significant corporate events including, but not limited to mergers, takeovers, tender offers, leveraged buyouts, spin-offs, liquidations and other corporate transactions ("merger-arbitrage investments"). During market conditions when there are fewer corporate events or transactions as described above, the Fund may invest a significant portion of its assets in securities issued by the U.S. Government, its agencies or government-sponsored enterprises or cash and cash equivalents in anticipation of merger arbitrage investment opportunities.
The Fund's investment process focuses on identifying desirable risk-adjusted opportunities to capture the "spread" between the price at which a target company's stock trades following an announcement that it is to be acquired or participate in another corporate transaction and the ultimate price to be paid for such stock upon completion of the transaction. The Fund will establish short positions in securities of such companies. The Fund may seek to purchase securities at prices only slightly below the anticipated value to be paid or exchanged for such securities in the merger, exchange offer or cash tender offer (and substantially above the price at which such securities traded immediately prior to the announcement of the merger, exchange offer or cash tender offer). Likewise, when Calamos Advisors believes it is likely that a transaction will not be consummated, the Fund may take short positions in such securities in order to seek to capture the difference attributable to the perceived market overvaluation of the acquisition target. The Fund may hold short positions in the target company and/or the acquiring company in a corporate transaction. In addition to holding a long position with respect to a company, part of the Fund's merger arbitrage strategy may include holding a short position to hedge risk in the Fund's portfolio.
The investment team utilizes both quantitative and fundamental research to identify those transactions which it believes provide desirable risk-adjusted opportunities. The fundamental research encompasses analysis of (i) the macro conditions that could influence the timing or probability of transaction completion, (ii) the specific facts and circumstances surrounding a transaction, and (iii) the valuation of the company as a standalone business in the event that the transaction is not consummated. While the team seeks to identify spreads that imply a mispriced transaction completion or duration risk, they will also look for other market-driven opportunities embedded in the "spread," including inefficiencies due to liquidity constraints in the arbitrage market or dislocations in merger spreads caused by other factors. The quantitative process consists of proprietary analysis surrounding both valuation (including valuation of derivatives on the equity of the target company) and other market conditions (e.g., liquidity).
PROSPECTUS | March 1, 2024
23
Calamos Merger Arbitrage Fund
The investment team will employ a variety of strategies to seek to manage the risks associated with the Fund's strategies, which may include investing across the capital structure of a company, most notably by investing in convertible securities (including synthetic convertible securities), other derivative instruments, including options, as well as corporate debt. The convertible securities in which the Fund invests may be either debt securities or preferred stocks that can be exchanged for common stock.
The Fund may invest significantly in SPACs. A SPAC investment typically represents an investment in a special purpose vehicle that seeks to identify and effect an acquisition of, or merger with, an operating company in a particular industry or sector. During the period when management of the SPAC seeks to identify a potential acquisition or merger target, typically most of the capital raised for that purpose (less a portion retained to cover expenses) is invested in income-producing investments. The Fund may invest in SPACs for a variety of investment purposes, including to achieve income. Some SPACs provide the opportunity for common shareholders to have some or all of their shares redeemed by the SPAC at or around the time a proposed merger or acquisition is expected to occur. The Fund may sell its investments in SPACs at any time, including before, at or after the time of a merger or acquisition. For purposes of the Fund's 80% policy discussed above, a SPAC is considered to be a merger-arbitrage investment throughout its life cycle.
The Fund may invest in certain companies that have alternative business structures, such as Master Limited Partnerships ("MLPs"). MLPs are publicly traded partnerships that trade on public securities exchanges similar to the shares of a corporation, without entity level taxation. In addition, the Fund may also invest in the real estate industry, including real estate investment trusts (REITs) and non-investment grade bonds (high yield or "junk bonds").
The Fund may invest up to 35% of its net assets in foreign securities, including securities in emerging markets. Foreign securities are securities issued by issuers that are organized under the laws of a foreign country or that have a substantial portion of their operations or assets in a foreign country or countries, or that derive a substantial portion of their revenue or profits from businesses, investments or sales outside of the United States. The Fund's investments in foreign securities include stocks of foreign companies that are represented in the United States securities markets by American Depositary Receipts ("ADRs") or similar depository arrangements. The Fund's foreign debt investments can be denominated in U.S. dollars or in foreign currencies. Debt securities issued by a foreign government may not be supported by the "full faith and credit" of that government.
A synthetic convertible instrument is designed to simulate the economic characteristics of a convertible security through the combined features of a debt instrument, or loan, and a security providing an option on an equity security. The Fund may establish a synthetic convertible instrument by combining a fixed-income security with the right to acquire an equity security. The fixed-income and equity option components may have different issuers, and either component may change at any time.
The Fund may utilize derivatives to enhance return and yield potential and also for risk management purposes by buying or selling options to (i) pursue upside capture opportunities (ii) hedge downside risk or (iii) enhance portfolio yield. When seeking to generate income from option premiums, the Fund will write (sell) options, which could include the use of both call and put options. The Fund may write call options on a portion of the equity securities (including securities that are convertible into equity securities) in the Fund's portfolio and/or on broad-based securities indexes (such as the S&P 500 or MSCI EAFE) or ETFs (exchange traded funds).
The Fund is classified as "non-diversified" under the Investment Company Act of 1940 (the "1940 Act"). The Fund's ability to broadly diversify its holdings is impacted by the number of merger arbitrage opportunities that exist and, as a result, may not meet the tests for being classified as a diversified fund.
Principal Risks
An investment in the Fund is subject to risks, and you could lose money on your investment in the Fund. There can be no assurance that the Fund will achieve its investment objective. The risks associated with an investment in the Fund can increase during times of significant market volatility. Your investment in the Fund is not a deposit in a bank and is not insured or guaranteed by the Federal Deposit Insurance Corporation or any other government agency. The principal risks are presented in alphabetical order to facilitate finding particular risks and comparing them with other funds. Each risk summarized below is
CALAMOS FAMILY OF FUNDS
24
Calamos Merger Arbitrage Fund
considered a "principal risk" of investing in the Fund, regardless of the order in which it appears. The principal risks of investing in the Fund include:
• American Depositary Receipts Risk — The stocks of most foreign companies that trade in the U.S. markets are traded as American Depositary Receipts (ADRs). U.S. depositary banks issue these stocks. Each ADR represents one or more shares of foreign stock or a fraction of a share. The price of an ADR corresponds to the price of the foreign stock in its home market, adjusted to the ratio of the ADRs to foreign company shares. Therefore while purchasing a security on a U.S. exchange, the risks inherently associated with foreign investing still apply to ADRs.
• Call Risk — A fixed-income security may be redeemed before maturity ("called") below its current market price, and a call may lead to the reinvestment of proceeds at a lower interest rate, or with higher credit risk or other less favorable characteristics.
• Convertible Hedging Risk — If the market price of the underlying common stock increases above the conversion price on a convertible security, the price of the convertible security will increase. The Fund's increased liability on any outstanding short position would, in whole or in part, reduce this gain.
• Convertible Securities Risk — The value of a convertible security is influenced by changes in interest rates, with investment value declining as interest rates increase and increasing as interest rates decline. The credit standing of the issuer and other factors also may have an effect on the convertible security's investment value.
• Covered Call Writing Risk — As the writer of a covered call option on a security, the Fund foregoes, during the option's life, the opportunity to profit from increases in the market value of the security covering the call option above the sum of the premium and the exercise price of the call.
• Currency Risk — To the extent that the Fund invests in securities or other instruments denominated in or indexed to foreign currencies, changes in currency exchange rates bring an added dimension of risk. Currency fluctuations could negatively impact investment gains or add to investment losses. Although the Fund may attempt to hedge against currency risk, the hedging instruments may not always perform as the Fund expects and could produce losses. Suitable hedging instruments may not be available for currencies of emerging market countries. The Fund's investment adviser may determine not to hedge currency risks, even if suitable instruments appear to be available.
• Debt Securities Risk — Debt securities are subject to various risks, including interest rate risk, credit risk and default risk.
• Interest Rate Risk — The value of debt securities generally decreases in periods when interest rates are rising. In addition, interest rate changes typically have a greater effect on prices of longer-term debt securities than shorter term debt securities. Changes in interest rates by the Federal Reserve Board, and other events affecting fixed-income markets, may subject a Fund to heightened interest rate risk as a result of a rise in interest rates.
• Credit Risk — A debt security could deteriorate in quality to such an extent that its rating is downgraded or its market value declines relative to comparable securities. Changes in actual or perceived creditworthiness may occur quickly. If the Fund holds securities that have been downgraded, or that default on payment, the Fund's performance could be negatively affected.
• Default Risk — A company that issues a debt security may be unable to fulfill its obligation to repay principal and interest. The lower a bond is rated, the greater its default risk. To the extent the Fund holds securities that have been downgraded, or that default on payment, its performance could be negatively affected.
• Limited Voting Risk — Debt securities typically do not provide any voting rights, except in cases when interest payments have not been made and the issuer is in default.
• Derivatives Risk — Derivatives are instruments, such as futures and forward foreign currency contracts, whose value is derived from that of other assets, rates or indices. The use of derivatives for non-hedging purposes may be considered more speculative than other types of investments. Derivatives can be used for hedging (attempting to reduce risk by offsetting one investment position with another) or non-hedging purposes. Hedging with derivatives may increase expenses, and there is no guarantee that a hedging strategy will work. While hedging can reduce or eliminate losses, it can also reduce or eliminate gains. In addition, derivative instruments are subject to counterparty risk, meaning that the
PROSPECTUS | March 1, 2024
25
Calamos Merger Arbitrage Fund
party with whom the Fund enters into a derivative transaction may experience a significant credit event and/or may be unwilling or unable to make timely settlement payments or otherwise honor its obligations. Changes in the value of a derivative may not correlate perfectly with the underlying asset, rate or index, and the Fund could lose more than the principal amount invested.
• Emerging Markets Risk — Emerging market countries may have relatively unstable governments and economies based on only a few industries, which may cause greater instability. The value of emerging market securities will likely be particularly sensitive to changes in the economies of such countries. These countries are also more likely to experience higher levels of inflation, deflation or currency devaluations, which could hurt their economies and securities markets.
• Equity Securities Risk — The securities markets are volatile, and the market prices of the Fund's securities may decline generally. The price of equity securities fluctuates based on changes in a company's financial condition and overall market and economic conditions. If the market prices of the securities owned by the Fund fall, the value of your investment in the Fund will decline.
• Focused Investing Risk — To the extent that the Fund invests a substantial portion of its assets in securities related to a particular industry, sector, market segment, or geographic area, its investments will be sensitive to developments in that industry, sector, market segment, or geographic area. The Fund is subject to the risk that changing economic conditions; changing political or regulatory conditions; or natural and other disasters affecting the particular industry, sector, market segment, or geographic area in which the Fund focuses its investments could have a significant impact on its investment performance and could ultimately cause the Fund to underperform, or its net asset value to be more volatile than, other funds that invest more broadly.
• Foreign Securities Risk — Risks associated with investing in foreign securities include fluctuations in the exchange rates of foreign currencies that may affect the U.S. dollar value of a security, the possibility of substantial price volatility as a result of political and economic instability in the foreign country, less public information about issuers of securities, different securities regulation, different accounting, auditing and financial reporting standards and less liquidity than in U.S. markets.
• Hedging Transaction Risk — The success of the Fund's hedging strategies will be subject to Calamos Advisors' ability to correctly assess the degree of correlation between the performance of the instruments used in the hedging strategies and the performance of the investments in the Fund's portfolio being hedged. Hedging transactions involve the risk of imperfect correlation. Imperfect correlation may prevent the Fund from achieving the intended hedge or expose the Fund to risk of loss. Hedging transactions also limit the opportunity for gain if the value of a hedged portfolio position should increase.
• High Yield Risk — High yield securities and unrated securities of similar credit quality (commonly known as "junk bonds") are subject to greater levels of credit and liquidity risks. High yield securities are considered primarily speculative with respect to the issuer's continuing ability to make principal and interest payments.
• Lack of Correlation Risk; Hedging Risk — There can be no assurance that the Fund's hedges will be effective. Any decrease in negative correlation or increase in positive correlation between the positions Calamos Advisors anticipated would be offsetting (such as short and long positions in securities or currencies held by the Fund) could result in significant losses for the Fund.
• Liquidity Risk — Liquidity risk exists when particular investments are difficult to purchase or sell. The Fund's investments in illiquid securities may reduce the returns of the Fund because it may be unable to sell the illiquid securities at an advantageous time or price.
• Merger and Other Arbitrage Transactions Risk — In the case of an investment in a potential acquisition target, if the proposed merger, exchange offer or cash tender offer appears likely not to be consummated, in fact is not consummated, or is delayed, the market price of the security to be tendered or exchanged will usually decline sharply, resulting in a loss to the Fund. Every merger transaction is subject to unique risks. The risks of investing in securities related to a merger or acquisition transaction include the risk that the transaction is renegotiated, the risk that the transaction takes longer to complete than originally planned, and the risk that the transaction is never completed. These risks may occur for a variety
CALAMOS FAMILY OF FUNDS
26
Calamos Merger Arbitrage Fund
of reasons, such as the inability to finance the transaction, lack of regulatory approval from the applicable state, federal or international regulatory agencies, or the failure of shareholders of the party companies to approve the transaction. These risks could cause the Fund to incur a loss.
• MLP Risk — Investments in securities of Master Limited Partnerships ("MLPs") involve risk that differ from investments in common stock, including risks related to limited control and limited rights to vote on matters affecting the MLP, risks related to the potential conflicts of interest between the MLP and the MLP's general partners, cash flow risks, dilution risks and risks related to the general partners right to require unit holders to sell their common units at an undesirable time or price.
• MLP Tax Risk — MLPs generally do not pay federal income tax at the partnership level. Rather, each partner is allocated a share of the partnerships' income, gains, losses, deductions and credits. A change in current tax law, or a change in the underlying business of an MLP, could result in an MLP being treated as a corporation, instead of a partnership, for federal income tax purposes, which would result in such MLP being required to pay income tax on its taxable income. This would have the effect of reducing the amount of cash available for distribution by the MLP, potentially reducing the value of the Fund's investment and consequently your investment in the Fund.
• MLP Liquidity Risk — Although common units of MLPs trade on the NYSE, the NASDAQ and Amex, certain MLP securities trade less frequently than those of larger companies due to their smaller capitalization. As a result, the price of such MLPs may display abrupt and erratic movements at times. Additionally it may be more difficult for the Fund to buy and sell significant amounts of such securities without unfavorable impact on prevailing market process. As a result, these securities may be difficult to dispose of at a fair price when the Adviser desires to do so. This may adversely affect the Fund's ability to take advantage of other market opportunities or make dividend distributions.
• Equity Securities of MLPs Risk — MLP common units, like other equity securities, can be affected by macro-economic and other factors affecting the stock market in general, expectations of interest rates, investor sentiment towards an issuer or certain market sector, changes in a particular issuer's financial condition, or unfavorable or unanticipated poor performance of a particular issuer (in the case of MLPs, generally measured in terms of distributable cash flow). Prices of common units of individual MLPs, like the prices of other equity securities, also can be affected by fundamentals unique to the partnership or company, including earnings power and coverage ratios.
• Non-diversified Fund Risk — As a non-diversified fund, the Fund may invest a greater percentage of its assets in a smaller number of investments than a diversified fund. Therefore, the Fund may be subject to increased risk as a result of changes in the financial condition or the market's assessment of such investments.
• Options Risk — The Fund's ability to close out its position as a purchaser or seller of an over-the-counter or exchange- listed put or call option is dependent, in part, upon the liquidity of the options market. There are significant differences between the securities and options markets that could result in an imperfect correlation among these markets, causing a given transaction not to achieve its objectives. The Fund's ability to utilize options successfully will depend on the ability of the Fund's investment adviser to predict pertinent market movements, which cannot be assured.
• Other Investment Companies (including ETFs) Risk — The Fund may invest in the securities of other investment companies to the extent that such investments are consistent with the Fund's investment objective and the policies are permissible under the 1940 Act. Investments in the securities of other investment companies, including ETFs, may involve duplication of advisory fees and certain other expenses. Additionally, if the investment company or ETF fails to achieve its investment objective, the value of the Fund's investment will decline, adversely affecting the Fund's performance. In addition, closed end investment company and ETF shares potentially may trade at a discount or a premium and are subject to brokerage and other trading costs, which could result in greater expenses to the Fund. In addition, the Fund may engage in short sales of the securities of other investment companies. When the Fund shorts securities of another investment company, it borrows shares of that investment company which it then sells. The Fund closes out a short sale by purchasing the security that it has sold short and returning that security to the entity that lent the security.
• Portfolio Selection Risk — The value of your investment may decrease if the investment adviser's judgment about the attractiveness, value or market trends affecting a particular security, issuer, industry or sector or about market movements is incorrect.
PROSPECTUS | March 1, 2024
27
Calamos Merger Arbitrage Fund
• Portfolio Turnover Risk — The portfolio managers may actively and frequently trade securities or other instruments in the Fund's portfolio to carry out its investment strategies. A high portfolio turnover rate increases transaction costs, which may increase the Fund's expenses. Frequent and active trading may also cause adverse tax consequences for investors in the Fund due to an increase in short-term capital gains.
• REITs Risk — Investments in the real estate industry, including real estate investment trusts (REITs), are particularly sensitive to economic downturns and are sensitive to factors such as changes in real estate values, property taxes and tax laws, interest rates, cash flow of underlying real estate assets, occupancy rates, government regulations affecting zoning, land use and rents and the management skill and creditworthiness of the issuer. Companies in the real estate industry also may be subject to liabilities under environmental and hazardous waste laws. In addition, the value of a REIT is affected by changes in the value of the properties owned by the REIT or mortgage loans held by the REIT. REITs are also subject to default and prepayment risk. Many REITs are highly leveraged, increasing their risk. A Fund will indirectly bear its proportionate share of expenses, including management fees, paid by each REIT in which it invests in addition to the expenses of the Fund.
• Rule 144A Securities Risk — The Fund may invest in securities that are issued and sold through transactions under Rule 144A of the Securities Act of 1933. Under the supervision of its board of trustees, the Fund will determine whether Rule 144A Securities are illiquid. If qualified institutional buyers are unwilling to purchase these Rule 144A Securities, the percentage of the Fund's assets invested in illiquid securities would increase. Typically, the Fund purchases Rule 144A Securities only if the Fund's adviser has determined them to be liquid. If any Rule 144A Security held by the Fund should become illiquid, the value of the security may be reduced and a sale of the security may be more difficult
• Sector Risk — To the extent the Fund invests a significant portion of its assets in a particular sector, a greater portion of the Fund's performance may be affected by the general business and economic conditions affecting that sector. Each sector may share economic risk with the broader market, however there may be economic risks specific to each sector. As a result, returns from those sectors may trail returns from the overall stock market and it is possible that the Fund may underperform the broader market, or experience greater volatility.
• Short Sale Risk — As part of its actively managed merger arbitrage strategy, the Fund will establish short positions in the securities of companies that are involved in announced mergers, acquisitions and other buy-out transactions. The Fund may incur a loss (without limit) as a result of a short sale if the market value of the borrowed security (i.e., the Fund's short position) increases between the date of the short sale and the date the Fund replaces the security. The Fund may be unable to repurchase the borrowed security at a particular time or at an acceptable price.
• Small and Mid-Sized Company Risk — Small and mid-sized company stocks have historically been subject to greater investment risk than large company stocks. The prices of small and mid-sized company stocks tend to be more volatile than prices of large company stocks. Small and mid-sized companies may have no or relatively short operating histories, or be newly formed public companies. Some of these companies have aggressive capital structures, including high debt levels, or are involved in rapidly growing or changing industries and/or new technologies, which pose additional risks.
• Special Purpose Acquisition Companies Risk — The Fund may invest in special purpose acquisition companies or similar special purpose entities (collectively, "SPACs"). Because SPACs and similar entities have no operating history or ongoing business other than seeking acquisitions, the value of their securities is particularly dependent on the ability of the entity's management to identify and complete a profitable acquisition. Some SPACs may pursue acquisitions only within certain industries or regions, which may increase the volatility of their prices. A SPAC will not generate any revenues until, at the earliest, after the consummation of a transaction. An attractive acquisition or merger target may not be identified at all, in which case the SPAC will be required to return any remaining monies to shareholders, and the Fund may be subject to opportunity costs to the extent that alternative investments would have produced higher return. While a SPAC is seeking a transaction target, its stock may be thinly traded and/or illiquid. The proceeds of a SPAC IPO that are placed in trust are subject to risks, including the risk of insolvency of the custodian of the funds, fraud by the trustee, interest rate risk and credit and liquidity risk relating to the securities and money market funds in which the proceeds are invested. The private rights or other interests issued by a SPAC that the Fund may obtain generally have more limited liquidity than SPAC shares issued in an IPO and may be subject to forfeiture or expire worthless.
CALAMOS FAMILY OF FUNDS
28
Calamos Merger Arbitrage Fund
• Special Situations or Event-Driven Risk — The Fund may seek to benefit from special situations or events, such as mergers, acquisitions, consolidations, bankruptcies, liquidations, reorganizations, restructurings, tender or exchange offers, or other events expected to affect a particular issuer. Investing in such special situations or events carries the risk that certain of such situations or events may not happen as anticipated, may involve a longer time frame than originally contemplated, or the market may react differently than expected to such situations or events. The securities of companies involved in special situations or events may be more volatile than other securities, may at times be illiquid, or may be difficult to value. Certain special situations or events carry the additional risks inherent in difficult corporate transitions and the securities of such companies may be more likely to lose value than the securities of more stable companies.
• Synthetic Convertible Instruments Risk — The value of a synthetic convertible instrument will respond differently to market fluctuations than a convertible security because a synthetic convertible instrument is composed of two or more separate securities, each with its own market value. In addition, if the value of the underlying common stock or the level of the index involved in the convertible component falls below the exercise price of the warrant or option, the warrant or option may lose all value.
• Tax Risk — The federal income tax treatment of convertible securities or other securities in which the Fund may invest may not be clear or may be subject to recharacterization by the Internal Revenue Service. It could be more difficult to comply with the tax requirements applicable to regulated investment companies if the tax characterization of investments or the tax treatment of the income from such investments were successfully challenged by the Internal Revenue Service. Any such failure to comply with the rules applicable to regulated investment companies could cause the Fund to fail to qualify as such.
• Total Return Swap Risk — A total return swap is a contract in which one party agrees to make periodic payments to another party based on the change in market value of the assets underlying the contract, which may include a specified security, basket of securities, or securities indices during the specified period, in return for periodic payments based on a fixed or variable interest rate or the total return from other underlying assets. Total return swap agreements may be used to obtain exposure to a security or market without owning or taking physical custody of such security or investing directly in such market. Total return swap agreements may effectively add leverage to a fund's portfolio because, in addition to its total net assets, the fund would be subject to investment exposure on the notional amount of the swap. The primary risks associated with total return swaps are credit risk (if the counterparty fails to meet its obligations) and market risk (if there is no liquid market for the agreement or unfavorable changes occur to the underlying asset).
• U.S. Government Security Risk — Some securities issued by U.S. Government agencies or government-sponsored enterprises are not backed by the full faith and credit of the U.S. and may only be supported by the right of the agency or enterprise to borrow from the U.S. Treasury. There can be no assurance that the U.S. Government will always provide financial support to those agencies or enterprises.
• Warrants Risk — The Fund may invest in warrants. A warrant is a right to purchase common stock at a specific price (usually at a premium above the market value of the underlying common stock at time of issuance) during a specified period of time. A warrant may have a life ranging from less than a year to 20 years or longer, but a warrant becomes worthless unless it is exercised or sold before expiration. In addition, if the market price of the common stock does not exceed the warrant's exercise price during the life of the warrant, the warrant will expire worthless. Warrants have no voting rights, pay no dividends and have no rights with respect to the assets of the corporation issuing them. The percentage increase or decrease in the value of a warrant may be greater than the percentage increase or decrease in the value of the underlying common stock.
Fund Performance
The Fund has not yet had a full calendar year of operations, and therefore performance information is not yet available. Performance information will be available at no cost by visiting www.calamos.com or by calling 800.582.6959.
PROSPECTUS | March 1, 2024
29
Calamos Merger Arbitrage Fund
Investment Adviser
Calamos Advisors LLC
PORTFOLIO MANAGER/
FUND TITLE (IF APPLICABLE) |
|
PORTFOLIO MANAGER
EXPERIENCE IN THE FUND |
|
PRIMARY TITLE
WITH INVESTMENT ADVISER |
|
|
Jason Hill |
|
since September 2023 |
|
SVP, Sr. Co-Portfolio Manager |
|
|
David O'Donohue |
|
since September 2023 |
|
SVP, Sr. Co-Portfolio Manager |
|
|
Eli Pars |
|
since September 2023 |
|
SVP, Sr. Co-Portfolio Manager |
|
|
Jimmy Young |
|
since September 2023 |
|
SVP, Co-Portfolio Manager |
|
|
Anthony Vecchiolla |
|
since September 2023 |
|
VP, Co-Portfolio Manager |
|
Other Important Information Regarding Fund Shares
For important information about purchase and sale of Fund shares, tax information, and financial intermediary compensation, please turn to "Other Important Information Regarding Fund Shares" on Page 125 of the prospectus.
CALAMOS FAMILY OF FUNDS
30
Investment Objective
Calamos Convertible Fund's primary objective is current income, with growth as its secondary objective.
Fees and Expenses of the Fund
The following table describes the fees and expenses that you may pay if you buy, hold, and sell shares of the Fund. Investors may pay other fees, such as brokerage commissions and/or other forms of compensation to a financial intermediary, which are not reflected in the tables or the examples below. You may qualify for sales charge discounts on purchase of Class A shares if you and your family invest, or agree to invest in the future, at least $100,000 in Calamos Funds. More information about these and other discounts is available from your financial professional and under "Fund Facts — What classes of shares do the Funds offer?" on Page 149 of the Fund's prospectus, in the Appendix to this prospectus and "Share Classes and Pricing of Shares" on Page 67 of the Fund's statement of additional information.
Shareholder Fees (fees paid directly from your investment):
|
|
|
CLASS A |
|
CLASS C |
|
CLASS I |
|
|
Maximum Sales Charge (Load) Imposed on Purchases (as a percentage of offering price) |
|
|
2.25 |
% |
|
|
None |
|
|
|
None |
|
|
Maximum Deferred Sales Charge (Load) (as a percentage of the lesser of the redemption price or
offering price) |
|
|
None |
|
|
|
1.00 |
% |
|
|
None |
|
|
Annual Fund Operating Expenses (expenses that you pay each year as a percentage of the value of your investment):
|
|
|
CLASS A |
|
CLASS C |
|
CLASS I |
|
|
Management Fees |
|
|
0.73 |
% |
|
|
0.73 |
% |
|
|
0.73 |
% |
|
|
Distribution and/or Service Fees (12b-1) |
|
|
0.25 |
% |
|
|
1.00 |
% |
|
|
None |
|
|
|
Other Expenses |
|
|
0.15 |
% |
|
|
0.15 |
% |
|
|
0.15 |
% |
|
|
Total Annual Fund Operating Expenses |
|
|
1.13 |
% |
|
|
1.88 |
% |
|
|
0.88 |
% |
|
Example
This example is intended to help you compare the cost of investing in the Fund with the cost of investing in other mutual funds. The example assumes that you invest $10,000 in the Fund for the time periods indicated and then either redeem or do not redeem your shares at the end of the reflected time periods. The example also assumes that your investment has a 5% return each year, that all dividends and capital gain distributions are reinvested, that you pay a maximum initial or contingent deferred sales charge and that the Fund's operating expenses remain the same. Although your actual performance and costs may be higher or lower, based on these assumptions, your costs would be:
You would pay the following expenses if you redeemed your shares at the end of the period:
|
|
|
One Year |
|
Three Years |
|
Five Years |
|
Ten Years |
|
|
Class A |
|
|
338 |
|
|
|
576 |
|
|
|
833 |
|
|
|
1,569 |
|
|
|
Class C |
|
|
291 |
|
|
|
591 |
|
|
|
1,016 |
|
|
|
2,201 |
|
|
|
Class I |
|
|
90 |
|
|
|
281 |
|
|
|
488 |
|
|
|
1,084 |
|
|
You would pay the following expenses if you did not redeem your shares:
|
|
|
One Year |
|
Three Years |
|
Five Years |
|
Ten Years |
|
|
Class A |
|
|
338 |
|
|
|
576 |
|
|
|
833 |
|
|
|
1,569 |
|
|
|
Class C |
|
|
191 |
|
|
|
591 |
|
|
|
1,016 |
|
|
|
2,201 |
|
|
|
Class I |
|
|
90 |
|
|
|
281 |
|
|
|
488 |
|
|
|
1,084 |
|
|
PROSPECTUS | March 1, 2024
31
Portfolio Turnover
The Fund pays transaction costs, such as commissions, when it buys and sells securities (or "turns over" its portfolio). A higher portfolio turnover rate may indicate higher transaction costs and may result in higher taxes when Fund shares are held in a taxable account. These costs, which are not reflected in the annual fund operating expenses or in the example, affect the Fund's performance. During the most recent fiscal year, the Fund's portfolio turnover rate was 40% of the average value of its portfolio.
Principal Investment Strategies
The Fund invests mainly in a diversified portfolio of convertible securities (including synthetic convertible instruments) issued by both U.S. and foreign companies without regard to market capitalization. These convertible securities may be either debt securities or preferred stocks that can be exchanged for common stock. Under normal circumstances, the Fund invests at least 80% of its net assets (plus any borrowings) in convertible securities.
A synthetic convertible instrument is designed to simulate the economic characteristics of a convertible security through the combined features of a debt instrument, or loan, and a security providing an option on an equity security. The Fund may establish a synthetic convertible instrument by combining a fixed-income security with the right to acquire an equity security. The fixed-income and equity option components may have different issuers, and either component may change at any time.
The Fund may invest up to 25% of its net assets in foreign securities, but generally will invest approximately 5% to 15% of its net assets in foreign securities. Foreign securities are securities issued by issuers that are organized under the laws of a foreign country or that have a substantial portion of their operations or assets in a foreign country or countries, or that derive a substantial portion of their revenue or profits from businesses, investments or sales outside of the United States. The Fund may also invest in foreign securities that are represented in the United States securities markets by American Depositary Receipts ("ADRs") or similar depository arrangements. The Fund's foreign debt investments can be denominated in U.S. dollars or in foreign currencies. Debt securities issued by a foreign government may not be supported by the "full faith and credit" of that government.
In analyzing the appreciation potential of the underlying common stock and the default risk of the convertible security, the Fund generally considers the issuer's financial soundness, ability to make interest and dividend payments, earnings and cash flow forecast and quality of management. The investment adviser takes environmental, social and governance ("ESG") factors into account in making investment decisions. The Fund's investment adviser seeks to lower the risks of investing in stocks by using a "top-down approach" of diversification by company, industry, sector, country and currency and focusing on macro-level investment themes. Consistent with the Fund's investment objective and principal investment strategies the Fund's investment adviser views the strategies as low volatility equity strategies and attempts to achieve equity-like returns with lower than equity market risk by managing a portfolio that it believes will exhibit less volatility over full market cycles.
Principal Risks
An investment in the Fund is subject to risks, and you could lose money on your investment in the Fund. There can be no assurance that the Fund will achieve its investment objective. The risks associated with an investment in the Fund can increase during times of significant market volatility. Your investment in the Fund is not a deposit in a bank and is not insured or guaranteed by the Federal Deposit Insurance Corporation or any other government agency. The principal risks are presented in alphabetical order to facilitate finding particular risks and comparing them with other funds. Each risk summarized below is considered a "principal risk" of investing in the Fund, regardless of the order in which it appears. The principal risks of investing in the Fund include:
• Convertible Securities Risk — The value of a convertible security is influenced by changes in interest rates, with investment value declining as interest rates increase and increasing as interest rates decline. The credit standing of the issuer and other factors also may have an effect on the convertible security's investment value.
• Debt Securities Risk — Debt securities are subject to various risks, including interest rate risk, credit risk and default risk.
• Interest Rate Risk — The value of debt securities generally decreases in periods when interest rates are rising. In addition, interest rate changes typically have a greater effect on prices of longer-term debt securities than shorter term
CALAMOS FAMILY OF FUNDS
32
debt securities. Changes in interest rates by the Federal Reserve Board, and other events affecting fixed-income markets, may subject a Fund to heightened interest rate risk as a result of a rise in interest rates.
• Credit Risk — A debt security could deteriorate in quality to such an extent that its rating is downgraded or its market value declines relative to comparable securities. Changes in actual or perceived creditworthiness may occur quickly. If the Fund holds securities that have been downgraded, or that default on payment, the Fund's performance could be negatively affected.
• Default Risk — A company that issues a debt security may be unable to fulfill its obligation to repay principal and interest. The lower a bond is rated, the greater its default risk. To the extent the Fund holds securities that have been downgraded, or that default on payment, its performance could be negatively affected.
• Equity Securities Risk — The securities markets are volatile, and the market prices of the Fund's securities may decline generally. The price of equity securities fluctuates based on changes in a company's financial condition and overall market and economic conditions. If the market prices of the securities owned by the Fund fall, the value of your investment in the Fund will decline.
• Foreign Securities Risk — Risks associated with investing in foreign securities include fluctuations in the exchange rates of foreign currencies that may affect the U.S. dollar value of a security, the possibility of substantial price volatility as a result of political and economic instability in the foreign country, less public information about issuers of securities, different securities regulation, different accounting, auditing and financial reporting standards and less liquidity than in U.S. markets.
• Forward Foreign Currency Contract Risk — Forward foreign currency contracts are contractual agreements to purchase or sell a specified currency at a specified future date (or within a specified time period) at a price set at the time of the contract. The Fund may not fully benefit from, or may lose money on, forward foreign currency transactions if changes in currency exchange rates do not occur as anticipated or do not correspond accurately to changes in the value of the Fund's holdings.
• High Yield Risk — High yield securities and unrated securities of similar credit quality (commonly known as "junk bonds") are subject to greater levels of credit and liquidity risks. High yield securities are considered primarily speculative with respect to the issuer's continuing ability to make principal and interest payments.
• Liquidity Risk — Liquidity risk exists when particular investments are difficult to purchase or sell. The Fund's investments in illiquid securities may reduce the returns of the Fund because it may be unable to sell the illiquid securities at an advantageous time or price.
• Options Risk — The Fund's ability to close out its position as a purchaser or seller of an over-the-counter or exchange- listed put or call option is dependent, in part, upon the liquidity of the option market. There are significant differences between the securities and options markets that could result in an imperfect correlation among these markets, causing a given transaction not to achieve its objectives. The Fund's ability to utilize options successfully will depend on the ability of the Fund's investment adviser to predict pertinent market movements, which cannot be assured.
• Portfolio Selection Risk — The value of your investment may decrease if the investment adviser's judgment about the attractiveness, value or market trends affecting a particular security, issuer, industry or sector or about market movements is incorrect.
• Rule 144A Securities Risk — The Fund may invest in securities that are issued and sold through transactions under Rule 144A of the Securities Act of 1933. Under the supervision of its board of trustees, the Fund will determine whether Rule 144A Securities are illiquid. If qualified institutional buyers are unwilling to purchase these Rule 144A Securities, the percentage of the Fund's assets invested in illiquid securities would increase. Typically, the Fund purchases Rule 144A Securities only if the Fund's adviser has determined them to be liquid. If any Rule 144A Security held by the Fund should become illiquid, the value of the security may be reduced and a sale of the security may be more difficult.
• Sector Risk — To the extent the Fund invests a significant portion of its assets in a particular sector, a greater portion of the Fund's performance may be affected by the general business and economic conditions affecting that sector. Each sector may share economic risk with the broader market, however there may be economic risks specific to each sector. As
PROSPECTUS | March 1, 2024
33
a result, returns from those sectors may trail returns from the overall stock market and it is possible that the Fund may underperform the broader market, or experience greater volatility.
• Securities Lending Risk — The Fund may lend its portfolio securities to broker-dealers and banks in order to generate additional income for the Fund. Any such loan must be continuously secured by collateral in cash or cash equivalents maintained on a current basis in an amount at least equal to the market value of the securities loaned by the Fund. In the event of bankruptcy or other default of a borrower of portfolio securities, the Fund could experience both delays in liquidating the loan collateral or recovering the loaned securities and losses, including (a) possible decline in the value of the collateral or in the value of the securities loaned during the period while the Fund seeks to enforce its rights thereto, (b) possible subnormal levels of income and lack of access to income during this period, and (c) expenses of enforcing its rights. In an effort to reduce these risks, the Fund's securities lending agent monitors, and reports to Calamos Advisors on, the creditworthiness of the firms to which a Fund lends securities. The Fund may also experience losses as a result of a diminution in value of its cash collateral investments.
• Small and Mid-Sized Company Risk — Small and mid-sized company stocks have historically been subject to greater investment risk than large company stocks. The prices of small and mid-sized company stocks tend to be more volatile than prices of large company stocks.
• Synthetic Convertible Instruments Risk — The value of a synthetic convertible instrument will respond differently to market fluctuations than a convertible security because a synthetic convertible instrument is composed of two or more separate securities, each with its own market value. In addition, if the value of the underlying common stock or the level of the index involved in the convertible component falls below the exercise price of the warrant or option, the warrant or option may lose all value.
• Tax Risk — The federal income tax treatment of convertible securities or other securities in which the Fund may invest may not be clear or may be subject to recharacterization by the Internal Revenue Service. It could be more difficult to comply with the tax requirements applicable to regulated investment companies if the tax characterization of investments or the tax treatment of the income from such investments were successfully challenged by the Internal Revenue Service. Any such failure to comply with the rules applicable to regulated investment companies could cause the Fund to fail to qualify as such.
Fund Performance
The following bar chart and table indicate the risks of investing in the Fund by showing changes in the Fund's performance from calendar year to calendar year and how the Fund's average annual total returns compare with those of a broad measure of market performance. All returns include the reinvestment of dividends and distributions. As always, please note that the Fund's past performance (before and after taxes) cannot predict how it will perform in the future. Updated performance information is available at no cost by visiting www.calamos.com or by calling 800.582.6959.
CLASS I* ANNUAL TOTAL RETURN FOR YEARS ENDED 12.31

|
Highest Quarterly Return: |
|
|
30.35 |
% (6.30.2020) |
|
Lowest Quarterly Return: |
|
|
-16.35 |
% (6.30.2022) |
|
* Annual returns for Class I are provided because Class I shares represent the largest percentage of assets in the Calamos Family of Funds.
CALAMOS FAMILY OF FUNDS
34
Average Annual Total Returns as of 12.31.23
The following table shows how the Fund's average annual performance (before and after taxes) for the one-, five- and ten-year periods ended December 31, 2023 and since the Fund's inception compared with broad measures of market performance. "Since Inception" returns shown for each index are returns since the inception of the Fund's Class A shares, or since the nearest subsequent month end when comparative index data is available only for full monthly periods. The after-tax returns show the impact of assumed federal income taxes on an investment in the Fund. "Return After Taxes on Distributions" shows the effect of taxable distributions, but assumes that you still hold the Fund shares at the end of the period and so do not have any taxable gain or loss on your investment. "Return After Taxes on Distributions and Sale of Fund Shares" shows the effect of taxable distributions and any taxable gain or loss that would be realized if the Fund shares were purchased at the beginning and sold at the end of the specified period.
The after-tax returns are shown only for Class I shares, and are calculated using the historical highest individual federal marginal income tax rates and do not reflect the impact of state and local taxes. Actual after-tax returns depend on an investor's tax situation and may differ from those shown, and the after-tax returns shown are not relevant to investors who hold their Fund shares through tax-advantaged arrangements, such as 401(k) plans or individual retirement accounts. After-tax returns for classes other than Class I will vary from returns shown for Class I. "Return After Taxes on Distributions and Sale of Fund Shares" may be higher than other returns for the same period due to a tax benefit of realizing a capital loss upon the sale of Fund shares.
AVERAGE ANNUAL TOTAL RETURNS — FOR THE PERIODS ENDED 12.31.23
|
|
|
INCEPTION
DATE OF CLASS |
|
ONE YEAR |
|
FIVE YEAR |
|
TEN YEAR |
|
SINCE
INCEPTION |
|
|
Class A |
|
|
6.21.85 |
|
|
|
|
|
|
|
|
|
|
|
Load Adjusted Return before taxes |
|
|
|
|
|
|
8.12 |
% |
|
|
9.65 |
% |
|
|
6.46 |
% |
|
|
8.76 |
% |
|
|
Class C |
|
|
7.5.96 |
|
|
|
|
|
|
|
|
|
|
|
Load Adjusted Return before taxes |
|
|
|
|
|
|
8.79 |
% |
|
|
9.34 |
% |
|
|
6.18 |
% |
|
|
7.37 |
% |
|
|
Class I |
|
|
6.25.97 |
|
|
|
|
|
|
|
|
|
|
|
Return before taxes |
|
|
|
|
|
|
10.92 |
% |
|
|
10.43 |
% |
|
|
7.25 |
% |
|
|
7.84 |
% |
|
|
Return after taxes on distributions* |
|
|
|
|
|
|
10.05 |
% |
|
|
8.76 |
% |
|
|
5.22 |
% |
|
|
5.75 |
% |
|
Return after taxes on distributions and sale of
Fund shares* |
|
|
|
|
|
|
6.69 |
% |
|
|
8.06 |
% |
|
|
5.17 |
% |
|
|
5.74 |
% |
|
|
ICE BofA All U.S. Convertibles Index (VXA0) |
|
|
|
|
|
|
12.87 |
% |
|
|
11.93 |
% |
|
|
8.90 |
% |
|
|
8.02 |
% |
|
|
S&P 500 Index |
|
|
|
|
|
|
26.29 |
% |
|
|
15.69 |
% |
|
|
12.03 |
% |
|
|
8.55 |
% |
|
*
Since inception return for the ICE BofA All US Convertible Index is not available, as the inception date of the Index is January 1, 1988. The S&P 500 Index shows how the Fund's performance compares to an index that is generally considered to be representative of the U.S. stock market.
PROSPECTUS | March 1, 2024
35
Investment Adviser
Calamos Advisors LLC
PORTFOLIO MANAGER/
FUND TITLE (IF APPLICABLE) |
|
PORTFOLIO MANAGER
EXPERIENCE IN THE FUND |
|
PRIMARY TITLE
WITH INVESTMENT ADVISER |
|
|
John P. Calamos, Sr. (President, Chairman) |
|
since Fund's inception |
|
Founder, Chairman, and Global CIO |
|
|
R. Matthew Freund |
|
7 years |
|
SVP, Sr. Co-Portfolio Manager |
|
|
John Hillenbrand |
|
20 years |
|
SVP, Sr. Co-Portfolio Manager |
|
|
Eli Pars |
|
10.5 years |
|
SVP, Sr. Co-Portfolio Manager |
|
|
Jon Vacko |
|
20 years |
|
SVP, Sr. Co-Portfolio Manager |
|
|
Joe Wysocki |
|
9 years |
|
SVP, Sr. Co-Portfolio Manager |
|
Other Important Information Regarding Fund Shares
For important information about purchase and sale of Fund shares, tax information, and financial intermediary compensation, please turn to "Other Important Information Regarding Fund Shares" on Page 125 of the prospectus.
CALAMOS FAMILY OF FUNDS
36
Calamos Global Convertible Fund
Investment Objective
Calamos Global Convertible Fund's primary objective is total return through capital appreciation and current income.
Fees and Expenses of the Fund
The following table describes the fees and expenses that you may pay if you buy, hold and sell shares of the Fund. Investors may pay other fees, such as brokerage commissions and/or other forms of compensation to a financial intermediary, which are not reflected in the tables or the examples below. You may qualify for sales charge discounts on purchases of Class A shares if you and your family invest, or agree to invest in the future, at least $100,000 in Calamos Funds. More information about these and other discounts is available from your financial professional and under "Fund Facts — What classes of shares do the Funds offer?" on Page 149 of the Fund's prospectus, in the Appendix to this prospectus and "Share Classes and Pricing of Shares" on Page 67 of the Fund's statement of additional information.
Shareholder Fees (fees paid directly from your investment):
|
|
|
CLASS A |
|
CLASS C |
|
CLASS I |
|
|
Maximum Sales Charge (Load) Imposed on Purchases (as a percentage of offering price) |
|
|
2.25 |
% |
|
|
None |
|
|
|
None |
|
|
Maximum Deferred Sales Charge (Load) (as a percentage of the lesser of the redemption price or
offering price) |
|
|
None |
|
|
|
1.00 |
% |
|
|
None |
|
|
Annual Fund Operating Expenses (expenses that you pay each year as a percentage of the value of your investment):
|
|
|
CLASS A |
|
CLASS C |
|
CLASS I |
|
|
Management Fees |
|
|
0.85 |
% |
|
|
0.85 |
% |
|
|
0.85 |
% |
|
|
Distribution and/or Service Fees (12b-1) |
|
|
0.25 |
% |
|
|
1.00 |
% |
|
|
None |
|
|
|
Other Expenses |
|
|
0.24 |
% |
|
|
0.24 |
% |
|
|
0.24 |
% |
|
|
Total Annual Fund Operating Expenses |
|
|
1.34 |
% |
|
|
2.09 |
% |
|
|
1.09 |
% |
|
Example
This example is intended to help you compare the cost of investing in the Fund with the cost of investing in other mutual funds. The example assumes that you invest $10,000 in the Fund for the time periods indicated and then either redeem or do not redeem your shares at the end of the reflected time periods. The example also assumes that your investment has a 5% return each year, that all dividends and capital gain distributions are reinvested, that you pay a maximum initial deferred sales charge and that the Fund's operating expenses remain the same. Although your actual performance and costs may be higher or lower, based on these assumptions, your costs would be:
You would pay the following expenses if you redeemed your shares at the end of the period:
|
|
|
One Year |
|
Three Years |
|
Five Years |
|
Ten Years |
|
|
Class A |
|
|
358 |
|
|
|
640 |
|
|
|
943 |
|
|
|
1,801 |
|
|
|
Class C |
|
|
312 |
|
|
|
655 |
|
|
|
1,124 |
|
|
|
2,421 |
|
|
|
Class I |
|
|
111 |
|
|
|
347 |
|
|
|
601 |
|
|
|
1,329 |
|
|
You would pay the following expenses if you did not redeem your shares:
|
|
|
One Year |
|
Three Years |
|
Five Years |
|
Ten Years |
|
|
Class A |
|
|
358 |
|
|
|
640 |
|
|
|
943 |
|
|
|
1,801 |
|
|
|
Class C |
|
|
212 |
|
|
|
655 |
|
|
|
1,124 |
|
|
|
2,421 |
|
|
|
Class I |
|
|
111 |
|
|
|
347 |
|
|
|
601 |
|
|
|
1,329 |
|
|
PROSPECTUS | March 1, 2024
37
Calamos Global Convertible Fund
Portfolio Turnover
The Fund pays transaction costs, such as commissions, when it buys and sells securities (or "turns over" its portfolio). A higher portfolio turnover rate may indicate higher transaction costs and may result in higher taxes when Fund shares are held in a taxable account. These costs, which are not reflected in the annual fund operating expenses or in the example, affect the Fund's performance. During the Fund's most recent fiscal year the Fund's portfolio turnover rate was 27% of the average value of its portfolio.
Principal Investment Strategies
The Fund invests mainly in a globally-diversified portfolio of convertible securities (including synthetic convertible instruments) issued by both U.S. and foreign companies without regard to market capitalization. Convertible securities include, but are not limited to, any corporate debt security, debentures, notes or preferred stock that may be converted into equity securities of companies around the world, including in emerging markets. Under normal circumstances, the Fund invests at least 80% of its net assets (plus borrowings for investment purposes, if any) in convertible securities, including synthetic convertible securities.
A synthetic convertible instrument is designed to simulate the economic characteristics of a convertible security through the combined features of a debt instrument, or loan, and a security providing an option on an equity security. The Fund may establish a synthetic convertible instrument by combining a fixed-income security with the right to acquire an equity security. The fixed-income and equity option components may have different issuers, and either component may change at any time.
The Fund anticipates that, under normal circumstances, the investment adviser's process will result in the Fund investing in a globally diversified manner, with at least 20% of its assets in securities of foreign issuers, including issuers in emerging markets. Securities of foreign issuers are securities issues by issuers that are organized under the laws of a foreign country or that have a substantial portion of their operations or assets in a foreign country or countries, or that derive a substantial portion of their revenue or profits from businesses, investments or sales outside of the United States. The Fund may also invest in foreign securities that are represented in the United States securities markets by American Depositary Receipts ("ADRs") or similar depository arrangements. The Fund's foreign debt investments can be denominated in U.S. dollars or in foreign currencies. Debt securities issued by a foreign government may not be supported by the "full faith and credit" of that government.
The Fund may invest up to 20% of its net assets in equity securities or securities with economic characteristics similar to stock or the equity markets. The Fund may also invest up to 20% of its net assets in high yield fixed-income securities, often referred to as "junk bonds"; however, such limitation shall not apply to convertible securities, including synthetic convertible securities. Junk bonds are securities rated BB or lower by S&P, or Ba or lower by Moody's or securities that are not rated but are considered by the Fund's investment adviser to be of similar quality. The Fund may not acquire debt securities that are rated lower than C. In addition, the Fund may engage in active and frequent trading of portfolio securities.
The Fund may use derivative instruments such as options, futures and forward contracts. The Fund may purchase or sell securities on a when-issued, delayed delivery or forward commitment basis.
When buying and selling convertible securities, the Fund typically applies a four-step approach, without regard to market capitalization:
1. Evaluating the default risk of the convertible security using traditional credit analysis;
2. Analyzing the convertible security's underlying common stock to determine its capital appreciation potential;
3. Assessing the convertible security's risk/return potential; and
4. Evaluating the convertible security's impact on the Fund's overall composition and diversification strategy.
As well, the Fund's investment adviser seeks to lower the risks of investing in stocks by using a "top-down approach" of diversification by country, company, industry, sector and currency and by focusing on macro-level investment themes.
Consistent with the Fund's investment objective and principal investment strategies the Fund's investment adviser views these strategies as low volatility equity strategies and attempts to achieve equity-like returns with lower than equity market risk by managing a portfolio that it believes will exhibit less volatility over full market cycles.
CALAMOS FAMILY OF FUNDS
38
Calamos Global Convertible Fund
Principal Risks
An investment in the Fund is subject to risks, and you could lose money on your investment in the Fund. There can be no assurance that the Fund will achieve its investment objective. The risks associated with an investment in the Fund can increase during times of significant market volatility. Your investment in the Fund is not a deposit in a bank and is not insured or guaranteed by the Federal Deposit Insurance Corporation or any other government agency. The principal risks are presented in alphabetical order to facilitate finding particular risks and comparing them with other funds. Each risk summarized below is considered a "principal risk" of investing in the Fund, regardless of the order in which it appears. The principal risks of investing in the Fund include:
• American Depositary Receipts Risk — The stocks of most foreign companies that trade in the U.S. markets are traded as American Depositary Receipts (ADRs). U.S. depositary banks issue these stocks. Each ADR represents one or more shares of foreign stock or a fraction of a share. The price of an ADR corresponds to the price of the foreign stock in its home market, adjusted to the ratio of the ADRs to foreign company shares. Therefore while purchasing a security on a U.S. exchange, the risks inherently associated with foreign investing still apply to ADRs.
• Convertible Securities Risk — The value of a convertible security is influenced by changes in interest rates, with investment value declining as interest rates increase and increasing as interest rates decline. The credit standing of the issuer and other factors also may have an effect on the convertible security's investment value. Convertible securities generally offer lower interest or dividend yields than non-convertible fixed-income securities of similar credit quality because of the potential for capital appreciation. In addition, as the market price of the underlying common stock declines below the conversion price, the price of the convertible security tends to be increasingly influenced by the yield of the convertible security. Holders of convertible securities have a claim on the issuer's assets prior to the common stockholders, but may be subordinated to holders of similar but non-convertible securities of the same issuer.
• Currency Risk — To the extent that the Fund invests in securities or other instruments denominated in or indexed to foreign currencies, changes in currency exchange rates bring an added dimension of risk. Currency fluctuations could negatively impact investment gains or add to investment losses. Although the Fund may attempt to hedge against currency risk, the hedging instruments may not always perform as the Fund expects and could produce losses. Suitable hedging instruments may not be available for currencies of emerging market countries. The Fund's investment adviser may determine not to hedge currency risks, even if suitable instruments appear to be available.
• Debt Securities Risk — Debt securities are subject to various risks, including interest rate risk, credit risk and default risk.
• Interest Rate Risk — The value of debt securities generally decreases in periods when interest rates are rising. In addition, interest rate changes typically have a greater effect on prices of longer-term debt securities than shorter term debt securities. Changes in interest rates by the Federal Reserve Board, and other events affecting fixed-income markets, may subject a Fund to heightened interest rate risk as a result of a rise in interest rates.
• Credit Risk — A debt security could deteriorate in quality to such an extent that its rating is downgraded or its market value declines relative to comparable securities. Changes in actual or perceived creditworthiness may occur quickly. If the Fund holds securities that have been downgraded, or that default on payment, the Fund's performance could be negatively affected.
• Default Risk — A company that issues a debt security may be unable to fulfill its obligation to repay principal and interest. The lower a bond is rated, the greater its default risk. To the extent the Fund holds securities that have been downgraded, or that default on payment, its performance could be negatively affected.
• Derivatives Risk — Derivatives are instruments, such as futures and forward foreign currency contracts, whose value is derived from that of other assets, rates or indices. The use of derivatives for non-hedging purposes may be considered more speculative than other types of investments. Derivatives can be used for hedging (attempting to reduce risk by offsetting one investment position with another) or non-hedging purposes. Hedging with derivatives may increase expenses, and there is no guarantee that a hedging strategy will work. While hedging can reduce or eliminate losses, it can also reduce or eliminate gains. In addition, derivative instruments are subject to counterparty risk, meaning that the party with whom the Fund enters into the derivatives contract may experience a significant credit event and/or may be
PROSPECTUS | March 1, 2024
39
Calamos Global Convertible Fund
unwilling or unable to make timely settlement payments or otherwise honor its obligations. Changes in the value of a derivative may not correlate perfectly with the underlying asset, rate or index, and the Fund could lose more than the principal amount invested.
• Emerging Markets Risk — Emerging market countries may have relatively unstable governments and economies based on only a few industries, which may cause greater instability. The value of emerging market securities will likely be particularly sensitive to changes in the economies of such countries. These countries are also more likely to experience higher levels of inflation, deflation or currency devaluations, which could hurt their economies and securities markets. Securities issued in these countries may be more volatile and less liquid than securities issued in foreign countries with more developed economies or markets. Loss may also result from the imposition of exchange controls, confiscations and other government restrictions, or from problems in share registration, settlement, custody, or other operational risks.
• Equity Securities Risk — The securities markets are volatile, and the market prices of the Fund's securities may decline generally. The price of equity securities fluctuates based on changes in a company's financial condition and overall market and economic conditions. If the market prices of the securities owned by the Fund fall, the value of your investment in the Fund will decline.
• Foreign Securities Risk — Risks associated with investing in foreign securities include fluctuations in the exchange rates of foreign currencies that may affect the U.S. dollar value of a security, the possibility of substantial price volatility as a result of political and economic instability in the foreign country, less public information about issuers of securities, different securities regulation, different accounting, auditing and financial reporting standards and less liquidity than in U.S. markets.
• Forward Foreign Currency Contract Risk — Forward foreign currency contracts are contractual agreements to purchase or sell a specified currency at a specified future date (or within a specified time period) at a price set at the time of the contract. The Fund may not fully benefit from, or may lose money on, forward foreign currency transactions if changes in currency exchange rates do not occur as anticipated or do not correspond accurately to changes in the value of the Fund's holdings.
• Futures and Forward Contracts Risk — Futures contracts provide for the future sale by one party and purchase by another of a specific asset at a specific time and price (with or without delivery required). Futures contracts are standardized contracts traded on a recognized exchange. An option on a futures contract gives the purchaser the right, in exchange for a premium, to assume a position in a futures contract at a specified exercise price during the term of the option. Futures and forward contracts are subject to counterparty risk, meaning that the party with whom the Fund enters into the derivatives contract (the clearinghouse or the broker holding the Fund's position for a futures contract or the counterparty for a forward contract) may experience a significant credit event and may be unwilling or unable to make timely settlement payments or otherwise honor its obligations.
• Geographic Concentration Risk — Investments in a particular country or geographic region may be particularly susceptible to political, diplomatic or economic conditions and regulatory requirements. To the extent the Fund concentrates its investments in a particular country, region or group of regions, the Fund may be more volatile than a more geographically diversified fund.
• High Yield Risk — High yield securities and unrated securities of similar credit quality (commonly known as "junk bonds") are subject to greater levels of credit and liquidity risks. High yield securities are considered primarily speculative with respect to the issuer's continuing ability to make principal and interest payments.
• Options Risk — The Fund's ability to close out its position as a purchaser or seller of an exchange-listed put or call option is dependent, in part, upon the liquidity of the options market. There are significant differences between the securities and options markets that could result in an imperfect correlation among these markets, causing a given transaction not to achieve its objectives. The Fund's ability to utilize options successfully will depend on the ability of the Fund's investment adviser to predict pertinent market movements, which cannot be assured. The Fund may also purchase or write over-the-counter put or call options, which involves risks different from, and possibly greater than, the risks associated with exchange-listed put or call options. In some instances, over-the-counter put or call options may expose the Fund to the risk that a counterparty may be unable or unwilling to perform according to a contract, and that any
CALAMOS FAMILY OF FUNDS
40
Calamos Global Convertible Fund
deterioration in a counterparty's creditworthiness could adversely affect the instrument. In addition, the Fund may be exposed to a risk that losses may exceed the amount originally invested.
• Portfolio Selection Risk — The value of your investment may decrease if the investment adviser's judgment about the attractiveness, value or market trends affecting a particular security, issuer, industry, or sector or about market movements is incorrect.
• Portfolio Turnover Risk — The portfolio managers may actively and frequently trade securities or other instruments in the Fund's portfolio to carry out its investment strategies. A high portfolio turnover rate increases transaction costs, which may increase the Fund's expenses. Frequent and active trading may also cause adverse tax consequences for investors in the Fund due to an increase in short-term capital gains.
• Rule 144A Securities Risk — The Fund may invest in securities that are issued and sold through transactions under Rule 144A of the Securities Act of 1933. Under the supervision of its board of trustees, the Fund will determine whether Rule 144A Securities are illiquid. If qualified institutional buyers are unwilling to purchase these Rule 144A Securities, the percentage of the Fund's assets invested in illiquid securities would increase. Typically, the Fund purchases Rule 144A Securities only if the Fund's adviser has determined them to be liquid. If any Rule 144A Security held by the Fund should become illiquid, the value of the security may be reduced and a sale of the security may be more difficult.
• Sector Risk — To the extent the Fund invests a significant portion of its assets in a particular sector, a greater portion of the Fund's performance may be affected by the general business and economic conditions affecting that sector. Each sector may share economic risk with the broader market, however there may be economic risks specific to each sector. As a result, returns from those sectors may trail returns from the overall stock market and it is possible that the Fund may underperform the broader market, or experience greater volatility.
• Securities Lending Risk — The Fund may lend its portfolio securities to broker-dealers and banks in order to generate additional income for the Fund. Any such loan must be continuously secured by collateral in cash or cash equivalents maintained on a current basis in an amount at least equal to the market value of the securities loaned by the Fund. In the event of bankruptcy or other default of a borrower of portfolio securities, the Fund could experience both delays in liquidating the loan collateral or recovering the loaned securities and losses, including (a) possible decline in the value of the collateral or in the value of the securities loaned during the period while the Fund seeks to enforce its rights thereto, (b) possible subnormal levels of income and lack of access to income during this period, and (c) expenses of enforcing its rights. In an effort to reduce these risks, the Fund's securities lending agent monitors, and reports to Calamos Advisors on, the creditworthiness of the firms to which a Fund lends securities. The Fund may also experience losses as a result of a diminution in value of its cash collateral investments.
• Synthetic Convertible Instruments Risk — The value of a synthetic convertible instrument may respond differently to market fluctuations than a traditional convertible security because a synthetic convertible instrument is composed of two or more separate securities or instruments, each with its own market value. Because the convertible component is typically achieved by investing in warrants or options to buy common stock at a certain exercise price, or options on a stock index, synthetic convertible instruments are subject to the risks associated with derivatives. In addition, if the value of the underlying common stock or the level of the index involved in the convertible component falls below the exercise price of the warrant or option, the warrant or option may lose all value.
• Tax Risk — The federal income tax treatment of convertible securities or other securities in which the Fund may invest may not be clear or may be subject to recharacterization by the Internal Revenue Service. It could be more difficult to comply with the tax requirements applicable to regulated investment companies if the tax characterization of investments or the tax treatment of the income from such investments were successfully challenged by the Internal Revenue Service. Any such failure to comply with the rules applicable to regulated investment companies could cause the Fund to fail to qualify as such.
Fund Performance
The following bar chart and table indicate the risks of investing in the Fund by showing changes in the Fund's performance from calendar year to calendar year and how the Fund's average annual total returns compare with those of a broad measure
PROSPECTUS | March 1, 2024
41
Calamos Global Convertible Fund
of market performance. All returns include the reinvestment of dividends and distributions. As always, please note that the Fund's past performance (before and after taxes) cannot predict how it will perform in the future. Updated performance information is available at no cost by visiting www.calamos.com or by calling 800.582.6959.
CLASS I* ANNUAL TOTAL RETURN FOR YEARS ENDED 12.31
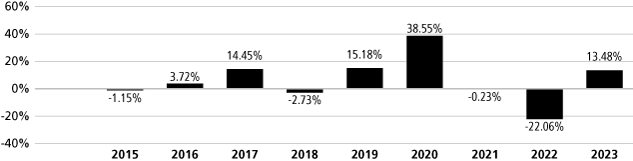
|
Highest Quarterly Return: |
|
|
19.56 |
% (6.30.2020) |
|
Lowest Quarterly Return: |
|
|
-15.92 |
% (6.30.2022) |
|
* Annual returns for Class I are provided because Class I shares represent the largest percentage of assets in the Calamos Family of Funds.
Average Annual Total Returns as of 12.31.23
The following table shows how the Fund's average annual performance (before and after taxes) for the one- and five- year periods ended December 31, 2023 and since the Fund's inception compared with broad measures of market performance. "Since Inception" returns shown for the index are returns since the inception of the Fund's Class A shares, or since the nearest subsequent month end when comparative index data is available only for full monthly periods. The after-tax returns show the impact of assumed federal income taxes on an investment in the Fund. "Return After Taxes on Distributions" shows the effect of taxable distributions, but assumes that you still hold the Fund shares at the end of the period and so do not have any taxable gain or loss on your investment. "Return After Taxes on Distributions and Sale of Fund Shares" shows the effect of taxable distributions and any taxable gain or loss that would be realized if the Fund shares were purchased at the beginning and sold at the end of the specified period.
The after-tax returns are shown only for Class I shares, and are calculated using the historical highest individual federal marginal income tax rates and do not reflect the impact of state and local taxes. Actual after-tax returns depend on an investor's tax situation and may differ from those shown, and the after-tax returns shown are not relevant to investors who hold their Fund shares through tax-advantaged arrangements, such as 401(k) plans or individual retirement accounts. After-tax returns for classes other than Class I will vary from returns shown for Class I. "Return After Taxes on Distributions and Sale of Fund Shares" may be higher than other returns for the same period due to a tax benefit of realizing a capital loss on the sale of Fund shares.
CALAMOS FAMILY OF FUNDS
42
Calamos Global Convertible Fund
AVERAGE ANNUAL TOTAL RETURNS — FOR THE PERIODS ENDED 12.31.23
|
|
|
INCEPTION
DATE OF CLASS |
|
ONE YEAR |
|
FIVE YEAR |
|
SINCE
INCEPTION |
|
|
Class A |
|
|
12.31.14 |
|
|
|
|
|
|
|
|
|
Load Adjusted Return before taxes |
|
|
|
|
|
|
10.66 |
% |
|
|
6.33 |
% |
|
|
4.58 |
% |
|
|
Class C |
|
|
12.31.14 |
|
|
|
|
|
|
|
|
|
Load Adjusted Return before taxes |
|
|
|
|
|
|
11.29 |
% |
|
|
6.02 |
% |
|
|
4.36 |
% |
|
|
Class I |
|
|
12.31.14 |
|
|
|
|
|
|
|
|
|
Return before taxes |
|
|
|
|
|
|
13.48 |
% |
|
|
7.09 |
% |
|
|
5.41 |
% |
|
|
Return after taxes on distributions* |
|
|
|
|
|
|
13.30 |
% |
|
|
5.45 |
% |
|
|
4.03 |
% |
|
|
Return after taxes on distributions and sale of Fund shares* |
|
|
|
|
|
|
7.98 |
% |
|
|
5.19 |
% |
|
|
3.89 |
% |
|
|
Refinitiv Global Convertible Bond Index |
|
|
|
|
|
|
12.44 |
% |
|
|
7.71 |
% |
|
|
5.33 |
% |
|
*
Investment Adviser
Calamos Advisors LLC
PORTFOLIO MANAGER/
FUND TITLE (IF APPLICABLE) |
|
PORTFOLIO MANAGER
EXPERIENCE IN THE FUND |
|
PRIMARY TITLE
WITH INVESTMENT ADVISER |
|
|
John P. Calamos, Sr. (President, Chairman) |
|
since Fund's inception |
|
Founder, Chairman, and Global CIO |
|
|
R. Matthew Freund |
|
7 years |
|
SVP, Sr. Co-Portfolio Manager |
|
|
John Hillenbrand |
|
since Fund's inception |
|
SVP, Sr. Co-Portfolio Manager |
|
|
Nick Niziolek |
|
since Fund's inception |
|
SVP, Sr. Co-Portfolio Manager |
|
|
Eli Pars |
|
since Fund's inception |
|
SVP, Sr. Co-Portfolio Manager |
|
|
Dennis Cogan |
|
since Fund's inception |
|
SVP, Sr. Co-Portfolio Manager |
|
|
Jon Vacko |
|
since Fund's inception |
|
SVP, Sr. Co-Portfolio Manager |
|
|
Joe Wysocki |
|
9 years |
|
SVP, Sr. Co-Portfolio Manager |
|
|
Anthony Vecchiolla |
|
since February 2023 |
|
VP, Co-Portfolio Manager |
|
Other Important Information Regarding Fund Shares
For important information about purchase and sale of Fund shares, tax information, and financial intermediary compensation, please turn to "Other Important Information Regarding Fund Shares" on Page 125 of the prospectus.
PROSPECTUS | March 1, 2024
43
Calamos Timpani Small Cap Growth Fund
Investment Objective
Calamos Timpani Small Cap Growth Fund's investment objective is capital appreciation.
Fees and Expenses of the Fund
The following table describes the fees and expenses that you may pay if you buy, hold and sell shares of the Fund. Investors may pay other fees, such as brokerage commissions and/or other forms of compensation to a financial intermediary, which are not reflected in the tables or the examples below. You may qualify for sales charge discounts on purchases of Class A shares if you and your family invest, or agree to invest in the future, at least $50,000 in Calamos Funds. More information about these and other discounts is available from your financial professional and under "Fund Facts — What classes of shares do the Funds offer?" on Page 149 of the Fund's prospectus, in the Appendix to this prospectus and "Share Classes and Pricing of Shares" on Page 67 of the Fund's statement of additional information.
Shareholder Fees (fees paid directly from your investment):
|
|
|
CLASS A |
|
CLASS C |
|
CLASS I |
|
CLASS R6 |
|
Maximum Sales Charge (Load) Imposed on Purchases (as a percentage of
offering price) |
|
|
4.75 |
% |
|
|
None |
|
|
|
None |
|
|
|
None |
|
|
Maximum Deferred Sales Charge (Load) (as a percentage of the lesser of the
redemption price or offering price) |
|
|
None |
|
|
|
1.00 |
% |
|
|
None |
|
|
|
None |
|
|
Annual Fund Operating Expenses (expenses that you pay each year as a percentage of the value of your investment):
|
|
|
CLASS A |
|
CLASS C |
|
CLASS I |
|
CLASS R6 |
|
|
Management Fees |
|
|
0.90 |
% |
|
|
0.90 |
% |
|
|
0.90 |
% |
|
|
0.90 |
% |
|
|
Distribution and/or Service Fees (12b-1) |
|
|
0.25 |
% |
|
|
1.00 |
% |
|
|
None |
|
|
|
None |
|
|
|
Other Expenses |
|
|
0.22 |
% |
|
|
0.22 |
% |
|
|
0.22 |
% |
|
|
0.09 |
% |
|
|
Total Annual Fund Operating Expenses |
|
|
1.37 |
% |
|
|
2.12 |
% |
|
|
1.12 |
% |
|
|
0.99 |
% |
|
|
Expense Reimbursement1 |
|
|
(0.07 |
)% |
|
|
(0.07 |
)% |
|
|
(0.07 |
)% |
|
|
(0.07 |
)% |
|
|
Total Annual Fund Operating Expenses After Reimbursement |
|
|
1.30 |
% |
|
|
2.05 |
% |
|
|
1.05 |
% |
|
|
0.92 |
% |
|
1
Example
This example is intended to help you compare the cost of investing in the Fund with the cost of investing in other mutual funds. The example assumes that you invest $10,000 in the Fund for the time periods indicated and then either redeem or do not redeem your shares at the end of the reflected time periods. The example also assumes that your investment has a 5% return each year that all dividends and capital gain distributions are reinvested, that you pay a maximum initial or contingent deferred sales charge and that the Fund's operating expenses remain the same. Any applicable fee waivers and/or expense
CALAMOS FAMILY OF FUNDS
44
Calamos Timpani Small Cap Growth Fund
reimbursements are reflected in the below examples for the period through March 1, 2025 only. Although your actual performance and costs may be higher or lower, based on these assumptions, your costs would be:
You would pay the following expenses if you redeemed your shares at the end of the period:
|
|
|
One Year |
|
Three Years |
|
Five Years |
|
Ten Years |
|
|
Class A |
|
|
601 |
|
|
|
882 |
|
|
|
1,183 |
|
|
|
2,037 |
|
|
|
Class C |
|
|
308 |
|
|
|
657 |
|
|
|
1,133 |
|
|
|
2,446 |
|
|
|
Class I |
|
|
107 |
|
|
|
349 |
|
|
|
610 |
|
|
|
1,357 |
|
|
|
Class R6 |
|
|
94 |
|
|
|
308 |
|
|
|
540 |
|
|
|
1,207 |
|
|
You would pay the following expenses if you did not redeem your shares at the end of the period:
|
|
|
One Year |
|
Three Years |
|
Five Years |
|
Ten Years |
|
|
Class A |
|
|
601 |
|
|
|
882 |
|
|
|
1,183 |
|
|
|
2,037 |
|
|
|
Class C |
|
|
208 |
|
|
|
657 |
|
|
|
1,133 |
|
|
|
2,446 |
|
|
|
Class I |
|
|
107 |
|
|
|
349 |
|
|
|
610 |
|
|
|
1,357 |
|
|
|
Class R6 |
|
|
94 |
|
|
|
308 |
|
|
|
540 |
|
|
|
1,207 |
|
|
Portfolio Turnover
The Fund pays transaction costs, such as commissions, when it buys and sells securities (or "turns over" its portfolio). A higher portfolio turnover rate may indicate higher transaction costs and may result in higher taxes when Fund shares are held in a taxable account. These costs, which are not reflected in the annual fund operating expenses or in the example, affect the Fund's performance. During the Fund's most recent fiscal year the Fund's portfolio turnover rate was 215% of the average value of its portfolio.
Principal Investment Strategies
Under normal market conditions, the Fund invests at least 80% of its net assets (plus any borrowings) in equity securities of small capitalization companies that the Fund's investment adviser, Calamos Advisors LLC ("Calamos Advisors"), believes have sound growth potential. The Fund defines a small capitalization company as any company with a market capitalization less than or equal to that of the company with the largest market capitalization of either the Russell 2000® Index or the MSCI USA Small Cap Index as measured on a rolling 24-month basis over the most recent period. The market capitalization of a security is measured at the time of purchase.
Equity securities in which the Fund invests as a part of its principal investment strategy consist of common stocks and American Depositary Receipts ("ADRs"). The Fund may invest up to 25% of its net assets in foreign securities. Foreign securities are securities issued by issuers that are organized under the laws of a foreign country, that have a substantial portion of their operations or assets in a foreign country or countries, or that derive a substantial portion of their revenue or profits from businesses, investments, or sales outside of the United States. The Fund may also invest in foreign securities that are represented in the United States securities markets by ADRs or similar depositary arrangements. The Fund's foreign investments can be denominated in U.S. dollars or in foreign currencies. Calamos Advisors uses fundamental research to evaluate investment opportunities, focusing on companies that it believes have superior management and whose business models have a high potential for earnings upside. Calamos Advisors may actively trade portfolio securities. From time to time, the Fund may have significant investments in certain sectors due to Calamos Advisors' investment process yielding opportunities for sound growth potential within those sectors. The Fund's sector concentrations may vary.
PROSPECTUS | March 1, 2024
45
Calamos Timpani Small Cap Growth Fund
Principal Risks
An investment in the Fund is subject to risks, and you could lose money on your investment in the Fund. There can be no assurance that the Fund will achieve its investment objective. The risks associated with an investment in the Fund can increase during times of significant market volatility. Your investment in the Fund is not a deposit in a bank and is not insured or guaranteed by the Federal Deposit Insurance Corporation or any other government agency. The principal risks are presented in alphabetical order to facilitate finding particular risks and comparing them with other funds. Each risk summarized below is considered a "principal risk" of investing in the Fund, regardless of the order in which it appears. The principal risks of investing in the Fund include:
• American Depositary Receipts Risk — The stocks of most foreign companies that trade in the U.S. markets are traded as ADRs. U.S. depositary banks issue these stocks. Each ADR represents one or more shares of foreign stock or a fraction of a share. The price of an ADR corresponds to the price of the foreign stock in its home market, adjusted to the ratio of the ADRs to foreign company shares. Therefore while purchasing a security on a U.S. exchange, the risks inherently associated with foreign investing still apply to ADRs.
• Cash Holdings Risk — The Fund may invest in cash and cash equivalents for indefinite periods of time when the Fund's investment adviser determines the prevailing market environment warrants doing so. When the Fund holds cash positions, it may lose opportunities to participate in market appreciation, which may result in lower returns than if the Fund had remained fully invested in the market. Furthermore, cash and cash equivalents may generate minimal or no income and could negatively impact the Fund's performance and ability to achieve its investment objective.
• Equity Securities Risk — The securities markets are volatile, and the market prices of the Fund's securities may decline generally. The price of equity securities fluctuates based on changes in a company's financial condition and overall market and economic conditions. If the market prices of the securities owned by the Fund fall, the value of your investment in the Fund will decline.
• Foreign Securities Risk — Risks associated with investing in foreign securities include fluctuations in the exchange rates of foreign currencies that may affect the U.S. dollar value of a security, the possibility of substantial price volatility as a result of political and economic instability in the foreign country, less public information about issuers of securities, different securities regulation, different accounting, auditing and financial reporting standards and less liquidity than in U.S. markets.
• Growth Stock Risk — Growth securities typically trade at higher multiples of current earnings than other securities and, therefore, may be more sensitive to changes in current or expected earnings than other equity securities and may be more volatile.
• Liquidity Risk — Liquidity risk exists when particular investments are difficult to purchase or sell. The Fund's investments in illiquid securities may reduce the returns of the Fund because it may be unable to sell the illiquid securities at an advantageous time or price.
• Portfolio Selection Risk — The value of your investment may decrease if the investment adviser's judgment about the attractiveness, value or market trends affecting a particular security, issuer, industry or sector or about market movements is incorrect.
• Portfolio Turnover Risk — The portfolio managers may actively and frequently trade securities or other instruments in the Fund's portfolio to carry out its investment strategies. A high portfolio turnover rate increases transaction costs, which may increase the Fund's expenses. Frequent and active trading may also cause adverse tax consequences for investors in the Fund due to an increase in short-term capital gains.
• Sector Risk — To the extent the Fund invests a significant portion of its assets in a particular sector, a greater portion of the Fund's performance may be affected by the general business and economic conditions affecting that sector. Each sector may share economic risk with the broader market, however there may be economic risks specific to each sector. As a result, returns from those sectors may trail returns from the overall stock market, and it is possible that the Fund may underperform the broader market or experience greater volatility.
• Industrials Sector Risk — Companies involved in the industrials sector include those whose businesses are dominated by one of the following activities: the manufacture and distribution of capital goods, including aerospace and defense,
CALAMOS FAMILY OF FUNDS
46
Calamos Timpani Small Cap Growth Fund
construction, engineering and building products, electrical equipment, and industrial machinery; the provision of commercial services and supplies, including printing, employment, environmental, and office services; and the provision of transportation services, including airlines, couriers, marine, road and rail, and transportation infrastructure. Companies involved in the industrials sector are affected by changes in the supply and demand for products and services, product obsolescence, claims for environmental damage or product liability, and general economic conditions, among other factors.
• Technology Sector Risk — Investments in companies involved in the technology sector are subject to significant competitive pressures, such as aggressive pricing of products or services, new market entrants, competition for market share, short product cycles due to an accelerated rate of technological developments, evolving industry standards, changing customer demands, and the potential for limited earnings and/or falling profit margins. The failure of a company to adapt to such changes could have a material adverse effect on the company's business, results of operations, and financial condition.These companies also face the risks that new services, equipment, or technologies will not be accepted by consumers and businesses or will become rapidly obsolete. These factors can affect the profitability of these companies and, as a result, the values of their securities. Many companies involved in the technology sector have limited operating histories, and prices of these companies' securities historically have been more volatile than those of many other companies' securities, especially over the short term.
• Small Company Risk — Small company stocks have historically been subject to greater investment risk than mid and large company stocks. The prices of small company stocks tend to be more volatile than prices of mid and large company stocks.
Fund Performance
The following bar chart and table indicate the risks of investing in the Fund by showing changes in the Fund's performance from calendar year to calendar year and how the Fund's average annual total returns compare with those of a broad measure of market performance. All returns include the reinvestment of dividends and distributions. The performance shown in the bar chart and performance table for the period May 31, 2019 through December 31, 2023 is the Fund's performance whereas performance prior to May 31, 2019 is that of another investment vehicle (the "Predecessor Fund") prior to the commencement of the Fund's operations. On May 31, 2019, the Fund acquired all of the assets, subject to the liabilities, of the Predecessor Fund through a tax-free reorganization (the "Reorganization"). As a result of the Reorganization, the Fund adopted the performance and financial history of the Predecessor Fund. The Fund has the same investment objective, strategy and portfolio manager as the Predecessor Fund. As a result, the performance of the Fund would have been substantially similar to that of the Predecessor Fund.
The bar chart shows the performance of the Predecessor Fund's Institutional Class performance which was adopted by the Class I shares of the Fund for periods prior to the Reorganization. If the Predecessor Fund's investment adviser had not waived or reimbursed certain Predecessor Fund expenses during these periods, the Predecessor Fund's returns would have been lower. As always, please note that the Fund's past performance (before and after taxes) cannot predict how it will perform in the future. Updated performance information is available at no cost by visiting www.calamos.com or by calling 800.582.6959.
CLASS I* ANNUAL TOTAL RETURN FOR YEARS ENDED 12.31
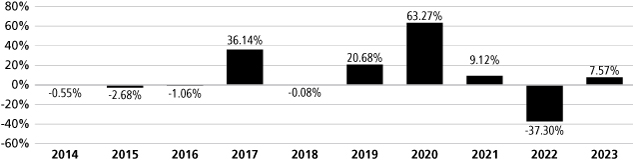
|
Highest Quarterly Return: |
|
|
40.93 |
% (6.30.2020) |
|
Lowest Quarterly Return: |
|
|
-23.99 |
% (6.30.2022) |
|
* Annual returns for Class I are provided because Class I shares represent the largest percentage of assets in the Calamos Family of Funds.
PROSPECTUS | March 1, 2024
47
Calamos Timpani Small Cap Growth Fund
Average Annual Total Returns as of 12.31.23
The following table shows how the Fund's average annual performance (before and after taxes) for the one- and five-year periods ended December 31, 2023 and since the Fund's inception compared with broad measures of market performance. For periods prior to the Reorganization, the average annual total return table compares the Predecessor Fund's Institutional Class performance which was adopted by the Class I shares of the Fund and Class Y performance which was adopted by the Class A shares of the Fund and adjusted to reflect the maximum sales load of 4.75% for Class A shares, to that of the Russell 2000 Growth Index. "Since Inception" return shown for the Russell 2000 Growth Index is the return since the inception of the Predecessor Fund's Class Y shares. The after-tax returns show the impact of assumed federal income taxes on an investment in the Fund. "Return After Taxes on Distributions" shows the effect of taxable distributions, but assumes that you still hold the Fund shares at the end of the period and so do not have any taxable gain or loss on your investment. "Return After Taxes on Distributions and Sale of Fund Shares" shows the effect of taxable distributions and any taxable gain or loss that would be realized if the Fund shares were purchased at the beginning and sold at the end of the specified period.
The after-tax returns are shown only for Class I shares, and are calculated using the historical highest individual federal marginal income tax rates and do not reflect the impact of state and local taxes. Actual after-tax returns depend on an investor's tax situation and may differ from those shown, and the after-tax returns shown are not relevant to investors who hold their Fund shares through tax-advantaged arrangements, such as 401(k) plans or individual retirement accounts. After-tax returns for classes other than Class I shares will vary from returns shown for Class I shares. "Return After Taxes on Distributions and Sale of Fund Shares" may be higher than other returns for the same period due to a tax benefit of realizing a capital loss on the sale of Fund shares.
AVERAGE ANNUAL TOTAL RETURNS — FOR THE PERIODS ENDED 12.31.23
|
|
|
INCEPTION
DATE OF CLASS |
|
ONE YEAR |
|
FIVE YEAR |
|
TEN YEAR |
|
SINCE
INCEPTION |
|
|
Class A |
|
|
01.06.14 |
|
|
|
|
|
|
|
|
|
|
|
Load Adjusted Return before taxes |
|
|
|
|
2.22 |
% |
|
|
6.39 |
% |
|
|
N/A |
|
|
|
5.81 |
% |
|
|
Class C |
|
|
06.25.21 |
|
|
|
|
|
|
|
|
|
|
|
Load Adjusted Return before taxes |
|
|
|
|
5.50 |
% |
|
|
N/A |
|
|
|
N/A |
|
|
|
-17.23 |
% |
|
|
Class I |
|
|
03.23.11 |
|
|
|
|
|
|
|
|
|
|
|
Return before taxes |
|
|
|
|
7.57 |
% |
|
|
7.71 |
% |
|
|
6.57 |
% |
|
|
9.48 |
% |
|
|
Return after taxes on distributions* |
|
|
|
|
7.57 |
% |
|
|
7.28 |
% |
|
|
6.18 |
% |
|
|
9.12 |
% |
|
Return after taxes on distributions and sale of
Fund shares* |
|
|
|
|
4.48 |
% |
|
|
6.09 |
% |
|
|
5.27 |
% |
|
|
7.91 |
% |
|
|
Class R6 |
|
|
05.31.19 |
|
|
|
|
|
|
|
|
|
|
|
Load Adjusted Return before taxes |
|
|
|
|
7.70 |
% |
|
|
N/A |
|
|
|
N/A |
|
|
|
5.35 |
% |
|
|
Russell 2000 Growth Index |
|
|
|
|
18.66 |
% |
|
|
9.22 |
% |
|
|
7.16 |
% |
|
|
8.75 |
% |
|
*
Investment Adviser
Calamos Advisors LLC
PORTFOLIO MANAGER/
FUND TITLE (IF APPLICABLE) |
|
PORTFOLIO MANAGER
EXPERIENCE IN THE FUND |
|
PRIMARY TITLE
WITH INVESTMENT ADVISER |
|
|
Brandon Nelson |
|
since Fund's inception |
|
Senior Portfolio Manager |
|
Other Important Information Regarding Fund Shares
For important information about purchase and sale of Fund shares, tax information, and financial intermediary compensation, please turn to "Other Important Information Regarding Fund Shares" on Page 125 of the prospectus.
CALAMOS FAMILY OF FUNDS
48
Calamos Timpani SMID Growth Fund
Investment Objective
Calamos Timpani SMID Growth Fund's investment objective is capital appreciation.
Fees and Expenses of the Fund
The following table describes the fees and expenses that you may pay if you buy, hold and sell shares of the Fund. Investors may pay other fees, such as brokerage commissions and/or other forms of compensation to a financial intermediary, which are not reflected in the tables or the examples below. You may qualify for sales charge discounts on purchases of Class A shares if you and your family invest, or agree to invest in the future, at least $50,000 in Calamos Funds. More information about these and other discounts is available from your financial professional and under "Fund Facts — What classes of shares do the Funds offer?" on Page 149 of the Fund's prospectus, in the Appendix to this prospectus and "Share Classes and Pricing of Shares" on Page 67 of the Fund's statement of additional information.
Shareholder Fees (fees paid directly from your investment):
|
|
|
CLASS A |
|
CLASS I |
|
CLASS R6 |
|
|
Maximum Sales Charge (Load) Imposed on Purchases (as a percentage of offering price) |
|
|
4.75 |
% |
|
|
None |
|
|
|
None |
|
|
Maximum Deferred Sales Charge (Load) (as a percentage of the lesser of the redemption price or
offering price) |
|
|
None |
|
|
|
None |
|
|
|
None |
|
|
Annual Fund Operating Expenses (expenses that you pay each year as a percentage of the value of your investment):
|
|
|
CLASS A |
|
CLASS I |
|
CLASS R6 |
|
|
Management Fees |
|
|
0.95 |
% |
|
|
0.95 |
% |
|
|
0.95 |
% |
|
|
Distribution and/or Service Fees (12b-1) |
|
|
0.25 |
% |
|
|
None |
|
|
|
None |
|
|
|
Other Expenses |
|
|
0.78 |
% |
|
|
0.78 |
% |
|
|
0.75 |
% |
|
|
Total Annual Fund Operating Expenses |
|
|
1.98 |
% |
|
|
1.73 |
% |
|
|
1.70 |
% |
|
|
Expense Reimbursement1 |
|
|
(0.63 |
)% |
|
|
(0.63 |
)% |
|
|
(0.63 |
)% |
|
|
Total Annual Fund Operating Expenses After Reimbursement |
|
|
1.35 |
% |
|
|
1.10 |
% |
|
|
1.07 |
% |
|
1
Example
This example is intended to help you compare the cost of investing in the Fund with the cost of investing in other mutual funds. The example assumes that you invest $10,000 in the Fund for the time periods indicated and then either redeem or do not redeem your shares at the end of the reflected time periods. The example also assumes that your investment has a 5% return each year, that all dividends and capital gain distributions are reinvested, that you pay a maximum initial or contingent deferred sales charge and that the Fund's operating expenses remain the same. Any applicable fee waivers and/or expense
PROSPECTUS | March 1, 2024
49
Calamos Timpani SMID Growth Fund
reimbursements are reflected in the below examples for the period through March 1, 2025 only. Although your actual performance and costs may be higher or lower, based on these assumptions, your costs would be:
You would pay the following expenses whether or not you redeemed your shares at the end of the period:
|
|
|
One Year |
|
Three Years |
|
Five Years |
|
Ten Years |
|
|
Class A |
|
|
606 |
|
|
|
1,009 |
|
|
|
1,436 |
|
|
|
2,623 |
|
|
|
Class I |
|
|
112 |
|
|
|
483 |
|
|
|
879 |
|
|
|
1,988 |
|
|
|
Class R6 |
|
|
109 |
|
|
|
474 |
|
|
|
864 |
|
|
|
1,956 |
|
|
Portfolio Turnover
The Fund pays transaction costs, such as commissions, when it buys and sells securities (or "turns over" its portfolio). A higher portfolio turnover rate may indicate higher transaction costs and may result in higher taxes when Fund shares are held in a taxable account. These costs, which are not reflected in the annual fund operating expenses or in the example, affect the Fund's performance. During the most recent fiscal year, the Fund's portfolio turnover rate was 231% of the average value of its portfolio.
Principal Investment Strategies
Under normal market conditions, the Fund invests at least 80% of its net assets (plus any borrowings) in equity securities of small and mid-capitalization ("SMID") companies of issuers primarily located in the United States. The Fund defines a SMID company as a company with a market capitalization less than or equal to that of the company with the largest market capitalization of the Russell 2500® Index or the MSCI USA SMID Cap Index as measured on a rolling 24-month basis over the most recent period. The market capitalization of a security is measured at the time of purchase.
Equity securities in which the Fund invests as a part of its principal investment strategy consist of common stocks and American Depositary Receipts ("ADRs"). The Fund may invest up to 25% of its net assets in foreign securities. Foreign securities are securities issued by issuers that are organized under the laws of a foreign country, that have a substantial portion of their operations or assets in a foreign country or countries, or that derive a substantial portion of their revenue or profits from businesses, investments or sales outside of the United States. The Fund may also invest in foreign securities that are represented in the United States securities markets by ADRs or similar depositary arrangements. The Fund's foreign investments can be denominated in U.S. dollars or in foreign currencies. Calamos Advisors uses fundamental research to evaluate investment opportunities, focusing on companies that it believes have superior management and whose business models have a high potential for earnings upside. Calamos Advisors may actively trade portfolio securities. From time to time, the Fund may have significant investments in certain sectors due to Calamos Advisors' investment process yielding opportunities for sound growth potential within those sectors. The Fund's sector concentrations may vary.
Principal Risks
An investment in the Fund is subject to risks, and you could lose money on your investment in the Fund. There can be no assurance that the Fund will achieve its investment objective. The risks associated with an investment in the Fund can increase during times of significant market volatility. Your investment in the Fund is not a deposit in a bank and is not insured or guaranteed by the Federal Deposit Insurance Corporation or any other government agency. The principal risks are presented in alphabetical order to facilitate finding particular risks and comparing them with other funds. Each risk summarized below is considered a "principal risk" of investing in the Fund, regardless of the order in which it appears. The principal risks of investing in the Fund include:
• American Depositary Receipts Risk — The stocks of most foreign companies that trade in the U.S. markets are traded as ADRs. U.S. depositary banks issue these stocks. Each ADR represents one or more shares of foreign stock or a fraction of a share. The price of an ADR corresponds to the price of the foreign stock in its home market, adjusted to the ratio of the ADRs to foreign company shares. Therefore while purchasing a security on a U.S. exchange, the risks inherently associated with foreign investing still apply to ADRs.
CALAMOS FAMILY OF FUNDS
50
Calamos Timpani SMID Growth Fund
• Cash Holdings Risk — The Fund may invest in cash and cash equivalents for indefinite periods of time when the Fund's investment adviser determines the prevailing market environment warrants doing so. When the Fund holds cash positions, it may lose opportunities to participate in market appreciation, which may result in lower returns than if the Fund had remained fully invested in the market. Furthermore, cash and cash equivalents may generate minimal or no income and could negatively impact the Fund's performance and ability to achieve its investment objective.
• Equity Securities Risk — The securities markets are volatile, and the market prices of the Fund's securities may decline generally. The price of equity securities fluctuates based on changes in a company's financial condition and overall market and economic conditions. If the market prices of the securities owned by the Fund fall, the value of your investment in the Fund will decline.
• Foreign Securities Risk — Risks associated with investing in foreign securities include fluctuations in the exchange rates of foreign currencies that may affect the U.S. dollar value of a security, the possibility of substantial price volatility as a result of political and economic instability in the foreign country, less public information about issuers of securities, different securities regulation, different accounting, auditing and financial reporting standards and less liquidity than in U.S. markets.
• Growth Stock Risk — Growth securities typically trade at higher multiples of current earnings than other securities and, therefore, may be more sensitive to changes in current or expected earnings than other equity securities and may be more volatile.
• Liquidity Risk — Liquidity risk exists when particular investments are difficult to purchase or sell. The Fund's investments in illiquid securities may reduce the returns of the Fund because it may be unable to sell the illiquid securities at an advantageous time or price.
• Portfolio Selection Risk — The value of your investment may decrease if the investment adviser's judgment about the attractiveness, value or market trends affecting a particular security, issuer, industry or sector or about market movements is incorrect.
• Portfolio Turnover Risk — The portfolio managers may actively and frequently trade securities or other instruments in the Fund's portfolio to carry out its investment strategies. A high portfolio turnover rate increases transaction costs, which may increase the Fund's expenses. Frequent and active trading may also cause adverse tax consequences for investors in the Fund due to an increase in short-term capital gains.
• Sector Risk — To the extent the Fund invests a significant portion of its assets in a particular sector, a greater portion of the Fund's performance may be affected by the general business and economic conditions affecting that sector. Each sector may share economic risk with the broader market, however there may be economic risks specific to each sector. As a result, returns from those sectors may trail returns from the overall stock market, and it is possible that the Fund may underperform the broader market or experience greater volatility.
• Small and Mid-Sized Company Stock Risk — Small to mid-sized company stocks have historically been subject to greater investment risk than large company stocks. The prices of small to mid-sized company stocks tend to be more volatile and less liquid than large company stocks. Small and mid-sized companies may have no or relatively short operating histories, or be newly formed public companies. Some of these companies have aggressive capital structures, including high debt levels, or are involved in rapidly growing or changing industries and/or new technologies, which pose additional risks.
PROSPECTUS | March 1, 2024
51
Calamos Timpani SMID Growth Fund
Fund Performance
The following bar chart and table indicate the risks of investing in the Fund by showing changes in the Fund's first full calendar year of performance compared to a broad measure of market performance. All returns include the reinvestment of dividends and distributions. As always, please note that the Fund's past performance (before and after taxes) cannot predict how it will perform in the future. Updated performance information is available at no cost by visiting www.calamos.com or by calling 800.582.6959.
CLASS I* ANNUAL TOTAL RETURN FOR YEARS ENDED 12.31
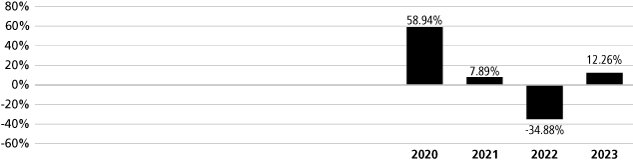
|
Highest Quarterly Return: |
|
|
37.58 |
% (6.30.2020) |
|
Lowest Quarterly Return: |
|
|
-22.94 |
% (6.30.2022) |
|
* Annual returns for Class I are provided because Class I shares represent the largest percentage of assets in the Calamos Family of Funds.
Average Annual Total Returns as of 12.31.23
The following table shows how the Fund's average annual performance (before and after taxes) for the one-year period ended December 31, 2023 and since the Fund's inception compared with broad measures of market performance. "Since Inception" returns shown for each index are returns since the inception of the Fund's Class A shares, or since the nearest subsequent month end when comparative index data is available only for full monthly periods. The after-tax returns show the impact of assumed federal income taxes on an investment in the Fund. "Return After Taxes on Distributions" shows the effect of taxable distributions, but assumes that you still hold the Fund shares at the end of the period and so do not have any taxable gain or loss on your investment. "Return After Taxes on Distributions and Sale of Fund Shares" shows the effect of taxable distributions and any taxable gain or loss that would be realized if the Fund shares were purchased at the beginning and sold at the end of the specified period.
The after-tax returns are shown only for Class I shares and are calculated using the historical highest individual federal marginal income tax rates and do not reflect the impact of state and local taxes. Actual after-tax returns depend on an investor's tax situation and may differ from those shown, and the after-tax returns shown are not relevant to investors who hold their Fund shares through tax-advantaged arrangements, such as 401(k) plans or individual retirement accounts. After-tax returns for classes other than Class I will vary from returns shown for Class I. "Return After Taxes on Distributions and Sale of Fund Shares" may be higher than other returns for the same period due to a tax benefit of realizing a capital loss on the sale of Fund shares.
CALAMOS FAMILY OF FUNDS
52
Calamos Timpani SMID Growth Fund
AVERAGE ANNUAL TOTAL RETURNS — FOR THE PERIODS ENDED 12.31.23
|
|
|
INCEPTION
DATE OF CLASS |
|
ONE YEAR |
|
SINCE
INCEPTION |
|
|
Class A |
|
|
7.31.19 |
|
|
|
|
|
|
|
Load Adjusted Return before taxes |
|
|
|
|
6.55 |
% |
|
|
2.90 |
% |
|
|
Class I |
|
|
7.31.19 |
|
|
|
|
|
|
|
Return before taxes |
|
|
|
|
12.26 |
% |
|
|
4.33 |
% |
|
|
Return after taxes on distributions* |
|
|
|
|
12.26 |
% |
|
|
3.64 |
% |
|
|
Return after taxes on distributions and sale of Fund shares* |
|
|
|
|
7.26 |
% |
|
|
3.43 |
% |
|
|
Class R6 |
|
|
7.31.19 |
|
|
|
|
|
|
|
Load Adjusted Return before taxes |
|
|
|
|
12.15 |
% |
|
|
4.33 |
% |
|
|
Russell 2500 Growth Index |
|
|
|
|
18.93 |
% |
|
|
7.29 |
% |
|
*
Investment Adviser
Calamos Advisors LLC
PORTFOLIO MANAGER/
FUND TITLE (IF APPLICABLE) |
|
PORTFOLIO MANAGER
EXPERIENCE IN THE FUND |
|
PRIMARY TITLE
WITH INVESTMENT ADVISER |
|
|
Brandon Nelson |
|
since Fund's inception |
|
Senior Portfolio Manager |
|
|
Ryan Isherwood |
|
since Fund's inception |
|
Co-Portfolio Manager |
|
Other Important Information Regarding Fund Shares
For important information about purchase and sale of Fund shares, tax information, and financial intermediary compensation, please turn to "Other Important Information Regarding Fund Shares" on Page 125 of the prospectus.
PROSPECTUS | March 1, 2024
53
Investment Objective
Calamos Growth Fund's investment objective is long-term capital growth.
Fees and Expenses of the Fund
The following table describes the fees and expenses that you may pay if you buy, hold and sell shares of the Fund. Investors may pay other fees, such as brokerage commissions and/or other forms of compensation to a financial intermediary, which are not reflected in the tables or the examples below. You may qualify for sales charge discounts on purchases of Class A if you and your family invest, or agree to invest in the future, at least $50,000 in Calamos Funds. More information about these and other discounts is available from your financial professional and under "Fund Facts — What classes of shares do the Funds offer?" on Page 149 of the Fund's prospectus, in the Appendix to this prospectus and "Share Classes and Pricing of Shares" on Page 67 of the Fund's statement of additional information.
Shareholder Fees (fees paid directly from your investment):
|
|
|
CLASS A |
|
CLASS C |
|
CLASS I |
|
|
Maximum Sales Charge (Load) Imposed on Purchases (as a percentage of offering price) |
|
|
4.75 |
% |
|
|
None |
|
|
|
None |
|
|
Maximum Deferred Sales Charge (Load) (as a percentage of the lesser of the redemption price or
offering price) |
|
|
None |
|
|
|
1.00 |
% |
|
|
None |
|
|
Annual Fund Operating Expenses (expenses that you pay each year as a percentage of the value of your investment):
|
|
|
CLASS A |
|
CLASS C |
|
CLASS I |
|
|
Management Fees |
|
|
0.92 |
% |
|
|
0.92 |
% |
|
|
0.92 |
% |
|
|
Distribution and/or Service Fees (12b-1) |
|
|
0.25 |
% |
|
|
1.00 |
% |
|
|
None |
|
|
|
Other Expenses |
|
|
0.15 |
% |
|
|
0.15 |
% |
|
|
0.15 |
% |
|
|
Total Annual Fund Operating Expenses |
|
|
1.32 |
% |
|
|
2.07 |
% |
|
|
1.07 |
% |
|
Example
This example is intended to help you compare the cost of investing in the Fund with the cost of investing in other mutual funds. The example assumes that you invest $10,000 in the Fund for the time periods indicated and then either redeem or do not redeem your shares at the end of the reflected time periods. The example also assumes that your investment has a 5% return each year, that all dividends and capital gain distributions are reinvested, that you pay a maximum initial or contingent deferred sales charge and that the Fund's operating expenses remain the same. Although your actual performance and costs may be higher or lower, based on these assumptions, your costs would be:
You would pay the following expenses if you redeemed your shares at the end of the period:
|
|
|
One Year |
|
Three Years |
|
Five Years |
|
Ten Years |
|
|
Class A |
|
|
603 |
|
|
|
873 |
|
|
|
1,164 |
|
|
|
1,990 |
|
|
|
Class C |
|
|
310 |
|
|
|
649 |
|
|
|
1,114 |
|
|
|
2,400 |
|
|
|
Class I |
|
|
109 |
|
|
|
340 |
|
|
|
590 |
|
|
|
1,306 |
|
|
You would pay the following expenses if you did not redeem your shares:
|
|
|
One Year |
|
Three Years |
|
Five Years |
|
Ten Years |
|
|
Class A |
|
|
603 |
|
|
|
873 |
|
|
|
1,164 |
|
|
|
1,990 |
|
|
|
Class C |
|
|
210 |
|
|
|
649 |
|
|
|
1,114 |
|
|
|
2,400 |
|
|
|
Class I |
|
|
109 |
|
|
|
340 |
|
|
|
590 |
|
|
|
1,306 |
|
|
CALAMOS FAMILY OF FUNDS
54
Portfolio Turnover
The Fund pays transaction costs, such as commissions, when it buys and sells securities (or "turns over" its portfolio). A higher portfolio turnover rate may indicate higher transaction costs and may result in higher taxes when Fund shares are held in a taxable account. These costs, which are not reflected in the annual fund operating expenses or in the example, affect the Fund's performance. During the most recent fiscal year, the Fund's portfolio turnover rate was 57% of the average value of its portfolio.
Principal Investment Strategies
The Fund invests primarily in equity securities issued by U.S. companies. The Fund currently anticipates that substantially all of its portfolio will consist of securities of companies with large and mid-sized market capitalizations. The Fund's investment adviser generally defines a large cap company to have a market capitalization in excess of $25 billion and a mid-sized company to have a market capitalization greater than $1 billion, up to $25 billion. The Fund may invest up to 25% of its net assets in foreign securities. Foreign securities are securities issued by issuers that are organized under the laws of a foreign country or that have a substantial portion of their operations or assets in a foreign country or countries, or that derive a substantial portion of their revenue or profits from businesses, investments or sales outside of the United States. The Fund may also invest in foreign securities that are represented in the United States securities markets by American Depositary Receipts ("ADRs") or similar depository arrangements. The Fund's foreign debt investments can be denominated in U.S. dollars or in foreign currencies. Debt securities issued by a foreign government may not be supported by the "full faith and credit" of that government.
In pursuing its investment objective, the Fund seeks out securities that, in the investment adviser's opinion, offer the best opportunities for growth. The Fund's investment adviser typically considers the company's financial soundness, earnings and cash flow forecast and quality of management. The Fund's investment adviser seeks to lower the risks of investing in stocks by using a "top-down approach" of diversification by company, industry, sector, country and currency and focusing on macro-level investment themes.
Principal Risks
An investment in the Fund is subject to risks, and you could lose money on your investment in the Fund. There can be no assurance that the Fund will achieve its investment objective. The risks associated with an investment in the Fund can increase during times of significant market volatility. Your investment in the Fund is not a deposit in a bank and is not insured or guaranteed by the Federal Deposit Insurance Corporation or any other government agency. The principal risks are presented in alphabetical order to facilitate finding particular risks and comparing them with other funds. Each risk summarized below is considered a "principal risk" of investing in the Fund, regardless of the order in which it appears. The principal risks of investing in the Fund include:
• American Depositary Receipts Risk — The stocks of most foreign companies that trade in the U.S. markets are traded as American Depositary Receipts (ADRs). U.S. depositary banks issue these stocks. Each ADR represents one or more shares of foreign stock or a fraction of a share. The price of an ADR corresponds to the price of the foreign stock in its home market, adjusted to the ratio of the ADRs to foreign company shares. Therefore while purchasing a security on a U.S. exchange, the risks inherently associated with foreign investing still apply to ADRs.
• Equity Securities Risk — The securities markets are volatile, and the market prices of the Fund's securities may decline generally. The price of equity securities fluctuates based on changes in a company's financial condition and overall market and economic conditions. If the market prices of the securities owned by the Fund fall, the value of your investment in the Fund will decline.
• Foreign Securities Risk — Risks associated with investing in foreign securities include fluctuations in the exchange rates of foreign currencies that may affect the U.S. dollar value of a security, the possibility of substantial price volatility as a result of political and economic instability in the foreign country, less public information about issuers of securities, different securities regulation, different accounting, auditing and financial reporting standards and less liquidity than in U.S. markets.
PROSPECTUS | March 1, 2024
55
• Forward Foreign Currency Contract Risk — Forward foreign currency contracts are contractual agreements to purchase or sell a specified currency at a specified future date (or within a specified time period) at a price set at the time of the contract. The Fund may not fully benefit from, or may lose money on, forward foreign currency transactions if changes in currency exchange rates do not occur as anticipated or do not correspond accurately to changes in the value of the Fund's holdings.
• Growth Stock Risk — Growth securities typically trade at higher multiples of current earnings than other securities and, therefore, may be more sensitive to changes in current or expected earnings than other equity securities and may be more volatile.
• Mid-Sized Company Risk — Mid-sized company stocks have historically been subject to greater investment risk than large company stocks. The prices of mid-sized company stocks tend to be more volatile than prices of large company stocks.
• Options Risk — The Fund's ability to close out its position as a purchaser or seller of an over-the-counter or exchange-listed put or call option is dependent, in part, upon the liquidity of the options market. There are significant differences between the securities and options markets that could result in an imperfect correlation among these markets, causing a given transaction not to achieve its objectives. The Fund's ability to utilize options successfully will depend on the ability of the Fund's investment adviser to predict pertinent market movements, which cannot be assured.
• Portfolio Selection Risk — The value of your investment may decrease if the investment adviser's judgment about the attractiveness, value or market trends affecting a particular security, issuer, industry or sector or about market movements is incorrect.
• Sector Risk — To the extent the Fund invests a significant portion of its assets in a particular sector, a greater portion of the Fund's performance may be affected by the general business and economic conditions affecting that sector. Each sector may share economic risk with the broader market, however there may be economic risks specific to each sector. As a result, returns from those sectors may trail returns from the overall stock market and it is possible that the Fund may underperform the broader market, or experience greater volatility.
• Securities Lending Risk — The Fund may lend its portfolio securities to broker-dealers and banks in order to generate additional income for the Fund. Any such loan must be continuously secured by collateral in cash or cash equivalents maintained on a current basis in an amount at least equal to the market value of the securities loaned by the Fund. In the event of bankruptcy or other default of a borrower of portfolio securities, the Fund could experience both delays in liquidating the loan collateral or recovering the loaned securities and losses, including (a) possible decline in the value of the collateral or in the value of the securities loaned during the period while the Fund seeks to enforce its rights thereto,(b) possible subnormal levels of income and lack of access to income during this period, and (c) expenses of enforcing its rights. In an effort to reduce these risks, the Fund's securities lending agent monitors, and reports to Calamos Advisors on, the creditworthiness of the firms to which a Fund lends securities. The Fund may also experience losses as a result of a diminution in value of its cash collateral investments.
Fund Performance
The following bar chart and table indicate the risks of investing in the Fund by showing changes in the Fund's performance from calendar year to calendar year and how the Fund's average annual total returns compare with those of a broad measure of market performance. All returns include the reinvestment of dividends and distributions. As always, please note that the Fund's past performance (before and after taxes) cannot predict how it will perform in the future. Updated performance information is available at no cost by visiting www.calamos.com or by calling 800.582.6959.
CALAMOS FAMILY OF FUNDS
56
CLASS I* ANNUAL TOTAL RETURN FOR YEARS ENDED 12.31
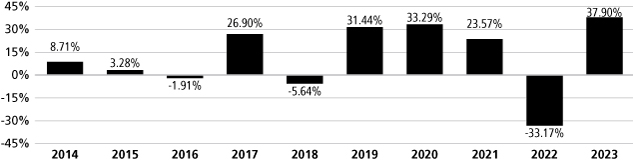
|
Highest Quarterly Return: |
|
|
29.42 |
% (6.30.2020) |
|
Lowest Quarterly Return: |
|
|
-22.98 |
% (6.30.2022) |
|
* Annual returns for Class I are provided because Class I shares represent the largest percentage of assets in the Calamos Family of Funds.
Average Annual Total Returns as of 12.31.23
The following table shows how the Fund's average annual performance (before and after taxes) for the one-, five- and ten-year periods ended December 31, 2023 and since the Fund's inception compared with broad measures of market performance. "Since Inception" returns shown for each index are returns since the inception of the Fund's Class A shares, or since the nearest subsequent month end when comparative index data is available only for full monthly periods. The after-tax returns show the impact of assumed federal income taxes on an investment in the Fund. "Return After Taxes on Distributions" shows the effect of taxable distributions, but assumes that you still hold the Fund shares at the end of the period and so do not have any taxable gain or loss on your investment. "Return After Taxes on Distributions and Sale of Fund Shares" shows the effect of taxable distributions and any taxable gain or loss that would be realized if the Fund shares were purchased at the beginning and sold at the end of the specified period.
The after-tax returns are shown only for Class I shares, and are calculated using the historical highest individual federal marginal income tax rates and do not reflect the impact of state and local taxes. Actual after-tax returns depend on an investor's tax situation and may differ from those shown, and the after-tax returns shown are not relevant to investors who hold their Fund shares through tax-advantaged arrangements, such as 401(k) plans or individual retirement accounts. After-tax returns for classes other than Class I will vary from returns shown for Class I. "Return After Taxes on Distributions and Sale of Fund Shares" may be higher than other returns for the same period due to a tax benefit of realizing a capital loss on the sale of Fund shares.
AVERAGE ANNUAL TOTAL RETURNS — FOR THE PERIODS ENDED 12.31.23
|
|
|
INCEPTION
DATE OF CLASS |
|
ONE YEAR |
|
FIVE YEAR |
|
TEN YEAR |
|
SINCE
INCEPTION |
|
|
Class A |
|
|
9.4.90 |
|
|
|
|
|
|
|
|
|
|
|
Load Adjusted Return before taxes |
|
|
|
|
|
|
31.05 |
% |
|
|
13.42 |
% |
|
|
9.35 |
% |
|
|
12.39 |
% |
|
|
Class C |
|
|
9.3.96 |
|
|
|
|
|
|
|
|
|
|
|
Load Adjusted Return before taxes |
|
|
|
|
|
|
35.57 |
% |
|
|
13.70 |
% |
|
|
9.07 |
% |
|
|
11.24 |
% |
|
|
Class I |
|
|
9.18.97 |
|
|
|
|
|
|
|
|
|
|
|
Return before taxes |
|
|
|
|
|
|
37.90 |
% |
|
|
14.81 |
% |
|
|
10.16 |
% |
|
|
11.06 |
% |
|
|
Return after taxes on distributions* |
|
|
|
|
|
|
36.97 |
% |
|
|
13.40 |
% |
|
|
7.72 |
% |
|
|
9.18 |
% |
|
Return after taxes on distributions and sale of
Fund shares* |
|
|
|
|
|
|
23.09 |
% |
|
|
11.73 |
% |
|
|
7.43 |
% |
|
|
8.91 |
% |
|
|
S&P 1500 Growth Index |
|
|
|
|
|
|
29.01 |
% |
|
|
15.85 |
% |
|
|
12.97 |
% |
|
|
8.77 |
% |
|
|
S&P 500 Index |
|
|
|
|
|
|
26.29 |
% |
|
|
15.69 |
% |
|
|
12.03 |
% |
|
|
8.34 |
% |
|
*
PROSPECTUS | March 1, 2024
57
The S&P 1500 Index is a composite index that includes securities that account for 90% of the total market capitalization of the U.S.'s stocks. The index includes small, mid and large cap stocks. The S&P 1500 Growth Index is a subset of the securities appearing in the S&P 1500 Index, which includes the S&P 500, S&P 400, and S&P 600 indices. The S&P 1500 Growth Index is designed to provide investors with a measure of the performance of U.S. growth equities. The S&P 500 Index is provided as it is generally representative of the U.S. stock market.
Investment Adviser
Calamos Advisors LLC
PORTFOLIO MANAGER/
FUND TITLE (IF APPLICABLE) |
|
PORTFOLIO MANAGER
EXPERIENCE IN THE FUND |
|
PRIMARY TITLE
WITH INVESTMENT ADVISER |
|
|
John P. Calamos, Sr. (President, Chairman) |
|
since Fund's inception |
|
Founder, Chairman, and Global CIO |
|
|
R. Matthew Freund |
|
4 years |
|
SVP, Sr. Co-Portfolio Manager |
|
|
Michael Grant |
|
7 years |
|
SVP, Sr. Co-Portfolio Manager |
|
Other Important Information Regarding Fund Shares
For important information about purchase and sale of Fund shares, tax information, and financial intermediary compensation, please turn to "Other Important Information Regarding Fund Shares" on Page 125 of the prospectus.
CALAMOS FAMILY OF FUNDS
58
Calamos Growth and Income Fund
Investment Objective
Calamos Growth and Income Fund's investment objective is high long-term total return through growth and current income.
Fees and Expenses of the Fund
The following table describes the fees and expenses that you may pay if you buy, hold and sell shares of the Fund. Investors may pay other fees, such as brokerage commissions and/or other forms of compensation to a financial intermediary, which are not reflected in the tables or the examples below. You may qualify for sales charge discounts on purchases of Class A shares if you and your family invest, or agree to invest in the future, at least $50,000 in Calamos Funds. More information about these and other discounts is available from your financial professional and under "Fund Facts — What classes of shares do the Funds offer?" on Page 149 of the Fund's prospectus, in the Appendix to this prospectus and "Share Classes and Pricing of Shares" on Page 67 of the Fund's statement of additional information.
Shareholder Fees (fees paid directly from your investment):
|
|
|
CLASS A |
|
CLASS C |
|
CLASS I |
|
CLASS R6 |
|
Maximum Sales Charge (Load) Imposed on Purchases (as a percentage of
offering price) |
|
|
4.75 |
% |
|
|
None |
|
|
|
None |
|
|
|
None |
|
|
Maximum Deferred Sales Charge (Load) (as a percentage of the lesser of the
redemption price or offering price) |
|
|
None |
|
|
|
1.00 |
% |
|
|
None |
|
|
|
None |
|
|
Annual Fund Operating Expenses (expenses that you pay each year as a percentage of the value of your investment):
|
|
|
CLASS A |
|
CLASS C |
|
CLASS I |
|
CLASS R6 |
|
|
Management Fees |
|
|
0.68 |
% |
|
|
0.68 |
% |
|
|
0.68 |
% |
|
|
0.68 |
% |
|
|
Distribution and/or Service Fees (12b-1) |
|
|
0.25 |
% |
|
|
1.00 |
% |
|
|
None |
|
|
|
None |
|
|
|
Other Expenses |
|
|
0.13 |
% |
|
|
0.13 |
% |
|
|
0.13 |
% |
|
|
0.03 |
% |
|
|
Total Annual Fund Operating Expenses |
|
|
1.06 |
% |
|
|
1.81 |
% |
|
|
0.81 |
% |
|
|
0.71 |
% |
|
Example
This example is intended to help you compare the cost of investing in the Fund with the cost of investing in other mutual funds. The example assumes that you invest $10,000 in the Fund for the time periods indicated and then either redeem or do not redeem your shares at the end of the reflected time periods. The example also assumes that your investment has a 5% return each year, that all dividends and capital gain distributions are reinvested, that you pay a maximum initial or contingent deferred sales charge and that the Fund's operating expenses remain the same. Although your actual performance and costs may be higher or lower, based on these assumptions, your costs would be:
You would pay the following expenses if you redeemed your shares at the end of the period:
|
|
|
One Year |
|
Three Years |
|
Five Years |
|
Ten Years |
|
|
Class A |
|
|
578 |
|
|
|
796 |
|
|
|
1,032 |
|
|
|
1,708 |
|
|
|
Class C |
|
|
284 |
|
|
|
569 |
|
|
|
980 |
|
|
|
2,127 |
|
|
|
Class I |
|
|
83 |
|
|
|
259 |
|
|
|
450 |
|
|
|
1,002 |
|
|
|
Class R6 |
|
|
73 |
|
|
|
227 |
|
|
|
395 |
|
|
|
883 |
|
|
PROSPECTUS | March 1, 2024
59
Calamos Growth and Income Fund
You would pay the following expenses if you did not redeem your shares:
|
|
|
One Year |
|
Three Years |
|
Five Years |
|
Ten Years |
|
|
Class A |
|
|
578 |
|
|
|
796 |
|
|
|
1,032 |
|
|
|
1,708 |
|
|
|
Class C |
|
|
184 |
|
|
|
569 |
|
|
|
980 |
|
|
|
2,127 |
|
|
|
Class I |
|
|
83 |
|
|
|
259 |
|
|
|
450 |
|
|
|
1,002 |
|
|
|
Class R6 |
|
|
73 |
|
|
|
227 |
|
|
|
395 |
|
|
|
883 |
|
|
Portfolio Turnover
The Fund pays transaction costs, such as commissions, when it buys and sells securities (or "turns over" its portfolio). A higher portfolio turnover rate may indicate higher transaction costs and may result in higher taxes when Fund shares are held in a taxable account. These costs, which are not reflected in the annual fund operating expenses or in the example, affect the Fund's performance. During the most recent fiscal year, the Fund's portfolio turnover rate was 20% of the average value of its portfolio.
Principal Investment Strategies
The Fund invests primarily in a diversified portfolio of convertible (including synthetic convertible), equity and fixed-income securities of U.S. companies without regard to market capitalization. In pursuing its investment objective, the Fund attempts to utilize these different types of securities to strike, in the investment adviser's opinion, the appropriate balance between risk and reward in terms of growth and income.
A synthetic convertible instrument is designed to simulate the economic characteristics of a convertible security through the combined features of a debt instrument, or loan, and a security providing an option on an equity security. The Fund may establish a synthetic convertible instrument by combining a fixed-income security with the right to acquire an equity security. The fixed-income and equity option components may have different issuers, and either component may change at any time.
The Fund may invest up to 25% of its net assets in foreign equity securities. Foreign securities are securities issued by issuers that are organized under the laws of a foreign country or that have a substantial portion of their operations or assets in a foreign country or countries, or that derive a substantial portion of their revenue or profits from businesses, investments or sales outside of the United States. The Fund may also invest in foreign securities that are represented in the United States securities markets by American Depositary Receipts ("ADRs") or similar depository arrangements. The Fund's foreign debt investments can be denominated in U.S. dollars or in foreign currencies. Debt securities issued by a foreign government may not be supported by the "full faith and credit" of that government.
The Fund attempts to keep a consistent balance between risk and reward over the course of different market cycles, through various combinations of stocks, bonds and/or convertible securities, to achieve what the Fund's investment adviser believes to be an appropriate blend for the then-current market. As the market environment changes, portfolio securities may change in an attempt to achieve a relatively consistent risk level over time. At some points in a market cycle, one type of security may make up a substantial portion of the portfolio, while at other times certain securities may have minimal or no representation, depending on market conditions. Interest rate changes normally have a greater effect on prices of longer-term bonds than shorter-term bonds. The Fund's investment adviser seeks to lower the risks of investing in stocks by using a "top-down approach" of diversification by company, industry, sector, country and currency and focusing on macro-level investment themes. Consistent with the Fund's investment objective and principal investment strategies the Fund's investment adviser views the strategies as low volatility equity strategies and attempts to achieve equity-like returns with lower than equity market risk by managing a portfolio that it believes will exhibit less volatility over full market cycles.
CALAMOS FAMILY OF FUNDS
60
Calamos Growth and Income Fund
Principal Risks
An investment in the Fund is subject to risks, and you could lose money on your investment in the Fund. There can be no assurance that the Fund will achieve its investment objective. The risks associated with an investment in the Fund can increase during times of significant market volatility. Your investment in the Fund is not a deposit in a bank and is not insured or guaranteed by the Federal Deposit Insurance Corporation or any other government agency. The principal risks are presented in alphabetical order to facilitate finding particular risks and comparing them with other funds. Each risk summarized below is considered a "principal risk" of investing in the Fund, regardless of the order in which it appears. The principal risks of investing in the Fund include:
• American Depositary Receipts Risk — The stocks of most foreign companies that trade in the U.S. markets are traded as American Depositary Receipts (ADRs). U.S. depositary banks issue these stocks. Each ADR represents one or more shares of foreign stock or a fraction of a share. The price of an ADR corresponds to the price of the foreign stock in its home market, adjusted to the ratio of the ADRs to foreign company shares. Therefore while purchasing a security on a U.S. exchange, the risks inherently associated with foreign investing still apply to ADRs.
• Convertible Securities Risk — The value of a convertible security is influenced by changes in interest rates, with investment value declining as interest rates increase and increasing as interest rates decline. The credit standing of the issuer and other factors also may have an effect on the convertible security's investment value.
• Debt Securities Risk — Debt securities are subject to various risks, including interest rate risk, credit risk and default risk.
• Interest Rate Risk — The value of debt securities generally decreases in periods when interest rates are rising. In addition, interest rate changes typically have a greater effect on prices of longer-term debt securities than shorter term debt securities. Changes in interest rates by the Federal Reserve Board, and other events affecting fixed-income markets, may subject a Fund to heightened interest rate risk as a result of a rise in interest rates.
• Credit Risk — A debt security could deteriorate in quality to such an extent that its rating is downgraded or its market value declines relative to comparable securities. Changes in actual or perceived creditworthiness may occur quickly. If the Fund holds securities that have been downgraded, or that default on payment, the Fund's performance could be negatively affected.
• Default Risk — A company that issues a debt security may be unable to fulfill its obligation to repay principal and interest. The lower a bond is rated, the greater its default risk. To the extent the Fund holds securities that have been downgraded, or that default on payment, its performance could be negatively affected.
• Equity Securities Risk — The securities markets are volatile, and the market prices of the Fund's securities may decline generally. The price of equity securities fluctuates based on changes in a company's financial condition and overall market and economic conditions. If the market prices of the securities owned by the Fund fall, the value of your investment in the Fund will decline.
• Foreign Securities Risk — Risks associated with investing in foreign securities include fluctuations in the exchange rates of foreign currencies that may affect the U.S. dollar value of a security, the possibility of substantial price volatility as a result of political and economic instability in the foreign country, less public information about issuers of securities, different securities regulation, different accounting, auditing and financial reporting standards and less liquidity than in U.S. markets.
• Forward Foreign Currency Contract Risk — Forward foreign currency contracts are contractual agreements to purchase or sell a specified currency at a specified future date (or within a specified time period) at a price set at the time of the contract. The Fund may not fully benefit from, or may lose money on, forward foreign currency transactions if changes in currency exchange rates do not occur as anticipated or do not correspond accurately to changes in the value of the Fund's holdings.
• Growth Stock Risk — Growth securities typically trade at higher multiples of current earnings than other securities and, therefore, may be more sensitive to changes in current or expected earnings than other equity securities and may be more volatile.
PROSPECTUS | March 1, 2024
61
Calamos Growth and Income Fund
• High Yield Risk — High yield securities and unrated securities of similar credit quality (commonly known as "junk bonds") are subject to greater levels of credit and liquidity risks. High yield securities are considered primarily speculative with respect to the issuer's continuing ability to make principal and interest payments.
• Liquidity Risk — Liquidity risk exists when particular investments are difficult to purchase or sell. The Fund's investments in illiquid securities may reduce the returns of the Fund because it may be unable to sell the illiquid securities at an advantageous time or price.
• Options Risk — The Fund's ability to close out its position as a purchaser or seller of an over-the-counter or exchange- listed put or call option is dependent, in part, upon the liquidity of the options market. There are significant differences between the securities and options markets that could result in an imperfect correlation among these markets, causing a given transaction not to achieve its objectives. The Fund's ability to utilize options successfully will depend on the ability of the Fund's investment adviser to predict pertinent market movements, which cannot be assured.
• Portfolio Selection Risk — The value of your investment may decrease if the investment adviser's judgment about the attractiveness, value or market trends affecting a particular security, issuer, industry, or sector or about market movements is incorrect.
• Rule 144A Securities Risk — The Fund may invest in securities that are issued and sold through transactions under Rule 144A of the Securities Act of 1933. Under the supervision of its board of trustees, the Fund will determine whether Rule 144A Securities are illiquid. If qualified institutional buyers are unwilling to purchase these Rule 144A Securities, the percentage of the Fund's assets invested in illiquid securities would increase. Typically, the Fund purchases Rule 144A Securities only if the Fund's adviser has determined them to be liquid. If any Rule 144A Security held by the Fund should become illiquid, the value of the security may be reduced and a sale of the security may be more difficult.
• Securities Lending Risk — The Fund may lend its portfolio securities to broker-dealers and banks in order to generate additional income for the Fund. Any such loan must be continuously secured by collateral in cash or cash equivalents maintained on a current basis in an amount at least equal to the market value of the securities loaned by the Fund. In the event of bankruptcy or other default of a borrower of portfolio securities, the Fund could experience both delays in liquidating the loan collateral or recovering the loaned securities and losses, including (a) possible decline in the value of the collateral or in the value of the securities loaned during the period while the Fund seeks to enforce its rights thereto, (b) possible subnormal levels of income and lack of access to income during this period, and (c) expenses of enforcing its rights. In an effort to reduce these risks, the Fund's securities lending agent monitors, and reports to Calamos Advisors on, the creditworthiness of the firms to which a Fund lends securities. The Fund may also experience losses as a result of a diminution in value of its cash collateral investments.
• Small and Mid-Sized Company Risk — Small and mid-sized company stocks have historically been subject to greater investment risk than large company stocks. The prices of small and mid-sized company stocks tend to be more volatile than prices of large company stocks.
• Synthetic Convertible Instruments Risk — The value of a synthetic convertible instrument will respond differently to market fluctuations than a convertible security because a synthetic convertible instrument is composed of two or more separate securities, each with its own market value. In addition, if the value of the underlying common stock or the level of the index involved in the convertible component falls below the exercise price of the warrant or option, the warrant or option may lose all value.
• Tax Risk — The federal income tax treatment of convertible securities or other securities in which the Fund may invest may not be clear or may be subject to recharacterization by the Internal Revenue Service. It could be more difficult to comply with the tax requirements applicable to regulated investment companies if the tax characterization of investments or the tax treatment of the income from such investments were successfully challenged by the Internal Revenue Service. Any such failure to comply with the rules applicable to regulated investment companies could cause the Fund to fail to qualify as such.
CALAMOS FAMILY OF FUNDS
62
Calamos Growth and Income Fund
Fund Performance
The following bar chart and table indicate the risks of investing in the Fund by showing changes in the Fund's performance from calendar year to calendar year and how the Fund's average annual total returns compare with those of a broad measure of market performance. All returns include the reinvestment of dividends and distributions. As always, please note that the Fund's past performance (before and after taxes) cannot predict how it will perform in the future. Updated performance information is available at no cost by visiting www.calamos.com or by calling 800.582.6959.
CLASS I* ANNUAL TOTAL RETURN FOR YEARS ENDED 12.31
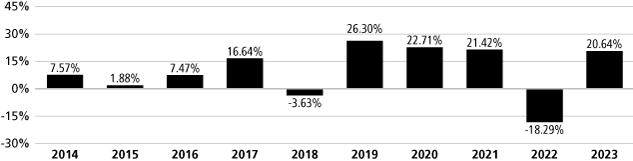
|
Highest Quarterly Return: |
|
|
20.08 |
% (6.30.2020) |
|
Lowest Quarterly Return: |
|
|
-16.25 |
% (3.31.2020) |
|
* Annual returns for Class I are provided because Class I shares represent the largest percentage of assets in the Calamos Family of Funds.
Average Annual Total Returns as of 12.31.23
The following table shows how the Fund's average annual performance (before and after taxes) for the one-, five- and ten-year periods ended December 31, 2023 and since the Fund's inception compared with broad measures of market performance. "Since Inception" returns shown for each index are returns since the inception of the Fund's Class A shares, or since the nearest subsequent month end when comparative index data is available only for full monthly periods. The after-tax returns show the impact of assumed federal income taxes on an investment in the Fund. "Return After Taxes on Distributions" shows the effect of taxable distributions, but assumes that you still hold the Fund shares at the end of the period and so do not have any taxable gain or loss on your investment. "Return After Taxes on Distributions and Sale of Fund Shares" shows the effect of taxable distributions and any taxable gain or loss that would be realized if the Fund shares were purchased at the beginning and sold at the end of the specified period.
The after-tax returns are shown only for Class I shares, and are calculated using the historical highest individual federal marginal income tax rates and do not reflect the impact of state and local taxes. Actual after-tax returns depend on an investor's tax situation and may differ from those shown, and the after-tax returns shown are not relevant to investors who hold their Fund shares through tax-advantaged arrangements, such as 401(k) plans or individual retirement accounts. After-tax returns for classes other than Class I will vary from returns shown for Class I. "Return After Taxes on Distributions and Sale of Fund Shares" may be higher than other returns for the same period due to a tax benefit of realizing a capital loss on the sale of Fund shares.
PROSPECTUS | March 1, 2024
63
Calamos Growth and Income Fund
AVERAGE ANNUAL TOTAL RETURNS — FOR THE PERIODS ENDED 12.31.23
|
|
|
INCEPTION
DATE OF CLASS |
|
ONE YEAR |
|
FIVE YEAR |
|
TEN YEAR |
|
SINCE
INCEPTION |
|
|
Class A |
|
|
9.22.88 |
|
|
|
|
|
|
|
|
|
|
|
Load Adjusted Return before taxes |
|
|
|
|
14.59 |
% |
|
|
11.78 |
% |
|
|
8.60 |
% |
|
|
10.70 |
% |
|
|
Class C |
|
|
8.5.96 |
|
|
|
|
|
|
|
|
|
|
|
Load Adjusted Return before taxes |
|
|
|
|
18.42 |
% |
|
|
12.03 |
% |
|
|
8.31 |
% |
|
|
9.45 |
% |
|
|
Class I |
|
|
9.18.97 |
|
|
|
|
|
|
|
|
|
|
|
Return before taxes |
|
|
|
|
20.64 |
% |
|
|
13.15 |
% |
|
|
9.40 |
% |
|
|
9.68 |
% |
|
|
Return after taxes on distributions* |
|
|
|
|
19.19 |
% |
|
|
11.84 |
% |
|
|
7.52 |
% |
|
|
7.97 |
% |
|
Return after taxes on distributions and sale of
Fund shares* |
|
|
|
|
12.94 |
% |
|
|
10.31 |
% |
|
|
7.03 |
% |
|
|
7.63 |
% |
|
|
Class R6 |
|
|
6.23.20 |
|
|
|
|
|
|
|
|
|
|
|
Load Adjusted Return before taxes |
|
|
|
|
20.73 |
% |
|
|
N/A |
|
|
|
N/A |
|
|
|
11.11 |
% |
|
|
S&P 500 Index |
|
|
|
|
26.29 |
% |
|
|
15.69 |
% |
|
|
12.03 |
% |
|
|
8.34 |
% |
|
ICE BofA All U.S. Convertibles EX Mandatory
Index |
|
|
|
|
13.77 |
% |
|
|
12.22 |
% |
|
|
9.43 |
% |
|
|
8.10 |
% |
|
*
The ICE BofA All U.S. Convertibles EX Mandatory Index represents the U.S. convertible market excluding mandatory convertibles. The ICE BofA All U.S. Convertibles EX Mandatory Index is provided to show how the Fund's performance compares with the returns of an index of securities similar to those in which the Fund invests.
Investment Adviser
Calamos Advisors LLC
PORTFOLIO MANAGER/
FUND TITLE (IF APPLICABLE) |
|
PORTFOLIO MANAGER
EXPERIENCE IN THE FUND |
|
PRIMARY TITLE
WITH INVESTMENT ADVISER |
|
|
John P. Calamos, Sr. (President, Chairman) |
|
since Fund's inception |
|
Founder, Chairman, and Global CIO |
|
|
R. Matthew Freund |
|
7 years |
|
SVP, Sr. Co-Portfolio Manager |
|
|
John Hillenbrand |
|
20 years |
|
SVP, Sr. Co-Portfolio Manager |
|
|
Eli Pars |
|
10.5 years |
|
SVP, Sr. Co-Portfolio Manager |
|
|
Jon Vacko |
|
20 years |
|
SVP, Sr. Co-Portfolio Manager |
|
|
Joe Wysocki |
|
9 years |
|
SVP, Sr. Co-Portfolio Manager |
|
|
Dino Dussias |
|
since February 2023 |
|
SVP, Associate Portfolio Manager |
|
Other Important Information Regarding Fund Shares
For important information about purchase and sale of Fund shares, tax information, and financial intermediary compensation, please turn to "Other Important Information Regarding Fund Shares" on Page 125 of the prospectus.
CALAMOS FAMILY OF FUNDS
64
Calamos Dividend Growth Fund
Investment Objective
Calamos Dividend Growth Fund's investment objective is to seek income and capital appreciation primarily through investments in dividend paying equities.
Fees and Expenses of the Fund
The following table describes the fees and expenses that you may pay if you buy, hold and sell shares of the Fund. Investors may pay other fees, such as brokerage commissions and/or other forms of compensation to a financial intermediary, which are not reflected in the tables or the examples below. You may qualify for sales charge discounts on purchases of Class A shares if you and your family invest, or agree to invest in the future, at least $50,000 in Calamos Funds. More information about these and other discounts is available from your financial professional and under "Fund Facts — What classes of shares do the Funds offer?" on Page 149 of the Fund's prospectus, in the Appendix to this prospectus and "Share Classes and Pricing of Shares" on Page 67 of the Fund's statement of additional information.
Shareholder Fees (fees paid directly from your investment):
|
|
|
CLASS A |
|
CLASS C |
|
CLASS I |
|
|
Maximum Sales Charge (Load) Imposed on Purchases (as a percentage of offering price) |
|
|
4.75 |
% |
|
|
None |
|
|
|
None |
|
|
Maximum Deferred Sales Charge (Load) (as a percentage of the lesser of the redemption price or
offering price) |
|
|
None |
|
|
|
1.00 |
% |
|
|
None |
|
|
Annual Fund Operating Expenses (expenses that you pay each year as a percentage of the value of your investment):
|
|
|
CLASS A
|
|
CLASS C
|
|
CLASS I
|
|
|
Management Fees
|
|
|
1.00
|
%
|
|
|
1.00
|
%
|
|
|
1.00
|
%
|
|
|
Distribution and/or Service Fees (12b-1)
|
|
|
0.25
|
%
|
|
|
1.00
|
%
|
|
|
None
|
|
|
|
Other Expenses
|
|
|
0.84
|
%
|
|
|
0.84
|
%
|
|
|
0.84
|
%
|
|
|
Acquired Fund Fees and Expenses2
|
|
|
0.01
|
%
|
|
|
0.01
|
%
|
|
|
0.01
|
%
|
|
|
Total Annual Fund Operating Expenses
|
|
|
2.10
|
%
|
|
|
2.85
|
%
|
|
|
1.85
|
%
|
|
|
Expense Reimbursement1
|
|
|
(0.74
|
)%
|
|
|
(0.74
|
)%
|
|
|
(0.74
|
)%
|
|
|
Total Annual Fund Operating Expenses After Reimbursement
|
|
|
1.36
|
%
|
|
|
2.11
|
%
|
|
|
1.11
|
%
|
|
1
2
Example
This example is intended to help you compare the cost of investing in the Fund with the cost of investing in other mutual funds. The example assumes that you invest $10,000 in the Fund for the time periods indicated and then either redeem or do not redeem your shares at the end of the reflected time periods. The example also assumes that your investment has a 5% return each year, that all dividends and capital gain distributions are reinvested, that you pay a maximum initial or contingent deferred sales charge and that the Fund's operating expenses remain the same. Any applicable fee waivers and/or expense
PROSPECTUS | March 1, 2024
65
Calamos Dividend Growth Fund
reimbursements are reflected in the below examples for the period through March 1, 2025 only. Although your actual performance and costs may be higher or lower, based on these assumptions, your costs would be:
You would pay the following expenses if you redeemed your shares at the end of the period:
|
|
|
One Year |
|
Three Years |
|
Five Years |
|
Ten Years |
|
|
Class A |
|
|
607 |
|
|
|
1,033 |
|
|
|
1,485 |
|
|
|
2,735 |
|
|
|
Class C |
|
|
314 |
|
|
|
813 |
|
|
|
1,438 |
|
|
|
3,123 |
|
|
|
Class I |
|
|
113 |
|
|
|
510 |
|
|
|
932 |
|
|
|
2,108 |
|
|
You would pay the following expenses if you did not redeem your shares:
|
|
|
One Year |
|
Three Years |
|
Five Years |
|
Ten Years |
|
|
Class A |
|
|
607 |
|
|
|
1,033 |
|
|
|
1,485 |
|
|
|
2,735 |
|
|
|
Class C |
|
|
214 |
|
|
|
813 |
|
|
|
1,438 |
|
|
|
3,123 |
|
|
|
Class I |
|
|
113 |
|
|
|
510 |
|
|
|
932 |
|
|
|
2,108 |
|
|
Portfolio Turnover
The Fund pays transaction costs, such as commissions, when it buys and sells securities (or "turns over" its portfolio). A higher portfolio turnover rate may indicate higher transaction costs and may result in higher taxes when Fund shares are held in a taxable account. These costs, which are not reflected in the annual fund operating expenses or in the example, affect the Fund's performance. During the Fund's most recent fiscal year, the Fund's portfolio turnover rate was 28% of the average value of its portfolio.
Principal Investment Strategies
Under normal market conditions, the Fund invests at least 80% of its net assets (plus borrowing for investment purposes, if any) in dividend-paying equities (including common and preferred stocks and invests in units of Master Limited Partnerships ("MLPs"). Companies in certain economic sectors of the market have historically provided higher dividend yields than companies in other sectors and industries. Given the Fund's focus on dividend-paying securities, the Fund may, from time to time, have a greater exposure to these higher dividend-yield sectors and industries than the broader equity market. The Fund may invest up to 25% of its net assets in foreign equity securities. Foreign securities are securities issued by issuers that are organized under the laws of a foreign country or that have a substantial portion of their operations or assets in a foreign country or countries, or that derive a substantial portion of their revenue or profits from businesses, investments or sales outside of the United States. The Fund may also invest in foreign securities that are represented in the United States securities markets by American Depositary Receipts ("ADRs") or similar depository arrangements. The Fund's foreign debt investments can be denominated in U.S. dollars or in foreign currencies. Debt securities issued by a foreign government may not be supported by the "full faith and credit" of that government. The Fund may invest in options in furtherance of its investment strategy.
The Fund may invest up to 25% of its net assets in MLPs. MLPs are publicly traded partnerships engaged in the transportation, storage, processing, refining, marketing, exploration, production and mining of minerals and natural resources. By confining their operations to these specific activities, their interests or units, are able to trade on public securities exchanges similar to the shares of a corporation, without entity level taxation.
Principal Risks
An investment in the Fund is subject to risks, and you could lose money on your investment in the Fund. There can be no assurance that the Fund will achieve its investment objective. The risks associated with an investment in the Fund can increase during times of significant market volatility. Your investment in the Fund is not a deposit in a bank and is not insured or
CALAMOS FAMILY OF FUNDS
66
Calamos Dividend Growth Fund
guaranteed by the Federal Deposit Insurance Corporation or any other government agency. The principal risks are presented in alphabetical order to facilitate finding particular risks and comparing them with other funds. Each risk summarized below is considered a "principal risk" of investing in the Fund, regardless of the order in which it appears. The principal risks of investing in the Fund include:
• Equity Securities Risk — The securities markets are volatile, and the market prices of the Fund's securities may decline generally. The price of equity securities fluctuates based on changes in a company's financial condition and overall market and economic conditions. If the market prices of the securities owned by the Fund fall, the value of your investment in the Fund will decline.
• Foreign Securities Risk — Risks associated with investing in foreign securities include fluctuations in the exchange rates of foreign currencies that may affect the U.S. dollar value of a security, the possibility of substantial price volatility as a result of political and economic instability in the foreign country, less public information about issuers of securities, different securities regulation, different accounting, auditing and financial reporting standards and less liquidity than in U.S. markets.
• Futures and Forward Contracts Risk — Futures contracts provide for the future sale by one party and purchase by another of a specific asset at a specific time and price (with or without delivery required). Futures contracts are standardized contracts traded on a recognized exchange. An option on a futures contract gives the purchaser the right, in exchange for a premium, to assume a position in a futures contract at a specified exercise price during the term of the option. Futures and forward contracts are subject to counterparty risk, meaning that the party with whom the Fund enters into the derivatives transaction (the clearinghouse or the broker holding the Fund's position for a futures contract or the counterparty for a forward contract) may experience a significant credit event and/or may be unwilling or unable to make timely settlement payments or otherwise honor its obligations.
• Liquidity Risk — Liquidity risk exists when particular investments are difficult to purchase or sell. The Fund's investments in illiquid securities may reduce the returns of the Fund because it may be unable to sell the illiquid securities at an advantageous time or price.
• MLP Risk — Investments in securities of MLPs involve risk that differ from investments in common stock, including risks related to limited control and limited rights to vote on matters affecting the MLP, risks related to the potential conflicts of interest between the MLP and the MLP's general partners, cash flow risks, dilution risks and risks related to the general partners right to require unit holders to sell their common units at an undesirable time or price.
• MLP Tax Risk — MLPs generally do not pay federal income tax at the partnership level. Rather, each partner is allocated a share of the partnerships' income, gains, losses, deductions and credits. A change in current tax law, or a change in the underlying business of an MLP, could result in an MLP being treated as a corporation, instead of a partnership, for federal income tax purposes, which would result in such MLP being required to pay income tax on its taxable income. This would have the effect of reducing the amount of cash available for distribution by the MLP, potentially reducing the value of the Fund's investment and consequently your investment in the Fund.
• MLP Liquidity Risk — Although common units of MLPs trade on the NYSE, the NASDAQ and Amex, certain MLP securities trade less frequently than those of larger companies due to their smaller capitalization. As a result, the price of such MLPs may display abrupt and erratic movements at times. Additionally it may be more difficult for the Fund to buy and sell significant amounts of such securities without unfavorable impact on prevailing market process. As a result, these securities may be difficult to dispose of at a fair price when the Adviser desires to do so. This may adversely affect the Fund's ability to take advantage of other market opportunities or make dividend distributions.
• Equity Securities of MLPs Risk — MLP common units, like other equity securities, can be affected by macro-economic and other factors affecting the stock market in general, expectations of interest rates, investor sentiment towards an issuer or certain market sector, changes in a particular issuer's financial condition, or unfavorable or unanticipated poor performance of a particular issuer (in the case of MLPs, generally measured in terms of distributable cash flow). Prices of common units of individual MLPs, like the prices of other equity securities, also can be affected by fundamentals unique to the partnership or company, including earnings power and coverage ratios.
PROSPECTUS | March 1, 2024
67
Calamos Dividend Growth Fund
• Options Risk — The Fund's ability to close out its position as a purchaser or seller of an over-the-counter or exchange-listed put or call option is dependent, in part, upon the liquidity of the options market. There are significant differences between the securities and options markets that could result in an imperfect correlation among these markets, causing a given transaction not to achieve its objectives. The Fund's ability to utilize options successfully will depend on the ability of the Fund's investment adviser to predict pertinent market movements, which cannot be assured.
• Portfolio Selection Risk — The value of your investment may decrease if the investment adviser's judgment about the attractiveness, value or market trends affecting a particular security, issuer, industry or sector or about market movements is incorrect.
• RIC Qualification Risk — To qualify for treatment as a regulated investment company ("RIC") under the Internal Revenue Code of 1986, as amended (the "Code"), the Fund must meet certain income source, asset diversification and annual distribution requirements. The Fund's MLP investments may make it more difficult for the Fund to meet these requirements. The asset diversification requirements include a requirement that, at the end of each quarter of each taxable year, not more than 25% of the value of the Fund's total assets is invested in the securities (including debt securities) of one or more qualified publicly traded partnerships. The Fund anticipates that the MLPs in which it invests will be qualified publicly traded partnerships. If the Fund's MLP investments exceed this 25% limitation, due to other portfolio activity, the Fund would not satisfy the diversification requirements and could fail to qualify as a RIC. If, in any year, the Fund fails to qualify as a RIC for any reason, the Fund would be taxed as an ordinary corporation and would become (or remain) subject to corporate income tax. The resulting corporate taxes could substantially reduce the Fund's net assets, the amount of income available for distribution and the amount of Fund distributions.
• Rule 144A Securities Risk — The Fund may invest in securities that are issued and sold through transactions under Rule 144A of the Securities Act of 1933. Under the supervision of its board of trustees, the Fund will determine whether Rule 144A Securities are illiquid. If qualified institutional buyers are unwilling to purchase these Rule 144A Securities, the percentage of the Fund's assets invested in illiquid securities would increase. Typically, the Fund purchases Rule 144A Securities only if the Fund's adviser has determined them to be liquid. If any Rule 144A Security held by the Fund should become illiquid, the value of the security may be reduced and a sale of the security may be more difficult.
• Securities Lending Risk — The Fund may lend its portfolio securities to broker-dealers and banks in order to generate additional income for the Fund. Any such loan must be continuously secured by collateral in cash or cash equivalents maintained on a current basis in an amount at least equal to the market value of the securities loaned by the Fund. In the event of bankruptcy or other default of a borrower of portfolio securities, the Fund could experience both delays in liquidating the loan collateral or recovering the loaned securities and losses, including (a) possible decline in the value of the collateral or in the value of the securities loaned during the period while the Fund seeks to enforce its rights thereto, (b) possible subnormal levels of income and lack of access to income during this period, and (c) expenses of enforcing its rights. In an effort to reduce these risks, the Fund's securities lending agent monitors, and reports to Calamos Advisors on, the creditworthiness of the firms to which a Fund lends securities. The Fund may also experience losses as a result of a diminution in value of its cash collateral investments.
• Tax Risk — The federal income tax treatment of convertible securities or other securities in which the Fund may invest may not be clear or may be subject to recharacterization by the Internal Revenue Service. It could be more difficult to comply with the tax requirements applicable to RICs if the tax characterization of investments or the tax treatment of the income from such investments were successfully challenged by the Internal Revenue Service. Any such failure to comply with the rules applicable to RICs could cause the Fund to fail to qualify as such.
Fund Performance
The following bar chart and table indicate the risks of investing in the Fund by showing changes in the Fund's performance from calendar year to calendar year and how the Fund's average annual total returns compare with those of a broad measure of market performance. All returns include the reinvestment of dividends and distributions. As always, please note that the Fund's past performance (before and after taxes) cannot predict how it will perform in the future. Updated performance information is available at no cost by visiting www.calamos.com or by calling 800.582.6959.
CALAMOS FAMILY OF FUNDS
68
Calamos Dividend Growth Fund
CLASS I* ANNUAL TOTAL RETURN FOR YEARS ENDED 12.31
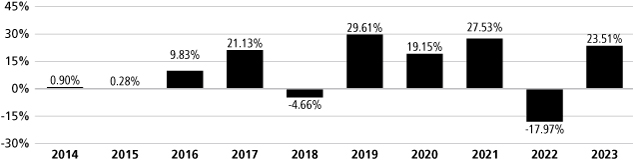
|
Highest Quarterly Return: |
|
|
20.97 |
% (6.30.2020) |
|
Lowest Quarterly Return: |
|
|
-19.72 |
% (3.31.2020) |
|
* Annual returns for Class I are provided because Class I shares represent the largest percentage of assets in the Calamos Family of Funds.
Average Annual Total Returns as of 12.31.23
The following table shows how the Fund's average annual performance (before and after taxes) for the one-and five-year periods ended December 31, 2023 and since the Fund's inception compared with broad measures of market performance. "Since Inception" returns shown for the index are returns since the inception of the Fund's Class A shares, or since the nearest subsequent month end when comparative index data is available only for full monthly periods. The after-tax returns show the impact of assumed federal income taxes on an investment in the Fund. "Return After Taxes on Distributions" shows the effect of taxable distributions, but assumes that you still hold the Fund shares at the end of the period and so do not have any taxable gain or loss on your investment. "Return After Taxes on Distributions and Sale of Fund Shares" shows the effect of taxable distributions and any taxable gain or loss that would be realized if the Fund shares were purchased at the beginning and sold at the end of the specified period.
The after-tax returns are shown only for Class I shares, and are calculated using the historical highest individual federal marginal income tax rates and do not reflect the impact of state and local taxes. Actual after-tax returns depend on an investor's tax situation and may differ from those shown, and the after-tax returns shown are not relevant to investors who hold their Fund shares through tax-advantaged arrangements, such as 401(k) plans or individual retirement accounts. After-tax returns for classes other than Class I will vary from returns shown for Class I. "Return After Taxes on Distributions and Sale of Fund Shares" may be higher than other returns for the same period due to a tax benefit of realizing a capital loss upon the sale of Fund shares.
AVERAGE ANNUAL TOTAL RETURNS — FOR THE PERIODS ENDED 12.31.23
|
|
|
INCEPTION
DATE OF CLASS |
|
ONE YEAR |
|
FIVE YEAR |
|
TEN YEAR |
|
SINCE
INCEPTION |
|
|
Class A |
|
|
8.5.13 |
|
|
|
|
|
|
|
|
|
|
|
Load Adjusted Return before taxes |
|
|
|
|
17.44 |
% |
|
|
13.43 |
% |
|
|
9.05 |
% |
|
|
9.46 |
% |
|
|
Class C |
|
|
8.5.13 |
|
|
|
|
|
|
|
|
|
|
|
Load Adjusted Return before taxes |
|
|
|
|
21.31 |
% |
|
|
13.68 |
% |
|
|
8.77 |
% |
|
|
9.15 |
% |
|
|
Class I |
|
|
8.5.13 |
|
|
|
|
|
|
|
|
|
|
|
Return before taxes |
|
|
|
|
23.51 |
% |
|
|
14.82 |
% |
|
|
9.86 |
% |
|
|
10.25 |
% |
|
|
Return after taxes on distributions* |
|
|
|
|
22.21 |
% |
|
|
13.06 |
% |
|
|
8.45 |
% |
|
|
8.86 |
% |
|
Return after taxes on distributions and sale of
Fund shares* |
|
|
|
|
14.73 |
% |
|
|
11.64 |
% |
|
|
7.73 |
% |
|
|
8.09 |
% |
|
|
S&P 500 Index |
|
|
|
|
26.29 |
% |
|
|
15.69 |
% |
|
|
12.03 |
% |
|
|
12.62 |
% |
|
*
PROSPECTUS | March 1, 2024
69
Calamos Dividend Growth Fund
Investment Adviser
Calamos Advisors LLC
PORTFOLIO MANAGER/
FUND TITLE (IF APPLICABLE) |
|
PORTFOLIO MANAGER
EXPERIENCE IN THE FUND |
|
PRIMARY TITLE
WITH INVESTMENT ADVISER |
|
|
John P. Calamos, Sr. (President, Chairman) |
|
since Fund's inception |
|
Founder, Chairman, and Global CIO |
|
|
John Hillenbrand |
|
9 years |
|
SVP, Sr. Co-Portfolio Manager |
|
|
Jon Vacko |
|
9 years |
|
SVP, Sr. Co-Portfolio Manager |
|
|
Dino Dussias |
|
since February 2023 |
|
SVP, Associate Portfolio Manager |
|
Other Important Information Regarding Fund Shares
For important information about purchase and sale of Fund shares, tax information, and financial intermediary compensation, please turn to "Other Important Information Regarding Fund Shares" on Page 125 of the prospectus.
CALAMOS FAMILY OF FUNDS
70
Investment Objective
Calamos Select Fund's investment objective is long-term capital growth.
Fees and Expenses of the Fund
The following table describes the fees and expenses that you may pay if you buy, hold and sell shares of the Fund. Investors may pay other fees, such as brokerage commissions and/or other forms of compensation to a financial intermediary, which are not reflected in the tables or the examples below. You may qualify for sales charge discounts on purchases of Class A shares if you and your family invest, or agree to invest in the future, at least $50,000 in Calamos Funds. More information about these and other discounts is available from your financial professional and under "Fund Facts — What classes of shares do the Funds offer?" on Page 149 of the Fund's prospectus, in the Appendix to this prospectus and "Share Classes and Pricing of Shares" on Page 67 of the Fund's statement of additional information.
Shareholder Fees (fees paid directly from your investment):
|
|
|
CLASS A |
|
CLASS C |
|
CLASS I |
|
|
Maximum Sales Charge (Load) Imposed on Purchases (as a percentage of offering price) |
|
|
4.75 |
% |
|
|
None |
|
|
|
None |
|
|
Maximum Deferred Sales Charge (Load) (as a percentage of the lesser of the redemption price or
offering price) |
|
|
None |
|
|
|
1.00 |
% |
|
|
None |
|
|
Annual Fund Operating Expenses (expenses that you pay each year as a percentage of the value of your investment):
|
|
|
CLASS A |
|
CLASS C |
|
CLASS I |
|
|
Management Fees |
|
|
1.00 |
% |
|
|
1.00 |
% |
|
|
1.00 |
% |
|
|
Distribution and/or Service Fees (12b-1) |
|
|
0.25 |
% |
|
|
1.00 |
% |
|
|
None |
|
|
|
Other Expenses |
|
|
0.37 |
% |
|
|
0.37 |
% |
|
|
0.37 |
% |
|
|
Total Annual Fund Operating Expenses |
|
|
1.62 |
% |
|
|
2.37 |
% |
|
|
1.37 |
% |
|
|
Expense Reimbursement1 |
|
|
(0.47 |
)% |
|
|
(0.47 |
)% |
|
|
(0.47 |
)% |
|
|
Total Annual Fund Operating Expenses After Reimbursement |
|
|
1.15 |
% |
|
|
1.90 |
% |
|
|
0.90 |
% |
|
1
Example
This example is intended to help you compare the cost of investing in the Fund with the cost of investing in other mutual funds. The example assumes that you invest $10,000 in the Fund for the time periods indicated and then either redeem or do not redeem your shares at the end of the reflected time periods. The example also assumes that your investment has a 5% return each year, that all dividends and capital gain distributions are reinvested, that you pay a maximum initial or contingent deferred sales charge and that the Fund's operating expenses remain the same. Any applicable fee waivers and/or expense reimbursements are reflected in the below examples for the period through March 1, 2025 only. Although your actual performance and costs may be higher or lower, based on these assumptions, your costs would be:
You would pay the following expenses if you redeemed your shares at the end of the period:
|
|
|
One Year |
|
Three Years |
|
Five Years |
|
Ten Years |
|
|
Class A |
|
|
587 |
|
|
|
918 |
|
|
|
1,272 |
|
|
|
2,268 |
|
|
|
Class C |
|
|
293 |
|
|
|
694 |
|
|
|
1,223 |
|
|
|
2,670 |
|
|
|
Class I |
|
|
92 |
|
|
|
387 |
|
|
|
705 |
|
|
|
1,605 |
|
|
PROSPECTUS | March 1, 2024
71
You would pay the following expenses if you did not redeem your shares:
|
|
|
One Year |
|
Three Years |
|
Five Years |
|
Ten Years |
|
|
Class A |
|
|
587 |
|
|
|
918 |
|
|
|
1,272 |
|
|
|
2,268 |
|
|
|
Class C |
|
|
193 |
|
|
|
694 |
|
|
|
1,223 |
|
|
|
2,670 |
|
|
|
Class I |
|
|
92 |
|
|
|
387 |
|
|
|
705 |
|
|
|
1,605 |
|
|
Portfolio Turnover
The Fund pays transaction costs, such as commissions, when it buys and sells securities (or "turns over" its portfolio). A higher portfolio turnover rate may indicate higher transaction costs and may result in higher taxes when Fund shares are held in a taxable account. These costs, which are not reflected in the annual fund operating expenses or in the example, affect the Fund's performance. During the most recent fiscal year, the Fund's portfolio turnover rate was 55% of the average value of its portfolio.
Principal Investment Strategies
The Fund anticipates that it will invest primarily in equity securities issued by U.S. companies. The Fund's portfolio may include securities of well-established companies with large market capitalizations as well as small, unseasoned companies. The Fund's investment adviser generally defines a large cap company to have a market capitalization in excess of $25 billion and a mid- sized company to have a market capitalization greater than $1 billion, up to $25 billion. Generally, a small cap company is defined by the investment adviser as having a market capitalization of up to $1 billion. The market capitalization of a security is measured at the time of purchase. The Fund may invest up to 25% of its net assets in foreign securities. Foreign securities are securities issued by issuers that are organized under the laws of a foreign country or that have a substantial portion of their operations or assets in a foreign country or countries, or that derive a substantial portion of their revenue or profits from businesses, investments or sales outside of the United States. The Fund may also invest in foreign securities that are represented in the United States securities markets by American Depositary Receipts ("ADRs") or similar depository arrangements. The Fund's foreign debt investments can be denominated in U.S. dollars or in foreign currencies. Debt securities issued by a foreign government may not be supported by the "full faith and credit" of that government.
In pursuing its investment objective, the Fund seeks out stocks that, in the investment adviser's opinion, are undervalued according to certain financial measurements of their intrinsic value (such as the present value of the company's future free cash flow). The Fund's investment adviser typically considers the company's financial soundness, earnings and cash flow forecast and quality of management. The Fund's investment adviser seeks to lower the risks of investing in stocks by using a "top-down approach" of diversification by company, industry, sector, country and currency and focusing on macro-level investment themes.
Principal Risks
An investment in the Fund is subject to risks, and you could lose money on your investment in the Fund. There can be no assurance that the Fund will achieve its investment objective. The risks associated with an investment in the Fund can increase during times of significant market volatility. Your investment in the Fund is not a deposit in a bank and is not insured or guaranteed by the Federal Deposit Insurance Corporation or any other government agency. The principal risks are presented in alphabetical order to facilitate finding particular risks and comparing them with other funds. Each risk summarized below is considered a "principal risk" of investing in the Fund, regardless of the order in which it appears. The principal risks of investing in the Fund include:
• American Depositary Receipts Risk — The stocks of most foreign companies that trade in the U.S. markets are traded as American Depositary Receipts (ADRs). U.S. depositary banks issue these stocks. Each ADR represents one or more shares of foreign stock or a fraction of a share. The price of an ADR corresponds to the price of the foreign stock in its home market, adjusted to the ratio of the ADRs to foreign company shares. Therefore while purchasing a security on a U.S. exchange, the risks inherently associated with foreign investing still apply to ADRs.
CALAMOS FAMILY OF FUNDS
72
• Equity Securities Risk — The securities markets are volatile, and the market prices of the Fund's securities may decline generally. The price of equity securities fluctuates based on changes in a company's financial condition and overall market and economic conditions. If the market prices of the securities owned by the Fund fall, the value of your investment in the Fund will decline.
• Foreign Securities Risk — Risks associated with investing in foreign securities include fluctuations in the exchange rates of foreign currencies that may affect the U.S. dollar value of a security, the possibility of substantial price volatility as a result of political and economic instability in the foreign country, less public information about issuers of securities, different securities regulation, different accounting, auditing and financial reporting standards and less liquidity than in U.S. markets.
• Options Risk — The Fund's ability to close out its position as a purchaser or seller of an over-the-counter or exchange- listed put or call option is dependent, in part, upon the liquidity of the options market. There are significant differences between the securities and options markets that could result in an imperfect correlation among these markets, causing a given transaction not to achieve its objectives. The Fund's ability to utilize options successfully will depend on the ability of the Fund's investment adviser to predict pertinent market movements, which cannot be assured.
• Portfolio Selection Risk — The value of your investment may decrease if the investment adviser's judgment about the attractiveness, value or market trends affecting a particular security, issuer, industry or sector or about market movements is incorrect.
• Sector Risk — To the extent the Fund invests a significant portion of its assets in a particular sector, a greater portion of the Fund's performance may be affected by the general business and economic conditions affecting that sector. Each sector may share economic risk with the broader market, however there may be economic risks specific to each sector. As a result, returns from those sectors may trail returns from the overall stock market and it is possible that the Fund may underperform the broader market, or experience greater volatility.
• Securities Lending Risk — The Fund may lend its portfolio securities to broker-dealers and banks in order to generate additional income for the Fund. Any such loan must be continuously secured by collateral in cash or cash equivalents maintained on a current basis in an amount at least equal to the market value of the securities loaned by the Fund. In the event of bankruptcy or other default of a borrower of portfolio securities, the Fund could experience both delays in liquidating the loan collateral or recovering the loaned securities and losses, including (a) possible decline in the value of the collateral or in the value of the securities loaned during the period while the Fund seeks to enforce its rights thereto, (b) possible subnormal levels of income and lack of access to income during this period, and (c) expenses of enforcing its rights. In an effort to reduce these risks, the Fund's securities lending agent monitors, and reports to Calamos Advisors on, the creditworthiness of the firms to which a Fund lends securities. The Fund may also experience losses as a result of a diminution in value of its cash collateral investments.
• Small and Mid-Sized Company Risk — Small and mid-sized company stocks have historically been subject to greater investment risk than large company stocks. The prices of small and mid-sized company stocks tend to be more volatile than prices of large company stocks.
• Value Stock Risk — Value stocks involve the risk that they may never reach what the Fund's investment adviser believes is their full market value. Additionally, because different types of stocks tend to shift in and out of favor depending on market conditions, a value fund's performance may sometimes be higher or lower than that of other types of funds (such as those emphasizing growth stocks).
Fund Performance
The following bar chart and table indicate the risks of investing in the Fund by showing changes in the Fund's performance from calendar year to calendar year and how the Fund's average annual total returns compare with those of a broad measure of market performance. All returns include the reinvestment of dividends and distributions. As always, please note that the Fund's past performance (before and after taxes) cannot predict how it will perform in the future. Updated performance information is available at no cost by visiting www.calamos.com or by calling 800.582.6959.
PROSPECTUS | March 1, 2024
73
CLASS I* ANNUAL TOTAL RETURN FOR YEARS ENDED 12.31
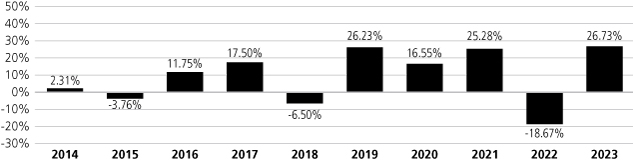
|
Highest Quarterly Return: |
|
|
22.60 |
% (6.30.2020) |
|
Lowest Quarterly Return: |
|
|
-22.99 |
% (3.31.2020) |
|
* Annual returns for Class I are provided because Class I shares represent the largest percentage of assets in the Calamos Family of Funds.
Average Annual Total Returns as of 12.31.23
The following table shows how the Fund's average annual performance (before and after taxes) for the one-, five- and ten-year periods ended December 31, 2023 and since the Fund's inception compared with broad measures of market performance. "Since Inception" returns shown for each index are returns since the inception of the Fund's Class A shares, or since the nearest subsequent month end when comparative index data is available only for full monthly periods. The after-tax returns show the impact of assumed federal income taxes on an investment in the Fund. "Return After Taxes on Distributions" shows the effect of taxable distributions, but assumes that you still hold the Fund shares at the end of the period and so do not have any taxable gain or loss on your investment. "Return After Taxes on Distributions and Sale of Fund Shares" shows the effect of taxable distributions and any taxable gain or loss that would be realized if the Fund shares were purchased at the beginning and sold at the end of the specified period.
The after-tax returns are shown only for Class I shares, and are calculated using the historical highest individual federal marginal income tax rates and do not reflect the impact of state and local taxes. Actual after-tax returns depend on an investor's tax situation and may differ from those shown, and the after-tax returns shown are not relevant to investors who hold their Fund shares through tax-advantaged arrangements, such as 401(k) plans or individual retirement accounts. After-tax returns for classes other than Class I will vary from returns shown for Class I. "Return After Taxes on Distributions and Sale of Fund Shares" may be higher than other returns for the same period due to a tax benefit of realizing a capital loss on the sale of Fund shares.
AVERAGE ANNUAL TOTAL RETURNS — FOR THE PERIODS ENDED 12.31.23
|
|
|
INCEPTION
DATE OF CLASS |
|
ONE YEAR |
|
FIVE YEAR |
|
TEN YEAR |
|
SINCE
INCEPTION |
|
|
Class A |
|
|
1.2.02 |
|
|
|
|
|
|
|
|
|
|
|
Load Adjusted Return before taxes |
|
|
|
|
20.39 |
% |
|
|
12.31 |
% |
|
|
7.87 |
% |
|
|
6.60 |
% |
|
|
Class C |
|
|
1.2.02 |
|
|
|
|
|
|
|
|
|
|
|
Load Adjusted Return before taxes |
|
|
|
|
24.40 |
% |
|
|
12.58 |
% |
|
|
7.59 |
% |
|
|
6.04 |
% |
|
|
Class I |
|
|
3.1.02 |
|
|
|
|
|
|
|
|
|
|
|
Return before taxes |
|
|
|
|
26.73 |
% |
|
|
13.69 |
% |
|
|
8.67 |
% |
|
|
7.24 |
% |
|
|
Return after taxes on distributions* |
|
|
|
|
25.56 |
% |
|
|
12.57 |
% |
|
|
7.12 |
% |
|
|
6.25 |
% |
|
Return after taxes on distributions and sale of
Fund shares* |
|
|
|
|
16.65 |
% |
|
|
10.81 |
% |
|
|
6.54 |
% |
|
|
5.80 |
% |
|
|
S&P 500 Index |
|
|
|
|
26.29 |
% |
|
|
15.69 |
% |
|
|
12.03 |
% |
|
|
9.03 |
% |
|
*
CALAMOS FAMILY OF FUNDS
74
Investment Adviser
Calamos Advisors LLC
PORTFOLIO MANAGER/
FUND TITLE (IF APPLICABLE) |
|
PORTFOLIO MANAGER
EXPERIENCE IN THE FUND |
|
PRIMARY TITLE
WITH INVESTMENT ADVISER |
|
|
John P. Calamos, Sr. (President, Chairman) |
|
since Fund's inception |
|
Founder, Chairman, and Global CIO |
|
|
R. Matthew Freund |
|
4 years |
|
SVP, Sr. Co-Portfolio Manager |
|
|
Michael Kassab |
|
4 years |
|
SVP, Associate Portfolio Manager |
|
Other Important Information Regarding Fund Shares
For important information about purchase and sale of Fund shares, tax information, and financial intermediary compensation, please turn to "Other Important Information Regarding Fund Shares" on Page 125 of the prospectus.
PROSPECTUS | March 1, 2024
75
Calamos International Growth Fund
Investment Objective
Calamos International Growth Fund's investment objective is long-term capital growth.
Fees and Expenses of the Fund
The following table describes the fees and expenses that you may pay if you buy, hold and sell shares of the Fund. Investors may pay other fees, such as brokerage commissions and/or other forms of compensation to a financial intermediary, which are not reflected in the tables or the examples below. You may qualify for sales charge discounts on purchases of Class A shares if you and your family invest, or agree to invest in the future, at least $50,000 in Calamos Funds. More information about these and other discounts is available from your financial professional and under "Fund Facts — What classes of shares do the Funds offer?" on Page 149 of the Fund's prospectus, in the Appendix to this prospectus and "Share Classes and Pricing of Shares" on Page 67 of the Fund's statement of additional information.
Shareholder Fees (fees paid directly from your investment):
|
|
|
CLASS A |
|
CLASS C |
|
CLASS I |
|
CLASS R6 |
|
Maximum Sales Charge (Load) Imposed on Purchases (as a percentage of
offering price) |
|
|
4.75 |
% |
|
|
None |
|
|
|
None |
|
|
|
None |
|
|
Maximum Deferred Sales Charge (Load) (as a percentage of the lesser of the
redemption price or offering price) |
|
|
None |
|
|
|
1.00 |
% |
|
|
None |
|
|
|
None |
|
|
Annual Fund Operating Expenses (expenses that you pay each year as a percentage of the value of your investment):
|
|
|
CLASS A |
|
CLASS C |
|
CLASS I |
|
CLASS R6 |
|
|
Management Fees (subject to performance adjustment) |
|
|
0.97 |
% |
|
|
0.97 |
% |
|
|
0.97 |
% |
|
|
0.97 |
% |
|
|
Distribution and/or Service Fees (12b-1) |
|
|
0.25 |
% |
|
|
1.00 |
% |
|
|
None |
|
|
|
None |
|
|
|
Other Expenses |
|
|
0.27 |
% |
|
|
0.27 |
% |
|
|
0.27 |
% |
|
|
0.16 |
% |
|
|
Total Annual Fund Operating Expenses |
|
|
1.49 |
% |
|
|
2.24 |
% |
|
|
1.24 |
% |
|
|
1.13 |
% |
|
|
Expense Reimbursement1 |
|
|
(0.29 |
)% |
|
|
(0.29 |
)% |
|
|
(0.29 |
)% |
|
|
(0.29 |
)% |
|
|
Total Annual Fund Operating Expenses After Reimbursement |
|
|
1.20 |
% |
|
|
1.95 |
% |
|
|
0.95 |
% |
|
|
0.84 |
% |
|
1
Example
This example is intended to help you compare the cost of investing in the Fund with the cost of investing in other mutual funds. The example assumes that you invest $10,000 in the Fund for the time periods indicated and then either redeem or do not redeem your shares at the end of the reflected time periods. The example also assumes that your investment has a 5% return each year, that all dividends and capital gain distributions are reinvested, that you pay a maximum initial or contingent deferred sales charge and that the Fund's operating expenses remain the same. Any applicable fee waivers and/or expense
CALAMOS FAMILY OF FUNDS
76
Calamos International Growth Fund
reimbursements are reflected in the below examples for the period through March 1, 2025 only. Although your actual performance and costs may be higher or lower, based on these assumptions, your costs would be:
You would pay the following expenses if you redeemed your shares at the end of the period:
|
|
|
One Year |
|
Three Years |
|
Five Years |
|
Ten Years |
|
|
Class A |
|
|
591 |
|
|
|
896 |
|
|
|
1,223 |
|
|
|
2,146 |
|
|
|
Class C |
|
|
298 |
|
|
|
672 |
|
|
|
1,173 |
|
|
|
2,552 |
|
|
|
Class I |
|
|
97 |
|
|
|
365 |
|
|
|
653 |
|
|
|
1,474 |
|
|
|
Class R6 |
|
|
86 |
|
|
|
330 |
|
|
|
594 |
|
|
|
1,349 |
|
|
You would pay the following expenses if you did not redeem your shares:
|
|
|
One Year |
|
Three Years |
|
Five Years |
|
Ten Years |
|
|
Class A |
|
|
591 |
|
|
|
896 |
|
|
|
1,223 |
|
|
|
2,146 |
|
|
|
Class C |
|
|
198 |
|
|
|
672 |
|
|
|
1,173 |
|
|
|
2,552 |
|
|
|
Class I |
|
|
97 |
|
|
|
365 |
|
|
|
653 |
|
|
|
1,474 |
|
|
|
Class R6 |
|
|
86 |
|
|
|
330 |
|
|
|
594 |
|
|
|
1,349 |
|
|
Portfolio Turnover
The Fund pays transaction costs, such as commissions, when it buys and sells securities (or "turns over" its portfolio). A higher portfolio turnover rate may indicate higher transaction costs and may result in higher taxes when Fund shares are held in a taxable account. These costs, which are not reflected in the annual fund operating expenses or in the example, affect the Fund's performance. During the most recent fiscal year, the Fund's portfolio turnover rate was 131% of the average value of its portfolio.
Principal Investment Strategies
The Fund anticipates that under normal circumstances its investment adviser's investment process will result in the Fund investing in an internationally diversified manner, with at least 40% of its assets in securities of foreign issuers. Securities of foreign issuers are securities issues by issuers that are organized under the laws of a foreign country or that have a substantial portion of their operations or assets in a foreign country or countries, or that derive a substantial portion of their revenue or profits from businesses, investments or sales outside of the United States. The Fund may also invest in foreign securities that are represented in the United States securities markets by American Depositary Receipts ("ADRs") or similar depository arrangements. The Fund's foreign debt investments can be denominated in U.S. dollars or in foreign currencies. Debt securities issued by a foreign government may not be supported by the "full faith and credit" of that government. Although not a principal investment strategy, the Fund may invest in securities of issuers in emerging markets to a significant extent.
The Fund's portfolio may include securities of well-established companies with large market capitalizations as well as small, unseasoned companies. The Fund's investment adviser generally defines a large cap company to have a market capitalization in excess of $25 billion and a mid-sized company to have a market capitalization greater than $1 billion, up to $25 billion.
Generally, a small cap company is defined by the investment adviser as having a market capitalization of up to $1 billion. The market capitalization of a security is measured at the time of purchase.
In pursuing its investment objective, the Fund seeks out securities that, in the investment adviser's opinion, offer some of the best opportunities for growth. The Fund's investment adviser typically considers the company's financial soundness, earnings and cash flow forecast and quality of management. The investment adviser takes environmental, social and governance ("ESG") factors into account in making investment decisions. The Fund's investment adviser seeks to lower the risks of investing in stocks by using a "top-down approach" of diversification by company, industry, sector, country, and currency and focusing on macro-level investment themes.
PROSPECTUS | March 1, 2024
77
Calamos International Growth Fund
Principal Risks
An investment in the Fund is subject to risks, and you could lose money on your investment in the Fund. There can be no assurance that the Fund will achieve its investment objective. The risks associated with an investment in the Fund can increase during times of significant market volatility. Your investment in the Fund is not a deposit in a bank and is not insured or guaranteed by the Federal Deposit Insurance Corporation or any other government agency. The principal risks are presented in alphabetical order to facilitate finding particular risks and comparing them with other funds. Each risk summarized below is considered a "principal risk" of investing in the Fund, regardless of the order in which it appears. The principal risks of investing in the Fund include:
• American Depositary Receipts Risk — The stocks of most foreign companies that trade in the U.S. markets are traded as American Depositary Receipts (ADRs). U.S. depositary banks issue these stocks. Each ADR represents one or more shares of foreign stock or a fraction of a share. The price of an ADR corresponds to the price of the foreign stock in its home market, adjusted to the ratio of the ADRs to foreign company shares. Therefore while purchasing a security on a U.S. exchange, the risks inherently associated with foreign investing still apply to ADRs.
• Emerging Markets Risk — Emerging market countries may have relatively unstable governments and economies based on only a few industries, which may cause greater instability. The value of emerging market securities will likely be particularly sensitive to changes in the economies of such countries. These countries are also more likely to experience higher levels of inflation, deflation or currency devaluations, which could hurt their economies and securities markets.
• Equity Securities Risk — The securities markets are volatile, and the market prices of the Fund's securities may decline generally. The price of equity securities fluctuates based on changes in a company's financial condition and overall market and economic conditions. If the market prices of the securities owned by the Fund fall, the value of your investment in the Fund will decline.
• Foreign Securities Risk — Risks associated with investing in foreign securities include fluctuations in the exchange rates of foreign currencies that may affect the U.S. dollar value of a security, the possibility of substantial price volatility as a result of political and economic instability in the foreign country, less public information about issuers of securities, different securities regulation, different accounting, auditing and financial reporting standards and less liquidity than in U.S. markets.
• Forward Foreign Currency Contract Risk — Forward foreign currency contracts are contractual agreements to purchase or sell a specified currency at a specified future date (or within a specified time period) at a price set at the time of the contract. The Fund may not fully benefit from, or may lose money on, forward foreign currency transactions if changes in currency exchange rates do not occur as anticipated or do not correspond accurately to changes in the value of the Fund's holdings.
• Growth Stock Risk — Growth securities typically trade at higher multiples of current earnings than other securities and, therefore, may be more sensitive to changes in current or expected earnings than other equity securities and may be more volatile.
• Portfolio Selection Risk — The value of your investment may decrease if the investment adviser's judgment about the attractiveness, value or market trends affecting a particular security, issuer, industry or sector or about market movements is incorrect.
• Portfolio Turnover Risk — The portfolio managers may actively and frequently trade securities or other instruments in the Fund's portfolio to carry out its investment strategies. A high portfolio turnover rate increases transaction costs, which may increase the Fund's expenses. Frequent and active trading may also cause adverse tax consequences for investors in the Fund due to an increase in short-term capital gains.
• Securities Lending Risk — The Fund may lend its portfolio securities to broker-dealers and banks in order to generate additional income for the Fund. Any such loan must be continuously secured by collateral in cash or cash equivalents maintained on a current basis in an amount at least equal to the market value of the securities loaned by the Fund. In the event of bankruptcy or other default of a borrower of portfolio securities, the Fund could experience both delays in liquidating the loan collateral or recovering the loaned securities and losses, including (a) possible decline in the value of
CALAMOS FAMILY OF FUNDS
78
Calamos International Growth Fund
the collateral or in the value of the securities loaned during the period while the Fund seeks to enforce its rights thereto, (b) possible subnormal levels of income and lack of access to income during this period, and (c) expenses of enforcing its rights. In an effort to reduce these risks, the Fund's securities lending agent monitors, and reports to Calamos Advisors on, the creditworthiness of the firms to which a Fund lends securities. The Fund may also experience losses as a result of a diminution in value of its cash collateral investments.
• Small and Mid-Sized Company Risk — Small and mid-sized company stocks have historically been subject to greater investment risk than large company stocks. The prices of small and mid-sized company stocks tend to be more volatile than prices of large company stocks.
Fund Performance
The following bar chart and table indicate the risks of investing in the Fund by showing changes in the Fund's performance from calendar year to calendar year and how the Fund's average annual total returns compare with those of a broad measure of market performance. All returns include the reinvestment of dividends and distributions. As always, please note that the Fund's past performance (before and after taxes) cannot predict how it will perform in the future. Updated performance information is available at no cost by visiting www.calamos.com or by calling 800.582.6959.
CLASS I* ANNUAL TOTAL RETURN FOR YEARS ENDED 12.31
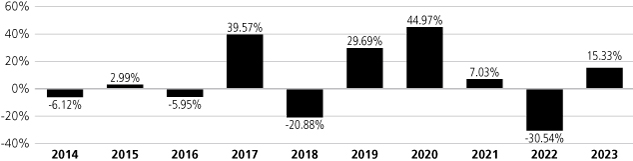
|
Highest Quarterly Return: |
|
|
29.32 |
% (6.30.2020) |
|
Lowest Quarterly Return: |
|
|
-18.42 |
% (12.31.2018) |
|
* Annual returns for Class I are provided because Class I shares represent the largest percentage of assets in the Calamos Family of Funds.
Average Annual Total Returns as of 12.31.23
The following table shows how the Fund's average annual performance (before and after taxes) for the one-, five- and ten-year periods ended December 31, 2023 and since the Fund's inception compared with broad measures of market performance. "Since Inception" returns shown for each index are returns since the inception of the Fund's Class A shares, or since the nearest subsequent month end when comparative index data is available only for full monthly periods. The after-tax returns show the impact of assumed federal income taxes on an investment in the Fund. "Return After Taxes on Distributions" shows the effect of taxable distributions, but assumes that you still hold the Fund shares at the end of the period and so do not have any taxable gain or loss on your investment. "Return After Taxes on Distributions and Sale of Fund Shares" shows the effect of taxable distributions and any taxable gain or loss that would be realized if the Fund shares were purchased at the beginning and sold at the end of the specified period.
The after-tax returns are shown only for Class I shares, and are calculated using the historical highest individual federal marginal income tax rates and do not reflect the impact of state and local taxes. Actual after-tax returns depend on an investor's tax situation and may differ from those shown, and the after-tax returns shown are not relevant to investors who hold their Fund shares through tax-advantaged arrangements, such as 401(k) plans or individual retirement accounts. After-tax returns for classes other than Class I will vary from returns shown for Class I. "Return After Taxes on Distributions and Sale of Fund Shares" may be higher than other returns for the same period due to a tax benefit of realizing a capital loss on the sale of Fund shares.
PROSPECTUS | March 1, 2024
79
Calamos International Growth Fund
AVERAGE ANNUAL TOTAL RETURNS — FOR THE PERIODS ENDED 12.31.23
|
|
|
INCEPTION
DATE OF CLASS |
|
ONE YEAR |
|
FIVE YEAR |
|
TEN YEAR |
|
SINCE
INCEPTION |
|
|
Class A |
|
|
3.16.05 |
|
|
|
|
|
|
|
|
|
|
|
Load Adjusted Return before taxes |
|
|
|
|
9.57 |
% |
|
|
8.67 |
% |
|
|
4.16 |
% |
|
|
6.34 |
% |
|
|
Class C |
|
|
3.16.05 |
|
|
|
|
|
|
|
|
|
|
|
Load Adjusted Return before taxes |
|
|
|
|
13.13 |
% |
|
|
8.92 |
% |
|
|
3.89 |
% |
|
|
5.82 |
% |
|
|
Class I |
|
|
3.16.05 |
|
|
|
|
|
|
|
|
|
|
|
Return before taxes |
|
|
|
|
15.33 |
% |
|
|
10.02 |
% |
|
|
4.93 |
% |
|
|
6.89 |
% |
|
|
Return after taxes on distributions* |
|
|
|
|
15.19 |
% |
|
|
8.82 |
% |
|
|
3.75 |
% |
|
|
6.23 |
% |
|
Return after taxes on distributions and sale of
Fund shares* |
|
|
|
|
9.07 |
% |
|
|
8.00 |
% |
|
|
3.81 |
% |
|
|
5.79 |
% |
|
|
Class R6 |
|
|
9.17.18 |
|
|
|
|
|
|
|
|
|
|
|
Load Adjusted Return before taxes |
|
|
|
|
15.45 |
% |
|
|
10.12 |
% |
|
|
N/A |
|
|
|
5.84 |
% |
|
|
MSCI EAFE Growth Index |
|
|
|
|
17.97 |
% |
|
|
9.18 |
% |
|
|
5.53 |
% |
|
|
6.05 |
% |
|
|
MSCI ACWI ex-US Index |
|
|
|
|
16.21 |
% |
|
|
7.60 |
% |
|
|
4.32 |
% |
|
|
5.47 |
% |
|
*
The MSCI ACWI ex US Index is designed to measure the equity market performance of companies outside of the United States in developed and emerging markets. The MSCI ACWI ex US Index is provided to show how the Fund's performance compares with the returns of an index of securities similar to those in which the Fund invests.
Investment Adviser
Calamos Advisors LLC
PORTFOLIO MANAGER/
FUND TITLE (IF APPLICABLE) |
|
PORTFOLIO MANAGER
EXPERIENCE IN THE FUND |
|
PRIMARY TITLE
WITH INVESTMENT ADVISER |
|
|
John P. Calamos, Sr. (President, Chairman) |
|
since Fund's inception |
|
Founder, Chairman, and Global CIO |
|
|
Nick Niziolek |
|
11 years |
|
SVP, Sr. Co-Portfolio Manager |
|
|
Dennis Cogan |
|
11 years |
|
SVP, Sr. Co-Portfolio Manager |
|
|
Paul Ryndak |
|
since February 2024 |
|
SVP, Associate Portfolio Manager |
|
|
Kyle Ruge |
|
since February 2024 |
|
VP, Associate Portfolio Manager |
|
Other Important Information Regarding Fund Shares
For important information about purchase and sale of Fund shares, tax information, and financial intermediary compensation, please turn to "Other Important Information Regarding Fund Shares" on Page 125 of the prospectus.
CALAMOS FAMILY OF FUNDS
80
Calamos Evolving World Growth Fund
Investment Objective
Calamos Evolving World Growth Fund's investment objective is long-term capital growth.
Fees and Expenses of the Fund
The following table describes the fees and expenses that you may pay if you buy, hold and sell shares of the Fund. Investors may pay other fees, such as brokerage commissions and/or other forms of compensation to a financial intermediary, which are not reflected in the tables or the examples below. You may qualify for sales charge discounts on purchases of Class A shares if you and your family invest, or agree to invest in the future, at least $50,000 in Calamos Funds. More information about these and other discounts is available from your financial professional and under "Fund Facts — What classes of shares do the Funds offer?" on Page 149 of the Fund's prospectus, in the Appendix to this prospectus and "Share Classes and Pricing of Shares" on Page 67 of the Fund's statement of additional information.
Shareholder Fees (fees paid directly from your investment):
|
|
|
CLASS A |
|
CLASS C |
|
CLASS I |
|
|
Maximum Sales Charge (Load) Imposed on Purchases (as a percentage of offering price) |
|
|
4.75 |
% |
|
|
None |
|
|
|
None |
|
|
Maximum Deferred Sales Charge (Load) (as a percentage of the lesser of the redemption price or
offering price) |
|
|
None |
|
|
|
1.00 |
% |
|
|
None |
|
|
Annual Fund Operating Expenses (expenses that you pay each year as a percentage of the value of your investment):
|
|
|
CLASS A |
|
CLASS C |
|
CLASS I |
|
|
Management Fees |
|
|
1.10 |
% |
|
|
1.10 |
% |
|
|
1.10 |
% |
|
|
Distribution and/or Service Fees (12b-1) |
|
|
0.25 |
% |
|
|
1.00 |
% |
|
|
None |
|
|
|
Other Expenses |
|
|
0.28 |
% |
|
|
0.28 |
% |
|
|
0.28 |
% |
|
|
Total Annual Fund Operating Expenses |
|
|
1.63 |
% |
|
|
2.38 |
% |
|
|
1.38 |
% |
|
|
Expense Reimbursement1 |
|
|
(0.33 |
)% |
|
|
(0.33 |
)% |
|
|
(0.33 |
)% |
|
|
Total Annual Fund Operating Expenses After Reimbursement |
|
|
1.30 |
% |
|
|
2.05 |
% |
|
|
1.05 |
% |
|
1
Example
This example is intended to help you compare the cost of investing in the Fund with the cost of investing in other mutual funds. The example assumes that you invest $10,000 in the Fund for the time periods indicated and then either redeem or do not redeem your shares at the end of the reflected time periods. The example also assumes that your investment has a 5% return each year, that all dividends and capital gain distributions are reinvested, that you pay a maximum initial or contingent deferred sales charge and that the Fund's operating expenses remain the same. Any applicable fee waivers and/or expense reimbursements are reflected in the below examples for the period through March 1, 2025 only. Although your actual performance and costs may be higher or lower, based on these assumptions, your costs would be:
You would pay the following expenses if you redeemed your shares at the end of the period:
|
|
|
One Year |
|
Three Years |
|
Five Years |
|
Ten Years |
|
|
Class A |
|
|
601 |
|
|
|
934 |
|
|
|
1,290 |
|
|
|
2,290 |
|
|
|
Class C |
|
|
308 |
|
|
|
711 |
|
|
|
1,241 |
|
|
|
2,691 |
|
|
|
Class I |
|
|
107 |
|
|
|
404 |
|
|
|
724 |
|
|
|
1,629 |
|
|
PROSPECTUS | March 1, 2024
81
Calamos Evolving World Growth Fund
You would pay the following expenses if you did not redeem your shares:
|
|
|
One Year |
|
Three Years |
|
Five Years |
|
Ten Years |
|
|
Class A |
|
|
601 |
|
|
|
934 |
|
|
|
1,290 |
|
|
|
2,290 |
|
|
|
Class C |
|
|
208 |
|
|
|
711 |
|
|
|
1,241 |
|
|
|
2,691 |
|
|
|
Class I |
|
|
107 |
|
|
|
404 |
|
|
|
724 |
|
|
|
1,629 |
|
|
Portfolio Turnover
The Fund pays transaction costs, such as commissions, when it buys and sells securities (or "turns over" its portfolio). A higher portfolio turnover rate may indicate higher transaction costs and may result in higher taxes when Fund shares are held in a taxable account. These costs, which are not reflected in the annual fund operating expenses or in the example, affect the Fund's performance. During the most recent fiscal year, the Fund's portfolio turnover rate was 137% of the average value of its portfolio.
Principal Investment Strategies
The Fund anticipates that, under normal circumstances, the investment adviser's process will result in the Fund investing in a globally diversified manner, with at least 40% of its assets in securities of foreign issuers. Securities of foreign issuers are securities issues by issuers that are organized under the laws of a foreign country or that have a substantial portion of their operations or assets in a foreign country or countries, or that derive a substantial portion of their revenue or profits from businesses, investments or sales outside of the United States. The Fund may also invest in foreign securities that are represented in the United States securities markets by American Depositary Receipts ("ADRs") or similar depository arrangements. The Fund's foreign debt investments can be denominated in U.S. dollars or in foreign currencies. Debt securities issued by a foreign government may not be supported by the "full faith and credit" of that government. The Fund intends to invest at least 35% of its assets in equity, convertible or debt securities of issuers that are incorporated in emerging market countries. Under normal circumstances, the remaining assets will be invested primarily in (1) equity, convertible (including synthetic convertible) or debt securities of companies, regardless of where they are incorporated, if the Fund's investment adviser determines that a significant portion (generally, 20% or more) of the assets or revenues of each such company is attributable to emerging market countries and (2) sovereign and agency debt of non-emerging market countries.
A synthetic convertible instrument is designed to simulate the economic characteristics of a convertible security through the combined features of a debt instrument, or loan, and a security providing an option on an equity security. The Fund may establish a synthetic convertible instrument by combining a fixed-income security with the right to acquire an equity security. The fixed-income and equity option components may have different issuers, and either component may change at any time.
In pursuing its investment objective, the Fund seeks out securities that, in the investment adviser's opinion, offer the best opportunities for growth. The Fund's investment adviser typically considers the company's financial soundness, earnings and cash flow forecast and quality of management. The investment adviser takes environmental, social and governance ("ESG") factors into account in making investment decisions. The Fund may also invest in high yield securities and unrated securities of similar credit quality (commonly known as "junk bonds"). The Fund's investment adviser seeks to lower the risks of investing in stocks by using a "top-down approach" of diversification by company, industry, sector, country, and currency and focusing on macro-level investment themes.
Principal Risks
An investment in the Fund is subject to risks, and you could lose money on your investment in the Fund. There can be no assurance that the Fund will achieve its investment objective. The risks associated with an investment in the Fund can increase during times of significant market volatility. Your investment in the Fund is not a deposit in a bank and is not insured or guaranteed by the Federal Deposit Insurance Corporation or any other government agency. The principal risks are presented in alphabetical order to facilitate finding particular risks and comparing them with other funds. Each risk summarized below is
CALAMOS FAMILY OF FUNDS
82
Calamos Evolving World Growth Fund
considered a "principal risk" of investing in the Fund, regardless of the order in which it appears. The principal risks of investing in the Fund include:
• American Depositary Receipts Risk — The stocks of most foreign companies that trade in the U.S. markets are traded as American Depositary Receipts (ADRs). U.S. depositary banks issue these stocks. Each ADR represents one or more shares of foreign stock or a fraction of a share. The price of an ADR corresponds to the price of the foreign stock in its home market, adjusted to the ratio of the ADRs to foreign company shares. Therefore while purchasing a security on a U.S. exchange, the risks inherently associated with foreign investing still apply to ADRs.
• Convertible Securities Risk — The value of a convertible security is influenced by changes in interest rates, with investment value declining as interest rates increase and increasing as interest rates decline. The credit standing of the issuer and other factors also may have an effect on the convertible security's investment value.
• Debt Securities Risk — Debt securities are subject to various risks, including interest rate risk, credit risk and default risk.
• Interest Rate Risk — The value of debt securities generally decreases in periods when interest rates are rising. In addition, interest rate changes typically have a greater effect on prices of longer-term debt securities than shorter term debt securities. Changes in interest rates by the Federal Reserve Board, and other events affecting fixed-income markets, may subject a Fund to heightened interest rate risk as a result of a rise in interest rates.
• Credit Risk — A debt security could deteriorate in quality to such an extent that its rating is downgraded or its market value declines relative to comparable securities. Changes in actual or perceived creditworthiness may occur quickly. If the Fund holds securities that have been downgraded, or that default on payment, the Fund's performance could be negatively affected.
• Default Risk — A company that issues a debt security may be unable to fulfill its obligation to repay principal and interest. The lower a bond is rated, the greater its default risk. To the extent the Fund holds securities that have been downgraded, or that default on payment, its performance could be negatively affected.
• Emerging Markets Risk — Emerging market countries may have relatively unstable governments and economies based on only a few industries, which may cause greater instability. The value of emerging market securities will likely be particularly sensitive to changes in the economies of such countries. These countries are also more likely to experience higher levels of inflation, deflation or currency devaluations, which could hurt their economies and securities markets.
• Equity Securities Risk — The securities markets are volatile, and the market prices of the Fund's securities may decline generally. The price of equity securities fluctuates based on changes in a company's financial condition and overall market and economic conditions. If the market prices of the securities owned by the Fund fall, the value of your investment in the Fund will decline.
• Foreign Securities Risk — Risks associated with investing in foreign securities include fluctuations in the exchange rates of foreign currencies that may affect the U.S. dollar value of a security, the possibility of substantial price volatility as a result of political and economic instability in the foreign country, less public information about issuers of securities, different securities regulation, different accounting, auditing and financial reporting standards and less liquidity than in U.S. markets.
• Forward Foreign Currency Contract Risk — Forward foreign currency contracts are contractual agreements to purchase or sell a specified currency at a specified future date (or within a specified time period) at a price set at the time of the contract. The Fund may not fully benefit from, or may lose money on, forward foreign currency transactions if changes in currency exchange rates do not occur as anticipated or do not correspond accurately to changes in the value of the Fund's holdings.
• Growth Stock Risk — Growth securities typically trade at higher multiples of current earnings than other securities and, therefore, may be more sensitive to changes in current or expected earnings than other equity securities and may be more volatile.
PROSPECTUS | March 1, 2024
83
Calamos Evolving World Growth Fund
• High Yield Risk — High yield securities and unrated securities of similar credit quality (commonly known as "junk bonds") are subject to greater levels of credit and liquidity risks. High yield securities are considered primarily speculative with respect to the issuer's continuing ability to make principal and interest payments.
• Portfolio Selection Risk — The value of your investment may decrease if the investment adviser's judgment about the attractiveness, value or market trends affecting a particular security, issuer, industry or sector or about market movements is incorrect.
• Portfolio Turnover Risk — The portfolio managers may actively and frequently trade securities or other instruments in the Fund's portfolio to carry out its investment strategies. A high portfolio turnover rate increases transaction costs, which may increase the Fund's expenses. Frequent and active trading may also cause adverse tax consequences for investors in the Fund due to an increase in short-term capital gains.
• Sector Risk — To the extent the Fund invests a significant portion of its assets in a particular sector, a greater portion of the Fund's performance may be affected by the general business and economic conditions affecting that sector. Each sector may share economic risk with the broader market, however there may be economic risks specific to each sector. As a result, returns from those sectors may trail returns from the overall stock market and it is possible that the Fund may underperform the broader market, or experience greater volatility.
• Securities Lending Risk — The Fund may lend its portfolio securities to broker-dealers and banks in order to generate additional income for the Fund. Any such loan must be continuously secured by collateral in cash or cash equivalents maintained on a current basis in an amount at least equal to the market value of the securities loaned by the Fund. In the event of bankruptcy or other default of a borrower of portfolio securities, the Fund could experience both delays in liquidating the loan collateral or recovering the loaned securities and losses, including (a) possible decline in the value of the collateral or in the value of the securities loaned during the period while the Fund seeks to enforce its rights thereto, (b) possible subnormal levels of income and lack of access to income during this period, and (c) expenses of enforcing its rights. In an effort to reduce these risks, the Fund's securities lending agent monitors, and reports to Calamos Advisors on, the creditworthiness of the firms to which a Fund lends securities. The Fund may also experience losses as a result of a diminution in value of its cash collateral investments.
• Synthetic Convertible Instruments Risk — The value of a synthetic convertible instrument will respond differently to market fluctuations than a convertible security because a synthetic convertible instrument is composed of two or more separate securities, each with its own market value. In addition, if the value of the underlying common stock or the level of the index involved in the convertible component falls below the exercise price of the warrant or option, the warrant or option may lose all value.
Fund Performance
The following bar chart and table indicate the risks of investing in the Fund by showing changes in the Fund's performance from calendar year to calendar year and how the Fund's average annual total returns compare with those of a broad measure of market performance. All returns include the reinvestment of dividends and distributions. As always, please note that the Fund's past performance (before and after taxes) cannot predict how it will perform in the future. Updated performance information is available at no cost by visiting www.calamos.com or by calling 800.582.6959.
CALAMOS FAMILY OF FUNDS
84
Calamos Evolving World Growth Fund
CLASS I* ANNUAL TOTAL RETURN FOR YEARS ENDED 12.31

|
Highest Quarterly Return: |
|
|
30.66 |
% (6.30.2020) |
|
Lowest Quarterly Return: |
|
|
-16.46 |
% (3.31.2020) |
|
* Annual returns for Class I are provided because Class I shares represent the largest percentage of assets in the Calamos Family of Funds.
Average Annual Total Returns as of 12.31.23
The following table shows how the Fund's average annual performance (before and after taxes) for the one-, five- and ten-year periods ended December 31, 2023 and since the Fund's inception compared with broad measures of market performance. "Since Inception" returns shown for the index are returns since the inception of the Fund's Class A shares, or since the nearest subsequent month end when comparative index data is available only for full monthly periods. The after-tax returns show the impact of assumed federal income taxes on an investment in the Fund. "Return After Taxes on Distributions" shows the effect of taxable distributions, but assumes that you still hold the Fund shares at the end of the period and so do not have any taxable gain or loss on your investment. "Return After Taxes on Distributions and Sale of Fund Shares" shows the effect of taxable distributions and any taxable gain or loss that would be realized if the Fund shares were purchased at the beginning and sold at the end of the specified period.
The after-tax returns are shown only for Class I shares, and are calculated using the historical highest individual federal marginal income tax rates and do not reflect the impact of state and local taxes. Actual after-tax returns depend on an investor's tax situation and may differ from those shown, and the after-tax returns shown are not relevant to investors who hold their Fund shares through tax-advantaged arrangements, such as 401(k) plans or individual retirement accounts. After-tax returns for classes other than Class I will vary from returns shown for Class I. "Return After Taxes on Distributions and Sale of Fund Shares" may be higher than other returns for the same period due to a tax benefit of realizing a capital loss on the sale of Fund shares.
AVERAGE ANNUAL TOTAL RETURNS — FOR THE PERIODS ENDED 12.31.23
|
|
|
INCEPTION
DATE OF CLASS |
|
ONE YEAR |
|
FIVE YEAR |
|
TEN YEAR |
|
SINCE
INCEPTION |
|
|
Class A |
|
|
8.15.08 |
|
|
|
|
|
|
|
|
|
|
|
Load Adjusted Return before taxes |
|
|
|
|
1.33 |
% |
|
|
5.68 |
% |
|
|
1.93 |
% |
|
|
3.66 |
% |
|
|
Class C |
|
|
8.15.08 |
|
|
|
|
|
|
|
|
|
|
|
Load Adjusted Return before taxes |
|
|
|
|
4.59 |
% |
|
|
5.92 |
% |
|
|
1.67 |
% |
|
|
3.22 |
% |
|
|
Class I |
|
|
8.15.08 |
|
|
|
|
|
|
|
|
|
|
|
Return before taxes |
|
|
|
|
6.59 |
% |
|
|
6.97 |
% |
|
|
2.69 |
% |
|
|
4.25 |
% |
|
|
Return after taxes on distributions* |
|
|
|
|
6.35 |
% |
|
|
6.78 |
% |
|
|
2.64 |
% |
|
|
4.18 |
% |
|
Return after taxes on distributions and sale of
Fund shares* |
|
|
|
|
3.90 |
% |
|
|
5.58 |
% |
|
|
2.26 |
% |
|
|
3.56 |
% |
|
|
MSCI Emerging Markets Index |
|
|
|
|
10.27 |
% |
|
|
4.08 |
% |
|
|
3.05 |
% |
|
|
2.68 |
% |
|
*
PROSPECTUS | March 1, 2024
85
Calamos Evolving World Growth Fund
Investment Adviser
Calamos Advisors LLC
PORTFOLIO MANAGER/
FUND TITLE (IF APPLICABLE) |
|
PORTFOLIO MANAGER
EXPERIENCE IN THE FUND |
|
PRIMARY TITLE
WITH INVESTMENT ADVISER |
|
|
John P. Calamos, Sr. (President, Chairman) |
|
since Fund's inception |
|
Founder, Chairman, and Global CIO |
|
|
Nick Niziolek |
|
11 years |
|
SVP, Sr. Co-Portfolio Manager |
|
|
Dennis Cogan |
|
11 years |
|
SVP, Sr. Co-Portfolio Manager |
|
|
Paul Ryndak |
|
since February 2024 |
|
SVP, Associate Portfolio Manager |
|
|
Kyle Ruge |
|
since February 2024 |
|
VP, Associate Portfolio Manager |
|
Other Important Information Regarding Fund Shares
For important information about purchase and sale of Fund shares, tax information, and financial intermediary compensation, please turn to "Other Important Information Regarding Fund Shares" on Page 125 of the prospectus.
CALAMOS FAMILY OF FUNDS
86
Calamos Global Equity Fund
Investment Objective
Calamos Global Equity Fund's investment objective is long-term capital growth.
Fees and Expenses of the Fund
The following table describes the fees and expenses that you may pay if you buy, hold and sell shares of the Fund. Investors may pay other fees, such as brokerage commissions and/or other forms of compensation to a financial intermediary, which are not reflected in the tables or the examples below. You may qualify for sales charge discounts on Class A shares if you and your family invest, or agree to invest in the future, at least $50,000 in Calamos Funds. More information about these and other discounts is available from your financial professional and under "Fund Facts — What classes of shares do the Funds offer?" on Page 149 of the Fund's prospectus, in the Appendix to this prospectus and "Share Classes and Pricing of Shares" on Page 67 of the Fund's statement of additional information.
Shareholder Fees (fees paid directly from your investment):
|
|
|
CLASS A |
|
CLASS C |
|
CLASS I |
|
CLASS R6 |
|
Maximum Sales Charge (Load) Imposed on Purchases (as a percentage of
offering price) |
|
|
4.75 |
% |
|
|
None |
|
|
|
None |
|
|
|
None |
|
|
Maximum Deferred Sales Charge (Load) (as a percentage of the lesser of the
redemption price or offering price) |
|
|
None |
|
|
|
1.00 |
% |
|
|
None |
|
|
|
None |
|
|
Annual Fund Operating Expenses (expenses that you pay each year as a percentage of the value of your investment):
|
|
|
CLASS A
|
|
CLASS C
|
|
CLASS I
|
|
CLASS R6
|
|
|
Management Fees (subject to performance adjustment)
|
|
|
0.93
|
%
|
|
|
0.93
|
%
|
|
|
0.93
|
%
|
|
|
0.93
|
%
|
|
|
Distribution and/or Service Fees (12b-1)
|
|
|
0.25
|
%
|
|
|
1.00
|
%
|
|
|
None
|
|
|
|
None
|
|
|
|
Other Expenses
|
|
|
0.33
|
%
|
|
|
0.33
|
%
|
|
|
0.33
|
%
|
|
|
0.28
|
%
|
|
|
Total Annual Fund Operating Expenses
|
|
|
1.51
|
%
|
|
|
2.26
|
%
|
|
|
1.26
|
%
|
|
|
1.21
|
%
|
|
|
Expense Reimbursement1
|
|
|
(0.11
|
)%
|
|
|
(0.11
|
)%
|
|
|
(0.11
|
)%
|
|
|
(0.11
|
)%
|
|
|
Total Annual Fund Operating Expenses After Reimbursement
|
|
|
1.40
|
%
|
|
|
2.15
|
%
|
|
|
1.15
|
%
|
|
|
1.10
|
%
|
|
1
Example
This example is intended to help you compare the cost of investing in the Fund with the cost of investing in other mutual funds. The example assumes that you invest $10,000 in the Fund for the time periods indicated and then either redeem or do not redeem your shares at the end of the reflected time periods. The example also assumes that your investment has a 5% return each year, that all dividends and capital gain distributions are reinvested, that you pay a maximum initial or contingent deferred sales charge and that the Fund's operating expenses remain the same. Any applicable fee waivers and/or expense
PROSPECTUS | March 1, 2024
87
Calamos Global Equity Fund
reimbursements are reflected in the below examples for the period through March 1, 2025 only. Although your actual performance and costs may be higher or lower, based on these assumptions, your costs would be:
You would pay the following expenses if you redeemed your shares at the end of the period:
|
|
|
One Year
|
|
Three Years
|
|
Five Years
|
|
Ten Years
|
|
|
Class A
|
|
|
611
|
|
|
|
919
|
|
|
|
1,250
|
|
|
|
2,182
|
|
|
|
Class C
|
|
|
318
|
|
|
|
696
|
|
|
|
1,200
|
|
|
|
2,587
|
|
|
|
Class I
|
|
|
117
|
|
|
|
389
|
|
|
|
681
|
|
|
|
1,513
|
|
|
|
Class R6
|
|
|
112
|
|
|
|
373
|
|
|
|
654
|
|
|
|
1,456
|
|
|
You would pay the following expenses if you did not redeem your shares:
|
|
|
One Year
|
|
Three Years
|
|
Five Years
|
|
Ten Years
|
|
|
Class A
|
|
|
611
|
|
|
|
919
|
|
|
|
1,250
|
|
|
|
2,182
|
|
|
|
Class C
|
|
|
218
|
|
|
|
696
|
|
|
|
1,200
|
|
|
|
2,587
|
|
|
|
Class I
|
|
|
117
|
|
|
|
389
|
|
|
|
681
|
|
|
|
1,513
|
|
|
|
Class R6
|
|
|
112
|
|
|
|
373
|
|
|
|
654
|
|
|
|
1,456
|
|
|
Portfolio Turnover
The Fund pays transaction costs, such as commissions, when it buys and sells securities (or "turns over" its portfolio). A higher portfolio turnover rate may indicate higher transaction costs and may result in higher taxes when Fund shares are held in a taxable account. These costs, which are not reflected in the annual fund operating expenses or in the example, affect the Fund's performance. During the most recent fiscal year, the Fund's portfolio turnover rate was 90% of the average value of its portfolio.
Principal Investment Strategies
The Fund invests primarily in a globally-diversified portfolio of equity securities. Under normal circumstances, the Fund invests at least 80% of its net assets (plus any borrowings) in equity securities, including convertible securities convertible into equity securities. The Fund's portfolio may include securities of well-established companies with large market capitalizations as well as small, unseasoned companies. The Fund's investment adviser generally defines a large cap company to have a market capitalization in excess of $25 billion and a mid-sized company to have a market capitalization greater than $1 billion, up to $25 billion. Generally, a small cap company is defined by the investment adviser as having a market capitalization of up to $1 billion. The market capitalization of a security is measured at the time of purchase.
The Fund anticipates that, under normal circumstances, the investment adviser's process will result in the Fund investing in a globally diversified manner, with at least 40% of its assets in securities of foreign issuers. Securities of foreign issuers are securities issues by issuers that are organized under the laws of a foreign country or that have a substantial portion of their operations or assets in a foreign country or countries, or that derive a substantial portion of their revenue or profits from businesses, investments or sales outside of the United States. The Fund may also invest in foreign securities that are represented in the United States securities markets by American Depositary Receipts ("ADRs") or similar depository arrangements. Although not a principal investment strategy, the Fund may invest in securities of issuers in emerging markets to a significant extent.
In its fundamental analysis, the Fund's investment adviser typically considers the company's financial soundness, earnings and cash flow forecast and quality of management. The investment adviser takes environmental, social and governance ("ESG") factors into account in making investment decisions. The Fund's investment adviser seeks to lower the risks of investing in stocks by using a "top-down approach" of diversification by company, industry, sector, country and currency and focusing on macro-level investment themes.
CALAMOS FAMILY OF FUNDS
88
Calamos Global Equity Fund
Principal Risks
An investment in the Fund is subject to risks, and you could lose money on your investment in the Fund. There can be no assurance that the Fund will achieve its investment objective. The risks associated with an investment in the Fund can increase during times of significant market volatility. Your investment in the Fund is not a deposit in a bank and is not insured or guaranteed by the Federal Deposit Insurance Corporation or any other government agency. The principal risks are presented in alphabetical order to facilitate finding particular risks and comparing them with other funds. Each risk summarized below is considered a "principal risk" of investing in the Fund, regardless of the order in which it appears. The principal risks of investing in the Fund include:
• American Depositary Receipts Risk — The stocks of most foreign companies that trade in the U.S. markets are traded as American Depositary Receipts (ADRs). U.S. depositary banks issue these stocks. Each ADR represents one or more shares of foreign stock or a fraction of a share. The price of an ADR corresponds to the price of the foreign stock in its home market, adjusted to the ratio of the ADRs to foreign company shares. Therefore while purchasing a security on a U.S. exchange, the risks inherently associated with foreign investing still apply to ADRs.
• Emerging Markets Risk — Emerging market countries may have relatively unstable governments and economies based on only a few industries, which may cause greater instability. The value of emerging market securities will likely be particularly sensitive to changes in the economies of such countries. These countries are also more likely to experience higher levels of inflation, deflation or currency devaluations, which could hurt their economies and securities markets.
• Equity Securities Risk — The securities markets are volatile, and the market prices of the Fund's securities may decline generally. The price of equity securities fluctuates based on changes in a company's financial condition and overall market and economic conditions. If the market prices of the securities owned by the Fund fall, the value of your investment in the Fund will decline.
• Foreign Securities Risk — Risks associated with investing in foreign securities include fluctuations in the exchange rates of foreign currencies that may affect the U.S. dollar value of a security, the possibility of substantial price volatility as a result of political and economic instability in the foreign country, less public information about issuers of securities, different securities regulation, different accounting, auditing and financial reporting standards and less liquidity than in U.S. markets.
• Forward Foreign Currency Contract Risk — Forward foreign currency contracts are contractual agreements to purchase or sell a specified currency at a specified future date (or within a specified time period) at a price set at the time of the contract. The Fund may not fully benefit from, or may lose money on, forward foreign currency transactions if changes in currency exchange rates do not occur as anticipated or do not correspond accurately to changes in the value of the Fund's holdings.
• Growth Stock Risk — Growth securities typically trade at higher multiples of current earnings than other securities and, therefore, may be more sensitive to changes in current or expected earnings than other equity securities and may be more volatile.
• Portfolio Selection Risk — The value of your investment may decrease if the investment adviser's judgment about the attractiveness, value or market trends affecting a particular security, issuer, industry or sector or about market movements is incorrect.
• Sector Risk — To the extent the Fund invests a significant portion of its assets in a particular sector, a greater portion of the Fund's performance may be affected by the general business and economic conditions affecting that sector. Each sector may share economic risk with the broader market, however there may be economic risks specific to each sector. As a result, returns from those sectors may trail returns from the overall stock market and it is possible that the Fund may underperform the broader market, or experience greater volatility.
• Securities Lending Risk — The Fund may lend its portfolio securities to broker-dealers and banks in order to generate additional income for the Fund. Any such loan must be continuously secured by collateral in cash or cash equivalents maintained on a current basis in an amount at least equal to the market value of the securities loaned by the Fund. In the event of bankruptcy or other default of a borrower of portfolio securities, the Fund could experience both delays in
PROSPECTUS | March 1, 2024
89
Calamos Global Equity Fund
liquidating the loan collateral or recovering the loaned securities and losses, including (a) possible decline in the value of the collateral or in the value of the securities loaned during the period while the Fund seeks to enforce its rights thereto,(b) possible subnormal levels of income and lack of access to income during this period, and (c) expenses of enforcing its rights. In an effort to reduce these risks, the Fund's securities lending agent monitors, and reports to Calamos Advisors on, the creditworthiness of the firms to which a Fund lends securities. The Fund may also experience losses as a result of a diminution in value of its cash collateral investments.
• Small and Mid-Sized Company Risk — Small and mid-sized company stocks have historically been subject to greater investment risk than large company stocks. The prices of small and mid-sized company stocks tend to be more volatile than prices of large company stocks.
• Value Stock Risk — Value stocks involve the risk that they may never reach what the Fund's investment adviser believes is their full market value. Additionally, because different types of stocks tend to shift in and out of favor depending on market conditions, a value fund's performance may sometimes be higher or lower than that of other types of funds (such as those emphasizing growth stocks).
Fund Performance
The following bar chart and table indicate the risks of investing in the Fund by showing changes in the Fund's performance from calendar year to calendar year and how the Fund's average annual total returns compare with those of a broad measure of market performance. All returns include the reinvestment of dividends and distributions. As always, please note that the Fund's past performance (before and after taxes) cannot predict how it will perform in the future. Updated performance information is available at no cost by visiting www.calamos.com or by calling 800.582.6959.
CLASS I* ANNUAL TOTAL RETURN FOR YEARS ENDED 12.31
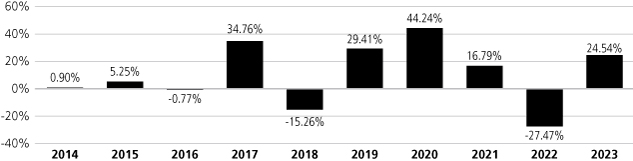
|
Highest Quarterly Return: |
|
|
31.45 |
% (6.30.2020) |
|
Lowest Quarterly Return: |
|
|
-18.36 |
% (12.31.2018) |
|
* Annual returns for Class I are provided because Class I shares represent the largest percentage of assets in the Calamos Family of Funds.
Average Annual Total Returns as of 12.31.23
The following table shows how the Fund's average annual performance (before and after taxes) for the one-, five-, and ten- year periods ended December 31, 2023 and since the Fund's inception compared with broad measures of market performance. "Since Inception" returns shown for each index are returns since the inception of the Fund's Class A shares, or since the nearest subsequent month end when comparative index data is available only for full monthly periods. The after-tax returns show the impact of assumed federal income taxes on an investment in the Fund. "Return After Taxes on Distributions" shows the effect of taxable distributions, but assumes that you still hold the Fund shares at the end of the period and so do not have any taxable gain or loss on your investment. "Return After Taxes on Distributions and Sale of Fund Shares" shows the effect of taxable distributions and any taxable gain or loss that would be realized if the Fund shares were purchased at the beginning and sold at the end of the specified period.
CALAMOS FAMILY OF FUNDS
90
Calamos Global Equity Fund
The after-tax returns are shown only for Class I shares, and are calculated using the historical highest individual federal marginal income tax rates and do not reflect the impact of state and local taxes. Actual after-tax returns depend on an investor's tax situation and may differ from those shown, and the after-tax returns shown are not relevant to investors who hold their Fund shares through tax-advantaged arrangements, such as 401(k) plans or individual retirement accounts. After-tax returns for classes other than Class I will vary from returns shown for Class I. "Return After Taxes on Distributions and Sale of Fund Shares" may be higher than other returns for the same period due to a tax benefit of realizing a capital loss on the sale of Fund shares.
AVERAGE ANNUAL TOTAL RETURNS — FOR THE PERIODS ENDED 12.31.23
|
|
|
INCEPTION
DATE OF CLASS |
|
ONE YEAR |
|
FIVE YEAR |
|
TEN YEAR |
|
SINCE
INCEPTION |
|
|
Class A |
|
|
3.1.07 |
|
|
|
|
|
|
|
|
|
|
|
Load Adjusted Return before taxes |
|
|
|
|
18.42 |
% |
|
|
13.13 |
% |
|
|
8.22 |
% |
|
|
7.99 |
% |
|
|
Class C |
|
|
3.1.07 |
|
|
|
|
|
|
|
|
|
|
|
Load Adjusted Return before taxes |
|
|
|
|
22.29 |
% |
|
|
13.37 |
% |
|
|
7.92 |
% |
|
|
7.49 |
% |
|
|
Class I |
|
|
3.1.07 |
|
|
|
|
|
|
|
|
|
|
|
Return before taxes |
|
|
|
|
24.54 |
% |
|
|
14.51 |
% |
|
|
9.01 |
% |
|
|
8.58 |
% |
|
|
Return after taxes on distributions* |
|
|
|
|
24.49 |
% |
|
|
12.95 |
% |
|
|
6.78 |
% |
|
|
7.12 |
% |
|
Return after taxes on distributions and sale of
Fund shares* |
|
|
|
|
14.53 |
% |
|
|
11.55 |
% |
|
|
6.69 |
% |
|
|
6.78 |
% |
|
|
Class R6 |
|
|
6.23.20 |
|
|
|
|
|
|
|
|
|
|
|
Load Adjusted Return before taxes |
|
|
|
|
24.67 |
% |
|
|
N/A |
|
|
|
N/A |
|
|
|
9.67 |
% |
|
|
MSCI World Index |
|
|
|
|
24.42 |
% |
|
|
13.37 |
% |
|
|
9.18 |
% |
|
|
7.22 |
% |
|
|
MSCI ACWI Index |
|
|
|
|
22.81 |
% |
|
|
12.27 |
% |
|
|
8.48 |
% |
|
|
6.77 |
% |
|
*
The MSCI ACWI (USD) Index is designed to measure the equity market performance of companies in developed and emerging markets. The MSCI ACWI (USD) Index is provided to show how the Fund's performance compares with the returns of an index of securities similar to those in which the Fund invests.
Investment Adviser
Calamos Advisors LLC
PORTFOLIO MANAGER/
FUND TITLE (IF APPLICABLE) |
|
PORTFOLIO MANAGER
EXPERIENCE IN THE FUND |
|
PRIMARY TITLE
WITH INVESTMENT ADVISER |
|
|
John P. Calamos, Sr. (President, Chairman) |
|
since Fund's inception |
|
Founder, Chairman, and Global CIO |
|
|
Nick Niziolek |
|
11 years |
|
SVP, Sr. Co-Portfolio Manager |
|
|
Dennis Cogan |
|
11 years |
|
SVP, Sr. Co-Portfolio Manager |
|
|
Paul Ryndak |
|
since February 2024 |
|
SVP, Associate Portfolio Manager |
|
|
Kyle Ruge |
|
since February 2024 |
|
VP, Associate Portfolio Manager |
|
Other Important Information Regarding Fund Shares
For important information about purchase and sale of Fund shares, tax information, and financial intermediary compensation, please turn to "Other Important Information Regarding Fund Shares" on Page 125 of the prospectus.
PROSPECTUS | March 1, 2024
91
Calamos Global Opportunities Fund
Investment Objective
Calamos Global Opportunities Fund's investment objective is high long-term total return through capital appreciation and current income.
Fees and Expenses of the Fund
The following table describes the fees and expenses that you may pay if you buy, hold and sell shares of the Fund. Investors may pay other fees, such as brokerage commissions and/or other forms of compensation to a financial intermediary, which are not reflected in the tables or the examples below. You may qualify for sales charge discounts on purchases of Class A shares if you and your family invest, or agree to invest in the future, at least $50,000 in Calamos Funds. More information about these and other discounts is available from your financial professional and under "Fund Facts — What classes of shares do the Funds offer?" on Page 149 of the Fund's prospectus, in the Appendix to this prospectus and "Share Classes and Pricing of Shares" on Page 67 of the Fund's statement of additional information.
Shareholder Fees (fees paid directly from your investment):
|
|
|
CLASS A |
|
CLASS C |
|
CLASS I |
|
|
Maximum Sales Charge (Load) Imposed on Purchases (as a percentage of offering price) |
|
|
4.75 |
% |
|
|
None |
|
|
|
None |
|
|
Maximum Deferred Sales Charge (Load) (as a percentage of the lesser of the redemption price or
offering price) |
|
|
None |
|
|
|
1.00 |
% |
|
|
None |
|
|
Annual Fund Operating Expenses (expenses that you pay each year as a percentage of the value of your investment):
|
|
|
CLASS A |
|
CLASS C |
|
CLASS I |
|
|
Management Fees |
|
|
1.00 |
% |
|
|
1.00 |
% |
|
|
1.00 |
% |
|
|
Distribution and/or Service Fees (12b-1) |
|
|
0.25 |
% |
|
|
1.00 |
% |
|
|
None |
|
|
|
Other Expenses |
|
|
0.24 |
% |
|
|
0.24 |
% |
|
|
0.24 |
% |
|
|
Total Annual Fund Operating Expenses |
|
|
1.49 |
% |
|
|
2.24 |
% |
|
|
1.24 |
% |
|
|
Expense Reimbursement1 |
|
|
(0.27 |
)% |
|
|
(0.27 |
)% |
|
|
(0.27 |
)% |
|
|
Total Annual Fund Operating Expenses After Reimbursement |
|
|
1.22 |
% |
|
|
1.97 |
% |
|
|
0.97 |
% |
|
1
Example
This example is intended to help you compare the cost of investing in the Fund with the cost of investing in other mutual funds. The example assumes that you invest $10,000 in the Fund for the time periods indicated and then either redeem or do not redeem your shares at the end of the reflected time periods. The example also assumes that your investment has a 5% return each year, that all dividends and capital gain distributions are reinvested, that you pay a maximum initial or contingent deferred sales charge and that the Fund's operating expenses remain the same. Any applicable fee waivers and/or expense
CALAMOS FAMILY OF FUNDS
92
Calamos Global Opportunities Fund
reimbursements are reflected in the below examples for the period through March 1, 2025 only. Although your actual performance and costs may be higher or lower, based on these assumptions, your costs would be:
You would pay the following expenses if you redeemed your shares at the end of the period:
|
|
|
One Year |
|
Three Years |
|
Five Years |
|
Ten Years |
|
|
Class A |
|
|
593 |
|
|
|
898 |
|
|
|
1,225 |
|
|
|
2,148 |
|
|
|
Class C |
|
|
300 |
|
|
|
674 |
|
|
|
1,175 |
|
|
|
2,554 |
|
|
|
Class I |
|
|
99 |
|
|
|
367 |
|
|
|
655 |
|
|
|
1,476 |
|
|
You would pay the following expenses if you did not redeem your shares:
|
|
|
One Year |
|
Three Years |
|
Five Years |
|
Ten Years |
|
|
Class A |
|
|
593 |
|
|
|
898 |
|
|
|
1,225 |
|
|
|
2,148 |
|
|
|
Class C |
|
|
200 |
|
|
|
674 |
|
|
|
1,175 |
|
|
|
2,554 |
|
|
|
Class I |
|
|
99 |
|
|
|
367 |
|
|
|
655 |
|
|
|
1,476 |
|
|
Portfolio Turnover
The Fund pays transaction costs, such as commissions, when it buys and sells securities (or "turns over" its portfolio). A higher portfolio turnover rate may indicate higher transaction costs and may result in higher taxes when Fund shares are held in a taxable account. These costs, which are not reflected in the annual fund operating expenses or in the example, affect the Fund's performance. During the most recent fiscal year, the Fund's portfolio turnover rate was 81% of the average value of its portfolio.
Principal Investment Strategies
The Fund invests primarily in a globally-diversified portfolio of convertible, equity and fixed-income securities, which may include synthetic convertible instruments, without regard to market capitalization. In pursuing its investment objective, the Fund attempts to utilize these different types of securities to strike, in the investment adviser's opinion, the appropriate balance between risk and reward in terms of growth and income.
A synthetic convertible instrument is designed to simulate the economic characteristics of a convertible security through the combined features of a debt instrument, or loan, and a security providing an option on an equity security. The Fund may establish a synthetic convertible instrument by combining a fixed-income security with the right to acquire an equity security. The fixed-income and equity option components may have different issuers, and either component may change at any time.
The Fund anticipates that under normal circumstances its investment adviser's investment process will result in the Fund investing in an internationally-diversified manner, with at least 40% of its assets in securities of foreign issuers. Securities of foreign issuers are securities issues by issuers that are organized under the laws of a foreign country or that have a substantial portion of their operations or assets in a foreign country or countries, or that derive a substantial portion of their revenue or profits from businesses, investments or sales outside of the United States. The Fund may also invest in foreign securities that are represented in the United States securities markets by American Depositary Receipts ("ADRs") or similar depository arrangements. The Fund's foreign debt investments can be denominated in U.S. dollars or in foreign currencies. Debt securities issued by a foreign government may not be supported by the "full faith and credit" of that government. The investment adviser takes environmental, social and governance ("ESG") factors into account in making investment decisions. The Fund's investment adviser seeks to lower the risks of investing in stocks by using a "top-down approach" of diversification by company, industry, sector, country and currency and focusing on macro-level investment themes. Consistent with the Fund's investment objective and principal investment strategies the Fund's investment adviser views the strategies as low volatility equity strategies and attempts to achieve equity-like returns with lower than equity market risk by managing a portfolio that it believes will exhibit less volatility over full market cycles.
PROSPECTUS | March 1, 2024
93
Calamos Global Opportunities Fund
Principal Risks
An investment in the Fund is subject to risks, and you could lose money on your investment in the Fund. There can be no assurance that the Fund will achieve its investment objective. The risks associated with an investment in the Fund can increase during times of significant market volatility. Your investment in the Fund is not a deposit in a bank and is not insured or guaranteed by the Federal Deposit Insurance Corporation or any other government agency. The principal risks are presented in alphabetical order to facilitate finding particular risks and comparing them with other funds. Each risk summarized below is considered a "principal risk" of investing in the Fund, regardless of the order in which it appears. The principal risks of investing in the Fund include:
• American Depositary Receipts Risk — The stocks of most foreign companies that trade in the U.S. markets are traded as ADRs. U.S. depositary banks issue these stocks. Each ADR represents one or more shares of foreign stock or a fraction of a share. The price of an ADR corresponds to the price of the foreign stock in its home market, adjusted to the ratio of the ADRs to foreign company shares. Therefore while purchasing a security on a U.S. exchange, the risks inherently associated with foreign investing still apply to ADRs.
• Convertible Securities Risk — The value of a convertible security is influenced by changes in interest rates, with investment value declining as interest rates increase and increasing as interest rates decline. The credit standing of the issuer and other factors also may have an effect on the convertible security's investment value.
• Debt Securities Risk — Debt securities are subject to various risks, including interest rate risk, credit risk and default risk.
• Interest Rate Risk — The value of debt securities generally decreases in periods when interest rates are rising. In addition, interest rate changes typically have a greater effect on prices of longer-term debt securities than shorter term debt securities. Changes in interest rates by the Federal Reserve Board, and other events affecting fixed-income markets, may subject a Fund to heightened interest rate risk as a result of a rise in interest rates.
• Credit Risk — A debt security could deteriorate in quality to such an extent that its rating is downgraded or its market value declines relative to comparable securities. Changes in actual or perceived creditworthiness may occur quickly. If the Fund holds securities that have been downgraded, or that default on payment, the Fund's performance could be negatively affected.
• Default Risk — A company that issues a debt security may be unable to fulfill its obligation to repay principal and interest. The lower a bond is rated, the greater its default risk. To the extent the Fund holds securities that have been downgraded, or that default on payment, its performance could be negatively affected.
• Emerging Markets Risk — Emerging market countries may have relatively unstable governments and economies based on only a few industries, which may cause greater instability. The value of emerging market securities will likely be particularly sensitive to changes in the economies of such countries. These countries are also more likely to experience higher levels of inflation, deflation or currency devaluations, which could hurt their economies and securities markets.
• Equity Securities Risk — The securities markets are volatile, and the market prices of the Fund's securities may decline generally. The price of equity securities fluctuates based on changes in a company's financial condition and overall market and economic conditions. If the market prices of the securities owned by the Fund fall, the value of your investment in the Fund will decline.
• Foreign Securities Risk — Risks associated with investing in foreign securities include fluctuations in the exchange rates of foreign currencies that may affect the U.S. dollar value of a security, the possibility of substantial price volatility as a result of political and economic instability in the foreign country, less public information about issuers of securities, different securities regulation, different accounting, auditing and financial reporting standards and less liquidity than in U.S. markets.
• Growth Stock Risk — Growth securities typically trade at higher multiples of current earnings than other securities and, therefore, may be more sensitive to changes in current or expected earnings than other equity securities and may be more volatile.
CALAMOS FAMILY OF FUNDS
94
Calamos Global Opportunities Fund
• High Yield Risk — High yield securities and unrated securities of similar credit quality (commonly known as "junk bonds") are subject to greater levels of credit and liquidity risks. High yield securities are considered primarily speculative with respect to the issuer's continuing ability to make principal and interest payments.
• Liquidity Risk — Liquidity risk exists when particular investments are difficult to purchase or sell. The Fund's investments in illiquid securities may reduce the returns of the Fund because it may be unable to sell the illiquid securities at an advantageous time or price.
• Options Risk — The Fund's ability to close out its position as a purchaser or seller of an over-the-counter or exchange- listed put or call option is dependent, in part, upon the liquidity of the options market. There are significant differences between the securities and options markets that could result in an imperfect correlation among these markets, causing a given transaction not to achieve its objectives. The Fund's ability to utilize options successfully will depend on the ability of the Fund's investment adviser to predict pertinent market movements, which cannot be assured.
• Portfolio Selection Risk — The value of your investment may decrease if the investment adviser's judgment about the attractiveness, value or market trends affecting a particular security, issuer, industry or sector or about market movements is incorrect.
• Rule 144A Securities Risk — The Fund may invest in securities that are issued and sold through transactions under Rule 144A of the Securities Act of 1933. Under the supervision of its board of trustees, the Fund will determine whether Rule 144A Securities are illiquid. If qualified institutional buyers are unwilling to purchase these Rule 144A Securities, the percentage of the Fund's assets invested in illiquid securities would increase. Typically, the Fund purchases Rule 144A Securities only if the Fund's adviser has determined them to be liquid. If any Rule 144A Security held by the Fund should become illiquid, the value of the security may be reduced and a sale of the security may be more difficult.
• Sector Risk — To the extent the Fund invests a significant portion of its assets in a particular sector, a greater portion of the Fund's performance may be affected by the general business and economic conditions affecting that sector. Each sector may share economic risk with the broader market, however there may be economic risks specific to each sector. As a result, returns from those sectors may trail returns from the overall stock market and it is possible that the Fund may underperform the broader market, or experience greater volatility.
• Securities Lending Risk — The Fund may lend its portfolio securities to broker-dealers and banks in order to generate additional income for the Fund. Any such loan must be continuously secured by collateral in cash or cash equivalents maintained on a current basis in an amount at least equal to the market value of the securities loaned by the Fund. In the event of bankruptcy or other default of a borrower of portfolio securities, the Fund could experience both delays in liquidating the loan collateral or recovering the loaned securities and losses, including (a) possible decline in the value of the collateral or in the value of the securities loaned during the period while the Fund seeks to enforce its rights thereto, (b) possible subnormal levels of income and lack of access to income during this period, and (c) expenses of enforcing its rights. In an effort to reduce these risks, the Fund's securities lending agent monitors, and reports to Calamos Advisors on, the creditworthiness of the firms to which a Fund lends securities. The Fund may also experience losses as a result of a diminution in value of its cash collateral investments.
• Small and Mid-Sized Company Risk — Small and mid-sized company stocks have historically been subject to greater investment risk than large company stocks. The prices of small and mid-sized company stocks tend to be more volatile than prices of large company stocks.
• Synthetic Convertible Instruments Risk — The value of a synthetic convertible instrument will respond differently to market fluctuations than a convertible security because a synthetic convertible instrument is composed of two or more separate securities, each with its own market value. In addition, if the value of the underlying common stock or the level of the index involved in the convertible component falls below the exercise price of the warrant or option, the warrant or option may lose all value.
• Tax Risk — The federal income tax treatment of convertible securities or other securities in which the Fund may invest may not be clear or may be subject to recharacterization by the Internal Revenue Service. It could be more difficult to comply with the tax requirements applicable to regulated investment companies if the tax characterization of investments
PROSPECTUS | March 1, 2024
95
Calamos Global Opportunities Fund
or the tax treatment of the income from such investments were successfully challenged by the Internal Revenue Service. Any such failure to comply with the rules applicable to regulated investment companies could cause the Fund to fail to qualify as such.
Fund Performance
The following bar chart and table indicate the risks of investing in the Fund by showing changes in the Fund's performance from calendar year to calendar year and how the Fund's average annual total returns compare with those of a broad measure of market performance. All returns include the reinvestment of dividends and distributions. As always, please note that the Fund's past performance (before and after taxes) cannot predict how it will perform in the future. Updated performance information is available at no cost by visiting www.calamos.com or by calling 800.582.6959.
CLASS I* ANNUAL TOTAL RETURN FOR YEARS ENDED 12.31

|
Highest Quarterly Return: |
|
|
24.55 |
% (6.30.2020) |
|
Lowest Quarterly Return: |
|
|
-16.61 |
% (3.31.2020) |
|
* Annual returns for Class I are provided because Class I shares represent the largest percentage of assets in the Calamos Family of Funds.
Average Annual Total Returns as of 12.31.23
The following table shows how the Fund's average annual performance (before and after taxes) for the one-, five- and ten-year periods ended December 31, 2023 and since the Fund's inception compared with broad measures of market performance. "Since Inception" returns shown for each index are returns since the inception of the Fund's Class A shares, or since the nearest subsequent month end when comparative index data is available only for full monthly periods. The after-tax returns show the impact of assumed federal income taxes on an investment in the Fund. "Return After Taxes on Distributions" shows the effect of taxable distributions, but assumes that you still hold the Fund shares at the end of the period and so do not have any taxable gain or loss on your investment. "Return After Taxes on Distributions and Sale of Fund Shares" shows the effect of taxable distributions and any taxable gain or loss that would be realized if the Fund shares were purchased at the beginning and sold at the end of the specified period.
The after-tax returns are shown only for Class I shares, and are calculated using the historical highest individual federal marginal income tax rates and do not reflect the impact of state and local taxes. Actual after-tax returns depend on an investor's tax situation and may differ from those shown, and the after-tax returns shown are not relevant to investors who hold their Fund shares through tax-advantaged arrangements, such as 401(k) plans or individual retirement accounts. After-tax returns for classes other than Class I will vary from returns shown for Class I. "Return After Taxes on Distributions and Sale of Fund Shares" may be higher than other returns for the same period due to a tax benefit of realizing a capital loss on the sale of Fund shares.
CALAMOS FAMILY OF FUNDS
96
Calamos Global Opportunities Fund
AVERAGE ANNUAL TOTAL RETURNS — FOR THE PERIODS ENDED 12.31.23
|
|
|
INCEPTION
DATE OF CLASS |
|
ONE YEAR |
|
FIVE YEAR |
|
TEN YEAR |
|
SINCE
INCEPTION |
|
|
Class A |
|
|
9.9.96 |
|
|
|
|
|
|
|
|
|
|
|
Load Adjusted Return before taxes |
|
|
|
|
8.43 |
% |
|
|
8.78 |
% |
|
|
5.46 |
% |
|
|
7.50 |
% |
|
|
Class C |
|
|
9.24.96 |
|
|
|
|
|
|
|
|
|
|
|
Load Adjusted Return before taxes |
|
|
|
|
11.96 |
% |
|
|
9.01 |
% |
|
|
5.19 |
% |
|
|
7.00 |
% |
|
|
Class I |
|
|
9.18.97 |
|
|
|
|
|
|
|
|
|
|
|
Return before taxes |
|
|
|
|
14.05 |
% |
|
|
10.09 |
% |
|
|
6.24 |
% |
|
|
7.29 |
% |
|
|
Return after taxes on distributions* |
|
|
|
|
13.68 |
% |
|
|
9.26 |
% |
|
|
4.88 |
% |
|
|
6.02 |
% |
|
Return after taxes on distributions and sale of
Fund shares* |
|
|
|
|
8.31 |
% |
|
|
7.88 |
% |
|
|
4.63 |
% |
|
|
5.75 |
% |
|
|
MSCI ACWI Index |
|
|
|
|
22.81 |
% |
|
|
12.27 |
% |
|
|
8.48 |
% |
|
|
6.79 |
% |
|
|
MSCI World Index |
|
|
|
|
24.42 |
% |
|
|
13.37 |
% |
|
|
9.18 |
% |
|
|
7.04 |
% |
|
*
The MSCI World Index is designed to measure the equity market performance of developed markets. The MSCI World Index is provided to show how the Fund's performance compares with the returns of an index of securities similar to those in which the Fund invests.
Investment Adviser
Calamos Advisors LLC
PORTFOLIO MANAGER/
FUND TITLE (IF APPLICABLE) |
|
PORTFOLIO MANAGER
EXPERIENCE IN THE FUND |
|
PRIMARY TITLE
WITH INVESTMENT ADVISER |
|
|
John P. Calamos, Sr. (President, Chairman) |
|
since Fund's inception |
|
Founder, Chairman, and Global CIO |
|
|
Nick Niziolek |
|
11 years |
|
SVP, Sr. Co-Portfolio Manager |
|
|
Dennis Cogan |
|
11 years |
|
SVP, Sr. Co-Portfolio Manager |
|
|
Paul Ryndak |
|
since February 2024 |
|
SVP, Associate Portfolio Manager |
|
|
Kyle Ruge |
|
since February 2024 |
|
VP, Associate Portfolio Manager |
|
Other Important Information Regarding Fund Shares
For important information about purchase and sale of Fund shares, tax information, and financial intermediary compensation, please turn to "Other Important Information Regarding Fund Shares" on Page 125 of the prospectus.
PROSPECTUS | March 1, 2024
97
Calamos International Small Cap Growth Fund
Investment Objective
Calamos International Small Cap Growth Fund's investment objective is long-term capital appreciation.
Fees and Expenses of the Fund
The following table describes the fees and expenses that you may pay if you buy, hold and sell shares of the Fund. Investors may pay other fees, such as brokerage commissions and/or other forms of compensation to a financial intermediary, which are not reflected in the tables or the examples below. More information about discounts is available from your financial professional and under "Fund Facts — What classes of shares does the Fund offer?" on Page 149 of the Fund's prospectus, in the Appendix to this prospectus and "Share Classes and Pricing of Shares" on Page 67 of the Fund's statement of additional information.
Shareholder Fees (fees paid directly from your investment):
|
|
|
CLASS A |
|
CLASS C |
|
CLASS I |
|
CLASS R6 |
|
Maximum Sales Charge (Load) Imposed on Purchases (as a percentage of
offering price) |
|
|
4.75 |
% |
|
|
None |
|
|
|
None |
|
|
|
None |
|
|
Maximum Deferred Sales Charge (Load) (as a percentage of the lesser of the
redemption price or offering price) |
|
|
None |
|
|
|
1.00 |
% |
|
|
None |
|
|
|
None |
|
|
Annual Fund Operating Expenses (expenses that you pay each year as a percentage of the value of your investment):
|
|
|
CLASS A
|
|
CLASS C
|
|
CLASS I
|
|
CLASS R6
|
|
|
Management Fees
|
|
|
0.95
|
%
|
|
|
0.95
|
%
|
|
|
0.95
|
%
|
|
|
0.95
|
%
|
|
|
Distribution and/or Service Fees (12b-1)
|
|
|
0.25
|
%
|
|
|
1.00
|
%
|
|
|
None
|
|
|
|
None
|
|
|
|
Other Expenses
|
|
|
7.85
|
%
|
|
|
7.85
|
%
|
|
|
7.85
|
%
|
|
|
7.84
|
%
|
|
|
Total Annual Fund Operating Expenses
|
|
|
9.05
|
%
|
|
|
9.80
|
%
|
|
|
8.80
|
%
|
|
|
8.79
|
%
|
|
|
Expense Reimbursement1
|
|
|
(7.70
|
)%
|
|
|
(7.70
|
)%
|
|
|
(7.70
|
)%
|
|
|
(7.70
|
)%
|
|
|
Total Annual Fund Operating Expenses After Reimbursement
|
|
|
1.35
|
%
|
|
|
2.10
|
%
|
|
|
1.10
|
%
|
|
|
1.09
|
%
|
|
1
Example
This example is intended to help you compare the cost of investing in the Fund with the cost of investing in other mutual funds. The example assumes that you invest $10,000 in the Fund for the time periods indicated and then either redeem or do not redeem your shares at the end of the reflected time periods. The example also assumes that your investment has a 5% return each year that all dividends and capital gain distributions are reinvested, that you pay a maximum initial or contingent deferred sales charge and that the Fund's operating expenses remain the same. Any applicable fee waivers and/or expense
CALAMOS FAMILY OF FUNDS
98
Calamos International Small Cap Growth Fund
reimbursements are reflected in the below examples for the period through March 31, 2025 only. Although your actual performance and costs may be higher or lower, based on these assumptions, your costs would be:
You would pay the following expenses if you redeemed your shares at the end of the period:
|
|
|
One Year |
|
Three Years |
|
Five Years |
|
Ten Years |
|
|
Class A |
|
|
606 |
|
|
|
2,266 |
|
|
|
3,856 |
|
|
|
7,301 |
|
|
|
Class C |
|
|
313 |
|
|
|
2,078 |
|
|
|
3,831 |
|
|
|
7,529 |
|
|
|
Class I |
|
|
112 |
|
|
|
1,814 |
|
|
|
3,454 |
|
|
|
7,038 |
|
|
|
Class R6 |
|
|
111 |
|
|
|
1,811 |
|
|
|
3,450 |
|
|
|
7,032 |
|
|
You would pay the following expenses if you did not redeem your shares:
|
|
|
One Year |
|
Three Years |
|
Five Years |
|
Ten Years |
|
|
Class A |
|
|
606 |
|
|
|
2,266 |
|
|
|
3,856 |
|
|
|
7,301 |
|
|
|
Class C |
|
|
213 |
|
|
|
2,078 |
|
|
|
3,831 |
|
|
|
7,529 |
|
|
|
Class I |
|
|
112 |
|
|
|
1,814 |
|
|
|
3,454 |
|
|
|
7,038 |
|
|
|
Class R6 |
|
|
111 |
|
|
|
1,811 |
|
|
|
3,450 |
|
|
|
7,032 |
|
|
Portfolio Turnover
The Fund pays transaction costs, such as commissions, when it buys and sells securities (or "turns over" its portfolio). A higher portfolio turnover rate may indicate higher transaction costs and may result in higher taxes when Fund shares are held in a taxable account. These costs, which are not reflected in the annual fund operating expenses or in the example, affect the Fund's performance. During the most recent fiscal year, the Fund's portfolio turnover rate was 126% of the average value of its portfolio.
Principal Investment Strategies
Under normal market conditions, the Fund invests at least 80% of its net assets (plus borrowings for investment purposes, if any) in securities of small capitalization, non-U.S. companies, including emerging and frontier markets. The Fund may invest up to 30% in emerging and frontier markets. The Fund will generally be invested in a minimum of five countries.
Small capitalization companies are defined as companies with a market capitalization less than or equal to that of the company with the largest market capitalization of the MSCI ACWI ex USA Small Cap Index. As of December 31, 2023, the largest market cap in the MSCI ACWI ex USA Small Cap Index was $7.6 billion and the weighted average market cap was $2.5 billion. Market capitalization is measured at the time of purchase.
Securities of foreign issuers are securities issues by issuers that are organized under the laws of a foreign country or that have a substantial portion of their operations or assets in a foreign country or countries, or that derive a substantial portion of their revenue or profits from businesses, investments or sales outside of the United States. Emerging markets are markets of countries in the initial stages of industrialization and generally have low per capita income. Certain emerging markets are sometimes referred to as "frontier markets." Frontier markets are the least advanced capital markets in the developing world. Frontier markets are countries with investable stock markets that are less established than those in the emerging markets. To determine if a country is an emerging market or frontier market country, Calamos Advisors will use the classification provided by MSCI, Inc. Foreign securities include American Depositary Receipts ("ADRs") or securities guaranteed by a U.S. person but which represent underlying shares of foreign issuers, and may include foreign securities in the form of European Depositary Receipts ("EDRs"), Global Depositary Receipts ("GDRs") or other securities representing underlying shares of foreign issuers. The Fund may use derivative instruments such as options and forward foreign currency contracts for hedging purposes.
PROSPECTUS | March 1, 2024
99
Calamos International Small Cap Growth Fund
In pursuing its investment objective, the Fund seeks out securities that, in the opinion of Calamos Advisors, offer some of the best opportunities for growth. Calamos Advisors typically considers the company's financial soundness, earnings and cash flow forecast and quality of management. Calamos Advisors evaluates environmental, social and governance ("ESG") information within its fundamental research process to aid in determining investment opportunities and risks. As part of the research process, Calamos Advisors reviews ESG information and ratings from a third-party vendor as well as any additional ESG analysis and incorporates this information into Calamos Advisors' company research. Calamos Advisors also receives ESG information updates and rating changes from its third-party vendor and evaluates that information as appropriate. Calamos Advisors does not exclude an investment solely based on its ESG rating nor does Calamos Advisors target a certain average ESG rating for the portfolio. Calamos Advisors seeks to lower the risks of investing in stocks by using a "top-down approach" of diversification by company, industry, sector, country, and currency and focusing on macro-level investment themes. From time to time, the Fund may have significant investments in certain sectors. The Fund's sector concentrations may vary.
Principal Risks
An investment in the Fund is subject to risks, and you could lose money on your investment in the Fund. There can be no assurance that the Fund will achieve its investment objective. The risks associated with an investment in the Fund can increase during times of significant market volatility. Your investment in the Fund is not a deposit in a bank and is not insured or guaranteed by the Federal Deposit Insurance Corporation or any other government agency. The principal risks are presented in alphabetical order to facilitate finding particular risks and comparing them with other funds. Each risk summarized below is considered a "principal risk" of investing in the Fund, regardless of the order in which it appears. The principal risks of investing in the Fund include:
• American Depositary Receipts Risk — The stocks of most foreign companies that trade in the U.S. markets are traded as American Depositary Receipts (ADRs). U.S. depositary banks issue these stocks. Each ADR represents one or more shares of foreign stock or a fraction of a share. The price of an ADR corresponds to the price of the foreign stock in its home market, adjusted to the ratio of the ADRs to foreign company shares. Therefore while purchasing a security on a U.S. exchange, the risks inherently associated with foreign investing still apply to ADRs.
• Currency Risk — To the extent that the Fund invests in securities or other instruments denominated in or indexed to foreign currencies, changes in currency exchange rates bring an added dimension of risk. Currency fluctuations could negatively impact investment gains or add to investment losses. Although the Fund may attempt to hedge against currency risk, the hedging instruments may not always perform as the Fund expects and could produce losses. Suitable hedging instruments may not be available for currencies of emerging market countries. The Fund's investment adviser may determine not to hedge currency risks, even if suitable instruments appear to be available.
• Emerging Markets Risk — Emerging market countries may have relatively unstable governments and economies based on only a few industries, which may cause greater instability. The value of emerging market securities will likely be particularly sensitive to changes in the economies of such countries. These countries are also more likely to experience higher levels of inflation, deflation or currency devaluations, which could hurt their economies and securities markets. Certain emerging markets are sometimes referred to as "frontier markets." Frontier markets, the least advanced capital markets in the developing world, are among the riskiest markets in the world in which to invest. Investments in this sector are typically illiquid, nontransparent and subject to very low regulation levels as well as high transaction fees, and may also have substantial political and currency risk.
• Equity Securities Risk — The securities markets are volatile, and the market prices of the Fund's securities may decline generally. The price of equity securities fluctuates based on changes in a company's financial condition and overall market and economic conditions. If the market prices of the securities owned by the Fund (i.e., the Fund's long position) fall, the value of your investment in the Fund will decline.
• Forward Foreign Currency Contract Risk — Forward foreign currency contracts are contractual agreements to purchase or sell a specified currency at a specified future date (or within a specified time period) at a price set at the time of the contract. The Fund may not fully benefit from, or may lose money on, forward foreign currency transactions if
CALAMOS FAMILY OF FUNDS
100
Calamos International Small Cap Growth Fund
changes in currency exchange rates do not occur as anticipated or do not correspond accurately to changes in the value of the Fund's holdings.
• Foreign Securities Risk — Risks associated with investing in foreign securities include fluctuations in the exchange rates of foreign currencies that may affect the U.S. dollar value of a security, the possibility of substantial price volatility as a result of political and economic instability in the foreign country, less public information about issuers of securities, different securities regulation, different accounting, auditing and financial reporting standards and less liquidity than in U.S. markets.
• Growth Stock Risk — Growth securities typically trade at higher multiples of current earnings than other securities and, therefore, may be more sensitive to changes in current or expected earnings than other equity securities and may be more volatile.
• Options Risk — The Fund's ability to close out its position as a purchaser or seller of an over-the-counter or exchange-listed put or call option is dependent, in part, upon the liquidity of the options market. There are significant differences between the securities and options markets that could result in an imperfect correlation among these markets, causing a given transaction not to achieve its objectives. The Fund's ability to utilize options successfully will depend on the ability of the Fund's investment adviser to predict pertinent market movements, which cannot be assured.
• Portfolio Selection Risk — The value of your investment may decrease if the investment adviser's judgment about the attractiveness, value or market trends affecting a particular security, issuer, industry or sector or about market movements is incorrect.
• Sector Risk — To the extent the Fund invests a significant portion of its assets in a particular sector, a greater portion of the Fund's performance may be affected by the general business and economic conditions affecting that sector. Each sector may share economic risk with the broader market, however there may be economic risks specific to each sector. As a result, returns from those sectors may trail returns from the overall stock market and it is possible that the Fund may underperform the broader market, or experience greater volatility.
• Securities Lending Risk — The Fund may lend its portfolio securities to broker-dealers and banks in order to generate additional income for the Fund. Any such loan must be continuously secured by collateral in cash or cash equivalents maintained on a current basis in an amount at least equal to the market value of the securities loaned by the Fund. In the event of bankruptcy or other default of a borrower of portfolio securities, the Fund could experience both delays in liquidating the loan collateral or recovering the loaned securities and losses, including (a) possible decline in the value of the collateral or in the value of the securities loaned during the period while the Fund seeks to enforce its rights thereto, (b) possible subnormal levels of income and lack of access to income during this period, and (c) expenses of enforcing its rights. In an effort to reduce these risks, the Fund's securities lending agent monitors, and reports to Calamos Advisors on, the creditworthiness of the firms to which a Fund lends securities. The Fund may also experience losses as a result of a diminution in value of its cash collateral investments.
• Small Company Risk — Small company stocks have historically been subject to greater investment risk than mid and large company stocks. The prices of small company stocks tend to be more volatile than prices of mid and large company stocks.
• Sustainability (ESG) Policy Risk — The investment adviser's consideration of ESG information could cause the Fund to perform differently compared to similar funds that do not consider such information. In executing the Fund's investment strategy, the investment adviser will rely on ESG related data provided by third parties. There is no assurance that ESG data sources will always be available.
PROSPECTUS | March 1, 2024
101
Calamos International Small Cap Growth Fund
Fund Performance
The following bar chart and table indicate the risks of investing in the Fund by showing changes in the Fund's performance from calendar year to calendar year and how the Fund's average annual total returns compare with those of a broad measure of market performance. All returns include the reinvestment of dividends and distributions. As always, please note that the Fund's past performance (before and after taxes) cannot predict how it will perform in the future. Updated performance information is available at no cost by visiting www.calamos.com or by calling 800.582.6959.
CLASS I* ANNUAL TOTAL RETURN FOR YEARS ENDED 12.31
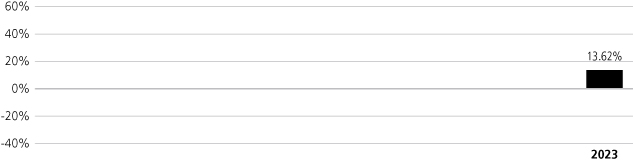
|
Highest Quarterly Return: |
|
|
15.22 |
% (12.31.2023) |
|
Lowest Quarterly Return: |
|
|
-3.22 |
% (9.30.2023) |
|
* Annual returns for Class I are provided because Class I shares represent the largest percentage of assets in the Calamos Family of Funds.
Average Annual Total Returns as of 12.31.23
The following table shows how the Fund's average annual performance (before and after taxes) since the Fund's inception compared with broad measures of market performance. "Since Inception" returns shown for each index are returns since the inception of the Fund's Class A shares, or since the nearest subsequent month end when comparative index data is available only for full monthly periods. The after-tax returns show the impact of assumed federal income taxes on an investment in the Fund. "Return After Taxes on Distributions" shows the effect of taxable distributions, but assumes that you still hold the Fund shares at the end of the period and so do not have any taxable gain or loss on your investment. "Return After Taxes on Distributions and Sale of Fund Shares" shows the effect of taxable distributions and any taxable gain or loss that would be realized if the Fund shares were purchased at the beginning and sold at the end of the specified period.
The after-tax returns are shown only for Class I shares, and are calculated using the historical highest individual federal marginal income tax rates and do not reflect the impact of state and local taxes. Actual after-tax returns depend on an investor's tax situation and may differ from those shown, and the after-tax returns shown are not relevant to investors who hold their Fund shares through tax-advantaged arrangements, such as 401(k) plans or individual retirement accounts. After-tax returns for classes other than Class I will vary from returns shown for Class I. "Return After Taxes on Distributions and Sale of Fund Shares" may be higher than other returns for the same period due to a tax benefit of realizing a capital loss on the sale of Fund shares.
CALAMOS FAMILY OF FUNDS
102
Calamos International Small Cap Growth Fund
AVERAGE ANNUAL TOTAL RETURNS — FOR THE PERIOD ENDED 12.31.23
|
|
|
ONE YEAR |
|
SINCE
INCEPTION
(3.31.22) |
|
|
Class A |
|
|
|
|
|
|
Load Adjusted Return before taxes |
|
|
7.80 |
% |
|
|
-8.23 |
% |
|
|
Class C |
|
|
|
|
|
|
Load Adjusted Return before taxes |
|
|
11.29 |
% |
|
|
-6.41 |
% |
|
|
Class I |
|
|
|
|
|
|
Return before taxes |
|
|
13.62 |
% |
|
|
-5.40 |
% |
|
|
Return after taxes on distributions* |
|
|
13.62 |
% |
|
|
-5.46 |
% |
|
|
Return after taxes on distributions and sale of Fund shares* |
|
|
8.06 |
% |
|
|
-4.08 |
% |
|
|
Class R6 |
|
|
|
|
|
|
Load Adjusted Return before taxes |
|
|
13.62 |
% |
|
|
-5.40 |
% |
|
|
MSCI ACWI ex USA Small Cap Index (Net) |
|
|
15.66 |
% |
|
|
-0.57 |
% |
|
*
The MSCI ACWI ex USA Small Cap Index (Net) is designed to measure the small cap equity market performance of companies in developed (excluding the US) and emerging markets. The MSCI ACWI ex USA Small Cap Index (Net) is provided to show how the Fund's performance compares with the returns of an index of securities similar to those in which the Fund invests.
Investment Adviser
Calamos Advisors LLC
PORTFOLIO MANAGER/
FUND TITLE (IF APPLICABLE) |
|
PORTFOLIO MANAGER
EXPERIENCE IN THE FUND |
|
PRIMARY TITLE
WITH INVESTMENT ADVISER |
|
|
John P. Calamos, Sr. (President, Chairman) |
|
since Fund's inception |
|
Founder, Chairman, and Global CIO |
|
|
Nick Niziolek |
|
since Fund's inception |
|
SVP, Co-Portfolio Manager |
|
|
Dennis Cogan |
|
since Fund's inception |
|
SVP, Co-Portfolio Manager |
|
|
Kyle Ruge |
|
since Fund's inception |
|
VP, Associate Portfolio Manager |
|
|
Paul Ryndak |
|
since Fund's inception |
|
SVP, Associate Portfolio Manager |
|
Other Important Information Regarding Fund Shares
For important information about purchase and sale of Fund shares, tax information, and financial intermediary compensation, please turn to "Other Important Information Regarding Fund Shares" on Page 125 of the prospectus.
PROSPECTUS | March 1, 2024
103
Calamos Total Return Bond Fund
Investment Objective
Calamos Total Return Bond Fund's investment objective is to seek total return, consistent with preservation of capital and prudent investment management.
Fees and Expenses of the Fund
The following table describes the fees and expenses that you may pay if you buy, hold and sell shares of the Fund. Investors may pay other fees, such as brokerage commissions and/or other forms of compensation to a financial intermediary, which are not reflected in the tables or the examples below. You may qualify for sales charge discounts on purchases of Class A shares if you and your family invest, or agree to invest in the future, at least $100,000 in Calamos Funds. More information about these and other discounts is available from your financial professional and under "Fund Facts — What classes of shares do the Funds offer?" on Page 149 of the Fund's prospectus, in the Appendix to this prospectus and "Share Classes and Pricing of Shares" on Page 67 of the Fund's statement of additional information.
Shareholder Fees (fees paid directly from your investment):
|
|
|
CLASS A |
|
CLASS C |
|
CLASS I |
|
|
Maximum Sales Charge (Load) Imposed on Purchases (as a percentage of offering price) |
|
|
2.25 |
% |
|
|
None |
|
|
|
None |
|
|
Maximum Deferred Sales Charge (Load) (as a percentage of the lesser of the redemption price or
offering price) |
|
|
None |
|
|
|
1.00 |
% |
|
|
None |
|
|
Annual Fund Operating Expenses (expenses that you pay each year as a percentage of the value of your investment):
|
|
|
CLASS A |
|
CLASS C |
|
CLASS I |
|
|
Management Fees |
|
|
0.45 |
% |
|
|
0.45 |
% |
|
|
0.45 |
% |
|
|
Distribution and/or Service Fees (12b-1) |
|
|
0.25 |
% |
|
|
1.00 |
% |
|
|
None |
|
|
|
Other Expenses |
|
|
0.54 |
% |
|
|
0.54 |
% |
|
|
0.54 |
% |
|
|
Total Annual Fund Operating Expenses |
|
|
1.24 |
% |
|
|
1.99 |
% |
|
|
0.99 |
% |
|
|
Expense Reimbursement1 |
|
|
(0.34 |
)% |
|
|
(0.34 |
)% |
|
|
(0.34 |
)% |
|
|
Total Annual Fund Operating Expenses After Reimbursement |
|
|
0.90 |
% |
|
|
1.65 |
% |
|
|
0.65 |
% |
|
1
Example
This example is intended to help you compare the cost of investing in the Fund with the cost of investing in other mutual funds. The example assumes that you invest $10,000 in the Fund for the time periods indicated and then either redeem or do not redeem your shares at the end of the reflected time periods. The example also assumes that your investment has a 5% return each year, that all dividends and capital gain distributions are reinvested, that you pay a maximum initial or contingent deferred sales charge and that the Fund's operating expenses remain the same. Any applicable fee waivers and/or expense
CALAMOS FAMILY OF FUNDS
104
Calamos Total Return Bond Fund
reimbursements are reflected in the below examples for the period through March 1, 2025 only. Although your actual performance and costs may be higher or lower, based on these assumptions, your costs would be:
You would pay the following expenses if you redeemed your shares at the end of the period:
|
|
|
One Year |
|
Three Years |
|
Five Years |
|
Ten Years |
|
|
Class A |
|
|
315 |
|
|
|
577 |
|
|
|
859 |
|
|
|
1,662 |
|
|
|
Class C |
|
|
268 |
|
|
|
591 |
|
|
|
1,041 |
|
|
|
2,289 |
|
|
|
Class I |
|
|
66 |
|
|
|
281 |
|
|
|
514 |
|
|
|
1,182 |
|
|
You would pay the following expenses if you did not redeem your shares:
|
|
|
One Year |
|
Three Years |
|
Five Years |
|
Ten Years |
|
|
Class A |
|
|
315 |
|
|
|
577 |
|
|
|
859 |
|
|
|
1,662 |
|
|
|
Class C |
|
|
168 |
|
|
|
591 |
|
|
|
1,041 |
|
|
|
2,289 |
|
|
|
Class I |
|
|
66 |
|
|
|
281 |
|
|
|
514 |
|
|
|
1,182 |
|
|
Portfolio Turnover
The Fund pays transaction costs, such as commissions, when it buys and sells securities (or "turns over" its portfolio). A higher portfolio turnover rate may indicate higher transaction costs and may result in higher taxes when Fund shares are held in a taxable account. These costs, which are not reflected in the annual fund operating expenses or in the example, affect the Fund's performance. During the most recent fiscal year, the Fund's portfolio turnover rate was 41% of the average value of its portfolio.
Principal Investment Strategies
The Fund seeks total return through income earned on the Fund's investments, plus capital appreciation. The Fund seeks to achieve its investment objective by investing, under normal circumstances, at least 80% of its net assets (plus any borrowings) in a diversified portfolio of fixed-income instruments of varying maturities, including derivative instruments with economic characteristics similar to fixed-income instruments. The fixed-income instruments in which the Fund may invest include: securities issued by the U.S. Government, its agencies or government-sponsored enterprises; corporate debt securities of U.S. and non-U.S. issuers, including convertible securities (including synthetic convertible instruments) and corporate commercial paper; mortgage-related and other asset-backed securities; and obligations of non-U.S. governments or their subdivisions, agencies and government- sponsored enterprises. The Fund may invest all of its assets in derivative instruments to gain or reduce exposure to particular securities or segments of the fixed-income markets.
A synthetic convertible instrument is designed to simulate the economic characteristics of a convertible security through the combined features of a debt instrument, or loan, and a security providing an option on an equity security. The Fund may establish a synthetic convertible instrument by combining a fixed-income security with the right to acquire an equity security. The fixed-income and equity option components may have different issuers, and either component may change at any time.
The Fund's dollar-weighted average portfolio duration (a measure of the approximate sensitivity of a fixed-income instrument's value to changes in interest rate) normally varies within a range of three to ten years based on the interest rate forecast of the Fund's investment adviser. The Fund may invest up to 25% of its net assets in high yield debt securities, often referred to as "junk bonds." Junk bonds are securities rated BB or lower by S&P, or Ba or lower by Moody's or securities that are not rated but are considered by the Fund's investment adviser to be of similar quality. The Fund may not acquire debt securities that are rated lower than C. The Fund may invest up to 35% of its net assets in foreign securities. Foreign securities are securities issued by issuers that are organized under the laws of a foreign country or that have a substantial portion of their operations or assets in a foreign country or countries, or that derive a substantial portion of their revenue or profits from businesses, investments or sales outside of the United States. The Fund may also invest in foreign securities that are represented in the United States securities markets by American Depositary Receipts ("ADRs") or similar depository arrangements. The Fund's foreign debt
PROSPECTUS | March 1, 2024
105
Calamos Total Return Bond Fund
investments can be denominated in U.S. dollars or in foreign currencies. Debt securities issued by a foreign government may not be supported by the "full faith and credit" of that government.
The Fund's investment adviser seeks to lower the risks of investing in securities by using a "top-down approach" of diversification by company, industry, sector, country and currency and focusing on macro-level investment themes.
Principal Risks
An investment in the Fund is subject to risks, and you could lose money on your investment in the Fund. There can be no assurance that the Fund will achieve its investment objective. The risks associated with an investment in the Fund can increase during times of significant market volatility. Your investment in the Fund is not a deposit in a bank and is not insured or guaranteed by the Federal Deposit Insurance Corporation or any other government agency. The principal risks are presented in alphabetical order to facilitate finding particular risks and comparing them with other funds. Each risk summarized below is considered a "principal risk" of investing in the Fund, regardless of the order in which it appears. The principal risks of investing in the Fund include:
• Convertible Securities Risk — The value of a convertible security is influenced by changes in interest rates, with investment value declining as interest rates increase and increasing as interest rates decline. The credit standing of the issuer and other factors also may have an effect on the convertible security's investment value.
• Debt Securities Risk — Debt securities are subject to various risks, including interest rate risk, credit risk and default risk.
• Interest Rate Risk — The value of debt securities generally decreases in periods when interest rates are rising. In addition, interest rate changes typically have a greater effect on prices of longer-term debt securities than shorter term debt securities. Changes in interest rates by the Federal Reserve Board, and other events affecting fixed-income markets, may subject a Fund to heightened interest rate risk as a result of a rise in interest rates.
• Credit Risk — A debt security could deteriorate in quality to such an extent that its rating is downgraded or its market value declines relative to comparable securities. Changes in actual or perceived creditworthiness may occur quickly. If the Fund holds securities that have been downgraded, or that default on payment, the Fund's performance could be negatively affected.
• Default Risk — A company that issues a debt security may be unable to fulfill its obligation to repay principal and interest. The lower a bond is rated, the greater its default risk. To the extent the Fund holds securities that have been downgraded, or that default on payment, its performance could be negatively affected.
• Derivatives Risk — Derivatives are instruments, such as futures and forward foreign currency contracts, whose value is derived from that of other assets, rates or indices. The use of derivatives for non-hedging purposes may be considered more speculative than other types of investments. Derivatives can be used for hedging (attempting to reduce risk by offsetting one investment position with another) or non-hedging purposes. Hedging with derivatives may increase expenses, and there is no guarantee that a hedging strategy will work. While hedging can reduce or eliminate losses, it can also reduce or eliminate gains. In addition, derivative instruments are subject to counterparty risk, meaning that the party with whom the Fund enters into the derivatives transaction may experience a significant credit event and/or may be unwilling or unable to make timely settlement payments or otherwise honor its obligations. Changes in the value of a derivative may not correlate perfectly with the underlying asset, rate or index, and the Fund could lose more than the principal amount invested.
• Foreign Securities Risk — Risks associated with investing in foreign securities include fluctuations in the exchange rates of foreign currencies that may affect the U.S. dollar value of a security, the possibility of substantial price volatility as a result of political and economic instability in the foreign country, less public information about issuers of securities, different securities regulation, different accounting, auditing and financial reporting standards and less liquidity than in U.S. markets.
• Futures and Forward Contracts Risk — Futures contracts provide for the future sale by one party and purchase by another of a specific asset at a specific time and price (with or without delivery required). Futures contracts are standardized contracts traded on a recognized exchange. An option on a futures contract gives the purchaser the right, in
CALAMOS FAMILY OF FUNDS
106
Calamos Total Return Bond Fund
exchange for a premium, to assume a position in a futures contract at a specified exercise price during the term of the option. Futures and forward contracts are subject to counterparty risk, meaning that the party with whom the Fund enters into the derivatives transaction (the clearinghouse or the broker holding the Fund's position for a futures contract or the counterparty for a forward contract) may experience a significant credit event and/or may be unwilling or unable to make timely settlement payments or otherwise honor its obligations.
• High Yield Risk — High yield securities and unrated securities of similar credit quality (commonly known as "junk bonds") are subject to greater levels of credit and liquidity risks. High yield securities are considered primarily speculative with respect to the issuer's continuing ability to make principal and interest payments.
• MLP Risk — Investments in securities of MLPs involve risk that differ from investments in common stock, including risks related to limited control and limited rights to vote on matters affecting the MLP, risks related to the potential conflicts of interest between the MLP and the MLP's general partners, cash flow risks, dilution risks and risks related to the general partners right to require unit holders to sell their common units at an undesirable time or price.
• MLP Tax Risk — MLPs generally do not pay federal income tax at the partnership level. Rather, each partner is allocated a share of the partnerships' income, gains, losses, deductions and credits. A change in current tax law, or a change in the underlying business of an MLP, could result in an MLP being treated as a corporation, instead of a partnership, for federal income tax purposes, which would result in such MLP being required to pay income tax on its taxable income. This would have the effect of reducing the amount of cash available for distribution by the MLP, potentially reducing the value of the Fund's investment and consequently your investment in the Fund.
• MLP Liquidity Risk — Although common units of MLPs trade on the NYSE, the NASDAQ and Amex, certain MLP securities trade less frequently than those of larger companies due to their smaller capitalization. As a result, the price of such MLPs may display abrupt and erratic movements at times. Additionally it may be more difficult for the Fund to buy and sell significant amounts of such securities without unfavorable impact on prevailing market process. As a result, these securities may be difficult to dispose of at a fair price when the Adviser desires to do so. This may adversely affect the Fund's ability to take advantage of other market opportunities or make dividend distributions.
• Equity Securities of MLPs Risk — MLP common units, like other equity securities, can be affected by macro-economic and other factors affecting the stock market in general, expectations of interest rates, investor sentiment towards an issuer or certain market sector, changes in a particular issuer's financial condition, or unfavorable or unanticipated poor performance of a particular issuer (in the case of MLPs, generally measured in terms of distributable cash flow). Prices of common units of individual MLPs, like the prices other equity securities, also can be affected by fundamentals unique to the partnership or company, including earnings power and coverage ratios.
• Mortgage-related and Other Asset-backed Securities Risk — In addition to general fixed-income instrument risks, mortgage-related and asset-backed securities are subject to extension risk and prepayment risk.
• Extension Risk — Rising interest rates tend to extend the duration of mortgage-related securities, making them more sensitive to changes in interest rates. As a result, in a period of rising interest rates, if the Fund holds mortgage-related securities, it may exhibit additional volatility.
• Prepayment Risk — When interest rates decline, the value of mortgage-related securities with prepayment features may not increase as much as other fixed-income securities because borrowers may pay off their mortgages sooner than expected. In addition, the potential impact of prepayment on the price of asset-backed and mortgage-backed securities may be difficult to predict and result in greater volatility.
• Non-U.S. Government Obligation Risk — An investment in debt obligations of non-U.S. governments and their political subdivisions involves special risks that are not present in corporate debt obligations. The non-U.S. issuer of the sovereign debt or the non-U.S. governmental authorities that control the repayment of the debt may be unable or unwilling to repay principal or interest when due, and the Fund may have limited recourse in the event of a default. During periods of economic uncertainty, the market prices of sovereign debt may be more volatile than prices of debt obligations of U.S. issuers.
PROSPECTUS | March 1, 2024
107
Calamos Total Return Bond Fund
• Options Risk — The Fund's ability to close out its position as a purchaser or seller of an over-the-counter or exchange- listed put or call option is dependent, in part, upon the liquidity of the options market. There are significant differences between the securities and options markets that could result in an imperfect correlation among these markets, causing a given transaction not to achieve its objectives. The Fund's ability to utilize options successfully will depend on the ability of the Fund's investment adviser to predict pertinent market movements, which cannot be assured.
• Other Investment Companies (including ETFs) Risk — The Fund may invest in the securities of other investment companies to the extent that such investments are consistent with the Fund's investment objective and the policies are permissible under the 1940 Act. Investments in the securities of other investment companies, including ETFs, may involve duplication of advisory fees and certain other expenses. By investing in another investment company or ETF, the Fund becomes a shareholder thereof. As a result, Fund shareholders indirectly bear the Fund's proportionate share of the fees and expenses indirectly paid by shareholders of the other investment company or ETF, in addition to the fees and expenses Fund shareholders bear in connection with the Fund's own operations. If the investment company or ETF fails to achieve its investment objective, the value of the Fund's investment will decline, adversely affecting the Fund's performance. In addition, closed end investment company and ETF shares potentially may trade at a discount or a premium and are subject to brokerage and other trading costs, which could result in greater expenses to the Fund. In addition, the Fund may engage in short sales of the securities of other investment companies. When the Fund shorts securities of another investment company, it borrows shares of that investment company which it then sells. The Fund closes out a short sale by purchasing the security that it has sold short and returning that security to the entity that lent the security.
• Portfolio Selection Risk — The value of your investment may decrease if the investment adviser's judgment about the attractiveness, value or market trends affecting a particular security, issuer, industry or sector or about market movements is incorrect.
• Rule 144A Securities Risk — The Fund may invest in securities that are issued and sold through transactions under Rule 144A of the Securities Act of 1933. Under the supervision of its board of trustees, the Fund will determine whether Rule 144A Securities are illiquid. If qualified institutional buyers are unwilling to purchase these Rule 144A Securities, the percentage of the Fund's assets invested in illiquid securities would increase. Typically, the Fund purchases Rule 144A Securities only if the Fund's adviser has determined them to be liquid. If any Rule 144A Security held by the Fund should become illiquid, the value of the security may be reduced and a sale of the security may be more difficult.
• Securities Lending Risk — The Fund may lend its portfolio securities to broker-dealers and banks in order to generate additional income for the Fund. Any such loan must be continuously secured by collateral in cash or cash equivalents maintained on a current basis in an amount at least equal to the market value of the securities loaned by the Fund. In the event of bankruptcy or other default of a borrower of portfolio securities, the Fund could experience both delays in liquidating the loan collateral or recovering the loaned securities and losses, including (a) possible decline in the value of the collateral or in the value of the securities loaned during the period while the Fund seeks to enforce its rights thereto, (b) possible subnormal levels of income and lack of access to income during this period, and (c) expenses of enforcing its rights. In an effort to reduce these risks, the Fund's securities lending agent monitors, and reports to Calamos Advisors on, the creditworthiness of the firms to which a Fund lends securities. The Fund may also experience losses as a result of a diminution in value of its cash collateral investments.
• Synthetic Convertible Instruments Risk — The value of a synthetic convertible instrument will respond differently to market fluctuations than a convertible security because a synthetic convertible instrument is composed of two or more separate securities, each with its own market value. In addition, if the value of the underlying common stock or the level of the index involved in the convertible component falls below the exercise price of the warrant or option, the warrant or option may lose all value.
• Tax Risk — The federal income tax treatment of convertible securities or other securities in which the Fund may invest may not be clear or may be subject to recharacterization by the Internal Revenue Service. It could be more difficult to comply with the tax requirements applicable to regulated investment companies if the tax characterization of investments or the tax treatment of the income from such investments were successfully challenged by the Internal Revenue Service.
CALAMOS FAMILY OF FUNDS
108
Calamos Total Return Bond Fund
Any such failure to comply with the rules applicable to regulated investment companies could cause the Fund to fail to qualify as such.
• Total Return Swap Risk — A total return swap is a contract in which one party agrees to make periodic payments to another party based on the change in market value of the assets underlying the contract, which may include a specified security, basket of securities, or securities indices during the specified period, in return for periodic payments based on a fixed or variable interest rate or the total return from other underlying assets. Total return swap agreements may be used to obtain exposure to a security or market without owning or taking physical custody of such security or investing directly in such market. Total return swap agreements may effectively add leverage to a fund's portfolio because, in addition to its total net assets, the fund would be subject to investment exposure on the notional amount of the swap. The primary risks associated with total return swaps are credit risk (if the counterparty fails to meet its obligations) and market risk (if there is no liquid market for the agreement or unfavorable changes occur to the underlying asset).
• U.S. Government Security Risk — Some securities issued by U.S. Government agencies or government-sponsored enterprises are not backed by the full faith and credit of the U.S. and may only be supported by the right of the agency or enterprise to borrow from the U.S. Treasury. There can be no assurance that the U.S. Government will always provide financial support to those agencies or enterprises.
Fund Performance
The following bar chart and table indicate the risks of investing in the Fund by showing changes in the Fund's performance from calendar year to calendar year and how the Fund's average annual total returns compare with those of a broad measure of market performance. All returns include the reinvestment of dividends and distributions. As always, please note that the Fund's past performance (before and after taxes) cannot predict how it will perform in the future. Updated performance information is available at no cost by visiting www.calamos.com or by calling 800.582.6959.
CLASS I* ANNUAL TOTAL RETURN FOR YEARS ENDED 12.31
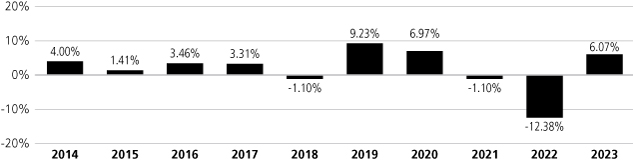
|
Highest Quarterly Return: |
|
|
6.73 |
% (12.31.2023) |
|
Lowest Quarterly Return: |
|
|
-5.72 |
% (6.30.2022) |
|
* Annual returns for Class I are provided because Class I shares represent the largest percentage of assets in the Calamos Family of Funds.
Average Annual Total Returns as of 12.31.23
The following table shows how the Fund's average annual performance (before and after taxes) for the one-, five- and ten-year periods ended December 31, 2023 and since the Fund's inception compared with those of a broad measure of market performance. "Since Inception" returns shown for the index are returns since the inception of the Fund's Class A shares, or since the nearest subsequent month end when comparative index data is available only for full monthly periods. The after-tax returns show the impact of assumed federal income taxes on an investment in the Fund. "Return After Taxes on Distributions" shows the effect of taxable distributions, but assumes that you still hold the Fund shares at the end of the period and so do not have any taxable gain or loss on your investment. "Return After Taxes on Distributions and Sale of Fund Shares" shows the effect of taxable distributions and any taxable gain or loss that would be realized if the Fund shares were purchased at the beginning and sold at the end of the specified period.
PROSPECTUS | March 1, 2024
109
Calamos Total Return Bond Fund
The after-tax returns are shown only for Class I shares, and are calculated using the historical highest individual federal marginal income tax rates and do not reflect the impact of state and local taxes. Actual after-tax returns depend on an investor's tax situation and may differ from those shown, and the after-tax returns shown are not relevant to investors who hold their Fund shares through tax-advantaged arrangements, such as 401(k) plans or individual retirement accounts. After-tax returns for classes other than Class I will vary from returns shown for Class I. "Return After Taxes on Distributions and Sale of Fund Shares" may be higher than other returns for the same period due to a tax benefit of realizing a capital loss on the sale of Fund shares.
AVERAGE ANNUAL TOTAL RETURNS — FOR THE PERIODS ENDED 12.31.23
|
|
|
INCEPTION
DATE OF CLASS |
|
ONE YEAR |
|
FIVE YEAR |
|
TEN YEAR |
|
SINCE
INCEPTION |
|
|
Class A |
|
|
6.27.07 |
|
|
|
|
|
|
|
|
|
|
|
Load Adjusted Return before taxes |
|
|
|
|
3.59 |
% |
|
|
0.72 |
% |
|
|
1.18 |
% |
|
|
2.72 |
% |
|
|
Class C |
|
|
6.27.07 |
|
|
|
|
|
|
|
|
|
|
|
Load Adjusted Return before taxes |
|
|
|
|
4.02 |
% |
|
|
0.41 |
% |
|
|
0.80 |
% |
|
|
2.19 |
% |
|
|
Class I |
|
|
6.27.07 |
|
|
|
|
|
|
|
|
|
|
|
Return before taxes |
|
|
|
|
6.07 |
% |
|
|
1.44 |
% |
|
|
1.82 |
% |
|
|
3.22 |
% |
|
|
Return after taxes on distributions* |
|
|
|
|
4.40 |
% |
|
|
0.17 |
% |
|
|
0.50 |
% |
|
|
1.77 |
% |
|
Return after taxes on distributions and sale of
Fund shares* |
|
|
|
|
3.56 |
% |
|
|
0.60 |
% |
|
|
0.86 |
% |
|
|
1.94 |
% |
|
Bloomberg Capital U.S. Aggregate Bond
Index |
|
|
|
|
5.53 |
% |
|
|
1.10 |
% |
|
|
1.81 |
% |
|
|
3.11 |
% |
|
*
Investment Adviser
Calamos Advisors LLC
PORTFOLIO MANAGER/
FUND TITLE (IF APPLICABLE)
|
|
PORTFOLIO MANAGER
EXPERIENCE IN THE FUND
|
|
PRIMARY TITLE
WITH INVESTMENT ADVISER
|
|
|
John P. Calamos, Sr. (President, Chairman)
|
|
since Fund's inception
|
|
Founder, Chairman, and Global CIO
|
|
|
R. Matthew Freund
|
|
7 years
|
|
SVP, Sr. Co-Portfolio Manager
|
|
|
John Hillenbrand
|
|
15 years
|
|
SVP, Sr. Co-Portfolio Manager
|
|
|
Eli Pars
|
|
10 years
|
|
SVP, Sr. Co-Portfolio Manager
|
|
|
Jon Vacko
|
|
9 years
|
|
SVP, Sr. Co-Portfolio Manager
|
|
|
Chuck Carmody
|
|
8 years
|
|
SVP, Co-Portfolio Manager
|
|
|
Christian Brobst
|
|
3 years
|
|
VP, Co-Portfolio Manager
|
|
Other Important Information Regarding Fund Shares
For important information about purchase and sale of Fund shares, tax information, and financial intermediary compensation, please turn to "Other Important Information Regarding Fund Shares" on Page 125 of the prospectus.
CALAMOS FAMILY OF FUNDS
110
Calamos High Income Opportunities Fund
Investment Objective
Calamos High Income Opportunities Fund's primary objective is the highest level of current income obtainable with reasonable risk. Its secondary objective is capital gain, where consistent with the Fund's primary objective.
Fees and Expenses of the Fund
The following table describes the fees and expenses that you may pay if you buy, hold and sell shares of the Fund. Investors may pay other fees, such as brokerage commissions and/or other forms of compensation to a financial intermediary, which are not reflected in the tables or the examples below. You may qualify for sales charge discounts on purchases of Class A shares if you and your family invest, or agree to invest in the future, at least $100,000 in Calamos Funds. More information about these and other discounts is available from your financial professional and under "Fund Facts — What classes of shares do the Funds offer?" on Page 149 of the Fund's prospectus, in the Appendix to this prospectus and "Share Classes and Pricing of Shares" on Page 67 of the Fund's statement of additional information.
Shareholder Fees (fees paid directly from your investment):
|
|
|
CLASS A |
|
CLASS C |
|
CLASS I |
|
|
Maximum Sales Charge (Load) Imposed on Purchases (as a percentage of offering price) |
|
|
2.25 |
% |
|
|
None |
|
|
|
None |
|
|
Maximum Deferred Sales Charge (Load) (as a percentage of the lesser of the redemption price or
offering price) |
|
|
None |
|
|
|
1.00 |
% |
|
|
None |
|
|
|
Redemption Fee on Shares Held Sixty Days or Less (as a percentage of amount redeemed) |
|
|
1.00 |
% |
|
|
1.00 |
% |
|
|
1.00 |
% |
|
Annual Fund Operating Expenses (expenses that you pay each year as a percentage of the value of your investment):
|
|
|
CLASS A |
|
CLASS C |
|
CLASS I |
|
|
Management Fees |
|
|
0.60 |
% |
|
|
0.60 |
% |
|
|
0.60 |
% |
|
|
Distribution and/or Service Fees (12b-1) |
|
|
0.25 |
% |
|
|
1.00 |
% |
|
|
None |
|
|
|
Other Expenses |
|
|
0.58 |
% |
|
|
0.58 |
% |
|
|
0.58 |
% |
|
|
Total Annual Fund Operating Expenses |
|
|
1.43 |
% |
|
|
2.18 |
% |
|
|
1.18 |
% |
|
|
Expense Reimbursement1 |
|
|
(0.43 |
)% |
|
|
(0.43 |
)% |
|
|
(0.43 |
)% |
|
|
Total Annual Fund Operating Expenses After Reimbursement |
|
|
1.00 |
% |
|
|
1.75 |
% |
|
|
0.75 |
% |
|
1
Example
This example is intended to help you compare the cost of investing in the Fund with the cost of investing in other mutual funds. The example assumes that you invest $10,000 in the Fund for the time periods indicated and then either redeem or do not redeem your shares at the end of the reflected time periods. The example also assumes that your investment has a 5% return each year, that all dividends and capital gain distributions are reinvested, that you pay a maximum initial or contingent deferred sales charge and that the Fund's operating expenses remain the same. Any applicable fee waivers and/or expense
PROSPECTUS | March 1, 2024
111
Calamos High Income Opportunities Fund
reimbursements are reflected in the below examples for the period through March 1, 2025 only. Although your actual performance and costs may be higher or lower, based on these assumptions, your costs would be:
You would pay the following expenses if you redeemed your shares at the end of the period:
|
|
|
One Year |
|
Three Years |
|
Five Years |
|
Ten Years |
|
|
Class A |
|
|
325 |
|
|
|
626 |
|
|
|
949 |
|
|
|
1,863 |
|
|
|
Class C |
|
|
278 |
|
|
|
641 |
|
|
|
1,130 |
|
|
|
2,480 |
|
|
|
Class I |
|
|
77 |
|
|
|
332 |
|
|
|
607 |
|
|
|
1,393 |
|
|
You would pay the following expenses if you did not redeem your shares:
|
|
|
One Year |
|
Three Years |
|
Five Years |
|
Ten Years |
|
|
Class A |
|
|
325 |
|
|
|
626 |
|
|
|
949 |
|
|
|
1,863 |
|
|
|
Class C |
|
|
178 |
|
|
|
641 |
|
|
|
1,130 |
|
|
|
2,480 |
|
|
|
Class I |
|
|
77 |
|
|
|
332 |
|
|
|
607 |
|
|
|
1,393 |
|
|
Portfolio Turnover
The Fund pays transaction costs, such as commissions, when it buys and sells securities (or "turns over" its portfolio). A higher portfolio turnover rate may indicate higher transaction costs and may result in higher taxes when Fund shares are held in a taxable account. These costs, which are not reflected in the annual fund operating expenses or in the example, affect the Fund's performance. During the most recent fiscal year, the Fund's portfolio turnover rate was 25% of the average value of its portfolio.
Principal Investment Strategies
The Fund invests primarily in a diversified portfolio of high yield fixed-income securities (often referred to as "junk bonds") issued by both U.S. and foreign companies. Although not a principal investment strategy, the Fund may invest in securities of issuers in emerging markets to a significant extent.
The high yield fixed-income securities in which the Fund intends to invest have lower credit ratings than investment grade securities (those rated BBB or higher by S&P, or Baa or higher by Moody's). However, junk bonds typically offer a significantly higher yield, as well as greater risks, than investment grade securities. S&P's and Moody's ratings are used only as preliminary indicators of investment quality. The Fund also uses its own credit research and analysis. The Fund's investment adviser seeks to lower the risks of investing in stocks by using a "top-down approach" of diversification by company, industry, sector, country and currency and focusing on macro-level investment themes, such as large-scale events on the country-wide, continental and global scale, implementing opportunistic investment strategies to capitalize on geopolitical trends.
The Fund may invest in both convertible (including synthetic convertible) and non-convertible high yield bonds. Convertible debt securities are exchangeable for equity securities of the issuer at a predetermined price, and typically offer greater appreciation potential than non-convertible debt securities. References in this prospectus to the Fund "investing" in any instrument, security or strategy include direct or indirect investment, including gaining exposure through derivatives, master limited partnerships or other investment companies.
A synthetic convertible instrument is designed to simulate the economic characteristics of a convertible security through the combined features of a debt instrument, or loan, and a security providing an option on an equity security. The Fund may establish a synthetic convertible instrument by combining a fixed-income security with the right to acquire an equity security. The fixed-income and equity option components may have different issuers, and either component may change at any time.
CALAMOS FAMILY OF FUNDS
112
Calamos High Income Opportunities Fund
Principal Risks
An investment in the Fund is subject to risks, and you could lose money on your investment in the Fund. There can be no assurance that the Fund will achieve its investment objective. The risks associated with an investment in the Fund can increase during times of significant market volatility. Your investment in the Fund is not a deposit in a bank and is not insured or guaranteed by the Federal Deposit Insurance Corporation or any other government agency. The principal risks are presented in alphabetical order to facilitate finding particular risks and comparing them with other funds. Each risk summarized below is considered a "principal risk" of investing in the Fund, regardless of the order in which it appears. The principal risks of investing in the Fund include:
• Convertible Securities Risk — The value of a convertible security is influenced by changes in interest rates, with investment value declining as interest rates increase and increasing as interest rates decline. The credit standing of the issuer and other factors also may have an effect on the convertible security's investment value.
• Debt Securities Risk — Debt securities are subject to various risks, including interest rate risk, credit risk and default risk.
• Interest Rate Risk — The value of debt securities generally decreases in periods when interest rates are rising. In addition, interest rate changes typically have a greater effect on prices of longer-term debt securities than shorter term debt securities. Changes in interest rates by the Federal Reserve Board, and other events affecting fixed-income markets, may subject a Fund to heightened interest rate risk as a result of a rise in interest rates.
• Credit Risk — A debt security could deteriorate in quality to such an extent that its rating is downgraded or its market value declines relative to comparable securities. Changes in actual or perceived creditworthiness may occur quickly. If the Fund holds securities that have been downgraded, or that default on payment, the Fund's performance could be negatively affected.
• Default Risk — A company that issues a debt security may be unable to fulfill its obligation to repay principal and interest. The lower a bond is rated, the greater its default risk. To the extent the Fund holds securities that have been downgraded, or that default on payment, its performance could be negatively affected.
• Derivatives Risk — Derivatives are instruments, such as futures and forward foreign currency contracts, whose value is derived from that of other assets, rates or indices. The use of derivatives for non-hedging purposes may be considered more speculative than other types of investments. Derivatives can be used for hedging (attempting to reduce risk by offsetting one investment position with another) or non-hedging purposes. Hedging with derivatives may increase expenses, and there is no guarantee that a hedging strategy will work. While hedging can reduce or eliminate losses, it can also reduce or eliminate gains. In addition, derivative instruments are subject to counterparty risk, meaning that the party with whom the Fund enters into the derivatives transaction may experience a significant credit event and/or may be unwilling or unable to make timely settlement payments or otherwise honor its obligations. Changes in the value of a derivative may not correlate perfectly with the underlying asset, rate or index, and the Fund could lose more than the principal amount invested.
• Emerging Markets Risk — Emerging market countries may have relatively unstable governments and economies based on only a few industries, which may cause greater instability. The value of emerging market securities will likely be particularly sensitive to changes in the economies of such countries. These countries are also more likely to experience higher levels of inflation, deflation or currency devaluations, which could hurt their economies and securities markets.
• Equity Securities Risk — The securities markets are volatile, and the market prices of the Fund's securities may decline generally. The price of equity securities fluctuates based on changes in a company's financial condition and overall market and economic conditions. If the market prices of the securities owned by the Fund fall, the value of your investment in the Fund will decline.
• Foreign Securities Risk — There are special risks associated with investing in foreign securities that are not typically associated with investing in U.S. companies. These risks include fluctuations in the exchange rates of foreign currencies that may affect the U.S. dollar value of a security, and the possibility of substantial price volatility as a result of political and economic instability in the foreign country. Other risks of investing in foreign securities include: less public information about issuers of securities, different securities regulation, different accounting, auditing and financial reporting standards and less liquidity in foreign markets than in U.S. markets.
PROSPECTUS | March 1, 2024
113
Calamos High Income Opportunities Fund
• Futures and Forward Contracts Risk — Futures contracts provide for the future sale by one party and purchase by another of a specific asset at a specific time and price (with or without delivery required). Futures contracts are standardized contracts traded on a recognized exchange. An option on a futures contract gives the purchaser the right, in exchange for a premium, to assume a position in a futures contract at a specified exercise price during the term of the option. Futures and forward contracts are subject to counterparty risk, meaning that the party with whom the Fund enters into the derivatives transaction (the clearinghouse or the broker holding the Fund's position for a futures contract or the counterparty for a forward contract) may experience a significant credit event and/or may be unwilling or unable to make timely settlement payments or otherwise honor its obligations.
• High Yield Risk — High yield securities and unrated securities of similar credit quality (commonly known as "junk bonds") are subject to greater levels of credit and liquidity risks. High yield securities are considered primarily speculative with respect to the issuer's continuing ability to make principal and interest payments.
• MLP Risk — Investments in securities of MLPs involve risk that differ from investments in common stock, including risks related to limited control and limited rights to vote on matters affecting the MLP, risks related to the potential conflicts of interest between the MLP and the MLP's general partners, cash flow risks, dilution risks and risks related to the general partners right to require unit holders to sell their common units at an undesirable time or price.
• MLP Tax Risk — MLPs generally do not pay federal income tax at the partnership level. Rather, each partner is allocated a share of the partnerships' income, gains, losses, deductions and credits. A change in current tax law, or a change in the underlying business of an MLP, could result in an MLP being treated as a corporation, instead of a partnership, for federal income tax purposes, which would result in such MLP being required to pay income tax on its taxable income. This would have the effect of reducing the amount of cash available for distribution by the MLP, potentially reducing the value of the Fund's investment and consequently your investment in the Fund.
• MLP Liquidity Risk — Although common units of MLPs trade on the NYSE, the NASDAQ and Amex, certain MLP securities trade less frequently than those of larger companies due to their smaller capitalization. As a result, the price of such MLPs may display abrupt and erratic movements at times. Additionally it may be more difficult for the Fund to buy and sell significant amounts of such securities without unfavorable impact on prevailing market process. As a result, these securities may be difficult to dispose of at a fair price when the Adviser desires to do so. This may adversely affect the Fund's ability to take advantage of other market opportunities or make dividend distributions.
• Equity Securities of MLPs Risk — MLP common units, like other equity securities, can be affected by macro-economic and other factors affecting the stock market in general, expectations of interest rates, investor sentiment towards an issuer or certain market sector, changes in a particular issuer's financial condition, or unfavorable or unanticipated poor performance of a particular issuer (in the case of MLPs, generally measured in terms of distributable cash flow). Prices of common units of individual MLPs, like the prices other equity securities, also can be affected by fundamentals unique to the partnership or company, including earnings power and coverage ratios.
• Mortgage-related and Other Asset-backed Securities Risk — In addition to general fixed-income instrument risks, mortgage-related and asset-backed securities are subject to extension risk and prepayment risk.
• Extension Risk — Rising interest rates tend to extend the duration of mortgage-related securities, making them more sensitive to changes in interest rates. As a result, in a period of rising interest rates, if the Fund holds mortgage-related securities, it may exhibit additional volatility.
• Prepayment Risk — When interest rates decline, the value of mortgage-related securities with prepayment features may not increase as much as other fixed-income securities because borrowers may pay off their mortgages sooner than expected. In addition, the potential impact of prepayment on the price of asset-backed and mortgage-backed securities may be difficult to predict and result in greater volatility.
• Options Risk — There are significant differences between the securities and options markets that could result in an imperfect correlation among these markets, causing a given transaction not to achieve its objectives. The Fund's ability to utilize options successfully will depend on Calamos Advisors' ability to predict pertinent market movements, which cannot be assured.
CALAMOS FAMILY OF FUNDS
114
Calamos High Income Opportunities Fund
• Other Investment Companies (including ETFs) Risk — The Fund may invest in the securities of other investment companies to the extent that such investments are consistent with the Fund's investment objective and the policies are permissible under the 1940 Act. Investments in the securities of other investment companies, including ETFs, may involve duplication of advisory fees and certain other expenses. By investing in another investment company or ETF, the Fund becomes a shareholder thereof. As a result, Fund shareholders indirectly bear the Fund's proportionate share of the fees and expenses indirectly paid by shareholders of the other investment company or ETF, in addition to the fees and expenses Fund shareholders bear in connection with the Fund's own operations. If the investment company or ETF fails to achieve its investment objective, the value of the Fund's investment will decline, adversely affecting the Fund's performance. In addition, closed end investment company and ETF shares potentially may trade at a discount or a premium and are subject to brokerage and other trading costs, which could result in greater expenses to the Fund. In addition, the Fund may engage in short sales of the securities of other investment companies. When the Fund shorts securities of another investment company, it borrows shares of that investment company which it then sells. The Fund closes out a short sale by purchasing the security that it has sold short and returning that security to the entity that lent the security.
• Portfolio Selection Risk — The value of your investment may decrease if the investment adviser's judgment about the attractiveness, value or market trends affecting a particular security, issuer, industry, or sector or about market movements is incorrect.
• RIC Qualification Risk — To qualify for treatment as a regulated investment company ("RIC") under the Code, the Fund must meet certain income source, asset diversification and annual distribution requirements. The Fund's MLP investments may make it more difficult for the Fund to meet these requirements. The asset diversification requirements include a requirement that, at the end of each quarter of each taxable year, not more than 25% of the value of the Fund's total assets is invested in the securities (including debt securities) of one or more qualified publicly traded partnerships. The Fund anticipates that the MLPs in which it invests will be qualified publicly traded partnerships. If the Fund's MLP investments exceed this 25% limitation then the Fund would not satisfy the diversification requirements and could fail to qualify as a RIC. If, in any year, the Fund fails to qualify as a RIC for any reason, the Fund would be taxed as an ordinary corporation and would become (or remain) subject to corporate income tax. The resulting corporate taxes could substantially reduce the Fund's net assets, the amount of income available for distribution and the amount of Fund distributions.
• Rule 144A Securities Risk — The Fund may invest in securities that are issued and sold through transactions under Rule 144A of the Securities Act of 1933. Under the supervision of its board of trustees, the Fund will determine whether Rule 144A Securities are illiquid. If qualified institutional buyers are unwilling to purchase these Rule 144A Securities, the percentage of the Fund's assets invested in illiquid securities would increase. Typically, the Fund purchases Rule 144A Securities only if the Fund's adviser has determined them to be liquid. If any Rule 144A Security held by the Fund should become illiquid, the value of the security may be reduced and a sale of the security may be more difficult.
• Securities Lending Risk — The Fund may lend its portfolio securities to broker-dealers and banks in order to generate additional income for the Fund. Any such loan must be continuously secured by collateral in cash or cash equivalents maintained on a current basis in an amount at least equal to the market value of the securities loaned by the Fund. In the event of bankruptcy or other default of a borrower of portfolio securities, the Fund could experience both delays in liquidating the loan collateral or recovering the loaned securities and losses, including (a) possible decline in the value of the collateral or in the value of the securities loaned during the period while the Fund seeks to enforce its rights thereto, (b) possible subnormal levels of income and lack of access to income during this period, and (c) expenses of enforcing its rights. In an effort to reduce these risks, the Fund's securities lending agent monitors, and reports to Calamos Advisors on, the creditworthiness of the firms to which a Fund lends securities. The Fund may also experience losses as a result of a diminution in value of its cash collateral investments.
• Synthetic Convertible Instruments Risk — The value of a synthetic convertible instrument will respond differently to market fluctuations than a convertible security because a synthetic convertible instrument is composed of two or more separate securities, each with its own market value. In addition, if the value of the underlying common stock or the level of the index involved in the convertible component falls below the exercise price of the warrant or option, the warrant or option may lose all value.
PROSPECTUS | March 1, 2024
115
Calamos High Income Opportunities Fund
• Tax Risk — The federal income tax treatment of convertible securities or other securities in which the Fund may invest may not be clear or may be subject to recharacterization by the Internal Revenue Service. It could be more difficult to comply with the tax requirements applicable to RICs if the tax characterization of investments or the tax treatment of the income from such investments were successfully challenged by the Internal Revenue Service. Any such failure to comply with the rules applicable to RICs could cause the Fund to fail to qualify as such.
• U.S. Government Security Risk — Some securities issued by U.S. Government agencies or government sponsored enterprises are not backed by the full faith and credit of the U.S. and may only be supported by the right of the agency or enterprise to borrow from the U.S. Treasury. There can be no assurance that the U.S. Government will always provide financial support to those agencies or enterprises.
Fund Performance
The following bar chart and table indicate the risks of investing in the Fund by showing changes in the Fund's performance from calendar year to calendar year and how the Fund's average annual total returns compare with those of a broad measure of market performance. All returns include the reinvestment of dividends and distributions. As always, please note that the Fund's past performance (before and after taxes) cannot predict how it will perform in the future. Updated performance information is available at no cost by visiting www.calamos.com or by calling 800.582.6959.
CLASS I* ANNUAL TOTAL RETURN FOR YEARS ENDED 12.31

|
Highest Quarterly Return: |
|
|
10.21 |
% (6.30.2020) |
|
Lowest Quarterly Return: |
|
|
-15.13 |
% (3.31.2020) |
|
* Annual returns for Class I are provided because Class I shares represent the largest percentage of assets in the Calamos Family of Funds.
Average Annual Total Returns as of 12.31.23
The following table shows how the Fund's average annual performance (before and after taxes) for the one-, five- and ten-year periods ended December 31, 2023 and since the Fund's inception compared with broad measures of market performance. "Since Inception" returns shown for the index are returns since the inception of the Fund's Class A shares, or since the nearest subsequent month end when comparative index data is available only for full monthly periods. The after-tax returns show the impact of assumed federal income taxes on an investment in the Fund. "Return After Taxes on Distributions" shows the effect of taxable distributions, but assumes that you still hold the Fund shares at the end of the period and so do not have any taxable gain or loss on your investment. "Return After Taxes on Distributions and Sale of Fund Shares" shows the effect of taxable distributions and any taxable gain or loss that would be realized if the Fund shares were purchased at the beginning and sold at the end of the specified period.
The after-tax returns are shown only for Class I shares, and are calculated using the historical highest individual federal marginal income tax rates and do not reflect the impact of state and local taxes. Actual after-tax returns depend on an investor's tax situation and may differ from those shown, and the after-tax returns shown are not relevant to investors who hold their Fund shares through tax-advantaged arrangements, such as 401(k) plans or individual retirement accounts. After-tax returns for classes other than Class I will vary from returns shown for Class I. "Return After Taxes on Distributions and Sale of Fund Shares" may be higher than other returns for the same period due to a tax benefit of realizing a capital loss on the sale of Fund shares.
CALAMOS FAMILY OF FUNDS
116
Calamos High Income Opportunities Fund
AVERAGE ANNUAL TOTAL RETURNS — FOR THE PERIODS ENDED 12.31.23
|
|
|
INCEPTION
DATE OF CLASS |
|
ONE YEAR |
|
FIVE YEAR |
|
TEN YEAR |
|
SINCE
INCEPTION |
|
|
Class A |
|
|
8.2.99 |
|
|
|
|
|
|
|
|
|
|
|
Load Adjusted Return before taxes |
|
|
|
|
9.69 |
% |
|
|
4.63 |
% |
|
|
2.92 |
% |
|
|
5.26 |
% |
|
|
Class C |
|
|
12.21.00 |
|
|
|
|
|
|
|
|
|
|
|
Load Adjusted Return before taxes |
|
|
|
|
10.39 |
% |
|
|
4.31 |
% |
|
|
2.65 |
% |
|
|
5.12 |
% |
|
|
Class I |
|
|
3.1.02 |
|
|
|
|
|
|
|
|
|
|
|
Return before taxes |
|
|
|
|
12.52 |
% |
|
|
5.36 |
% |
|
|
3.69 |
% |
|
|
5.85 |
% |
|
|
Return after taxes on distributions* |
|
|
|
|
9.48 |
% |
|
|
3.05 |
% |
|
|
1.25 |
% |
|
|
3.34 |
% |
|
Return after taxes on distributions and sale of
Fund shares* |
|
|
|
|
7.30 |
% |
|
|
3.12 |
% |
|
|
1.72 |
% |
|
|
3.57 |
% |
|
Bloomberg U.S. Corporate High Yield 2%
Issuer Capped Index |
|
|
|
|
13.44 |
% |
|
|
5.35 |
% |
|
|
4.59 |
% |
|
|
7.27 |
% |
|
*
Investment Adviser
Calamos Advisors LLC
PORTFOLIO MANAGER/
FUND TITLE (IF APPLICABLE) |
|
PORTFOLIO MANAGER
EXPERIENCE IN THE FUND |
|
PRIMARY TITLE
WITH INVESTMENT ADVISER |
|
|
John P. Calamos, Sr. (President, Chairman) |
|
since Fund's inception |
|
Founder, Chairman, and Global CIO |
|
|
R. Matthew Freund |
|
7 years |
|
SVP, Sr. Co-Portfolio Manager |
|
|
John Hillenbrand |
|
20 years |
|
SVP, Sr. Co-Portfolio Manager |
|
|
Eli Pars |
|
10 years |
|
SVP, Sr. Co-Portfolio Manager |
|
|
Jon Vacko |
|
9 years |
|
SVP, Sr. Co-Portfolio Manager |
|
|
Chuck Carmody |
|
8 years |
|
SVP, Co-Portfolio Manager |
|
Other Important Information Regarding Fund Shares
For important information about purchase and sale of Fund shares, tax information, and financial intermediary compensation, please turn to "Other Important Information Regarding Fund Shares" on Page 125 of the prospectus.
PROSPECTUS | March 1, 2024
117
Calamos Short-Term Bond Fund
Investment Objective
Calamos Short-Term Bond Fund's investment objective is a high level of current income consistent with preservation of principal.
Fees and Expenses of the Fund
The following table describes the fees and expenses that you may pay if you buy, hold and sell shares of the Fund. Investors may pay other fees, such as brokerage commissions and/or other forms of compensation to a financial intermediary, which are not reflected in the tables or the examples below. You may qualify for sales charge discounts on purchases of Class A shares if you and your family invest, or agree to invest in the future, at least $100,000 in Calamos Funds. More information about these and other discounts is available from your financial professional and under "Fund Facts — What classes of shares do the Funds offer?" on Page 149 of the Fund's prospectus, in the Appendix to this prospectus and "Share Classes and Pricing of Shares" on Page 67 of the Fund's statement of additional information.
Shareholder Fees (fees paid directly from your investment):
|
|
|
CLASS A |
|
CLASS I |
|
|
Maximum Sales Charge (Load) Imposed on Purchases (as a percentage of offering price) |
|
|
2.25 |
% |
|
|
None |
|
|
|
Maximum Deferred Sales Charge (Load) (as a percentage of the lesser of the redemption price or offering price) |
|
|
None |
|
|
|
None |
|
|
Annual Fund Operating Expenses (expenses that you pay each year as a percentage of the value of your investment):
|
|
|
CLASS A
|
|
CLASS I
|
|
|
Management Fees
|
|
|
0.30
|
%
|
|
|
0.30
|
%
|
|
|
Distribution and/or Service Fees (12b-1)
|
|
|
0.25
|
%
|
|
|
None
|
|
|
|
Other Expenses
|
|
|
0.09
|
%
|
|
|
0.09
|
%
|
|
|
Total Annual Fund Operating Expenses
|
|
|
0.64
|
%
|
|
|
0.39
|
%
|
|
Example
This example is intended to help you compare the cost of investing in the Fund with the cost of investing in other mutual funds. The example assumes that you invest $10,000 in the Fund for the time periods indicated and then either redeem or do not redeem your shares at the end of the reflected time periods. The example also assumes that your investment has a 5% return each year that all dividends and capital gain distributions are reinvested, that you pay a maximum initial or contingent deferred sales charge and that the Fund's operating expenses remain the same. Any applicable fee waivers and/or expense reimbursements are reflected in the below examples for the period through March 1, 2025 only. Although your actual performance and costs may be higher or lower, based on these assumptions, your costs would be:
You would pay the following expenses whether or not you redeemed your shares at the end of the period:
|
|
|
One Year |
|
Three Years |
|
Five Years |
|
Ten Years |
|
|
Class A |
|
|
289 |
|
|
|
425 |
|
|
|
574 |
|
|
|
1,005 |
|
|
|
Class I |
|
|
40 |
|
|
|
125 |
|
|
|
219 |
|
|
|
493 |
|
|
Portfolio Turnover
The Fund pays transaction costs, such as commissions, when it buys and sells securities (or "turns over" its portfolio). A higher portfolio turnover rate may indicate higher transaction costs and may result in higher taxes when Fund shares are held in a taxable account. These costs, which are not reflected in the annual fund operating expenses or in the example, affect the Fund's performance. During the most recent fiscal year, the Fund's portfolio turnover rate was 41% of the average value of its portfolio.
CALAMOS FAMILY OF FUNDS
118
Calamos Short-Term Bond Fund
Principal Investment Strategies
The Fund normally invests at least 80% of its net assets (plus any borrowings for investment purposes) in a broad range of investment grade debt securities that have a dollar weighted average portfolio maturity of three years or less. The debt securities in which the Fund may invest include, among others, obligations of U.S., state, and local governments, their agencies and instrumentalities; mortgage- and asset-backed debt securities (including TBAs); corporate debt securities, repurchase agreements, convertible securities, money market instruments, Treasury Bills, and other securities believed to have debt-like characteristics (such as preferred securities and corporate loans and related assignments and participations). The Fund's 80% policy may be changed upon at least 60 days' written notice to shareholders.
The Fund will invest primarily in investment grade debt securities (those rated BBB or higher by S&P, or Baa or higher by Moody's), which include securities issued or guaranteed by the U.S. government, its agencies and instrumentalities, as well as securities rated or subject to a guarantee that is rated within the investment grade categories listed by at least one of the Nationally Recognized Statistical Rating Organizations (NRSROs). In addition, the Fund may invest up to 20% of its net assets in below investment grade debt securities, which are sometimes referred to as high yield or "junk" bonds, which include bonds, bank loans and preferred securities. Junk bonds are securities rated BB or lower by S&P, or Ba or lower by Moody's or securities that are not rated but are considered by the Fund's investment adviser to be of similar quality. The Fund may not acquire debt securities that are rated lower than C.
Convertible debt securities are exchangeable for equity securities of the issuer at a predetermined price, and typically offer greater appreciation potential than non-convertible debt securities. The convertible securities in which the Fund may invest consist of bonds, structured notes, debentures and preferred stocks, which may be converted or exchanged at a stated or determinable exchange ratio into underlying shares. Structured notes are fixed-income debentures linked to equity and the structured notes invested in by the Fund will not be customized for the Fund. Convertible structured notes have the attributes of a convertible security, however, the investment bank that issued the convertible note assumes the credit risk associated with the investment, rather than the issuer of the underlying common stock into which the note is convertible. The bonds, structured notes and debentures may be rated investment grade or below, may be issued by corporates, governments or public international bodies and may be denominated in a variety of currencies and issued with either fixed or floating rates. Convertible securities may offer higher income than the shares into which they are convertible. The Fund may be required to permit the issuer of a convertible security to redeem the security, convert it into the underlying shares or sell it to a third party. Convertible securities include debt obligations and preferred stock of the company issuing the security, which may be exchanged for a predetermined price (the conversion price), into the issuer's common stock.
Certain convertible debt securities include a "put option" which entitles the Fund to sell the security to the issuer before maturity at a stated price, which may represent a premium over the stated principal amount of the debt security. Conversely many convertible securities are issued with a "call" feature that allows the security's issuers to choose when to redeem the security.
The debt securities described above may include mortgage-backed, mortgage-related and other asset-backed securities, which directly or indirectly represent a participation in, or are secured by and payable from, mortgage loans, real property, or other assets such as car loans or aviation financing.
The investment adviser searches for securities that represent value at the time of purchase given current market conditions. Value is a combination of yield, credit quality, structure (maturity, coupon, redemption features), and liquidity. The investment adviser recognizes value by simultaneously analyzing the interaction of these factors among the securities available in the market. As part of its security strategy, the investment adviser also evaluates whether environmental, social and governance factors could have a material negative or positive impact on the cash flows or risk profiles of many companies in the universe in which the Fund may invest. These determinations may not be conclusive and securities of issuers that may be negatively impacted by such factors may be purchased and retained by the Fund while the Fund may divest or not invest in securities of issuers that may be positively impacted by such factors. The investment adviser will sell a security if it becomes concerned about its credit risk, is forced by market factors to raise money, or an attractive replacement is available.
PROSPECTUS | March 1, 2024
119
Calamos Short-Term Bond Fund
Pending investment or re-investment or, at any time, for temporary defensive purposes, the Fund may hold up to 100% of its net assets in cash, money market funds and cash equivalent securities. The Fund may invest up to 20% of its net assets in non-U.S. debt securities, including non-dollar denominated debt securities and emerging markets securities.
The Fund may use derivative instruments such as futures, options, forwards, swaps (including currency swaps, interest rate swaps, credit default swaps, credit default index swaps, and total return swaps), and equity-linked structured notes for risk management purposes or as part of the Fund's investment strategies. The Fund may also invest in ETFs.
Principal Risks
An investment in the Fund is subject to risks, and you could lose money on your investment in the Fund. There can be no assurance that the Fund will achieve its investment objective. The risks associated with an investment in the Fund can increase during times of significant market volatility. Your investment in the Fund is not a deposit in a bank and is not insured or guaranteed by the Federal Deposit Insurance Corporation or any other government agency. The principal risks are presented in alphabetical order to facilitate finding particular risks and comparing them with other funds. Each risk summarized below is considered a "principal risk" of investing in the Fund, regardless of the order in which it appears. The principal risks of investing in the Fund include:
• Cash Holdings Risk — To the extent the Fund holds cash positions, the Fund risks achieving lower returns and potential lost opportunities to participate in market appreciation which could negatively impact the Fund's performance and ability to achieve its investment objective.
• Convertible Securities Risk — The value of a convertible security is influenced by changes in interest rates, with investment value declining as interest rates increase and increasing as interest rates decline. The credit standing of the issuer and other factors also may have an effect on the convertible security's investment value.
• Currency Risk — To the extent that the Fund invests in securities or other instruments denominated in or indexed to foreign currencies, changes in currency exchange rates bring an added dimension of risk. Currency fluctuations could negatively impact investment gains or add to investment losses. Although the Fund may attempt to hedge against currency risk, the hedging instruments may not always perform as the Fund expects and could produce losses. Suitable hedging instruments may not be available for currencies of emerging market countries. The Fund's investment adviser may determine not to hedge currency risks, even if suitable instruments appear to be available.
• Debt Securities Risk — Debt securities are subject to various risks, including interest rate risk, credit risk and default risk.
• Interest Rate Risk — The value of debt securities generally decreases in periods when interest rates are rising. In addition, interest rate changes typically have a greater effect on prices of longer-term debt securities than shorter term debt securities. Changes in interest rates by the Federal Reserve Board, and other events affecting fixed-income markets, may subject a Fund to heightened interest rate risk as a result of a rise in interest rates.
• Credit Risk — A debt security could deteriorate in quality to such an extent that its rating is downgraded or its market value declines relative to comparable securities. Changes in actual or perceived creditworthiness may occur quickly. If the Fund holds securities that have been downgraded, or that default on payment, the Fund's performance could be negatively affected.
• Default Risk — A company that issues a debt security may be unable to fulfill its obligation to repay principal and interest. The lower a bond is rated, the greater its default risk. To the extent the Fund holds securities that have been downgraded, or that default on payment, its performance could be negatively affected.
• Derivatives Risk — Derivatives are instruments, such as futures and forward foreign currency contracts, whose value is derived from that of other assets, rates or indices. The Fund may invest in futures for purposes of managing duration. Futures have durations that, in general, are closely related to the duration of the securities that underlie them. Holding long futures may lengthen portfolio duration by approximately the same amount as would holding an equivalent amount of the underlying securities. Short futures, in general, have durations roughly equal to the negative duration of the securities that underlie these positions and generally have the effect of reducing portfolio duration by approximately the same amount as would selling an equivalent amount of the underlying securities. The use of derivatives for non-hedging
CALAMOS FAMILY OF FUNDS
120
Calamos Short-Term Bond Fund
purposes may be considered more speculative than other types of investments. Derivatives can be used for hedging (attempting to reduce risk by offsetting one investment position with another) or non-hedging purposes. Hedging with derivatives may increase expenses, and there is no guarantee that a hedging strategy will work. While hedging can reduce or eliminate losses, it can also reduce or eliminate gains. In addition, derivative instruments are subject to counterparty risk, meaning that the party with whom the Fund enters into the derivatives transaction may experience a significant credit event and/or may be unwilling or unable to make timely settlement payments or otherwise honor its obligations. Changes in the value of a derivative may not correlate perfectly with the underlying asset, rate or index, and the Fund could lose more than the principal amount invested.
• Emerging Markets Risk — Emerging market countries may have relatively unstable governments and economies based on only a few industries, which may cause greater instability. The value of emerging market securities will likely be particularly sensitive to changes in the economies of such countries. These countries are also more likely to experience higher levels of inflation, deflation or currency devaluations, which could hurt their economies and securities markets.
• Foreign Securities Risk — Risks associated with investing in foreign securities include fluctuations in the exchange rates of foreign currencies that may affect the U.S. dollar value of a security, the possibility of substantial price volatility as a result of political and economic instability in the foreign country, less public information about issuers of securities, different securities regulation, different accounting, auditing and financial reporting standards and less liquidity than in U.S. markets.
• High Yield Risk — High yield securities and unrated securities of similar credit quality (commonly known as "junk bonds") are subject to greater levels of credit and liquidity risks. High yield securities are considered primarily speculative with respect to the issuer's continuing ability to make principal and interest payments.
• Large Shareholder Risk — From time to time, shareholders of the Fund (which may include other Calamos funds) may make relatively large redemptions or purchases of fund shares. These transactions may cause the Fund to sell securities or invest additional cash, as the case may be, at disadvantageous prices. Redemptions of a large number of shares also may increase transaction and other costs or have adverse tax consequences for shareholders of the Fund by requiring a sale of portfolio securities. Purchases of a large number of shares may adversely affect the Fund's performance to the extent that it takes time to invest new cash and the Fund maintains a larger cash position than it ordinarily would.
• Mortgage-related and Other Asset-backed Securities Risk — In addition to general fixed-income instrument risks, mortgage-related and asset-backed securities are subject to extension risk and prepayment risk.
• Extension Risk — Rising interest rates tend to extend the duration of mortgage-related securities, making them more sensitive to changes in interest rates. As a result, in a period of rising interest rates, if the Fund holds mortgage-related securities, it may exhibit additional volatility.
• Prepayment Risk — When interest rates decline, the value of mortgage-related securities with prepayment features may not increase as much as other fixed-income securities because borrowers may pay off their mortgages sooner than expected. In addition, the potential impact of prepayment on the price of asset-backed and mortgage-backed securities may be difficult to predict and result in greater volatility.
• Non-U.S. Government Obligation Risk — An investment in debt obligations of non-U.S. governments and their political subdivisions involves special risks that are not present in corporate debt obligations. The non-U.S. issuer of the sovereign debt or the non-U.S. governmental authorities that control the repayment of the debt may be unable or unwilling to repay principal or interest when due, and the Fund may have limited recourse in the event of a default. During periods of economic uncertainty, the market prices of sovereign debt may be more volatile than prices of debt obligations of U.S. issuers.
• Options Risk — The Fund's ability to close out its position as a purchaser or seller of an over-the-counter or exchange- listed put or call option is dependent, in part, upon the liquidity of the options market. There are significant differences between the securities and options markets that could result in an imperfect correlation among these markets, causing a given transaction not to achieve its objectives. The Fund's ability to utilize options successfully will depend on the ability of the Fund's investment adviser to predict pertinent market movements, which cannot be assured.
PROSPECTUS | March 1, 2024
121
Calamos Short-Term Bond Fund
• Other Investment Companies (including ETFs) Risk — The Fund may invest in the securities of other investment companies to the extent that such investments are consistent with the Fund's investment objective and the policies are permissible under the 1940 Act. Investments in the securities of other investment companies, including ETFs, may involve duplication of advisory fees and certain other expenses. By investing in another investment company or ETF, the Fund becomes a shareholder thereof. As a result, Fund shareholders indirectly bear the Fund's proportionate share of the fees and expenses indirectly paid by shareholders of the other investment company or ETF, in addition to the fees and expenses Fund shareholders bear in connection with the Fund's own operations. If the investment company or ETF fails to achieve its investment objective, the value of the Fund's investment will decline, adversely affecting the Fund's performance. In addition, closed end investment company and ETF shares potentially may trade at a discount or a premium and are subject to brokerage and other trading costs, which could result in greater expenses to the Fund. In addition, the Fund may engage in short sales of the securities of other investment companies. When the Fund shorts securities of another investment company, it borrows shares of that investment company which it then sells. The Fund closes out a short sale by purchasing the security that it has sold short and returning that security to the entity that lent the security.
• Portfolio Selection Risk — The value of your investment may decrease if the investment adviser's judgment about the attractiveness, value or market trends affecting a particular security, issuer, industry or sector or about market movements is incorrect.
• Rule 144A Securities Risk — The Fund may invest in securities that are issued and sold through transactions under Rule 144A of the Securities Act of 1933. Under the supervision of its board of trustees, the Fund will determine whether Rule 144A Securities are illiquid. If qualified institutional buyers are unwilling to purchase these Rule 144A Securities, the percentage of the Fund's assets invested in illiquid securities would increase. Typically, the Fund purchases Rule 144A Securities only if the Fund's adviser has determined them to be liquid. If any Rule 144A Security held by the Fund should become illiquid, the value of the security may be reduced and a sale of the security may be more difficult.
• Securities Lending Risk — The Fund may lend its portfolio securities to broker-dealers and banks in order to generate additional income for the Fund. Any such loan must be continuously secured by collateral in cash or cash equivalents maintained on a current basis in an amount at least equal to the market value of the securities loaned by the Fund. In the event of bankruptcy or other default of a borrower of portfolio securities, the Fund could experience both delays in liquidating the loan collateral or recovering the loaned securities and losses, including (a) possible decline in the value of the collateral or in the value of the securities loaned during the period while the Fund seeks to enforce its rights thereto, (b) possible subnormal levels of income and lack of access to income during this period, and (c) expenses of enforcing its rights. In an effort to reduce these risks, the Fund's securities lending agent monitors, and reports to Calamos Advisors on, the creditworthiness of the firms to which a Fund lends securities. The Fund may also experience losses as a result of a diminution in value of its cash collateral investments.
• U.S. Government Security Risk — Some securities issued by U.S. Government agencies or government-sponsored enterprises are not backed by the full faith and credit of the U.S. and may only be supported by the right of the agency or enterprise to borrow from the U.S. Treasury. There can be no assurance that the U.S. Government will always provide financial support to those agencies or enterprises.
Fund Performance
The following bar chart and table indicate the risks of investing in the Fund by showing changes in the Fund's performance from calendar year to calendar year and how the Fund's average annual total returns compare with those of a broad measure of market performance. All returns include the reinvestment of dividends and distributions. As always, please note that the Fund's past performance (before and after taxes) cannot predict how it will perform in the future. Updated performance information is available at no cost by visiting www.calamos.com or by calling 800.582.6959.
CALAMOS FAMILY OF FUNDS
122
Calamos Short-Term Bond Fund
CLASS I* ANNUAL TOTAL RETURN FOR YEARS ENDED 12.31

|
Highest Quarterly Return: |
|
|
3.16 |
% (6.30.2020) |
|
Lowest Quarterly Return: |
|
|
-2.42 |
% (3.31.2022) |
|
* Annual returns for Class I are provided because Class I shares represent the largest percentage of assets in the Calamos Family of Funds.
Average Annual Total Returns as of 12.31.23
The following table shows how the Fund's average annual performance (before and after taxes) for the one-year period ended December 31, 2023 and since the Fund's inception compared with broad measures of market performance. "Since Inception" returns shown for each index are returns since the inception of the Fund's Class A shares, or since the nearest subsequent month end when comparative index data is available only for full monthly periods. The after-tax returns show the impact of assumed federal income taxes on an investment in the Fund. "Return After Taxes on Distributions" shows the effect of taxable distributions, but assumes that you still hold the Fund shares at the end of the period and so do not have any taxable gain or loss on your investment. "Return After Taxes on Distributions and Sale of Fund Shares" shows the effect of taxable distributions and any taxable gain or loss that would be realized if the Fund shares were purchased at the beginning and sold at the end of the specified period.
The after-tax returns are shown only for Class I shares, and are calculated using the historical highest individual federal marginal income tax rates and do not reflect the impact of state and local taxes. Actual after-tax returns depend on an investor's tax situation and may differ from those shown, and the after-tax returns shown are not relevant to investors who hold their Fund shares through tax-advantaged arrangements, such as 401(k) plans or individual retirement accounts. After-tax returns for classes other than Class I will vary from returns shown for Class I. "Return After Taxes on Distributions and Sale of Fund Shares" may be higher than other returns for the same period due to a tax benefit of realizing a capital loss on the sale of Fund shares.
AVERAGE ANNUAL TOTAL RETURNS — FOR THE PERIODS ENDED 12.31.23
|
|
|
INCEPTION
DATE OF CLASS |
|
ONE YEAR |
|
FIVE YEAR |
|
SINCE
INCEPTION |
|
|
Class A |
|
|
9.18.18 |
|
|
|
|
|
|
|
|
|
Load Adjusted Return before taxes |
|
|
|
|
3.09 |
% |
|
|
1.53 |
% |
|
|
1.58 |
% |
|
|
Class I |
|
|
9.18.18 |
|
|
|
|
|
|
|
|
|
Return before taxes |
|
|
|
|
5.68 |
% |
|
|
2.22 |
% |
|
|
2.25 |
% |
|
|
Return after taxes on distributions* |
|
|
|
|
4.00 |
% |
|
|
0.89 |
% |
|
|
0.92 |
% |
|
|
Return after taxes on distributions and sale of Fund shares* |
|
|
|
|
3.34 |
% |
|
|
1.15 |
% |
|
|
1.17 |
% |
|
|
Bloomberg 1-3 Year Government/Credit Index |
|
|
|
|
4.61 |
% |
|
|
1.51 |
% |
|
|
1.67 |
% |
|
|
Bloomberg U.S. 1-3 Year Credit Index |
|
|
|
|
5.28 |
% |
|
|
2.03 |
% |
|
|
2.10 |
% |
|
*
PROSPECTUS | March 1, 2024
123
Calamos Short-Term Bond Fund
The Bloomberg US 1-3 Year Credit Index shows how the Fund's performance compares to an index of investment grade, US dollar-denominated, fixed-rate, taxable corporate and government-related debt with 1 to 3 years to maturity. It is composed of a corporate and a non-corporate component that includes non-US agencies, sovereigns, supranationals and local authorities.
Investment Adviser
Calamos Advisors LLC
PORTFOLIO MANAGER/
FUND TITLE (IF APPLICABLE) |
|
PORTFOLIO MANAGER
EXPERIENCE IN THE FUND |
|
PRIMARY TITLE
WITH INVESTMENT ADVISER |
|
|
John P. Calamos, Sr. (President, Chairman) |
|
since Fund's inception |
|
Founder, Chairman, and Global CIO |
|
|
R. Matthew Freund |
|
since Fund's inception |
|
SVP, Sr. Co-Portfolio Manager |
|
|
Chuck Carmody |
|
since Fund's inception |
|
SVP, Co-Portfolio Manager |
|
|
John Saf |
|
since Fund's inception |
|
VP, Co-Portfolio Manager |
|
|
Christian Brobst |
|
3 years |
|
VP, Co-Portfolio Manager |
|
Other Important Information Regarding Fund Shares
For important information about purchase and sale of Fund shares, tax information, and financial intermediary compensation, please turn to "Other Important Information Regarding Fund Shares" on Page 125 of the prospectus.
CALAMOS FAMILY OF FUNDS
124
~ http://www.calamos.com/20240223/role/ScheduleShareholderFees20001 column dei_LegalEntityAxis compact ck0000826732_S000004062Member row primary compact * ~
~ http://www.calamos.com/20240223/role/ScheduleAnnualFundOperatingExpenses20002 column dei_LegalEntityAxis compact ck0000826732_S000004062Member row primary compact * ~
~ http://www.calamos.com/20240223/role/ScheduleExpenseExampleTransposed20003 column dei_LegalEntityAxis compact ck0000826732_S000004062Member row primary compact * ~
~ http://www.calamos.com/20240223/role/ScheduleExpenseExampleNoRedemptionTransposed20004 column dei_LegalEntityAxis compact ck0000826732_S000004062Member row primary compact * ~
0.0221
0.013
0.0504
0.0475
0.018
0.0673
0.0535
0.0502
0.0426
0.0917
~ http://www.calamos.com/20240223/role/ScheduleAnnualTotalReturnsBarChart20005 column dei_LegalEntityAxis compact ck0000826732_S000004062Member row primary compact * ~
~ http://www.calamos.com/20240223/role/ScheduleAverageAnnualReturnsTransposed20006 column dei_LegalEntityAxis compact ck0000826732_S000004062Member column rr_PerformanceMeasureAxis compact * row primary compact * ~
~ http://www.calamos.com/20240223/role/ScheduleShareholderFees20009 column dei_LegalEntityAxis compact ck0000826732_S000047914Member row primary compact * ~
~ http://www.calamos.com/20240223/role/ScheduleAnnualFundOperatingExpenses20010 column dei_LegalEntityAxis compact ck0000826732_S000047914Member row primary compact * ~
~ http://www.calamos.com/20240223/role/ScheduleExpenseExampleTransposed20011 column dei_LegalEntityAxis compact ck0000826732_S000047914Member row primary compact * ~
~ http://www.calamos.com/20240223/role/ScheduleExpenseExampleNoRedemptionTransposed20012 column dei_LegalEntityAxis compact ck0000826732_S000047914Member row primary compact * ~
0.0076
0.0545
0.0837
0.0089
0.1447
0.0966
0.1331
0.1111
0.1588
~ http://www.calamos.com/20240223/role/ScheduleAnnualTotalReturnsBarChart20013 column dei_LegalEntityAxis compact ck0000826732_S000047914Member row primary compact * ~
~ http://www.calamos.com/20240223/role/ScheduleAverageAnnualReturnsTransposed20014 column dei_LegalEntityAxis compact ck0000826732_S000047914Member column rr_PerformanceMeasureAxis compact * row primary compact * ~
~ http://www.calamos.com/20240223/role/ScheduleShareholderFees20017 column dei_LegalEntityAxis compact ck0000826732_S000052577Member row primary compact * ~
~ http://www.calamos.com/20240223/role/ScheduleAnnualFundOperatingExpenses20018 column dei_LegalEntityAxis compact ck0000826732_S000052577Member row primary compact * ~
~ http://www.calamos.com/20240223/role/ScheduleExpenseExampleTransposed20019 column dei_LegalEntityAxis compact ck0000826732_S000052577Member row primary compact * ~
~ http://www.calamos.com/20240223/role/ScheduleExpenseExampleNoRedemptionTransposed20020 column dei_LegalEntityAxis compact ck0000826732_S000052577Member row primary compact * ~
0.0049
0.0496
0.1289
0.0922
0.0594
0.0397
0.1981
0.0752
0.0096
0.0804
~ http://www.calamos.com/20240223/role/ScheduleAnnualTotalReturnsBarChart20021 column dei_LegalEntityAxis compact ck0000826732_S000052577Member row primary compact * ~
~ http://www.calamos.com/20240223/role/ScheduleAverageAnnualReturnsTransposed20022 column dei_LegalEntityAxis compact ck0000826732_S000052577Member column rr_PerformanceMeasureAxis compact * row primary compact * ~
~ http://www.calamos.com/20240223/role/ScheduleShareholderFees20025 column dei_LegalEntityAxis compact ck0000826732_S000081268Member row primary compact * ~
~ http://www.calamos.com/20240223/role/ScheduleAnnualFundOperatingExpenses20026 column dei_LegalEntityAxis compact ck0000826732_S000081268Member row primary compact * ~
~ http://www.calamos.com/20240223/role/ScheduleExpenseExampleTransposed20027 column dei_LegalEntityAxis compact ck0000826732_S000081268Member row primary compact * ~
~ http://www.calamos.com/20240223/role/ScheduleExpenseExampleNoRedemptionTransposed20028 column dei_LegalEntityAxis compact ck0000826732_S000081268Member row primary compact * ~
~ http://www.calamos.com/20240223/role/ScheduleShareholderFees20031 column dei_LegalEntityAxis compact ck0000826732_S000004060Member row primary compact * ~
~ http://www.calamos.com/20240223/role/ScheduleAnnualFundOperatingExpenses20032 column dei_LegalEntityAxis compact ck0000826732_S000004060Member row primary compact * ~
~ http://www.calamos.com/20240223/role/ScheduleExpenseExampleTransposed20033 column dei_LegalEntityAxis compact ck0000826732_S000004060Member row primary compact * ~
~ http://www.calamos.com/20240223/role/ScheduleExpenseExampleNoRedemptionTransposed20034 column dei_LegalEntityAxis compact ck0000826732_S000004060Member row primary compact * ~
0.0519
0.0362
0.0475
0.1462
0.0072
0.195
0.4877
0.0546
0.2103
0.1092
~ http://www.calamos.com/20240223/role/ScheduleAnnualTotalReturnsBarChart20035 column dei_LegalEntityAxis compact ck0000826732_S000004060Member row primary compact * ~
~ http://www.calamos.com/20240223/role/ScheduleAverageAnnualReturnsTransposed20036 column dei_LegalEntityAxis compact ck0000826732_S000004060Member column rr_PerformanceMeasureAxis compact * row primary compact * ~
~ http://www.calamos.com/20240223/role/ScheduleShareholderFees20039 column dei_LegalEntityAxis compact ck0000826732_S000047913Member row primary compact * ~
~ http://www.calamos.com/20240223/role/ScheduleAnnualFundOperatingExpenses20040 column dei_LegalEntityAxis compact ck0000826732_S000047913Member row primary compact * ~
~ http://www.calamos.com/20240223/role/ScheduleExpenseExampleTransposed20041 column dei_LegalEntityAxis compact ck0000826732_S000047913Member row primary compact * ~
~ http://www.calamos.com/20240223/role/ScheduleExpenseExampleNoRedemptionTransposed20042 column dei_LegalEntityAxis compact ck0000826732_S000047913Member row primary compact * ~
0.0115
0.0372
0.1445
0.0273
0.1518
0.3855
0.0023
0.2206
0.1348
~ http://www.calamos.com/20240223/role/ScheduleAnnualTotalReturnsBarChart20043 column dei_LegalEntityAxis compact ck0000826732_S000047913Member row primary compact * ~
~ http://www.calamos.com/20240223/role/ScheduleAverageAnnualReturnsTransposed20044 column dei_LegalEntityAxis compact ck0000826732_S000047913Member column rr_PerformanceMeasureAxis compact * row primary compact * ~
~ http://www.calamos.com/20240223/role/ScheduleShareholderFees20047 column dei_LegalEntityAxis compact ck0000826732_S000065224Member row primary compact * ~
~ http://www.calamos.com/20240223/role/ScheduleAnnualFundOperatingExpenses20048 column dei_LegalEntityAxis compact ck0000826732_S000065224Member row primary compact * ~
~ http://www.calamos.com/20240223/role/ScheduleExpenseExampleTransposed20049 column dei_LegalEntityAxis compact ck0000826732_S000065224Member row primary compact * ~
~ http://www.calamos.com/20240223/role/ScheduleExpenseExampleNoRedemptionTransposed20050 column dei_LegalEntityAxis compact ck0000826732_S000065224Member row primary compact * ~
0.0055
0.0268
0.0106
0.3614
0.0008
0.2068
0.6327
0.0912
0.3730
0.0757
~ http://www.calamos.com/20240223/role/ScheduleAnnualTotalReturnsBarChart20051 column dei_LegalEntityAxis compact ck0000826732_S000065224Member row primary compact * ~
~ http://www.calamos.com/20240223/role/ScheduleAverageAnnualReturnsTransposed20052 column dei_LegalEntityAxis compact ck0000826732_S000065224Member column rr_PerformanceMeasureAxis compact * row primary compact * ~
~ http://www.calamos.com/20240223/role/ScheduleShareholderFees20055 column dei_LegalEntityAxis compact ck0000826732_S000065991Member row primary compact * ~
~ http://www.calamos.com/20240223/role/ScheduleAnnualFundOperatingExpenses20056 column dei_LegalEntityAxis compact ck0000826732_S000065991Member row primary compact * ~
~ http://www.calamos.com/20240223/role/ScheduleExpenseExampleTransposed20057 column dei_LegalEntityAxis compact ck0000826732_S000065991Member row primary compact * ~
~ http://www.calamos.com/20240223/role/ScheduleExpenseExampleNoRedemptionTransposed20058 column dei_LegalEntityAxis compact ck0000826732_S000065991Member row primary compact * ~
0.5894
0.0789
0.3488
0.1226
~ http://www.calamos.com/20240223/role/ScheduleAnnualTotalReturnsBarChart20059 column dei_LegalEntityAxis compact ck0000826732_S000065991Member row primary compact * ~
~ http://www.calamos.com/20240223/role/ScheduleAverageAnnualReturnsTransposed20060 column dei_LegalEntityAxis compact ck0000826732_S000065991Member column rr_PerformanceMeasureAxis compact * row primary compact * ~
~ http://www.calamos.com/20240223/role/ScheduleShareholderFees20063 column dei_LegalEntityAxis compact ck0000826732_S000004063Member row primary compact * ~
~ http://www.calamos.com/20240223/role/ScheduleAnnualFundOperatingExpenses20064 column dei_LegalEntityAxis compact ck0000826732_S000004063Member row primary compact * ~
~ http://www.calamos.com/20240223/role/ScheduleExpenseExampleTransposed20065 column dei_LegalEntityAxis compact ck0000826732_S000004063Member row primary compact * ~
~ http://www.calamos.com/20240223/role/ScheduleExpenseExampleNoRedemptionTransposed20066 column dei_LegalEntityAxis compact ck0000826732_S000004063Member row primary compact * ~
0.0871
0.0328
0.0191
0.269
0.0564
0.3144
0.3329
0.2357
0.3317
0.3790
~ http://www.calamos.com/20240223/role/ScheduleAnnualTotalReturnsBarChart20067 column dei_LegalEntityAxis compact ck0000826732_S000004063Member row primary compact * ~
~ http://www.calamos.com/20240223/role/ScheduleAverageAnnualReturnsTransposed20068 column dei_LegalEntityAxis compact ck0000826732_S000004063Member column rr_PerformanceMeasureAxis compact * row primary compact * ~
~ http://www.calamos.com/20240223/role/ScheduleShareholderFees20071 column dei_LegalEntityAxis compact ck0000826732_S000004061Member row primary compact * ~
~ http://www.calamos.com/20240223/role/ScheduleAnnualFundOperatingExpenses20072 column dei_LegalEntityAxis compact ck0000826732_S000004061Member row primary compact * ~
~ http://www.calamos.com/20240223/role/ScheduleExpenseExampleTransposed20073 column dei_LegalEntityAxis compact ck0000826732_S000004061Member row primary compact * ~
~ http://www.calamos.com/20240223/role/ScheduleExpenseExampleNoRedemptionTransposed20074 column dei_LegalEntityAxis compact ck0000826732_S000004061Member row primary compact * ~
0.0757
0.0188
0.0747
0.1664
0.0363
0.263
0.2271
0.2142
0.1829
0.2064
~ http://www.calamos.com/20240223/role/ScheduleAnnualTotalReturnsBarChart20075 column dei_LegalEntityAxis compact ck0000826732_S000004061Member row primary compact * ~
~ http://www.calamos.com/20240223/role/ScheduleAverageAnnualReturnsTransposed20076 column dei_LegalEntityAxis compact ck0000826732_S000004061Member column rr_PerformanceMeasureAxis compact * row primary compact * ~
~ http://www.calamos.com/20240223/role/ScheduleShareholderFees20079 column dei_LegalEntityAxis compact ck0000826732_S000041744Member row primary compact * ~
~ http://www.calamos.com/20240223/role/ScheduleAnnualFundOperatingExpenses20080 column dei_LegalEntityAxis compact ck0000826732_S000041744Member row primary compact * ~
~ http://www.calamos.com/20240223/role/ScheduleExpenseExampleTransposed20081 column dei_LegalEntityAxis compact ck0000826732_S000041744Member row primary compact * ~
~ http://www.calamos.com/20240223/role/ScheduleExpenseExampleNoRedemptionTransposed20082 column dei_LegalEntityAxis compact ck0000826732_S000041744Member row primary compact * ~
0.009
0.0028
0.0983
0.2113
0.0466
0.2961
0.1915
0.2753
0.1797
0.2351
~ http://www.calamos.com/20240223/role/ScheduleAnnualTotalReturnsBarChart20083 column dei_LegalEntityAxis compact ck0000826732_S000041744Member row primary compact * ~
~ http://www.calamos.com/20240223/role/ScheduleAverageAnnualReturnsTransposed20084 column dei_LegalEntityAxis compact ck0000826732_S000041744Member column rr_PerformanceMeasureAxis compact * row primary compact * ~
~ http://www.calamos.com/20240223/role/ScheduleShareholderFees20087 column dei_LegalEntityAxis compact ck0000826732_S000004058Member row primary compact * ~
~ http://www.calamos.com/20240223/role/ScheduleAnnualFundOperatingExpenses20088 column dei_LegalEntityAxis compact ck0000826732_S000004058Member row primary compact * ~
~ http://www.calamos.com/20240223/role/ScheduleExpenseExampleTransposed20089 column dei_LegalEntityAxis compact ck0000826732_S000004058Member row primary compact * ~
~ http://www.calamos.com/20240223/role/ScheduleExpenseExampleNoRedemptionTransposed20090 column dei_LegalEntityAxis compact ck0000826732_S000004058Member row primary compact * ~
0.0231
0.0376
0.1175
0.175
0.065
0.2623
0.1655
0.2528
0.1867
0.2673
~ http://www.calamos.com/20240223/role/ScheduleAnnualTotalReturnsBarChart20091 column dei_LegalEntityAxis compact ck0000826732_S000004058Member row primary compact * ~
~ http://www.calamos.com/20240223/role/ScheduleAverageAnnualReturnsTransposed20092 column dei_LegalEntityAxis compact ck0000826732_S000004058Member column rr_PerformanceMeasureAxis compact * row primary compact * ~
~ http://www.calamos.com/20240223/role/ScheduleShareholderFees20095 column dei_LegalEntityAxis compact ck0000826732_S000004065Member row primary compact * ~
~ http://www.calamos.com/20240223/role/ScheduleAnnualFundOperatingExpenses20096 column dei_LegalEntityAxis compact ck0000826732_S000004065Member row primary compact * ~
~ http://www.calamos.com/20240223/role/ScheduleExpenseExampleTransposed20097 column dei_LegalEntityAxis compact ck0000826732_S000004065Member row primary compact * ~
~ http://www.calamos.com/20240223/role/ScheduleExpenseExampleNoRedemptionTransposed20098 column dei_LegalEntityAxis compact ck0000826732_S000004065Member row primary compact * ~
0.0612
0.0299
0.0595
0.3957
0.2088
0.2969
0.4497
0.0703
0.3054
0.1533
~ http://www.calamos.com/20240223/role/ScheduleAnnualTotalReturnsBarChart20099 column dei_LegalEntityAxis compact ck0000826732_S000004065Member row primary compact * ~
~ http://www.calamos.com/20240223/role/ScheduleAverageAnnualReturnsTransposed20100 column dei_LegalEntityAxis compact ck0000826732_S000004065Member column rr_PerformanceMeasureAxis compact * row primary compact * ~
~ http://www.calamos.com/20240223/role/ScheduleShareholderFees20103 column dei_LegalEntityAxis compact ck0000826732_S000022429Member row primary compact * ~
~ http://www.calamos.com/20240223/role/ScheduleAnnualFundOperatingExpenses20104 column dei_LegalEntityAxis compact ck0000826732_S000022429Member row primary compact * ~
~ http://www.calamos.com/20240223/role/ScheduleExpenseExampleTransposed20105 column dei_LegalEntityAxis compact ck0000826732_S000022429Member row primary compact * ~
~ http://www.calamos.com/20240223/role/ScheduleExpenseExampleNoRedemptionTransposed20106 column dei_LegalEntityAxis compact ck0000826732_S000022429Member row primary compact * ~
0.055
0.0841
0.045
0.3697
0.1774
0.2076
0.5424
0.0675
0.2436
0.0659
~ http://www.calamos.com/20240223/role/ScheduleAnnualTotalReturnsBarChart20107 column dei_LegalEntityAxis compact ck0000826732_S000022429Member row primary compact * ~
~ http://www.calamos.com/20240223/role/ScheduleAverageAnnualReturnsTransposed20108 column dei_LegalEntityAxis compact ck0000826732_S000022429Member column rr_PerformanceMeasureAxis compact * row primary compact * ~
~ http://www.calamos.com/20240223/role/ScheduleShareholderFees20111 column dei_LegalEntityAxis compact ck0000826732_S000015914Member row primary compact * ~
~ http://www.calamos.com/20240223/role/ScheduleAnnualFundOperatingExpenses20112 column dei_LegalEntityAxis compact ck0000826732_S000015914Member row primary compact * ~
~ http://www.calamos.com/20240223/role/ScheduleExpenseExampleTransposed20113 column dei_LegalEntityAxis compact ck0000826732_S000015914Member row primary compact * ~
~ http://www.calamos.com/20240223/role/ScheduleExpenseExampleNoRedemptionTransposed20114 column dei_LegalEntityAxis compact ck0000826732_S000015914Member row primary compact * ~
0.009
0.0525
0.0077
0.3476
0.1526
0.2941
0.4424
0.1679
0.2747
0.2454
~ http://www.calamos.com/20240223/role/ScheduleAnnualTotalReturnsBarChart20115 column dei_LegalEntityAxis compact ck0000826732_S000015914Member row primary compact * ~
~ http://www.calamos.com/20240223/role/ScheduleAverageAnnualReturnsTransposed20116 column dei_LegalEntityAxis compact ck0000826732_S000015914Member column rr_PerformanceMeasureAxis compact * row primary compact * ~
~ http://www.calamos.com/20240223/role/ScheduleShareholderFees20119 column dei_LegalEntityAxis compact ck0000826732_S000004064Member row primary compact * ~
~ http://www.calamos.com/20240223/role/ScheduleAnnualFundOperatingExpenses20120 column dei_LegalEntityAxis compact ck0000826732_S000004064Member row primary compact * ~
~ http://www.calamos.com/20240223/role/ScheduleExpenseExampleTransposed20121 column dei_LegalEntityAxis compact ck0000826732_S000004064Member row primary compact * ~
~ http://www.calamos.com/20240223/role/ScheduleExpenseExampleNoRedemptionTransposed20122 column dei_LegalEntityAxis compact ck0000826732_S000004064Member row primary compact * ~
0.0207
0.0102
0.0087
0.2034
0.0949
0.1839
0.3221
0.1600
0.2191
0.1405
~ http://www.calamos.com/20240223/role/ScheduleAnnualTotalReturnsBarChart20123 column dei_LegalEntityAxis compact ck0000826732_S000004064Member row primary compact * ~
~ http://www.calamos.com/20240223/role/ScheduleAverageAnnualReturnsTransposed20124 column dei_LegalEntityAxis compact ck0000826732_S000004064Member column rr_PerformanceMeasureAxis compact * row primary compact * ~
~ http://www.calamos.com/20240223/role/ScheduleShareholderFees20127 column dei_LegalEntityAxis compact ck0000826732_S000075668Member row primary compact * ~
~ http://www.calamos.com/20240223/role/ScheduleAnnualFundOperatingExpenses20128 column dei_LegalEntityAxis compact ck0000826732_S000075668Member row primary compact * ~
~ http://www.calamos.com/20240223/role/ScheduleExpenseExampleTransposed20129 column dei_LegalEntityAxis compact ck0000826732_S000075668Member row primary compact * ~
~ http://www.calamos.com/20240223/role/ScheduleExpenseExampleNoRedemptionTransposed20130 column dei_LegalEntityAxis compact ck0000826732_S000075668Member row primary compact * ~
0.1362
~ http://www.calamos.com/20240223/role/ScheduleAnnualTotalReturnsBarChart20131 column dei_LegalEntityAxis compact ck0000826732_S000075668Member row primary compact * ~
~ http://www.calamos.com/20240223/role/ScheduleAverageAnnualReturnsTransposed20132 column dei_LegalEntityAxis compact ck0000826732_S000075668Member column rr_PerformanceMeasureAxis compact * row primary compact * ~
~ http://www.calamos.com/20240223/role/ScheduleShareholderFees20135 column dei_LegalEntityAxis compact ck0000826732_S000017871Member row primary compact * ~
~ http://www.calamos.com/20240223/role/ScheduleAnnualFundOperatingExpenses20136 column dei_LegalEntityAxis compact ck0000826732_S000017871Member row primary compact * ~
~ http://www.calamos.com/20240223/role/ScheduleExpenseExampleTransposed20137 column dei_LegalEntityAxis compact ck0000826732_S000017871Member row primary compact * ~
~ http://www.calamos.com/20240223/role/ScheduleExpenseExampleNoRedemptionTransposed20138 column dei_LegalEntityAxis compact ck0000826732_S000017871Member row primary compact * ~
0.04
0.0141
0.0346
0.0331
0.011
0.0923
0.0697
0.0110
0.1238
0.0607
~ http://www.calamos.com/20240223/role/ScheduleAnnualTotalReturnsBarChart20139 column dei_LegalEntityAxis compact ck0000826732_S000017871Member row primary compact * ~
~ http://www.calamos.com/20240223/role/ScheduleAverageAnnualReturnsTransposed20140 column dei_LegalEntityAxis compact ck0000826732_S000017871Member column rr_PerformanceMeasureAxis compact * row primary compact * ~
~ http://www.calamos.com/20240223/role/ScheduleShareholderFees20143 column dei_LegalEntityAxis compact ck0000826732_S000004057Member row primary compact * ~
~ http://www.calamos.com/20240223/role/ScheduleAnnualFundOperatingExpenses20144 column dei_LegalEntityAxis compact ck0000826732_S000004057Member row primary compact * ~
~ http://www.calamos.com/20240223/role/ScheduleExpenseExampleTransposed20145 column dei_LegalEntityAxis compact ck0000826732_S000004057Member row primary compact * ~
~ http://www.calamos.com/20240223/role/ScheduleExpenseExampleNoRedemptionTransposed20146 column dei_LegalEntityAxis compact ck0000826732_S000004057Member row primary compact * ~
0.011
0.044
0.1221
0.0631
0.0408
0.1457
0.0504
0.0670
0.1013
0.1252
~ http://www.calamos.com/20240223/role/ScheduleAnnualTotalReturnsBarChart20147 column dei_LegalEntityAxis compact ck0000826732_S000004057Member row primary compact * ~
~ http://www.calamos.com/20240223/role/ScheduleAverageAnnualReturnsTransposed20148 column dei_LegalEntityAxis compact ck0000826732_S000004057Member column rr_PerformanceMeasureAxis compact * row primary compact * ~
~ http://www.calamos.com/20240223/role/ScheduleShareholderFees20151 column dei_LegalEntityAxis compact ck0000826732_S000062995Member row primary compact * ~
~ http://www.calamos.com/20240223/role/ScheduleAnnualFundOperatingExpenses20152 column dei_LegalEntityAxis compact ck0000826732_S000062995Member row primary compact * ~
~ http://www.calamos.com/20240223/role/ScheduleExpenseExampleTransposed20153 column dei_LegalEntityAxis compact ck0000826732_S000062995Member row primary compact * ~
~ http://www.calamos.com/20240223/role/ScheduleExpenseExampleNoRedemptionTransposed20154 column dei_LegalEntityAxis compact ck0000826732_S000062995Member row primary compact * ~
0.0482
0.0405
0.0001
0.0317
0.0568
~ http://www.calamos.com/20240223/role/ScheduleAnnualTotalReturnsBarChart20155 column dei_LegalEntityAxis compact ck0000826732_S000062995Member row primary compact * ~
~ http://www.calamos.com/20240223/role/ScheduleAverageAnnualReturnsTransposed20156 column dei_LegalEntityAxis compact ck0000826732_S000062995Member column rr_PerformanceMeasureAxis compact * row primary compact * ~
1990-09-04
1985-06-21
1996-07-05
1997-06-25
1996-09-03
1990-09-04
1997-09-18
1996-08-05
1997-09-18
1988-09-22
1996-09-09
1996-09-24
1997-09-18
1999-08-02
false
2023-10-31
485BPOS
0000826732
2025-03-01
0000826732
2024-02-23
2024-02-23
0000826732
ck0000826732:S000004062Member
2024-02-23
2024-02-23
0000826732
ck0000826732:S000004062Member
ck0000826732:C000220408Member
2024-02-23
2024-02-23
0000826732
ck0000826732:S000004062Member
ck0000826732:C000011366Member
2024-02-23
2024-02-23
0000826732
ck0000826732:S000004062Member
ck0000826732:C000011368Member
2024-02-23
2024-02-23
0000826732
ck0000826732:S000004062Member
ck0000826732:C000011369Member
2024-02-23
2024-02-23
0000826732
rr:RiskNotInsuredMember
ck0000826732:S000004062Member
2024-02-23
2024-02-23
0000826732
rr:RiskLoseMoneyMember
ck0000826732:S000004062Member
2024-02-23
2024-02-23
0000826732
ck0000826732:ConvertibleHedgingRiskMember
ck0000826732:S000004062Member
2024-02-23
2024-02-23
0000826732
ck0000826732:ConvertibleSecuritiesRiskMember
ck0000826732:S000004062Member
2024-02-23
2024-02-23
0000826732
ck0000826732:CoveredCallWritingRiskMember
ck0000826732:S000004062Member
2024-02-23
2024-02-23
0000826732
ck0000826732:DebtSecuritiesRiskMember
ck0000826732:S000004062Member
2024-02-23
2024-02-23
0000826732
ck0000826732:InterestRateRiskMember
ck0000826732:S000004062Member
2024-02-23
2024-02-23
0000826732
ck0000826732:CreditRiskMember
ck0000826732:S000004062Member
2024-02-23
2024-02-23
0000826732
ck0000826732:DefaultRiskMember
ck0000826732:S000004062Member
2024-02-23
2024-02-23
0000826732
ck0000826732:DerivativesRiskMember
ck0000826732:S000004062Member
2024-02-23
2024-02-23
0000826732
ck0000826732:EquitySecuritiesRiskMember
ck0000826732:S000004062Member
2024-02-23
2024-02-23
0000826732
ck0000826732:ForeignSecuritiesRiskMember
ck0000826732:S000004062Member
2024-02-23
2024-02-23
0000826732
ck0000826732:HighYieldRiskMember
ck0000826732:S000004062Member
2024-02-23
2024-02-23
0000826732
ck0000826732:LiquidityRiskMember
ck0000826732:S000004062Member
2024-02-23
2024-02-23
0000826732
ck0000826732:OptionsRiskMember
ck0000826732:S000004062Member
2024-02-23
2024-02-23
0000826732
ck0000826732:OtherInvestmentCompaniesincludingETFsRiskMember
ck0000826732:S000004062Member
2024-02-23
2024-02-23
0000826732
ck0000826732:PortfolioSelectionRiskMember
ck0000826732:S000004062Member
2024-02-23
2024-02-23
0000826732
ck0000826732:PortfolioTurnoverRiskMember
ck0000826732:S000004062Member
2024-02-23
2024-02-23
0000826732
ck0000826732:Rule144ASecuritiesRiskMember
ck0000826732:S000004062Member
2024-02-23
2024-02-23
0000826732
ck0000826732:SectorRiskMember
ck0000826732:S000004062Member
2024-02-23
2024-02-23
0000826732
ck0000826732:SecuritiesLendingRiskMember
ck0000826732:S000004062Member
2024-02-23
2024-02-23
0000826732
ck0000826732:ShortSaleRiskMember
ck0000826732:S000004062Member
2024-02-23
2024-02-23
0000826732
ck0000826732:SmallAndMidSizedCompanyRiskMember
ck0000826732:S000004062Member
2024-02-23
2024-02-23
0000826732
ck0000826732:SpecialPurposeAcquisitionCompaniesRiskMember
ck0000826732:S000004062Member
2024-02-23
2024-02-23
0000826732
ck0000826732:SyntheticConvertibleInstrumentsRiskMember
ck0000826732:S000004062Member
2024-02-23
2024-02-23
0000826732
ck0000826732:TaxRiskMember
ck0000826732:S000004062Member
2024-02-23
2024-02-23
0000826732
ck0000826732:TotalReturnSwapRiskMember
ck0000826732:S000004062Member
2024-02-23
2024-02-23
0000826732
ck0000826732:S000004062Member
rr:AfterTaxesOnDistributionsMember
ck0000826732:C000011369Member
2024-02-23
2024-02-23
0000826732
ck0000826732:S000004062Member
rr:AfterTaxesOnDistributionsAndSalesMember
ck0000826732:C000011369Member
2024-02-23
2024-02-23
0000826732
ck0000826732:S000004062Member
ck0000826732:index_Bloomberg_US_GovernmentCredit_IndexMember
2024-02-23
2024-02-23
0000826732
ck0000826732:S000004062Member
ck0000826732:index_Bloomberg_Short_Treasury_13_Month_IndexMember
2024-02-23
2024-02-23
0000826732
ck0000826732:S000047914Member
2024-02-23
2024-02-23
0000826732
ck0000826732:S000047914Member
ck0000826732:C000150500Member
2024-02-23
2024-02-23
0000826732
ck0000826732:S000047914Member
ck0000826732:C000150501Member
2024-02-23
2024-02-23
0000826732
ck0000826732:S000047914Member
ck0000826732:C000150502Member
2024-02-23
2024-02-23
0000826732
rr:RiskNotInsuredMember
ck0000826732:S000047914Member
2024-02-23
2024-02-23
0000826732
rr:RiskLoseMoneyMember
ck0000826732:S000047914Member
2024-02-23
2024-02-23
0000826732
ck0000826732:AmericanDepositaryReceiptsRiskMember
ck0000826732:S000047914Member
2024-02-23
2024-02-23
0000826732
ck0000826732:ConvertibleSecuritiesRiskMember
ck0000826732:S000047914Member
2024-02-23
2024-02-23
0000826732
ck0000826732:CorrelationRiskMember
ck0000826732:S000047914Member
2024-02-23
2024-02-23
0000826732
ck0000826732:CoveredCallWritingRiskMember
ck0000826732:S000047914Member
2024-02-23
2024-02-23
0000826732
ck0000826732:CurrencyRiskMember
ck0000826732:S000047914Member
2024-02-23
2024-02-23
0000826732
ck0000826732:DebtSecuritiesRiskMember
ck0000826732:S000047914Member
2024-02-23
2024-02-23
0000826732
ck0000826732:InterestRateRiskMember
ck0000826732:S000047914Member
2024-02-23
2024-02-23
0000826732
ck0000826732:CreditRiskMember
ck0000826732:S000047914Member
2024-02-23
2024-02-23
0000826732
ck0000826732:DefaultRiskMember
ck0000826732:S000047914Member
2024-02-23
2024-02-23
0000826732
ck0000826732:DerivativesRiskMember
ck0000826732:S000047914Member
2024-02-23
2024-02-23
0000826732
ck0000826732:EquitySecuritiesRiskMember
ck0000826732:S000047914Member
2024-02-23
2024-02-23
0000826732
ck0000826732:ForeignSecuritiesRiskMember
ck0000826732:S000047914Member
2024-02-23
2024-02-23
0000826732
ck0000826732:ForwardForeignCurrencyContractRiskMember
ck0000826732:S000047914Member
2024-02-23
2024-02-23
0000826732
ck0000826732:FuturesAndForwardContractsRiskMember
ck0000826732:S000047914Member
2024-02-23
2024-02-23
0000826732
ck0000826732:OptionsRiskMember
ck0000826732:S000047914Member
2024-02-23
2024-02-23
0000826732
ck0000826732:OtherInvestmentCompaniesincludingETFsRiskMember
ck0000826732:S000047914Member
2024-02-23
2024-02-23
0000826732
ck0000826732:PortfolioSelectionRiskMember
ck0000826732:S000047914Member
2024-02-23
2024-02-23
0000826732
ck0000826732:PortfolioTurnoverRiskMember
ck0000826732:S000047914Member
2024-02-23
2024-02-23
0000826732
ck0000826732:Rule144ASecuritiesRiskMember
ck0000826732:S000047914Member
2024-02-23
2024-02-23
0000826732
ck0000826732:SectorRiskMember
ck0000826732:S000047914Member
2024-02-23
2024-02-23
0000826732
ck0000826732:SecuritiesLendingRiskMember
ck0000826732:S000047914Member
2024-02-23
2024-02-23
0000826732
ck0000826732:ShortSaleRiskMember
ck0000826732:S000047914Member
2024-02-23
2024-02-23
0000826732
ck0000826732:TaxRiskMember
ck0000826732:S000047914Member
2024-02-23
2024-02-23
0000826732
ck0000826732:S000047914Member
rr:AfterTaxesOnDistributionsMember
ck0000826732:C000150502Member
2024-02-23
2024-02-23
0000826732
ck0000826732:S000047914Member
rr:AfterTaxesOnDistributionsAndSalesMember
ck0000826732:C000150502Member
2024-02-23
2024-02-23
0000826732
ck0000826732:S000047914Member
ck0000826732:index_SP_500_IndexMember
2024-02-23
2024-02-23
0000826732
ck0000826732:S000047914Member
ck0000826732:index_Bloomberg_US_Aggregate_Bond_IndexMember
2024-02-23
2024-02-23
0000826732
ck0000826732:S000052577Member
2024-02-23
2024-02-23
0000826732
ck0000826732:S000052577Member
ck0000826732:C000165048Member
2024-02-23
2024-02-23
0000826732
ck0000826732:S000052577Member
ck0000826732:C000165049Member
2024-02-23
2024-02-23
0000826732
ck0000826732:S000052577Member
ck0000826732:C000165050Member
2024-02-23
2024-02-23
0000826732
rr:RiskNotInsuredMember
ck0000826732:S000052577Member
2024-02-23
2024-02-23
0000826732
rr:RiskLoseMoneyMember
ck0000826732:S000052577Member
2024-02-23
2024-02-23
0000826732
ck0000826732:AmericanDepositaryReceiptsRiskMember
ck0000826732:S000052577Member
2024-02-23
2024-02-23
0000826732
ck0000826732:CashHoldingsRiskMember
ck0000826732:S000052577Member
2024-02-23
2024-02-23
0000826732
ck0000826732:CurrencyRiskMember
ck0000826732:S000052577Member
2024-02-23
2024-02-23
0000826732
ck0000826732:DerivativesRiskMember
ck0000826732:S000052577Member
2024-02-23
2024-02-23
0000826732
ck0000826732:EmergingMarketsRiskMember
ck0000826732:S000052577Member
2024-02-23
2024-02-23
0000826732
ck0000826732:EquitySecuritiesRiskMember
ck0000826732:S000052577Member
2024-02-23
2024-02-23
0000826732
ck0000826732:ForeignSecuritiesRiskMember
ck0000826732:S000052577Member
2024-02-23
2024-02-23
0000826732
ck0000826732:ForwardForeignCurrencyContractRiskMember
ck0000826732:S000052577Member
2024-02-23
2024-02-23
0000826732
ck0000826732:FuturesAndForwardContractsRiskMember
ck0000826732:S000052577Member
2024-02-23
2024-02-23
0000826732
ck0000826732:GeographicConcentrationRiskMember
ck0000826732:S000052577Member
2024-02-23
2024-02-23
0000826732
ck0000826732:LeveragingRiskMember
ck0000826732:S000052577Member
2024-02-23
2024-02-23
0000826732
ck0000826732:LiquidityRiskMember
ck0000826732:S000052577Member
2024-02-23
2024-02-23
0000826732
ck0000826732:OptionsRiskMember
ck0000826732:S000052577Member
2024-02-23
2024-02-23
0000826732
ck0000826732:OtherInvestmentCompaniesincludingETFsRiskMember
ck0000826732:S000052577Member
2024-02-23
2024-02-23
0000826732
ck0000826732:PortfolioSelectionRiskMember
ck0000826732:S000052577Member
2024-02-23
2024-02-23
0000826732
ck0000826732:PortfolioTurnoverRiskMember
ck0000826732:S000052577Member
2024-02-23
2024-02-23
0000826732
ck0000826732:SectorRiskMember
ck0000826732:S000052577Member
2024-02-23
2024-02-23
0000826732
ck0000826732:SecuritiesLendingRiskMember
ck0000826732:S000052577Member
2024-02-23
2024-02-23
0000826732
ck0000826732:ShortSaleRiskMember
ck0000826732:S000052577Member
2024-02-23
2024-02-23
0000826732
ck0000826732:SmallAndMidSizedCompanyStockRiskMember
ck0000826732:S000052577Member
2024-02-23
2024-02-23
0000826732
ck0000826732:S000052577Member
rr:AfterTaxesOnDistributionsMember
ck0000826732:C000165050Member
2024-02-23
2024-02-23
0000826732
ck0000826732:S000052577Member
rr:AfterTaxesOnDistributionsAndSalesMember
ck0000826732:C000165050Member
2024-02-23
2024-02-23
0000826732
ck0000826732:S000052577Member
ck0000826732:index_SP_500_IndexMember
2024-02-23
2024-02-23
0000826732
ck0000826732:S000052577Member
ck0000826732:index_MSCI_World_IndexMember
2024-02-23
2024-02-23
0000826732
ck0000826732:S000081268Member
2024-02-23
2024-02-23
0000826732
ck0000826732:S000081268Member
ck0000826732:C000243949Member
2024-02-23
2024-02-23
0000826732
ck0000826732:S000081268Member
ck0000826732:C000243950Member
2024-02-23
2024-02-23
0000826732
ck0000826732:S000081268Member
ck0000826732:C000243951Member
2024-02-23
2024-02-23
0000826732
rr:RiskNotInsuredMember
ck0000826732:S000081268Member
2024-02-23
2024-02-23
0000826732
rr:RiskNondiversifiedStatusMember
ck0000826732:S000081268Member
2024-02-23
2024-02-23
0000826732
rr:RiskLoseMoneyMember
ck0000826732:S000081268Member
2024-02-23
2024-02-23
0000826732
ck0000826732:AmericanDepositaryReceiptsRiskMember
ck0000826732:S000081268Member
2024-02-23
2024-02-23
0000826732
ck0000826732:CallRiskMember
ck0000826732:S000081268Member
2024-02-23
2024-02-23
0000826732
ck0000826732:ConvertibleHedgingRiskMember
ck0000826732:S000081268Member
2024-02-23
2024-02-23
0000826732
ck0000826732:ConvertibleSecuritiesRiskMember
ck0000826732:S000081268Member
2024-02-23
2024-02-23
0000826732
ck0000826732:CoveredCallWritingRiskMember
ck0000826732:S000081268Member
2024-02-23
2024-02-23
0000826732
ck0000826732:CurrencyRiskMember
ck0000826732:S000081268Member
2024-02-23
2024-02-23
0000826732
ck0000826732:DebtSecuritiesRiskMember
ck0000826732:S000081268Member
2024-02-23
2024-02-23
0000826732
ck0000826732:InterestRateRiskMember
ck0000826732:S000081268Member
2024-02-23
2024-02-23
0000826732
ck0000826732:CreditRiskMember
ck0000826732:S000081268Member
2024-02-23
2024-02-23
0000826732
ck0000826732:DefaultRiskMember
ck0000826732:S000081268Member
2024-02-23
2024-02-23
0000826732
ck0000826732:LimitedVotingRiskMember
ck0000826732:S000081268Member
2024-02-23
2024-02-23
0000826732
ck0000826732:DerivativesRiskMember
ck0000826732:S000081268Member
2024-02-23
2024-02-23
0000826732
ck0000826732:EmergingMarketsRiskMember
ck0000826732:S000081268Member
2024-02-23
2024-02-23
0000826732
ck0000826732:EquitySecuritiesRiskMember
ck0000826732:S000081268Member
2024-02-23
2024-02-23
0000826732
ck0000826732:FocusedInvestingRiskMember
ck0000826732:S000081268Member
2024-02-23
2024-02-23
0000826732
ck0000826732:ForeignSecuritiesRiskMember
ck0000826732:S000081268Member
2024-02-23
2024-02-23
0000826732
ck0000826732:HedgingTransactionRiskMember
ck0000826732:S000081268Member
2024-02-23
2024-02-23
0000826732
ck0000826732:HighYieldRiskMember
ck0000826732:S000081268Member
2024-02-23
2024-02-23
0000826732
ck0000826732:LackOfCorrelationRiskMember
ck0000826732:S000081268Member
2024-02-23
2024-02-23
0000826732
ck0000826732:LiquidityRiskMember
ck0000826732:S000081268Member
2024-02-23
2024-02-23
0000826732
ck0000826732:MergerAndOtherArbitrageTransactionsRiskMember
ck0000826732:S000081268Member
2024-02-23
2024-02-23
0000826732
ck0000826732:MLPRiskMember
ck0000826732:S000081268Member
2024-02-23
2024-02-23
0000826732
ck0000826732:MLPTaxRiskMember
ck0000826732:S000081268Member
2024-02-23
2024-02-23
0000826732
ck0000826732:MLPLiquidityRiskMember
ck0000826732:S000081268Member
2024-02-23
2024-02-23
0000826732
ck0000826732:EquitySecuritiesOfMLPsRiskMember
ck0000826732:S000081268Member
2024-02-23
2024-02-23
0000826732
ck0000826732:OptionsRiskMember
ck0000826732:S000081268Member
2024-02-23
2024-02-23
0000826732
ck0000826732:OtherInvestmentCompaniesincludingETFsRiskMember
ck0000826732:S000081268Member
2024-02-23
2024-02-23
0000826732
ck0000826732:PortfolioSelectionRiskMember
ck0000826732:S000081268Member
2024-02-23
2024-02-23
0000826732
ck0000826732:PortfolioTurnoverRiskMember
ck0000826732:S000081268Member
2024-02-23
2024-02-23
0000826732
ck0000826732:REITsRiskMember
ck0000826732:S000081268Member
2024-02-23
2024-02-23
0000826732
ck0000826732:Rule144ASecuritiesRiskMember
ck0000826732:S000081268Member
2024-02-23
2024-02-23
0000826732
ck0000826732:SectorRiskMember
ck0000826732:S000081268Member
2024-02-23
2024-02-23
0000826732
ck0000826732:ShortSaleRiskMember
ck0000826732:S000081268Member
2024-02-23
2024-02-23
0000826732
ck0000826732:SmallAndMidSizedCompanyRiskMember
ck0000826732:S000081268Member
2024-02-23
2024-02-23
0000826732
ck0000826732:SpecialPurposeAcquisitionCompaniesRiskMember
ck0000826732:S000081268Member
2024-02-23
2024-02-23
0000826732
ck0000826732:SpecialSituationsOrEventDrivenRiskMember
ck0000826732:S000081268Member
2024-02-23
2024-02-23
0000826732
ck0000826732:SyntheticConvertibleInstrumentsRiskMember
ck0000826732:S000081268Member
2024-02-23
2024-02-23
0000826732
ck0000826732:TaxRiskMember
ck0000826732:S000081268Member
2024-02-23
2024-02-23
0000826732
ck0000826732:TotalReturnSwapRiskMember
ck0000826732:S000081268Member
2024-02-23
2024-02-23
0000826732
ck0000826732:USGovernmentSecurityRiskMember
ck0000826732:S000081268Member
2024-02-23
2024-02-23
0000826732
ck0000826732:WarrantsRiskMember
ck0000826732:S000081268Member
2024-02-23
2024-02-23
0000826732
ck0000826732:S000004060Member
2024-02-23
2024-02-23
0000826732
ck0000826732:S000004060Member
ck0000826732:C000011358Member
2024-02-23
2024-02-23
0000826732
ck0000826732:S000004060Member
ck0000826732:C000011360Member
2024-02-23
2024-02-23
0000826732
ck0000826732:S000004060Member
ck0000826732:C000011361Member
2024-02-23
2024-02-23
0000826732
rr:RiskNotInsuredMember
ck0000826732:S000004060Member
2024-02-23
2024-02-23
0000826732
rr:RiskLoseMoneyMember
ck0000826732:S000004060Member
2024-02-23
2024-02-23
0000826732
ck0000826732:ConvertibleSecuritiesRiskMember
ck0000826732:S000004060Member
2024-02-23
2024-02-23
0000826732
ck0000826732:DebtSecuritiesRiskMember
ck0000826732:S000004060Member
2024-02-23
2024-02-23
0000826732
ck0000826732:InterestRateRiskMember
ck0000826732:S000004060Member
2024-02-23
2024-02-23
0000826732
ck0000826732:CreditRiskMember
ck0000826732:S000004060Member
2024-02-23
2024-02-23
0000826732
ck0000826732:DefaultRiskMember
ck0000826732:S000004060Member
2024-02-23
2024-02-23
0000826732
ck0000826732:EquitySecuritiesRiskMember
ck0000826732:S000004060Member
2024-02-23
2024-02-23
0000826732
ck0000826732:ForeignSecuritiesRiskMember
ck0000826732:S000004060Member
2024-02-23
2024-02-23
0000826732
ck0000826732:ForwardForeignCurrencyContractRiskMember
ck0000826732:S000004060Member
2024-02-23
2024-02-23
0000826732
ck0000826732:HighYieldRiskMember
ck0000826732:S000004060Member
2024-02-23
2024-02-23
0000826732
ck0000826732:LiquidityRiskMember
ck0000826732:S000004060Member
2024-02-23
2024-02-23
0000826732
ck0000826732:OptionsRiskMember
ck0000826732:S000004060Member
2024-02-23
2024-02-23
0000826732
ck0000826732:PortfolioSelectionRiskMember
ck0000826732:S000004060Member
2024-02-23
2024-02-23
0000826732
ck0000826732:Rule144ASecuritiesRiskMember
ck0000826732:S000004060Member
2024-02-23
2024-02-23
0000826732
ck0000826732:SectorRiskMember
ck0000826732:S000004060Member
2024-02-23
2024-02-23
0000826732
ck0000826732:SecuritiesLendingRiskMember
ck0000826732:S000004060Member
2024-02-23
2024-02-23
0000826732
ck0000826732:SmallAndMidSizedCompanyRiskMember
ck0000826732:S000004060Member
2024-02-23
2024-02-23
0000826732
ck0000826732:SyntheticConvertibleInstrumentsRiskMember
ck0000826732:S000004060Member
2024-02-23
2024-02-23
0000826732
ck0000826732:TaxRiskMember
ck0000826732:S000004060Member
2024-02-23
2024-02-23
0000826732
ck0000826732:S000004060Member
rr:AfterTaxesOnDistributionsMember
ck0000826732:C000011361Member
2024-02-23
2024-02-23
0000826732
ck0000826732:S000004060Member
rr:AfterTaxesOnDistributionsAndSalesMember
ck0000826732:C000011361Member
2024-02-23
2024-02-23
0000826732
ck0000826732:S000004060Member
ck0000826732:index_ICE_BofA_All_US_Convertibles_Index_VXA0Member
2024-02-23
2024-02-23
0000826732
ck0000826732:S000004060Member
ck0000826732:index_SP_500_IndexMember
2024-02-23
2024-02-23
0000826732
ck0000826732:S000047913Member
2024-02-23
2024-02-23
0000826732
ck0000826732:S000047913Member
ck0000826732:C000150496Member
2024-02-23
2024-02-23
0000826732
ck0000826732:S000047913Member
ck0000826732:C000150497Member
2024-02-23
2024-02-23
0000826732
ck0000826732:S000047913Member
ck0000826732:C000150498Member
2024-02-23
2024-02-23
0000826732
rr:RiskNotInsuredMember
ck0000826732:S000047913Member
2024-02-23
2024-02-23
0000826732
rr:RiskLoseMoneyMember
ck0000826732:S000047913Member
2024-02-23
2024-02-23
0000826732
ck0000826732:AmericanDepositaryReceiptsRiskMember
ck0000826732:S000047913Member
2024-02-23
2024-02-23
0000826732
ck0000826732:ConvertibleSecuritiesRiskMember
ck0000826732:S000047913Member
2024-02-23
2024-02-23
0000826732
ck0000826732:CurrencyRiskMember
ck0000826732:S000047913Member
2024-02-23
2024-02-23
0000826732
ck0000826732:DebtSecuritiesRiskMember
ck0000826732:S000047913Member
2024-02-23
2024-02-23
0000826732
ck0000826732:InterestRateRiskMember
ck0000826732:S000047913Member
2024-02-23
2024-02-23
0000826732
ck0000826732:CreditRiskMember
ck0000826732:S000047913Member
2024-02-23
2024-02-23
0000826732
ck0000826732:DefaultRiskMember
ck0000826732:S000047913Member
2024-02-23
2024-02-23
0000826732
ck0000826732:DerivativesRiskMember
ck0000826732:S000047913Member
2024-02-23
2024-02-23
0000826732
ck0000826732:EmergingMarketsRiskMember
ck0000826732:S000047913Member
2024-02-23
2024-02-23
0000826732
ck0000826732:EquitySecuritiesRiskMember
ck0000826732:S000047913Member
2024-02-23
2024-02-23
0000826732
ck0000826732:ForeignSecuritiesRiskMember
ck0000826732:S000047913Member
2024-02-23
2024-02-23
0000826732
ck0000826732:ForwardForeignCurrencyContractRiskMember
ck0000826732:S000047913Member
2024-02-23
2024-02-23
0000826732
ck0000826732:FuturesAndForwardContractsRiskMember
ck0000826732:S000047913Member
2024-02-23
2024-02-23
0000826732
ck0000826732:GeographicConcentrationRiskMember
ck0000826732:S000047913Member
2024-02-23
2024-02-23
0000826732
ck0000826732:HighYieldRiskMember
ck0000826732:S000047913Member
2024-02-23
2024-02-23
0000826732
ck0000826732:OptionsRiskMember
ck0000826732:S000047913Member
2024-02-23
2024-02-23
0000826732
ck0000826732:PortfolioSelectionRiskMember
ck0000826732:S000047913Member
2024-02-23
2024-02-23
0000826732
ck0000826732:PortfolioTurnoverRiskMember
ck0000826732:S000047913Member
2024-02-23
2024-02-23
0000826732
ck0000826732:Rule144ASecuritiesRiskMember
ck0000826732:S000047913Member
2024-02-23
2024-02-23
0000826732
ck0000826732:SectorRiskMember
ck0000826732:S000047913Member
2024-02-23
2024-02-23
0000826732
ck0000826732:SecuritiesLendingRiskMember
ck0000826732:S000047913Member
2024-02-23
2024-02-23
0000826732
ck0000826732:SyntheticConvertibleInstrumentsRiskMember
ck0000826732:S000047913Member
2024-02-23
2024-02-23
0000826732
ck0000826732:TaxRiskMember
ck0000826732:S000047913Member
2024-02-23
2024-02-23
0000826732
ck0000826732:S000047913Member
rr:AfterTaxesOnDistributionsMember
ck0000826732:C000150498Member
2024-02-23
2024-02-23
0000826732
ck0000826732:S000047913Member
rr:AfterTaxesOnDistributionsAndSalesMember
ck0000826732:C000150498Member
2024-02-23
2024-02-23
0000826732
ck0000826732:S000047913Member
ck0000826732:index_Refinitiv_Global_Convertible_Bond_IndexMember
2024-02-23
2024-02-23
0000826732
ck0000826732:S000065224Member
2024-02-23
2024-02-23
0000826732
ck0000826732:S000065224Member
ck0000826732:C000211096Member
2024-02-23
2024-02-23
0000826732
ck0000826732:S000065224Member
ck0000826732:C000211097Member
2024-02-23
2024-02-23
0000826732
ck0000826732:S000065224Member
ck0000826732:C000211098Member
2024-02-23
2024-02-23
0000826732
ck0000826732:S000065224Member
ck0000826732:C000228743Member
2024-02-23
2024-02-23
0000826732
rr:RiskNotInsuredMember
ck0000826732:S000065224Member
2024-02-23
2024-02-23
0000826732
rr:RiskLoseMoneyMember
ck0000826732:S000065224Member
2024-02-23
2024-02-23
0000826732
ck0000826732:AmericanDepositaryReceiptsRiskMember
ck0000826732:S000065224Member
2024-02-23
2024-02-23
0000826732
ck0000826732:CashHoldingsRiskMember
ck0000826732:S000065224Member
2024-02-23
2024-02-23
0000826732
ck0000826732:EquitySecuritiesRiskMember
ck0000826732:S000065224Member
2024-02-23
2024-02-23
0000826732
ck0000826732:ForeignSecuritiesRiskMember
ck0000826732:S000065224Member
2024-02-23
2024-02-23
0000826732
ck0000826732:GrowthStockRiskMember
ck0000826732:S000065224Member
2024-02-23
2024-02-23
0000826732
ck0000826732:LiquidityRiskMember
ck0000826732:S000065224Member
2024-02-23
2024-02-23
0000826732
ck0000826732:PortfolioSelectionRiskMember
ck0000826732:S000065224Member
2024-02-23
2024-02-23
0000826732
ck0000826732:PortfolioTurnoverRiskMember
ck0000826732:S000065224Member
2024-02-23
2024-02-23
0000826732
ck0000826732:SectorRiskMember
ck0000826732:S000065224Member
2024-02-23
2024-02-23
0000826732
ck0000826732:IndustrialsSectorRiskMember
ck0000826732:S000065224Member
2024-02-23
2024-02-23
0000826732
ck0000826732:TechnologySectorRiskMember
ck0000826732:S000065224Member
2024-02-23
2024-02-23
0000826732
ck0000826732:SmallCompanyRiskMember
ck0000826732:S000065224Member
2024-02-23
2024-02-23
0000826732
ck0000826732:S000065224Member
rr:AfterTaxesOnDistributionsMember
ck0000826732:C000211096Member
2024-02-23
2024-02-23
0000826732
ck0000826732:S000065224Member
rr:AfterTaxesOnDistributionsAndSalesMember
ck0000826732:C000211096Member
2024-02-23
2024-02-23
0000826732
ck0000826732:S000065224Member
ck0000826732:index_Russell_2000_Growth_IndexMember
2024-02-23
2024-02-23
0000826732
ck0000826732:S000065991Member
2024-02-23
2024-02-23
0000826732
ck0000826732:S000065991Member
ck0000826732:C000213160Member
2024-02-23
2024-02-23
0000826732
ck0000826732:S000065991Member
ck0000826732:C000213161Member
2024-02-23
2024-02-23
0000826732
ck0000826732:S000065991Member
ck0000826732:C000213162Member
2024-02-23
2024-02-23
0000826732
rr:RiskNotInsuredMember
ck0000826732:S000065991Member
2024-02-23
2024-02-23
0000826732
rr:RiskLoseMoneyMember
ck0000826732:S000065991Member
2024-02-23
2024-02-23
0000826732
ck0000826732:AmericanDepositaryReceiptsRiskMember
ck0000826732:S000065991Member
2024-02-23
2024-02-23
0000826732
ck0000826732:CashHoldingsRiskMember
ck0000826732:S000065991Member
2024-02-23
2024-02-23
0000826732
ck0000826732:EquitySecuritiesRiskMember
ck0000826732:S000065991Member
2024-02-23
2024-02-23
0000826732
ck0000826732:ForeignSecuritiesRiskMember
ck0000826732:S000065991Member
2024-02-23
2024-02-23
0000826732
ck0000826732:GrowthStockRiskMember
ck0000826732:S000065991Member
2024-02-23
2024-02-23
0000826732
ck0000826732:LiquidityRiskMember
ck0000826732:S000065991Member
2024-02-23
2024-02-23
0000826732
ck0000826732:PortfolioSelectionRiskMember
ck0000826732:S000065991Member
2024-02-23
2024-02-23
0000826732
ck0000826732:PortfolioTurnoverRiskMember
ck0000826732:S000065991Member
2024-02-23
2024-02-23
0000826732
ck0000826732:SectorRiskMember
ck0000826732:S000065991Member
2024-02-23
2024-02-23
0000826732
ck0000826732:SmallAndMidSizedCompanyStockRiskMember
ck0000826732:S000065991Member
2024-02-23
2024-02-23
0000826732
ck0000826732:S000065991Member
rr:AfterTaxesOnDistributionsMember
ck0000826732:C000213162Member
2024-02-23
2024-02-23
0000826732
ck0000826732:S000065991Member
rr:AfterTaxesOnDistributionsAndSalesMember
ck0000826732:C000213162Member
2024-02-23
2024-02-23
0000826732
ck0000826732:S000065991Member
ck0000826732:index_Russell_2500_Growth_IndexMember
2024-02-23
2024-02-23
0000826732
ck0000826732:S000004063Member
2024-02-23
2024-02-23
0000826732
ck0000826732:S000004063Member
ck0000826732:C000011370Member
2024-02-23
2024-02-23
0000826732
ck0000826732:S000004063Member
ck0000826732:C000011372Member
2024-02-23
2024-02-23
0000826732
ck0000826732:S000004063Member
ck0000826732:C000011373Member
2024-02-23
2024-02-23
0000826732
rr:RiskNotInsuredMember
ck0000826732:S000004063Member
2024-02-23
2024-02-23
0000826732
rr:RiskLoseMoneyMember
ck0000826732:S000004063Member
2024-02-23
2024-02-23
0000826732
ck0000826732:AmericanDepositaryReceiptsRiskMember
ck0000826732:S000004063Member
2024-02-23
2024-02-23
0000826732
ck0000826732:EquitySecuritiesRiskMember
ck0000826732:S000004063Member
2024-02-23
2024-02-23
0000826732
ck0000826732:ForeignSecuritiesRiskMember
ck0000826732:S000004063Member
2024-02-23
2024-02-23
0000826732
ck0000826732:ForwardForeignCurrencyContractRiskMember
ck0000826732:S000004063Member
2024-02-23
2024-02-23
0000826732
ck0000826732:GrowthStockRiskMember
ck0000826732:S000004063Member
2024-02-23
2024-02-23
0000826732
ck0000826732:MidSizedCompanyRiskMember
ck0000826732:S000004063Member
2024-02-23
2024-02-23
0000826732
ck0000826732:OptionsRiskMember
ck0000826732:S000004063Member
2024-02-23
2024-02-23
0000826732
ck0000826732:PortfolioSelectionRiskMember
ck0000826732:S000004063Member
2024-02-23
2024-02-23
0000826732
ck0000826732:SectorRiskMember
ck0000826732:S000004063Member
2024-02-23
2024-02-23
0000826732
ck0000826732:SecuritiesLendingRiskMember
ck0000826732:S000004063Member
2024-02-23
2024-02-23
0000826732
ck0000826732:S000004063Member
rr:AfterTaxesOnDistributionsMember
ck0000826732:C000011373Member
2024-02-23
2024-02-23
0000826732
ck0000826732:S000004063Member
rr:AfterTaxesOnDistributionsAndSalesMember
ck0000826732:C000011373Member
2024-02-23
2024-02-23
0000826732
ck0000826732:S000004063Member
ck0000826732:index_SP_1500_Growth_IndexMember
2024-02-23
2024-02-23
0000826732
ck0000826732:S000004063Member
ck0000826732:index_SP_500_IndexMember
2024-02-23
2024-02-23
0000826732
ck0000826732:S000004061Member
2024-02-23
2024-02-23
0000826732
ck0000826732:S000004061Member
ck0000826732:C000220407Member
2024-02-23
2024-02-23
0000826732
ck0000826732:S000004061Member
ck0000826732:C000011362Member
2024-02-23
2024-02-23
0000826732
ck0000826732:S000004061Member
ck0000826732:C000011364Member
2024-02-23
2024-02-23
0000826732
ck0000826732:S000004061Member
ck0000826732:C000011365Member
2024-02-23
2024-02-23
0000826732
rr:RiskNotInsuredMember
ck0000826732:S000004061Member
2024-02-23
2024-02-23
0000826732
rr:RiskLoseMoneyMember
ck0000826732:S000004061Member
2024-02-23
2024-02-23
0000826732
ck0000826732:AmericanDepositaryReceiptsRiskMember
ck0000826732:S000004061Member
2024-02-23
2024-02-23
0000826732
ck0000826732:ConvertibleSecuritiesRiskMember
ck0000826732:S000004061Member
2024-02-23
2024-02-23
0000826732
ck0000826732:DebtSecuritiesRiskMember
ck0000826732:S000004061Member
2024-02-23
2024-02-23
0000826732
ck0000826732:InterestRateRiskMember
ck0000826732:S000004061Member
2024-02-23
2024-02-23
0000826732
ck0000826732:CreditRiskMember
ck0000826732:S000004061Member
2024-02-23
2024-02-23
0000826732
ck0000826732:DefaultRiskMember
ck0000826732:S000004061Member
2024-02-23
2024-02-23
0000826732
ck0000826732:EquitySecuritiesRiskMember
ck0000826732:S000004061Member
2024-02-23
2024-02-23
0000826732
ck0000826732:ForeignSecuritiesRiskMember
ck0000826732:S000004061Member
2024-02-23
2024-02-23
0000826732
ck0000826732:ForwardForeignCurrencyContractRiskMember
ck0000826732:S000004061Member
2024-02-23
2024-02-23
0000826732
ck0000826732:GrowthStockRiskMember
ck0000826732:S000004061Member
2024-02-23
2024-02-23
0000826732
ck0000826732:HighYieldRiskMember
ck0000826732:S000004061Member
2024-02-23
2024-02-23
0000826732
ck0000826732:LiquidityRiskMember
ck0000826732:S000004061Member
2024-02-23
2024-02-23
0000826732
ck0000826732:OptionsRiskMember
ck0000826732:S000004061Member
2024-02-23
2024-02-23
0000826732
ck0000826732:PortfolioSelectionRiskMember
ck0000826732:S000004061Member
2024-02-23
2024-02-23
0000826732
ck0000826732:Rule144ASecuritiesRiskMember
ck0000826732:S000004061Member
2024-02-23
2024-02-23
0000826732
ck0000826732:SecuritiesLendingRiskMember
ck0000826732:S000004061Member
2024-02-23
2024-02-23
0000826732
ck0000826732:SmallAndMidSizedCompanyRiskMember
ck0000826732:S000004061Member
2024-02-23
2024-02-23
0000826732
ck0000826732:SyntheticConvertibleInstrumentsRiskMember
ck0000826732:S000004061Member
2024-02-23
2024-02-23
0000826732
ck0000826732:TaxRiskMember
ck0000826732:S000004061Member
2024-02-23
2024-02-23
0000826732
ck0000826732:S000004061Member
rr:AfterTaxesOnDistributionsMember
ck0000826732:C000011365Member
2024-02-23
2024-02-23
0000826732
ck0000826732:S000004061Member
rr:AfterTaxesOnDistributionsAndSalesMember
ck0000826732:C000011365Member
2024-02-23
2024-02-23
0000826732
ck0000826732:S000004061Member
ck0000826732:index_SP_500_IndexMember
2024-02-23
2024-02-23
0000826732
ck0000826732:S000004061Member
ck0000826732:index_ICE_BofA_All_US_Convertibles_EX_Mandatory_IndexMember
2024-02-23
2024-02-23
0000826732
ck0000826732:S000041744Member
2024-02-23
2024-02-23
0000826732
ck0000826732:S000041744Member
ck0000826732:C000129591Member
2024-02-23
2024-02-23
0000826732
ck0000826732:S000041744Member
ck0000826732:C000129592Member
2024-02-23
2024-02-23
0000826732
ck0000826732:S000041744Member
ck0000826732:C000129593Member
2024-02-23
2024-02-23
0000826732
rr:RiskNotInsuredMember
ck0000826732:S000041744Member
2024-02-23
2024-02-23
0000826732
rr:RiskLoseMoneyMember
ck0000826732:S000041744Member
2024-02-23
2024-02-23
0000826732
ck0000826732:EquitySecuritiesRiskMember
ck0000826732:S000041744Member
2024-02-23
2024-02-23
0000826732
ck0000826732:ForeignSecuritiesRiskMember
ck0000826732:S000041744Member
2024-02-23
2024-02-23
0000826732
ck0000826732:FuturesAndForwardContractsRiskMember
ck0000826732:S000041744Member
2024-02-23
2024-02-23
0000826732
ck0000826732:LiquidityRiskMember
ck0000826732:S000041744Member
2024-02-23
2024-02-23
0000826732
ck0000826732:MLPRiskMember
ck0000826732:S000041744Member
2024-02-23
2024-02-23
0000826732
ck0000826732:MLPTaxRiskMember
ck0000826732:S000041744Member
2024-02-23
2024-02-23
0000826732
ck0000826732:MLPLiquidityRiskMember
ck0000826732:S000041744Member
2024-02-23
2024-02-23
0000826732
ck0000826732:EquitySecuritiesOfMLPsRiskMember
ck0000826732:S000041744Member
2024-02-23
2024-02-23
0000826732
ck0000826732:OptionsRiskMember
ck0000826732:S000041744Member
2024-02-23
2024-02-23
0000826732
ck0000826732:PortfolioSelectionRiskMember
ck0000826732:S000041744Member
2024-02-23
2024-02-23
0000826732
ck0000826732:RICQualificationRiskMember
ck0000826732:S000041744Member
2024-02-23
2024-02-23
0000826732
ck0000826732:Rule144ASecuritiesRiskMember
ck0000826732:S000041744Member
2024-02-23
2024-02-23
0000826732
ck0000826732:SecuritiesLendingRiskMember
ck0000826732:S000041744Member
2024-02-23
2024-02-23
0000826732
ck0000826732:TaxRiskMember
ck0000826732:S000041744Member
2024-02-23
2024-02-23
0000826732
ck0000826732:S000041744Member
rr:AfterTaxesOnDistributionsMember
ck0000826732:C000129593Member
2024-02-23
2024-02-23
0000826732
ck0000826732:S000041744Member
rr:AfterTaxesOnDistributionsAndSalesMember
ck0000826732:C000129593Member
2024-02-23
2024-02-23
0000826732
ck0000826732:S000041744Member
ck0000826732:index_SP_500_IndexMember
2024-02-23
2024-02-23
0000826732
ck0000826732:S000004058Member
2024-02-23
2024-02-23
0000826732
ck0000826732:S000004058Member
ck0000826732:C000011350Member
2024-02-23
2024-02-23
0000826732
ck0000826732:S000004058Member
ck0000826732:C000011352Member
2024-02-23
2024-02-23
0000826732
ck0000826732:S000004058Member
ck0000826732:C000011353Member
2024-02-23
2024-02-23
0000826732
rr:RiskNotInsuredMember
ck0000826732:S000004058Member
2024-02-23
2024-02-23
0000826732
rr:RiskLoseMoneyMember
ck0000826732:S000004058Member
2024-02-23
2024-02-23
0000826732
ck0000826732:AmericanDepositaryReceiptsRiskMember
ck0000826732:S000004058Member
2024-02-23
2024-02-23
0000826732
ck0000826732:EquitySecuritiesRiskMember
ck0000826732:S000004058Member
2024-02-23
2024-02-23
0000826732
ck0000826732:ForeignSecuritiesRiskMember
ck0000826732:S000004058Member
2024-02-23
2024-02-23
0000826732
ck0000826732:OptionsRiskMember
ck0000826732:S000004058Member
2024-02-23
2024-02-23
0000826732
ck0000826732:PortfolioSelectionRiskMember
ck0000826732:S000004058Member
2024-02-23
2024-02-23
0000826732
ck0000826732:SectorRiskMember
ck0000826732:S000004058Member
2024-02-23
2024-02-23
0000826732
ck0000826732:SecuritiesLendingRiskMember
ck0000826732:S000004058Member
2024-02-23
2024-02-23
0000826732
ck0000826732:SmallAndMidSizedCompanyRiskMember
ck0000826732:S000004058Member
2024-02-23
2024-02-23
0000826732
ck0000826732:ValueStockRiskMember
ck0000826732:S000004058Member
2024-02-23
2024-02-23
0000826732
ck0000826732:S000004058Member
rr:AfterTaxesOnDistributionsMember
ck0000826732:C000011353Member
2024-02-23
2024-02-23
0000826732
ck0000826732:S000004058Member
rr:AfterTaxesOnDistributionsAndSalesMember
ck0000826732:C000011353Member
2024-02-23
2024-02-23
0000826732
ck0000826732:S000004058Member
ck0000826732:index_SP_500_IndexMember
2024-02-23
2024-02-23
0000826732
ck0000826732:S000004065Member
2024-02-23
2024-02-23
0000826732
ck0000826732:S000004065Member
ck0000826732:C000204888Member
2024-02-23
2024-02-23
0000826732
ck0000826732:S000004065Member
ck0000826732:C000011378Member
2024-02-23
2024-02-23
0000826732
ck0000826732:S000004065Member
ck0000826732:C000011380Member
2024-02-23
2024-02-23
0000826732
ck0000826732:S000004065Member
ck0000826732:C000011381Member
2024-02-23
2024-02-23
0000826732
rr:RiskNotInsuredMember
ck0000826732:S000004065Member
2024-02-23
2024-02-23
0000826732
rr:RiskLoseMoneyMember
ck0000826732:S000004065Member
2024-02-23
2024-02-23
0000826732
ck0000826732:AmericanDepositaryReceiptsRiskMember
ck0000826732:S000004065Member
2024-02-23
2024-02-23
0000826732
ck0000826732:EmergingMarketsRiskMember
ck0000826732:S000004065Member
2024-02-23
2024-02-23
0000826732
ck0000826732:EquitySecuritiesRiskMember
ck0000826732:S000004065Member
2024-02-23
2024-02-23
0000826732
ck0000826732:ForeignSecuritiesRiskMember
ck0000826732:S000004065Member
2024-02-23
2024-02-23
0000826732
ck0000826732:ForwardForeignCurrencyContractRiskMember
ck0000826732:S000004065Member
2024-02-23
2024-02-23
0000826732
ck0000826732:GrowthStockRiskMember
ck0000826732:S000004065Member
2024-02-23
2024-02-23
0000826732
ck0000826732:PortfolioSelectionRiskMember
ck0000826732:S000004065Member
2024-02-23
2024-02-23
0000826732
ck0000826732:PortfolioTurnoverRiskMember
ck0000826732:S000004065Member
2024-02-23
2024-02-23
0000826732
ck0000826732:SecuritiesLendingRiskMember
ck0000826732:S000004065Member
2024-02-23
2024-02-23
0000826732
ck0000826732:SmallAndMidSizedCompanyRiskMember
ck0000826732:S000004065Member
2024-02-23
2024-02-23
0000826732
ck0000826732:S000004065Member
rr:AfterTaxesOnDistributionsMember
ck0000826732:C000011381Member
2024-02-23
2024-02-23
0000826732
ck0000826732:S000004065Member
rr:AfterTaxesOnDistributionsAndSalesMember
ck0000826732:C000011381Member
2024-02-23
2024-02-23
0000826732
ck0000826732:S000004065Member
ck0000826732:index_MSCI_EAFE_Growth_IndexMember
2024-02-23
2024-02-23
0000826732
ck0000826732:S000004065Member
ck0000826732:index_MSCI_ACWI_exUS_IndexMember
2024-02-23
2024-02-23
0000826732
ck0000826732:S000022429Member
2024-02-23
2024-02-23
0000826732
ck0000826732:S000022429Member
ck0000826732:C000064541Member
2024-02-23
2024-02-23
0000826732
ck0000826732:S000022429Member
ck0000826732:C000064543Member
2024-02-23
2024-02-23
0000826732
ck0000826732:S000022429Member
ck0000826732:C000064544Member
2024-02-23
2024-02-23
0000826732
rr:RiskNotInsuredMember
ck0000826732:S000022429Member
2024-02-23
2024-02-23
0000826732
rr:RiskLoseMoneyMember
ck0000826732:S000022429Member
2024-02-23
2024-02-23
0000826732
ck0000826732:AmericanDepositaryReceiptsRiskMember
ck0000826732:S000022429Member
2024-02-23
2024-02-23
0000826732
ck0000826732:ConvertibleSecuritiesRiskMember
ck0000826732:S000022429Member
2024-02-23
2024-02-23
0000826732
ck0000826732:DebtSecuritiesRiskMember
ck0000826732:S000022429Member
2024-02-23
2024-02-23
0000826732
ck0000826732:InterestRateRiskMember
ck0000826732:S000022429Member
2024-02-23
2024-02-23
0000826732
ck0000826732:CreditRiskMember
ck0000826732:S000022429Member
2024-02-23
2024-02-23
0000826732
ck0000826732:DefaultRiskMember
ck0000826732:S000022429Member
2024-02-23
2024-02-23
0000826732
ck0000826732:EmergingMarketsRiskMember
ck0000826732:S000022429Member
2024-02-23
2024-02-23
0000826732
ck0000826732:EquitySecuritiesRiskMember
ck0000826732:S000022429Member
2024-02-23
2024-02-23
0000826732
ck0000826732:ForeignSecuritiesRiskMember
ck0000826732:S000022429Member
2024-02-23
2024-02-23
0000826732
ck0000826732:ForwardForeignCurrencyContractRiskMember
ck0000826732:S000022429Member
2024-02-23
2024-02-23
0000826732
ck0000826732:GrowthStockRiskMember
ck0000826732:S000022429Member
2024-02-23
2024-02-23
0000826732
ck0000826732:HighYieldRiskMember
ck0000826732:S000022429Member
2024-02-23
2024-02-23
0000826732
ck0000826732:PortfolioSelectionRiskMember
ck0000826732:S000022429Member
2024-02-23
2024-02-23
0000826732
ck0000826732:PortfolioTurnoverRiskMember
ck0000826732:S000022429Member
2024-02-23
2024-02-23
0000826732
ck0000826732:SectorRiskMember
ck0000826732:S000022429Member
2024-02-23
2024-02-23
0000826732
ck0000826732:SecuritiesLendingRiskMember
ck0000826732:S000022429Member
2024-02-23
2024-02-23
0000826732
ck0000826732:SyntheticConvertibleInstrumentsRiskMember
ck0000826732:S000022429Member
2024-02-23
2024-02-23
0000826732
ck0000826732:S000022429Member
rr:AfterTaxesOnDistributionsMember
ck0000826732:C000064544Member
2024-02-23
2024-02-23
0000826732
ck0000826732:S000022429Member
rr:AfterTaxesOnDistributionsAndSalesMember
ck0000826732:C000064544Member
2024-02-23
2024-02-23
0000826732
ck0000826732:S000022429Member
ck0000826732:index_MSCI_Emerging_Markets_IndexMember
2024-02-23
2024-02-23
0000826732
ck0000826732:S000015914Member
2024-02-23
2024-02-23
0000826732
ck0000826732:S000015914Member
ck0000826732:C000043702Member
2024-02-23
2024-02-23
0000826732
ck0000826732:S000015914Member
ck0000826732:C000043704Member
2024-02-23
2024-02-23
0000826732
ck0000826732:S000015914Member
ck0000826732:C000043705Member
2024-02-23
2024-02-23
0000826732
ck0000826732:S000015914Member
ck0000826732:C000220409Member
2024-02-23
2024-02-23
0000826732
rr:RiskNotInsuredMember
ck0000826732:S000015914Member
2024-02-23
2024-02-23
0000826732
rr:RiskLoseMoneyMember
ck0000826732:S000015914Member
2024-02-23
2024-02-23
0000826732
ck0000826732:AmericanDepositaryReceiptsRiskMember
ck0000826732:S000015914Member
2024-02-23
2024-02-23
0000826732
ck0000826732:EmergingMarketsRiskMember
ck0000826732:S000015914Member
2024-02-23
2024-02-23
0000826732
ck0000826732:EquitySecuritiesRiskMember
ck0000826732:S000015914Member
2024-02-23
2024-02-23
0000826732
ck0000826732:ForeignSecuritiesRiskMember
ck0000826732:S000015914Member
2024-02-23
2024-02-23
0000826732
ck0000826732:ForwardForeignCurrencyContractRiskMember
ck0000826732:S000015914Member
2024-02-23
2024-02-23
0000826732
ck0000826732:GrowthStockRiskMember
ck0000826732:S000015914Member
2024-02-23
2024-02-23
0000826732
ck0000826732:PortfolioSelectionRiskMember
ck0000826732:S000015914Member
2024-02-23
2024-02-23
0000826732
ck0000826732:SectorRiskMember
ck0000826732:S000015914Member
2024-02-23
2024-02-23
0000826732
ck0000826732:SecuritiesLendingRiskMember
ck0000826732:S000015914Member
2024-02-23
2024-02-23
0000826732
ck0000826732:SmallAndMidSizedCompanyRiskMember
ck0000826732:S000015914Member
2024-02-23
2024-02-23
0000826732
ck0000826732:ValueStockRiskMember
ck0000826732:S000015914Member
2024-02-23
2024-02-23
0000826732
ck0000826732:S000015914Member
rr:AfterTaxesOnDistributionsMember
ck0000826732:C000043705Member
2024-02-23
2024-02-23
0000826732
ck0000826732:S000015914Member
rr:AfterTaxesOnDistributionsAndSalesMember
ck0000826732:C000043705Member
2024-02-23
2024-02-23
0000826732
ck0000826732:S000015914Member
ck0000826732:index_MSCI_World_IndexMember
2024-02-23
2024-02-23
0000826732
ck0000826732:S000015914Member
ck0000826732:index_MSCI_ACWI_IndexMember
2024-02-23
2024-02-23
0000826732
ck0000826732:S000004064Member
2024-02-23
2024-02-23
0000826732
ck0000826732:S000004064Member
ck0000826732:C000011374Member
2024-02-23
2024-02-23
0000826732
ck0000826732:S000004064Member
ck0000826732:C000011376Member
2024-02-23
2024-02-23
0000826732
ck0000826732:S000004064Member
ck0000826732:C000011377Member
2024-02-23
2024-02-23
0000826732
rr:RiskNotInsuredMember
ck0000826732:S000004064Member
2024-02-23
2024-02-23
0000826732
rr:RiskLoseMoneyMember
ck0000826732:S000004064Member
2024-02-23
2024-02-23
0000826732
ck0000826732:AmericanDepositaryReceiptsRiskMember
ck0000826732:S000004064Member
2024-02-23
2024-02-23
0000826732
ck0000826732:ConvertibleSecuritiesRiskMember
ck0000826732:S000004064Member
2024-02-23
2024-02-23
0000826732
ck0000826732:DebtSecuritiesRiskMember
ck0000826732:S000004064Member
2024-02-23
2024-02-23
0000826732
ck0000826732:InterestRateRiskMember
ck0000826732:S000004064Member
2024-02-23
2024-02-23
0000826732
ck0000826732:CreditRiskMember
ck0000826732:S000004064Member
2024-02-23
2024-02-23
0000826732
ck0000826732:DefaultRiskMember
ck0000826732:S000004064Member
2024-02-23
2024-02-23
0000826732
ck0000826732:EmergingMarketsRiskMember
ck0000826732:S000004064Member
2024-02-23
2024-02-23
0000826732
ck0000826732:EquitySecuritiesRiskMember
ck0000826732:S000004064Member
2024-02-23
2024-02-23
0000826732
ck0000826732:ForeignSecuritiesRiskMember
ck0000826732:S000004064Member
2024-02-23
2024-02-23
0000826732
ck0000826732:GrowthStockRiskMember
ck0000826732:S000004064Member
2024-02-23
2024-02-23
0000826732
ck0000826732:HighYieldRiskMember
ck0000826732:S000004064Member
2024-02-23
2024-02-23
0000826732
ck0000826732:LiquidityRiskMember
ck0000826732:S000004064Member
2024-02-23
2024-02-23
0000826732
ck0000826732:OptionsRiskMember
ck0000826732:S000004064Member
2024-02-23
2024-02-23
0000826732
ck0000826732:PortfolioSelectionRiskMember
ck0000826732:S000004064Member
2024-02-23
2024-02-23
0000826732
ck0000826732:Rule144ASecuritiesRiskMember
ck0000826732:S000004064Member
2024-02-23
2024-02-23
0000826732
ck0000826732:SectorRiskMember
ck0000826732:S000004064Member
2024-02-23
2024-02-23
0000826732
ck0000826732:SecuritiesLendingRiskMember
ck0000826732:S000004064Member
2024-02-23
2024-02-23
0000826732
ck0000826732:SmallAndMidSizedCompanyRiskMember
ck0000826732:S000004064Member
2024-02-23
2024-02-23
0000826732
ck0000826732:SyntheticConvertibleInstrumentsRiskMember
ck0000826732:S000004064Member
2024-02-23
2024-02-23
0000826732
ck0000826732:TaxRiskMember
ck0000826732:S000004064Member
2024-02-23
2024-02-23
0000826732
ck0000826732:S000004064Member
rr:AfterTaxesOnDistributionsMember
ck0000826732:C000011377Member
2024-02-23
2024-02-23
0000826732
ck0000826732:S000004064Member
rr:AfterTaxesOnDistributionsAndSalesMember
ck0000826732:C000011377Member
2024-02-23
2024-02-23
0000826732
ck0000826732:S000004064Member
ck0000826732:index_MSCI_ACWI_IndexMember
2024-02-23
2024-02-23
0000826732
ck0000826732:S000004064Member
ck0000826732:index_MSCI_World_IndexMember
2024-02-23
2024-02-23
0000826732
ck0000826732:S000075668Member
2024-02-23
2024-02-23
0000826732
ck0000826732:S000075668Member
ck0000826732:C000234922Member
2024-02-23
2024-02-23
0000826732
ck0000826732:S000075668Member
ck0000826732:C000234923Member
2024-02-23
2024-02-23
0000826732
ck0000826732:S000075668Member
ck0000826732:C000234924Member
2024-02-23
2024-02-23
0000826732
ck0000826732:S000075668Member
ck0000826732:C000234925Member
2024-02-23
2024-02-23
0000826732
rr:RiskNotInsuredMember
ck0000826732:S000075668Member
2024-02-23
2024-02-23
0000826732
rr:RiskLoseMoneyMember
ck0000826732:S000075668Member
2024-02-23
2024-02-23
0000826732
ck0000826732:AmericanDepositaryReceiptsRiskMember
ck0000826732:S000075668Member
2024-02-23
2024-02-23
0000826732
ck0000826732:CurrencyRiskMember
ck0000826732:S000075668Member
2024-02-23
2024-02-23
0000826732
ck0000826732:EmergingMarketsRiskMember
ck0000826732:S000075668Member
2024-02-23
2024-02-23
0000826732
ck0000826732:EquitySecuritiesRiskMember
ck0000826732:S000075668Member
2024-02-23
2024-02-23
0000826732
ck0000826732:ForwardForeignCurrencyContractRiskMember
ck0000826732:S000075668Member
2024-02-23
2024-02-23
0000826732
ck0000826732:ForeignSecuritiesRiskMember
ck0000826732:S000075668Member
2024-02-23
2024-02-23
0000826732
ck0000826732:GrowthStockRiskMember
ck0000826732:S000075668Member
2024-02-23
2024-02-23
0000826732
ck0000826732:OptionsRiskMember
ck0000826732:S000075668Member
2024-02-23
2024-02-23
0000826732
ck0000826732:PortfolioSelectionRiskMember
ck0000826732:S000075668Member
2024-02-23
2024-02-23
0000826732
ck0000826732:SectorRiskMember
ck0000826732:S000075668Member
2024-02-23
2024-02-23
0000826732
ck0000826732:SecuritiesLendingRiskMember
ck0000826732:S000075668Member
2024-02-23
2024-02-23
0000826732
ck0000826732:SmallCompanyRiskMember
ck0000826732:S000075668Member
2024-02-23
2024-02-23
0000826732
ck0000826732:SustainabilityESGPolicyRiskMember
ck0000826732:S000075668Member
2024-02-23
2024-02-23
0000826732
ck0000826732:S000075668Member
rr:AfterTaxesOnDistributionsMember
ck0000826732:C000234924Member
2024-02-23
2024-02-23
0000826732
ck0000826732:S000075668Member
rr:AfterTaxesOnDistributionsAndSalesMember
ck0000826732:C000234924Member
2024-02-23
2024-02-23
0000826732
ck0000826732:S000075668Member
ck0000826732:index_MSCI_ACWI_ex_USA_Small_Cap_Index_NetMember
2024-02-23
2024-02-23
0000826732
ck0000826732:S000017871Member
2024-02-23
2024-02-23
0000826732
ck0000826732:S000017871Member
ck0000826732:C000049601Member
2024-02-23
2024-02-23
0000826732
ck0000826732:S000017871Member
ck0000826732:C000049603Member
2024-02-23
2024-02-23
0000826732
ck0000826732:S000017871Member
ck0000826732:C000049604Member
2024-02-23
2024-02-23
0000826732
rr:RiskNotInsuredMember
ck0000826732:S000017871Member
2024-02-23
2024-02-23
0000826732
rr:RiskLoseMoneyMember
ck0000826732:S000017871Member
2024-02-23
2024-02-23
0000826732
ck0000826732:ConvertibleSecuritiesRiskMember
ck0000826732:S000017871Member
2024-02-23
2024-02-23
0000826732
ck0000826732:DebtSecuritiesRiskMember
ck0000826732:S000017871Member
2024-02-23
2024-02-23
0000826732
ck0000826732:InterestRateRiskMember
ck0000826732:S000017871Member
2024-02-23
2024-02-23
0000826732
ck0000826732:CreditRiskMember
ck0000826732:S000017871Member
2024-02-23
2024-02-23
0000826732
ck0000826732:DefaultRiskMember
ck0000826732:S000017871Member
2024-02-23
2024-02-23
0000826732
ck0000826732:DerivativesRiskMember
ck0000826732:S000017871Member
2024-02-23
2024-02-23
0000826732
ck0000826732:ForeignSecuritiesRiskMember
ck0000826732:S000017871Member
2024-02-23
2024-02-23
0000826732
ck0000826732:FuturesAndForwardContractsRiskMember
ck0000826732:S000017871Member
2024-02-23
2024-02-23
0000826732
ck0000826732:HighYieldRiskMember
ck0000826732:S000017871Member
2024-02-23
2024-02-23
0000826732
ck0000826732:MLPRiskMember
ck0000826732:S000017871Member
2024-02-23
2024-02-23
0000826732
ck0000826732:MLPTaxRiskMember
ck0000826732:S000017871Member
2024-02-23
2024-02-23
0000826732
ck0000826732:MLPLiquidityRiskMember
ck0000826732:S000017871Member
2024-02-23
2024-02-23
0000826732
ck0000826732:EquitySecuritiesOfMLPsRiskMember
ck0000826732:S000017871Member
2024-02-23
2024-02-23
0000826732
ck0000826732:MortgagerelatedAndOtherAssetbackedSecuritiesRiskMember
ck0000826732:S000017871Member
2024-02-23
2024-02-23
0000826732
ck0000826732:ExtensionRiskMember
ck0000826732:S000017871Member
2024-02-23
2024-02-23
0000826732
ck0000826732:PrepaymentRiskMember
ck0000826732:S000017871Member
2024-02-23
2024-02-23
0000826732
ck0000826732:NonUSGovernmentObligationRiskMember
ck0000826732:S000017871Member
2024-02-23
2024-02-23
0000826732
ck0000826732:OptionsRiskMember
ck0000826732:S000017871Member
2024-02-23
2024-02-23
0000826732
ck0000826732:OtherInvestmentCompaniesincludingETFsRiskMember
ck0000826732:S000017871Member
2024-02-23
2024-02-23
0000826732
ck0000826732:PortfolioSelectionRiskMember
ck0000826732:S000017871Member
2024-02-23
2024-02-23
0000826732
ck0000826732:Rule144ASecuritiesRiskMember
ck0000826732:S000017871Member
2024-02-23
2024-02-23
0000826732
ck0000826732:SecuritiesLendingRiskMember
ck0000826732:S000017871Member
2024-02-23
2024-02-23
0000826732
ck0000826732:SyntheticConvertibleInstrumentsRiskMember
ck0000826732:S000017871Member
2024-02-23
2024-02-23
0000826732
ck0000826732:TaxRiskMember
ck0000826732:S000017871Member
2024-02-23
2024-02-23
0000826732
ck0000826732:TotalReturnSwapRiskMember
ck0000826732:S000017871Member
2024-02-23
2024-02-23
0000826732
ck0000826732:USGovernmentSecurityRiskMember
ck0000826732:S000017871Member
2024-02-23
2024-02-23
0000826732
ck0000826732:S000017871Member
rr:AfterTaxesOnDistributionsMember
ck0000826732:C000049604Member
2024-02-23
2024-02-23
0000826732
ck0000826732:S000017871Member
rr:AfterTaxesOnDistributionsAndSalesMember
ck0000826732:C000049604Member
2024-02-23
2024-02-23
0000826732
ck0000826732:S000017871Member
ck0000826732:index_Bloomberg_Capital_US_Aggregate_Bond_IndexMember
2024-02-23
2024-02-23
0000826732
ck0000826732:S000004057Member
2024-02-23
2024-02-23
0000826732
ck0000826732:S000004057Member
ck0000826732:C000011346Member
2024-02-23
2024-02-23
0000826732
ck0000826732:S000004057Member
ck0000826732:C000011348Member
2024-02-23
2024-02-23
0000826732
ck0000826732:S000004057Member
ck0000826732:C000011349Member
2024-02-23
2024-02-23
0000826732
rr:RiskNotInsuredMember
ck0000826732:S000004057Member
2024-02-23
2024-02-23
0000826732
rr:RiskLoseMoneyMember
ck0000826732:S000004057Member
2024-02-23
2024-02-23
0000826732
ck0000826732:ConvertibleSecuritiesRiskMember
ck0000826732:S000004057Member
2024-02-23
2024-02-23
0000826732
ck0000826732:DebtSecuritiesRiskMember
ck0000826732:S000004057Member
2024-02-23
2024-02-23
0000826732
ck0000826732:InterestRateRiskMember
ck0000826732:S000004057Member
2024-02-23
2024-02-23
0000826732
ck0000826732:CreditRiskMember
ck0000826732:S000004057Member
2024-02-23
2024-02-23
0000826732
ck0000826732:DefaultRiskMember
ck0000826732:S000004057Member
2024-02-23
2024-02-23
0000826732
ck0000826732:DerivativesRiskMember
ck0000826732:S000004057Member
2024-02-23
2024-02-23
0000826732
ck0000826732:EmergingMarketsRiskMember
ck0000826732:S000004057Member
2024-02-23
2024-02-23
0000826732
ck0000826732:EquitySecuritiesRiskMember
ck0000826732:S000004057Member
2024-02-23
2024-02-23
0000826732
ck0000826732:ForeignSecuritiesRiskMember
ck0000826732:S000004057Member
2024-02-23
2024-02-23
0000826732
ck0000826732:FuturesAndForwardContractsRiskMember
ck0000826732:S000004057Member
2024-02-23
2024-02-23
0000826732
ck0000826732:HighYieldRiskMember
ck0000826732:S000004057Member
2024-02-23
2024-02-23
0000826732
ck0000826732:MLPRiskMember
ck0000826732:S000004057Member
2024-02-23
2024-02-23
0000826732
ck0000826732:MLPTaxRiskMember
ck0000826732:S000004057Member
2024-02-23
2024-02-23
0000826732
ck0000826732:MLPLiquidityRiskMember
ck0000826732:S000004057Member
2024-02-23
2024-02-23
0000826732
ck0000826732:EquitySecuritiesOfMLPsRiskMember
ck0000826732:S000004057Member
2024-02-23
2024-02-23
0000826732
ck0000826732:MortgagerelatedAndOtherAssetbackedSecuritiesRiskMember
ck0000826732:S000004057Member
2024-02-23
2024-02-23
0000826732
ck0000826732:ExtensionRiskMember
ck0000826732:S000004057Member
2024-02-23
2024-02-23
0000826732
ck0000826732:PrepaymentRiskMember
ck0000826732:S000004057Member
2024-02-23
2024-02-23
0000826732
ck0000826732:OptionsRiskMember
ck0000826732:S000004057Member
2024-02-23
2024-02-23
0000826732
ck0000826732:OtherInvestmentCompaniesincludingETFsRiskMember
ck0000826732:S000004057Member
2024-02-23
2024-02-23
0000826732
ck0000826732:PortfolioSelectionRiskMember
ck0000826732:S000004057Member
2024-02-23
2024-02-23
0000826732
ck0000826732:RICQualificationRiskMember
ck0000826732:S000004057Member
2024-02-23
2024-02-23
0000826732
ck0000826732:Rule144ASecuritiesRiskMember
ck0000826732:S000004057Member
2024-02-23
2024-02-23
0000826732
ck0000826732:SecuritiesLendingRiskMember
ck0000826732:S000004057Member
2024-02-23
2024-02-23
0000826732
ck0000826732:SyntheticConvertibleInstrumentsRiskMember
ck0000826732:S000004057Member
2024-02-23
2024-02-23
0000826732
ck0000826732:TaxRiskMember
ck0000826732:S000004057Member
2024-02-23
2024-02-23
0000826732
ck0000826732:USGovernmentSecurityRiskMember
ck0000826732:S000004057Member
2024-02-23
2024-02-23
0000826732
ck0000826732:S000004057Member
rr:AfterTaxesOnDistributionsMember
ck0000826732:C000011349Member
2024-02-23
2024-02-23
0000826732
ck0000826732:S000004057Member
rr:AfterTaxesOnDistributionsAndSalesMember
ck0000826732:C000011349Member
2024-02-23
2024-02-23
0000826732
ck0000826732:S000004057Member
ck0000826732:index_Bloomberg_US_Corporate_High_Yield_2_Issuer_Capped_IndexMember
2024-02-23
2024-02-23
0000826732
ck0000826732:S000062995Member
2024-02-23
2024-02-23
0000826732
ck0000826732:S000062995Member
ck0000826732:C000204433Member
2024-02-23
2024-02-23
0000826732
ck0000826732:S000062995Member
ck0000826732:C000204432Member
2024-02-23
2024-02-23
0000826732
rr:RiskNotInsuredMember
ck0000826732:S000062995Member
2024-02-23
2024-02-23
0000826732
rr:RiskLoseMoneyMember
ck0000826732:S000062995Member
2024-02-23
2024-02-23
0000826732
ck0000826732:CashHoldingsRiskMember
ck0000826732:S000062995Member
2024-02-23
2024-02-23
0000826732
ck0000826732:ConvertibleSecuritiesRiskMember
ck0000826732:S000062995Member
2024-02-23
2024-02-23
0000826732
ck0000826732:CurrencyRiskMember
ck0000826732:S000062995Member
2024-02-23
2024-02-23
0000826732
ck0000826732:DebtSecuritiesRiskMember
ck0000826732:S000062995Member
2024-02-23
2024-02-23
0000826732
ck0000826732:InterestRateRiskMember
ck0000826732:S000062995Member
2024-02-23
2024-02-23
0000826732
ck0000826732:CreditRiskMember
ck0000826732:S000062995Member
2024-02-23
2024-02-23
0000826732
ck0000826732:DefaultRiskMember
ck0000826732:S000062995Member
2024-02-23
2024-02-23
0000826732
ck0000826732:DerivativesRiskMember
ck0000826732:S000062995Member
2024-02-23
2024-02-23
0000826732
ck0000826732:EmergingMarketsRiskMember
ck0000826732:S000062995Member
2024-02-23
2024-02-23
0000826732
ck0000826732:ForeignSecuritiesRiskMember
ck0000826732:S000062995Member
2024-02-23
2024-02-23
0000826732
ck0000826732:HighYieldRiskMember
ck0000826732:S000062995Member
2024-02-23
2024-02-23
0000826732
ck0000826732:LargeShareholderRiskMember
ck0000826732:S000062995Member
2024-02-23
2024-02-23
0000826732
ck0000826732:MortgagerelatedAndOtherAssetbackedSecuritiesRiskMember
ck0000826732:S000062995Member
2024-02-23
2024-02-23
0000826732
ck0000826732:ExtensionRiskMember
ck0000826732:S000062995Member
2024-02-23
2024-02-23
0000826732
ck0000826732:PrepaymentRiskMember
ck0000826732:S000062995Member
2024-02-23
2024-02-23
0000826732
ck0000826732:NonUSGovernmentObligationRiskMember
ck0000826732:S000062995Member
2024-02-23
2024-02-23
0000826732
ck0000826732:OptionsRiskMember
ck0000826732:S000062995Member
2024-02-23
2024-02-23
0000826732
ck0000826732:OtherInvestmentCompaniesincludingETFsRiskMember
ck0000826732:S000062995Member
2024-02-23
2024-02-23
0000826732
ck0000826732:PortfolioSelectionRiskMember
ck0000826732:S000062995Member
2024-02-23
2024-02-23
0000826732
ck0000826732:Rule144ASecuritiesRiskMember
ck0000826732:S000062995Member
2024-02-23
2024-02-23
0000826732
ck0000826732:SecuritiesLendingRiskMember
ck0000826732:S000062995Member
2024-02-23
2024-02-23
0000826732
ck0000826732:USGovernmentSecurityRiskMember
ck0000826732:S000062995Member
2024-02-23
2024-02-23
0000826732
ck0000826732:S000062995Member
rr:AfterTaxesOnDistributionsMember
ck0000826732:C000204433Member
2024-02-23
2024-02-23
0000826732
ck0000826732:S000062995Member
rr:AfterTaxesOnDistributionsAndSalesMember
ck0000826732:C000204433Member
2024-02-23
2024-02-23
0000826732
ck0000826732:S000062995Member
ck0000826732:index_Bloomberg_13_Year_GovernmentCredit_IndexMember
2024-02-23
2024-02-23
0000826732
ck0000826732:S000062995Member
ck0000826732:index_Bloomberg_US_13_Year_Credit_IndexMember
2024-02-23
2024-02-23
xbrli:pure
iso4217:USD
Other Important Information Regarding Fund Shares
Buying and Redeeming Fund Shares
Minimum Initial Investment
Classes A and C: $2,500/$500 for IRA
Class I: $1,000,000
Class R6: None
Minimum Additional Investment
Classes A and C: $50
Classes I and R6: None
Buying and Redeeming Class R6 Shares
Class R6 shares are available to employer-sponsored retirement and benefit plans, held either at the plan level or through omnibus accounts that generally process no more than one net redemption and one net purchase transaction each day. You may purchase Class R6 shares from your benefit plan record-keeper or financial intermediary or directly from the Calamos Family of Funds through the Funds' transfer agent. The purchase and redemption options identified in this prospectus are generally available to plan administrators and/or the plans themselves, but not to the individual participants of such plans. Plan participants should contact the financial intermediary and/or plan administrator through which the plan is held for additional information on their respective plan assets and/or how to transact in their respective plan assets, as the Fund's transfer agent, U.S. Bank Global Fund Services will generally have no information with respect to or control over an individual participant's plan assets. For direct investments, please note that neither the Fund nor its transfer agent offers master plan documentation and/or record-keeping services.
To Place Orders
Please contact your broker, benefit plan record-keeper, or other intermediary, or to place your order directly, contact the Fund's transfer agent, U.S. Bank Global Fund Services, toll-free at the number noted below for further instructions:
U.S. Bank Global Fund Services
P.O. Box 701
Milwaukee, WI 53201
Phone: 800.582.6959
Transaction Policies
The Funds' shares are redeemable. In general, investors may purchase, redeem, or exchange Fund shares on any day the New York Stock Exchange is open by written request (to the address noted above), by wire transfer, by telephone (at the number noted above), or through a financial intermediary, depending on how the shares are held. Orders to buy and redeem shares are processed at the next net asset value (share price or "NAV") to be calculated only on days when the New York Stock Exchange is open for regular trading, except as otherwise provided herein (see the "Transaction Information — Share Price" section below for more information).
Class I and Class R6 may not be available for purchase directly from the Funds. Please contact us at 800.582.6959 to inquire further about such availability.
Tax Information
The Funds' distributions will generally be taxable as ordinary income or capital gains, except when your investment is in an IRA, 401(k) or other tax-advantaged investment plan. Any distributions from a retirement account or 401(k) plan may be taxed as ordinary income when withdrawn from such account or plan. Special tax rules apply to investments held through defined contribution plans and other tax-qualified plans.
PROSPECTUS | March 1, 2024
125
Other Important Information Regarding Fund Shares
Payments to Broker-Dealers and Other Financial Intermediaries
If you purchase shares of a Fund through a broker-dealer or other financial intermediary (such as a bank), the Fund and its related companies may pay the intermediary for the sale of Fund shares and related services. These payments may create a conflict of interest by influencing the broker-dealer or other intermediary and your salesperson to recommend the Fund over another investment. Ask your salesperson or visit your financial intermediary's website for more information.
Transferring Shares to Another Financial Intermediary
You may transfer existing shares of the Calamos Funds from one financial intermediary to another financial intermediary provided that the receiving financial intermediary has entered into an agreement with the Funds' Distributor. Certain shareholder services may not be available for the transferred shares and all future trading of these shares must be coordinated by the receiving firm. Before requesting a transfer of shares, existing shareholders should first contact the receiving financial intermediary to determine which share classes are available at that financial intermediary and what services are available to any transferred shares.
If you hold shares through a financial intermediary, please also see the "Reduced sales charges available through certain financial intermediaries" section for more information.
CALAMOS FAMILY OF FUNDS
126
Additional Information About Investment Strategies and Related Risks
What are the investment objectives and principal strategies common to the Funds?
As described above, each Fund has different investment objectives and strategies, and may invest in different securities. The Funds differ principally in (i) how important growth potential and/or current income is considered when selecting investments, (ii) the types of securities selected as investments, such as convertible, fixed-income, equity or foreign securities, and (iii) the risks involved with an investment in a Fund.
When buying and selling growth-oriented securities, the investment adviser focuses on the company's earnings growth potential coupled with financial strength and stability. When buying and selling value-oriented securities, the investment adviser focuses on how a company's stock is valued relative to what the Fund's investment adviser considers to be the company's worth, the financial strength of the issuer and whether there is a near-term catalyst that could trigger an increase in the stock's price. Whether examining growth-oriented or value-oriented securities for selection, the Fund focuses on individual stock selection (referred to as a "bottom-up approach") and quantitative research.
When buying and selling fixed-income securities, the investment adviser's analyses may take into consideration such quantitative factors as an issuer's present and potential liquidity, profitability, internal capability to generate funds, debt/equity ratio and debt servicing capabilities, and such qualitative factors as an assessment of management, industry characteristics, accounting methodology and foreign business exposure.
When buying and selling convertible securities, a Fund typically applies a four-step approach:
1. Evaluating the default risk of the convertible security using traditional credit analysis;
2. Analyzing the convertible security's underlying common stock to determine its capital appreciation potential;
3. Assessing the convertible security's risk/return potential; and
4. Evaluating the convertible security's impact on the Fund's overall composition and diversification strategy.
For certain Funds, the investment adviser takes environmental, social and governance ("ESG") factors into account in making investment decisions.
In analyzing the appreciation potential of the underlying common stock and the default risk of a convertible security, a Fund generally considers the issuer's financial soundness, ability to make interest and dividend payments, earnings and cash flow forecast and quality of management.
In seeking to meet the Funds' respective investment objectives, the Funds' investment adviser utilizes highly disciplined institutional management strategies designed to help enhance investment returns while managing risk. As part of these strategies, an in-depth proprietary analysis is employed on an issuing company and its securities. At the portfolio level, risk management tools are also used, such as diversification across companies, sectors and industries to achieve a risk-reward profile suitable for each Fund's objectives.
The investment objective of each Fund other than Calamos Merger Arbitrage Fund and Calamos International Small Cap Growth Fund may not be changed without the approval of a "majority of the outstanding" shares of that Fund, as defined in the Investment Company Act of 1940, as amended (the "1940 Act"). The investment objectives of Calamos Merger Arbitrage Fund and Calamos International Small Cap Growth Fund are non-fundamental and may be changed by a vote of the Fund's Board, without shareholder approval. There can be no assurance that a Fund will achieve its investment objectives.
Calamos Global Convertible Fund
Although the Fund does not have as its investment objective sustainable investments, the investment adviser takes ESG factors into account in making investment decisions by employing an integrated, ESG screening process. As part of this process, Calamos Advisors reviews the ESG ratings or scores from its third-party vendors to assess sustainability factors, such as the performance of the relevant companies with reference to ESG aspects (with a focus on greenhouse gas emissions). The
PROSPECTUS | March 1, 2024
127
Additional Information About Investment Strategies and Related Risks
investment adviser defines sustainability as the ability to leverage the ESG factors of business practices seeking to generate opportunities and mitigate risks that can contribute to the long-term performance of issuers. ESG rating changes inform the investment adviser to ESG changes in the Fund's current holdings. If the investment adviser determines that certain ESG ratings or scores are material, it could influence any related investment decision.
Principal Risks of Investing in a Fund
This prospectus describes the risks you may face as an investor in the CALAMOS FAMILY OF FUNDS. It is important to keep in mind that generally, investments with a higher potential reward also have a higher risk of losing money. The reverse is also commonly true: the lower the risk, the lower the potential reward. However, as you consider an investment in the Funds, you should also take into account your tolerance for the daily fluctuations of the financial markets and whether you can afford to leave your money in this investment for a long period of time to ride out down periods.
As with any security, there are market and investment risks associated with your investment in the Funds. The value of your investment will fluctuate over time, and it is possible to lose money.
In response to market, economic, political, or other conditions, a Fund may temporarily invest for defensive purposes. If a Fund does so, different factors could affect the Fund's performance, and the Fund may not achieve its investment objective.
What are the principal risks that apply to all of the Funds?
Cybersecurity Risk. Investment companies, such as the Funds, and their service providers are exposed to operational and information security risks resulting from cyberattacks, which may result in financial losses to a Fund and its shareholders. Cyber- attacks include, among other behaviors, stealing or corrupting data maintained online or digitally, denial of service attacks on websites, "ransomware" that renders systems inoperable until ransom is paid, the unauthorized release of confidential information, or various other forms of cybersecurity breaches. Cyber-attacks affecting the Funds or the Funds' investment adviser, custodian, transfer agent, distributor, administrator, intermediaries, trading counterparties, and other third-party service providers may adversely impact the Funds or the companies in which the Funds invest, causing the Funds' investments to lose value or to prevent a shareholder redemption or purchase from clearing in a timely manner.
Inflation Risk. The risk that the value of assets or income from a Fund's investments will be worth less in the future as inflation decreases the value of payments at future dates is considered inflation risk. As inflation increases, the value of a Fund's portfolio could decline. Inflation rates may change frequently and drastically as a result of various factors and a Fund's investments may not keep pace with inflation, which may result in losses to the Fund's investors or adversely affect the value of shareholders' investments in the Fund.
Investment Management Risk. Whether a Fund achieves its investment objective(s) is significantly impacted by whether CALAMOS ADVISORS is able to choose suitable investments for each Fund.
Market Disruption Risk. Certain events have a disruptive effect on securities markets, including but not limited to, terrorist attacks, war and other geopolitical events or catastrophes. The Funds' investment adviser, CALAMOS ADVISORS, cannot predict the effect of similar events in the future on the U.S. or foreign economies. Certain securities such as high yield and equity securities tend to be impacted more by these events than other types of securities in terms of price and volatility.
Market Risk. The risk that the securities markets will increase or decrease in value is considered market risk and applies to any security. If there is a general decline in the stock or fixed-income market, it is possible your investment may lose value regardless of the individual results of the companies in which a Fund invests.
Recent Market Events. Since the 2008 financial crisis, financial markets throughout the world have experienced increased periods of volatility, depressed valuations, decreased liquidity and heightened uncertainty and turmoil. This turmoil resulted in unusual and extreme volatility in the equity and debt markets, in the prices of individual securities and in the world economy. Events that have contributed to these market conditions include, but are not limited to, major cybersecurity events, geopolitical events (such as wars (including Russia's military invasion of the Ukraine), terror attacks, natural or environmental disasters, country instability, and public health emergencies), measures to address budget deficits, downgrading of sovereign debt, declines in oil and commodity prices, dramatic changes in currency exchange rates, and public sentiment. In addition, many
CALAMOS FAMILY OF FUNDS
128
Additional Information About Investment Strategies and Related Risks
governments and quasi-governmental entities throughout the world have responded to the turmoil with a variety of significant fiscal and monetary policy changes, including, but not limited to, direct capital infusions into companies, new monetary programs and dramatically lower interest rates.
The full extent of the political, economic and legal consequences of Brexit are not yet fully known, and the long-term impact of Brexit on the UK, the EU and the broader global economy may be significant. As a result of the political divisions within the UK and between the UK and the EU that the referendum vote has highlighted and the uncertain consequences of Brexit, the UK and European economies and the broader global economy could be significantly impacted, potentially resulting in increased market volatility and illiquidity, political, economic, and legal uncertainty, and lower economic growth for companies that rely significantly on Europe for their business activities and revenues. Any further exits from the EU, or the possibility of such exits, or the abandonment of the Euro, may cause additional market disruption globally and introduce new legal and regulatory uncertainties.
In addition, policy and legislative changes in the United States and in other countries are changing many aspects of financial regulation. The impact of these changes on the markets, and the practical implications for market participants, may not be fully known for some time. Widespread disease and virus epidemics and pandemics, such as the coronavirus outbreak, could likewise be highly disruptive, adversely affecting individual companies, sectors, industries, markets, currencies, interest and inflation rates, credit ratings, investor sentiment, and other factors affecting the value of the Fund's investments.
PROSPECTUS | March 1, 2024
129
Additional Information About Investment Strategies and Related Risks
What are the principal risks specific to each Fund?
|
RISKS |
|
MARKET
NEUTRAL
INCOME
FUND |
|
HEDGED
EQUITY
FUND |
|
PHINEUS
LONG/
SHORT
FUND |
|
MERGER
ARBITRAGE
FUND |
|
CONVERTIBLE
FUND |
|
GLOBAL
CONVERTIBLE
FUND |
|
TIMPANI
SMALL
CAP
GROWTH
FUND |
|
TIMPANI
SMID
GROWTH
FUND |
|
GROWTH
FUND |
|
GROWTH
AND
INCOME
FUND |
|
DIVIDEND
GROWTH
FUND |
|
American Depositary Receipts
Risk |
|
|
|
|
● |
|
|
|
● |
|
|
|
● |
|
|
|
|
|
● |
|
|
|
● |
|
|
|
● |
|
|
|
● |
|
|
|
● |
|
|
|
|
|
Call Risk |
|
|
|
|
|
|
|
|
● |
|
|
|
|
|
|
|
|
|
|
|
|
|
|
|
|
|
Cash Holdings Risk |
|
|
|
|
|
|
● |
|
|
|
|
|
|
|
|
|
● |
|
|
|
● |
|
|
|
|
|
|
|
|
|
Convertible Hedging Risk |
|
|
● |
|
|
|
|
|
|
|
● |
|
|
|
|
|
|
|
|
|
|
|
|
|
|
|
|
|
Convertible Securities Risk |
|
|
● |
|
|
|
● |
|
|
|
|
|
● |
|
|
|
● |
|
|
|
● |
|
|
|
|
|
|
|
|
|
● |
|
|
|
|
|
Correlation Risk |
|
|
|
|
● |
|
|
|
|
|
|
|
|
|
|
|
|
|
|
|
|
|
|
|
|
|
Covered Call Writing Risk |
|
|
● |
|
|
|
● |
|
|
|
|
|
● |
|
|
|
|
|
|
|
|
|
|
|
|
|
|
|
|
|
Currency Risk |
|
|
|
|
● |
|
|
|
● |
|
|
|
● |
|
|
|
|
|
● |
|
|
|
|
|
|
|
|
|
|
|
|
|
Debt Securities Risk |
|
|
● |
|
|
|
● |
|
|
|
|
|
● |
|
|
|
● |
|
|
|
● |
|
|
|
|
|
|
|
|
|
● |
|
|
|
|
|
Derivatives Risk |
|
|
● |
|
|
|
● |
|
|
|
● |
|
|
|
● |
|
|
|
|
|
● |
|
|
|
|
|
|
|
|
|
|
|
|
|
Emerging Markets Risk |
|
|
|
|
|
|
● |
|
|
|
● |
|
|
|
|
|
● |
|
|
|
|
|
|
|
|
|
|
|
|
|
Equity Securities Risk |
|
|
● |
|
|
|
● |
|
|
|
● |
|
|
|
● |
|
|
|
● |
|
|
|
● |
|
|
|
● |
|
|
|
● |
|
|
|
● |
|
|
|
● |
|
|
|
● |
|
|
|
Focused Investing Risk |
|
|
|
|
|
|
|
|
● |
|
|
|
|
|
|
|
|
|
|
|
|
|
|
|
|
|
Foreign Securities Risk |
|
|
● |
|
|
|
● |
|
|
|
● |
|
|
|
● |
|
|
|
● |
|
|
|
● |
|
|
|
● |
|
|
|
● |
|
|
|
● |
|
|
|
● |
|
|
|
● |
|
|
Forward Foreign Currency
Contract Risk |
|
|
|
|
● |
|
|
|
● |
|
|
|
|
|
● |
|
|
|
● |
|
|
|
|
|
|
|
● |
|
|
|
● |
|
|
|
|
Futures and Forward
Contracts Risk |
|
|
|
|
● |
|
|
|
● |
|
|
|
|
|
|
|
● |
|
|
|
|
|
|
|
|
|
|
|
● |
|
|
|
Geographic Concentration Risk |
|
|
|
|
|
|
● |
|
|
|
|
|
|
|
● |
|
|
|
|
|
|
|
|
|
|
|
|
|
Growth Stock Risk |
|
|
|
|
|
|
|
|
|
|
|
|
|
|
● |
|
|
|
● |
|
|
|
● |
|
|
|
● |
|
|
|
|
|
Hedging Transaction Risk |
|
|
|
|
|
|
|
|
● |
|
|
|
|
|
|
|
|
|
|
|
|
|
|
|
|
High Yield Fixed-Income Securities
(Junk Bond) Risk |
|
|
● |
|
|
|
|
|
|
|
● |
|
|
|
● |
|
|
|
● |
|
|
|
|
|
|
|
|
|
● |
|
|
|
|
Lack of Correlation Risk;
Hedging Risk |
|
|
|
|
|
|
|
|
● |
|
|
|
|
|
|
|
|
|
|
|
|
|
|
|
|
|
Large-Capitalization Investing Risk |
|
|
|
|
|
|
|
|
|
|
|
|
|
|
|
|
|
|
|
|
|
|
|
|
Large Shareholder Risk |
|
|
|
|
|
|
|
|
|
|
|
|
|
|
|
|
|
|
|
|
|
|
|
|
Leveraging Risk |
|
|
|
|
|
|
● |
|
|
|
|
|
|
|
|
|
|
|
|
|
|
|
|
|
|
|
Liquidity Risk |
|
|
● |
|
|
|
|
|
● |
|
|
|
● |
|
|
|
● |
|
|
|
|
|
● |
|
|
|
● |
|
|
|
|
|
● |
|
|
|
|
Merger and Other Arbitrage
Transactions Risk |
|
|
|
|
|
|
|
|
● |
|
|
|
|
|
|
|
|
|
|
|
|
|
|
|
|
|
Mid-Sized Company Risk |
|
|
● |
|
|
|
|
|
● |
|
|
|
● |
|
|
|
● |
|
|
|
|
|
|
|
● |
|
|
|
● |
|
|
|
● |
|
|
|
|
|
MLP Risk |
|
|
|
|
|
|
|
|
● |
|
|
|
|
|
|
|
|
|
|
|
|
|
|
|
● |
|
|
Mortgage-Related and Other
Asset-Backed Securities Risk |
|
|
|
|
|
|
|
|
|
|
|
|
|
|
|
|
|
|
|
|
|
|
|
|
Non-diversified Fund Risk |
|
|
|
|
|
|
|
|
● |
|
|
|
|
|
|
|
|
|
|
|
|
|
|
|
|
Non-U.S. Government
Obligations Risk |
|
|
|
|
|
|
|
|
|
|
|
|
|
|
|
|
|
|
|
|
|
|
|
|
Options Risk |
|
|
● |
|
|
|
● |
|
|
|
● |
|
|
|
● |
|
|
|
● |
|
|
|
● |
|
|
|
|
|
|
|
● |
|
|
|
● |
|
|
|
● |
|
|
Other Investment Companies
(including ETFs) Risk |
|
|
● |
|
|
|
● |
|
|
|
● |
|
|
|
● |
|
|
|
|
|
|
|
|
|
|
|
|
|
|
|
|
|
Portfolio Selection Risk |
|
|
● |
|
|
|
● |
|
|
|
● |
|
|
|
● |
|
|
|
● |
|
|
|
● |
|
|
|
● |
|
|
|
● |
|
|
|
● |
|
|
|
● |
|
|
|
● |
|
|
CALAMOS FAMILY OF FUNDS
130
Additional Information About Investment Strategies and Related Risks
|
RISKS |
|
MARKET
NEUTRAL
INCOME
FUND |
|
HEDGED
EQUITY
FUND |
|
PHINEUS
LONG/
SHORT
FUND |
|
MERGER
ARBITRAGE
FUND |
|
CONVERTIBLE
FUND |
|
GLOBAL
CONVERTIBLE
FUND |
|
TIMPANI
SMALL
CAP
GROWTH
FUND |
|
TIMPANI
SMID
GROWTH
FUND |
|
GROWTH
FUND |
|
GROWTH
AND
INCOME
FUND |
|
DIVIDEND
GROWTH
FUND |
|
|
Portfolio Turnover Risk |
|
|
● |
|
|
|
● |
|
|
|
● |
|
|
|
● |
|
|
|
|
|
● |
|
|
|
● |
|
|
|
● |
|
|
|
|
|
|
|
|
|
REITs Risk |
|
|
|
|
|
|
|
|
|
|
|
|
|
|
|
|
|
|
|
|
|
|
|
|
RIC Qualification Risk |
|
|
|
|
|
|
|
|
|
|
|
|
|
|
|
|
|
|
|
|
|
|
● |
|
|
|
Rule 144A Securities Risk |
|
|
● |
|
|
|
● |
|
|
|
|
|
● |
|
|
|
● |
|
|
|
● |
|
|
|
|
|
|
|
|
|
● |
|
|
|
● |
|
|
|
Sector Risk |
|
|
● |
|
|
|
● |
|
|
|
● |
|
|
|
● |
|
|
|
● |
|
|
|
● |
|
|
|
● |
|
|
|
● |
|
|
|
● |
|
|
|
|
|
|
|
Securities Lending Risk |
|
|
● |
|
|
|
● |
|
|
|
● |
|
|
|
|
|
● |
|
|
|
● |
|
|
|
|
|
|
|
● |
|
|
|
● |
|
|
|
● |
|
|
|
Short Sale Risk |
|
|
● |
|
|
|
● |
|
|
|
● |
|
|
|
● |
|
|
|
|
|
|
|
|
|
|
|
|
|
|
|
|
|
Small Company Risk |
|
|
● |
|
|
|
|
|
● |
|
|
|
● |
|
|
|
● |
|
|
|
|
|
● |
|
|
|
● |
|
|
|
|
|
● |
|
|
|
|
Special Purpose Acquisition
Companies Risk |
|
|
● |
|
|
|
|
|
|
|
● |
|
|
|
|
|
|
|
|
|
|
|
|
|
|
|
|
Special Situations or
Event-Driven Risk |
|
|
|
|
|
|
|
|
● |
|
|
|
|
|
|
|
|
|
|
|
|
|
|
|
|
|
Sustainability (ESG) Policy Risk |
|
|
|
|
|
|
|
|
|
|
|
|
|
|
|
|
|
|
|
|
|
|
|
Synthetic Convertible
Instruments Risk |
|
|
● |
|
|
|
|
|
|
|
● |
|
|
|
● |
|
|
|
● |
|
|
|
|
|
|
|
|
|
● |
|
|
|
|
|
Tax Risk |
|
|
● |
|
|
|
● |
|
|
|
|
|
● |
|
|
|
● |
|
|
|
● |
|
|
|
|
|
|
|
|
|
● |
|
|
|
● |
|
|
|
Total Return Swap Risk |
|
|
● |
|
|
|
|
|
|
|
● |
|
|
|
|
|
|
|
|
|
|
|
|
|
|
|
|
|
U.S. Government Security Risk |
|
|
|
|
|
|
|
|
● |
|
|
|
|
|
|
|
|
|
|
|
|
|
|
|
|
|
Value Stock Risk |
|
|
|
|
|
|
|
|
|
|
|
|
|
|
|
|
|
|
|
|
|
|
|
|
Warrants Risk |
|
|
|
|
|
|
|
|
● |
|
|
|
|
|
|
|
|
|
|
|
|
|
|
|
|
PROSPECTUS | March 1, 2024
131
Additional Information About Investment Strategies and Related Risks
|
RISKS
|
|
SELECT
FUND
|
|
INTERNATIONAL
GROWTH
FUND
|
|
EVOLVING
WORLD
GROWTH
FUND
|
|
GLOBAL
EQUITY
FUND
|
|
GLOBAL
OPPORTUNITIES
FUND
|
|
INTERNATIONAL
SMALL CAP
GROWTH
FUND
|
|
TOTAL
RETURN
BOND
FUND
|
|
HIGH
INCOME
OPPORTUNITIES
FUND
|
|
SHORT-
TERM
BOND
FUND
|
|
|
American Depositary Receipts Risk
|
|
|
●
|
|
|
|
●
|
|
|
|
●
|
|
|
|
●
|
|
|
|
●
|
|
|
|
●
|
|
|
|
|
|
|
|
|
|
Call Risk
|
|
|
|
|
|
|
|
|
|
|
|
|
|
|
|
|
|
|
|
|
Cash Holdings Risk
|
|
|
|
|
|
|
|
|
|
|
|
|
|
|
|
|
|
|
●
|
|
|
|
Convertible Hedging Risk
|
|
|
|
|
|
|
|
|
|
|
|
|
|
|
|
|
|
|
|
|
Convertible Securities Risk
|
|
|
|
|
|
|
●
|
|
|
|
|
|
●
|
|
|
|
|
|
●
|
|
|
|
●
|
|
|
|
●
|
|
|
|
Correlation Risk
|
|
|
|
|
|
|
|
|
|
|
|
|
|
|
|
|
|
|
|
|
Covered Call Writing Risk
|
|
|
|
|
|
|
|
|
|
|
|
|
|
|
|
|
|
|
|
|
Currency Risk
|
|
|
|
|
|
|
|
|
|
|
|
|
●
|
|
|
|
|
|
|
|
●
|
|
|
|
Debt Securities Risk
|
|
|
|
|
|
|
●
|
|
|
|
|
|
●
|
|
|
|
|
|
●
|
|
|
|
●
|
|
|
|
●
|
|
|
|
Derivatives Risk
|
|
|
|
|
|
|
|
|
|
|
|
|
|
|
●
|
|
|
|
●
|
|
|
|
●
|
|
|
|
Emerging Markets Risk
|
|
|
|
|
●
|
|
|
|
●
|
|
|
|
●
|
|
|
|
●
|
|
|
|
●
|
|
|
|
|
|
●
|
|
|
|
●
|
|
|
|
Equity Securities Risk
|
|
|
●
|
|
|
|
●
|
|
|
|
●
|
|
|
|
●
|
|
|
|
●
|
|
|
|
●
|
|
|
|
|
|
●
|
|
|
|
|
|
Focused Investing Risk
|
|
|
|
|
|
|
|
|
|
|
|
|
|
|
|
|
|
|
|
|
Foreign Securities Risk
|
|
|
●
|
|
|
|
●
|
|
|
|
●
|
|
|
|
●
|
|
|
|
●
|
|
|
|
●
|
|
|
|
●
|
|
|
|
●
|
|
|
|
●
|
|
|
|
Forward Foreign Currency Contract Risk
|
|
|
|
|
●
|
|
|
|
●
|
|
|
|
●
|
|
|
|
|
|
●
|
|
|
|
|
|
|
|
|
|
Futures and Forward Contracts Risk
|
|
|
|
|
|
|
|
|
|
|
|
|
|
|
●
|
|
|
|
●
|
|
|
|
|
|
Geographic Concentration Risk
|
|
|
|
|
|
|
|
|
|
|
|
|
|
|
|
|
|
|
|
|
Growth Stock Risk
|
|
|
|
|
●
|
|
|
|
●
|
|
|
|
●
|
|
|
|
●
|
|
|
|
●
|
|
|
|
|
|
|
|
|
|
Hedging Transaction Risk
|
|
|
|
|
|
|
|
|
|
|
|
|
|
|
|
|
|
|
|
|
High Yield Fixed-Income Securities (Junk Bond) Risk
|
|
|
|
|
|
|
●
|
|
|
|
|
|
●
|
|
|
|
|
|
●
|
|
|
|
●
|
|
|
|
●
|
|
|
|
Lack of Correlation Risk; Hedging Risk
|
|
|
|
|
|
|
|
|
|
|
|
|
|
|
|
|
|
|
|
|
Large-Capitalization Investing Risk
|
|
|
|
|
|
|
|
|
|
|
|
|
|
|
|
|
|
|
|
|
Large Shareholder Risk
|
|
|
|
|
|
|
|
|
|
|
|
|
|
|
|
|
|
|
●
|
|
|
|
Leveraging Risk
|
|
|
|
|
|
|
|
|
|
|
|
|
|
|
|
|
|
|
|
|
Liquidity Risk
|
|
|
|
|
|
|
|
|
|
|
●
|
|
|
|
|
|
|
|
|
|
|
|
Merger and Other Arbitrage Transactions Risk
|
|
|
|
|
|
|
|
|
|
|
|
|
|
|
|
|
|
|
|
|
Mid-Sized Company Risk
|
|
|
●
|
|
|
|
●
|
|
|
|
|
|
●
|
|
|
|
●
|
|
|
|
|
|
|
|
|
|
|
|
MLP Risk
|
|
|
|
|
|
|
|
|
|
|
|
|
|
|
●
|
|
|
|
●
|
|
|
|
|
Mortgage-Related and Other Asset-Backed
Securities Risk
|
|
|
|
|
|
|
|
|
|
|
|
|
|
|
●
|
|
|
|
●
|
|
|
|
●
|
|
|
|
Non-diversified Fund Risk
|
|
|
|
|
|
|
|
|
|
|
|
|
|
|
|
|
|
|
|
|
Non-U.S. Government Obligations Risk
|
|
|
|
|
|
|
|
|
|
|
|
|
|
|
●
|
|
|
|
|
|
●
|
|
|
|
Options Risk
|
|
|
●
|
|
|
|
|
|
|
|
|
|
●
|
|
|
|
●
|
|
|
|
●
|
|
|
|
●
|
|
|
|
●
|
|
|
|
Other Investment Companies (including ETFs) Risk
|
|
|
|
|
|
|
|
|
|
|
|
|
|
|
●
|
|
|
|
●
|
|
|
|
●
|
|
|
|
Portfolio Selection Risk
|
|
|
●
|
|
|
|
●
|
|
|
|
●
|
|
|
|
●
|
|
|
|
●
|
|
|
|
●
|
|
|
|
●
|
|
|
|
●
|
|
|
|
●
|
|
|
|
Portfolio Turnover Risk
|
|
|
|
|
●
|
|
|
|
●
|
|
|
|
|
|
|
|
|
|
|
|
|
|
|
|
REITs Risk
|
|
|
|
|
|
|
|
|
|
|
|
|
|
|
|
|
|
|
|
|
RIC Qualification Risk
|
|
|
|
|
|
|
|
|
|
|
|
|
|
|
|
|
●
|
|
|
|
|
|
Rule 144A Securities Risk
|
|
|
|
|
|
|
|
|
|
|
●
|
|
|
|
|
|
●
|
|
|
|
●
|
|
|
|
●
|
|
|
|
Sector Risk
|
|
|
●
|
|
|
|
|
|
●
|
|
|
|
●
|
|
|
|
●
|
|
|
|
●
|
|
|
|
|
|
|
|
|
|
Securities Lending Risk
|
|
|
●
|
|
|
|
●
|
|
|
|
●
|
|
|
|
●
|
|
|
|
●
|
|
|
|
●
|
|
|
|
●
|
|
|
|
●
|
|
|
|
●
|
|
|
|
Short Sale Risk
|
|
|
|
|
|
|
|
|
|
|
|
|
|
|
|
|
|
|
|
|
Small Company Risk
|
|
|
●
|
|
|
|
●
|
|
|
|
|
|
●
|
|
|
|
●
|
|
|
|
●
|
|
|
|
|
|
|
|
|
|
Special Purpose Acquisition Companies Risk
|
|
|
|
|
|
|
|
|
|
|
|
|
|
|
|
|
|
|
|
|
Special Situations or Event-Driven Risk
|
|
|
|
|
|
|
|
|
|
|
|
|
|
|
|
|
|
|
|
|
Sustainability (ESG) Policy Risk
|
|
|
|
|
|
|
|
|
|
|
|
|
●
|
|
|
|
|
|
|
|
|
CALAMOS FAMILY OF FUNDS
132
Additional Information About Investment Strategies and Related Risks
|
RISKS |
|
SELECT
FUND |
|
INTERNATIONAL
GROWTH
FUND |
|
EVOLVING
WORLD
GROWTH
FUND |
|
GLOBAL
EQUITY
FUND |
|
GLOBAL
OPPORTUNITIES
FUND |
|
INTERNATIONAL
SMALL CAP
GROWTH
FUND |
|
TOTAL
RETURN
BOND
FUND |
|
HIGH
INCOME
OPPORTUNITIES
FUND |
|
SHORT-
TERM
BOND
FUND |
|
|
Synthetic Convertible Instruments Risk |
|
|
|
|
|
|
● |
|
|
|
|
|
● |
|
|
|
|
|
● |
|
|
|
● |
|
|
|
|
|
Tax Risk |
|
|
|
|
|
|
|
|
|
|
● |
|
|
|
|
|
● |
|
|
|
● |
|
|
|
|
|
Total Return Swap Risk |
|
|
|
|
|
|
|
|
|
|
|
|
|
|
● |
|
|
|
|
|
|
|
U.S. Government Security Risk |
|
|
|
|
|
|
|
|
|
|
|
|
|
|
● |
|
|
|
● |
|
|
|
● |
|
|
|
Value Stock Risk |
|
|
● |
|
|
|
|
|
|
|
● |
|
|
|
|
|
|
|
|
|
|
|
|
|
Warrants Risk |
|
|
|
|
|
|
|
|
|
|
|
|
|
|
|
|
|
|
|
American Depositary Receipts Risk. The stocks of most foreign companies that trade in the U.S. markets are traded as American Depositary Receipts (ADRs). U.S. depositary banks issue these stocks. Each ADR represents one or more shares of foreign stock or a fraction of a share. The price of an ADR corresponds to the price of the foreign stock in its home market, adjusted to the ratio of the ADRs to foreign company shares. Therefore while purchasing a security on a U.S. exchange, the risks inherently associated with foreign investing still apply to ADRs.
Call Risk. A fixed-income security may be redeemed before maturity ("called") below its current market price, and a call may lead to the reinvestment of proceeds at a lower interest rate, or with higher credit risk or other less favorable characteristics.
Cash Holdings Risk. The Fund may invest in cash and cash equivalents for indefinite periods of time when the Fund's investment adviser determines the prevailing market environment warrants doing so. When the Fund holds cash positions, it may lose opportunities to participate in market appreciation, which may result in lower returns than if the Fund had remained fully invested in the market. Furthermore, cash and cash equivalents may generate minimal or no income and could negatively impact the Fund's performance and ability to achieve its investment objective.
Convertible Hedging Risk. If the market price of the underlying common stock increases above the conversion price on a convertible security, the price of the convertible security will increase. The Fund's increased liability on any outstanding short position would, in whole or in part, reduce this gain.
Convertible Securities Risk. The value of a convertible security is influenced by both the yield of non-convertible securities of comparable issuers and by the value of the underlying common stock. The value of a convertible security viewed without regard to its conversion feature (i.e., strictly on the basis of its yield) is sometimes referred to as its "investment value." A convertible security's investment value tends to decline as prevailing interest rate levels increase. Conversely, a convertible security's investment value increases as prevailing interest rate levels decline. However, a convertible security's market value will also be influenced by its "conversion value," which is the market value of the underlying common stock that would be obtained if the convertible security were converted. A convertible security's conversion value tends to increase as the price of the underlying common stock increases, and decrease as the price of the underlying common stock decreases.
As the market price of the underlying common stock declines such that the conversion value is substantially below the investment value of the convertible security, the price of the convertible security tends to be influenced more by the yield of the convertible security. Thus, it may not decline in price to the same extent as the underlying common stock.
If the market price of the underlying common stock increases to a point where the conversion value approximates or exceeds the investment value, the price of the convertible security tends to be influenced more by the market price of the underlying common stock. In the event of a liquidation of the issuing company, holders of convertible securities would be paid before the company's common stockholders. Consequently, the issuer's convertible securities entail less risk than its common stock.
Correlation Risk. The effectiveness of a Fund's index option-based risk management strategy may be reduced if the performance of the Fund's equity portfolio does not correlate to that of the indices underlying its option positions.
Covered Call Writing Risk. As the writer of a covered call option on a security, the Fund foregoes, during the option's life, the opportunity to profit from increases in the market value of the security covering the call option above the sum of the premium and the exercise price of the call.
PROSPECTUS | March 1, 2024
133
Additional Information About Investment Strategies and Related Risks
Currency Risk. To the extent that a Fund invests in securities or other instruments denominated in or indexed to foreign currencies, changes in currency exchange rates bring an added dimension of risk. Currency fluctuations could negatively impact investment gains or add to investment losses. Although a Fund may attempt to hedge against currency risk, the hedging instruments may not always perform as the Fund expects and could produce losses. Suitable hedging instruments may not be available for currencies of emerging market countries. A Fund's investment adviser may determine not to hedge currency risks, even if suitable instruments appear to be available.
Debt Securities Risk. Debt securities are subject to various risks, including interest rate risk, credit risk and default risk.
Interest Rate Risk. Interest rate risk is the risk that a Fund's investments in debt securities will decrease in value as a result of an increase in interest rates. Generally, there is an inverse relationship between the value of a debt security and interest rates. Therefore, the value of debt securities generally decrease in periods when interest rates are rising. In addition, interest rate changes typically have a greater effect on prices of longer-term debt securities than shorter-term debt securities. Changes in interest rates by the Federal Reserve Board, and other events affecting fixed-income markets, may subject a Fund to heightened interest rate risk as a result of a rise in interest rates. In addition, a Fund is subject to the risk that interest rates may exhibit increased volatility, which could cause the Fund's net asset value to fluctuate more. A decrease in fixed-income market maker capacity may act to decrease liquidity in the fixed-income markets and act to further increase volatility, affecting a Fund's return.
Credit Risk. Credit risk is the risk that a debt security could deteriorate in quality to such an extent that its rating is downgraded or its market value declines relative to comparable securities. Changes in actual or perceived creditworthiness may occur quickly. If a Fund holds securities that have been downgraded, or that default on payment, such Fund's performance could be negatively affected.
Default Risk. Default risk refers to the risk that a company that issues a debt security will be unable to fulfill its obligation to repay principal and interest. The lower a bond is rated, the greater its default risk. To the extent the Fund holds securities that have been downgraded, or that default on payment, its performance could be negatively affected.
Derivatives Risk. Derivatives are instruments, such as futures and forward foreign currency contracts, whose value is derived from that of other assets, rates or indices. Derivatives may be more volatile than other investments and may magnify a Fund's gains or losses. Successful use of derivatives depends upon the level to which prices of the underlying assets correlate with price movements in the derivatives a Fund buys or sells. A Fund could be negatively affected if the change in market value of its securities fails to correlate with the value of derivatives it purchased or sold. The potential lack of a liquid market for a derivative may prevent a Fund from closing its derivatives positions to limit losses or realize profits. Derivatives may be purchased for a fraction of their value and small price movements may result in an immediate and substantial loss to a Fund.
The use of derivatives for non-hedging purposes may be considered more speculative than other types of investments. Derivatives can be used for hedging (attempting to reduce risk by offsetting one investment position with another) or non-hedging purposes. Hedging with derivatives may increase expenses, and there is no guarantee that a hedging strategy will work. While hedging can reduce or eliminate losses, it can also reduce or eliminate gains. In addition, derivative instruments are subject to counterparty risk, meaning that the party with whom the Fund enters into the derivatives transaction (e.g., the clearinghouse or the broker holding the Fund's position for a futures contract or the counterparty for a forward contract) may experience a significant credit event and/or may be unwilling or unable to make timely settlement payments or otherwise honor its obligations. Changes in the value of a derivative may not correlate perfectly with the underlying asset, rate or index, and a Fund could lose more than the principal amount invested.
Emerging Markets Risk. Investment in foreign securities may include investment in securities of foreign issuers located in less developed countries, which are sometimes referred to as emerging markets. Emerging market countries may have relatively unstable governments and economies based on only a few industries, which may cause greater instability. The value of emerging market securities will likely be particularly sensitive to changes in the economies of such countries (such as reversals of economic liberalization, political unrest or changes in trading status). These countries are also more likely to experience higher levels of inflation, deflation or currency devaluations, which could hurt their economies and securities markets. Certain emerging markets are sometimes referred to as "frontier markets." Frontier markets, the least advanced capital markets in the
CALAMOS FAMILY OF FUNDS
134
Additional Information About Investment Strategies and Related Risks
developing world, are among the riskiest markets in the world in which to invest. Frontier markets have the fewest number of investors and investment holdings and may not even have stock markets on which to trade. Investments in this sector are typically illiquid, nontransparent and subject to very low regulation levels as well as high transaction fees, and may also have substantial political and currency risk. Emerging and frontier markets both offer the prospect of higher returns with higher risk. However, emerging markets are more stable and developed than frontier markets. The economies of emerging market countries have achieved a rudimentary level of development, while frontier markets represent the least economically developed nations in the global marketplace. Emerging and frontier markets also carry several types of investment risk, including market, political and currency risk, as well as the risk of nationalization.
Equity Securities Risk. Equity investments are subject to greater fluctuations in market value than other asset classes as a result of such factors as a company's business performance, investor perceptions, stock market trends and general economic conditions.
Focused Investing Risk. To the extent that the Fund invests a substantial portion of its assets in securities related to a particular industry, sector, market segment, or geographic area, its investments will be sensitive to developments in that industry, sector, market segment, or geographic area. The Fund is subject to the risk that changing economic conditions; changing political or regulatory conditions; or natural and other disasters affecting the particular industry, sector, market segment, or geographic area in which the Fund focuses its investments could have a significant impact on its investment performance and could ultimately cause the Fund to underperform, or its net asset value to be more volatile than, other funds that invest more broadly.
Foreign Securities Risk. There are special risks associated with investing in foreign securities that are not typically associated with investing in U.S. companies. These risks include fluctuations in the exchange rates of foreign currencies that may affect the U.S. dollar value of a security, and the possibility of substantial price volatility as a result of political and economic instability in the foreign country. Other risks of investing in foreign securities include: less public information about issuers of securities, different securities regulation, different accounting, auditing and financial reporting standards and less liquidity in foreign markets than in U.S. markets.
Forward Foreign Currency Contract Risk. Forward foreign currency contracts are contractual agreements to purchase or sell a specified currency at a specified future date (or within a specified time period) at a price set at the time of the contract. A Fund may not fully benefit from, or may lose money on, forward foreign currency transactions if changes in currency exchange rates do not occur as anticipated or do not correspond accurately to changes in the value of a Fund's holdings. A Fund's ability to use forward foreign currency transactions successfully depends on a number of factors, including the forward foreign currency transactions being available at attractive prices, the availability of liquid markets and the ability of the portfolio managers to accurately predict the direction of changes in currency exchange rates. Currency exchange rates may be volatile and may be affected by, among other factors, the general economics of a country, the actions of U.S. and foreign governments or central banks, the imposition of currency controls and speculation. Currency transactions are also subject to the risk that the other party in the transaction will default on its contractual obligations, which would deprive a Fund of unrealized profits or force a Fund to cover its commitments for purchase or sale of a currency, if any, at the current market price.
Futures and Forward Contracts Risk. Futures contracts provide for the future sale by one party and purchase by another of a specific asset at a specific time and price (with or without delivery required). Futures contracts are standardized contracts traded on a recognized exchange. An option on a futures contract gives the purchaser the right, in exchange for a premium, to assume a position in a futures contract at a specified exercise price during the term of the option. Futures and forward contracts are subject to counterparty risk, meaning that the party with whom a Fund enters into the derivatives transaction (the clearinghouse or the broker holding the Fund's position for a futures contract or the counterparty for a forward contract) may experience a significant credit event and/or may be unwilling or unable to make timely settlement payments or otherwise honor its obligations.
Geographic Concentration Risk. Investments in a particular country or geographic region may be particularly susceptible to political, diplomatic or economic conditions and regulatory requirements. To the extent a Fund concentrates its investments in a particular country, region or group of regions, the Fund may be more volatile than a more geographically diversified fund.
PROSPECTUS | March 1, 2024
135
Additional Information About Investment Strategies and Related Risks
Growth Stock Risk. Growth securities experience relatively rapid earnings growth and typically trade at higher multiples of current earnings than other securities. Therefore, growth securities may be more sensitive to changes in current or expected earnings than other securities. Growth securities also may be more volatile because growth companies usually invest a high portion of earnings in their business, and they may lack the dividends of value stocks that can lessen the decreases in stock prices in a falling market. A company may never achieve the earnings expansion the Fund anticipates.
Hedging Transaction Risk. The success of the Fund's hedging strategies will be subject to Calamos Advisors' ability to correctly assess the degree of correlation between the performance of the instruments used in the hedging strategies and the performance of the investments in the Fund's portfolio being hedged. Hedging transactions involve the risk of imperfect correlation. Imperfect correlation may prevent the Fund from achieving the intended hedge or expose the Fund to risk of loss. Hedging transactions also limit the opportunity for gain if the value of a hedged portfolio position should increase.
High Yield Fixed-Income Securities (Junk Bonds) Risk. Investment in junk bonds entails a greater risk than an investment in higher-rated securities. Although junk bonds typically pay higher interest rates than investment-grade bonds, there is a greater likelihood that the company issuing the junk bond will default on interest and principal payments. In the event of an issuer's bankruptcy, claims of other creditors may have priority over the claims of junk bond holders, leaving few or no assets to repay them. Junk bonds are also more sensitive to adverse economic changes or individual corporate developments than higher quality bonds. During a period of adverse economic changes, including a period of rising interest rates, companies issuing junk bonds may be unable to make principal and interest payments.
Lack of Correlation Risk; Hedging Risk. There can be no assurance that the Fund's hedges will be effective. Any decrease in negative correlation or increase in positive correlation between the positions Calamos Advisors anticipated would be offsetting (such as short and long positions in securities or currencies held by the Fund) could result in significant losses for the Fund.
Large-Capitalization Investing Risk. Large-capitalization stocks as a group could fall out of favor with the market, which may cause a Fund to underperform funds that focus on other types of stocks. In addition, larger, more established companies may be unable to respond quickly to new competitive challenges such as changes in technology and consumer preferences. Many larger companies also may not be able to attain the high growth rate of successful smaller companies, especially during extended periods of economic expansion.
Large Shareholder Risk. From time to time, shareholders of the Fund (which may include other Calamos funds) may make relatively large redemptions or purchases of fund shares. These transactions may cause the Fund to sell securities or invest additional cash, as the case may be, at disadvantageous prices. Redemptions of a large number of shares also may increase transaction and other costs or have adverse tax consequences for shareholders of the Fund by requiring a sale of portfolio securities. Purchases of a large number of shares may adversely affect the Fund's performance to the extent that it takes time to invest new cash and the Fund maintains a larger cash position than it ordinarily would.
Leveraging Risk. Leverage is the potential for the Fund to participate in gains and losses on an amount that exceeds the Fund's investment. Leveraging risk is the risk that certain transactions of the Fund may cause the Fund to be more volatile and experience greater losses than if it had not been leveraged. A Fund's use of short sales and investments in derivatives subject the Fund to leveraging risk.
Liquidity Risk. Liquidity risk exists when particular investments are difficult to purchase or sell. The Fund's investments in illiquid securities may reduce the returns of the Fund because it may be unable to sell the illiquid securities at an advantageous time or price.
Merger and Other Arbitrage Transactions Risk. In the case of an investment in a potential acquisition target, if the proposed merger, exchange offer or cash tender offer appears likely not to be consummated, in fact is not consummated, or is delayed, the market price of the security to be tendered or exchanged will usually decline sharply, resulting in a loss to the Fund. Every merger transaction is subject to unique risks. The risks of investing in securities related to a merger or acquisition transaction include the risk that the transaction is renegotiated, the risk that the transaction takes longer to complete than originally planned, and the risk that the transaction is never completed. These risks may occur for a variety of reasons, such as the inability to finance the transaction, lack of regulatory approval from the applicable state, federal or international regulatory
CALAMOS FAMILY OF FUNDS
136
Additional Information About Investment Strategies and Related Risks
agencies, or the failure of shareholders of the party companies to approve the transaction. These risks could cause the Fund to incur a loss
Mid-Sized Company Risk. Mid-sized company stocks have historically been subject to greater investment risk than large company stocks. The risks generally associated with these companies include more limited product lines, markets and financial resources, lack of management depth or experience, dependency on key personnel, and vulnerability to adverse market and economic developments. Accordingly, the prices of mid-sized company stocks tend to be more volatile than prices of large company stocks.
MLP Risk. Investments in securities of MLPs involve risk that differ from investments in common stock, including risks related to limited control and limited rights to vote on matters affecting the MLP, risks related to the potential conflicts of interest between the MLP and the MLP's general partners, cash flow risks, dilution risks and risks related to the general partners right to require unit holders to sell their common units at an undesirable time or price.
MLP Tax Risk. MLPs generally do not pay federal income tax at the partnership level. Rather, each partner is allocated a share of the partnerships' income, gains, losses, deductions and credits. A change in current tax law, or a change in the underlying business of an MLP, could result in an MLP being treated as a corporation, instead of a partnership, for federal income tax purposes, which would result in such MLP being required to pay income tax on its taxable income. This would have the effect of reducing the amount of cash available for distribution by the MLP, potentially reducing the value of the Fund's investment and consequently your investment in the Fund.
MLP Liquidity Risk. Although common units of MLPs trade on the NYSE, the NASDAQ and Amex, certain MLP securities trade less frequently than those of larger companies due to their smaller capitalization. As a result, the price of such MLPs may display abrupt and erratic movements at times. Additionally it may be more difficult for the Fund to buy and sell significant amounts of such securities without unfavorable impact on prevailing market process. As a result, these securities may be difficult to dispose of at a fair price when the Adviser desires to do so. This may adversely affect the Fund's ability to take advantage of other market opportunities or make dividend distributions.
Equity Securities of MLPs Risk. MLP common units, like other equity securities, can be affected by macro-economic and other factors affecting the stock market in general, expectations of interest rates, investor sentiment towards an issuer or certain market sector, changes in a particular issuer's financial condition, or unfavorable or unanticipated poor performance of a particular issuer (in the case of MLPs, generally measured in terms of distributable cash flow). Prices of common units of individual MLPs, like the prices other equity securities, also can be affected by fundamentals unique to the partnership or company, including earnings power and coverage ratios.
Mortgage-related and Other Asset-backed Securities Risk. In addition to general fixed-income instrument risks, mortgage- related and asset-backed securities are subject to extension risk and prepayment risk.
Extension Risk. Rising interest rates tend to extend the duration of mortgage-related securities, making them more sensitive to changes in interest rates. As a result, in a period of rising interest rates, if the Fund holds mortgage-related securities, it may exhibit additional volatility.
Prepayment Risk. When interest rates decline, the value of mortgage-related securities with prepayment features may not increase as much as other fixed-income securities because borrowers may pay off their mortgages sooner than expected. In addition, the potential impact of prepayment on the price of asset-backed and mortgage-backed securities may be difficult to predict and result in greater volatility.
Non-diversified Fund Risk. As a non-diversified fund, the Fund may invest a greater percentage of its assets in a smaller number of investments than a diversified fund. Therefore, the Fund may be subject to increased risk as a result of changes in the financial condition or the market's assessment of such investments.
Non-U.S. Government Obligation Risk. An investment in debt obligations of non-U.S. governments and their political subdivisions involves special risks that are not present in corporate debt obligations. The non-U.S. issuer of the sovereign debt or the non-U.S. governmental authorities that control the repayment of the debt may be unable or unwilling to repay principal
PROSPECTUS | March 1, 2024
137
Additional Information About Investment Strategies and Related Risks
or interest when due, and the Fund may have limited recourse in the event of a default. During periods of economic uncertainty, the market prices of sovereign debt may be more volatile than prices of debt obligations of U.S. issuers.
Options Risk. There are significant differences between the securities and options markets that could result in an imperfect correlation among these markets, causing a given transaction not to achieve its objectives. A Fund's ability to utilize options successfully will depend on CALAMOS ADVISORS' ability to predict pertinent market movements, which cannot be assured.
A Fund's ability to close out its position as a purchaser or seller of an Options Clearing Corporation or exchange-listed put or call option is dependent, in part, upon the liquidity of the options market. If a Fund were unable to close out an option that it had purchased on a security, it would have to exercise the option to realize any profit or the option would expire and become worthless. If a Fund were unable to close out a covered call option that it had written on a security, it would not be able to sell the underlying security until the option expired. As the writer of a covered call option on a security, a Fund foregoes, during the option's life, the opportunity to profit from increases in the market value of the security covering the call option above the sum of the premium and the exercise price of the call. The hours of trading for listed options may not coincide with the hours during which the underlying financial instruments are traded. To the extent that the option markets close before the markets for the underlying financial instruments, significant price and rate movements can take place in the underlying markets that cannot be reflected in the option markets until the next trading day.
Unless the parties provide for it, there is no central clearing or guaranty function in an over-the-counter option. As a result, if the counterparty fails to make or take delivery of the security or other instrument underlying an over-the-counter option it has entered into with a Fund or fails to make a cash settlement payment due in accordance with the terms of that option, the Fund will lose any premium it paid for the option as well as any anticipated benefit of the transaction. Accordingly, CALAMOS ADVISORS must assess the creditworthiness of each such counterparty or any guarantor or credit enhancement of the counterparty's credit to determine the likelihood that the terms of the over-the-counter option will be satisfied.
A Fund may also purchase or write over-the-counter put or call options, which involves risks different from, and possibly greater than, the risks associated with exchange-listed put or call options. In some instances, over-the-counter put or call options may expose a Fund to the risk that a counterparty may be unable or unwilling to perform according to a contract, and that any deterioration in a counterparty's creditworthiness could adversely affect the instrument. In addition, a Fund may be exposed to a risk that losses may exceed the amount originally invested.
Other Investment Companies (including ETFs) Risk. A Fund may invest in the securities of other investment companies to the extent that such investments are consistent with the Fund's investment objective and the policies are permissible under the 1940 Act. Investments in the securities of other investment companies, including ETFs, may involve duplication of advisory fees and certain other expenses. By investing in another investment company or ETF, the Fund becomes a shareholder thereof. As a result, Fund shareholders indirectly bear the Fund's proportionate share of the fees and expenses indirectly paid by shareholders of the other investment company or ETF, in addition to the fees and expenses Fund shareholders bear in connection with the Fund's own operations. If the investment company or ETF fails to achieve its investment objective, the value of the Fund's investment will decline, adversely affecting the Fund's performance. In addition, closed end investment company and ETF shares potentially may trade at a discount or a premium and are subject to brokerage and other trading costs, which could result in greater expenses to the Fund. In addition, the Fund may engage in short sales of the securities of other investment companies. When the Fund shorts securities of another investment company, it borrows shares of that investment company which it then sells. The Fund closes out a short sale by purchasing the security that it has sold short and returning that security to the entity that lent the security.
Portfolio Selection Risk. The value of your investment may decrease if the investment adviser's judgment about the attractiveness, value or market trends affecting a particular security, issuer, industry, or sector or about market movements is incorrect.
Portfolio Turnover Risk. Engaging in active and frequent trading of securities may result in a higher than average level of capital gains and greater transaction costs to a Fund, including brokerage commissions or dealer mark-ups and other transaction costs on the sale and reinvestments of securities. Such sales may also result in the realization of capital gains, including short-term capital gains (which are taxed at ordinary income tax rates for federal income tax purposes, rather than at
CALAMOS FAMILY OF FUNDS
138
Additional Information About Investment Strategies and Related Risks
lower capital gains rates) and may adversely impact a Fund's performance. It is possible that a Fund engaging in active and frequent trading may be required to make significant distributions derived from taxable gains, regardless of the Fund's net longer term performance. The trading costs and tax effects associated with portfolio turnover will adversely affect the Fund's performance and lower the Fund's effective return for investors.
REITs Risk. Investments in the real estate industry, including real estate investment trusts (REITs), are particularly sensitive to economic downturns and are sensitive to factors such as changes in real estate values, property taxes and tax laws, interest rates, cash flow of underlying real estate assets, occupancy rates, government regulations affecting zoning, land use and rents and the management skill and creditworthiness of the issuer. Companies in the real estate industry also may be subject to liabilities under environmental and hazardous waste laws. Although interest rates have significantly increased since 2022, the prices of real estate-related assets generally have not decreased as much as may be expected based on historical orrelations between interest rates and prices of real estate-related assets. This presents an increased risk of a correction or severe downturn in real estate-related asset prices, which could adversely impact the value of other investments as well (such as loans, securitized debt, and other debt instruments). This risk is particularly present with respect to commercial real estate-related asset prices, and the value of other investments with a connection to the commercial real estate sector. In addition, the value of a REIT is affected by changes in the value of the properties owned by the REIT or mortgage loans held by the REIT. REITs are also subject to default and prepayment risk. Many REITs are highly leveraged, increasing their risk. A Fund will indirectly bear its proportionate share of expenses, including management fees, paid by each REIT in which it invests in addition to the expenses of the Fund.
RIC Qualification Risk. To qualify for treatment as a regulated investment company ("RIC") under the Code, the Fund must meet certain income source, asset diversification and annual distribution requirements. The Fund's MLP investments may make it more difficult for the Fund to meet these requirements. The asset diversification requirements include a requirement that, at the end of each quarter of each taxable year, not more than 25% of the value of the Fund's total assets is invested in the securities (including debt securities) of one or more qualified publicly traded partnerships. The Fund anticipates that the MLPs in which it invests will be qualified publicly traded partnerships.
If the Fund's MLP investments exceed this 25% limitation then the Fund would not satisfy the diversification requirements and could fail to qualify as a RIC. If, in any year, the Fund fails to qualify as a RIC for any reason, the Fund would be taxed as an ordinary corporation and would become (or remain) subject to corporate income tax. The resulting corporate taxes could substantially reduce the Fund's net assets, the amount of income available for distribution and the amount of Fund distributions.
Rule 144A Securities Risk. Certain of the Funds may invest in convertible securities and synthetic convertible instruments, which typically are issued and sold through transactions under Rule 144A of the Securities Act of 1933. Under the supervision of its board of trustees, a Fund will determine whether Rule 144A Securities are illiquid. If qualified institutional buyers are unwilling to purchase these Rule 144A Securities, the percentage of a Fund's assets invested in illiquid securities would increase. Typically, a Fund purchases Rule 144A Securities only if the Fund's adviser has determined them to be liquid. If any Rule 144A Security held by a fund should become illiquid, the value of the security may be reduced and a sale of the security may be more difficult.
Sector Risk. To the extent a Fund invests a significant portion of its assets in a particular sector, a greater portion of the Fund's performance may be affected by the general business and economic conditions affecting that sector. Each sector may share economic risk with the broader market, however there may be economic risks specific to each sector. As a result, returns from those sectors may trail returns from the overall stock market and it is possible that a Fund may underperform the broader market, or experience greater volatility.
Securities Lending Risk. A Fund may lend its portfolio securities to broker-dealers and banks in order to generate additional income for the Fund. Any such loan must be continuously secured by collateral in cash or cash equivalents maintained on a current basis in an amount at least equal to the market value of the securities loaned by the Fund. In the event of bankruptcy or other default of a borrower of portfolio securities, a Fund could experience both delays in liquidating the loan collateral or recovering the loaned securities and losses, including (a) possible decline in the value of the collateral or in the value of the
PROSPECTUS | March 1, 2024
139
Additional Information About Investment Strategies and Related Risks
securities loaned during the period while the Fund seeks to enforce its rights thereto, (b) possible subnormal levels of income and lack of access to income during this period, and (c) expenses of enforcing its rights. In an effort to reduce these risks, the Fund's securities lending agent monitors, and reports to CALAMOS ADVISORS on, the creditworthiness of the firms to which a Fund lends securities. A Fund may also experience losses as a result of a diminution in value of its cash collateral investments.
Short Sale Risk. Short sales involve risks. A Fund may incur a loss (without limit) as a result of a short sale if the market value of the borrowed security (i.e., the Fund's short position) increases between the date of the short sale and the date the Fund replaces the security. A Fund may be unable to repurchase the borrowed security at a particular time or at an acceptable price. A Fund might be unable to implement these strategies because of the lack of attractive short sale opportunities. If a convertible security used to cover a short position is called before conversion, a Fund may be required to purchase the security sold short at a price in the open market above the price at which the Fund had sold the security short.
Small Company Risk. Small company stocks have historically been subject to greater investment risk than mid-sized and large company stocks. The risks generally associated with small companies include more limited product lines, markets and financial resources, lack of management depth or experience, dependency on key personnel, and vulnerability to adverse market and economic developments. Accordingly, the prices of small company stocks tend to be more volatile than prices of mid-sized and large company stocks. Further, the prices of small company stocks are often adversely affected by limited trading volumes and the lack of publicly available information.
Special Purpose Acquisition Companies Risk. The Fund may invest in special purpose acquisition companies ("SPACs") or similar special purpose entities. Because SPACs and similar entities have no operating history or ongoing business other than seeking acquisitions, the value of their securities is particularly dependent on the ability of the entity's management to identify and complete a profitable acquisition. Some SPACs may pursue acquisitions only within certain industries or regions, which may increase the volatility of their prices. A SPAC will not generate any revenues until, at the earliest, after the consummation of a transaction. An attractive acquisition or merger target may not be identified at all, in which case the SPAC will be required to return any remaining monies to shareholders, and the Fund may be subject to opportunity costs to the extent that alternative investments would have produced higher return. While a SPAC is seeking a transaction target, its stock may be thinly traded and/or illiquid. The proceeds of a SPAC IPO that are placed in trust are subject to risks, including the risk of insolvency of the custodian of the funds, fraud by the trustee, interest rate risk and credit and liquidity risk relating to the securities and money market funds in which the proceeds are invested. The private rights or other interests issued by a SPAC that the Fund may obtain generally have more limited liquidity than SPAC shares issued in an IPO and may be subject to forfeiture or expire worthless.
Special Situations or Event-Driven Risk. The Fund may seek to benefit from special situations or events, such as mergers, acquisitions, consolidations, bankruptcies, liquidations, reorganizations, restructurings, tender or exchange offers, or other events expected to affect a particular issuer. Investing in such special situations or events carries the risk that certain of such situations or events may not happen as anticipated, may involve a longer time frame than originally contemplated, or the market may react differently than expected to such situations or events. The securities of companies involved in special situations or events may be more volatile than other securities, may at times be illiquid, or may be difficult to value. Certain special situations or events carry the additional risks inherent in difficult corporate transitions and the securities of such companies may be more likely to lose value than the securities of more stable companies.
Sustainability (ESG) Policy Risk. A Fund's ESG policy could cause it to perform differently compared to similar funds that do not have such a policy. The application of the Calamos Advisors social and environmental standards may affect a Fund's exposure to certain issuers, industries, sectors, and factors that may impact the relative financial performance of a Fund — positively or negatively — depending on whether such investments are in or out of favor. Additionally, it may be difficult in certain instances for Calamos Advisors to correctly evaluate an issuer's commitment to ESG practices, and a failure to do so may result in investment issuers with practices that are not consistent with a Fund's aspirations. In executing a Fund's investment strategy Calamos Advisors will rely on ESG related data provided by third parties. There is no assurance that ESG data sources will always be available.
CALAMOS FAMILY OF FUNDS
140
Additional Information About Investment Strategies and Related Risks
Synthetic Convertible Instruments Risk. The value of a synthetic convertible instrument will respond differently to market fluctuations than a convertible security because a synthetic convertible instrument is composed of two or more separate securities, each with its own market value. In addition, if the value of the underlying common stock or the level of the index involved in the convertible component falls below the exercise price of the warrant or option, the warrant or option may lose all value.
Tax Risk. The federal income tax treatment of convertible securities or other securities in which the Funds may invest may not be clear or may be subject to recharacterization by the Internal Revenue Service. It could be more difficult to comply with the tax requirements applicable to RICs if the tax characterization of investments or the tax treatment of the income from such investments were successfully challenged by the Internal Revenue Service. Any such failure to comply with the rules applicable to RICs could cause the Fund to fail to qualify as such.
Total Return Swap Risk. A total return swap is a contract in which one party agrees to make periodic payments to another party based on the change in market value of the assets underlying the contract, which may include a specified security, basket of securities, or securities indices during the specified period, in return for periodic payments based on a fixed or variable interest rate or the total return from other underlying assets. Total return swap agreements may be used to obtain exposure to a security or market without owning or taking physical custody of such security or investing directly in such market. Total return swap agreements may effectively add leverage to a fund's portfolio because, in addition to its total net assets, the fund would be subject to investment exposure on the notional amount of the swap. The primary risks associated with total return swaps are credit risk (if the counterparty fails to meet its obligations) and market risk (if there is no liquid market for the agreement or unfavorable changes occur to the underlying asset).
U.S. Government Security Risk. Some securities issued by U.S. Government agencies or government sponsored enterprises are not backed by the full faith and credit of the U.S. and may only be supported by the right of the agency or enterprise to borrow from the U.S. Treasury. There can be no assurance that the U.S. Government will always provide financial support to those agencies or enterprises.
Value Stock Risk. Value stocks involve the risk that they may never reach what CALAMOS ADVISORS believes is their full market value, either because the market failed to recognize the stocks' intrinsic worth or CALAMOS ADVISORS misgauged that worth. Because different types of stocks tend to shift in and out of favor depending on market conditions, a value fund's performance may sometimes be higher or lower than that of other types of funds (such as those emphasizing growth stocks).
Warrants Risk. The Fund may invest in warrants. A warrant is a right to purchase common stock at a specific price (usually at a premium above the market value of the underlying common stock at time of issuance) during a specified period of time. A warrant may have a life ranging from less than a year to 20 years or longer, but a warrant becomes worthless unless it is exercised or sold before expiration. In addition, if the market price of the common stock does not exceed the warrant's exercise price during the life of the warrant, the warrant will expire worthless. Warrants have no voting rights, pay no dividends and have no rights with respect to the assets of the corporation issuing them. The percentage increase or decrease in the value of a warrant may be greater than the percentage increase or decrease in the value of the underlying common stock.
Portfolio Security Holdings Disclosure
A description of the Funds' policies and procedures in connection with the disclosure of portfolio security holdings of the Funds is available in the Funds' statement of additional information, which can be obtained on CALAMOS ADVISORS' website at www.calamos.com.
PROSPECTUS | March 1, 2024
141
Who manages the Funds?
The Funds are advised by CALAMOS ADVISORS LLC ("Calamos Advisors" or the "Adviser"), 2020 Calamos Court, Naperville, Illinois 60563. Calamos Advisors, an investment adviser registered with the SEC effective May 29, 1987, is a wholly owned subsidiary of CALAMOS INVESTMENTS LLC ("CILLC"). CILLC's assets under management as of December 31, 2023, were $35 billion ($34 billion of which represented Calamos Advisors' assets under management). CALAMOS ASSET MANAGEMENT, INC. ("CAM") is the sole manager of CILLC. As of December 31, 2023, approximately 22% of the outstanding interests of CILLC was owned by CAM and the remaining approximately 78% of CILLC was owned by CALAMOS PARTNERS LLC ("CPL") and John P. Calamos, Sr. CAM was owned by John P. Calamos, Sr. and John S. Koudounis, and CPL was owned by John S. Koudounis and CALAMOS FAMILY PARTNERS, INC. ("CFP"). CFP was beneficially owned by members of the Calamos family, including John P. Calamos, Sr.
Subject to the overall authority of the board of trustees, CALAMOS ADVISORS provides continuous investment supervision and management to the Funds under a management agreement and also furnishes office space, equipment and management personnel. For these services, each Fund pays CALAMOS ADVISORS a fee based on its average daily net assets, which is accrued daily and paid on a monthly basis. The Funds paid fees (before any reimbursement) under the management agreement during the fiscal year ended October 31, 2023 in the following amounts as a percentage of their average net assets:
|
FUND |
|
FISCAL YEAR
ENDED
OCTOBER 31, 2023 |
|
|
Calamos Market Neutral Income Fund |
|
|
0.66 |
% |
|
|
Calamos Hedged Equity Fund |
|
|
0.74 |
% |
|
|
Calamos Phineus Long/Short Fund |
|
|
1.23 |
% |
|
|
Calamos Merger Arbitrage Fund1 |
|
|
1.00 |
% |
|
|
Calamos Convertible Fund |
|
|
0.73 |
% |
|
|
Calamos Global Convertible Fund |
|
|
0.85 |
% |
|
|
Calamos Timpani Small Cap Growth Fund |
|
|
0.90 |
% |
|
|
Calamos Timpani SMID Growth Fund |
|
|
0.95 |
% |
|
|
Calamos Growth Fund |
|
|
0.92 |
% |
|
|
Calamos Growth and Income Fund |
|
|
0.68 |
% |
|
|
Calamos Dividend Growth Fund |
|
|
1.00 |
% |
|
|
Calamos Select Fund |
|
|
1.00 |
% |
|
|
Calamos International Growth Fund2 |
|
|
0.97 |
% |
|
|
Calamos Evolving World Growth Fund |
|
|
1.10 |
% |
|
|
Calamos Global Equity Fund2 |
|
|
0.93 |
% |
|
|
Calamos Global Opportunities Fund |
|
|
1.00 |
% |
|
|
Calamos International Small Cap Growth Fund |
|
|
0.95 |
% |
|
|
Calamos Total Return Bond Fund |
|
|
0.45 |
% |
|
|
Calamos High Income Opportunities Fund |
|
|
0.60 |
% |
|
|
Calamos Short-Term Bond Fund |
|
|
0.30 |
% |
|
1 For the period from September 29, 2023 (commencement of operations) through October 31, 2023.
2 Amount includes performance adjustment.
For the International Growth Fund and the Global Equity Fund, the fee payable under the management agreement is determined by calculating a base fee and applying a performance adjustment, as described in further detail below. The payment and calculation of the performance adjustment is subject to the ultimate supervision of the board of trustees. The base fee is at the annual rate of 1.00% on the first $500 million, 0.95% on the next $500 million, 0.90% on the next $5 billion (over $1 billion to $6 billion), and 0.80% on average daily net assets in excess of $6 billion.
CALAMOS FAMILY OF FUNDS
142
For the International Growth Fund, the performance adjustment equally increases or decreases the management fee, on a monthly basis, by 1/12 of 0.03% of the Fund's average daily net assets over the performance measurement period for each full 1% increment amount by which the Fund outperforms or underperforms the MSCI EAFE Growth Index over the performance measurement period on an annualized basis. For the Global Equity Fund, the performance adjustment equally increases or decreases the fee, on a monthly basis, by 1/12 of 0.03% of the Fund's average daily net assets over the performance measurement period for each full 1% increment amount by which the Fund outperforms or underperforms the MSCI World Index over the performance measurement period on an annualized basis.
The maximum monthly performance adjustment for each Fund is plus or minus 1/12 of 0.30% of the Fund's average daily net assets during the performance measurement period.
The performance adjustment rate is calculated by comparing each Fund's NAV per Class A share to the performance of its respective Index over the performance measurement period. The performance measurement period for the International Growth Fund began at the start of the first full month of operation (April 1, 2005) and includes the trailing 36 months. The performance measurement period for the Global Equity Fund began at the start of the first full month of operation (March 1, 2007) and includes the trailing 36 months. Prior to February 1, 2008, only the base fee was payable, and there was no performance adjustment. Commencing in February 2008, the base fee was subject to adjustment based on the performance of the Fund's Class A shares relative to that of the MSCI World Index over the 12 calendar months ended February 29, 2008. For each succeeding month through February 2010, the performance measurement period increased by one month, and thereafter the performance measurement period became the trailing 36 months.
Because the performance adjustment is tied to the Fund's performance relative to that of the Index (and not to its absolute performance), the performance adjustment could increase the fee payable to CALAMOS ADVISORS even if the Fund's shares lose value during the performance measurement period and could decrease that fee even if the Fund's shares increase in value during the performance measurement period. For purposes of computing the base fee and the performance adjustment, net assets are averaged over different periods (average daily net assets during the previous month for the base fee, versus average daily net assets during the performance measurement period for the performance adjustment). Fund performance is calculated net of expenses, whereas the Index does not bear any fees or expenses. Reinvestment of dividends and distributions are included in calculating the performance of both the Fund and the Index. The base fee is calculated and accrued daily. The performance adjustment is calculated monthly in arrears and is accrued evenly each day throughout the month. The management fee is paid monthly in arrears. If the board of trustees determines that another index is appropriate for the Fund, it may designate a successor index to be substituted for the Index, subject to approval by shareholders.
When a fund in the Calamos Family of Funds (an "Acquiring Fund") invests in shares of another fund in the Calamos Family of Funds (an "Acquired Fund"), the portion of the Acquiring Fund's advisory fee equal to the advisory fee payable to the Acquired Fund (based on average daily net assets invested) is waived.
CALAMOS ADVISORS has contractually agreed to limit the annual ordinary operating expenses of the Market Neutral Income Fund, Convertible Fund, Growth Fund, and Growth and Income Fund, as a percentage of the average net assets of the particular class of shares, to 1.75% for Class A shares, 2.50% for Class C shares, and 1.50% for Class I shares. CALAMOS ADVISORS has contractually agreed to limit Market Neutral Income Fund and Growth and Income Fund's annual ordinary operating expenses for Class R6 shares (as a percentage of average net assets) to 1.50% less each Fund's annual sub-transfer agency ratio (the aggregate sub-transfer agency fees of the Fund's other share classes divided by the aggregate average annual net assets of the Fund's other share classes). For purposes of these expense limitation agreements, operating expenses do not include taxes, interest, short interest, short dividend expenses, brokerage commissions, acquired fund fees and expenses, foreign tax reclaim expenses, and extraordinary expenses (as determined in the discretion of Calamos Advisors), such as litigation costs. This expense limitation agreement is binding on CALAMOS ADVISORS through March 1, 2025 for each Fund. This undertaking is binding on CALAMOS ADVISORS and any of its successors and assigns. This agreement is not terminable by either party.
CALAMOS ADVISORS has contractually agreed to limit the annual ordinary operating expenses of the Global Opportunities Fund, as a percentage of the average net assets of the particular class of shares, to 1.22% for Class A shares, 1.97% for Class C shares, and 0.97% for Class I shares. For purposes of this expense limitation agreement, operating expenses do not include taxes,
PROSPECTUS | March 1, 2024
143
interest, short interest, short dividend expenses, brokerage commissions, acquired fund fees and expenses, foreign tax reclaim expenses, and extraordinary expenses (as determined in the discretion of Calamos Advisors), such as litigation costs. This expense limitation agreement is binding on CALAMOS ADVISORS through March 1, 2025. This undertaking is binding on CALAMOS ADVISORS and any of its successors and assigns. This agreement is not terminable by either party.
CALAMOS ADVISORS has contractually agreed to limit the annual ordinary operating expenses of the Evolving World Growth Fund, as a percentage of the average net assets of the particular class of shares, to 1.30% for Class A shares, 2.05% for Class C shares, and 1.05% for Class I shares. For purposes of this expense limitation agreement, operating expenses do not include taxes, interest, short interest, short dividend expenses, brokerage commissions, acquired fund fees and expenses, foreign tax reclaim expenses, and extraordinary expenses (as determined in the discretion of Calamos Advisors), such as litigation costs. This expense limitation agreement is binding on CALAMOS ADVISORS through March 1, 2025. This undertaking is binding on CALAMOS ADVISORS and any of its successors and assigns. This agreement is not terminable by either party.
CALAMOS ADVISORS has contractually agreed to limit the annual ordinary operating expenses of the Hedged Equity Fund, as a percentage of the average net assets of the particular class of shares, to 1.25% for Class A shares, 2.00% for Class C shares, and 1.00% for Class I shares. For purposes of this expense limitation agreement, operating expenses do not include taxes, interest, short interest, short dividend expenses, brokerage commissions, acquired fund fees and expenses, foreign tax reclaim expenses, and extraordinary expenses (as determined in the discretion of Calamos Advisors), such as litigation costs. This expense limitation agreement is binding on CALAMOS ADVISORS through March 1, 2025. This undertaking is binding on CALAMOS ADVISORS and any of its successors and assigns. This agreement is not terminable by either party.
CALAMOS ADVISORS has contractually agreed to limit the annual ordinary operating expenses of the Phineus Long/Short Fund, as a percentage of the average net assets of the particular class of shares to 2.00% for Class A shares, 2.75% for Class C shares, and 1.75% for Class I shares. For purposes of this expense limitation agreement, operating expenses do not include taxes, interest, short interest, short dividend expenses, brokerage commissions, acquired fund fees and expenses, foreign tax reclaim expenses, and extraordinary expenses (as determined in the discretion of Calamos Advisors), such as litigation costs. This expense limitation agreement is binding on CALAMOS ADVISORS through March 1, 2025. This undertaking is binding on CALAMOS ADVISORS and any of its successors and assigns. This agreement is not terminable by either party.
CALAMOS ADVISORS has contractually agreed to limit the annual ordinary operating expenses of the Merger Arbitrage Fund, as a percentage of the average net assets of the particular class of shares, to 1.50% for Class A shares, 2.25% for Class C shares, and 1.25% for Class I shares. For purposes of this expense limitation agreement, operating expenses do not include taxes, interest, short interest, short dividend expenses, brokerage commissions, acquired fund fees and expenses, foreign tax reclaim expenses, and extraordinary expenses (as determined in the discretion of Calamos Advisors), such as litigation costs. This expense limitation agreement is binding on CALAMOS ADVISORS through October 31, 2026. This undertaking is binding on CALAMOS ADVISORS and any of its successors and assigns. This agreement is not terminable by either party.
CALAMOS ADVISORS has contractually agreed to limit the annual ordinary operating expenses of the Global Convertible Fund and Dividend Growth Fund, as a percentage of the average net assets of the particular class of shares, to 1.35% for Class A shares, 2.10% for Class C shares, and 1.10% for Class I shares. For purposes of this expense limitation agreement, operating expenses do not include taxes, interest, short interest, short dividend expenses, brokerage commissions, acquired fund fees and expenses, foreign tax reclaim expenses, and extraordinary expenses (as determined in the discretion of Calamos Advisors), such as litigation costs. This expense limitation agreement is binding on CALAMOS ADVISORS through March 1, 2025 for each Fund. This undertaking is binding on CALAMOS ADVISORS and any of its successors and assigns. This agreement is not terminable by either party.
CALAMOS ADVISORS has contractually agreed to limit the annual ordinary operating expenses of the Timpani Small Cap Growth Fund as a percentage of the average net assets of the particular class of shares to 1.30% for Class A shares, 2.05% for Class C shares, and 1.05% for Class I shares. CALAMOS ADVISORS has contractually agreed to limit the Fund's annual ordinary operating expenses for Class R6 shares (as a percentage of average net assets) to 1.05% less the Fund's annual sub-transfer agency ratio (the aggregate sub- transfer agency fees of the Fund's other share classes divided by the aggregate average annual net assets of the Fund's other share classes). For purposes of the expense limitation agreement, operating expenses do not include taxes,
CALAMOS FAMILY OF FUNDS
144
interest, short interest, short dividend expenses, brokerage commissions, acquired fund fees and expenses, foreign tax reclaim expenses, and extraordinary expenses (as determined in the discretion of Calamos Advisors), such as litigation costs. This expense limitation agreement is binding on CALAMOS ADVISORS through March 1, 2025. This undertaking is binding on CALAMOS ADVISORS and any of its successors and assigns. This agreement is not terminable by either party.
CALAMOS ADVISORS has contractually agreed to limit the annual ordinary operating expenses of the Timpani SMID Growth Fund as a percentage of the average net assets of the particular class of shares to 1.35% for Class A shares and 1.10% for Class I shares. CALAMOS ADVISORS has contractually agreed to limit the Fund's annual ordinary operating expenses for Class R6 shares (as a percentage of average net assets) to 1.10% less the Fund's annual sub-transfer agency ratio (the aggregate sub-transfer agency fees of the Fund's other share classes divided by the aggregate average annual net assets of the Fund's other share classes). For purposes of the expense limitation agreement, operating expenses do not include taxes, interest, short interest, short dividend expenses, brokerage commissions, acquired fund fees and expenses, foreign tax reclaim expenses, and extraordinary expenses (as determined in the discretion of Calamos Advisors), such as litigation costs. This expense limitation agreement is binding on CALAMOS ADVISORS through March 1, 2025. This undertaking is binding on CALAMOS ADVISORS and any of its successors and assigns. This agreement is not terminable by either party.
CALAMOS ADVISORS has contractually agreed to limit the annual ordinary operating expenses of the Select Fund, as a percentage of the average net assets of the particular class of shares, to 1.15% for Class A shares, 1.90% for Class C shares, and 0.90% for Class I shares. For purposes of this expense limitation agreement, operating expenses do not include taxes, interest, short interest, short dividend expenses, brokerage commissions, acquired fund fees and expenses, foreign tax reclaim expenses, and extraordinary expenses (as determined in the discretion of Calamos Advisors), such as litigation costs. This expense limitation agreement is binding on CALAMOS ADVISORS through March 1, 2025. This undertaking is binding on CALAMOS ADVISORS and any of its successors and assigns. This agreement is not terminable by either party.
CALAMOS ADVISORS has contractually agreed to limit the annual ordinary operating expenses of the International Growth Fund, as a percentage of the average net assets of the particular class of shares, to 1.20% for Class A shares, 1.95% for Class C shares, 0.95% for Class I shares and 0.95% less the annual sub-transfer agency ratio for the Fund (the aggregate sub-transfer agency fees of the Fund's other share classes divided by the aggregate average annual net assets of the Fund's other share classes) for Class R6 shares, provided that such limitations for any period will be adjusted upward or downward by the performance adjustment for the period. For example, a 0.10% upward adjustment to the management fee would mean that CALAMOS ADVISORS would reimburse Fund expenses so that total annual fund operating expenses are limited to 1.30% for Class A shares, 2.05% for Class C shares, 1.05% for Class I shares and 1.05% less the annual sub-transfer agency ratio for Class R6 shares. For purposes of this expense limitation agreement, operating expenses do not include taxes, interest, short interest, short dividend expenses, brokerage commissions, acquired fund fees and expenses, foreign tax reclaim expenses, and extraordinary expenses (as determined in the discretion of Calamos Advisors), such as litigation costs. This expense limitation agreement is binding on CALAMOS ADVISORS through March 1, 2025. This undertaking is binding on CALAMOS ADVISORS and any of its successors and assigns. This agreement is not terminable by either party.
CALAMOS ADVISORS has contractually agreed to limit the annual ordinary operating expenses of the Global Equity Fund, as a percentage of the average net assets of the particular class of shares, to 1.40% for Class A shares, 2.15% for Class C shares, 1.15% for Class I shares, and 1.15% less the Fund's annual sub-transfer agency ratio (the aggregate sub-transfer agency fees of the Fund's other share classes divided by the aggregate average annual net assets of the Fund's other share classes) for Class R6 shares, provided that such limitations for any period will be adjusted upward or downward by the performance adjustment for the period. For example, a 0.10% upward adjustment to the management fee would mean that CALAMOS ADVISORS would reimburse Fund expenses so that total annual fund operating expenses are limited to 1.50% for Class A shares, 2.25% for Class C shares, 1.25% for Class I shares and 1.25% less the annual sub-transfer agency ratio for Class R6 shares. For purposes of this expense limitation agreement, operating expenses do not include taxes, interest, short interest, short dividend expenses, brokerage commissions, acquired fund fees and expenses, foreign tax reclaim expenses, and extraordinary expenses (as determined in the discretion of Calamos Advisors), such as litigation costs. This expense limitation agreement is binding on CALAMOS ADVISORS through March 1, 2025. This undertaking is binding on CALAMOS ADVISORS and any of its successors and assigns. This agreement is not terminable by either party.
PROSPECTUS | March 1, 2024
145
CALAMOS ADVISORS has contractually agreed to limit the annual ordinary operating expenses of the International Small Cap Growth Fund as a percentage of the average net assets of the particular class of shares to 1.35% for Class A shares, 2.10% for Class C shares, and 1.10% for Class I shares. CALAMOS ADVISORS has contractually agreed to limit the Fund's annual ordinary operating expenses for Class R6 shares (as a percentage of average net assets) to 1.10% less the Fund's annual sub-transfer agency ratio (the aggregate sub-transfer agency fees of the Fund's other share classes divided by the aggregate average annual net assets of the Fund's other share classes). For purposes of the expense limitation agreement, operating expenses do not include taxes, interest, short interest, short dividend expenses, brokerage commissions, acquired fund fees and expenses, foreign tax reclaim expenses, and extraordinary expenses (as determined in the discretion of Calamos Advisors), such as litigation costs. This expense limitation agreement is binding on CALAMOS ADVISORS through March 31, 2025. This undertaking is binding on CALAMOS ADVISORS and any of its successors and assigns. This agreement is not terminable by either party.
CALAMOS ADVISORS has contractually agreed to limit the annual ordinary operating expenses of the Total Return Bond Fund, as a percentage of the average net assets of the particular class of shares, to 0.90% for Class A shares, 1.65% for Class C shares, and 0.65% for Class I shares. For purposes of this expense limitation agreement, operating expenses do not include taxes, interest, short interest, short dividend expenses, brokerage commissions, acquired fund fees and expenses, foreign tax reclaim expenses, and extraordinary expenses (as determined in the discretion of Calamos Advisors), such as litigation costs. This expense limitation agreement is binding on CALAMOS ADVISORS through March 1, 2025. This undertaking is binding on CALAMOS ADVISORS and any of its successors and assigns. This agreement is not terminable by either party.
CALAMOS ADVISORS has contractually agreed to limit the annual ordinary operating expenses of the High Income Opportunities Fund, as a percentage of the average net assets of the particular class of shares, to 1.00% for Class A shares, 1.75% for Class C shares, and 0.75% for Class I shares. For purposes of this expense limitation agreement, operating expenses do not include taxes, interest, short interest, short dividend expenses, brokerage commissions, acquired fund fees and expenses, foreign tax reclaim expenses, and extraordinary expenses (as determined in the discretion of Calamos Advisors), such as litigation costs. This expense limitation agreement is binding on CALAMOS ADVISORS through March 1, 2025. This undertaking is binding on CALAMOS ADVISORS and any of its successors and assigns. This agreement is not terminable by either party.
CALAMOS ADVISORS has contractually agreed to limit the annual ordinary operating expenses of the Short-Term Bond Fund as a percentage of the average net assets of the particular class of shares, to 0.65% for Class A shares and 0.40% for Class I shares. For purposes of this expense limitation agreement, operating expenses do not include taxes, interest, short interest, short dividend expenses, brokerage commissions, acquired fund fees and expenses, foreign tax reclaim expenses, and extraordinary expenses (as determined in the discretion of Calamos Advisors), such as litigation costs. This expense limitation agreement is binding on CALAMOS ADVISORS through March 1, 2025. This undertaking is binding on CALAMOS ADVISORS and any of its successors and assigns. This agreement is not terminable by either party.
CALAMOS ADVISORS may recapture previously waived expense amounts within the same fiscal year for any day where the respective share class's expense ratio falls below the contractual expense limit up to the expense limit for that day. This undertaking is binding on CALAMOS ADVISORS and any of its successors and assigns. This agreement is not terminable by either party.
At a meeting held on June 21, 2023, the board of trustees unanimously approved the renewal of the management agreement for each Fund other than Merger Arbitrage Fund. A discussion regarding the basis for the approval by the board of trustees of the management agreement for the Funds is included in the Funds' annual report to shareholders for the fiscal year ended October 31, 2023.
At a meeting held on September 26, 2023, the board of trustees unanimously approved the management agreement for the Merger Arbitrage Fund. A discussion regarding the basis for the approval by the board of trustees of the management agreement for the Fund is included in the Funds' annual report to shareholders for the fiscal year ended October 31, 2023.
Portfolio Managers
John P. Calamos, Sr. John P. Calamos, Sr. serves as President and Trustee of the Calamos Investment Trust ("Trust") and for CALAMOS ADVISORS: Founder, Chairman and Global Chief Investment Officer ("Global CIO") since August 2016; Chairman and
CALAMOS FAMILY OF FUNDS
146
Global CIO from April to August 2016; Chairman, Chief Executive Officer and Global Co-CIO between April 2013 and April 2016; Chief Executive Officer and Global Co-CIO between August 2012 and April 2013; and Chief Executive Officer and Co-CIO prior thereto.
Christian Brobst. Christian Brobst joined CALAMOS ADVISORS in 2017 and since July 2018 is a Co-Portfolio Manager. From 2017 to July 2018, he was a Portfolio Specialist. Previously, he was Senior Vice President at CU Capital Market Solutions.
Chuck Carmody. Chuck Carmody joined CALAMOS ADVISORS in 2004 and since February 2016 is a Co-Portfolio Manager, as well as a Senior Fixed Income Trader. From January 2010 to February 2016 he was a Senior Trader.
Dennis Cogan. Dennis Cogan joined CALAMOS ADVISORS in March 2005 and since February 2021 has been a Senior Co-Portfolio Manager. From March 2013 to February 2021, he was a Co-Portfolio Manager and from March 2005 to March 2013, he was a senior strategy analyst.
Dino Dussias. Dino Dussias joined CALAMOS ADVISORS in October 1995 and since February 2023 has been an Associate Portfolio Manager. From May 1997 to August 2013, he served in various analyst roles. He served as Sector Head — Industrials from August 2013 to August 2015, Sector Head from September 2015 to December 2017, and Sector Head-US Industrials/Utilities from December 2017 to January 2023.
R. Matthew Freund. R. Matthew Freund joined CALAMOS ADVISORS in November 2016 as a Co-CIO, Head of Fixed Income Strategies, as well as a Senior Co-Portfolio Manager. Previously, he was SVP of Investment Portfolio Management and Chief Investment Officer at USAA Investments since 2010.
Michael Grant. Michael Grant joined CALAMOS ADVISORS in September 2015 and since January 2018 is a Co-CIO, Head of Long/ Short Strategies and Growth Strategies, as well as a Senior Co-Portfolio Manager. From 2015 to January 2018, he was a Global Economist — Long/Short Strategies. Previously, he was Founder, CIO, and Portfolio Manager at Phineus Partners LP since 2002.
Jason Hill. Jason Hill joined CALAMOS ADVISORS in March 2004 and has been a Sr. Co-Portfolio manager since February 2024 and was a Co-Portfolio Manager from June 2014 through January 2024. Between August 2013 and June 2014, he was a Senior Strategy Analyst. Previously, he was a Portfolio Administrator.
John Hillenbrand. John Hillenbrand joined CALAMOS ADVISORS in 2002 and since September 2015 is a Co-CIO, Head of Multi- Asset Strategies and Co-Head of Convertible Strategies, as well as a Senior Co-Portfolio Manager. From March 2013 to September 2015 he was a Co-Portfolio Manager. Between August 2002 and March 2013 he was a senior strategy analyst.
Ryan Isherwood. Ryan Isherwood joined CALAMOS ADVISORS on May 31, 2019 as a Co-Portfolio Manager. Previously, he was Senior Analyst for Timpani Capital Management LLC since 2008.
Michael Kassab. Michael Kassab joined CALAMOS ADVISORS in 2014 and has served as SVP, Chief Market Strategist and Associate Portfolio Manager since February 2020. From June 2019 to January 2020 he was VP, Chief Market Strategist. From September 2014 to May 2019 he was the Vice President and Chief Investment Officer, Wealth Management Strategies.
Brandon Nelson. Brandon Nelson joined CALAMOS ADVISORS on May 31, 2019 as a Senior Portfolio Manager. Previously, he was President, Chief Investment Officer and a director of Timpani Capital Management, LLC since 2008.
Nick Niziolek. Nick Niziolek joined CALAMOS ADVISORS in March 2005 and has been a Co-CIO, Head of International and Global Strategies, as well as a Senior Co-Portfolio Manager, since September 2015. Between August 2013 and September 2015 he was a Co-Portfolio Manager, Co-Head of Research. Between March 2013 and August 2013 he was a Co-Portfolio Manager. Between March 2005 and March 2013 he was a senior strategy analyst.
David O'Donohue. David O'Donohue joined CALAMOS ADVISORS in August 2014 and has been a Sr. Co-Portfolio manager since February 2024 and was a Co-Portfolio Manager from September 2015 through January 2024. Between March 2013 and August 2014, he was a Trader at Forty4 Asset Management LLC/Hard8 Futures LLC. Prior thereto, Mr. O'Donohue was a Portfolio Manager at Chicago Fundamental Investment Partners LLC from February 2009 to November 2012.
Eli Pars. Eli Pars joined CALAMOS ADVISORS in May 2013 and has been Co-CIO, Head of Alternative Strategies and Co-Head of Convertible Strategies, as well as a Senior Co-Portfolio Manager, since September 2015. Between May 2013 and
PROSPECTUS | March 1, 2024
147
September 2015, he was a Co-Portfolio Manager. Previously, he was a Portfolio Manager at Chicago Fundamental Investment Partners from February 2009 until November 2012.
Kyle Ruge. Kyle Ruge joined CALAMOS ADVISORS in September 2006 and since January 2022 has been an Associate Portfolio Manager. From September 2015 to December 2021, he was a Senior Strategy Analyst. From September 2006 to September 2015 he was a Research Analyst.
Paul Ryndak. Paul Ryndak joined CALAMOS ADVISORS in September 2013 and since January 2022 has been an Associate Portfolio Manager as well as Head of International Research. From February 2018 to December 2021, he was Head of International Research. From September 2013 to February 2018, he was Sector Head — International Cyclicals. Previously, he was a Research Analyst at Calamos Advisors from April 2002 to May 2012.
John Saf. John Saf joined CALAMOS ADVISORS in 2017 as a Co-Portfolio Manager. Previously, he was managing director and portfolio manager at Oppenheimer Investment Management since 2006.
Jon Vacko. Jon Vacko joined CALAMOS ADVISORS in 2000 and has been a Senior Co-Portfolio Manager since September 2015. Previously, he was a Co-Portfolio Manager from August 2013 to September 2015; prior thereto he was a Co-Head of Research and Investments from July 2010 to August 2013.
Anthony Vecchiolla. Anthony Vecchiolla joined CALAMOS ADVISORS in May 2014 and since February 2023 has been Co-Portfolio Manager. Previously, he was Research Associate from May 2014 to August 2015, Research Analyst from September 2015 to February 2020, Senior Research Analyst from February 2020 to February 2021, and Assistant Portfolio Manager from February 2021 to January 2023.
Joe Wysocki. Joe Wysocki joined CALAMOS ADVISORS in October 2003 and since February 2021 is a Senior Co-Portfolio Manager. Previously, he was a Co-Portfolio Manager from March 2015 to February 2021; a sector head from March 2014 to March 2015; a Co-Portfolio Manager from March 2013 to March 2014; and a senior strategy analyst from February 2007 and March 2013.
Jimmy Young. Jimmy Young joined CALAMOS ADVISORS in June 2003 and has been a Co-Portfolio Manager since February 2019. Between February 2018 and February 2019, he was an Assistant Portfolio Manager. Prior thereto, he was a senior strategy analyst from September 2015 to February 2018. Between July 2013 and August 2015, he was a strategy analyst.
The Funds' statement of additional information provides additional information about the portfolio managers, including other accounts they manage, their ownership in the CALAMOS FAMILY OF FUNDS and their compensation.
For all Funds, Except Growth Fund:
Team Approach to Management. CALAMOS ADVISORS employs a "team of teams" approach to portfolio management, led by the Global CIO and our CIO team consisting of 5 Co-CIOs with specialized areas of investment expertise. The Global CIO and Co-CIO team are responsible for oversight of investment team resources, investment processes, performance and risk. As heads of investment verticals, Co-CIOs manage investment team members and, along with Co-Portfolio Managers and Associate Portfolio Managers, have day-to-day portfolio oversight and construction responsibilities of their respective investment strategies. While investment research professionals within each Co-CIO's team are assigned specific strategy responsibilities, they also provide support to other investment team verticals, creating deeper insights across a wider range of investment strategies. The combination of specialized investment teams with cross team collaboration results in what we call our team of teams approach.
This team of teams approach is further reflected in the composition of CALAMOS ADVISORS' Investment Committee, made up of the Global CIO, the Co-CIO team, and the Global Head of Trading. Other members of the investment team participate in Investment Committee meetings in connection with specific investment related issues or topics as deemed appropriate.
The structure and composition of the Investment Committee results in a number of benefits, as it:
• Leads to broader perspective on investment decisions: multiple viewpoints and areas of expertise feed into consensus;
• Promotes collaboration between teams; and
• Functions as a think tank with the goal of identifying ways to outperform the market on a risk-adjusted basis.
CALAMOS FAMILY OF FUNDS
148
The objectives of the Investment Committee are to:
• Form the firm's top-down macro view, market direction, asset allocation, and sector/country positioning.
• Establish firm-wide secular and cyclical themes for review.
• Review firm-wide and portfolio risk metrics, recommending changes where appropriate.
• Review firm-wide, portfolio and individual security liquidity constraints.
• Evaluate firm-wide and portfolio investment performance.
• Evaluate firm-wide and portfolio hedging policies and execution.
• Evaluate enhancements to the overall investment process.
John P. Calamos, Sr., Founder, Chairman and Global CIO, is responsible for the day-to-day management of the team, bottom- up research efforts and strategy implementation. R. Matthew Freund, Michael Grant, Jason Hill, John Hillenbrand, Nick Niziolek, Eli Pars, Dennis Cogan, Brandon Nelson, David O'Donohue, Jon Vacko, and Joe Wysocki, are each Sr. Co-Portfolio Managers; Chuck Carmody, Ryan Isherwood, John Saf, Anthony Vecchiolla, Christian Brobst, and Jimmy Young are each Co-Portfolio Managers; and Kyle Ruge, Paul Ryndak, Dino Dussias and Michael Kassab are each Associate Portfolio Managers for the Funds for which each has been so designated. Sr. Co- Portfolio Managers, Co-Portfolio Managers, and Associate Portfolio Managers are collectively referred to within this registration statement as "Portfolio Managers".
For Growth Fund only:
John P. Calamos, Sr., R. Matthew Freund, and Michael Grant are the lead portfolio managers for the Fund. As lead portfolio managers, Messrs. Calamos, Freund, and Grant have responsibility for allocating the portfolio across the market capitalization spectrum, sectors, and geographies within the portfolio's eligible investment universe and reviewing the overall composition of the portfolio to ensure compliance with its stated investment objective. Messrs. Calamos, Freund, and Grant also have access to members of the investment team, each of whom may be at certain times, at the discretion of the lead portfolio managers, allocated a specified portion of the portfolio over which he or she has independent responsibility for research, security selection, and portfolio construction.
What classes of shares do the Funds offer?
This prospectus offers four classes of shares: Class A, Class C, Class I and Class R6 shares. (All of the Funds, except Short-Term Bond Fund and Timpani SMID Growth Fund, offer Class A, Class C and Class I shares. Short-Term Bond Fund offers Class A and Class I shares only. Timpani SMID Growth Fund offers Class A, Class I and Class R6 shares only. Market Neutral Income Fund, Timpani Small Cap Growth Fund, Timpani SMID Growth Fund, Growth and Income Fund, International Growth Fund, Global Equity Fund and International Small Cap Growth Fund are the only Funds that offer Class R6 shares.) The different classes of Fund shares are investments in the same portfolio of securities, but each class of shares has different expenses and will likely have different NAVs. The main differences among Class A, Class C, Class I and Class R6 shares lie primarily in their initial and contingent deferred sales charge structures and their distribution and service fees. Class A shares generally bear an initial sales charge at the time of purchase, while Class C shares generally bear a contingent deferred sales charge at the time of redemption. Class A and Class C shares bear distribution and/or service fees. Class I and Class R6 shares do not bear distribution or service fees.
Pursuant to the Reorganization of the Predecessor Fund into the Timpani Small Cap Growth Fund, Class Y shareholders of the Predecessor Fund received Class A shares, and Service Class and Institutional Class shareholders of the Predecessor Fund received Class I shares. The sales load, initial investment and additional investment minimums are waived for Class Y shareholders of the Predecessor Fund who received Class A shares as part of the Reorganization. The Class I eligibility requirements and initial investment minimum are waived for Service Class and Institutional Class shareholders of the Predecessor Fund.
Please see the "How Can I Buy Shares — By Exchange" section of the prospectus for a discussion of the exchange features of each Fund's share classes.
PROSPECTUS | March 1, 2024
149
The availability of certain sales charge waivers and discounts will depend on whether you purchase your shares directly from a Fund or through a financial intermediary. Intermediaries may have different policies and procedures regarding the availability of front-end sales load waivers or contingent deferred (back-end) sales charge waivers, which are discussed below. In all instances, it is your responsibility to notify the Fund or your financial intermediary at the time of purchase of any relationship or other facts qualifying the purchase for sales charge waivers or discounts. For waivers and discounts not available through a particular intermediary, shareholders will have to purchase Fund shares directly from the Fund or through another intermediary to receive these waivers or discounts.
The sales charge and contingent deferred sales charge waiver categories described below may not apply to customers purchasing shares of the Funds through any of the financial intermediaries specified in the Appendix to this prospectus. Different financial intermediaries may impose different sales charges. Please refer to the Appendix for the sales charge or contingent deferred sales charge waivers or discounts that are applicable to each financial intermediary.
The Funds do not provide separate information regarding sale charge discounts on their website, however information regarding sale charge discounts is included the Funds' prospectus, which can be obtained on CALAMOS ADVISORS' website at www.calamos.com.
CALAMOS FAMILY OF FUNDS
150
Class A Shares
For each Fund, the offering price for Class A shares is the NAV per share plus an initial sales charge rounded to the nearest whole cent. Due to rounding, the actual sales charge may be more or less than the percentage shown. For each Fund, except Market Neutral Income Fund, Convertible Fund, Global Convertible Fund, Total Return Bond Fund, High Income Opportunities Fund, and Short-Term Bond Fund, the maximum sales charge is 4.75% of the offering price. For Convertible Fund, Global Convertible Fund, Total Return Bond Fund, High Income Opportunities Fund, and Short-Term Bond Fund, the maximum sales charge is 2.25% of the offering price. For Market Neutral Income Fund and Merger Arbitrage Fund, the maximum sales charge is 2.75% of the offering price. The sales charge varies depending on the amount of your purchase, as follows:
|
|
|
SALES CHARGE |
|
EACH FUND (OTHER THAN MARKET NEUTRAL INCOME FUND, MERGER ARBITRAGE FUND,
CONVERTIBLE FUND, GLOBAL CONVERTIBLE FUND, TOTAL RETURN BOND FUND, HIGH
INCOME OPPORTUNITIES FUND, AND SHORT-TERM BOND FUND) |
|
AS A % OF
NET AMOUNT
INVESTED |
|
AS A % OF
OFFERING
PRICE |
|
|
Less than $50,000 |
|
|
4.99 |
% |
|
|
4.75 |
% |
|
|
$50,000 but less than $100,000 |
|
|
4.44 |
|
|
|
4.25 |
|
|
|
$100,000 but less than $250,000 |
|
|
3.63 |
|
|
|
3.50 |
|
|
|
$250,000 but less than $500,000 |
|
|
2.56 |
|
|
|
2.50 |
|
|
|
$500,000 but less than $1,000,000 |
|
|
2.04 |
|
|
|
2.00 |
|
|
|
$1,000,000 or more* |
|
|
None |
|
|
|
None |
|
|
CONVERTIBLE FUND, GLOBAL CONVERTIBLE FUND, TOTAL RETURN BOND FUND,
HIGH INCOME OPPORTUNITIES FUND, AND SHORT-TERM BOND FUND |
|
AS A % OF
NET AMOUNT
INVESTED |
|
AS A % OF
OFFERING
PRICE |
|
|
Less than $100,000 |
|
|
2.30 |
% |
|
|
2.25 |
% |
|
|
$100,000 but less than $250,000 |
|
|
1.78 |
|
|
|
1.75 |
|
|
|
$250,000 or more* |
|
|
None |
|
|
|
None |
|
|
|
MARKET NEUTRAL INCOME FUND AND MERGER ARBITRAGE FUND |
|
AS A % OF
NET AMOUNT
INVESTED |
|
AS A % OF
OFFERING
PRICE |
|
|
Less than $50,000 |
|
|
2.83 |
% |
|
|
2.75 |
% |
|
|
$50,000 but less than $100,000 |
|
|
2.30 |
|
|
|
2.25 |
|
|
|
$100,000 but less than $250,000 |
|
|
1.78 |
|
|
|
1.75 |
|
|
|
$250,000 or more* |
|
|
None |
|
|
|
None |
|
|
* Redemption of shares may be subject to a contingent deferred sales charge as discussed below.
Class A shares also have a 0.25% distribution (12b-1) fee. See "Distribution and service (Rule 12b-1) plan" for more information about distribution fees.
How can I reduce sales charges for Class A purchases?
As the table above shows, the larger your investment, the lower your initial sales charge on Class A shares. Each investment threshold that qualifies for a lower sales charge is known as a "breakpoint." You may be able to qualify for a breakpoint on the basis of a single purchase or by aggregating the amounts of more than one purchase in the following ways:
Rights of accumulation
You may combine the value, at the current public offering price, of Class A, Class C and Class I shares of any Funds within the CALAMOS FAMILY OF FUNDS already owned and Fidelity Investments Money Market Treasury Portfolio Shares (that were previously acquired by exchange from holdings of other Funds' shares within the CALAMOS FAMILY OF FUNDS — also see additional money market fund details below) with a new purchase of Class A shares of any Fund within the CALAMOS FAMILY OF FUNDS to reduce the
PROSPECTUS | March 1, 2024
151
sales charge on the new purchase. The sales charge for the new shares will be figured at the rate in the table above that applies to the combined value of your current and new investment. If purchasing shares through a financial intermediary, please also see the "Reduced sales charges available through certain financial intermediaries" section for more information.
Letter of Intent
You may reduce the sales charges you pay on the purchase of Class A shares by making investments pursuant to a Letter of Intent ("LOI"). Under an LOI, you may purchase additional Class A shares of any Fund over a 13-month period and receive the same sales charge as if you had purchased all the shares at once. Your individual purchases will be made at the applicable sales charge based on the amount you intend to invest over a 13-month period. In addition, the market value of any current holdings in the Calamos Funds (as described and calculated under "Rights of Accumulation" as further noted in the Funds' prospectus) are eligible to be aggregated as of the start of the 13-month period and will be credited toward satisfying the LOI, but the reduced LOI sales charge rate will only apply to purchases made on or after the commencement date of the LOI. The 13-month LOI period commences with your first purchase of shares at the reduced LOI sales charge rate, and this first purchase also acknowledges acceptance of the terms of the LOI. The initial investment must meet the minimum initial purchase requirements. Purchases resulting from the reinvestment of dividends and/or capital gains do not apply towards the fulfillment of the LOI. In all instances, it is the investor's responsibility to notify the Funds, the Funds' transfer agent and/or their financial advisor of any current holdings in the Calamos Funds that should be counted towards the sales charge reduction (and provide account statements, as needed, for verification purposes) and any subsequent purchases that should be counted towards fulfillment of the LOI. During the term of the LOI, shares representing up to 5% of the indicated LOI amount will be held in escrow. Shares held in escrow have full dividend and voting privileges. The escrowed shares will be released when the full amount indicated has been purchased. If the full indicated LOI amount is not purchased during the term of the LOI, you will be required to pay CFS an amount equal to the difference between the dollar amount of the sales charges actually paid and the amount of the sales charges that you would have paid on your aggregate purchases if the total of such purchases had been made at a single time, and CFS reserves the right to redeem escrowed shares from your account if necessary to satisfy this obligation. Any remaining escrowed shares will be released to you. An LOI does not obligate you to buy, or a Fund to sell, the indicated amount of shares. Before submitting and/or signing an LOI, please carefully read and review the LOI provisions found in both this prospectus and the statement of additional information.
If purchasing shares through a financial intermediary, please also see the "Reduced sales charges available through certain financial intermediaries" section for more information.
Large purchase order
You may purchase a Fund's Class A shares at the NAV without a sales charge provided that the total amount invested in Class A shares of all Funds within the CALAMOS FAMILY OF FUNDS totals at least $1,000,000. You may purchase Market Neutral Income Fund, Merger Arbitrage Fund, Convertible Fund, Global Convertible Fund, Total Return Bond Fund, High Income Opportunities Fund, and Short-Term Bond Fund's Class A shares at the NAV without a sales charge provided that the total amount invested in Class A shares of all Funds within the CALAMOS FAMILY OF FUNDS totals at least $250,000. For all Funds except Market Neutral Income Fund, Merger Arbitrage Fund, Convertible Fund, Global Convertible Fund, Total Return Bond Fund, High Income Opportunities Fund, and Short-Term Bond Fund, shares purchased at NAV in an account with a value of at least $1,000,000 without a sales charge may incur a contingent deferred sales charge of 1.00% if sold within two years after purchase, excluding shares purchased from the reinvestment of dividends or capital gains distributions. Shares of Market Neutral Income Fund, Merger Arbitrage Fund, Convertible Fund, Global Convertible Fund, Total Return Bond Fund, and High Income Opportunities Fund purchased at NAV in an account with a value of at least $250,000 without a sales charge may incur a contingent deferred sales charge of 1.00% if sold within one year after purchase, excluding shares purchased from the reinvestment of dividends or capital gains distributions. Shares of Short-Term Bond Fund purchased at NAV in an account with a value of at least $250,000 without a sales charge may incur a contingent deferred sales charge of 0.55% if sold within one year after purchase, excluding shares purchased from the reinvestment of dividends or capital gains distributions. See "Contingent deferred sales charges" for more information about contingent deferred sales charges.
CALAMOS FAMILY OF FUNDS
152
What accounts are eligible for reduced sales charges on Class A shares?
You may aggregate your eligible accounts with the eligible accounts of members of your immediate family to obtain a breakpoint discount. The types of eligible accounts that may be aggregated to obtain the breakpoint discounts described above include:
|
• Individual accounts |
|
• Joint accounts |
|
• Certain IRA accounts |
|
For the purpose of obtaining a breakpoint discount, members of your "immediate family" include your spouse, child, stepchild, parent, stepparent, sibling, grandchild and grandparent, in each case including in-law and adoptive relationships. In addition, a fiduciary can count all shares purchased for a trust, estate or other fiduciary account (including one or more employee benefit plans of the same employer) that has multiple accounts. Eligible accounts include those registered in the name of your financial intermediary through which you own CALAMOS FAMILY OF FUNDS SHARES. If purchasing shares through a financial intermediary, please also see the "Reduced sales charges available through certain financial intermediaries" section for more information.
Who may purchase Class A shares without a sales charge?
Any of the following investors may purchase Class A shares of a Fund at NAV, with no initial sales charge:
(a) any investor buying shares through a wrap account or other investment program whereby the investor pays the investment professional directly for services;
(b) any investor buying Class A shares by exchanging Class A shares of another Fund in the CALAMOS FAMILY OF FUNDS or Fidelity Investments Money Market Treasury Portfolio Shares, if purchases of those shares have previously incurred a sales charge (see "Money market fund" below);
(c) any trust created under a pension, profit sharing or other employee benefit plan (including qualified and non-qualified deferred compensation plans), where such plan has at least $1,000,000 in assets or 100 employees, or where the administrator for such plan acts as the administrator for qualified employee benefit plans with assets of at least $1,000,000, except for purchases by such plans made through brokerage relationships in which sales charges are customarily imposed. For purposes of this waiver, eligible accounts and/or plan types do not include SEP IRAs, SAR-SEPs, SIMPLE IRAs, Keogh plans, or individual participant-level 401(k) and/or 403(b) plans;
(d) any company exchanging shares with a Fund pursuant to a merger, acquisition or exchange offer;
(e) any investor or intermediary platform on behalf of investors, including any investment company, that has entered into an investment advisory agreement or other written arrangements with CALAMOS ADVISORS or its affiliates;
(f) some insurance company separate accounts not otherwise restricted by Internal Revenue Code Section 817(h);
(g) any current or retired trustee of the Trust, or other registered investment company where CALAMOS ADVISORS acts as the sole investment adviser; or any associated trust, person, profit sharing or other benefit plan of such current or retired trustee;
(h) any employee of CALAMOS FINANCIAL SERVICES LLC ("CFS" or the "Distributor"), the Funds' distributor, or its affiliates;
(i) employees of an entity with a selling group agreement with CFS;
(j) any member of the immediate family of a person qualifying under (g), (h) or (i) including a spouse, child, stepchild, parent, stepparent, sibling, grandchild and grandparent, in each case including in-law and adoptive relationships;
(k) accounts at any intermediary who have entered into an agreement with CFS to offer shares to self-directed accounts; or
(l) any Class Y shareholders of the Predecessor Fund of Timpani Small Cap Growth Fund that received Class A shares in connection with the Reorganization with the Timpani Small Cap Growth Fund. The initial investment and additional investment minimums are waived for Class Y shareholders of the Predecessor Fund who received Class A shares as part of the Reorganization.
Proceeds of Class A shares redeemed from a Fund within the previous 90 days may be reinvested in Class A shares of that Fund at NAV without a sales charge.
PROSPECTUS | March 1, 2024
153
If purchasing shares through a financial intermediary, please also see the "Reduced sales charges available through certain financial intermediaries" section for more information.
How do I obtain a breakpoint discount or purchase Class A shares without a sales charge?
The steps to obtain a breakpoint discount depend on how your account is maintained with the CALAMOS FAMILY OF FUNDS. To obtain any of the breakpoint discounts described above, you must notify us or your financial advisor at the time you purchase shares of each eligible account you or a member of your immediate family maintains. For example, if an initial investment that was less than $1,000,000 grows to over $1,000,000, you must tell us or your financial advisor that you qualify to purchase Class A shares without an initial sales charge when you make a subsequent investment. If you do not let us or your financial advisor know of all of the holdings or planned purchases that make you eligible for a reduction, you may not receive a discount to which you are otherwise entitled. If you make your investment through a financial advisor, it is solely your financial advisor's responsibility to ensure that you receive discounts for which you are eligible, and the Funds are not responsible for a financial advisor's failure to apply the eligible discount to your account. You may be asked by us or your financial advisor for account statements or other records to verify your discount eligibility, including, where applicable, records for accounts opened with a different financial advisor and records of accounts established by members of your immediate family. If you own shares exclusively through an account maintained with the Funds' transfer agent, you will need to provide the foregoing information to us at the time you purchase shares. Additional information regarding sales loads and discounts applicable to us may be found in the Funds' statement of additional information, which can be obtained on CALAMOS ADVISORS' website at www.calamos.com.
If purchasing shares through a financial intermediary, please also see the "Reduced sales charges available through certain financial intermediaries" section for more information.
Conversion to Class I Shares
Certain holders of Class A shares issued by Funds in the CALAMOS FAMILY OF FUNDS may convert their Class A shares for Class I shares of the same Fund provided that they: (1) hold their shares through an institution that has a valid Class I sales agreement with CFS authorizing such a conversion; and (2) are otherwise eligible to invest in Class I shares through their financial intermediary in accordance with the criteria set forth in "Fund Facts — What classes of shares do the Funds offer? — Class I". Any such conversion is subject to the Funds' discretion to accept or reject. Shares still subject to a contingent deferred sales charge are not eligible for such conversions — this includes Class A shares originally purchased at net asset value pursuant to the $1,000,000 purchase order privilege (or the $250,000 purchase order privilege for Market Neutral Income Fund, Merger Arbitrage Fund, Convertible Fund, Global Convertible Fund, Total Return Bond Fund, High Income Opportunities Fund, and Short-Term Bond Fund). Share class conversions are not eligible for contingent deferred sales charge waivers. For federal income tax purposes, a same-Fund conversion generally will not result in the recognition by the investor of a capital gain or loss. However, investors should consult their own tax or legal adviser to discuss their particular circumstances. Class A shareholders should contact their financial intermediary for information on the availability of Class I shares, and should read and consider the information set forth in "Fund Facts — What classes of shares do the Funds offer? — Class I" before any such conversion.
Class C Shares
The offering price for Class C shares is the NAV per share with no initial sales charge. However, each Fund pays an aggregate distribution and service fee at the annual rate of 1.00% of average net assets. As a result, the annual expenses for Class C shares are somewhat higher compared to Class A shares, which pay an aggregate 0.25% distribution fee.
Class C shares have a contingent deferred sales charge of 1.00% for any shares redeemed within one year of purchase, measured from the first day of the month in which the shares were purchased. No order for Class C shares of any Fund may exceed $1,000,000. Additionally, no order for Class C shares of Market Neutral Income Fund, Merger Arbitrage Fund, Convertible Fund, Global Convertible Fund, Total Return Bond Fund, and High Income Opportunities Fund may exceed $250,000.
Automatic Conversion to Class A Shares
As of March 1, 2021 (the "Effective Date"), Class C shares of the Calamos Funds, including Class C shares purchased prior to the Effective Date, are eligible for conversion to Class A shares of the same Fund approximately eight years after the date of each original purchase. It is the financial intermediary's responsibility to ensure that the shareholder is credited with the proper
CALAMOS FAMILY OF FUNDS
154
holding period. Prior to the Effective Date, for shareholders investing in Class C shares through certain financial intermediaries, retirement plans and/or group retirement recordkeeping platforms, omnibus accounts, and in certain other instances, the Fund and its agents may not have been tracking such holding periods, nor currently have the operational and systems capabilities to do so, or they may lack such capabilities entirely, and as such, may not be able to effectively administer this conversion option. Where such limitations exist, the conversion of Class C shares to Class A shares may still occur eight years after the Effective Date, or sooner, provided the shareholder provides documentation to support such a conversion. To determine eligibility for conversions in these circumstances, it is the responsibility of the shareholder and/or their financial advisor to notify the Fund, or the financial intermediary through which the shares are held, that the shareholder is eligible for the conversion of Class C shares to Class A shares, and the shareholder or their financial intermediary may be required to provide records that substantiate the holding period of Class C shares. It is the financial intermediary's (and not the Fund's) responsibility to keep records of transactions made in accounts it holds and to ensure that the shareholder is credited with the proper holding period based on such records or those provided to the financial intermediary by the shareholder. Please consult with your financial intermediary for the applicability of this conversion feature to your shares.
The conversion of Class C shares to Class A shares will be on the basis of the NAV per share, without the imposition of the Class A share sales load or any additional sales loads, fees, or other charges. Class C shares of a Fund acquired through the reinvestment of dividends and/or capital gains distributions will convert to Class A shares of the same Fund on a pro rata basis once automatic conversions commence. For federal income tax purposes, a same-Fund conversion generally will not result in the recognition by the investor of a capital gain or loss. However, investors should consult their own tax or legal adviser to discuss their particular circumstances. Class C shareholders should contact their financial intermediary for information on the availability of Class A shares, and should read and consider the information set forth in "Fund Facts — What classes of shares do the Funds offer? — Class A".
Additionally, certain financial intermediaries may implement a conversion holding period of less than eight years, or have additional or differing eligibility requirements than those described in the prospectus. Any such conversion policy is solely the responsibility of the respective financial intermediary to administer and support. Please consult with the financial intermediary through which you hold Fund shares for further information about any such conversion option. However, shareholders must have held the Class C shares being converted for a minimum of one year from the date of purchase of those shares. Shares still subject to a contingent deferred sales charge are not eligible for such conversions. Share class conversions are not eligible for contingent deferred sales charge waivers.
Conversion to Class A Shares
Certain holders of Class C shares issued by Funds in the CALAMOS FAMILY OF FUNDS may be eligible to convert their Class C shares for Class A shares of the same Fund provided that they: (1) hold their shares through an institution that has a valid Class A sales agreement with CFS authorizing such a conversion; and (2) are otherwise eligible to invest in Class A shares through their financial intermediary in accordance with the criteria set forth in "Fund Facts — What classes of shares do the Funds offer? — Class A". Any such conversion is subject to the Funds' discretion to accept or reject. In addition, shareholders must have held the Class C shares being converted for a minimum of one year from the date of purchase of those shares. Shares still subject to a contingent deferred sales charge are not eligible for such conversions. Share class conversions are not eligible for contingent deferred sales charge waivers. For federal income tax purposes, a same-Fund conversion generally will not result in the recognition by the investor of a capital gain or loss. However, investors should consult their own tax or legal adviser to discuss their particular circumstances. Class C shareholders should contact their financial intermediary for information on the availability of Class A shares, and should read and consider the information set forth in "Fund Facts — What classes of shares do the Funds offer? — Class A" before any such conversion.
Conversion to Class I Shares
Certain holders of Class C shares issued by Funds in the CALAMOS FAMILY OF FUNDS may be eligible to convert their Class C shares for Class I shares of the same Fund provided that they: (1) hold their shares through an institution that has a valid Class I sales agreement with CFS authorizing such a conversion; and (2) are otherwise eligible to invest in Class I shares through their financial intermediary in accordance with the criteria set forth in "Fund Facts — What classes of shares do the Funds offer? — Class I". Any such conversion is subject to the Funds' discretion to accept or reject. In addition, shareholders must have held
PROSPECTUS | March 1, 2024
155
the Class C shares being converted for a minimum of one year from the date of purchase of those shares. Shares still subject to a contingent deferred sales charge are not eligible for such conversions. Share class conversions are not eligible for contingent deferred sales charge waivers. For federal income tax purposes, a same-Fund conversion generally will not result in the recognition by the investor of a capital gain or loss. However, investors should consult their own tax or legal adviser to discuss their particular circumstances. Class C shareholders should contact their financial intermediary for information on the availability of Class I shares, and should read and consider the information set forth in "Fund Facts — What classes of shares do the Funds offer? — Class I" before any such conversion.
Class I Shares
The offering price for Class I shares is the NAV per share with no initial sales charge. There is no contingent deferred sales charge nor distribution or service fees with respect to Class I shares.
Class I shares are offered primarily for direct investment by investors through certain tax-advantaged retirement plans (including 401(k) plans, 457 plans, employer-sponsored 403(b) plans, profit sharing and money purchase pension plans, defined benefit plans, non-qualified deferred compensation plans and health care benefit funding plans) and by institutional clients, provided such plans or clients have assets of at least $1 million. Class I shares may also be offered to certain other entities or programs, including, but not limited to, investment companies, fee-based advisory relationships, and brokerage platforms of firms that have agreements with CALAMOS ADVISORS or its affiliates to offer such shares when acting solely on an agency basis for the purchase or sale of such shares, under certain circumstances. If you transact in Class I shares through a brokerage platform, you may be required to pay a commission and/or other forms of compensation to the broker. Shares of each Fund are available in other share classes that have different fees and expenses.
The minimum initial investment required to purchase each Fund's Class I shares is $1 million. There is no minimum subsequent investment requirement. Each Fund may reduce or waive the minimum initial investment of $1 million at its sole discretion. The minimum initial investment is waived for current or retired trustees of the Trust, Calamos Asset Management, Inc. and its subsidiaries, officers, and employees of CALAMOS ADVISORS, employees of CFS, or employees of an entity with a selling group arrangement with CFS, and their immediate family members, including a spouse, child, stepchild, parent, stepparents, sibling, grandchild, and grandparent, in each case including in-law and adoptive relationships. It is also waived for clients of CALAMOS ADVISORS or an affiliate thereof who acquire shares of a Fund made available through a mutual fund asset allocation program offered by CALAMOS ADVISORS or an affiliate thereof. Also, the minimum initial investment for Class I shares may be waived or reduced at the discretion of CFS, the Funds' distributor, including waivers or reductions for purchases made through certain registered investment advisers, fee-based advisory relationships, qualified third party platforms, certain tax-advantaged retirement plans (as further defined above), and brokerage platforms (as described above). Certain holders of Class A and Class C shares issued by Funds in the CALAMOS FAMILY OF FUNDS may convert their shares for Class I shares of the same Fund provided that they meet certain conditions set forth in this prospectus. Pursuant to the Reorganization of the Predecessor Fund into the Timpani Small Cap Growth Fund, Service Class and Institutional Class shareholders of the Predecessor Fund received Class I shares in connection with the Reorganization. The Class I eligibility requirements and initial investment minimum are waived for Service Class and Institutional Class shareholders of the Predecessor Fund who received Class I shares as part of the Reorganization.
As a result of the relatively lower expenses for Class I shares, the level of income dividends per share (as a percentage of NAV) and, therefore, the overall investment return, will typically be higher for Class I shares than for Class A and Class C shares.
Advisory Programs Eligible for Class I Shares
Class I shares purchased by accounts participating in certain programs sponsored by and/or controlled by financial intermediaries ("Advisory Programs") may be exchanged by the financial intermediary on behalf of the shareholder for Class A shares of the same Fund under certain circumstances. If a shareholder that holds Class I shares of a Fund no longer participates in an Advisory Program, the Class I shares held by the shareholder may be exchanged by the financial intermediary on behalf of the shareholder for Class A shares of the same Fund under certain circumstances. In this case, the shareholder would be subject to ongoing Class A shares' Rule 12b-1 fees to which it was not previously subject. All such exchanges are initiated by the financial intermediary and not the Fund, and the Fund does not have information or oversight with respect to such
CALAMOS FAMILY OF FUNDS
156
exchanges. Such exchanges will be on the basis of each Class' NAV per share, without the imposition of any sales charge, fee or other charge.
Class R6 Shares
The offering price for Class R6 shares is the NAV per share with no initial sales charge. There is no contingent deferred sales charge nor distribution or service fees with respect to Class R6 shares. There is no minimum initial investment nor minimum subsequent investment requirement for Class R6 shares. Class R6 shares are available for use by employer-sponsored retirement and benefit plans, held either at the plan level or through omnibus accounts that generally process no more than one net redemption and one net purchase transaction each day. Eligible employer-sponsored retirement and benefit plans include 401(k) plans, 457 plans, employer-sponsored 403(b) plans, profit sharing and money purchase pension plans, defined benefit plans, non-qualified deferred compensation plans, health care benefit funding plans and other specified benefit plans and accounts whereby the plan or the plan's broker, dealer or other financial intermediary ("financial intermediary") has an agreement with the Fund's Distributor or the Adviser to utilize Class R6 shares in certain investment products or programs ("specified benefit plans"). Class R6 shares are not available to retail or institutional investors that are not specified benefit plans. Class R6 shares are not available to Traditional or Roth IRAs, Coverdell Education Savings Accounts, SEPs, SAR-SEPs, SIMPLE IRAs, individual participant- level 403(b) plans or 529 portfolios. Certain financial intermediaries may not presently possess the operational and/or systems capabilities to restrict or otherwise limit purchases to those client or account types as defined above, such that accounts may exist in Class R6 Shares outside of the prospectus-defined account types and/or outside of specified benefit plans. The existence of any such accounts is not an indication of the Funds' prior knowledge and/or further consent to such accounts, as the Funds' ability to monitor for and potentially restrict any such accounts may be hampered by a financial intermediary's use of omnibus accounts to trade the Calamos Funds.
Reduced sales charges available through certain financial intermediaries
When purchasing shares through a financial intermediary, you may not benefit from certain policies and procedures of the Funds as your eligibility to purchase shares may be dependent upon the policies and procedures of your financial intermediary, including those regarding reductions or waivers of sales charges and other features of the share class. In all instances, it is your responsibility to notify your financial intermediary of any relationship or other facts that may qualify your investment for sales charge reductions or waivers and other features of the class. Different financial intermediaries may impose different sales charges. Please refer to the Appendix for the sales charge or contingent deferred sales charge waivers or discounts that are applicable to each financial intermediary.
Share Class Conversions
As deemed appropriate and if found to be in the best interest of the shareholders affected, the Funds may make available other share class conversion options, other than those specifically disclosed in this prospectus, at their sole discretion. Holders of a certain share class issued by Funds in the CALAMOS FAMILY OF FUNDS may be eligible to convert their shares for another share class of the same Fund provided that they: (1) hold their shares through an institution that has a valid sales agreement, for the share classes involved, with CFS authorizing such a conversion; and (2) are otherwise eligible to invest in the share classes involved through their financial intermediary in accordance with the criteria set forth in this prospectus. Shares still subject to a contingent deferred sales charge are not eligible for such conversions. Share class conversions are not eligible for contingent deferred sales charge waivers. For federal income tax purposes, a same-Fund conversion generally will not result in the recognition by the investor of a capital gain or loss. However, investors should consult their own tax or legal adviser to discuss their particular circumstances. Shareholders should contact their financial intermediary for information on share class availability, and should read and consider the corresponding prospectus before any such conversion.
Money market fund
If you wish to exchange your Fund shares for shares of a money market fund, you may exchange them for shares of the Fidelity Investments Money Market Treasury Portfolio ("Fidelity Treasury Shares"). Class A, Class C and Class I shares of the Funds may be exchanged for Class III, Class IV and Class I Fidelity Treasury Shares, respectively. Class R6 shares cannot be exchanged for Fidelity Treasury Shares nor can Fidelity Treasury Shares be exchanged for Class R6 shares.
PROSPECTUS | March 1, 2024
157
Fidelity Treasury Shares are offered by a separate prospectus and are not offered by the Funds. You may at any time exchange your Fidelity Treasury Shares back into shares of the equivalent class of the CALAMOS FAMILY OF FUNDS. However, should you redeem (and not exchange) your Fidelity Treasury Shares, you would pay any applicable contingent deferred sales charge. For a prospectus and more complete information on Fidelity Treasury Shares, including management fees and expenses, please call 800.582.6959. Please read the prospectus relating to Fidelity Treasury Shares carefully.
Not all financial intermediaries make Fidelity Treasury Shares available to their customers who hold shares of the Funds. Please contact your financial intermediary about the availability of Fidelity Treasury Shares.
Closed Fund Policies
For any Fund subject to a purchase restriction or limitation, each such Fund reserves the right to modify the extent to which sales of shares are limited and may, in its sole discretion, permit purchases of shares where, in the judgment of management, such purchases do not have a detrimental effect on the portfolio management of the Fund or its Shareholders. Notwithstanding the forgoing, each Fund continues to reserve the right to reject any order for the purchase of shares in whole or in part for any reason, and to suspend the sale of shares to the public in response to conditions in the securities markets or otherwise.
Contingent deferred sales charges
Any contingent deferred sales charge on redemptions of Class A or Class C shares is based on the lesser of the redemption price or purchase price of the Fund shares. For purposes of determining a contingent deferred sales charge, Fund shares are considered sold on a first-in, first-out basis. The contingent deferred sales charge may be waived under certain circumstances. See the statement of additional information for more information about the contingent deferred sales charge.
Which class of shares should I purchase?
The decision as to which class of shares you should purchase depends on a number of factors, including the amount and intended length of your investment. An investor making an investment that qualifies for reduced sales charges might consider Class A shares. An investor who prefers not to pay an initial sales charge might consider Class C shares. For more information about the share classes available, consult your financial advisor or call us toll free at 800.582.6959. Please note that financial intermediaries may receive different compensation depending upon which class of shares they sell.
What is the minimum amount I can invest in the Funds?
The minimum initial investment for Class A shares and Class C shares of each Fund is $2,500 per Fund account. For certain qualified retirement plans, such as individual retirement accounts, the minimum initial investment for Class A shares and Class C shares is $500 per Fund account. The minimum subsequent investment for Class A shares and Class C shares of any Fund is $50 per Fund account. The minimum initial investment for Class I shares is $1,000,000 per Fund account, with no minimum subsequent investment amount. There is no minimum initial or subsequent investment amount for Class R6 shares.
Each Fund may waive or reduce the minimum initial or subsequent investment requirement at its sole discretion, including, but not limited to, waivers or reductions for purchases made through any omnibus account or fee-based program of any financial intermediary with whom CALAMOS ADVISORS has entered into an agreement, including, without limitation, profit sharing or pension plans, Section 401(k) plans and Section 403(b)(7) plans in the case of employees of public school systems and certain non-profit organizations. There is no minimum initial or subsequent investment amount for Class R6 shares for participants in employer-sponsored retirement and benefit plans.
Additionally, investments in Class A shares of a Fund by former Class R shareholders of the same Fund (where Class A shares were acquired due to the conversion from Class R shares on or around February 22, 2018) may be made without regard to the normal initial or subsequent investment minimums for such shares.
Class Y shareholders of the Predecessor Fund of Timpani Small Cap Growth Fund who received Class A shares as part of the Reorganization are exempt from the initial investment and additional investment minimums for Class A shares of the Timpani Small Cap Growth Fund. Service Class and Institutional Class shareholders of the Predecessor Fund who received Class I shares as part of the Reorganization are exempt from the eligibility requirements and initial investment minimum for Class I shares of the Timpani Small Cap Growth Fund.
CALAMOS FAMILY OF FUNDS
158
How can I buy shares?
Class A, C, and I shares
You may buy shares of the Funds by contacting us, your financial advisor, your financial intermediary or the broker-dealer that gave you this prospectus. Your financial advisor or another intermediary may charge for its services. You may purchase shares from us directly without any additional charges other than those described above. When you buy shares, be sure to specify whether you want Class A, Class C, or Class I shares. For more information about the share classes available, please contact the financial intermediary through which you are purchasing Fund shares or call us toll free at 800.582.6959. Please note that financial intermediaries may receive different compensation depending upon which class of shares they sell.
Class R6 shares — Notice to Plan Participants
The purchase and redemption options for Class R6 shares are generally available to plan administrators and/or the plans themselves, but not to the individual participants of such plans. Plan participants should contact the financial intermediary and/or plan administrator through which the plan is held for additional information on their respective plan assets and/or how to transact in their respective plan assets, as the Fund's transfer agent, U.S. Bank Global Fund Services, will generally have no information with respect to or control over an individual participant's plan assets. For direct investments, please note that neither the Fund nor its transfer agent offers master plan documentation and/or record-keeping services.
Benefit plan participants may purchase Class R6 shares only through specified benefit plans. In connection with the purchase, the plan record-keeper or financial intermediary may charge for such services. Specified benefit plans may also purchase Class R6 shares through the Fund's transfer agent, U.S. Bank Global Fund Services. To make direct investments, please call us toll free at 800.582.6959. Specified benefit plans that purchase their shares directly from the Fund must hold their shares in an omnibus account at the benefit plan level.
Specified benefit plans will hold Class R6 shares (either directly or through a financial intermediary and/or plan record-keeper) in nominee or street name as the plan's agent. In most cases, the Fund's transfer agent, U.S. Bank Global Fund Services, will have no information with respect to or control over accounts of specific Class R6 shareholders and participants may obtain information about their accounts only through their plan. Class R6 shares are only available through a financial intermediary if the financial intermediary will not receive from Fund assets or the Distributor's or an affiliate's resources any commission payments, service fees (including sub-transfer agent and networking fees), or distribution fees (including Rule 12b-1 fees) with respect to assets invested in Class R6 shares. Certificates for Class R6 shares will not be issued.
All share classes
The offering price for shares will be based on the NAV per share, plus any applicable sales charge, next computed after receipt by the Funds' transfer agent of your purchase order in good form on any day the New York Stock Exchange (the "NYSE") is open for trading. Generally, if you place your order by 4:00 p.m. Eastern time, you will receive that day's offering price. Orders placed after 4:00 p.m. Eastern time will receive the following business day's offering price.
With respect to each Fund, at the discretion of the Fund, an investor may be permitted to purchase shares of the Fund by transferring securities to the Fund that meet the Fund's investment objective and policies. Securities transferred to the Fund will be valued in accordance with the same procedures used to determine the Fund's net asset value at the time of the next determination of net asset value after such receipt. Shares issued by the Fund in exchange for securities will be issued at net asset value determined as of the same time. All dividends, interest, subscription, or other rights pertaining to such securities after such transfers to the Fund will become the property of the Fund and must be delivered to the Fund by the investor upon receipt from the issuer. Investors that are permitted to transfer such securities may be required to recognize a taxable gain on such transfer and pay tax thereon, if applicable, measured by the difference between the fair market value of the securities and the investors' basis therein but will not be permitted to recognize any loss. The Trust will not accept securities in exchange for shares of the Fund unless: (1) such securities are, at the time of the exchange, eligible to be included in the Fund's investment portfolio and current market quotations are readily available for such securities; and (2) the investor represents and warrants that all securities offered to be exchanged are not subject to any restrictions upon their sale by the Fund under the Securities Act or under the laws of the country in which the principal market for such securities exists, or otherwise.
PROSPECTUS | March 1, 2024
159
We generally do not sell Fund shares to investors residing outside the U.S., District of Columbia, Puerto Rico, Guam and the U.S. Virgin Islands, even if they are U.S. citizens or lawful permanent residents of the U.S. We will sell shares to investors residing outside the U.S. if they have U.S. military APO or FPO addresses.
Generally, each purchase of shares is confirmed by a written statement mailed to the shareholder, without issuance of share certificates. You generally may buy shares using the following methods:
By mail
You may purchase shares of a Fund by sending a check payable to the CALAMOS FAMILY OF FUNDS, along with a completed account application, to the Fund's transfer agent: U.S. Bank Global Fund Services, P.O. Box 701, Milwaukee, WI 53201. A subsequent investment may be made by detaching the investment stub from your account statement and sending it, along with your check, in the envelope provided with your statement. If you do not have the investment stub, include the Fund name, your name, address, and account number on a separate piece of paper along with your check. All checks must be drawn on a U.S. bank in U.S. funds. To prevent check fraud, the Funds will not accept Treasury checks, credit card checks, traveler's checks, starter checks or checks written by third parties for the purchase of shares. A Fund also will not accept payment in cash, money orders, post-dated checks, or conditional orders for the purchase of shares. A $25 charge will be imposed if any check or electronic funds transfer submitted for investment is returned, and the investor will be responsible for any resulting loss sustained by the Fund. If you purchase shares by check or by electronic funds transfer via the Automatic Clearing House ("ACH") Network, and redeem them shortly thereafter, payment may be delayed until the transfer agent is reasonably assured that the check or purchase by ACH has been collected, which may take up to 15 calendar days. You may avoid this delay by buying shares with a wire transfer.
When purchasing shares through a financial intermediary, you may not benefit from certain policies and procedures of the Funds as your eligibility to purchase shares may be dependent upon the policies and procedures of your financial intermediary, including those regarding reductions or waivers of sales charges and other features of the share class
Please do not mail letters by overnight delivery service or registered mail to the Post Office Box address. The Funds do not consider the U.S. Postal Service or other independent delivery services to be their agents. Therefore, deposit in the mail or with such services, or receipt at U.S. Bank Global Fund Services post office box, of purchase orders does not constitute receipt by the transfer agent of the Funds. Receipt of purchase orders is based on when the order is received at the transfer agent's offices.
By telephone
Once you have established a Fund account, you may make subsequent purchases of $50 or more over the telephone by debiting your bank account, if this purchase option has been pre-authorized on your Fund account. To electronically debit your bank account, you must hold your account at a financial institution that is an ACH member. The Funds will initiate most electronic transfers from your bank account to pay for the share purchase within that same business day. Generally, if your order is received prior to 4 p.m. Eastern time, your shares will be purchased at the next applicable price calculated on the day your order is placed. To permit telephone purchases, your account must be open for 7 business days, and you must have authorized telephone purchases on your account application. Call us at 800.582.6959 to purchase shares by telephone or to obtain an account application with the telephone purchase option. If you did not authorize telephone purchases on your original account application, you may request telephone purchases by submitting a request to the Funds' transfer agent, in writing along with a voided check or savings account deposit slip, at U.S. Bank Global Fund Services, P.O. Box 701, Milwaukee, WI 53201.
When purchasing shares through a financial intermediary, you may not benefit from certain policies and procedures of the Funds as your eligibility to purchase shares may be dependent upon the policies and procedures of your financial intermediary, including those regarding purchase features of the share class.
The Funds may modify or terminate the ability to purchase shares by telephone at any time, or from time to time, without notice to shareholders. If your order to purchase shares of a Fund is canceled because your electronic transfer does not clear, you will be charged a $25 service fee, and you will be responsible for any resulting loss incurred by the Fund. The Funds and their transfer agent will be liable for losses resulting from unauthorized telephone purchases only if the Funds do not follow
CALAMOS FAMILY OF FUNDS
160
reasonable procedures designed to verify the identity of the caller. You should immediately verify your trade confirmations when you receive them. If an account has more than one owner or authorized person, the Fund will accept telephone instructions from any one owner or authorized person.
By wire
You may purchase shares by wiring funds from your bank. To establish and initially fund an account by wire, a completed account application is required before your wire can be accepted. You may mail or deliver by overnight mail your completed account application to the transfer agent. Upon receipt of your completed application, the transfer agent will establish an account for you. Your bank must include the name of the Fund you are purchasing, your Fund account number, and your name so that monies can be correctly applied. Your bank should transmit funds by wire to:
U.S. Bank, N.A.
777 East Wisconsin Avenue
Milwaukee, WI 53202
ABA #075000022
Credit:
U.S. Bank Global Fund Services
Account #112-952-137
Further Credit:
(name of Fund to be purchased)
(account registration)
(account number)
Before sending any wire, please advise the Funds and their transfer agent of your intent to wire funds by calling us at 800.582.6959. Wired funds must be received prior to 4:00 p.m. Eastern time to be eligible for same day pricing. Federal fund purchases will be accepted only on a day on which the Fund and the custodian are open for business. The Fund and U.S. Bank, N.A. are not responsible for the consequences of delays resulting from the banking or Federal Reserve wire system, or from incomplete wiring instructions.
When purchasing shares through a financial intermediary, you may not benefit from certain policies and procedures of the Funds as your eligibility to purchase shares may be dependent upon the policies and procedures of your financial intermediary, including those regarding purchase features of the share class.
By exchange
You may exchange Class A shares of a Fund for Class A shares of another Fund in the CALAMOS FAMILY OF FUNDS or for Class III Fidelity Treasury Shares with no sales charge, if you have previously paid a sales charge on the shares you are exchanging. You may exchange Class C shares of a Fund for Class C shares of another Fund in the CALAMOS FAMILY OF FUNDS or for Class IV Fidelity Treasury Shares with no sales charge, and the time period for the contingent deferred sales charge will continue to run. You may exchange Class III Fidelity Treasury Shares for Class A shares of a Fund without paying a sales charge, if you have previously paid a sales charge on the shares you are exchanging. You may exchange Class IV Fidelity Treasury Shares for Class C shares of a Fund with no sales charge, if you have previously paid a sales charge on the shares you are exchanging, and the time period for the contingent deferred sales charge will continue to run. You may exchange Class I shares of any Fund for Class I shares of another Fund in the CALAMOS FAMILY OF FUNDS or for Class I Fidelity Treasury Shares with no sales charge. In addition, you may exchange Class I Fidelity Treasury Shares for Class I shares of any Fund, provided you meet the eligibility requirements for Class I shares. See "Money market fund" above. Class R6 shares cannot be exchanged for Fidelity Treasury Shares nor can Fidelity Treasury Shares be exchanged for Class R6 shares. You may exchange Class R6 shares of a Fund for Class R6 shares of another Fund in the CALAMOS FAMILY OF FUNDS, however Class R6 shares offer limited exchange options, as not all of the Funds in the CALAMOS FAMILY OF FUNDS offer Class R6 shares.
Not all financial intermediaries make Fidelity Treasury Shares available to their customers who hold shares of the Funds. Please contact your financial intermediary about the availability of Fidelity Treasury Shares.
PROSPECTUS | March 1, 2024
161
The registration of the account to which you are making an exchange must be exactly the same as that of the account from which the exchange is made, and the amount you exchange must meet any applicable minimum investment of the Fund being purchased. You may exchange your shares by writing to us at the CALAMOS FAMILY OF FUNDS, c/o U.S. Bank Global Fund Services, P.O. Box 701, Milwaukee, WI 53201. If you have authorized telephone exchange on your account application, you may also exchange your shares by calling us at 800.582.6959. An exchange may also be made by instructing your financial advisor, who will communicate your instruction to us. An exchange transaction generally is considered a sale and purchase of shares for federal income tax purposes and may result in capital gain or loss.
The exchange privilege is not intended as a vehicle for short-term or excessive trading. Excessive or short-term exchange activity may interfere with portfolio management and have an adverse effect on all shareholders. Accordingly, a Fund may suspend or permanently terminate the exchange privileges of any investor who appears to be engaged in short-term or excessive trading. Although an investor may be precluded from utilizing the exchange privilege, an investor's ability to redeem shares of a Fund for cash will not be affected.
By transmittal from a broker-dealer
Financial intermediaries (such as broker-dealers or other sales agents) may communicate purchase orders by various means to the Fund's transfer agent. When purchasing shares through a financial intermediary, you may not benefit from certain policies and procedures of the Fund as your ability to utilize certain purchase features may be dependent upon the policies and procedures of your financial intermediary, including those regarding purchase features of the share class.
By Automatic Investment Plan
If you own shares of a Fund, you may purchase additional shares of that Fund periodically through the Automatic Investment Plan. Under the Plan, after your initial investment, you may authorize the Fund to withdraw from your bank checking or savings account an amount that you wish to invest on a regularly scheduled basis, which must be for $50 or more. Your financial institution must be a member of the ACH Network to participate.
If you wish to enroll in this Plan, complete the appropriate form. To obtain the form, call 800.582.6959. The Plan is not available to clients of financial advisors that offer similar investment services. The Funds may terminate or modify this privilege at any time. You may change your investment amount or terminate your participation in the Plan at any time by calling us at 800.582.6959 or by written notice to the transfer agent at least five calendar days prior to the effective date of the next transaction. A request to change bank information for this Plan may require a signature guarantee. If your order to purchase shares of a Fund is canceled because your electronic transfer does not clear, you will be charged a $25 service fee, and you will be responsible for any resulting loss incurred by the Fund.
How can I sell (redeem) shares?
Class A, C, and I shares
You may redeem shares of a Fund by contacting us or your financial intermediary. Your financial intermediary may charge for its services. For shares held directly only, you may redeem shares from us directly without any additional charges other than those described below.
Class R6 shares — Notice to Plan Participants
The purchase and redemption options for Class R6 shares are generally available to plan administrators and/or the plans themselves, but not to the individual participants of such plans. Plan participants should contact the financial intermediary and/or plan administrator through which the plan is held for additional information on their respective plan assets and/or how to transact in their respective plan assets, as the Fund's transfer agent, U.S. Bank Global Fund Services, will generally have no information with respect to or control over an individual participant's plan assets. For direct investments, please note that neither the Fund nor its transfer agent offers master plan documentation and/or record-keeping services.
You may redeem Class R6 shares of a Fund by contacting us or your financial intermediary and/or plan record-keeper, depending first on how the shares are held. Your financial intermediary or plan record-keeper may charge for its services. For shares held directly only, you may redeem shares from us directly without any additional charges other than those described below.
CALAMOS FAMILY OF FUNDS
162
Retirement plan record-keepers, participant recordkeeping organizations and other financial intermediaries may also impose their own restrictions, limitations or fees in connection with transactions in the Fund's shares, which may be stricter than those described in this prospectus. You should contact your plan/participant record-keeper or financial intermediary for more information on any additional restrictions, limitations or fees that are imposed in connection with transactions in Fund shares.
Once your written instructions to sell shares of a Fund have been received, you may not cancel or revoke your request. It is, therefore, very important that you call us at 800.582.6959 if you have any questions about the requirements for selling shares before submitting your request.
Class A, C, and I shares
Through your broker-dealer or financial intermediary (certain charges may apply)
Shares held for you in your broker-dealer and/or financial intermediary's name must be sold through the broker-dealer and/or financial intermediary.
Class R6 shares
Through your financial intermediary or plan/participant record-keeper
Class R6 shares are only available through a financial intermediary if the financial intermediary will not receive from Fund assets or the Distributor's or an affiliate's resources any commission payments, service fees (including sub-transfer agent and networking fees), or distribution fees (including Rule 12b-1 fees) with respect to assets invested in Class R6 shares.
Shares held for you in your financial intermediary's or plan/participant record-keeper's name must be sold through the financial intermediary or plan/participant record-keeper. Subject to any restrictions in the applicable specified benefit plan documents, financial intermediaries or plan/participant record-keepers are obligated to transmit redemption orders to the transfer agent promptly and are responsible for ensuring that redemption requests are in proper form. Specified benefit plans, financial intermediaries or plan/participant record-keepers will be responsible for furnishing all necessary documentation to the Fund's transfer agent and may charge for their services. Redemption proceeds will be forwarded to the specified benefit plan, financial intermediary or plan/participant record-keeper as promptly as possible and in any event within seven days after the redemption request is received by the transfer agent in good order.
By writing to the Funds' transfer agent
When your shares are held for you by the Funds' transfer agent, you may sell your shares by sending a written request to: U.S. Bank Global Fund Services, P.O. Box 701, Milwaukee, WI 53201. Your redemption request must:
1. specify the Fund, your Fund account number and the number of shares or dollar amount to be redeemed, if less than all shares are to be redeemed;
2. be signed by all owners exactly as their names appear on the account; and
3. for each signature on the redemption request, include a signature guarantee, if necessary.
Certain types of accounts, such as a trust, corporate, nonprofit or retirement accounts, may require additional documentation for their redemption requests to be deemed to be in good order. In the case of shares held by a corporation, the redemption request must be signed in the name of the corporation by an officer whose title must be stated, and a certified bylaw provision or resolution of the board of directors authorizing the officer to so act may be required. In the case of a trust or partnership, the signature must include the name of the registered shareholder and the title of the person(s) signing on its behalf.
Shareholders who have an IRA account must indicate on their written request whether or not to withhold federal income tax, as redemption requests failing to indicate an election not to have tax withheld will generally be subject to 10% withholding.
Under certain circumstances, before shares can be redeemed, additional documents may be required in order to verify the authority of the person seeking to redeem.
In all instances, before submitting your written redemption request to the Funds' transfer agent, you should first contact the Funds' transfer agent by telephone at 800.582.6959 to insure that you are providing all required documentation, as the status
PROSPECTUS | March 1, 2024
163
and type of your account and the amount to be redeemed will determine the requirements to be met. Please also see the "Signature Guarantee Program" section below for further details.
When redeeming shares through a financial intermediary, you may not benefit from certain policies and procedures of the Funds as your ability to utilize certain redemption features may be dependent upon the policies and procedures of your financial intermediary, including those regarding redemption features of the share class.
Please do not mail letters by overnight delivery service or registered mail to the Post Office Box address. The Funds do not consider the U.S. Postal Service or other independent delivery services to be their agents. Therefore, deposit in the mail or with such services, or receipt at U.S. Bank Global Fund Services post office box, of redemption requests does not constitute receipt by the transfer agent of the Funds. Receipt of redemption requests is based on when the request is received at the transfer agent's offices.
By telephone
Unless the telephone redemption options were declined on your original account application, you may elect to redeem your shares by telephone and have proceeds sent by wire, ACH or check to your address of record by calling us at 800.582.6959. With either the telephone redemption by check or ACH options, you may sell up to $50,000 worth of shares per day. There is no dollar limit on redemption proceeds sent by wire when using a pre-authorized "telephone redemption by wire" account option (where a pre-authorized bank record is already on file). For redemption proceeds paid by check, you cannot redeem shares by telephone if you have changed the address of record on your account within the preceding 30 days.
If you want redemption proceeds sent to your bank account by either wire transfer (at a current cost of $15 per transfer), or electronic funds transfer via the ACH Network at no cost, you must have selected these alternate payment types on the application. If you have authorized telephone redemptions on your original account application, but would like to change the predetermined bank to which proceeds are sent, please submit your request in writing with a signature guarantee or other acceptable form of authentication from a financial institution source, along with a voided check or savings account deposit slip for the new bank account. Only member banks may transmit funds via the ACH network.
If you declined telephone redemptions on your original account application, you may request the telephone redemption privilege at a later date by submitting a request in writing, which may require a signature guarantee or other acceptable form of authentication from a financial institution source. Please send your request along with a voided check or savings account deposit slip to have proceeds deposited directly into your bank account to U.S. Bank Global Fund Services, P.O. Box 701, Milwaukee, WI 53201.
To redeem shares from your account by telephone, call 800.582.6959. IRA investors will be asked whether or not to withhold federal income taxes from any distribution. To reduce the risk of fraudulent instruction and to ensure that instructions communicated by telephone are genuine, the Funds will send your redemption proceeds only to the address or bank/brokerage account as shown on their records. The Funds also may record a call, request more information and send written confirmation of telephone transactions. The Funds and their transfer agent will be liable for losses resulting from unauthorized telephone instructions only if the Funds do not follow reasonable procedures designed to verify the identity of the caller. Please verify the accuracy of each telephone transaction as soon as you receive your confirmation statement. If an account has more than one owner or authorized person, the Fund will accept telephone instructions from any one owner or authorized person.
When redeeming shares through a financial intermediary, you may not benefit from certain policies and procedures of the Funds as your ability to utilize certain redemption features may be dependent upon the policies and procedures of your financial intermediary, including those regarding redemption features of the share class.
During periods of volatile economic and market conditions, you may experience difficulty making a redemption request by telephone, in which case you should make your redemption request in writing. Telephone trades must be received by or prior to market close. During periods of high market activity, shareholders may encounter higher than usual call wait times. Please allow sufficient time to place your telephone transaction. Once you place a telephone transaction request, it cannot be cancelled or modified after the close of regular trading on the NYSE (generally, 4:00 p.m., Eastern Time).
CALAMOS FAMILY OF FUNDS
164
By transmittal from a broker-dealer
Financial intermediaries (such as broker-dealers or other sales agents) may communicate redemption orders by various means to the Fund's transfer agent. When redeeming shares through a financial intermediary, you may not benefit from certain policies and procedures of the Fund as your ability to utilize certain redemption features may be dependent upon the policies and procedures of your financial intermediary, including those regarding redemption features of the share class.
By systematic withdrawal plan
Under the Funds' Systematic Withdrawal Plan, you may request that a Fund periodically redeem shares having a specified redemption value. In order to initiate the Systematic Withdrawal Plan, call 800.582.6959 and request a systematic withdrawal form. Generally, your account must have a share balance of $25,000 or more. Withdrawal proceeds are likely to exceed dividends and distributions paid on shares in your account and therefore may deplete and eventually exhaust your account. The periodic payments are redemption proceeds and are taxable as such. With respect to any possible contingent deferred sales charge or redemption fee waivers (as further defined in the CALAMOS FAMILY OF FUNDS' Statement of Additional Information), the maximum annual rate at which Class C shares (in their first year following purchase) and Class A shares (applicable to shares purchased at NAV pursuant to the $1,000,000 purchase order privilege for two years after the time of purchase (for Market Neutral Income Fund, Merger Arbitrage Fund, Convertible Fund, Global Convertible Fund, Total Return Bond Fund, High Income Opportunities Fund, and Short-Term Bond Fund, this applies to shares purchased at NAV pursuant to the $250,000 purchase order privilege for one year after the time of purchase)) may be redeemed under the Systematic Withdrawal Plan is 10% of the NAV of the account. Because a sales charge typically is imposed on purchases of Fund shares, you should not purchase shares while participating in the Systematic Withdrawal Plan. Generally, you may modify or terminate your Systematic Withdrawal Plan by calling us at 800.582.6959 or by written notice to the transfer agent received at least five calendar days prior to the effective date of the next withdrawal. You may have a check sent to your address of record or you may have proceeds sent to your predetermined bank account via electronic funds transfer through the ACH Network (which may require a signature guarantee).
When redeeming shares through a financial intermediary, you may not benefit from certain policies and procedures of the Funds as your ability to utilize certain redemption features may be dependent upon the policies and procedures of your financial intermediary, including those regarding redemption features of the share class.
By exchange
You may redeem all or any portion of your shares of a Fund and use the proceeds to purchase shares of any of the other Funds in the Calamos Family of Funds or Fidelity Treasury Shares if your signed, properly completed application is on file. An exchange transaction generally is considered a sale and purchase of shares for federal income tax purposes and may result in capital gain or loss. See "How can I buy shares? — By exchange" for more information about the exchange privilege. Class R6 shares cannot be exchanged for Fidelity Treasury Shares nor can Fidelity Treasury Shares be exchanged for Class R6 shares. You may exchange Class R6 shares of a Fund for Class R6 shares of another Fund in the Calamos Family of Funds, however Class R6 shares offer limited exchange options, as not all of the Funds in the Calamos Family of Funds offer Class R6 shares.
Not all financial intermediaries make Fidelity Treasury Shares available to their customers who hold shares of the Funds. Please contact your financial intermediary about the availability of Fidelity Treasury Shares.
Short-Term Redemption Fee
High Income Opportunities Fund may charge a 1.00% fee on all share classes redeemed before they have been held for more than 60 days. The fee applies if you redeem shares of High Income Opportunities Fund by selling or by exchanging to another fund. For purposes of determining this fee, shares are considered sold on a first-in, first-out basis. The redemption fee may be waived in certain circumstances, including in situations involving death or disability and in other circumstances as further described in the statement of additional information.
The redemption fee is paid directly to High Income Opportunities Fund to offset the costs of buying and selling securities. The redemption fee is designed to ensure that short-term investors pay their share of High Income Opportunities Fund's transaction costs and that long-term investors do not subsidize the activities of short-term traders.
PROSPECTUS | March 1, 2024
165
Signature Guarantee Program
A signature guarantee is a guarantee that your signature is authentic. A signature guarantee is required for a variety of transactions including, but not limited to, requests for changes to your account or to the instructions for distribution of proceeds. We reserve the right to require a signature guarantee on any transaction at our discretion.
A signature guarantee is designed to protect shareholders and the Funds from fraud by verifying signatures. You can obtain a signature guarantee from most domestic banks, brokers, dealers including CFS, credit unions, national securities exchanges, registered securities associations, clearing agencies and savings associations, as well as from participants in the New York Stock Exchange Medallion Signature Program and the Securities Transfer Agents Medallion Program ("STAMP"). An assertion or attestation by a notary public is not a signature guarantee and will not be accepted in place of a signature guarantee.
Non-financial transactions including establishing or modifying certain services on an account may require a signature guarantee, signature verification from a Signature Validation Program member or other acceptable form of authentication from a financial institution source. The Funds reserve the right to waive any signature guarantee requirement at their discretion.
A signature guarantee, from a Medallion program member or a non-Medallion program member, is required in the following situations:
• If ownership is being changed on your account;
• When redemption proceeds are payable or sent to any person, address or bank account not on record;
• Written requests to wire redemption proceeds (if not previously authorized on the account);
• When a redemption is received by the transfer agent and the account address has changed within the last 30 calendar days;
• For all redemptions in excess of $50,000 from any shareholder account.
Redemption requests
The Funds typically expect that a Fund will hold cash or cash equivalents to meet redemption requests. The Funds may also use the proceeds from the sale of portfolio securities to meet redemption requests if consistent with the management of the Fund. These redemption methods will be used regularly and may also be used in stressed market conditions. The Funds reserve the right to redeem in-kind as described under "Redemption-in-kind". Redemptions in-kind are typically used to meet redemption requests that represent a large percentage of a Fund's net assets in order to minimize the effect of large redemptions on the Fund and its remaining shareholders. Redemptions in-kind may be used regularly in circumstances as described above, and may also be used in stressed market conditions. Certain Funds may participate in the ReFlow liquidity program, as described in the statement of additional information, which is designed to provide an alternative liquidity source for mutual funds experiencing net redemptions of their shares. The Funds have in place an uncommitted line of credit intended to provide short-term financing, if necessary, subject to certain conditions, in connection with stressed market conditions or atypical redemption activity.
With regard to a Fund's investment in bank loans as compared to securities and to certain other types of financial assets, purchases and sales of loans take relatively longer to settle. This extended settlement process can (i) increase the counterparty credit risk borne by the Fund; (ii) leave the Fund unable to timely vote, or otherwise act with respect to, loans it has agreed to purchase; (iii) delay the Fund from realizing the proceeds of a sale of a loan; (iv) inhibit the Fund's ability to re-sell a loan that it has agreed to purchase if conditions change (leaving the Fund more exposed to price fluctuations); (v) prevent the Fund from timely collecting principal and interest payments; and (vi) expose the Fund to adverse regulatory consequences.
To the extent the extended loan settlement process gives rise to short-term liquidity needs, such as the need to satisfy redemption requests, the Fund may hold cash, sell investments or temporarily borrow from banks or other lenders.
If a Fund invests in a loan via a participation, the Fund will be exposed to the ongoing counterparty risk of the entity providing exposure to the loan (and, in certain circumstances, such entity's credit risk), in addition to the exposure the Fund has to the creditworthiness of the borrower.
CALAMOS FAMILY OF FUNDS
166
In certain circumstances, loans may not be deemed to be securities, and in the event of fraud or misrepresentation by a borrower or an arranger, lenders will not have the protection of the anti-fraud provisions of the federal securities laws, as would be the case for bonds or stocks. Instead, in such cases, lenders generally rely on the contractual provisions in the loan agreement itself, and common-law fraud protections under applicable state law.
Redemption-in-kind
The Funds reserve the right to pay all or part of a redemption request through an in-kind payment (in the form of securities or other assets instead of cash) if the Adviser reasonably believes that a cash redemption would negatively affect a Fund's operation or performance or that the redeeming shareholder may be engaged in market timing, frequent trading or other activity disruptive to portfolio management. Shares normally will be redeemed for cash, although each Fund retains the right to redeem some or all of its shares in-kind under unusual circumstances, in order to protect the interests of remaining shareholders, or to accommodate a request by a particular shareholder that does not adversely affect the interest of the remaining shareholders, by delivery of securities selected from its assets at its discretion. However, each Fund is required to redeem shares solely for cash up to the lesser of $250,000 or 1% of the net assets of that Fund during any 90-day period for any one shareholder. Should redemptions by any shareholder exceed such limitation, a Fund will have the option of redeeming the excess in cash or in-kind. In-kind payment means payment will be made in liquid portfolio securities rather than cash. If that occurs, the redeeming shareholder might incur brokerage and/or other transaction costs to convert the securities to cash.
Processing time
The Funds will send your redemption proceeds to you by check to the address of record or by wire to a predetermined bank or brokerage account. Redemption proceeds paid by wire will normally be sent on the next business day after receipt of the redemption request. The cost of the wire (currently $15) will be deducted from the redemption proceeds if you are redeeming all of your shares or only a specific number of shares. If you are redeeming a specific dollar amount, the wire fee will be deducted from the remaining balance in the account. You may also have proceeds sent directly to a predetermined bank or brokerage account via electronic funds transfer through the ACH Network if your bank or brokerage firm is an ACH member. There is no charge for an electronic funds transfer through the ACH Network and your proceeds will be credited to your account within two to three business days.
Proceeds from the sale of Fund shares will not be sent to you until the check or ACH purchase used to purchase the shares has cleared, which can take up to 15 calendar days after purchase. You may avoid this delay by buying shares with a wire transfer.
A Fund may suspend the right of redemption under certain extraordinary circumstances in accordance with the rules of the Securities and Exchange Commission.
Emergency Circumstances
The Funds may postpone the payment of redemption proceeds for up to seven calendar days from the date of redemption. In addition, the Funds can suspend and/or postpone payments of redemption proceeds beyond seven calendar days for:
(1) any period during which the New York Stock Exchange is closed for other than customary weekend and holiday closings or during which trading on the New York Stock Exchange is restricted;
(2) any period during which an emergency exists, as a result of which disposal of the securities owned is not reasonably practical or it is not reasonably practical for the Funds to fairly determine the value of its net assets; or
(3) such other periods as the Securities and Exchange Commission may by order permit for the protection of security holders of the company.
Small accounts
Due to the relatively high cost of handling small accounts, each Fund may give you 30 days written notice that it intends to redeem your shares, at the NAV of those shares, if your account has a value of less than $500. This would not apply if your account value declined to less than $500 as a result of market fluctuations.
PROSPECTUS | March 1, 2024
167
Class R6 Shares — Other Information
Your employer-sponsored retirement and benefit plan may establish various minimum investment requirements and may also establish certain privileges with respect to purchases and redemptions or the reinvestment of dividends. Plan participants should contact their plan record-keeper with respect to these issues. This prospectus should be read in connection with the specified benefit plan's and/or the financial intermediary's materials regarding its fees and services.
Transaction information
Share price
Each Fund's share price, or NAV, is determined as of the close of regular session trading on the NYSE (normally 4:00 p.m. Eastern Time) each day that the NYSE is open, in accordance with Rule 22c-1 of the 1940 Act. The NYSE is regularly closed on New Year's Day, the third Mondays in January and February, Good Friday, the last Monday in May, Independence Day, Labor Day, Thanksgiving and Christmas. If the NYSE is closed due to weather or other extenuating circumstances (for examples of other extenuating circumstances, see the section titled "Emergency Circumstances" in this prospectus) on a day it would typically be open for business, each Fund reserves the right to treat such day as a Business Day and accept purchase and redemption orders and calculate a Fund's NAV as of the normally scheduled close of regular trading on the NYSE or such other time that the Fund may determine, in accordance with applicable law. A Fund reserves the right to close if the primary trading markets of the Fund's portfolio instruments are closed and the Fund's management believes that there is not an adequate market to meet purchase, redemption or exchange requests. On any business day when the Securities Industry and Financial Markets Association ("SIFMA") recommends that the securities markets close trading early or when the NYSE closes earlier than scheduled, each Fund may (i) close trading early (as such, the time as of which the NAV is calculated would be advanced and, therefore, also the time by which purchase and redemption orders must be received in order to receive that day's NAV would be advanced) or (ii) accept purchase and redemption orders until, and calculate its NAV as of, the normally scheduled close of regular trading on the NYSE for that day. Purchase orders will be accepted only on days which the Funds are open for business.
The NAV per share for each class of Fund shares is calculated by dividing the pro rata share of the value of all of the securities and other assets of the Fund allocable to that class of Fund shares, less the liabilities allocable to that class, by the number of shares of the class outstanding. When shares are purchased or sold, the order is processed at the next NAV (plus any applicable sales charge) that is calculated on a day when the NYSE is open for trading, after receiving a purchase or sale order. On each day that the NYSE is open, Fund shares are ordinarily valued as of the NYSE close. Information that becomes known to the Funds after the time as of which NAV has been calculated on a particular day will not generally be used to retroactively adjust the price of a security or the NAV determined earlier that day. If regular trading on the NYSE closes earlier than scheduled, each Fund reserves the right to either (i) calculate its NAV as of the earlier closing time or (ii) calculate its NAV as of the normally scheduled close of regular trading on the NYSE for that day. Each Fund generally does not calculate its NAV on days during which the NYSE is closed. However, if the NYSE is closed on a day it would normally be open for business, each Fund reserves the right to calculate its NAV as of the normally scheduled close of regular trading on the NYSE for that day or such other time that the Fund may determine. To the extent circumstances prevent the use of the primary calculation methodology previously described, the Adviser may use alternative methods to calculate the NAV. Because the Funds may invest in securities that are primarily listed on foreign exchanges and trade on days when the Funds do not price their shares, a Fund's underlying assets may change in value on days when shareholders will not be able to purchase or redeem the Fund's shares. If shares are purchased or sold through an intermediary, it is the responsibility of that intermediary to transmit those orders to the Funds' transfer agent so such orders will be received in a timely manner.
A purchase or sale order typically is accepted when the Funds' transfer agent, an intermediary or plan record-keeper has received a completed application or appropriate instruction along with the intended investment, if applicable, and any other required documentation.
Valuation Procedures
The Trust's Board of Trustees, including a majority of the Trustees who are not "interested persons" of the Trust, have designated Calamos Advisors to perform fair valuation determinations related to all Fund investments under the oversight of
CALAMOS FAMILY OF FUNDS
168
the Board. As "valuation designee" Calamos Advisors has adopted procedures to guide the determination of the NAV on any day on which a Fund's NAVs are determined. The valuation of a Fund's investments is in accordance with these procedures. Fund securities that are traded on U.S. securities exchanges, except option securities, are valued at the official closing price, which is the last current reported sales price on its principal exchange at the time each Fund determines its net asset value ("NAV"). Securities traded in the over-the-counter market and quoted on The NASDAQ Stock Market are valued at the NASDAQ Official Closing Price, as determined by NASDAQ, or lacking a NASDAQ Official Closing Price, the last current reported sale price on NASDAQ at the time a Fund determines its NAV. When a last sale or closing price is not available, equity securities, other than option securities, that are traded on a U.S. securities exchange and other equity securities traded in the over-the-counter market are valued at the mean between the most recent bid and asked quotations on its principal exchange in accordance with guidelines adopted by the board of trustees. Each option security traded on a U.S. securities exchange is valued at the mid-point of the consolidated bid/ask quote for the option security, also in accordance with guidelines adopted by the board of trustees. Each over-the-counter option that is not traded through the Options Clearing Corporation is valued either by an independent pricing agent approved by the board of trustees or based on a quotation provided by the counterparty to such option under the ultimate supervision of the board of trustees.
Fixed income securities, bank loans, certain convertible preferred securities, and non-exchange traded derivatives are normally valued by independent pricing services or by dealers or brokers who make markets in such securities. Valuations of such fixed income securities, bank loans, certain convertible preferred securities, and non-exchange traded derivatives consider yield or price of equivalent securities of comparable quality, coupon rate, maturity, type of issue, trading characteristics and other market data and do not rely exclusively upon exchange or over-the-counter prices.
Trading on European and Far Eastern exchanges and over-the-counter markets is typically completed at various times before the close of business on each day on which the New York Stock Exchange ("NYSE") is open. Each security trading on these exchanges or in over-the-counter markets may be valued utilizing a systematic fair valuation model provided by an independent pricing service approved by the board of trustees. The valuation of each security that meets certain criteria in relation to the valuation model is systematically adjusted to reflect the impact of movement in the U.S. market after the foreign markets close. Securities that do not meet the criteria, or that are principally traded in other foreign markets, are valued as of the last reported sale price at the time the respective Fund determines its NAV, or when reliable market prices or quotations are not readily available, at the mean between the most recent bid and asked quotations as of the close of the appropriate exchange or other designated time. Trading of foreign securities may not take place on every NYSE business day. In addition, trading may take place in various foreign markets on Saturdays or on other days when the NYSE is not open and on which the respective Fund's NAV is not calculated.
If the valuation designee determines that the valuation of a security in accordance with the methods described above is not reflective of a fair value for such security, the security is valued at a fair value by the valuation designee.
Each Fund also may use fair value pricing, pursuant to guidelines adopted by Calamos Advisors, if trading in the security is halted or if the value of a security it holds is materially affected by events occurring before the Fund's pricing time but after the close of the primary market or exchange on which the security is listed. Those procedures may utilize valuations furnished by pricing services approved by Calamos Advisors, which may be based on market transactions for comparable securities and various relationships between securities that are generally recognized by institutional traders, a computerized matrix system, or appraisals derived from information concerning the securities or similar securities received from recognized dealers in those securities.
When fair value pricing of securities is employed, the prices of securities used by the Fund to calculate its NAV may differ from market quotations or official closing prices. There can be no assurance that the Fund could purchase or sell a portfolio security at the price used to calculate the Fund's net asset value ("NAV").
Distribution and Service (Rule 12b-1) Plan
The Funds have a Distribution and Service Plan or "12b-1 Plan." Under the plan, Class A shares pay a distribution and/or service fee at the annual rate of 0.25% of the average daily net assets of the class. Class C shares pay a service fee at the annual rate of 0.25% and a distribution fee at the rate of 0.75%. The distribution fees are for the sale of Fund shares, and the
PROSPECTUS | March 1, 2024
169
service fees are for services provided to shareholders. Since a Fund's assets are used to pay 12b-1 fees on an ongoing basis, over time those fees will increase the cost of your investment and may cost you more than other types of sales charges.
Consequently, long-term shareholders of Class C shares eventually may pay more than the economic equivalent of the maximum initial charges permitted by the Financial Industry Regulatory Authority ("FINRA"). For more information about the 12b-1 Plan, please see the Funds' statement of additional information.
Intermediaries
The Funds may authorize intermediaries to accept purchase, exchange and redemption orders on the Funds' behalf. An order properly received by an intermediary will be deemed to have been received by the Funds as of the time of receipt by the intermediary. If you buy, exchange or redeem shares through an intermediary, you will pay or receive the Fund's NAV per share (plus any applicable sales charge) next calculated after receipt and acceptance of the order by the intermediary, after giving effect to any transaction charge imposed by the intermediary. Each Fund's NAV is determined as of the close of regular session trading on the NYSE (normally 4:00 p.m., Eastern time) each day that the NYSE is open for trading.
If you buy and sell Fund shares through an intermediary or plan record-keeper, that intermediary or plan record-keeper may charge a fee for that service. Any such charges could constitute a substantial portion of a smaller account and may not be in your best interest. The Funds cannot always identify individual accounts or transactions for an account that is facilitated by an intermediary or plan record-keeper. Due to differing operational and systems capabilities, an intermediary may calculate sales charges and fees and track transaction activity differently than the Funds. When transacting in Fund shares, be sure you understand how your intermediary or plan record-keeper calculates sales charges and fees and tracks transaction activity.
Class A, C, and I shares
Shares of any Fund may be purchased through certain intermediaries that are agents of the Funds for the limited purpose of completing purchases and sales. For services provided by such a company with respect to Fund shares (except Class R6 shares) held by that company for its customers, and for shares held in Network Level III accounts, the Fund may pay additional fees for services being provided by the intermediary to the Fund's shareholders. For shares held in sub-accounts, such as those in qualified retirement plans, these fees are often referred to as "sub-transfer agent" or "recordkeeping" fees. The annual fee may either be a percentage of the account's average annual net assets or a specific dollar amount per account, determined on the basis of how the intermediary charges. The Board of Trustees of the Funds have set maximum limits to these payments.
The Funds' Adviser or Distributor, out of their own resources and without additional cost to a Fund or its shareholders, may provide additional cash compensation to intermediaries selling shares of a Fund, including third-party administrators of qualified plans whose customers have purchased Fund shares. These amounts would be in addition to the distribution payments made by a Fund under the distribution and service (Rule 12b-1) agreements described above and are commonly referred to as "revenue sharing" payments. These payments are generally a percentage of the account's average annual net assets.
CFS and/or CALAMOS ADVISORS may provide additional non-cash compensation to third parties selling the Funds, including affiliated companies, in accordance with relevant FINRA guidelines governing non-cash compensation. The Distributor may also pay concessions in addition to those described above to broker-dealers so that the Funds are made available by those broker-dealers for their customers.
Payments to Intermediaries may create a conflict of interest by influencing the broker-dealer or other Intermediary and your salesperson to recommend a Fund over another investment. Ask your salesperson or visit your Intermediary's website for more information.
In addition, CFS and/or CALAMOS ADVISORS may also share certain marketing expenses with intermediaries, or pay for or sponsor informational meetings, seminars, client awareness events, support for marketing materials, sales reporting, or business building programs for such financial intermediaries to raise awareness of the Funds. CFS and/or CALAMOS ADVISORS may make payments to participate in intermediary marketing support programs which may provide CFS and/or CALAMOS ADVISORS, as applicable, with one or more of the following benefits: attendance at sales conferences, participation in meetings or training sessions, access to or information about intermediary personnel, use of an intermediary's marketing and communication
CALAMOS FAMILY OF FUNDS
170
infrastructure, fund analysis, tools, data and data analytics, business planning and strategy sessions with intermediary personnel, information on industry- or platform specific developments, trends and service providers, and other marketing- related services. Such payments may be in addition to, or in lieu of, the payments described above. These payments are intended to promote the sales of the Funds and to reimburse financial intermediaries, directly or indirectly, for the costs that they or their salespersons incur in connection with educational seminars, meetings, and training efforts about the Funds to enable the intermediaries and their salespersons to make suitable recommendations, provide useful services, and maintain the necessary infrastructure to make the Funds available to their customers.
CFS has an Incentive Plan (the "Plan") covering its Intermediary Sales Department. Generally, CFS markets and sells shares of the Calamos Family of Funds to financial advisors, who in turn may recommend that investors purchase shares of a Fund. The Plan is an incentive program that combines discretionary quarterly bonuses with a discretionary annual bonus sales performance and other discretionary factors. Incentive compensation may differ for each Fund and is subject to change depending on certain criteria considered by CFS. The Plan creates a potential conflict of interest in that it creates an incentive for the Intermediary Sales Department members to sell one Fund over another. CFS' Compliance Department monitors sales and other activity in an effort to detect unusual activity in the context of the compensation structure under the Plan.
Anti-money laundering compliance
The Funds are required to comply with various federal anti-money laundering laws and regulations. Consequently, the Funds will request the following information from all investors: full name, date of birth, Social Security number and permanent street address. If you are opening the account in the name of a legal entity (e.g., partnership, limited liability company, business trust, corporation, etc.), you must also supply the identity of the beneficial owners. Corporate, trust, and other entity accounts must provide additional documentation. The Funds will use this information to verify your identity. The Funds will return your application and the monies received to establish your account if any of this information is missing. After your account is established, the Funds may request additional information from you to assist in verifying your identity. If the Funds are unable to verify your identity, they reserve the right to redeem your account at the current day's NAV. If at any time the Funds believe you may be involved in suspicious activity or if your identifying information matches information on government lists of suspicious persons, the Funds may choose not to establish a new account or may be required to "freeze" your account. The Funds also may be required to provide a governmental agency with information about your attempt to establish a new account or about transactions that have occurred in your account. The Funds also may be required to transfer monies received to establish a new account, transfer an existing account or transfer the proceeds of an existing account to a governmental agency. In some circumstances, the law may not permit a Fund to inform you that it has taken the actions described above.
Transaction restrictions
The Funds reserve the right to reject any order for the purchase of shares in whole or in part for any reason, and to suspend the sale of shares to the public in response to conditions in the securities markets or otherwise. The Fund generally expects to inform any investor within 24 hours if a purchase order has been rejected. The Funds are intended for long-term investment purposes only, and are not intended for short-term or excessive trading. Those practices may disrupt portfolio management strategies and/ or increase expenses, thus harming Fund performance.
Each Fund may, in its discretion, suspend, and may permanently terminate, the purchase privileges or the purchase portion of exchange privileges of any investor who engages in trading activity that the Fund believes would be disruptive to the Fund.
Although each Fund will attempt to give prior notice of a suspension or termination of such privileges when it is reasonably able to do so, the suspension or termination may be effective immediately, thereby preventing any uncompleted exchange.
In addition, the Funds receive purchase and sale orders through intermediaries and cannot always identify or reasonably detect short-term or excessive trading that may be facilitated by those intermediaries or by the use of omnibus accounts by those intermediaries. Omnibus accounts are comprised of multiple investors whose purchases and redemptions are aggregated and netted before being submitted to the Funds, making it more difficult to locate and eliminate short-term or excessive trading. To the degree a Fund is able to identify excessive or short-term trading in accounts maintained by intermediaries, the Fund will seek the cooperation of the intermediary to enforce the Fund's excessive trading policy. However, there can be no assurance that an intermediary will cooperate in all instances. Certain intermediaries may not presently possess the same operational
PROSPECTUS | March 1, 2024
171
capabilities to track the number of purchase, redemption or exchange orders made by an individual investor as the Funds, or they may lack such capabilities entirely. Certain intermediaries may possess other capabilities to deter short-term or excessive trading upon which the Funds may rely. In general, the Funds cannot eliminate the possibility that short-term or excessive trading activity will occur in the Funds.
Each Fund also reserves the right to restrict the account of any investor with respect to purchase orders or the purchase portion of exchange orders, without prior notice, if the trading activity in the account is determined to be disruptive to the Fund. To minimize harm to the Funds and their shareholders, each Fund may, at the Fund's sole discretion, exercise these rights if an investor has a history of excessive or disruptive trading. In making this judgment, the Fund may consider trading done in multiple accounts under common ownership or control. Such restriction typically is placed in the account immediately after such disruptive trading is determined to be occurring.
Excessive trading policies and procedures
Excessive trading may present risks to the Funds' long-term shareholders. Excessive trading into and out of a Fund can be disruptive to the portfolio, including with respect to the implementation of investment strategies. Excessive trading also may create taxable gains to remaining Fund shareholders and may increase Fund expenses, which may negatively impact investment returns for remaining shareholders.
Funds that invest in foreign securities may be at a greater risk for excessive trading. Some investors may seek to profit from the fact that foreign markets or exchanges normally close earlier in the day than do U.S. markets or exchanges. These investors may seek to engage in a practice known as pricing arbitrage to take advantage of information that becomes available after the close of the foreign markets or exchanges but before the Fund prices its shares, which may affect the prices of the foreign securities held by a Fund. Alternatively, some investors may attempt to benefit from stale pricing — when trading in a security held by a Fund is halted and does not resume prior to the time the Fund calculates its NAV. To the extent that a Fund does not accurately value securities, short-term arbitrage traders may dilute the Fund's NAV, which may negatively impact long-term shareholders. Although the Funds have adopted policies and procedures intended to reduce their exposure to price arbitrage, stale pricing and other potential pricing inefficiencies, the Funds cannot entirely eliminate the potential for short-term arbitrage trades to dilute the value of Fund shares.
The Funds' policy is against trading of Fund shares by Fund shareholders that is disruptive to the management of a Fund. In analyzing whether trading is disruptive, the Funds will consider the purpose of the trades, the effects on the Fund's portfolio and shareholders, and the impact of any costs or administrative charges it may incur (net of any reimbursement by the shareholder). For certain redemption and reinvestment transactions in which the investment adviser or its affiliates may engage, see page 67 of the statement of additional information.
The Funds' policy is against frequent purchases and redemptions of a Fund's shares that are disruptive to the Fund's portfolio. The Funds attempt to detect and deter excessive trading through the following methods:
• imposing restrictions on trading or exchange privileges of investors the Funds believe are engaging in short-term or excessive trading, as described under "Transaction restrictions;"
• utilizing fair valuation of securities, as described under "Valuation procedures;" and
• monitoring trades.
Although the Funds will take steps to detect and deter abusive trading pursuant to the policies and procedures approved by the board of trustees, there are no assurances that these policies and procedures will be effective in limiting excessive trading in all circumstances. For example, the Funds may be unable to completely eliminate the possibility of excessive trading in certain omnibus accounts and other accounts traded through intermediaries as discussed in the "Transaction restrictions" section.
Certain types of transactions will be exempt from the excessive trading policies and procedures. These exempt transactions are certain non-participant directed transactions in retirement plans, and purchases and redemptions by Calamos funds of funds.
The Funds' policies and procedures regarding excessive trading may be modified by the Board of Trustees at any time.
CALAMOS FAMILY OF FUNDS
172
Interfund Lending
The SEC has granted an exemptive order to the Funds permitting the Funds to participate in an interfund lending facility whereby participating Funds may directly lend to and borrow money from each other for temporary purposes (e.g., to satisfy redemption requests or when a sale of securities "fails," resulting in an unanticipated cash shortfall) (the "InterFund Program"). A description of the Funds' policies and procedures in connection with the InterFund Program is available in the statement of additional information and on the Funds' website, www.calamos.com.
Distributions and taxes
Dividends and capital gains distributions
You may receive two kinds of distributions from a Fund: dividends and capital gains distributions. Unless you requested on the account application or in writing that distributions be made in cash, all dividends and capital gains distributions are paid by crediting you with additional Fund shares of the same class you already own. In addition, under the same shareholder account registration and within the same share class, dividends and distributions from one Fund may be reinvested into another Fund, with this receiving Fund account being subject to the minimum initial investment requirements. These shares are valued at the next NAV per share that is computed after the dividend or distribution date. There is no sales charge applied. Market Neutral Income Fund, Hedged Equity Fund, Convertible Fund, Global Convertible Fund, Growth and Income Fund, Dividend Growth Fund, and Global Opportunities Fund declare and pay dividends from net investment income quarterly; Phineus Long/Short Fund, Merger Arbitrage Fund, Timpani Small Cap Growth Fund, Timpani SMID Growth Fund, Growth Fund, Select Fund, International Growth Fund, Evolving World Growth Fund, Global Equity Fund and International Small Cap Growth Fund declare dividends annually; High Income Opportunities Fund declares and pays dividends from net investment income monthly; and Total Return Bond Fund and Short-Term Bond Fund declare dividends from net investment income daily and pay such dividends monthly. Distributions of capital gains, if any, are paid to shareholders by each Fund at least annually.
If a dividend check is returned undeliverable, or if a check remains outstanding for six months, the Fund reserves the right to reinvest those dividends in additional shares of that Fund at the current NAV and to designate the account as a dividend reinvestment account.
You may change the distribution option on your account at any time by calling us at 800.582.6959 or by written notice to the transfer agent at least five calendar days prior to the record date of the next distribution.
Taxes
You may realize a capital gain or capital loss when you redeem or exchange shares, provided you hold Fund shares as a capital asset. The gain or loss will be a long-term or short-term capital gain or loss, depending on how long you owned the Fund shares. In addition to federal income tax, you may also be subject to state and local taxes on the redemption or exchange of Fund shares, depending on the laws of your home state and locality.
You may be taxed on dividends from net investment income and capital gains distributions at different rates depending on your tax situation. Dividends paid by a Fund from net investment income generally are taxable to you as ordinary income, unless paid from "qualified dividend income," as described below. Federal taxes on distributions of capital gains by a Fund are determined by how long the Fund owned the investments that generated the gains, rather than by how long you have owned your shares.
Distributions of gains from investments that a Fund owned for more than one year and that are properly reported by the Fund as capital gain dividends will generally be taxable to you as long-term capital gains. Distributions of gains from investments that a Fund owned for one year or less will generally be taxable to you as ordinary income. Annually, the Funds will advise you of the source of your distributions for tax purposes. Distributions to you are taxable even if they are paid from income or gains earned by a Fund before you invested in the Fund (and thus were included in the price paid for the Fund shares). Distributions are subject to federal income tax, whether received in cash or reinvested in additional Fund shares or shares of another fund, and may be subject to state or local taxes.
A portion of the dividends from net investment income paid by Funds may be eligible for the reduced rate applicable to "qualified dividend income," provided that the recipient of the dividend is an individual and that certain holding period and
PROSPECTUS | March 1, 2024
173
other requirements are met at both the shareholder and Fund level. No assurance can be given as to what portion of the dividends paid by a Fund will consist of "qualified dividend income."
The dividends and distributions paid by a Fund are generally taxable to you as of the date of payment, except for those distributions declared and payable to shareholders of record on a date in October, November or December and paid in January of the next year. Such a distribution will be treated as though it were received on December 31 of the year in which it is declared.
Income and proceeds received by a Fund from sources within foreign countries may be subject to withholding and other taxes imposed by such countries. A Fund's return on investments subject to such taxes will be decreased. Tax treaties between certain countries and the U.S. may reduce or eliminate such taxes. If more than 50% of a Fund's assets at taxable year end consists of the securities of foreign corporations, the Fund may elect to permit shareholders to claim a credit or deduction on their income tax returns for their pro rata portions of qualified taxes paid by the Fund to foreign countries. In addition, a Fund's investments in foreign securities or foreign currencies may increase or accelerate the Fund's recognition of ordinary income and may affect the timing or amount of the Fund's distributions.
A Fund's transactions in derivatives, as well as any of its hedging, short sale, securities loan or similar transactions may be subject to one or more special tax rules. These rules may affect whether gains and losses recognized by the Fund are treated as ordinary or capital, accelerate the recognition of income or gains to the Fund, defer losses to the Fund, and cause adjustments in the holding periods of the Fund's securities, thereby affecting whether capital gains and losses are treated as short-term or long-term. These rules could therefore affect the amount, timing and/or character of distributions to shareholders and thus taxes payable by shareholders.
A Fund may be required to withhold federal income tax ("backup withholding") from payments to you if:
• you fail to furnish your properly certified Social Security or other tax identification number;
• you fail to certify that your tax identification number is correct or that you are not subject to backup withholding due to the underreporting of certain income; or
• the Internal Revenue Service ("IRS") informs the Fund that your tax identification number is incorrect.
These certifications are contained in the application that you complete and return when you open an account. The Fund must promptly pay to the IRS all amounts withheld. Therefore, it is usually not possible for the Fund to reimburse you for amounts withheld. Backup withholding is not an additional tax. You may claim the amount withheld as a credit on your federal income tax return, provided you furnish the appropriate information to the IRS.
The above is only a summary of certain federal tax consequences of investing in a Fund. You should consult your tax adviser for more information about your own tax situation, including possible foreign, state, and local taxes.
Other information
Shareholder accounts
Each shareholder of a Fund receives quarterly account statements showing transactions in Fund shares, with a balance denominated in Fund shares. A confirmation will be sent to the shareholder upon purchase, redemption, or change of shareholder address (sent to both the former and the new address).
Retirement plans
You may use the Funds as investments for your IRA, profit sharing plan, pension plan, Section 401(k) plan, Section 403(b)(7) plan in the case of employees of public school systems and certain non-profit organizations, and certain other qualified plans. A master IRA plan document and information regarding IRA plan administration, fees, and other details are available from us or your plan administrator or record-keeper. For direct investments via corporate retirement plans, please note that neither the Funds nor their transfer agent offers master plan documentation and/or record-keeping services.
CALAMOS FAMILY OF FUNDS
174
Prospectuses and shareholder reports
The Funds reduce the number of duplicate prospectuses and other documents, including annual and semiannual reports you receive, by sending only one copy of each to those addresses shared by two or more accounts. Call us at 800.582.6959 or write to us at the CALAMOS FAMILY OF FUNDS, c/o U.S. Bank Global Fund Services, P.O. Box 701, Milwaukee, WI 53201 if you want to receive individual copies of these documents. The Funds will begin sending you individual copies within 30 days of your request.
Changes in 80% policies
Certain of the Funds have adopted non-fundamental operating policies that require at least 80% of the Fund's assets (net assets plus the amount of any borrowings for investment purposes) to be invested, under normal circumstances, in securities of the type suggested by the Fund's name. Although these requirements may be changed by the board of trustees without shareholder approval, a Fund will notify shareholders at least 60 days prior to any change in its 80% policy.
Lost Shareholders, Inactive Accounts and Unclaimed Property
It is important that the Funds maintain a correct address for each investor. An incorrect address may cause an investor's account statements and other mailings to be returned to the Funds. Based upon statutory requirements for returned mail, the Funds will attempt to locate the investor or rightful owner of the account. If the Funds are unable to locate the investor, then they will determine whether the investor's account can legally be considered abandoned. Mutual fund accounts may be transferred to the state government of an investor's state of residence if no activity occurs within the account during the "inactivity period" specified in the applicable state's abandoned property laws, which varies by state. The Funds are legally obligated to escheat (or transfer) abandoned property to the appropriate state's unclaimed property administrator in accordance with statutory requirements. The investor's last known address of record determines which state has jurisdiction. Please proactively contact the transfer agent at 800.582.6959 at least annually to ensure your account remains in active status. Investors who are residents of the state of Texas may designate a representative to receive legislatively required unclaimed property due diligence notifications. Please contact the transfer agent to complete a Texas Designation of Representative form.
PROSPECTUS | March 1, 2024
175
The financial highlights tables are intended to help you understand each Fund's financial performance during the periods indicated below for Class A, Class C, Class I and Class R6 shares, as applicable. Certain information reflects financial results for a single Fund share. The total returns in each table represent the rate that an investor would have earned (or lost) on an investment in the Fund (assuming reinvestment of all dividends and distributions). Deloitte & Touche LLP, an independent registered public accounting firm, has audited the information presented. The report of Deloitte & Touche LLP, along with the Funds' financial statements and financial highlights, is included in the Funds' annual report to shareholders for the fiscal year ended October 31, 2023, which is available upon request.
Calamos Market Neutral Income Fund
FINANCIAL HIGHLIGHTS
Selected data for a share outstanding throughout each year were as follows:
|
|
|
CLASS A |
|
CLASS C |
|
|
|
|
Year Ended October 31, |
|
Year Ended October 31, |
|
|
|
|
2023 |
|
2022 |
|
2021 |
|
2020 |
|
2019 |
|
2023 |
|
2022 |
|
2021 |
|
2020 |
|
2019 |
|
Net asset value, beginning
of year |
|
$ |
13.84 |
|
|
$ |
14.63 |
|
|
$ |
13.77 |
|
|
$ |
13.47 |
|
|
$ |
13.52 |
|
|
$ |
13.92 |
|
|
$ |
14.80 |
|
|
$ |
13.98 |
|
|
$ |
13.70 |
|
|
$ |
13.73 |
|
|
Income from investment
operations: |
|
Net investment income
(loss)(a) |
|
|
0.01 |
|
|
|
(0.04 |
) |
|
|
(0.45 |
) |
|
|
0.19 |
|
|
|
0.27 |
|
|
|
(0.10 |
) |
|
|
(0.27 |
) |
|
|
(0.57 |
) |
|
|
0.10 |
|
|
|
0.18 |
|
|
Net realized and
unrealized gain (loss) |
|
|
1.07 |
|
|
|
(0.72 |
) |
|
|
1.37 |
|
|
|
0.24 |
|
|
|
0.28 |
|
|
|
1.07 |
|
|
|
(0.61 |
) |
|
|
1.39 |
|
|
|
0.24 |
|
|
|
0.28 |
|
|
Total from investment
operations |
|
|
1.08 |
|
|
|
(0.76 |
) |
|
|
0.92 |
|
|
|
0.43 |
|
|
|
0.55 |
|
|
|
0.97 |
|
|
|
(0.88 |
) |
|
|
0.82 |
|
|
|
0.34 |
|
|
|
0.46 |
|
|
|
Distributions: |
|
Dividends from net
investment income |
|
|
(0.20 |
) |
|
|
(0.03 |
) |
|
|
(0.06 |
) |
|
|
(0.13 |
) |
|
|
(0.19 |
) |
|
|
(0.10 |
) |
|
|
— |
|
|
|
(0.00 |
)* |
|
|
(0.06 |
) |
|
|
(0.08 |
) |
|
Dividends from net
realized gains |
|
|
— |
|
|
|
— |
|
|
|
— |
|
|
|
— |
|
|
|
(0.41 |
) |
|
|
— |
|
|
|
— |
|
|
|
— |
|
|
|
— |
|
|
|
(0.41 |
) |
|
|
Total distributions** |
|
|
(0.20 |
) |
|
|
(0.03 |
) |
|
|
(0.06 |
) |
|
|
(0.13 |
) |
|
|
(0.60 |
) |
|
|
(0.10 |
) |
|
|
— |
|
|
|
(0.00 |
)* |
|
|
(0.06 |
) |
|
|
(0.49 |
) |
|
|
Net asset value, end of year |
|
$ |
14.72 |
|
|
$ |
13.84 |
|
|
$ |
14.63 |
|
|
$ |
13.77 |
|
|
$ |
13.47 |
|
|
$ |
14.79 |
|
|
$ |
13.92 |
|
|
$ |
14.80 |
|
|
$ |
13.98 |
|
|
$ |
13.70 |
|
|
Ratios and supplemental
data: |
|
|
Total return(b) |
|
|
7.76 |
% |
|
|
(5.22 |
%) |
|
|
6.67 |
% |
|
|
3.27 |
% |
|
|
4.32 |
% |
|
|
6.93 |
% |
|
|
(5.95 |
%) |
|
|
5.88 |
% |
|
|
2.46 |
% |
|
|
3.56 |
% |
|
Net assets, end of
year (000) |
|
$ |
1,009,976 |
|
|
$ |
1,244,117 |
|
|
$ |
1,334,984 |
|
|
$ |
817,405 |
|
|
$ |
744,356 |
|
|
$ |
254,478 |
|
|
$ |
306,312 |
|
|
$ |
322,432 |
|
|
$ |
252,490 |
|
|
$ |
261,352 |
|
|
Ratio of net expenses to
average net assets |
|
|
1.20 |
%(c) |
|
|
1.16 |
%(d) |
|
|
1.14 |
%(e) |
|
|
1.20 |
%(f) |
|
|
1.24 |
%(g) |
|
|
1.95 |
%(c) |
|
|
1.91 |
%(d) |
|
|
1.89 |
%(e) |
|
|
1.95 |
%(f) |
|
|
1.98 |
%(g) |
|
Ratio of gross expenses to
average net assets prior
to expense reductions |
|
|
1.21 |
% |
|
|
1.17 |
% |
|
|
1.14 |
% |
|
|
1.21 |
% |
|
|
1.24 |
% |
|
|
1.96 |
% |
|
|
1.92 |
% |
|
|
1.89 |
% |
|
|
1.96 |
% |
|
|
1.99 |
% |
|
Ratio of net investment
income (loss) to average
net assets |
|
|
0.06 |
% |
|
|
(1.12 |
%) |
|
|
(3.15 |
%) |
|
|
1.43 |
% |
|
|
2.04 |
% |
|
|
(0.69 |
%) |
|
|
(1.87 |
%) |
|
|
(3.92 |
%) |
|
|
0.70 |
% |
|
|
1.31 |
% |
|
|
|
|
Year Ended October 31, |
|
|
|
|
2023 |
|
2022 |
|
2021 |
|
2020 |
|
2019 |
|
|
Portfolio turnover rate |
|
|
28 |
% |
|
|
41 |
% |
|
|
49 |
% |
|
|
77 |
% |
|
|
74 |
% |
|
* Amounts are less than $0.005.
** Distribution for annual periods determined in accordance with federal income tax regulations.
(a) Net investment income (loss) allocated based on average shares method.
(b) Total return measures net investment income (loss) and capital gain or loss from portfolio investments assuming reinvestment of dividends and capital gains distributions. Total return is not annualized for periods that are less than a full year, does not reflect the effect of sales charge for Class A shares nor the contingent deferred sales charge for Class C shares and does not reflect the deduction of taxes that a shareholder would pay on fund distributions or the redemption of fund shares.
(c) Ratio of net expenses, excluding dividend expense on short positions, to average net assets was 1.03% and 1.77% for the year ended October 31, 2023.
(d) Ratio of net expenses, excluding dividend expense on short positions, to average net assets was 1.01% and 1.76% for the year ended October 31, 2022.
(e) Ratio of net expenses, excluding dividend expense on short positions, to average net assets was 1.03% and 1.78% for the year ended October 31, 2021.
(f) Ratio of net expenses, excluding dividend expense on short positions, to average net assets was 1.05% and 1.80% for the year ended October 31, 2020.
(g) Ratio of net expenses, excluding dividend expense on short positions, to average net assets was 1.06% and 1.80% for the year ended October 31, 2019.
CALAMOS FAMILY OF FUNDS
176
Calamos Market Neutral Income Fund
|
|
|
CLASS I |
|
|
|
|
Year Ended October 31, |
|
|
|
|
2023 |
|
2022 |
|
2021 |
|
2020 |
|
2019 |
|
Net asset value, beginning
of year |
|
$ |
13.68 |
|
|
$ |
14.45 |
|
|
$ |
13.60 |
|
|
$ |
13.30 |
|
|
$ |
13.36 |
|
|
Income from investment
operations: |
|
Net investment income
(loss)(a) |
|
|
0.04 |
|
|
|
(0.12 |
) |
|
|
(0.41 |
) |
|
|
0.22 |
|
|
|
0.30 |
|
|
Net realized and
unrealized gain (loss) |
|
|
1.06 |
|
|
|
(0.59 |
) |
|
|
1.35 |
|
|
|
0.24 |
|
|
|
0.28 |
|
|
Total from investment
operations |
|
|
1.10 |
|
|
|
(0.71 |
) |
|
|
0.94 |
|
|
|
0.46 |
|
|
|
0.58 |
|
|
|
Distributions: |
|
Dividends from net
investment income |
|
|
(0.24 |
) |
|
|
(0.06 |
) |
|
|
(0.09 |
) |
|
|
(0.16 |
) |
|
|
(0.23 |
) |
|
Dividends from net
realized gains |
|
|
— |
|
|
|
— |
|
|
|
— |
|
|
|
— |
|
|
|
(0.41 |
) |
|
|
Total distributions** |
|
|
(0.24 |
) |
|
|
(0.06 |
) |
|
|
(0.09 |
) |
|
|
(0.16 |
) |
|
|
(0.64 |
) |
|
|
Net asset value, end of year |
|
$ |
14.54 |
|
|
$ |
13.68 |
|
|
$ |
14.45 |
|
|
$ |
13.60 |
|
|
$ |
13.30 |
|
|
Ratios and supplemental
data: |
|
|
Total return(b) |
|
|
8.07 |
% |
|
|
(5.01 |
%) |
|
|
6.92 |
% |
|
|
3.51 |
% |
|
|
4.62 |
% |
|
Net assets, end of
year (000) |
|
$ |
12,620,874 |
|
|
$ |
14,470,090 |
|
|
$ |
14,780,637 |
|
|
$ |
9,207,961 |
|
|
$ |
7,709,445 |
|
|
Ratio of net expenses to
average net assets |
|
|
0.95 |
%(c) |
|
|
0.91 |
%(d) |
|
|
0.89 |
%(e) |
|
|
0.95 |
%(f) |
|
|
0.99 |
%(g) |
|
Ratio of gross expenses to
average net assets prior
to expense reductions |
|
|
0.95 |
% |
|
|
0.92 |
% |
|
|
0.89 |
% |
|
|
0.96 |
% |
|
|
0.99 |
% |
|
Ratio of net investment
income (loss) to average
net assets |
|
|
0.31 |
% |
|
|
(0.87 |
%) |
|
|
(2.90 |
%) |
|
|
1.66 |
% |
|
|
2.28 |
% |
|
** Distribution for annual periods determined in accordance with federal income tax regulations.
(a) Net investment income (loss) allocated based on average shares method.
(b) Total return measures net investment income (loss) and capital gain or loss from portfolio investments assuming reinvestment of dividends and capital gains distributions. Total return is not annualized for periods that are less than a full year, does not reflect the effect of sales charge for Class A shares nor the contingent deferred sales charge for Class C shares and does not reflect the deduction of taxes that a shareholder would pay on fund distributions or the redemption of fund shares.
(c) Ratio of net expenses, excluding dividend expense on short positions, to average net assets was 0.77% for the year ended October 31, 2023.
(d) Ratio of net expenses, excluding dividend expense on short positions, to average net assets was 0.76% for the year ended October 31, 2022.
(e) Ratio of net expenses, excluding dividend expense on short positions, to average net assets was 0.78% for the year ended October 31, 2021.
(f) Ratio of net expenses, excluding dividend expense on short positions, to average net assets was 0.80% for the year ended October 31, 2020.
(g) Ratio of net expenses, excluding dividend expense on short positions, to average net assets was 0.81% for the year ended October 31, 2019.
PROSPECTUS | March 1, 2024
177
Calamos Market Neutral Income Fund
Selected data for a share outstanding throughout each period were as follows:
|
|
|
CLASS R6 |
|
|
|
|
Year Ended October 31, |
|
June 23,
2020•
through
October 31, |
|
|
|
|
2023 |
|
2022 |
|
2021 |
|
2020 |
|
Net asset value, beginning
of period |
|
$ |
13.68 |
|
|
$ |
14.46 |
|
|
$ |
13.61 |
|
|
$ |
13.35 |
|
|
Income from investment
operations: |
|
Net investment income
(loss)(a) |
|
|
0.06 |
|
|
|
(0.11 |
) |
|
|
(0.38 |
) |
|
|
0.05 |
|
|
Net realized and
unrealized gain (loss) |
|
|
1.05 |
|
|
|
(0.60 |
) |
|
|
1.33 |
|
|
|
0.21 |
|
|
Total from investment
operations |
|
|
1.11 |
|
|
|
(0.71 |
) |
|
|
0.95 |
|
|
|
0.26 |
|
|
|
Distributions: |
|
Dividends from net
investment income |
|
|
(0.25 |
) |
|
|
(0.07 |
) |
|
|
(0.10 |
) |
|
|
— |
|
|
Dividends from net
realized gains |
|
|
— |
|
|
|
— |
|
|
|
— |
|
|
|
— |
|
|
|
Total distributions** |
|
|
(0.25 |
) |
|
|
(0.07 |
) |
|
|
(0.10 |
) |
|
|
— |
|
|
|
Net asset value, end of period |
|
$ |
14.54 |
|
|
$ |
13.68 |
|
|
$ |
14.46 |
|
|
$ |
13.61 |
|
|
Ratios and supplemental
data: |
|
|
Total return(b) |
|
|
8.08 |
% |
|
|
(4.94 |
%) |
|
|
6.99 |
% |
|
|
1.95 |
% |
|
Net assets, end of
year (000) |
|
$ |
49,159 |
|
|
$ |
43,956 |
|
|
$ |
8,846 |
|
|
$ |
10 |
|
|
Ratio of net expenses to
average net assets |
|
|
0.86 |
%(c) |
|
|
0.86 |
%(d) |
|
|
0.82 |
%(e) |
|
|
0.77 |
%(f)(g) |
|
Ratio of gross expenses to
average net assets prior
to expense reductions |
|
|
0.87 |
% |
|
|
0.87 |
% |
|
|
0.83 |
% |
|
|
0.77 |
%(g) |
|
Ratio of net investment
income (loss) to average
net assets |
|
|
0.40 |
% |
|
|
(0.82 |
%) |
|
|
(2.64 |
%) |
|
|
1.06 |
%(g) |
|
• Commencement of operations.
** Distribution for annual periods determined in accordance with federal income tax regulations.
(a) Net investment income (loss) allocated based on average shares method.
(b) Total return measures net investment income (loss) and capital gain or loss from portfolio investments assuming reinvestment of dividends and capital gains distributions. Total return is not annualized for periods that are less than a full year, does not reflect the effect of sales charge for Class A shares nor the contingent deferred sales charge for Class C shares and does not reflect the deduction of taxes that a shareholder would pay on fund distributions or the redemption of fund shares.
(c) Ratio of net expenses, excluding dividend expense on short positions, to average net assets was 0.69% for the year ended October 31, 2023.
(d) Ratio of net expenses, excluding dividend expense on short positions, to average net assets was 0.69% for the year ended October 31, 2022.
(e) Ratio of net expenses, excluding dividend expense on short positions, to average net assets was 0.70% for the year ended October 31, 2021.
(f) Ratio of net expenses, excluding dividend expense on short positions, to average net assets was 0.66% for the year ended October 31, 2020.
(g) Annualized.
CALAMOS FAMILY OF FUNDS
178
Calamos Hedged Equity Fund
FINANCIAL HIGHLIGHTS
Selected data for a share outstanding throughout each year were as follows:
|
|
|
CLASS A |
|
CLASS C |
|
|
|
|
Year Ended October 31, |
|
Year Ended October 31, |
|
|
|
|
2023 |
|
2022 |
|
2021 |
|
2020 |
|
2019 |
|
2023 |
|
2022 |
|
2021 |
|
2020 |
|
2019 |
|
Net asset value, beginning
of year |
|
$ |
13.08 |
|
|
$ |
14.66 |
|
|
$ |
12.35 |
|
|
$ |
11.88 |
|
|
$ |
11.44 |
|
|
$ |
12.78 |
|
|
$ |
14.39 |
|
|
$ |
12.18 |
|
|
$ |
11.72 |
|
|
$ |
11.35 |
|
|
Income from investment
operations: |
|
Net investment income
(loss)(a) |
|
|
0.08 |
|
|
|
0.06 |
|
|
|
0.06 |
|
|
|
0.10 |
|
|
|
0.10 |
|
|
|
(0.03 |
) |
|
|
(0.04 |
) |
|
|
(0.04 |
) |
|
|
0.01 |
|
|
|
0.01 |
|
|
Net realized and
unrealized gain (loss) |
|
|
0.98 |
|
|
|
(1.60 |
) |
|
|
2.32 |
|
|
|
0.47 |
|
|
|
0.64 |
|
|
|
0.96 |
|
|
|
(1.57 |
) |
|
|
2.28 |
|
|
|
0.48 |
|
|
|
0.63 |
|
|
Total from investment
operations |
|
|
1.06 |
|
|
|
(1.54 |
) |
|
|
2.38 |
|
|
|
0.57 |
|
|
|
0.74 |
|
|
|
0.93 |
|
|
|
(1.61 |
) |
|
|
2.24 |
|
|
|
0.49 |
|
|
|
0.64 |
|
|
|
Distributions: |
|
Dividends from net
investment income |
|
|
(0.09 |
) |
|
|
(0.04 |
) |
|
|
(0.07 |
) |
|
|
(0.10 |
) |
|
|
(0.05 |
) |
|
|
(0.04 |
) |
|
|
— |
|
|
|
(0.03 |
) |
|
|
(0.03 |
) |
|
|
(0.02 |
) |
|
Dividends from net
realized gains |
|
|
— |
|
|
|
— |
|
|
|
— |
|
|
|
— |
|
|
|
(0.25 |
) |
|
|
— |
|
|
|
— |
|
|
|
— |
|
|
|
— |
|
|
|
(0.25 |
) |
|
|
Total distributions** |
|
|
(0.09 |
) |
|
|
(0.04 |
) |
|
|
(0.07 |
) |
|
|
(0.10 |
) |
|
|
(0.30 |
) |
|
|
(0.04 |
) |
|
|
— |
|
|
|
(0.03 |
) |
|
|
(0.03 |
) |
|
|
(0.27 |
) |
|
|
Net asset value, end of year |
|
$ |
14.05 |
|
|
$ |
13.08 |
|
|
$ |
14.66 |
|
|
$ |
12.35 |
|
|
$ |
11.88 |
|
|
$ |
13.67 |
|
|
$ |
12.78 |
|
|
$ |
14.39 |
|
|
$ |
12.18 |
|
|
$ |
11.72 |
|
|
Ratios and supplemental
data: |
|
|
Total return(b) |
|
|
8.10 |
% |
|
|
(10.51 |
%) |
|
|
19.20 |
% |
|
|
4.92 |
% |
|
|
6.65 |
% |
|
|
7.28 |
% |
|
|
(11.19 |
%) |
|
|
18.43 |
% |
|
|
4.19 |
% |
|
|
5.88 |
% |
|
Net assets, end of
year (000) |
|
$ |
24,754 |
|
|
$ |
33,814 |
|
|
$ |
34,309 |
|
|
$ |
15,782 |
|
|
$ |
10,412 |
|
|
$ |
8,703 |
|
|
$ |
7,884 |
|
|
$ |
6,960 |
|
|
$ |
3,429 |
|
|
$ |
2,151 |
|
|
Ratio of net expenses to
average net assets |
|
|
1.17 |
% |
|
|
1.16 |
% |
|
|
1.17 |
% |
|
|
1.15 |
% |
|
|
1.21 |
% |
|
|
1.92 |
% |
|
|
1.91 |
% |
|
|
1.92 |
% |
|
|
1.90 |
% |
|
|
1.96 |
% |
|
Ratio of gross expenses to
average net assets prior
to expense reductions |
|
|
1.17 |
% |
|
|
1.16 |
% |
|
|
1.17 |
% |
|
|
1.20 |
% |
|
|
1.21 |
% |
|
|
1.92 |
% |
|
|
1.91 |
% |
|
|
1.92 |
% |
|
|
1.95 |
% |
|
|
1.96 |
% |
|
Ratio of net investment
income (loss) to average
net assets |
|
|
0.58 |
% |
|
|
0.42 |
% |
|
|
0.44 |
% |
|
|
0.84 |
% |
|
|
0.86 |
% |
|
|
(0.20 |
%) |
|
|
(0.31 |
%) |
|
|
(0.30 |
%) |
|
|
0.08 |
% |
|
|
0.11 |
% |
|
|
|
|
Year Ended October 31, |
|
|
|
|
2023 |
|
2022 |
|
2021 |
|
2020 |
|
2019 |
|
|
Portfolio turnover rate |
|
|
19 |
% |
|
|
32 |
% |
|
|
39 |
% |
|
|
57 |
% |
|
|
82 |
% |
|
** Distribution for annual periods determined in accordance with federal income tax regulations.
(a) Net investment income (loss) allocated based on average shares method.
(b) Total return measures net investment income (loss) and capital gain or loss from portfolio investments assuming reinvestment of dividends and capital gains distributions. Total return is not annualized for periods that are less than a full year, does not reflect the effect of sales charge for Class A shares nor the contingent deferred sales charge for Class C shares and does not reflect the deduction of taxes that a shareholder would pay on fund distributions or the redemption of fund shares.
PROSPECTUS | March 1, 2024
179
Calamos Hedged Equity Fund
|
|
|
CLASS I |
|
|
|
|
Year Ended October 31, |
|
|
|
|
2023 |
|
2022 |
|
2021 |
|
2020 |
|
2019 |
|
Net asset value, beginning
of year |
|
$ |
13.09 |
|
|
$ |
14.66 |
|
|
$ |
12.34 |
|
|
$ |
11.87 |
|
|
$ |
11.45 |
|
|
Income from investment
operations: |
|
Net investment income
(loss)(a) |
|
|
0.11 |
|
|
|
0.10 |
|
|
|
0.10 |
|
|
|
0.13 |
|
|
|
0.13 |
|
|
Net realized and
unrealized gain (loss) |
|
|
0.99 |
|
|
|
(1.61 |
) |
|
|
2.31 |
|
|
|
0.47 |
|
|
|
0.64 |
|
|
Total from investment
operations |
|
|
1.10 |
|
|
|
(1.51 |
) |
|
|
2.41 |
|
|
|
0.60 |
|
|
|
0.77 |
|
|
|
Distributions: |
|
Dividends from net
investment income |
|
|
(0.12 |
) |
|
|
(0.06 |
) |
|
|
(0.09 |
) |
|
|
(0.13 |
) |
|
|
(0.10 |
) |
|
Dividends from net
realized gains |
|
|
— |
|
|
|
— |
|
|
|
— |
|
|
|
— |
|
|
|
(0.25 |
) |
|
|
Total distributions** |
|
|
(0.12 |
) |
|
|
(0.06 |
) |
|
|
(0.09 |
) |
|
|
(0.13 |
) |
|
|
(0.35 |
) |
|
|
Net asset value, end of year |
|
$ |
14.07 |
|
|
$ |
13.09 |
|
|
$ |
14.66 |
|
|
$ |
12.34 |
|
|
$ |
11.87 |
|
|
Ratios and supplemental
data: |
|
|
Total return(b) |
|
|
8.41 |
% |
|
|
(10.33 |
%) |
|
|
19.60 |
% |
|
|
5.09 |
% |
|
|
7.01 |
% |
|
Net assets, end of
year (000) |
|
$ |
527,423 |
|
|
$ |
547,166 |
|
|
$ |
514,903 |
|
|
$ |
342,851 |
|
|
$ |
224,234 |
|
|
Ratio of net expenses to
average net assets |
|
|
0.92 |
% |
|
|
0.91 |
% |
|
|
0.92 |
% |
|
|
0.90 |
% |
|
|
0.96 |
% |
|
Ratio of gross expenses to
average net assets prior
to expense reductions |
|
|
0.92 |
% |
|
|
0.91 |
% |
|
|
0.92 |
% |
|
|
0.95 |
% |
|
|
0.96 |
% |
|
Ratio of net investment
income (loss) to average
net assets |
|
|
0.81 |
% |
|
|
0.69 |
% |
|
|
0.73 |
% |
|
|
1.09 |
% |
|
|
1.12 |
% |
|
** Distribution for annual periods determined in accordance with federal income tax regulations.
(a) Net investment income (loss) allocated based on average shares method.
(b) Total return measures net investment income (loss) and capital gain or loss from portfolio investments assuming reinvestment of dividends and capital gains distributions. Total return is not annualized for periods that are less than a full year, does not reflect the effect of sales charge for Class A shares nor the contingent deferred sales charge for Class C shares and does not reflect the deduction of taxes that a shareholder would pay on fund distributions or the redemption of fund shares.
CALAMOS FAMILY OF FUNDS
180
Calamos Phineus Long/Short Fund
FINANCIAL HIGHLIGHTS
Selected data for a share outstanding throughout each year were as follows:
|
|
|
CLASS A |
|
CLASS C |
|
|
|
|
Year Ended October 31, |
|
Year Ended October 31, |
|
|
|
|
2023 |
|
2022 |
|
2021 |
|
2020 |
|
2019 |
|
2023 |
|
2022 |
|
2021 |
|
2020 |
|
2019 |
|
Net asset value, beginning
of year |
|
$ |
14.60 |
|
|
$ |
15.46 |
|
|
$ |
11.18 |
|
|
$ |
11.63 |
|
|
$ |
12.15 |
|
|
$ |
13.90 |
|
|
$ |
14.83 |
|
|
$ |
10.80 |
|
|
$ |
11.32 |
|
|
$ |
11.92 |
|
|
Income from investment
operations: |
|
Net investment income
(loss)(a) |
|
|
0.19 |
|
|
|
(0.06 |
) |
|
|
(0.13 |
) |
|
|
(0.08 |
) |
|
|
0.04 |
|
|
|
0.07 |
|
|
|
(0.17 |
) |
|
|
(0.24 |
) |
|
|
(0.16 |
) |
|
|
(0.05 |
) |
|
Net realized and
unrealized gain (loss) |
|
|
0.14 |
|
|
|
(0.80 |
) |
|
|
4.41 |
|
|
|
(0.36 |
) |
|
|
(0.12 |
) |
|
|
0.14 |
|
|
|
(0.76 |
) |
|
|
4.27 |
|
|
|
(0.36 |
) |
|
|
(0.11 |
) |
|
Total from investment
operations |
|
|
0.33 |
|
|
|
(0.86 |
) |
|
|
4.28 |
|
|
|
(0.44 |
) |
|
|
(0.08 |
) |
|
|
0.21 |
|
|
|
(0.93 |
) |
|
|
4.03 |
|
|
|
(0.52 |
) |
|
|
(0.16 |
) |
|
|
Distributions: |
|
Dividends from net
investment income |
|
|
— |
|
|
|
— |
|
|
|
— |
|
|
|
(0.01 |
) |
|
|
— |
|
|
|
— |
|
|
|
— |
|
|
|
— |
|
|
|
— |
|
|
|
— |
|
|
Dividends from net
realized gains |
|
|
— |
|
|
|
— |
|
|
|
— |
|
|
|
— |
|
|
|
(0.44 |
) |
|
|
— |
|
|
|
— |
|
|
|
— |
|
|
|
— |
|
|
|
(0.44 |
) |
|
|
Return of capital |
|
|
— |
|
|
|
— |
|
|
|
— |
|
|
|
(0.00 |
)* |
|
|
— |
|
|
|
— |
|
|
|
— |
|
|
|
— |
|
|
|
(0.00 |
)* |
|
|
— |
|
|
|
Total distributions** |
|
|
— |
|
|
|
— |
|
|
|
— |
|
|
|
(0.01 |
) |
|
|
(0.44 |
) |
|
|
— |
|
|
|
— |
|
|
|
— |
|
|
|
(0.00 |
)* |
|
|
(0.44 |
) |
|
|
Net asset value, end of year |
|
$ |
14.93 |
|
|
$ |
14.60 |
|
|
$ |
15.46 |
|
|
$ |
11.18 |
|
|
$ |
11.63 |
|
|
$ |
14.11 |
|
|
$ |
13.90 |
|
|
$ |
14.83 |
|
|
$ |
10.80 |
|
|
$ |
11.32 |
|
|
Ratios and supplemental
data: |
|
|
Total return(b) |
|
|
2.12 |
% |
|
|
(5.44 |
%) |
|
|
38.19 |
% |
|
|
(3.77 |
%) |
|
|
(0.45 |
%) |
|
|
1.37 |
% |
|
|
(6.20 |
%) |
|
|
37.31 |
% |
|
|
(4.59 |
%) |
|
|
(1.15 |
%) |
|
Net assets, end of
year (000) |
|
$ |
65,214 |
|
|
$ |
55,800 |
|
|
$ |
51,971 |
|
|
$ |
40,748 |
|
|
$ |
76,689 |
|
|
$ |
32,461 |
|
|
$ |
31,352 |
|
|
$ |
29,980 |
|
|
$ |
22,528 |
|
|
$ |
38,072 |
|
|
Ratio of net expenses to
average net assets |
|
|
2.38 |
%(c) |
|
|
2.38 |
%(d) |
|
|
2.34 |
%(e) |
|
|
2.91 |
%(f) |
|
|
2.95 |
%(g) |
|
|
3.13 |
%(c) |
|
|
3.12 |
%(d) |
|
|
3.09 |
%(e) |
|
|
3.65 |
%(f) |
|
|
3.69 |
%(g) |
|
Ratio of gross expenses to
average net assets prior
to expense reductions |
|
|
2.38 |
% |
|
|
2.38 |
% |
|
|
2.34 |
% |
|
|
2.92 |
% |
|
|
2.96 |
% |
|
|
3.13 |
% |
|
|
3.12 |
% |
|
|
3.09 |
% |
|
|
3.65 |
% |
|
|
3.70 |
% |
|
Ratio of net investment
income (loss) to average
net assets |
|
|
1.21 |
% |
|
|
(0.43 |
%) |
|
|
(0.88 |
%) |
|
|
(0.68 |
%) |
|
|
0.33 |
% |
|
|
0.46 |
% |
|
|
(1.19 |
%) |
|
|
(1.63 |
%) |
|
|
(1.43 |
%) |
|
|
(0.42 |
%) |
|
|
|
|
Year Ended October 31, |
|
|
|
|
2023 |
|
2022 |
|
2021 |
|
2020 |
|
2019 |
|
|
Portfolio turnover rate |
|
|
194 |
% |
|
|
214 |
% |
|
|
211 |
% |
|
|
206 |
% |
|
|
135 |
% |
|
* Amounts are less than $0.005.
** Distribution for annual periods determined in accordance with federal income tax regulations.
(a) Net investment income (loss) allocated based on average shares method.
(b) Total return measures net investment income (loss) and capital gain or loss from portfolio investments assuming reinvestment of dividends and capital gains distributions. Total return is not annualized for periods that are less than a full year, does not reflect the effect of sales charge for Class A shares nor the contingent deferred sales charge for Class C shares and does not reflect the deduction of taxes that a shareholder would pay on fund distributions or the redemption of fund shares.
(c) Ratio of net expenses, excluding dividend expense on short positions, to average net assets was 1.64% and 2.39% for the year ended October 31, 2023.
(d) Ratio of net expenses, excluding dividend expense on short positions, to average net assets was 1.64% and 2.39% for the year ended October 31, 2022.
(e) Ratio of net expenses, excluding dividend expense on short positions, to average net assets was 1.67% and 2.42% for the year ended October 31, 2021.
(f) Ratio of net expenses, excluding dividend expense on short positions, to average net assets was 1.71% and 2.46% for the year ended October 31, 2020.
(g) Ratio of net expenses, excluding dividend expense on short positions, to average net assets was 1.64% and 2.39% for the year ended October 31, 2019.
PROSPECTUS | March 1, 2024
181
Calamos Phineus Long/Short Fund
|
|
|
CLASS I |
|
|
|
|
Year Ended October 31, |
|
|
|
|
2023 |
|
2022 |
|
2021 |
|
2020 |
|
2019 |
|
Net asset value, beginning
of year |
|
$ |
14.81 |
|
|
$ |
15.64 |
|
|
$ |
11.28 |
|
|
$ |
11.75 |
|
|
$ |
12.23 |
|
|
Income from investment
operations: |
|
Net investment income
(loss)(a) |
|
|
0.23 |
|
|
|
(0.02 |
) |
|
|
(0.10 |
) |
|
|
(0.05 |
) |
|
|
0.07 |
|
|
Net realized and
unrealized gain (loss) |
|
|
0.13 |
|
|
|
(0.81 |
) |
|
|
4.46 |
|
|
|
(0.37 |
) |
|
|
(0.11 |
) |
|
Total from investment
operations |
|
|
0.36 |
|
|
|
(0.83 |
) |
|
|
4.36 |
|
|
|
(0.42 |
) |
|
|
(0.04 |
) |
|
|
Distributions: |
|
Dividends from net
investment income |
|
|
(0.00 |
)* |
|
|
— |
|
|
|
— |
|
|
|
(0.02 |
) |
|
|
— |
|
|
Dividends from net
realized gains |
|
|
— |
|
|
|
— |
|
|
|
— |
|
|
|
— |
|
|
|
(0.44 |
) |
|
|
Return of capital |
|
|
— |
|
|
|
— |
|
|
|
— |
|
|
|
(0.03 |
) |
|
|
— |
|
|
|
Total distributions** |
|
|
(0.00 |
)* |
|
|
— |
|
|
|
— |
|
|
|
(0.05 |
) |
|
|
(0.44 |
) |
|
|
Net asset value, end of year |
|
$ |
15.17 |
|
|
$ |
14.81 |
|
|
$ |
15.64 |
|
|
$ |
11.28 |
|
|
$ |
11.75 |
|
|
Ratios and supplemental
data: |
|
|
Total return(b) |
|
|
2.40 |
% |
|
|
(5.25 |
%) |
|
|
38.69 |
% |
|
|
(3.67 |
%) |
|
|
(0.16 |
%) |
|
Net assets, end of
year (000) |
|
$ |
838,221 |
|
|
$ |
697,472 |
|
|
$ |
476,965 |
|
|
$ |
344,843 |
|
|
$ |
678,157 |
|
|
Ratio of net expenses to
average net assets |
|
|
2.13 |
%(c) |
|
|
2.14 |
%(d) |
|
|
2.09 |
%(e) |
|
|
2.64 |
%(f) |
|
|
2.68 |
%(g) |
|
Ratio of gross expenses to
average net assets prior
to expense reductions |
|
|
2.13 |
% |
|
|
2.14 |
% |
|
|
2.09 |
% |
|
|
2.65 |
% |
|
|
2.69 |
% |
|
Ratio of net investment
income (loss) to average
net assets |
|
|
1.48 |
% |
|
|
(0.12 |
%) |
|
|
(0.63 |
%) |
|
|
(0.42 |
%) |
|
|
0.57 |
% |
|
* Amounts are less than $0.005.
** Distribution for annual periods determined in accordance with federal income tax regulations.
(a) Net investment income (loss) allocated based on average shares method.
(b) Total return measures net investment income (loss) and capital gain or loss from portfolio investments assuming reinvestment of dividends and capital gains distributions. Total return is not annualized for periods that are less than a full year, does not reflect the effect of sales charge for Class A shares nor the contingent deferred sales charge for Class C shares and does not reflect the deduction of taxes that a shareholder would pay on fund distributions or the redemption of fund shares.
(c) Ratio of net expenses, excluding dividend expense on short positions, to average net assets was 1.39% for the year ended October 31, 2023.
(d) Ratio of net expenses, excluding dividend expense on short positions, to average net assets was 1.38% for the year ended October 31, 2022.
(e) Ratio of net expenses, excluding dividend expense on short positions, to average net assets was 1.42% for the year ended October 31, 2021.
(f) Ratio of net expenses, excluding dividend expense on short positions, to average net assets was 1.46% for the year ended October 31, 2020.
(g) Ratio of net expenses, excluding dividend expense on short positions, to average net assets was 1.39% for the year ended October 31, 2019.
CALAMOS FAMILY OF FUNDS
182
Calamos Merger Arbitrage Fund
FINANCIAL HIGHLIGHTS
Selected data for a share outstanding throughout each year were as follows:
|
|
|
CLASS A |
|
CLASS C |
|
|
|
|
September 29,
2023•
through
October 31, |
|
September 29,
2023•
through
October 31, |
|
|
|
|
2023 |
|
2023 |
|
Net asset value, beginning
of year |
|
$ |
10.00 |
|
|
$ |
10.00 |
|
|
Income from investment
operations: |
|
Net investment income
(loss)(a) |
|
|
0.00 |
|
|
|
0.00 |
|
|
Net realized and
unrealized gain (loss) |
|
|
(0.27 |
) |
|
|
(0.28 |
) |
|
Total from investment
operations |
|
|
(0.27 |
) |
|
|
(0.28 |
) |
|
|
Distributions: |
|
Dividends from net
investment income |
|
|
— |
|
|
|
— |
|
|
Dividends from net
realized gains |
|
|
— |
|
|
|
— |
|
|
|
Total distributions** |
|
|
— |
|
|
|
— |
|
|
|
Net asset value, end of year |
|
$ |
9.73 |
|
|
$ |
9.72 |
|
|
Ratios and supplemental
data: |
|
|
Total return(b) |
|
|
(2.70 |
%) |
|
|
(2.80 |
%) |
|
Net assets, end of
year (000) |
|
$ |
97 |
|
|
$ |
97 |
|
|
Ratio of net expenses to
average net assets |
|
|
1.50 |
%(c) |
|
|
2.25 |
%(c) |
|
Ratio of gross expenses to
average net assets prior
to expense reductions |
|
|
6.06 |
%(c) |
|
|
6.81 |
%(c) |
|
Ratio of net investment
income (loss) to average
net assets |
|
|
0.52 |
%(c) |
|
|
(0.23 |
%)(c) |
|
|
|
|
September 29,
2023•
through
October 31, |
|
|
|
|
2023 |
|
|
Portfolio turnover rate |
|
|
13 |
%(d) |
|
• Commencement of operations.
** Distribution for annual periods determined in accordance with federal income tax regulations.
(a) Net investment income (loss) allocated based on average shares method.
(b) Total return measures net investment income (loss) and capital gain or loss from portfolio investments assuming reinvestment of dividends and capital gains distributions. Total return is not annualized for periods that are less than a full year, does not reflect the effect of sales charge for Class A shares nor the contingent deferred sales charge for Class C shares and does not reflect the deduction of taxes that a shareholder would pay on fund distributions or the redemption of fund shares.
(c) Annualized.
(d) Not annualized.
PROSPECTUS | March 1, 2024
183
Calamos Merger Arbitrage Fund
|
|
|
CLASS I |
|
|
|
|
September 29,
2023•
through
October 31, |
|
|
|
|
2023 |
|
Net asset value, beginning
of year |
|
$ |
10.00 |
|
|
Income from investment
operations: |
|
Net investment income
(loss)(a) |
|
|
0.01 |
|
|
Net realized and
unrealized gain (loss) |
|
|
(0.28 |
) |
|
Total from investment
operations |
|
|
(0.27 |
) |
|
|
Distributions: |
|
Dividends from net
investment income |
|
|
— |
|
|
Dividends from net
realized gains |
|
|
— |
|
|
|
Total distributions** |
|
|
— |
|
|
|
Net asset value, end of year |
|
$ |
9.73 |
|
|
Ratios and supplemental
data: |
|
|
Total return(b) |
|
|
(2.70 |
%) |
|
Net assets, end of
year (000) |
|
$ |
1,864 |
|
|
Ratio of net expenses to
average net assets |
|
|
1.25 |
%(c) |
|
Ratio of gross expenses to
average net assets prior
to expense reductions |
|
|
5.81 |
%(c) |
|
Ratio of net investment
income (loss) to average
net assets |
|
|
1.13 |
%(c) |
|
• Commencement of operations.
** Distribution for annual periods determined in accordance with federal income tax regulations.
(a) Net investment income (loss) allocated based on average shares method.
(b) Total return measures net investment income (loss) and capital gain or loss from portfolio investments assuming reinvestment of dividends and capital gains distributions. Total return is not annualized for periods that are less than a full year, does not reflect the effect of sales charge for Class A shares nor the contingent deferred sales charge for Class C shares and does not reflect the deduction of taxes that a shareholder would pay on fund distributions or the redemption of fund shares.
(c) Annualized.
CALAMOS FAMILY OF FUNDS
184
FINANCIAL HIGHLIGHTS
Selected data for a share outstanding throughout each year were as follows:
|
|
|
CLASS A |
|
CLASS C |
|
|
|
|
Year Ended October 31, |
|
Year Ended October 31, |
|
|
|
|
2023 |
|
2022 |
|
2021 |
|
2020 |
|
2019 |
|
2023 |
|
2022 |
|
2021 |
|
2020 |
|
2019 |
|
Net asset value, beginning
of year |
|
$ |
18.57 |
|
|
$ |
27.25 |
|
|
$ |
22.78 |
|
|
$ |
17.45 |
|
|
$ |
18.11 |
|
|
$ |
18.03 |
|
|
$ |
26.73 |
|
|
$ |
22.48 |
|
|
$ |
17.27 |
|
|
$ |
17.92 |
|
|
Income from investment
operations: |
|
Net investment income
(loss)(a) |
|
|
(0.08 |
) |
|
|
(0.27 |
) |
|
|
(0.61 |
) |
|
|
0.47 |
|
|
|
0.51 |
|
|
|
(0.22 |
) |
|
|
(0.42 |
) |
|
|
(0.80 |
) |
|
|
0.32 |
|
|
|
0.39 |
|
|
Net realized and
unrealized gain (loss) |
|
|
(0.15 |
) |
|
|
(5.20 |
) |
|
|
6.68 |
|
|
|
4.99 |
|
|
|
1.00 |
|
|
|
(0.13 |
) |
|
|
(5.09 |
) |
|
|
6.59 |
|
|
|
4.93 |
|
|
|
0.99 |
|
|
Total from investment
operations |
|
|
(0.23 |
) |
|
|
(5.47 |
) |
|
|
6.07 |
|
|
|
5.46 |
|
|
|
1.51 |
|
|
|
(0.35 |
) |
|
|
(5.51 |
) |
|
|
5.79 |
|
|
|
5.25 |
|
|
|
1.38 |
|
|
|
Distributions: |
|
Dividends from net
investment income |
|
|
(0.16 |
) |
|
|
(0.02 |
) |
|
|
(0.06 |
) |
|
|
(0.13 |
) |
|
|
(0.35 |
) |
|
|
(0.06 |
) |
|
|
— |
|
|
|
— |
|
|
|
(0.04 |
) |
|
|
(0.21 |
) |
|
Dividends from net
realized gains |
|
|
— |
|
|
|
(3.19 |
) |
|
|
(1.54 |
) |
|
|
— |
|
|
|
(1.82 |
) |
|
|
— |
|
|
|
(3.19 |
) |
|
|
(1.54 |
) |
|
|
— |
|
|
|
(1.82 |
) |
|
|
Total distributions** |
|
|
(0.16 |
) |
|
|
(3.21 |
) |
|
|
(1.60 |
) |
|
|
(0.13 |
) |
|
|
(2.17 |
) |
|
|
(0.06 |
) |
|
|
(3.19 |
) |
|
|
(1.54 |
) |
|
|
(0.04 |
) |
|
|
(2.03 |
) |
|
|
Net asset value, end of year |
|
$ |
18.18 |
|
|
$ |
18.57 |
|
|
$ |
27.25 |
|
|
$ |
22.78 |
|
|
$ |
17.45 |
|
|
$ |
17.62 |
|
|
$ |
18.03 |
|
|
$ |
26.73 |
|
|
$ |
22.48 |
|
|
$ |
17.27 |
|
|
Ratios and supplemental
data: |
|
|
Total return(b) |
|
|
(1.26 |
%) |
|
|
(22.29 |
%) |
|
|
27.09 |
% |
|
|
31.58 |
% |
|
|
10.02 |
% |
|
|
(2.01 |
%) |
|
|
(22.88 |
%) |
|
|
26.16 |
% |
|
|
30.53 |
% |
|
|
9.21 |
% |
|
Net assets, end of
year (000) |
|
$ |
243,516 |
|
|
$ |
294,233 |
|
|
$ |
422,476 |
|
|
$ |
333,481 |
|
|
$ |
245,948 |
|
|
$ |
31,773 |
|
|
$ |
41,804 |
|
|
$ |
71,925 |
|
|
$ |
56,935 |
|
|
$ |
56,070 |
|
|
Ratio of net expenses to
average net assets |
|
|
1.13 |
% |
|
|
1.10 |
% |
|
|
1.08 |
% |
|
|
1.13 |
% |
|
|
1.16 |
% |
|
|
1.88 |
% |
|
|
1.85 |
% |
|
|
1.83 |
% |
|
|
1.88 |
% |
|
|
1.91 |
% |
|
Ratio of gross expenses to
average net assets prior
to expense reductions |
|
|
1.13 |
% |
|
|
1.10 |
% |
|
|
1.08 |
% |
|
|
1.13 |
% |
|
|
1.16 |
% |
|
|
1.88 |
% |
|
|
1.85 |
% |
|
|
1.83 |
% |
|
|
1.88 |
% |
|
|
1.91 |
% |
|
Ratio of net investment
income (loss) to average
net assets |
|
|
(0.44 |
%) |
|
|
(1.30 |
%) |
|
|
(2.35 |
%) |
|
|
2.37 |
% |
|
|
2.98 |
% |
|
|
(1.19 |
%) |
|
|
(2.04 |
%) |
|
|
(3.10 |
%) |
|
|
1.65 |
% |
|
|
2.34 |
% |
|
|
|
|
Year Ended October 31, |
|
|
|
|
2023 |
|
2022 |
|
2021 |
|
2020 |
|
2019 |
|
|
Portfolio turnover rate |
|
|
40 |
% |
|
|
39 |
% |
|
|
41 |
% |
|
|
71 |
% |
|
|
37 |
% |
|
** Distribution for annual periods determined in accordance with federal income tax regulations.
(a) Net investment income (loss) allocated based on average shares method.
(b) Total return measures net investment income (loss) and capital gain or loss from portfolio investments assuming reinvestment of dividends and capital gains distributions. Total return is not annualized for periods that are less than a full year, does not reflect the effect of sales charge for Class A shares nor the contingent deferred sales charge for Class C shares and does not reflect the deduction of taxes that a shareholder would pay on fund distributions or the redemption of fund shares.
PROSPECTUS | March 1, 2024
185
|
|
|
CLASS I |
|
|
|
|
Year Ended October 31, |
|
|
|
|
2023 |
|
2022 |
|
2021 |
|
2020 |
|
2019 |
|
Net asset value, beginning
of year |
|
$ |
15.91 |
|
|
$ |
23.82 |
|
|
$ |
20.05 |
|
|
$ |
15.38 |
|
|
$ |
16.23 |
|
|
Income from investment
operations: |
|
Net investment income
(loss)(a) |
|
|
(0.03 |
) |
|
|
(0.19 |
) |
|
|
(0.48 |
) |
|
|
0.46 |
|
|
|
0.49 |
|
|
Net realized and
unrealized gain (loss) |
|
|
(0.12 |
) |
|
|
(4.49 |
) |
|
|
5.86 |
|
|
|
4.39 |
|
|
|
0.88 |
|
|
Total from investment
operations |
|
|
(0.15 |
) |
|
|
(4.68 |
) |
|
|
5.38 |
|
|
|
4.85 |
|
|
|
1.37 |
|
|
|
Distributions: |
|
Dividends from net
investment income |
|
|
(0.21 |
) |
|
|
(0.04 |
) |
|
|
(0.07 |
) |
|
|
(0.18 |
) |
|
|
(0.40 |
) |
|
Dividends from net
realized gains |
|
|
— |
|
|
|
(3.19 |
) |
|
|
(1.54 |
) |
|
|
— |
|
|
|
(1.82 |
) |
|
|
Total distributions** |
|
|
(0.21 |
) |
|
|
(3.23 |
) |
|
|
(1.61 |
) |
|
|
(0.18 |
) |
|
|
(2.22 |
) |
|
|
Net asset value, end of year |
|
$ |
15.55 |
|
|
$ |
15.91 |
|
|
$ |
23.82 |
|
|
$ |
20.05 |
|
|
$ |
15.38 |
|
|
Ratios and supplemental
data: |
|
|
Total return(b) |
|
|
(1.04 |
%) |
|
|
(22.09 |
%) |
|
|
27.40 |
% |
|
|
31.91 |
% |
|
|
10.31 |
% |
|
Net assets, end of
year (000) |
|
$ |
559,907 |
|
|
$ |
680,441 |
|
|
$ |
1,161,030 |
|
|
$ |
773,460 |
|
|
$ |
442,907 |
|
|
Ratio of net expenses to
average net assets |
|
|
0.88 |
% |
|
|
0.85 |
% |
|
|
0.83 |
% |
|
|
0.88 |
% |
|
|
0.91 |
% |
|
Ratio of gross expenses to
average net assets prior
to expense reductions |
|
|
0.88 |
% |
|
|
0.85 |
% |
|
|
0.83 |
% |
|
|
0.88 |
% |
|
|
0.91 |
% |
|
Ratio of net investment
income (loss) to average
net assets |
|
|
(0.19 |
%) |
|
|
(1.04 |
%) |
|
|
(2.09 |
%) |
|
|
2.60 |
% |
|
|
3.21 |
% |
|
** Distribution for annual periods determined in accordance with federal income tax regulations.
(a) Net investment income (loss) allocated based on average shares method.
(b) Total return measures net investment income (loss) and capital gain or loss from portfolio investments assuming reinvestment of dividends and capital gains distributions. Total return is not annualized for periods that are less than a full year, does not reflect the effect of sales charge for Class A shares nor the contingent deferred sales charge for Class C shares and does not reflect the deduction of taxes that a shareholder would pay on fund distributions or the redemption of fund shares.
CALAMOS FAMILY OF FUNDS
186
Calamos Global Convertible Fund
FINANCIAL HIGHLIGHTS
Selected data for a share outstanding throughout each year were as follows:
|
|
|
CLASS A |
|
CLASS C |
|
|
|
|
Year Ended October 31, |
|
Year Ended October 31, |
|
|
|
|
2023 |
|
2022 |
|
2021 |
|
2020 |
|
2019 |
|
2023 |
|
2022 |
|
2021 |
|
2020 |
|
2019 |
|
Net asset value, beginning
of year |
|
$ |
9.59 |
|
|
$ |
14.85 |
|
|
$ |
13.48 |
|
|
$ |
11.08 |
|
|
$ |
10.81 |
|
|
$ |
9.23 |
|
|
$ |
14.47 |
|
|
$ |
13.25 |
|
|
$ |
10.93 |
|
|
$ |
10.69 |
|
|
Income from investment
operations: |
|
Net investment income
(loss)(a) |
|
|
(0.15 |
) |
|
|
(0.01 |
) |
|
|
(0.44 |
) |
|
|
0.24 |
|
|
|
0.10 |
|
|
|
(0.22 |
) |
|
|
(0.09 |
) |
|
|
(0.54 |
) |
|
|
0.14 |
|
|
|
0.02 |
|
|
Net realized and
unrealized gain (loss) |
|
|
0.60 |
|
|
|
(3.45 |
) |
|
|
2.95 |
|
|
|
2.37 |
|
|
|
0.70 |
|
|
|
0.59 |
|
|
|
(3.36 |
) |
|
|
2.89 |
|
|
|
2.35 |
|
|
|
0.69 |
|
|
Total from investment
operations |
|
|
0.45 |
|
|
|
(3.46 |
) |
|
|
2.51 |
|
|
|
2.61 |
|
|
|
0.80 |
|
|
|
0.37 |
|
|
|
(3.45 |
) |
|
|
2.35 |
|
|
|
2.49 |
|
|
|
0.71 |
|
|
|
Distributions: |
|
Dividends from net
investment income |
|
|
(0.03 |
) |
|
|
(0.01 |
) |
|
|
(0.01 |
) |
|
|
(0.06 |
) |
|
|
(0.22 |
) |
|
|
— |
|
|
|
— |
|
|
|
— |
|
|
|
(0.02 |
) |
|
|
(0.16 |
) |
|
Dividends from net
realized gains |
|
|
— |
|
|
|
(1.79 |
) |
|
|
(1.13 |
) |
|
|
(0.15 |
) |
|
|
(0.31 |
) |
|
|
— |
|
|
|
(1.79 |
) |
|
|
(1.13 |
) |
|
|
(0.15 |
) |
|
|
(0.31 |
) |
|
|
Total distributions** |
|
|
(0.03 |
) |
|
|
(1.80 |
) |
|
|
(1.14 |
) |
|
|
(0.21 |
) |
|
|
(0.53 |
) |
|
|
— |
|
|
|
(1.79 |
) |
|
|
(1.13 |
) |
|
|
(0.17 |
) |
|
|
(0.47 |
) |
|
|
Net asset value, end of year |
|
$ |
10.01 |
|
|
$ |
9.59 |
|
|
$ |
14.85 |
|
|
$ |
13.48 |
|
|
$ |
11.08 |
|
|
$ |
9.60 |
|
|
$ |
9.23 |
|
|
$ |
14.47 |
|
|
$ |
13.25 |
|
|
$ |
10.93 |
|
|
Ratios and supplemental
data: |
|
|
Total return(b) |
|
|
4.78 |
% |
|
|
(26.01 |
%) |
|
|
18.86 |
% |
|
|
23.93 |
% |
|
|
7.90 |
% |
|
|
4.01 |
% |
|
|
(26.58 |
%) |
|
|
17.95 |
% |
|
|
23.09 |
% |
|
|
7.01 |
% |
|
Net assets, end of
year (000) |
|
$ |
8,455 |
|
|
$ |
10,698 |
|
|
$ |
17,865 |
|
|
$ |
11,231 |
|
|
$ |
8,998 |
|
|
$ |
2,615 |
|
|
$ |
3,425 |
|
|
$ |
5,448 |
|
|
$ |
4,824 |
|
|
$ |
3,409 |
|
|
Ratio of net expenses to
average net assets |
|
|
1.34 |
% |
|
|
1.28 |
% |
|
|
1.25 |
% |
|
|
1.33 |
% |
|
|
1.32 |
% |
|
|
2.09 |
% |
|
|
2.03 |
% |
|
|
2.00 |
% |
|
|
2.08 |
% |
|
|
2.07 |
% |
|
Ratio of gross expenses to
average net assets prior
to expense reductions |
|
|
1.34 |
% |
|
|
1.28 |
% |
|
|
1.25 |
% |
|
|
1.34 |
% |
|
|
1.32 |
% |
|
|
2.09 |
% |
|
|
2.03 |
% |
|
|
2.00 |
% |
|
|
2.09 |
% |
|
|
2.07 |
% |
|
Ratio of net investment
income (loss) to average
net assets |
|
|
(1.48 |
%) |
|
|
(0.11 |
%) |
|
|
(2.96 |
%) |
|
|
1.96 |
% |
|
|
0.91 |
% |
|
|
(2.23 |
%) |
|
|
(0.85 |
%) |
|
|
(3.72 |
%) |
|
|
1.21 |
% |
|
|
0.16 |
% |
|
|
|
|
Year Ended October 31, |
|
|
|
|
2023 |
|
2022 |
|
2021 |
|
2020 |
|
2019 |
|
|
Portfolio turnover rate |
|
|
27 |
% |
|
|
31 |
% |
|
|
35 |
% |
|
|
48 |
% |
|
|
45 |
% |
|
** Distribution for annual periods determined in accordance with federal income tax regulations.
(a) Net investment income (loss) allocated based on average shares method.
(b) Total return measures net investment income (loss) and capital gain or loss from portfolio investments assuming reinvestment of dividends and capital gains distributions. Total return is not annualized for periods that are less than a full year, does not reflect the effect of sales charge for Class A shares nor the contingent deferred sales charge for Class C shares and does not reflect the deduction of taxes that a shareholder would pay on fund distributions or the redemption of fund shares.
PROSPECTUS | March 1, 2024
187
Calamos Global Convertible Fund
|
|
|
CLASS I |
|
|
|
|
Year Ended October 31, |
|
|
|
|
2023 |
|
2022 |
|
2021 |
|
2020 |
|
2019 |
|
Net asset value, beginning
of year |
|
$ |
9.60 |
|
|
$ |
14.87 |
|
|
$ |
13.50 |
|
|
$ |
11.08 |
|
|
$ |
10.82 |
|
|
Income from investment
operations: |
|
Net investment income
(loss)(a) |
|
|
(0.13 |
) |
|
|
0.01 |
|
|
|
(0.40 |
) |
|
|
0.26 |
|
|
|
0.12 |
|
|
Net realized and
unrealized gain (loss) |
|
|
0.61 |
|
|
|
(3.46 |
) |
|
|
2.94 |
|
|
|
2.39 |
|
|
|
0.70 |
|
|
Total from investment
operations |
|
|
0.48 |
|
|
|
(3.45 |
) |
|
|
2.54 |
|
|
|
2.65 |
|
|
|
0.82 |
|
|
|
Distributions: |
|
Dividends from net
investment income |
|
|
(0.04 |
) |
|
|
(0.03 |
) |
|
|
(0.04 |
) |
|
|
(0.08 |
) |
|
|
(0.25 |
) |
|
Dividends from net
realized gains |
|
|
— |
|
|
|
(1.79 |
) |
|
|
(1.13 |
) |
|
|
(0.15 |
) |
|
|
(0.31 |
) |
|
|
Total distributions** |
|
|
(0.04 |
) |
|
|
(1.82 |
) |
|
|
(1.17 |
) |
|
|
(0.23 |
) |
|
|
(0.56 |
) |
|
|
Net asset value, end of year |
|
$ |
10.04 |
|
|
$ |
9.60 |
|
|
$ |
14.87 |
|
|
$ |
13.50 |
|
|
$ |
11.08 |
|
|
Ratios and supplemental
data: |
|
|
Total return(b) |
|
|
5.00 |
% |
|
|
(25.82 |
%) |
|
|
19.09 |
% |
|
|
24.36 |
% |
|
|
8.09 |
% |
|
Net assets, end of
year (000) |
|
$ |
109,319 |
|
|
$ |
117,766 |
|
|
$ |
260,688 |
|
|
$ |
192,475 |
|
|
$ |
120,526 |
|
|
Ratio of net expenses to
average net assets |
|
|
1.09 |
% |
|
|
1.03 |
% |
|
|
1.00 |
% |
|
|
1.08 |
% |
|
|
1.07 |
% |
|
Ratio of gross expenses to
average net assets prior
to expense reductions |
|
|
1.09 |
% |
|
|
1.03 |
% |
|
|
1.00 |
% |
|
|
1.09 |
% |
|
|
1.07 |
% |
|
Ratio of net investment
income (loss) to average
net assets |
|
|
(1.23 |
%) |
|
|
0.13 |
% |
|
|
(2.71 |
%) |
|
|
2.19 |
% |
|
|
1.16 |
% |
|
** Distribution for annual periods determined in accordance with federal income tax regulations.
(a) Net investment income (loss) allocated based on average shares method.
(b) Total return measures net investment income (loss) and capital gain or loss from portfolio investments assuming reinvestment of dividends and capital gains distributions. Total return is not annualized for periods that are less than a full year, does not reflect the effect of sales charge for Class A shares nor the contingent deferred sales charge for Class C shares and does not reflect the deduction of taxes that a shareholder would pay on fund distributions or the redemption of fund shares.
CALAMOS FAMILY OF FUNDS
188
Calamos Timpani Small Cap Growth Fund
FINANCIAL HIGHLIGHTS
Selected data for a share outstanding throughout each year were as follows:
|
|
|
CLASS A* |
|
|
|
|
Year Ended October 31, |
|
May 31,
2019
through
October 31, |
|
July 1,
2018
through
May 31, |
|
Year Ended
June 30, |
|
|
|
|
2023 |
|
2022 |
|
2021 |
|
2020 |
|
2019 |
|
2019† |
|
2018 |
|
Net asset value, beginning
of year |
|
$ |
26.35 |
|
|
$ |
42.31 |
|
|
$ |
29.18 |
|
|
$ |
22.31 |
|
|
$ |
22.51 |
|
|
$ |
25.02 |
|
|
$ |
18.54 |
|
|
Income from investment
operations: |
|
Net investment income
(loss)(a) |
|
|
(0.26 |
) |
|
|
(0.24 |
) |
|
|
(0.45 |
) |
|
|
(0.28 |
) |
|
|
(0.11 |
) |
|
|
(0.29 |
) |
|
|
(0.28 |
) |
|
Net realized and
unrealized gain (loss) |
|
|
(3.89 |
) |
|
|
(15.72 |
) |
|
|
14.95 |
|
|
|
8.29 |
|
|
|
(0.09 |
) |
|
|
(0.80 |
) |
|
|
6.76 |
|
|
Total from investment
operations |
|
|
(4.15 |
) |
|
|
(15.96 |
) |
|
|
14.50 |
|
|
|
8.01 |
|
|
|
(0.20 |
) |
|
|
(1.09 |
) |
|
|
6.48 |
|
|
|
Distributions: |
|
Dividends from net
investment income |
|
|
— |
|
|
|
— |
|
|
|
— |
|
|
|
— |
|
|
|
— |
|
|
|
— |
|
|
|
— |
|
|
Dividends from net
realized gains |
|
|
— |
|
|
|
— |
|
|
|
(1.37 |
) |
|
|
(1.14 |
) |
|
|
— |
|
|
|
(1.42 |
) |
|
|
— |
|
|
|
Return of capital |
|
|
— |
|
|
|
— |
|
|
|
(0.00 |
)** |
|
|
— |
|
|
|
— |
|
|
|
— |
|
|
|
— |
|
|
|
Total distributions*** |
|
|
— |
|
|
|
— |
|
|
|
(1.37 |
) |
|
|
(1.14 |
) |
|
|
— |
|
|
|
(1.42 |
) |
|
|
— |
|
|
|
Net asset value, end of year |
|
$ |
22.20 |
|
|
$ |
26.35 |
|
|
$ |
42.31 |
|
|
$ |
29.18 |
|
|
$ |
22.31 |
|
|
$ |
22.51 |
|
|
$ |
25.02 |
|
|
Ratios and supplemental
data: |
|
|
Total return(b) |
|
|
(15.75 |
%) |
|
|
(37.71 |
%) |
|
|
50.42 |
% |
|
|
37.60 |
% |
|
|
(0.89 |
%) |
|
|
(3.52 |
%) |
|
|
34.95 |
% |
|
Net assets, end of
year (000) |
|
$ |
18,283 |
|
|
$ |
23,762 |
|
|
$ |
35,274 |
|
|
$ |
9,313 |
|
|
$ |
6,857 |
|
|
$ |
5,551 |
|
|
$ |
5,890 |
|
|
Ratio of net expenses to
average net assets |
|
|
1.30 |
% |
|
|
1.30 |
% |
|
|
1.30 |
% |
|
|
1.30 |
% |
|
|
1.30 |
%(c) |
|
|
1.50 |
%(c) |
|
|
1.50 |
% |
|
Ratio of gross expenses to
average net assets prior
to expense reductions |
|
|
1.37 |
% |
|
|
1.37 |
% |
|
|
1.37 |
% |
|
|
1.40 |
% |
|
|
1.35 |
%(c) |
|
|
1.71 |
%(c) |
|
|
1.74 |
% |
|
Ratio of net investment
income (loss) to average
net assets |
|
|
(1.03 |
%) |
|
|
(0.78 |
%) |
|
|
(1.15 |
%) |
|
|
(1.16 |
%) |
|
|
(1.18 |
%)(c) |
|
|
(1.31 |
%)(c) |
|
|
(1.33 |
%) |
|
|
|
|
Year Ended October 31, |
|
May 31,
2019
through
October 31, |
|
July 1,
2018
through
May 31, |
|
Year Ended
June 30, |
|
|
|
|
2023 |
|
2022 |
|
2021 |
|
2020 |
|
2019 |
|
2019† |
|
2018 |
|
|
Portfolio turnover rate |
|
|
215 |
% |
|
|
197 |
% |
|
|
165 |
% |
|
|
181 |
% |
|
|
142 |
% |
|
|
112 |
% |
|
|
126 |
% |
|
* Prior to May 31, 2019, Class A shares were Class Y shares of the predecessor fund.
† Pursuant to the Reorganization of the Predecessor Fund into the Fund, Class Y shareholders of the Predecessor Fund received Class A shares of the Fund, and Service Class and Institutional Class shareholders of the Predecessor Fund each received Class I shares of the Fund. As a result of the Reorganization, the Fund adopted the performance and financial history of the Predecessor Fund. Accordingly, the data shown for periods prior to May 31, 2019 is the data of the Predecessor Fund.
** Amounts are less than $0.005.
*** Distribution for annual periods determined in accordance with federal income tax regulations.
(a) Net investment income (loss) allocated based on average shares method.
(b) Total return measures net investment income (loss) and capital gain or loss from portfolio investments assuming reinvestment of dividends and capital gains distributions. Total return is not annualized for periods that are less than a full year, does not reflect the effect of sales charge for Class A shares and does not reflect the deduction of taxes that a shareholder would pay on fund distributions or the redemption of fund shares.
(c) Annualized.
PROSPECTUS | March 1, 2024
189
Calamos Timpani Small Cap Growth Fund
|
|
|
CLASS C |
|
|
|
|
Year Ended October 31, |
|
June 25,
2021•
through
October 31, |
|
|
|
|
2023 |
|
2022 |
|
2021 |
|
Net asset value, beginning
of year |
|
$ |
26.88 |
|
|
$ |
43.50 |
|
|
$ |
41.91 |
|
|
Income from investment
operations: |
|
Net investment income
(loss)(a) |
|
|
(0.45 |
) |
|
|
(0.45 |
) |
|
|
(0.82 |
) |
|
Net realized and
unrealized gain (loss) |
|
|
(3.95 |
) |
|
|
(16.17 |
) |
|
|
2.41 |
|
|
Total from investment
operations |
|
|
(4.40 |
) |
|
|
(16.62 |
) |
|
|
1.59 |
|
|
|
Distributions: |
|
Dividends from net
investment income |
|
|
— |
|
|
|
— |
|
|
|
— |
|
|
Dividends from net
realized gains |
|
|
— |
|
|
|
— |
|
|
|
— |
|
|
|
Total distributions** |
|
|
— |
|
|
|
— |
|
|
|
— |
|
|
|
Net asset value, end of year |
|
$ |
22.48 |
|
|
$ |
26.88 |
|
|
$ |
43.50 |
|
|
Ratios and supplemental
data:(b) |
|
|
Total return |
|
|
(16.37 |
%) |
|
|
(38.18 |
%) |
|
|
3.75 |
% |
|
Net assets, end of
year (000) |
|
$ |
3,648 |
|
|
$ |
4,425 |
|
|
$ |
3,165 |
|
|
Ratio of net expenses to
average net assets |
|
|
2.05 |
% |
|
|
2.05 |
% |
|
|
2.05 |
%(c) |
|
Ratio of gross expenses to
average net assets prior
to expense reductions |
|
|
2.12 |
% |
|
|
2.12 |
% |
|
|
2.06 |
%(c) |
|
Ratio of net investment
income (loss) to average
net assets |
|
|
(1.79 |
%) |
|
|
(1.50 |
%) |
|
|
(2.00 |
%)(c) |
|
• Commencement of operations.
** Distribution for annual periods determined in accordance with federal income tax regulations.
(a) Net investment income (loss) allocated based on average shares method.
(b) Total return measures net investment income (loss) and capital gain or loss from portfolio investments assuming reinvestment of dividends and capital gains distributions. Total return is not annualized for periods that are less than a full year, does not reflect the effect of sales charge for Class A shares nor the contingent deferred sales charge for Class C shares and does not reflect the deduction of taxes that a shareholder would pay on fund distributions or the redemption of fund shares.
(c) Annualized.
CALAMOS FAMILY OF FUNDS
190
Calamos Timpani Small Cap Growth Fund
|
|
|
CLASS I* |
|
|
|
|
Year Ended October 31, |
|
May 31,
2019
through
October 31, |
|
July 1,
2018
through
May 31, |
|
Year Ended
June 30, |
|
|
|
|
2023 |
|
2022 |
|
2021 |
|
2020 |
|
2019 |
|
2019† |
|
2018 |
|
Net asset value, beginning
of year |
|
$ |
27.24 |
|
|
$ |
43.65 |
|
|
$ |
29.99 |
|
|
$ |
22.85 |
|
|
$ |
23.02 |
|
|
$ |
25.47 |
|
|
$ |
18.80 |
|
|
Income from investment
operations: |
|
Net investment income
(loss)(a) |
|
|
(0.20 |
) |
|
|
(0.16 |
) |
|
|
(0.36 |
) |
|
|
(0.23 |
) |
|
|
(0.09 |
) |
|
|
(0.20 |
) |
|
|
(0.20 |
) |
|
Net realized and
unrealized gain (loss) |
|
|
(4.03 |
) |
|
|
(16.25 |
) |
|
|
15.39 |
|
|
|
8.51 |
|
|
|
(0.08 |
) |
|
|
(0.83 |
) |
|
|
6.87 |
|
|
Total from investment
operations |
|
|
(4.23 |
) |
|
|
(16.41 |
) |
|
|
15.03 |
|
|
|
8.28 |
|
|
|
(0.17 |
) |
|
|
(1.03 |
) |
|
|
6.67 |
|
|
|
Distributions: |
|
Dividends from net
investment income |
|
|
— |
|
|
|
— |
|
|
|
— |
|
|
|
— |
|
|
|
— |
|
|
|
— |
|
|
|
— |
|
|
Dividends from net
realized gains |
|
|
— |
|
|
|
— |
|
|
|
(1.37 |
) |
|
|
(1.14 |
) |
|
|
— |
|
|
|
(1.42 |
) |
|
|
— |
|
|
|
Return of capital |
|
|
— |
|
|
|
— |
|
|
|
(0.00 |
)** |
|
|
— |
|
|
|
— |
|
|
|
— |
|
|
|
— |
|
|
|
Total distributions*** |
|
|
— |
|
|
|
— |
|
|
|
(1.37 |
) |
|
|
(1.14 |
) |
|
|
— |
|
|
|
(1.42 |
) |
|
|
— |
|
|
|
Net asset value, end of year |
|
$ |
23.01 |
|
|
$ |
27.24 |
|
|
$ |
43.65 |
|
|
$ |
29.99 |
|
|
$ |
22.85 |
|
|
$ |
23.02 |
|
|
$ |
25.47 |
|
|
Ratios and supplemental
data: |
|
|
Total return(b) |
|
|
(15.53 |
%) |
|
|
(37.57 |
%) |
|
|
50.80 |
% |
|
|
37.90 |
% |
|
|
(0.74 |
%) |
|
|
(3.21 |
%) |
|
|
35.48 |
% |
|
Net assets, end of
year (000) |
|
$ |
191,831 |
|
|
$ |
292,187 |
|
|
$ |
387,149 |
|
|
$ |
124,867 |
|
|
$ |
72,539 |
|
|
$ |
68,510 |
|
|
$ |
69,095 |
|
|
Ratio of net expenses to
average net assets |
|
|
1.05 |
% |
|
|
1.05 |
% |
|
|
1.05 |
% |
|
|
1.05 |
% |
|
|
1.05 |
%(c) |
|
|
1.10 |
%(c) |
|
|
1.10 |
% |
|
Ratio of gross expenses to
average net assets prior
to expense reductions |
|
|
1.12 |
% |
|
|
1.12 |
% |
|
|
1.11 |
% |
|
|
1.16 |
% |
|
|
1.11 |
%(c) |
|
|
1.34 |
%(c) |
|
|
1.36 |
% |
|
Ratio of net investment
income (loss) to average
net assets |
|
|
(0.78 |
%) |
|
|
(0.52 |
%) |
|
|
(0.90 |
%) |
|
|
(0.92 |
%) |
|
|
(0.93 |
%)(c) |
|
|
(0.92 |
%)(c) |
|
|
(0.92 |
%) |
|
* Prior to May 31, 2019, Class I shares were Institutional Class shares or Service Class shares of the predecessor fund. Results shown are exclusive of the Service Class shares.
† Pursuant to the Reorganization of the Predecessor Fund into the Fund, Class Y shareholders of the Predecessor Fund received Class A shares of the Fund, and Service Class and Institutional Class shareholders of the Predecessor Fund each received Class I shares of the Fund. As a result of the Reorganization, the Fund adopted the performance and financial history of the Predecessor Fund. Accordingly, the data shown for periods prior to May 31, 2019 is the data of the Predecessor Fund.
** Amounts are less than $0.005.
*** Distribution for annual periods determined in accordance with federal income tax regulations.
(a) Net investment income (loss) allocated based on average shares method.
(b) Total return measures net investment income (loss) and capital gain or loss from portfolio investments assuming reinvestment of dividends and capital gains distributions. Total return is not annualized for periods that are less than a full year, does not reflect the effect of sales charge for Class A shares and does not reflect the deduction of taxes that a shareholder would pay on fund distributions or the redemption of fund shares.
(c) Annualized.
PROSPECTUS | March 1, 2024
191
Calamos Timpani Small Cap Growth Fund
|
|
|
CLASS R6 |
|
|
|
|
Year Ended October 31, |
|
May 31,
2019•
through
October 31, |
|
|
|
|
2023 |
|
2022 |
|
2021 |
|
2020 |
|
2019 |
|
Net asset value, beginning
of year |
|
$ |
27.33 |
|
|
$ |
43.74 |
|
|
$ |
30.02 |
|
|
$ |
22.86 |
|
|
$ |
23.02 |
|
|
Income from investment
operations: |
|
Net investment income
(loss)(a) |
|
|
(0.17 |
) |
|
|
(0.11 |
) |
|
|
(0.32 |
) |
|
|
(0.21 |
) |
|
|
(0.08 |
) |
|
Net realized and
unrealized gain (loss) |
|
|
(4.05 |
) |
|
|
(16.30 |
) |
|
|
15.41 |
|
|
|
8.51 |
|
|
|
(0.08 |
) |
|
Total from investment
operations |
|
|
(4.22 |
) |
|
|
(16.41 |
) |
|
|
15.09 |
|
|
|
8.30 |
|
|
|
(0.16 |
) |
|
|
Distributions: |
|
Dividends from net
investment income |
|
|
— |
|
|
|
— |
|
|
|
— |
|
|
|
— |
|
|
|
— |
|
|
Dividends from net
realized gains |
|
|
— |
|
|
|
— |
|
|
|
(1.37 |
) |
|
|
(1.14 |
) |
|
|
— |
|
|
|
Total distributions** |
|
|
— |
|
|
|
— |
|
|
|
(1.37 |
) |
|
|
(1.14 |
) |
|
|
— |
|
|
|
Net asset value, end of year |
|
$ |
23.11 |
|
|
$ |
27.33 |
|
|
$ |
43.74 |
|
|
$ |
30.02 |
|
|
$ |
22.86 |
|
|
Ratios and supplemental
data: |
|
|
Total return(b) |
|
|
(15.41 |
%) |
|
|
(37.51 |
%) |
|
|
50.96 |
% |
|
|
37.98 |
% |
|
|
(0.70 |
%) |
|
Net assets, end of
year (000) |
|
$ |
24,499 |
|
|
$ |
22,181 |
|
|
$ |
29,120 |
|
|
$ |
1,562 |
|
|
$ |
1,063 |
|
|
Ratio of net expenses to
average net assets |
|
|
0.92 |
% |
|
|
0.93 |
% |
|
|
0.96 |
% |
|
|
0.98 |
% |
|
|
1.00 |
%(c) |
|
Ratio of gross expenses to
average net assets prior
to expense reductions |
|
|
0.99 |
% |
|
|
1.00 |
% |
|
|
1.02 |
% |
|
|
1.09 |
% |
|
|
0.96 |
%(c) |
|
Ratio of net investment
income (loss) to average
net assets |
|
|
(0.67 |
%) |
|
|
(0.37 |
%) |
|
|
(0.80 |
%) |
|
|
(0.84 |
%) |
|
|
(0.84 |
%)(c) |
|
• Commencement of operations.
** Distribution for annual periods determined in accordance with federal income tax regulations.
(a) Net investment income (loss) allocated based on average shares method.
(b) Total return measures net investment income (loss) and capital gain or loss from portfolio investments assuming reinvestment of dividends and capital gains distributions. Total return is not annualized for periods that are less than a full year.
(c) Annualized.
CALAMOS FAMILY OF FUNDS
192
Calamos Timpani SMID Growth Fund
FINANCIAL HIGHLIGHTS
Selected data for a share outstanding throughout each year were as follows:
|
|
|
CLASS A |
|
|
|
|
Year Ended October 31, |
|
August 1,
2019•
through
October 31, |
|
|
|
|
2023 |
|
2022 |
|
2021 |
|
2020 |
|
2019 |
|
Net asset value, beginning
of year |
|
$ |
10.14 |
|
|
$ |
18.17 |
|
|
$ |
12.34 |
|
|
$ |
9.01 |
|
|
$ |
10.00 |
|
|
Income from investment
operations: |
|
Net investment income
(loss)(a) |
|
|
(0.10 |
) |
|
|
(0.08 |
) |
|
|
(0.20 |
) |
|
|
(0.13 |
) |
|
|
(0.03 |
) |
|
Net realized and
unrealized gain (loss) |
|
|
(0.95 |
) |
|
|
(6.23 |
) |
|
|
6.03 |
|
|
|
3.46 |
|
|
|
(0.96 |
) |
|
Total from investment
operations |
|
|
(1.05 |
) |
|
|
(6.31 |
) |
|
|
5.83 |
|
|
|
3.33 |
|
|
|
(0.99 |
) |
|
|
Distributions: |
|
Dividends from net
investment income |
|
|
— |
|
|
|
— |
|
|
|
— |
|
|
|
— |
|
|
|
— |
|
|
Dividends from net
realized gains |
|
|
— |
|
|
|
(1.72 |
) |
|
|
— |
|
|
|
— |
|
|
|
— |
|
|
|
Total distributions** |
|
|
— |
|
|
|
(1.72 |
) |
|
|
— |
|
|
|
— |
|
|
|
— |
|
|
|
Net asset value, end of year |
|
$ |
9.09 |
|
|
$ |
10.14 |
|
|
$ |
18.17 |
|
|
$ |
12.34 |
|
|
$ |
9.01 |
|
|
Ratios and supplemental
data: |
|
|
Total return(b) |
|
|
(10.36 |
%) |
|
|
(37.07 |
%) |
|
|
47.04 |
% |
|
|
36.96 |
% |
|
|
(9.90 |
%) |
|
Net assets, end of
year (000) |
|
$ |
341 |
|
|
$ |
305 |
|
|
$ |
162 |
|
|
$ |
182 |
|
|
$ |
9 |
|
|
Ratio of net expenses to
average net assets |
|
|
1.35 |
% |
|
|
1.35 |
% |
|
|
1.35 |
% |
|
|
1.35 |
% |
|
|
1.37 |
%(c) |
|
Ratio of gross expenses to
average net assets prior
to expense reductions |
|
|
1.98 |
% |
|
|
1.93 |
% |
|
|
1.79 |
% |
|
|
2.45 |
% |
|
|
3.42 |
%(c) |
|
Ratio of net investment
income (loss) to average
net assets |
|
|
(1.06 |
%) |
|
|
(0.68 |
%) |
|
|
(1.22 |
%) |
|
|
(1.21 |
%) |
|
|
(1.11 |
%)(c) |
|
|
|
|
Year Ended October 31, |
|
August 1,
2019•
through
October 31, |
|
|
|
|
2023 |
|
2022 |
|
2021 |
|
2020 |
|
2019 |
|
|
Portfolio turnover rate |
|
|
231 |
% |
|
|
205 |
% |
|
|
188 |
% |
|
|
201 |
% |
|
|
55 |
% |
|
• Commencement of operations.
** Distribution for annual periods determined in accordance with federal income tax regulations.
(a) Net investment income (loss) allocated based on average shares method.
(b) Total return measures net investment income (loss) and capital gain or loss from portfolio investments assuming reinvestment of dividends and capital gains distributions. Total return is not annualized for periods that are less than a full year, does not reflect the effect of sales charge for Class A shares.
(c) Annualized.
PROSPECTUS | March 1, 2024
193
Calamos Timpani SMID Growth Fund
|
|
|
CLASS I |
|
CLASS R6 |
|
|
|
|
Year Ended October 31, |
|
August 1,
2019•
through
October 31, |
|
Year Ended October 31, |
|
August 1,
2019•
through
October 31, |
|
|
|
|
2023 |
|
2022 |
|
2021 |
|
2020 |
|
2019 |
|
2023 |
|
2022 |
|
2021 |
|
2020 |
|
2019 |
|
Net asset value, beginning
of year |
|
$ |
10.23 |
|
|
$ |
18.28 |
|
|
$ |
12.38 |
|
|
$ |
9.02 |
|
|
$ |
10.00 |
|
|
$ |
10.23 |
|
|
$ |
18.28 |
|
|
$ |
12.38 |
|
|
$ |
9.02 |
|
|
$ |
10.00 |
|
|
Income from investment
operations: |
|
Net investment income
(loss)(a) |
|
|
(0.08 |
) |
|
|
(0.06 |
) |
|
|
(0.16 |
) |
|
|
(0.10 |
) |
|
|
(0.02 |
) |
|
|
(0.08 |
) |
|
|
(0.05 |
) |
|
|
(0.18 |
) |
|
|
(0.09 |
) |
|
|
(0.02 |
) |
|
Net realized and
unrealized gain (loss) |
|
|
(0.95 |
) |
|
|
(6.27 |
) |
|
|
6.06 |
|
|
|
3.46 |
|
|
|
(0.96 |
) |
|
|
(0.94 |
) |
|
|
(6.28 |
) |
|
|
6.08 |
|
|
|
3.45 |
|
|
|
(0.96 |
) |
|
Total from investment
operations |
|
|
(1.03 |
) |
|
|
(6.33 |
) |
|
|
5.90 |
|
|
|
3.36 |
|
|
|
(0.98 |
) |
|
|
(1.02 |
) |
|
|
(6.33 |
) |
|
|
5.90 |
|
|
|
3.36 |
|
|
|
(0.98 |
) |
|
|
Distributions: |
|
Dividends from net
investment income |
|
|
— |
|
|
|
— |
|
|
|
— |
|
|
|
— |
|
|
|
— |
|
|
|
— |
|
|
|
— |
|
|
|
— |
|
|
|
— |
|
|
|
— |
|
|
Dividends from net
realized gains |
|
|
— |
|
|
|
(1.72 |
) |
|
|
— |
|
|
|
— |
|
|
|
— |
|
|
|
— |
|
|
|
(1.72 |
) |
|
|
— |
|
|
|
— |
|
|
|
— |
|
|
|
Total distributions** |
|
|
— |
|
|
|
(1.72 |
) |
|
|
— |
|
|
|
— |
|
|
|
— |
|
|
|
— |
|
|
|
(1.72 |
) |
|
|
— |
|
|
|
— |
|
|
|
— |
|
|
|
Net asset value, end of year |
|
$ |
9.20 |
|
|
$ |
10.23 |
|
|
$ |
18.28 |
|
|
$ |
12.38 |
|
|
$ |
9.02 |
|
|
$ |
9.21 |
|
|
$ |
10.23 |
|
|
$ |
18.28 |
|
|
$ |
12.38 |
|
|
$ |
9.02 |
|
|
Ratios and supplemental
data: |
|
|
Total return(b) |
|
|
(10.07 |
%) |
|
|
(36.95 |
%) |
|
|
47.46 |
% |
|
|
37.25 |
% |
|
|
(9.80 |
%) |
|
|
(9.97 |
%) |
|
|
(36.95 |
%) |
|
|
47.46 |
% |
|
|
37.25 |
% |
|
|
(9.80 |
%) |
|
Net assets, end of
year (000) |
|
$ |
15,495 |
|
|
$ |
16,497 |
|
|
$ |
25,793 |
|
|
$ |
16,877 |
|
|
$ |
9,348 |
|
|
$ |
320 |
|
|
$ |
355 |
|
|
$ |
499 |
|
|
$ |
12 |
|
|
$ |
9 |
|
|
Ratio of net expenses to
average net assets |
|
|
1.10 |
% |
|
|
1.10 |
% |
|
|
1.10 |
% |
|
|
1.10 |
% |
|
|
1.10 |
%(c) |
|
|
1.07 |
% |
|
|
1.07 |
% |
|
|
1.08 |
% |
|
|
1.06 |
% |
|
|
1.07 |
%(c) |
|
Ratio of gross expenses to
average net assets prior
to expense reductions |
|
|
1.73 |
% |
|
|
1.65 |
% |
|
|
1.55 |
% |
|
|
2.25 |
% |
|
|
3.17 |
%(c) |
|
|
1.70 |
% |
|
|
1.63 |
% |
|
|
1.48 |
% |
|
|
2.25 |
% |
|
|
3.16 |
%(c) |
|
Ratio of net investment
income (loss) to average
net assets |
|
|
(0.80 |
%) |
|
|
(0.48 |
%) |
|
|
(0.98 |
%) |
|
|
(0.94 |
%) |
|
|
(0.85 |
%)(c) |
|
|
(0.77 |
%) |
|
|
(0.43 |
%) |
|
|
(1.04 |
%) |
|
|
(0.90 |
%) |
|
|
(0.81 |
%)(c) |
|
• Commencement of operations.
** Distribution for annual periods determined in accordance with federal income tax regulations.
(a) Net investment income (loss) allocated based on average shares method.
(b) Total return measures net investment income (loss) and capital gain or loss from portfolio investments assuming reinvestment of dividends and capital gains distributions. Total return is not annualized for periods that are less than a full year.
(c) Annualized.
CALAMOS FAMILY OF FUNDS
194
FINANCIAL HIGHLIGHTS
Selected data for a share outstanding throughout each year were as follows:
|
|
|
CLASS A |
|
CLASS C |
|
|
|
|
Year Ended October 31, |
|
Year Ended October 31, |
|
|
|
|
2023 |
|
2022 |
|
2021 |
|
2020 |
|
2019 |
|
2023 |
|
2022 |
|
2021 |
|
2020 |
|
2019 |
|
Net asset value, beginning
of year |
|
$ |
28.24 |
|
|
$ |
45.88 |
|
|
$ |
34.96 |
|
|
$ |
32.23 |
|
|
$ |
33.14 |
|
|
$ |
11.03 |
|
|
$ |
21.21 |
|
|
$ |
18.18 |
|
|
$ |
18.26 |
|
|
$ |
21.00 |
|
|
Income from investment
operations: |
|
Net investment income
(loss)(a) |
|
|
(0.13 |
) |
|
|
(0.22 |
) |
|
|
(0.33 |
) |
|
|
(0.14 |
) |
|
|
(0.04 |
) |
|
|
(0.14 |
) |
|
|
(0.19 |
) |
|
|
(0.29 |
) |
|
|
(0.20 |
) |
|
|
(0.13 |
) |
|
Net realized and
unrealized gain (loss) |
|
|
4.36 |
|
|
|
(12.47 |
) |
|
|
15.44 |
|
|
|
5.90 |
|
|
|
3.53 |
|
|
|
1.70 |
|
|
|
(5.04 |
) |
|
|
7.51 |
|
|
|
3.15 |
|
|
|
1.79 |
|
|
Total from investment
operations |
|
|
4.23 |
|
|
|
(12.69 |
) |
|
|
15.11 |
|
|
|
5.76 |
|
|
|
3.49 |
|
|
|
1.56 |
|
|
|
(5.23 |
) |
|
|
7.22 |
|
|
|
2.95 |
|
|
|
1.66 |
|
|
|
Distributions: |
|
Dividends from net
investment income |
|
|
— |
|
|
|
— |
|
|
|
— |
|
|
|
— |
|
|
|
— |
|
|
|
— |
|
|
|
— |
|
|
|
— |
|
|
|
— |
|
|
|
— |
|
|
Dividends from net
realized gains |
|
|
— |
|
|
|
(4.95 |
) |
|
|
(4.19 |
) |
|
|
(3.03 |
) |
|
|
(4.40 |
) |
|
|
— |
|
|
|
(4.95 |
) |
|
|
(4.19 |
) |
|
|
(3.03 |
) |
|
|
(4.40 |
) |
|
|
Total distributions** |
|
|
— |
|
|
|
(4.95 |
) |
|
|
(4.19 |
) |
|
|
(3.03 |
) |
|
|
(4.40 |
) |
|
|
— |
|
|
|
(4.95 |
) |
|
|
(4.19 |
) |
|
|
(3.03 |
) |
|
|
(4.40 |
) |
|
|
Net asset value, end of year |
|
$ |
32.47 |
|
|
$ |
28.24 |
|
|
$ |
45.88 |
|
|
$ |
34.96 |
|
|
$ |
32.23 |
|
|
$ |
12.59 |
|
|
$ |
11.03 |
|
|
$ |
21.21 |
|
|
$ |
18.18 |
|
|
$ |
18.26 |
|
|
Ratios and supplemental
data: |
|
|
Total return(b) |
|
|
14.98 |
% |
|
|
(30.58 |
%) |
|
|
46.00 |
% |
|
|
19.11 |
% |
|
|
13.97 |
% |
|
|
14.14 |
% |
|
|
(31.12 |
%) |
|
|
44.94 |
% |
|
|
18.23 |
% |
|
|
13.18 |
% |
|
Net assets, end of
year (000) |
|
$ |
925,437 |
|
|
$ |
900,167 |
|
|
$ |
1,436,709 |
|
|
$ |
1,093,909 |
|
|
$ |
1,066,939 |
|
|
$ |
9,493 |
|
|
$ |
12,281 |
|
|
$ |
25,965 |
|
|
$ |
35,843 |
|
|
$ |
50,442 |
|
|
Ratio of net expenses to
average net assets |
|
|
1.32 |
% |
|
|
1.30 |
% |
|
|
1.28 |
% |
|
|
1.34 |
% |
|
|
1.34 |
% |
|
|
2.08 |
% |
|
|
2.05 |
% |
|
|
2.04 |
% |
|
|
2.09 |
% |
|
|
2.11 |
% |
|
Ratio of gross expenses to
average net assets prior
to expense reductions |
|
|
1.32 |
% |
|
|
1.30 |
% |
|
|
1.28 |
% |
|
|
1.34 |
% |
|
|
1.34 |
% |
|
|
2.08 |
% |
|
|
2.05 |
% |
|
|
2.04 |
% |
|
|
2.10 |
% |
|
|
2.12 |
% |
|
Ratio of net investment
income (loss) to average
net assets |
|
|
(0.43 |
%) |
|
|
(0.64 |
%) |
|
|
(0.80 |
%) |
|
|
(0.45 |
%) |
|
|
(0.12 |
%) |
|
|
(1.16 |
%) |
|
|
(1.39 |
%) |
|
|
(1.53 |
%) |
|
|
(1.17 |
%) |
|
|
(0.73 |
%) |
|
|
|
|
Year Ended October 31, |
|
|
|
|
2023 |
|
2022 |
|
2021 |
|
2020 |
|
2019 |
|
|
Portfolio turnover rate |
|
|
57 |
% |
|
|
42 |
% |
|
|
45 |
% |
|
|
115 |
% |
|
|
69 |
% |
|
** Distribution for annual periods determined in accordance with federal income tax regulations.
(a) Net investment income (loss) allocated based on average shares method.
(b) Total return measures net investment income (loss) and capital gain or loss from portfolio investments assuming reinvestment of dividends and capital gains distributions. Total return is not annualized for periods that are less than a full year, does not reflect the effect of sales charge for Class A shares nor the contingent deferred sales charge for Class C shares and does not reflect the deduction of taxes that a shareholder would pay on fund distributions or the redemption of fund shares.
PROSPECTUS | March 1, 2024
195
|
|
|
CLASS I |
|
|
|
|
Year Ended October 31, |
|
|
|
|
2023 |
|
2022 |
|
2021 |
|
2020 |
|
2019 |
|
Net asset value, beginning
of year |
|
$ |
42.95 |
|
|
$ |
66.93 |
|
|
$ |
49.25 |
|
|
$ |
44.13 |
|
|
$ |
43.48 |
|
|
Income from investment
operations: |
|
Net investment income
(loss)(a) |
|
|
(0.09 |
) |
|
|
(0.20 |
) |
|
|
(0.33 |
) |
|
|
(0.09 |
) |
|
|
0.06 |
|
|
Net realized and
unrealized gain (loss) |
|
|
6.65 |
|
|
|
(18.83 |
) |
|
|
22.20 |
|
|
|
8.24 |
|
|
|
4.99 |
|
|
Total from investment
operations |
|
|
6.56 |
|
|
|
(19.03 |
) |
|
|
21.87 |
|
|
|
8.15 |
|
|
|
5.05 |
|
|
|
Distributions: |
|
Dividends from net
investment income |
|
|
— |
|
|
|
— |
|
|
|
— |
|
|
|
— |
|
|
|
— |
|
|
Dividends from net
realized gains |
|
|
— |
|
|
|
(4.95 |
) |
|
|
(4.19 |
) |
|
|
(3.03 |
) |
|
|
(4.40 |
) |
|
|
Total distributions** |
|
|
— |
|
|
|
(4.95 |
) |
|
|
(4.19 |
) |
|
|
(3.03 |
) |
|
|
(4.40 |
) |
|
|
Net asset value, end of year |
|
$ |
49.51 |
|
|
$ |
42.95 |
|
|
$ |
66.93 |
|
|
$ |
49.25 |
|
|
$ |
44.13 |
|
|
Ratios and supplemental
data: |
|
|
Total return(b) |
|
|
15.27 |
% |
|
|
(30.43 |
%) |
|
|
46.40 |
% |
|
|
19.39 |
% |
|
|
14.24 |
% |
|
Net assets, end of
year (000) |
|
$ |
262,752 |
|
|
$ |
246,566 |
|
|
$ |
395,431 |
|
|
$ |
291,027 |
|
|
$ |
280,294 |
|
|
Ratio of net expenses to
average net assets |
|
|
1.07 |
% |
|
|
1.05 |
% |
|
|
1.03 |
% |
|
|
1.09 |
% |
|
|
1.09 |
% |
|
Ratio of gross expenses to
average net assets prior
to expense reductions |
|
|
1.07 |
% |
|
|
1.05 |
% |
|
|
1.03 |
% |
|
|
1.09 |
% |
|
|
1.09 |
% |
|
Ratio of net investment
income (loss) to average
net assets |
|
|
(0.18 |
%) |
|
|
(0.39 |
%) |
|
|
(0.56 |
%) |
|
|
(0.20 |
%) |
|
|
0.15 |
% |
|
** Distribution for annual periods determined in accordance with federal income tax regulations.
(a) Net investment income (loss) allocated based on average shares method.
(b) Total return measures net investment income (loss) and capital gain or loss from portfolio investments assuming reinvestment of dividends and capital gains distributions. Total return is not annualized for periods that are less than a full year, does not reflect the effect of sales charge for Class A shares nor the contingent deferred sales charge for Class C shares and does not reflect the deduction of taxes that a shareholder would pay on fund distributions or the redemption of fund shares.
CALAMOS FAMILY OF FUNDS
196
Calamos Growth and Income Fund
FINANCIAL HIGHLIGHTS
Selected data for a share outstanding throughout each year were as follows:
|
|
|
CLASS A |
|
CLASS C |
|
|
|
|
Year Ended October 31, |
|
Year Ended October 31, |
|
|
|
|
2023 |
|
2022 |
|
2021 |
|
2020 |
|
2019 |
|
2023 |
|
2022 |
|
2021 |
|
2020 |
|
2019 |
|
Net asset value, beginning
of year |
|
$ |
38.33 |
|
|
$ |
48.18 |
|
|
$ |
36.26 |
|
|
$ |
33.43 |
|
|
$ |
32.53 |
|
|
$ |
38.57 |
|
|
$ |
48.55 |
|
|
$ |
36.57 |
|
|
$ |
33.68 |
|
|
$ |
32.69 |
|
|
Income from investment
operations: |
|
Net investment income
(loss)(a) |
|
|
0.19 |
|
|
|
0.08 |
|
|
|
0.07 |
|
|
|
0.30 |
|
|
|
0.32 |
|
|
|
(0.11 |
) |
|
|
(0.24 |
) |
|
|
(0.25 |
) |
|
|
0.04 |
|
|
|
0.12 |
|
|
Net realized and
unrealized gain (loss) |
|
|
2.38 |
|
|
|
(7.32 |
) |
|
|
13.01 |
|
|
|
3.74 |
|
|
|
2.99 |
|
|
|
2.38 |
|
|
|
(7.37 |
) |
|
|
13.12 |
|
|
|
3.79 |
|
|
|
2.98 |
|
|
Total from investment
operations |
|
|
2.57 |
|
|
|
(7.24 |
) |
|
|
13.08 |
|
|
|
4.04 |
|
|
|
3.31 |
|
|
|
2.27 |
|
|
|
(7.61 |
) |
|
|
12.87 |
|
|
|
3.83 |
|
|
|
3.10 |
|
|
|
Distributions: |
|
Dividends from net
investment income |
|
|
(0.44 |
) |
|
|
(0.24 |
) |
|
|
(0.27 |
) |
|
|
(0.41 |
) |
|
|
(0.50 |
) |
|
|
(0.23 |
) |
|
|
— |
|
|
|
— |
|
|
|
(0.14 |
) |
|
|
(0.20 |
) |
|
Dividends from net
realized gains |
|
|
(1.04 |
) |
|
|
(2.37 |
) |
|
|
(0.89 |
) |
|
|
(0.80 |
) |
|
|
(1.91 |
) |
|
|
(1.04 |
) |
|
|
(2.37 |
) |
|
|
(0.89 |
) |
|
|
(0.80 |
) |
|
|
(1.91 |
) |
|
|
Total distributions** |
|
|
(1.48 |
) |
|
|
(2.61 |
) |
|
|
(1.16 |
) |
|
|
(1.21 |
) |
|
|
(2.41 |
) |
|
|
(1.27 |
) |
|
|
(2.37 |
) |
|
|
(0.89 |
) |
|
|
(0.94 |
) |
|
|
(2.11 |
) |
|
|
Net asset value, end of year |
|
$ |
39.42 |
|
|
$ |
38.33 |
|
|
$ |
48.18 |
|
|
$ |
36.26 |
|
|
$ |
33.43 |
|
|
$ |
39.57 |
|
|
$ |
38.57 |
|
|
$ |
48.55 |
|
|
$ |
36.57 |
|
|
$ |
33.68 |
|
|
Ratios and supplemental
data: |
|
|
Total return(b) |
|
|
6.86 |
% |
|
|
(15.77 |
%) |
|
|
36.68 |
% |
|
|
12.43 |
% |
|
|
11.51 |
% |
|
|
6.08 |
% |
|
|
(16.41 |
%) |
|
|
35.66 |
% |
|
|
11.62 |
% |
|
|
10.68 |
% |
|
Net assets, end of
year (000) |
|
$ |
1,182,667 |
|
|
$ |
1,199,491 |
|
|
$ |
1,531,445 |
|
|
$ |
1,163,876 |
|
|
$ |
1,129,201 |
|
|
$ |
79,895 |
|
|
$ |
84,104 |
|
|
$ |
98,647 |
|
|
$ |
101,490 |
|
|
$ |
136,333 |
|
|
Ratio of net expenses to
average net assets |
|
|
1.06 |
% |
|
|
1.05 |
% |
|
|
1.06 |
% |
|
|
1.08 |
% |
|
|
1.09 |
% |
|
|
1.81 |
% |
|
|
1.80 |
% |
|
|
1.81 |
% |
|
|
1.84 |
% |
|
|
1.85 |
% |
|
Ratio of gross expenses to
average net assets prior
to expense reductions |
|
|
1.06 |
% |
|
|
1.05 |
% |
|
|
1.06 |
% |
|
|
1.08 |
% |
|
|
1.09 |
% |
|
|
1.81 |
% |
|
|
1.80 |
% |
|
|
1.81 |
% |
|
|
1.84 |
% |
|
|
1.85 |
% |
|
Ratio of net investment
income (loss) to average
net assets |
|
|
0.48 |
% |
|
|
0.19 |
% |
|
|
0.15 |
% |
|
|
0.86 |
% |
|
|
1.01 |
% |
|
|
(0.27 |
%) |
|
|
(0.56 |
%) |
|
|
(0.57 |
%) |
|
|
0.13 |
% |
|
|
0.37 |
% |
|
|
|
|
Year Ended October 31, |
|
|
|
|
2023 |
|
2022 |
|
2021 |
|
2020 |
|
2019 |
|
|
Portfolio turnover rate |
|
|
20 |
% |
|
|
24 |
% |
|
|
18 |
% |
|
|
35 |
% |
|
|
19 |
% |
|
** Distribution for annual periods determined in accordance with federal income tax regulations.
(a) Net investment income (loss) allocated based on average shares method.
(b) Total return measures net investment income (loss) and capital gain or loss from portfolio investments assuming reinvestment of dividends and capital gains distributions. Total return is not annualized for periods that are less than a full year, does not reflect the effect of sales charge for Class A shares nor the contingent deferred sales charge for Class C shares and does not reflect the deduction of taxes that a shareholder would pay on fund distributions or the redemption of fund shares.
PROSPECTUS | March 1, 2024
197
Calamos Growth and Income Fund
|
|
|
CLASS I |
|
|
|
|
Year Ended October 31, |
|
|
|
|
2023 |
|
2022 |
|
2021 |
|
2020 |
|
2019 |
|
Net asset value, beginning
of year |
|
$ |
36.50 |
|
|
$ |
46.02 |
|
|
$ |
34.68 |
|
|
$ |
32.03 |
|
|
$ |
31.28 |
|
|
Income from investment
operations: |
|
Net investment income
(loss)(a) |
|
|
0.27 |
|
|
|
0.17 |
|
|
|
0.17 |
|
|
|
0.36 |
|
|
|
0.39 |
|
|
Net realized and
unrealized gain (loss) |
|
|
2.25 |
|
|
|
(6.97 |
) |
|
|
12.44 |
|
|
|
3.58 |
|
|
|
2.85 |
|
|
Total from investment
operations |
|
|
2.52 |
|
|
|
(6.80 |
) |
|
|
12.61 |
|
|
|
3.94 |
|
|
|
3.24 |
|
|
|
Distributions: |
|
Dividends from net
investment income |
|
|
(0.51 |
) |
|
|
(0.35 |
) |
|
|
(0.38 |
) |
|
|
(0.49 |
) |
|
|
(0.58 |
) |
|
Dividends from net
realized gains |
|
|
(1.04 |
) |
|
|
(2.37 |
) |
|
|
(0.89 |
) |
|
|
(0.80 |
) |
|
|
(1.91 |
) |
|
|
Total distributions** |
|
|
(1.55 |
) |
|
|
(2.72 |
) |
|
|
(1.27 |
) |
|
|
(1.29 |
) |
|
|
(2.49 |
) |
|
|
Net asset value, end of year |
|
$ |
37.47 |
|
|
$ |
36.50 |
|
|
$ |
46.02 |
|
|
$ |
34.68 |
|
|
$ |
32.03 |
|
|
Ratios and supplemental
data: |
|
|
Total return(b) |
|
|
7.12 |
% |
|
|
(15.55 |
%) |
|
|
37.02 |
% |
|
|
12.72 |
% |
|
|
11.81 |
% |
|
Net assets, end of
year (000) |
|
$ |
978,583 |
|
|
$ |
977,765 |
|
|
$ |
1,211,985 |
|
|
$ |
818,641 |
|
|
$ |
735,329 |
|
|
Ratio of net expenses to
average net assets |
|
|
0.81 |
% |
|
|
0.80 |
% |
|
|
0.81 |
% |
|
|
0.83 |
% |
|
|
0.85 |
% |
|
Ratio of gross expenses to
average net assets prior
to expense reductions |
|
|
0.81 |
% |
|
|
0.80 |
% |
|
|
0.81 |
% |
|
|
0.83 |
% |
|
|
0.85 |
% |
|
Ratio of net investment
income (loss) to average
net assets |
|
|
0.73 |
% |
|
|
0.44 |
% |
|
|
0.40 |
% |
|
|
1.11 |
% |
|
|
1.27 |
% |
|
** Distribution for annual periods determined in accordance with federal income tax regulations.
(a) Net investment income (loss) allocated based on average shares method.
(b) Total return measures net investment income (loss) and capital gain or loss from portfolio investments assuming reinvestment of dividends and capital gains distributions. Total return is not annualized for periods that are less than a full year, does not reflect the effect of sales charge for Class A shares nor the contingent deferred sales charge for Class C shares and does not reflect the deduction of taxes that a shareholder would pay on fund distributions or the redemption of fund shares.
CALAMOS FAMILY OF FUNDS
198
Calamos Growth and Income Fund
Selected data for a share outstanding throughout each period were as follows:
|
|
|
CLASS R6 |
|
|
|
|
Year Ended October 31, |
|
June 23,
2020•
through
October 31, |
|
|
|
|
2023 |
|
2022 |
|
2021 |
|
2020 |
|
Net asset value, beginning
of period |
|
$ |
36.51 |
|
|
$ |
46.04 |
|
|
$ |
34.69 |
|
|
$ |
33.24 |
|
|
Income from investment
operations: |
|
Net investment income
(loss)(a) |
|
|
0.30 |
|
|
|
0.21 |
|
|
|
0.16 |
|
|
|
0.12 |
|
|
Net realized and
unrealized gain (loss) |
|
|
2.26 |
|
|
|
(6.99 |
) |
|
|
12.49 |
|
|
|
1.42 |
|
|
Total from investment
operations |
|
|
2.56 |
|
|
|
(6.78 |
) |
|
|
12.65 |
|
|
|
1.54 |
|
|
|
Distributions: |
|
Dividends from net
investment income |
|
|
(0.54 |
) |
|
|
(0.38 |
) |
|
|
(0.41 |
) |
|
|
(0.09 |
) |
|
Dividends from net
realized gains |
|
|
(1.04 |
) |
|
|
(2.37 |
) |
|
|
(0.89 |
) |
|
|
— |
|
|
|
Total distributions** |
|
|
(1.58 |
) |
|
|
(2.75 |
) |
|
|
(1.30 |
) |
|
|
(0.09 |
) |
|
|
Net asset value, end of period |
|
$ |
37.49 |
|
|
$ |
36.51 |
|
|
$ |
46.04 |
|
|
$ |
34.69 |
|
|
Ratios and supplemental
data: |
|
|
Total return(b) |
|
|
7.21 |
% |
|
|
(15.50 |
%) |
|
|
37.14 |
% |
|
|
4.63 |
% |
|
Net assets, end of
year (000) |
|
$ |
27,965 |
|
|
$ |
16,688 |
|
|
$ |
5,968 |
|
|
$ |
15 |
|
|
Ratio of net expenses to
average net assets |
|
|
0.71 |
% |
|
|
0.73 |
% |
|
|
0.73 |
% |
|
|
0.71 |
%(c) |
|
Ratio of gross expenses to
average net assets prior
to expense reductions |
|
|
0.71 |
% |
|
|
0.73 |
% |
|
|
0.73 |
% |
|
|
0.71 |
%(c) |
|
Ratio of net investment
income (loss) to average
net assets |
|
|
0.78 |
% |
|
|
0.55 |
% |
|
|
0.38 |
% |
|
|
0.99 |
%(c) |
|
• Commencement of operations.
** Distribution for annual periods determined in accordance with federal income tax regulations.
(a) Net investment income (loss) allocated based on average shares method.
(b) Total return measures net investment income (loss) and capital gain or loss from portfolio investments assuming reinvestment of dividends and capital gains distributions. Total return is not annualized for periods that are less than a full year, does not reflect the effect of sales charge for Class A shares nor the contingent deferred sales charge for Class C shares and does not reflect the deduction of taxes that a shareholder would pay on fund distributions or the redemption of fund shares.
(c) Annualized.
PROSPECTUS | March 1, 2024
199
Calamos Dividend Growth Fund
FINANCIAL HIGHLIGHTS
Selected data for a share outstanding throughout each year were as follows:
|
|
|
CLASS A |
|
|
|
|
Year Ended October 31, |
|
|
|
|
2023 |
|
2022 |
|
2021 |
|
2020 |
|
2019 |
|
Net asset value, beginning
of year |
|
$ |
13.41 |
|
|
$ |
17.13 |
|
|
$ |
13.04 |
|
|
$ |
13.37 |
|
|
$ |
12.34 |
|
|
Income from investment
operations: |
|
Net investment income
(loss)(a) |
|
|
0.04 |
|
|
|
0.03 |
|
|
|
0.00 |
* |
|
|
0.05 |
|
|
|
0.07 |
|
|
Net realized and
unrealized gain (loss) |
|
|
1.11 |
|
|
|
(2.41 |
) |
|
|
5.24 |
|
|
|
1.13 |
|
|
|
1.50 |
|
|
Total from investment
operations |
|
|
1.15 |
|
|
|
(2.38 |
) |
|
|
5.24 |
|
|
|
1.18 |
|
|
|
1.57 |
|
|
|
Distributions: |
|
Dividends from net
investment income |
|
|
(0.05 |
) |
|
|
— |
|
|
|
(0.02 |
) |
|
|
(0.06 |
) |
|
|
(0.08 |
) |
|
Dividends from net
realized gains |
|
|
— |
|
|
|
(1.34 |
) |
|
|
(1.13 |
) |
|
|
(1.45 |
) |
|
|
(0.46 |
) |
|
|
Total distributions** |
|
|
(0.05 |
) |
|
|
(1.34 |
) |
|
|
(1.15 |
) |
|
|
(1.51 |
) |
|
|
(0.54 |
) |
|
|
Net asset value, end of year |
|
$ |
14.51 |
|
|
$ |
13.41 |
|
|
$ |
17.13 |
|
|
$ |
13.04 |
|
|
$ |
13.37 |
|
|
Ratios and supplemental
data: |
|
|
Total return(b) |
|
|
8.61 |
% |
|
|
(15.01 |
%) |
|
|
42.42 |
% |
|
|
9.20 |
% |
|
|
13.63 |
% |
|
Net assets, end of
year (000) |
|
$ |
5,250 |
|
|
$ |
5,181 |
|
|
$ |
5,139 |
|
|
$ |
3,534 |
|
|
$ |
3,638 |
|
|
Ratio of net expenses to
average net assets |
|
|
1.35 |
% |
|
|
1.35 |
% |
|
|
1.35 |
% |
|
|
1.35 |
% |
|
|
1.35 |
% |
|
Ratio of gross expenses to
average net assets prior
to expense reductions |
|
|
2.09 |
% |
|
|
2.03 |
% |
|
|
2.04 |
% |
|
|
2.15 |
% |
|
|
1.94 |
% |
|
Ratio of net investment
income (loss) to average
net assets |
|
|
0.29 |
% |
|
|
0.23 |
% |
|
|
0.02 |
% |
|
|
0.40 |
% |
|
|
0.60 |
% |
|
|
|
|
Year Ended October 31, |
|
|
|
|
2023 |
|
2022 |
|
2021 |
|
2020 |
|
2019 |
|
|
Portfolio turnover rate |
|
|
28 |
% |
|
|
25 |
% |
|
|
20 |
% |
|
|
22 |
% |
|
|
15 |
% |
|
* Amounts are less than $0.005.
** Distribution for annual periods determined in accordance with federal income tax regulations.
(a) Net investment income (loss) allocated based on average shares method.
(b) Total return measures net investment income (loss) and capital gain or loss from portfolio investments assuming reinvestment of dividends and capital gains distributions. Total return is not annualized for periods that are less than a full year, does not reflect the effect of sales charge for Class A shares nor the contingent deferred sales charge for Class C shares and does not reflect the deduction of taxes that a shareholder would pay on fund distributions or the redemption of fund shares.
CALAMOS FAMILY OF FUNDS
200
Calamos Dividend Growth Fund
|
|
|
CLASS C |
|
|
|
|
Year Ended October 31, |
|
|
|
|
2023 |
|
2022 |
|
2021 |
|
2020 |
|
2019 |
|
Net asset value, beginning
of year |
|
$ |
12.77 |
|
|
$ |
16.49 |
|
|
$ |
12.67 |
|
|
$ |
13.07 |
|
|
$ |
12.09 |
|
|
Income from investment
operations: |
|
Net investment income
(loss)(a) |
|
|
(0.06 |
)(b) |
|
|
(0.07 |
) |
|
|
(0.11 |
) |
|
|
(0.04 |
) |
|
|
(0.01 |
) |
|
Net realized and
unrealized gain (loss) |
|
|
1.06 |
|
|
|
(2.31 |
) |
|
|
5.07 |
|
|
|
1.09 |
|
|
|
1.45 |
|
|
Total from investment
operations |
|
|
1.00 |
|
|
|
(2.38 |
) |
|
|
4.96 |
|
|
|
1.05 |
|
|
|
1.44 |
|
|
|
Distributions: |
|
Dividends from net
investment income |
|
|
(0.03 |
) |
|
|
— |
|
|
|
(0.01 |
) |
|
|
— |
|
|
|
— |
|
|
Dividends from net
realized gains |
|
|
— |
|
|
|
(1.34 |
) |
|
|
(1.13 |
) |
|
|
(1.45 |
) |
|
|
(0.46 |
) |
|
|
Total distributions** |
|
|
(0.03 |
) |
|
|
(1.34 |
) |
|
|
(1.14 |
) |
|
|
(1.45 |
) |
|
|
(0.46 |
) |
|
|
Net asset value, end of year |
|
$ |
13.74 |
|
|
$ |
12.77 |
|
|
$ |
16.49 |
|
|
$ |
12.67 |
|
|
$ |
13.07 |
|
|
Ratios and supplemental
data: |
|
|
Total return(c) |
|
|
7.82 |
% |
|
|
(15.63 |
%) |
|
|
41.37 |
% |
|
|
8.35 |
% |
|
|
12.74 |
% |
|
Net assets, end of
year (000) |
|
$ |
2,342 |
|
|
$ |
2,202 |
|
|
$ |
2,017 |
|
|
$ |
685 |
|
|
$ |
659 |
|
|
Ratio of net expenses to
average net assets |
|
|
2.10 |
% |
|
|
2.10 |
% |
|
|
2.10 |
% |
|
|
2.11 |
% |
|
|
2.10 |
% |
|
Ratio of gross expenses to
average net assets prior
to expense reductions |
|
|
2.85 |
% |
|
|
2.78 |
% |
|
|
2.78 |
% |
|
|
2.91 |
% |
|
|
2.65 |
% |
|
Ratio of net investment
income (loss) to average
net assets |
|
|
(0.46 |
%) |
|
|
(0.51 |
%) |
|
|
(0.74 |
%) |
|
|
(0.36 |
%) |
|
|
(0.06 |
%) |
|
** Distribution for annual periods determined in accordance with federal income tax regulations.
(a) Net investment income (loss) allocated based on average shares method.
(b) The amount shown for a share outstanding throughout the period may not correlate with the Statement of Operations for the period due to class specific expenses.
(c) Total return measures net investment income (loss) and capital gain or loss from portfolio investments assuming reinvestment of dividends and capital gains distributions. Total return is not annualized for periods that are less than a full year, does not reflect the effect of sales charge for Class A shares nor the contingent deferred sales charge for Class C shares and does not reflect the deduction of taxes that a shareholder would pay on fund distributions or the redemption of fund shares.
PROSPECTUS | March 1, 2024
201
Calamos Dividend Growth Fund
|
|
|
CLASS I |
|
|
|
|
Year Ended October 31, |
|
|
|
|
2023 |
|
2022 |
|
2021 |
|
2020 |
|
2019 |
|
Net asset value, beginning
of year |
|
$ |
13.44 |
|
|
$ |
17.15 |
|
|
$ |
13.03 |
|
|
$ |
13.36 |
|
|
$ |
12.33 |
|
|
Income from investment
operations: |
|
Net investment income
(loss)(a) |
|
|
0.08 |
|
|
|
0.07 |
|
|
|
0.04 |
|
|
|
0.08 |
|
|
|
0.11 |
|
|
Net realized and
unrealized gain (loss) |
|
|
1.11 |
|
|
|
(2.41 |
) |
|
|
5.23 |
|
|
|
1.12 |
|
|
|
1.49 |
|
|
Total from investment
operations |
|
|
1.19 |
|
|
|
(2.34 |
) |
|
|
5.27 |
|
|
|
1.20 |
|
|
|
1.60 |
|
|
|
Distributions: |
|
Dividends from net
investment income |
|
|
(0.06 |
) |
|
|
(0.03 |
) |
|
|
(0.02 |
) |
|
|
(0.08 |
) |
|
|
(0.11 |
) |
|
Dividends from net
realized gains |
|
|
— |
|
|
|
(1.34 |
) |
|
|
(1.13 |
) |
|
|
(1.45 |
) |
|
|
(0.46 |
) |
|
|
Total distributions** |
|
|
(0.06 |
) |
|
|
(1.37 |
) |
|
|
(1.15 |
) |
|
|
(1.53 |
) |
|
|
(0.57 |
) |
|
|
Net asset value, end of year |
|
$ |
14.57 |
|
|
$ |
13.44 |
|
|
$ |
17.15 |
|
|
$ |
13.03 |
|
|
$ |
13.36 |
|
|
Ratios and supplemental
data: |
|
|
Total return(b) |
|
|
8.88 |
% |
|
|
(14.76 |
%) |
|
|
42.73 |
% |
|
|
9.46 |
% |
|
|
13.93 |
% |
|
Net assets, end of
year (000) |
|
$ |
7,639 |
|
|
$ |
10,195 |
|
|
$ |
10,373 |
|
|
$ |
8,974 |
|
|
$ |
12,986 |
|
|
Ratio of net expenses to
average net assets |
|
|
1.10 |
% |
|
|
1.10 |
% |
|
|
1.10 |
% |
|
|
1.10 |
% |
|
|
1.10 |
% |
|
Ratio of gross expenses to
average net assets prior
to expense reductions |
|
|
1.84 |
% |
|
|
1.78 |
% |
|
|
1.80 |
% |
|
|
1.88 |
% |
|
|
1.67 |
% |
|
Ratio of net investment
income (loss) to average
net assets |
|
|
0.56 |
% |
|
|
0.48 |
% |
|
|
0.28 |
% |
|
|
0.67 |
% |
|
|
0.92 |
% |
|
** Distribution for annual periods determined in accordance with federal income tax regulations.
(a) Net investment income (loss) allocated based on average shares method.
(b) Total return measures net investment income (loss) and capital gain or loss from portfolio investments assuming reinvestment of dividends and capital gains distributions. Total return is not annualized for periods that are less than a full year, does not reflect the effect of sales charge for Class A shares nor the contingent deferred sales charge for Class C shares and does not reflect the deduction of taxes that a shareholder would pay on fund distributions or the redemption of fund shares.
CALAMOS FAMILY OF FUNDS
202
FINANCIAL HIGHLIGHTS
Selected data for a share outstanding throughout each year were as follows:
|
|
|
CLASS A |
|
CLASS C |
|
|
|
|
Year Ended October 31, |
|
Year Ended October 31, |
|
|
|
|
2023 |
|
2022 |
|
2021 |
|
2020 |
|
2019 |
|
2023 |
|
2022 |
|
2021 |
|
2020 |
|
2019 |
|
Net asset value, beginning
of year |
|
$ |
15.86 |
|
|
$ |
20.48 |
|
|
$ |
14.93 |
|
|
$ |
14.21 |
|
|
$ |
15.37 |
|
|
$ |
13.28 |
|
|
$ |
17.52 |
|
|
$ |
12.97 |
|
|
$ |
12.36 |
|
|
$ |
13.77 |
|
|
Income from investment
operations: |
|
Net investment income
(loss)(a) |
|
|
0.03 |
|
|
|
0.00 |
|
|
|
(0.03 |
) |
|
|
0.07 |
|
|
|
0.15 |
|
|
|
(0.08 |
) |
|
|
(0.12 |
) |
|
|
(0.14 |
) |
|
|
(0.01 |
) |
|
|
0.02 |
|
|
Net realized and
unrealized gain (loss) |
|
|
1.29 |
|
|
|
(3.12 |
) |
|
|
6.39 |
|
|
|
0.74 |
|
|
|
0.95 |
|
|
|
1.07 |
|
|
|
(2.62 |
) |
|
|
5.50 |
|
|
|
0.62 |
|
|
|
0.83 |
|
|
Total from investment
operations |
|
|
1.32 |
|
|
|
(3.12 |
) |
|
|
6.36 |
|
|
|
0.81 |
|
|
|
1.10 |
|
|
|
0.99 |
|
|
|
(2.74 |
) |
|
|
5.36 |
|
|
|
0.61 |
|
|
|
0.85 |
|
|
|
Distributions: |
|
Dividends from net
investment income |
|
|
— |
|
|
|
— |
|
|
|
— |
|
|
|
(0.09 |
) |
|
|
(0.06 |
) |
|
|
— |
|
|
|
— |
|
|
|
— |
|
|
|
— |
|
|
|
(0.06 |
) |
|
Dividends from net
realized gains |
|
|
(0.41 |
) |
|
|
(1.50 |
) |
|
|
(0.81 |
) |
|
|
— |
|
|
|
(2.20 |
) |
|
|
(0.41 |
) |
|
|
(1.50 |
) |
|
|
(0.81 |
) |
|
|
— |
|
|
|
(2.20 |
) |
|
|
Total distributions** |
|
|
(0.41 |
) |
|
|
(1.50 |
) |
|
|
(0.81 |
) |
|
|
(0.09 |
) |
|
|
(2.26 |
) |
|
|
(0.41 |
) |
|
|
(1.50 |
) |
|
|
(0.81 |
) |
|
|
— |
|
|
|
(2.26 |
) |
|
|
Net asset value, end of year |
|
$ |
16.77 |
|
|
$ |
15.86 |
|
|
$ |
20.48 |
|
|
$ |
14.93 |
|
|
$ |
14.21 |
|
|
$ |
13.86 |
|
|
$ |
13.28 |
|
|
$ |
17.52 |
|
|
$ |
12.97 |
|
|
$ |
12.36 |
|
|
Ratios and supplemental
data: |
|
|
Total return(b) |
|
|
8.60 |
% |
|
|
(16.22 |
%) |
|
|
43.93 |
% |
|
|
5.71 |
% |
|
|
10.14 |
% |
|
|
7.76 |
% |
|
|
(16.85 |
%) |
|
|
42.92 |
% |
|
|
4.85 |
% |
|
|
9.33 |
% |
|
Net assets, end of
year (000) |
|
$ |
11,533 |
|
|
$ |
11,628 |
|
|
$ |
14,211 |
|
|
$ |
10,595 |
|
|
$ |
11,363 |
|
|
$ |
120 |
|
|
$ |
170 |
|
|
$ |
887 |
|
|
$ |
1,056 |
|
|
$ |
5,274 |
|
|
Ratio of net expenses to
average net assets |
|
|
1.15 |
% |
|
|
1.15 |
% |
|
|
1.15 |
% |
|
|
1.15 |
% |
|
|
1.15 |
% |
|
|
1.90 |
% |
|
|
1.91 |
% |
|
|
1.90 |
% |
|
|
1.90 |
% |
|
|
1.90 |
% |
|
Ratio of gross expenses to
average net assets prior
to expense reductions |
|
|
1.62 |
% |
|
|
1.57 |
% |
|
|
1.57 |
% |
|
|
1.64 |
% |
|
|
1.62 |
% |
|
|
2.36 |
% |
|
|
2.33 |
% |
|
|
2.33 |
% |
|
|
2.40 |
% |
|
|
2.35 |
% |
|
Ratio of net investment
income (loss) to average
net assets |
|
|
0.16 |
% |
|
|
0.00 |
% |
|
|
(0.19 |
%) |
|
|
0.49 |
% |
|
|
1.06 |
% |
|
|
(0.57 |
%) |
|
|
(0.77 |
%) |
|
|
(0.92 |
%) |
|
|
(0.11 |
%) |
|
|
0.15 |
% |
|
|
|
|
Year Ended October 31, |
|
|
|
|
2023 |
|
2022 |
|
2021 |
|
2020 |
|
2019 |
|
|
Portfolio turnover rate |
|
|
55 |
% |
|
|
34 |
% |
|
|
25 |
% |
|
|
136 |
% |
|
|
78 |
% |
|
** Distribution for annual periods determined in accordance with federal income tax regulations.
(a) Net investment income (loss) allocated based on average shares method.
(b) Total return measures net investment income (loss) and capital gain or loss from portfolio investments assuming reinvestment of dividends and capital gains distributions. Total return is not annualized for periods that are less than a full year, does not reflect the effect of sales charge for Class A shares nor the contingent deferred sales charge for Class C shares and does not reflect the deduction of taxes that a shareholder would pay on fund distributions or the redemption of fund shares.
PROSPECTUS | March 1, 2024
203
|
|
|
CLASS I |
|
|
|
|
Year Ended October 31, |
|
|
|
|
2023 |
|
2022 |
|
2021 |
|
2020 |
|
2019 |
|
Net asset value, beginning
of year |
|
$ |
16.45 |
|
|
$ |
21.15 |
|
|
$ |
15.36 |
|
|
$ |
14.62 |
|
|
$ |
15.80 |
|
|
Income from investment
operations: |
|
Net investment income
(loss)(a) |
|
|
0.07 |
|
|
|
0.05 |
|
|
|
0.01 |
|
|
|
0.10 |
|
|
|
0.16 |
|
|
Net realized and
unrealized gain (loss) |
|
|
1.34 |
|
|
|
(3.23 |
) |
|
|
6.59 |
|
|
|
0.76 |
|
|
|
1.01 |
|
|
Total from investment
operations |
|
|
1.41 |
|
|
|
(3.18 |
) |
|
|
6.60 |
|
|
|
0.86 |
|
|
|
1.17 |
|
|
|
Distributions: |
|
Dividends from net
investment income |
|
|
— |
|
|
|
(0.02 |
) |
|
|
— |
|
|
|
(0.12 |
) |
|
|
(0.15 |
) |
|
Dividends from net
realized gains |
|
|
(0.41 |
) |
|
|
(1.50 |
) |
|
|
(0.81 |
) |
|
|
— |
|
|
|
(2.20 |
) |
|
|
Total distributions** |
|
|
(0.41 |
) |
|
|
(1.52 |
) |
|
|
(0.81 |
) |
|
|
(0.12 |
) |
|
|
(2.35 |
) |
|
|
Net asset value, end of year |
|
$ |
17.45 |
|
|
$ |
16.45 |
|
|
$ |
21.15 |
|
|
$ |
15.36 |
|
|
$ |
14.62 |
|
|
Ratios and supplemental
data: |
|
|
Total return(b) |
|
|
8.84 |
% |
|
|
(16.00 |
%) |
|
|
44.28 |
% |
|
|
5.92 |
% |
|
|
10.43 |
% |
|
Net assets, end of
year (000) |
|
$ |
31,663 |
|
|
$ |
30,660 |
|
|
$ |
38,585 |
|
|
$ |
36,075 |
|
|
$ |
28,389 |
|
|
Ratio of net expenses to
average net assets |
|
|
0.90 |
% |
|
|
0.90 |
% |
|
|
0.90 |
% |
|
|
0.90 |
% |
|
|
0.90 |
% |
|
Ratio of gross expenses to
average net assets prior
to expense reductions |
|
|
1.37 |
% |
|
|
1.32 |
% |
|
|
1.32 |
% |
|
|
1.39 |
% |
|
|
1.36 |
% |
|
Ratio of net investment
income (loss) to average
net assets |
|
|
0.41 |
% |
|
|
0.25 |
% |
|
|
0.07 |
% |
|
|
0.69 |
% |
|
|
1.13 |
% |
|
** Distribution for annual periods determined in accordance with federal income tax regulations.
(a) Net investment income (loss) allocated based on average shares method.
(b) Total return measures net investment income (loss) and capital gain or loss from portfolio investments assuming reinvestment of dividends and capital gains distributions. Total return is not annualized for periods that are less than a full year, does not reflect the effect of sales charge for Class A shares nor the contingent deferred sales charge for Class C shares and does not reflect the deduction of taxes that a shareholder would pay on fund distributions or the redemption of fund shares.
CALAMOS FAMILY OF FUNDS
204
Calamos International Growth Fund
FINANCIAL HIGHLIGHTS
Selected data for a share outstanding throughout each year were as follows:
|
|
|
CLASS A |
|
CLASS C |
|
|
|
|
Year Ended October 31, |
|
Year Ended October 31, |
|
|
|
|
2023 |
|
2022 |
|
2021 |
|
2020 |
|
2019 |
|
2023 |
|
2022 |
|
2021 |
|
2020 |
|
2019 |
|
Net asset value, beginning
of year |
|
$ |
15.43 |
|
|
$ |
28.83 |
|
|
$ |
22.96 |
|
|
$ |
17.97 |
|
|
$ |
18.10 |
|
|
$ |
12.86 |
|
|
$ |
24.94 |
|
|
$ |
20.17 |
|
|
$ |
15.91 |
|
|
$ |
16.38 |
|
|
Income from investment
operations: |
|
Net investment income
(loss)(a) |
|
|
0.05 |
|
|
|
0.21 |
|
|
|
0.05 |
|
|
|
(0.04 |
) |
|
|
0.09 |
|
|
|
(0.07 |
) |
|
|
0.05 |
|
|
|
(0.16 |
) |
|
|
(0.16 |
) |
|
|
(0.05 |
) |
|
Net realized and
unrealized gain (loss) |
|
|
0.77 |
|
|
|
(9.48 |
) |
|
|
7.29 |
|
|
|
5.03 |
|
|
|
1.80 |
|
|
|
0.65 |
|
|
|
(8.00 |
) |
|
|
6.40 |
|
|
|
4.42 |
|
|
|
1.60 |
|
|
Total from investment
operations |
|
|
0.82 |
|
|
|
(9.27 |
) |
|
|
7.34 |
|
|
|
4.99 |
|
|
|
1.89 |
|
|
|
0.58 |
|
|
|
(7.95 |
) |
|
|
6.24 |
|
|
|
4.26 |
|
|
|
1.55 |
|
|
|
Distributions: |
|
Dividends from net
investment income |
|
|
— |
|
|
|
(0.00 |
)* |
|
|
— |
|
|
|
— |
|
|
|
— |
|
|
|
— |
|
|
|
— |
|
|
|
— |
|
|
|
— |
|
|
|
— |
|
|
Dividends from net
realized gains |
|
|
— |
|
|
|
(4.13 |
) |
|
|
(1.47 |
) |
|
|
— |
|
|
|
(2.02 |
) |
|
|
— |
|
|
|
(4.13 |
) |
|
|
(1.47 |
) |
|
|
— |
|
|
|
(2.02 |
) |
|
|
Total distributions** |
|
|
— |
|
|
|
(4.13 |
) |
|
|
(1.47 |
) |
|
|
— |
|
|
|
(2.02 |
) |
|
|
— |
|
|
|
(4.13 |
) |
|
|
(1.47 |
) |
|
|
— |
|
|
|
(2.02 |
) |
|
|
Net asset value, end of year |
|
$ |
16.25 |
|
|
$ |
15.43 |
|
|
$ |
28.83 |
|
|
$ |
22.96 |
|
|
$ |
17.97 |
|
|
$ |
13.44 |
|
|
$ |
12.86 |
|
|
$ |
24.94 |
|
|
$ |
20.17 |
|
|
$ |
15.91 |
|
|
Ratios and supplemental
data: |
|
|
Total return(b) |
|
|
5.31 |
% |
|
|
(36.67 |
%) |
|
|
32.76 |
% |
|
|
27.82 |
% |
|
|
13.07 |
% |
|
|
4.51 |
% |
|
|
(37.18 |
%) |
|
|
31.79 |
% |
|
|
26.84 |
% |
|
|
12.21 |
% |
|
Net assets, end of
year (000) |
|
$ |
41,631 |
|
|
$ |
46,993 |
|
|
$ |
79,503 |
|
|
$ |
60,527 |
|
|
$ |
53,950 |
|
|
$ |
1,339 |
|
|
$ |
1,989 |
|
|
$ |
3,953 |
|
|
$ |
6,344 |
|
|
$ |
9,022 |
|
|
Ratio of net expenses to
average net assets |
|
|
1.16 |
% |
|
|
1.10 |
% |
|
|
1.10 |
% |
|
|
1.10 |
% |
|
|
1.10 |
% |
|
|
1.91 |
% |
|
|
1.85 |
% |
|
|
1.85 |
% |
|
|
1.85 |
% |
|
|
1.85 |
% |
|
Ratio of gross expenses to
average net assets prior
to expense reductions |
|
|
1.49 |
% |
|
|
1.64 |
% |
|
|
1.56 |
% |
|
|
1.52 |
% |
|
|
1.48 |
% |
|
|
2.24 |
% |
|
|
2.39 |
% |
|
|
2.31 |
% |
|
|
2.27 |
% |
|
|
2.26 |
% |
|
Ratio of net investment
income (loss) to average
net assets |
|
|
0.27 |
% |
|
|
1.04 |
% |
|
|
0.19 |
% |
|
|
(0.20 |
%) |
|
|
0.51 |
% |
|
|
(0.48 |
%) |
|
|
0.27 |
% |
|
|
(0.69 |
%) |
|
|
(0.95 |
%) |
|
|
(0.35 |
%) |
|
|
|
|
Year Ended October 31, |
|
|
|
|
2023 |
|
2022 |
|
2021 |
|
2020 |
|
2019 |
|
|
Portfolio turnover rate |
|
|
131 |
% |
|
|
129 |
% |
|
|
99 |
% |
|
|
85 |
% |
|
|
81 |
% |
|
* Amounts are less than $0.005.
** Distribution for annual periods determined in accordance with federal income tax regulations.
(a) Net investment income (loss) allocated based on average shares method.
(b) Total return measures net investment income (loss) and capital gain or loss from portfolio investments assuming reinvestment of dividends and capital gains distributions. Total return is not annualized for periods that are less than a full year, does not reflect the effect of sales charge for Class A shares nor the contingent deferred sales charge for Class C shares and does not reflect the deduction of taxes that a shareholder would pay on fund distributions or the redemption of fund shares.
PROSPECTUS | March 1, 2024
205
Calamos International Growth Fund
|
|
|
CLASS I |
|
CLASS R6 |
|
|
|
|
Year Ended October 31, |
|
Year Ended October 31, |
|
|
|
|
2023 |
|
2022 |
|
2021 |
|
2020 |
|
2019 |
|
2023 |
|
2022 |
|
2021 |
|
2020 |
|
2019 |
|
Net asset value, beginning
of year |
|
$ |
16.10 |
|
|
$ |
29.92 |
|
|
$ |
23.73 |
|
|
$ |
18.53 |
|
|
$ |
18.55 |
|
|
$ |
16.28 |
|
|
$ |
30.20 |
|
|
$ |
23.93 |
|
|
$ |
18.67 |
|
|
$ |
18.66 |
|
|
Income from investment
operations: |
|
Net investment income
(loss)(a) |
|
|
0.09 |
|
|
|
0.27 |
|
|
|
0.12 |
|
|
|
0.01 |
|
|
|
0.13 |
|
|
|
0.11 |
|
|
|
0.31 |
|
|
|
0.15 |
|
|
|
0.05 |
|
|
|
0.20 |
|
|
Net realized and
unrealized gain (loss) |
|
|
0.81 |
|
|
|
(9.88 |
) |
|
|
7.54 |
|
|
|
5.19 |
|
|
|
1.87 |
|
|
|
0.82 |
|
|
|
(10.00 |
) |
|
|
7.61 |
|
|
|
5.21 |
|
|
|
1.83 |
|
|
Total from investment
operations |
|
|
0.90 |
|
|
|
(9.61 |
) |
|
|
7.66 |
|
|
|
5.20 |
|
|
|
2.00 |
|
|
|
0.93 |
|
|
|
(9.69 |
) |
|
|
7.76 |
|
|
|
5.26 |
|
|
|
2.03 |
|
|
|
Distributions: |
|
Dividends from net
investment income |
|
|
— |
|
|
|
(0.08 |
) |
|
|
(0.00 |
)* |
|
|
— |
|
|
|
— |
|
|
|
— |
|
|
|
(0.10 |
) |
|
|
(0.02 |
) |
|
|
— |
|
|
|
— |
|
|
Dividends from net
realized gains |
|
|
— |
|
|
|
(4.13 |
) |
|
|
(1.47 |
) |
|
|
— |
|
|
|
(2.02 |
) |
|
|
— |
|
|
|
(4.13 |
) |
|
|
(1.47 |
) |
|
|
— |
|
|
|
(2.02 |
) |
|
|
Total distributions** |
|
|
— |
|
|
|
(4.21 |
) |
|
|
(1.47 |
) |
|
|
— |
|
|
|
(2.02 |
) |
|
|
— |
|
|
|
(4.23 |
) |
|
|
(1.49 |
) |
|
|
— |
|
|
|
(2.02 |
) |
|
|
Net asset value, end of year |
|
$ |
17.00 |
|
|
$ |
16.10 |
|
|
$ |
29.92 |
|
|
$ |
23.73 |
|
|
$ |
18.53 |
|
|
$ |
17.21 |
|
|
$ |
16.28 |
|
|
$ |
30.20 |
|
|
$ |
23.93 |
|
|
$ |
18.67 |
|
|
Ratios and supplemental
data: |
|
|
Total return(b) |
|
|
5.59 |
% |
|
|
(36.54 |
%) |
|
|
33.13 |
% |
|
|
28.06 |
% |
|
|
13.32 |
% |
|
|
5.71 |
% |
|
|
(36.47 |
%) |
|
|
33.24 |
% |
|
|
28.23 |
% |
|
|
13.41 |
% |
|
Net assets, end of
year (000) |
|
$ |
141,782 |
|
|
$ |
120,520 |
|
|
$ |
216,723 |
|
|
$ |
156,321 |
|
|
$ |
134,562 |
|
|
$ |
4,829 |
|
|
$ |
4,332 |
|
|
$ |
1,921 |
|
|
$ |
1,012 |
|
|
$ |
7,463 |
|
|
Ratio of net expenses to
average net assets |
|
|
0.91 |
% |
|
|
0.85 |
% |
|
|
0.85 |
% |
|
|
0.85 |
% |
|
|
0.85 |
% |
|
|
0.81 |
% |
|
|
0.75 |
% |
|
|
0.77 |
% |
|
|
0.76 |
% |
|
|
0.77 |
% |
|
Ratio of gross expenses to
average net assets prior
to expense reductions |
|
|
1.24 |
% |
|
|
1.39 |
% |
|
|
1.31 |
% |
|
|
1.28 |
% |
|
|
1.23 |
% |
|
|
1.13 |
% |
|
|
1.28 |
% |
|
|
1.22 |
% |
|
|
1.17 |
% |
|
|
1.15 |
% |
|
Ratio of net investment
income (loss) to average
net assets |
|
|
0.52 |
% |
|
|
1.28 |
% |
|
|
0.43 |
% |
|
|
0.05 |
% |
|
|
0.75 |
% |
|
|
0.61 |
% |
|
|
1.59 |
% |
|
|
0.51 |
% |
|
|
0.24 |
% |
|
|
1.13 |
% |
|
* Amounts are less than $0.005.
** Distribution for annual periods determined in accordance with federal income tax regulations.
(a) Net investment income (loss) allocated based on average shares method.
(b) Total return measures net investment income (loss) and capital gain or loss from portfolio investments assuming reinvestment of dividends and capital gains distributions. Total return is not annualized for periods that are less than a full year, does not reflect the effect of sales charge for Class A shares nor the contingent deferred sales charge for Class C shares and does not reflect the deduction of taxes that a shareholder would pay on fund distributions or the redemption of fund shares.
CALAMOS FAMILY OF FUNDS
206
Calamos Evolving World Growth Fund
FINANCIAL HIGHLIGHTS
Selected data for a share outstanding throughout each year were as follows:
|
|
|
CLASS A |
|
CLASS C |
|
|
|
|
Year Ended October 31, |
|
Year Ended October 31, |
|
|
|
|
2023 |
|
2022 |
|
2021 |
|
2020 |
|
2019 |
|
2023 |
|
2022 |
|
2021 |
|
2020 |
|
2019 |
|
Net asset value, beginning
of year |
|
$ |
14.51 |
|
|
$ |
22.25 |
|
|
$ |
19.60 |
|
|
$ |
14.12 |
|
|
$ |
12.54 |
|
|
$ |
13.34 |
|
|
$ |
20.55 |
|
|
$ |
18.26 |
|
|
$ |
13.16 |
|
|
$ |
11.78 |
|
|
Income from investment
operations: |
|
Net investment income
(loss)(a) |
|
|
0.01 |
|
|
|
0.12 |
|
|
|
(0.05 |
) |
|
|
(0.07 |
) |
|
|
0.09 |
|
|
|
(0.09 |
) |
|
|
(0.03 |
) |
|
|
(0.22 |
) |
|
|
(0.18 |
) |
|
|
(0.01 |
) |
|
Net realized and
unrealized gain (loss) |
|
|
0.46 |
|
|
|
(7.79 |
) |
|
|
3.15 |
|
|
|
5.66 |
|
|
|
1.49 |
|
|
|
0.42 |
|
|
|
(7.18 |
) |
|
|
2.96 |
|
|
|
5.28 |
|
|
|
1.39 |
|
|
Total from investment
operations |
|
|
0.47 |
|
|
|
(7.67 |
) |
|
|
3.10 |
|
|
|
5.59 |
|
|
|
1.58 |
|
|
|
0.33 |
|
|
|
(7.21 |
) |
|
|
2.74 |
|
|
|
5.10 |
|
|
|
1.38 |
|
|
|
Distributions: |
|
Dividends from net
investment income |
|
|
(0.11 |
) |
|
|
(0.07 |
) |
|
|
— |
|
|
|
(0.11 |
) |
|
|
— |
|
|
|
— |
|
|
|
— |
|
|
|
— |
|
|
|
— |
|
|
|
— |
|
|
Dividends from net
realized gains |
|
|
— |
|
|
|
— |
|
|
|
(0.45 |
) |
|
|
— |
|
|
|
— |
|
|
|
— |
|
|
|
— |
|
|
|
(0.45 |
) |
|
|
— |
|
|
|
— |
|
|
|
Total distributions** |
|
|
(0.11 |
) |
|
|
(0.07 |
) |
|
|
(0.45 |
) |
|
|
(0.11 |
) |
|
|
— |
|
|
|
— |
|
|
|
— |
|
|
|
(0.45 |
) |
|
|
— |
|
|
|
— |
|
|
|
Net asset value, end of year |
|
$ |
14.87 |
|
|
$ |
14.51 |
|
|
$ |
22.25 |
|
|
$ |
19.60 |
|
|
$ |
14.12 |
|
|
$ |
13.67 |
|
|
$ |
13.34 |
|
|
$ |
20.55 |
|
|
$ |
18.26 |
|
|
$ |
13.16 |
|
|
Ratios and supplemental
data: |
|
|
Total return(b) |
|
|
3.19 |
% |
|
|
(34.55 |
%) |
|
|
15.87 |
% |
|
|
39.81 |
% |
|
|
12.60 |
% |
|
|
2.40 |
% |
|
|
(35.04 |
%) |
|
|
15.05 |
% |
|
|
38.75 |
% |
|
|
11.71 |
% |
|
Net assets, end of
year (000) |
|
$ |
36,830 |
|
|
$ |
36,890 |
|
|
$ |
54,731 |
|
|
$ |
31,015 |
|
|
$ |
28,168 |
|
|
$ |
3,930 |
|
|
$ |
6,153 |
|
|
$ |
16,050 |
|
|
$ |
13,183 |
|
|
$ |
13,478 |
|
|
Ratio of net expenses to
average net assets |
|
|
1.29 |
% |
|
|
1.30 |
% |
|
|
1.30 |
% |
|
|
1.56 |
% |
|
|
1.64 |
% |
|
|
2.04 |
% |
|
|
2.05 |
% |
|
|
2.05 |
% |
|
|
2.32 |
% |
|
|
2.39 |
% |
|
Ratio of gross expenses to
average net assets prior
to expense reductions |
|
|
1.63 |
% |
|
|
1.63 |
% |
|
|
1.60 |
% |
|
|
1.64 |
% |
|
|
1.64 |
% |
|
|
2.38 |
% |
|
|
2.39 |
% |
|
|
2.34 |
% |
|
|
2.39 |
% |
|
|
2.39 |
% |
|
Ratio of net investment
income (loss) to average
net assets |
|
|
0.09 |
% |
|
|
0.67 |
% |
|
|
(0.21 |
%) |
|
|
(0.47 |
%) |
|
|
0.63 |
% |
|
|
(0.63 |
%) |
|
|
(0.16 |
%) |
|
|
(1.04 |
%) |
|
|
(1.23 |
%) |
|
|
(0.11 |
%) |
|
|
|
|
Year Ended October 31, |
|
|
|
|
2023 |
|
2022 |
|
2021 |
|
2020 |
|
2019 |
|
|
Portfolio turnover rate |
|
|
137 |
% |
|
|
132 |
% |
|
|
140 |
% |
|
|
125 |
% |
|
|
78 |
% |
|
** Distribution for annual periods determined in accordance with federal income tax regulations.
(a) Net investment income (loss) allocated based on average shares method.
(b) Total return measures net investment income (loss) and capital gain or loss from portfolio investments assuming reinvestment of dividends and capital gains distributions. Total return is not annualized for periods that are less than a full year, does not reflect the effect of sales charge for Class A shares nor the contingent deferred sales charge for Class C shares and does not reflect the deduction of taxes that a shareholder would pay on fund distributions or the redemption of fund shares.
PROSPECTUS | March 1, 2024
207
Calamos Evolving World Growth Fund
|
|
|
CLASS I |
|
|
|
|
Year Ended October 31, |
|
|
|
|
2023 |
|
2022 |
|
2021 |
|
2020 |
|
2019 |
|
Net asset value, beginning
of year |
|
$ |
14.67 |
|
|
$ |
22.51 |
|
|
$ |
19.78 |
|
|
$ |
14.26 |
|
|
$ |
12.63 |
|
|
Income from investment
operations: |
|
Net investment income
(loss)(a) |
|
|
0.06 |
|
|
|
0.17 |
|
|
|
0.01 |
|
|
|
(0.03 |
) |
|
|
0.12 |
|
|
Net realized and
unrealized gain (loss) |
|
|
0.45 |
|
|
|
(7.87 |
) |
|
|
3.18 |
|
|
|
5.71 |
|
|
|
1.51 |
|
|
Total from investment
operations |
|
|
0.51 |
|
|
|
(7.70 |
) |
|
|
3.19 |
|
|
|
5.68 |
|
|
|
1.63 |
|
|
|
Distributions: |
|
Dividends from net
investment income |
|
|
(0.15 |
) |
|
|
(0.14 |
) |
|
|
(0.01 |
) |
|
|
(0.16 |
) |
|
|
— |
|
|
Dividends from net
realized gains |
|
|
— |
|
|
|
— |
|
|
|
(0.45 |
) |
|
|
— |
|
|
|
— |
|
|
|
Total distributions** |
|
|
(0.15 |
) |
|
|
(0.14 |
) |
|
|
(0.46 |
) |
|
|
(0.16 |
) |
|
|
— |
|
|
|
Net asset value, end of year |
|
$ |
15.03 |
|
|
$ |
14.67 |
|
|
$ |
22.51 |
|
|
$ |
19.78 |
|
|
$ |
14.26 |
|
|
Ratios and supplemental
data: |
|
|
Total return(b) |
|
|
3.44 |
% |
|
|
(34.39 |
%) |
|
|
16.17 |
% |
|
|
40.16 |
% |
|
|
12.91 |
% |
|
Net assets, end of
year (000) |
|
$ |
320,622 |
|
|
$ |
315,858 |
|
|
$ |
509,216 |
|
|
$ |
193,243 |
|
|
$ |
120,318 |
|
|
Ratio of net expenses to
average net assets |
|
|
1.04 |
% |
|
|
1.05 |
% |
|
|
1.05 |
% |
|
|
1.30 |
% |
|
|
1.39 |
% |
|
Ratio of gross expenses to
average net assets prior
to expense reductions |
|
|
1.38 |
% |
|
|
1.38 |
% |
|
|
1.35 |
% |
|
|
1.39 |
% |
|
|
1.39 |
% |
|
Ratio of net investment
income (loss) to average
net assets |
|
|
0.35 |
% |
|
|
0.90 |
% |
|
|
0.04 |
% |
|
|
(0.22 |
%) |
|
|
0.91 |
% |
|
** Distribution for annual periods determined in accordance with federal income tax regulations.
(a) Net investment income (loss) allocated based on average shares method.
(b) Total return measures net investment income (loss) and capital gain or loss from portfolio investments assuming reinvestment of dividends and capital gains distributions. Total return is not annualized for periods that are less than a full year, does not reflect the effect of sales charge for Class A shares nor the contingent deferred sales charge for Class C shares and does not reflect the deduction of taxes that a shareholder would pay on fund distributions or the redemption of fund shares.
CALAMOS FAMILY OF FUNDS
208
Calamos Global Equity Fund
FINANCIAL HIGHLIGHTS
Selected data for a share outstanding throughout each year were as follows:
|
|
|
CLASS A |
|
CLASS C |
|
|
|
|
Year Ended October 31, |
|
Year Ended October 31, |
|
|
|
|
2023 |
|
2022 |
|
2021 |
|
2020 |
|
2019 |
|
2023 |
|
2022 |
|
2021 |
|
2020 |
|
2019 |
|
Net asset value, beginning
of year |
|
$ |
11.50 |
|
|
$ |
18.40 |
|
|
$ |
14.05 |
|
|
$ |
11.64 |
|
|
$ |
13.61 |
|
|
$ |
9.35 |
|
|
$ |
15.45 |
|
|
$ |
12.03 |
|
|
$ |
10.15 |
|
|
$ |
12.34 |
|
|
Income from investment
operations: |
|
Net investment income
(loss)(a) |
|
|
0.01 |
|
|
|
0.02 |
|
|
|
(0.08 |
) |
|
|
(0.07 |
) |
|
|
(0.01 |
) |
|
|
(0.07 |
) |
|
|
(0.07 |
) |
|
|
(0.18 |
) |
|
|
(0.14 |
) |
|
|
(0.09 |
) |
|
Net realized and
unrealized gain (loss) |
|
|
1.07 |
|
|
|
(4.94 |
) |
|
|
5.49 |
|
|
|
3.37 |
|
|
|
0.79 |
|
|
|
0.86 |
|
|
|
(4.05 |
) |
|
|
4.66 |
|
|
|
2.91 |
|
|
|
0.65 |
|
|
Total from investment
operations |
|
|
1.08 |
|
|
|
(4.92 |
) |
|
|
5.41 |
|
|
|
3.30 |
|
|
|
0.78 |
|
|
|
0.79 |
|
|
|
(4.12 |
) |
|
|
4.48 |
|
|
|
2.77 |
|
|
|
0.56 |
|
|
|
Distributions: |
|
Dividends from net
investment income |
|
|
— |
|
|
|
— |
|
|
|
— |
|
|
|
— |
|
|
|
— |
|
|
|
— |
|
|
|
— |
|
|
|
— |
|
|
|
— |
|
|
|
— |
|
|
Dividends from net
realized gains |
|
|
(0.50 |
) |
|
|
(1.98 |
) |
|
|
(1.06 |
) |
|
|
(0.89 |
) |
|
|
(2.75 |
) |
|
|
(0.50 |
) |
|
|
(1.98 |
) |
|
|
(1.06 |
) |
|
|
(0.89 |
) |
|
|
(2.75 |
) |
|
|
Total distributions** |
|
|
(0.50 |
) |
|
|
(1.98 |
) |
|
|
(1.06 |
) |
|
|
(0.89 |
) |
|
|
(2.75 |
) |
|
|
(0.50 |
) |
|
|
(1.98 |
) |
|
|
(1.06 |
) |
|
|
(0.89 |
) |
|
|
(2.75 |
) |
|
|
Net asset value, end of year |
|
$ |
12.08 |
|
|
$ |
11.50 |
|
|
$ |
18.40 |
|
|
$ |
14.05 |
|
|
$ |
11.64 |
|
|
$ |
9.64 |
|
|
$ |
9.35 |
|
|
$ |
15.45 |
|
|
$ |
12.03 |
|
|
$ |
10.15 |
|
|
Ratios and supplemental
data: |
|
|
Total return(b) |
|
|
9.68 |
% |
|
|
(29.36 |
%) |
|
|
39.89 |
% |
|
|
30.07 |
% |
|
|
10.28 |
% |
|
|
8.99 |
% |
|
|
(29.96 |
%) |
|
|
38.88 |
% |
|
|
29.19 |
% |
|
|
9.36 |
% |
|
Net assets, end of
year (000) |
|
$ |
20,462 |
|
|
$ |
21,143 |
|
|
$ |
32,511 |
|
|
$ |
21,814 |
|
|
$ |
20,236 |
|
|
$ |
611 |
|
|
$ |
726 |
|
|
$ |
1,492 |
|
|
$ |
4,635 |
|
|
$ |
8,011 |
|
|
Ratio of net expenses to
average net assets |
|
|
1.41 |
% |
|
|
1.40 |
% |
|
|
1.40 |
% |
|
|
1.40 |
% |
|
|
1.40 |
% |
|
|
2.16 |
% |
|
|
2.15 |
% |
|
|
2.15 |
% |
|
|
2.15 |
% |
|
|
2.15 |
% |
|
Ratio of gross expenses to
average net assets prior
to expense reductions |
|
|
1.52 |
% |
|
|
1.61 |
% |
|
|
1.58 |
% |
|
|
1.65 |
% |
|
|
1.51 |
% |
|
|
2.28 |
% |
|
|
2.37 |
% |
|
|
2.33 |
% |
|
|
2.40 |
% |
|
|
2.26 |
% |
|
Ratio of net investment
income (loss) to average
net assets |
|
|
0.04 |
% |
|
|
0.17 |
% |
|
|
(0.48 |
%) |
|
|
(0.59 |
%) |
|
|
(0.08 |
%) |
|
|
(0.71 |
%) |
|
|
(0.59 |
%) |
|
|
(1.32 |
%) |
|
|
(1.31 |
%) |
|
|
(0.86 |
%) |
|
|
|
|
Year Ended October 31, |
|
|
|
|
2023 |
|
2022 |
|
2021 |
|
2020 |
|
2019 |
|
|
Portfolio turnover rate |
|
|
90 |
% |
|
|
77 |
% |
|
|
72 |
% |
|
|
71 |
% |
|
|
72 |
% |
|
** Distribution for annual periods determined in accordance with federal income tax regulations.
(a) Net investment income (loss) allocated based on average shares method.
(b) Total return measures net investment income (loss) and capital gain or loss from portfolio investments assuming reinvestment of dividends and capital gains distributions. Total return is not annualized for periods that are less than a full year, does not reflect the effect of sales charge for Class A shares nor the contingent deferred sales charge for Class C shares and does not reflect the deduction of taxes that a shareholder would pay on fund distributions or the redemption of fund shares.
PROSPECTUS | March 1, 2024
209
Calamos Global Equity Fund
|
|
|
CLASS I |
|
|
|
|
Year Ended October 31, |
|
|
|
|
2023 |
|
2022 |
|
2021 |
|
2020 |
|
2019 |
|
Net asset value, beginning
of year |
|
$ |
12.10 |
|
|
$ |
19.20 |
|
|
$ |
14.59 |
|
|
$ |
12.02 |
|
|
$ |
13.93 |
|
|
Income from investment
operations: |
|
Net investment income
(loss)(a) |
|
|
0.04 |
|
|
|
0.05 |
|
|
|
(0.04 |
) |
|
|
(0.04 |
) |
|
|
0.02 |
|
|
Net realized and
unrealized gain (loss) |
|
|
1.13 |
|
|
|
(5.17 |
) |
|
|
5.71 |
|
|
|
3.50 |
|
|
|
0.82 |
|
|
Total from investment
operations |
|
|
1.17 |
|
|
|
(5.12 |
) |
|
|
5.67 |
|
|
|
3.46 |
|
|
|
0.84 |
|
|
|
Distributions: |
|
Dividends from net
investment income |
|
|
(0.02 |
) |
|
|
— |
|
|
|
— |
|
|
|
— |
|
|
|
— |
|
|
Dividends from net
realized gains |
|
|
(0.50 |
) |
|
|
(1.98 |
) |
|
|
(1.06 |
) |
|
|
(0.89 |
) |
|
|
(2.75 |
) |
|
|
Total distributions** |
|
|
(0.52 |
) |
|
|
(1.98 |
) |
|
|
(1.06 |
) |
|
|
(0.89 |
) |
|
|
(2.75 |
) |
|
|
Net asset value, end of year |
|
$ |
12.75 |
|
|
$ |
12.10 |
|
|
$ |
19.20 |
|
|
$ |
14.59 |
|
|
$ |
12.02 |
|
|
Ratios and supplemental
data: |
|
|
Total return(b) |
|
|
9.98 |
% |
|
|
(29.20 |
%) |
|
|
40.29 |
% |
|
|
30.46 |
% |
|
|
10.52 |
% |
|
Net assets, end of
year (000) |
|
$ |
66,181 |
|
|
$ |
51,538 |
|
|
$ |
103,256 |
|
|
$ |
65,062 |
|
|
$ |
52,619 |
|
|
Ratio of net expenses to
average net assets |
|
|
1.15 |
% |
|
|
1.15 |
% |
|
|
1.15 |
% |
|
|
1.15 |
% |
|
|
1.15 |
% |
|
Ratio of gross expenses to
average net assets prior
to expense reductions |
|
|
1.25 |
% |
|
|
1.36 |
% |
|
|
1.33 |
% |
|
|
1.40 |
% |
|
|
1.26 |
% |
|
Ratio of net investment
income (loss) to average
net assets |
|
|
0.28 |
% |
|
|
0.37 |
% |
|
|
(0.23 |
%) |
|
|
(0.34 |
%) |
|
|
0.14 |
% |
|
** Distribution for annual periods determined in accordance with federal income tax regulations.
(a) Net investment income (loss) allocated based on average shares method.
(b) Total return measures net investment income (loss) and capital gain or loss from portfolio investments assuming reinvestment of dividends and capital gains distributions. Total return is not annualized for periods that are less than a full year, does not reflect the effect of sales charge for Class A shares nor the contingent deferred sales charge for Class C shares and does not reflect the deduction of taxes that a shareholder would pay on fund distributions or the redemption of fund shares.
CALAMOS FAMILY OF FUNDS
210
Calamos Global Equity Fund
Selected data for a share outstanding throughout each period were as follows:
|
|
|
CLASS R6 |
|
|
|
|
Year Ended October 31, |
|
June 23, 2020•
through
October 31, |
|
|
|
|
2023 |
|
2022 |
|
2021 |
|
2020 |
|
Net asset value, beginning
of period |
|
$ |
12.11 |
|
|
$ |
19.21 |
|
|
$ |
14.59 |
|
|
$ |
13.19 |
|
|
Income from investment
operations: |
|
Net investment income
(loss)(a) |
|
|
0.05 |
|
|
|
(0.02 |
) |
|
|
(0.03 |
) |
|
|
(0.02 |
) |
|
Net realized and
unrealized gain (loss) |
|
|
1.13 |
|
|
|
(5.10 |
) |
|
|
5.71 |
|
|
|
1.42 |
|
|
Total from investment
operations |
|
|
1.18 |
|
|
|
(5.12 |
) |
|
|
5.68 |
|
|
|
1.40 |
|
|
|
Distributions: |
|
Dividends from net
investment income |
|
|
(0.03 |
) |
|
|
— |
|
|
|
— |
|
|
|
— |
|
|
Dividends from net
realized gains |
|
|
(0.50 |
) |
|
|
(1.98 |
) |
|
|
(1.06 |
) |
|
|
— |
|
|
|
Total distributions** |
|
|
(0.53 |
) |
|
|
(1.98 |
) |
|
|
(1.06 |
) |
|
|
— |
|
|
|
Net asset value, end of period |
|
$ |
12.76 |
|
|
$ |
12.11 |
|
|
$ |
19.21 |
|
|
$ |
14.59 |
|
|
Ratios and supplemental
data: |
|
|
Total return(b) |
|
|
10.04 |
% |
|
|
(29.18 |
%) |
|
|
40.36 |
% |
|
|
10.61 |
% |
|
Net assets, end of
year (000) |
|
$ |
93 |
|
|
$ |
11 |
|
|
$ |
168 |
|
|
$ |
120 |
|
|
Ratio of net expenses to
average net assets |
|
|
1.06 |
% |
|
|
1.12 |
% |
|
|
1.09 |
% |
|
|
1.09 |
%(c) |
|
Ratio of gross expenses to
average net assets prior
to expense reductions |
|
|
1.14 |
% |
|
|
1.35 |
% |
|
|
1.27 |
% |
|
|
1.36 |
%(c) |
|
Ratio of net investment
income (loss) to average
net assets |
|
|
0.35 |
% |
|
|
(0.12 |
%) |
|
|
(0.18 |
%) |
|
|
(0.45 |
%)(c) |
|
• Commencement of operations.
** Distribution for annual periods determined in accordance with federal income tax regulations.
(a) Net investment income (loss) allocated based on average shares method.
(b) Total return measures net investment income (loss) and capital gain or loss from portfolio investments assuming reinvestment of dividends and capital gains distributions. Total return is not annualized for periods that are less than a full year, does not reflect the effect of sales charge for Class A shares nor the contingent deferred sales charge for Class C shares and does not reflect the deduction of taxes that a shareholder would pay on fund distributions or the redemption of fund shares.
(c) Annualized.
PROSPECTUS | March 1, 2024
211
Calamos Global Opportunities Fund
FINANCIAL HIGHLIGHTS
Selected data for a share outstanding throughout each year were as follows:
|
|
|
CLASS A |
|
CLASS C |
|
|
|
|
Year Ended October 31, |
|
Year Ended October 31, |
|
|
|
|
2023 |
|
2022 |
|
2021 |
|
2020 |
|
2019 |
|
2023 |
|
2022 |
|
2021 |
|
2020 |
|
2019 |
|
Net asset value, beginning
of year |
|
$ |
9.15 |
|
|
$ |
12.72 |
|
|
$ |
10.02 |
|
|
$ |
8.51 |
|
|
$ |
8.99 |
|
|
$ |
7.73 |
|
|
$ |
10.92 |
|
|
$ |
8.71 |
|
|
$ |
7.45 |
|
|
$ |
7.98 |
|
|
Income from investment
operations: |
|
Net investment income
(loss)(a) |
|
|
0.00 |
|
|
|
(0.03 |
) |
|
|
(0.04 |
) |
|
|
0.07 |
|
|
|
0.10 |
|
|
|
(0.07 |
) |
|
|
(0.09 |
) |
|
|
(0.11 |
) |
|
|
0.00 |
|
|
|
0.04 |
|
|
Net realized and
unrealized gain (loss) |
|
|
0.46 |
|
|
|
(2.88 |
) |
|
|
3.42 |
|
|
|
1.55 |
|
|
|
0.37 |
|
|
|
0.40 |
|
|
|
(2.44 |
) |
|
|
2.95 |
|
|
|
1.35 |
|
|
|
0.31 |
|
|
Total from investment
operations |
|
|
0.46 |
|
|
|
(2.91 |
) |
|
|
3.38 |
|
|
|
1.62 |
|
|
|
0.47 |
|
|
|
0.33 |
|
|
|
(2.53 |
) |
|
|
2.84 |
|
|
|
1.35 |
|
|
|
0.35 |
|
|
|
Distributions: |
|
Dividends from net
investment income |
|
|
(0.04 |
) |
|
|
— |
|
|
|
(0.05 |
) |
|
|
(0.02 |
) |
|
|
(0.07 |
) |
|
|
(0.01 |
) |
|
|
— |
|
|
|
— |
|
|
|
— |
|
|
|
— |
|
|
Dividends from net
realized gains |
|
|
— |
|
|
|
(0.66 |
) |
|
|
(0.63 |
) |
|
|
(0.09 |
) |
|
|
(0.88 |
) |
|
|
— |
|
|
|
(0.66 |
) |
|
|
(0.63 |
) |
|
|
(0.09 |
) |
|
|
(0.88 |
) |
|
|
Total distributions** |
|
|
(0.04 |
) |
|
|
(0.66 |
) |
|
|
(0.68 |
) |
|
|
(0.11 |
) |
|
|
(0.95 |
) |
|
|
(0.01 |
) |
|
|
(0.66 |
) |
|
|
(0.63 |
) |
|
|
(0.09 |
) |
|
|
(0.88 |
) |
|
|
Net asset value, end of year |
|
$ |
9.57 |
|
|
$ |
9.15 |
|
|
$ |
12.72 |
|
|
$ |
10.02 |
|
|
$ |
8.51 |
|
|
$ |
8.05 |
|
|
$ |
7.73 |
|
|
$ |
10.92 |
|
|
$ |
8.71 |
|
|
$ |
7.45 |
|
|
Ratios and supplemental
data: |
|
|
Total return(b) |
|
|
4.97 |
% |
|
|
(23.93 |
%) |
|
|
34.84 |
% |
|
|
19.09 |
% |
|
|
6.67 |
% |
|
|
4.22 |
% |
|
|
(24.43 |
%) |
|
|
33.77 |
% |
|
|
18.22 |
% |
|
|
5.87 |
% |
|
Net assets, end of
year (000) |
|
$ |
81,821 |
|
|
$ |
86,403 |
|
|
$ |
119,261 |
|
|
$ |
88,618 |
|
|
$ |
83,069 |
|
|
$ |
7,317 |
|
|
$ |
7,528 |
|
|
$ |
10,032 |
|
|
$ |
8,946 |
|
|
$ |
14,742 |
|
|
Ratio of net expenses to
average net assets |
|
|
1.22 |
% |
|
|
1.22 |
% |
|
|
1.31 |
% |
|
|
1.53 |
% |
|
|
1.49 |
% |
|
|
1.97 |
% |
|
|
1.97 |
% |
|
|
2.07 |
% |
|
|
2.28 |
% |
|
|
2.28 |
% |
|
Ratio of gross expenses to
average net assets prior
to expense reductions |
|
|
1.49 |
% |
|
|
1.46 |
% |
|
|
1.45 |
% |
|
|
1.53 |
% |
|
|
1.49 |
% |
|
|
2.24 |
% |
|
|
2.21 |
% |
|
|
2.20 |
% |
|
|
2.28 |
% |
|
|
2.28 |
% |
|
Ratio of net investment
income (loss) to average
net assets |
|
|
(0.05 |
%) |
|
|
(0.28 |
%) |
|
|
(0.33 |
%) |
|
|
0.78 |
% |
|
|
1.20 |
% |
|
|
(0.80 |
%) |
|
|
(1.03 |
%) |
|
|
(1.09 |
%) |
|
|
0.01 |
% |
|
|
0.50 |
% |
|
|
|
|
Year Ended October 31, |
|
|
|
|
2023 |
|
2022 |
|
2021 |
|
2020 |
|
2019 |
|
|
Portfolio turnover rate |
|
|
81 |
% |
|
|
92 |
% |
|
|
82 |
% |
|
|
119 |
% |
|
|
69 |
% |
|
** Distribution for annual periods determined in accordance with federal income tax regulations.
(a) Net investment income (loss) allocated based on average shares method.
(b) Total return measures net investment income (loss) and capital gain or loss from portfolio investments assuming reinvestment of dividends and capital gains distributions. Total return is not annualized for periods that are less than a full year, does not reflect the effect of sales charge for Class A shares nor the contingent deferred sales charge for Class C shares and does not reflect the deduction of taxes that a shareholder would pay on fund distributions or the redemption of fund shares.
CALAMOS FAMILY OF FUNDS
212
Calamos Global Opportunities Fund
|
|
|
CLASS I |
|
|
|
|
Year Ended October 31, |
|
|
|
|
2023 |
|
2022 |
|
2021 |
|
2020 |
|
2019 |
|
Net asset value, beginning
of year |
|
$ |
9.53 |
|
|
$ |
13.18 |
|
|
$ |
10.36 |
|
|
$ |
8.79 |
|
|
$ |
9.25 |
|
|
Income from investment
operations: |
|
Net investment income
(loss)(a) |
|
|
0.02 |
|
|
|
(0.02 |
) |
|
|
(0.01 |
) |
|
|
0.09 |
|
|
|
0.13 |
|
|
Net realized and
unrealized gain (loss) |
|
|
0.48 |
|
|
|
(2.96 |
) |
|
|
3.54 |
|
|
|
1.60 |
|
|
|
0.38 |
|
|
Total from investment
operations |
|
|
0.50 |
|
|
|
(2.98 |
) |
|
|
3.53 |
|
|
|
1.69 |
|
|
|
0.51 |
|
|
|
Distributions: |
|
Dividends from net
investment income |
|
|
(0.05 |
) |
|
|
(0.01 |
) |
|
|
(0.08 |
) |
|
|
(0.03 |
) |
|
|
(0.09 |
) |
|
Dividends from net
realized gains |
|
|
— |
|
|
|
(0.66 |
) |
|
|
(0.63 |
) |
|
|
(0.09 |
) |
|
|
(0.88 |
) |
|
|
Total distributions** |
|
|
(0.05 |
) |
|
|
(0.67 |
) |
|
|
(0.71 |
) |
|
|
(0.12 |
) |
|
|
(0.97 |
) |
|
|
Net asset value, end of year |
|
$ |
9.98 |
|
|
$ |
9.53 |
|
|
$ |
13.18 |
|
|
$ |
10.36 |
|
|
$ |
8.79 |
|
|
Ratios and supplemental
data: |
|
|
Total return(b) |
|
|
5.21 |
% |
|
|
(23.66 |
%) |
|
|
35.16 |
% |
|
|
19.33 |
% |
|
|
6.95 |
% |
|
Net assets, end of
year (000) |
|
$ |
107,198 |
|
|
$ |
117,790 |
|
|
$ |
152,596 |
|
|
$ |
65,909 |
|
|
$ |
53,594 |
|
|
Ratio of net expenses to
average net assets |
|
|
0.97 |
% |
|
|
0.97 |
% |
|
|
1.04 |
% |
|
|
1.28 |
% |
|
|
1.25 |
% |
|
Ratio of gross expenses to
average net assets prior
to expense reductions |
|
|
1.24 |
% |
|
|
1.21 |
% |
|
|
1.20 |
% |
|
|
1.28 |
% |
|
|
1.25 |
% |
|
Ratio of net investment
income (loss) to average
net assets |
|
|
0.20 |
% |
|
|
(0.14 |
%) |
|
|
(0.09 |
%) |
|
|
1.01 |
% |
|
|
1.47 |
% |
|
** Distribution for annual periods determined in accordance with federal income tax regulations.
(a) Net investment income (loss) allocated based on average shares method.
(b) Total return measures net investment income (loss) and capital gain or loss from portfolio investments assuming reinvestment of dividends and capital gains distributions. Total return is not annualized for periods that are less than a full year, does not reflect the effect of sales charge for Class A shares nor the contingent deferred sales charge for Class C shares and does not reflect the deduction of taxes that a shareholder would pay on fund distributions or the redemption of fund shares.
PROSPECTUS | March 1, 2024
213
Calamos International Small Cap Growth Fund
FINANCIAL HIGHLIGHTS
Selected data for a share outstanding throughout each year were as follows:
|
|
|
CLASS A |
|
CLASS C |
|
|
|
|
Year Ended
October 31, |
|
March 31,
2022•
through
October 31, |
|
Year Ended
October 31, |
|
March 31,
2022•
through
October 31, |
|
|
|
|
2023 |
|
2022 |
|
2023 |
|
2022 |
|
Net asset value, beginning
of year |
|
$ |
7.65 |
|
|
$ |
10.00 |
|
|
$ |
7.62 |
|
|
$ |
10.00 |
|
|
Income from investment
operations: |
|
Net investment income
(loss)(a) |
|
|
0.00 |
* |
|
|
0.05 |
|
|
|
(0.07 |
) |
|
|
0.01 |
|
|
Net realized and
unrealized gain (loss) |
|
|
(0.06 |
) |
|
|
(2.40 |
) |
|
|
(0.05 |
) |
|
|
(2.39 |
) |
|
Total from investment
operations |
|
|
(0.06 |
) |
|
|
(2.35 |
) |
|
|
(0.12 |
) |
|
|
(2.38 |
) |
|
|
Distributions: |
|
Dividends from net
investment income |
|
|
(0.05 |
) |
|
|
— |
|
|
|
(0.04 |
) |
|
|
— |
|
|
Dividends from net
realized gains |
|
|
— |
|
|
|
— |
|
|
|
— |
|
|
|
— |
|
|
|
Total distributions** |
|
|
(0.05 |
) |
|
|
— |
|
|
|
(0.04 |
) |
|
|
— |
|
|
|
Net asset value, end of year |
|
$ |
7.54 |
|
|
$ |
7.65 |
|
|
$ |
7.46 |
|
|
$ |
7.62 |
|
|
Ratios and supplemental
data: |
|
|
Total return(b) |
|
|
(0.87 |
%) |
|
|
(23.50 |
%) |
|
|
(1.62 |
%) |
|
|
(23.80 |
%) |
|
Net assets, end of
year (000) |
|
$ |
20 |
|
|
$ |
13 |
|
|
$ |
7 |
|
|
$ |
8 |
|
|
Ratio of net expenses to
average net assets |
|
|
1.35 |
% |
|
|
2.66 |
%(c) |
|
|
2.09 |
% |
|
|
2.67 |
%(c) |
|
Ratio of gross expenses to
average net assets prior
to expense reductions |
|
|
9.06 |
% |
|
|
11.03 |
%(c) |
|
|
9.79 |
% |
|
|
11.03 |
%(c) |
|
Ratio of net investment
income (loss) to average
net assets |
|
|
(0.04 |
%) |
|
|
(9.66 |
%)(c) |
|
|
(0.92 |
%) |
|
|
(9.66 |
%)(c) |
|
|
|
|
Year Ended
October 31, |
|
March 31,
2022•
through
October 31, |
|
|
|
|
2023 |
|
2022 |
|
|
Portfolio turnover rate |
|
|
126 |
% |
|
|
64 |
%(d) |
|
• Commencement of operations.
* Amounts are less than $0.005.
** Distribution for annual periods determined in accordance with federal income tax regulations.
(a) Net investment income (loss) allocated based on average shares method.
(b) Total return measures net investment income (loss) and capital gain or loss from portfolio investments assuming reinvestment of dividends and capital gains distributions. Total return is not annualized for periods that are less than a full year, does not reflect the effect of sales charge for Class A shares nor the contingent deferred sales charge for Class C shares and does not reflect the deduction of taxes that a shareholder would pay on fund distributions or the redemption of fund shares.
(c) Annualized.
(d) Not annualized.
CALAMOS FAMILY OF FUNDS
214
Calamos International Small Cap Growth Fund
|
|
|
CLASS I |
|
CLASS R6 |
|
|
|
|
Year Ended
October 31, |
|
March 31,
2022•
through
October 31, |
|
Year Ended
October 31, |
|
March 31,
2022•
through
October 31, |
|
|
|
|
2023 |
|
2022 |
|
2023 |
|
2022 |
|
Net asset value, beginning
of year |
|
$ |
7.66 |
|
|
$ |
10.00 |
|
|
$ |
7.66 |
|
|
$ |
10.00 |
|
|
Income from investment
operations: |
|
Net investment income
(loss)(a) |
|
|
0.01 |
|
|
|
0.06 |
|
|
|
0.01 |
|
|
|
0.06 |
|
|
Net realized and
unrealized gain (loss) |
|
|
(0.05 |
) |
|
|
(2.40 |
) |
|
|
(0.05 |
) |
|
|
(2.40 |
) |
|
Total from investment
operations |
|
|
(0.04 |
) |
|
|
(2.34 |
) |
|
|
(0.04 |
) |
|
|
(2.34 |
) |
|
|
Distributions: |
|
Dividends from net
investment income |
|
|
(0.06 |
) |
|
|
— |
|
|
|
(0.06 |
) |
|
|
— |
|
|
Dividends from net
realized gains |
|
|
— |
|
|
|
— |
|
|
|
— |
|
|
|
— |
|
|
|
Total distributions** |
|
|
(0.06 |
) |
|
|
— |
|
|
|
(0.06 |
) |
|
|
— |
|
|
|
Net asset value, end of year |
|
$ |
7.56 |
|
|
$ |
7.66 |
|
|
$ |
7.56 |
|
|
$ |
7.66 |
|
|
Ratios and supplemental
data: |
|
|
Total return(b) |
|
|
(0.48 |
%) |
|
|
(23.40 |
%) |
|
|
(0.48 |
%) |
|
|
(23.40 |
%) |
|
Net assets, end of
year (000) |
|
$ |
2,327 |
|
|
$ |
1,740 |
|
|
$ |
8 |
|
|
$ |
8 |
|
|
Ratio of net expenses to
average net assets |
|
|
1.10 |
% |
|
|
2.67 |
%(c) |
|
|
1.07 |
% |
|
|
2.67 |
%(c) |
|
Ratio of gross expenses to
average net assets prior
to expense reductions |
|
|
8.80 |
% |
|
|
11.03 |
%(c) |
|
|
8.78 |
% |
|
|
11.03 |
%(c) |
|
Ratio of net investment
income (loss) to average
net assets |
|
|
0.17 |
% |
|
|
(9.66 |
%)(c) |
|
|
0.19 |
% |
|
|
(9.66 |
%)(c) |
|
• Commencement of operations.
** Distribution for annual periods determined in accordance with federal income tax regulations.
(a) Net investment income (loss) calculated based on average shares method.
(b) Total return measures net investment income (loss) and capital gain or loss from portfolio investments assuming reinvestment of dividends and capital gains distributions. Total return is not annualized for periods that are less than a full year, does not reflect the effect of sales charge for Class A shares nor the contingent deferred sales charge for Class C shares and does not reflect the deduction of taxes that a shareholder would pay on fund distributions or the redemption of fund shares.
(c) Annualized.
PROSPECTUS | March 1, 2024
215
Calamos Total Return Bond Fund
FINANCIAL HIGHLIGHTS
Selected data for a share outstanding throughout each year were as follows:
|
|
|
CLASS A |
|
CLASS C |
|
|
|
|
Year Ended October 31, |
|
Year Ended October 31, |
|
|
|
|
2023 |
|
2022 |
|
2021 |
|
2020 |
|
2019 |
|
2023 |
|
2022 |
|
2021 |
|
2020 |
|
2019 |
|
Net asset value, beginning
of year |
|
$ |
8.67 |
|
|
$ |
10.61 |
|
|
$ |
10.85 |
|
|
$ |
10.53 |
|
|
$ |
9.81 |
|
|
$ |
8.67 |
|
|
$ |
10.61 |
|
|
$ |
10.85 |
|
|
$ |
10.53 |
|
|
$ |
9.81 |
|
|
Income from investment
operations: |
|
Net investment income
(loss)(a) |
|
|
0.30 |
|
|
|
0.24 |
|
|
|
0.19 |
|
|
|
0.21 |
|
|
|
0.27 |
|
|
|
0.23 |
|
|
|
0.17 |
|
|
|
0.11 |
|
|
|
0.14 |
|
|
|
0.20 |
|
|
Net realized and
unrealized gain (loss) |
|
|
(0.27 |
) |
|
|
(1.81 |
) |
|
|
(0.19 |
) |
|
|
0.33 |
|
|
|
0.72 |
|
|
|
(0.27 |
) |
|
|
(1.81 |
) |
|
|
(0.19 |
) |
|
|
0.32 |
|
|
|
0.72 |
|
|
Total from investment
operations |
|
|
0.03 |
|
|
|
(1.57 |
) |
|
|
— |
|
|
|
0.54 |
|
|
|
0.99 |
|
|
|
(0.04 |
) |
|
|
(1.64 |
) |
|
|
(0.08 |
) |
|
|
0.46 |
|
|
|
0.92 |
|
|
|
Distributions: |
|
Dividends from net
investment income |
|
|
(0.32 |
) |
|
|
(0.24 |
) |
|
|
(0.23 |
) |
|
|
(0.22 |
) |
|
|
(0.27 |
) |
|
|
(0.25 |
) |
|
|
(0.17 |
) |
|
|
(0.15 |
) |
|
|
(0.14 |
) |
|
|
(0.20 |
) |
|
Dividends from net
realized gains |
|
|
— |
|
|
|
(0.13 |
) |
|
|
(0.01 |
) |
|
|
— |
|
|
|
— |
|
|
|
— |
|
|
|
(0.13 |
) |
|
|
(0.01 |
) |
|
|
— |
|
|
|
— |
|
|
|
Total distributions** |
|
|
(0.32 |
) |
|
|
(0.37 |
) |
|
|
(0.24 |
) |
|
|
(0.22 |
) |
|
|
(0.27 |
) |
|
|
(0.25 |
) |
|
|
(0.30 |
) |
|
|
(0.16 |
) |
|
|
(0.14 |
) |
|
|
(0.20 |
) |
|
|
Net asset value, end of year |
|
$ |
8.38 |
|
|
$ |
8.67 |
|
|
$ |
10.61 |
|
|
$ |
10.85 |
|
|
$ |
10.53 |
|
|
$ |
8.38 |
|
|
$ |
8.67 |
|
|
$ |
10.61 |
|
|
$ |
10.85 |
|
|
$ |
10.53 |
|
|
Ratios and supplemental
data: |
|
|
Total return(b) |
|
|
0.18 |
% |
|
|
(15.13 |
%) |
|
|
0.01 |
% |
|
|
5.18 |
% |
|
|
10.24 |
% |
|
|
(0.57 |
%) |
|
|
(15.76 |
%) |
|
|
(0.74 |
%) |
|
|
4.40 |
% |
|
|
9.42 |
% |
|
Net assets, end of
year (000) |
|
$ |
11,764 |
|
|
$ |
14,662 |
|
|
$ |
22,394 |
|
|
$ |
24,376 |
|
|
$ |
22,565 |
|
|
$ |
323 |
|
|
$ |
549 |
|
|
$ |
800 |
|
|
$ |
1,777 |
|
|
$ |
2,929 |
|
|
Ratio of net expenses to
average net assets |
|
|
0.90 |
% |
|
|
0.90 |
% |
|
|
0.90 |
% |
|
|
0.90 |
% |
|
|
0.90 |
% |
|
|
1.65 |
% |
|
|
1.65 |
% |
|
|
1.65 |
% |
|
|
1.65 |
% |
|
|
1.65 |
% |
|
Ratio of gross expenses to
average net assets prior
to expense reductions |
|
|
1.24 |
% |
|
|
1.15 |
% |
|
|
1.01 |
% |
|
|
1.03 |
% |
|
|
1.09 |
% |
|
|
1.99 |
% |
|
|
1.90 |
% |
|
|
1.76 |
% |
|
|
1.77 |
% |
|
|
1.84 |
% |
|
Ratio of net investment
income (loss) to average
net assets |
|
|
3.36 |
% |
|
|
2.48 |
% |
|
|
1.77 |
% |
|
|
2.00 |
% |
|
|
2.67 |
% |
|
|
2.60 |
% |
|
|
1.72 |
% |
|
|
1.02 |
% |
|
|
1.28 |
% |
|
|
1.98 |
% |
|
|
|
|
Year Ended October 31, |
|
|
|
|
2023 |
|
2022 |
|
2021 |
|
2020 |
|
2019 |
|
|
Portfolio turnover rate |
|
|
41 |
% |
|
|
28 |
% |
|
|
51 |
% |
|
|
61 |
% |
|
|
64 |
% |
|
** Distribution for annual periods determined in accordance with federal income tax regulations.
(a) Net investment income (loss) allocated based on average shares method.
(b) Total return measures net investment income (loss) and capital gain or loss from portfolio investments assuming reinvestment of dividends and capital gains distributions. Total return is not annualized for periods that are less than a full year, does not reflect the effect of sales charge for Class A shares nor the contingent deferred sales charge for Class C shares and does not reflect the deduction of taxes that a shareholder would pay on fund distributions or the redemption of fund shares.
CALAMOS FAMILY OF FUNDS
216
Calamos Total Return Bond Fund
|
|
|
CLASS I |
|
|
|
|
Year Ended October 31, |
|
|
|
|
2023 |
|
2022 |
|
2021 |
|
2020 |
|
2019 |
|
Net asset value, beginning
of year |
|
$ |
8.68 |
|
|
$ |
10.61 |
|
|
$ |
10.85 |
|
|
$ |
10.54 |
|
|
$ |
9.81 |
|
|
Income from investment
operations: |
|
Net investment income
(loss)(a) |
|
|
0.32 |
|
|
|
0.26 |
|
|
|
0.22 |
|
|
|
0.24 |
|
|
|
0.30 |
|
|
Net realized and
unrealized gain (loss) |
|
|
(0.27 |
) |
|
|
(1.79 |
) |
|
|
(0.20 |
) |
|
|
0.32 |
|
|
|
0.73 |
|
|
Total from investment
operations |
|
|
0.05 |
|
|
|
(1.53 |
) |
|
|
0.02 |
|
|
|
0.56 |
|
|
|
1.03 |
|
|
|
Distributions: |
|
Dividends from net
investment income |
|
|
(0.34 |
) |
|
|
(0.27 |
) |
|
|
(0.25 |
) |
|
|
(0.25 |
) |
|
|
(0.30 |
) |
|
Dividends from net
realized gains |
|
|
— |
|
|
|
(0.13 |
) |
|
|
(0.01 |
) |
|
|
— |
|
|
|
— |
|
|
|
Total distributions** |
|
|
(0.34 |
) |
|
|
(0.40 |
) |
|
|
(0.26 |
) |
|
|
(0.25 |
) |
|
|
(0.30 |
) |
|
|
Net asset value, end of year |
|
$ |
8.39 |
|
|
$ |
8.68 |
|
|
$ |
10.61 |
|
|
$ |
10.85 |
|
|
$ |
10.54 |
|
|
Ratios and supplemental
data: |
|
|
Total return(b) |
|
|
0.55 |
% |
|
|
(14.92 |
%) |
|
|
0.17 |
% |
|
|
5.34 |
% |
|
|
10.62 |
% |
|
Net assets, end of
year (000) |
|
$ |
19,236 |
|
|
$ |
18,622 |
|
|
$ |
43,979 |
|
|
$ |
60,602 |
|
|
$ |
35,570 |
|
|
Ratio of net expenses to
average net assets |
|
|
0.65 |
% |
|
|
0.65 |
% |
|
|
0.65 |
% |
|
|
0.65 |
% |
|
|
0.65 |
% |
|
Ratio of gross expenses to
average net assets prior
to expense reductions |
|
|
0.99 |
% |
|
|
0.88 |
% |
|
|
0.76 |
% |
|
|
0.77 |
% |
|
|
0.84 |
% |
|
Ratio of net investment
income (loss) to average
net assets |
|
|
3.61 |
% |
|
|
2.65 |
% |
|
|
2.02 |
% |
|
|
2.21 |
% |
|
|
2.92 |
% |
|
** Distribution for annual periods determined in accordance with federal income tax regulations.
(a) Net investment income (loss) allocated based on average shares method.
(b) Total return measures net investment income (loss) and capital gain or loss from portfolio investments assuming reinvestment of dividends and capital gains distributions. Total return is not annualized for periods that are less than a full year, does not reflect the effect of sales charge for Class A shares nor the contingent deferred sales charge for Class C shares and does not reflect the deduction of taxes that a shareholder would pay on fund distributions or the redemption of fund shares.
PROSPECTUS | March 1, 2024
217
Calamos High Income Opportunities Fund
FINANCIAL HIGHLIGHTS
Selected data for a share outstanding throughout each year were as follows:
|
|
|
CLASS A |
|
CLASS C |
|
|
|
|
Year Ended October 31, |
|
Year Ended October 31, |
|
|
|
|
2023 |
|
2022 |
|
2021 |
|
2020 |
|
2019 |
|
2023 |
|
2022 |
|
2021 |
|
2020 |
|
2019 |
|
Net asset value, beginning
of year |
|
$ |
7.30 |
|
|
$ |
8.58 |
|
|
$ |
7.96 |
|
|
$ |
8.34 |
|
|
$ |
8.37 |
|
|
$ |
7.80 |
|
|
$ |
9.14 |
|
|
$ |
8.45 |
|
|
$ |
8.82 |
|
|
$ |
8.82 |
|
|
Income from investment
operations: |
|
Net investment income
(loss)(a) |
|
|
0.45 |
|
|
|
0.37 |
|
|
|
0.35 |
|
|
|
0.43 |
|
|
|
0.48 |
|
|
|
0.43 |
|
|
|
0.33 |
|
|
|
0.31 |
|
|
|
0.40 |
|
|
|
0.45 |
|
|
Net realized and
unrealized gain (loss) |
|
|
(0.07 |
) |
|
|
(1.27 |
) |
|
|
0.66 |
|
|
|
(0.35 |
) |
|
|
(0.01 |
) |
|
|
(0.09 |
) |
|
|
(1.35 |
) |
|
|
0.71 |
|
|
|
(0.38 |
) |
|
|
(0.02 |
) |
|
Total from investment
operations |
|
|
0.38 |
|
|
|
(0.90 |
) |
|
|
1.01 |
|
|
|
0.08 |
|
|
|
0.47 |
|
|
|
0.34 |
|
|
|
(1.02 |
) |
|
|
1.02 |
|
|
|
0.02 |
|
|
|
0.43 |
|
|
|
Distributions: |
|
Dividends from net
investment income |
|
|
(0.46 |
) |
|
|
(0.38 |
) |
|
|
(0.27 |
) |
|
|
(0.46 |
) |
|
|
(0.50 |
) |
|
|
(0.40 |
) |
|
|
(0.32 |
) |
|
|
(0.21 |
) |
|
|
(0.39 |
) |
|
|
(0.43 |
) |
|
Dividends from net
realized gains |
|
|
— |
|
|
|
— |
|
|
|
— |
|
|
|
— |
|
|
|
— |
|
|
|
— |
|
|
|
— |
|
|
|
— |
|
|
|
— |
|
|
|
— |
|
|
|
Return of capital |
|
|
— |
|
|
|
— |
|
|
|
(0.12 |
) |
|
|
— |
|
|
|
— |
|
|
|
— |
|
|
|
— |
|
|
|
(0.12 |
) |
|
|
— |
|
|
|
— |
|
|
|
Total distributions** |
|
|
(0.46 |
) |
|
|
(0.38 |
) |
|
|
(0.39 |
) |
|
|
(0.46 |
) |
|
|
(0.50 |
) |
|
|
(0.40 |
) |
|
|
(0.32 |
) |
|
|
(0.33 |
) |
|
|
(0.39 |
) |
|
|
(0.43 |
) |
|
|
Net asset value, end of year |
|
$ |
7.22 |
|
|
$ |
7.30 |
|
|
$ |
8.58 |
|
|
$ |
7.96 |
|
|
$ |
8.34 |
|
|
$ |
7.74 |
|
|
$ |
7.80 |
|
|
$ |
9.14 |
|
|
$ |
8.45 |
|
|
$ |
8.82 |
|
|
Ratios and supplemental
data: |
|
|
Total return(b) |
|
|
5.22 |
% |
|
|
(10.67 |
%) |
|
|
12.88 |
% |
|
|
1.13 |
% |
|
|
5.85 |
% |
|
|
4.35 |
% |
|
|
(11.35 |
%) |
|
|
12.11 |
% |
|
|
0.38 |
% |
|
|
5.04 |
% |
|
Net assets, end of
year (000) |
|
$ |
25,252 |
|
|
$ |
26,775 |
|
|
$ |
34,550 |
|
|
$ |
30,580 |
|
|
$ |
35,124 |
|
|
$ |
438 |
|
|
$ |
471 |
|
|
$ |
677 |
|
|
$ |
981 |
|
|
$ |
1,887 |
|
|
Ratio of net expenses to
average net assets |
|
|
1.00 |
% |
|
|
1.00 |
% |
|
|
1.00 |
% |
|
|
1.00 |
% |
|
|
1.00 |
% |
|
|
1.75 |
% |
|
|
1.75 |
% |
|
|
1.75 |
% |
|
|
1.75 |
% |
|
|
1.75 |
% |
|
Ratio of gross expenses to
average net assets prior
to expense reductions |
|
|
1.43 |
% |
|
|
1.40 |
% |
|
|
1.33 |
% |
|
|
1.37 |
% |
|
|
1.23 |
% |
|
|
2.18 |
% |
|
|
2.15 |
% |
|
|
2.08 |
% |
|
|
2.11 |
% |
|
|
2.08 |
% |
|
Ratio of net investment
income (loss) to average
net assets |
|
|
6.12 |
% |
|
|
4.71 |
% |
|
|
4.10 |
% |
|
|
5.34 |
% |
|
|
5.71 |
% |
|
|
5.37 |
% |
|
|
3.95 |
% |
|
|
3.38 |
% |
|
|
4.67 |
% |
|
|
5.16 |
% |
|
|
|
|
Year Ended October 31, |
|
|
|
|
2023 |
|
2022 |
|
2021 |
|
2020 |
|
2019 |
|
|
Portfolio turnover rate |
|
|
25 |
% |
|
|
30 |
% |
|
|
49 |
% |
|
|
52 |
% |
|
|
46 |
% |
|
** Distribution for annual periods determined in accordance with federal income tax regulations.
(a) Net investment income (loss) allocated based on average shares method.
(b) Total return measures net investment income (loss) and capital gain or loss from portfolio investments assuming reinvestment of dividends and capital gains distributions. Total return is not annualized for periods that are less than a full year, does not reflect the effect of sales charge for Class A shares nor the contingent deferred sales charge for Class C shares and does not reflect the deduction of taxes that a shareholder would pay on fund distributions or the redemption of fund shares.
CALAMOS FAMILY OF FUNDS
218
Calamos High Income Opportunities Fund
|
|
|
CLASS I |
|
|
|
|
Year Ended October 31, |
|
|
|
|
2023 |
|
2022 |
|
2021 |
|
2020 |
|
2019 |
|
Net asset value, beginning
of year |
|
$ |
7.30 |
|
|
$ |
8.58 |
|
|
$ |
7.96 |
|
|
$ |
8.34 |
|
|
$ |
8.37 |
|
|
Income from investment
operations: |
|
Net investment income
(loss)(a) |
|
|
0.47 |
|
|
|
0.39 |
|
|
|
0.37 |
|
|
|
0.44 |
|
|
|
0.50 |
|
|
Net realized and
unrealized gain (loss) |
|
|
(0.07 |
) |
|
|
(1.27 |
) |
|
|
0.67 |
|
|
|
(0.34 |
) |
|
|
(0.01 |
) |
|
Total from investment
operations |
|
|
0.40 |
|
|
|
(0.88 |
) |
|
|
1.04 |
|
|
|
0.10 |
|
|
|
0.49 |
|
|
|
Distributions: |
|
Dividends from net
investment income |
|
|
(0.48 |
) |
|
|
(0.40 |
) |
|
|
(0.30 |
) |
|
|
(0.48 |
) |
|
|
(0.52 |
) |
|
Dividends from net
realized gains |
|
|
— |
|
|
|
— |
|
|
|
— |
|
|
|
— |
|
|
|
— |
|
|
|
Return of capital |
|
|
— |
|
|
|
— |
|
|
|
(0.12 |
) |
|
|
— |
|
|
|
— |
|
|
|
Total distributions** |
|
|
(0.48 |
) |
|
|
(0.40 |
) |
|
|
(0.42 |
) |
|
|
(0.48 |
) |
|
|
(0.52 |
) |
|
|
Net asset value, end of year |
|
$ |
7.22 |
|
|
$ |
7.30 |
|
|
$ |
8.58 |
|
|
$ |
7.96 |
|
|
$ |
8.34 |
|
|
Ratios and supplemental
data: |
|
|
Total return(b) |
|
|
5.48 |
% |
|
|
(10.45 |
%) |
|
|
13.16 |
% |
|
|
1.38 |
% |
|
|
6.11 |
% |
|
Net assets, end of
year (000) |
|
$ |
7,786 |
|
|
$ |
9,150 |
|
|
$ |
9,267 |
|
|
$ |
6,716 |
|
|
$ |
7,003 |
|
|
Ratio of net expenses to
average net assets |
|
|
0.75 |
% |
|
|
0.75 |
% |
|
|
0.75 |
% |
|
|
0.75 |
% |
|
|
0.75 |
% |
|
Ratio of gross expenses to
average net assets prior
to expense reductions |
|
|
1.18 |
% |
|
|
1.15 |
% |
|
|
1.08 |
% |
|
|
1.12 |
% |
|
|
0.99 |
% |
|
Ratio of net investment
income (loss) to average
net assets |
|
|
6.36 |
% |
|
|
4.98 |
% |
|
|
4.34 |
% |
|
|
5.56 |
% |
|
|
5.97 |
% |
|
** Distribution for annual periods determined in accordance with federal income tax regulations.
(a) Net investment income (loss) allocated based on average shares method.
(b) Total return measures net investment income (loss) and capital gain or loss from portfolio investments assuming reinvestment of dividends and capital gains distributions. Total return is not annualized for periods that are less than a full year, does not reflect the effect of sales charge for Class A shares nor the contingent deferred sales charge for Class C shares and does not reflect the deduction of taxes that a shareholder would pay on fund distributions or the redemption of fund shares.
PROSPECTUS | March 1, 2024
219
Calamos Short-Term Bond Fund
FINANCIAL HIGHLIGHTS
Selected data for a share outstanding throughout each year were as follows:
|
|
|
CLASS A |
|
CLASS I |
|
|
|
|
Year Ended October 31, |
|
Year Ended October 31, |
|
|
|
|
2023 |
|
2022 |
|
2021 |
|
2020 |
|
2019 |
|
2023 |
|
2022 |
|
2021 |
|
2020 |
|
2019 |
|
Net asset value, beginning
of year |
|
$ |
9.28 |
|
|
$ |
9.91 |
|
|
$ |
10.23 |
|
|
$ |
10.20 |
|
|
$ |
9.98 |
|
|
$ |
9.28 |
|
|
$ |
9.91 |
|
|
$ |
10.23 |
|
|
$ |
10.20 |
|
|
$ |
9.98 |
|
|
Income from investment
operations: |
|
Net investment income
(loss)(a) |
|
|
0.28 |
|
|
|
0.13 |
|
|
|
0.15 |
|
|
|
0.21 |
|
|
|
0.25 |
|
|
|
0.30 |
|
|
|
0.15 |
|
|
|
0.17 |
|
|
|
0.25 |
|
|
|
0.28 |
|
|
Net realized and
unrealized gain (loss) |
|
|
0.07 |
|
|
|
(0.62 |
) |
|
|
(0.07 |
) |
|
|
0.12 |
|
|
|
0.23 |
|
|
|
0.06 |
|
|
|
(0.62 |
) |
|
|
(0.06 |
) |
|
|
0.10 |
|
|
|
0.22 |
|
|
Total from investment
operations |
|
|
0.35 |
|
|
|
(0.49 |
) |
|
|
0.08 |
|
|
|
0.33 |
|
|
|
0.48 |
|
|
|
0.36 |
|
|
|
(0.47 |
) |
|
|
0.11 |
|
|
|
0.35 |
|
|
|
0.50 |
|
|
|
Distributions: |
|
Dividends from net
investment income |
|
|
(0.33 |
) |
|
|
(0.14 |
) |
|
|
(0.31 |
) |
|
|
(0.25 |
) |
|
|
(0.26 |
) |
|
|
(0.35 |
) |
|
|
(0.16 |
) |
|
|
(0.34 |
) |
|
|
(0.27 |
) |
|
|
(0.28 |
) |
|
Dividends from net
realized gains |
|
|
— |
|
|
|
— |
|
|
|
(0.09 |
) |
|
|
(0.05 |
) |
|
|
(0.00 |
)* |
|
|
— |
|
|
|
— |
|
|
|
(0.09 |
) |
|
|
(0.05 |
) |
|
|
(0.00 |
)* |
|
|
Total distributions** |
|
|
(0.33 |
) |
|
|
(0.14 |
) |
|
|
(0.40 |
) |
|
|
(0.30 |
) |
|
|
(0.26 |
) |
|
|
(0.35 |
) |
|
|
(0.16 |
) |
|
|
(0.43 |
) |
|
|
(0.32 |
) |
|
|
(0.28 |
) |
|
|
Net asset value, end of year |
|
$ |
9.30 |
|
|
$ |
9.28 |
|
|
$ |
9.91 |
|
|
$ |
10.23 |
|
|
$ |
10.20 |
|
|
$ |
9.29 |
|
|
$ |
9.28 |
|
|
$ |
9.91 |
|
|
$ |
10.23 |
|
|
$ |
10.20 |
|
|
Ratios and supplemental
data: |
|
|
Total return(b) |
|
|
3.79 |
% |
|
|
(4.99 |
%) |
|
|
0.85 |
% |
|
|
3.24 |
% |
|
|
4.84 |
% |
|
|
3.93 |
% |
|
|
(4.77 |
%) |
|
|
1.11 |
% |
|
|
3.49 |
% |
|
|
5.09 |
% |
|
Net assets, end of
year (000) |
|
$ |
3,523 |
|
|
$ |
2,128 |
|
|
$ |
2,661 |
|
|
$ |
3,225 |
|
|
$ |
601 |
|
|
$ |
354,109 |
|
|
$ |
356,908 |
|
|
$ |
306,398 |
|
|
$ |
176,439 |
|
|
$ |
217,552 |
|
|
Ratio of net expenses to
average net assets |
|
|
0.63 |
% |
|
|
0.63 |
% |
|
|
0.65 |
% |
|
|
0.65 |
% |
|
|
0.65 |
% |
|
|
0.39 |
% |
|
|
0.38 |
% |
|
|
0.40 |
% |
|
|
0.40 |
% |
|
|
0.40 |
% |
|
Ratio of gross expenses to
average net assets prior
to expense reductions |
|
|
0.63 |
% |
|
|
0.63 |
% |
|
|
0.65 |
% |
|
|
0.68 |
% |
|
|
0.74 |
% |
|
|
0.39 |
% |
|
|
0.38 |
% |
|
|
0.40 |
% |
|
|
0.42 |
% |
|
|
0.47 |
% |
|
Ratio of net investment
income (loss) to average
net assets |
|
|
2.94 |
% |
|
|
1.36 |
% |
|
|
1.51 |
% |
|
|
2.12 |
% |
|
|
2.47 |
% |
|
|
3.17 |
% |
|
|
1.58 |
% |
|
|
1.73 |
% |
|
|
2.44 |
% |
|
|
2.73 |
% |
|
|
|
|
Year Ended October 31, |
|
|
|
|
2023 |
|
2022 |
|
2021 |
|
2020 |
|
2019 |
|
|
Portfolio turnover rate |
|
|
41 |
% |
|
|
48 |
% |
|
|
44 |
% |
|
|
41 |
% |
|
|
132 |
% |
|
* Amounts are less than $0.005.
** Distribution for annual periods determined in accordance with federal income tax regulations.
(a) Net investment income (loss) allocated based on average shares method.
(b) Total return measures net investment income (loss) and capital gain or loss from portfolio investments assuming reinvestment of dividends and capital gains distributions. Total return is not annualized for periods that are less than a full year, does not reflect the effect of sales charge for Class A shares nor the contingent deferred sales charge for Class C shares and does not reflect the deduction of taxes that a shareholder would pay on fund distributions or the redemption of fund shares.
CALAMOS FAMILY OF FUNDS
220
Appendix
Ameriprise Prospectus Disclosure
Class A Shares Front-End Sales Charge Waivers Available at Ameriprise Financial:
The following information applies to Class A shares purchases if you have an account with or otherwise purchase Fund shares through Ameriprise Financial:
Shareholders purchasing Fund shares through an Ameriprise Financial brokerage account are eligible for the following front-end sales charge waivers, which may differ from those disclosed elsewhere in this Fund's prospectus or SAI:
• Employer-sponsored retirement plans (e.g., 401(k) plans, 457 plans, employer-sponsored 403(b) plans, profit sharing and money purchase pension plans and defined benefit plans). For purposes of this provision, employer-sponsored retirement plans do not include SEP IRAs, Simple IRAs or SAR-SEPs.
• Shares purchased through reinvestment of capital gains distributions and dividend reinvestment when purchasing shares of the same Fund (but not any other fund within the same fund family).
• Shares exchanged from Class C shares of the same fund in the month of or following the 7-year anniversary of the purchase date. To the extent that this prospectus elsewhere provides for a waiver with respect to exchanges of Class C shares or conversions of Class C shares following a shorter holding period, that waiver will apply.
• Employees and registered representatives of Ameriprise Financial or its affiliates and their immediate family members.
• Shares purchased by or through qualified accounts (including IRAs, Coverdell Education Savings Accounts, 401(k)s, 403(b) TSCAs subject to ERISA and defined benefit plans) that are held by a covered family member, defined as an Ameriprise financial advisor and/or the advisor's spouse, advisor's lineal ascendant (mother, father, grandmother, grandfather, great grandmother, great grandfather), advisor's lineal descendant (son, step-son, daughter, step-daughter, grandson, granddaughter, great grandson, great granddaughter) or any spouse of a covered family member who is a lineal descendant.
• Shares purchased from the proceeds of redemptions within the same fund family, provided (1) the repurchase occurs within 90 days following the redemption, (2) the redemption and purchase occur in the same account, and (3) redeemed shares were subject to a front-end or deferred sales load (i.e. Rights of Reinstatement).
Janney Prospectus Disclosure
If you purchase fund shares through a Janney Montgomery Scott LLC ("Janney") brokerage account, you will be eligible for the following load waivers (front-end sales charge waivers and contingent deferred sales charge ("CDSC"), or back-end sales charge, waivers) and discounts, which may differ from those disclosed elsewhere in this fund's Prospectus or SAI.
Front-end sales charge* waivers on Class A shares available at Janney
• Shares purchased through reinvestment of capital gains distributions and dividend reinvestment when purchasing shares of the same fund (but not any other fund within the fund family).
• Shares purchased by employees and registered representatives of Janney or its affiliates and their family members as designated by Janney.
• Shares purchased from the proceeds of redemptions within the same fund family, provided (1) the repurchase occurs within ninety (90) days following the redemption, (2) the redemption and purchase occur in the same account, and (3) redeemed shares were subject to a front-end or deferred sales load (i.e., right of reinstatement).
• Employer-sponsored retirement plans (e.g., 401(k) plans, 457 plans, employer-sponsored 403(b) plans, profit sharing and money purchase pension plans and defined benefit plans). For purposes of this provision, employer-sponsored retirement plans do not include SEP IRAs, Simple IRAs, SAR-SEPs or Keogh plans.
• Shares acquired through a right of reinstatement.
• Class C shares that are no longer subject to a contingent deferred sales charge and are converted to Class A shares of the same fund pursuant to Janney's policies and procedures.
CDSC waivers on Class A and C shares available at Janney
• Shares sold upon the death or disability of the shareholder.
• Shares sold as part of a systematic withdrawal plan as described in the fund's Prospectus.
• Shares purchased in connection with a return of excess contributions from an IRA account.
• Shares sold as part of a required minimum distribution for IRA and other retirement accounts if the redemption is taken in or after the year the shareholder reaches qualified age based on applicable IRS regulations.
• Shares sold to pay Janney fees but only if the transaction is initiated by Janney.
• Shares acquired through a right of reinstatement.
• Shares exchanged into the same share class of a different fund.
Front-end sales charge* discounts available at Janney: breakpoints, rights of accumulation, and/or letters of intent
• Breakpoints as described in the fund's Prospectus.
• Rights of accumulation ("ROA"), which entitle shareholders to breakpoint discounts, will be automatically calculated based on the aggregated holding of fund family assets held by accounts within the purchaser's household at Janney. Eligible fund family assets not held at Janney may be included in the ROA calculation only if the shareholder notifies his or her financial advisor about such assets.
• Letters of intent which allow for breakpoint discounts based on anticipated purchases within a fund family, over a 13-month time period. Eligible fund family assets not held at Janney Montgomery Scott may be included in the calculation of letters of intent only if the shareholder notifies his or her financial advisor about such assets.
* Also referred to as an "initial sales charge."
J.P. Morgan Securities LLC Prospectus Disclosure
If you purchase or hold fund shares through an applicable J.P. Morgan Securities LLC brokerage account, you will be eligible for the following sales charge waivers (front-end sales charge waivers and contingent deferred sales charge ("CDSC"), or back-end sales charge, waivers), share class conversion policy and discounts, which may differ from those disclosed elsewhere in this fund's prospectus or Statement of Additional Information.
Front-end sales charge waivers on Class A shares available at J.P. Morgan Securities LLC
• Shares exchanged from Class C (i.e. level-load) shares that are no longer subject to a CDSC and are exchanged into Class A shares of the same fund pursuant to J.P. Morgan Securities LLC's share class exchange policy.
• Qualified employer-sponsored defined contribution and defined benefit retirement plans, nonqualified deferred compensation plans, other employee benefit plans and trusts used to fund those plans. For purposes of this provision, such plans do not include SEP IRAs, SIMPLE IRAs, SAR-SEPs or 501(c)(3) accounts.
• Shares of funds purchased through J.P. Morgan Securities LLC Self-Directed Investing accounts.
• Shares purchased through rights of reinstatement.
• Shares purchased through reinvestment of capital gains distributions and dividend reinvestment when purchasing shares of the same fund (but not any other fund within the fund family).
• Shares purchased by employees and registered representatives of J.P. Morgan Securities LLC or its affiliates and their spouse or financial dependent as defined by J.P. Morgan Securities LLC.
Class C to Class A share conversion
• A shareholder in the fund's Class C shares will have their shares converted to Class A shares (or the appropriate share class) of the same fund if the shares are no longer subject to a CDSC and the conversion is consistent with J.P. Morgan Securities LLC's policies and procedures.
CDSC waivers on Class A and C shares available at J.P. Morgan Securities LLC
• Shares sold upon the death or disability of the shareholder.
• Shares sold as part of a systematic withdrawal plan as described in the fund's prospectus.
• Shares purchased in connection with a return of excess contributions from an IRA account.
• Shares sold as part of a required minimum distribution for IRA and retirement accounts pursuant to the Internal Revenue Code.
• Shares acquired through a right of reinstatement.
Front-end load discounts available at J.P. Morgan Securities LLC: breakpoints, rights of accumulation & letters of intent
• Breakpoints as described in the prospectus.
• Rights of Accumulation ("ROA") which entitle shareholders to breakpoint discounts as described in the fund's prospectus will be automatically calculated based on the aggregated holding of fund family assets held by accounts within the purchaser's household at J.P. Morgan Securities LLC. Eligible fund family assets not held at J.P. Morgan Securities LLC (including 529 program holdings, where applicable) may be included in the ROA calculation only if the shareholder notifies their financial advisor about such assets.
• Letters of Intent ("LOI") which allow for breakpoint discounts based on anticipated purchases within a fund family, through J.P. Morgan Securities LLC, over a 13-month period of time (if applicable).
Merrill Lynch Prospectus Disclosure
Purchases or sales of front-end (i.e. Class A) or level-load (i.e., Class C) mutual fund shares through a Merrill platform or account will be eligible only for the following sales load waivers (front-end, contingent deferred, or back-end waivers) and discounts, which differ from those disclosed elsewhere in this Fund's prospectus. Purchasers will have to buy mutual fund shares directly from the mutual fund company or through another intermediary to be eligible for waivers or discounts not listed below.
It is the client's responsibility to notify Merrill at the time of purchase or sale of any relationship or other facts that qualify the transaction for a waiver or discount. A Merrill representative may ask for reasonable documentation of such facts and Merrill may condition the granting of a waiver or discount on the timely receipt of such documentation.
Additional information on waivers and discounts is available in the Merrill Sales Load Waiver and Discounts Supplement (the "Merrill SLWD Supplement") and in the Mutual Fund Investing at Merrill pamphlet at ml.com/funds. Clients are encouraged to review these documents and speak with their financial advisor to determine whether a transaction is eligible for a waiver or discount.
|
Front-end Load Waivers Available at Merrill |
|
Shares of mutual funds available for purchase by employer-sponsored retirement, deferred compensation, and employee benefit plans (including health savings accounts) and trusts used to fund those plans provided the shares are not held in a commission-based brokerage account and shares are held for the benefit of the plan. For purposes of this provision, employer-sponsored retirement plans do not include SEP IRAs, Simple IRAs, SAR-SEPs or Keogh plans
Shares purchased through a Merrill investment advisory program
Brokerage class shares exchanged from advisory class shares due to the holdings moving from a Merrill investment advisory program to a Merrill brokerage account
Shares purchased through the Merrill Edge Self-Directed platform
Shares purchased through the systematic reinvestment of capital gains distributions and dividend reinvestment when purchasing shares of the same mutual fund in the same account
Shares exchanged from level-load shares to front-end load shares of the same mutual fund in accordance with the description in the Merrill SLWD Supplement
Shares purchased by eligible employees of Merrill or its affiliates and their family members who purchase shares in accounts within the employee's Merrill Household (as defined in the Merrill SLWD Supplement)
Shares purchased by eligible persons associated with the fund as defined in this prospectus (e.g. the fund's officers or trustees)
Shares purchased from the proceeds of a mutual fund redemption in front-end load shares provided (1) the repurchase is in a mutual fund within the same fund family; (2) the repurchase occurs within 90 calendar days from the redemption trade date, and (3) the redemption and purchase occur in the same account (known as Rights of Reinstatement). Automated transactions (i.e. systematic purchases and withdrawals) and purchases made after shares are automatically sold to pay Merrill's account maintenance fees are not eligible for Rights of Reinstatement
|
Contingent Deferred Sales Charge ("CDSC") Waivers on Front-end, Back-end, and Level Load Shares Available at Merrill |
|
Shares sold due to the client's death or disability (as defined by Internal Revenue Code Section 22e(3))
Shares sold pursuant to a systematic withdrawal program subject to Merrill's maximum systematic withdrawal limits as described in the Merrill SLWD Supplement
Shares sold due to return of excess contributions from an IRA account
Shares sold as part of a required minimum distribution for IRA and retirement accounts due to the investor reaching the qualified age based on applicable IRS regulation
Front-end or level-load shares held in commission-based, non-taxable retirement brokerage accounts (e.g. traditional, Roth, rollover, SEP IRAs, Simple IRAs, SAR-SEPs or Keogh plans) that are transferred to fee-based accounts or platforms and exchanged for a lower cost share class of the same mutual fund
Front-end Load Discounts Available at Merrill:
Breakpoints, Rights of Accumulation & Letters of Intent |
|
Breakpoint discounts, as described in this prospectus, where the sales load is at or below the maximum sales load that Merrill permits to be assessed to a front-end load purchase, as described in the Merrill SLWD Supplement
Rights of Accumulation (ROA), as described in the Merrill SLWD Supplement, which entitle clients to breakpoint discounts based on the aggregated holdings of mutual fund family assets held in accounts in their Merrill Household
Letters of Intent (LOI), which allow for breakpoint discounts on eligible new purchases based on anticipated future eligible purchases within a fund family at Merrill, in accounts within your Merrill Household, as further described in the Merrill SLWD Supplement
Morgan Stanley Prospectus Disclosure
Shareholders purchasing Fund shares through a Morgan Stanley Wealth Management transactional brokerage account will be eligible only for the following front-end sales charge waivers with respect to Class A shares, which may differ from and may be more limited than those disclosed elsewhere in this Fund's Prospectus or SAI.
Front-end Sales Charge Waivers on Class A Shares available at Morgan Stanley Wealth Management
• Employer-sponsored retirement plans (e.g., 401(k) plans, 457 plans, employer-sponsored 403(b) plans, profit sharing and money purchase pension plans and defined benefit plans). For purposes of this provision, employer-sponsored retirement plans do not include SEP IRAs, Simple IRAs, SAR-SEPs or Keogh plans
• Morgan Stanley employee and employee-related accounts according to Morgan Stanley's account linking rules
• Shares purchased through reinvestment of dividends and capital gains distributions when purchasing shares of the same fund
• Shares purchased through a Morgan Stanley self-directed brokerage account
• Class C (i.e., level-load) shares that are no longer subject to a contingent deferred sales charge and are converted to Class A shares of the same fund pursuant to Morgan Stanley Wealth Management's share class conversion program
• Shares purchased from the proceeds of redemptions within the same fund family, provided (i) the repurchase occurs within 90 days following the redemption, (ii) the redemption and purchase occur in the same account, and (iii) redeemed shares were subject to a front-end or deferred sales charge.
Oppenheimer Prospectus Disclosure
Shareholders purchasing Fund shares through an OPCO platform or account are eligible only for the following load waivers (front-end sales charge waivers and contingent deferred, or back- end, sales charge waivers) and discounts, which may differ from those disclosed elsewhere in this Fund's prospectus or SAI.
Front-end sales load waivers on class A shares available at OPCO
• Employer-sponsored retirement, deferred compensation and employee benefit plans (including health savings accounts) and trusts used to fund those plans, provided that the shares are not held in a commission-based brokerage account and shares are held for the benefit of the plan
• Shares purchased by or through a 529 Plan
• Shares purchased through a OPCO affiliated investment advisory program
• Shares purchased through reinvestment of capital gains distributions and dividend reinvestment when purchasing shares of the same fund (but not any other fund within the fund family)
• Shares purchased form the proceeds of redemptions within the same fund family, provided (1) the repurchase occurs within 90 days following the redemption, (2) the redemption and purchase occur in the same amount, and (3) redeemed shares were subject to a front-end or deferred sales load (known as Rights of Restatement).
• A shareholder in the Fund's Class C shares will have their shares converted at net asset value to Class A shares (or the appropriate share class) of the Fund if the shares are no longer subject to a CDSC and the conversion is in line with the policies and procedures of OPCO
• Employees and registered representatives of OPCO or its affiliates and their family members
• Directors or Trustees of the Fund, and employees of the Fund's investment adviser or any of its affiliates, as described in this prospectus
CDSC Waivers on A, B and C shares available at OPCO
• Death or disability of the shareholder
• Shares sold as part of a systematic withdrawal plan as described in the Fund's prospectus
• Return of excess contributions from an IRA Account
• Shares sold as part of a required minimum distribution for IRA and retirement accounts due to the shareholder reaching the qualified age based on applicable IRS regulations
• Shares sold to pay OPCO fees but only if the transaction is initiated by OPCO Shares acquired through a right of reinstatement
Front-end load discounts available at OPCO: breakpoints, rights of accumulation & letters of intent
• Breakpoints as described in this prospectus.
• Rights of Accumulation (ROA) which entitle shareholders to breakpoint discounts will be automatically calculated based on the aggregated holding of fund family assets held by accounts within the purchaser's household at OPCO. Eligible fund family assets not held at OPCO may be included in the ROA calculation only if the shareholder notifies his or her financial advisor about such assets.
Raymond James Prospectus Disclosure
Intermediary-Defined Sales Charge Waiver Policies
The availability of certain initial or deferred sales charge waivers and discounts may depend on the particular financial intermediary or type of account through which you purchase or hold Fund shares.
Intermediaries may have different policies and procedures regarding the availability of front-end sales load waivers or contingent deferred (back-end) sales load ("CDSC") waivers, which are discussed below. In all instances, it is the purchaser's responsibility to notify the fund or the purchaser's financial intermediary at the time of purchase of any relationship or other facts qualifying the purchaser for sales charge waivers or discounts. For waivers and discounts not available through a particular intermediary, shareholders will have to purchase fund shares directly from the fund or through another intermediary to receive these waivers or discounts.
Raymond James & Associates, Inc., Raymond James Financial Services, Inc. and each entity's affiliates ("Raymond James")
Shareholders purchasing fund shares through a Raymond James platform or account, or through an introducing broker-dealer or independent registered investment adviser for which Raymond James provides trade execution, clearance, and/or custody services, will be eligible only for the following load waivers (front-end sales charge waivers and contingent deferred, or back-end, sales charge waivers) and discounts, which may differ from those disclosed elsewhere in this fund's prospectus or SAI.
Front-end sales load waivers on Class A shares available at Raymond James
• Shares purchased in an investment advisory program.
• Shares purchased within the same fund family through a systematic reinvestment of capital gains and dividend distributions.
• Employees and registered representatives of Raymond James or its affiliates and their family members as designated by Raymond James.
• Shares purchased from the proceeds of redemptions within the same fund family, provided (1) the repurchase occurs within 90 days following the redemption, (2) the redemption and purchase occur in the same account, and (3) redeemed shares were subject to a front-end or deferred sales load (known as Rights of Reinstatement).
• A shareholder in the Fund's Class C shares will have their shares converted at net asset value to Class A shares (or the appropriate share class) of the Fund if the shares are no longer subject to a CDSC and the conversion is in line with the policies and procedures of Raymond James.
CDSC Waivers on Classes A, B and C shares available at Raymond James
• Death or disability of the shareholder.
• Shares sold as part of a systematic withdrawal plan as described in the fund's prospectus.
• Return of excess contributions from an IRA Account.
• Shares sold as part of a required minimum distribution for IRA and retirement accounts due to the shareholder reaching the qualified age based on applicable IRS regulations as described in the fund's prospectus.
• Shares sold to pay Raymond James fees but only if the transaction is initiated by Raymond James.
• Shares acquired through a right of reinstatement.
Front-end load discounts available at Raymond James: breakpoints, rights of accumulation, and/or letters of intent
• Breakpoints as described in this prospectus.
• Rights of accumulation which entitle shareholders to breakpoint discounts will be automatically calculated based on the aggregated holding of fund family assets held by accounts within the purchaser's household at Raymond James. Eligible fund family assets not held at Raymond James may be included in the calculation of rights of accumulation only if the shareholder notifies his or her financial advisor about such assets.
• Letters of intent which allow for breakpoint discounts based on anticipated purchases within a fund family, over a 13-month time period. Eligible fund family assets not held at Raymond James may be included in the calculation of letters of intent only if the shareholder notifies his or her financial advisor about such assets.
Robert W. Baird & Co. Prospectus Disclosure
Robert W. Baird & Co. ("Baird"):
Shareholders purchasing fund shares through a Baird platform or account will only be eligible for the following sales charge waivers (front-end sales charge waivers and CDSC waivers) and discounts, which may differ from those disclosed elsewhere in this prospectus or the SAI
Front-end sales charge waivers on Investors A-shares available at Baird
• Shares purchased through reinvestment of capital gains distributions and dividend reinvestment when purchasing share of the same fund
• Share purchase by employees and registers representatives of Baird or its affiliate and their family members as designated by Baird
• Shares purchased using the proceeds of redemptions within the same fund family, provided (1) the repurchase occurs within 90 days following the redemption, (2) the redemption and purchase occur in the same accounts, and (3) redeemed shares were subject to a front-end or deferred sales charge (known as rights of reinstatement)
• A shareholder in the Funds Investor C Shares will have their share converted at net asset value to Investor A shares of the same fund if the shares are no longer subject to CDSC and the conversion is in line with the policies and procedures of Baird
• Employer-sponsored retirement plans or charitable accounts in a transactional brokerage account at Baird, including 401(k) plans, 457 plans, employer-sponsored 403(b) plans, profit sharing and money purchase pension plans and defined benefit plans. For purposes of this provision, employer-sponsored retirement plans do not include SEP IRAs, Simple IRAs or SAR-SEPs
CDSC Waivers on Investor A and C shares available at Baird
• Shares sold due to death or disability of the shareholder
• Shares sold as part of a systematic withdrawal plan as described in the Fund's Prospectus
• Shares bought due to returns of excess contributions from an IRA Account
• Shares sold as part of a required minimum distribution for IRA and retirement accounts due to the shareholder reaching the qualified age based on applicable Internal Revenue Service regulations as described in the Fund's prospectus
• Shares sold to pay Baird fees but only if the transaction is initiated by Baird
• Shares acquired through a right of reinstatement
Front-end sales charge discounts available at Baird: breakpoints and/or rights of accumulations
• Breakpoints as described in this prospectus
• Rights of accumulations which entitles shareholders to breakpoint discounts will be automatically calculated based on the aggregated holding of fund family assets held by accounts within the purchaser's household at Baird. Eligible fund family assets not held at Baird may be included in the rights of accumulations calculation only if the shareholder notifies his or her financial advisor about such assets
• Letters of Intent (LOI) allow for breakpoint discounts based on anticipated purchases within a fund family through Baird, over a 13-month period of time
If you would like more information about the Funds, the following resources are available upon request, free of charge.
Additional information about the Funds' investments will be available in the Funds' semiannual and annual reports to shareholders. The annual report contains a discussion of the market conditions and investment strategies that significantly affected the Funds' performance for the one-year period ended October 31, 2023.
The Statement of Additional Information provides more detailed information about the Funds and, except for the information in the section entitled "Financial Statements," is incorporated into this prospectus by reference.
Copies of the reports and the Statement of Additional Information are available, without charge, upon request, by calling 800.582.6959 or by visiting the Funds' website at www.calamos.com. You can request other information and discuss your questions about the Funds by contacting Calamos Financial Services LLC at:
Calamos Financial Services LLC
2020 Calamos Court
Naperville, Illinois 60563
Telephone: 800.582.6959
The Funds' reports and Statement of Additional Information are available on the EDGAR database on the Commission's Internet website at http://www.sec.gov, and copies may be obtained, after paying a duplicating fee, by electronic request to:
E-mail: publicinfo@sec.gov.
FOR 24 HOUR AUTOMATED
SHAREHOLDER ASSISTANCE
800.823.7386
TO OBTAIN INFORMATION
ABOUT YOUR INVESTMENTS
800.582.6959
VISIT OUR WEBSITE
www.calamos.com
INVESTMENT ADVISER
Calamos Advisors LLC
2020 Calamos Court
Naperville, IL 60563
TRANSFER AGENT
U.S. Bank Global Fund Services
615 E. Michigan St. 3rd floor
Milwaukee, WI 53202
INDEPENDENT REGISTERED PUBLIC
ACCOUNTING FIRM
Deloitte & Touche LLP
Chicago, IL
LEGAL COUNSEL
Ropes & Gray LLP
Chicago, IL

2020 Calamos Court
Naperville, IL 60563-2787
800.582.6959
www.calamos.com
© 2024 Calamos Investments LLC. All Rights Reserved. Calamos® and Calamos Investments® are registered trademarks of Calamos Investments LLC.
CITPRO 030124
811-05443
March 1, 2024
STATEMENT OF ADDITIONAL INFORMATION
CALAMOS® FAMILY OF FUNDS
|
Fund |
|
Class A |
|
Class C |
|
Class I |
|
Class R6 |
|
|
Calamos Market Neutral Income Fund |
|
CVSIX |
|
CVSCX |
|
CMNIX |
|
CVSOX |
|
|
Calamos Hedged Equity Fund |
|
CAHEX |
|
CCHEX |
|
CIHEX |
|
|
|
|
Calamos Phineus Long/Short Fund |
|
CPLSX |
|
CPCLX |
|
CPLIX |
|
|
|
|
Calamos Merger Arbitrage Fund |
|
CMRAX |
|
CMRCX |
|
CMRGX |
|
|
|
|
Calamos Convertible Fund |
|
CCVIX |
|
CCVCX |
|
CICVX |
|
|
|
|
Calamos Global Convertible Fund |
|
CAGCX |
|
CCGCX |
|
CXGCX |
|
|
|
|
Calamos Timpani Small Cap Growth Fund |
|
CTASX |
|
CTCSX |
|
CTSIX |
|
CTSOX |
|
|
Calamos Timpani SMID Growth Fund |
|
CTAGX |
|
|
|
CTIGX |
|
CTOGX |
|
|
Calamos Growth Fund |
|
CVGRX |
|
CVGCX |
|
CGRIX |
|
|
|
|
Calamos Growth and Income Fund |
|
CVTRX |
|
CVTCX |
|
CGIIX |
|
CGIOX |
|
|
Calamos Dividend Growth Fund |
|
CADVX |
|
CCDVX |
|
CIDVX |
|
|
|
|
Calamos Select Fund |
|
CVAAX |
|
CVACX |
|
CVAIX |
|
|
|
|
Calamos International Growth Fund |
|
CIGRX |
|
CIGCX |
|
CIGIX |
|
CIGOX |
|
|
Calamos Evolving World Growth Fund |
|
CNWGX |
|
CNWDX |
|
CNWIX |
|
|
|
|
Calamos Global Equity Fund |
|
CAGEX |
|
CCGEX |
|
CIGEX |
|
CGEOX |
|
|
Calamos Global Opportunities Fund |
|
CVLOX |
|
CVLCX |
|
CGCIX |
|
|
|
|
Calamos International Small Cap |
|
|
Growth Fund |
|
CAISX |
|
CCISX |
|
CSGIX |
|
CISOX |
|
|
Calamos Total Return Bond Fund |
|
CTRAX |
|
CTRCX |
|
CTRIX |
|
|
|
|
Calamos High Income Opportunities Fund |
|
CHYDX |
|
CCHYX |
|
CIHYX |
|
|
|
|
Calamos Short-Term Bond Fund |
|
CSTBX |
|
|
|
CSTIX |
|
|
|
2020 Calamos Court
Naperville, Illinois 60563
800.582.6959
This Statement of Additional Information relates to Calamos Market Neutral Income Fund, Calamos Hedged Equity Fund, Calamos Phineus Long/Short Fund, Calamos Merger Arbitrage Fund, Calamos Convertible Fund, Calamos Global Convertible Fund, Calamos Timpani Small Cap Growth Fund, Calamos Timpani SMID Growth Fund, Calamos Growth Fund, Calamos Growth and Income Fund, Calamos Dividend Growth Fund, Calamos Select Fund, Calamos International Growth Fund, Calamos Evolving World Growth Fund, Calamos Global Equity Fund, Calamos Global Opportunities Fund, Calamos International Small Cap Growth Fund, Calamos Total Return Bond Fund, Calamos High Income Opportunities Fund, and Calamos Short-Term Bond Fund (the "Funds"), each of which is a series of Calamos Investment Trust (the "Trust"). This is not a prospectus, but provides information that should be read in conjunction with the Calamos Family of Funds prospectus, dated March 1, 2024 and any supplements thereto, which are incorporated herein by reference. The Funds' financial statements and financial highlights for the fiscal year ended October 31, 2023, as well as the report of the independent registered public accounting firm are incorporated by reference. The prospectus and the annual and semi-annual reports of the Funds may be obtained without charge by writing or telephoning the Funds at the address or telephone numbers set forth above.
TABLE OF CONTENTS
|
|
|
Page
|
|
|
THE TRUST AND THE FUNDS
|
|
|
3
|
|
|
|
INVESTMENT OBJECTIVES
|
|
|
3
|
|
|
|
INVESTMENT PRACTICES
|
|
|
4
|
|
|
|
INVESTMENT RESTRICTIONS
|
|
|
32
|
|
|
|
MANAGEMENT
|
|
|
36
|
|
|
|
INVESTMENT ADVISORY SERVICES
|
|
|
47
|
|
|
|
TEAM APPROACH TO MANAGEMENT
|
|
|
52
|
|
|
|
DISTRIBUTION PLAN
|
|
|
58
|
|
|
|
DISTRIBUTOR
|
|
|
60
|
|
|
|
OTHER COMPENSATION TO INTERMEDIARIES
|
|
|
63
|
|
|
|
PORTFOLIO TRANSACTIONS
|
|
|
63
|
|
|
|
SHARE CLASSES AND PRICING OF SHARES
|
|
|
67
|
|
|
|
TAXATION
|
|
|
70
|
|
|
|
CONTROL PERSONS AND PRINCIPAL SHAREHOLDERS
|
|
|
79
|
|
|
|
CUSTODIAN AND TRANSFER AGENT
|
|
|
107
|
|
|
|
FUND ACCOUNTING AND FINANCIAL ACCOUNTING AGENT
|
|
|
109
|
|
|
|
INDEPENDENT REGISTERED PUBLIC ACCOUNTING FIRM
|
|
|
110
|
|
|
|
GENERAL INFORMATION
|
|
|
110
|
|
|
|
FINANCIAL STATEMENTS
|
|
|
110
|
|
|
|
APPENDIX—DESCRIPTION OF BOND RATINGS
|
|
|
A-1
|
|
|
THE TRUST AND THE FUNDS
The Trust was organized as a Massachusetts business trust on December 21, 1987. Each Fund is an open-end, diversified management investment company. Prior to April 1, 2021, Global Opportunities Fund was named "Global Growth and Income Fund". Prior to February 28, 2020, Select Fund was named "Opportunistic Value Fund". Prior to June 23, 2017, High Income Opportunities Fund was known as "High Income Fund". Prior to March 1, 2019, Hedged Equity Fund was known as "Hedged Equity Income Fund".
INVESTMENT OBJECTIVES
Each Fund's investment objectives are shown below:
MARKET NEUTRAL INCOME FUND seeks high current income consistent with stability of principal.
HEDGED EQUITY FUND seeks total return with lower volatility than equity markets.
PHINEUS LONG/SHORT FUND seeks strong, risk-adjusted and absolute returns in the context of prevailing market conditions across the global equity universe.
MERGER ARBITRAGE FUND seeks long-term capital appreciation.
CONVERTIBLE FUND seeks current income, with growth as its secondary objective.
GLOBAL CONVERTIBLE FUND seeks total return through capital appreciation and current income.
TIMPANI SMALL CAP GROWTH FUND seeks capital appreciation.
TIMPANI SMID GROWTH FUND seeks capital appreciation.
GROWTH FUND seeks long-term capital growth.
GROWTH AND INCOME FUND seeks high long-term total return through growth and current income.
DIVIDEND GROWTH FUND seeks income and capital appreciation primarily through investments in dividend paying equities.
SELECT FUND seeks long-term capital growth.
INTERNATIONAL GROWTH FUND seeks long-term capital growth.
EVOLVING WORLD GROWTH FUND seeks long-term capital growth.
GLOBAL EQUITY FUND seeks long-term capital growth.
GLOBAL OPPORTUNITIES FUND seeks high long-term total return through capital appreciation and current income.
INTERNATIONAL SMALL CAP GROWTH FUND seeks long-term capital appreciation.
TOTAL RETURN BOND FUND seeks total return, consistent with preservation of capital and prudent investment management.
HIGH INCOME OPPORTUNITIES FUND seeks the highest level of current income obtainable with reasonable risk. Its secondary objective is capital gain, where consistent with the Fund's primary objective.
SHORT-TERM BOND FUND seeks a high level of current income consistent with preservation of principal.
The investment objectives of each Fund other than Merger Arbitrage Fund and International Small Cap Growth Fund may not be changed without the approval of a "majority of the outstanding" shares of that Fund, as defined in the Investment Company Act of 1940, as amended (the "1940 Act"). The investment objectives of Merger Arbitrage Fund and International Small Cap Growth Fund are non-fundamental and may be changed by a vote of the Fund's Board, without shareholder approval.
Each of Hedged Equity Fund, Merger Arbitrage Fund, Convertible Fund, Global Convertible Fund, Timpani Small Cap Growth Fund, Timpani SMID Growth Fund, Dividend Growth Fund, Global Equity Fund, International Small Cap Growth Fund, Total Return Bond Fund, and Short-Term Bond Fund, respectively, will notify shareholders in writing at least 60 days prior to any change in its 80% policy.
3
INVESTMENT PRACTICES
The prospectus contains information concerning each Fund's investment objectives and principal investment strategies and risks. This Statement of Additional Information provides additional information concerning certain securities and strategies used by the Funds and their associated risks.
In pursuing its investment objectives, each Fund will invest as described below and in the Funds' prospectus. The table below indicates whether each Fund, directly or indirectly through its investment in the underlying funds, invests in the securities and instruments listed as part of its principal (P) or non-principal (N) investment strategies.
Unless otherwise noted, all investment policies and restrictions described in the Prospectus and Statement of Additional Information are measured at the time of the transaction in the security. If market action affecting fund securities (including, but not limited to, appreciation, depreciation, or a credit rating event) causes a Fund to exceed an investment policy or restriction, Calamos Advisors LLC ("Calamos Advisors") is not required to take immediate action. Under normal market conditions, however, Calamos Advisors will not make any acquisitions that will make the Fund further outside the investment restriction.
|
INVESTMENTS AND INVESTMENT-RELATED PRACTICES |
|
MARKET
NEUTRAL
INCOME
FUND |
|
HEDGED
EQUITY
FUND |
|
PHINEUS
LONG/
SHORT
FUND |
|
MERGER
ARBITRAGE
FUND |
|
CONVERTIBLE
FUND |
|
GLOBAL
CONVERTIBLE
FUND |
|
|
Asset Swapped Convertible Option Transactions |
|
|
N |
|
|
|
N |
|
|
|
N |
|
|
|
N |
|
|
|
N |
|
|
|
N |
|
|
|
Calculations of Dollar Weighted Average Portfolio Maturity |
|
|
N |
|
|
|
N |
|
|
|
N |
|
|
|
N |
|
|
|
N |
|
|
|
N |
|
|
|
Convertible Securities |
|
|
P |
|
|
|
P |
|
|
|
N |
|
|
|
P |
|
|
|
P |
|
|
|
P |
|
|
|
Currency Exchange Transactions |
|
|
N |
|
|
|
P |
|
|
|
P |
|
|
|
N |
|
|
|
P |
|
|
|
P |
|
|
|
Debt Securities (including High Yield Fixed-Income Securities) |
|
|
P |
|
|
|
P |
|
|
|
N |
|
|
|
P |
|
|
|
P |
|
|
|
P |
|
|
|
Distressed Securities |
|
|
N |
|
|
|
N |
|
|
|
N |
|
|
|
N |
|
|
|
N |
|
|
|
N |
|
|
|
Equity Securities |
|
|
P |
|
|
|
P |
|
|
|
P |
|
|
|
P |
|
|
|
P |
|
|
|
P |
|
|
|
Foreign Securities |
|
|
P |
|
|
|
P |
|
|
|
P |
|
|
|
P |
|
|
|
P |
|
|
|
P |
|
|
|
Futures Contracts and Options on Futures Contracts |
|
|
N |
|
|
|
P |
|
|
|
P |
|
|
|
P |
|
|
|
N |
|
|
|
P |
|
|
|
Illiquid Securities |
|
|
P |
|
|
|
N |
|
|
|
N |
|
|
|
N |
|
|
|
N |
|
|
|
N |
|
|
|
Inflation-indexed Bonds |
|
|
N |
|
|
|
N |
|
|
|
N |
|
|
|
N |
|
|
|
N |
|
|
|
N |
|
|
|
Initial Public Offerings |
|
|
N |
|
|
|
N |
|
|
|
N |
|
|
|
N |
|
|
|
N |
|
|
|
N |
|
|
|
Lending of Portfolio Securities |
|
|
N |
|
|
|
N |
|
|
|
N |
|
|
|
N |
|
|
|
N |
|
|
|
P |
|
|
|
Loan Participations and Assignments |
|
|
N |
|
|
|
N |
|
|
|
N |
|
|
|
N |
|
|
|
N |
|
|
|
N |
|
|
|
Master Limited Partnerships |
|
|
N |
|
|
|
N |
|
|
|
N |
|
|
|
N |
|
|
|
N |
|
|
|
N |
|
|
|
Mortgage-related and Other Asset-backed Securities |
|
|
N |
|
|
|
N |
|
|
|
N |
|
|
|
N |
|
|
|
N |
|
|
|
N |
|
|
|
Municipal Bonds |
|
|
N |
|
|
|
N |
|
|
|
N |
|
|
|
N |
|
|
|
N |
|
|
|
N |
|
|
|
Municipal Lease Obligations |
|
|
N |
|
|
|
N |
|
|
|
N |
|
|
|
N |
|
|
|
N |
|
|
|
N |
|
|
|
Options on Securities, Indexes and Currencies* |
|
|
P |
|
|
|
P |
|
|
|
P |
|
|
|
P |
|
|
|
P |
|
|
|
P |
|
|
|
Portfolio Turnover |
|
|
P |
|
|
|
P |
|
|
|
P |
|
|
|
P |
|
|
|
N |
|
|
|
P |
|
|
|
Real Estate Investment Trusts |
|
|
N |
|
|
|
N |
|
|
|
N |
|
|
|
P |
|
|
|
N |
|
|
|
N |
|
|
|
Repurchase Agreements |
|
|
N |
|
|
|
N |
|
|
|
N |
|
|
|
N |
|
|
|
N |
|
|
|
N |
|
|
|
Reverse Repurchase Agreements and Other Borrowings |
|
|
N |
|
|
|
N |
|
|
|
N |
|
|
|
N |
|
|
|
N |
|
|
|
N |
|
|
|
Rule 144A Securities |
|
|
P |
|
|
|
P |
|
|
|
N |
|
|
|
P |
|
|
|
P |
|
|
|
P |
|
|
|
Short Sales |
|
|
P |
|
|
|
P |
|
|
|
P |
|
|
|
P |
|
|
|
N |
|
|
|
N |
|
|
|
Special Purpose Acquisition Companies |
|
|
N |
|
|
|
N |
|
|
|
N |
|
|
|
P |
|
|
|
N |
|
|
|
N |
|
|
|
Stripped Securities |
|
|
N |
|
|
|
N |
|
|
|
N |
|
|
|
N |
|
|
|
N |
|
|
|
N |
|
|
|
Structured Products |
|
|
N |
|
|
|
N |
|
|
|
N |
|
|
|
N |
|
|
|
N |
|
|
|
N |
|
|
|
Swaps, Caps, Floors and Collars |
|
|
P |
|
|
|
N |
|
|
|
N |
|
|
|
P |
|
|
|
N |
|
|
|
N |
|
|
|
Synthetic Convertible Instruments |
|
|
P |
|
|
|
N |
|
|
|
N |
|
|
|
P |
|
|
|
P |
|
|
|
P |
|
|
|
Synthetic Foreign Money Market Positions |
|
|
N |
|
|
|
N |
|
|
|
N |
|
|
|
N |
|
|
|
N |
|
|
|
N |
|
|
|
Temporary Investments |
|
|
N |
|
|
|
N |
|
|
|
N |
|
|
|
N |
|
|
|
N |
|
|
|
N |
|
|
|
U.S. Government Obligations |
|
|
N |
|
|
|
N |
|
|
|
N |
|
|
|
P |
|
|
|
N |
|
|
|
N |
|
|
|
Warrants* |
|
|
N |
|
|
|
P |
|
|
|
N |
|
|
|
P |
|
|
|
N |
|
|
|
N |
|
|
|
"When-Issued" and Delayed Delivery Securities |
|
|
N |
|
|
|
N |
|
|
|
N |
|
|
|
N |
|
|
|
N |
|
|
|
P |
|
|
4
|
INVESTMENTS AND INVESTMENT-RELATED PRACTICES |
|
TIMPANI
SMALL
CAP
GROWTH
FUND |
|
TIMPANI
SMID
GROWTH
FUND |
|
GROWTH
FUND |
|
GROWTH
AND
INCOME
FUND |
|
DIVIDEND
GROWTH
FUND |
|
SELECT
FUND |
|
|
Asset Swapped Convertible Option Transactions |
|
|
N |
|
|
|
N |
|
|
|
N |
|
|
|
N |
|
|
|
N |
|
|
|
N |
|
|
|
Calculations of Dollar Weighted Average Portfolio Maturity |
|
|
N |
|
|
|
N |
|
|
|
N |
|
|
|
N |
|
|
|
N |
|
|
|
N |
|
|
|
Convertible Securities |
|
|
N |
|
|
|
N |
|
|
|
N |
|
|
|
P |
|
|
|
N |
|
|
|
N |
|
|
|
Currency Exchange Transactions |
|
|
N |
|
|
|
N |
|
|
|
P |
|
|
|
P |
|
|
|
P |
|
|
|
N |
|
|
|
Debt Securities (including High Yield Fixed-Income Securities) |
|
|
N |
|
|
|
N |
|
|
|
N |
|
|
|
P |
|
|
|
N |
|
|
|
N |
|
|
|
Distressed Securities |
|
|
N |
|
|
|
N |
|
|
|
N |
|
|
|
N |
|
|
|
N |
|
|
|
N |
|
|
|
Equity Securities |
|
|
P |
|
|
|
P |
|
|
|
P |
|
|
|
P |
|
|
|
P |
|
|
|
P |
|
|
|
Foreign Securities |
|
|
P |
|
|
|
P |
|
|
|
P |
|
|
|
P |
|
|
|
P |
|
|
|
P |
|
|
|
Futures Contracts and Options on Futures Contracts |
|
|
N |
|
|
|
N |
|
|
|
N |
|
|
|
N |
|
|
|
P |
|
|
|
N |
|
|
|
Illiquid Securities |
|
|
N |
|
|
|
N |
|
|
|
N |
|
|
|
N |
|
|
|
P |
|
|
|
N |
|
|
|
Inflation-indexed Bonds |
|
|
N |
|
|
|
N |
|
|
|
N |
|
|
|
N |
|
|
|
N |
|
|
|
N |
|
|
|
Initial Public Offerings |
|
|
N |
|
|
|
N |
|
|
|
N |
|
|
|
N |
|
|
|
N |
|
|
|
N |
|
|
|
Lending of Portfolio Securities |
|
|
N |
|
|
|
N |
|
|
|
N |
|
|
|
N |
|
|
|
N |
|
|
|
N |
|
|
|
Loan Participations and Assignments |
|
|
N |
|
|
|
N |
|
|
|
N |
|
|
|
N |
|
|
|
N |
|
|
|
N |
|
|
|
Master Limited Partnerships |
|
|
N |
|
|
|
N |
|
|
|
N |
|
|
|
N |
|
|
|
P |
|
|
|
N |
|
|
|
Mortgage-related and Other Asset-backed Securities |
|
|
N |
|
|
|
N |
|
|
|
N |
|
|
|
N |
|
|
|
N |
|
|
|
N |
|
|
|
Municipal Bonds |
|
|
N |
|
|
|
N |
|
|
|
N |
|
|
|
N |
|
|
|
N |
|
|
|
N |
|
|
|
Municipal Lease Obligations |
|
|
N |
|
|
|
N |
|
|
|
N |
|
|
|
N |
|
|
|
N |
|
|
|
N |
|
|
|
Options on Securities, Indexes and Currencies* |
|
|
N |
|
|
|
N |
|
|
|
P |
|
|
|
P |
|
|
|
P |
|
|
|
P |
|
|
|
Portfolio Turnover |
|
|
P |
|
|
|
P |
|
|
|
N |
|
|
|
N |
|
|
|
N |
|
|
|
N |
|
|
|
Real Estate Investment Trusts |
|
|
N |
|
|
|
N |
|
|
|
N |
|
|
|
N |
|
|
|
N |
|
|
|
N |
|
|
|
Repurchase Agreements |
|
|
N |
|
|
|
N |
|
|
|
N |
|
|
|
N |
|
|
|
N |
|
|
|
N |
|
|
|
Reverse Repurchase Agreements and Other Borrowings |
|
|
N |
|
|
|
N |
|
|
|
N |
|
|
|
N |
|
|
|
N |
|
|
|
N |
|
|
|
Rule 144A Securities |
|
|
N |
|
|
|
N |
|
|
|
N |
|
|
|
P |
|
|
|
P |
|
|
|
N |
|
|
|
Short Sales |
|
|
N |
|
|
|
N |
|
|
|
N |
|
|
|
N |
|
|
|
N |
|
|
|
N |
|
|
|
Special Purpose Acquisition Companies |
|
|
N |
|
|
|
N |
|
|
|
N |
|
|
|
N |
|
|
|
N |
|
|
|
N |
|
|
|
Stripped Securities |
|
|
N |
|
|
|
N |
|
|
|
N |
|
|
|
N |
|
|
|
N |
|
|
|
N |
|
|
|
Structured Products |
|
|
N |
|
|
|
N |
|
|
|
N |
|
|
|
N |
|
|
|
N |
|
|
|
N |
|
|
|
Swaps, Caps, Floors and Collars |
|
|
N |
|
|
|
N |
|
|
|
N |
|
|
|
N |
|
|
|
N |
|
|
|
N |
|
|
|
Synthetic Convertible Instruments |
|
|
N |
|
|
|
N |
|
|
|
N |
|
|
|
P |
|
|
|
N |
|
|
|
N |
|
|
|
Synthetic Foreign Money Market Positions |
|
|
N |
|
|
|
N |
|
|
|
N |
|
|
|
N |
|
|
|
N |
|
|
|
N |
|
|
|
Temporary Investments |
|
|
N |
|
|
|
N |
|
|
|
N |
|
|
|
N |
|
|
|
N |
|
|
|
N |
|
|
|
U.S. Government Obligations |
|
|
N |
|
|
|
N |
|
|
|
N |
|
|
|
N |
|
|
|
N |
|
|
|
N |
|
|
|
Warrants* |
|
|
N |
|
|
|
N |
|
|
|
N |
|
|
|
N |
|
|
|
N |
|
|
|
N |
|
|
|
"When-Issued" and Delayed Delivery Securities |
|
|
N |
|
|
|
N |
|
|
|
N |
|
|
|
N |
|
|
|
N |
|
|
|
N |
|
|
|
INVESTMENTS AND INVESTMENT-RELATED PRACTICES |
|
INTERNATIONAL
GROWTH FUND |
|
EVOLVING
WORLD
GROWTH
FUND |
|
GLOBAL
EQUITY
FUND |
|
GLOBAL
OPPORTUNITIES
FUND |
|
INTERNATIONAL
SMALL CAP
GROWTH
FUND |
|
|
Asset Swapped Convertible Option Transactions |
|
|
N |
|
|
|
N |
|
|
|
N |
|
|
|
N |
|
|
|
N |
|
|
|
Calculations of Dollar Weighted Average Portfolio Maturity |
|
|
N |
|
|
|
N |
|
|
|
N |
|
|
|
N |
|
|
|
N |
|
|
|
Convertible Securities |
|
|
N |
|
|
|
P |
|
|
|
N |
|
|
|
P |
|
|
|
N |
|
|
|
Currency Exchange Transactions |
|
|
P |
|
|
|
P |
|
|
|
P |
|
|
|
N |
|
|
|
P |
|
|
|
Debt Securities (including High Yield Fixed-Income Securities) |
|
|
N |
|
|
|
P |
|
|
|
N |
|
|
|
P |
|
|
|
N |
|
|
|
Distressed Securities |
|
|
N |
|
|
|
N |
|
|
|
N |
|
|
|
N |
|
|
|
N |
|
|
|
Equity Securities |
|
|
P |
|
|
|
P |
|
|
|
P |
|
|
|
P |
|
|
|
P |
|
|
|
Foreign Securities |
|
|
P |
|
|
|
P |
|
|
|
P |
|
|
|
P |
|
|
|
P |
|
|
|
Futures Contracts and Options on Futures Contracts |
|
|
N |
|
|
|
N |
|
|
|
N |
|
|
|
N |
|
|
|
N |
|
|
|
Illiquid Securities |
|
|
N |
|
|
|
N |
|
|
|
N |
|
|
|
N |
|
|
|
N |
|
|
|
Inflation-indexed Bonds |
|
|
N |
|
|
|
N |
|
|
|
N |
|
|
|
N |
|
|
|
N |
|
|
|
Initial Public Offerings |
|
|
N |
|
|
|
N |
|
|
|
N |
|
|
|
N |
|
|
|
N |
|
|
|
Lending of Portfolio Securities |
|
|
N |
|
|
|
N |
|
|
|
N |
|
|
|
N |
|
|
|
N |
|
|
|
Loan Participations and Assignments |
|
|
N |
|
|
|
N |
|
|
|
N |
|
|
|
N |
|
|
|
N |
|
|
|
Master Limited Partnerships |
|
|
N |
|
|
|
N |
|
|
|
N |
|
|
|
N |
|
|
|
N |
|
|
|
Mortgage-related and Other Asset-backed Securities |
|
|
N |
|
|
|
N |
|
|
|
N |
|
|
|
N |
|
|
|
N |
|
|
5
|
INVESTMENTS AND INVESTMENT-RELATED PRACTICES |
|
INTERNATIONAL
GROWTH FUND |
|
EVOLVING
WORLD
GROWTH
FUND |
|
GLOBAL
EQUITY
FUND |
|
GLOBAL
OPPORTUNITIES
FUND |
|
INTERNATIONAL
SMALL CAP
GROWTH
FUND |
|
|
Municipal Bonds |
|
|
N |
|
|
|
N |
|
|
|
N |
|
|
|
N |
|
|
|
N |
|
|
|
Municipal Lease Obligations |
|
|
N |
|
|
|
N |
|
|
|
N |
|
|
|
N |
|
|
|
N |
|
|
|
Options on Securities, Indexes and Currencies* |
|
|
N |
|
|
|
N |
|
|
|
N |
|
|
|
P |
|
|
|
N |
|
|
|
Portfolio Turnover |
|
|
N |
|
|
|
P |
|
|
|
N |
|
|
|
P |
|
|
|
N |
|
|
|
Real Estate Investment Trusts |
|
|
N |
|
|
|
N |
|
|
|
N |
|
|
|
N |
|
|
|
N |
|
|
|
Repurchase Agreements |
|
|
N |
|
|
|
N |
|
|
|
N |
|
|
|
N |
|
|
|
N |
|
|
|
Reverse Repurchase Agreements and Other Borrowings |
|
|
N |
|
|
|
N |
|
|
|
N |
|
|
|
N |
|
|
|
N |
|
|
|
Rule 144A Securities |
|
|
N |
|
|
|
N |
|
|
|
N |
|
|
|
P |
|
|
|
N |
|
|
|
Short Sales |
|
|
N |
|
|
|
N |
|
|
|
N |
|
|
|
N |
|
|
|
N |
|
|
|
Special Purpose Acquisition Companies |
|
|
N |
|
|
|
N |
|
|
|
N |
|
|
|
N |
|
|
|
N |
|
|
|
Stripped Securities |
|
|
N |
|
|
|
N |
|
|
|
N |
|
|
|
N |
|
|
|
N |
|
|
|
Structured Products |
|
|
N |
|
|
|
N |
|
|
|
N |
|
|
|
N |
|
|
|
N |
|
|
|
Swaps, Caps, Floors and Collars |
|
|
N |
|
|
|
N |
|
|
|
N |
|
|
|
N |
|
|
|
N |
|
|
|
Synthetic Convertible Instruments |
|
|
N |
|
|
|
P |
|
|
|
N |
|
|
|
P |
|
|
|
N |
|
|
|
Synthetic Foreign Money Market Positions |
|
|
N |
|
|
|
N |
|
|
|
N |
|
|
|
N |
|
|
|
N |
|
|
|
Temporary Investments |
|
|
N |
|
|
|
N |
|
|
|
N |
|
|
|
N |
|
|
|
N |
|
|
|
U.S. Government Obligations |
|
|
N |
|
|
|
N |
|
|
|
N |
|
|
|
N |
|
|
|
N |
|
|
|
Warrants* |
|
|
N |
|
|
|
N |
|
|
|
N |
|
|
|
N |
|
|
|
N |
|
|
|
"When-Issued" and Delayed Delivery Securities |
|
|
N |
|
|
|
N |
|
|
|
N |
|
|
|
N |
|
|
|
N |
|
|
|
INVESTMENTS AND INVESTMENT-RELATED PRACTICES |
|
TOTAL
RETURN
BOND
FUND |
|
HIGH
INCOME
OPPORTUNITIES
FUND |
|
SHORT-TERM
BOND
FUND |
|
|
Asset Swapped Convertible Option Transactions |
|
|
N |
|
|
|
N |
|
|
|
N |
|
|
|
Calculations of Dollar Weighted Average Portfolio Maturity |
|
|
N |
|
|
|
N |
|
|
|
P |
|
|
|
Convertible Securities |
|
|
P |
|
|
|
P |
|
|
|
P |
|
|
|
Currency Exchange Transactions |
|
|
P |
|
|
|
N |
|
|
|
N |
|
|
|
Debt Securities (including High Yield Fixed-Income Securities) |
|
|
P |
|
|
|
P |
|
|
|
P |
|
|
|
Distressed Securities |
|
|
N |
|
|
|
N |
|
|
|
N |
|
|
|
Equity Securities |
|
|
N |
|
|
|
P |
|
|
|
N |
|
|
|
Foreign Securities |
|
|
P |
|
|
|
P |
|
|
|
P |
|
|
|
Futures Contracts and Options on Futures Contracts |
|
|
P |
|
|
|
P |
|
|
|
P |
|
|
|
Illiquid Securities |
|
|
N |
|
|
|
N |
|
|
|
N |
|
|
|
Inflation-indexed Bonds |
|
|
P |
|
|
|
P |
|
|
|
P |
|
|
|
Initial Public Offerings |
|
|
N |
|
|
|
N |
|
|
|
N |
|
|
|
Lending of Portfolio Securities |
|
|
P |
|
|
|
P |
|
|
|
P |
|
|
|
Loan Participations and Assignments |
|
|
P |
|
|
|
P |
|
|
|
P |
|
|
|
Master Limited Partnerships |
|
|
P |
|
|
|
P |
|
|
|
N |
|
|
|
Mortgage-related and Other Asset-backed Securities |
|
|
P |
|
|
|
P |
|
|
|
P |
|
|
|
Municipal Bonds |
|
|
P |
|
|
|
P |
|
|
|
P |
|
|
|
Municipal Lease Obligations |
|
|
N |
|
|
|
N |
|
|
|
N |
|
|
|
Options on Securities, Indexes and Currencies* |
|
|
P |
|
|
|
P |
|
|
|
N |
|
|
|
Portfolio Turnover |
|
|
N |
|
|
|
P |
|
|
|
N |
|
|
|
Real Estate Investment Trusts |
|
|
N |
|
|
|
N |
|
|
|
N |
|
|
|
Repurchase Agreements |
|
|
P |
|
|
|
P |
|
|
|
P |
|
|
|
Reverse Repurchase Agreements and Other Borrowings |
|
|
N |
|
|
|
N |
|
|
|
N |
|
|
|
Rule 144A Securities |
|
|
P |
|
|
|
P |
|
|
|
P |
|
|
|
Short Sales |
|
|
N |
|
|
|
N |
|
|
|
N |
|
|
|
Special Purpose Acquisition Companies |
|
|
N |
|
|
|
N |
|
|
|
N |
|
|
|
Stripped Securities |
|
|
P |
|
|
|
P |
|
|
|
P |
|
|
|
Structured Products |
|
|
P |
|
|
|
P |
|
|
|
P |
|
|
|
Swaps, Caps, Floors and Collars |
|
|
P |
|
|
|
P |
|
|
|
P |
|
|
|
Synthetic Convertible Instruments |
|
|
P |
|
|
|
P |
|
|
|
P |
|
|
|
Synthetic Foreign Money Market Positions |
|
|
N |
|
|
|
N |
|
|
|
N |
|
|
|
Temporary Investments |
|
|
N |
|
|
|
N |
|
|
|
N |
|
|
6
|
INVESTMENTS AND INVESTMENT-RELATED PRACTICES |
|
TOTAL
RETURN
BOND
FUND |
|
HIGH
INCOME
OPPORTUNITIES
FUND |
|
SHORT-TERM
BOND
FUND |
|
|
U.S. Government Obligations |
|
|
P |
|
|
|
P |
|
|
|
P |
|
|
|
Warrants* |
|
|
N |
|
|
|
N |
|
|
|
N |
|
|
|
"When-Issued" and Delayed Delivery Securities |
|
|
P |
|
|
|
P |
|
|
|
P |
|
|
* Not including those acquired in connection with investments in synthetic convertible instruments.
ASSET SWAPPED CONVERTIBLE OPTION TRANSACTIONS
Market Neutral Income Fund may invest up to 5% of its total assets in asset swapped convertible option transactions (each an "ASCOT"). An ASCOT is a structure in which an option on a convertible bond is used to separate a convertible bond into its two components (i.e., the bond with its regular coupon payments and the equity option that functions as a call option). An ASCOT provides exposure to the equity component of a convertible without the credit and interest rate exposure represented by the bond.
CONVERTIBLE SECURITIES
Convertible securities include any corporate debt security or preferred stock that may be converted into underlying shares of common stock. The common stock underlying convertible securities may be issued by a different entity than the issuer of the convertible securities. Convertible securities entitle the holder to receive interest payments paid on corporate debt securities or the dividend preference on a preferred stock until such time as the convertible security matures or is redeemed or until the holder elects to exercise the conversion privilege. As a result of the conversion feature, however, the interest rate or dividend preference on a convertible security is generally less than would be the case if the security were a non-convertible obligation.
The value of convertible securities is influenced by both the yield of non-convertible securities of comparable issuers and by the value of the underlying common stock. A convertible security's value viewed without regard to its conversion feature (i.e., strictly on the basis of its yield) is sometimes referred to as its "investment value." A convertible security's investment value typically will fluctuate inversely with changes in prevailing interest rates. However, at the same time, the convertible security will be influenced by its "conversion value," which is the market value of the underlying common stock that would be obtained if the convertible security were converted. Conversion value fluctuates directly with the price of the underlying common stock.
If, because of a low price of the common stock, a convertible security's conversion value is substantially below its investment value, the convertible security's price is governed principally by its investment value. If a convertible security's conversion value increases to a point that approximates or exceeds its investment value, the convertible security's value will be principally influenced by its conversion value. A convertible security will sell at a premium over its conversion value to the extent investors place value on the right to acquire the underlying common stock while holding a fixed-income security. Holders of convertible securities have a claim on the issuer's assets prior to the common stockholders, but may be subordinated to holders of similar non-convertible securities of the same issuer.
CURRENCY EXCHANGE TRANSACTIONS
Currency exchange transactions may be conducted either on a spot (i.e., cash) basis at the spot rate for purchasing or selling currency prevailing in the foreign exchange market or through forward currency exchange contracts ("forward contracts"). Forward contracts are contractual agreements to purchase or sell a specified currency at a specified future date (or within a specified time period) and price set at the time of the contract.
Forward contracts are usually entered into with banks, foreign exchange dealers and broker-dealers, are not exchange traded, and are usually for less than one year, but may be renewed.
Forward currency exchange transactions may involve currencies of the different countries in which the Funds may invest and serve as hedges against possible variations in the exchange rate between these currencies. Currency exchange transactions are limited to transaction hedging and portfolio hedging involving either specific transactions or portfolio positions, except to the extent described below under "Synthetic Foreign Money Market Positions." Transaction hedging is the purchase or sale of forward contracts with respect to specific receivables or payables of a Fund accruing in connection with the purchase and sale of its portfolio securities or the receipt of dividends or interest thereon. Portfolio hedging is the use of forward contracts with respect to portfolio security positions denominated or quoted in a particular foreign currency. Portfolio hedging allows a Fund to limit or reduce its exposure in a foreign currency by entering into a forward contract to sell such foreign currency (or another foreign currency that acts as a proxy for that currency) at a future date for a price payable in U.S. dollars so that the value of the
7
foreign denominated portfolio securities can be approximately matched by a foreign denominated liability. A Fund may not engage in portfolio hedging with respect to the currency of a particular country to an extent greater than the aggregate market value (at the time of making such sale) of the securities held in its portfolio denominated or quoted in that particular currency, except that the Fund may hedge all or part of its foreign currency exposure through the use of a basket of currencies or a proxy currency where such currencies or currency act as an effective proxy for other currencies. In such a case, the Fund may enter into a forward contract where the amount of the foreign currency to be sold exceeds the value of the securities denominated in such currency. The use of this basket hedging technique may be more efficient and economical than entering into separate forward contracts for each currency held in the Fund. No Fund may engage in "speculative" currency exchange transactions. At the maturity of a forward contract to deliver a particular currency, the Fund may either sell the portfolio security related to the contract and make delivery of the currency, or it may retain the security and either acquire the currency on the spot market or terminate its contractual obligation to deliver the currency by purchasing an offsetting contract with the same currency trader obligating it to purchase on the same maturity date the same amount of the currency.
It is impossible to forecast with absolute precision the market value of portfolio securities at the expiration of a forward contract. Accordingly, it may be necessary for a Fund to purchase additional currency on the spot market (and bear the expense of such purchase) if the market value of the security is less than the amount of currency the Fund is obligated to deliver and if a decision is made to sell the security and make delivery of the currency. Conversely, it may be necessary to sell on the spot market some of the currency received upon the sale of the portfolio security if its market value exceeds the amount of currency the Fund is obligated to deliver.
If a Fund retains the portfolio security and engages in an offsetting currency transaction, it will incur a gain or a loss to the extent that there has been movement in forward contract prices. If the Fund engages in an offsetting currency transaction, it subsequently may enter into a new forward contract to sell the currency. Should forward prices decline during the period between the Fund's entering into a forward contract for the sale of a currency and the date it enters into an offsetting contract for the purchase of the currency, the Fund will realize a gain to the extent the price of the currency it has agreed to sell exceeds the price of the currency it has agreed to purchase. Should forward prices increase, the Fund will suffer a loss to the extent the price of the currency it has agreed to purchase exceeds the price of the currency it has agreed to sell. A default on the contract would deprive the Fund of unrealized profits or force the Fund to cover its commitments for purchase or sale of currency, if any, at the current market price.
Hedging against a decline in the value of a currency does not eliminate fluctuations in the value of a portfolio security traded in that currency or prevent a loss if the value of the security declines. Hedging transactions also preclude the opportunity for gain if the value of the hedged currency should rise. Moreover, it may not be possible for a Fund to hedge against a devaluation that is so generally anticipated that the Fund is not able to contract to sell the currency at a price above the devaluation level it anticipates. The cost to a Fund of engaging in currency exchange transactions varies with such factors as the currency involved, the length of the contract period, and prevailing market conditions. Because currency exchange transactions are usually conducted on a principal basis, no fees or commissions are involved.
DEBT SECURITIES (INCLUDING HIGH YIELD FIXED-INCOME SECURITIES)
In pursuing its investment objectives, a Fund may invest in convertible and non-convertible debt securities, including high yield fixed-income securities (i.e., securities rated BB or lower by S&P Global Ratings, a division of S&P Global ("S&P"), or Ba or lower by Moody's Investor Services, Inc. ("Moody's")) and securities that are not rated but are considered by Calamos Advisors, the Funds' investment adviser, to be of similar quality. There are no restrictions as to the ratings of debt securities that may be acquired by a Fund or the portion of a Fund's assets that may be invested in debt securities in a particular rating category, except that Total Return Bond Fund may not invest more than 25% of its net assets and Global Convertible Fund, Timpani Small Cap Growth Fund, and Timpani SMID Growth Fund may not invest more than 20% of its net assets in high yield fixed-income securities, and none of Merger Arbitrage Fund, Total Return Bond Fund, Global Convertible Fund, Timpani Small Cap Growth Fund, nor Timpani SMID Growth Fund may acquire a security rated lower than C.
Securities rated BBB or Baa are considered to be medium grade and to have speculative characteristics. High yield fixed-income securities are predominantly speculative with respect to the issuer's capacity to pay interest and repay principal. Investment in medium- or lower-quality debt securities involves greater investment risk, including the possibility of issuer default or bankruptcy. An economic downturn could severely disrupt the market for such securities and adversely affect the value of such securities. In addition, lower-quality bonds are less sensitive to interest rate changes than higher-quality instruments and generally are more sensitive to adverse economic changes or individual corporate developments. During a period of adverse economic changes,
8
including a period of rising interest rates, issuers of such bonds may experience difficulty in servicing their principal and interest payment obligations.
Achievement by a Fund of its investment objectives will be more dependent on Calamos Advisors' credit analysis than would be the case if the Fund were investing in higher-quality debt securities. Because the ratings of rating services (which evaluate the safety of principal and interest payments, not market risks) are used only as preliminary indicators of investment quality, Calamos Advisors employs its own credit research and analysis. These analyses may take into consideration such quantitative factors as an issuer's present and potential liquidity, profitability, internal capability to generate funds, debt/equity ratio and debt servicing capabilities, and such qualitative factors as an assessment of management, industry characteristics, accounting methodology, and foreign business exposure.
Medium- and lower-quality debt securities may be less marketable than higher-quality debt securities because the market for them is less broad. The market for unrated debt securities is even narrower. During periods of thin trading in these markets, the spread between bid and asked prices is likely to increase significantly, and a Fund may have greater difficulty selling its portfolio securities. The market value of these securities and their liquidity may be affected by adverse publicity and investor perceptions.
CALCULATIONS OF DOLLAR WEIGHTED AVERAGE PORTFOLIO MATURITY
Dollar weighted average portfolio maturity is derived by multiplying the value of each debt security by the number of days remaining to its maturity, adding these calculations, and then dividing the total by the value of Short-Term Bond Fund's debt securities. An obligation's maturity typically is determined on a stated final maturity basis, although there are some exceptions to this rule.
With respect to obligations held by Short-Term Bond Fund, if it is probable that the issuer of a security will take advantage of a maturity-shortening device, such as a call, refunding, or redemption provision, the date on which the security will probably be called, refunded, or redeemed may be considered to be its maturity date. Also, the maturities of mortgage-backed securities, some asset-backed securities and securities subject to sinking fund arrangements are determined on a weighted average life basis, which is the average time for principal to be repaid. For mortgage-backed securities and some asset-backed securities, this average time is calculated by assuming prepayment rates of the underlying loans. These prepayment rates can vary depending upon the level and volatility of interest rates. This, in turn, can affect the weighted average life of the security. The weighted average lives of these securities will be shorter than their stated final maturities. In addition, for purposes of Short-Term Bond Fund's investment policies, a security will be treated as having a maturity earlier than its stated maturity date if the security has technical features such as puts or demand features that, in the judgment of the Calamos Advisors, will result in the security being valued in the market as though it has the earlier maturity.
Finally, for purposes of calculating the dollar weighted average portfolio maturity of Short-Term Bond Fund, the maturity of a debt security with a periodic interest reset date will be deemed to be the next reset date, rather than the remaining stated maturity of the security if, in the judgment of Calamos Advisors, the periodic interest reset features will result in the security being valued in the market as though it has the earlier maturity.
DISTRESSED SECURITIES
High Income Opportunities Fund may, but currently does not intend to, and Short-Term Bond Fund may invest up to 5% of its net assets in distressed securities, including corporate loans, which are the subject of bankruptcy proceedings or otherwise in default as to the repayment of principal and/or payment of interest at the time of acquisition by the Fund or are rated in the lower rating categories (Ca or lower by Moody's or CC or lower by S&P) or which are unrated investments considered by Calamos Advisors to be of comparable quality. Investment in distressed securities is speculative and involves significant risk of loss.
Distressed securities frequently do not produce income while they are outstanding and may require a Fund to bear certain extraordinary expenses in order to protect and recover its investment. Therefore, to the extent a Fund seeks capital appreciation through investment in distressed securities, the Fund's ability to achieve current income for its shareholders may be diminished. A Fund also will be subject to significant uncertainty as to when and in what manner and for what value the obligations evidenced by the distressed securities will eventually be satisfied (e.g., through a liquidation of the obligor's assets, an exchange offer or plan of reorganization involving the distressed securities or a payment of some amount in satisfaction of the obligation). In addition, even if an exchange offer is made or a plan of reorganization is adopted with respect to distressed securities held by a Fund, there can be no assurance that the securities or other assets received by a Fund in connection with such exchange offer or plan of reorganization will not have a lower value or income potential than may have been anticipated when the investment was
9
made. Moreover, any securities received by a Fund upon completion of an exchange offer or plan of reorganization may be restricted as to resale. As a result of a Fund's participation in negotiations with respect to any exchange offer or plan of reorganization with respect to an issuer of distressed securities, the Fund may be restricted from disposing of such securities.
EQUITY SECURITIES
Equity securities include common and preferred stocks, warrants, rights, and depository receipts. An investment in the equity securities of a company represents a proportionate ownership interest in that company. Therefore, a Fund participates in the financial success or failure of any company in which it has an equity interest.
Equity investments are subject to greater fluctuations in market value than other asset classes as a result of such factors as the issuer's business performance, investor perceptions, stock market trends and general economic conditions. Equity securities are subordinated to bonds and other debt instruments in a company's capital structure in terms of priority to corporate income and liquidation payments. See the prospectus for additional information regarding equity investments and their risks.
FOREIGN SECURITIES
Phineus Long/Short Fund, Global Convertible Fund, International Growth Fund, Evolving World Growth Fund, Global Equity Fund, Global Opportunities Fund and International Small Cap Growth Fund may invest all of their net assets, Merger Arbitrage Fund and Total Return Bond Fund may invest up to 35% of their net assets, and each other Fund may invest up to 25% of its net assets, in securities of foreign issuers. A foreign security is a security issued by a foreign government or a company whose country of incorporation is a foreign country. For this purpose, foreign securities include American Depositary Receipts (ADRs) or securities guaranteed by a U.S. person but which represent underlying shares of foreign issuers, and may include foreign securities in the form of European Depositary Receipts (EDRs), Global Depositary Receipts (GDRs) or other securities representing underlying shares of foreign issuers. Positions in those securities are not necessarily denominated in the same currency as the common stocks into which they may be converted. ADRs are receipts typically issued by an American bank or trust company evidencing ownership of the underlying securities. EDRs are European receipts listed on the Luxembourg Stock Exchange evidencing a similar arrangement. GDRs are U.S. dollar-denominated receipts issued by international banks evidencing ownership of foreign securities. Generally, ADRs, in registered form, are designed for the U.S. securities markets and EDRs and GDRs, in bearer form, are designed for use in foreign securities markets. A Fund may invest in sponsored or unsponsored ADRs. In the case of an unsponsored ADR, a Fund is likely to bear its proportionate share of the expenses of the depository and it may have greater difficulty in receiving shareholder communications than it would have with a sponsored ADR.
To the extent positions in portfolio securities are denominated in foreign currencies, a Fund's investment performance is affected by the relative strength or weakness of the U.S. dollar against those currencies. For example, if the dollar falls in value relative to the Japanese yen, the dollar value of a Japanese stock held in the portfolio will rise even though the price of the stock remains unchanged. Conversely, if the dollar rises in value relative to the yen, the dollar value of the Japanese stock will fall. (See discussion of transaction hedging and portfolio hedging below under "Currency Exchange Transactions.")
Investors should understand and consider carefully the risks involved in foreign investing. Investing in foreign securities, which are generally denominated in foreign currencies, and utilization of forward foreign currency exchange contracts involve certain considerations comprising both risks and opportunities not typically associated with investing in U.S. securities. These considerations include: fluctuations in exchange rates of foreign currencies; possible imposition of exchange control regulation or currency restrictions that would prevent cash from being brought back to the U.S.; less public information with respect to issuers of securities; less governmental supervision of stock exchanges, securities brokers, and issuers of securities; lack of uniform accounting, auditing and financial reporting standards; lack of uniform settlement periods and trading practices; less liquidity and frequently greater price volatility in foreign markets than in the U.S.; greater costs of buying, holding and selling securities, including brokerage, tax and custody costs; and sometimes less advantageous legal, operational and financial protections applicable to foreign sub-custodial arrangements.
Although each Fund that invests in foreign securities intends to invest in companies and government securities of countries having stable political environments, there is the possibility of expropriation or confiscatory taxation, seizure or nationalization of foreign bank deposits or other assets, establishment of exchange controls, the adoption of foreign government restrictions, or other adverse political, social or diplomatic developments that could affect investment in these nations.
However, each Fund that invests in foreign securities may invest in the securities of emerging countries (including, in the case of the International Small Cap Growth Fund, frontier markets). The securities markets of emerging countries are substantially smaller, less developed, less liquid and more volatile than the securities markets of the U.S. and other more developed countries. Disclosure and regulatory standards in many respects are less stringent than in the U.S. and other major markets. There also may
10
be a lower level of monitoring and regulation of emerging markets and the activities of investors in such markets, and enforcement of existing regulations has been extremely limited. The Public Company Accounting Oversight Board, which regulates auditors of U.S. public companies, is unable to inspect audit work papers in certain foreign countries. Investors in foreign countries often have limited rights and few practical remedies to pursue shareholder claims, including class actions or fraud claims, and the ability of the SEC, the U.S. Department of Justice and other authorities to bring and enforce actions against foreign issuers or foreign persons is limited. Economies in individual emerging markets may differ favorably or unfavorably from the U.S. economy in such respects as growth of gross domestic product, rates of inflation, currency depreciation, capital reinvestment, resource self-sufficiency and balance of payments positions. Many emerging market countries have experienced high rates of inflation for many years, which has had and may continue to have very negative effects on the economies and securities markets of those countries. Certain emerging markets are sometimes referred to as "frontier markets." Frontier markets, the least advanced capital markets in the developing world, are among the riskiest markets in the world in which to invest. Frontier markets have the fewest number of investors and investment holdings and may not even have stock markets on which to trade. Investments in this sector are typically illiquid, nontransparent and subject to very low regulation levels as well as high transaction fees, and may also have substantial political and currency risk. Emerging and frontier markets both offer the prospect of higher returns with higher risk. However, emerging markets are more stable and developed than frontier markets. The economies of emerging market countries have achieved a rudimentary level of development, while frontier markets represent the least economically developed nations in the global marketplace. Emerging and frontier markets also carry several types of investment risk, including market, political and currency risk, as well as the risk of nationalization.
A portion of a Fund's investments may be in Russian securities and instruments. The United States and the European Union have imposed sanctions on certain Russian persons and issuers. The United States and other nations or international organizations may impose additional, broader economic sanctions or take other actions that may adversely affect Russian-related issuers in the future. These sanctions, any future sanctions or other actions, or even the threat of further sanctions or other actions, may negatively affect the value and liquidity of a Fund's investments. For example, a Fund may be prohibited from investing in securities issued by companies subject to such sanctions. In addition, the sanctions may require a Fund to freeze its existing investments in Russian companies, prohibiting a Fund from buying, selling or otherwise transacting in these investments. Russia may undertake countermeasures or retaliatory actions which may further impair the value and liquidity of a Fund's portfolio and potentially disrupt its operations. For these or other reasons, a Fund could seek to suspend redemptions of shares, including in the event that an emergency exists in which it is not reasonably practicable for the Fund to dispose of its securities or to determine its net asset value. During the period that redemptions are affected, shares could trade at a significant premium or discount to their net asset value.
INVESTMENTS IN CHINA A-SHARES THROUGH STOCK CONNECT. Global Convertible Fund, International Growth Fund, Evolving World Growth Fund, Global Equity Fund, Global Opportunities Fund, International Small Cap Growth Fund, and Merger Arbitrage Fund may purchase certain listed eligible China A-Shares traded on the Shanghai Stock Exchange ("SSE") through the Shanghai-Hong Kong Stock Connect program as well as traded on the Shenzhen Stock Exchange ("SZSE") through the Shenzhen-Hong Kong Stock Connect program (both programs collectively referred to herein as "Stock Connect"). Stock Connect is a securities trading and clearing program developed by The Stock Exchange of Hong Kong Limited ("SEHK"), SSE, SZSE, Hong Kong Securities Clearing Company Limited and China Securities Depository and Clearing Corporation Limited for the establishment of mutual market access between SEHK, SSE and SZSE. In contrast to certain other regimes for foreign investment in Chinese securities, no individual investment quotas or licensing requirements apply to investors in Stock Connect securities through Stock Connect. In addition, there are no lock-up periods or restrictions on the repatriation of principal and profits.
However, trading through Stock Connect is subject to a number of restrictions that may affect a Fund's investments and returns. For example, a primary feature of the Stock Connect program is the application of the home market's laws and rules to investors in a security. Thus, investors in Stock Connect securities are generally subject to Chinese securities regulations and the listing rules of the respective exchange, among other restrictions. In addition, Stock Connect securities generally may not be sold, purchased or otherwise transferred other than through Stock Connect in accordance with applicable rules. While Stock Connect is not subject to individual investment quotas, daily and aggregate investment quotas apply to all Stock Connect participants, which may restrict or preclude a Fund's ability to invest in Stock Connect securities. For example, an investor cannot purchase and sell the same security on the same trading day. Stock Connect also is generally available only on business days when both the respective exchange and the SEHK are open. Trading in the Stock Connect program is subject to trading, clearance and settlement procedures that are untested in China, which could pose risks to the Fund. Additionally, the withholding tax treatment of dividends and capital gains payable to overseas investors currently is unsettled.
11
Investments in China A-shares may not be covered by the securities investor protection programs of the exchanges and, without the protection of such programs, will be subject to the risk of default by the broker. In the event that the depository of the SSE and the SZSE defaulted, a Fund may not be able to recover fully its losses from the depository or may be delayed in receiving proceeds as part of any recovery process. In addition, because all trades on Stock Connect in respect of eligible China A-shares must be settled in Renminbi (RMB), the Chinese currency, a Fund investing through Stock Connect must have timely access to a reliable supply of offshore RMB, which cannot be guaranteed. The existence of a liquid trading market for China A-shares may depend on whether there is supply of, and demand for, such China A-shares. Market volatility and settlement difficulties in the China A-share markets may also result in significant fluctuations in the prices of the securities traded on such markets.
China A-shares purchased through Stock Connect are held in nominee name and not the Fund's name as the beneficial owner. It is possible, therefore, that a Fund's ability to exercise its rights as a shareholder and to pursue claims against the issuer of China A-shares may be limited because the nominee structure has not been tested in Chinese courts. In addition, a Fund may not be able to participate in corporate actions affecting China A- shares held through Stock Connect due to time constraints or for other operational reasons.
There can be no assurance as to whether or how such developments in the Stock Connect may restrict or affect the Fund's investments or returns. In addition, the application and interpretation of the laws and regulations of Hong Kong and China, and the rules, policies or guidelines published or applied by relevant regulators and exchanges in respect of the Stock Connect program, are uncertain, and they may have a detrimental effect on a Fund's investments and returns.
RISKS RELATED TO INVESTMENT IN CHINA. Investments in China A-Shares are subject to various risks, including the risks associated with investing in China generally. In particular, the Mainland Chinese exchanges have lower trading volumes, the market capitalizations of companies listed on these exchanges are generally smaller, the securities listed on these exchanges are less liquid and may experience materially greater volatility, and government supervision and regulation of the Chinese securities market are less developed. The Chinese government continues to exercise significant control over China's economy, and any changes to existing policies and new reform-oriented policies and measures, which are often unprecedented or experimental, could negatively impact the Funds' investments in China A-Shares. The Chinese government has implemented, and may implement in the future, various measures to control inflation, which if unsuccessful, may negatively impact the Chinese economy. The Chinese legal system is still developing, and laws, regulations, government policies and political and economic climate in China may change with little or no advance notice. Any such change could adversely affect market conditions.
The tax law and regulations of China are constantly changing, sometimes with retroactive effect, and the interpretation and application thereof are not as consistent and transparent as in more developed nations and may vary from region to region within China. There has been, and continues to be, uncertainty over taxation of SSE equities in the Stock Connect program, and any taxes imposed on the earnings of the Fund will reduce its overall returns.
Some Chinese companies may have less established shareholder governance and disclosure standards. Accounting, auditing, financial and other reporting standards, practices and disclosure requirements applicable to Chinese companies are different, sometimes in fundamental ways, from those applicable to companies in the U.S. and other developed markets.
FUTURES CONTRACTS AND OPTIONS ON FUTURES CONTRACTS
A Fund may enter into interest rate futures contracts, index futures contracts, volatility index futures contracts and foreign currency futures contracts. An interest rate, index, volatility index or foreign currency futures contract provides for the future sale by one party and purchase by another party of a specified quantity of a financial instrument or the cash value of an index1 at a specified price and time. A public market exists in futures contracts covering a number of indexes (including, but not limited to, the S&P 500 Index, the Russell 2000 Index, the Value Line Composite Index, and the New York Stock Exchange Composite Index) as well as financial instruments (including, but not limited to, U.S. Treasury bonds, U.S. Treasury notes, Eurodollar certificates of deposit and foreign currencies). Other index and financial instrument futures contracts are available and it is expected that additional futures contracts will be developed and traded. A Fund may enter into such contract if, in Calamos Advisors' opinion, such contract meets the Fund's investment parameters.
1 A futures contract on an index is an agreement pursuant to which two parties agree to take or make delivery of an amount of cash equal to the difference between the value of the index at the close of the last trading day of the contract and the price at which the index contract was originally written. Although the value of a securities index is a function of the value of certain specified securities, no physical delivery of those securities is made.
12
A Fund may purchase and write call and put futures options. Futures options possess many of the same characteristics as options on securities, indexes and foreign currencies (discussed in this Statement of Additional Information). A futures option gives the holder the right, in return for the premium paid, to assume a long position (call) or short position (put) in a futures contract at a specified exercise price at any time during the period of the option. Upon exercise of a call option, the holder acquires a long position in the futures contract and the writer is assigned the opposite short position. In the case of a put option, the opposite is true. A Fund might, for example, use futures contracts to hedge against or gain exposure to fluctuations in the general level of stock prices, anticipated changes in interest rates or currency fluctuations that might adversely affect either the value of a Fund's securities or the price of the securities that the Fund intends to purchase. Although other techniques could be used to reduce or increase a Fund's exposure to stock price, interest rate and currency fluctuations, a Fund may be able to achieve its desired exposure more effectively and perhaps at a lower cost by using futures contracts and futures options.
A Fund will only enter into futures contracts and futures options that are standardized and traded on an exchange, board of trade or similar entity, or quoted on an automated quotation system.
The success of any futures transaction by a Fund depends on Calamos Advisors' correctly predicting changes in the level and direction of stock prices, interest rates, currency exchange rates and other factors. Should those predictions be incorrect, the Fund's return might have been better had the transaction not been attempted; however, in the absence of the ability to use futures contracts, Calamos Advisors might have taken portfolio actions in anticipation of the same market movements with similar investment results, but, presumably, at greater transaction costs.
When a Fund makes a purchase or sale of a futures contract, the Fund is required to deposit with its custodian (or broker, if legally permitted) a specified amount of cash or U.S. Government securities or other securities acceptable to the broker ("initial margin"). The margin required for a futures contract is set by the exchange on which the contract is traded and may be modified during the term of the contract, although the Fund's broker may require margin deposits in excess of the minimum required by the exchange. The initial margin is in the nature of a performance bond or good faith deposit on the futures contract, which is returned to the Fund upon termination of the contract, assuming all contractual obligations have been satisfied. The Fund expects to earn interest income on its initial margin deposits. A futures contract held by the Fund is valued daily at the official settlement price of the exchange on which it is traded. Each day the Fund pays or receives cash, called "variation margin," equal to the daily change in value of the futures contract. This process is known as "marking-to-market." Variation margin paid or received by the Fund does not represent a borrowing or loan by the Fund but is instead settlement between the Fund and the broker of the amount one would owe the other if the futures contract had expired at the close of the previous day. In computing daily net asset value, the Fund will mark-to-market its open futures positions.
A Fund is also required to deposit and maintain margin with respect to put and call options on futures contracts written by it. Such margin deposits will vary depending on the nature of the underlying futures contract (and the related initial margin requirements), the current market value of the option and other futures positions held by the Fund.
Although some futures contracts call for making or taking delivery of the underlying securities, usually these obligations are closed out prior to delivery by offsetting purchases or sales of matching futures contracts (same exchange, underlying security or index, and delivery month). If an offsetting purchase price is less than the original sale price, the Fund engaging in the transaction realizes a capital gain, or if it is more, the Fund realizes a capital loss. Conversely, if an offsetting sale price is more than the original purchase price, the Fund engaging in the transaction realizes a capital gain, or if it is less, the Fund realizes a capital loss. The transaction costs must also be included in these calculations.
RISKS ASSOCIATED WITH FUTURES. There are several risks associated with the use of futures contracts and futures options. A purchase or sale of a futures contract or option may result in losses in excess of the amount invested in the futures contract or option. In trying to increase or reduce market exposure, there can be no guarantee that there will be a correlation between price movements in the futures contract or option and in the portfolio exposure sought. In addition, there are significant differences between the securities and futures markets that could result in an imperfect correlation between the markets, causing a given transaction not to achieve its objectives. The degree of imperfection of correlation depends on circumstances such as: variations in speculative market demand for futures, futures options and the related securities, including technical influences in futures and futures options trading and differences between the securities markets and the securities underlying the standard contracts available for trading. For example, in the case of index futures contracts, the composition of the index, including the issuers and the weighing of each issue, may differ from the composition of the Fund's portfolio, and, in the case of interest rate futures contracts, the interest rate levels, maturities and creditworthiness of the issues underlying the futures contract may differ from the financial instruments held in the Fund's portfolio. Futures prices are highly volatile at times and are influenced by many external economic, governmental, and world events. The low margin deposits normally required in futures trading permits an
13
extremely high degree of leverage, which can result in a Fund experiencing substantial gains or losses due to relatively small price movements or other factors. A decision as to whether, when and how to use futures contracts involves the exercise of skill and judgment, and even a well-conceived transaction may be unsuccessful to some degree because of market behavior or unexpected stock price or interest rate trends.
Futures exchanges may limit the amount of fluctuation permitted in certain futures contract prices during a single trading day. The daily limit establishes the maximum amount that the price of a futures contract may vary either up or down from the previous day's settlement price at the end of the current trading session. Once the daily limit has been reached in a futures contract subject to the limit, no more trades may be made on that day at a price beyond that limit. The daily limit governs only price movements during a particular trading day and therefore does not limit potential losses because the limit may work to prevent the liquidation of unfavorable positions. For example, futures prices have occasionally moved to the daily limit for several consecutive trading days with little or no trading, thereby preventing prompt liquidation of positions and subjecting some holders of futures contracts to substantial losses. Stock index futures contracts are not normally subject to such daily price change limitations.
The markets for futures positions may be thinly traded from time to time. In addition, futures positions may become illiquid due to daily price limits taking effect or due to market disruptions. There can be no assurance that a liquid market will exist at a time when a Fund seeks to close out a futures or futures option position. The Fund would be exposed to possible loss on the position during the interval of inability to close, and would continue to be required to meet margin requirements until the position is closed. In addition, many of the contracts discussed above are relatively new instruments without a significant trading history. As a result, there can be no assurance that an active secondary market will develop or continue to exist.
LIMITATIONS ON OPTIONS AND FUTURES. If options, futures contracts or futures options of types other than those described herein are traded in the future, a Fund may also use those investment vehicles, provided the board of trustees determines that their use is consistent with the Fund's investment objectives.
A Fund may not maintain open short positions in futures contracts, call options written on futures contracts or call options written on indexes if, in the aggregate, the market value of all such open positions exceeds the current value of the securities in its portfolio, plus or minus unrealized gains and losses on the open positions, adjusted for the historical relative volatility of the relationship between the portfolio and the positions. For this purpose, to the extent a Fund has written call options on specific securities in its portfolio, the value of those securities will be deducted from the current market value of the securities portfolio.
The use of options and futures is subject to applicable regulations of the Securities and Exchange Commission ("SEC"), the several exchanges upon which they are traded and the Commodity Futures Trading Commission ("CFTC"). For example, the CFTC and domestic futures exchanges have established (and continue to evaluate and monitor) speculative position limits ("position limits") on the maximum speculative position which any person, or group of persons acting in concert, may hold or control in particular contracts. In addition, federal position limits apply to swaps that are economically equivalent to futures contracts on certain agricultural, metals, and energy commodities. All positions owned or controlled by the same person or entity, even if in different accounts, must be aggregated for purposes of complying with the speculative limits. Thus, even if a Fund does not intend to exceed applicable position limits, it is possible that different clients managed by the Adviser and its affiliates may be aggregated for this purpose. Therefore, the trading decisions of the Adviser may have to be modified and positions held by a Fund liquidated in order to avoid exceeding such limits. The modification of investment decisions or the elimination of open positions, if it occurs, may adversely affect the profitability of the Fund. A violation of position limits could also lead to regulatory action materially adverse to a Fund's investment strategy.
Calamos Advisors has claimed an exclusion from the definition of commodity pool operator ("CPO"), with respect to each Fund, pursuant to Rule 4.5 under the Commodity Exchange Act ("CEA"). Consequently, Calamos Advisors is not subject to registration or regulation as a commodity pool operator under the CEA.
Under Rule 4.5, if a Fund uses commodity interests (such as futures contracts, options on futures contracts and swaps) other than for bona fide hedging purposes (as defined by the CFTC) the aggregate initial margin and premiums required to establish these positions (after taking into account unrealized profits and unrealized losses on any such positions and excluding the amount by which options that are "in-the-money"2 at the time of purchase) may not exceed 5% of a fund's NAV, or alternatively, the aggregate net notional value of those positions, as determined at the time the most recent position was
2 A call option is "in-the-money" to the extent, if any, that the value of the futures contract that is the subject of the option exceeds the exercise price. A put option is "in-the-money" if the exercise price exceeds the value of the futures contract that is the subject of the option.
14
established, may not exceed 100% of the fund's NAV (after taking into account unrealized profits and unrealized losses on any such positions). Each Fund is subject to the risk that a change in U.S. law and related regulations will impact the way a Fund operates, increase the particular costs of a Fund's operation and/or change the competitive landscape. In this regard, any further amendments to the CEA or its related regulations that subject a Fund to additional regulation may have adverse impacts on a Fund's operations and expenses.
In addition, a Fund's ability to use options and futures will be limited by tax considerations. See "Taxation — Options, Futures and Forward Contracts, and Swap Agreements or Derivatives" below.
ILLIQUID SECURITIES
Each of Hedged Equity Fund, Phineus Long/Short Fund, Merger Arbitrage Fund, Global Convertible Fund, Timpani Small Cap Growth Fund, Timpani SMID Growth Fund, Dividend Growth Fund, International Growth Fund, Evolving World Growth Fund, Global Equity Fund, Global Opportunities Fund, International Small Cap Growth Fund, Total Return Bond Fund, High Income Opportunities Fund, and Short-Term Bond Fund may invest up to 15% of its net assets under regulatory rules, and each other Fund may invest up to 10% of its net assets, taken at market value, in illiquid investments that are assets, including any securities that are not readily marketable either because they are restricted securities or for other reasons. Restricted securities are securities that are subject to restrictions on resale because they have not been registered for sale under the Securities Act of 1933, as amended ("Securities Act"). A position in restricted securities might adversely affect the liquidity and marketability of a portion of a Fund's portfolio, and a Fund might not be able to sell or dispose of its holdings in such securities promptly or at reasonable prices. In those instances where a Fund is required to have restricted securities held by it registered prior to sale by the Fund and the Fund does not have a contractual commitment from the issuer or seller to pay the costs of such registration, the gross proceeds from the sale of securities would be reduced by the registration costs and underwriting discounts. Any such registration costs are not included in the percentage limitation on a Fund's investment in restricted securities.
INFLATION-INDEXED BONDS
Inflation-indexed bonds (other than municipal inflation-indexed bonds and certain corporate inflation-indexed bonds, which are more fully described below) are fixed-income securities whose principal value is periodically adjusted according to the rate of inflation. If the index measuring inflation falls, the principal value of inflation-indexed bonds (other than municipal inflation indexed bonds and certain corporate inflation-indexed bonds) will be adjusted downward, and consequently the interest payable on these securities (calculated with respect to a smaller principal amount) will be reduced. Repayment of the original bond principal upon maturity (as adjusted for inflation) is guaranteed in the case of U.S. Treasury inflation-indexed bonds. For bonds that do not provide a similar guarantee, the adjusted principal value of the bond repaid at maturity may be less than the original principal.
With regard to municipal inflation-indexed bonds and certain corporate inflation-indexed bonds, the inflation adjustment is reflected in the semi-annual coupon payment. As a result, the principal value of municipal inflation-indexed bonds and such corporate inflation-indexed bonds does not adjust according to the rate of inflation.
The value of inflation-indexed bonds is expected to change in response to changes in real interest rates. Real interest rates are tied to the relationship between nominal interest rates and the rate of inflation. If nominal interest rates increase at a faster rate than inflation, real interest rates may rise, leading to a decrease in value of inflation-indexed bonds. Any increase in the principal amount of an inflation-indexed bond will be considered taxable ordinary income to the Fund in the year in which it occurs, even though the Fund does not receive any principal payment in cash until maturity.
INITIAL PUBLIC OFFERINGS
A Fund may purchase stock in an initial public offering ("IPO"). An IPO is a company's first offering of stock to the public, typically to raise additional capital. Shares are given a market value reflecting expectations for the company's future growth. The market for these securities may be more volatile and entail greater risk of loss than investments in larger companies due to the absence of a prior public market, unseasoned trading, a limited number of shares available for trading, lack of information about the issuer and limited operating history.
The purchase of IPO shares may involve high transaction costs. Because of the price volatility of IPO shares, a Fund may choose to hold IPO shares for a very short period of time. This may increase the turnover of a Fund's portfolio and may lead to increased expenses to a Fund, such as commissions and transaction costs. Calamos Advisors cannot guarantee continued access to IPOs.
15
LENDING OF PORTFOLIO SECURITIES
In seeking to earn additional income, a Fund may lend its portfolio securities to qualified parties (typically broker-dealers and banks) who need to borrow securities in order to cover transactions into which they have entered. Any such loan must be continuously secured by collateral in cash or cash equivalents maintained on a current basis in an amount at least equal to the market value of the securities loaned by the Fund. The Fund would continue to receive the equivalent of the interest or dividends paid by the issuer on the securities loaned, and would also receive an additional return that may be in the form of a fixed fee or a percentage of income earned on the collateral. The Fund may experience losses as a result of a diminution in value of its cash collateral investments. The Fund may pay reasonable fees to persons unaffiliated with the Fund for services in arranging these loans. The Fund would have the right to call the loan and obtain the securities loaned at any time on notice of not less than five business days. The Fund would not have the right to vote the securities during the existence of the loan; however, the Fund may attempt to call back the loan and vote the proxy if time permits prior to the record date. In the event of bankruptcy or other default of the borrower, the Fund could experience both delays in liquidating the loan collateral or recovering the loaned securities and losses, including (a) possible decline in the value of the collateral or in the value of the securities loaned during the period while the Fund seeks to enforce its rights thereto, (b) possible subnormal levels of income and lack of access to income during this period, and (c) expenses of enforcing its rights. In an effort to reduce these risks, the Fund's securities lending agent will monitor, and report to Calamos Advisors on, the creditworthiness of the firms to which the Fund lends securities.
LOAN PARTICIPATIONS AND ASSIGNMENTS
Phineus Long/Short Fund, Timpani Small Cap Growth Fund, Timpani SMID Growth Fund, Total Return Bond Fund, High Income Opportunities Fund and Short-Term Bond Fund may each invest all of their total assets in fixed- and floating-rate loans, which investments generally will be in the form of loan participations and assignments of portions of such loans. Participations and assignments involve special types of risk, including credit risk, interest rate risk, liquidity risk, and the risks of being a lender. If a Fund purchases a participation, it may only be able to enforce its rights through the participating lender, and may assume the credit risk of both the lender and the borrower. Investments in loans through direct assignment of a financial institution's interests with respect to a loan may involve additional risks. For example, if a loan is foreclosed, a Fund could benefit from becoming part owner of any collateral, however, a fund would bear the costs and liabilities associated with owning and disposing of the collateral.
A Fund may have difficulty disposing of assignments and participations. In the event no liquid market for one of these obligations exists, a Fund anticipates that such obligation could be sold only to a limited number of institutional investors. The lack of a liquid secondary market could have an adverse effect on a Fund's ability to dispose of particular assignments or participations when necessary to meet a Fund's liquidity needs or in response to a specific economic event, such as deterioration in the creditworthiness of the borrower. The lack of a liquid secondary market for assignments and participations may also make it more difficult for a Fund to assign a value to those securities for purposes of valuing a Fund's portfolio and calculating its net asset value. Additionally, substantial increases in interest rates may cause an increase in loan defaults as borrowers may lack resources to meet higher debt service requirements.
The London Interbank Offered Rate ("LIBOR") was the offered rate for short-term Eurodollar deposits between major international banks. The terms of investments, financings (such as loan participations and assignments of portions of loans) or other transactions (including certain derivatives transactions) to which a Fund may be a party have historically been tied to LIBOR. In connection with the global transition away from LIBOR led by regulators and market participants, LIBOR was last published on a representative basis at the end of June 2023. Alternative reference rates to LIBOR have been established in most major currencies and markets in these new rates are continuing to develop. The transition away from LIBOR to the use of replacement rates has gone relatively smoothly but the full impact of the transition on the Funds or the financial instruments in which the Funds invests cannot yet be fully determined.
MASTER LIMITED PARTNERSHIPS
MLPs differ from investments in common stock as a result of limited control and limited rights to vote on matters affecting the MLP. MLP common units, like other equity securities, can be affected by macro-economic and other factors affecting the stock market in general, expectations of interest rates, investor sentiment towards an issuer or certain market sector, changes in a particular issuer's financial condition, or unfavorable or unanticipated poor performance of a particular issuer (in the case of MLPs, generally measured in terms of distributable cash flow). Prices of common units of individual MLPs, like the prices other equity securities, also can be affected by fundamentals unique to the partnership or company, including earnings power and coverage ratios. MLPs generally do not pay federal income tax at the partnership level. Rather, each Partner is allocated a share of the partnerships' income, gains, losses, deductions and credits. A change in current tax law, or a change in the underlying
16
business of an MLP, could result in an MLP being treated as a corporation, instead of a partnership, for federal income tax purposes, which would result in such MLP being required to pay income tax on its taxable income. This would have the effect of reducing the amount of cash available for distribution by the MLP, potentially reducing the value of the Fund's investment and consequently your investment in the Fund. Although common units of MLPs trade on the NYSE, the NASDAQ and NYSE American, LLC, certain MLP securities trade less frequently than those of larger companies due to their smaller capitalization. As a result, the price of such MLPs may display abrupt and erratic movements at times. Additionally it may be more difficult for the Fund to buy and sell significant amounts of such securities without unfavorable impact on prevailing market process. As a result, these securities may be difficult to dispose of at a fair price when the Adviser desires to do so.
MORTGAGE-RELATED AND OTHER ASSET-BACKED SECURITIES
A Fund may invest in mortgage- or other asset-backed securities. Mortgage-related securities include mortgage pass-through securities, collateralized mortgage obligations ("CMOs"), commercial mortgage-backed securities, mortgage dollar rolls, CMO residuals, SMBSs and other securities that directly or indirectly represent a participation in, or are secured by and payable from, mortgage loans on real property.
The value of some mortgage- or asset-backed securities may be particularly sensitive to changes in prevailing interest rates. Early repayment of principal on some mortgage-related securities may expose a Fund to a lower rate of return upon reinvestment of principal. When interest rates rise, the value of a mortgage-related security generally will decline; however, when interest rates are declining, the value of mortgage-related securities with prepayment features may not increase as much as other fixed-income securities. The rate of prepayments on underlying mortgages will affect the price and volatility of a mortgage-related security, and may shorten or extend the effective maturity of the security beyond what was anticipated at the time of purchase. If unanticipated rates of prepayment on underlying mortgages accelerate the effective maturity of a mortgage-related security, the volatility of the security can be expected to increase. The value of these securities may fluctuate in response to the market's perception of the creditworthiness of the issuers. Additionally, although mortgages and mortgage-related securities are generally supported by some form of government or private guarantee and/or insurance, there is no assurance that private guarantors or insurers will meet their obligations.
One type of SMBS has one class receiving all of the interest from the mortgage assets (the interest-only, or "IO" class), while the other class will receive all of the principal (the principal-only, or "PO" class). The yield to maturity on an IO class is extremely sensitive to the rate of principal payments (including prepayments) on the underlying mortgage assets, and a rapid rate of principal payments may have a material adverse effect on a Fund's yield to maturity from these securities.
Timpani Small Cap Growth Fund, Timpani SMID Growth Fund, Total Return Bond Fund and Short-Term Bond Fund may invest, without limitations, in any combination of mortgage-related and other asset-backed IO and PO securities. A Fund may invest in collateralized debt obligations ("CDOs"), which include collateralized bond obligations ("CBOs"), collateralized loan obligations ("CLOs") and other similarly structured securities. CBOs and CLOs are types of asset-backed securities. A CBO is a trust that is backed by a diversified pool of high risk, below investment grade fixed-income securities. A CLO is a trust typically collateralized by a pool of loans, which may include, among others, domestic and foreign senior secured loans, senior unsecured loans, and subordinate corporate loans, including loans that may be rated below investment grade or equivalent unrated loans. A Fund may invest in other asset-backed securities that have been offered to investors.
MUNICIPAL BONDS
Municipal bonds are generally issued by states and local governments and their agencies, authorities and other instrumentalities. Municipal bonds are subject to interest rate, credit and market risk. The ability of an issuer to make payments could be affected by litigation, legislation or other political events or the bankruptcy of the issuer. Lower rated municipal bonds are subject to greater credit and market risk than higher quality municipal bonds. The types of municipal bonds in which a Fund may invest include municipal lease obligations. A Fund may also invest in securities issued by entities whose underlying assets are municipal bonds. Timpani Small Cap Growth Fund, Timpani SMID Growth Fund, and Total Return Bond Fund may invest, without limitation, in residual interest bonds, which are created by depositing municipal securities in a trust and dividing the income stream of an underlying municipal bond in two parts, one, a variable rate security and the other, a residual interest bond. The interest rate for the variable rate security is determined by an index or an auction process held approximately every seven to 35 days, while the residual interest bond holder receives the balance of the income from the underlying municipal bond less an auction fee. The market prices of residual interest bonds may be highly sensitive to changes in market rates and may decrease significantly when market rates increase. Since February 2008, a significant number of auction rate municipal bonds have failed to attract buyers, resulting in "failed auctions" and a resetting of the periodic rates to rates in excess of that which would
17
otherwise prevail in the short-term market. The auction failures have affected municipal issuers throughout the nation. Failed auctions generally do not reflect the credit strength of individual issuers, but reflect concerns relating to bond insurers that have insured these auction rate bonds as well as changes in the operation of the auction rate market itself. As an outcome of these failed auctions, governmental issuers have experienced significantly higher service costs on auction rate bonds, and bondholders may experience significantly less liquidity than has been anticipated.
MUNICIPAL LEASE OBLIGATIONS
Short-Term Bond Fund may invest in municipal lease obligations, which are installment purchase contract obligations, and certificates of participation in such obligations (collectively, "lease obligations"). Lease obligations do not constitute general obligations of a municipality for which the municipality's taxing power is pledged, although a lease obligation is ordinarily backed by a municipality's covenant to budget for the payments due under the lease obligation.
Certain lease obligations contain "non-appropriation" clauses, which provide that the municipality has no obligation to make lease obligation payments in future years unless money is appropriated for such purpose on a yearly basis. Although "non-appropriation" lease obligations are secured by the leased property, disposition of the property in the event of foreclosure might prove difficult. In evaluating a potential investment in such a lease obligation, Calamos Advisors will consider: (1) the credit quality of the obligor; (2) whether the underlying property is essential to a governmental function; and (3) whether the lease obligation contains covenants prohibiting the obligor from substituting similar property if the obligor fails to make appropriations for the lease obligation.
OPTIONS ON SECURITIES, INDEXES AND CURRENCIES
A Fund may purchase and sell (write) put options and call options on securities, indexes or foreign currencies. A Fund may purchase agreements, sometimes called cash puts, that may accompany the purchase of a new issue of bonds from a dealer.
A put option gives the purchaser of the option, upon payment of a premium, the right to sell, and the writer the obligation to buy, the underlying security, commodity, index, currency or other instrument at the exercise price. For instance, a Fund's purchase of a put option on a security might be designed to protect its holdings in the underlying instrument (or, in some cases, a similar instrument) against a substantial decline in the market value by giving such Fund the right to sell such instrument at the option exercise price. A call option, upon payment of a premium, gives the purchaser of the option the right to buy, and the seller the obligation to sell, the underlying instrument at the exercise price. A Fund's purchase of a call option on a security, financial future, index, currency or other instrument might be intended to protect it against an increase in the price of the underlying instrument that it intends to purchase in the future by fixing the price at which it may purchase such instrument.
A Fund may purchase and sell (write) exchange listed options and over-the-counter ("OTC") options. Exchange listed options are issued by a regulated intermediary such as the Options Clearing Corporation ("OCC"), which guarantees the performance of the obligations of the parties to such options. The discussion below uses the OCC as an example, but is also applicable to other financial intermediaries.
With certain exceptions, OCC issued and exchange listed options generally settle by physical delivery of the underlying security or currency, although in the future cash settlement may become available. Index options and Eurodollar instruments are cash settled for the net amount, if any, by which the option is "in-the-money" (i.e., where the value of the underlying instrument exceeds, in the case of a call option, or is less than, in the case of a put option, the exercise price of the option) at the time the option is exercised. Frequently, rather than taking or making delivery of the underlying instrument through the process of exercising the option, listed options are closed by entering into offsetting purchase or sale transactions that do not result in ownership of the new option.
OTC options are purchased from or sold to sellers or purchasers ("Counterparties") through direct bilateral agreement with the Counterparties. In contrast to exchange listed options, which generally have standardized terms and performance mechanics, all the terms of an OTC option, including such terms as method of settlement, term, exercise price, premium, guarantees and security, are set by negotiation of the parties. A Fund will only sell (write) OTC options (other than OTC currency options) that are subject to a buy-back provision permitting the Fund to require the Counterparty to sell the option back to the Fund at a formula price within seven days. A Fund generally is expected to enter into OTC options that have cash settlement provisions, although it is not required to do so. The staff of the SEC currently takes the position that OTC options purchased by a fund, and portfolio securities "covering" the amount of a fund's obligation pursuant to an OTC option sold by it (or the amount of assets equal to the formula price for the repurchase of the option, if any, less the amount by which the option is "in the money") are illiquid, and are subject to a fund's limitation on investing no more than 10% of its net assets (or 15% in the case of Hedged Equity
18
Fund, Merger Arbitrage Fund, Phineus Long/Short Fund, Global Convertible Fund, Timpani Small Cap Growth Fund, Timpani SMID Growth Fund, Dividend Growth Fund, International Growth Fund, Evolving World Growth Fund, Global Equity Fund, Global Opportunities Fund, International Small Cap Growth Fund, Total Return Bond Fund, High Income Opportunities Fund, and Short-Term Bond Fund) in illiquid securities.
A Fund may also purchase and sell (write) options on securities indexes and other financial indexes. Options on securities indexes and other financial indexes are similar to options on a security or other instrument except that, rather than settling by physical delivery of the underlying instrument, they settle by cash settlement, i.e., an option or an index gives the holder the right to receive, upon exercise of the option, an amount of cash if the closing level of the index upon which the option is based exceeds, in the case of a call, or is less than, in the case of a put, the exercise price of the option (except if, in the case of an OTC option, physical delivery is specified). This amount of cash is equal to the excess of the closing price of the index over the exercise price of the option, which also may be multiplied by a formula value. The seller of the option is obligated, in return for the premium received, to make delivery of this amount. The gain or loss on an option on an index depends on price movements in the instruments making up the market, market segment, industry or other composite on which the underlying index is based, rather than price movements in individual securities, as is the case with respect to options on securities.
A Fund will sell (write) call options and put options only if they are "covered." A written option will be considered "covered" to the extent it has entered into an offsetting transaction or otherwise has segregated or earmarked cash or liquid assets equal to its uncovered obligations under the written option. For example, a call option written by a Fund could be covered by purchasing an offsetting call option, by purchasing or holding the underlying reference security or asset (or a security convertible into the underlying reference security or asset), or by segregating or earmarking cash or liquid assets equal to the exercise price of the written option (or such amount as is not otherwise covered by an offsetting transaction). A Fund writing a call option on an index would be considered as holding an offsetting position to the extent such Fund owned portfolio securities substantially correlating with the movement of the underlying reference index.
If an option written by a Fund expires, the Fund realizes a capital gain equal to the premium received at the time the option was written. If an option purchased by a Fund expires, the Fund realizes a capital loss equal to the premium paid.
A Fund will realize a capital gain from a closing purchase transaction if the cost of the closing option is less than the premium received from writing the option, or, if it is more, such Fund will realize a capital loss. If the premium received from a closing sale transaction is more than the premium paid to purchase the option, a Fund will realize a capital gain or, if it is less, the Fund will realize a capital loss. The principal factors affecting the market value of a put or a call option include supply and demand, interest rates, the current market price of the underlying security, asset or index in relation to the exercise price of the option, the volatility of the underlying security, asset or index, and the time remaining until the expiration date.
A put or call option purchased by a Fund is an asset of the Fund, valued initially at the premium paid for the option. The premium received for an option written by a Fund is recorded as a deferred credit. The value of an option purchased or written is marked-to-market daily and is valued at the closing price on the exchange on which it is traded or, if not traded on an exchange or no closing price is available, at the mean between the last bid and asked prices.
RISKS ASSOCIATED WITH OPTIONS. There are several risks associated with transactions in options. For example, there are significant differences between the securities markets, the currency markets and the options markets that could result in an imperfect correlation among these markets, causing a given transaction not to achieve Calamos Advisors' objective. A decision as to whether, when and how to use options involves the exercise of skill and judgment, and even a well-conceived transaction may be unsuccessful to some degree because of market behavior or unexpected events. A Fund's ability to utilize options successfully will depend on Calamos Advisors' ability to predict pertinent market investments, which cannot be assured.
A Fund's ability to close out its position as a purchaser or seller (writer) of an OCC or exchange listed put or call option is dependent, in part, upon the liquidity of the option market. Among the possible reasons for the absence of a liquid option market on an exchange are: (i) insufficient trading interest in certain options; (ii) restrictions on transactions imposed by an exchange; (iii) trading halts, suspensions or other restrictions imposed with respect to particular classes or series of options or underlying securities including reaching daily price limits; (iv) interruption of the normal operations of the OCC or an exchange; (v) inadequacy of the facilities of an exchange or OCC to handle current trading volume; or (vi) a decision by one or more exchanges to discontinue the trading of options (or a particular class or series of options), in which event the relevant market for that option on that exchange would cease to exist, although outstanding options on that exchange would generally continue to be exercisable in accordance with their terms. If a Fund were unable to close out an option that it has purchased on a security, it would have to exercise the option in order to realize any profit or the option would expire and become worthless. If a Fund were
19
unable to close out a covered call option that it had written on a security, it would not be able to sell the underlying security until the option expired. As the writer of a covered call option on a security, a Fund foregoes, during the option's life, the opportunity to profit from increases in the market value of the security covering the call option above the sum of the premium and the exercise price of the call. As the writer of a covered call option on a foreign currency, a Fund foregoes, during the option's life, the opportunity to profit from any currency appreciation.
The hours of trading for listed options may not coincide with the hours during which the underlying financial instruments are traded. To the extent that the option markets close before the markets for the underlying financial instruments, significant price and rate movements can take place in the underlying markets that cannot be reflected in the option markets.
Unless the parties provide for it, there is no central clearing or guaranty function in an OTC option. As a result, if the Counterparty (as described above under "Options on Securities, Indexes and Currencies") fails to make or take delivery of the security, currency or other instrument underlying an OTC option it has entered into with a Fund or fails to make a cash settlement payment due in accordance with the terms of that option, a Fund will lose any premium it paid for the option as well as any anticipated benefit of the transaction. Accordingly, Calamos Advisors must assess the creditworthiness of each such Counterparty or any guarantor or credit enhancement of the Counterparty's credit to determine the likelihood that the terms of the OTC option will be satisfied.
A Fund may purchase and sell (write) call options on securities indexes and currencies. All calls sold by a Fund must be "covered." Even though a Fund will receive the option premium to help protect it against loss, a call sold by a Fund exposes such Fund during the term of the option to possible loss of opportunity to realize appreciation in the market price of the underlying security or instrument and may require the Fund to hold the security or instrument that it might otherwise have sold. In addition, a loss on a call option sold may be greater than the premium received. A Fund may purchase and sell (write) put options on securities indexes and currencies. In selling (writing) put options, there is a risk that the Fund may be required to buy the underlying index or currency at a disadvantageous price above the market price.
PORTFOLIO TURNOVER
Although the Funds do not purchase securities with a view to rapid turnover, there are no limitations on the length of time that a portfolio security must be held. Portfolio turnover can occur for a number of reasons, including calls for redemption, general conditions in the securities markets, more favorable investment opportunities in other securities, or other factors relating to the desirability of holding or changing a portfolio investment. The portfolio turnover rates may vary greatly from year to year. A high rate of portfolio turnover in a Fund would result in increased transaction expense, which must be borne by the Fund. High portfolio turnover may also result in the realization of capital gains or losses and, to the extent net short-term capital gains are realized, any distributions resulting from such gains will be considered ordinary income for federal income tax purposes. Portfolio turnover for each Fund is shown under "Financial Highlights" in the prospectus. A portfolio turnover rate of 100% would mean that the Fund had sold and purchased securities valued at 100% of its net assets within a one-year period.
The portfolio turnover rate for Calamos Select Fund increased from the fiscal year ending 10/31/2022 to the fiscal year ending 10/31/2023. Market conditions and volatility will affect the amount of turnover from year to year, as the Fund opportunistically rebalances its positioning. Although the portfolio turnover rate for the 2023 fiscal year is higher than the past two fiscal years, a portfolio turnover rate of 55% remains fairly low at an absolute level. The Fund's portfolio turnover has fluctuated in the past and the Fund anticipates variations in portfolio turnover in the future.
The portfolio turnover rate for Calamos International Small Cap Growth Fund increased from the fiscal year ending 10/31/2022 to the fiscal year ending 10/31/2023. The prior fiscal year ending 10/31/22 accounted for seven months of portfolio activity as the Fund's inception date was 3/31/2022, and would be expected to be lower than the portfolio activity over a full fiscal year period. Market conditions and volatility will affect the amount of turnover from year to year, as the Fund opportunistically rebalances its positioning. The Fund anticipates variations in portfolio turnover in the future.
REAL ESTATE INVESTMENT TRUSTS
Investments in the real estate industry, including real estate investment trusts (REITs), are particularly sensitive to economic downturns and are sensitive to factors such as changes in real estate values, property taxes and tax laws, interest rates, cash flow of underlying real estate assets, occupancy rates, government regulations affecting zoning, land use and rents and the management skill and creditworthiness of the issuer. Companies in the real estate industry also may be subject to liabilities under environmental and hazardous waste laws. In addition, the value of a REIT is affected by changes in the value of the properties owned by the REIT or mortgage loans held by the REIT. Debt securities of REITs are subject to the risks of debt securities in general. For example, such securities are more sensitive to interest rates than equity securities of REITs. REITs are also subject to
20
default and prepayment risk. Many REITs are highly leveraged, increasing their risk. A Fund will indirectly bear its proportionate share of expenses, including management fees, paid by each REIT in which it invests in addition to the expenses of the Fund.
REPURCHASE AGREEMENTS
As part of its strategy for the temporary investment of cash, a Fund may enter into "repurchase agreements" pertaining to U.S. Government securities with member banks of the Federal Reserve System or primary dealers (as designated by the Federal Reserve Bank of New York) in such securities. Each Fund may invest in repurchase agreements, provided that Hedged Equity Fund, Phineus Long/Short Fund, Merger Arbitrage Fund, Global Convertible Fund, Timpani Small Cap Growth Fund, Timpani SMID Growth Fund, Dividend Growth Fund, International Growth Fund, Evolving World Growth Fund, Global Equity Fund, Global Opportunities Fund, International Small Cap Growth Fund, Total Return Bond Fund, High Income Opportunities Fund, and Short-Term Bond Fund may not invest more than 15%, and each other Fund may not invest more than 10%, of its net assets in illiquid securities, including repurchase agreements maturing in more than seven days, and any other illiquid securities. A repurchase agreement arises when a Fund purchases a security and simultaneously agrees to resell it to the vendor at an agreed upon future date. The resale price is greater than the purchase price, reflecting an agreed upon market rate of return that is effective for the period of time the Fund holds the security and that is not related to the coupon rate on the purchased security.
Such agreements generally have maturities of no more than seven days and could be used to permit a Fund to earn interest on assets awaiting long term investment. A Fund requires continuous maintenance by the custodian for the Fund's account in the Federal Reserve/Treasury Book Entry System of collateral in an amount equal to, or in excess of, the market value of the securities that are the subject of a repurchase agreement. In the event of a bankruptcy or other default of a seller of a repurchase agreement, a Fund could experience both delays in liquidating the underlying security and losses, including: (a) possible decline in the value of the underlying security during the period while the Fund seeks to enforce its rights thereto; (b) possible subnormal levels of income and lack of access to income during this period; and (c) expenses of enforcing its rights. In an effort to reduce these risks, Calamos Advisors will monitor the creditworthiness of the firms with which a Fund enters into repurchase agreements.
REVERSE REPURCHASE AGREEMENTS AND OTHER BORROWINGS
A Fund may enter into reverse repurchase agreements, mortgage dollar rolls, and economically similar transactions to the extent permitted under the leverage limitations of the 1940 Act and the Fund's investment restrictions described below. A reverse repurchase agreement is a repurchase agreement in which the Fund is the seller of, rather than the investor in, securities and agrees to repurchase them at an agreed-upon time and price. A reverse repurchase agreement enables the Fund to obtain cash to satisfy unusually heavy redemption requests or for other temporary or emergency purposes without needing to sell portfolio securities, or to earn additional income on portfolio securities, such as Treasury bills or notes. Use of a reverse repurchase agreement may be preferable to a regular sale and later repurchase of securities because it avoids certain market risks and transaction costs.
A "mortgage dollar roll" is similar to a reverse repurchase agreement in certain respects. In a "dollar roll" transaction a Fund sells a mortgage-related security, such as a security issued by the Government National Mortgage Association ("GNMA"), to a dealer and simultaneously agrees to repurchase a similar security (but not the same security) in the future at a pre-determined price. A "dollar roll" can be viewed, like a reverse repurchase agreement, as a collateralized borrowing in which a Fund pledges a mortgage-related security to a dealer to obtain cash. Unlike in the case of reverse repurchase agreements, the dealer with which a Fund enters into a dollar roll transaction is not obligated to return the same securities as those originally sold by the Fund, but only securities which are "substantially identical." To be considered "substantially identical," the securities returned to a Fund generally must: (1) be collateralized by the same types of underlying mortgages; (2) be issued by the same agency and be part of the same program; (3) have a similar original stated maturity; (4) have identical net coupon rates; (5) have similar market yields (and therefore price); and (6) satisfy "good delivery" requirements, meaning that the aggregate principal amounts of the securities delivered and received back must be within 0.01% of the initial amount delivered.
Because dollar roll transactions may be for terms ranging between one and six months, dollar roll transactions may be deemed "illiquid" and subject to a Fund's overall limitations on investments in illiquid securities.
A Fund also may effect simultaneous purchase and sale transactions that are known as "sale-buybacks." A sale-buyback is similar to a reverse repurchase agreement, except that in a sale-buyback, the counterparty who purchases the security is entitled to receive any principal or interest payments made on the underlying security pending settlement of the Fund's repurchase of the underlying security.
21
RULE 144A SECURITIES
A Fund may purchase securities that have been privately placed but that are eligible for purchase and sale by certain qualified institutional buyers, such as the Funds, under Rule 144A ("Rule 144A Securities") under the Securities Act. Calamos Advisors, under the supervision and oversight of the Trust's board of trustees, will consider whether Rule 144A Securities are illiquid and thus subject to a Fund's restriction of investing no more than a specified percentage of its net assets in securities that are illiquid at the time of purchase. A determination of whether a Rule 144A Security is liquid or not is a question of fact. In making this determination, Calamos Advisors will consider the trading markets for the specific security, taking into account the unregistered nature of a Rule 144A Security. In addition, Calamos Advisors may consider the (1) frequency of trades and quotes for the security, as well as equivalent or underlying securities (e.g. the underlying common stock of a convertible security), (2) number of dealers and potential purchasers, (3) dealer undertakings to make a market and (4) nature of the security and of marketplace trades (e.g., the time needed to dispose of the security, the method of soliciting offers and the mechanics of transfer).
The liquidity of Rule 144A Securities will be monitored and, if as a result of changed conditions, it is determined that a Rule 144A Security is no longer liquid, a Fund's holdings of illiquid securities would be reviewed to determine what, if any, steps are required to assure that the Fund does not invest more than 10% (or 15% in the case of Hedged Equity Fund, Phineus Long/Short Fund, Merger Arbitrage Fund, Global Convertible Fund, Timpani Small Cap Growth Fund, Timpani SMID Growth Fund, Dividend Growth Fund, International Growth Fund, Evolving World Growth Fund, Global Equity Fund, Global Opportunities Fund, International Small Cap Growth Fund, Total Return Bond Fund, High Income Opportunities Fund, and Short-Term Bond Fund) of its net assets in illiquid securities. Investing in Rule 144A Securities could have the effect of increasing the amount of a Fund's assets invested in illiquid securities if qualified institutional buyers are unwilling to purchase such securities.
SHORT SALES
A Fund may sell securities short to enhance income and protect against market risk by hedging a portion of the equity risk inherent in the Fund's portfolio. A short sale may be effected when Calamos Advisors believes that the price of a security will decline or underperform the market, and involves the sale of borrowed securities, in the hope of purchasing the same securities at a later date at a lower price. There can be no assurance that a Fund will be able to close out a short position (i.e., purchase the same securities) at any particular time or at an acceptable or advantageous price. To make delivery to the buyer, a Fund must borrow the securities from a broker-dealer through which the short sale is executed, and the broker-dealer delivers the securities, on behalf of the Fund, to the buyer.
The broker-dealer is entitled to retain the proceeds from the short sale until the Fund delivers to it the securities sold short. In addition, a Fund is required to pay to the broker-dealer the amount of any dividends or interest paid on the securities sold short.
A Fund is said to have a short position in the securities sold until it delivers to the broker-dealer the securities sold. A Fund will normally close out a short position by purchasing on the open market and delivering to the broker-dealer an equal amount of the securities sold short.
A Fund will realize a gain if the price of the securities declines between the date of the short sale and the date on which the Fund purchases securities to replace the borrowed securities. On the other hand, the Fund will incur a loss if the price of the securities increases between those dates. The amount of any gain will be decreased and the amount of any loss increased by any premium or interest that the Fund may be required to pay in connection with the short sale. It should be noted that possible losses from short sales differ from those that could arise from a cash investment in a security in that losses from a short sale may be limitless, while the losses from a cash investment in a security cannot exceed the total amount of the investment in the security.
There is also a risk that securities borrowed by a Fund and delivered to the buyer of the securities sold short will need to be returned to the broker-dealer on short notice. If the request for the return of securities occurs at a time when other short sellers of the security are receiving similar requests, a "short squeeze" can occur, meaning that the Fund might be compelled, at the most disadvantageous time, to replace the borrowed securities with securities purchased on the open market, possibly at prices significantly in excess of the proceeds received from the short sale.
It is possible that the market value of the securities a Fund holds in long positions will decline at the same time that the market value of the securities the Fund has sold short increases, thereby increasing the Fund's potential volatility.
A Fund may also make short sales "against the box," meaning that at all times when a short position is open the Fund owns an equal amount of such securities or securities convertible into or exchangeable, without payment of further consideration, for securities of the same issue as, and in an amount equal to, the securities sold short. A short sale "against the box" would be
22
made in anticipation of a decline in the market price of the securities sold short. Short sales "against the box" result in a "constructive sale" and require the Fund to recognize taxable gain unless an exception to the constructive sale rule applies.
A Fund will not make a short sale of securities (other than a short sale "against the box"), if more than 20% of its net assets would be deposited with brokers as collateral or allocated to segregated accounts in connection with all outstanding short sales (other than short sales "against the box").
Short sales also may afford a Fund an opportunity to earn additional current income to the extent it is able to enter into arrangements with broker-dealers through which the short sales are executed to receive income with respect to the proceeds of the short sales during the period the Fund's short positions remain open. Calamos Advisors believes that some broker-dealers may be willing to enter into such arrangements, but there is no assurance that a Fund will be able to enter into such arrangements to the desired degree. Further, in response to market events, the SEC and regulatory authorities in other jurisdictions may adopt (and in certain cases, have adopted) reporting obligations and/or bans on short sales of certain securities, including short positions on such securities acquired through certain derivative instruments.
SPECIAL PURPOSE ACQUISITION COMPANIES
Market Neutral Income Fund may invest up to 10% of its total assets and Merger Arbitrage Fund may invest an unlimited amount of its total assets in stock, rights, warrants, and other securities of special purpose acquisition companies or similar special purpose entities (collectively, "SPACs"). A SPAC is a publicly traded company that raises investment capital in the form of a blind pool via an initial public offering ("IPO") for the purpose of acquiring an existing company. The typical SPAC IPO involves the sale of units consisting of one share of common stock combined with one or more warrants or fractions of warrants to purchase common stock at a fixed price upon or after consummation of the acquisition. Shortly after the SPAC's IPO, such units typically are split into publicly listed common stock and warrants (and rights, if applicable) which are each listed and traded separately. The proceeds from the IPO are placed in trust until such time that the SPAC identifies and consummates the acquisition. A SPAC generally invests the proceeds of its IPO (less a portion retained to cover expenses), which are held in trust, in U.S. government securities, money market securities and cash. If the SPAC does not complete the acquisition within a specified period of time after going public, the SPAC is dissolved, at which point the invested funds are returned to the entity's shareholders (less certain permitted expenses) and any rights or warrants issued by the SPAC expire worthless. Because SPACs and similar entities have no operating history or ongoing business other than seeking acquisitions, the value of their securities is particularly dependent on the ability of the entity's management to identify and complete a profitable acquisition. Some SPACs may pursue acquisitions only within certain industries or regions, which may increase the volatility of their prices. In addition, the Fund may obtain certain private rights and other interests issued by a SPAC (commonly referred to as "founder shares"), which may be subject to forfeiture or expire worthless and which generally have more limited liquidity than SPAC shares issued in an IPO.
SPACs are "blank check" companies with no operating history and, at the time that the Fund invests in a SPAC, the SPAC typically has not conducted any discussions or made any plans, arrangements or understandings with any prospective transaction candidates. Accordingly, there is a limited basis, if any, on which to evaluate the SPAC's ability to achieve its business objective, and the value of its securities is particularly dependent on the ability of the entity's management to identify and complete a profitable acquisition. While certain SPACs are formed to make transactions in specified market sectors, others are complete "blank check" companies, and the management of the SPAC may have limited experience or knowledge of the market sector in which the transaction is made. Accordingly, at the time that the Fund invests in a SPAC, there may be little or no basis for the Fund to evaluate the possible merits or risks of the particular industry in which the SPAC may ultimately operate or the target business which the SPAC may ultimately acquire. A SPAC will not generate any revenues until, at the earliest, after the consummation of a transaction. While a SPAC is seeking a transaction target, its stock may be thinly traded and/or illiquid. There can be no assurance that a market will develop.
The proceeds of a SPAC IPO that are placed in trust are subject to risks, including the risk of insolvency of the custodian of the funds, fraud by the trustee, interest rate risk and credit and liquidity risk relating to the securities and money market funds in which the proceeds are invested.
STRIPPED SECURITIES
Stripped securities include Treasury receipts, securities of government-sponsored enterprises ("GSEs"), stripped mortgage-backed securities ("SMBS"), and other "stripped" securities that evidence ownership in either the future interest payments or the future principal payments on U.S. Government, mortgage and other obligations. The stripped securities purchased are issued by the U.S. Government (or a U.S. Government agency or instrumentality) or by private issuers such as banks, corporations and other
23
institutions at a discount to their face value. These securities generally are structured to make a lump-sum payment at maturity and do not make periodic payments of principal or interest. Hence, the duration of these securities tends to be longer and they are therefore more sensitive to interest rate fluctuations than similar securities that offer periodic payments over time. The Funds will not purchase stripped securities that are subject to direct prepayment or extension risk, although in the case of SMBS, their underlying securities may be subject to such risks. SMBS are usually structured with two classes that receive different proportions of the interest and principal distributions on a pool of mortgage assets. SMBS that are structured to receive interest only are extremely sensitive to changes in the prevailing interest rates as well as the rate of principal payments (including prepayments) on the related underlying mortgage assets, and are therefore much more volatile than SMBS that receive principal only.
Stripped securities may also include participations in trusts that hold U.S. Treasury securities such as Treasury Investors Growth Receipts ("TIGRs") and Certificates of Accrual on Treasury Securities ("CATS") or other obligations where the trust participations evidence ownership in either the future interest payments or the future principal payments on the obligations. These participations are normally issued at a discount to their "face value," and can exhibit greater price volatility than ordinary debt securities because of the way in which their principal and interest are returned to investors.
STRUCTURED PRODUCTS
A Fund may invest in interests in entities organized and operated for the purpose of restructuring the investment characteristics of certain other investments. This type of restructuring involves the deposit with or purchase by an entity, such as a corporation or trust, of specified instruments and the issuance by that entity of one or more classes of securities ("structured products") backed by, or representing interests in, the underlying instruments. The term "structured products" as used herein excludes synthetic convertibles. See "Investment Practices — Synthetic Convertible Securities." The cash flow on the underlying instruments may be apportioned among the newly issued structured products to create securities with different investment characteristics such as varying maturities, payment priorities and interest rate provisions, and the extent of the payments made with respect to structured products is dependent on the extent of the cash flow on the underlying instruments. A Fund may invest in structured products, which represent derived investment positions based on relationships among different markets or asset classes.
A Fund may also invest in other types of structured products, including, among others, baskets of credit default swaps referencing a portfolio of high-yield securities. A structured product may be considered to be leveraged to the extent its interest rate varies by a magnitude that exceeds the magnitude of the change in the index rate. Because they are linked to their underlying markets or securities, investments in structured products generally are subject to greater volatility than an investment directly in the underlying market or security. Total return on the structured product is derived by linking return to one or more characteristics of the underlying instrument. Because certain structured products of the type in which a Fund may invest may involve no credit enhancement, the credit risk of those structured products generally would be equivalent to that of the underlying instruments. A Fund may invest in a class of structured products that is either subordinated or unsubordinated to the right of payment of another class. Subordinated structured products typically have higher yields and present greater risks than unsubordinated structured products. Although a Fund's purchase of subordinated structured products would have similar economic effect to that of borrowing against the underlying securities, the purchase will not be deemed to be leverage for purposes of the Fund's limitations related to borrowing and leverage.
Certain issuers of structured products may be deemed to be "investment companies" as defined in the 1940 Act. As a result, a Fund's investments in these structured products may be limited by the restrictions contained in the 1940 Act. Structured products are typically sold in private placement transactions, and there may not be an active trading market for structured products. As a result, certain structured products in which the Fund invests may be deemed illiquid.
SWAPS, CAPS, FLOORS AND COLLARS
A Fund may enter into interest rate, currency, index, credit default, total return and other swaps and the purchase or sale of related caps, floors and collars. A Fund expects to enter into these transactions primarily to preserve a return or spread on a particular investment or portion of its portfolio, to protect against currency fluctuations, as a duration management technique or to protect against any increase in the price of securities the Fund anticipates purchasing at a later date. A Fund will not sell interest rate caps or floors where it does not own securities or other instruments providing the income stream the Fund may be obligated to pay. Interest rate swaps involve the exchange by a Fund with another party of their respective commitments to pay or receive interest, e.g., an exchange of floating rate payments for fixed rate payments with respect to a notional amount of principal. A currency swap is an agreement to exchange cash flows on a notional amount of two or more currencies based on the relative value differential among them and an index swap is an agreement to swap cash flows on a notional amount based
24
on changes in the values of the reference indexes. A credit default swap is an agreement to transfer the credit exposure of fixed-income products between parties. The purchase of a cap entitles the purchaser to receive payments on a notional principal amount from the party selling such cap to the extent that a specified benchmark exceeds a predetermined interest rate or amount. The purchase of a floor entitles the purchaser to receive payments on a notional principal amount from the party selling such floor to the extent that a specified benchmark falls below a predetermined interest rate or amount. A collar is a combination of a cap and a floor that preserves a certain return within a predetermined range of interest rates or values.
A Fund will usually enter into swaps on a net basis, i.e., the two payment streams are netted out in a cash settlement on the payment date or dates specified in the instrument, with the Fund receiving or paying, as the case may be, only the net amount of the two payments. A Fund will not enter into any swap, cap, floor or collar transaction unless, at the time of entering into such transaction, the unsecured long-term debt of the securities dealers, financial institutions or other parties with whom the Fund has entered into such a transaction ("Counterparties"), combined with any credit enhancements, is rated at least A by S&P or Moody's or has an equivalent rating from an NRSRO or is determined to be of equivalent credit quality by Calamos Advisors. If there is a default by the Counterparty, the Fund may have contractual remedies pursuant to the agreements related to the transaction. Although the swap market has grown substantially over the years, increasing liquidity, some swaps, including caps, floors, and collars, may be considered illiquid.
In addition, some swaps are, and more in the future may be, centrally cleared. Swaps that are centrally-cleared are subject to the creditworthiness of the clearing organizations involved in the transaction. For example, a Fund could lose margin payments deposited with the clearing organization, as well as the net amount of gains not yet paid by the clearing organization, if the clearing organization breaches the swap agreement with the Fund or becomes insolvent or goes into bankruptcy. Also, the Fund will be exposed to the credit risk of the futures commission merchant who acts as the Fund's clearing member on the clearinghouse for a centrally cleared swap. If the Fund's futures commission merchant becomes bankrupt or insolvent, or otherwise defaults on its obligations to the Fund, the Fund may not receive all amounts owed to it in respect of its trading, even if the clearinghouse fully discharges all of its obligations. In the event of bankruptcy of the Fund's futures commission merchant, the Fund may be entitled to the net amount of gains the Fund is entitled to receive, plus the return of margin owed to it, only in proportion to the amount received by the futures commission merchant's other customers for the relevant account class, potentially resulting in losses to the Fund.
SYNTHETIC CONVERTIBLE INSTRUMENTS
A Fund may establish a "synthetic" convertible instrument by combining fixed-income securities (which may be either convertible or non-convertible) with the right to acquire equity securities. A synthetic convertible instrument is designed to simulate the economic characteristics of a convertible security through the combined features of a debt instrument, or loan, and a security providing an option on an equity security. The Fund may establish a synthetic convertible instrument by combining a fixed-income security with the right to acquire an equity security. The fixed-income and equity option components may have different issuers, and either component may change at any time.
More flexibility is possible in the assembly of a synthetic convertible instrument than in the purchase of a convertible security. Although synthetic convertible instruments may be selected where the components are issued by a single issuer, the character of a synthetic convertible instrument allows the combination of components representing distinct issuers, when management believes that such a combination would better promote a Fund's investment objectives. A synthetic convertible instrument also is a more flexible investment in that its two components may be purchased separately. For example, a Fund may purchase a warrant for inclusion in a synthetic convertible instrument but temporarily hold short-term investments while postponing the purchase of a corresponding bond pending development of more favorable market conditions. Convertible Fund's and Global Convertible Fund's holdings of synthetic convertible instruments are considered convertible securities for purposes of the Funds' policy to invest at least 80% of their net assets (plus any borrowings) in convertible securities.
A holder of a synthetic convertible instrument faces the risk of a decline in the price of the security or the level of the index involved in the convertible component, causing a decline in the value of the call option or warrant purchased to create the synthetic convertible instrument. Should the price of the stock fall below the exercise price and remain there throughout the exercise period, the entire amount paid for the call option or warrant would be lost. Because a synthetic convertible instrument includes the fixed-income component as well, the holder of a synthetic convertible instrument also faces the risk that interest rates will rise, causing a decline in the value of the fixed-income instrument.
A Fund may also purchase synthetic convertible instruments manufactured by other parties, including convertible structured notes. Convertible structured notes are fixed-income debentures linked to equity, and are typically issued by investment banks.
25
Convertible structured notes have the attributes of a convertible security; however, the investment bank that issued the convertible note assumes the credit risk associated with the investment, rather than the issuer of the underlying common stock into which the note is convertible.
SYNTHETIC FOREIGN MONEY MARKET POSITIONS
A Fund may invest in money market instruments denominated in foreign currencies. In addition to, or in lieu of, such direct investment, a Fund may construct a synthetic foreign money market position by purchasing a money market instrument denominated in one currency, generally U.S. dollars, and concurrently entering into a forward contract to deliver a corresponding amount of that currency in exchange for a different currency on a future date and at a specified rate of exchange. For example, a synthetic money market position in Japanese yen could be constructed by purchasing a U.S. dollar money market instrument, and entering concurrently into a forward contract to deliver a corresponding amount of U.S. dollars in exchange for Japanese yen on a specified date and at a specified rate of exchange. Because of the availability of a variety of highly liquid short-term U.S. dollar money market instruments, a synthetic money market position utilizing such U.S. dollar instruments may offer greater liquidity than direct investment in foreign currency and a concurrent construction of a synthetic position in such foreign currency, in terms of both income yield and gain or loss from changes in currency exchange rates, in general should be similar, but would not be identical because the components of the alternative investments would not be identical.
TEMPORARY INVESTMENTS
A Fund may make temporary investments without limitation when Calamos Advisors determines that a defensive position is warranted, or as a reserve for possible cash needs. Such investments may be in money market instruments, consisting of obligations of, or guaranteed as to principal and interest by, the U.S. Government or its agencies or instrumentalities; certificates of deposit, bankers' acceptances and other obligations of domestic banks having total assets of at least $500 million and that are regulated by the U.S. Government, its agencies or instrumentalities; commercial paper rated in the highest category by a recognized rating agency; cash; and repurchase agreements.
U.S. GOVERNMENT OBLIGATIONS
U.S. Government Obligations include securities that are issued or guaranteed by the U.S. Treasury or by various U.S. Government agencies and instrumentalities. U.S. Treasury obligations ("U.S. Treasuries") include Treasury bills, Treasury notes, and Treasury bonds. U.S. Treasuries also include the separate principal and interest components of U.S. Treasuries that are traded under the Separate Trading of Registered Interest and Principal of Securities ("STRIPS") program. U.S. Treasury obligations are backed by the full faith and credit of the U.S.
Obligations issued or guaranteed by U.S. Government agencies and instrumentalities may be supported by any of the following: (a) the full faith and credit of the U.S., (b) the right of the issuer to borrow an amount limited to a specific line of credit from the U.S. Treasury, (c) the discretionary authority of the U.S. Treasury to lend to such Government agency or instrumentality, or (d) the credit of the agency or instrumentality.
Government agencies that issue or guarantee securities backed by the full faith and credit of the U.S. include the GNMA and the Small Business Administration. Government agencies and instrumentalities that issue or guarantee securities not backed by the full faith and credit of the U.S. include the Federal Farm Credit Banks, the Federal Home Loan Banks, the Federal Home Loan Mortgage Corporation ("FHLMC"), the Federal National Mortgage Association ("FNMA"), the Federal Land Bank, the Bank for Cooperatives, the Federal Intermediate Credit Bank, the Federal Financing Bank, the Resolution Funding Corporation, the Financing Corporation of America and the Tennessee Valley Authority. In the case of securities not backed by the full faith and credit of the U.S., the investor must look principally to the agency issuing or guaranteeing the obligation for ultimate repayment and may not be able to assert a claim against the U.S. in the event the agency or instrumentality does not meet its commitment.
In September 2008, the U.S. Treasury and the Federal Housing Finance Agency ("FHFA") announced that FNMA and FHLMC had been placed in conservatorship. The conservatorship is still in effect as of the date of this SAI and has no specified termination date. There can be no assurance as to when or how the conservatorship will be terminated or whether FNMA or FHLMC will continue to exist following the conservatorship or what their respective business structures will be during or following the conservatorship. Since that time, FNMA and FHLMC have received significant capital support through U.S. Treasury preferred stock purchases, as well as Treasury and Federal Reserve purchases of their mortgage backed securities ("MBS"). The FHFA and the U.S. Treasury (through its agreement to purchase FNMA and FHLMC preferred stock) have imposed strict limits on the size of their mortgage portfolios. The FHFA, as conservator, has the power to repudiate any contract entered into by FNMA or FHLMC prior to its appointment if it determines that performance of the contract is burdensome and repudiation of the contract
26
promotes the orderly administration of FNMA's or FHLMC's affairs. Further, the FHFA has the right to transfer or sell any asset or liability of FNMA or FHLMC without any approval, assignment or consent. If FHFA were to transfer any such guaranty obligation to another party, holders of FNMA or FHLMC MBS would have to rely on that party for satisfaction of the guaranty obligation and would be exposed to the credit risk of that party. No assurance can be given that the Federal Reserve or the U.S. Treasury will ensure that FNMA and FHLMC remain successful in meeting their obligations with respect to the debt and mortgage-backed securities that they issue.
In addition, the problems faced by FNMA and FHLMC, resulting in their being placed into federal conservatorship and receiving significant U.S. Government support, have sparked serious debate among federal policy makers regarding the continued role of the U.S. Government in providing liquidity for mortgage loans. In December 2011, Congress enacted the Temporary Payroll Tax Cut Continuation Act ("TCCA") of 2011 which, among other provisions, requires that FNMA and FHLMC increase their single-family guaranty fees by at least 10 basis points and remit this increase to Treasury with respect to all loans acquired by FNMA and FHLMC on or after April 1, 2012 and before January 1, 2022. Serious discussions among policymakers continue, however, as to whether FNMA and FHLMC should be nationalized, privatized, restructured, or eliminated altogether. FNMA reported in the second quarter of 2014 that there was "significant uncertainty regarding the future of our company, including how long the company will continue to exist in its current form, the extent of our role in the market, what form we will have, and what ownership interest, if any, our current common and preferred stockholders will hold in us after the conservatorship is terminated and whether we will continue to exist following conservatorship." FHLMC faces similar uncertainty about its future role. FNMA and FHLMC also are the subject of several continuing legal actions and investigations over certain accounting, disclosure or corporate governance matters, which (along with any resulting financial restatements) may continue to have an adverse effect on the guaranteeing entities.
A Fund may invest in securities issued or guaranteed by any of the entities listed above or by any other agency established or sponsored by the U.S. Government, provided that the securities are otherwise permissible investments of the Fund. Certain U.S. Government Obligations that have a variable rate of interest readjusted no less frequently than annually will be deemed to have a maturity equal to the period remaining until the next readjustment of the interest rate.
A Fund's yield will fluctuate due to changes in interest rates, economic conditions, quality ratings and other factors. The prepayment experience of the mortgages underlying mortgage-related securities, such as obligations issued by GNMA, may affect the value of, and return on, an investment in such securities.
WARRANTS
A Fund may invest in warrants. A warrant is a right to purchase common stock at a specific price (usually at a premium above the market value of the underlying common stock at time of issuance) during a specified period of time. A warrant may have a life ranging from less than a year to 20 years or longer, but a warrant becomes worthless unless it is exercised or sold before expiration. In addition, if the market price of the common stock does not exceed the warrant's exercise price during the life of the warrant, the warrant will expire worthless. Warrants have no voting rights, pay no dividends and have no rights with respect to the assets of the corporation issuing them. The percentage increase or decrease in the value of a warrant may be greater than the percentage increase or decrease in the value of the underlying common stock.
"WHEN-ISSUED" AND DELAYED DELIVERY SECURITIES
A Fund may purchase securities on a when-issued or delayed-delivery basis. Although the payment and interest terms of these securities are established at the time the Fund enters into the commitment, the securities may be delivered and paid for a month or more after the date of purchase, when their value may have changed. A Fund makes such commitments only with the intention of actually acquiring the securities, but may sell the securities before the settlement date if Calamos Advisors deems it advisable for investment reasons. A Fund may utilize spot and forward foreign currency exchange transactions to reduce the risk inherent in fluctuations in the exchange rate between one currency and another when securities are purchased or sold on a when-issued or delayed-delivery basis.
The use of this investment strategy, as well as entering into reverse repurchase agreements or engaging in other borrowing as described below, may increase net asset value fluctuation.
27
RECENT MARKET CONDITIONS
Since the 2008 financial crises, financial markets throughout the world have experienced periods of increased volatility, depressed valuations, decreased liquidity and heightened uncertainty and turmoil. Both domestic and international equity and fixed income markets experienced heightened volatility and turmoil, with issuers that have exposure to the real estate, mortgage and credit markets particularly affected. Events that have contributed to these market conditions include, but are not limited to, major cybersecurity events, geopolitical events (including such as wars (including Russia's military invasion of the Ukraine), terror attacks, natural or environmental disasters, country instability, and public health emergencies), measures to address budget deficits, downgrading of sovereign debt, declines in oil and commodity prices, dramatic changes in currency exchange rates, and public sentiment. In addition, many governments and quasi-governmental entities throughout the world have responded to the turmoil with a variety of significant fiscal and monetary policy changes, including, but not limited to, direct capital infusions into companies, new monetary programs and dramatically lower interest rates.
The full extent of the political, economic and legal consequences of Brexit are not yet fully known, and the long-term impact of Brexit on the UK, the EU and the broader global economy may be significant. As a result of the political divisions within the UK and between the UK and the EU that the referendum vote has highlighted and the uncertain consequences of Brexit, the UK and European economies and the broader global economy could be significantly impacted, potentially resulting in increased market volatility and illiquidity, political, economic, and legal uncertainty, and lower economic growth for companies that rely significantly on Europe for their business activities and revenues. Any further exits from the EU, or the possibility of such exits, or the abandonment of the Euro, may cause additional market disruption globally and introduce new legal and regulatory uncertainties.
In addition, policy and legislative changes in the United States and in other countries are changing many aspects of financial regulation. The impact of these changes on the markets, and the practical implications for market participants, may not be fully known for some time. Widespread disease and virus epidemics and pandemics, such as the coronavirus outbreak, could likewise be highly disruptive, adversely affecting individual companies, sectors, industries, markets, currencies, interest and inflation rates, credit ratings, investor sentiment, and other factors affecting the value of the Fund's investments.
In addition to the recent unprecedented turbulence in financial markets, the reduced liquidity in credit and fixed income markets may negatively affect many issuers worldwide. Reduced liquidity in these markets may mean there is less money available to purchase raw materials, goods and services, which may, in turn, bring down the prices of these economic staples. It may also result in some issuers having more difficulty obtaining financing and ultimately may lead to a decline in their stock prices. The values of some sovereign debt and of securities of issuers that hold that sovereign debt have fallen. These events, and the potential for continuing market turbulence, may have an adverse effect on each Fund. In addition, global economies and financial markets have become increasingly interconnected, which increases the possibilities that conditions in one country or region might adversely impact issuers in a different country or region.
The U.S. federal government and certain foreign central banks have acted to calm credit markets and increase confidence in the U.S. and world economies. Certain of these entities have injected liquidity into the markets and taken other steps in an effort to stabilize the markets and grow the economy. Certain foreign governments and central banks are implementing or discussing so-called negative interest rates (e.g., charging depositors who keep their cash at a bank) to spur economic growth. Further Federal Reserve or other U.S. or non-U.S. governmental or central bank actions, including interest rate increases or contrary actions by different governments, could negatively affect financial markets generally, increase market volatility and reduce the value and liquidity of securities in which the Funds invest.
The situation in the financial markets has led to increased regulation, and the need of many financial institutions for government help has given lawmakers and regulators new leverage. The Dodd-Frank Act initiated a dramatic revision of the U.S. financial regulatory framework that continues to unfold. The Dodd-Frank Act covers a broad range of topics, including (among many others) a reorganization of federal financial regulators; a process intended to improve financial systemic stability and the resolution of potentially insolvent financial firms; new rules for derivatives trading; the creation of the Consumer Financial Protection Bureau; the registration and additional regulation of hedge and private equity fund managers; and new federal requirements for residential mortgage loans. Instruments in which the Funds may invest, or the issuers of such instruments, may be affected by the legislation and regulations promulgated thereunder in ways that may be unforeseeable. Because these requirements are relatively new and evolving (and some of the rules are not yet final), their ultimate impact remains unclear.
28
The statutory provisions of the Dodd-Frank Act significantly change in several respects the ways in which investment products are marketed, sold, settled or terminated. For example, the Dodd-Frank Act mandates the elimination of references to credit ratings in numerous securities laws, including the 1940 Act. In addition, some types of swaps (including interest rate swaps and credit default index swaps on North American and European indices) are required to be centrally cleared. Clearinghouses and futures commission merchants have broad rights to increase margin requirements for existing cleared transactions or to terminate cleared transactions at any time. Any increase in margin requirements or termination by the clearing member or the clearinghouse may have an effect on the performance of a Fund.
Under rules adopted under the Dodd-Frank Act, certain cleared derivatives contracts are required to be executed through swap execution facilities ("SEFs"). A SEF is a trading platform where multiple market participants can execute derivatives by accepting bids and offers made by multiple other participants in the platform. Such requirements may make it more difficult and costly for investment funds, such as the Funds, to enter into highly tailored or customized transactions. Trading swaps on a SEF may offer certain advantages over traditional bilateral over-the-counter trading, such as ease of execution, price transparency, increased liquidity and/or favorable pricing. Execution through a SEF is not, however, without additional costs and risks, as parties are required to comply with SEF and rules and additional CFTC regulations, including disclosure and recordkeeping obligations, and SEF rights of inspection, among others. SEFs typically charge fees, and if the Fund executes derivatives on a swap execution facility through a broker intermediary, the intermediary may impose fees as well. The Fund also may be required to indemnify a SEF, or a broker intermediary who executes swaps on a SEF on the Fund's behalf, against any losses or costs that may be incurred as a result of the Fund's transactions on the SEF. In addition, the Fund may be subject to execution risk if it enters into a derivatives transaction that is required to be cleared, and no clearing member is willing to clear the transaction on the Fund's behalf. In that case, the transaction might have to be terminated, and the Fund could lose some or all of the benefit of any increase in the value of the transaction after the time of the trade.
The European Union, the United Kingdom and some other countries have implemented similar requirements to the Dodd-Frank Act requirements that will affect a Fund when it enters into derivatives transactions with a counterparty organized in those jurisdictions or otherwise subject to those jurisdictions' derivatives regulations.
Global requirements may also result in increased uncertainty about counterparty credit risk, and they may also limit the flexibility of a Fund to protect its interests in the event of an insolvency of a derivatives counterparty. In the event of a counterparty's (or its affiliate's) insolvency, the Fund's ability to exercise remedies, such as the termination of transactions, netting of obligations and realization on collateral, could be stayed or eliminated under special resolution regimes adopted in the United States, the European Union, the United Kingdom and various other jurisdictions. Such regimes provide government authorities with broad authority to intervene when a financial institution is experiencing financial difficulty. In particular, with respect to counterparties who are subject to such proceedings in the European Union or the United Kingdom, the liabilities of such counterparties to the Fund could be reduced, eliminated, or converted to equity in such counterparties (sometimes referred to as a "bail in").
Additionally, U.S. regulators, the European Union, the United Kingdom and certain other jurisdictions have adopted minimum margin and capital requirements for uncleared derivatives transactions. These regulations may have a material impact on the Fund's use of uncleared derivatives. These rules impose minimum variation (and in some cases, initial) margin requirements on derivatives transactions between the Fund and its swap counterparties and may increase the amount of margin the Fund is required to provide. They impose regulatory requirements on the calculation of margin and the timing of transferring margin.
The CFTC and U.S. futures exchanges have established limits, referred to as "position limits," on the maximum net long or net short positions which any person, or group of persons acting in concert, may own or control in certain futures and options contracts. In addition, federal position limits apply to swaps that are economically equivalent to futures contracts on certain agricultural, metals and energy commodities. All positions owned or controlled by the same person or entity, even if in different accounts, must be aggregated for purposes of determining whether the applicable position limits have been exceeded. Thus, even if a Fund does not intend to exceed applicable position limits, it is possible that different clients managed by the Adviser may be aggregated for this purpose. Therefore, the trading decisions of the Adviser may have to be modified and positions held by a Fund liquidated in order to avoid exceeding such limits. The modification of investment decisions or elimination of open positions that may be required to avoid exceeding such limits may adversely affect the performance of a Fund. A violation of position limits could also lead to regulatory action materially adverse to a Fund. The fund may also be affected by regimes of the European Union and United Kingdom that impose position limits on its trade of commodity derivative contracts.
29
In October 2020, the SEC adopted Rule 18f-4 under the 1940 Act, which applies to a Fund's use of derivative investments and certain financing transactions (e.g., reverse repurchase agreements). Among other things, Rule 18f-4 requires funds that invest in derivative instruments beyond a specified limited amount to apply a value-at-risk based limit to their use of certain derivative instruments and financing transactions and to adopt and implement a derivatives risk management program. A fund that uses derivative instruments (beyond certain currency and interest rate hedging transactions) in a limited amount is not subject to the full requirements of Rule 18f-4. In connection with compliance with Rule 18f-4, funds are no longer required to comply with the asset segregation framework arising from prior SEC guidance for covering certain derivative instruments and related transactions.
These and other new rules and regulations could, among other things, further restrict a Fund's ability to engage in, or increase the cost to a Fund of, derivatives transactions, for example, by making some types of derivatives no longer available to the Fund or otherwise limiting liquidity. This may result in changes to a Fund's principal investment strategies and could adversely affect a Fund's performance and its ability to achieve its investment objective.
Since 2021, the SEC has proposed and, in some cases, finalized several new rules regarding a wide range of topics related to the Funds. For example, the SEC has proposed new rules requiring the reporting and public disclosure of a manager's positions in security-based swaps, including CDS, equity total return swaps and related positions. The SEC has also finalized new rules restricting activities that could be considered to be manipulative in connection with security-based swaps, new rules regarding beneficial ownership and public reporting by managers under Section 13 of the Exchange Act, and new rules requiring the central clearing of certain cash and repurchase transactions involving U.S. Treasuries. These and other proposed new rules, whether assessed on an individual or collective basis, could fundamentally change the current regulatory framework for relevant markets and market participants, including having a material impact on activities of private fund advisers and their funds. While it is currently difficult to predict the full impact of these new rules, these rules could make it more difficult for the Funds to execute certain investment strategies and may have a material adverse effect on a Fund's ability to generate returns.
Economies and financial markets throughout the world are increasingly interconnected. Economic, financial or political events, trading and tariff arrangements, terrorism, natural disasters and other circumstances in one country or region could have profound impacts on global economies or markets. Widespread disease and virus epidemics, such as the recent coronavirus outbreak, could likewise be highly disruptive, adversely affecting individual companies, sectors, industries, markets, currencies, interest and inflation rates, credit ratings, investor sentiment, and other factors affecting the value of the Funds' investments. As a result, whether or not the Funds invest in securities of issuers located in or with significant exposure to the countries directly affected, the value and liquidity of the Funds' investments may be negatively affected.
European financial markets are vulnerable to volatility and losses arising from concerns about the potential exit of member countries from the European Union and/or the Eurozone and, in the latter case, the reversion of those countries to their national currencies. Defaults by Economic Monetary Union member countries on sovereign debt, as well as any future discussions about exits from the Eurozone, may negatively affect a Fund's investments in the defaulting or exiting country, in issuers, both private and governmental, with direct exposure to that country, and in European issuers generally. In addition, the United Kingdom left the European Union on January 31, 2020 (commonly referred to as "Brexit"). During an 11 month transition period, ending December 31, 2020, the United Kingdom and the European Union agreed to a Trade and Cooperation Agreement which sets out the agreement for certain parts of the future relationship between the European Union and the United Kingdom from 1 January 2021. The Trade and Cooperation Agreement does not provide the United Kingdom with the same level of rights or access to all goods and services in the European Union as the United Kingdom previously maintained as a member of the European Union and during the transition period. In particular the Trade and Cooperation Agreement does not include an agreement on financial services. Accordingly, uncertainty remains in certain areas as to the future relationship between the United Kingdom and the European Union. The uncertainty caused by the United Kingdom's departure from the European Union could lead to prolonged political, legal, regulatory, tax and economic uncertainty and wider instability and volatility in the financial markets of the United Kingdom and more broadly across Europe. It may also lead to weakening corporate and financial confidence in such markets as the United Kingdom renegotiates the regulation of the provision of financial services within and to persons in the European Union. Brexit could lead to market dislocation, heightened counterparty risk, an adverse effect on the management of market risk and, in particular, asset and liability management due in part to redenomination of financial assets and liabilities, an adverse effect on the management, operation and investment in each Fund and increased legal, regulatory or compliance burden for each Fund which may have a negative impact on the operations, financial condition, returns or prospects of each Fund. The consequences of the United Kingdom's, or another country's potential, exit from the European Union and/or Eurozone could also threaten the stability of the euro for remaining countries and could negatively affect the financial markets of other countries in the European Union and beyond.
30
REFLOW LIQUIDITY PROGRAM
Certain Funds may participate in the ReFlow liquidity program, which is designed to provide an alternative liquidity source for mutual funds experiencing net redemptions of their shares. Pursuant to the program, ReFlow Fund, LLC ("ReFlow") provides participating mutual funds with a source of cash to meet net shareholder redemptions by standing ready each business day to purchase fund shares up to the value of the net shares redeemed by the other shareholders that are to settle the next business day. After purchasing fund shares, Reflow then redeems those shares when the Fund next experiences net sales, at the end of ReFlow's maximum holding period, or at other times at ReFlow's discretion. For use of the ReFlow service, a Fund pays a fee to ReFlow each time it purchases Fund shares calculated by applying to the purchase amount a fee rate determined through an automated daily auction among participating mutual funds. The current minimum fee rate is 0.15% of the value of the Fund shares purchased by ReFlow. The fee is allocated among the Fund's share classes based on relative net assets. ReFlow's purchases of Fund shares are made on an investment-blind basis without regard to the Fund's investment objective, policies or anticipated performance. ReFlow may purchase various shares of the Fund and will not be subject to any investment minimum applicable to such shares. In accordance with federal securities laws, ReFlow is prohibited from acquiring more than 3% of the outstanding voting securities of the Fund. ReFlow's investments in the Funds are not subject to the Funds' Excessive Trading Policies and Procedures described in the Funds' prospectus. By participating in such a program, there is no assurance that ReFlow will have sufficient funds available to meet the Funds' needs.
INTERFUND LENDING
The SEC has granted an exemptive order to the Funds permitting the Funds to participate in an interfund lending facility whereby participating Funds may directly lend to and borrow money from each other (an "Interfund Loan") for temporary purposes (e.g., to satisfy redemption requests or when a sale of securities "fails," resulting in an unanticipated cash shortfall) (the "InterFund Program").
The InterFund Program is subject to a number of conditions, including, among other things, that each Fund may, to the extent permitted by its investment objective, strategies, and policies, (1) lend uninvested cash to other Calamos Funds in an amount up to 15% of its current net assets at the time of the loan (including lending up to 5% of its net assets to any single Calamos Fund) and (2) borrow money from other Calamos Funds provided that immediately after the borrowing total outstanding borrowings from all sources do not exceed 33 1/3% of its total assets or any lower threshold provided for by a Fund's fundamental restrictions or non-fundamental policies. Each Fund may borrow through the InterFund Program on an unsecured basis (i.e., without posting collateral) if its aggregate outstanding borrowings from all sources immediately after the interfund borrowing total 10% or less of the Fund's total assets. However, if the Fund's aggregate outstanding borrowings from all sources immediately after the interfund borrowing exceed 10% of the Fund's total assets, the Fund may borrow through the InterFund Program on a secured basis only. Each Fund also is required to secure an InterFund Loan on an equal priority basis and with at least an equivalent percentage of collateral to loan value if it has outstanding secured borrowings from other sources, including but not limited to another Calamos Fund, at the time the loan is requested.
Any loan made through the InterFund Program is expected to be more beneficial to a borrowing Fund (i.e., at a lower interest rate) than borrowing from a bank and more beneficial to a lending Fund (i.e., at a higher rate of return) than an alternative short-term investment. The duration of an InterFund Loan will be limited to the time required to receive payment for securities sold, but in no event more than seven days. In addition, each InterFund Loan may be called on one business day's notice by a lending Fund and may be repaid on any day by a borrowing Fund.
The limitations detailed above and the other conditions of the exemptive order, and related compliance procedures adopted by the board of trustees and implemented by the Adviser are designed to minimize the risks associated with interfund lending for both the borrowing Funds and the lending Funds. However, no borrowing or lending activity is without risk. When a Fund borrows money from another Fund, there is a risk that the loan could be called on one business day's notice or not renewed, in which case the Fund may need to borrow from a bank at higher rates if an InterFund Loan were not available from another Fund. Furthermore, a delay in repayment to a lending Fund could result in a lost investment opportunity or additional lending costs. Each Fund may lend or borrow money in an amount of up to 33 1/3% of the Fund's total assets to meet short-term needs, such as in connection with redemptions.
Each Fund incurs interest and other expenses when it borrows money. Borrowing creates leverage, which may increase expenses and increase the impact of the Fund's other risks. The use of leverage may exaggerate any increase or decrease in a Fund's net asset value causing the Fund to be more volatile than a fund that does not borrow.
31
JOINT CREDIT AGREEMENT
The Trust, on behalf of the Funds, is party to a $100,000,000 uncommitted credit agreement with State Street Bank and Trust Company (the "Credit Agreement"). Each Fund may borrow under the Credit Agreement to meet shareholder redemptions and for other lawful temporary purposes. Borrowing results in interest expense and other fees and expenses, which may increase the Fund's net expenses and reduce the Fund's return. In addition, borrowing by the Fund may create leverage by increasing the Fund's investment exposure. This will result in changes in the Fund's net asset value, either positive or negative, being greater than it would have been if the Fund had not borrowed. Administration, legal, and arrangement fees, if applicable, under the Credit Agreement are allocated among Funds based upon factors deemed relevant by the Adviser and the Board of each Fund, while fees on any amounts drawn by a Fund under the Credit Agreement are borne by that Fund.
INVESTMENT RESTRICTIONS
Each Fund (except Merger Arbitrage Fund) is classified as a diversified, open-end management investment company.
Merger Arbitrage Fund is classified as a non-diversified, open-end management investment company. A non-diversified investment company under the 1940 Act means that a fund is not limited by the 1940 Act in the proportion of its assets that it may invest in the obligations of a single issuer. The investment of a large percentage of a fund's assets in the securities of a small number of issuers may cause the fund's share price to fluctuate more than that of a diversified investment company. When compared to a diversified portfolio, a non-diversified fund may invest a greater portion of its assets in a particular issuer and, therefore, has greater exposure to the risk of poor earnings or losses by an issuer.
Except as noted below, each Fund operates under the following investment restrictions and may not:
(i) (for Hedged Equity Fund, Global Convertible Fund, Dividend Growth Fund, Select Fund, International Growth Fund, Evolving World Growth Fund, Global Equity Fund, Global Opportunities Fund, International Small Cap Growth Fund, Total Return Bond Fund, and High Income Opportunities Fund only) make any investment inconsistent with the Fund's classification as a diversified investment company under the 1940 Act if the Fund is classified as a diversified investment company;3
(for Market Neutral Income Fund, Convertible Fund, Timpani Small Cap Growth Fund, Timpani SMID Growth Fund, Growth Fund, Growth and Income Fund, and Short-Term Bond Fund only) as to 75% of its assets, invest more than 5% of its total assets, taken at market value at the time of a particular purchase, in the securities of any one issuer, except that this restriction does not apply to securities issued or guaranteed by the U.S. Government or its agencies or instrumentalities;
(ii) (for each fund, except Phineus Long/Short Fund and Merger Arbitrage Fund) acquire more than 10%, taken at the time of a particular purchase, of the outstanding voting securities of any one issuer;
(iii) act as an underwriter of securities, except insofar as it may be deemed an underwriter for purposes of the Securities Act on disposition of securities acquired subject to legal or contractual restrictions on resale;
(iv) (for Market Neutral Income Fund, Convertible Fund, Growth Fund, and Growth and Income Fund only) invest more than 10% of the Fund's net assets (taken at market value at the time of each purchase) in illiquid securities, including repurchase agreements maturing in more than seven days;
(v) (for Hedged Equity Fund, Phineus Long/Short Fund, Merger Arbitrage Fund, Global Convertible Fund, Timpani Small Cap Growth Fund, Timpani SMID Growth Fund, Dividend Growth Fund, Select Fund, International Growth Fund, Evolving World Growth Fund, Global Equity Fund, Global Opportunities Fund, International Small Cap Growth Fund, Total Return Bond Fund and High Income Opportunities Fund only) purchase or sell real estate (although it may purchase securities secured by real estate or interests therein, or securities issued by companies that invest in real estate or interests therein), commodities or commodity contracts, except that a Fund may enter into (a) futures, options and options on futures, (b) forward contracts and (c) other financial transactions not requiring the delivery of physical commodities;
3 Currently, under the 1940 Act, for a Fund to be classified as a diversified investment company, at least 75% of the value of the Fund's total assets must be represented by cash and cash items (including receivables), government securities, securities of other investment companies, and securities of other issuers, which for the purposes of this calculation are limited in respect of any one issuer to an amount (valued at the time of investment) not greater in value than 5% of the Fund's total assets and to not more than 10% of the outstanding voting securities of such issuer.
32
(for Market Neutral Income Fund, Convertible Fund, Growth Fund, and Growth and Income Fund only) purchase or sell real estate (although it may purchase securities secured by real estate or interests therein, or securities issued by companies that invest in real estate or interests therein), commodities or commodity contracts;
(for Short-Term Bond Fund only) purchase or sell real estate (although it may purchase securities secured by real estate or interests therein, or securities issued by companies that invest in real estate or interests therein), commodities or commodity contracts, except that the Fund may enter into (a) futures, options and options on futures, (b) forward contracts, (c) swaps and (d) other financial transactions not requiring the delivery of physical commodities;
(vi) make loans, but this restriction shall not prevent the Fund from (a) investing in debt obligations, (b) investing in repurchase agreements or (c) lending portfolio securities, provided, however, that it may not lend securities if, as a result, the aggregate value of all securities loaned would exceed 33% of its total assets (taken at market value at the time of such loan);4
(vii) (for Hedged Equity Fund, Phineus Long/Short Fund, Merger Arbitrage Fund, Global Convertible Fund, Timpani Small Cap Growth Fund, Timpani SMID Growth Fund, Dividend Growth Fund, Select Fund, International Growth Fund, Evolving World Growth Fund, Global Equity Fund, Global Opportunities Fund, International Small Cap Growth Fund, Total Return Bond Fund, High Income Opportunities Fund, and Short-Term Bond Fund only) borrow, except from banks, other affiliated funds and other entities to the extent permitted under the 1940 Act;5,7
(for Market Neutral Income Fund, Convertible Fund, Growth Fund, and Growth and Income Fund only) borrow, except that the Fund may (a) borrow up to 10% of its total assets, taken at market value at the time of such borrowing, as a temporary measure for extraordinary or emergency purposes, but not to increase portfolio income (the total of reverse repurchase agreements and such borrowings will not exceed 10% of total assets, and the Fund will not purchase securities when its borrowings exceed 5% of total assets) and (b) enter into transactions in options;5
(viii) (for each Fund except International Small Cap Growth Fund and Short-Term Bond Fund) invest in a security if more than 25% of its total assets (taken at market value at the time of a particular purchase) would be invested in the securities of issuers in any particular industry, except that this restriction does not apply to securities issued or guaranteed by the U.S. Government or its agencies or instrumentalities;6
(for International Small Cap Growth Fund) invest in a security if more than 25% of its total assets (taken at market value at the time of a particular purchase) would be invested in the securities of issuers in any particular industry or group of industries, except that this restriction does not apply to securities issued or guaranteed by the U.S. Government or its agencies or instrumentalities;
(for Short-Term Bond Fund only) invest in a security if more than 25% of its total assets (taken at market value at the time of a particular purchase) would be invested in the securities of issuers in any particular industry. For purposes of this limitation, the Fund will not invest more than 25% of its total assets in each of the following sectors (each sector measured separately): commercial (non-agency) mortgage-backed securities, residential (non-agency) mortgage-backed securities or asset-backed securities. This restriction does not apply to securities issued or guaranteed by the U.S. Government or its agencies or instrumentalities; or
(ix) (for Hedged Equity Fund, Phineus Long/Short Fund, Merger Arbitrage Fund, Global Convertible Fund, Timpani Small Cap Growth Fund, Timpani SMID Growth Fund, Dividend Growth Fund, Select Fund, International Growth Fund, Evolving World Growth Fund, Global Equity Fund, Global Opportunities Fund, International Small Cap Growth Fund, Total Return Bond Fund, High Income Opportunities Fund, and Short-Term Bond Fund only) issue any senior security, except to the extent permitted under the 1940 Act;7
4 This restriction shall not apply to loans made in accordance with the InterFund Program or other exemptive relief that may be granted by the SEC to the Funds with regard to interfund lending.
5 Each Fund's borrowing practices are limited by the 1940 Act. Currently, under the 1940 Act, a Fund may borrow in an aggregate amount not exceeding 331/3% of its total assets, including the proceeds of borrowings, for any purpose, but borrowings from entities other than banks may not exceed 5% of its total assets and may be only as a temporary measure for extraordinary or emergency purposes, unless the Fund has received an exemptive order from the SEC permitting it to borrow from other affiliated funds in excess of 5% of its total assets. None of these Funds, other than Phineus Long/Short Fund, intends to purchase securities when its borrowings exceed 5% of total assets.
6 For Merger Arbitrage Fund, with respect to the investment restriction relating to industry concentration set forth in (viii) above, with respect to investments in SPACs, the Fund will generally look to the investment or investments the SPAC principally holds in determining the SPAC's principal activities and whether to apply its fundamental policy regarding industry concentration to an investment in a SPAC. Many SPACs invest principally in U.S. Treasury obligations, money market funds that invest exclusively in obligations of the U.S. government and other investments that are not limited by the Fund's investment restriction on industry concentration until the SPAC identifies a suitable target for an acquisition or merger.
7 Currently, under the 1940 Act, a "senior security" does not include any promissory note or evidence of indebtedness where the indebtedness is for temporary purposes only and in an amount not exceeding 5% of the value of the total assets of the issuer at the time the loan is made. A loan is presumed to be for temporary purposes if it is repaid within 60 days and is not extended or renewed.
33
(for Market Neutral Income Fund, Convertible Fund, Growth Fund, and Growth and Income Fund only) issue any senior security, except that the Market Neutral Income Fund may sell securities short.8
The Phineus Long/Short Fund was previously classified as a non-diversified investment company. Pursuant to current positions of the SEC staff, the Phineus Long/Short Fund's classification has changed from non-diversified to diversified, and the Phineus Long/Short Fund will not be able to become non-diversified unless it seeks and obtains the approval of shareholders. Accordingly, the Phineus Long/Short Fund may not make any investment inconsistent with its classification as a diversified company under the 1940 Act.8
The above restrictions are fundamental policies and may not be changed with respect to a Fund without the approval of a "majority" of the outstanding shares of that Fund, which for this purpose means the approval of the lesser of (a) more than 50% of the outstanding voting securities of that Fund or (b) 67% or more of the outstanding shares if the holders of more than 50% of the outstanding shares of that Fund are present or represented at the meeting by proxy.
With regard to all Funds other than Phineus Long/Short Fund and except as noted below, in addition to the fundamental restrictions listed above, and as a non-fundamental policy:
(a) (for each Fund except Timpani Small Cap Growth Fund, Timpani SMID Growth Fund, International Small Cap Growth Fund and Short-Term Bond Fund) no Fund may invest in shares of other open-end investment companies, except as permitted by the 1940 Act;9
(for Timpani Small Cap Growth Fund, Timpani SMID Growth Fund, International Small Cap Growth Fund and Short-Term Bond Fund) To the extent other Calamos Funds invest in the Fund in reliance on section 12(d)(1)(G), the Fund may not acquire any securities of registered open-end investment companies or unit investment trusts in reliance on section 12(d)(1)(F) or (G) of the 1940 Act;9
(b) no Fund may invest in companies for the purpose of exercising control or management;
(c) no Fund may purchase securities on margin (except for use of such short-term credits as are necessary for the clearance of transactions, including transactions in options, futures and options on futures), or participate on a joint or a joint and several basis in any trading account in securities, except in connection with transactions in options, futures and options on futures;
(d) no Fund (other than Merger Arbitrage Fund) may make short sales of securities, except that the Fund may make short sales of securities (i) if the Fund owns an equal amount of such securities, or owns securities that are convertible or exchangeable, without payment of further consideration, into an equal amount of such securities, (ii) other than those described in clause (i), provided that no more than 20% of its net assets would be deposited with brokers as collateral or allocated to segregated accounts in connection with all outstanding short sales other than those described in clause (i). Merger Arbitrage Fund is subject to the limitations on its use of short sales of securities under the 1940 Act and the rules and interpretive positions of the SEC under the 1940 Act;
(e) (for each Fund except Short-Term Bond Fund) no Fund may invest more than 25% of its net assets (valued at time of purchase) in securities of foreign issuers (other than securities represented by ADRs and securities guaranteed by a U.S. person), except that Merger Arbitrage Fund and Total Return Bond Fund may invest up to 35% of its net assets in securities of foreign issuers, and each of Global Convertible Fund, International Growth Fund, Evolving World Growth Fund, Global Equity Fund, Global Opportunities Fund and International Small Cap Growth Fund may invest up to all of its net assets in securities of foreign issuers;
8 Currently, under the 1940 Act, for a Fund to be classified as a diversified investment company, at least 75% of the value of the Fund's total assets must be represented by cash and cash items (including receivables), government securities, securities of other investment companies, and securities of other issuers, which for the purposes of this calculation are limited in respect of any one issuer to an amount (valued at the time of investment) not greater in value than 5% of the Fund's total assets and to not more than 10% of the outstanding voting securities of such issuer.
9 Under Section 12(d)(1)(A) of the 1940 Act, each Fund generally must limit its investment in other investment companies so that, as determined immediately after a Fund invests in another investment company: (i) not more than 5% of the value of its total assets will be invested in the securities of any one investment company; (ii) not more than 10% of the value of its total assets will be invested in the aggregate in securities of investment companies; and (iii) not more than 3% of the outstanding voting shares of any one investment company will be owned by the Fund, except as permitted under the 1940 Act, the rules thereunder or SEC exemptive relief. Currently, under the 1940 Act, the rules thereunder and SEC exemptive relief, a Fund may invest in other investment companies in excess of the above limitations if certain requirements are met, including (i) that the Fund complies with Rule 12d1-4 under the 1940 Act or (ii) that any Fund whose shares are acquired by another Fund in accordance with Section 12(d)(1)(G) of the 1940 Act shall not purchase securities of a registered open-end investment company or registered unit investment trust in reliance on either Section 12(d)(1)(F) or Section 12(d)(1)(G) of the 1940 Act. Each Fund may also invest without limitation in money market funds, provided that the Fund complies with Rule 12d1-1 under the 1940 Act. These limitations do not apply in connection with a merger, consolidation, reorganization or acquisition of substantially all the assets of another investment company.
34
(f) (for Hedged Equity Fund, Merger Arbitrage Fund, Global Convertible Fund, Timpani Small Cap Growth Fund, Timpani SMID Growth Fund, Dividend Growth Fund, International Growth Fund, Evolving World Growth Fund, Global Equity Fund, Global Opportunities Fund, International Small Cap Growth Fund, Total Return Bond Fund, High Income Opportunities Fund, and Short-Term Bond Fund) no Fund may invest more than 15% under regulatory rules (or 10% in the case of each other Fund) of the Fund's net assets (taken at market value at the time of each purchase) in illiquid investments that are assets, including repurchase agreements maturing in more than seven days;
(g) (for Hedged Equity Fund, Convertible Fund, Global Convertible Fund, Growth and Income Fund, and Global Opportunities Fund) Consistent with the Fund's investment objective and principal investment strategies the Fund's investment adviser views the strategies as low volatility equity strategies and attempts to achieve equity-like returns with lower than equity market risk by managing a portfolio that it believes will exhibit less volatility over full market cycles;
(h) (for Market Neutral Income Fund and Merger Arbitrage Fund) Consistent with the Fund's investment objective and principal investment strategies may engage in a long/short equity investment strategy and total return swaps to reduce exposure to broader market risk and volatility; or
(i) (for Short-Term Bond Fund) The Fund may not invest more than 20% of its net assets (valued at the time of purchase) in non-U.S. debt securities, including non-dollar denominated debt securities and emerging markets securities.
In addition to the fundamental restrictions listed above, and as a non-fundamental policy Phineus Long/ Short Fund may not:
(a) invest in shares of other investment companies, except as permitted by the 1940 Act;9
(b) invest in companies for the purpose of exercising control or management;
(c) under regulatory rules, invest more than 15% of its net assets (taken at market value at the time of each purchase) in illiquid investments that are assets, including repurchase agreements maturing in more than seven days; or
(d) exceed the following maximum percentages, as applicable, for naked option positions on single issuer securities (excluding ETF and index hedges), judged as notional exposure of naked option position:
(i) 5% notional exposure for the aggregate naked puts on single issuer securities;
(ii) 3% notional exposure for the aggregate naked calls on single issuer securities;
(iii) 10% aggregate exposure for all naked calls on single issuer securities in the portfolio; and
(iv) 10% aggregate exposure for all naked puts on single issuer securities in the portfolio.
The non-fundamental investment restrictions above may be changed by the board of trustees without shareholder approval.
Notwithstanding the foregoing investment restrictions, a Fund may purchase securities pursuant to the exercise of subscription rights, subject to the condition that such purchase will not result in the Fund's ceasing to be a diversified investment company. Far Eastern and European corporations frequently issue additional capital stock by means of subscription rights offerings to existing shareholders at a price substantially below the market price of the shares. The failure to exercise such rights would result in the Fund's interest in the issuing company being diluted. The market for such rights is not well developed in all cases and, accordingly, the Fund may not always realize full value on the sale of rights. The exception applies in cases where the limits set forth in the investment restrictions would otherwise be exceeded by exercising rights or would have already been exceeded as a result of fluctuations in the market value of the Fund's portfolio securities with the result that the Fund would be forced either to sell securities at a time when it might not otherwise have done so, to forego exercising the rights.
9 Under Section 12(d)(1)(A) of the 1940 Act, each Fund generally must limit its investment in other investment companies so that, as determined immediately after a Fund invests in another investment company: (i) not more than 5% of the value of its total assets will be invested in the securities of any one investment company; (ii) not more than 10% of the value of its total assets will be invested in the aggregate in securities of investment companies; and (iii) not more than 3% of the outstanding voting shares of any one investment company will be owned by the Fund, except as permitted under the 1940 Act, the rules thereunder or SEC exemptive relief. Currently, under the 1940 Act, the rules thereunder and SEC exemptive relief, a Fund may invest in other investment companies in excess of the above limitations if certain requirements are met, including (i) that the Fund complies with Rule 12d1-4 under the 1940 Act or (ii) that any Fund whose shares are acquired by another Fund in accordance with Section 12(d)(1)(G) of the 1940 Act shall not purchase securities of a registered open-end investment company or registered unit investment trust in reliance on either Section 12(d)(1)(F) or Section 12(d)(1)(G) of the 1940 Act. Each Fund may also invest without limitation in money market funds, provided that the Fund complies with Rule 12d1-1 under the 1940 Act. These limitations do not apply in connection with a merger, consolidation, reorganization or acquisition of substantially all the assets of another investment company.
35
MANAGEMENT
TRUSTEES AND OFFICERS
The management of the Trust, including general supervision of the duties performed for each Fund under the investment management agreement between the Trust and Calamos Advisors, is the responsibility of its board of trustees. Each trustee elected will hold office for the lifetime of the Trust or until such trustee's earlier resignation, death or removal; however, each trustee who is not an interested person of the Trust shall retire as a trustee at the end of the calendar year in which the trustee attains the age of 75 years.
The following table sets forth each trustee's name, year of birth, position(s) with the Trust, number of portfolios in the Calamos Fund Complex overseen, principal occupation(s) during the past five years and other directorships held, and date first elected or appointed. Each trustee oversees each Fund of the Trust.
TRUSTEES WHO ARE INTERESTED PERSONS OF THE TRUST:
NAME AND
YEAR OF BIRTH
|
|
POSITION(S) AND
LENGTH OF TIME
WITH THE TRUST
|
|
PORTFOLIOS IN
FUND COMPLEX^
OVERSEEN
|
|
PRINCIPAL OCCUPATION(S)
DURING THE PAST 5 YEARS
AND OTHER DIRECTORSHIPS
|
|
EXPERIENCE,
QUALIFICATIONS,
ATTRIBUTES,
SKILLS FOR BOARD
MEMBERSHIP
|
|
|
John P. Calamos, Sr. (1940)*
|
|
Chairman, Trustee and President (since 1988)
|
|
|
33
|
|
|
Founder, Chairman and Global Chief Investment Officer, Calamos Asset Management, Inc. ("CAM"), Calamos Investments LLC ("CILLC"), Calamos Advisors LLC and its predecessor ("Calamos Advisors") and Calamos Wealth Management LLC ("CWM"); Director, CAM; Global Chief Investment Officer, Calamos Antetokounmpo Asset Management LLC ("CGAM"); and previously Chief Executive Officer, Calamos Financial Services LLC and its predecessor ("CFS"), CAM, CILLC, Calamos Advisors, and CWM
|
|
Served for multiple years as a trustee of the Funds; more than 25 years of experience in the financial services industry; experience serving on boards of other entities, including other investment companies; and earned a Masters of Business Administration degree
|
|
TRUSTEES WHO ARE NOT INTERESTED PERSONS OF THE TRUST:
|
John E. Neal (1950)
|
|
Trustee (since 2001); Lead Independent Trustee (since July 2019)
|
|
|
34^^
|
|
|
Retired; private investor; Director, Equity Residential Trust (publicly-owned REIT); Director, Creation Investments (private international microfinance company); Director, Centrust Bank (Northbrook, Illinois community bank); formerly, Director, Neuro-ID (private company providing prescriptive analytics for the risk industry) (until 2021); formerly, Partner, Linden LLC (health care private equity) (until 2018)
|
|
Served for multiple years as a trustee of the Funds; more than 25 years of experience in the financial services industry; experience serving on boards of other entities, including other investment companies; and earned a Masters of Business Administration degree
|
|
36
NAME AND
YEAR OF BIRTH
|
|
POSITION(S) AND
LENGTH OF TIME
WITH THE TRUST
|
|
PORTFOLIOS IN
FUND COMPLEX^
OVERSEEN
|
|
PRINCIPAL OCCUPATION(S)
DURING THE PAST 5 YEARS
AND OTHER DIRECTORSHIPS
|
|
EXPERIENCE,
QUALIFICATIONS,
ATTRIBUTES,
SKILLS FOR BOARD
MEMBERSHIP
|
|
|
William R. Rybak (1951)
|
|
Trustee (since 2002)
|
|
|
33
|
|
|
Private investor; Chairman (since 2016) and Director (since 2010), Christian Brothers Investment Services Inc.; Trustee, Jackson Credit Opportunities Fund (since 2023); Trustee, JNL Series Trust and JNL Investors Series Trust (since 2007), JNL Variable Fund LLC (2007-2020), Jackson Variable Series Trust (2018-2020) and JNL Strategic Income Fund LLC (2007-2018), (open-end mutual funds)**; Trustee, Lewis University (since 2012); Executive Vice President and Chief Financial Officer, Van Kampen Investments, Inc. and subsidiaries (investment manager) (until 2000)
|
|
Served for multiple years as a trustee of the Funds; more than 25 years of experience in the financial services industry; experience serving on boards of other entities, including other investment companies; and earned a Masters of Business Administration degree
|
|
|
Virginia G. Breen (1964)
|
|
Trustee (since 2015)
|
|
|
33
|
|
|
Private Investor; Trustee, UBS NY Fund Cluster (open-end funds) (since 2023)***; Director, Paylocity Holding Corporation (since 2018); Trustee, Neuberger Berman Private Equity Registered Funds (registered private equity funds) (since 2015)****; Director, UBS A&Q Fund Complex (closed-end funds) (since 2008)*****; Trustee, Jones Lang LaSalle Income Property Trust, Inc. (REIT) (2004-2023); Director, Tech and Energy Transition Corporation (blank check company) (2021-2023)
|
|
Served for multiple years as a trustee of the Funds; more than 25 years of experience in the financial services industry; experience serving on boards of other entities, including other investment companies; and earned a Masters of Business Administration degree
|
|
|
Lloyd A. Wennlund (1957)
|
|
Trustee (since 2018)
|
|
|
33
|
|
|
Board Member, Mutual Fund Directors Forum (2023-present); Trustee and Chairman, Datum One Series Trust (since 2020); Expert Affiliate, Bates Group, LLC (financial services consulting and expert testimony firm) (since 2018); Executive Vice President, The Northern Trust Company (1989-2017); President and Business Unit Head of Northern Funds and Northern Institutional Funds (1994-2017); Director, Northern Trust Investments (1998-2017); Governor (2004-2017) and Executive Committee member (2011-2017), Investment Company Institute Board of Governors; Member, Securities Industry Financial Markets Association (SIFMA) Advisory Council, Private Client Services Committee and Private Client Steering Group (2006-2017); Board Member, Chicago Advisory Board of the Salvation Army (2011-2019)
|
|
More than 25 years of experience in the financial services industry; experience serving on boards of other entities, including other investment companies
|
|
37
NAME AND
YEAR OF BIRTH
|
|
POSITION(S) AND
LENGTH OF TIME
WITH THE TRUST
|
|
PORTFOLIOS IN
FUND COMPLEX^
OVERSEEN
|
|
PRINCIPAL OCCUPATION(S)
DURING THE PAST 5 YEARS
AND OTHER DIRECTORSHIPS
|
|
EXPERIENCE,
QUALIFICATIONS,
ATTRIBUTES,
SKILLS FOR BOARD
MEMBERSHIP
|
|
|
Karen L. Stuckey (1953)
|
|
Trustee (since December 2019)
|
|
|
33
|
|
|
Partner (1990-2012) of PricewaterhouseCoopers LLP (professional services firm) (held various positions from 1975-1990); Member of Executive, Nominating, and Audit Committees and Chair of Finance Committee (1992-2006); formerly, Trustee, Denver Board of OppenheimerFunds (open-end mutual funds) (2012-2019)
|
|
More than 25 years of experience in the financial services industry; experience serving on boards of other entities, including other investment companies
|
|
|
Christopher M. Toub (1959)
|
|
Trustee (since December 2019)
|
|
|
33
|
|
|
Private investor; formerly Director of Equities, AllianceBernstein LP (until 2012)
|
|
More than 25 years of experience in the financial services industry; and earned a Masters of Business Administration degree
|
|
^ The Fund Complex consists of Calamos Investment Trust, Calamos Advisors Trust, Calamos Convertible Opportunities and Income Fund, Calamos Convertible and High Income Fund, Calamos Strategic Total Return Fund, Calamos Global Total Return Fund, Calamos Global Dynamic Income Fund, Calamos Dynamic Convertible and Income Fund, Calamos Long/Short Equity & Dynamic Income Trust, Calamos ETF Trust, Calamos Antetokounmpo Sustainable Equities Trust and Calamos Aksia Alternative Credit and Income Fund.
^^ Mr. Neal is the only Trustee of the Trust who oversees Calamos Aksia Alternative Credit and Income Fund.
* Mr. Calamos, Sr. is an "interested person" of the Trust as defined in the 1940 Act because he is an officer of the Trust and an affiliate of Calamos Advisors and CFS.
** Overseeing 131 portfolios in fund complex.
*** Overseeing thirty-eight portfolios in fund complex.
**** Overseeing twenty-one portfolios in fund complex.
***** Overseeing three portfolios in fund complex.
The address of each trustee is 2020 Calamos Court, Naperville, Illinois 60563.
OFFICERS. The preceding table gives information about John P. Calamos, Sr., who is Chairman, Trustee and President of the Trust. The following table sets forth each other officer's name, year of birth, position with the Trust and date first appointed to that position, and principal occupation(s) during the past five years. Each officer serves until his or her successor is chosen and qualified or until his or her resignation or removal by the board of trustees.
|
NAME AND YEAR OF BIRTH |
|
POSITION(S) WITH TRUST |
|
PRINCIPAL OCCUPATION(S) |
|
|
Robert Behan (1964) |
|
Vice President (since 2013) |
|
Executive Vice President, Chief Distribution Officer (since 2021), CAM, CILLC, Calamos Advisors, and CFS; Vice President (since 2022), CGAM; prior thereto President (2015-2021), Head of Global Distribution (2013-February 2021); Executive Vice President (2013-2015); Senior Vice President (2009-2013), Head of US Intermediary Distribution (2010-2013) |
|
|
Thomas E. Herman (1961) |
|
Vice President (since 2016) and Chief Financial Officer (2016-2017 and since 2019) |
|
Executive Vice President (since 2021) and Chief Financial Officer, CAM, CILLC, Calamos Advisors, and CWM (since 2016); Chief Financial Officer (since 2022), CGAM; prior thereto, Chief Financial Officer and Treasurer, Harris Associates (2010-2016) |
|
38
|
NAME AND YEAR OF BIRTH |
|
POSITION(S) WITH TRUST |
|
PRINCIPAL OCCUPATION(S) |
|
|
Erik D. Ojala (1975) |
|
Vice President and Secretary (since 2023) |
|
Senior Vice President, General Counsel and Secretary, CAM, CILLC, Calamos Advisors, CWM (since 2023); Chief Legal Officer, CGAM (since 2023); General Counsel and Secretary, CFS (since 2023); prior thereto, Executive Vice President and General Counsel (2017-2023), Secretary (2010-2023) and Chief Compliance Officer (2021-2023), Harbor Capital Advisors, Inc.; Director and Secretary (2019-2023) and Chief Compliance Officer (2022-2023), Harbor Trust Company, Inc.; Director, Executive Vice President (2017-2023) and Chief Compliance Officer (2017-2021, 2022-2023), Harbor Funds Distributors, Inc.; Director (2017-2023), Assistant Secretary (2014-2023) and Chief Compliance Officer (2022-2023), Harbor Services Group, Inc.; Chief Compliance Officer, Harbor ETF Trust (2021-2023); and Chief Compliance Officer of Harbor Funds (2017-2023) |
|
|
John S. Koudounis (1966) |
|
Vice President (since 2016) |
|
President (since February 2021) and Chief Executive Officer, CAM, CILLC, Calamos Advisors, CWM, and CFS (since 2016); Director, CAM (since 2016); Chairman and Chief Executive Officer (since 2022), CGAM; prior thereto President and Chief Executive Officer (2010-2016), Mizuho Securities USA Inc. |
|
|
Mark J. Mickey (1951) |
|
Chief Compliance Officer (since 2005) |
|
Chief Compliance Officer, Calamos Funds (since 2005) |
|
|
Stephen Atkins (1965) |
|
Treasurer (since 2020) |
|
Senior Vice President, Head of Fund Administration (since 2020), Calamos Advisors; prior thereto Consultant, Fund Accounting and Administration, Vx Capital Partners (2019-2020); Chief Financial Officer and Treasurer of SEC Registered Funds, and Senior Vice President, Head of European Special Purpose Vehicles Accounting and Administration, Avenue Capital Group (2010-2018) |
|
|
Daniel Dufresne (1974) |
|
Vice President (since 2021) |
|
Executive Vice President and Chief Operating Officer, CAM, CILLC, Calamos Advisors, and CWM (since 2021); President (since 2022), CGAM; prior thereto Citadel (1999-2020); Partner (2008-2020); Managing Director, Global Treasurer (2008-2020); Global Head of Operations (2011-2020); Global Head of Counterparty Strategy (2018-2020); Senior Advisor to the COO (2020); CEO, Citadel Clearing LLC (2015-2020) |
|
The address of each officer is 2020 Calamos Court, Naperville, Illinois 60563.
COMMITTEES OF THE BOARD OF TRUSTEES. The Trust's board of trustees currently has five standing committees:
Executive Committee. Messrs. John Calamos and John E. Neal are members of the executive committee, which has authority during intervals between meetings of the board of trustees to exercise the powers of the board, with certain exceptions. John Calamos is an interested trustee of the Trust.
Dividend Committee. Mr. John Calamos serves as the sole member of the dividend committee. The dividend committee is authorized, subject to Board review, to declare distributions on the shares of the Trust's series in accordance with such series' distribution policies, including, but not limited to, regular dividends, special dividends and short- and long-term capital gains distributions.
39
Audit Committee. Messrs. Neal, Rybak (Chair), Toub and Wennlund and Mses. Breen and Stuckey serve on the audit committee. The audit committee operates under a written charter adopted and approved by the board. The audit committee selects independent auditors, approves services to be rendered by the auditors, monitors the auditors' performance, reviews the results of the Trust's audit and responds to other matters deemed appropriate by the board. All members of the audit committee are independent trustees of the Trust.
Valuation Committee. Messrs. Neal, Rybak, Toub, and Wennlund (Chair) and Mses. Breen and Stuckey serve on the valuation committee. The valuation committee operates under a written charter approved by the board. The valuation committee oversees valuation matters of the Trust delegated to the valuation designee, including the fair valuation determinations and methodologies proposed and utilized by the valuation designee, reviews the Trust's valuation procedures and their application by the valuation designee, reviews pricing errors and procedures for calculation of net asset value of each series of the Trust and responds to other matters deemed appropriate by the board.
Governance Committee. Messrs. Neal, Rybak, Toub and Wennlund and Mses. Breen (Chair) and Stuckey serve on the governance committee. The governance committee operates under a written charter adopted and approved by the board. The governance committee oversees the independence and effective functioning of the board of trustees and endeavors to be informed about good practices for mutual fund boards. It also makes recommendations to the board regarding compensation of independent trustees. The governance committee also functions as a nominating committee by making recommendations to the board of trustees regarding candidates for election as non-interested trustees. The governance committee looks to many sources for recommendations of qualified trustees, including current trustees, employees of Calamos Advisors, current shareholders of the Funds, search firms that are compensated for their services and other third party sources. Any such search firm identifies and evaluates potential candidates, conducts screening interviews and provides information to the governance committee with respect to the individual candidates and the market for available candidates. In making trustee recommendations, the governance committee considers a number of factors, including a candidate's background, integrity, knowledge and relevant experience. These factors are set forth in an appendix to the committee's charter. Any prospective candidate is interviewed by the trustees and officers, and references are checked. The governance committee will consider shareholder recommendations regarding potential trustee candidates that are properly submitted to the governance committee for its consideration.
A Fund shareholder who wishes to propose a trustee candidate must submit any such recommendation in writing via regular mail to the attention of the Trust's Secretary, at the address of the Trust's principal executive offices. The shareholder recommendation must include:
• the number and class of all shares of the Trust's series owned beneficially or of record by the nominating shareholder at the time the recommendation is submitted and the dates on which such shares were acquired, specifying the number of shares owned beneficially;
• a full listing of the proposed candidate's education, experience (including knowledge of the investment company industry, experience as a director or senior officer of public or private companies, and directorships on other boards of other registered investment companies), current employment, date of birth, business and residence address, and the names and addresses of at least three professional references;
• information as to whether the candidate is, has been or may be an "interested person" (as such term is defined in the 1940 Act) of the Trust, Calamos Advisors or any of its affiliates, and, if believed not to be or have been an "interested person," information regarding the candidate that will be sufficient for the committee to make such determination;
• the written and signed consent of the candidate to be named as a nominee and to serve as a trustee of the Trust, if elected;
• a description of all arrangements or understandings between the nominating shareholder, the candidate and/or any other person or persons (including their names) pursuant to which the shareholder recommendation is being made, and if none, so specify;
• the class or series and number of all shares of the Trust's series owned of record or beneficially by the candidate, as reported by the candidate; and
• such other information that would be helpful to the governance committee in evaluating the candidate.
The governance committee may require the nominating shareholder to furnish other information it may reasonably require or deem necessary to verify any information furnished pursuant to the procedures delineated above or to determine the
40
qualifications and eligibility of the candidate proposed by the nominating shareholder to serve as a trustee. If the nominating shareholder fails to provide such additional information in writing within seven days of receipt of written request from the governance committee, the recommendation of such candidate will be deemed not properly submitted for consideration, and the governance committee is not required to consider such candidate.
Unless otherwise specified by the governance committee's chairman or by legal counsel to the non-interested trustees, the Trust's Secretary will promptly forward all shareholder recommendations to the governance committee's chairman and the legal counsel to the non-interested trustees, indicating whether the shareholder recommendation has been properly submitted pursuant to the procedures adopted by the governance committee for the consideration of trustee candidates nominated by shareholders.
Recommendations for candidates as trustees will be evaluated, among other things, in light of whether the number of trustees is expected to change and whether the trustees expect any vacancies. During periods when the governance committee is not actively recruiting new trustees, shareholder recommendations will be kept on file until active recruitment is under way. After consideration of a shareholder recommendation, the governance committee may dispose of the shareholder recommendation.
In addition to the above committees, there is a pricing committee, appointed by the board of trustees, comprised of officers of the Trust and employees of Calamos Advisors.
The following table identifies the number of meetings the board and each committee held during the fiscal year ended October 31, 2023.
|
|
|
NUMBER OF
MEETINGS DURING
FISCAL YEAR ENDED
OCTOBER 31, 2023 |
|
|
Board |
|
|
4 |
|
|
|
Executive Committee |
|
|
0 |
|
|
|
Audit Committee |
|
|
4 |
|
|
|
Governance Committee |
|
|
2 |
|
|
|
Dividend Committee |
|
|
12 |
|
|
|
Valuation Committee |
|
|
4 |
|
|
LEADERSHIP STRUCTURE AND QUALIFICATIONS OF THE BOARD OF TRUSTEES. The board of trustees is responsible for oversight of the Trust. The Trust has engaged Calamos Advisors to manage the Funds on a day-to-day basis. The board of trustees oversees Calamos Advisors and certain other principal service providers in the operations of the Funds. The board of trustees is currently composed of seven members, six of whom are non-interested trustees. The board of trustees meets in-person at regularly scheduled meetings four times throughout the year. In addition, the board may meet in-person or by telephone at special meetings or on an informal basis at other times. As described above, the board of trustees has established five standing committees — Audit, Dividend, Executive, Governance and Valuation — and may establish ad hoc committees or working groups from time to time to assist the board of trustees in fulfilling its oversight responsibilities. The non-interested trustees also have engaged independent legal counsel to assist them in fulfilling their responsibilities. Such independent legal counsel also serves as counsel to the Trust.
The chairman of the board of trustees is an "interested person" of the Trust (as such term is defined in the 1940 Act). The non-interested trustees have appointed a lead independent trustee. The lead independent trustee serves as a liaison between Calamos Advisors and the non-interested trustees and leads the non-interested trustees in all aspects of their oversight of the Funds. Among other things, the lead independent trustee reviews and approves, with the chairman, the agenda for each board and committee meeting and facilitates communication among the Trust's non-interested trustees. The trustees believe that the board's leadership structure is appropriate given the characteristics and circumstances of the Trust. The trustees also believe that this structure facilitates the exercise of the board's independent judgment in fulfilling its oversight function and efficiently allocates responsibility among committees.
The board of trustees has concluded that, based on each trustee's experience, qualifications, attributes or skills on an individual basis and in combination with those of the other trustees, each trustee should serve as a member of the board. In making this determination, the board has taken into account the actual service of the trustees during their tenure in concluding that each should continue to serve. The board also has considered each trustee's background and experience. Set forth below is a brief discussion of the specific experience qualifications, attributes or skills of each trustee that led the board to conclude that he or she should serve as a trustee.
41
Each of Messrs. Calamos, Neal, and Rybak has served for more than ten years as a trustee of the Trust. In addition, each of Mses. Breen and Stuckey and Messrs. Calamos, Neal, Rybak, Toub, and Wennlund has more than 25 years of experience in the financial services industry. Each of Mses. Breen and Stuckey and Messrs. Calamos, Neal, Rybak, and Wennlund has experience serving on boards of other entities, including other investment companies. Each of Ms. Breen and Messrs. Calamos, Neal, Rybak and Toub has earned a Masters of Business Administration degree.
RISK OVERSIGHT. The operation of a mutual fund, including its investment activities, generally involves a variety of risks. As part of its oversight of the Funds, the board of trustees oversees risk through various regular board and committee activities. The board of trustees, directly or through its committees, reviews reports from, among others, Calamos Advisors, the Trust's Compliance Officer, the Trust's independent registered public accounting firm, outside legal counsel, and internal auditors of Calamos Advisors or its affiliates, as appropriate, regarding risks faced by the Funds and the risk management programs of Calamos Advisors and certain service providers. The actual day-to-day risk management with respect to the Funds resides with Calamos Advisors and other service providers to the Funds. Although the risk management policies of Calamos Advisors and the service providers are designed to be effective, there is no guarantee that they will anticipate or mitigate all risks. Not all risks that may affect the Funds can be identified, eliminated or mitigated and some risks simply may not be anticipated or may be beyond the control of the board of trustees or Calamos Advisors, its affiliates or other service providers.
TRUSTEE AND OFFICER COMPENSATION. John P. Calamos, Sr., the trustee who is an "interested person" of the Trust, does not receive compensation from the Trust. Although they are compensated, the non-interested trustees do not receive any pension or retirement benefits from the Trust. Mr. Mickey is the only Trust officer who receives compensation from the Trust. The following table sets forth the total compensation (including any amounts deferred, as described below) paid by the Trust during the periods indicated to each of the current trustees and officers compensated by the Trust.
|
NAME
|
|
AGGREGATE
COMPENSATION
FROM THE TRUST
11/1/22-10/31/23
|
|
TOTAL
COMPENSATION
FROM CALAMOS
FUNDS
COMPLEX(2)
11/1/22-10/31/23
|
|
|
John P. Calamos
|
|
$
|
0
|
|
|
$
|
0
|
|
|
|
Virginia Breen
|
|
$
|
140,893
|
|
|
$
|
195,000
|
|
|
|
John E. Neal(1)
|
|
$
|
162,569
|
|
|
$
|
258,626
|
(3)
|
|
|
William R. Rybak
|
|
$
|
148,118
|
|
|
$
|
205,000
|
|
|
|
Karen Stuckey
|
|
$
|
133,668
|
|
|
$
|
185,000
|
|
|
|
Christopher Toub
|
|
$
|
133,668
|
|
|
$
|
185,000
|
|
|
|
Lloyd A. Wennlund
|
|
$
|
140,893
|
|
|
$
|
195,000
|
|
|
|
Mark J. Mickey
|
|
$
|
136,017
|
|
|
$
|
188,171
|
|
|
(1) Includes fees deferred during the relevant period pursuant to a deferred compensation plan. Deferred amounts are treated as though such amounts have been invested and reinvested in shares of one ore more of the Funds as selected by the trustee. As of October 31, 2023 the values of the deferred compensation accounts for Mr. Neal was $2,361,549.
(2) The Fund Complex consists of Calamos Investment Trust, Calamos Advisors Trust, Calamos Convertible Opportunities and Income Fund, Calamos Convertible and High Income Fund, Calamos Strategic Total Return Fund, Calamos Global Total Return Fund, Calamos Global Dynamic Income Fund, Calamos Dynamic Convertible and Income Fund, Calamos Long/Short Equity & Dynamic Income Trust, Calamos ETF Trust, Calamos Antetokounmpo Sustainable Equities Trust and Calamos Aksia Alternative Credit and Income Fund.
(3) Includes compensation received from the Calamos Aksia Alternative Credit and Income Fund in the amount of $33,626. Such compensation is subject to a different compensation schedule and allocation.
The compensation paid to the non-interested trustees of Calamos Funds for their services as such consists of an annual retainer fee in the amount of $210,000 (increased from $185,000, effective on January 1, 2024), with annual supplemental retainers of $40,000 to the lead independent trustee, $20,000 to the chair of the audit committee and $10,000 to the chair of any other committee. Each non-interested trustee receives a meeting attendance fee of $7,000 for any special board meeting attended in person and $3,500 for any special board meeting attended by telephone.
Compensation paid to the non-interested trustees is allocated among the series of the Calamos Funds in accordance with a procedure determined from time to time by the board.
The Trust has adopted a deferred compensation plan for non-interested trustees (the "Plan"). Under the Plan, a trustee who is not an "interested person" of Calamos Advisors and has elected to participate in the Plan (a "participating trustee") may defer receipt of all or a portion of his or her compensation from the Trust in order to defer payment of income taxes or for other reasons. The deferred compensation payable to the participating trustee is credited to the trustee's deferred compensation account as of the business day such compensation otherwise would have been paid to the trustee. The value of a trustee's
42
deferred compensation account at any time is equal to what the value would be if the amounts credited to the account had instead been invested in Class I shares of one or more of the Funds as designated by the trustee. Thus, the value of the account increases with contributions to the account or with increases in the value of the measuring shares, and the value of the account decreases with withdrawals from the account or with declines in the value of the measuring shares. If a participating trustee retires, the trustee may elect to receive payments under the plan in a lump sum or in equal annual installments over a period of five years. If a participating trustee dies, any amount payable under the Plan will be paid to the trustee's beneficiaries. Each Fund's obligation to make payments under the Plan is a general obligation of that Fund. No Fund is liable for any other Fund's obligations to make payments under the Plan.
At December 31, 2023, each trustee beneficially owned (as determined pursuant to Rule 16a-1(a)(2) under the Securities Exchange Act of 1934, as amended ("1934 Act")) shares of the respective Funds, and of all funds in the Fund Complex having values within the indicated dollar ranges.*
|
|
|
MARKET NEUTRAL
INCOME FUND
|
|
HEDGED
EQUITY FUND
|
|
PHINEUS
LONG/SHORT FUND
|
|
MERGER
ARBITRAGE
FUND
|
|
CONVERTIBLE FUND
|
|
|
John P. Calamos, Sr.(1)
|
|
Over $100,000
|
|
Over $100,000
|
|
Over $100,000
|
|
Over $100,000
|
|
Over $100,000
|
|
|
Virginia G. Breen
|
|
None
|
|
None
|
|
Over $100,000
|
|
None
|
|
None
|
|
|
John E. Neal
|
|
Over $100,000
|
|
None
|
|
Over $100,000
|
|
None
|
|
None
|
|
|
William R. Rybak
|
|
$10,001 — $50,000
|
|
None
|
|
None
|
|
None
|
|
$50,001 — $100,000
|
|
|
Karen L. Stuckey
|
|
Over $100,000
|
|
None
|
|
None
|
|
None
|
|
Over $100,000
|
|
|
Christopher M. Toub
|
|
None
|
|
$50,001 — $100,000
|
|
$10,001 — $50,000
|
|
None
|
|
None
|
|
|
Lloyd A. Wennlund
|
|
$10,001 — $50,000
|
|
None
|
|
$10,001 — $50,000
|
|
None
|
|
$10,001 — $50,000
|
|
|
|
|
GLOBAL CONVERTIBLE
FUND |
|
TIMPANI SMALL
CAP GROWTH FUND |
|
TIMPANI SMID
GROWTH FUND |
|
GROWTH FUND |
|
|
John P. Calamos, Sr.(1) |
|
Over $100,000 |
|
Over $100,000 |
|
Over $100,000 |
|
Over $100,000 |
|
|
Virginia G. Breen |
|
None |
|
None |
|
None |
|
None |
|
|
John E. Neal |
|
None |
|
Over $100,000 |
|
Over $100,000 |
|
None |
|
|
William R. Rybak |
|
None |
|
None |
|
None |
|
Over $100,000 |
|
|
Karen L. Stuckey |
|
None |
|
None |
|
None |
|
None |
|
|
Christopher M. Toub |
|
$10,001 — $50,000 |
|
$50,001 — $100,000 |
|
None |
|
None |
|
|
Lloyd A. Wennlund |
|
None |
|
$10,001 — $50,000 |
|
$10,001 — $50,000 |
|
None |
|
|
|
|
GROWTH AND
INCOME FUND |
|
DIVIDEND
GROWTH FUND |
|
SELECT FUND |
|
INTERNATIONAL
GROWTH FUND |
|
|
John P. Calamos, Sr.(1) |
|
Over $100,000 |
|
None |
|
Over $100,000 |
|
Over $100,000 |
|
|
Virginia G. Breen |
|
None |
|
None |
|
None |
|
None |
|
|
John E. Neal |
|
Over $100,000 |
|
None |
|
None |
|
None |
|
|
William R. Rybak |
|
$50,001 — $100,000 |
|
None |
|
$50,001 — $100,000 |
|
None |
|
|
Karen L. Stuckey |
|
None |
|
None |
|
None |
|
None |
|
|
Christopher M. Toub |
|
None |
|
None |
|
None |
|
None |
|
|
Lloyd A. Wennlund |
|
None |
|
None |
|
$10,001 — $50,000 |
|
None |
|
|
|
|
EVOLVING WORLD
GROWTH FUND |
|
GLOBAL EQUITY
FUND |
|
GLOBAL
OPPORTUNITIES
FUND |
|
TOTAL RETURN
BOND FUND |
|
|
John P. Calamos, Sr.(1) |
|
Over $100,000 |
|
Over $100,000 |
|
Over $100,000 |
|
Over $100,000 |
|
|
Virginia G. Breen |
|
None |
|
None |
|
None |
|
None |
|
|
John E. Neal |
|
$50,001 — $100,000 |
|
Over $100,000 |
|
Over $100,000 |
|
Over $100,000 |
|
|
William R. Rybak |
|
None |
|
None |
|
$50,001 — $100,000 |
|
None |
|
|
Karen L. Stuckey |
|
None |
|
None |
|
None |
|
None |
|
|
Christopher M. Toub |
|
None |
|
None |
|
None |
|
None |
|
|
Lloyd A. Wennlund |
|
None |
|
None |
|
None |
|
None |
|
|
|
|
HIGH INCOME
OPPORTUNITIES
FUND |
|
SHORT-TERM
BOND FUND |
|
INTERNATIONAL
SMALL CAP
GROWTH FUND |
|
AGGREGATE DOLLAR
RANGE OF SHARES
OF ALL FUNDS IN
THE FUND COMPLEX |
|
|
John P. Calamos, Sr.(1) |
|
Over $100,000 |
|
Over $100,000 |
|
Over $100,000 |
|
Over $100,000 |
|
|
Virginia G. Breen |
|
None |
|
None |
|
None |
|
Over $100,000 |
|
|
John E. Neal |
|
None |
|
None |
|
None |
|
Over $100,000 |
|
43
|
|
|
HIGH INCOME
OPPORTUNITIES
FUND |
|
SHORT-TERM
BOND FUND |
|
INTERNATIONAL
SMALL CAP
GROWTH FUND |
|
AGGREGATE DOLLAR
RANGE OF SHARES
OF ALL FUNDS IN
THE FUND COMPLEX |
|
|
William R. Rybak |
|
$10,001 — $50,000 |
|
None |
|
None |
|
Over $100,000 |
|
|
Karen L. Stuckey |
|
None |
|
None |
|
None |
|
Over $100,000 |
|
|
Christopher M. Toub |
|
None |
|
None |
|
None |
|
Over $100,000 |
|
|
Lloyd A. Wennlund |
|
None |
|
None |
|
None |
|
Over $100,000 |
|
(1) Pursuant to Rule 16a-1(a)(2) of the 1934 Act, John P. Calamos, Sr. may be deemed to have indirect beneficial ownership of Fund shares held by Calamos Investments LLC, its subsidiaries, and its parent companies (Calamos Asset Management, Inc. and Calamos Partners LLC, and its parent company Calamos Family Partners, Inc.) due to his direct or indirect ownership interest in those entities. As a result, these amounts reflect any holdings of those entities in addition to the individual, personal accounts of John P. Calamos, Sr.
* Valuation as of December 31, 2023.
None of the independent trustees (those trustees) who are not "interested persons" of the Trust as defined in the 1940 Act) own beneficially or of record, any security of Calamos Advisors, CFS, or any person (other than a registered investment company) directly or indirectly controlling, controlled by or under common control with Calamos Advisors or CFS.
CODE OF ETHICS. Employees of Calamos Advisors and Calamos Financial Services LLC ("CFS"), the Funds' distributor, are permitted to make personal securities transactions, including transactions in securities that the Trust may purchase, sell or hold, subject to requirements and restrictions set forth in the Code of Ethics of the Trust, the Code of Ethics of Calamos Advisors and the Code of Ethics of CFS. The Code of Ethics adopted pursuant to Rule 17j-1 under the 1940 Act contains provisions and requirements designed to identify and address certain conflicts of interest between personal investment activities of Calamos Advisors and CFS employees and the interests of investment advisory clients such as the Trust. Among other things, the Code of Ethics prohibits certain types of transactions absent prior approval, imposes time periods during which personal transactions may not be made in certain securities, and requires the submission of duplicate broker confirmations and statements and quarterly reporting of securities transactions. Additional restrictions apply to portfolio managers, traders, research analysts and others involved in the investment advisory process. Exceptions to these and other provisions of the Code of Ethics may be granted in particular circumstances after review by appropriate personnel.
Affiliates of Calamos Advisors and CFS, CAM, CILLC, Calamos Partners LLC ("CPL"), Calamos Family Partners, Inc. ("CFP") and the owners of these affiliates, which include John P. Calamos, Sr. and members of his family ("Calamos Family"), may invest in products managed by Calamos Advisors to support the continued growth of our investment products and strategies, including investments to seed new products. Notwithstanding any provision to the contrary in the Code of Ethics, investments made by CAM, CILLC, CPL, CFP and the Calamos Family in products managed by Calamos Advisors are not subject to restrictions of the Code of Ethics regarding short term or speculative trading. As a result, such entities or individuals may hedge corporate or personal investments in such products. However, these hedging transactions are subject to pre-clearance by the Corporate Investment Committee. Calamos Advisors' Chief Compliance Officer ("CCO") and the Funds' CCO are copied in the approval process. In addition, these entities do not receive preferential treatment over clients. They may, however, be traded together with discretionary client transactions.
The General Counsel may approve additional strategies or instruments based on unusual market circumstances and on the determination that the transactions would not impact the broader market or conflict with any customer activity.
PROXY VOTING PROCEDURES. Each Fund has delegated proxy voting responsibilities to Calamos Advisors, subject to the board of trustees' general oversight. Each Fund expects Calamos Advisors to vote proxies related to that Fund's portfolio securities for which the Fund has voting authority consistent with the Fund's best interests. Calamos Advisors has adopted its own Proxy Voting Policies and Procedures (the "Policies"). The Policies address, among other things, conflicts of interest that may arise between the Funds' interests, and the interests of Calamos Advisors and its affiliates.
The following is a summary of the Policies used by Calamos Advisors in voting proxies.
To assist it in voting proxies, Calamos Advisors has established a Proxy Review Committee ("committee") comprised of members of its Portfolio Management (which may include portfolio managers and/or research analysts), Operations, Legal and Compliance Departments. The committee and/or its members will vote proxies using the following guidelines.
In general, if Calamos Advisors believes that a company's management and board have interests sufficiently aligned with the Fund's interest, Calamos Advisors will vote in favor of proposals recommended by the company's board. More specifically, Calamos Advisors seeks to ensure that the board of directors of a company is sufficiently aligned with security holders' interests
44
and provides proper oversight of the company's management. In many cases this may be best accomplished by having a majority of independent board members. Calamos generally prefers that key committees such as audit, nominating, and compensation committees be comprised of independent directors.
Because of the enormous variety and complexity of transactions that are presented to shareholders, such as mergers, acquisitions, reincorporations, adoptions of anti-takeover measures (including adoption of a shareholder rights plan, requiring supermajority voting on particular issues, adoption of fair price provisions, issuance of blank check preferred stocks and the creation of a separate class of stock with unequal voting rights), changes to capital structures (including authorizing additional shares, repurchasing stock or approving a stock split), executive compensation and option plans, that occur in a variety of industries, companies and market cycles, it is extremely difficult to foresee exactly what would be in the best interests of a Fund in all circumstances. Moreover, voting on such proposals involves considerations unique to each transaction. Accordingly, Calamos Advisors will vote on a case-by-case basis on proposals presenting these transactions.
Calamos Advisors has assigned its administrative duties with respect to the proxy analysis and voting decisions to the "Proxy Group" (the Investment team — research analysts and portfolio management), and administrative processing to its Corporate Actions Group within the Operations Department. To assist it in analyzing proxies, Calamos subscribes to Glass Lewis an unaffiliated third-party corporate governance research service that provides in-depth analyses of shareholder meeting agendas, and voting recommendations. Glass Lewis facilitates the voting of each proxy by applying Calamos' custom proxy voting rules ("proxy voting policy") to the proposal(s). Any proxy proposal that is not covered by the proxy voting guidelines is reviewed and considered by Calamos' proxy group and voted in accordance with that review. Calamos has two sets of custom proxy voting rules: environmental, social and governance ("ESG") proxy voting rules, and non-ESG proxy voting rules.
Finally, Calamos Advisors has established procedures to help resolve conflicts of interests that might arise when voting proxies for the Funds. Calamos will generally apply its proxy voting policy to proxy proposals regardless if a conflict has been identified. However, in these situations, the Proxy Group will refer the proxy proposal, along with the recommended course of action, if any, to the Proxy Review Committee or a subcommittee thereof (each, a "committee") for evaluation. The committee will independently review the proposals and determine the appropriate action to be taken. The committee will then memorialize the conflict and the procedures used to address the conflict.
The Trust is required to file with the SEC its complete proxy voting record for the 12-month period ending June 30, by no later than August 31 of each year. The Trust's proxy voting record for the most recent 12-month period ending June 30 is available by August 31 of each year (1) on the SEC's website at www.sec.gov, and (2) without charge, upon request, by calling 800-582-6959.
You may obtain a copy of Calamos Advisors' Policies by calling 800.582.6959, by visiting Calamos Advisors' website at www.calamos.com, by writing Calamos Advisors at: Calamos Investments, Attn: Client Services, 2020 Calamos Court, Naperville, IL 60563, and on the SEC's website at www.sec.gov.
DISCLOSURE OF PORTFOLIO HOLDINGS. The board of trustees, including a majority of the non-interested trustees, has adopted policies and procedures to govern the disclosure of portfolio security holdings. The board of trustees considered the circumstances under which portfolio security holdings may be disclosed to different categories of persons and how to address actual and potential conflicts of interests between the interests of the Funds' shareholders, on the one hand, and those of Calamos Advisors and CFS, on the other. After giving due consideration to such matters and after exercising their fiduciary duties and reasonable business judgment, the board of trustees determined that the Funds have a legitimate business purpose for disclosing portfolio security holdings to the persons described in the policies and procedures, and that the policies and procedures are reasonably designed to ensure that disclosures of portfolio security holdings are not opposed to the best interests of shareholders and appropriately address the potential for material conflicts of interest.
Calamos Advisors and CFS carry out the policies and procedures governing disclosure of portfolio security holdings, and as such have access to information regarding portfolio security holdings on a daily basis and may disclose that information to the Funds' service providers and other third parties only in accordance with the policies and procedures adopted by the board of trustees.
Disclosure to the Public. For each fund, excluding Market Neutral Income Fund, a complete list of portfolio holdings as of the last business day of the preceding calendar month may be disclosed no earlier than 30 days after the last business day of the previous calendar month. For Market Neutral Income Fund, a complete list of portfolio holdings as of the last business day of the preceding calendar quarter may be disclosed no earlier than 30 days after the last business day of end of the previous calendar month.
45
A subset of each Fund's portfolio security holdings "top ten" list may be disclosed as of the last business day of the preceding month.
Portfolio attribution, any information relating to a Fund's portfolio characteristics, such as, but not limited to, industries or sectors within a Fund, income distributions, potential capital gains, beta, average weighted average, current yield, or SEC yield may be disclosed for any time period, after the last business day of such time period.
Based on an internal exception process and review of conflicts of interest, the Funds may publicly disclose whether an individual security is, or is not, owned by a Fund if the Funds determine that the disclosure is not opposed to the best interests of shareholders and any conflicts of interest are addressed. Such an exception shall be reported to the Funds' Board of Trustees at the next scheduled meeting.
NON-PUBLIC DISCLOSURE
Disclosure to Rating and Ranking Agencies. A complete list of portfolio security holdings as of the last business day of the preceding calendar quarter may be disclosed to rating or ranking agencies, such as S&P, Moody's, Morningstar, Inc. ("Morningstar") and Lipper, Inc. ("Lipper"), no earlier than 30 days after the end of such quarter. Any non-public disclosure to rating or ranking agencies shall be made subject to a duty of confidentiality, including a duty not to trade on non-public information. As of December 31, 2023, the following rating or ranking agencies are provided portfolio security holdings information in connection with the above procedures: Standard & Poor's Financial Services, LLC, Bloomberg LP, Refinitiv, Morningstar, Inc., and FactSet Financial Research Systems, Inc.
Disclosure to Third Parties. Portfolio security holdings may be disclosed more frequently than described above to third parties, with little or no lag time, when a Fund has a legitimate business purpose for doing so. The frequency and lag time of such disclosure is based upon each party's need for the information. Third parties include, but are not limited to, each Fund's investment adviser or sub-adviser, principal underwriter, custodian, transfer agent, administrator, fund accounting agent, financial accounting agent, independent auditors, attorneys or such other selected third parties. As of December 31, 2023, the following parties receive non-public portfolio security holdings disclosure: Calamos Advisors, CFS, State Street Bank and Trust Company, Ernst & Young LLP, U.S. Bank Global Fund Services, Charles River Systems, Inc., Deloitte & Touche LLP, Ropes & Gray LLP, DFIN and Toppan Merrill. The third parties have a duty to keep the Funds' non-public information confidential either through written contractual arrangements with the Funds or Calamos Advisors, or by the nature of their fiduciary duty with respect to the Funds, which includes a duty of confidentiality and a duty to refrain from trading on non-public information. The Funds may be harmed if the service providers breach any non-contractual duty to keep the Funds' non-public information confidential as the Funds may have no contractual remedies or recourse against such breaching parties.
In addition, the Funds, Calamos Advisors, CFS and the Funds' administrator and custodian may, for legitimate business purposes within the scope of their duties and responsibilities, disclose portfolio security holdings (whether a complete list of portfolio security holdings or a subset thereof) and other positions comprising the Funds' assets to one or more broker-dealers or foreign custodians during the course of, or in connection with, normal day-to-day securities and derivative transactions with or through such broker-dealers or foreign custodians, subject to such broker-dealer's obligation and/or foreign custodian's fiduciary duty not to disclose or use material, non-public information concerning the Funds' portfolio security holdings without the consent of the Funds or their agents. Any such disclosure must be approved in writing by Calamos Advisors' General Counsel or, in his absence, the Trust's Chief Compliance Officer.
Disclosures required by Applicable Law. The Funds, Calamos Advisors and CFS may disclose portfolio security holdings information of the Funds as may be required by applicable law, rule, regulation or court order. Any officer of the Funds, Calamos Advisors or CFS is authorized to disclose portfolio security holdings pursuant to these policies and procedures.
As part of the Funds' compliance program under Rule 38a-1 under the 1940 Act, the Trust's Chief Compliance Officer periodically will review or cause to be reviewed portfolio security holding disclosures in order to seek compliance with these policies and procedures. The board of trustees will oversee disclosures through the reporting of the Chief Compliance Officer.
The Funds, Calamos Advisors and CFS do not receive compensation or other consideration for the disclosure of portfolio security holdings.
46
INVESTMENT ADVISORY SERVICES
Investment management and certain other services are provided to the Trust by Calamos Advisors pursuant to a Management Agreement (the "Management Agreement") dated August 1, 2000, as amended. Calamos Advisors also furnishes office space, equipment and management personnel to the Trust. For more information, see the prospectus under "Who manages the Funds?"
Each Fund pays Calamos Advisors a fee based on its average daily net assets that is accrued daily and paid on a monthly basis.
Each of Market Neutral Income Fund, Hedged Equity Fund, Convertible Fund, and Growth and Income Fund pays a fee on its average daily net assets at the annual rate of 0.75% on the first $500 million, 0.70% on the next $500 million, and 0.65% on average daily net assets in excess of $1 billion.
Phineus Long/Short Fund pays a fee on its average daily net assets at the annual rate of 1.25% on the first $500 million, 1.20% on the next $500 million and 1.15% on average daily net assets in excess of $1 billion.
Merger Arbitrage Fund pays a fee on its average daily net assets at the annual rate of 1.00% on the first $500 million, 0.95% on the next $500 million and 0.90% on average daily net assets in excess of $1 billion.
Global Convertible Fund pays a fee on its average daily net assets at the annual rate of 0.85% on the first $500 million, 0.80% on the next $500 million, and 0.75% on average daily net assets in excess of $1 billion.
Timpani Small Cap Growth Fund pays a fee on its average daily net assets at the annual rate of 0.90% on the first $500 million, 0.80% on the next $500 million, and 0.75% on average daily net assets in excess of $1 billion.
Timpani SMID Growth Fund pays a fee on its average daily net assets at the annual rate of 0.95% on the first $500 million, 0.85% on the next $500 million, and 0.80% on average daily net assets in excess of $1 billion.
Growth Fund pays a fee on its average daily net assets at the annual rate of 1.00% on the first $500 million, 0.90% on the next $500 million, 0.80% on the next $5 billion (over $1 billion to $6 billion), and 0.70% on average daily net assets in excess of $6 billion.
Each of Dividend Growth Fund, Select Fund, and Global Opportunities Fund pays a fee on its average daily net assets at the annual rate of 1.00%on the first $500 million, 0.95% on the next $500 million, 0.90% on the next $5 billion (over $1 billion to $6 billion), and 0.80% on average daily net assets in excess of $6 billion.
International Small Cap Growth Fund pays a fee based on its average daily net assets at the annual rate of 0.95% on the first $500 million, 0.90% on the next $500 million, and 0.85% on average daily net assets in excess of $1 billion.
Evolving World Growth Fund pays a fee on its average daily net assets at the annual rate of 1.10% on the first $500 million, 1.05% on the next $500 million, 1.00% on the next $5 billion (over $1 billion to $6 billion), and 0.90% on average daily net assets in excess of $6 billion.
Total Return Bond Fund pays a fee on its average daily net assets at the annual rate of 0.45% on the first $500 million, 0.43% on the next $500 million, 0.41% on the next $5 billion (over $1 billion to $6 billion), and 0.35% on average daily net assets in excess of $6 billion.
High Income Opportunities Fund pays a fee on its average daily net assets at the annual rate of 0.60% on the first $500 million, 0.55% on the next $500 million, and 0.50% on average daily net assets in excess of $1 billion.
Short-Term Bond Fund pays a fee on its average daily net assets at the annual rate of 0.30% on the first $500 million, 0.27% on the next $500 million, and 0.25% on average daily net assets in excess of $1 billion.
Each of International Growth Fund and Global Equity Fund pays a base fee, subject to possible adjustment based on the Fund's performance, as described in the prospectus. The base fee is at the annual rate of 1.00% on the first $500 million, 0.95% on the next $500 million, 0.90% on the next $5 billion (over $1 billion to $6 billion), and 0.80% on average daily net assets in excess of $6 billion. For International Growth Fund, the performance adjustment equally increases or decreases the fee, on a monthly basis, by 1/12 of 0.03% of the Fund's average daily net assets over the performance measurement period for each full 1% increment amount by which the Fund outperforms or underperforms the MSCI EAFE Growth Index (the "Growth Index") over the performance measurement period on an annualized basis, respectively. For Global Equity Fund, the performance adjustment equally increases or decreases the fee, on a monthly basis, by 1/12 of 0.03% of the Fund's average daily net assets
47
over the performance measurement period for each full 1% increment amount by which the Fund outperforms or underperforms the MSCI World Index (the "World Index") over the performance measurement period on an annualized basis, respectively.
It is possible that the Funds' contractual expense reimbursement agreement with Calamos Advisors may have the effect of increasing the outperformance adjustment to the base fee paid to Calamos Advisors, or decreasing the underperformance adjustment to the base fee paid to Calamos Advisors. The payment and calculation of the performance adjustment is subject to the ultimate supervision of the board of trustees, and the board of trustees has the authority to terminate the contractual expense reimbursement agreement at any time. If the board of trustees determines that another index is appropriate for International Growth Fund or Global Equity Fund, it may designate a successor index to be substituted, subject to approval by shareholders.
The performance measurement period for International Growth Fund began at the start of the first full month of operation (April 1, 2005) and includes the trailing 36 months. The performance measurement period for Global Equity Fund began at the start of the first full month of operation (March 1, 2007) and includes the trailing 36 months. Prior to February 1, 2008, only the base fee was payable, and there was no performance adjustment. Commencing in February 2008, the base fee was subject to adjustment based on the performance of the Fund's Class A shares relative to that of the World Index over the 12 calendar months ended February 29, 2008. For each succeeding month through February 2010, the performance measurement period increased by one month, and thereafter the performance measurement period became the trailing 36 months.
The performance comparison is made at the end of each month. The maximum annualized performance adjustment rate for each of International Growth Fund and Global Equity Fund is +/-0.30% of such Fund's average daily net assets over the performance measurement period. The performance adjustment rate is divided by 12 and multiplied by the Fund's average daily net assets over the performance measurement period, and the resulting dollar amount is then added to or subtracted from the base fee. Calamos Advisors may receive a positive performance adjustment even if the Fund has a negative return over a performance measurement period if it otherwise outperforms its respective Index during that period.
The investment performance of each of International Growth Fund and Global Equity Fund will be the sum of: (1) the change in such Fund's net asset value ("NAV") per Class A share during the performance measurement period; plus (2) the value of such Fund's cash distributions per share accumulated to the end of the performance measurement period; plus (3) the value of capital gains taxes per share paid or payable on undistributed realized long-term capital gains accumulated to the end of the performance measurement period; expressed as a percentage of such Fund's NAV per Class A share at the beginning of the performance measurement period. For this purpose, the value of distributions per share of realized capital gains, of dividends per share paid from investment income and of capital gains taxes per share paid or payable on undistributed realized long-term capital gains shall be treated as reinvested in shares of the Fund at the NAV in effect at the close of business on the record date for the payment of such distributions and dividends and the date on which provision is made for such taxes, after giving effect to such distributions, dividends and taxes.
The investment record of each Index will be the sum of: (1) the change in the level of the Index during the performance measurement period; plus (2) the value, computed consistently with the Index, of cash distributions made by companies whose securities comprise the Index accumulated to the end of the performance management period; expressed as a percentage of the Index level at the beginning of the performance measurement period. For this purpose, cash distributions on the securities which comprise the Index shall be treated as reinvested in the index at least as frequently as the end of each calendar quarter following the payment of the dividend.
When a fund in the Calamos Family of Funds (an "Acquiring Fund") invests in shares of another fund in the Calamos Family of Funds (an "Acquired Fund"), the portion of the Acquiring Fund's advisory fee equal to the advisory fee payable to the Acquired Fund (based on average daily net assets invested) is waived.
Calamos Advisors is a wholly owned subsidiary of Calamos Investments LLC ("CILLC"). Calamos Asset Management, Inc. ("CAM") is the sole manager of CILLC. As of December 31, 2023, approximately 22% of the outstanding interests of CILLC was owned by CAM and the remaining approximately 78% of CILLC was owned by Calamos Partners LLC ("CPL") and John P. Calamos, Sr. CAM was owned by John P. Calamos, Sr. and John S. Koudounis, and CPL was owned by John S. Koudounis and Calamos Family Partners, Inc. ("CFP"). CFP was beneficially owned by members of the Calamos family, including John P. Calamos, Sr. In addition, Mr. Koudounis has the option to purchase a controlling interest in CPL upon the death or permanent disability of John P. Calamos, Sr., provided Mr. Koudounis is then serving as Chief Executive Officer of CAM and CILLC. John P. Calamos, Sr., is an affiliated person of the Funds and Calamos Advisors by virtue of his position as Chairman, Trustee and
48
President of the Trust and Chairman and Global Chief Investment Officer ("Global CIO") of Calamos Advisors. John S. Koudounis, Robert F. Behan, Thomas E. Herman, Erik D. Ojala, Stephen Atkins, and Daniel Dufresne are affiliated persons of the Funds and Calamos Advisors by virtue of their positions as Vice President; Vice President; Vice President and Chief Financial Officer; Vice President and Secretary; Treasurer; and Vice President of the Trust; respectively, and as President and Chief Executive Officer; Executive Vice President and Chief Distribution Officer; Executive Vice President and Chief Financial Officer; Senior Vice President, General Counsel and Secretary; Senior Vice President and Head of Fund Administration; and Executive Vice President and Chief Operating Officer, respectively.
During the periods shown below, each of the Funds paid total advisory fees and was reimbursed by Calamos Advisors for expenses in excess of applicable expense limitations or due to contractual fee waivers. Payments were as follows:
DESCRIPTION OF FUND
|
|
YEAR ENDED
10/31/23
|
|
YEAR ENDED
10/31/22
|
|
YEAR ENDED
10/31/21
|
|
|
Market Neutral Income Fund
|
|
|
Advisory fee
|
|
$
|
96,435,157
|
|
|
$
|
116,939,758
|
|
|
$
|
86,674,597
|
|
|
|
Waiver or reimbursement
|
|
|
(985,807
|
)
|
|
|
(999,822
|
)
|
|
|
(461,836
|
)
|
|
|
Net Fee
|
|
|
95,449,350
|
|
|
|
115,939,936
|
|
|
|
86,212,761
|
|
|
|
Hedged Equity Fund
|
|
|
Advisory fee
|
|
$
|
4,195,408
|
|
|
$
|
4,573,528
|
|
|
$
|
3,407,532
|
|
|
|
Waiver or reimbursement
|
|
|
0
|
|
|
|
0
|
|
|
|
0
|
|
|
|
Net Fee
|
|
|
4,195,408
|
|
|
|
4,573,528
|
|
|
|
3,407,532
|
|
|
|
Phineus Long/Short Fund
|
|
|
Advisory fee
|
|
$
|
11,334,604
|
|
|
$
|
8,423,375
|
|
|
$
|
6,508,825
|
|
|
|
Waiver or reimbursement
|
|
|
0
|
|
|
|
0
|
|
|
|
0
|
|
|
|
Net Fee
|
|
|
11,334,604
|
|
|
|
8,423,375
|
|
|
|
6,508,825
|
|
|
|
Merger Arbitrage Fund(1)
|
|
|
Advisory fee
|
|
$
|
1,472
|
|
|
$
|
0
|
|
|
$
|
0
|
|
|
|
Waiver or reimbursement
|
|
|
(25,019
|
)
|
|
|
0
|
|
|
|
0
|
|
|
|
Net Fee
|
|
|
(23,547
|
)
|
|
|
0
|
|
|
|
0
|
|
|
|
Convertible Fund
|
|
|
Advisory fee
|
|
$
|
6,890,150
|
|
|
$
|
8,901,824
|
|
|
$
|
10,533,093
|
|
|
|
Waiver or reimbursement
|
|
|
0
|
|
|
|
0
|
|
|
|
0
|
|
|
|
Net Fee
|
|
|
6,890,150
|
|
|
|
8,901,824
|
|
|
|
10,533,093
|
|
|
|
Global Convertible Fund
|
|
|
Advisory fee
|
|
$
|
1,084,984
|
|
|
$
|
1,655,654
|
|
|
$
|
2,249,547
|
|
|
|
Waiver or reimbursement
|
|
|
(3,418
|
)
|
|
|
0
|
|
|
|
0
|
|
|
|
Net Fee
|
|
|
1,081,566
|
|
|
|
1,655,654
|
|
|
|
2,249,547
|
|
|
|
Timpani Small Cap Growth Fund
|
|
|
Advisory fee
|
|
$
|
2,723,817
|
|
|
$
|
3,540,106
|
|
|
$
|
2,685,552
|
|
|
|
Waiver or reimbursement
|
|
|
(205,982
|
)
|
|
|
(292,694
|
)
|
|
|
(189,360
|
)
|
|
|
Net Fee
|
|
|
2,517,835
|
|
|
|
3,247,412
|
|
|
|
2,496,192
|
|
|
|
Timpani SMID Growth Fund
|
|
|
Advisory fee
|
|
$
|
166,130
|
|
|
$
|
182,484
|
|
|
$
|
220,851
|
|
|
|
Waiver or reimbursement
|
|
|
(109,798
|
)
|
|
|
(106,234
|
)
|
|
|
(103,916
|
)
|
|
|
Net Fee
|
|
|
56,332
|
|
|
|
76,250
|
|
|
|
116,935
|
|
|
|
Growth Fund
|
|
|
Advisory fee
|
|
$
|
11,166,371
|
|
|
$
|
13,066,505
|
|
|
$
|
15,055,081
|
|
|
|
Waiver or reimbursement
|
|
|
0
|
|
|
|
0
|
|
|
|
0
|
|
|
|
Net Fee
|
|
|
11,166,371
|
|
|
|
13,066,505
|
|
|
|
15,055,081
|
|
|
|
Growth & Income Fund
|
|
|
Advisory fee
|
|
$
|
15,797,951
|
|
|
$
|
17,325,937
|
|
|
$
|
17,411,853
|
|
|
|
Waiver or reimbursement
|
|
|
0
|
|
|
|
0
|
|
|
|
0
|
|
|
|
Net Fee
|
|
|
15,797,951
|
|
|
|
17,325,937
|
|
|
|
17,411,853
|
|
|
|
Dividend Growth Fund
|
|
|
Advisory fee
|
|
$
|
167,768
|
|
|
$
|
178,025
|
|
|
$
|
161,765
|
|
|
|
Waiver or reimbursement
|
|
|
(124,694
|
)
|
|
|
(120,770
|
)
|
|
|
(112,225
|
)
|
|
|
Net Fee
|
|
|
43,074
|
|
|
|
57,255
|
|
|
|
49,540
|
|
|
49
DESCRIPTION OF FUND
|
|
YEAR ENDED
10/31/23
|
|
YEAR ENDED
10/31/22
|
|
YEAR ENDED
10/31/21
|
|
|
Select Fund
|
|
|
Advisory fee
|
|
$
|
435,234
|
|
|
$
|
460,308
|
|
|
$
|
483,920
|
|
|
|
Waiver or reimbursement
|
|
|
(202,897
|
)
|
|
|
(192,104
|
)
|
|
|
(204,517
|
)
|
|
|
Net Fee
|
|
|
232,337
|
|
|
|
268,204
|
|
|
|
279,403
|
|
|
|
International Growth Fund
|
|
|
Advisory fee
|
|
$
|
2,111,272
|
|
|
$
|
2,266,447
|
|
|
$
|
2,809,601
|
|
|
|
Performance fee
|
|
|
(66,928
|
)
|
|
|
321,477
|
|
|
|
279,283
|
|
|
|
Waiver or reimbursement
|
|
|
(682,887
|
)
|
|
|
(1,223,993
|
)
|
|
|
(1,283,136
|
)
|
|
|
Net Fee
|
|
|
1,361,457
|
|
|
|
1,363,931
|
|
|
|
1,805,748
|
|
|
|
Evolving World Growth Fund
|
|
|
Advisory fee
|
|
$
|
4,721,499
|
|
|
$
|
4,935,164
|
|
|
$
|
6,276,427
|
|
|
|
Waiver or reimbursement
|
|
|
(1,467,736
|
)
|
|
|
(1,489,399
|
)
|
|
|
(1,744,036
|
)
|
|
|
Net Fee
|
|
|
3,253,763
|
|
|
|
3,445,765
|
|
|
|
4,532,391
|
|
|
|
Global Equity Fund
|
|
|
Advisory fee
|
|
$
|
804,022
|
|
|
$
|
934,348
|
|
|
$
|
1,261,431
|
|
|
|
Performance fee
|
|
|
(52,637
|
)
|
|
|
89,037
|
|
|
|
127,174
|
|
|
|
Waiver or reimbursement
|
|
|
(87,632
|
)
|
|
|
(200,665
|
)
|
|
|
(224,393
|
)
|
|
|
Net Fee
|
|
|
663,753
|
|
|
|
822,720
|
|
|
|
1,164,212
|
|
|
|
Global Opportunities Fund
|
|
|
Advisory fee
|
|
$
|
2,161,339
|
|
|
$
|
2,485,643
|
|
|
$
|
2,360,240
|
|
|
|
Waiver or reimbursement
|
|
|
(597,703
|
)
|
|
|
(602,953
|
)
|
|
|
(350,259
|
)
|
|
|
Net Fee
|
|
|
1,563,636
|
|
|
|
1,882,690
|
|
|
|
2,009,981
|
|
|
|
International Small Cap Growth(2)
|
|
|
Advisory fee
|
|
$
|
22,312
|
|
|
$
|
9,661
|
|
|
$
|
0
|
|
|
|
Waiver or reimbursement
|
|
|
(180,947
|
)
|
|
|
(145,216
|
)
|
|
|
0
|
|
|
|
Net Fee
|
|
|
(158,635
|
)
|
|
|
(135,555
|
)
|
|
|
0
|
|
|
|
Total Return Bond Fund
|
|
|
Advisory fee
|
|
$
|
150,899
|
|
|
$
|
190,330
|
|
|
$
|
341,349
|
|
|
|
Waiver or reimbursement
|
|
|
(113,216
|
)
|
|
|
(101,258
|
)
|
|
|
(80,345
|
)
|
|
|
Net Fee
|
|
|
37,683
|
|
|
|
89,072
|
|
|
|
261,004
|
|
|
|
High Income Fund
|
|
|
Advisory fee
|
|
$
|
211,524
|
|
|
$
|
244,140
|
|
|
$
|
256,440
|
|
|
|
Waiver or reimbursement
|
|
|
(153,238
|
)
|
|
|
(162,000
|
)
|
|
|
(140,229
|
)
|
|
|
Net Fee
|
|
|
58,286
|
|
|
|
82,140
|
|
|
|
116,211
|
|
|
|
Short-Term Bond Fund
|
|
|
Advisory fee
|
|
$
|
1,105,907
|
|
|
$
|
1,126,735
|
|
|
$
|
562,884
|
|
|
|
Waiver or reimbursement
|
|
|
(1,314
|
)
|
|
|
0
|
|
|
|
(11,056
|
)
|
|
|
Net Fee
|
|
|
1,104,593
|
|
|
|
1,126,735
|
|
|
|
551,828
|
|
|
(1) Merger Arbitrage Fund commenced operations on September 29, 2023.
(2) International Small Cap Growth Fund commenced operations on March 31, 2022.
The use of the name "Calamos" in the name of the Trust and in the names of the Funds are pursuant to licenses granted by Calamos Investments LLC, and the Trust has agreed to change the names to remove those references if Calamos Advisors ceases to act as investment adviser to the Funds.
EXPENSES
Subject to the expense limitations described below, the Funds pay all their own operating expenses that are not specifically assumed by Calamos Advisors, including (i) fees of Calamos Advisors; (ii) interest, taxes and any governmental filing fees; (iii) compensation and expenses of the trustees, other than those who are interested persons of the Trust, Calamos Advisors or CFS; (iv) legal, audit, custodial and transfer agency fees and expenses; (v) fees and expenses related to the Funds' organization and registration and qualification of the Funds and their shares under federal and state securities laws; (vi) expenses of printing and mailing reports, notices and proxy material to shareholders, and expenses incidental to meetings of shareholders; (vii) expenses of preparing prospectuses and of printing and distributing them to existing shareholders; (viii) insurance premiums; (ix) litigation and indemnification expenses and other extraordinary expenses not incurred in the normal course of the business of
50
the Trust; (x) distribution expenses pursuant to the Funds' Distribution Plans; and (xi) brokerage commissions and other transaction-related costs.
Calamos Advisors contractually agreed to limit the annual operating expenses of each class of shares of each Fund in excess of certain limits as reflected in the table below through March 1, 2025 for each Fund other than International Small Cap Growth Fund and Merger Arbitrage Fund and through March 31, 2025 for International Small Cap Growth Fund and October 31, 2026 for Merger Arbitrage Fund. For purposes of this agreement, operating expenses do not include taxes, interest, short interest, short dividend expenses, brokerage commissions, acquired fund fees and expenses, foreign tax reclaim expenses, and extraordinary expenses (as determined in the discretion of Calamos Advisors), such as litigation costs.
|
FUND |
|
CLASS |
|
LIMITATION
PERIOD |
|
EXPENSE
LIMITATION |
|
|
Calamos Market Neutral Income Fund |
|
Class A |
|
3/1/2025 |
|
|
1.75 |
% |
|
|
|
|
Class C |
|
3/1/2025 |
|
|
2.50 |
% |
|
|
|
|
Class I |
|
3/1/2025 |
|
|
1.50 |
% |
|
|
|
|
Class R6 |
|
3/1/2025 |
|
|
1.50 |
%(a) |
|
|
Calamos Hedged Equity Fund |
|
Class A |
|
3/1/2025 |
|
|
1.25 |
% |
|
|
|
|
Class C |
|
3/1/2025 |
|
|
2.00 |
% |
|
|
|
|
Class I |
|
3/1/2025 |
|
|
1.00 |
% |
|
|
Calamos Phineus Long/Short Fund |
|
Class A |
|
3/1/2025 |
|
|
2.00 |
% |
|
|
|
|
Class C |
|
3/1/2025 |
|
|
2.75 |
% |
|
|
|
|
Class I |
|
3/1/2025 |
|
|
1.75 |
% |
|
|
Calamos Merger Arbitrage Fund |
|
Class A |
|
10/31/2026 |
|
|
1.50 |
% |
|
|
|
|
Class C |
|
10/31/2026 |
|
|
2.25 |
% |
|
|
|
|
Class I |
|
10/31/2026 |
|
|
1.25 |
% |
|
|
Calamos Convertible Fund |
|
Class A |
|
3/1/2025 |
|
|
1.75 |
% |
|
|
|
|
Class C |
|
3/1/2025 |
|
|
2.50 |
% |
|
|
|
|
Class I |
|
3/1/2025 |
|
|
1.50 |
% |
|
|
Calamos Global Convertible Fund |
|
Class A |
|
3/1/2025 |
|
|
1.35 |
% |
|
|
|
|
Class C |
|
3/1/2025 |
|
|
2.10 |
% |
|
|
|
|
Class I |
|
3/1/2025 |
|
|
1.10 |
% |
|
|
Calamos Timpani Small Cap Growth Fund |
|
Class A |
|
3/1/2025 |
|
|
1.30 |
% |
|
|
|
|
Class C |
|
3/1/2025 |
|
|
2.05 |
% |
|
|
|
|
Class I |
|
3/1/2025 |
|
|
1.05 |
% |
|
|
|
|
Class R6 |
|
3/1/2025 |
|
|
1.05 |
%(b) |
|
|
Calamos Timpani SMID Growth Fund |
|
Class A |
|
3/1/2025 |
|
|
1.35 |
% |
|
|
|
|
Class I |
|
3/1/2025 |
|
|
1.10 |
% |
|
|
|
|
Class R6 |
|
3/1/2025 |
|
|
1.10 |
%(c) |
|
|
Calamos Growth Fund |
|
Class A |
|
3/1/2025 |
|
|
1.75 |
% |
|
|
|
|
Class C |
|
3/1/2025 |
|
|
2.50 |
% |
|
|
|
|
Class I |
|
3/1/2025 |
|
|
1.50 |
% |
|
|
Calamos Growth and Income Fund |
|
Class A |
|
3/1/2025 |
|
|
1.75 |
% |
|
|
|
|
Class C |
|
3/1/2025 |
|
|
2.50 |
% |
|
|
|
|
Class I |
|
3/1/2025 |
|
|
1.50 |
% |
|
|
|
|
Class R6 |
|
3/1/2025 |
|
|
1.50 |
%(d) |
|
|
Calamos Dividend Growth Fund |
|
Class A |
|
3/1/2025 |
|
|
1.35 |
% |
|
|
|
|
Class C |
|
3/1/2025 |
|
|
2.10 |
% |
|
|
|
|
Class I |
|
3/1/2025 |
|
|
1.10 |
% |
|
|
Calamos Select Fund |
|
Class A |
|
3/1/2025 |
|
|
1.15 |
% |
|
|
|
|
Class C |
|
3/1/2025 |
|
|
1.90 |
% |
|
|
|
|
Class I |
|
3/1/2025 |
|
|
0.90 |
% |
|
|
Calamos International Growth Fund |
|
Class A |
|
3/1/2025 |
|
|
1.20 |
% |
|
|
|
|
Class C |
|
3/1/2025 |
|
|
1.95 |
% |
|
|
|
|
Class I |
|
3/1/2025 |
|
|
0.95 |
% |
|
|
|
|
Class R6 |
|
3/1/2025 |
|
|
0.95 |
%(e) |
|
|
Calamos Evolving World Growth Fund |
|
Class A |
|
3/1/2025 |
|
|
1.30 |
% |
|
|
|
|
Class C |
|
3/1/2025 |
|
|
2.05 |
% |
|
|
|
|
Class I |
|
3/1/2025 |
|
|
1.05 |
% |
|
51
|
FUND |
|
CLASS |
|
LIMITATION
PERIOD |
|
EXPENSE
LIMITATION |
|
|
Calamos Global Equity Fund |
|
Class A |
|
3/1/2025 |
|
|
1.40 |
% |
|
|
|
|
Class C |
|
3/1/2025 |
|
|
2.15 |
% |
|
|
|
|
Class I |
|
3/1/2025 |
|
|
1.15 |
% |
|
|
|
|
Class R6 |
|
3/1/2025 |
|
|
1.15 |
%(f) |
|
|
Calamos Global Opportunities Fund |
|
Class A |
|
3/1/2025 |
|
|
1.22 |
% |
|
|
|
|
Class C |
|
3/1/2025 |
|
|
1.97 |
% |
|
|
|
|
Class I |
|
3/1/2025 |
|
|
0.97 |
% |
|
|
Calamos International Small Cap Growth Fund |
|
Class A |
|
3/31/2025 |
|
|
1.35 |
% |
|
|
|
|
Class C |
|
3/31/2025 |
|
|
2.10 |
% |
|
|
|
|
Class I |
|
3/31/2025 |
|
|
1.10 |
% |
|
|
|
|
Class R6 |
|
3/31/2025 |
|
|
1.10 |
%(g) |
|
|
Calamos Total Return Bond Fund |
|
Class A |
|
3/1/2025 |
|
|
0.90 |
% |
|
|
|
|
Class C |
|
3/1/2025 |
|
|
1.65 |
% |
|
|
|
|
Class I |
|
3/1/2025 |
|
|
0.65 |
% |
|
|
Calamos High Income Opportunities Fund |
|
Class A |
|
3/1/2025 |
|
|
1.00 |
% |
|
|
|
|
Class C |
|
3/1/2025 |
|
|
1.75 |
% |
|
|
|
|
Class I |
|
3/1/2025 |
|
|
0.75 |
% |
|
|
Calamos Short-Term Bond Fund |
|
Class A |
|
3/1/2025 |
|
|
0.65 |
% |
|
|
|
|
Class I |
|
3/1/2025 |
|
|
0.40 |
% |
|
(a) Class R6 Total Annual Operating Expenses are limited to 1.50% less Market Neutral Income Fund's annual sub-transfer agency ratio (the aggregate sub-transfer agency fees of the Market Neutral Income Fund's other share classes divided by the aggregate average annual net assets of the Market Neutral Income Fund's other share classes).
(b) Class R6 Total Annual Operating Expenses are limited to 1.05% less Timpani Small Cap Growth Fund's annual sub-transfer agency ratio (the aggregate sub-transfer agency fees of the Timpani Small Cap Growth Fund's other share classes divided by the aggregate average annual net assets of the Timpani Small Cap Growth Fund's other share classes).
(c) Class R6 Total Annual Operating Expenses are limited to 1.10% less Timpani SMID Growth Fund's annual sub-transfer agency ratio (the aggregate sub-transfer agency fees of the Timpani SMID Growth Fund's other share classes divided by the aggregate average annual net assets of the Timpani SMID Growth Fund's other share classes).
(d) Class R6 Total Annual Operating Expenses are limited to 1.50% less Growth and Income Fund's annual sub-transfer agency ratio (the aggregate sub-transfer agency fees of the Growth and Income Fund's other share classes divided by the aggregate average annual net assets of the Growth and Income Fund's other share classes).
(e) Class R6 Total Annual Operating Expenses are limited to 0.95% less International Growth Fund's annual sub-transfer agency ratio (the aggregate sub-transfer agency fees of the International Growth Fund's other share classes divided by the aggregate average annual net assets of the International Growth Fund's other share classes).
(f) Class R6 Total Annual Operating Expenses are limited to 1.15% less Global Equity Fund's annual sub-transfer agency ratio (the aggregate sub-transfer agency fees of the Global Equity Fund's other share classes divided by the aggregate average annual net assets of the Global Equity Fund's other share classes).
(g) Class R6 Total Annual Operating Expenses are limited to 1.10% less International Small Cap Growth Fund's annual sub-transfer agency ratio (the aggregate sub-transfer agency fees of the International Small Cap Growth Fund's other share classes divided by the aggregate average annual net assets of the International Small Cap Growth Fund's other share classes).
For all Funds, except Growth Fund:
TEAM APPROACH TO MANAGEMENT
Calamos Advisors employs a "team of teams" approach to portfolio management, led by the Global CIO and our CIO team consisting of 5 Co-CIOs with specialized areas of investment expertise. The Global CIO and Co-CIO team are responsible for oversight of investment team resources, investment processes, performance and risk. As heads of investment verticals, Co-CIOs manage investment team members and, along with Co-Portfolio Managers and Associate Portfolio Managers, have day-to-day portfolio oversight and construction responsibilities of their respective investment strategies. While investment research professionals within each Co-CIO's team are assigned specific strategy responsibilities, they also provide support to other investment team verticals, creating deeper insights across a wider range of investment strategies. The combination of specialized investment teams with cross team collaboration results in what we call our Team of Teams approach.
This team of teams approach is further reflected in the composition of Calamos Advisors' Investment Committee, made up of the Global CIO, the Co-CIO team, and the Global Head of Trading. Other members of the investment team participate in Investment Committee meetings in connection with specific investment related issues or topics as deemed appropriate.
The structure and composition of the Investment Committee results in a number of benefits, as it:
• Leads to broader perspective on investment decisions: multiple viewpoints and areas of expertise feed into consensus;
• Promotes collaboration between teams; and
• Functions as a think tank with the goal of identifying ways to outperform the market on a risk-adjusted basis.
52
The objectives of the Investment Committee are to:
• Form the firm's top-down macro view, market direction, asset allocation, and sector/country positioning.
• Establish firm-wide secular and cyclical themes for review.
• Review firm-wide and portfolio risk metrics, recommending changes where appropriate.
• Review firm-wide, portfolio and individual security liquidity constraints.
• Evaluate firm-wide and portfolio investment performance.
• Evaluate firm-wide and portfolio hedging policies and execution.
• Evaluate enhancements to the overall investment process.
John P. Calamos, Sr., Founder, Chairman and Global CIO, is responsible for the day-to-day management of the team, bottom-up research efforts and strategy implementation. R. Matthew Freund, Michael Grant, John Hillenbrand, Nick Niziolek, Eli Pars, Dennis Cogan, Brandon Nelson, Jon Vacko, and Joe Wysocki, are each Sr. Co-Portfolio Managers; Jason Hill, David O'Donohue, Chuck Carmody, Ryan Isherwood, John Saf, Anthony Vecchiolla, Christian Brobst, and Jimmy Young are each Co-Portfolio Managers; and Kyle Ruge, Paul Ryndak, Dino Dussias and Michael Kassab are each Associate Portfolio Managers for the Funds for which each has been so designated. Sr. Co- Portfolio Managers, Co-Portfolio Managers, and Associate Portfolio Managers are collectively referred to within this registration statement as "Portfolio Managers".
For Growth Fund only:
John P. Calamos, Sr., R. Matthew Freund, and Michael Grant are the lead portfolio managers for the Fund. As lead portfolio managers, Messrs. Calamos, Freund, and Grant have responsibility for allocating the portfolio across the market capitalization spectrum, sectors, and geographies within the portfolio's eligible investment universe and reviewing the overall composition of the portfolio to ensure compliance with its stated investment objective. Messrs. Calamos, Freund, and Grant also have access to members of the investment team, each of whom may be at certain times, at the discretion of the lead portfolio managers, allocated a specified portion of the portfolio over which he or she has independent responsibility for research, security selection, and portfolio construction.
For all Funds:
The Global CIO, and Portfolio Managers also have responsibility for the day-to-day management of accounts other than the Funds. Information regarding these other accounts as of October 31, 2023 is set forth below.
Other Accounts Managed and Assets by Account Type as of October 31, 2023:
|
|
|
REGISTERED
INVESTMENT COMPANIES
|
|
OTHER POOLED
INVESTMENT VEHICLES
|
|
OTHER ACCOUNTS
|
|
|
|
|
ACCOUNTS
|
|
ASSETS
|
|
ACCOUNTS
|
|
ASSETS
|
|
ACCOUNTS
|
|
ASSETS
|
|
|
John P. Calamos Sr.
|
|
|
24
|
|
|
|
27,467,286,397
|
|
|
|
5
|
|
|
|
670,551,689
|
|
|
|
5,152
|
|
|
|
4,002,702,692
|
|
|
|
R. Matthew Freund
|
|
|
16
|
|
|
|
12,446,240,748
|
|
|
|
3
|
|
|
|
573,409,680
|
|
|
|
4,882
|
|
|
|
3,993,046,568
|
|
|
|
Michael Grant
|
|
|
3
|
|
|
|
2,578,348,234
|
|
|
|
0
|
|
|
|
—
|
|
|
|
118
|
|
|
|
113,207,540
|
|
|
|
John Hillenbrand
|
|
|
14
|
|
|
|
10,422,679,474
|
|
|
|
5
|
|
|
|
670,551,689
|
|
|
|
4,030
|
|
|
|
3,235,215,539
|
|
|
|
Nick Niziolek
|
|
|
11
|
|
|
|
7,282,646,281
|
|
|
|
3
|
|
|
|
151,590,745
|
|
|
|
3,430
|
|
|
|
2,008,583,817
|
|
|
|
Eli Pars
|
|
|
15
|
|
|
|
24,899,943,446
|
|
|
|
6
|
|
|
|
725,000,426
|
|
|
|
3,978
|
|
|
|
3,148,682,295
|
|
|
|
Dennis Cogan
|
|
|
11
|
|
|
|
7,282,646,281
|
|
|
|
3
|
|
|
|
151,590,745
|
|
|
|
3,430
|
|
|
|
2,008,583,817
|
|
|
|
Brandon Nelson
|
|
|
2
|
|
|
|
254,416,414
|
|
|
|
2
|
|
|
|
74,056,775
|
|
|
|
4
|
|
|
|
110,908,948
|
|
|
|
Jon Vacko
|
|
|
15
|
|
|
|
10,867,460,145
|
|
|
|
5
|
|
|
|
670,551,689
|
|
|
|
3,995
|
|
|
|
3,182,801,619
|
|
|
|
Joe Wysocki
|
|
|
12
|
|
|
|
10,787,406,984
|
|
|
|
4
|
|
|
|
667,807,809
|
|
|
|
3,253
|
|
|
|
2,181,760,815
|
|
|
|
Jason Hill
|
|
|
3
|
|
|
|
14,497,103,228
|
|
|
|
0
|
|
|
|
—
|
|
|
|
0
|
|
|
|
—
|
|
|
|
David O'Donohue
|
|
|
3
|
|
|
|
14,497,103,228
|
|
|
|
0
|
|
|
|
—
|
|
|
|
0
|
|
|
|
—
|
|
|
|
Christian Brobst
|
|
|
4
|
|
|
|
4,107,984,580
|
|
|
|
0
|
|
|
|
—
|
|
|
|
0
|
|
|
|
—
|
|
|
|
Chuck Carmody
|
|
|
10
|
|
|
|
7,953,907,274
|
|
|
|
0
|
|
|
|
—
|
|
|
|
451
|
|
|
|
1,007,769,299
|
|
|
|
Ryan Isherwood
|
|
|
1
|
|
|
|
16,155,689
|
|
|
|
2
|
|
|
|
74,056,775
|
|
|
|
7
|
|
|
|
100,274,694
|
|
|
|
John Saf
|
|
|
1
|
|
|
|
357,632,441
|
|
|
|
0
|
|
|
|
—
|
|
|
|
94
|
|
|
|
227,381,617
|
|
|
|
Jimmy Young
|
|
|
3
|
|
|
|
14,497,103,228
|
|
|
|
0
|
|
|
|
—
|
|
|
|
0
|
|
|
|
—
|
|
|
|
Michael Kassab
|
|
|
1
|
|
|
|
43,316,134
|
|
|
|
0
|
|
|
|
—
|
|
|
|
0
|
|
|
|
—
|
|
|
53
|
|
|
REGISTERED
INVESTMENT COMPANIES
|
|
OTHER POOLED
INVESTMENT VEHICLES
|
|
OTHER ACCOUNTS
|
|
|
|
|
ACCOUNTS
|
|
ASSETS
|
|
ACCOUNTS
|
|
ASSETS
|
|
ACCOUNTS
|
|
ASSETS
|
|
|
Paul Ryndak
|
|
|
5
|
|
|
|
837,007,703
|
|
|
|
0
|
|
|
|
—
|
|
|
|
0
|
|
|
|
—
|
|
|
|
Kyle Ruge
|
|
|
5
|
|
|
|
837,007,703
|
|
|
|
0
|
|
|
|
—
|
|
|
|
0
|
|
|
|
—
|
|
|
|
Anthony Vecchiolla
|
|
|
4
|
|
|
|
14,617,491,658
|
|
|
|
0
|
|
|
|
—
|
|
|
|
0
|
|
|
|
—
|
|
|
|
Dino Dussias
|
|
|
3
|
|
|
|
2,310,994,014
|
|
|
|
2
|
|
|
|
518,960,944
|
|
|
|
0
|
|
|
|
—
|
|
|
Number of Accounts and Assets for which Advisory Fee is Performance Based as of October 31, 2023:
|
|
|
REGISTERED
INVESTMENT COMPANIES
|
|
OTHER POOLED
INVESTMENT VEHICLES
|
|
OTHER ACCOUNTS
|
|
|
|
|
ACCOUNTS
|
|
ASSETS
|
|
ACCOUNTS
|
|
ASSETS
|
|
ACCOUNTS
|
|
ASSETS
|
|
|
John P. Calamos Sr.
|
|
|
2
|
|
|
|
276,927,945
|
|
|
|
0
|
|
|
|
—
|
|
|
|
0
|
|
|
|
—
|
|
|
|
R. Matthew Freund
|
|
|
0
|
|
|
|
—
|
|
|
|
0
|
|
|
|
—
|
|
|
|
0
|
|
|
|
—
|
|
|
|
Michael Grant
|
|
|
0
|
|
|
|
—
|
|
|
|
0
|
|
|
|
—
|
|
|
|
0
|
|
|
|
—
|
|
|
|
John Hillenbrand
|
|
|
0
|
|
|
|
—
|
|
|
|
0
|
|
|
|
—
|
|
|
|
0
|
|
|
|
—
|
|
|
|
Nick Niziolek
|
|
|
2
|
|
|
|
276,927,945
|
|
|
|
0
|
|
|
|
—
|
|
|
|
0
|
|
|
|
—
|
|
|
|
Eli Pars
|
|
|
0
|
|
|
|
—
|
|
|
|
0
|
|
|
|
—
|
|
|
|
0
|
|
|
|
—
|
|
|
|
Dennis Cogan
|
|
|
2
|
|
|
|
276,927,945
|
|
|
|
0
|
|
|
|
—
|
|
|
|
0
|
|
|
|
—
|
|
|
|
Brandon Nelson
|
|
|
0
|
|
|
|
—
|
|
|
|
0
|
|
|
|
—
|
|
|
|
1
|
|
|
|
12,957,092
|
|
|
|
Jon Vacko
|
|
|
0
|
|
|
|
—
|
|
|
|
0
|
|
|
|
—
|
|
|
|
0
|
|
|
|
—
|
|
|
|
Joe Wysocki
|
|
|
0
|
|
|
|
—
|
|
|
|
0
|
|
|
|
—
|
|
|
|
0
|
|
|
|
—
|
|
|
|
Jason Hill
|
|
|
0
|
|
|
|
—
|
|
|
|
0
|
|
|
|
—
|
|
|
|
0
|
|
|
|
—
|
|
|
|
David O'Donohue
|
|
|
0
|
|
|
|
—
|
|
|
|
0
|
|
|
|
—
|
|
|
|
0
|
|
|
|
—
|
|
|
|
Christian Brobst
|
|
|
0
|
|
|
|
—
|
|
|
|
0
|
|
|
|
—
|
|
|
|
0
|
|
|
|
—
|
|
|
|
Chuck Carmody
|
|
|
0
|
|
|
|
—
|
|
|
|
0
|
|
|
|
—
|
|
|
|
0
|
|
|
|
—
|
|
|
|
Ryan Isherwood
|
|
|
0
|
|
|
|
—
|
|
|
|
0
|
|
|
|
—
|
|
|
|
4
|
|
|
|
2,322,838
|
|
|
|
John Saf
|
|
|
0
|
|
|
|
—
|
|
|
|
0
|
|
|
|
—
|
|
|
|
0
|
|
|
|
—
|
|
|
|
Jimmy Young
|
|
|
0
|
|
|
|
—
|
|
|
|
0
|
|
|
|
—
|
|
|
|
0
|
|
|
|
—
|
|
|
|
Michael Kassab
|
|
|
0
|
|
|
|
—
|
|
|
|
0
|
|
|
|
—
|
|
|
|
0
|
|
|
|
—
|
|
|
|
Paul Ryndak
|
|
|
2
|
|
|
|
276,927,945
|
|
|
|
0
|
|
|
|
—
|
|
|
|
0
|
|
|
|
—
|
|
|
|
Kyle Ruge
|
|
|
2
|
|
|
|
276,927,945
|
|
|
|
0
|
|
|
|
—
|
|
|
|
0
|
|
|
|
—
|
|
|
|
Anthony Vecchiolla
|
|
|
0
|
|
|
|
—
|
|
|
|
0
|
|
|
|
—
|
|
|
|
0
|
|
|
|
—
|
|
|
|
Dino Dussias
|
|
|
0
|
|
|
|
—
|
|
|
|
0
|
|
|
|
—
|
|
|
|
0
|
|
|
|
—
|
|
|
Each Co-Portfolio Manager may invest for his own benefit in securities held in brokerage and mutual fund accounts. The information shown in the table does not include information about those accounts where the Co-Portfolio Manager or members of his family have a beneficial or pecuniary interest because no advisory relationship exists with Calamos Advisors or any of its affiliates.
The Funds' Portfolio Managers are responsible for managing both the Funds and other accounts, including separate accounts and funds not required to be registered under the 1940 Act.
Other than potential conflicts between investment strategies, the side-by-side management of both the Funds and other accounts may raise potential conflicts of interest due to the interest held by Calamos Advisors in an account and certain trading practices used by the portfolio managers (e.g., cross trades between a Fund and another account and allocation of aggregated trades). Calamos Advisors has developed policies and procedures reasonably designed to mitigate those conflicts. For example, Calamos Advisors will only place cross-trades in securities held by the Funds in accordance with the rules promulgated under the 1940 Act and has adopted policies designed to ensure the fair allocation of securities purchased on an aggregated basis. The allocation methodology employed by Calamos Advisors varies depending on the type of securities sought to be bought or sold and the type of client or group of clients. Generally, however, orders are placed first for those clients that have given Calamos Advisors brokerage discretion (including the ability to step out a portion of trades), and then to clients that have directed Calamos Advisors to execute trades through a specific broker. However, if the directed broker allows Calamos Advisors to execute with other brokerage firms, which then book the transaction directly with the directed broker, the order will be placed as if the client had given Calamos Advisors full brokerage discretion. Calamos Advisors and its affiliates frequently use a "rotational" method of placing and aggregating client orders and will build and fill a position for a designated client or group of clients before placing orders for other clients.
54
A client account may not receive an allocation of an order if: (a) the client would receive an unmarketable amount of securities based on account size; (b) the client has precluded Calamos Advisors from using a particular broker; (c) the cash balance in the client account will be insufficient to pay for the securities allocated to it at settlement; (d) current portfolio attributes make an allocation inappropriate; and (e) account specific guidelines, objectives and other account specific factors make an allocation inappropriate. Allocation methodology may be modified when strict adherence to the usual allocation is impractical or leads to inefficient or undesirable results. Calamos Advisors' head trader must approve each instance that the usual allocation methodology is not followed and provide a reasonable basis for such instances and all modifications must be reported in writing to Calamos Advisors' Chief Compliance Officer on a monthly basis. Investment opportunities for which there is limited availability generally are allocated among participating client accounts pursuant to an objective methodology (i.e., either on a pro rata basis or using a rotational method, as described above). However, in some instances, Calamos Advisors may consider subjective elements in attempting to allocate a trade, in which case a Fund may not participate, or may participate to a lesser degree than other clients, in the allocation of an investment opportunity. In considering subjective criteria when allocating trades, Calamos Advisors is bound by its fiduciary duty to its clients to treat all client accounts fairly and equitably.
The Portfolio Managers advise certain accounts under a performance fee arrangement. A performance fee arrangement may create an incentive for a Co-Portfolio Manager to make investments that are riskier or more speculative than would be the case in the absence of performance fees. A performance fee arrangement may result in increased compensation to the Portfolio Managers from such accounts due to unrealized appreciation as well as realized gains in the client's account.
As of October 31, 2023, John P. Calamos, Sr., our Global CIO, aside from distributions arising from his ownership from various entities, receives all of his compensation from Calamos Advisors. He has entered into an employment agreement that provides for compensation in the form of an annual base salary and an annual bonus, both components payable in cash. Similarly, Mr. Calamos is eligible for Calamos Advisors' Long-Term Incentive ("LTI") program, which is an incentive award vesting over time that reflects appreciation and depreciation in the value of both the funds managed by such professional and the company generally. LTI awards granted in 2023 vest on a three-year schedule (25% on or about the first anniversary of the award grant, 25% on or about the second anniversary of the award grant, and 50% on or about the third anniversary of the award grant). Each investment team LTI award will be allocated as follows: (i) 33.3% to track the value of the associate's managed strategies, (ii) 33.3% to track the Calamos strategy of the associate's choice, and (iii) 33.3% to track the value of the firm; all over the vesting period.
As of October 31, 2023, R. Matthew Freund, Michael Grant, John Hillenbrand, Nick Niziolek, Eli Pars, Dennis Cogan, Brandon Nelson, Jon Vacko, Joe Wysocki, Jason Hill, David O'Donohue, Christian Brobst, Chuck Carmody, Ryan Isherwood, John Saf, Anthony Vecchiolla, Jimmy Young, Dino Dussias, Michael Kassab, Kyle Ruge, and Paul Ryndak receive all of their compensation from Calamos Advisors. These individuals each receive compensation in the form of an annual base salary, a discretionary bonus (payable in cash) and are eligible for awards under the LTI program described above.
In addition to the forms of compensation described above, Mr. Grant and Mr. Nelson receive additional payments. Mr. Grant is eligible to receive certain amounts to be determined based on asset levels within the Calamos Phineus Long/Short Fund (a separate open-end fund managed by the Adviser), subject to various conditions. Mr. Nelson is eligible to receive certain "Timpani Team Revenue Share" payments, which are defined as a percentage of management fees received with respect to assets managed by him over certain thresholds.
The existence of these separate asset or fee-based payments could create a conflict of interest with regard to Mr. Grant's and Mr. Nelson's allocation of investment opportunities among the accounts for which they act as portfolio manager. Calamos Advisors maintains policies and procedures reasonably designed to mitigate such conflicts of interest.
This compensation structure considers annually the performance of the various strategies managed by the Portfolio Managers, among other factors, including, without limitation, the overall performance of the firm.
55
As of October 31, 2023, the portfolio managers held the following amounts in the Funds:
|
|
|
MARKET
NEUTRAL
INCOME FUND |
|
HEDGED
EQUITY FUND |
|
PHINEUS
LONG/SHORT
FUND |
|
MERGER
ARBITRAGE
FUND |
|
CONVERTIBLE
FUND |
|
GLOBAL
CONVERTIBLE
FUND |
|
John P.
Calamos, Sr.(1) |
|
over $1,000,000 |
|
over $1,000,000 |
|
over $1,000,000 |
|
$500,001 —
$1,000,000 |
|
over $1,000,000 |
|
$500,001 —
$1,000,000 |
|
Brandon
Nelson |
|
None |
|
None |
|
None |
|
None |
|
None |
|
None |
|
Christian
Brobst |
|
None |
|
None |
|
None |
|
None |
|
None |
|
None |
|
Chuck
Carmody |
|
None |
|
None |
|
None |
|
None |
|
None |
|
None |
|
David
O'Donohue |
|
$500,001 —
$1,000,000 |
|
over $1,000,000 |
|
$50,001 —
$100,000 |
|
$100,001 —
$500,000 |
|
$100,001 —
$500,000 |
|
$50,001 —
$100,000 |
|
Dennis
Cogan |
|
None |
|
None |
|
None |
|
None |
|
None |
|
None |
|
|
Eli Pars |
|
over $1,000,000 |
|
over $1,000,000 |
|
None |
|
$100,001 —
$500,000 |
|
$10,001 —
$50,000 |
|
$500,001 —
$1,000,000 |
|
|
Jason Hill |
|
$100,001 —
$500,000 |
|
over $1,000,000 |
|
None |
|
$500,001 —
$1,000,000 |
|
$10,001 —
$50,001 |
|
$10,001 —
$50,001 |
|
|
Jimmy Young |
|
$100,001 —
$500,000 |
|
$500,001 —
$1,000,000 |
|
None |
|
$100,001 —
$500,000 |
|
None |
|
None |
|
|
Joe Wysocki |
|
$50,001 —
$100,000 |
|
None |
|
None |
|
None |
|
over $1,000,000 |
|
None |
|
John
Hillenbrand |
|
None |
|
None |
|
None |
|
None |
|
$500,001 —
$1,000,000 |
|
None |
|
|
John Saf |
|
None |
|
None |
|
None |
|
None |
|
None |
|
None |
|
|
Jon Vacko |
|
None |
|
None |
|
None |
|
None |
|
$100,001 —
$500,000 |
|
None |
|
|
Kyle Ruge |
|
None |
|
None |
|
None |
|
None |
|
None |
|
None |
|
|
Michael Grant |
|
None |
|
None |
|
over $1,000,000 |
|
None |
|
None |
|
None |
|
|
Michael Kassab |
|
None |
|
None |
|
None |
|
None |
|
None |
|
None |
|
|
Nick Niziolek |
|
None |
|
None |
|
None |
|
None |
|
None |
|
None |
|
|
Paul Ryndak |
|
None |
|
None |
|
None |
|
None |
|
None |
|
None |
|
R. Matthew
Freund |
|
None |
|
None |
|
None |
|
None |
|
None |
|
None |
|
Ryan
Isherwood |
|
None |
|
None |
|
None |
|
None |
|
None |
|
None |
|
Anthony
Vecchiolla |
|
$1 — $10,000 |
|
$1 — $10,000 |
|
None |
|
$100,001 —
$500,000 |
|
$1 — $10,000 |
|
$1 — $10,000 |
|
|
Dino Dussias |
|
None |
|
None |
|
None |
|
None |
|
$100,001 —
$500,000 |
|
None |
|
|
|
|
TIMPANI SMALL
CAP GROWTH FUND |
|
TIMPANI SMID
GROWTH FUND |
|
GROWTH FUND |
|
GROWTH AND
INCOME FUND |
|
DIVIDEND
GROWTH FUND |
|
John P.
Calamos, Sr.(1) |
|
over $1,000,000 |
|
over $1,000,000 |
|
over $1,000,000 |
|
over $1,000,000 |
|
None |
|
|
Brandon Nelson |
|
over $1,000,000 |
|
over $1,000,000 |
|
None |
|
None |
|
None |
|
|
Christian Brobst |
|
None |
|
None |
|
None |
|
None |
|
None |
|
|
Chuck Carmody |
|
None |
|
None |
|
None |
|
None |
|
None |
|
David
O'Donohue |
|
$10,001 — $50,000 |
|
None |
|
None |
|
None |
|
None |
|
|
Dennis Cogan |
|
None |
|
None |
|
None |
|
None |
|
None |
|
|
Eli Pars |
|
$10,001 — $50,000 |
|
None |
|
None |
|
None |
|
None |
|
|
Jason Hill |
|
None |
|
None |
|
None |
|
None |
|
None |
|
|
Jimmy Young |
|
None |
|
None |
|
None |
|
None |
|
None |
|
|
Joe Wysocki |
|
$10,001 — $50,000 |
|
$1 — $10,000 |
|
None |
|
$100,001 — $500,000 |
|
None |
|
John
Hillenbrand |
|
None |
|
None |
|
None |
|
$500,001 — $1,000,000 |
|
None |
|
|
John Saf |
|
None |
|
None |
|
None |
|
None |
|
None |
|
|
Jon Vacko |
|
None |
|
None |
|
None |
|
$500,001 — $1,000,000 |
|
None |
|
|
Kyle Ruge |
|
None |
|
None |
|
None |
|
None |
|
None |
|
|
Michael Grant |
|
None |
|
None |
|
None |
|
None |
|
None |
|
56
|
|
|
TIMPANI SMALL
CAP GROWTH FUND |
|
TIMPANI SMID
GROWTH FUND |
|
GROWTH FUND |
|
GROWTH AND
INCOME FUND |
|
DIVIDEND
GROWTH FUND |
|
|
Michael Kassab |
|
None |
|
None |
|
None |
|
None |
|
None |
|
|
Nick Niziolek |
|
None |
|
None |
|
None |
|
$50,001 —$100,000 |
|
None |
|
|
Paul Ryndak |
|
None |
|
None |
|
None |
|
$100,001 — $500,000 |
|
None |
|
R. Matthew
Freund |
|
None |
|
None |
|
$50,001 — $100,000 |
|
None |
|
None |
|
Ryan
Isherwood |
|
$100,001 —
$500,000 |
|
$100,001 — $500,000 |
|
None |
|
None |
|
None |
|
Anthony
Vecchiolla |
|
None |
|
None |
|
None |
|
None |
|
None |
|
|
Dino Dussias |
|
None |
|
None |
|
None |
|
$100,001 — $500,000 |
|
None |
|
|
|
|
SELECT FUND |
|
INTERNATIONAL
GROWTH FUND |
|
EVOLVING WORLD
GROWTH FUND |
|
GLOBAL
EQUITY FUND |
|
|
John P. Calamos, Sr.(1) |
|
$500,001 — $1,000,000 |
|
over $1,000,000 |
|
over $1,000,000 |
|
over $1,000,000 |
|
|
Brandon Nelson |
|
None |
|
None |
|
None |
|
None |
|
|
Christian Brobst |
|
None |
|
None |
|
None |
|
None |
|
|
Chuck Carmody |
|
None |
|
None |
|
None |
|
None |
|
|
David O'Donohue |
|
None |
|
None |
|
None |
|
None |
|
|
Dennis Cogan |
|
None |
|
None |
|
$100,001 — $500,000 |
|
$100,001 — $500,000 |
|
|
Eli Pars |
|
None |
|
None |
|
None |
|
None |
|
|
Jason Hill |
|
None |
|
None |
|
None |
|
None |
|
|
Jimmy Young |
|
None |
|
None |
|
None |
|
None |
|
|
Joe Wysocki |
|
None |
|
$100,001 — $500,000 |
|
$10,001 — $50,000 |
|
$100,001 — $500,000 |
|
|
John Hillenbrand |
|
None |
|
$100,001 — $500,000 |
|
$50,001 — $100,000 |
|
$100,001 — $500,000 |
|
|
John Saf |
|
None |
|
None |
|
None |
|
None |
|
|
Jon Vacko |
|
None |
|
$100,001 — $500,000 |
|
$100,001 — $500,000 |
|
None |
|
|
Kyle Ruge |
|
None |
|
$100,001 — $500,000 |
|
$100,001 — $500,000 |
|
None |
|
|
Michael Grant |
|
None |
|
None |
|
None |
|
None |
|
|
Michael Kassab |
|
None |
|
None |
|
None |
|
None |
|
|
Nick Niziolek |
|
None |
|
Over $1,000,000 |
|
Over $1,000,000 |
|
$100,001 — $500,000 |
|
|
Paul Ryndak |
|
None |
|
$50,001 — $100,000 |
|
$50,001 — $100,000 |
|
$50,001 — $100,000 |
|
|
R. Matthew Freund |
|
$10,001 — $50,000 |
|
None |
|
None |
|
None |
|
|
Ryan Isherwood |
|
None |
|
None |
|
None |
|
None |
|
|
Anthony Vecchiolla |
|
None |
|
None |
|
None |
|
None |
|
|
Dino Dussias |
|
None |
|
None |
|
None |
|
None |
|
|
|
|
GLOBAL
OPPORTUNITIES
FUND |
|
INTERNATIONAL
SMALL CAP
GROWTH FUND |
|
TOTAL RETURN
BOND FUND |
|
HIGH INCOME
OPPORTUNITIES
FUND |
|
SHORT-TERM
BOND FUND |
|
John P.
Calamos, Sr.(1) |
|
None |
|
over $1,000,000 |
|
over $1,000,000 |
|
over $1,000,000 |
|
$500,001 —
$1,000,000 |
|
Brandon
Nelson |
|
None |
|
None |
|
None |
|
None |
|
None |
|
Christian
Brobst |
|
None |
|
None |
|
$10,001 — $50,000 |
|
None |
|
$50,001 — $100,000 |
|
Chuck
Carmody |
|
None |
|
None |
|
$100,001 — $500,000 |
|
$100,001 — $500,000 |
|
$100,001 — $500,000 |
|
David
O'Donohue |
|
None |
|
None |
|
None |
|
None |
|
None |
|
Dennis
Cogan |
|
$100,001 — $500,000 |
|
$100,001 —
$500,000 |
|
None |
|
None |
|
None |
|
|
Eli Pars |
|
$10,001 — $50,000 |
|
None |
|
None |
|
None |
|
None |
|
|
Jason Hill |
|
None |
|
None |
|
None |
|
None |
|
None |
|
|
Jimmy Young |
|
None |
|
None |
|
None |
|
None |
|
None |
|
|
Joe Wysocki |
|
None |
|
None |
|
None |
|
None |
|
None |
|
John
Hillenbrand |
|
$100,001 — $500,000 |
|
None |
|
None |
|
None |
|
None |
|
|
John Saf |
|
None |
|
None |
|
None |
|
None |
|
None |
|
|
Jon Vacko |
|
$100,001 — $500,000 |
|
None |
|
None |
|
None |
|
None |
|
Kyle
Ruge |
|
$10,001 — $50,000 |
|
$100,001 —
$500,000 |
|
None |
|
None |
|
None |
|
57
|
|
|
GLOBAL
OPPORTUNITIES
FUND |
|
INTERNATIONAL
SMALL CAP
GROWTH FUND |
|
TOTAL RETURN
BOND FUND |
|
HIGH INCOME
OPPORTUNITIES
FUND |
|
SHORT-TERM
BOND FUND |
|
|
Michael Grant |
|
None |
|
None |
|
None |
|
None |
|
None |
|
|
Michael Kassab |
|
None |
|
None |
|
None |
|
None |
|
None |
|
|
Nick Niziolek |
|
$100,001 — $500,000 |
|
None |
|
None |
|
None |
|
None |
|
|
Paul Ryndak |
|
$1 — $10,000 |
|
None |
|
None |
|
None |
|
None |
|
R. Matthew
Freund |
|
None |
|
None |
|
$100,001 — $500,000 |
|
$100,001 — $500,000 |
|
$500,001 —
$1,000,000 |
|
Ryan
Isherwood |
|
None |
|
None |
|
None |
|
None |
|
None |
|
Anthony
Vecchiolla |
|
None |
|
None |
|
None |
|
None |
|
None |
|
|
Dino Dussias |
|
None |
|
None |
|
None |
|
None |
|
None |
|
(1) Pursuant to Rule 16a-1(a)(2) of the 1934 Act, John P. Calamos, Sr. may be deemed to have indirect beneficial ownership of Fund shares held by Calamos Investments LLC, its subsidiaries, and its parent companies (Calamos Asset Management, Inc. and Calamos Partners LLC, and its parent company Calamos Family Partners, Inc.) due to his direct or indirect ownership interest in those entities. As a result, these amounts reflect any holdings of those entities in addition to the individual, personal accounts of John P. Calamos, Sr.
DISTRIBUTION PLAN
The Trust has adopted a plan pursuant to Rule 12b-1 under the 1940 Act (the "Plan"), whereby Class A shares and Class C shares of each Fund pay to CFS service and distribution fees as described in the prospectus. No distribution or service fees are paid with respect to Class I shares or Class R6 shares. For purchases of Class A shares of Market Neutral Income Fund, Merger Arbitrage Fund, Convertible Fund, Global Convertible Fund, Total Return Bond Fund, High Income Opportunities Fund, and Short-Term Bond Fund, where a commission is paid by CFS under the $250,000 breakpoint and for purchases of Class C shares of all Funds, the distribution fee will be paid to the applicable financial intermediary beginning the 13th month after purchase. CFS may use the amount of such fees to defray the costs of commissions and service fees paid to broker-dealers and other financial intermediaries whose customers invest in shares of the Funds and for other purposes.
The Trust's board of trustees has determined that the Plan could be a significant factor in the growth and retention of Fund assets, resulting in a more advantageous expense ratio and increased investment flexibility, which could benefit each class of Fund shareholders. A cash flow from sales of shares may enable a Fund to meet shareholder redemptions without having to liquidate portfolio securities and to take advantage of buying opportunities without having to make unwarranted liquidations of portfolio securities. The board also considered that continuing growth in the Funds' size would be in the shareholders' best interests because increased size would allow the Funds to realize certain economies of scale in their operations and would likely reduce the proportionate share of expenses borne by each shareholder. Even in the case of a Fund that is closed to new investors, the payment of ongoing compensation to a financial intermediary for providing services to its customers based on the value of their Fund shares is likely to provide the shareholders with valuable services and to benefit the Fund by promoting shareholder retention and reduced redemptions. The board of trustees therefore determined that it would benefit the Fund to have monies available for the direct distribution and service activities of CFS, as the Funds' distributor, in promoting the continuous sale of the Funds' shares. The board of trustees, including the non-interested trustees, concluded, in the exercise of their reasonable business judgment and in light of their fiduciary duties, that there is a reasonable likelihood that the Plan will benefit the Funds and their shareholders.
The Plan has been approved by the board of trustees, including all of the trustees who are non-interested persons as defined in the 1940 Act. The substance of the Plan has also been approved by the vote of a majority of the outstanding shares of each Fund. The Plan must be reviewed annually by the board of trustees and may be continued from year to year by vote of the board, including a majority of the trustees who are non-interested persons of the Funds and who have no direct or indirect financial interest in the Plan's operation ("non-interested trustees"), cast in person at a meeting called for that purpose. It is also required that the selection and nomination of non-interested trustees be done by non-interested trustees. The Plan may be terminated at any time, without any penalty, by such trustees, by any act that terminates the distribution agreement between the Trust and CFS, or, as to the Fund, by vote of a majority of the Fund's outstanding shares.
The Plan may not be amended as to any class of shares of any Fund to increase materially the amount spent for distribution or service expenses or in any other material way without approval by a majority of the outstanding shares of the affected class, and all such material amendments to the Plan must also be approved by the non-interested trustees, in person, at a meeting called for the purpose of voting on any such amendment.
58
CFS is required to report in writing to the board of trustees at least quarterly on the amounts and purpose of any payments made under the Plan and any distribution or service agreement, as well as to furnish the board with such other information as may reasonably be requested to enable the board to make an informed determination of whether the Plan should be continued.
During the fiscal year ended October 31, 2023, payments to CFS and affiliates and broker-dealers pursuant to the Plan were made as indicated below.
|
|
|
CONVERTIBLE
FUND
|
|
GROWTH
AND
INCOME
FUND
|
|
MARKET
NEUTRAL
INCOME
FUND
|
|
GROWTH
FUND
|
|
GLOBAL
OPPORTUNITIES
FUND
|
|
HIGH
INCOME
OPPORTUNITIES
FUND
|
|
SELECT
FUND
|
|
INTERNATIONAL
GROWTH
FUND
|
|
GLOBAL
EQUITY
FUND
|
|
TOTAL
RETURN
BOND
FUND
|
|
|
Payments to CFS:
|
|
|
Class A
|
|
|
32,390
|
|
|
|
39,478
|
|
|
|
100,802
|
|
|
|
73,411
|
|
|
|
664
|
|
|
|
2,113
|
|
|
|
1,845
|
|
|
|
1,517
|
|
|
|
604
|
|
|
|
909
|
|
|
|
Class C
|
|
|
42,731
|
|
|
|
145,842
|
|
|
|
296,985
|
|
|
|
9,691
|
|
|
|
18,797
|
|
|
|
920
|
|
|
|
19
|
|
|
|
1,449
|
|
|
|
261
|
|
|
|
33
|
|
|
|
Payments to affiliated broker-dealers:
|
|
|
Class A
|
|
|
649,259
|
|
|
|
3,010,638
|
|
|
|
2,675,894
|
|
|
|
2,270,893
|
|
|
|
223,067
|
|
|
|
63,918
|
|
|
|
27,881
|
|
|
|
118,190
|
|
|
|
53,889
|
|
|
|
33,186
|
|
|
|
Class C
|
|
|
343,030
|
|
|
|
687,585
|
|
|
|
2,508,185
|
|
|
|
96,518
|
|
|
|
61,388
|
|
|
|
4,224
|
|
|
|
1,317
|
|
|
|
16,852
|
|
|
|
6,685
|
|
|
|
4,211
|
|
|
|
|
|
EVOLVING
WORLD
GROWTH
FUND
|
|
DIVIDEND
GROWTH
FUND
|
|
GLOBAL
CONVERTIBLE
FUND
|
|
HEDGED
EQUITY
FUND
|
|
PHINEUS
LONG/
SHORT
FUND
|
|
SHORT-
TERM
BOND
FUND
|
|
TIMPANI
SMALL CAP
GROWTH
FUND
|
|
TIMPANI
SMID
GROWTH
FUND
|
|
INTERNATIONAL
SMALL CAP
GROWTH
FUND
|
|
MERGER
ARBITRAGE
FUND
|
|
TOTAL
|
|
|
Payments to CFS:
|
|
|
Class A
|
|
|
(72
|
)
|
|
|
(792
|
)
|
|
|
495
|
|
|
|
459
|
|
|
|
15,772
|
|
|
|
2,938
|
|
|
|
257
|
|
|
|
17
|
|
|
|
45
|
|
|
|
—
|
|
|
|
272,853
|
|
|
|
Class C
|
|
|
5,364
|
|
|
|
6,687
|
|
|
|
1,853
|
|
|
|
19,917
|
|
|
|
62,558
|
|
|
|
—
|
|
|
|
15,075
|
|
|
|
—
|
|
|
|
67
|
|
|
|
87
|
|
|
|
628,336
|
|
|
|
Payments to affiliated broker-dealers:
|
|
|
Class A
|
|
|
101,570
|
|
|
|
14,428
|
|
|
|
22,051
|
|
|
|
71,335
|
|
|
|
145,687
|
|
|
|
5,747
|
|
|
|
53,406
|
|
|
|
773
|
|
|
|
17
|
|
|
|
22
|
|
|
|
9,541,849
|
|
|
|
Class C
|
|
|
50,660
|
|
|
|
17,305
|
|
|
|
29,806
|
|
|
|
63,636
|
|
|
|
279,115
|
|
|
|
—
|
|
|
|
28,050
|
|
|
|
—
|
|
|
|
70
|
|
|
|
—
|
|
|
|
4,198,638
|
|
|
(1) 'Payments to CFS' and 'Payments to affiliated broker-dealers' may include prior period true-ups resulting in credit balances.
During the fiscal year ended October 31, 2023, payments were made under the Plan on behalf of the indicated Funds for expenses associated with advertising, printing and mailing of prospectuses to prospective shareholders, and sales personnel compensation as indicated below.
|
|
|
CONVERTIBLE
FUND
|
|
GROWTH
AND
INCOME
FUND
|
|
MARKET
NEUTRAL
INCOME
FUND
|
|
GROWTH
FUND
|
|
GLOBAL
OPPORTUNITIES
FUND
|
|
HIGH
INCOME
OPPORTUNITIES
FUND
|
|
SELECT
FUND
|
|
INTERNATIONAL
GROWTH
FUND
|
|
GLOBAL
EQUITY
FUND
|
|
TOTAL
RETURN
BOND
FUND
|
|
|
Expenses:
|
|
|
Class A
|
|
Printed
Materials
|
|
|
558
|
|
|
|
1,531
|
|
|
|
3,171
|
|
|
|
413
|
|
|
|
234
|
|
|
|
29
|
|
|
|
10
|
|
|
|
132
|
|
|
|
29
|
|
|
|
24
|
|
|
Sales &
Marketing
|
|
|
285,191
|
|
|
|
442,950
|
|
|
|
664,108
|
|
|
|
267,647
|
|
|
|
252,472
|
|
|
|
214,563
|
|
|
|
211,287
|
|
|
|
228,337
|
|
|
|
214,813
|
|
|
|
212,988
|
|
|
|
Total
|
|
|
285,749
|
|
|
|
444,481
|
|
|
|
667,279
|
|
|
|
268,060
|
|
|
|
252,705
|
|
|
|
214,591
|
|
|
|
211,297
|
|
|
|
228,468
|
|
|
|
214,842
|
|
|
|
213,011
|
|
|
|
Class C
|
|
Printed
Materials
|
|
|
216
|
|
|
|
543
|
|
|
|
564
|
|
|
|
21
|
|
|
|
49
|
|
|
|
6
|
|
|
|
1
|
|
|
|
4
|
|
|
|
2
|
|
|
|
1
|
|
|
Sales &
Marketing
|
|
|
238,824
|
|
|
|
283,106
|
|
|
|
296,493
|
|
|
|
212,892
|
|
|
|
217,686
|
|
|
|
210,581
|
|
|
|
209,815
|
|
|
|
210,233
|
|
|
|
210,156
|
|
|
|
209,841
|
|
|
|
Total
|
|
|
239,040
|
|
|
|
283,649
|
|
|
|
297,057
|
|
|
|
212,912
|
|
|
|
217,736
|
|
|
|
210,587
|
|
|
|
209,816
|
|
|
|
210,237
|
|
|
|
210,159
|
|
|
|
209,841
|
|
|
|
|
|
EVOLVING
WORLD
GROWTH
FUND
|
|
DIVIDEND
GROWTH
FUND
|
|
GLOBAL
CONVERTIBLE
FUND
|
|
HEDGED
EQUITY
FUND
|
|
PHINEUS
LONG/
SHORT
FUND
|
|
SHORT-
TERM
BOND
FUND
|
|
TIMPANI
SMALL CAP
GROWTH
FUND
|
|
TIMPANI
SMID
GROWTH
FUND
|
|
INTERNATIONAL
SMALL CAP
GROWTH
FUND
|
|
MERGER
ARBITRAGE
FUND
|
|
TOTAL
|
|
|
Expenses:
|
|
|
Class A
|
|
Printed
Materials
|
|
|
275
|
|
|
|
33
|
|
|
|
23
|
|
|
|
148
|
|
|
|
545
|
|
|
|
89
|
|
|
|
189
|
|
|
|
3
|
|
|
|
1
|
|
|
|
7
|
|
|
|
7,443
|
|
|
Sales &
Marketing
|
|
|
250,076
|
|
|
|
213,778
|
|
|
|
213,057
|
|
|
|
233,102
|
|
|
|
290,724
|
|
|
|
221,523
|
|
|
|
236,048
|
|
|
|
210,270
|
|
|
|
209,931
|
|
|
|
19,059
|
|
|
|
5,091,923
|
|
|
|
Total
|
|
|
250,350
|
|
|
|
213,811
|
|
|
|
213,080
|
|
|
|
233,250
|
|
|
|
291,269
|
|
|
|
221,611
|
|
|
|
236,237
|
|
|
|
210,273
|
|
|
|
209,932
|
|
|
|
19,066
|
|
|
|
5,099,366
|
|
|
59
|
|
|
EVOLVING
WORLD
GROWTH
FUND
|
|
DIVIDEND
GROWTH
FUND
|
|
GLOBAL
CONVERTIBLE
FUND
|
|
HEDGED
EQUITY
FUND
|
|
PHINEUS
LONG/
SHORT
FUND
|
|
SHORT-
TERM
BOND
FUND
|
|
TIMPANI
SMALL CAP
GROWTH
FUND
|
|
TIMPANI
SMID
GROWTH
FUND
|
|
INTERNATIONAL
SMALL CAP
GROWTH
FUND
|
|
MERGER
ARBITRAGE
FUND
|
|
TOTAL
|
|
|
Class C
|
|
Printed
Materials
|
|
|
14
|
|
|
|
7
|
|
|
|
7
|
|
|
|
78
|
|
|
|
193
|
|
|
|
—
|
|
|
|
26
|
|
|
|
—
|
|
|
|
1
|
|
|
|
7
|
|
|
|
1,739
|
|
|
Sales &
Marketing
|
|
|
211,815
|
|
|
|
211,725
|
|
|
|
210,725
|
|
|
|
220,875
|
|
|
|
237,696
|
|
|
|
—
|
|
|
|
213,655
|
|
|
|
—
|
|
|
|
209,839
|
|
|
|
19,059
|
|
|
|
3,835,015
|
|
|
|
Total
|
|
|
211,829
|
|
|
|
211,731
|
|
|
|
210,731
|
|
|
|
220,953
|
|
|
|
237,889
|
|
|
|
—
|
|
|
|
213,681
|
|
|
|
—
|
|
|
|
209,839
|
|
|
|
19,066
|
|
|
|
3,836,754
|
|
|
(1) Payments to CFS' and 'Payments to affiliated broker-dealers' may include prior period true-ups resulting in credit balances.
DISTRIBUTOR
CFS, a broker-dealer, serves as principal underwriter and distributor for the Funds, subject to change by a majority of the "non-interested" trustees at any time. CFS is located at 2020 Calamos Court, Naperville, Illinois 60563-1493. CFS is an indirect subsidiary of Calamos Asset Management, Inc. CFS is responsible for all purchases, sales, redemptions and other transfers of shares of the Funds without any charge to the Funds except the fees paid to CFS under the Plan and distribution agreement. CFS is also responsible for all expenses incurred in connection with its performance of services for the Funds, including, but not limited to, personnel, office space and equipment, telephone, postage and stationery expenses. CFS receives commissions from sales of shares of the Funds that are not expenses of the Funds but represent sales commissions added to the net asset value of shares purchased from the Funds. See "How can I buy shares?" in the prospectus. See "Portfolio Transactions." CFS received and retained commissions on the sale of shares of each of the Funds as shown below during the indicated periods:
|
DESCRIPTION |
|
YEAR ENDED
10/31/23 |
|
YEAR ENDED
10/31/22 |
|
YEAR ENDED
10/31/21 |
|
|
Market Neutral Income Fund |
|
|
Commissions received |
|
$ |
304,673 |
|
|
$ |
2,260,212 |
|
|
$ |
3,982,603 |
|
|
|
Commissions retained |
|
$ |
16,859 |
|
|
$ |
54,046 |
|
|
$ |
101,277 |
|
|
|
Hedged Equity Fund |
|
|
Commissions received |
|
$ |
27,180 |
|
|
$ |
64,646 |
|
|
$ |
180,084 |
|
|
|
Commissions retained |
|
$ |
4,124 |
|
|
$ |
11,074 |
|
|
$ |
21,216 |
|
|
|
Phineus Long/Short Fund |
|
|
Commissions received |
|
$ |
207,917 |
|
|
$ |
138,262 |
|
|
$ |
67,526 |
|
|
|
Commissions retained |
|
$ |
28,486 |
|
|
$ |
19,878 |
|
|
$ |
7,842 |
|
|
|
Merger Arbitrage Fund(1) |
|
|
Commissions received |
|
$ |
— |
|
|
$ |
— |
|
|
$ |
— |
|
|
|
Commissions retained |
|
$ |
— |
|
|
$ |
— |
|
|
$ |
— |
|
|
|
Convertible Fund |
|
|
Commissions received |
|
$ |
107,932 |
|
|
$ |
209,036 |
|
|
$ |
482,656 |
|
|
|
Commissions retained |
|
$ |
8,213 |
|
|
$ |
7,139 |
|
|
$ |
23,248 |
|
|
|
Global Convertible Fund |
|
|
Commissions received |
|
$ |
113 |
|
|
$ |
7,675 |
|
|
$ |
40,812 |
|
|
|
Commissions retained |
|
$ |
13 |
|
|
$ |
136 |
|
|
$ |
1,189 |
|
|
|
Timpani Small Cap Growth Fund |
|
|
Commissions received |
|
$ |
53,696 |
|
|
$ |
105,893 |
|
|
$ |
191,260 |
|
|
|
Commissions retained |
|
$ |
10,051 |
|
|
$ |
17,494 |
|
|
$ |
29,370 |
|
|
|
Timpani SMID Growth Fund |
|
|
Commissions received |
|
$ |
— |
|
|
$ |
4,286 |
|
|
$ |
339 |
|
|
|
Commissions retained |
|
$ |
— |
|
|
$ |
761 |
|
|
$ |
54 |
|
|
|
Growth Fund |
|
|
Commissions received |
|
$ |
139,766 |
|
|
$ |
284,903 |
|
|
$ |
184,147 |
|
|
|
Commissions retained |
|
$ |
31,494 |
|
|
$ |
59,693 |
|
|
$ |
44,760 |
|
|
|
Growth and Income Fund |
|
|
Commissions received |
|
$ |
539,082 |
|
|
$ |
743,785 |
|
|
$ |
1,022,622 |
|
|
|
Commissions retained |
|
$ |
98,168 |
|
|
$ |
129,796 |
|
|
$ |
182,806 |
|
|
|
Dividend Growth Fund |
|
|
Commissions received |
|
$ |
5,832 |
|
|
$ |
13,297 |
|
|
$ |
6,660 |
|
|
|
Commissions retained |
|
$ |
1,274 |
|
|
$ |
2,653 |
|
|
$ |
1,137 |
|
|
60
|
DESCRIPTION |
|
YEAR ENDED
10/31/23 |
|
YEAR ENDED
10/31/22 |
|
YEAR ENDED
10/31/21 |
|
|
Select Fund |
|
|
Commissions received |
|
$ |
2,863 |
|
|
$ |
657 |
|
|
$ |
3,667 |
|
|
|
Commissions retained |
|
$ |
968 |
|
|
$ |
365 |
|
|
$ |
836 |
|
|
|
International Growth Fund |
|
|
Commissions received |
|
$ |
6,050 |
|
|
$ |
12,356 |
|
|
$ |
16,655 |
|
|
|
Commissions retained |
|
$ |
1,082 |
|
|
$ |
2,387 |
|
|
$ |
3,069 |
|
|
|
Evolving World Growth Fund |
|
|
Commissions received |
|
$ |
22,834 |
|
|
$ |
17,280 |
|
|
$ |
142,643 |
|
|
|
Commissions retained |
|
$ |
4,241 |
|
|
$ |
2,853 |
|
|
$ |
19,106 |
|
|
|
Global Equity Fund |
|
|
Commissions received |
|
$ |
3,069 |
|
|
$ |
10,823 |
|
|
$ |
13,185 |
|
|
|
Commissions retained |
|
$ |
590 |
|
|
$ |
1,959 |
|
|
$ |
2,501 |
|
|
|
Global Opportunities Fund |
|
|
Commissions received |
|
$ |
31,151 |
|
|
$ |
22,983 |
|
|
$ |
95,046 |
|
|
|
Commissions retained |
|
$ |
6,347 |
|
|
$ |
4,822 |
|
|
$ |
14,863 |
|
|
|
International Small Cap Growth Fund(2) |
|
|
Commissions received |
|
$ |
266 |
|
|
$ |
— |
|
|
$ |
— |
|
|
|
Commissions retained |
|
$ |
3 |
|
|
$ |
— |
|
|
$ |
— |
|
|
|
Total Return Bond Fund |
|
|
Commissions received |
|
$ |
1,882 |
|
|
$ |
1,085 |
|
|
$ |
22,319 |
|
|
|
Commissions retained |
|
$ |
47 |
|
|
$ |
79 |
|
|
$ |
230 |
|
|
|
High Income Fund |
|
|
Commissions received |
|
$ |
8,319 |
|
|
$ |
3,752 |
|
|
$ |
10,027 |
|
|
|
Commissions retained |
|
$ |
754 |
|
|
$ |
445 |
|
|
$ |
225 |
|
|
|
Short-Term Bond Fund |
|
|
Commissions received |
|
$ |
7,182 |
|
|
$ |
689 |
|
|
$ |
656 |
|
|
|
Commissions retained |
|
$ |
33 |
|
|
$ |
76 |
|
|
$ |
73 |
|
|
(1) Merger Arbitrage Fund commenced operations on September 29, 2023.
(2) International Small Cap Growth Fund commenced operations on March 31, 2022.
The sales charges on sales of Class A shares of each Fund other than Market Neutral Income Fund, Merger Arbitrage Fund, Convertible Fund, Global Convertible Fund, Total Return Bond Fund, High Income Opportunities Fund, and Short-Term Bond Fund (except when waived as described below under "Share Classes and Pricing of Shares — Sales Charge Waiver") and concessions reallowed to dealers at the time of purchase are as follows:
|
|
|
SALES CHARGE PAID BY INVESTOR ON PURCHASE OF
CLASS A SHARES |
|
|
|
|
AS A % OF
NET AMOUNT
INVESTED |
|
AS A % OF
OFFERING PRICE |
|
% OF OFFERING
PRICE
RETAINED BY
SELLING DEALER |
|
|
Less than $50,000 |
|
|
4.99 |
% |
|
|
4.75 |
% |
|
|
4.00 |
% |
|
|
$50,000 but less than $100,000 |
|
|
4.44 |
|
|
|
4.25 |
|
|
|
3.50 |
|
|
|
$100,000 but less than $250,000 |
|
|
3.63 |
|
|
|
3.50 |
|
|
|
2.75 |
|
|
|
$250,000 but less than $500,000 |
|
|
2.56 |
|
|
|
2.50 |
|
|
|
2.00 |
|
|
|
$500,000 but less than $1,000,000 |
|
|
2.04 |
|
|
|
2.00 |
|
|
|
1.60 |
|
|
|
$1,000,000 or more* |
|
|
None |
|
|
|
None |
|
|
|
None |
|
|
* On an investment of $1,000,000 or more: on the first $4 million, CFS from its own resources pays the selling dealer a commission of 1.00% of the amount of the investment, 0.50% on the next $21 million (amounts above $4 million and up to $25 million), and 0.25% on investment amounts in excess of $25 million. On an investment of $1,000,000 or more without a sales charge, you may pay a contingent deferred sales charge of 1.00% on shares that are sold within two years after purchase, excluding shares purchased from the reinvestment of dividends or capital gains distributions.
61
The sales charges on sales of Class A shares of Convertible Fund, Global Convertible Fund, Total Return Bond Fund, High Income Opportunities Fund, and Short-Term Bond Fund (except when waived as described below under "Share Classes and Pricing of Shares — Sales Charge Waiver") and concessions reallowed to dealers at the time of purchase are as follows:
|
|
|
SALES CHARGE PAID BY INVESTOR ON PURCHASE OF
CLASS A SHARES |
|
|
|
|
AS A % OF
NET AMOUNT
INVESTED |
|
AS A % OF
OFFERING PRICE |
|
% OF OFFERING
PRICE
RETAINED BY
SELLING DEALER |
|
|
Less than $100,000 |
|
|
2.30 |
% |
|
|
2.25 |
% |
|
|
2.00 |
% |
|
|
$100,000 but less than $250,000 |
|
|
1.78 |
|
|
|
1.75 |
|
|
|
1.50 |
|
|
|
$250,000 or more* |
|
|
None |
|
|
|
None |
|
|
|
None |
|
|
* On an investment of $250,000 or more for Convertible Fund, Global Convertible Fund, Total Return Bond Fund, and High Income Opportunities Fund: on the first $4 million, CFS from its own resources pays the selling dealer a commission of 1.00% of the amount of the investment, 0.50% on the next $21 million (amounts above $4 million and up to $25 million), and 0.25% on investment amounts in excess of $25 million. On an investment of $250,000 or more without a sales charge, you may pay a contingent deferred sales charge of 1.00% on shares that are sold within one year after purchase, excluding shares purchased from the reinvestment of dividends or capital gains distributions.
* On an investment of $250,000 or more for Short-Term Bond Fund: on the first $4 million, CFS from its own resources pays the selling dealer a commission of 0.55% of the amount of the investment, 0.40% on the next $21 million (amounts above $4 million and up to $25 million), and 0.20% on investment amounts in excess of $25 million. On an investment of $250,000 or more without a sales charge, you may pay a contingent deferred sales charge of 0.55% on shares that are sold within one year after purchase, excluding shares purchased from the reinvestment of dividends or capital gains distributions.
The sales charges on sales of Class A shares of Market Neutral Income Fund and Merger Arbitrage Fund (except when waived as described below under "Share Classes and Pricing of Shares — Sales Charge Waiver") and concessions reallowed to dealers at the time of purchase are as follows:
|
|
|
SALES CHARGE PAID BY INVESTOR ON PURCHASE OF
CLASS A SHARES |
|
|
|
|
AS A % OF
NET AMOUNT
INVESTED |
|
AS A % OF
OFFERING PRICE |
|
% OF OFFERING
PRICE
RETAINED BY
SELLING DEALER |
|
|
Less than $50,000 |
|
|
2.83 |
% |
|
|
2.75 |
% |
|
|
2.25 |
% |
|
|
$50,000 but less than $100,000 |
|
|
2.30 |
|
|
|
2.25 |
|
|
|
2.00 |
|
|
|
$100,000 but less than $250,000 |
|
|
1.78 |
|
|
|
1.75 |
|
|
|
1.50 |
|
|
|
$250,000 or more* |
|
|
None |
|
|
|
None |
|
|
|
None |
|
|
* On an investment of $250,000 or more for Market Neutral Income Fund and Merger Arbitrage Fund: on the first $4 million, CFS from its own resources pays the selling dealer a commission of 1.00% of the amount of the investment, 0.50% on the next $21 million (amounts above $4 million and up to $25 million), and 0.25% on investment amounts in excess of $25 million. On an investment of $250,000 or more without a sales charge, you may pay a contingent deferred sales charge of 1.00% on shares that are sold within one year after purchase, excluding shares purchased from the reinvestment of dividends or capital gains distributions.
Each Fund receives the entire net asset value of all of its shares sold. CFS, the Funds' principal underwriter, retains the sales charge on sales of Class A shares from which it allows discounts from the applicable public offering price to investment dealers. The normal discount to dealers is set forth in the table above. Upon notice to all dealers with whom it has sales agreements, CFS may allow up to the full applicable sales charge, as shown in the above table, during periods and for transactions specified in such notice and such reallowances may be based upon attainment of minimum sales levels. Dealers who receive 90% or more of the sales charge may be deemed to be underwriters under the Securities Act. CFS retains the entire amount of any deferred sales charge on Class C shares redeemed within one year of purchase. CFS may from time to time conduct promotional campaigns in which incentives would be offered to dealers meeting or exceeding stated target sales of shares of a Fund. The cost of any such promotional campaign, including any incentives offered, would be borne entirely by CFS and would have no effect on either the public offering price of Fund shares or the percentage of the public offering price retained by the selling dealer.
CFS has the exclusive right to distribute shares of the Funds through affiliated and unaffiliated dealers on a continuous basis. The obligation of CFS is an agency or "best efforts" arrangement, which does not obligate CFS to sell any stated number of shares.
In connection with the exchange privilege (described in the prospectus under "How can I buy shares? — By exchange"), CFS acts as a service organization for the Fidelity Investments Money Market Treasury Portfolio (the "Fidelity Fund"). CFS receives compensation from the Fidelity Fund, through the Fidelity Fund's 12b-1 Plan, for distribution services provided to the Fidelity Fund.
62
OTHER COMPENSATION TO INTERMEDIARIES
CAL, CFS and their affiliates are currently subject to supplemental compensation payment requests by certain securities broker-dealers, banks or other intermediaries, including third party administrators of qualified plans (each an "Intermediary") whose customers have purchased Fund shares. In their discretion, CAL, CFS or their affiliates may make payments to an Intermediary for various purposes. These payments do not increase the amount paid by you or the Funds, as they are paid from the legitimate profits from these entities in what is generally referred to as "revenue sharing."
Revenue sharing payments are generally a percentage of the account's average annual net assets. CAL and CFS may make these payments to an Intermediary for various purposes, including to help defray costs incurred by the Intermediary to educate financial advisers about the Funds so they can make recommendations and provide services that are suitable and meet shareholder needs, to access the Intermediary's representatives, to provide marketing support and other specified services. To the extent that the Funds do not pay for these costs directly, CAL and CFS may also make payments to certain financial intermediaries for administrative services such as record keeping, sub-accounting for shareholder accounts, client account maintenance support, statement preparation, transaction processing, payment of ticket charges per purchase or exchange order placed by a financial intermediary, payment of networking fees in connection with certain mutual fund trading systems, or one-time payments for services such as setting up the Funds on a intermediary's mutual fund trading system.
Service costs for sub-transfer agency fees attributable to Class A, Class C and Class I shares are borne solely by those share classes and are allocated pro-rata based upon assets of all Class A, Class C and Class I shares in the aggregate, without regard to fund or class. No sub-transfer agency or client account support payments will be made with respect to Class R6 shares.
In addition, CFS and/or CAL may also share certain marketing expenses with intermediaries, or pay for or sponsor informational meetings, seminars, client awareness events, support for marketing materials, sales reporting, or business building programs for such financial intermediaries to raise awareness of the Funds. CFS and/or CAL may make payments to participate in intermediary marketing support programs which may provide CFS and/or CAL, as applicable, with one or more of the following benefits: attendance at sales conferences, participation in meetings or training sessions, access to or information about intermediary personnel, use of an intermediary's marketing and communication infrastructure, fund analysis tools, data and data analytics, business planning and strategy sessions with intermediary personnel, information on industry- or platform specific developments, trends and service providers, and other marketing-related services. Such payments may be in addition to, or in lieu of, the payments described above. These payments are intended to promote the sales of the Funds and to reimburse financial intermediaries, directly or indirectly, for the costs that they or their salespersons incur in connection with educational seminars, meetings, and training efforts about the Funds to enable the intermediaries and their salespersons to make suitable recommendations, provide useful services, and maintain the necessary infrastructure to make the Funds available to their customers.
These payments may provide Intermediaries with an incentive to favor shares of the Funds over sales of shares of other mutual funds or non-mutual fund investments. These payments may influence the Intermediary and your salesperson to recommend a Fund over another investment. Ask your salesperson or visit your Intermediary's website for more information. You may wish to take such payment arrangements into account when considering and evaluating any recommendations relating to Fund shares and you should discuss this matter with your Intermediary and its representatives. The Funds may utilize an Intermediary that offers and sells shares of the Funds to execute portfolio transactions for the Funds. The Funds, Calamos Advisors and CFS do not consider sales of shares of the Funds as a factor in the selection of broker-dealers to execute portfolio transactions for the Funds.
CFS has an Incentive Plan (the "Plan") covering its Intermediary Sales Department. Generally, CFS markets and sells shares of the Calamos Family of Funds to financial advisors, who in turn may recommend that investors purchase shares of a Fund. The Plan is an incentive program that combines discretionary quarterly bonuses with a discretionary annual bonus sales performance and other discretionary factors. Incentive compensation may differ for each Fund and is subject to change depending on certain criteria considered by CFS. The Plan creates a potential conflict of interest in that it creates an incentive for the Intermediary Sales Department members to sell one Fund over another. CFS' Compliance Department monitors sales and other activity in an effort to detect unusual activity in the context of the compensation structure under the Plan.
PORTFOLIO TRANSACTIONS
Calamos Advisors is responsible for decisions to buy and sell securities for the Funds, the selection of brokers and dealers to effect the transactions and the negotiation of prices and any brokerage commissions on such transactions.
63
Portfolio transactions on behalf of the Funds effected on stock exchanges involve the payment of negotiated brokerage commissions. There is generally no stated commission in the case of securities traded in the OTC markets, but the price the Funds pay usually includes an undisclosed dealer commission or mark-up. For securities purchased in an underwritten offering, the price the Funds pay includes a disclosed, fixed commission or discount retained by the underwriter or dealer.
In executing portfolio transactions, Calamos Advisors uses its best efforts to obtain for the Funds the most favorable combination of price and execution available. In seeking the most favorable combination of price and execution, Calamos Advisors considers all factors it deems relevant, including price, the size of the transaction, the nature of the market for the security, the amount of commission, the timing of the transaction taking into account market prices and trends, the execution capability of the broker-dealer and the quality of service rendered by the broker-dealer in other transactions.
In allocating the Funds' portfolio brokerage transactions to unaffiliated broker-dealers, Calamos Advisors may take into consideration the research, analytical, statistical and other information and services provided by the broker-dealer, such as general economic reports and information, reports or analyses of particular companies or industry groups, market timing and technical information, and the availability of the brokerage firm's analysts for consultation. Although Calamos Advisors believes these services have substantial value, they are considered supplemental to Calamos Advisors' own efforts in performing its duties under the Management Agreement.
Calamos Advisors does not guarantee any broker the placement of a predetermined amount of securities transactions in return for the research or brokerage services it provides. Calamos Advisors does, however, have internal procedures for allocating transactions in a manner consistent with its execution policies to brokers that it has identified as providing research, research-related products or services, or execution-related services of a particular benefit to its clients. Calamos Advisors has entered into client commission agreements ("CCAs") with certain broker-dealers under which the broker-dealers may use a portion of their commissions to pay third parties or other broker-dealers that provide Calamos Advisors with research or brokerage services, as permitted under Section 28(e) of the Exchange Act. CCAs allow Calamos Advisors to direct broker-dealers to pool commissions that are generated from orders executed at that broker-dealer, and then periodically direct the broker-dealer to pay third parties or other broker-dealers for research or brokerage services. All uses of CCAs by Calamos Advisors are subject to applicable law and their best execution obligations. Brokerage and research products and services furnished by brokers may be used in servicing any or all of the clients of Calamos Advisors and such research may not necessarily be used by Calamos Advisors in connection with the accounts which paid commissions to the broker providing such brokerage and research products and services.
As permitted by Section 28(e) of the 1934 Act, Calamos Advisors may pay a broker-dealer that provides brokerage and research services an amount of commission for effecting a securities transaction for a Fund in excess of the commission that another broker-dealer would have charged for effecting that transaction if Calamos Advisors believes the amount to be reasonable in relation to the value of the overall quality of the brokerage and research services provided. Other clients of Calamos Advisors may indirectly benefit from the availability of these services to Calamos Advisors, and the Funds may indirectly benefit from services available to Calamos Advisors as a result of research services received by Calamos Advisors through transactions for other clients. In addition, Calamos Advisors may execute portfolio transactions for the Funds, to the extent permitted by law, through broker-dealers affiliated with the Funds, Calamos Advisors, CFS, or other broker-dealers distributing shares of the Funds if it reasonably believes that the combination of price and execution is at least as favorable as with unaffiliated broker-dealers, and in such transactions any such broker-dealer would receive brokerage commissions paid by the Funds.
In certain cases, Calamos Advisors may obtain products or services from a broker that have both research and non-research uses. Examples of non-research uses are administrative and marketing functions. These are referred to as "mixed use" products. In each case, Calamos Advisors makes a good faith effort to determine the proportion of such products or services that may be used for research and non-research purposes. That determination is based upon the time spent by Calamos Advisors personnel for research and non-research uses. The portion of the costs of such products or services attributable to research usage may be defrayed by Calamos Advisors through brokerage commissions generated by transactions of its clients, including the Funds. Calamos Advisors pays the provider in cash for the non-research portion of its use of these products or services.
For the periods presented below, Calamos Advisors did not execute trades through CFS, its affiliated broker-dealer. For the periods indicated, the following table shows the amount of aggregate commissions related to those transactions executed through unaffiliated broker-dealers.
64
|
DESCRIPTION |
|
AGGREGATE
COMMISSIONS |
|
|
Market Neutral Income Fund |
|
|
|
|
|
|
Year Ended 10/31/23 |
|
$ |
3,701,326 |
|
|
|
Year Ended 10/31/22 |
|
$ |
3,811,072 |
|
|
|
Year Ended 10/31/21 |
|
$ |
3,977,282 |
|
|
|
Hedged Equity Fund |
|
|
|
|
|
|
Year Ended 10/31/23 |
|
$ |
147,665 |
|
|
|
Year Ended 10/31/22 |
|
$ |
150,529 |
|
|
|
Year Ended 10/31/21 |
|
$ |
93,685 |
|
|
|
Phineus Long/Short Fund |
|
|
|
|
|
|
Year Ended 10/31/23 |
|
$ |
5,790,174 |
|
|
|
Year Ended 10/31/22 |
|
$ |
4,507,438 |
|
|
|
Year Ended 10/31/21 |
|
$ |
3,711,001 |
|
|
|
Merger Arbitrage Fund(1) |
|
|
|
|
|
|
Year Ended 10/31/23 |
|
$ |
769 |
|
|
|
Year Ended 10/31/22 |
|
$ |
— |
|
|
|
Year Ended 10/31/21 |
|
$ |
— |
|
|
|
Convertible Fund |
|
|
|
|
|
|
Year Ended 10/31/23 |
|
$ |
16,449 |
|
|
|
Year Ended 10/31/22 |
|
$ |
900 |
|
|
|
Year Ended 10/31/21 |
|
$ |
104,768 |
|
|
|
Global Convertible Fund |
|
|
|
|
|
|
Year Ended 10/31/23 |
|
$ |
4,677 |
|
|
|
Year Ended 10/31/22 |
|
$ |
3,561 |
|
|
|
Year Ended 10/31/21 |
|
$ |
1,593 |
|
|
|
Timpani Small Cap Growth Fund |
|
|
|
|
|
|
Year Ended 10/31/23 |
|
$ |
1,009,494 |
|
|
|
Year Ended 10/31/22 |
|
$ |
1,207,512 |
|
|
|
Year Ended 10/31/21 |
|
$ |
793,119 |
|
|
|
Timpani SMID Growth Fund |
|
|
|
|
|
|
Year Ended 10/31/23 |
|
$ |
43,346 |
|
|
|
Year Ended 10/31/22 |
|
$ |
38,589 |
|
|
|
Year Ended 10/31/21 |
|
$ |
47,423 |
|
|
|
Growth Fund |
|
|
|
|
|
|
Year Ended 10/31/23 |
|
$ |
732,271 |
|
|
|
Year Ended 10/31/22 |
|
$ |
634,542 |
|
|
|
Year Ended 10/31/21 |
|
$ |
637,403 |
|
|
|
Growth and Income Fund |
|
|
|
|
|
|
Year Ended 10/31/23 |
|
$ |
741,152 |
|
|
|
Year Ended 10/31/22 |
|
$ |
561,747 |
|
|
|
Year Ended 10/31/21 |
|
$ |
1,089,811 |
|
|
|
Dividend Growth Fund |
|
|
|
|
|
|
Year Ended 10/31/23 |
|
$ |
2,865 |
|
|
|
Year Ended 10/31/22 |
|
$ |
2,278 |
|
|
|
Year Ended 10/31/21 |
|
$ |
1,614 |
|
|
|
Select Fund |
|
|
|
|
|
|
Year Ended 10/31/23 |
|
$ |
7,874 |
|
|
|
Year Ended 10/31/22 |
|
$ |
8,129 |
|
|
|
Year Ended 10/31/21 |
|
$ |
6,731 |
|
|
|
International Growth Fund |
|
|
|
|
|
|
Year Ended 10/31/23 |
|
$ |
646,944 |
|
|
|
Year Ended 10/31/22 |
|
$ |
669,009 |
|
|
|
Year Ended 10/31/21 |
|
$ |
631,424 |
|
|
|
Evolving World Growth Fund |
|
|
|
|
|
|
Year Ended 10/31/23 |
|
$ |
1,989,830 |
|
|
|
Year Ended 10/31/22 |
|
$ |
2,762,215 |
|
|
|
Year Ended 10/31/21 |
|
$ |
3,232,879 |
|
|
65
|
DESCRIPTION |
|
AGGREGATE
COMMISSIONS |
|
|
Global Equity Fund |
|
|
|
|
|
|
Year Ended 10/31/23 |
|
$ |
100,456 |
|
|
|
Year Ended 10/31/22 |
|
$ |
123,089 |
|
|
|
Year Ended 10/31/21 |
|
$ |
122,098 |
|
|
|
Global Opportunities Fund |
|
|
|
|
|
|
Year Ended 10/31/23 |
|
$ |
142,868 |
|
|
|
Year Ended 10/31/22 |
|
$ |
223,310 |
|
|
|
Year Ended 10/31/21 |
|
$ |
197,114 |
|
|
|
International Small Cap Growth Fund(2) |
|
|
|
|
|
|
Year Ended 10/31/23 |
|
$ |
7,656 |
|
|
|
Year Ended 10/31/22 |
|
$ |
4,949 |
|
|
|
Year Ended 10/31/21 |
|
$ |
— |
|
|
|
Total Return Bond Fund |
|
|
|
|
|
|
Year Ended 10/31/23 |
|
$ |
— |
|
|
|
Year Ended 10/31/22 |
|
$ |
— |
|
|
|
Year Ended 10/31/21 |
|
$ |
— |
|
|
|
High Income Opportunities Fund |
|
|
|
|
|
|
Year Ended 10/31/23 |
|
$ |
214 |
|
|
|
Year Ended 10/31/22 |
|
$ |
404 |
|
|
|
Year Ended 10/31/21 |
|
$ |
1,528 |
|
|
|
Short-Term Bond Fund |
|
|
|
|
|
|
Year Ended 10/31/23 |
|
$ |
— |
|
|
|
Year Ended 10/31/22 |
|
$ |
— |
|
|
|
Year Ended 10/31/21 |
|
$ |
— |
|
|
(1) Merger Arbitrage Fund commenced operations on September 29, 2023.
(2) International Small Cap Growth Fund commenced operations on March 31, 2022.
The following table shows the brokerage commissions paid by each Fund to brokers who furnished research services to the Fund or Calamos Advisors, and the aggregate dollar amounts involved in those transactions, during the period indicated.
|
|
|
FISCAL YEAR ENDED
OCTOBER 31, 2023
|
|
|
|
|
COMMISSIONS PAID
FOR RESEARCH
|
|
PERCENTAGE OF
AGGREGATE
COMMISSIONS
|
|
|
Market Neutral Income Fund
|
|
$
|
1,056,575
|
|
|
|
28.5
|
%
|
|
|
Hedged Equity Fund
|
|
$
|
16,417
|
|
|
|
11.1
|
%
|
|
|
Phineus Long/Short Fund
|
|
$
|
874,217
|
|
|
|
15.1
|
%
|
|
|
Merger Arbitrage Fund(1)
|
|
$
|
308
|
|
|
|
40.1
|
%
|
|
|
Convertible Fund
|
|
$
|
8,207
|
|
|
|
49.9
|
%
|
|
|
Global Convertible Fund
|
|
$
|
479
|
|
|
|
10.2
|
%
|
|
|
Timpani Small Cap Growth Fund
|
|
$
|
271,712
|
|
|
|
26.9
|
%
|
|
|
Timpani SMID Growth Fund
|
|
$
|
11,977
|
|
|
|
27.6
|
%
|
|
|
Growth Fund
|
|
$
|
252,547
|
|
|
|
34.5
|
%
|
|
|
Growth and Income Fund
|
|
$
|
75,521
|
|
|
|
10.2
|
%
|
|
|
Dividend Growth Fund
|
|
$
|
988
|
|
|
|
34.5
|
%
|
|
|
Select Fund
|
|
$
|
5,132
|
|
|
|
65.2
|
%
|
|
|
International Growth Fund
|
|
$
|
279,983
|
|
|
|
43.3
|
%
|
|
|
Evolving World Growth Fund
|
|
$
|
577,779
|
|
|
|
29.0
|
%
|
|
|
Global Equity Fund
|
|
$
|
50,260
|
|
|
|
50.0
|
%
|
|
|
Global Opportunities Fund
|
|
$
|
56,482
|
|
|
|
39.5
|
%
|
|
|
International Small Cap Growth Fund
|
|
$
|
4,163
|
|
|
|
54.4
|
%
|
|
|
Total Return Bond Fund
|
|
$
|
—
|
|
|
|
0.0
|
%
|
|
|
High Income Opportunities Fund
|
|
$
|
147
|
|
|
|
68.5
|
%
|
|
|
Short-Term Bond Fund
|
|
$
|
—
|
|
|
|
0.0
|
%
|
|
(1) Merger Arbitrage Fund commenced operations on September 29, 2023.
66
SHARE CLASSES AND PRICING OF SHARES
Purchases and redemptions are discussed in the prospectus under the headings "How can I buy shares?" and "How can I sell (redeem) shares?" All of that information is incorporated herein by reference.
SALES CHARGE WAIVER
In addition to the sales charge waivers enumerated in the prospectus, dividends and distributions paid on shares of a Fund will be reinvested in shares of the same class of that Fund at net asset value (without the payment of any sales charge) unless you elect to receive dividends and distributions in cash. Additionally, proceeds of Class A shares redeemed from a Fund within the previous 90 days may be reinvested in Class A shares of that Fund at NAV without a sales charge. In order to take advantage of this sales charge waiver, you, or your broker-dealer or other sales agent, must submit your intent, in writing, with your purchase. In addition, if the amount of reinvestment is less than the amount of redemption, the sales charge waiver shall be pro-rated accordingly.
CONTINGENT DEFERRED SALES CHARGE
The contingent deferred sales charge ("CDSC") is computed on the lesser of the redemption price or purchase price, excluding amounts not subject to the charge. The following example illustrates the operation of the CDSC:
Assume that an individual opens an account and makes a purchase payment of $10,000 for 1,000 Class C shares of a Fund (at $10 per share) and that six months later the value of the investor's account for that Fund has grown through investment performance to $11,000 ($11 per share). If the investor should redeem $2,200 (200 shares), a CDSC would be applied against $2,000 of the redemption (the purchase price of the shares redeemed, because the purchase price is lower than the current net asset value of such shares ($2,200)). At the rate of 1.00%, the Class C CDSC would be $20.
The CDSC for Class A9 and Class C shares will be waived: (a) in the event of the total disability (as evidenced by a determination by the Social Security Administration) of the shareholder (including a registered joint owner) occurring after the purchase of the shares being redeemed, (b) in the event of the death of the shareholder (including a registered joint owner), (c) for redemptions made pursuant to a systematic withdrawal plan, including any Individual Retirement Account ("IRA") systematic withdrawal based on the shareholder's life expectancy including, but not limited to, substantially equal periodic payments described in Section 72(t)(2)(iv) of the Internal Revenue Code of 1986, as amended (the "Code") prior to age 59 1/2 (with the maximum annual rate subject to this waiver being 10% of the NAV of the account), and (d) for redemptions to satisfy required minimum distributions after age 73 from an IRA account (with the maximum amount subject to this waiver being based only upon the shareholder's Calamos IRA accounts).
LETTER OF INTENT
You may reduce the sales charges you pay on the purchase of Class A shares by making investments pursuant to a Letter of Intent ("LOI"). Under an LOI, you may purchase additional Class A shares of any Fund over a 13-month period and receive the same sales charge as if you had purchased all the shares at once. Your individual purchases will be made at the applicable sales charge based on the amount you intend to invest over a 13-month period. In addition, the market value of any current holdings in the Calamos Funds (as described and calculated under "Rights of Accumulation" as further noted in the Funds' prospectus) are eligible to be aggregated as of the start of the 13-month period and will be credited toward satisfying the LOI, but the reduced LOI sales charge rate will only apply to purchases made on or after the commencement date of the LOI. The 13-month LOI period commences with your first purchase of shares at the reduced LOI sales charge rate, and this first purchase also acknowledges acceptance of the terms of the LOI. The initial investment must meet the minimum initial purchase requirements. Purchases resulting from the reinvestment of dividends and/or capital gains do not apply towards the fulfillment of the LOI. In all instances, it is the investor's responsibility to notify the Funds, the Funds' transfer agent and/or their financial advisor of any current holdings in the Calamos Funds that should be counted towards the sales charge reduction (and provide account statements, as needed, for verification purposes) and any subsequent purchases that should be counted towards fulfillment of the LOI. During the term of the LOI, shares representing up to 5% of the indicated LOI amount will be held in escrow. Shares held in escrow have full dividend and voting privileges. The escrowed shares will be released when the full amount indicated has been purchased. If the full indicated LOI amount is not purchased during the term of the LOI, you will be required to pay CFS an
9 The above waivers apply to Class A shares originally purchased at net asset value pursuant to the $1,000,000 purchase order privilege for two years after the time of purchase (or the $250,000 or more purchase order privilege for one year after the time of purchase for Market Neutral Income Fund, Merger Arbitrage Fund, Convertible Fund, Global Convertible Fund, Total Return Bond Fund, High Income Opportunities Fund, and Short-Term Bond Fund).
67
amount equal to the difference between the dollar amount of the sales charges actually paid and the amount of the sales charges that you would have paid on your aggregate purchases if the total of such purchases had been made at a single time, and CFS reserves the right to redeem escrowed shares from your account if necessary to satisfy this obligation. Any remaining escrowed shares will be released to you. An LOI does not obligate you to buy, or a Fund to sell, the indicated amount of shares. Before submitting and/or signing an LOI, please carefully read and review the LOI provisions found in both the prospectus and this statement of additional information.
If purchasing shares through a financial intermediary, please also see the "Reduced sales charges available through certain financial intermediaries" section in the Funds' prospectus for more information.
PURCHASES OF CLASS I AND R6 SHARES
Class I and R6 shares are sold at net asset value and are not subject to an initial sales charge or to a contingent deferred sales charge. Please refer to the prospectus for more information.
REDEMPTION IN KIND
The Funds have elected to be governed by Rule 18f-1 under the 1940 Act pursuant to which they are obligated to redeem shares solely in cash up to the lesser of $250,000 or 1% of the net asset value of a Fund during any 90-day period for any one shareholder. Redemptions in excess of these amounts will normally be paid in cash, but may be paid wholly or partly by a distribution in kind of securities. A redemption is generally a taxable event for shareholders, regardless of whether the redemption is satisfied in cash or in kind.
PURCHASE IN KIND
You may, under certain circumstances, purchase shares of a Fund with other securities that you presently own (an "in-kind purchase"). Any in-kind purchase would be subject to approval by the Trust, and would be subject to the Trust's in-kind purchase procedures then in effect. These procedures presently require any consideration used in an in-kind purchase to be comprised of (a) securities that are held in the Fund's portfolio, or (b) securities that are not currently held in the portfolio but that are eligible for purchase by the Fund (consistent with the Fund's investment objectives and restrictions), have been approved for investment by the Fund's portfolio manager and have readily available market quotations. Should the Trust approve your purchase of a Fund's shares with securities, the Trust would follow its in-kind purchase procedures and would value the securities tendered in payment (determined as of the next close of regular session trading on the New York Stock Exchange after receipt of the purchase order) pursuant to the Trust's valuation procedures as then in effect, and you would receive the number of Fund shares having a net asset value on the purchase date equal to the aggregate value of the securities tendered. Such in-kind purchases may result in the recognition of gain or loss for federal income tax purposes on the securities transferred to the Fund.
REDEMPTION FEES
High Income Opportunities Fund has a 1% redemption fee that may apply if a shareholder redeems shares within 60 days of purchase by selling or by exchanging to another fund. For purposes of determining this fee, shares are considered sold on a first-in, first-out basis. The fee is withheld from redemption proceeds and retained by High Income Opportunities Fund. Shares held for more than 60 days are not subject to the 1% fee. For purposes of determining the 60-day period, Day 1 will be the day following the trade date of a purchase into High Income Opportunities Fund (and Day 1 will be the day following the exchange in trade date for an exchange into High Income Opportunities Fund from another Calamos Fund) and will be tracked using calendar days. The following transactions will be exempt from the redemption fee:
• Redemptions of shares previously acquired through the reinvestment of the Fund's dividend and/or capital gains distributions
• In the event of the death of the shareholder (including a registered joint owner)
• In the event of the total disability (as evidenced by a determination by the Social Security Administration) of the shareholder (including a registered joint owner) occurring after the purchase of the shares being redeemed
• Shareholder divorce
• Shareholder hardship
• Mandatory distributions to satisfy required minimum distributions after age 73 from an IRA or other Retirement Plan account (with the maximum amount subject to this waiver being based only upon the shareholder's Calamos accounts)
68
• Redemptions made pursuant to a systematic withdrawal plan, including any Individual Retirement Account ("IRA") systematic withdrawal based on the shareholder's life expectancy including, but not limited to, substantially equal periodic payments described in Code Section 72(t)(2)(iv) prior to age 59 1/2 (with the maximum annual rate subject to this waiver being 10% of the NAV of the account)
• Redemptions due to automatic rebalancing of an account
• Retirement Plan account terminations
• Retirement Plan account involuntary redemptions
• Retirement Plan account forfeitures
• Return of excess contributions within IRA's and Retirement Plan accounts
• Redemptions of shares through a fund of funds
• Redemptions of shares through a fee-based advisory or wrap account (both discretionary and non-discretionary)
• Redemptions of shares to correct or adjust a prior transaction processed in error by a financial intermediary
• Redemptions of shares to pay for involuntary fees (maintenance, low balance, fiduciary, etc.) assessed against an account (for both qualified and non-qualified accounts), except for fees related to contingent deferred sales charges
High Income Opportunities Fund may waive the redemption fee at its sole discretion.
High Income Opportunities Fund reserves the right to modify or eliminate the redemption fee at any time.
CERTAIN REDEMPTIONS AND REINVESTMENTS
Calamos Advisors and its affiliates have investments in certain of the Funds. From time to time, Calamos Advisors or an affiliate may, for tax purposes, redeem a portion of its Fund holdings, reinvesting in shares of the same Fund shortly thereafter. These transactions are subject to the Funds' excessive trading policies and procedures and will only be consummated if they are determined not to be disruptive to the management of the Fund under those procedures.
NET ASSET VALUE
Each Fund's share price, or NAV, is determined as of the close of regular session trading on the New York Stock Exchange (the "NYSE") (normally 4:00 p.m. Eastern Time) each day that the NYSE is open. The NYSE is regularly closed on New Year's Day, the third Monday in January and February, Good Friday, the last Monday in May, Independence Day, Labor Day, Thanksgiving and Christmas.
The NAV per share for each class of Fund shares is calculated in accordance with Rule 22c-1 of the 1940 Act by dividing the pro rata share of the value of all of the securities and other assets of the Fund allocable to that class of Fund shares, less the liabilities allocable to that class, by the number of shares of the class outstanding. When shares are purchased or sold, the order is processed at the next NAV (plus any applicable sales charge) that is calculated on a day when the NYSE is open for trading, after receiving a purchase or sale order. Because the Funds may invest in securities that are primarily listed on foreign exchanges and trade on days when the Funds do not price their shares, a Fund's NAV may change on days when shareholders will not be able to purchase or redeem the Fund's shares. If shares are purchased or sold through a broker-dealer, it is the responsibility of that broker-dealer to transmit those orders to the Funds' transfer agent so such orders will be received in a timely manner. To the extent circumstances prevent the use of the primary calculation methodology previously described, the Adviser may use alternative methods to calculate the NAV.
A purchase or sale order typically is accepted when the Fund's transfer agent or an intermediary has received a completed application or appropriate instruction along with the intended investment, if applicable, and any other required documentation.
VALUATION PROCEDURES
The Trust's Board of Trustees, including a majority of the Trustees who are not "interested persons" of the Trust, have designated Calamos Advisors to perform fair valuation determinations related to all Fund investments under the oversight of the Board. As "valuation designee" Calamos Advisors has adopted procedures to guide the determination of the NAV on any day on which a Fund's NAVs are determined. The valuation of a Fund's investments is in accordance with these procedures. Fund securities that are traded on U.S. securities exchanges, except option securities, are valued at the official closing price, which is the last current reported sales price on its principal exchange at the time each Fund determines its net asset value ("NAV"). Securities traded in
69
the over-the-counter market and quoted on The NASDAQ Stock Market are valued at the NASDAQ Official Closing Price, as determined by NASDAQ, or lacking a NASDAQ Official Closing Price, the last current reported sale price on NASDAQ at the time a Fund determines its NAV.
When a last sale or closing price is not available, equity securities, other than option securities, that are traded on a U.S. securities exchange and other equity securities traded in the over-the-counter market are valued at the mean between the most recent bid and asked quotations on its principal exchange in accordance with guidelines adopted by the board of trustees. Each option security traded on a U.S. securities exchange is valued at the mid-point of the consolidated bid/ask quote for the option security, also in accordance with guidelines adopted by the board of trustees. Each over-the-counter option that is not traded through the Options Clearing Corporation is valued either by an independent pricing agent approved by the board of trustees or based on a quotation provided by the counterparty to such option under the ultimate supervision of the board of trustees.
Fixed-income securities, bank loans, certain convertible preferred securities, and non-exchange traded derivatives are normally valued by independent pricing services or by dealers or brokers who make markets in such securities. Valuations of such fixed income securities, bank loans, certain convertible preferred securities, and non-exchange traded derivatives consider yield or price of equivalent securities of comparable quality, coupon rate, maturity, type of issue, trading characteristics and other market data and do not rely exclusively upon exchange or over-the-counter prices.
Trading on European and Far Eastern exchanges and over-the-counter markets is typically completed at various times before the close of business on each day on which the New York Stock Exchange ("NYSE") is open. Each security trading on these exchanges or in over-the-counter markets may be valued utilizing a systematic fair valuation model provided by an independent pricing service approved by the board of trustees. The valuation of each security that meets certain criteria in relation to the valuation model is systematically adjusted to reflect the impact of movement in the U.S. market after the foreign markets close. Securities that do not meet the criteria, or that are principally traded in other foreign markets, are valued as of the last reported sale price at the time the respective Fund determines its NAV, or when reliable market prices or quotations are not readily available, at the mean between the most recent bid and asked quotations as of the close of the appropriate exchange or other designated time. Trading of foreign securities may not take place on every NYSE business day. In addition, trading may take place in various foreign markets on Saturdays or on other days when the NYSE is not open and on which the respective Fund's NAV is not calculated.
If the pricing committee determines that the valuation of a security in accordance with the methods described above is not reflective of a fair value for such security, the security is valued at a fair value by the pricing committee.
Each Fund also may use fair value pricing, pursuant to guidelines adopted by Calamos Advisors, if trading in the security is halted or if the value of a security it holds is materially affected by events occurring before the Fund's pricing time but after the close of the primary market or exchange on which the security is listed. Those procedures may utilize valuations furnished by pricing services approved by the Calamos Advisors, which may be based on market transactions for comparable securities and various relationships between securities that are generally recognized by institutional traders, a computerized matrix system, or appraisals derived from information concerning the securities or similar securities received from recognized dealers in those securities.
When fair value pricing of securities is employed, the prices of securities used by a Fund to calculate its NAV may differ from market quotations or official closing prices. There can be no assurance that a Fund could purchase or sell a portfolio security at the price used to calculate the Fund's net asset value ("NAV").
TAXATION
The following summarizes certain additional federal income tax considerations generally affecting the Funds and their shareholders. The discussion is for general information only and does not purport to consider all aspects of U.S. federal income taxation that might be relevant to beneficial owners of shares of the Funds. The discussion is based upon current provisions of the Code, existing regulations promulgated thereunder, and administrative and judicial interpretations thereof, all of which are subject to change, which change could be retroactive. The discussion applies only to beneficial owners of Fund shares in whose hands such shares are capital assets within the meaning of Section 1221 of the Code, and may not apply to certain types of beneficial owners of shares (such as insurance companies, financial institutions, tax exempt organizations, broker-dealers, persons investing through tax-qualified plans or other tax-advantaged arrangements) who may be subject to special rules. Persons who may be subject to tax in more than one country should consult the provisions of any applicable tax treaty to determine the potential tax consequences to them. Prospective investors should consult their own tax advisers with regard to the
70
federal tax consequences of the purchase, ownership and disposition of Fund shares, as well as the tax consequences arising under the laws of any state, foreign country, or other taxing jurisdiction. The discussion here and in the prospectus is not intended as a substitute for careful tax planning.
Each Fund has elected to be treated as a regulated investment company under the Code and intends each year to qualify and be eligible to be treated as such. To qualify as a regulated investment company, each Fund generally must, among other things, (a) derive in each taxable year at least 90% of its gross income from (i) dividends, interest, payments with respect to certain securities loans, gains from the sale or other disposition of stock, securities or foreign currencies, or other income (including, but not limited to, gains from options, futures, or forward contracts) derived with respect to its business of investing in such stock, securities or currencies, and (ii) net income derived from interests in certain "qualified publicly traded partnerships" ("Qualifying Income Test"); (b) diversify its holdings so that, at the end of each quarter of the Fund's taxable year, (i) at least 50% of the value of the Fund's assets is represented by cash, U.S. Government securities, the securities of other regulated investment companies and other securities, with such other securities of any one issuer limited for the purposes of this calculation to an amount not greater than 5% of the value of the Fund's total assets and 10% of the outstanding voting securities of such issuer, and (ii) not more than 25% of the value of its total assets is invested in the securities (other than U.S. Government securities or the securities of other regulated investment companies) of any one issuer, two or more issuers which the Fund controls and which are engaged in the same, similar or related trades or businesses or one or more "qualified publicly traded partnerships" ("Diversification Test"); and (c) distribute with respect to each taxable year at least the sum of (i) 90% of its investment company taxable income (which includes dividends, interest and net short-term capital gains in excess of any net long-term capital losses) and (ii) 90% of its tax exempt income, net of expenses allocable thereto.
In general, for purposes of the 90% gross income requirement described in (a) above, income derived from an equity investment in a partnership will be treated as qualifying income only to the extent such income is attributable to items of income of the partnership which would be qualifying income if realized directly by the regulated investment company. However, 100% of the net income derived from an interest in a "qualified publicly traded partnership" will be treated as qualifying income. A "qualified publicly traded partnership" is one in which the interests are traded on an established securities market or are readily tradable on a secondary market or the substantial equivalent thereof, and that derives less than 90% of its income from the qualifying income described in paragraph (a)(i) above. In general, such entities will be treated as partnerships for federal income tax purposes because they meet the passive income requirement under Code section 7704(c)(2). MLPs, if any, in which a Fund invests generally will qualify as qualified publicly traded partnerships. In addition, although in general the passive loss rules of the Code do not apply to regulated investment companies, such rules do apply to a regulated investment company with respect to items attributable to an interest in a qualified publicly traded partnership.
For purposes of the diversification test in (b) above, the term "outstanding voting securities of such issuer" will include the equity securities of a qualified publicly traded partnership. Also, for purposes of the diversification test in (b) above, the identification of the issuer (or, in some cases, issuers) of a particular Fund investment can depend on the terms and conditions of that investment. In some cases, identification of the issuer (or issuers) is uncertain under current law, and an adverse determination or future guidance by the Internal Revenue Service ("IRS") with respect to issuer identification for a particular type of investment may adversely affect the Fund's ability to meet the diversification test in (b) above.
The Treasury Department is authorized to promulgate regulations under which gains from foreign currencies (and options, futures, and forward contracts on foreign currency) would constitute qualifying income for purposes of the Qualifying Income Test only if such gains are directly related to investing in securities. To date, such regulations have not been issued.
A regulated investment company generally must look through any of 20% or more voting interest it owns in a corporation, including another regulated investment company, to the underlying assets thereof for purposes of the Diversification Test; special rules potentially providing limited relief from the application of this rule apply where a regulated investment company owns such an interest in an underlying regulated investment company.
If a Fund were to fail to qualify as a regulated investment company accorded special tax treatment for any taxable year, the Fund would be subject to tax on its taxable income at corporate income tax rates (without any deduction for distributions to its shareholders), and all distributions from earnings and profits, including any distributions of net tax-exempt income and net long-term capital gains, would be taxable to shareholders as ordinary income. Some portions of such distributions may be eligible for the dividends received deduction in the case of corporate shareholders and reduced rates of taxation on qualified dividend income in the case of individuals. In addition, the Fund could be required to recognize unrealized gains, pay substantial taxes and interest and make substantial distributions before requalifying as a regulated investment company that is accorded special tax treatment. The remainder of this discussion assumes that each Fund will qualify as a regulated investment company.
71
As a regulated investment company, a Fund generally will not be subject to U.S. federal income tax on its investment company taxable income and net capital gains (any net long-term capital gains in excess of the sum of net short-term capital losses and capital loss carryovers from prior years) properly reported by the Fund as capital gain dividends, if any, that it distributes to shareholders on a timely basis. Each Fund intends to distribute to its shareholders, at least annually, all or substantially all of its investment company taxable income and any net capital gains. In addition, amounts not distributed by a Fund on a timely basis in accordance with a calendar year distribution requirement are subject to a nondeductible 4% excise tax. To avoid the tax, a Fund must distribute during each calendar year an amount equal to the sum of (1) at least 98% of its ordinary income (not taking into account any capital gains or losses) for the calendar year, (2) at least 98.2% of its capital gains in excess of its capital losses (and adjusted for certain ordinary losses) for the twelve month period ending on October 31, and (3) all ordinary income and capital gains for previous years that were not distributed during such years. A distribution will be treated as paid on December 31 of the calendar year if it is declared by a Fund in October, November, or December of that year to shareholders of record on a date in such a month and paid by the Fund during January of the following year. Such distributions will be treated as paid to shareholders in the calendar year in which the distributions are declared, rather than the calendar year in which the distributions are received. To avoid application of the excise tax, each Fund intends to make its distributions in accordance with the calendar year distribution requirement.
DISTRIBUTIONS
Dividends and distributions from a Fund, whether received in shares or cash, generally are taxable to shareholders and must be reported on each shareholder's federal income tax return. Dividends paid out of a Fund's investment company taxable income generally will be taxable to a U.S. shareholder as ordinary income.
A portion of the dividends paid by certain Funds may qualify for the dividends received deduction available to corporate shareholders under Section 243 of the Code or the reduced rates of taxation under Section 1(h)(11) of the Code that apply to "qualified dividend income" received by noncorporate shareholders, provided holding period and other requirements are met at both the shareholder and Fund level. Distributions of net capital gains — that is, the excess, if any, of net long-term gain over net short-term loss — properly reported by a Fund as capital gain dividends, generally are taxable to shareholders as long-term capital gains, regardless of how long the shareholder has held a Fund's shares, and are not eligible for the dividends received deduction. The IRS and the Department of the Treasury have issued regulations that impose special rules in respect of capital gain dividends received through partnership interests constituting "applicable partnership interests" under Section 1061 of the Code. Distributions of gains from investments that a Fund owned for one year or less will generally be taxable to shareholders as ordinary income.
Any distributions in excess of a Fund's current and accumulated earnings and profits will be characterized as a return of capital to shareholders to the extent of their basis in their Fund shares and, thereafter, as capital gain. A return of capital is not taxable, but it reduces a shareholder's tax basis, thus reducing any loss or increasing any gain on a subsequent taxable disposition of Fund shares. Distributions are taxable to shareholders as described herein even if they are paid from income or gains earned by a Fund before a shareholder's investment (and thus effectively were included in the price the shareholder paid). The tax treatment of dividends and distributions will be the same whether a shareholder reinvests them in additional shares or elects to receive them in cash.
Distributions by a Fund to its shareholders that the Fund properly reports as "section 199A dividends," as defined and subject to certain conditions described below, are treated as qualified REIT dividends in the hands of non-corporate shareholders. Non-corporate shareholders are permitted a federal income tax deduction equal to 20% of qualified REIT dividends received by them, subject to certain limitations. Very generally, a "section 199A dividend" is any dividend or portion thereof that is attributable to certain dividends received by a regulated investment company from REITs, to the extent such dividends are properly reported as such by the regulated investment company in a written notice to its shareholders. A section 199A dividend is treated as a qualified REIT dividend only if the shareholder receiving such dividend holds the dividend-paying regulated investment company shares for at least 46 days of the 91-day period beginning 45 days before the shares become ex-dividend, and is not under an obligation to make related payments with respect to a position in substantially similar or related property. A Fund is permitted to report such part of its dividends as section 199A dividends as are eligible, but is not required to do so. Subject to future regulatory guidance to the contrary, a distribution of income attributable to qualified publicly traded partnership income from a Fund's investment in an MLP will ostensibly not qualify for the deduction that would be available to a non-corporate shareholder were the shareholder to own such MLP directly.
72
SALES OF SHARES
Upon the disposition of shares of a Fund (whether by redemption, sale or exchange), a shareholder may realize a gain or loss. Such gain or loss will be capital gain or loss if the shares are capital assets in the shareholder's hands, and will be long-term or short-term generally depending upon the shareholder's holding period for the shares. Any loss realized on a disposition of Fund shares will be disallowed to the extent the shares disposed of are replaced with substantially identical shares within a period of 61 days beginning 30 days before and ending 30 days after the shares are disposed of. In such a case, the basis of the shares acquired will be adjusted to reflect the disallowed loss. Any loss realized by a shareholder on a disposition of shares held by the shareholder for six months or less will be treated as a long-term capital loss to the extent of any capital gain dividends received by the shareholder with respect to such shares.
Depending on certain factors relating to a Fund's ownership in an underlying fund both before and after a redemption, a Fund's redemption of shares of such underlying fund may cause the Fund to be treated not as realizing capital gain or loss in the amount by which the redemption proceeds exceed the Fund's tax basis in the shares of the underlying fund, but instead to be treated as receiving a taxable dividend in the full amount of the redemption proceeds. Dividend treatment of a redemption by a Fund would affect the amount and character of income required to be distributed by both the Fund and the underlying fund for the year in which the redemption occurred. It is possible that such a dividend would qualify as a "qualified dividend income"; otherwise, it would be taxable as ordinary income and could cause shareholders of a Fund that invests in underlying funds to recognize higher amounts of ordinary income than if the shareholders had held the shares of the underlying funds directly.
NET INVESTMENT INCOME TAX ON CERTAIN INVESTMENT INCOME
Certain noncorporate taxpayers are subject to an additional tax of 3.8% with respect to the lesser of (1) their "net investment income" or (2) the excess of their "modified adjusted gross income" over a threshold amount ($250,000 for married persons filing jointly and $200,000 for single taxpayers). For this purpose, "net investment income" includes interest, dividends (including dividends paid with respect to shares), annuities, royalties, rent, net gain attributable to the disposition of property not held in a trade or business (including net gain from the sale, redemption, exchange or other taxable disposition of shares) and certain other income, but will be reduced by any deductions properly allocable to such income or net gain.
OPTIONS, FUTURES AND FORWARD CONTRACTS, AND SWAP AGREEMENTS OR DERIVATIVES
A Fund may purchase and sell put and call options. In general, option premiums received by a Fund are not immediately included in the income of the Fund. Instead, the premiums are recognized when the option contract expires, the option is exercised by the holder, or the Fund transfers or otherwise terminates the option (e.g., through a closing transaction). If a call option written by a Fund is exercised and the Fund sells or delivers the underlying stock, the Fund generally will recognize capital gain or loss equal to (a) the sum of the strike price and the option premium received by the Fund minus (b) the Fund's basis in the stock. Such gain or loss generally will be short-term or long-term depending upon the holding period of the underlying stock. If securities are purchased by a Fund pursuant to the exercise of a put option written by it, the Fund generally will subtract the premium received for purposes of computing its cost basis in the securities purchased. Gain or loss arising in respect of a termination of a Fund's obligation under an option other than through the exercise of the option will be short-term gain or loss depending on whether the premium income received by the Fund is greater or less than the amount paid by the Fund (if any) in terminating the transaction. Thus, for example, if an option written by a Fund expires unexercised, the Fund generally will recognize short-term gain equal to the premium received.
The tax treatment of certain options, futures contracts, forward contracts, foreign currency positions and swap agreements used by the Funds may be governed by Section 1256 of the Code ("Section 1256 contracts"). Any gains or losses on Section 1256 contracts are generally considered 60% long-term and 40% short-term capital gains or losses ("60/40"), although certain foreign currency gains and losses from such contracts may be treated as ordinary in character. Also, Section 1256 contracts held by a Fund at the end of each taxable year (and, for purposes of the 4% excise tax, on certain other dates as prescribed under the Code) are "marked to market" with the result that unrealized gains or losses are treated as though they were realized and the resulting gain or loss is treated as ordinary or 60/40 gain or loss, as applicable.
Generally, the hedging transactions and certain other transactions in options, futures and forward contracts undertaken by a Fund, may trigger the straddle rules contained primarily in Section 1092 of the Code. In some cases, the straddle rules also could apply in connection with swap agreements. Very generally, where applicable, Section 1092 requires (i) that losses be deferred on positions deemed to be offsetting positions with respect to "substantially similar or related property," to the extent of unrealized gain in the latter, and (ii) that the holding period of such a straddle position that has not already been held for the long-term holding period be terminated and begin anew once the position is no longer part of a straddle. Options on single stocks that are
73
not "deep in the money" may constitute qualified covered calls, which generally are not subject to the straddle rules; the holding period on stock underlying qualified covered calls that are "in the money" although not "deep in the money" will be suspended during the period that such calls are outstanding. The straddle rules and the rules governing qualified covered calls may affect the character of gains (or losses) realized by a Fund by causing gains that would otherwise constitute long-term capital gains to be treated as short-term capital gains, and distributions that would otherwise constitute "qualified dividend income" or qualify for the dividends-received deduction to fail to satisfy the holding period requirements and therefore to be taxed as ordinary income or to fail to qualify for the dividends-received deduction, as the case may be. In addition, losses realized by a Fund on positions that are part of a straddle may be deferred under the straddle rules, rather than being taken into account in calculating the taxable income for the taxable year in which such losses are realized. Because only a few regulations implementing the straddle rules have been promulgated, the tax consequences to a Fund of transactions in options, futures, forward contracts, and swap agreements are not entirely clear.
A Fund may make one or more of the elections available under the Code which are applicable to straddles. If a Fund makes any of the elections, the amount, character and timing of gains or losses from the affected straddle positions will be determined under rules that vary according to the election(s) made. The rules applicable under certain of the elections operate to accelerate the recognition of gains or losses from the affected straddle positions. Because application of the straddle rules may affect the character of gains or losses, defer losses and/or accelerate the recognition of gains or losses from the affected straddle positions, the amount which must be distributed to shareholders, and which will be taxed to shareholders as ordinary income or long-term capital gain, may be increased or decreased substantially as compared to a fund that did not engage in such hedging transactions.
In addition, a Fund's transactions in other derivative instruments (e.g., forward contracts and swap agreements), as well as any of its hedging, short sale, securities loan or similar transactions, may be subject to one or more special tax rules (e.g., notional principal contract, straddle, constructive sale, wash sale and short sale rules), which could affect the amount, timing and/or character of distributions to shareholders. The qualifying income and diversification requirements applicable to a Fund's assets may limit the extent to which the Fund will be able to engage in transactions in options, futures contracts, forward contracts, swap agreements, and other derivative instruments.
Rules governing the tax aspects of swap agreements and other derivative instruments are in a developing stage and are not entirely clear in certain respects. Accordingly, while the Funds intend to account for such transactions in a manner they deem to be appropriate, the IRS might not accept such treatment. If it did not, the status of a Fund as a regulated investment company might be affected. Calamos Advisors intends to monitor developments in this area.
An adverse determination or future guidance by the IRS with respect to these rules (which determination or guidance could be retroactive) may affect whether a Fund has made sufficient distributions, and otherwise satisfied the relevant requirements, to maintain its qualification as a regulated investment company and avoid a Fund-level tax.
SHORT SALES
Certain Funds may make short sales of securities. Short sales may increase the amount of short-term capital gain realized by a Fund, which is taxed as ordinary income when distributed to shareholders.
PASSIVE FOREIGN INVESTMENT COMPANIES
Certain Funds may invest in the stock of foreign corporations which may be classified under the Code as passive foreign investment companies ("PFICs"). In general, a foreign corporation is classified as a PFIC for a taxable year if at least one-half of its assets constitute investment-type assets or 75% or more of its gross income is investment-type income. If a Fund receives a so-called "excess distribution" with respect to PFIC stock, the Fund itself may be subject to tax on a portion of the excess distribution, whether or not the corresponding income is distributed by the Fund to stockholders. In general, under the PFIC rules, an excess distribution is treated as having been realized ratably over the period during which the Fund held the PFIC stock. A Fund itself will be subject to tax on the portion, if any, of an excess distribution that is so allocated to prior taxable years and an interest factor will be added to the tax, as if the tax had been payable in such prior taxable years. Certain distributions from a PFIC as well as gain from the sale of PFIC stock are treated as excess distributions. Excess distributions are characterized as ordinary income even though, absent application of the PFIC rules, certain excess distributions might have been classified as capital gain.
A Fund may be eligible to elect alternative tax treatment with respect to PFIC stock. Under an election that currently is available in some circumstances, a Fund generally would be required to include in its gross income its share of the earnings of a PFIC on a
74
current basis, regardless of whether distributions are received from the PFIC in a given year. If this election were made, the special rules, discussed above, relating to the taxation of excess distributions, would not apply. Alternatively, another election may be available that would involve marking to market a Fund's PFIC shares at the end of each taxable year (and on certain other dates prescribed in the Code), with the result that unrealized gains (and to a limited extent losses) are treated as though they were realized on the last day of the Fund's taxable year and reported as ordinary income or loss. Any mark-to-market losses and any loss from an actual disposition of PFIC shares would be deductible as ordinary losses to the extent of any net mark-to-market gains included in income with respect to such shares in prior years. If this election were made, tax at the Fund level under the PFIC rules would generally be eliminated, but the Fund could, in limited circumstances, incur nondeductible interest charges. A Fund's intention to qualify annually as a regulated investment company may limit its elections with respect to PFIC shares.
Because the application of the PFIC rules may affect, among other things, the character of gains and the amount of gain or loss and the timing of the recognition of income with respect to PFIC shares, and may subject a Fund itself to tax on certain income from PFIC shares, the amount that must be distributed to shareholders and will be taxed to shareholders as ordinary income or long-term capital gain may be increased or decreased substantially as compared to a fund that did not invest in PFIC shares. Dividends paid by PFICs are not eligible to be treated as "qualified dividend income."
FOREIGN CURRENCY TRANSACTIONS
Under the Code, gains or losses attributable to fluctuations in exchange rates which occur between the time a Fund accrues income or other receivables or accrues expenses or other liabilities denominated in a foreign currency and the time the Fund actually collects such receivables or pays such liabilities generally are treated as ordinary income or loss. Similarly, on disposition of debt securities denominated in a foreign currency and on disposition of certain other instruments, gains or losses attributable to fluctuations in the value of the foreign currency between the date of acquisition of the security or contract and the date of disposition also are treated as ordinary gain or loss. These gains and losses, referred to under the Code as "section 988" gains or losses, may increase or decrease the amount of a Fund's investment company taxable income to be distributed to its shareholders as ordinary income, and affect the timing as well as character of distributions.
FOREIGN TAXATION
Income, gains and proceeds received by the Funds from sources within foreign countries may be subject to withholding and other taxes imposed by such countries. Tax conventions between certain countries and the U.S. may reduce or eliminate such taxes. In addition, the Funds intend to minimize foreign taxation in cases where it is deemed prudent to do so. If more than 50% of the value of a Fund's total assets at the close of its taxable year consists of securities of foreign corporations, such Fund will be eligible to elect to "pass-through" to the Fund's shareholders the amount of foreign income and similar taxes paid by the Fund. If this election is made, a shareholder generally subject to tax will be required to include in gross income (in addition to taxable dividends actually received) his pro rata share of the foreign taxes paid by the Fund, and may be entitled either to deduct (as an itemized deduction) his or her pro rata share of foreign taxes in computing his taxable income or to use it (subject to limitations) as a foreign tax credit against his or her U.S. federal income tax liability. No deduction for foreign taxes may be claimed by a shareholder who does not itemize deductions. Each shareholder will be notified within 60 days after the close of the Fund's taxable year if the foreign taxes paid by the Fund will "pass-through" for that year.
Generally, a credit for foreign taxes is subject to the limitation that it may not exceed the shareholder's U.S. tax attributable to his or her total foreign source taxable income. For this purpose, if the pass-through election is made, the source of the Fund's income will flow through to shareholders. With respect to such Funds, gains from the sale of securities will be treated as derived from U.S. sources and certain currency fluctuation gains, including fluctuation gains from foreign currency-denominated debt securities, receivables and payables will be treated as ordinary income derived from U.S. sources. The limitation on the foreign tax credit is applied separately to foreign source passive income, and to certain other types of income. Shareholders may be unable to claim a credit for the full amount of their proportionate share of the foreign taxes paid by the Fund.
ORIGINAL ISSUE DISCOUNT AND MARKET DISCOUNT
Some of the debt securities with a fixed maturity date of more than one year from the date of issuance (and zero-coupon debt obligations with a fixed maturity date of more than one year from the date of issuance) that may be acquired by a Fund may be treated as debt securities that are issued originally at a discount. Generally, the amount of the original issue discount ("OID") is treated as interest income and is included in the Fund's income and required to be distributed by the Fund over the term of the debt security, even though payment of that amount is not received until a later time, usually when the debt security matures. A portion of the OID includable in income with respect to certain high-yield corporate debt securities may be treated as a dividend for federal income tax purposes.
75
Some of the debt securities with a fixed maturity date of more than one year from the date of issuance that may be acquired by a Fund in the secondary market may be treated as having "market discount". Very generally, market discount is the excess of the stated redemption price of a debt obligation (or in the case of an obligation issued with original issue discount, its "revised issue price") over the purchase price of such obligation. Generally, any gain recognized on the disposition of, and any partial payment of principal on, a debt security having market discount is treated as ordinary income to the extent the gain, or principal payment, does not exceed the "accrued market discount" on such debt security. Alternatively, a Fund may elect to accrue market discount currently, in which case the Fund will be required to include the accrued market discount in the Fund's income (as ordinary income) and thus distribute it over the term of the debt security, even though payment of that amount is not received until a later time, upon partial or full repayment or disposition of the debt security. If the Fund makes the election referred to in the preceding sentence, the rate at which the market discount accrues, and thus is included in a Fund's income, will depend upon which of the permitted accrual methods the Fund elects.
Some debt securities with a fixed maturity date of one year or less from the date of issuance that may be acquired by a Fund may be treated as having OID or, in certain cases, "acquisition discount" (very generally, the excess of the stated redemption price over the purchase price). Generally, the Fund will be required to include the OID or acquisition discount in income over the term of the debt security, even though payment of that amount is not received until a later time, upon partial or full repayment or disposition of the debt security. The rate at which OID or acquisition discount accrues, and thus is included in the Fund's income, will depend upon which of the permitted accrual methods the Fund elects.
A portion of the OID accrued on certain high yield discount obligations may not be deductible to the issuer and will instead be treated as a dividend paid by the issuer for purposes of the dividends received deduction. In such cases, if the issuer of the high yield discount obligations is a domestic corporation, dividend payments by a Fund may be eligible for the dividends received deduction to the extent attributable to the deemed dividend portion of such OID. A Fund generally will be required to distribute dividends to shareholders representing discount on debt securities that is currently includable in income, even though cash representing such income may not have been received by the Fund. Cash to pay such dividends may be obtained from sales proceeds of securities held by the Fund.
Investments in debt obligations that are at risk of or in default present special tax issues for a Fund. Tax rules are not entirely clear about issues such as whether or to what extent a Fund should recognize market discount on a debt obligation, when the Fund may cease to accrue interest, OID or market discount, when and to what extent the Fund may take deductions for bad debts or worthless securities and how the Fund should allocate payments received on obligations in default between principal and income. These and other related issues will be addressed by a Fund when, as and if it invests in such securities, in order to seek to ensure that it distributes sufficient income to preserve its status as a regulated investment company and does not become subject to U.S. federal income or excise tax.
CONSTRUCTIVE SALES
Certain rules may affect the timing and character of gain if a Fund engages in transactions that reduce or eliminate its risk of loss with respect to appreciated financial positions. If a Fund enters into certain transactions (including, but not limited to, short sales) in property while holding substantially identical property, the Fund would be treated as if it had sold and immediately repurchased the property and would be taxed on any gain (but not loss) from the constructive sale. The character of gain from a constructive sale would depend upon the Fund's holding period in the property. Loss from a constructive sale would be recognized when the property was subsequently disposed of, and its character would depend on the Fund's holding period and the application of various loss deferral provisions of the Code.
INVESTMENTS IN MASTER LIMITED PARTNERSHIPS
A Fund's ability to make direct and indirect investments in MLPs and certain non-U.S. entities is limited by the Fund's intention to qualify as a regulated investment company, and if the Fund does not appropriately limit such investments or if such investments are re-characterized for U.S. federal income tax purposes, the Fund's status as a regulated investment company may be jeopardized. Among other limitations, the Fund is permitted to have no more than 25% of the value of its total assets invested in qualified publicly traded partnerships, including MLPs.
INVESTMENTS IN OTHER REGULATED INVESTMENT COMPANIES
A Fund's investments in shares of another mutual fund, ETF or another company that qualifies as a regulated investment company (each, an "investment company") can cause the Fund to be required to distribute greater amounts of net investment income or net capital gain than the Fund would have distributed had it invested directly in the securities held by the investment
76
company, rather than in shares of the investment company. Further, the amount or timing of distributions from the Fund qualifying for treatment as a particular character (e.g., long-term capital gain, eligibility for dividends-received deduction, etc.) will not necessarily be the same as it would have been had the Fund invested directly in the securities held by the investment company.
A Fund that invests in shares of other investment companies will not be able to offset gains realized by one underlying fund in which the Fund invests against losses realized by another underlying fund in which the Fund invests. A Fund's investments in underlying funds could therefore affect the amount, timing and character of distributions to shareholders.
BACKUP WITHHOLDING
A Fund may be required to withhold on all taxable distributions payable to shareholders who fail to provide the Fund with their correct taxpayer identification number or to make required certifications, or who have been notified by the IRS that they are subject to backup withholding. Corporate shareholders and certain other shareholders specified in the Code generally are exempt from such backup withholding. Backup withholding is not an additional tax. Any amounts withheld may be credited against the shareholder's U.S. federal tax liability.
NON-U.S. SHAREHOLDERS
Withholding of Income Tax on Dividends: Under U.S. federal tax law, dividends paid on shares beneficially held by a person who is not a "U.S. person" within the meaning of the Code (a "foreign person"), are, in general, subject to withholding of U.S. federal income tax at a rate of 30% of the gross dividend, which may, in some cases, be reduced by an applicable tax treaty. However, if a beneficial holder who is a foreign person is eligible for the benefits of a tax treaty and has a permanent establishment in the United States, income effectively connected with the conduct by the beneficial holder of a trade or business in the United States and attributable to such permanent establishment will be subject to U.S. federal income taxation on a net basis at regular income tax rates.
Distributions by a Fund to foreign persons properly reported by the Fund as capital gain dividends, interest-related dividends and short-term capital gain dividends generally will not be subject to withholding of U.S. federal income tax. In general, the Code defines (1) "short-term capital gain dividends" as distributions of net short-term capital gains in excess of net long-term capital losses and (2) "interest-related dividends" as distributions from U.S. source interest income of types similar to those not subject to U.S. federal income tax if earned directly by an individual foreign person, in each case to the extent such distributions are properly reported as such by a Fund in a written notice to shareholders.
The exceptions to withholding for capital gain dividends and short-term capital gain dividends do not apply to (A) distributions to an individual foreign person who is present in the United States for a period or periods aggregating 183 days or more during the year of the distribution and (B) distributions attributable to gain that is (or is treated as) effectively connected with the conduct by the foreign person of a trade or business within the United States, including distributions subject to special rules regarding the disposition of U.S. real property interests. The exception to withholding for interest-related dividends does not apply to distributions to a foreign person (A) that has not provided a satisfactory statement that the beneficial owner is not a U.S. person, (B) to the extent that the dividend is attributable to certain interest on an obligation if the foreign person is the issuer or is a 10% shareholder of the issuer, (C) that is within certain foreign countries that have inadequate information exchange with the United States, or (D) to the extent the dividend is attributable to interest paid by a person that is a related person of the foreign person and the foreign person is a controlled foreign corporation. If a Fund invests in a RIC that pays capital gain dividends, short-term capital gain dividends or interest-related dividends to the Fund, such distributions retain their character as not subject to withholding if properly reported when paid by the Fund to foreign persons. A Fund is permitted to report such part of its dividends as interest-related and/or short-term capital gain dividends as are eligible, but is not required to do so.
In the case of shares held through an intermediary, the intermediary may withhold even if a Fund reports all or a portion of a payment as an interest-related or short-term capital gain dividend to shareholders. Foreign persons should contact their intermediaries regarding the application of these rules to their accounts.
Distributions by a Fund to foreign persons other than capital gain dividends, interest-related dividends and short-term capital gain dividends (e.g., distributions derived from any dividends on corporate stock, ordinary income other than U.S. source interest, foreign currency gains, foreign source interest, and ordinary income from swaps or investments in PFICs) would generally be subject to withholding at a rate of 30% (or lower applicable treaty rate). There can be no assurance as to the amount of distributions that would not be subject to withholding when paid to foreign persons.
77
Sections 1471-1474 of the Code and the U.S. Treasury and IRS guidance issued thereunder (collectively, "FATCA"), generally require each Fund to obtain information sufficient to identify the status of each of its shareholders under FATCA or under an applicable intergovernmental agreement (an "IGA") between the United States and a foreign government. Each Fund may be required to withhold 30% of the ordinary dividends it pays to shareholders that fail to meet the prescribed information reporting or certification requirements. The IRS and the Department of Treasury have issued proposed regulations providing that these withholding rules will not apply to the gross proceeds of share redemptions or capital gain dividends the Fund pays. Non-U.S. investors should consult their own tax advisers regarding the impact of these requirements on their investment in the Fund.
Income Tax on Sale of a Fund's Shares: Under U.S. federal tax law, a beneficial holder of shares who is a foreign person is not, in general, subject to U.S. federal income tax on gains (and is not allowed a deduction for losses) realized on the sale of such shares unless (i) such gain is effectively connected with the conduct of a trade or business carried on by such holder within the United States or (ii) in the case of an individual holder, the holder is present in the United States for a period or periods aggregating 183 days or more during the year of the sale and certain other conditions are met.
The availability of reduced U.S. taxation pursuant to any applicable treaties depends upon compliance with established procedures for claiming the benefits thereof and may further, in some circumstances, depend upon making a satisfactory demonstration to U.S. tax authorities that a foreign investor qualifies as a foreign person under U.S. domestic tax law and such treaties.
OTHER TAXATION
Distributions also may be subject to additional state, local and foreign taxes, depending on each shareholder's particular situation. Under the laws of various states, distributions of investment company taxable income generally are taxable to shareholders even though all or a substantial portion of such distributions may be derived from interest on certain federal obligations which, if the interest were received directly by a resident of such state, would be exempt from such state's income tax ("qualifying federal obligations"). However, some states may exempt all or a portion of such distributions from income tax to the extent the shareholder is able to establish that the distribution is derived from qualifying federal obligations. Moreover, for state income tax purposes, interest on some federal obligations generally is not exempt from taxation, whether received directly by a shareholder or through distributions of investment company taxable income (for example, interest on FNMA Certificates and GNMA Certificates). Each Fund will provide information annually to shareholders indicating the amount and percentage of a Fund's dividend distribution which is attributable to interest on federal obligations, and will indicate to the extent possible from what types of federal obligations such dividends are derived. Shareholders are advised to consult their own tax advisers with respect to the particular tax consequences to them of an investment in a Fund.
COST BASIS REPORTING
Each Fund (or its administrative agent) is required to report to the IRS and furnish to Fund shareholders the cost basis information for Fund shares purchased on or after January 1, 2012, and sold on or after that date. For each sale of Fund shares the Fund will permit Fund shareholders to elect from among several IRS-accepted cost basis methods, including average cost. In the absence of an election, the Fund will use the average cost method as a default cost basis method for the Fund's direct shareholders. Shareholders who purchase Fund shares through a broker or other intermediary should contact that broker or intermediary regarding the applicable default method, or other electable method, as these methods may vary. The cost basis method elected by a Fund shareholder (or the cost basis method applied by default) for each sale of Fund shares may not be changed after the settlement date of each such sale of Fund shares. Fund shareholders should consult with their tax advisors to determine the best IRS-accepted cost basis method for their tax situation and to obtain more information about how the cost basis reporting requirement applies to them.
GENERAL CONSIDERATIONS
The U.S. federal income tax discussion set forth above is for general information only. Prospective investors should consult their tax advisers regarding the specific federal tax consequences of purchasing, holding, and disposing of shares of a Fund, as well as the effects of state, local, foreign, and other tax law and any proposed tax law changes.
78
CONTROL PERSONS AND PRINCIPAL SHAREHOLDERS
The following table shows the only persons known to own beneficially (as determined in accordance with Rule 13d-3 under the 1934 Act) 5% or more of the outstanding shares of any Fund at January 31, 2024.
|
FUND
|
|
REGISTRATION
|
|
ACCOUNT SHARE BALANCE
PERCENT OF TOTAL SHRS
|
|
|
CALAMOS MARKET NEUTRAL INCOME FUND CLASS A
|
|
MORGAN STANLEY SMITH BARNEY LLC
FOR THE EXCLUSIVE BENEFIT OF ITS CUSTOMERS
1 NEW YORK PLZ FL 12
NEW YORK NY 10004-1965
|
|
14,318,736.3660
21.41%
|
|
|
|
|
CHARLES SCHWAB CO
REINVEST ACCOUNT
211 MAIN ST
SAN FRANCISCO CA 94105-1901
|
|
13,729,974.0970
20.53%
|
|
|
|
|
MERRILL LYNCH PIERCE FENNER & SMITH
FOR THE SOLE BENEFIT OF ITS
CUSTOMERS ATTN FUND ADMIN-97HC6
4800 DEER LAKE DR E 2ND FLOOR
JACKSONVILLE FL 32246-6484
|
|
11,956,338.4470
17.88%
|
|
|
|
|
WELLS FARGO CLEARING SERVICES LLC
SPECIAL CUSTODY ACCT FOR THE
EXCLUSIVE BENEFIT OF CUSTOMER
2801 MARKET ST
SAINT LOUIS MO 63103-2523
|
|
5,298,088.6450
7.92%
|
|
|
|
|
PERSHING LLC
1 PERSHING PLZ
JERSEY CITY NJ 07399-0001
|
|
4,301,139.3080
6.43%
|
|
|
|
|
NATIONAL FINANCIAL SERVICES LLC
FOR THE EXCLUSIVE BENEFIT OF OUR CUSTOMERS
ATTN MUTUAL FUNDS DEPT 4TH FL
499 WASHINGTON BLVD
JERSEY CITY NJ 07310-1995
|
|
3,928,314.3760
5.87%
|
|
|
CALAMOS MARKET NEUTRAL INCOME FUND CLASS C
|
|
MORGAN STANLEY SMITH BARNEY LLC
FOR THE EXCLUSIVE BENEFIT OF ITS CUSTOMERS
1 NEW YORK PLZ FL 12
NEW YORK NY 10004-1965
|
|
3,180,697.3460
18.98%
|
|
|
|
|
MERRILL LYNCH PIERCE FENNER & SMITH
FOR THE SOLE BENEFIT OF ITS
CUSTOMERS ATTN FUND ADMIN- 97KS6
4800 DEER LAKE DR E 2ND FLOOR
JACKSONVILLE FL 32246-6484
|
|
2,824,090.6000
16.86%
|
|
|
|
|
WELLS FARGO CLEARING SERVICES LLC
SPECIAL CUSTODY ACCT FOR THE
EXCLUSIVE BENEFIT OF CUSTOMER
2801 MARKET ST
SAINT LOUIS MO 63103-2523
|
|
2,790,191.0540
16.65%
|
|
|
|
|
RAYMOND JAMES
OMNIBUS FOR MUTUAL FUNDS
HOUSE ACCT FIRM 92500015
ATTN COURTNEY WALLER
880 CARILLON PKWY
ST PETERSBURG FL 33716-1100
|
|
2,277,510.9240
13.59%
|
|
|
|
|
PERSHING LLC
1 PERSHING PLZ
JERSEY CITY NJ 07399-0001
|
|
1,855,020.0840
11.07%
|
|
79
|
FUND
|
|
REGISTRATION
|
|
ACCOUNT SHARE BALANCE
PERCENT OF TOTAL SHRS
|
|
|
|
|
LPL FINANCIAL
OMNIBUS CUSTOMER ACCOUNT
ATTN LINDSAY O TOOLE
4707 EXECUTIVE DR
SAN DIEGO CA 92121-3091
|
|
1,041,348.3680
6.22%
|
|
|
CALAMOS MARKET NEUTRAL INCOME FUND CLASS I
|
|
MORGAN STANLEY SMITH BARNEY LLC
FOR THE EXCLUSIVE BENEFIT OF ITS CUSTOMERS
1 NEW YORK PLZ FL 12
NEW YORK NY 10004-1965
|
|
186,384,706.6760
20.72%
|
|
|
|
|
NATIONAL FINANCIAL SERVICES LLC
FOR THE EXCLUSIVE BENEFIT OF OUR CUSTOMERS
ATTN MUTUAL FUNDS DEPT 4TH FL
499 WASHINGTON BLVD
JERSEY CITY NJ 07310-1995
|
|
126,750,966.3440
14.09%
|
|
|
|
|
MERRILL LYNCH PIERCE FENNER & SMITH
FOR THE SOLE BENEFIT OF ITS
CUSTOMERS ATTN FUND ADMIN-97HC6
4800 DEER LAKE DR E 2ND FLOOR
JACKSONVILLE FL 32246-6484
|
|
99,552,988.4390
11.07%
|
|
|
|
|
CHARLES SCHWAB CO
REINVEST ACCOUNT
211 MAIN ST
SAN FRANCISCO CA 94105-1901
|
|
97,630,548.7740
10.86%
|
|
|
|
|
LPL FINANCIAL
OMNIBUS CUSTOMER ACCOUNT
ATTN LINDSAY O TOOLE
4707 EXECUTIVE DR
SAN DIEGO CA 92121-3091
|
|
62,523,369.5960
6.95%
|
|
|
|
|
RAYMOND JAMES
OMNIBUS FOR MUTUAL FUNDS
HOUSE ACCT FIRM 92500015
ATTN COURTNEY WALLER
880 CARILLON PKWY
ST PETERSBURG FL 33716-1100
|
|
49,835,088.2880
5.54%
|
|
|
|
|
UBS WM USA
0O0 11011 6100
SPEC CDY A/C EBOC UBSFSI
1000 HARBOR BLVD
WEEHAWKEN NJ 07086-6761
|
|
48,241,342.2690
5.36%
|
|
|
|
|
WELLS FARGO CLEARING SERVICES LLC
SPECIAL CUSTODY ACCT FOR THE
EXCLUSIVE BENEFIT OF CUSTOMER
2801 MARKET ST
SAINT LOUIS MO 63103-2523
|
|
48,157,817.9200
5.35%
|
|
|
CALAMOS MARKET NEUTRAL INCOME FUND CLASS R6
|
|
ATTN MUTUAL FUND OPERATIONS
MAC & CO A/C 764790
500 GRANT STREET ROOM 151-1010
PITTSBURGH PA 15219-2502
|
|
2,897,245.9930
35.19%
|
|
|
|
|
ATTN MUTUAL FUND OPERATIONS
MAC & CO A/C 888162
500 GRANT STREET ROOM 151-1010
PITTSBURGH PA 15219-2502
|
|
1,830,966.5810
22.24%
|
|
80
|
FUND
|
|
REGISTRATION
|
|
ACCOUNT SHARE BALANCE
PERCENT OF TOTAL SHRS
|
|
|
|
|
MAILCODE BD1N — ATTN MF
C/O RELIANCE TRUST COMPANY WI
MARIL & CO FBO 47
4900 W BROWN DEER ROAD
MILWAUKEE WI 53223-2422
|
|
1,341,121.3810
16.29%
|
|
|
|
|
AMERICAN UNITED LIFE INS CO
UNIT INVESTMENT TRUST
PO BOX 368
INDIANAPOLIS IN 46206-0368
|
|
1,169,061.9380
14.20%
|
|
|
CALAMOS HEDGED EQUITY FUND CLASS A
|
|
CHARLES SCHWAB CO
REINVEST ACCOUNT
211 MAIN ST
SAN FRANCISCO CA 94105-1901
|
|
876,479.5030
48.62%
|
|
|
|
|
PERSHING LLC
1 PERSHING PLZ
JERSEY CITY NJ 07399-0001
|
|
225,329.3310
12.50%
|
|
|
|
|
NATIONAL FINANCIAL SERVICES LLC
FOR THE EXCLUSIVE BENEFIT OF OUR CUSTOMERS
ATTN MUTUAL FUNDS DEPT 4TH FL
499 WASHINGTON BLVD
JERSEY CITY NJ 07310-1995
|
|
223,098.6740
12.38%
|
|
|
|
|
LPL FINANCIAL
OMNIBUS CUSTOMER ACCOUNT
ATTN LINDSAY O TOOLE
4707 EXECUTIVE DR
SAN DIEGO CA 92121-3091
|
|
130,580.2570
7.24%
|
|
|
|
|
RBC CAPITAL MARKETS LLC
MUTUAL FUND OMNIBUS PROCESSING OMNIBUS
ATTN MUTUAL FUND OPS MANAGER
250 NICOLLET MALL STE 1200 STE 1800
MINNEAPOLIS MN 55401-7554
|
|
117,618.2680
6.52%
|
|
|
|
|
STRATEVEST CO OMNIBUS ACCOUNT
PO BOX 1034
CHERRY HILL NJ 08034-0009
|
|
96,884.4390
5.37%
|
|
|
CALAMOS HEDGED EQUITY FUND CLASS C
|
|
LPL FINANCIAL
OMNIBUS CUSTOMER ACCOUNT
ATTN LINDSAY O TOOLE
4707 EXECUTIVE DR
SAN DIEGO CA 92121-3091
|
|
247,551.5930
37.32%
|
|
|
|
|
STIFEL NICOLAUS & CO INC
EXCLUSIVE BENEFIT OF CUSTOMERS
501 NORTH BROADWAY
ST LOUIS MO 63102-2188
|
|
218,786.0690
32.98%
|
|
|
|
|
NATIONAL FINANCIAL SERVICES LLC
FOR THE EXCLUSIVE BENEFIT OF OUR CUSTOMERS
ATTN MUTUAL FUNDS DEPT 4TH FL
499 WASHINGTON BLVD
JERSEY CITY NJ 07310-1995
|
|
73,324.2440
11.05%
|
|
|
|
|
PERSHING LLC
1 PERSHING PLZ
JERSEY CITY NJ 07399-0001
|
|
42,664.8860
6.43%
|
|
81
|
FUND
|
|
REGISTRATION
|
|
ACCOUNT SHARE BALANCE
PERCENT OF TOTAL SHRS
|
|
|
|
|
UBS WM USA
0O0 11011 6100
SPEC CDY A/C EBOC UBSFSI
1000 HARBOR BLVD
WEEHAWKEN NJ 07086-6761
|
|
40,851.9950
6.16%
|
|
|
CALAMOS HEDGED EQUITY FUND CLASS I
|
|
NATIONAL FINANCIAL SERVICES LLC
FOR THE EXCLUSIVE BENEFIT OF OUR CUSTOMERS
ATTN MUTUAL FUNDS DEPT 4TH FL
499 WASHINGTON BLVD
JERSEY CITY NJ 07310-1995
|
|
13,980,001.2180
37.56%
|
|
|
|
|
LPL FINANCIAL
OMNIBUS CUSTOMER ACCOUNT
ATTN LINDSAY O TOOLE
4707 EXECUTIVE DR
SAN DIEGO CA 92121-3091
|
|
6,371,738.089
17.12%
|
|
|
|
|
CHARLES SCHWAB & CO INC
SPECIAL CUSTODY A/C FBO CUSTOMERS
ATTN MUTUAL FUNDS
211 MAIN ST
SAN FRANCISCO CA 94105-1901
|
|
3,121,517.7110
8.39%
|
|
|
|
|
UBS WM USA
0O0 11011 6100
SPEC CDY A/C EBOC UBSFSI
1000 HARBOR BLVD
WEEHAWKEN NJ 07086-6761
|
|
2,990,565.7620
8.04%
|
|
|
|
|
CHARLES SCHWAB & CO INC
SPECIAL CUSTODY A/C FBO CUSTOMERS
ATTN MUTUAL FUNDS
211 MAIN ST
SAN FRANCISCO CA 94105-1901
|
|
2,801,446.0230
7.53%
|
|
|
|
|
PERSHING LLC
1 PERSHING PLZ
JERSEY CITY NJ 07399-0001
|
|
2,436,256.3360
6.55%
|
|
|
CALAMOS PHINEUS LONG/SHORT FUND CLASS A
|
|
MORGAN STANLEY SMITH BARNEY LLC
FOR THE EXCLUSIVE BENEFIT OF ITS CUSTOMERS
1 NEW YORK PLZ FL 12
NEW YORK NY 10004-1965
|
|
1,193,343.9520
26.62%
|
|
|
|
|
CHARLES SCHWAB & CO INC
SPECIAL CUSTODY A/C FBO CUSTOMERS
ATTN MUTUAL FUNDS
211 MAIN ST
SAN FRANCISCO CA 94105-1901
|
|
732,552.1480
16.34%
|
|
|
|
|
RAYMOND JAMES
OMNIBUS FOR MUTUAL FUNDS
HOUSE ACCT FIRM 92500015
ATTN: COURTNEY WALLER
880 CARILLON PKWY
ST PETERSBURG FL 33716-1100
|
|
609,984.2100
13.61%
|
|
|
|
|
UBS WM USA
0O0 11011 6100
SPEC CDY A/C EBOC UBSFSI
1000 HARBOR BLVD
WEEHAWKEN NJ 07086-6761
|
|
582,480.9650
13.00%
|
|
82
|
FUND
|
|
REGISTRATION
|
|
ACCOUNT SHARE BALANCE
PERCENT OF TOTAL SHRS
|
|
|
|
|
LPL FINANCIAL
OMNIBUS CUSTOMER ACCOUNT
ATTN LINDSAY O TOOLE
4707 EXECUTIVE DR
SAN DIEGO CA 92121-3091
|
|
428,652.1550
9.56%
|
|
|
|
|
PERSHING LLC
1 PERSHING PLZ
JERSEY CITY NJ 07399-2052
|
|
314,298.2850
7.01%
|
|
|
|
|
NATIONAL FINANCIAL SERVICES LLC
FOR THE EXCLUSIVE BENEFIT OF OUR CUSTOMERS
ATTN MUTUAL FUNDS DEPT 4TH FL
499 WASHINGTON BLVD
JERSEY CITY NJ 07310-1995
|
|
273,023.2720
6.09%
|
|
|
CALAMOS PHINEUS LONG/SHORT FUND CLASS C
|
|
MORGAN STANLEY SMITH BARNEY LLC
FOR THE EXCLUSIVE BENEFIT OF ITS CUSTOMERS
1 NEW YORK PLZ FL 12
NEW YORK NY 10004-1965
|
|
408,502.3610
18.41%
|
|
|
|
|
RAYMOND JAMES
OMNIBUS FOR MUTUAL FUNDS
HOUSE ACCT FIRM 92500015
ATTN: COURTNEY WALLER
880 CARILLON PKWY
ST PETERSBURG FL 33716-1100
|
|
391,899.4710
17.66%
|
|
|
|
|
PERSHING LLC
1 PERSHING PLZ
JERSEY CITY NJ 07399-2052
|
|
387,789.937
17.47%
|
|
|
|
|
LPL FINANCIAL
OMNIBUS CUSTOMER ACCOUNT
ATTN LINDSAY O TOOLE
4707 EXECUTIVE DR
SAN DIEGO CA 92121-3091
|
|
331,572.7760
14.94%
|
|
|
|
|
UBS WM USA
0O0 11011 6100
SPEC CDY A/C EBOC UBSFSI
1000 HARBOR BLVD
WEEHAWKEN NJ 07086-6761
|
|
318,025.9870
14.33%
|
|
|
|
|
NATIONAL FINANCIAL SERVICES LLC
FOR THE EXCLUSIVE BENEFIT OF OUR CUSTOMERS
ATTN MUTUAL FUNDS DEPT 4TH FL
499 WASHINGTON BLVD
JERSEY CITY NJ 07310-1995
|
|
176,087.5250
7.93%
|
|
|
CALAMOS PHINEUS LONG/SHORT FUND CLASS I
|
|
MORGAN STANLEY SMITH BARNEY LLC
FOR THE EXCLUSIVE BENEFIT OF ITS CUSTOMERS
1 NEW YORK PLZ FL 12
NEW YORK NY 10004-1965
|
|
18,143,887.5110
33.20%
|
|
|
|
|
LPL FINANCIAL
OMNIBUS CUSTOMER ACCOUNT
ATTN LINDSAY O TOOLE
4707 EXECUTIVE DR
SAN DIEGO CA 92121-3091
|
|
8,396,784.1740
15.36%
|
|
83
|
FUND
|
|
REGISTRATION
|
|
ACCOUNT SHARE BALANCE
PERCENT OF TOTAL SHRS
|
|
|
|
|
NATIONAL FINANCIAL SERVICES LLC
FOR THE EXCLUSIVE BENEFIT OF OUR CUSTOMERS
ATTN MUTUAL FUNDS DEPT 4TH FL
499 WASHINGTON BLVD
JERSEY CITY NJ 07310-1995
|
|
6,524,846.6120
11.94%
|
|
|
|
|
UBS WM USA
0O0 11011 6100
SPEC CDY A/C EBOC UBSFSI
1000 HARBOR BLVD
WEEHAWKEN NJ 07086-6761
|
|
5,987,913.8540
10.96%
|
|
|
|
|
RAYMOND JAMES
OMNIBUS FOR MUTUAL FUNDS
HOUSE ACCT FIRM 92500015
ATTN: COURTNEY WALLER
880 CARILLON PKWY
ST PETERSBURG FL 33716-1100
|
|
4,661,425.0500
8.53%
|
|
|
|
|
RBC CAPITAL MARKETS LLC
MUTUAL FUND OMNIBUS PROCESSING OMNIBUS
ATTN MUTUAL FUND OPS MANAGER
250 NICOLLET MALL STE 1200 STE 1800
MINNEAPOLIS MN 55401-7554
|
|
2,794,596.9440
5.11%
|
|
|
CALAMOS CONVERTIBLE FUND CLASS A
|
|
MORGAN STANLEY SMITH BARNEY LLC
FOR THE EXCLUSIVE BENEFIT OF ITS CUSTOMERS
1 NEW YORK PLZ FL 12
NEW YORK NY 10004-1965
|
|
2,439,381.0840
18.88%
|
|
|
|
|
PERSHING LLC
1 PERSHING PLZ
JERSEY CITY NJ 07399-0001
|
|
1,743,276.1180
13.49%
|
|
|
|
|
WELLS FARGO CLEARING SERVICES LLC
SPECIAL CUSTODY ACCT FOR THE
EXCLUSIVE BENEFIT OF CUSTOMER
2801 MARKET ST
SAINT LOUIS MO 63103-2523
|
|
1,460,468.0060
11.30%
|
|
|
|
|
RAYMOND JAMES
OMNIBUS FOR MUTUAL FUNDS
HOUSE ACCT FIRM 92500015
ATTN COURTNEY WALLER
880 CARILLON PKWY
ST PETERSBURG FL 33716-1100
|
|
1,186,151.8800
9.18%
|
|
|
|
|
MERRILL LYNCH PIERCE FENNER & SMITH
FOR THE SOLE BENEFIT OF ITS
CUSTOMERS ATTN FUND ADMIN-97HC5
4800 DEER LAKE DR E FL 2
JACKSONVILLE FL 32246-6484
|
|
1,146,157.3790
8.87%
|
|
|
|
|
NATIONAL FINANCIAL SERVICES LLC
FOR THE EXCLUSIVE BENEFIT OF OUR CUSTOMERS
ATTN MUTUAL FUNDS DEPT 4TH FL
499 WASHINGTON BLVD
JERSEY CITY NJ 07310-1995
|
|
903,317.9210
6.99%
|
|
|
|
|
CHARLES SCHWAB CO
REINVEST ACCOUNT
211 MAIN ST
SAN FRANCISCO CA 94105-1901
|
|
797,474.8460
6.17%
|
|
84
|
FUND
|
|
REGISTRATION
|
|
ACCOUNT SHARE BALANCE
PERCENT OF TOTAL SHRS
|
|
|
|
|
LPL FINANCIAL
OMNIBUS CUSTOMER ACCOUNT
ATTN LINDSAY O TOOLE
4707 EXECUTIVE DR
SAN DIEGO CA 92121-3091
|
|
765,755.1740
5.93%
|
|
|
|
|
UBS WM USA
0O0 11011 6100
SPEC CDY A/C EBOC UBSFSI
1000 HARBOR BLVD
WEEHAWKEN NJ 07086-6761
|
|
669,879.7750
5.18%
|
|
|
CALAMOS CONVERTIBLE FUND CLASS C
|
|
PERSHING LLC
1 PERSHING PLZ
JERSEY CITY NJ 07399-0001
|
|
393,169.7630
23.26%
|
|
|
|
|
RAYMOND JAMES
OMNIBUS FOR MUTUAL FUNDS
HOUSE ACCT FIRM 92500015
ATTN COURTNEY WALLER
880 CARILLON PKWY
ST PETERSBURG FL 33716-1100
|
|
255,976.4260
15.14%
|
|
|
|
|
WELLS FARGO CLEARING SERVICES LLC
SPECIAL CUSTODY ACCT FOR THE
EXCLUSIVE BENEFIT OF CUSTOMER
2801 MARKET ST
SAINT LOUIS MO 63103-2523
|
|
248,655.2300
14.71%
|
|
|
|
|
MORGAN STANLEY SMITH BARNEY LLC
FOR THE EXCLUSIVE BENEFIT OF ITS CUSTOMERS
1 NEW YORK PLZ FL 12
NEW YORK NY 10004-1965
|
|
245,200.9680
14.50%
|
|
|
|
|
LPL FINANCIAL
OMNIBUS CUSTOMER ACCOUNT
ATTN LINDSAY O TOOLE
4707 EXECUTIVE DR
SAN DIEGO CA 92121-3091
|
|
224,382.4980
13.27%
|
|
|
|
|
RBC CAPITAL MARKETS LLC
MUTUAL FUND OMNIBUS PROCESSING OMNIBUS
ATTN MUTUAL FUND OPS MANAGER
250 NICOLLET MALL STE 1200 STE 1800
MINNEAPOLIS MN 55401-7554
|
|
85,135.9820
5.04%
|
|
|
CALAMOS CONVERTIBLE FUND CLASS I
|
|
MORGAN STANLEY SMITH BARNEY LLC
FOR THE EXCLUSIVE BENEFIT OF ITS CUSTOMERS
1 NEW YORK PLZ FL 12
NEW YORK NY 10004-1965
|
|
8,627,710.8960
25.30%
|
|
|
|
|
NATIONAL FINANCIAL SERVICES LLC
FOR THE EXCLUSIVE BENEFIT OF OUR CUSTOMERS
ATTN MUTUAL FUNDS DEPT 4TH FL
499 WASHINGTON BLVD
JERSEY CITY NJ 07310-1995
|
|
4,400,834.8470
12.90%
|
|
|
|
|
RAYMOND JAMES
OMNIBUS FOR MUTUAL FUNDS
HOUSE ACCT FIRM 92500015
ATTN COURTNEY WALLER
880 CARILLON PKWY
ST PETERSBURG FL 33716-1100
|
|
4,240,483.3630
12.43%
|
|
85
|
FUND
|
|
REGISTRATION
|
|
ACCOUNT SHARE BALANCE
PERCENT OF TOTAL SHRS
|
|
|
|
|
LPL FINANCIAL
OMNIBUS CUSTOMER ACCOUNT
ATTN LINDSAY O TOOLE
4707 EXECUTIVE DR
SAN DIEGO CA 92121-3091
|
|
4,007,022.6400
11.75%
|
|
|
|
|
WELLS FARGO CLEARING SERVICES LLC
SPECIAL CUSTODY ACCT FOR THE
EXCLUSIVE BENEFIT OF CUSTOMER
2801 MARKET ST
SAINT LOUIS MO 63103-2523
|
|
2,998,305.2330
8.79%
|
|
|
|
|
UBS WM USA
0O0 11011 6100
SPEC CDY A/C EBOC UBSFSI
1000 HARBOR BLVD
WEEHAWKEN NJ 07086-6761
|
|
2,239,620.7980
6.57%
|
|
|
|
|
PERSHING LLC
1 PERSHING PLZ
JERSEY CITY NJ 07399-0001
|
|
2,211,771.7220
6.48%
|
|
|
|
|
CHARLES SCHWAB CO
REINVEST ACCOUNT
211 MAIN ST
SAN FRANCISCO CA 94105-1901
|
|
1,821,960.4230
5.34%
|
|
|
CALAMOS GLOBAL CONVERTIBLE FUND CLASS A
|
|
PERSHING LLC
1 PERSHING PLZ
JERSEY CITY NJ 07399-0001
|
|
301,642.1180
36.70%
|
|
|
|
|
CHARLES SCHWAB CO
REINVEST ACCOUNT
211 MAIN ST
SAN FRANCISCO CA 94105-1901
|
|
166,339.5100
20.24%
|
|
|
|
|
NATIONAL FINANCIAL SERVICES LLC
FOR THE EXCLUSIVE BENEFIT OF OUR CUSTOMERS
ATTN MUTUAL FUNDS DEPT 4TH FL
499 WASHINGTON BLVD
JERSEY CITY NJ 07310-1995
|
|
119,522.1740
14.54%
|
|
|
|
|
LPL FINANCIAL
OMNIBUS CUSTOMER ACCOUNT
ATTN LINDSAY O TOOLE
4707 EXECUTIVE DR
SAN DIEGO CA 92121-3091
|
|
58,477.8940
7.12%
|
|
|
CALAMOS GLOBAL CONVERTIBLE FUND CLASS C
|
|
PERSHING LLC
1 PERSHING PLZ
JERSEY CITY NJ 07399-0001
|
|
92,638.2110
43.75%
|
|
|
|
|
STIFEL NICOLAUS & CO INC
EXCLUSIVE BENEFIT OF CUSTOMERS
501 NORTH BROADWAY
ST LOUIS MO 63102-2188
|
|
88,991.7160
42.03%
|
|
|
|
|
LPL FINANCIAL
OMNIBUS CUSTOMER ACCOUNT
ATTN LINDSAY O TOOLE
4707 EXECUTIVE DR
SAN DIEGO CA 92121-3091
|
|
20,044.8690
9.47%
|
|
86
|
FUND
|
|
REGISTRATION
|
|
ACCOUNT SHARE BALANCE
PERCENT OF TOTAL SHRS
|
|
|
CALAMOS GLOBAL CONVERTIBLE FUND CLASS I
|
|
NATIONAL FINANCIAL SERVICES LLC
FOR THE EXCLUSIVE BENEFIT OF OUR CUSTOMERS
ATTN MUTUAL FUNDS DEPT 4TH FL
499 WASHINGTON BLVD
JERSEY CITY NJ 07310-1995
|
|
7,765,213.1540
76.36%
|
|
|
|
|
CHARLES SCHWAB & CO INC
SPECIAL CUSTODY A/C FBO CUSTOMERS
ATTN MUTUAL FUNDS
211 MAIN ST
SAN FRANCISCO CA 94105-1901
|
|
866,073.1240
8.52%
|
|
|
|
|
RBC CAPITAL MARKETS LLC
MUTUAL FUND OMNIBUS PROCESSING OMNIBUS
ATTN MUTUAL FUND OPS MANAGER
250 NICOLLET MALL STE 1200 STE 1800
MINNEAPOLIS MN 55401-7554
|
|
602,190.2680
5.92%
|
|
|
CALAMOS TIMPANI SMALL CAP GROWTH FUND CLASS A
|
|
NATIONAL FINANCIAL SERVICES LLC
FOR THE EXCLUSIVE BENEFIT OF OUR CUSTOMERS
ATTN MUTUAL FUNDS DEPT 4TH FL
499 WASHINGTON BLVD
JERSEY CITY NJ 07310-1995
|
|
260,129.7230
31.53%
|
|
|
|
|
CHARLES SCHWAB & CO INC
SPECIAL CUSTODY A/C FBO CUSTOMERS
ATTN MUTUAL FUNDS
211 MAIN ST
SAN FRANCISCO CA 94105-1901
|
|
223,256.2720
27.06%
|
|
|
|
|
WELLS FARGO CLEARING SERVICES LLC
SPECIAL CUSTODY ACCT FOR THE
EXCLUSIVE BENEFIT OF CUSTOMER
2801 MARKET ST
SAINT LOUIS MO 63103-2523
|
|
120,038.8670
14.55%
|
|
|
|
|
LPL FINANCIAL
OMNIBUS CUSTOMER ACCOUNT
ATTN LINDSAY O TOOLE
4707 EXECUTIVE DR
SAN DIEGO CA 92121-3091
|
|
70,547.8920
8.55%
|
|
|
|
|
RAYMOND JAMES
OMNIBUS FOR MUTUAL FUNDS
HOUSE ACCT FIRM 92500015
ATTN: COURTNEY WALLER
880 CARILLON PKWY
ST PETERSBURG FL 33716-1100
|
|
58,216.9740
7.06%
|
|
|
|
|
PERSHING LLC
1 PERSHING PLZ
JERSEY CITY NJ 07399-0001
|
|
49,070.8240
5.95%
|
|
|
CALAMOS TIMPANI SMALL CAP GROWTH FUND CLASS I
|
|
NATIONAL FINANCIAL SERVICES LLC
FOR THE EXCLUSIVE BENEFIT OF OUR CUSTOMERS
ATTN MUTUAL FUNDS DEPT 4TH FL
499 WASHINGTON BLVD
JERSEY CITY NJ 07310-1995
|
|
3,113,869.8370
42.44%
|
|
|
|
|
LPL FINANCIAL
OMNIBUS CUSTOMER ACCOUNT
ATTN LINDSAY O TOOLE
4707 EXECUTIVE DR
SAN DIEGO CA 92121-3091
|
|
815,057.1780
11.11%
|
|
87
|
FUND
|
|
REGISTRATION
|
|
ACCOUNT SHARE BALANCE
PERCENT OF TOTAL SHRS
|
|
|
|
|
RAYMOND JAMES
OMNIBUS FOR MUTUAL FUNDS
HOUSE ACCT FIRM 92500015
ATTN: COURTNEY WALLER
880 CARILLON PKWY
ST PETERSBURG FL 33716-1100
|
|
780,057.4810
10.63%
|
|
|
|
|
CHARLES SCHWAB & CO INC
SPECIAL CUSTODY A/C FBO CUSTOMERS
ATTN MUTUAL FUNDS
211 MAIN ST
SAN FRANCISCO CA 94105-1901
|
|
745,665.7690
10.16%
|
|
|
|
|
PERSHING LLC
1 PERSHING PLZ
JERSEY CITY NJ 07399-0001
|
|
397,157.6250
5.41%
|
|
|
CALAMOS TIMPANI SMALL CAP GROWTH FUND CLASS R6
|
|
JOHN HANCOCK TRUST COMPANY LLC
200 BERKELEY ST STE 7
BOSTON MA 02116-5038
|
|
621,434.4760
57.48%
|
|
|
|
|
CHARLES SCHWAB & CO INC
SPECIAL CUSTODY A/C FBO CUSTOMERS
ATTN MUTUAL FUNDS
211 MAIN ST
SAN FRANCISCO CA 94105-1901
|
|
213,410.6890
19.74%
|
|
|
|
|
RELIANCE TRUST CO FBO
SALEM TRUST EB R/R
PO BOX 570788
ATLANTA GA 30357-3114
|
|
129,795.3070
12.00%
|
|
|
CALAMOS TIMPANI SMALL CAP GROWTH FUND CLASS C
|
|
RBC CAPITAL MARKETS LLC
MUTUAL FUND OMNIBUS PROCESSING OMNIBUS
ATTN MUTUAL FUND OPS MANAGER
250 NICOLLET MALL STE 1200 STE 1800
MINNEAPOLIS MN 55401-7554
|
|
60,543.6670
38.83%
|
|
|
|
|
PERSHING LLC
1 PERSHING PLZ
JERSEY CITY NJ 07399-0001
|
|
33,890.5570
21.74%
|
|
|
|
|
RAYMOND JAMES
OMNIBUS FOR MUTUAL FUNDS
HOUSE ACCT FIRM 92500015
ATTN: COURTNEY WALLER
880 CARILLON PKWY
ST PETERSBURG FL 33716-1100
|
|
22,490.3440
14.43%
|
|
|
|
|
WELLS FARGO CLEARING SERVICES LLC
SPECIAL CUSTODY ACCT FOR THE
EXCLUSIVE BENEFIT OF CUSTOMER
2801 MARKET ST
SAINT LOUIS MO 63103-2523
|
|
21,186.5980
13.59%
|
|
|
|
|
LPL FINANCIAL
OMNIBUS CUSTOMER ACCOUNT
ATTN LINDSAY O TOOLE
4707 EXECUTIVE DR
SAN DIEGO CA 92121-3091
|
|
13,880.4560
8.90%
|
|
88
|
FUND
|
|
REGISTRATION
|
|
ACCOUNT SHARE BALANCE
PERCENT OF TOTAL SHRS
|
|
|
CALAMOS TIMPANI SMID GROWTH FUND CLASS A
|
|
CHARLES SCHWAB & CO INC
SPECIAL CUSTODY A/C FBO CUSTOMERS
ATTN MUTUAL FUNDS
211 MAIN ST
SAN FRANCISCO CA 94105-1901
|
|
12,063.5340
48.57%
|
|
|
|
|
PERSHING LLC
1 PERSHING PLZ
JERSEY CITY NJ 07399-0001
|
|
10,981.2310
44.21%
|
|
|
CALAMOS TIMPANI SMID GROWTH FUND CLASS I
|
|
NATIONAL FINANCIAL SERVICES LLC
FOR THE EXCLUSIVE BENEFIT OF OUR CUSTOMERS
ATTN MUTUAL FUNDS DEPT 4TH FL
499 WASHINGTON BLVD
JERSEY CITY NJ 07310-1995
|
|
1,553,203.3690
92.11%
|
|
|
CALAMOS TIMPANI SMID GROWTH FUND CLASS R6
|
|
CHARLES SCHWAB & CO INC
SPECIAL CUSTODY A/C FBO CUSTOMERS
ATTN MUTUAL FUNDS
211 MAIN ST
SAN FRANCISCO CA 94105-1901
|
|
33,606.1210
96.76%
|
|
|
CALAMOS GROWTH FUND CLASS A
|
|
NATIONAL FINANCIAL SERVICES LLC
FOR THE EXCLUSIVE BENEFIT OF OUR
CUSTOMERS
ATTN MUTUAL FUNDS DEPT 4TH FL
499 WASHINGTON BLVD
JERSEY CITY NJ 07310-1995
|
|
3,392,265.2180
11.77%
|
|
|
|
|
WELLS FARGO CLEARING SERVICES LLC
SPECIAL CUSTODY ACCT FOR THE
EXCLUSIVE BENEFIT OF CUSTOMER
2801 MARKET ST
SAINT LOUIS MO 63103-2523
|
|
3,114,761.7930
10.80%
|
|
|
|
|
MORGAN STANLEY SMITH BARNEY LLC
FOR THE EXCLUSIVE BENEFIT OF ITS CUSTOMERS
1 NEW YORK PLZ FL 12
NEW YORK NY 10004-1965
|
|
2,909,067.3350
10.09%
|
|
|
|
|
PERSHING LLC
1 PERSHING PLZ
JERSEY CITY NJ 07399-0001
|
|
2,780,961.6700
9.65%
|
|
|
|
|
CHARLES SCHWAB CO
REINVEST ACCOUNT
211 MAIN ST
SAN FRANCISCO CA 94105-1901
|
|
2,360,615.7330
8.19%
|
|
|
|
|
MERRILL LYNCH PIERCE FENNER & SMITH
FOR THE SOLE BENEFIT OF ITS CUSTOMERS
4800 DEER LAKE DR E FL 97HC3
JACKSONVILLE FL 32246-6484
|
|
2,034,716.4020
7.06%
|
|
|
CALAMOS GROWTH FUND CLASS C
|
|
RAYMOND JAMES
OMNIBUS FOR MUTUAL FUNDS
HOUSE ACCT FIRM 92500015
ATTN COURTNEY WALLER
880 CARILLON PKWY
ST PETERSBURG FL 33716-1100
|
|
134,331.2480
16.72%
|
|
89
|
FUND
|
|
REGISTRATION
|
|
ACCOUNT SHARE BALANCE
PERCENT OF TOTAL SHRS
|
|
|
|
|
WELLS FARGO CLEARING SERVICES LLC
SPECIAL CUSTODY ACCT FOR THE
EXCLUSIVE BENEFIT OF CUSTOMER
2801 MARKET ST
SAINT LOUIS MO 63103-2523
|
|
112,973.7780
14.06%
|
|
|
|
|
LPL FINANCIAL
OMNIBUS CUSTOMER ACCOUNT
ATTN LINDSAY O TOOLE
4707 EXECUTIVE DR
SAN DIEGO CA 92121-3091
|
|
68,479.7930
8.52%
|
|
|
|
|
CHARLES SCHWAB & CO INC
SPECIAL CUSTODY A/C FBO CUSTOMERS
ATTN MUTUAL FUNDS
211 MAIN ST
SAN FRANCISCO CA 94105-1901
|
|
64,208.9510
7.99%
|
|
|
|
|
NATIONAL FINANCIAL SERVICES LLC
FOR THE EXCLUSIVE BENEFIT OF OUR CUSTOMERS
ATTN MUTUAL FUNDS DEPT 4TH FL
499 WASHINGTON BLVD
JERSEY CITY NJ 07310-1995
|
|
44,848.2570
5.58%
|
|
|
CALAMOS GROWTH FUND CLASS I
|
|
NATIONAL FINANCIAL SERVICES LLC
FOR THE EXCLUSIVE BENEFIT OF OUR CUSTOMERS
ATTN MUTUAL FUNDS DEPT 4TH FL
499 WASHINGTON BLVD
JERSEY CITY NJ 07310-1995
|
|
1,229,482.6060
23.22%
|
|
|
|
|
JP MORGAN SECURITIES LLC
FOR EXCLUSIVE BENEFIT OF CUSTOMERS
3 CHASE METROTECH CENTER
3RD FLOOR MUTUAL FUND DEPARTMENT
BROOKLYN NY 11245-0001
|
|
1,018,778.6750
19.24%
|
|
|
|
|
CHARLES SCHWAB & CO INC
SPECIAL CUSTODY A/C FBO CUSTOMERS
ATTN MUTUAL FUNDS
211 MAIN ST
SAN FRANCISCO CA 94105-1901
|
|
831,413.3480
15.70%
|
|
|
|
|
WELLS FARGO CLEARING SERVICES LLC
SPECIAL CUSTODY ACCT FOR THE
EXCLUSIVE BENEFIT OF CUSTOMER
2801 MARKET ST
SAINT LOUIS MO 63103-2523
|
|
519,201.3030
9.80%
|
|
|
|
|
UBS WM USA
0O0 11011 6100
SPEC CDY A/C EBOC UBSFSI
1000 HARBOR BLVD
WEEHAWKEN NJ 07086-6761
|
|
379,047.7110
7.16%
|
|
|
|
|
PERSHING LLC
1 PERSHING PLZ
JERSEY CITY NJ 07399-0001
|
|
277,813.1080
5.25%
|
|
|
CALAMOS GROWTH & INCOME FUND CLASS A
|
|
MORGAN STANLEY SMITH BARNEY LLC
FOR THE EXCLUSIVE BENEFIT OF ITS CUSTOMERS
1 NEW YORK PLZ FL 12
NEW YORK NY 10004-1965
|
|
3,561,652.5480
11.75%
|
|
90
|
FUND
|
|
REGISTRATION
|
|
ACCOUNT SHARE BALANCE
PERCENT OF TOTAL SHRS
|
|
|
|
|
WELLS FARGO CLEARING SERVICES LLC
SPECIAL CUSTODY ACCT FOR THE
EXCLUSIVE BENEFIT OF CUSTOMER
2801 MARKET ST
SAINT LOUIS MO 63103-2523
|
|
3,343,726.9370
11.03%
|
|
|
|
|
MERRILL LYNCH PIERCE FENNER & SMITH
FOR THE SOLE BENEFIT OF ITS CUSTOMERS ATTN FUND ADMIN-97HC4
4800 DEER LAKE DR E 2ND FLOOR
JACKSONVILLE FL 32246-6484
|
|
2,687,863.7610
8.87%
|
|
|
|
|
NATIONAL FINANCIAL SERVICES LLC
FOR THE EXCLUSIVE BENEFIT OF OUR CUSTOMERS
ATTN MUTUAL FUNDS DEPT 4TH FL
499 WASHINGTON BLVD
JERSEY CITY NJ 07310-1995
|
|
2,661,482.0130
8.78%
|
|
|
|
|
PERSHING LLC
1 PERSHING PLZ
JERSEY CITY NJ 07399-0001
|
|
2,276,572.0130
7.51%
|
|
|
|
|
CHARLES SCHWAB CO
REINVEST ACCOUNT
211 MAIN ST
SAN FRANCISCO CA 94105-1901
|
|
1,958,641.2380
6.46%
|
|
|
|
|
RAYMOND JAMES
OMNIBUS FOR MUTUAL FUNDS
HOUSE ACCT FIRM 92500015
ATTN COURTNEY WALLER
880 CARILLON PKWY
ST PETERSBURG FL 33716-1100
|
|
1,885,958.4120
6.22%
|
|
|
CALAMOS GROWTH & INCOME FUND CLASS C
|
|
WELLS FARGO CLEARING SERVICES LLC
SPECIAL CUSTODY ACCT FOR THE
EXCLUSIVE BENEFIT OF CUSTOMER
2801 MARKET ST
SAINT LOUIS MO 63103-2523
|
|
462,490.3200
21.64%
|
|
|
|
|
LPL FINANCIAL
OMNIBUS CUSTOMER ACCOUNT
ATTN LINDSAY O TOOLE
4707 EXECUTIVE DR
SAN DIEGO CA 92121-3091
|
|
288,566.1950
13.50%
|
|
|
|
|
PERSHING LLC
1 PERSHING PLZ
JERSEY CITY NJ 07399-0001
|
|
278,746.8430
13.04%
|
|
|
|
|
RAYMOND JAMES
OMNIBUS FOR MUTUAL FUNDS
HOUSE ACCT FIRM 92500015
ATTN COURTNEY WALLER
880 CARILLON PKWY
ST PETERSBURG FL 33716-1100
|
|
189,903.8640
8.88%
|
|
|
|
|
NATIONAL FINANCIAL SERVICES LLC
FOR THE EXCLUSIVE BENEFIT OF OUR CUSTOMERS
ATTN MUTUAL FUNDS DEPT 4TH FL
499 WASHINGTON BLVD
JERSEY CITY NJ 07310-1995
|
|
176,471.4560
8.26%
|
|
91
|
FUND
|
|
REGISTRATION
|
|
ACCOUNT SHARE BALANCE
PERCENT OF TOTAL SHRS
|
|
|
|
|
MORGAN STANLEY SMITH BARNEY LLC
FOR THE EXCLUSIVE BENEFIT OF ITS
CUSTOMERS
1 NEW YORK PLZ FL 12
NEW YORK NY 10004-1965
|
|
147,490.7310
6.90%
|
|
|
|
|
CHARLES SCHWAB & CO INC
SPECIAL CUSTODY A/C FBO CUSTOMERS
ATTN MUTUAL FUNDS
211 MAIN ST
SAN FRANCISCO CA 94105-1901
|
|
136,973.7150
6.41%
|
|
|
|
|
AMERICAN ENTERPRISE INVESTMENT SVC
707 2ND AVE S
MINNEAPOLIS MN 55402-2405
|
|
118,478.1960
5.54%
|
|
|
CALAMOS GROWTH & INCOME FUND CLASS I
|
|
NATIONAL FINANCIAL SERVICES LLC
FOR THE EXCLUSIVE BENEFIT OF OUR CUSTOMERS
ATTN MUTUAL FUNDS DEPT 4TH FL
499 WASHINGTON BLVD
JERSEY CITY NJ 07310-1995
|
|
4,181,845.6040
15.22%
|
|
|
|
|
WELLS FARGO CLEARING SERVICES LLC
SPECIAL CUSTODY ACCT FOR THE
EXCLUSIVE BENEFIT OF CUSTOMER
2801 MARKET ST
SAINT LOUIS MO 63103-2523
|
|
3,376,965.6720
12.29%
|
|
|
|
|
LPL FINANCIAL
OMNIBUS CUSTOMER ACCOUNT
ATTN LINDSAY O TOOLE
4707 EXECUTIVE DR
SAN DIEGO CA 92121-3091
|
|
2,962,498.4900
10.78%
|
|
|
|
|
MORGAN STANLEY SMITH BARNEY LLC
FOR THE EXCLUSIVE BENEFIT OF ITS CUSTOMERS
1 NEW YORK PLZ FL 12
NEW YORK NY 10004-1965
|
|
2,944,728.8370
10.72%
|
|
|
|
|
RAYMOND JAMES
OMNIBUS FOR MUTUAL FUNDS
HOUSE ACCT FIRM 92500015
ATTN COURTNEY WALLER
880 CARILLON PKWY
ST PETERSBURG FL 33716-1100
|
|
2,845,789.3950
10.36%
|
|
|
|
|
UBS WM USA
0O0 11011 6100
SPEC CDY A/C EBOC UBSFSI
1000 HARBOR BLVD
WEEHAWKEN NJ 07086-6761
|
|
2,205,066.3010
8.02%
|
|
|
|
|
PERSHING LLC
1 PERSHING PLZ
JERSEY CITY NJ 07399-0001
|
|
1,950,190.6400
7.10%
|
|
|
|
|
CHARLES SCHWAB & CO INC
SPECIAL CUSTODY A/C FBO CUSTOMERS
ATTN MUTUAL FUNDS
211 MAIN ST
SAN FRANCISCO CA 94105-1901
|
|
1,402,339.0640
5.10%
|
|
92
|
FUND
|
|
REGISTRATION
|
|
ACCOUNT SHARE BALANCE
PERCENT OF TOTAL SHRS
|
|
|
CALAMOS GROWTH & INCOME FUND CLASS R6
|
|
CHARLES SCHWAB & CO INC
SPECIAL CUSTODY A/C FBO CUSTOMERS
ATTN MUTUAL FUNDS
211 MAIN ST
SAN FRANCISCO CA 94105-1901
|
|
678,663.8290
87.86%
|
|
|
|
|
MATRIX TRUST COMPANY CUST FBO
W G CLARK CONSTRUCTION COMPANY
RETIREMENT PLANS
PO BOX 52129
PHOENIX AZ 85072-2129
|
|
70,186.7700
9.09%
|
|
|
CALAMOS DIVIDEND GROWTH FUND CLASS A
|
|
LPL FINANCIAL
OMNIBUS CUSTOMER ACCOUNT
ATTN LINDSAY O TOOLE
4707 EXECUTIVE DR
SAN DIEGO CA 92121-3091
|
|
111,100.9090
29.21%
|
|
|
|
|
PERSHING LLC
1 PERSHING PLZ
JERSEY CITY NJ 07399-0001
|
|
85,123.1060
22.38%
|
|
|
|
|
NATIONAL FINANCIAL SERVICES LLC
FOR THE EXCLUSIVE BENEFIT OF OUR CUSTOMERS
ATTN MUTUAL FUNDS DEPT 4TH FL
499 WASHINGTON BLVD
JERSEY CITY NJ 07310-1995
|
|
58,178.4310
15.29%
|
|
|
|
|
RBC CAPITAL MARKETS LLC
MUTUAL FUND OMNIBUS PROCESSING OMNIBUS
ATTN MUTUAL FUND OPS MANAGER
250 NICOLLET MALL STE 1200 STE 1800
MINNEAPOLIS MN 55401-7554
|
|
30,510.0350
8.02%
|
|
|
CALAMOS DIVIDEND GROWTH FUND CLASS C
|
|
PERSHING LLC
1 PERSHING PLZ
JERSEY CITY NJ 07399-0001
|
|
149,761.9910
86.19%
|
|
|
|
|
NATIONAL FINANCIAL SERVICES LLC
FOR THE EXCLUSIVE BENEFIT OF OUR CUSTOMERS
ATTN MUTUAL FUNDS DEPT 4TH FL
499 WASHINGTON BLVD
JERSEY CITY NJ 07310-1995
|
|
13,466.1900
7.75%
|
|
|
|
|
LPL FINANCIAL
OMNIBUS CUSTOMER ACCOUNT
ATTN LINDSAY O TOOLE
4707 EXECUTIVE DR
SAN DIEGO CA 92121-3091
|
|
8,801.3370
5.07%
|
|
|
CALAMOS DIVIDEND GROWTH FUND CLASS I
|
|
NATIONAL FINANCIAL SERVICES LLC
FOR THE EXCLUSIVE BENEFIT OF OUR CUSTOMERS
ATTN MUTUAL FUNDS DEPT 4TH FL
499 WASHINGTON BLVD
JERSEY CITY NJ 07310-1995
|
|
450,727.2790
79.88%
|
|
|
|
|
LPL FINANCIAL
OMNIBUS CUSTOMER ACCOUNT
ATTN LINDSAY O TOOLE
4707 EXECUTIVE DR
SAN DIEGO CA 92121-3091
|
|
69,065.9580
12.24%
|
|
93
|
FUND
|
|
REGISTRATION
|
|
ACCOUNT SHARE BALANCE
PERCENT OF TOTAL SHRS
|
|
|
CALAMOS SELECT FUND CLASS A
|
|
WELLS FARGO CLEARING SERVICES LLC
SPECIAL CUSTODY ACCT FOR THE
EXCLUSIVE BENEFIT OF CUSTOMER
2801 MARKET ST
SAINT LOUIS MO 63103-2523
|
|
91,009.0000
13.06%
|
|
|
|
|
LPL FINANCIAL
OMNIBUS CUSTOMER ACCOUNT
ATTN LINDSAY O TOOLE
4707 EXECUTIVE DR
SAN DIEGO CA 92121-3091
|
|
63,251.3960
9.08%
|
|
|
|
|
PERSHING LLC
1 PERSHING PLZ
JERSEY CITY NJ 07399-0001
|
|
58,677.3420
8.42%
|
|
|
|
|
EDWARD D JONES & CO
FOR THE BENEFIT OF CUSTOMERS
12555 MANCHESTER RD
SAINT LOUIS MO 63131-3710
|
|
57,109.5380
8.20%
|
|
|
|
|
MORGAN STANLEY SMITH BARNEY LLC
FOR THE EXCLUSIVE BENEFIT OF ITS CUSTOMERS
1 NEW YORK PLZ FL 12
NEW YORK NY 10004-1965
|
|
47,231.1990
6.78%
|
|
|
|
|
UBS WM USA
0O0 11011 6100
SPEC CDY A/C EBOC UBSFSI
1000 HARBOR BLVD
WEEHAWKEN NJ 07086-6761
|
|
38,092.0400
5.47%
|
|
|
|
|
NATIONAL FINANCIAL SERVICES LLC
FOR THE EXCLUSIVE BENEFIT OF OUR CUSTOMERS
ATTN MUTUAL FUNDS DEPT 4TH FL
499 WASHINGTON BLVD
JERSEY CITY NJ 07310-1995
|
|
36,455.1030
5.23%
|
|
|
|
|
RAYMOND JAMES
OMNIBUS FOR MUTUAL FUNDS
HOUSE ACCT FIRM 92500015
ATTN COURTNEY WALLER
880 CARILLON PKWY
ST PETERSBURG FL 33716-1100
|
|
35,544.6370
5.10%
|
|
|
CALAMOS SELECT FUND CLASS C
|
|
WELLS FARGO CLEARING SERVICES LLC
SPECIAL CUSTODY ACCT FOR THE
EXCLUSIVE BENEFIT OF CUSTOMER
2801 MARKET ST
SAINT LOUIS MO 63103-2523
|
|
5,560.5900
63.60%
|
|
|
|
|
PERSHING LLC
1 PERSHING PLZ
JERSEY CITY NJ 07399-0001
|
|
1,082.8350
12.39%
|
|
|
|
|
US BANK NA CUST
WILLIAM GRANZEN ROTH IRA
2020 CALAMOS COURT
NAPERVILLE IL 60563
|
|
783.5070
8.96%
|
|
|
|
|
US BANK NA CUST
FRANC E FLOTRON ROTH IRA
2020 CALAMOS COURT
NAPERVILLE IL 60563
|
|
654.9630
7.49%
|
|
94
|
FUND
|
|
REGISTRATION
|
|
ACCOUNT SHARE BALANCE
PERCENT OF TOTAL SHRS
|
|
|
|
|
US BANK NA CUST
LOIS P LAIGLE ROTH IRA
2020 CALAMOS COURT
NAPERVILLE IL 60563
|
|
482.7660
5.52%
|
|
|
CALAMOS INTERNATIONAL GROWTH FUND CLASS A
|
|
CHARLES SCHWAB CO
REINVEST ACCOUNT
211 MAIN ST
SAN FRANCISCO CA 94105-1901
|
|
278,686.4280
11.28%
|
|
|
|
|
WELLS FARGO CLEARING SERVICES LLC
SPECIAL CUSTODY ACCT FOR THE
EXCLUSIVE BENEFIT OF CUSTOMER
2801 MARKET ST
SAINT LOUIS MO 63103-2523
|
|
238,761.0870
9.66%
|
|
|
|
|
MERRILL LYNCH PIERCE FENNER & SMITH
FOR THE SOLE BENEFIT OF ITS CUSTOMERS
4800 DEER LAKE DR E FL 97HC3
JACKSONVILLE FL 32246-6484
|
|
186,773.7680
7.56%
|
|
|
|
|
PERSHING LLC
1 PERSHING PLZ
JERSEY CITY NJ 07399-0001
|
|
182,589.0290
7.39%
|
|
|
|
|
NATIONAL FINANCIAL SERVICES LLC
FOR THE EXCLUSIVE BENEFIT OF OUR CUSTOMERS
ATTN MUTUAL FUNDS DEPT 4TH FL
499 WASHINGTON BLVD
JERSEY CITY NJ 07310-1995
|
|
179,692.3500
7.27%
|
|
|
|
|
MORGAN STANLEY SMITH BARNEY LLC
FOR THE EXCLUSIVE BENEFIT OF ITS CUSTOMERS
1 NEW YORK PLZ FL 12
NEW YORK NY 10004-1965
|
|
174,211.4230
7.05%
|
|
|
CALAMOS INTERNATIONAL GROWTH FUND CLASS C
|
|
RAYMOND JAMES
OMNIBUS FOR MUTUAL FUNDS
HOUSE ACCT FIRM 92500015
ATTN COURTNEY WALLER
880 CARILLON PKWY
ST PETERSBURG FL 33716-1100
|
|
27,588.2320
29.89%
|
|
|
|
|
WELLS FARGO CLEARING SERVICES LLC
SPECIAL CUSTODY ACCT FOR THE
EXCLUSIVE BENEFIT OF CUSTOMER
2801 MARKET ST
SAINT LOUIS MO 63103-2523
|
|
19,594.9560
21.23%
|
|
|
|
|
LPL FINANCIAL
OMNIBUS CUSTOMER ACCOUNT
ATTN LINDSAY O TOOLE
4707 EXECUTIVE DR
SAN DIEGO CA 92121-3091
|
|
9,157.6210
9.92%
|
|
|
|
|
PERSHING LLC
1 PERSHING PLZ
JERSEY CITY NJ 07399-0001
|
|
8,557.2330
9.27%
|
|
|
|
|
US BANK NA CUST
MANUEL ORTEGA SIMPLE IRA
2020 CALAMOS COURT
NAPERVILLE IL 60563
|
|
7,159.7310
7.76%
|
|
95
|
FUND
|
|
REGISTRATION
|
|
ACCOUNT SHARE BALANCE
PERCENT OF TOTAL SHRS
|
|
|
CALAMOS INTERNATIONAL GROWTH FUND CLASS I
|
|
EMPOWER TRUST FBO
EMPLOYEE BENEFIT CLIENTS 401K
8515 E ORCHARD RD 2T2
GREENWOOD VILLAGE CO 80111-5002
|
|
1,628,149.7690
19.75%
|
|
|
|
|
JP MORGAN SECURITIES LLC
FOR EXCLUSIVE BENEFIT OF CUSTOMERS
3 CHASE METROTECH CENTER
3RD FLOOR MUTUAL FUND DEPARTMENT
BROOKLYN NY 11245-0001
|
|
1,254,292.9050
15.22%
|
|
|
|
|
MINNESOTA LIFE INSURANCE COMPANY
400 ROBERT STREET NORTH
SAINT PAUL MN 55101-2099
|
|
1,237,590.4820
15.01%
|
|
|
|
|
NATIONAL FINANCIAL SERVICES LLC
FOR THE EXCLUSIVE BENEFIT OF OUR CUSTOMERS
ATTN MUTUAL FUNDS DEPT 4TH FL
499 WASHINGTON BLVD
JERSEY CITY NJ 07310-1995
|
|
1,127,826.9560
13.68%
|
|
|
|
|
CHARLES SCHWAB CO
REINVEST ACCOUNT
211 MAIN ST
SAN FRANCISCO CA 94105-1901
|
|
571,581.2770
6.93%
|
|
|
|
|
PERSHING LLC
1 PERSHING PLZ
JERSEY CITY NJ 07399-0001
|
|
539,960.6870
6.55%
|
|
|
CALAMOS INTERNATIONAL GROWTH FUND CLASS R6
|
|
CHARLES SCHWAB & CO INC
SPECIAL CUSTODY A/C FBO CUSTOMERS
ATTN MUTUAL FUNDS
211 MAIN ST
SAN FRANCISCO CA 94105-1901
|
|
66,876.4260
22.67%
|
|
|
|
|
STATE STREET BANK & TRUST TRUSTEE
AND/OR CUSTODIAN
FBO ADP ACCESS PRODUCT
1 LINCOLN ST
BOSTON MA 02111-2901
|
|
32,502.4960
11.02%
|
|
|
|
|
MID ATLANTIC TRUST COMPANY FBO
ROSWELL PEDIATRIC CENTER, P C 401(
1251 WATERFRONT PLACE SUITE 525
PITTSBURGH PA 15222-4228
|
|
29,310.1120
9.93%
|
|
|
|
|
EMPOWER TRUST FBO
RETIREMENT PLANS
8515 E ORCHARD RD 2T2
GREENWOOD VILLAGE CO 80111-5002
|
|
24,761.4940
8.39%
|
|
|
|
|
ATTN NPIO TRADE DESK
DCGT AS TTEE AND/OR CUST
FBO PLIC VARIOUS RETIREMENT PLANS OMNIBUS
711 HIGH STREET
DES MOINES IA 50392-0001
|
|
22,493.7750
7.62%
|
|
|
|
|
ASCENSUS TRUST COMPANY FBO
MARIN & MONTANYE LLP 401(K) PROFIT
215666 P O BOX 10758
FARGO ND 58106-0758
|
|
15,962.2260
5.41%
|
|
96
|
FUND
|
|
REGISTRATION
|
|
ACCOUNT SHARE BALANCE
PERCENT OF TOTAL SHRS
|
|
|
|
|
EMPOWER TRUST FBO
EMPLOYEE BENEFITS CLIENTS 401K
8515 E ORCHARD RD 2T2
GREENWOOD VILLAGE CO 80111-5002
|
|
14,853.6000
5.03%
|
|
|
CALAMOS EVOLVING WORLD GROWTH FUND CLASS A
|
|
CHARLES SCHWAB & CO INC
SPECIAL CUSTODY ACCT FBO CUSTOMERS
ATTN MUTUAL FUNDS
211 MAIN ST
SAN FRANCISCO CA 94105-1901
|
|
687,404.9320
28.71%
|
|
|
|
|
WELLS FARGO CLEARING SERVICES LLC
SPECIAL CUSTODY ACCT FOR THE
EXCLUSIVE BENEFIT OF CUSTOMER
2801 MARKET ST
SAINT LOUIS MO 63103-2523
|
|
393,191.6170
16.42%
|
|
|
|
|
NATIONAL FINANCIAL SERVICES LLC
FOR THE EXCLUSIVE BENEFIT OF OUR CUSTOMERS
ATTN MUTUAL FUNDS DEPT 4TH FL
499 WASHINGTON BLVD
JERSEY CITY NJ 07310-1995
|
|
254,175.4530
10.62%
|
|
|
|
|
MORGAN STANLEY SMITH BARNEY LLC
FOR THE EXCLUSIVE BENEFIT OF ITS CUSTOMERS
1 NEW YORK PLZ FL 12
NEW YORK NY 10004-1965
|
|
164,781.2720
6.88%
|
|
|
|
|
PERSHING LLC
1 PERSHING PLZ
JERSEY CITY NJ 07399-0001
|
|
148,101.1360
6.19%
|
|
|
|
|
MERRILL LYNCH PIERCE FENNER & SMITH
FOR THE SOLE BENEFIT OF ITS CUSTOMERS
4800 DEER LAKE DR E FL 97HC3
JACKSONVILLE FL 32246-6484
|
|
129,118.9640
5.39%
|
|
|
CALAMOS EVOLVING WORLD GROWTH FUND CLASS C
|
|
WELLS FARGO CLEARING SERVICES LLC
SPECIAL CUSTODY ACCT FOR THE
EXCLUSIVE BENEFIT OF CUSTOMER
2801 MARKET ST
SAINT LOUIS MO 63103-2523
|
|
68,499.5430
27.75%
|
|
|
|
|
RAYMOND JAMES
OMNIBUS FOR MUTUAL FUNDS
HOUSE ACCT FIRM 92500015
ATTN: COURTNEY WALLER
880 CARILLON PKWY
ST PETERSBURG FL 33716-1100
|
|
50,893.5830
20.62%
|
|
|
|
|
PERSHING LLC
1 PERSHING PLZ
JERSEY CITY NJ 07399-0001
|
|
45,634.8590
18.49%
|
|
|
|
|
UBS WM USA
0O0 11011 6100
SPEC CDY A/C EBOC UBSFSI
1000 HARBOR BLVD
WEEHAWKEN NJ 07086-6761
|
|
20,436.5230
8.28%
|
|
|
|
|
LPL FINANCIAL
OMNIBUS CUSTOMER ACCOUNT
ATTN LINDSAY O TOOLE
4707 EXECUTIVE DR
SAN DIEGO CA 92121-3091
|
|
17,481.8650
7.08%
|
|
97
|
FUND
|
|
REGISTRATION
|
|
ACCOUNT SHARE BALANCE
PERCENT OF TOTAL SHRS
|
|
|
CALAMOS EVOLVING WORLD GROWTH FUND CLASS I
|
|
NATIONAL FINANCIAL SERVICES LLC
FOR THE EXCLUSIVE BENEFIT OF OUR CUSTOMERS
ATTN MUTUAL FUNDS DEPT 4TH FL
499 WASHINGTON BLVD
JERSEY CITY NJ 07310-1995
|
|
3,537,237.5550
18.43%
|
|
|
|
|
WELLS FARGO CLEARING SERVICES LLC
SPECIAL CUSTODY ACCT FOR THE
EXCLUSIVE BENEFIT OF CUSTOMER
2801 MARKET ST
SAINT LOUIS MO 63103-2523
|
|
2,962,659.1960
15.43%
|
|
|
|
|
LPL FINANCIAL
OMNIBUS CUSTOMER ACCOUNT
ATTN LINDSAY O TOOLE
4707 EXECUTIVE DR
SAN DIEGO CA 92121-3091
|
|
2,222,406.6730
11.58%
|
|
|
|
|
UBS WM USA
0O0 11011 6100
SPEC CDY A/C EBOC UBSFSI
1000 HARBOR BLVD
WEEHAWKEN NJ 07086-6761
|
|
1,805,231.4020
9.40%
|
|
|
|
|
RAYMOND JAMES
OMNIBUS FOR MUTUAL FUNDS
HOUSE ACCT FIRM 92500015
ATTN: COURTNEY WALLER
880 CARILLON PKWY
ST PETERSBURG FL 33716-1100
|
|
1,547,104.4070
8.06%
|
|
|
|
|
CHARLES SCHWAB & CO INC
SPECIAL CUSTODY A/C FBO CUSTOMERS
ATTN MUTUAL FUNDS
211 MAIN ST
SAN FRANCISCO CA 94105-1901
|
|
1,502,702.9940
7.83%
|
|
|
|
|
JP MORGAN SECURITIES LLC
FOR EXCLUSIVE BENEFIT OF CUSTOMERS
3 CHASE METROTECH CENTER
3RD FLOOR MUTUAL FUND DEPARTMENT
BROOKLYN NY 11245-0001
|
|
1,278,805.5810
6.66%
|
|
|
|
|
PERSHING LLC
1 PERSHING PLZ
JERSEY CITY NJ 07399-0001
|
|
1,088,186.0220
5.67%
|
|
|
|
|
AMERICAN ENTERPRISE INVESTMENT SVC
707 2ND AVE S
MINNEAPOLIS MN 55402-2405
|
|
1,040,753.2430
5.42%
|
|
|
CALAMOS GLOBAL EQUITY FUND CLASS A
|
|
MERRILL LYNCH PIERCE FENNER & SMITH
FOR THE SOLE BENEFIT OF ITS
CUSTOMERS
4800 DEER LAKE DR E FL 97HC3
JACKSONVILLE FL 32246-6484
|
|
185,447.7820
11.29%
|
|
|
|
|
NATIONAL FINANCIAL SERVICES LLC
FOR THE EXCLUSIVE BENEFIT OF OUR CUSTOMERS
ATTN MUTUAL FUNDS DEPT 4TH FL
499 WASHINGTON BLVD
JERSEY CITY NJ 07310-1995
|
|
171,156.5200
10.42%
|
|
98
|
FUND
|
|
REGISTRATION
|
|
ACCOUNT SHARE BALANCE
PERCENT OF TOTAL SHRS
|
|
|
|
|
PERSHING LLC
1 PERSHING PLZ
JERSEY CITY NJ 07399-0001
|
|
149,437.1590
9.10%
|
|
|
|
|
EDWARD D JONES & CO
FOR THE BENEFIT OF CUSTOMERS
12555 MANCHESTER RD
SAINT LOUIS MO 63131-3710
|
|
141,478.5540
8.61%
|
|
|
|
|
WELLS FARGO CLEARING SERVICES LLC
SPECIAL CUSTODY ACCT FOR THE
EXCLUSIVE BENEFIT OF CUSTOMER
2801 MARKET ST
SAINT LOUIS MO 63103-2523
|
|
130,621.3540
7.95%
|
|
|
|
|
RAYMOND JAMES
OMNIBUS FOR MUTUAL FUNDS
HOUSE ACCT FIRM 92500015
ATTN: COURTNEY WALLER
880 CARILLON PKWY
ST PETERSBURG FL 33716-1100
|
|
107,667.5510
6.55%
|
|
|
|
|
LPL FINANCIAL
OMNIBUS CUSTOMER ACCOUNT
ATTN LINDSAY O TOOLE
4707 EXECUTIVE DR
SAN DIEGO CA 92121-3091
|
|
90,215.9600
5.49%
|
|
|
CALAMOS GLOBAL EQUITY FUND CLASS C
|
|
AMERICAN ENTERPRISE INVESTMENT SVC
707 2ND AVE S
MINNEAPOLIS MN 55402-2405
|
|
16,023.4910
25.73%
|
|
|
|
|
LPL FINANCIAL
OMNIBUS CUSTOMER ACCOUNT
ATTN LINDSAY O TOOLE
4707 EXECUTIVE DR
SAN DIEGO CA 92121-3091
|
|
11,255.1990
18.08%
|
|
|
|
|
RAYMOND JAMES
OMNIBUS FOR MUTUAL FUNDS
HOUSE ACCT FIRM 92500015
ATTN: COURTNEY WALLER
880 CARILLON PKWY
ST PETERSBURG FL 33716-1100
|
|
10,358.1900
16.63%
|
|
|
|
|
NATIONAL FINANCIAL SERVICES LLC
FOR THE EXCLUSIVE BENEFIT OF OUR CUSTOMERS
ATTN MUTUAL FUNDS DEPT 4TH FL
499 WASHINGTON BLVD
JERSEY CITY NJ 07310-1995
|
|
5,310.3050
8.53%
|
|
|
|
|
PERSHING LLC
1 PERSHING PLZ
JERSEY CITY NJ 07399-0001
|
|
3,863.6310
6.20%
|
|
|
CALAMOS GLOBAL EQUITY FUND CLASS I
|
|
JP MORGAN SECURITIES LLC
FOR EXCLUSIVE BENEFIT OF CUSTOMERS
3 CHASE METROTECH CENTER
3RD FLOOR MUTUAL FUND DEPARTMENT
BROOKLYN NY 11245-0001
|
|
1,765,637.0460
34.11%
|
|
99
|
FUND
|
|
REGISTRATION
|
|
ACCOUNT SHARE BALANCE
PERCENT OF TOTAL SHRS
|
|
|
|
|
NATIONAL FINANCIAL SERVICES LLC
FOR THE EXCLUSIVE BENEFIT OF OUR CUSTOMERS
ATTN MUTUAL FUNDS DEPT 4TH FL
499 WASHINGTON BLVD
JERSEY CITY NJ 07310-1995
|
|
1,319,925.2890
25.50%
|
|
|
|
|
PRINCIPAL BANK FBO
CITY OF HOUSTON DEFERRED COMPENSATI TRUST
8515 E ORCHARD RD 2T2
GREENWOOD VILLAGE CO 80111-5002
|
|
1,175,770.4110
22.71%
|
|
|
CALAMOS GLOBAL EQUITY FUND CLASS R6
|
|
MATRIX TRUST COMPANY CUST FBO
WOOD RESOURCES LLC
717 17TH ST STE 1300
DENVER CO 80202-3304
|
|
2,734.3680
73.45%
|
|
|
|
|
CALAMOS INVESTMENTS LLC
ATTN CORPORATE ACCOUNTING
2020 CALAMOS COURT
NAPERVILLE IL 60563-2787
|
|
949.4940
25.50%
|
|
|
CALAMOS GLOBAL OPPORTUNITIES FUND CLASS A
|
|
MORGAN STANLEY SMITH BARNEY LLC
FOR THE EXCLUSIVE BENEFIT OF ITS CUSTOMERS
1 NEW YORK PLZ FL 12
NEW YORK NY 10004-1965
|
|
1,161,005.3550
14.01%
|
|
|
|
|
UBS WM USA
0O0 11011 6100
SPEC CDY A/C EBOC UBSFSI
1000 HARBOR BLVD
WEEHAWKEN NJ 07086-6761
|
|
910,374.0930
10.99%
|
|
|
|
|
WELLS FARGO CLEARING SERVICES LLC
SPECIAL CUSTODY ACCT
FOR THE EXCLUSIVE BENEFIT OF CUSTOMER
2801 MARKET ST
SAINT LOUIS MO 63103-2523
|
|
738,276.4290
8.91%
|
|
|
|
|
RAYMOND JAMES
OMNIBUS FOR MUTUAL FUNDS
HOUSE ACCT FIRM 92500015
ATTN COURTNEY WALLER
880 CARILLON PKWY
ST PETERSBURG FL 33716-1100
|
|
682,468.2070
8.24%
|
|
|
|
|
PERSHING LLC
1 PERSHING PLZ
JERSEY CITY NJ 07399-0001
|
|
647,647.5880
7.82%
|
|
|
|
|
MERRILL LYNCH PIERCE FENNER & SMITH
FOR THE SOLE BENEFIT OF ITS CUSTOMERS
ATTN FUND ADMIN — 97KT2
4800 DEER LAKE DR E 2ND FLOOR
JACKSONVILLE FL 32246-6484
|
|
616,524.2690
7.44%
|
|
|
|
|
NATIONAL FINANCIAL SERVICES LLC
FOR THE EXCLUSIVE BENEFIT OF OUR CUSTOMERS
ATTN MUTUAL FUNDS DEPT 4TH FL
499 WASHINGTON BLVD
JERSEY CITY NJ 07310-1995
|
|
615,830.5890
7.43%
|
|
100
|
FUND
|
|
REGISTRATION
|
|
ACCOUNT SHARE BALANCE
PERCENT OF TOTAL SHRS
|
|
|
|
|
CHARLES SCHWAB & CO INC
SPECIAL CUSTODY A/C FBO CUSTOMERS
ATTN MUTUAL FUNDS
211 MAIN ST
SAN FRANCISCO CA 94105-1901
|
|
545,028.1210
6.58%
|
|
|
|
|
EDWARD D JONES & CO
FOR THE BENEFIT OF CUSTOMERS
12555 MANCHESTER RD
SAINT LOUIS MO 63131-3710
|
|
433,327.4260
5.23%
|
|
|
CALAMOS GLOBAL OPPORTUNITIES FUND CLASS C
|
|
MORGAN STANLEY SMITH BARNEY LLC
FOR THE EXCLUSIVE BENEFIT OF ITS CUSTOMERS
1 NEW YORK PLZ FL 12
NEW YORK NY 10004-1965
|
|
375,635.3080
38.97%
|
|
|
|
|
RAYMOND JAMES
OMNIBUS FOR MUTUAL FUNDS
HOUSE ACCT FIRM 92500015
ATTN COURTNEY WALLER
880 CARILLON PKWY
ST PETERSBURG FL 33716-1100
|
|
209,086.3240
21.69%
|
|
|
|
|
WELLS FARGO CLEARING SERVICES LLC
SPECIAL CUSTODY ACCT FOR THE
EXCLUSIVE BENEFIT OF CUSTOMER
2801 MARKET ST
SAINT LOUIS MO 63103-2523
|
|
131,270.8390
13.62%
|
|
|
|
|
PERSHING LLC
1 PERSHING PLZ
JERSEY CITY NJ 07399-0001
|
|
58,021.5990
6.02%
|
|
|
|
|
NATIONAL FINANCIAL SERVICES LLC
FOR THE EXCLUSIVE BENEFIT OF OUR CUSTOMERS
ATTN MUTUAL FUNDS DEPT 4TH FL
499 WASHINGTON BLVD
JERSEY CITY NJ 07310-1995
|
|
52,441.5780
5.44%
|
|
|
CALAMOS GLOBAL OPPORTUNITIES FUND CLASS I
|
|
MORGAN STANLEY SMITH BARNEY LLC
SPECIAL CUSTODY ACCT FOR THE EXCLUSIVE
BENEFIT OF CUSTOMERS OF MSSB
1 NEW YORK PLZ FL 12
NEW YORK NY 10004-1965
|
|
1,958,022.0540
18.32%
|
|
|
|
|
NATIONAL FINANCIAL SERVICES LLC
FOR THE EXCLUSIVE BENEFIT OF OUR CUSTOMERS
ATTN MUTUAL FUNDS DEPT 4TH FL
499 WASHINGTON BLVD
JERSEY CITY NJ 07310-1995
|
|
1,549,661.8860
14.50%
|
|
|
|
|
WELLS FARGO CLEARING SERVICES LLC
SPECIAL CUSTODY ACCT FOR THE
EXCLUSIVE BENEFIT OF CUSTOMER
2801 MARKET ST
SAINT LOUIS MO 63103-2523
|
|
1,549,525.2340
14.50%
|
|
|
|
|
RAYMOND JAMES
OMNIBUS FOR MUTUAL FUNDS
HOUSE ACCT FIRM 92500015
ATTN COURTNEY WALLER
880 CARILLON PKWY
ST PETERSBURG FL 33716-1100
|
|
1,536,030.8450
14.37%
|
|
101
|
FUND
|
|
REGISTRATION
|
|
ACCOUNT SHARE BALANCE
PERCENT OF TOTAL SHRS
|
|
|
|
|
UBS WM USA
0O0 11011 6100
SPEC CDY A/C EBOC UBSFSI
1000 HARBOR BLVD
WEEHAWKEN NJ 07086-6761
|
|
1,313,201.9260
12.29%
|
|
|
|
|
LPL FINANCIAL
OMNIBUS CUSTOMER ACCOUNT
ATTN LINDSAY O TOOLE
4707 EXECUTIVE DR
SAN DIEGO CA 92121-3091
|
|
807,566.6730
7.56%
|
|
|
|
|
PERSHING LLC
1 PERSHING PLZ
JERSEY CITY NJ 07399-0001
|
|
597,303.2140
5.59%
|
|
|
CALAMOS INTERNATIONAL SMALL CAP GROWTH FUND CLASS A
|
|
NATIONAL FINANCIAL SERVICES LLC
FOR THE EXCLUSIVE BENEFIT OF OUR CUSTOMERS
ATTN MUTUAL FUNDS DEPT 4TH FL
499 WASHINGTON BLVD
JERSEY CITY NJ 07310-1995
|
|
1,044.6670
39.28%
|
|
|
|
|
CALAMOS INVESTMENTS LLC
ATTN CORPORATE ACCOUNTING
2020 CALAMOS CT
NAPERVILLE IL 60563-2787
|
|
1,005.7810
37.82%
|
|
|
|
|
CHARLES SCHWAB & CO INC
SPECIAL CUSTODY A/C FBO CUSTOMERS
ATTN MUTUAL FUNDS
211 MAIN ST
SAN FRANCISCO CA 94105-1901
|
|
609.0130
22.90%
|
|
|
CALAMOS INTERNATIONAL SMALL CAP GROWTH FUND CLASS C
|
|
CALAMOS INVESTMENTS LLC
ATTN CORPORATE ACCOUNTING
2020 CALAMOS CT
NAPERVILLE IL 60563-2787
|
|
1,004.9020
100.00%
|
|
|
CALAMOS INTERNATIONAL SMALL CAP GROWTH FUND CLASS I
|
|
NATIONAL FINANCIAL SERVICES LLC
FOR THE EXCLUSIVE BENEFIT OF OUR CUSTOMERS
ATTN MUTUAL FUNDS DEPT 4TH FL
499 WASHINGTON BLVD
JERSEY CITY NJ 07310-1995
|
|
200,994.1280
62.15%
|
|
|
|
|
CHARLES SCHWAB & CO INC
SPECIAL CUSTODY A/C FBO CUSTOMERS
ATTN MUTUAL FUNDS
211 MAIN ST
SAN FRANCISCO CA 94105-1901
|
|
122,393.2980
37.84%
|
|
|
CALAMOS INTERNATIONAL SMALL CAP GROWTH FUND CLASS R6
|
|
CALAMOS INVESTMENTS LLC
ATTN CORPORATE ACCOUNTING
2020 CALAMOS CT
NAPERVILLE IL 60563-2787
|
|
1,007.0050
100.00%
|
|
|
CALAMOS TOTAL RETURN BOND FUND CLASS A
|
|
RAYMOND JAMES
OMNIBUS FOR MUTUAL FUNDS
HOUSE ACCT FIRM 92500015
ATTN: COURTNEY WALLER
880 CARILLON PKWY
ST PETERSBURG FL 33716-1100
|
|
189,917.6830
14.09%
|
|
102
|
FUND
|
|
REGISTRATION
|
|
ACCOUNT SHARE BALANCE
PERCENT OF TOTAL SHRS
|
|
|
|
|
EDWARD D JONES & CO
FOR THE BENEFIT OF CUSTOMERS
12555 MANCHESTER RD
SAINT LOUIS MO 63131-3710
|
|
154,815.2000
11.48%
|
|
|
|
|
WELLS FARGO CLEARING SERVICES LLC
SPECIAL CUSTODY ACCT
FOR THE EXCLUSIVE BENEFIT OF CUSTOMER
2801 MARKET ST
SAINT LOUIS MO 63103-2523
|
|
153,568.6400
11.39%
|
|
|
|
|
MERRILL LYNCH PIERCE FENNER & SMITH
FOR THE SOLE BENEFIT OF ITS CUSTOMERS
4800 DEER LAKE DR E FL 97HC3
JACKSONVILLE FL 32246-6484
|
|
125,653.9080
9.32%
|
|
|
|
|
LPL FINANCIAL
OMNIBUS CUSTOMER ACCOUNT
ATTN LINDSAY O TOOLE
4707 EXECUTIVE DR
SAN DIEGO CA 92121-3091
|
|
103,625.5500
7.69%
|
|
|
|
|
CHARLES SCHWAB & CO INC
SPECIAL CUSTODY A/C FBO CUSTOMERS
ATTN MUTUAL FUNDS
211 MAIN ST
SAN FRANCISCO CA 94105-1901
|
|
99,499.3800
7.38%
|
|
|
|
|
UBS WM USA
0O0 11011 6100
SPEC CDY A/C EBOC UBSFSI
1000 HARBOR BLVD
WEEHAWKEN NJ 07086-6761
|
|
95,412.5550
7.08%
|
|
|
|
|
NATIONAL FINANCIAL SERVICES LLC
FOR THE EXCLUSIVE BENEFIT OF OUR CUSTOMERS
ATTN MUTUAL FUNDS DEPT 4TH FL
499 WASHINGTON BLVD
JERSEY CITY NJ 07310-1995
|
|
93,594.5640
6.94%
|
|
|
|
|
PERSHING LLC
1 PERSHING PLZ
JERSEY CITY NJ 07399-0001
|
|
84,651.3090
6.28%
|
|
|
CALAMOS TOTAL RETURN BOND FUND CLASS C
|
|
WELLS FARGO CLEARING SERVICES LLC
SPECIAL CUSTODY ACCT
FOR THE EXCLUSIVE BENEFIT OF CUSTOMER
2801 MARKET ST
SAINT LOUIS MO 63103-2523
|
|
12,963.2700
36.38%
|
|
|
|
|
UBS WM USA
0O0 11011 6100
SPEC CDY A/C EBOC UBSFSI
1000 HARBOR BLVD
WEEHAWKEN NJ 07086-6761
|
|
9,535.6010
26.76%
|
|
|
|
|
RAYMOND JAMES
OMNIBUS FOR MUTUAL FUNDS
HOUSE ACCT FIRM 92500015
ATTN: COURTNEY WALLER
880 CARILLON PKWY
ST PETERSBURG FL 33716-1100
|
|
2,261.4980
6.35%
|
|
103
|
FUND
|
|
REGISTRATION
|
|
ACCOUNT SHARE BALANCE
PERCENT OF TOTAL SHRS
|
|
|
|
|
US BANK NA CUST
DEBRA L HERROLD IRA
2020 CALAMOS COURT
NAPERVILLE IL 60563
|
|
2,189.1620
6.14%
|
|
|
|
|
PERSHING LLC
1 PERSHING PLZ
JERSEY CITY NJ 07399-0001
|
|
2,103.7120
5.90%
|
|
|
CALAMOS TOTAL RETURN BOND FUND CLASS I
|
|
LPL FINANCIAL
OMNIBUS CUSTOMER ACCOUNT
ATTN LINDSAY O TOOLE
4707 EXECUTIVE DR
SAN DIEGO CA 92121-3091
|
|
1,688,935.3510
46.38%
|
|
|
|
|
NATIONAL FINANCIAL SERVICES LLC
FOR THE EXCLUSIVE BENEFIT OF OUR CUSTOMERS
ATTN MUTUAL FUNDS DEPT 4TH FL
499 WASHINGTON BLVD
JERSEY CITY NJ 07310-1995
|
|
1,203,342.2740
33.04%
|
|
|
|
|
JP MORGAN SECURITIES LLC
FOR EXCLUSIVE BENEFIT OF CUSTOMERS
3 CHASE METROTECH CENTER
3RD FLOOR MUTUAL FUND DEPARTMENT
BROOKLYN NY 11245-0001
|
|
448,511.9520
12.32%
|
|
|
CALAMOS HIGH INCOME OPPORTUNITIES FUND CLASS A
|
|
JP MORGAN SECURITIES LLC
FOR EXCLUSIVE BENEFIT OF CUSTOMERS
3 CHASE METROTECH CENTER
3RD FLOOR MUTUAL FUND DEPARTMENT
BROOKLYN NY 11245-0001
|
|
1,417,836.5950
40.91%
|
|
|
|
|
MORGAN STANLEY SMITH BARNEY LLC
FOR THE EXCLUSIVE BENEFIT OF ITS CUSTOMERS
1 NEW YORK PLZ FL 12
NEW YORK NY 10004-1965
|
|
264,561.3880
7.63%
|
|
|
|
|
PERSHING LLC
1 PERSHING PLZ
JERSEY CITY NJ 07399-0001
|
|
244,025.3240
7.04%
|
|
|
|
|
NATIONAL FINANCIAL SERVICES LLC
FOR THE EXCLUSIVE BENEFIT OF OUR CUSTOMERS
ATTN MUTUAL FUNDS DEPT 4TH FL
499 WASHINGTON BLVD
JERSEY CITY NJ 07310-1995
|
|
202,351.6340
5.84%
|
|
|
|
|
RAYMOND JAMES
OMNIBUS FOR MUTUAL FUNDS
HOUSE ACCT FIRM 92500015
ATTN COURTNEY WALLER
880 CARILLON PKWY
ST PETERSBURG FL 33716-1100
|
|
191,377.7400
5.52%
|
|
|
|
|
WELLS FARGO CLEARING SERVICES LLC
SPECIAL CUSTODY ACCT
FOR THE EXCLUSIVE BENEFIT OF CUSTOMER
2801 MARKET ST
SAINT LOUIS MO 63103-2523
|
|
182,274.3890
5.26%
|
|
|
CALAMOS HIGH INCOME OPPORTUNITIES FUND CLASS C
|
|
PERSHING LLC
1 PERSHING PLZ
JERSEY CITY NJ 07399-0001
|
|
40,540.7980
75.34%
|
|
104
|
FUND
|
|
REGISTRATION
|
|
ACCOUNT SHARE BALANCE
PERCENT OF TOTAL SHRS
|
|
|
|
|
LPL FINANCIAL
OMNIBUS CUSTOMER ACCOUNT
ATTN LINDSAY O TOOLE
4707 EXECUTIVE DR
SAN DIEGO CA 92121-3091
|
|
7,716.7030
14.34%
|
|
|
|
|
WELLS FARGO CLEARING SERVICES LLC
SPECIAL CUSTODY ACCT
FOR THE EXCLUSIVE BENEFIT OF CUSTOMER
2801 MARKET ST
SAINT LOUIS MO 63103-2523
|
|
4,876.0440
9.06%
|
|
|
CALAMOS HIGH INCOME OPPORTUNITIES FUND CLASS I
|
|
NATIONAL FINANCIAL SERVICES LLC
FOR THE EXCLUSIVE BENEFIT OF OUR CUSTOMERS
ATTN MUTUAL FUNDS DEPT 4TH FL
499 WASHINGTON BLVD
JERSEY CITY NJ 07310-1995
|
|
389,347.5480
35.86%
|
|
|
|
|
RAYMOND JAMES
OMNIBUS FOR MUTUAL FUNDS
HOUSE ACCT FIRM 92500015
ATTN COURTNEY WALLER
880 CARILLON PKWY
ST PETERSBURG FL 33716-1100
|
|
307,711.6880
28.34%
|
|
|
|
|
LPL FINANCIAL
OMNIBUS CUSTOMER ACCOUNT
ATTN LINDSAY O TOOLE
4707 EXECUTIVE DR
SAN DIEGO CA 92121-3091
|
|
104,148.3630
9.59%
|
|
|
|
|
CHARLES SCHWAB CO
REINVEST ACCOUNT
211 MAIN ST
SAN FRANCISCO CA 94105-1901
|
|
104,020.8020
9.58%
|
|
|
|
|
UBS WM USA
0O0 11011 6100
SPEC CDY A/C EBOC UBSFSI
1000 HARBOR BLVD
WEEHAWKEN NJ 07086-6761
|
|
74,316.2340
6.85%
|
|
|
CALAMOS MERGER ARBITRAGE FUND CLASS A
|
|
CALAMOS INVESTMENTS LLC
ATTN CORPORATE ACCOUNTING
2020 CALAMOS CT
NAPERVILLE IL 60563-2787
|
|
10,055.9510
66.97%
|
|
|
|
|
CHARLES SCHWAB & CO INC
SPECIAL CUSTODY A/C FBO CUSTOMERS
ATTN MUTUAL FUNDS
211 MAIN ST
SAN FRANCISCO CA 94105-1901
|
|
4,900.5600
32.64%
|
|
|
CALAMOS MERGER ARBITRAGE FUND CLASS C
|
|
CALAMOS INVESTMENTS LLC
ATTN CORPORATE ACCOUNTING
2020 CALAMOS CT
NAPERVILLE IL 60563-2787
|
|
10,042.5240
100.00%
|
|
|
CALAMOS MERGER ARBITRAGE FUND CLASS I
|
|
CALAMOS INVESTMENTS LLC
ATTN CORPORATE ACCOUNTING
2020 CALAMOS CT
NAPERVILLE IL 60563-2787
|
|
80,469.2560
42.61%
|
|
105
|
FUND
|
|
REGISTRATION
|
|
ACCOUNT SHARE BALANCE
PERCENT OF TOTAL SHRS
|
|
|
|
|
CHARLES SCHWAB & CO INC
SPECIAL CUSTODY A/C FBO CUSTOMERS
ATTN MUTUAL FUNDS
211 MAIN ST
SAN FRANCISCO CA 94105-1901
|
|
64,866.5510
34.35%
|
|
|
|
|
NATIONAL FINANCIAL SERVICES LLC
FOR THE EXCLUSIVE BENEFIT OF OUR CUSTOMERS
ATTN MUTUAL FUNDS DEPT 4TH FL
499 WASHINGTON BLVD
JERSEY CITY NJ 07310-1995
|
|
43,506.4580
23.04%
|
|
|
CALAMOS SHORT-TERM BOND FUND CLASS A
|
|
PERSHING LLC
1 PERSHING PLZ
JERSEY CITY NJ 07399-0001
|
|
163,627.8760
43.92%
|
|
|
|
|
CHARLES SCHWAB & CO INC
SPECIAL CUSTODY A/C FBO CUSTOMERS
ATTN MUTUAL FUNDS
211 MAIN ST
SAN FRANCISCO CA 94105-1901
|
|
94,690.1360
25.42%
|
|
|
|
|
US BANK NA CUST
PATRICK GEBEL BENE
OF THE SUZANNE M GEBEL IRA
2020 CALAMOS COURT
NAPERVILLE IL 60563
|
|
30,480.3740
8.18%
|
|
|
|
|
LPL FINANCIAL
OMNIBUS CUSTOMER ACCOUNT
ATTN LINDSAY O TOOLE
4707 EXECUTIVE DR
SAN DIEGO CA 92121-3091
|
|
23,650.9270
6.35%
|
|
|
|
|
VANGUARD BROKERAGE SERVICES
PO BOX 1170
VALLEY FORGE PA 19482-1170
|
|
22,888.8880
6.14%
|
|
|
CALAMOS SHORT-TERM BOND FUND CLASS I
|
|
CALAMOS MARKET NEUTRAL INCOME FUND
2020 CALAMOS COURT
NAPERVILLE IL 60563-3284
|
|
35,117,149.8300
92.14%
|
|
As of January 31, 2024, the trustees and officers of the Trust as a group owned:
Calamos Dividend Growth Fund — Class I: 1%
Calamos Evolving World Growth Fund — Class I: 7%
Calamos Global Convertible — Class I: 1%
Calamos Global Equity Fund — Class I: 36%
Calamos Global Equity Fund — Class R6: 26%
Calamos Global Opportunities Fund — Class I: 3%
Calamos Growth and Income Fund — Class C: 2%
Calamos Growth and Income Fund — Class I: 5%
Calamos Growth and Income Fund — Class R6: 23%
Calamos Growth Fund — Class I: 51%
Calamos Hedged Equity Fund — Class I: 8%
Calamos High Income Opportunities Fund — Class A: 41%
106
Calamos High Income Opportunities Fund — Class I: 18%
Calamos International Growth Fund — Class I: 21%
Calamos International Growth Fund — Class R6: 1%
Calamos Merger Arbitrage Fund — Class A: 67%
Calamos Merger Arbitrage Fund — Class C: 100%
Calamos Merger Arbitrage Fund — Class I: 43%
Calamos Phineus Long Short Fund — Class I: 5%
Calamos Select Fund — Class A: 1%
Calamos Select Fund — Class I: 47%
Calamos Short-Term Bond Fund — Class A: 1%
Calamos Timpani Small Cap Growth Fund — Class A: 1%
Calamos Timpani Small Cap Growth Fund — Class I: 5%
Calamos Timpani Small Cap Growth Fund — Class R6: 5%
Calamos Timpani SMID Growth Fund — Class A: 5%
Calamos Timpani SMID Growth Fund — Class I: 72%
Calamos Timpani SMID Growth Fund — Class R6: 3%
Calamos International Small Cap Growth Fund — Class A: 38%
Calamos International Small Cap Growth Fund — Class C: 100%
Calamos International Small Cap Growth Fund — Class I: 62%
Calamos International Small Cap Growth Fund — Class R6: 100%
Calamos Total Return Bond Fund — Class I: 15%
The trustees and officers as a group owned less than 1% of the outstanding shares of each other class of each Fund. Pursuant to Rule 16a-1(a)(2) of the 1934 Act, John P. Calamos, Sr. may be deemed to have indirect beneficial ownership of Fund shares held by Calamos Investments LLC, its subsidiaries, and its parent companies (Calamos Asset Management, Inc. and Calamos Partners LLC, and its parent company, Calamos Family Partners, Inc.) due to his direct or indirect ownership interest in those entities. As a result, these percentages reflect any holdings of those entities in addition to the individual, personal accounts of John P. Calamos, Sr.
CUSTODIAN AND TRANSFER AGENT
State Street Bank and Trust Company ("State Street"), 200 Clarendon Street, P.O. Box 9130, Boston, Massachusetts 02117-9130, is the custodian for the assets of each Fund. The custodian is responsible for holding all cash and securities of the Funds, directly or through a book entry system, delivering and receiving payment for securities sold by the Funds, receiving and paying for securities purchased by the Funds, collecting income from investments of the Funds and performing other duties, all as directed by authorized persons of the Trust. The custodian does not exercise any supervisory functions in such matters as the purchase and sale of securities by a Fund, payment of dividends or payment of expenses of a Fund.
U.S. Bank Global Fund Services, P.O. Box 701, Milwaukee, WI 53201, serves as transfer agent and dividend paying agent for each Fund.
Securities Lending
The Board has approved each Fund's participation in a securities lending program. Under the securities lending program, each Fund has retained its custodian, State Street, to serve as the Funds' securities lending agent. A Fund will receive amounts equivalent to any dividends, interest or other distributions on the securities loaned. The board of trustees periodically reviews information on the Funds' securities lending program.
107
For the fiscal year ended October 31, 2023, State Street, acting as agent for the Funds, provided the following services to the Funds in connection with the Funds' securities lending activities: (i) locating borrowers among an approved list of prospective borrowers; (ii) monitoring applicable minimum spread requirements, lending limits and the value of the loaned securities and collateral received; (iii) seeking additional collateral, as necessary, from borrowers; (iv) receiving and holding collateral from borrowers, and facilitating the investment and reinvestment of all or substantially all cash collateral in an investment vehicle designated by the Funds; (v) returning collateral to borrowers; (vi) facilitating substitute dividend, interest, and other distribution payments to the Funds from borrowers; (vii) negotiating the terms of each loan of securities, including, but not limited to, the amount of any loan premium, and monitoring the terms of securities loan agreements with prospective borrowers for consistency with the requirements of the State Street Securities Lending Agreement; (viii) selecting securities, including amounts (percentages), to be loaned; (ix) recordkeeping and accounting servicing; (x) monitoring dividend activity; (xi) material proxy votes relating to loaned securities as well as recall of securities on loan for Fund to vote proxies; (xii) arranging for return of loaned securities to the Fund at loan termination; and (xiii) preparation of and modification to ancillary lending documents.
Lending portfolio securities enables a Fund to earn additional income, but could result in a loss or delay in recovering these securities. The borrower of a Fund's portfolio securities must deposit acceptable collateral with the Fund's custodian in an amount, marked to market daily, at least equal to the market value of the securities loaned, plus accrued interest and dividends. Acceptable collateral is limited to cash, U.S. government securities, including obligations issued or guaranteed by its agencies or instrumentalities, U.S. mortgage backed securities, U.K. government securities, Eurozone government securities and irrevocable letters of credit that meet certain guidelines. A Fund will receive amounts equivalent to any dividends, interest or other distributions on the securities loaned.
A Fund may reinvest any cash collateral in money market investments or other investments subject to guidelines approved by the Adviser and the Board of Trustees. The cash collateral investments are not guaranteed, and may lose money. A Fund retains authority to terminate any of its loans at any time. A Fund may terminate a loan and regain record ownership of loaned securities to exercise ownership rights, such as voting and subscription rights, when regaining such rights is considered to be in the Fund's interest.
In the event of bankruptcy or other default of the borrower, a Fund may be unable to recover the loaned securities or could experience delays in liquidating the loan collateral or recovering the loaned securities and incur expenses related to enforcing its rights. In addition, there could be a decline in the value of the collateral or in the fair value of the securities loaned while a Fund seeks to enforce its rights thereto, and the Fund could experience subnormal levels of income or lack of access to income during that period. The Funds also bear the risk of any deficiency in the amount of collateral available for return to a borrower due to a loss in an approved investment.
The net securities lending revenue is shared by the lending agent and the Funds. The securities lending revenue "split" between the Funds and the lending agent was determined based on the Adviser's review of competitive industry information. The Adviser and the Board will periodically review the "split" between the lending agent and the Funds.
For the fiscal year ended October 31, 2023, the income earned by each Fund as well as the fees and/or compensation paid by each Fund (in dollars) pursuant to the Securities Lending Authorization Agreement between the Adviser, on behalf of each Fund, and State Street were as follows:
|
|
|
GROSS INCOME
EARNED BY THE
FUND FROM
SECURITIES
LENDING
ACTIVITIES(1)
|
|
FEES AND/OR
COMPENSATION
PAID BY THE
FUND FOR
SECURITIES
LENDING
ACTIVITIES AND
RELATED
SERVICES(2)
|
|
AGGREGATE FEES/
COMPENSATION
PAID BY THE
FUND FOR
SECURITIES
LENDING
ACTIVITIES
|
|
NET INCOME
FROM
SECURITIES
LENDING
ACTIVITIES(3)
|
|
|
Market Neutral Income Fund
|
|
$
|
674,540
|
|
|
$
|
101,179
|
|
|
$
|
101,179
|
|
|
$
|
573,360
|
|
|
|
Hedged Equity Fund
|
|
$
|
19,394
|
|
|
$
|
2,909
|
|
|
$
|
2,909
|
|
|
$
|
16,485
|
|
|
|
Phineus Long/Short Fund
|
|
$
|
17,358
|
|
|
$
|
2,603
|
|
|
$
|
2,603
|
|
|
$
|
14,755
|
|
|
|
Merger Arbitrage Fund(4)
|
|
$
|
—
|
|
|
$
|
—
|
|
|
$
|
—
|
|
|
$
|
—
|
|
|
|
Convertible Fund
|
|
$
|
1,258,086
|
|
|
$
|
188,709
|
|
|
$
|
188,709
|
|
|
$
|
1,069,377
|
|
|
|
Global Convertible Fund
|
|
$
|
114,267
|
|
|
$
|
17,141
|
|
|
$
|
17,141
|
|
|
$
|
97,126
|
|
|
|
Timpani Small Cap Growth Fund
|
|
$
|
—
|
|
|
$
|
—
|
|
|
$
|
—
|
|
|
$
|
—
|
|
|
108
|
|
|
GROSS INCOME
EARNED BY THE
FUND FROM
SECURITIES
LENDING
ACTIVITIES(1)
|
|
FEES AND/OR
COMPENSATION
PAID BY THE
FUND FOR
SECURITIES
LENDING
ACTIVITIES AND
RELATED
SERVICES(2)
|
|
AGGREGATE FEES/
COMPENSATION
PAID BY THE
FUND FOR
SECURITIES
LENDING
ACTIVITIES
|
|
NET INCOME
FROM
SECURITIES
LENDING
ACTIVITIES(3)
|
|
|
Timpani SMID Growth Fund
|
|
$
|
—
|
|
|
$
|
—
|
|
|
$
|
—
|
|
|
$
|
—
|
|
|
|
Growth Fund
|
|
$
|
108,679
|
|
|
$
|
16,297
|
|
|
$
|
16,297
|
|
|
$
|
92,382
|
|
|
|
Growth and Income Fund
|
|
$
|
1,136,520
|
|
|
$
|
170,473
|
|
|
$
|
170,473
|
|
|
$
|
966,046
|
|
|
|
Dividend Growth Fund
|
|
$
|
781
|
|
|
$
|
117
|
|
|
$
|
117
|
|
|
$
|
664
|
|
|
|
Select Fund
|
|
$
|
750
|
|
|
$
|
112
|
|
|
$
|
112
|
|
|
$
|
638
|
|
|
|
International Growth Fund
|
|
$
|
27,883
|
|
|
$
|
4,182
|
|
|
$
|
4,182
|
|
|
$
|
23,701
|
|
|
|
Evolving World Growth Fund
|
|
$
|
20,680
|
|
|
$
|
3,102
|
|
|
$
|
3,102
|
|
|
$
|
17,579
|
|
|
|
Global Equity Fund
|
|
$
|
5,247
|
|
|
$
|
787
|
|
|
$
|
787
|
|
|
$
|
4,460
|
|
|
|
Global Opportunities Fund
|
|
$
|
82,447
|
|
|
$
|
12,366
|
|
|
$
|
12,366
|
|
|
$
|
70,081
|
|
|
|
International Small Cap Growth Fund
|
|
$
|
—
|
|
|
$
|
—
|
|
|
$
|
—
|
|
|
$
|
—
|
|
|
|
Total Return Bond Fund
|
|
$
|
3,830
|
|
|
$
|
573
|
|
|
$
|
573
|
|
|
$
|
3,256
|
|
|
|
High Income Fund
|
|
$
|
24,782
|
|
|
$
|
3,717
|
|
|
$
|
3,717
|
|
|
$
|
21,065
|
|
|
|
Short-Term Bond Fund
|
|
$
|
59,763
|
|
|
$
|
8,956
|
|
|
$
|
8,956
|
|
|
$
|
50,807
|
|
|
(1) Includes income from cash collateral reinvestment, and may also include: negative rebates; loan fees paid by borrowers when collateral is noncash; management fees from a pooled cash collateral reinvestment vehicle that are deducted from the vehicle's assets before income is distributed; and any other income.
(2) Includes fees paid to State Street from a revenue split.
(3) Represents "Gross income earned by the Fund from securities lending activities" minus the values of "Aggregate fees/compensation paid by the Fund for securities lending activities."
(4) Merger Arbitrage Fund commenced operations on September 29, 2023.
FUND ACCOUNTING AND FINANCIAL ACCOUNTING AGENT
The Funds have an agreement with Ernst & Young LLP ("EY") located at 155 N. Wacker Drive, Chicago, IL 60606 to provide certain tax services. The tax services include the following: calculating, tracking and reporting tax adjustments on all assets of the Funds, including but not limited to contingent debt and preferred trust obligations; preparing excise tax and fiscal year distribution schedules; preparing tax information required for financial statement footnotes; preparing state and federal income tax returns; preparing specialized calculations of amortization on convertible securities; preparing year-end dividend disclosure information; providing treaty-based foreign withholding tax reclaim services; providing certain global compliance and reporting services; providing a match service and analysis of the "passive foreign investment company" status of foreign corporate entities; and providing services related to corporate actions that may or may not have a tax impact on the Funds' holdings. For the fiscal years ended October 31, 2023, October 31, 2022, and October 31, 2021, the Funds paid EY $893,901, $785,460, and $728,426, respectively, for tax services.
Under the arrangements with State Street located at One Iron Street, Boston, MA 02111 to provide fund accounting services, State Street provides certain administrative and accounting services including providing daily reconciliation of cash, trades and positions; maintaining general ledger and capital stock accounts; preparing daily trial balance; calculating net asset value; providing selected general ledger reports; preferred share compliance; calculating total returns; and providing monthly distribution analysis to the Funds. For the fiscal years ended October 31, 2023, October 31, 2022, and October 31, 2021, the Funds paid State Street $1,491,450, $1,568,479, and $1,401,811, respectively, for fund accounting services. The Funds have also entered into an agreement with State Street pursuant to which State Street provides certain administration treasury services to the Funds. These services include: monitoring the calculation of expense accrual amounts for the Funds and making any necessary modifications; managing the Funds' expenses and expense payment processing; coordinating any expense reimbursement calculations and payment; calculating net investment income dividends and capital gain distributions; coordinating the audits for the Funds; preparing financial reporting statements for each Fund; preparing certain regulatory filings; and calculating asset coverage tests for certain Calamos Funds. For the fiscal years ended October 31, 2023, October 31, 2022, and October 31, 2021, the Funds paid State Street $1,419,411, $1,501,161, and $1,342,414, respectively, for administration services.
109
INDEPENDENT REGISTERED PUBLIC ACCOUNTING FIRM
Deloitte & Touche LLP, an independent registered public accounting firm, is the Trust's independent auditor and is located at 111 South Wacker Drive, Chicago, IL 60606. Deloitte & Touche LLP audits and reports on the Funds' annual financial statements and performs audit, audit-related and other services when approved by the Trust's audit committee.
GENERAL INFORMATION
SHAREHOLDER INFORMATION
Each Fund is a series of Calamos Investment Trust (formerly named CFS Investment Trust). As of March 18, 1996, all shares of each Fund then outstanding were re-designated as Class A shares of that Fund. Under the terms of the Agreement and Declaration of Trust, the trustees may issue an unlimited number of shares of beneficial interest without par value for each series of shares authorized by the trustees and the trustees may divide the shares of any series into two or more classes of shares of that series. As of the date of this Statement of Additional Information, the Trust has 20 series in operation. All shares issued will be fully paid and non-assessable and will have no preemptive or conversion rights. In the future, the board of trustees may authorize the issuance of shares of additional series and additional classes of shares of any series.
Each Fund's shares of a given class are entitled to participate pro rata in any dividends and other distributions declared by the Fund's board of trustees with respect to shares of the Fund. All shares of the Fund of a given class have equal rights in the event of liquidation of that class.
Under Massachusetts law, the shareholders of the Trust may, under certain circumstances, be held personally liable for the Trust's obligations. However, the Trust's Declaration of Trust disclaims liability of the shareholders, trustees, and officers of the Trust for acts or obligations of the Funds that are binding only on the assets and property of the Fund. The Declaration of Trust requires that notice of such disclaimer be given in each agreement, obligation, or contract entered into or executed by the Trust or the board of trustees. The Declaration of Trust provides for indemnification out of a Fund's assets of all losses and expenses of any Fund shareholder held personally liable for the Fund's obligations. Thus, the risk of a shareholder incurring financial loss on account of shareholder liability is remote, because it is limited to circumstances in which the disclaimer is inoperative and the Fund itself is unable to meet its obligations.
VOTING RIGHTS
Each share has one vote and fractional shares have fractional votes. Shareholders of the Trust generally will vote together on all matters except when a particular matter affects only shareholders of a particular class or series or when applicable law requires shareholders to vote separately by series or class. As a business trust, the Trust is not required to hold annual shareholder meetings. However, special meetings may be called for purposes such as electing or removing trustees, changing fundamental policies or approving an investment advisory agreement.
FINANCIAL STATEMENTS
The Funds' financial statements and financial highlights for the fiscal year ended October 31, 2023, as well as the report of the independent registered public accounting firm, are incorporated herein by reference from the Funds' annual report to shareholders. See the front cover of the Funds' statement of additional information or the back cover of the Funds' prospectus for information on how to obtain the Funds' annual report to shareholders.
110
APPENDIX—DESCRIPTION OF RATINGS1
A rating of a rating service represents the service's opinion as to the credit quality of the security being rated. However, the ratings are general and are not absolute standards of quality or guarantees as to the creditworthiness of an issuer. Consequently, Calamos Advisors believes that the quality of debt securities in which a Fund invests should be continuously reviewed. A rating is not a recommendation to purchase, sell or hold a security, because it does not take into account market value or suitability for a particular investor. When a security has received a rating from more than one service, each rating should be evaluated independently. Ratings are based on current information furnished by the issuer or obtained by the ratings services from other sources that they consider reliable. Ratings may be changed, suspended or withdrawn as a result of changes in or unavailability of such information, or for other reasons.
The following is a description of the characteristics of ratings used by Moody's Investors Service ("Moody's") and Standard & Poor's Corporation, a division of The McGraw-Hill Companies ("S&P").
MOODY'S GLOBAL SHORT-TERM RATING SCALE
P-1: Issuers (or supporting institutions) rated Prime-1 have a superior ability to repay short-term debt obligations.
P-2: Issuers (or supporting institutions) rated Prime-2 have a strong ability to repay short-term debt obligations.
P-3: Issuers (or supporting institutions) rated Prime-3 have an acceptable ability to repay short-term obligations.
NP: Issuers (or supporting institutions) rated Not Prime do not fall within any of the Prime rating categories.
MOODY'S GLOBAL LONG-TERM RATING SCALE
Aaa—Obligations rated Aaa are judged to be of the highest quality, subject to the lowest level of credit risk.
Aa—Obligations rated Aa are judged to be of high quality and are subject to very low credit risk.
A—Obligations rated A are judged to be upper-medium grade and are subject to low credit risk.
Baa—Obligations rated Baa are judged to be medium-grade and subject to moderate credit risk and as such may possess certain speculative characteristics.
Ba—Obligations rated Ba are judged to be speculative and are subject to substantial credit risk.
B—Obligations rated B are considered speculative and are subject to high credit risk.
Caa—Obligations rated Caa are judged to be speculative of poor standing and are subject to very high credit risk.
Ca—Obligations rated Ca are highly speculative and are likely in, or very near, default, with some prospect of recovery of principal and interest.
C—Obligations rated C are the lowest rated and are typically in default, with little prospect for recovery of principal or interest.
Note: Moody's appends numerical modifiers 1, 2, and 3 to each generic rating classification from Aa through Caa. The modifier 1 indicates that the obligation ranks in the higher end of its generic rating category; the modifier 2 indicates a mid-range ranking; and the modifier 3 indicates a ranking in the lower end of that generic rating category. Additionally, a "(hyb)" indicator is appended to all ratings of hybrid securities issued by banks, insurers, finance companies, and securities firms.*
S&P SHORT-TERM ISSUE CREDIT RATINGS
A-1: A short-term obligation rated 'A-1' is rated in the highest category by S&P Global Ratings. The obligor's capacity to meet its financial commitments on the obligation is strong. Within this category, certain obligations are designated with a plus sign (+). This indicates that the obligor's capacity to meet its financial commitments on these obligations is extremely strong.
1 The ratings indicated herein are believed to be the most recent ratings available at the date of this prospectus for the securities listed. Ratings are generally given to securities at the time of issuance. While the rating agencies may from time to time revise such ratings, they undertake no obligation to do so, and the rating indicated do not necessarily represent ratings which will be given to these securities on the date of the Funds' fiscal year-end.
* By their terms, hybrid securities allow for the omission of scheduled dividends, interest, or principal payments, which can potentially result in impairment if such an omission occurs. Hybrid securities may also be subject to contractually allowable write-downs of principal that could result in impairment. Together with the hybrid indicator, the long-term obligation rating assigned to a hybrid security is an expression of the relative credit risk associated with that security.
A-1
A-2: A short-term obligation rated 'A-2' is somewhat more susceptible to the adverse effects of changes in circumstances and economic conditions than obligations in higher rating categories. However, the obligor's capacity to meet its financial commitments on the obligation is satisfactory.
A-3: A short-term obligation rated 'A-3' exhibits adequate protection parameters. However, adverse economic conditions or changing circumstances are more likely to weaken an obligor's capacity to meet its financial commitments on the obligation.
B: A short-term obligation rated 'B' is regarded as vulnerable and has significant speculative characteristics. The obligor currently has the capacity to meet its financial commitments; however, it faces major ongoing uncertainties that could lead to the obligor's inadequate capacity to meet its financial commitments.
C: A short-term obligation rated 'C' is currently vulnerable to nonpayment and is dependent upon favorable business, financial, and economic conditions for the obligor to meet its financial commitments on the obligation.
D: A short-term obligation rated 'D' is in default or in breach of an imputed promise. For non-hybrid capital instruments, the 'D' rating category is used when payments on an obligation are not made on the date due, unless S&P Global Ratings believes that such payments will be made within any stated grace period. However, any stated grace period longer than five business days will be treated as five business days. The 'D' rating also will be used upon the filing of a bankruptcy petition or the taking of a similar action and where default on an obligation is a virtual certainty, for example due to automatic stay provisions. A rating on an obligation is lowered to 'D' if it is subject to a distressed exchange offer.
S&P LONG-TERM ISSUE CREDIT RATINGS*
Issue credit ratings are based, in varying degrees, on S&P Global Ratings' analysis of the following considerations:
• The likelihood of payment — the capacity and willingness of the obligor to meet its financial commitments on an obligation in accordance with the terms of the obligation;
• The nature and provisions of the financial obligation, and the promise we impute; and
• The protection afforded by, and relative position of, the financial obligation in the event of a bankruptcy, reorganization, or other arrangement under the laws of bankruptcy and other laws affecting creditors' rights.
An issue rating is an assessment of default risk but may incorporate an assessment of relative seniority or ultimate recovery in the event of default. Junior obligations are typically rated lower than senior obligations, to reflect lower priority in bankruptcy, as noted above. (Such differentiation may apply when an entity has both senior and subordinated obligations, secured and unsecured obligations, or operating company and holding company obligations.)
AAA—An obligation rated 'AAA' has the highest rating assigned by S&P. The obligor's capacity to meet its financial commitments on the obligation is extremely strong.
AA—An obligation rated 'AA' differs from the highest-rated obligations only to a small degree. The obligor's capacity to meet its financial commitments on the obligation is very strong.
A—An obligation rated 'A' is somewhat more susceptible to the adverse effects of changes in circumstances and economic conditions than obligations in higher-rated categories. However, the obligor's capacity to meet its financial commitments on the obligation is still strong.
BBB—An obligation rated 'BBB' exhibits adequate protection parameters. However, adverse economic conditions or changing circumstances are more likely to weaken an obligor's capacity to meet its financial commitments on the obligation.
BB, B, CCC, CC and C—Obligations rated 'BB', 'B', 'CCC', 'CC', and 'C' are regarded as having significant speculative characteristics. 'BB' indicates the least degree of speculation and 'C' the highest. While such obligations will likely have some quality and protective characteristics, these may be outweighed by large uncertainties or major exposure to adverse conditions.
BB—An obligation rated 'BB' is less vulnerable to nonpayment than other speculative issues. However, it faces major ongoing uncertainties or exposure to adverse business, financial, or economic conditions that could lead to the obligor's inadequate capacity to meet its financial commitments on the obligation.
* Ratings from 'AA' to 'CCC' may be modified by the addition of a plus (+) or minus (-) sign to show relative standing within the rating categories.
A-2
B—An obligation rated 'B' is more vulnerable to nonpayment than obligations rated 'BB', but the obligor currently has the capacity to meet its financial commitments on the obligation. Adverse business, financial, or economic conditions will likely impair the obligor's capacity or willingness to meet its financial commitments on the obligation.
CCC—An obligation rated 'CCC' is currently vulnerable to nonpayment, and is dependent upon favorable business, financial, and economic conditions for the obligor to meet its financial commitment on the obligation. In the event of adverse business, financial, or economic conditions, the obligor is not likely to have the capacity to meet its financial commitment on the obligation.
CC—An obligation rated 'CC' is currently highly vulnerable to nonpayment. The 'CC' rating is used when a default has not yet occurred, but S&P expects default to be a virtual certainty, regardless of the anticipated time to default.
C—An obligation rated 'C' is currently highly vulnerable to nonpayment, and the obligation is expected to have lower relative seniority or lower ultimate recovery compared with obligations that are rated higher.
D—An obligation rated 'D' is in payment default or in breach of an imputed promise. For non-hybrid capital instruments, the 'D' rating category is used when payments on an obligation are not made on the date due, unless S&P believes that such payments will be made within five business days in the absence of a stated grace period or within the earlier of the stated grace period or 30 calendar days. The 'D' rating also will be used upon the filing of a bankruptcy petition or the taking of similar action and where default on an obligation is a virtual certainty, for example due to automatic stay provisions. An obligation's rating is lowered to 'D' if it is subject to a distressed exchange offer.
NR—indicates that a rating has not been assigned or is no longer assigned.
Local Currency and Foreign Currency Ratings
S&P Global Ratings' issuer credit ratings make a distinction between foreign currency ratings and local currency ratings. A foreign currency rating on an issuer will differ from the local currency rating on it when the obligor has a different capacity to meet its obligations denominated in its local currency versus obligations denominated in a foreign currency.
A-3
PART C. OTHER INFORMATION
| ITEM 28. |
EXHIBITS. |
| |
|
| (a)(1) |
Fourth Amended and Restated Agreement and Declaration of Trust, dated May 15, 2012 (incorporated by reference to Exhibit (a)(1) to Post-Effective Amendment No. 78 to Registrant’s Registration Statement on Form N-1A, filed on February 27, 2013). |
| |
|
| (a)(2) |
Amendment No. 1 to Fourth Amended and Restated Agreement and Declaration of Trust, dated February 26, 2013 (incorporated by reference to Exhibit (a)(1) to Post-Effective Amendment No. 78 to Registrant’s Registration Statement on Form N-1A, filed on February 27, 2013). |
| |
|
| (a)(3) |
Amendment No. 2 to Fourth Amended and Restated Agreement and Declaration of Trust, dated May 24, 2013 (incorporated by reference to Exhibit (a)(3) to Post-Effective Amendment No. 85 to Registrant’s Registration Statement on Form N-1A, filed on August 2, 2013). |
| |
|
| (a)(4) |
Amendment No. 3 to Fourth Amended and Restated Agreement and Declaration of Trust, dated July 19, 2013 (incorporated by reference to Exhibit (a)(4) to Post-Effective Amendment No. 85 to Registrant’s Registration Statement on Form N-1A, filed on August 2, 2013). |
| |
|
| (a)(5) |
Amendment No. 4 to the Fourth Amended and Restated Agreement and Declaration of Trust, dated November 6, 2013 (incorporated by reference to Exhibit (a)(5) to Post-Effective Amendment No. 88 to Registrant’s Registration Statement on Form N-1A, filed on December 20, 2013). |
| |
|
| (a)(6) |
Amendment No. 5 to the Fourth Amended and Restated Agreement and Declaration of Trust, dated February 14, 2014 (incorporated by reference to Exhibit (a)(6) to Post-Effective Amendment No. 90 to Registrant’s Registration Statement on Form N-1A, filed on February 26, 2014). |
| |
|
| (a)(7) |
Amendment No. 6 to the Fourth Amended and Restated Agreement and Declaration of Trust, dated November 4, 2014 (incorporated by reference to Exhibit (a)(7) to Post-Effective Amendment No. 93 to Registrant’s Registration Statement on Form N-1A, filed on December 30, 2014). |
| |
|
| (a)(8) |
Amendment No. 7 to the Fourth Amended and Restated Agreement and Declaration of Trust, dated November 9, 2015 (incorporated by reference to Exhibit (a)(8) to Post-Effective Amendment No. 104 to Registrant’s Registration Statement on Form N-1A, filed on April 1, 2016). |
| |
|
| (a)(9) |
Amendment No. 8 to the Fourth Amended and Restated Agreement and Declaration of Trust, dated October 27, 2016 (incorporated by reference to Exhibit (a)(9) to Post-Effective Amendment No. 108 to Registrant’s Registration Statement on Form N-1A, filed on February 27, 2017). |
| |
|
| (a)(10) |
Amendment No. 9 to the Fourth Amended and Restated Agreement and Declaration of Trust, dated February 7, 2017 (incorporated by reference to Exhibit (a)(10) to Post-Effective Amendment No. 108 to Registrant’s Registration Statement on Form N-1A, filed on February 27, 2017). |
| |
|
| (a)(11) |
Amendment No. 10 to the Fourth Amended and Restated Agreement and Declaration of Trust, dated June 23, 2017 (incorporated by reference to Exhibit (a)(11) to Post-Effective Amendment No. 110 to Registrant’s Registration Statement on Form N-1A, filed on July 10, 2017). |
| |
|
| (a)(12) |
Amendment No. 11 to the Fourth Amended and Restated Agreement and Declaration of Trust, dated December 13, 2017 (incorporated by reference to Exhibit (a)(12) to Post-Effective Amendment No. 113 to Registrant’s Registration Statement on Form N-1A, filed on February 23, 2018). |
| |
|
| (a)(13) |
Amendment No. 12 to the Fourth Amended and Restated Agreement and Declaration of Trust, dated May 15, 2018 (incorporated by reference to Exhibit (a)(13) to Post-Effective Amendment No. 115 to Registrant’s Registration Statement on Form N-1A, filed on June 15, 2018). |
| (a)(14) |
Amendment No. 13 to the Fourth Amended and Restated Agreement and Declaration of Trust, dated June 29, 2018 (incorporated by reference to Exhibit (a)(14) to Post-Effective Amendment No. 116 to Registrant’s Registration Statement on Form N-1A, filed on July 18, 2018). |
| |
|
| (a)(15) |
Amendment No. 14 to the Fourth Amended and Restated Agreement and Declaration of Trust, dated January 25, 2019 (incorporated by reference to Exhibit (a)(15) to Post-Effective Amendment No. 121 to Registrant’s Registration Statement on Form N-1A, filed on January 28, 2019). |
| |
|
| (a)(16) |
Amendment No. 15 to the Fourth Amended and Restated Agreement and Declaration of Trust, dated April 24, 2019 (incorporated by reference to Exhibit (a)(16) to Post-Effective Amendment No. 125 to Registrant’s Registration Statement on Form N-1A, filed on April 29, 2019). |
| |
|
| (a)(17) |
Amendment No. 16 to the Fourth Amended and Restated Agreement and Declaration of Trust, dated February 19, 2020 (incorporated by reference to Exhibit (a)(17) to Post-Effective Amendment No. 131 to Registrant’s Registration Statement on Form N-1A, filed on February 24, 2020). |
| |
|
| (a)(18) |
Amendment No. 17 to the Fourth Amended and Restated Agreement and Declaration of Trust, dated April 20, 2020 (incorporated by reference to Exhibit (a)(18) to Post-Effective Amendment No. 133 to Registrant’s Registration Statement on Form N-1A, filed on April 24, 2020). |
| |
|
| (a)(19) |
Amendment No. 18 to the Fourth Amended and Restated Agreement and Declaration of Trust, dated March 26, 2021 (incorporated by reference to Exhibit (a)(19) to Post-Effective Amendment No. 137 to Registrant's Registration Statement on Form N-1A, filed on April 26, 2021). |
| |
|
| (a)(20) |
Amendment No. 19 to the Fourth Amended and Restated Agreement and Declaration of Trust, dated September 27, 2021 (incorporated by reference to Exhibit (a)(20) to Post-Effective Amendment No. 140 to Registrant’s Registration Statement on Form N-1A, filed on December 14, 2021). |
| |
|
| (a)(21) |
Amendment No. 20 to the Fourth Amended and Restated Agreement and Declaration of Trust, dated January 6, 2022 (incorporated by reference to Exhibit (a)(21) to Post-Effective Amendment No. 141 to Registrant’s Registration Statement on Form N-1A, filed on January 14, 2022). |
| |
|
| (a)(22) |
Amendment No. 21 to the Fourth Amended and Restated Agreement and Declaration of Trust, dated April 20, 2023 (incorporated by reference to Exhibit (a)(22) to Post-Effective Amendment No. 149 to Registrant’s Registration Statement on Form N-1A, filed on September 27, 2023). |
| |
|
| (b) |
Bylaws, as amended through September 22, 2015 (incorporated by reference to Exhibit (b) to Post-Effective Amendment No. 97 to Registrant’s Registration Statement on Form N-1A, filed on November 6, 2015). |
| |
|
| (c) |
See Articles IV and V of Exhibit (a), above. |
| |
|
| (d)(1) |
Amended and Restated Management Agreement with Calamos Advisors LLC, dated June 29, 2022 (incorporated by reference to Exhibit (d)(1) to Post-Effective Amendment No. 144 to Registrant’s Registration Statement on Form N-1A, filed on February 24, 2023). |
| |
|
| (d)(2) |
Amendment, dated August 1, 2006, to Management Agreement, dated December 13, 2004, with Calamos Advisors LLC (incorporated by reference to Exhibit (d)(2) to Post-Effective Amendment No. 50 to Registrant’s Registration Statement on Form N-1A, filed on February 28, 2007). |
| |
|
| (d)(3) |
Letter Agreement with Calamos Advisors LLC, dated March 7, 2008 (incorporated by reference to Exhibit (d)(3) to Post-Effective Amendment No. 64 to Registrant’s Registration Statement on Form N-1A, filed on June 20, 2008). |
| (d)(4) |
Form of Notification to Calamos Asset Management, Inc. regarding Establishment of Calamos Opportunistic Value Fund (formerly known as the Calamos Mid Cap Value Fund) (incorporated by reference to Exhibit (d)(2) to Post-Effective Amendment No. 27 to Registrant’s Registration Statement on Form N-1A, filed on December 18, 2001). |
| |
|
| (d)(5) |
Notification to Calamos Advisors LLC, regarding Establishment of Calamos Multi-Fund Blend, dated March 30, 2006 (incorporated by reference to Exhibit (d)(5) to Post-Effective Amendment No. 44 to Registrant’s Registration Statement on Form N-1A, filed on June 13, 2006). |
| |
|
| (d)(6) |
Form of Notification to Calamos Advisors LLC, regarding Fee Schedule Amendment (incorporated by reference to Exhibit (d) (6) to Post-Effective Amendment No. 47 to Registrant’s Registration Statement on Form N-1A, filed on July 31, 2006). |
| |
|
| (d)(7) |
Notification to Calamos Advisors LLC, regarding Fee Schedule Amendment (incorporated by reference to Exhibit (d)(8) to Post-Effective Amendment No. 93 to Registrant’s Registration Statement on Form N-1A, filed on December 30, 2014). |
| |
|
| (d)(8) |
Notification to Calamos Advisors LLC, regarding Establishment of Global Equity Fund, dated as of March 1, 2007 (incorporated by reference to Exhibit (d)(8) to Post-Effective Amendment No. 50 to Registrant’s Registration Statement on Form N-1A, filed on February 28, 2007). |
| |
|
| (d)(9) |
Notification to Calamos Advisors LLC, regarding Establishment of Government Money Market Fund, dated May 8, 2007 (incorporated by reference to Exhibit (d)(9) to Post-Effective Amendment No. 54 to Registrant’s Registration Statement on Form N-1A, filed on May 16, 2007). |
| |
|
| (d)(10) |
Notification to Calamos Advisors LLC, regarding Establishment of Total Return Bond Fund, dated June 15, 2007 (incorporated by reference to Exhibit (d)(10) to Post-Effective Amendment No. 56 to Registrant’s Registration Statement on Form N-1A, filed on June 26, 2007). |
| |
|
| (d)(11) |
Notification to Calamos Advisors LLC, regarding Establishment of 130/30 Equity Growth Fund and New World Growth Fund, dated March 7, 2008 (incorporated by reference to Exhibit (d)(11) to Post-Effective Amendment No. 64 to Registrant’s Registration Statement on Form N-1A, filed on June 20, 2008). |
| |
|
| (d)(12) |
Notification to Calamos Advisors LLC, regarding Establishment of Emerging Market Equity Fund (incorporated by reference to Exhibit (d)(15) to Post-Effective Amendment No. 88 to Registrant’s Registration Statement on Form N-1A, filed on December 20, 2013). |
| |
|
| (d)(13) |
Notification to Calamos Advisors LLC, regarding Establishment of Global Convertible Fund and Hedged Equity Income Fund (incorporated by reference to Exhibit (d)(17) to Post-Effective Amendment No. 93 to Registrant’s Registration Statement on Form N-1A, filed on December 30, 2014). |
| |
|
| (d)(14) |
Notification to Calamos Advisors LLC, regarding Establishment of Phineus Long/Short Fund (incorporated by reference to Exhibit (d)(19) to Post-Effective Amendment No. 104 to Registrant’s Registration Statement on Form N-1A, filed on April 1, 2016). |
| |
|
| (d)(15) |
Notification to Calamos Advisors LLC, regarding Establishment of Short-Term Bond Fund (incorporated by reference to Exhibit (d)(18) to Post-Effective Amendment No. 117 to Registrant’s Registration Statement on Form N-1A, filed on August 28, 2018). |
| |
|
| (d)(16) |
Notification to Calamos Advisors LLC, regarding Establishment of Timpani Small Cap Growth Fund (incorporated by reference to Exhibit (d)(16) to Post-Effective Amendment No. 124 to Registrant’s Registration Statement on Form N-1A, filed on April 12, 2019). |
| (d)(18) |
Notification to Calamos Advisors LLC, regarding Establishment of Global Sustainable Equities Fund (incorporated by reference to Exhibit (d)(18) to Post-Effective Amendment No. 142 to Registrant's Registration Statement on Form N-1A, filed on February 23, 2022). |
| |
|
| (d)(19) |
Form of Notification to Calamos Advisors LLC, regarding Establishment of International Small Cap Growth Fund (incorporated by reference to Exhibit (d)(19) to Post-Effective Amendment No. 143 to Registrant’s Registration Statement on Form N-1A, filed on March 30, 2022). |
| |
|
| (d)(20) |
Notification to Calamos Advisors LLC, dated September 26, 2023, regarding Establishment of Merger Arbitrage Fund (filed herewith). |
| |
|
| (d)(21) |
Letter Agreement with Calamos Advisors LLC, dated December 19, 2013 (incorporated by reference to Exhibit (d)(16) to Post-Effective Amendment No. 88 to Registrant’s Registration Statement on Form N-1A, filed on December 20, 2013). |
| |
|
| (d)(22) |
Letter Agreement with Calamos Advisors LLC, dated March 26, 2010 (incorporated by reference to Exhibit (d)(13) to Post-Effective Amendment No. 73 to Registrant’s Registration Statement on Form N-1A, filed on June 1, 2010). |
| |
|
| (d)(23) |
Letter Agreement with Calamos Advisors LLC, dated December 15, 2015 (incorporated by reference to Exhibit (d)(9) to Post-Effective Amendment No. 104 to Registrant’s Registration Statement on Form N-1A, filed on April 1, 2016). |
| |
|
| (d)(24) |
Letter Agreement with Calamos Advisors LLC, dated June 21, 2017 (incorporated by reference to Exhibit (d)(21) to Post-Effective Amendment No. 110 to Registrant’s Registration Statement on Form N-1A, filed on July 10, 2017). |
| |
|
| (d)(25) |
Letter Agreement with Calamos Advisors LLC, dated June 29, 2018 (incorporated by reference to Exhibit (d)(23) to Post-Effective Amendment No. 117 to Registrant’s Registration Statement on Form N-1A, filed on August 28, 2018). |
| |
|
| (d)(26) |
Letter Agreement with Calamos Advisors LLC, dated March 12, 2019 (incorporated by reference to Exhibit (d)(22) to Post-Effective Amendment No. 124 to Registrant’s Registration Statement on Form N-1A, filed on April 12, 2019). |
| |
|
| (d)(27) |
Letter Agreement with Calamos Advisors LLC, dated July 9, 2019 (incorporated by reference to Exhibit (d)(24) to Post-Effective Amendment No. 129 to Registrant’s Registration Statement on Form N-1A, filed on July 31, 2019). |
| |
|
| (d)(28) |
Letter Agreement with Calamos Advisors LLC, dated December 14, 2021 (incorporated by reference to Exhibit (d)(26) to Post-Effective Amendment No. 142 to Registrant's Registration Statement on Form N-1A, filed on February 23, 2022). |
| |
|
| (d)(29) |
Form of Letter Agreement with Calamos Advisors LLC, dated March 23, 2022 (incorporated by reference to Exhibit (d)(28) to Post-Effective Amendment No. 143 to Registrant’s Registration Statement on Form N-1A, filed March 30, 2022. |
| |
|
| (d)(30) |
Letter Agreement with Calamos Advisors LLC, dated Setember 26, 2023 (filed herewith). |
| |
|
| (d)(31) |
Organizational Expenses Agreement, dated December 13, 2004, relating to International Growth Fund (incorporated by reference to Exhibit (d)(8) to Post-Effective Amendment No. 41 to Registrant’s Registration Statement on Form N-1A, filed July 28, 2005). |
| (d)(32) |
Organizational Expenses Agreement, dated March 30, 2006, relating to Multi-Fund Equity (incorporated by reference to Exhibit (d)(9) to Post-Effective Amendment No. 44 to Registrant’s Registration Statement on Form N-1A, filed on June 13, 2006). |
| |
|
| (d)(33) |
Organizational Expenses Agreement, dated as of March 1, 2007, relating to Global Equity Fund (incorporated by reference to Exhibit (d)(13) to Post-Effective Amendment No. 50 to Registrant’s Registration Statement on Form N-1A, filed on February 28, 2007). |
| (d)(34) |
Organizational Expenses Agreement, dated May 8, 2007, relating to Government Money Market Fund (incorporated by reference to Exhibit (d) (14) to Post-Effective Amendment No. 54 to Registrant’s Registration Statement on Form N-1A, filed on May 16, 2007). |
| |
|
| (d)(35) |
Organizational Expenses Agreement, dated June 15, 2007, relating to Total Return Bond Fund (incorporated by reference to Exhibit (d)(16) to Post-Effective Amendment No. 56 to Registrant’s Registration Statement on Form N-1A, filed on June 26, 2007). |
| |
|
| (d)(36) |
Organizational Expenses Agreement, dated March 7, 2008, relating to 130/30 Equity Growth Fund and New World Growth Fund (incorporated by reference to Exhibit (d)(18) to Post-Effective Amendment No. 64 to Registrant’s Registration Statement on Form N-1A, filed on June 20, 2008). |
| |
|
| (d)(37) |
Organizational Expenses Agreement, dated June 21, 2013, relating to Dividend Growth Fund (incorporated by reference to Exhibit (d)(25) to Post-Effective Amendment No. 85 to Registrant’s Registration Statement on Form N-1A, filed on August 2, 2013). |
| |
|
| (d)(38) |
Organizational Expenses Agreement, dated December 19, 2013, relating to Emerging Market Equity Fund (incorporated by reference to Exhibit (d)(28) to Post-Effective Amendment No. 88 to Registrant’s Registration Statement on Form N-1A, filed on December 20, 2013). |
| |
|
| (d)(39) |
Organizational Expenses Agreement, dated December 18, 2014, relating to Global Convertible and Hedged Equity Income Fund (incorporated by reference to Exhibit (d)(31) to Post-Effective Amendment No. 93 to Registrant’s Registration Statement on Form N-1A, filed on December 30, 2014). |
| |
|
| (d)(40) |
Organizational Expenses Agreement, dated December 15, 2015, relating to Phineus Long/Short Fund (incorporated by reference to Exhibit (d)(34) to Post-Effective Amendment No. 104 to Registrant’s Registration Statement on Form N-1A, filed on April 1, 2016). |
| |
|
| (d)(41) |
Organizational Expenses Agreement, dated June 29, 2018, relating to Short-Term Bond Fund (incorporated by reference to Exhibit (d)(34) to Post-Effective Amendment No. 117 to Registrant’s Registration Statement on Form N-1A, filed on August 28, 2018). |
| |
|
| (d)(42) |
Organizational Expenses Agreement, dated July 9, 2019, relating to Timpani SMID Growth Fund (incorporated by refence to Exhibit (d)(36) to Post-Effective Amendment No. 129 to Registrant’s Registration Statement on Form N-1A, filed on July 31, 2019). |
| |
|
| (d)(43) |
Organizational Expenses Agreement, dated September 26, 2023, relating to Merger Arbitrage Fund (filed herewith). |
| |
|
| (e)(1) |
Nineteenth Amended and Restated Distribution Agreement, dated September 26, 2023, with Calamos Financial Services LLC (filed herewith). |
| |
|
| (e)(2) |
Selling Group Agreement, revised September 2000 (incorporated by reference to Exhibit (e)(2) to Post-Effective Amendment No. 24 to Registrant’s Registration Statement on Form N-1A, filed on July 31, 2001). |
| |
|
| (f) |
None. |
| (g)(1) |
Master Custodian Agreement with State Street Bank and Trust Company, dated September 11, 2009 (incorporated by reference to Exhibit (g)(1) to Post-Effective Amendment No. 69 to Registrant’s Registration Statement on Form N-1A, filed on February 26, 2010). |
| |
|
| (g)(2) |
Notification of Additional Funds, dated December 16, 2009, pursuant to Master Custodian Agreement, dated as of September 11, 2009 (incorporated by reference to Exhibit (g)(2) to Post-Effective Amendment No. 73 to Registrant’s Registration Statement on Form N-1A, filed on June 1, 2010). |
| |
|
| (g)(3) |
Notification of Additional Funds, dated March 15, 2013, pursuant to Master Custodian Agreement, dated as of September 11, 2009 (incorporated by reference to Exhibit (g)(3) to Post-Effective Amendment No. 85 to Registrant’s Registration Statement on Form N-1A, filed on August 2, 2013). |
| |
|
| (g)(4) |
Notification of Additional Funds, dated July 26, 2013, pursuant to Master Custodian Agreement, dated as of September 11, 2009 (incorporated by reference to Exhibit (g)(4) to Post-Effective Amendment No. 85 to Registrant’s Registration Statement on Form N-1A, filed on August 2, 2013). |
| |
|
| (g)(5) |
Notification of Additional Funds, dated December 19, 2013, pursuant to Master Custodian Agreement, dated as of September 11, 2009 (incorporated by reference to Exhibit (g)(5) to Post-Effective Amendment No. 88 to Registrant’s Registration Statement on Form N-1A, filed on December 20, 2013). |
| |
|
| (g)(6) |
Notification of Additional Funds, dated December 18, 2014, pursuant to Master Custodian Agreement, dated as of September 11, 2009 (incorporated by reference to Exhibit (g)(6) to Post-Effective Amendment No. 93 to Registrant’s Registration Statement on Form N-1A, filed on December 30, 2014). |
| |
|
| (g)(7) |
Notification of Additional Fund, dated January 21, 2016, pursuant to Master Custodian Agreement, dated as of September 11, 2009 (incorporated by reference to Exhibit (g)(7) to Post-Effective Amendment No. 104 to Registrant’s Registration Statement on Form N-1A, filed on April 1, 2016). |
| |
|
| (g)(8) |
Notification of Additional Fund, dated June 29, 2018, pursuant to Master Custodian Agreement, dated as of September 11, 2009 (incorporated by reference to Exhibit (g)(8) to Post-Effective Amendment No. 117 to Registrant’s Registration Statement on Form N-1A, filed on August 28, 2018). |
| |
|
| (g)(9) |
Notification of Additional Fund, dated March 12, 2019, pursuant to Master Custodian Agreement, dated as of September 11, 2009 (incorporated by reference to Exhibit (g)(9) to Post-Effective Amendment No. 124 to Registrant’s Registration Statement on Form N-1A, filed on April 12, 2019). |
| |
|
| (g)(10) |
Notification of Additional Fund, dated July 9, 2019, pursuant to Master Custodian Agreement, dated as of September 11, 2009 (incorporated by reference to Exhibit (g)(10) to Post-Effective Amendment No. 129 to Registrant’s Registration Statement on Form N-1A, filed on July 31, 2019). |
| |
|
| (g)(11) |
Notification of Additional Fund, dated December 14, 2021, pursuant to Master Custodian Agreement, dated as of September 11, 2009 (incorporated by reference to Exhibit (g)(11) to Post-Effective Amendment No. 142 to Registrant's Registration Statement on Form N-1A, filed on February 23, 2022). |
| |
|
| (g)(12) |
Form of Notification of Additional Fund, dated March 23, 2022, pursuant to Master Custodian Agreement, dated as of September 11, 2009 (incorporated by reference to Exhibit (g)(12) to Post-Effective Amendment No. 143 to Registrant's Registration Statement on Form N-1A, filed on March 30, 2022). |
| |
|
| (g)(13) |
Notification of Additional Fund, dated October 31, 2022, pursuant to Master Custodian Agreement, dated as of September 11, 2009 (incorporated by reference to Exhibit (g)(13) to Post-Effective Amendment No. 144 to Registrant’s Registration Statement on Form N-1A, filed on February 24, 2023). |
| |
|
| (g)(14) |
Notification of Additional Fund, dated December 21, 2022, pursuant to Master Custodian Agreement, dated as of September 11, 2009 (incorporated by reference to Exhibit (g)(14) to Post-Effective Amendment No. 144 to Registrant’s Registration Statement on Form N-1A, filed on February 24, 2023). |
| (g)(15) |
Notification of Additional Funds, dated September 26, 2023, pursuant to Master Custodian Agreement, dated as of September 11, 2009 (filed herewith). |
| |
|
| (g)(16) |
Notification of Additional Funds, dated December 12, 2023, pursuant to Master Custodian Agreement, dated as of September 11, 2009 (filed herewith). |
| |
|
| (h)(1) |
Master Services Agreement, dated March 15, 2004, with State Street Bank and Trust Company (incorporated by reference to Exhibit (h)(1) to Post-Effective Amendment No. 44 to Registrant’s Registration Statement on Form N-1A, filed on June 13, 2006). |
| |
|
| (h)(2) |
Notification of Additional Funds, dated March 31, 2006, pursuant to Master Services Agreement, dated as of March 15, 2004 (incorporated by reference to Exhibit (h)(2) to Post-Effective Amendment No. 44 to Registrant’s Registration Statement on Form N-1A, filed on June 13, 2006). |
| |
|
| (h)(3) |
Notification of Additional Funds, dated February 28, 2007, pursuant to Master Services Agreement, dated as of March 15, 2004 (incorporated by reference to Exhibit (h)(3) to Post-Effective Amendment No. 50 to Registrant’s Registration Statement on Form N-1A, filed on February 28, 2007). |
| |
|
| (h)(4) |
Notification of Additional Funds, dated May 8, 2007, pursuant to Master Services Agreement, dated as of March 15, 2004 (incorporated by reference to Exhibit (h)(4) to Post-Effective Amendment No. 56 to Registrant’s Registration Statement on Form N-1A, filed on June 26, 2007). |
| |
|
| (h)(5) |
Notification of Additional Funds, dated June 15, 2007 pursuant to Master Services Agreement, dated as of March 15, 2004 (incorporated by reference to Exhibit (h)(5) to Post-Effective Amendment No. 56 to Registrant’s Registration Statement on Form N-1A, filed on June 26, 2007). |
| |
|
| (h)(6) |
Notification of Additional Funds, dated March 7, 2008, pursuant to Master Services Agreement, dated as of March 15, 2004 (incorporated by reference to Exhibit (h)(6) to Post-Effective Amendment No. 64 to Registrant’s Registration Statement on Form N-1A, filed on June 20, 2008). |
| |
|
| (h)(7) |
Notification of Additional Funds, dated December 16, 2009, pursuant to Master Services Agreement, dated as of March 15, 2004 (incorporated by reference to Exhibit (h)(7) to Post-Effective Amendment No. 73 to Registrant’s Registration Statement on Form N-1A, filed on June 1, 2010). |
| |
|
| (h)(8) |
Notification of Additional Funds, dated March 15, 2013, pursuant to Master Services Agreement, dated as of March 15, 2004 (incorporated by reference to Exhibit (h)(8) to Post-Effective Amendment No. 83 to Registrant’s Registration Statement on Form N-1A, filed on May 31, 2013). |
| |
|
| (h)(9) |
Notification of Additional Funds, dated June 21, 2013, pursuant to Master Services Agreement dated March 15, 2004 (incorporated by reference to Exhibit (h)(9) to Post-Effective Amendment No. 85 to Registrant’s Registration Statement on Form N-1A, filed on August 2, 2013). |
| |
|
| (h)(10) |
Notification of Additional Funds, dated December 19, 2013, pursuant to Master Services Agreement, dated as of March 15, 2004 (incorporated by reference to Exhibit (h)(10) to Post-Effective Amendment No. 88 to Registrant’s Registration Statement on Form N-1A, filed on December 20, 2013). |
| |
|
| (h)(11) |
Notification of Additional Funds, dated December 18, 2014, pursuant to Master Services Agreement, dated as of March 15, 2004 (incorporated by reference to Exhibit (h)(11) to Post-Effective Amendment No. 93 to Registrant’s Registration Statement on Form N-1A, filed on December 30, 2014). |
| |
|
| (h)(12) |
Notification of Additional Fund, dated January 21, 2016, pursuant to Master Services Agreement, dated as of March 15, 2004 (incorporated by reference to Exhibit (h)(12) to Post-Effective Amendment No. 104 to Registrant’s Registration Statement on Form N-1A, filed on April 1, 2016). |
| |
|
| (h)(13) |
Notification of Additional Fund, dated June 29, 2018, pursuant to Master Services Agreement, dated as of March 15, 2004 (incorporated by reference to Exhibit (h)(13) to Post-Effective Amendment No. 117 to Registrant’s Registration Statement on Form N-1A, filed on August 28, 2018). |
| (h)(14) |
Notification of Additional Fund, dated March 12, 2019, pursuant to Master Services Agreement, dated as of March 15, 2004 (incorporated by reference to Exhibit (h)(14) to Post-Effective Amendment No. 124 to Registrant’s Registration Statement on Form N-1A, filed on April 12, 2019). |
| |
|
| (h)(15) |
Notification of Additional Fund, dated July 9, 2019, pursuant to Master Services Agreement, dated as of March 15, 2004 (incorporated by reference to Exhibit (h)(15) to Post-Effective Amendment No. 129 to Registrant’s Registration Statement on Form N-1A, filed on July 31, 2019). |
| |
|
| (h)(16) |
Notification of Additional Fund, dated December 14, 2021, pursuant to Master Services Agreement, dated as of March 15, 2004 (incorporated by reference to Exhibit (h)(16) to Post-Effective Amendment No. 142 to Registrant's Registration Statement on Form N-1A, filed on February 23, 2022). |
| |
|
| (h)(17) |
Form of Notification of Additional Fund, dated March 23, 2022, pursuant to Master Services Agreement, dated as of March 15, 2004 (incorporated by reference to Exhibit (h)(17) to Post-Effective Amendment No. 143 to Registrant's Registration Statement on Form N-1A, filed on March 30, 2022). |
| |
|
| (h)(18) |
Notification of Additional Fund, dated October 31, 2022, pursuant to Master Services Agreement, dated as of March 15, 2004 (incorporated by reference to Exhibit (h)(17)(i) to Post-Effective Amendment No. 144 to Registrant’s Registration Statement on Form N-1A, filed on February 24, 2023). |
| |
|
| (h)(19) |
Notification of Additional Fund, dated December 21, 2022, pursuant to Master Services Agreement, dated as of March 15, 2004 (incorporated by reference to Exhibit (h)(17)(ii) to Post-Effective Amendment No. 144 to Registrant’s Registration Statement on Form N-1A, filed on February 24, 2023). |
| |
|
| (h)(20) |
Notification of Additional Funds, dated September 26, 2023, pursuant to Master Services Agreement, dated as of March 15, 2004 (filed herewith). |
| |
|
| (h)(21) |
Notification of Additional Funds, dated December 12, 2023, pursuant to Master Services Agreement, dated as of March 15, 2004 (filed herewith). |
| |
|
| (h)(22) |
Letter Agreement, dated March 15, 2004, with State Street Bank and Trust Company (incorporated by reference to Exhibit (h)(3) to Post-Effective Amendment No. 44 to Registrant’s Registration Statement on Form N-1A, filed on June 13, 2006). |
| |
|
| (h)(23) |
Letter Agreement, dated October 31, 2004, with State Street Bank and Trust Company (incorporated by reference to Exhibit (h) (4) to Post-Effective Amendment No. 44 to Registrant’s Registration Statement on Form N-1A, filed on June 13, 2006). |
| |
|
| (h)(24) |
Letter Agreement, dated March 31, 2006, with State Street Bank and Trust Company (incorporated by reference to Exhibit (h)(5) to Post-Effective Amendment No. 44 to Registrant’s Registration Statement on Form N-1A, filed on June 13, 2006). |
| |
|
| (h)(25) |
Letter Agreement, dated February 28, 2007, with State Street Bank and Trust Company (incorporated by reference to Exhibit (h) (8) to Post-Effective Amendment No. 50 to Registrant’s Registration Statement on Form N-1A, filed on February 28, 2007). |
| |
|
| (h)(26) |
Letter Agreement, dated May 8, 2007, with State Street Bank and Trust Company (incorporated by reference to Exhibit (h)(10) to Post-Effective Amendment No. 56 to Registrant’s Registration Statement on Form N-1A, filed on June 26, 2007). |
| |
|
| (h)(27) |
Letter Agreement, dated September 16, 2009, with State Street Bank and Trust Company (incorporated by reference to Exhibit (h)(12) to Post-Effective Amendment No. 69 to Registrant’s Registration Statement on Form N-1A, filed on February 26, 2010). |
| |
|
| (h)(28) |
Second Amended and Restated Transfer Agent Servicing Agreement by and among Calamos Investment Trust, Calamos Advisors Trust and U.S. Bancorp Fund Services, LLC dated October 31, 2022 (incorporated by reference to Exhibit (h)(24) to Post-Effective Amendment No. 144 to Registrant’s Registration Statement on Form N-1A, filed on February 24, 2023). |
| |
|
| (h)(29) |
First Amendment to the Second Amended and Restated Transfer Agent Servicing Agreement by and among Calamos Investment Trust, Calamos Advisors Trust, Calamos Antetokounmpo Sustainable Equities Trust and U.S. Bancorp Fund Services, LLC, dated September 28, 2023 (filed herewith). |
| (h)(30) |
Amendment, dated July 5, 2017, to Amended and Restated Transfer Agent Servicing Agreement by and among Calamos Investment Trust, Calamos Advisors Trust and U.S. Bancorp Fund Services, LLC dated January 1, 2017 (incorporated by reference to Exhibit (h)(20) to Post-Effective Amendment No. 113 to Registrant’s Registration Statement on Form N-1A, filed on February 23, 2018). |
| |
|
| (h)(31) |
Amendment, dated June 29, 2018, to Amended and Restated Transfer Agent Servicing Agreement by and among Calamos Investment Trust, Calamos Advisors Trust and U.S. Bancorp Fund Services, LLC dated January 1, 2017 (incorporated by reference to Exhibit (h)(22) to Post-Effective Amendment No. 117 to Registrant’s Registration Statement on Form N-1A, filed on August 28, 2018). |
| |
|
| (h)(32) |
Amendment, dated March 12, 2019, to Amended and Restated Transfer Agent Servicing Agreement by and among Calamos Investment Trust, Calamos Advisors Trust and U.S. Bancorp Fund Services, LLC dated January 1, 2017 (incorporated by reference to Exhibit (h)(24) to Post-Effective Amendment No. 124 to Registrant’s Registration Statement on Form N-1A, filed on April 12, 2019). |
| |
|
| (h)(33) |
Amendment, dated July 9, 2019, to Amended and Restated Transfer Agent Servicing Agreement by and among Calamos Investment Trust, Calamos Advisors Trust and U.S. Bancorp Fund Services, LLC dated January 1, 2017 (incorporated by reference to Exhibit (h)(26) to Post-Effective Amendment No. 129 to Registrant’s Registration Statement on Form N-1A, filed on July 31, 2019). |
| |
|
| (h)(34) |
Amendment, dated June 30, 2021, to Amended and Restated Transfer Agent Servicing Agreement by and among Calamos Investment Trust, Calamos Advisors Trust and U.S. Bancorp Fund Services, LLC dated January 1, 2017 (incorporated by reference to Exhibit (h)(27) to Post-Effective Amendment No. 139 to Registrant’s Registration Statement on Form N-1A, filed on September 30, 2021). |
| |
|
| (h)(35) |
Amendment, dated December 14, 2021, to Amended and Restated Transfer Agent Servicing Agreement by and among Calamos Investment Trust, Calamos Advisors Trust and U.S. Bancorp Fund Services, LLC dated January 1, 2017 (incorporated by reference to Exhibit (h)(29) to Post-Effective Amendment No. 140 to Registrant’s Registration Statement on Form N-1A, filed on December 14, 2021). |
| |
|
| (h)(36) |
Form of Amendment, dated March 23, 2022, to Amended and Restated Transfer Agent Servicing Agreement by and among Calamos Investment Trust, Calamos Advisors Trust and U.S. Bancorp Fund Services, LLC dated January 1, 2017 (incorporated by reference to Exhibit (h)(31) to Post-Effective Amendment No. 143 to Registrant’s Registration Statement on Form N-1A, file on March 30, 2022). |
| |
|
| (h)(37) |
Administration Servicing Agreement with Firstar Mutual Fund Services, LLC, dated September 21, 2000 (incorporated herein by reference to Exhibit (h)(4) to Post-Effective Amendment No. 24 to Registrant’s Registration Statement on Form N-1A, filed on July 31, 2001). |
| |
|
| (h)(38) |
Amendment, dated March 30, 2006, to Administration Servicing Agreement with Firstar Mutual Fund Services, LLC, dated September 21, 2000 (incorporated by reference to Exhibit (h)(15) to Post-Effective Amendment No. 44 to Registrant’s Registration Statement on Form N-1A, filed on June 13, 2006). |
| |
|
| (h)(39) |
Amendment, dated as of March 1, 2007, to Administration Servicing Agreement with Firstar Mutual Fund Services, LLC, dated as of September 21, 2000 (incorporated by reference to Exhibit (h)(17) to Post-Effective Amendment No. 50 to Registrant’s Registration Statement on Form N-1A, filed on February 28, 2007). |
| |
|
| (h)(40) |
Amendment, dated May 8, 2007, to Administration Servicing Agreement with Firstar Mutual Fund Services, LLC, dated September 21, 2000 (incorporated by reference to Exhibit (h)(23) to Post-Effective Amendment No. 56 to Registrant’s Registration Statement on Form N-1A, filed on June 26, 2007). |
| |
|
| (h)(41) |
Amendment, dated June 15, 2007, to Administration Servicing Agreement with Firstar Mutual Fund Services, LLC, dated September 11, 2000 (incorporated by reference to Exhibit (h)(24) to Post-Effective Amendment No. 56 to Registrant’s Registration Statement on Form N-1A, filed on June 26, 2007). |
| (h)(42) |
Amendment, dated March 7, 2008, to Administration Servicing Agreement with Firstar Mutual Fund Services, LLC, dated September 11, 2000 (incorporated by reference to Exhibit (h)(28) to Post-Effective Amendment No. 64 to Registrant’s Registration Statement on Form N-1A, filed on June 20, 2008). |
| |
|
| (h)(43) |
Amendment, dated September 16, 2009, to Administration Servicing Agreement with Firstar Mutual Fund Services, LLC, dated September 11, 2000 (incorporated by reference to Exhibit (h)(30) to Post-Effective Amendment No. 69 to Registrant’s Registration Statement on Form N-1A, filed on February 26, 2010). |
| |
|
| (h)(44) |
Amendment, dated December 16, 2009, to Administration Servicing Agreement with Firstar Mutual Fund Services, LLC, dated September 11, 2000 (incorporated by reference to Exhibit (h)(34) to Post-Effective Amendment No. 73 to Registrant’s Registration Statement on Form N-1A, filed on June 1, 2010). |
| |
|
| (h)(45) |
Amendment, dated March 15, 2013, to Administration Servicing Agreement with U.S. Bancorp Fund Services, LLC, formerly known as Firstar Mutual Fund Services, LLC, dated September 11, 2000 (incorporated by reference to Exhibit (h)(41) to Post-Effective Amendment No. 85 to Registrant’s Registration Statement on Form N-1A, filed on August 2, 2013). |
| |
|
| (h)(46) |
Amendment, dated June 21, 2013, to Administration Servicing Agreement with U.S. Bancorp Fund Services, LLC, formerly known as Firstar Mutual Fund Services, LLC, dated September 11, 2000 (incorporated by reference to Exhibit (h)(42) to Post-Effective Amendment No. 85 to Registrant’s Registration Statement on Form N-1A, filed on August 2, 2013). |
| |
|
| (h)(47) |
Amendment, dated December 19, 2013, to Administration Servicing Agreement with U.S. Bancorp Fund Services, LLC, formerly known as Firstar Mutual Fund Services, LLC, dated September 21, 2000 (incorporated by reference to Exhibit (h)(46) to Post-Effective Amendment No. 88 to Registrant’s Registration Statement on Form N-1A, filed on December 20, 2013). |
| |
|
| (h)(48) |
Amendment, dated December 18, 2014, to Administration Servicing Agreement with U.S. Bancorp Fund Services, LLC, formerly known as Firstar Mutual Fund Services, LLC, dated September 21, 2000 (incorporated by reference to Exhibit (h)(41) to Post-Effective Amendment No. 93 to Registrant’s Registration Statement on Form N-1A, filed on December 30, 2014). |
| |
|
| (h)(49) |
Amendment, dated March 21, 2016, to Administration Servicing Agreement with U.S. Bancorp Fund Services, LLC, formerly known as Firstar Mutual Fund Services, LLC, dated September 21, 2000 (incorporated by reference to Exhibit (h)(43) to Post-Effective Amendment No. 104 to Registrant’s Registration Statement on Form N-1A, filed on April 1, 2016). |
| |
|
| (h)(50) |
Amendment, dated July 9, 2019, to Administration Servicing Agreement with U.S. Bancorp Fund Services, LLC, formerly known as Firstar Mutual Fund Services, LLC, dated September 21, 2000 (incorporated by reference to Exhibit (h)(40) to Post-Effective Amendment No. 129 to Registrant’s Registration Statement on Form N-1A, filed on July 31, 2019). |
| |
|
| (h)(51) |
Amendment, dated November 10, 2022, to Administration Servicing Agreement with U.S. Bancorp Fund Services, LLC, formerly known as Firstar Mutual Fund Services, LLC, dated September 21, 2000 (incorporated by reference to Exhibit (h)(45)(i) to Post-Effective Amendment No. 144 to Registrant’s Registration Statement on Form N-1A, filed on February 24, 2023). |
| (h)(52) |
Use of Name Agreement, dated August 23, 1990 (incorporated herein by reference to Exhibit 9.5 to Post-Effective Amendment No. 18 to Registrant’s Registration Statement on Form N-1A, filed on June 24, 1997). |
| |
|
| (h)(53) |
Administration Agreement, effective November 1, 2018, with State Street Bank and Trust Company (incorporated by reference to Exhibit (h)(37) to Post-Effective Amendment No. 122 to Registrant’s Registration Statement on Form N-1A, filed on February 22, 2019). |
| |
|
| (h)(54) |
Amendment, dated January 25, 2023, to Administration Agreement, effective November 1, 2018, with State Street Bank and Trust Company (incorporated by reference to Exhibit (h)(47)(i) to Post-Effective Amendment No. 144 to Registrant’s Registration Statement on Form N-1A, filed on February 24, 2023). |
| |
|
| (h)(55) |
Amendment, dated October 3, 2023, to Administration Agreement, effective November 1, 2018, with State Street Bank and Trust Company (filed herewith). |
| |
|
| (h)(56) |
Notification of Additional Fund, dated March 12, 2019, pursuant to Administration Agreement, effective November 1, 2018 (incorporated by reference to Exhibit (h)(43) to Post-Effective Amendment No. 129 to Registrant’s Registration Statement on Form N-1A, filed on July 31, 2019). |
| |
|
| (h)(57) |
Notification of Additional Fund, dated July 9, 2019, pursuant to Administration Agreement, effective November 1, 2018 (incorporated by reference to Exhibit (h)(44) to Post-Effective Amendment No. 129 to Registrant’s Registration Statement on Form N-1A, filed on July 31, 2019). |
| |
|
| (h)(58) |
Notification of Additional Registrant, dated October 31, 2022, pursuant to Administration Agreement, effective November 1, 2018 (incorporated by reference to Exhibit (h)(49)(i) to Post-Effective Amendment No. 144 to Registrant’s Registration Statement on Form N-1A, filed on February 24, 2023). |
| |
|
| (h)(59) |
Notification of Additional Registrant, dated December 21, 2022 and effective January 1, 2023, pursuant to Administration Agreement, effective November 1, 2018 (incorporated by reference to Exhibit (h)(49)(ii) to Post-Effective Amendment No. 144 to Registrant’s Registration Statement on Form N-1A, filed on February 24, 2023). |
| |
|
| (h)(60) |
Notification of Additional Funds, dated January 4, 2024, pursuant to Administration Agreement, effective November 1, 2018 (filed herewith). |
| |
|
| (h)(61) |
Master Services Agreement, effective as of October 16, 2023, with Ernst & Young LLP (filed herewith). |
| |
|
| (h)(62) |
Expense Limitation Agreement, dated June 29, 2022 (incorporated by reference to Exhibit (h)(51) to Post-Effective Amendment No. 144 to Registrant’s Registration Statement on Form N-1A, filed on February 24, 2023). |
| |
|
| (h)(63) |
Expense Limitation Agreement, dated September 26, 2023, regarding Calamos Merger Arbitrage Fund (filed herewith). |
| (h)(64) |
Fund of Funds Investment Agreement dated January 19, 2022 with SPDR Series Trust, SPDR Index Shares Funds and SSGA Active Trust (incorporated by reference to Exhibit (h)(52) to Post-Effective Amendment No. 144 to Registrant’s Registration Statement on Form N-1A, filed on February 24, 2023). |
| |
|
| (h)(65) |
Fund of Funds Investment Agreement dated January 19, 2022 with SPDR S&P 500 ETF Trust and SPDR Dow Jones Industrial Average ETF Trust (incorporated by reference to Exhibit (h)(53) to Post-Effective Amendment No. 144 to Registrant’s Registration Statement on Form N-1A, filed on February 24, 2023). |
| |
|
| (h)(66) |
Rule 12d1-4 Fund of Funds Investment Agreement dated January 19, 2022 with Vanguard Funds (incorporated by reference to Exhibit (h)(54) to Post-Effective Amendment No. 144 to Registrant’s Registration Statement on Form N-1A, filed on February 24, 2023). |
| |
|
| (h)(67) |
BlackRock Rule 12d1-4 Fund of Funds Investment Agreement dated January 19, 2022 with BlackRock ETF Trust, BlackRock ETF Trust II, iShares Trust, iShares, Inc., and iShares U.S. ETF Trust (incorporated by reference to Exhibit (h)(55) to Post-Effective Amendment No. 144 to Registrant’s Registration Statement on Form N-1A, filed on February 24, 2023 ). |
| |
|
| (h)(68) |
Fund of Funds Investment Agreement dated January 19, 2022 with The Select Sector SPDR Trust (incorporated by reference to Exhibit (h)(56) to Post-Effective Amendment No. 144 to Registrant’s Registration Statement on Form N-1A, filed on February 24, 2023 ). |
| |
|
| (h)(69) |
Fund of Funds Investment Agreement dated January 19, 2022 with John Hancock Variable Insurance Trust and John Hancock Funds II (incorporated by reference to Exhibit (h)(57) to Post-Effective Amendment No. 144 to Registrant’s Registration Statement on Form N-1A, filed on February 24, 2023). |
| |
|
| (h)(70) |
Rule 12d1-4 Fund of Funds Investment Agreement dated January 19, 2022 with Invesco QQQ Trust, Series 1 (incorporated by reference to Exhibit (h)(58) to Post-Effective Amendment No. 144 to Registrant’s Registration Statement on Form N-1A, filed on February 24, 2023). |
| |
|
| (h)(71) |
Rule 12d1-4 Fund of Funds Investment Agreement dated January 19, 2022 with MidCap SPDR Trust, Series 1 (incorporated by reference to Exhibit (h)(59) to Post-Effective Amendment No. 144 to Registrant’s Registration Statement on Form N-1A, filed on February 24, 2023). |
| |
|
| (h)(72) |
Rule 12d1-4 Fund of Funds Investment Agreement dated January 19, 2022 with Invesco Exchange-Traded Fund Trust, Invesco Exchange-Traded Fund Trust II, lnvesco India Exchange-Traded Fund Trust, Invesco Actively Managed Exchange-Traded Trust, Invesco Actively Managed Exchange-Traded Commodity Fund Trust and Invesco Exchange-Traded Self-Indexed Fund Trust (incorporated by reference to Exhibit (h)(60) to Post-Effective Amendment No. 144 to Registrant’s Registration Statement on Form N-1A, filed on February 24, 2023). |
| |
|
| (h)(73) |
Rule 12d1-4 Fund of Funds Investment Agreement dated December 13, 2023, with Advanced Series Trust (filed herewith). |
| |
|
| (i) |
Opinion and Consent of Ropes & Gray LLP (filed herewith). |
| |
|
| (j) |
Consent of Independent Registered Public Accounting Firm for Calamos Investment Trust (filed herewith). |
| |
|
| (k) |
None. |
| |
|
| (l)(1) |
Subscription Agreement — Calamos Global Convertible Fund, dated June 11, 1996 (incorporated herein by reference to Exhibit 13.5 to Post-Effective Amendment No. 14 to Registrant’s Registration Statement on Form N-1A, filed June 24, 1996). |
| |
|
| (l)(2) |
Subscription Agreement — Calamos Convertible Growth and Income Fund, dated July 5, 1988 (incorporated herein by reference to Exhibit (13.1) to Post-Effective Amendment No. 18 to Registrant’s Registration Statement on Form N-1A, filed on June 24, 1997). |
| (l)(3) |
Subscription Agreement — Calamos Market Neutral Fund and Calamos Growth Fund (incorporated herein by reference to Exhibit (13.3) to Post-Effective Amendment No. 18 to Registrant’s Registration Statement on Form N-1A, filed on June 24, 1997). |
| |
|
| (l)(4) |
Subscription Agreement — Calamos Convertible Technology Fund (incorporated herein by reference to Exhibit (l) to Post-Effective Amendment No. 21 to Registrant’s Registration Statement on Form N-1A, filed on July 30, 2000). |
| |
|
| (l)(5) |
Subscription Agreement — Calamos Opportunistic Value Fund, dated December 28, 2001 (incorporated herein by reference to Exhibit (l)(6) to Post-Effective Amendment No. 29 to Registrant’s Registration Statement on Form N-1A, filed on May 31, 2002). |
| |
|
| (l)(6) |
Subscription Agreement — Calamos International Growth Fund, dated December 13, 2004, with Calamos Investments LLC (incorporated herein by reference to Exhibit (l)(8) to Post-Effective Amendment No. 41 to Registrant’s Registration Statement on Form N-1A, filed July 28, 2005). |
| |
|
| (l)(7) |
Subscription Agreement — Calamos International Growth Fund, dated December 13, 2004, with Calamos Family Partners Inc. (incorporated herein by reference to Exhibit (l)(9) to Post-Effective Amendment No. 41 to Registrant’s Registration Statement on Form N-1A, filed July 28, 2005). |
| |
|
| (l)(8) |
Subscription Agreement — Calamos Global Equity Fund, dated as of March 1, 2007, with Calamos Advisors LLC (incorporated by reference to Exhibit (l)(10) to Post-Effective Amendment No. 50 to Registrant’s Registration Statement on Form N-1A, filed on February 28, 2007). |
| |
|
| (l)(9) |
Subscription Agreement — Calamos 130/30 Equity Fund, dated as of June 20, 2008, with Calamos Advisors LLC (incorporated by reference to Exhibit (l)(10) to Post-Effective Amendment No. 64 to Registrant’s Registration Statement on Form N-1A, filed on June 20, 2008). |
| |
|
| (l)(10) |
Subscription Agreement --- Calamos New World Growth Fund, dated as of August 15, 2008, with Calamos Advisors LLC (incorporated by reference to Exhibit (l)(11) to Post-Effective Amendment No. 74 to Registrant’s Registration Statement on Form N-1A, filed on February 25, 2011). |
| |
|
| (l)(11) |
Form of Subscription Agreement --- Calamos Merger Arbitrage Fund, dated as of September 26, 2023, with Calamos Advisors LLC (incorporated by reference to Exhibit (l)(11) to Post-Effective Amendment No. 149 to Registrant’s Registration Statement on Form N-1A, filed on September 27, 2023). |
| |
|
| (m) |
Twenty-First Amended and Restated Distribution Plan (filed herewith). |
| |
|
| (n) |
Amended and Restated Plan Pursuant to Rule 18f-3(d) under the Investment Company Act of 1940 (incorporated by reference to Exhibit (n) to Post-Effective Amendment No. 122 to Registrant’s Registration Statement on Form N-1A, filed on February 22, 2019). |
| |
|
| (o) |
[Item Omitted]. |
| |
|
| (p) |
Code of Ethics and Insider Trading Policy of Registrant, its investment adviser, distributor and affiliated entities, dated December 12, 2023 (filed herewith). |
| |
|
| (q)(1)(a) |
Powers of Attorney (incorporated by reference to Exhibit (q) to Post-Effective Amendment No. 97 to Registrant’s Registration Statement on Form N-1A, filed on November 6, 2015). |
| |
|
| (q)(1)(b) |
Power of Attorney (incorporated by reference to Exhibit (q)(1)(b) to Post-Effective Amendment No. 117 to Registrant’s Registration Statement on Form N-1A, filed on August 28, 2018). |
| (q)(1)(c) |
Powers of Attorney (incorporated by reference to Exhibit (q)(1)(c) to Post-Effective Amendment No. 131 to Registrant’s Registration Statement on Form N-1A, filed on February 24, 2020). |
| |
|
| (q)(2) |
Audited financial statements for the fiscal year ending December 31, 2014 for Phineus Voyager, L.P. (incorporated by reference to Appendix B of the Statement of Additional Information part of the Registration Statement on Form N-1A, filed on April 1, 2016). |
| |
|
| (q)(3) |
Unaudited Schedule of Investments for the fiscal year ending December 31, 2014 for Phineus Voyager, L.P. (incorporated by reference to Appendix B of the Statement of Additional Information part of the Registration Statement on Form N-1A, filed on April 1, 2016). |
| |
|
| (q)(4) |
Unaudited financial statements for the fiscal period ending June 30, 2015 for Phineus Voyager, L.P. (incorporated by reference to Appendix B of the Statement of Additional Information part of the Registration Statement on Form N-1A, filed on April 1, 2016). |
| |
|
| (q)(5) |
Unaudited Schedule of Investments for the fiscal period ending June 30, 2015 for Phineus Voyager, L.P. (incorporated by reference to Appendix B of the Statement of Additional Information part of the Registration Statement on Form N-1A, filed on April 1, 2016). |
| |
|
| (q)(6) |
Audited financial statements for the fiscal year ending December 31, 2015 for Phineus Voyager, L.P. (incorporated by reference to Appendix B of the Statement of Additional Information part of the Registration Statement on Form N-1A, filed on April 1, 2016). |
| ITEM 29. |
PERSONS CONTROLLED BY OR UNDER COMMON CONTROL WITH THE REGISTRANT. |
The information in the prospectus,
under the caption “Who Manages the Fund?” and in the Statement of Additional Information under the captions “Management”
and “Control Persons and Principal Shareholders” is incorporated herein by reference.
| ITEM 30. |
INDEMNIFICATION. |
Article VI of the Fourth
Amended Agreement and Declaration of Trust of Registrant (Exhibit (a) to this registration statement, which is incorporated
herein by reference) provides that the Trust shall indemnify (from the assets of the Sub-Trust or Sub-Trusts in question) each of its
Trustees and officers (including persons who serve at the Trust’s request as directors, officers or trustees of another organization
in which the Trust has any interest as a shareholder, creditor or otherwise (hereinafter referred to as a “Covered Person”))
against all liabilities, including but not limited to amounts paid in satisfaction of judgments, in compromise or as fines and penalties,
and expenses, including reasonable accountants’ and counsel fees, incurred by any Covered Person in connection with the defense
or disposition of any action, suit or other proceeding, whether civil or criminal, before any court or administrative or legislative body,
in which such Covered Person may be or may have been involved as a party or otherwise or with which such person may be or may have been
threatened, while in office or thereafter, by reason of being or having been such a Trustee or officer, director or trustee, except with
respect to any matter as to which it has been determined, in one of the manners described below, that such Covered Person (i) did
not act in good faith in the reasonable belief that such Covered Person’s action was in or not opposed to the best interests of
the Trust or (ii) had acted with willful misfeasance, bad faith, gross negligence or reckless disregard of the duties involved in
the conduct of such Covered Person’s office (either and both of the conduct described in (i) and (ii) being referred to
hereafter as “Disabling Conduct”).
A determination that a Covered
Person is entitled to indemnification despite allegations of Disabling Conduct may be made by (i) a final decision on the merits
by a court or other body before whom the proceeding was brought that the person to be indemnified was not liable by reason of Disabling
Conduct, (ii) dismissal of a court action or an administrative proceeding against a Covered Person for insufficiency of evidence
of Disabling Conduct, or (iii) a reasonable determination, based upon a review of the facts, that the indemnitee was not liable by
reason of Disabling Conduct by (a) a vote of a majority of a quorum of Trustees who are neither “interested persons”
of the Trust as defined in section 2(a)(19) of the Investment Company Act of 1940 nor parties to the proceeding, or (b) an independent
legal counsel in a written opinion.
Expenses, including accountants’
and counsel fees so incurred by any such Covered Person (but excluding amounts paid in satisfaction of judgments, in compromise or as
fines or penalties), may be paid from time to time in advance of the final disposition of any such action, suit or proceeding, provided
that the Covered Person shall have undertaken to repay the amounts so paid to the Sub-Trust in question if it is ultimately determined
that indemnification of such expenses is not authorized under this Article VI and (i) the Covered Person shall have provided
security for such undertaking, (ii) the Trust shall be insured against losses arising by reason or any lawful advances, or (iii) a
majority of a quorum of the disinterested Trustees who are not a party to the proceeding, or an independent legal counsel in a written
opinion, shall have determined, based on a review of readily available facts (as opposed to a full trial-type inquiry), that there is
reason to believe that the Covered Party ultimately will be found to be entitled to indemnification.
The registrant, its trustees
and officers, its investment adviser, the other investment companies advised by the adviser and certain persons affiliated with them are
insured, within the limits and subject to the limitations of the insurance, against certain expenses in connection with the defense of
actions, suits or proceedings, and certain liabilities that might be imposed as a result of such actions, suits or proceedings. The insurance
expressly excludes coverage for any trustee or officer whose personal dishonesty, fraudulent breach of trust, lack of good faith, or intention
to deceive or defraud has been finally adjudicated or may be established or who willfully fails to act prudently.
Insofar as indemnification
for liabilities arising under the Securities Act of 1933 (the “Securities Act”) may be permitted to trustees, officers, and
controlling persons of the Registrant pursuant to the foregoing provisions, or otherwise, the Registrant has been advised that in the
opinion of the Securities and Exchange Commission such indemnification is against public policy as expressed in the Securities Act and
is, therefore, unenforceable. In the event that a claim for indemnification against such liabilities (other than the payment by the Registrant
of expenses incurred or paid by a trustee, officer, or controlling person of the Registrant in the successful defense of any action, suit,
or proceeding) is asserted by such trustee, officer, or controlling person in connection with the securities being registered, the Registrant
will, unless in the opinion of its counsel the matter has been settled by controlling precedent, submit to a court of appropriate jurisdiction
the question whether such indemnification by it is against public policy as expressed in the Securities Act and will be governed by the
final adjudication of such issue.
| ITEM 31. |
BUSINESS AND OTHER CONNECTION OF THE INVESTMENT ADVISER. |
The information in the Statement of Additional
Information under the captions “Management” and “Investment Advisory Services” is incorporated by reference.
| ITEM 32. |
PRINCIPAL UNDERWRITERS. |
| (a) |
Calamos Financial Services LLC (“CFS”) serves as principal underwriter for the Calamos Investment Trust, Calamos Advisors Trust, Calamos Antetokounmpo Sustainable Equities Trust, and Calamos ETF Trust. |
| (b) |
Information on the officers of CFS is set forth below. CFS has no directors. The principal business address for all named individuals, except Mr. Ojala, is 2020 Calamos Court, Naperville, Illinois 60563. Mr. Ojala’s principal business address is 215 North Peoria Street, Chicago, Illinois 60607. |
| Name |
|
Position with Underwriter |
|
Position with Registrant |
| John S. Koudounis |
|
President and Chief Executive Officer |
|
Vice President |
| Robert F. Behan |
|
Principal Executive Officer and Chief Distribution Officer |
|
Vice President |
| Daniel Dufresne |
|
Executive Vice President, Chief Operating Officer |
|
Vice President |
| Christian A. Helmetag |
|
Principal Financial Officer and Principal Operations Officer |
|
None |
| Erik D. Ojala |
|
General Counsel and Secretary |
|
Vice President and Secretary |
| Jacqueline E. Sinker |
|
Chief Compliance Officer |
|
None |
| (c) |
There are no commissions or other compensation received from the Registrant directly or indirectly, by any principal underwriter who is not an affiliated person of the Registrant or an affiliated person of an affiliated person. |
| ITEM 33. |
LOCATION OF ACCOUNTS AND RECORDS. |
All such accounts, books,
and other documents are maintained at the offices of the Registrant, at the offices of the Registrant’s investment manager, Calamos
Advisors LLC, and CFS, the Registrant’s principal underwriter, 2020 Calamos Court, Naperville, Illinois 60563, at the offices
of the custodian, State Street Bank and Trust Company, 1 Lincoln Street, Boston, Massachusetts, 02111, or at the offices of the transfer
agent, U.S. Bank Global Fund Services, LLC, P.O. Box 701, Milwaukee, WI 53201.
| ITEM 34. |
MANAGEMENT SERVICES. |
None.
None.
SIGNATURES
Pursuant to the requirements
of the Securities Act of 1933, as amended (“1933 Act”), and the Investment Company Act of 1940, as amended, the Registrant
certifies that it meets all of the requirements for effectiveness of this registration statement under Rule 485(b) under the
1933 Act and has duly caused this Post-Effective Amendment No. 150 to its Registration Statement on Form N-1A to be signed on
its behalf by the undersigned, thereunto duly authorized, in this City of Naperville and State of Illinois, on the 23rd day of February,
2024.
| CALAMOS INVESTMENT TRUST |
|
| |
|
|
| By: |
/s/ John P. Calamos, Sr. |
|
| |
John P. Calamos, Sr.
Trustee and President |
|
Pursuant to the requirements
of the 1933 Act, Post-Effective Amendment No. 149 has been signed below by the following persons in the capacities and on the date(s) indicated.
| Name |
|
Title |
|
Date |
| |
|
|
|
|
| /s/ John P. Calamos, Sr. |
|
Trustee and President (principal executive officer) |
|
February 23, 2024 |
| John P. Calamos, Sr. |
|
|
|
| |
|
|
|
|
| /s/ John E. Neal* |
|
Trustee |
|
February 23, 2024 |
| John E. Neal |
|
|
|
|
| |
|
|
|
|
| /s/ William Rybak* |
|
Trustee |
|
February 23, 2024 |
| William Rybak |
|
|
|
|
| |
|
|
|
|
| /s/ Virginia G. Breen* |
|
Trustee |
|
February 23, 2024 |
| Virginia G. Breen |
|
|
|
|
| |
|
|
|
|
| /s/ Lloyd A. Wennlund* |
|
Trustee |
|
February 23, 2024 |
| Lloyd A. Wennlund |
|
|
|
|
| |
|
|
|
|
| /s/ Karen L. Stuckey* |
|
Trustee |
|
February 23, 2024 |
| Karen L. Stuckey |
|
|
|
|
| |
|
|
|
|
| /s/ Christopher M. Toub* |
|
Trustee |
|
February 23, 2024 |
| Christopher M. Toub |
|
|
|
|
| |
|
|
|
|
| /s/ Thomas E. Herman |
|
Vice President and Chief Financial Officer |
|
February 23, 2024 |
| Thomas E. Herman |
|
|
|
| * |
John P. Calamos, Sr. signs this document pursuant to powers of attorney filed in Post-Effective Amendment No. 97 to Registrant’s Registration Statement on Form N-1A, filed on November 6, 2015; Post-Effective Amendment No. 117 to Registrant’s Registration Statement on Form N-1A filed on August 28, 2018; and Post-Effective Amendment No. 131 to Registrant’s Registration Statement on Form N-1A, filed on February 24, 2020. |
| By: |
/s/ John P. Calamos, Sr. |
|
| |
John P. Calamos, Sr.
Attorney-in-Fact
February 23, 2024 |
|
CALAMOS INVESTMENT TRUST
EXHIBIT INDEX
Index
No. |
|
Description of Exhibit |
| (d) |
(20) |
Notification to Calamos Advisors LLC, dated September 26, 2023, regarding Establishment of Merger Arbitrage Fund |
| (d) |
(30) |
Letter Agreement with Calamos Advisors LLC, dated Setember 26, 2023 |
| (d) |
(43) |
Organizational Expenses Agreement, dated September 26, 2023, relating to Merger Arbitrage Fund |
| (e) |
(1) |
Nineteenth Amended and Restated Distribution Agreement, dated September 26, 2023, with Calamos Financial Services LLC |
| (g) |
(15) |
Notification of Additional Funds, dated September 26, 2023, pursuant to Master Custodian Agreement, dated as of September 11, 2009 |
| (g) |
(16) |
Notification of Additional Funds, dated December 12, 2023, pursuant to Master Custodian Agreement, dated as of September 11, 2009 |
| (h) |
(20) |
Notification of Additional Funds, dated September 26, 2023, pursuant to Master Services Agreement, dated as of March 15, 2004 |
| (h) |
(21) |
Notification of Additional Funds, dated December 12, 2023, pursuant to Master Services Agreement, dated as of March 15, 2004 |
| (h) |
(29) |
First Amendment to the Second Amended and Restated Transfer Agent Servicing Agreement by and among Calamos Investment Trust, Calamos Advisors Trust, Calamos Antetokounmpo Sustainable Equities Trust and U.S. Bancorp Fund Services, LLC, dated September 28, 2023 |
| (h) |
(55) |
Amendment, dated October 3, 2023, to Administration Agreement, effective November 1, 2018, with State Street Bank and Trust Company |
| (h) |
(60) |
Notification of Additional Funds, dated January 4, 2024, pursuant to Administration Agreement, effective November 1, 2018 |
| (h) |
(61) |
Master Services Agreement, effective as of October 16, 2023, with Ernst & Young LLP |
| (h) |
(63) |
Expense Limitation Agreement, dated September 26, 2023, regarding Calamos Merger Arbitrage Fund |
| (h) |
(73) |
Rule 12d1-4 Fund of Funds Investment Agreement dated December 13, 2023, with Advanced Series Trust |
| (i) |
|
Opinion and Consent of Ropes & Gray LLP |
| (j) |
|
Consent of Independent Registered Public Accounting Firm for Calamos Investment Trust |
| (m) |
|
Twenty-First Amended and Restated Distribution Plan |
| (p) |
|
Code of Ethics and Insider Trading Policy of Registrant, its investment adviser, distributor and affiliated entities, dated December 12, 2023 |
EX-101.SCH XBRL Taxonomy Extension Schema Document
EX-101.CAL XBRL Taxonomy Extension Calculation Linkbase
EX-101.DEF XBRL Taxonomy Extension
Definition Linkbase
EX-101.LAB XBRL Taxonomy Extension Label Linkbase
EX-101.PRE XBRL Taxonomy Extension Presentation Linkbase