UNITED STATES
SECURITIES AND EXCHANGE COMMISSION
Washington, D.C. 20549
FORM N-CSR
CERTIFIED SHAREHOLDER REPORT OF REGISTERED
MANAGEMENT INVESTMENT COMPANIES
Investment Company Act file number 811-05361
Variable Insurance Products Fund V
(Exact name of registrant as specified in charter)
245 Summer St., Boston, MA 02210
(Address of principal executive offices) (Zip code)
Cynthia Lo Bessette, Secretary
245 Summer St.
Boston, Massachusetts 02210
(Name and address of agent for service)
Registrant's telephone number, including area code:
617-563-7000
Date of fiscal year end: | December 31 |
Date of reporting period: | June 30, 2022 |
Item 1.
Reports to Stockholders
Fidelity® Variable Insurance Products:
Asset Manager Portfolio
Semi-Annual Report
June 30, 2022

Contents
To view a fund's proxy voting guidelines and proxy voting record for the 12-month period ended June 30, visit http://www.fidelity.com/proxyvotingresults or visit the Securities and Exchange Commission's (SEC) web site at http://www.sec.gov.
You may also call 1-877-208-0098 to request a free copy of the proxy voting guidelines.
Fidelity® Variable Insurance Products are separate account options which are purchased through a variable insurance contract.
Standard & Poor's, S&P and S&P 500 are registered service marks of The McGraw-Hill Companies, Inc. and have been licensed for use by Fidelity Distributors Corporation.
Other third-party marks appearing herein are the property of their respective owners.
All other marks appearing herein are registered or unregistered trademarks or service marks of FMR LLC or an affiliated company. © 2022 FMR LLC. All rights reserved.
This report and the financial statements contained herein are submitted for the general information of the shareholders of the Fund. This report is not authorized for distribution to prospective investors in the Fund unless preceded or accompanied by an effective prospectus.
A fund files its complete schedule of portfolio holdings with the SEC for the first and third quarters of each fiscal year on Form N-PORT. Forms N-PORT are available on the SEC’s web site at http://www.sec.gov. A fund's Forms N-PORT may be reviewed and copied at the SEC’s Public Reference Room in Washington, DC. Information regarding the operation of the SEC's Public Reference Room may be obtained by calling 1-800-SEC-0330.
For a complete list of a fund's portfolio holdings, view the most recent holdings listing, semiannual report, or annual report on Fidelity's web site at http://www.fidelity.com, http://www.institutional.fidelity.com, or http://www.401k.com, as applicable.
NOT FDIC INSURED •MAY LOSE VALUE •NO BANK GUARANTEE
Neither the Fund nor Fidelity Distributors Corporation is a bank.
Note to Shareholders:
Early in 2020, the outbreak and spread of COVID-19 emerged as a public health emergency that had a major influence on financial markets, primarily based on its impact on the global economy and corporate earnings. On March 11, 2020, the World Health Organization declared the COVID-19 outbreak a pandemic, citing sustained risk of further global spread. The pandemic prompted a number of measures to limit the spread of COVID-19, including travel and border restrictions, quarantines, and restrictions on large gatherings. In turn, these resulted in lower consumer activity, diminished demand for a wide range of products and services, disruption in manufacturing and supply chains, and – given the wide variability in outcomes regarding the outbreak – significant market uncertainty and volatility. To help stem the turmoil, the U.S. government took unprecedented action – in concert with the U.S. Federal Reserve and central banks around the world – to help support consumers, businesses, and the broader economy, and to limit disruption to the financial system.
In general, the overall impact of the pandemic lessened in 2021, amid a resilient economy and widespread distribution of three COVID-19 vaccines granted emergency use authorization from the U.S. Food and Drug Administration (FDA) early in the year. Still, the situation remains dynamic, and the extent and duration of its influence on financial markets and the economy is highly uncertain, due in part to a recent spike in cases based on highly contagious variants of the coronavirus.
Extreme events such as the COVID-19 crisis are exogenous shocks that can have significant adverse effects on mutual funds and their investments. Although multiple asset classes may be affected by market disruption, the duration and impact may not be the same for all types of assets. Fidelity is committed to helping you stay informed amid news about COVID-19 and during increased market volatility, and we continue to take extra steps to be responsive to customer needs. We encourage you to visit us online, where we offer ongoing updates, commentary, and analysis on the markets and our funds.
On June 1, 2022, the fund’s composite benchmark began transitioning to a new domestic equity neutral allocation of 30% and new international equity neutral allocation of 20%. The fund will reach its new neutral allocations during the third quarter of 2022.
Investment Summary (Unaudited)
The information in the following tables is based on the combined investments of the Fund and its pro-rata share of the investments of Fidelity's Central Funds, other than the Commodity Strategy and Money Market Central Funds.Top Ten Stocks as of June 30, 2022
| % of fund's net assets | |
| Microsoft Corp. | 2.4 |
| Apple, Inc. | 2.3 |
| Alphabet, Inc. Class A | 1.4 |
| Amazon.com, Inc. | 1.0 |
| UnitedHealth Group, Inc. | 0.6 |
| Exxon Mobil Corp. | 0.5 |
| Bank of America Corp. | 0.5 |
| Meta Platforms, Inc. Class A | 0.5 |
| The Travelers Companies, Inc. | 0.4 |
| Tesla, Inc. | 0.4 |
| 10.0 |
Top Bond Issuers as of June 30, 2022
| (with maturities greater than one year) | % of fund's net assets |
| U.S. Treasury Obligations | 15.4 |
| Fannie Mae | 1.5 |
| Uniform Mortgage Backed Securities | 1.4 |
| Ginnie Mae | 1.3 |
| Freddie Mac | 1.1 |
| JPMorgan Chase & Co. | 0.4 |
| Petroleos Mexicanos | 0.5 |
| Bank of America Corp. | 0.3 |
| Goldman Sachs Group, Inc. | 0.3 |
| Morgan Stanley | 0.4 |
| 22.6 |
Market Sectors as of June 30, 2022
| % of fund's net assets | |
| Financials | 14.1 |
| Information Technology | 12.2 |
| Health Care | 7.5 |
| Consumer Discretionary | 7.2 |
| Industrials | 6.1 |
| Communication Services | 5.4 |
| Consumer Staples | 4.4 |
| Energy | 3.9 |
| Real Estate | 3.6 |
| Materials | 2.4 |
| Utilities | 2.2 |
Asset Allocation (% of fund's net assets)
| As of June 30, 2022 | ||
| Stock Class and Equity Futures | 55.8% | |
| Bonds | 41.8% | |
| Short-Term Class | 2.4% | |

Geographic Diversification (% of fund's net assets)
| As of June 30, 2022 | ||
| United States of America* | 78.3% | |
| Cayman Islands | 3.2% | |
| United Kingdom | 2.2% | |
| France | 1.9% | |
| Canada | 1.8% | |
| Switzerland | 1.7% | |
| Japan | 1.3% | |
| Netherlands | 1.1% | |
| Germany | 1.1% | |
| Other | 7.4% | |

* Includes Short-Term investments and Net Other Assets (Liabilities).
Asset allocations in the pie chart reflects the categorization of assets as defined in the Fund’s prospectus in effect as of the time periods indicated above. Financial Statement categorizations conform to accounting standards and will differ from the pie chart. Percentages are adjusted for the effect of future contracts and swap contracts, if applicable.
An unaudited holdings listing for the Fund, which presents direct holdings as well as the pro-rata share of any securities and other investments held indirectly through its investment in underlying Fidelity Central Funds, other than the Commodity Strategy and Money Market Central Funds, is available at institutional.fidelity.com.
Percentages are based on country or territory of incorporation and are adjusted for the effect of futures contracts, if applicable.
Percentages in the above tables are adjusted for the effect of TBA Sale Commitments.
Schedule of Investments June 30, 2022 (Unaudited)
Showing Percentage of Net Assets
| U.S. Treasury Obligations - 0.3% | |||
| Principal Amount | Value | ||
| U.S. Treasury Bills, yield at date of purchase 0.75% to 1.24% 7/14/22 to 9/8/22 (a) | |||
| (Cost $2,485,916) | 2,490,000 | 2,484,650 | |
| Shares | Value | ||
| Fixed-Income Funds - 43.1% | |||
| Fidelity Emerging Markets Debt Central Fund (b) | 279,768 | $2,095,463 | |
| Fidelity Emerging Markets Debt Local Currency Central Fund (b) | 31,297 | 2,547,919 | |
| Fidelity Floating Rate Central Fund (b) | 397,565 | 37,335,356 | |
| Fidelity High Income Central Fund (b) | 77,711 | 7,739,267 | |
| Fidelity Inflation-Protected Bond Index Central Fund (b) | 203,942 | 20,526,725 | |
| Fidelity International Credit Central Fund (b) | 137,785 | 11,633,183 | |
| Fidelity VIP Investment Grade Central Fund (b) | 3,293,536 | 315,981,831 | |
| iShares 20+ Year Treasury Bond ETF (c) | 161,747 | 18,579,879 | |
| TOTAL FIXED-INCOME FUNDS | |||
| (Cost $448,711,470) | 416,439,623 | ||
| Money Market Funds - 3.6% | |||
| Fidelity Cash Central Fund 1.58% (d) | 16,204,115 | 16,207,356 | |
| Fidelity Securities Lending Cash Central Fund 1.58% (d)(e) | 18,795,745 | 18,797,625 | |
| TOTAL MONEY MARKET FUNDS | |||
| (Cost $35,004,981) | 35,004,981 | ||
| Equity Funds - 56.3% | |||
| Domestic Equity Funds - 40.4% | |||
| Fidelity Commodity Strategy Central Fund (b) | 2,647,807 | 15,727,976 | |
| Fidelity Real Estate Equity Central Fund (b) | 71,634 | 9,033,701 | |
| Fidelity U.S. Equity Central Fund (b) | 3,407,099 | 348,478,088 | |
| iShares MSCI USA Minimum Volatility ETF | 246,210 | 17,286,404 | |
| TOTAL DOMESTIC EQUITY FUNDS | 390,526,169 | ||
| International Equity Funds - 15.9% | |||
| Fidelity Emerging Markets Equity Central Fund (b) | 281,068 | 53,894,781 | |
| Fidelity International Equity Central Fund (b) | 1,258,175 | 100,138,123 | |
| TOTAL INTERNATIONAL EQUITY FUNDS | 154,032,904 | ||
| TOTAL EQUITY FUNDS | |||
| (Cost $437,140,209) | 544,559,073 | ||
| TOTAL INVESTMENT IN SECURITIES - 103.3% | |||
| (Cost $923,342,576) | 998,488,327 | ||
| NET OTHER ASSETS (LIABILITIES) - (3.3)% | (32,004,260) | ||
| NET ASSETS - 100% | $966,484,067 |
| Futures Contracts | |||||
| Number of contracts | Expiration Date | Notional Amount | Value | Unrealized Appreciation/(Depreciation) | |
| Purchased | |||||
| Equity Index Contracts | |||||
| ICE E-mini MSCI Emerging Markets Index Contracts (United States) | 208 | Sept. 2022 | $10,428,080 | $(4,677) | $(4,677) |
| Sold | |||||
| Equity Index Contracts | |||||
| CME E-mini S&P 500 Index Contracts (United States) | 251 | Sept. 2022 | 47,558,225 | (328,717) | (328,717) |
| ICE E-mini MSCI EAFE Index Contracts (United States) | 11 | Sept. 2022 | 1,021,130 | 804 | 804 |
| TOTAL FUTURES SOLD | (327,913) | ||||
| TOTAL FUTURES CONTRACTS | $(332,590) |
The notional amount of futures purchased as a percentage of Net Assets is 1.1%
The notional amount of futures sold as a percentage of Net Assets is 5.0%
For the period, the average monthly notional amount at value for futures contracts in the aggregate was $64,176,698.
Security Type Abbreviations
ETF – Exchange-Traded Fund
Legend
(a) Security or a portion of the security was pledged to cover margin requirements for futures contracts. At period end, the value of securities pledged amounted to $2,342,705.
(b) Affiliated fund that is generally available only to investment companies and other accounts managed by Fidelity Investments. A complete unaudited schedule of portfolio holdings for each Fidelity Central Fund is filed with the SEC for the first and third quarters of each fiscal year on Form N-PORT and is available upon request or at the SEC's website at www.sec.gov. An unaudited holdings listing for the Fund, which presents direct holdings as well as the pro-rata share of securities and other investments held indirectly through its investment in underlying non-money market Fidelity Central Funds, other than the Commodity Strategy Central Fund, is available at fidelity.com and/or institutional.fidelity.com, as applicable. In addition, each Fidelity Central Fund's financial statements are available on the SEC's website or upon request.
(c) Security or a portion of the security is on loan at period end.
(d) Affiliated fund that is generally available only to investment companies and other accounts managed by Fidelity Investments. The rate quoted is the annualized seven-day yield of the fund at period end. A complete unaudited listing of the fund's holdings as of its most recent quarter end is available upon request. In addition, each Fidelity Central Fund's financial statements are available on the SEC's website or upon request.
(e) Investment made with cash collateral received from securities on loan.
Affiliated Central Funds
Fiscal year to date information regarding the Fund's investments in Fidelity Central Funds, including the ownership percentage, is presented below.
| Affiliate | Value, beginning of period | Purchases | Sales Proceeds | Dividend Income | Realized Gain (loss) | Change in Unrealized appreciation (depreciation) | Value, end of period | |
| Fidelity Cash Central Fund 1.58% | $28,742,301 | $65,130,313 | $77,665,258 | $55,723 | $-- | $-- | $16,207,356 | 0.0% |
| Fidelity Commodity Strategy Central Fund | 14,352,238 | 7,413,424 | 8,705,222 | -- | 1,699,380 | 968,156 | 15,727,976 | 2.2% |
| Fidelity Emerging Markets Debt Central Fund | 2,751,017 | 477,511 | 696,114 | 54,318 | (115,662) | (321,289) | 2,095,463 | 0.1% |
| Fidelity Emerging Markets Debt Local Currency Central Fund | 2,891,098 | 29,831 | -- | 29,831 | -- | (373,010) | 2,547,919 | 3.1% |
| Fidelity Emerging Markets Equity Central Fund | 52,970,146 | 20,879,134 | 6,839,586 | 171 | (213,538) | (12,901,375) | 53,894,781 | 2.8% |
| Fidelity Floating Rate Central Fund | 42,133,576 | 4,058,552 | 6,130,457 | 887,244 | 68,068 | (2,794,383) | 37,335,356 | 1.3% |
| Fidelity High Income Central Fund | 9,153,490 | 866,671 | 1,044,171 | 231,881 | 13,960 | (1,250,683) | 7,739,267 | 0.4% |
| Fidelity Inflation-Protected Bond Index Central Fund | 35,033,428 | 1,714,495 | 15,059,684 | 11,326 | 540,751 | (1,702,265) | 20,526,725 | 3.4% |
| Fidelity International Credit Central Fund | 17,000,205 | 1,225,822 | 4,214,976 | 166,520 | (348,320) | (2,029,548) | 11,633,183 | 2.5% |
| Fidelity International Equity Central Fund | 118,930,889 | 21,004,362 | 10,652,267 | 1,124,631 | (1,619,091) | (27,525,770) | 100,138,123 | 2.8% |
| Fidelity Real Estate Equity Central Fund | 24,974,660 | 1,310,148 | 12,599,326 | 45,767 | (75,819) | (4,575,962) | 9,033,701 | 0.8% |
| Fidelity Securities Lending Cash Central Fund 1.58% | -- | 229,636,216 | 210,838,591 | 5,576 | -- | -- | 18,797,625 | 0.0% |
| Fidelity U.S. Equity Central Fund | 482,710,833 | 32,969,653 | 63,580,966 | 1,886,094 | (4,468,325) | (99,153,107) | 348,478,088 | 2.1% |
| Fidelity VIP Investment Grade Central Fund | 328,747,739 | 74,141,452 | 45,545,910 | 6,678,924 | (2,837,868) | (38,523,582) | 315,981,831 | 13.9% |
| $1,160,391,620 | $460,857,584 | $463,572,528 | $11,178,006 | $(7,356,464) | $(190,182,818) | $960,137,394 |
Amounts in the income column in the above table include any capital gain distributions from underlying funds, which are presented in the corresponding line-item in the Statement of Operations, if applicable. Amount for Fidelity Securities Lending Cash Central Fund represents the income earned on investing cash collateral, less rebates paid to borrowers and any lending agent fees associated with the loan, plus any premium payments received for lending certain types of securities.
Investment Valuation
The following is a summary of the inputs used, as of June 30, 2022, involving the Fund's assets and liabilities carried at fair value. The inputs or methodology used for valuing securities may not be an indication of the risk associated with investing in those securities. For more information on valuation inputs, and their aggregation into the levels used below, please refer to the Investment Valuation section in the accompanying Notes to Financial Statements.
| Valuation Inputs at Reporting Date: | ||||
| Description | Total | Level 1 | Level 2 | Level 3 |
| Investments in Securities: | ||||
| U.S. Government and Government Agency Obligations | $2,484,650 | $-- | $2,484,650 | $-- |
| Fixed-Income Funds | 416,439,623 | 416,439,623 | -- | -- |
| Money Market Funds | 35,004,981 | 35,004,981 | -- | -- |
| Equity Funds | 544,559,073 | 544,559,073 | -- | -- |
| Total Investments in Securities: | $998,488,327 | $996,003,677 | $2,484,650 | $-- |
| Derivative Instruments: | ||||
| Assets | ||||
| Futures Contracts | $804 | $804 | $-- | $-- |
| Total Assets | $804 | $804 | $-- | $-- |
| Liabilities | ||||
| Futures Contracts | $(333,394) | $(333,394) | $-- | $-- |
| Total Liabilities | $(333,394) | $(333,394) | $-- | $-- |
| Total Derivative Instruments: | $(332,590) | $(332,590) | $-- | $-- |
Value of Derivative Instruments
The following table is a summary of the Fund's value of derivative instruments by primary risk exposure as of June 30, 2022. For additional information on derivative instruments, please refer to the Derivative Instruments section in the accompanying Notes to Financial Statements.
| Primary Risk Exposure / Derivative Type | Value | |
| Asset | Liability | |
| Equity Risk | ||
| Futures Contracts(a) | $804 | $(333,394) |
| Total Equity Risk | 804 | (333,394) |
| Total Value of Derivatives | $804 | $(333,394) |
(a) Reflects gross cumulative appreciation (depreciation) on futures contracts as presented in the Schedule of Investments. In the Statement of Assets and Liabilities, the period end daily variation margin is included in receivable or payable for daily variation margin on futures contracts, and the net cumulative appreciation (depreciation) is included in Total accumulated earnings (loss).
Other Information
The information in the following tables is based on the combined investments of the Fund and its pro-rata share of the investments of Fidelity's Central Funds, other than the Commodity Strategy and Money Market Central Funds. Percentages in the below tables are adjusted for the effect of TBA Sale Commitments.
The composition of credit quality ratings as a percentage of Total Net Assets is as follows (Unaudited):
| U.S. Government and U.S. Government Agency Obligations | 20.7% |
| AAA,AA,A | 6.3% |
| BBB | 6.8% |
| BB | 2.5% |
| B | 3.0% |
| CCC,CC,C | 0.3% |
| D | 0.0% |
| Not Rated | 0.1% |
| Equities | 55.4% |
| Short-Term Investments and Net Other Assets | 4.9% |
| 100.0% |
We have used ratings from Moody's Investors Service, Inc. Where Moody's® ratings are not available, we have used S&P® ratings. All ratings are as of the date indicated and do not reflect subsequent changes.
Percentages shown as 0.0% may reflect amounts less than 0.05%.
See accompanying notes which are an integral part of the financial statements.
Financial Statements
Statement of Assets and Liabilities
| June 30, 2022 (Unaudited) | ||
| Assets | ||
| Investment in securities, at value (including securities loaned of $18,574,479) — See accompanying schedule: Unaffiliated issuers (cost $44,760,045) | $38,350,933 | |
| Fidelity Central Funds (cost $878,582,531) | 960,137,394 | |
| Total Investment in Securities (cost $923,342,576) | $998,488,327 | |
| Cash | 8 | |
| Receivable for investments sold | 3,314,943 | |
| Receivable for fund shares sold | 81,993 | |
| Distributions receivable from Fidelity Central Funds | 18,151 | |
| Receivable for daily variation margin on futures contracts | 283,229 | |
| Other receivables | 15,530 | |
| Total assets | 1,002,202,181 | |
| Liabilities | ||
| Payable for investments purchased | $16,252,777 | |
| Payable for fund shares redeemed | 125,355 | |
| Accrued management fee | 392,890 | |
| Distribution and service plan fees payable | 3,604 | |
| Other affiliated payables | 99,979 | |
| Other payables and accrued expenses | 45,884 | |
| Collateral on securities loaned | 18,797,625 | |
| Total liabilities | 35,718,114 | |
| Net Assets | $966,484,067 | |
| Net Assets consist of: | ||
| Paid in capital | $878,357,748 | |
| Total accumulated earnings (loss) | 88,126,319 | |
| Net Assets | $966,484,067 | |
| Net Asset Value and Maximum Offering Price | ||
| Initial Class: | ||
| Net Asset Value, offering price and redemption price per share ($717,315,861 ÷ 49,338,723 shares) | $14.54 | |
| Service Class: | ||
| Net Asset Value, offering price and redemption price per share ($2,795,805 ÷ 194,502 shares) | $14.37 | |
| Service Class 2: | ||
| Net Asset Value, offering price and redemption price per share ($15,709,811 ÷ 1,115,671 shares) | $14.08 | |
| Investor Class: | ||
| Net Asset Value, offering price and redemption price per share ($230,662,590 ÷ 16,001,184 shares) | $14.42 |
See accompanying notes which are an integral part of the financial statements.
Statement of Operations
| Six months ended June 30, 2022 (Unaudited) | ||
| Investment Income | ||
| Dividends | $217,519 | |
| Interest | 5,709 | |
| Income from Fidelity Central Funds (including $5,576 from security lending) | 8,111,087 | |
| Total income | 8,334,315 | |
| Expenses | ||
| Management fee | $2,567,213 | |
| Transfer agent fees | 429,715 | |
| Distribution and service plan fees | 24,053 | |
| Accounting fees | 223,695 | |
| Custodian fees and expenses | 12,303 | |
| Independent trustees' fees and expenses | 1,684 | |
| Audit | 23,008 | |
| Legal | 1,061 | |
| Miscellaneous | 2,175 | |
| Total expenses before reductions | 3,284,907 | |
| Expense reductions | (17,009) | |
| Total expenses after reductions | 3,267,898 | |
| Net investment income (loss) | 5,066,417 | |
| Realized and Unrealized Gain (Loss) | ||
| Net realized gain (loss) on: | ||
| Investment securities: | ||
| Unaffiliated issuers | (1,772,556) | |
| Fidelity Central Funds | (7,356,464) | |
| Foreign currency transactions | 13 | |
| Futures contracts | 13,306,906 | |
| Capital gain distributions from Fidelity Central Funds | 3,066,919 | |
| Total net realized gain (loss) | 7,244,818 | |
| Change in net unrealized appreciation (depreciation) on: | ||
| Investment securities: | ||
| Unaffiliated issuers | (4,355,343) | |
| Fidelity Central Funds | (190,182,818) | |
| Futures contracts | 477,117 | |
| Total change in net unrealized appreciation (depreciation) | (194,061,044) | |
| Net gain (loss) | (186,816,226) | |
| Net increase (decrease) in net assets resulting from operations | $(181,749,809) |
See accompanying notes which are an integral part of the financial statements.
Statement of Changes in Net Assets
| Six months ended June 30, 2022 (Unaudited) | Year ended December 31, 2021 | |
| Increase (Decrease) in Net Assets | ||
| Operations | ||
| Net investment income (loss) | $5,066,417 | $19,261,641 |
| Net realized gain (loss) | 7,244,818 | 78,253,720 |
| Change in net unrealized appreciation (depreciation) | (194,061,044) | 15,737,810 |
| Net increase (decrease) in net assets resulting from operations | (181,749,809) | 113,253,171 |
| Distributions to shareholders | (69,917,589) | (25,440,391) |
| Share transactions - net increase (decrease) | 18,651,638 | (57,468,969) |
| Total increase (decrease) in net assets | (233,015,760) | 30,343,811 |
| Net Assets | ||
| Beginning of period | 1,199,499,827 | 1,169,156,016 |
| End of period | $966,484,067 | $1,199,499,827 |
See accompanying notes which are an integral part of the financial statements.
Financial Highlights
VIP Asset Manager Portfolio Initial Class
| Six months ended (Unaudited) June 30, | Years endedDecember 31, | |||||
| 2022 | 2021 | 2020 | 2019 | 2018 | 2017 | |
| Selected Per–Share Data | ||||||
| Net asset value, beginning of period | $18.33 | $17.04 | $15.23 | $13.68 | $15.23 | $15.29 |
| Income from Investment Operations | ||||||
| Net investment income (loss)A,B | .08 | .29 | .22 | .27 | .24 | .23 |
| Net realized and unrealized gain (loss) | (2.79) | 1.40 | 2.03 | 2.16 | (1.04) | 1.76 |
| Total from investment operations | (2.71) | 1.69 | 2.25 | 2.43 | (.80) | 1.99 |
| Distributions from net investment income | (.01) | (.30) | (.24) | (.27) | (.26)C | (.29) |
| Distributions from net realized gain | (1.07) | (.10) | (.21) | (.61) | (.49)C | (1.76) |
| Total distributions | (1.08) | (.40) | (.44)D | (.88) | (.75) | (2.05) |
| Net asset value, end of period | $14.54 | $18.33 | $17.04 | $15.23 | $13.68 | $15.23 |
| Total ReturnE,F,G | (15.48)% | 9.92% | 14.87% | 18.25% | (5.35)% | 14.03% |
| Ratios to Average Net AssetsB,H,I | ||||||
| Expenses before reductions | .59%J | .59% | .59% | .60% | .60% | .61% |
| Expenses net of fee waivers, if any | .58%J | .58% | .59% | .60% | .60% | .61% |
| Expenses net of all reductions | .58%J | .58% | .59% | .60% | .60% | .61% |
| Net investment income (loss) | .96%J | 1.62% | 1.41% | 1.88% | 1.64% | 1.54% |
| Supplemental Data | ||||||
| Net assets, end of period (000 omitted) | $717,316 | $889,923 | $889,473 | $843,000 | $788,193 | $937,508 |
| Portfolio turnover rateK | 34%J | 20% | 20% | 30% | 27% | 26% |
A Calculated based on average shares outstanding during the period.
B Net investment income (loss) is affected by the timing of the declaration of dividends by any underlying mutual funds or exchange-traded funds (ETFs). Net investment income (loss) of any such underlying funds is not included in the Fund's net investment income (loss) ratio.
C The amount shown reflects reclassifications related to book to tax differences that were made in the year shown.
D Total distributions per share do not sum due to rounding.
E Total returns for periods of less than one year are not annualized.
F Total returns do not reflect charges attributable to your insurance company's separate account. Inclusion of these charges would reduce the total returns shown.
G Total returns would have been lower if certain expenses had not been reduced during the applicable periods shown.
H Fees and expenses of any underlying mutual funds or exchange-traded funds (ETFs) are not included in the Fund's expense ratio. The Fund indirectly bears its proportionate share of these expenses. For additional expense information related to investments in Fidelity Central Funds, please refer to the "Investments in Fidelity Central Funds" note found in the Notes to Financial Statements section of the most recent Annual or Semi-Annual report.
I Expense ratios reflect operating expenses of the class. Expenses before reductions do not reflect amounts reimbursed, waived, or reduced through arrangements with the investment adviser, brokerage services, or other offset arrangements, if applicable, and do not represent the amount paid by the class during periods when reimbursements, waivers or reductions occur.
J Annualized
K Amount does not include the portfolio activity of any underlying mutual funds or exchange-traded funds (ETFs).
See accompanying notes which are an integral part of the financial statements.
VIP Asset Manager Portfolio Service Class
| Six months ended (Unaudited) June 30, | Years endedDecember 31, | |||||
| 2022 | 2021 | 2020 | 2019 | 2018 | 2017 | |
| Selected Per–Share Data | ||||||
| Net asset value, beginning of period | $18.14 | $16.86 | $15.08 | $13.55 | $15.09 | $15.16 |
| Income from Investment Operations | ||||||
| Net investment income (loss)A,B | .07 | .27 | .20 | .26 | .23 | .21 |
| Net realized and unrealized gain (loss) | (2.76) | 1.38 | 2.01 | 2.13 | (1.03) | 1.75 |
| Total from investment operations | (2.69) | 1.65 | 2.21 | 2.39 | (.80) | 1.96 |
| Distributions from net investment income | (.01) | (.27) | (.23) | (.25) | (.25)C | (.27) |
| Distributions from net realized gain | (1.07) | (.10) | (.21) | (.61) | (.49)C | (1.76) |
| Total distributions | (1.08) | (.37) | (.43)D | (.86) | (.74) | (2.03) |
| Net asset value, end of period | $14.37 | $18.14 | $16.86 | $15.08 | $13.55 | $15.09 |
| Total ReturnE,F,G | (15.54)% | 9.80% | 14.74% | 18.16% | (5.44)% | 13.94% |
| Ratios to Average Net AssetsB,H,I | ||||||
| Expenses before reductions | .69%J | .69% | .69% | .70% | .70% | .71% |
| Expenses net of fee waivers, if any | .68%J | .69% | .69% | .70% | .70% | .71% |
| Expenses net of all reductions | .68%J | .69% | .69% | .70% | .70% | .71% |
| Net investment income (loss) | .86%J | 1.52% | 1.31% | 1.78% | 1.54% | 1.44% |
| Supplemental Data | ||||||
| Net assets, end of period (000 omitted) | $2,796 | $3,627 | $5,108 | $3,923 | $4,378 | $5,004 |
| Portfolio turnover rateK | 34%J | 20% | 20% | 30% | 27% | 26% |
A Calculated based on average shares outstanding during the period.
B Net investment income (loss) is affected by the timing of the declaration of dividends by any underlying mutual funds or exchange-traded funds (ETFs). Net investment income (loss) of any such underlying funds is not included in the Fund's net investment income (loss) ratio.
C The amount shown reflects reclassifications related to book to tax differences that were made in the year shown.
D Total distributions per share do not sum due to rounding.
E Total returns for periods of less than one year are not annualized.
F Total returns do not reflect charges attributable to your insurance company's separate account. Inclusion of these charges would reduce the total returns shown.
G Total returns would have been lower if certain expenses had not been reduced during the applicable periods shown.
H Fees and expenses of any underlying mutual funds or exchange-traded funds (ETFs) are not included in the Fund's expense ratio. The Fund indirectly bears its proportionate share of these expenses. For additional expense information related to investments in Fidelity Central Funds, please refer to the "Investments in Fidelity Central Funds" note found in the Notes to Financial Statements section of the most recent Annual or Semi-Annual report.
I Expense ratios reflect operating expenses of the class. Expenses before reductions do not reflect amounts reimbursed, waived, or reduced through arrangements with the investment adviser, brokerage services, or other offset arrangements, if applicable, and do not represent the amount paid by the class during periods when reimbursements, waivers or reductions occur.
J Annualized
K Amount does not include the portfolio activity of any underlying mutual funds or exchange-traded funds (ETFs).
See accompanying notes which are an integral part of the financial statements.
VIP Asset Manager Portfolio Service Class 2
| Six months ended (Unaudited) June 30, | Years endedDecember 31, | |||||
| 2022 | 2021 | 2020 | 2019 | 2018 | 2017 | |
| Selected Per–Share Data | ||||||
| Net asset value, beginning of period | $17.81 | $16.56 | $14.82 | $13.33 | $14.86 | $14.96 |
| Income from Investment Operations | ||||||
| Net investment income (loss)A,B | .06 | .24 | .17 | .23 | .20 | .19 |
| Net realized and unrealized gain (loss) | (2.71) | 1.36 | 1.97 | 2.11 | (1.02) | 1.71 |
| Total from investment operations | (2.65) | 1.60 | 2.14 | 2.34 | (.82) | 1.90 |
| Distributions from net investment income | (.01) | (.25) | (.20) | (.23) | (.22)C | (.25) |
| Distributions from net realized gain | (1.07) | (.10) | (.21) | (.61) | (.49)C | (1.76) |
| Total distributions | (1.08) | (.35) | (.40)D | (.85)D | (.71) | (2.00)D |
| Net asset value, end of period | $14.08 | $17.81 | $16.56 | $14.82 | $13.33 | $14.86 |
| Total ReturnE,F,G | (15.60)% | 9.68% | 14.54% | 18.01% | (5.61)% | 13.74% |
| Ratios to Average Net AssetsB,H,I | ||||||
| Expenses before reductions | .84%J | .84% | .84% | .85% | .85% | .86% |
| Expenses net of fee waivers, if any | .83%J | .83% | .84% | .85% | .85% | .86% |
| Expenses net of all reductions | .83%J | .83% | .84% | .85% | .85% | .86% |
| Net investment income (loss) | .71%J | 1.37% | 1.16% | 1.63% | 1.39% | 1.29% |
| Supplemental Data | ||||||
| Net assets, end of period (000 omitted) | $15,710 | $20,038 | $19,943 | $19,343 | $18,211 | $20,807 |
| Portfolio turnover rateK | 34%J | 20% | 20% | 30% | 27% | 26% |
A Calculated based on average shares outstanding during the period.
B Net investment income (loss) is affected by the timing of the declaration of dividends by any underlying mutual funds or exchange-traded funds (ETFs). Net investment income (loss) of any such underlying funds is not included in the Fund's net investment income (loss) ratio.
C The amount shown reflects reclassifications related to book to tax differences that were made in the year shown.
D Total distributions per share do not sum due to rounding.
E Total returns for periods of less than one year are not annualized.
F Total returns do not reflect charges attributable to your insurance company's separate account. Inclusion of these charges would reduce the total returns shown.
G Total returns would have been lower if certain expenses had not been reduced during the applicable periods shown.
H Fees and expenses of any underlying mutual funds or exchange-traded funds (ETFs) are not included in the Fund's expense ratio. The Fund indirectly bears its proportionate share of these expenses. For additional expense information related to investments in Fidelity Central Funds, please refer to the "Investments in Fidelity Central Funds" note found in the Notes to Financial Statements section of the most recent Annual or Semi-Annual report.
I Expense ratios reflect operating expenses of the class. Expenses before reductions do not reflect amounts reimbursed, waived, or reduced through arrangements with the investment adviser, brokerage services, or other offset arrangements, if applicable, and do not represent the amount paid by the class during periods when reimbursements, waivers or reductions occur.
J Annualized
K Amount does not include the portfolio activity of any underlying mutual funds or exchange-traded funds (ETFs).
See accompanying notes which are an integral part of the financial statements.
VIP Asset Manager Portfolio Investor Class
| Six months ended (Unaudited) June 30, | Years endedDecember 31, | |||||
| 2022 | 2021 | 2020 | 2019 | 2018 | 2017 | |
| Selected Per–Share Data | ||||||
| Net asset value, beginning of period | $18.19 | $16.91 | $15.12 | $13.59 | $15.13 | $15.20 |
| Income from Investment Operations | ||||||
| Net investment income (loss)A,B | .07 | .28 | .20 | .26 | .23 | .22 |
| Net realized and unrealized gain (loss) | (2.76) | 1.39 | 2.02 | 2.14 | (1.03) | 1.74 |
| Total from investment operations | (2.69) | 1.67 | 2.22 | 2.40 | (.80) | 1.96 |
| Distributions from net investment income | (.01) | (.28) | (.23) | (.25) | (.25)C | (.28) |
| Distributions from net realized gain | (1.07) | (.10) | (.21) | (.61) | (.49)C | (1.76) |
| Total distributions | (1.08) | (.39)D | (.43)D | (.87)D | (.74) | (2.03)D |
| Net asset value, end of period | $14.42 | $18.19 | $16.91 | $15.12 | $13.59 | $15.13 |
| Total ReturnE,F,G | (15.49)% | 9.85% | 14.77% | 18.14% | (5.39)% | 13.95% |
| Ratios to Average Net AssetsB,H,I | ||||||
| Expenses before reductions | .66%J | .66% | .67% | .68% | .68% | .69% |
| Expenses net of fee waivers, if any | .66%J | .66% | .67% | .68% | .68% | .69% |
| Expenses net of all reductions | .66%J | .66% | .67% | .68% | .68% | .69% |
| Net investment income (loss) | .89%J | 1.55% | 1.33% | 1.80% | 1.56% | 1.46% |
| Supplemental Data | ||||||
| Net assets, end of period (000 omitted) | $230,663 | $285,912 | $254,632 | $229,330 | $202,182 | $213,497 |
| Portfolio turnover rateK | 34%J | 20% | 20% | 30% | 27% | 26% |
A Calculated based on average shares outstanding during the period.
B Net investment income (loss) is affected by the timing of the declaration of dividends by any underlying mutual funds or exchange-traded funds (ETFs). Net investment income (loss) of any such underlying funds is not included in the Fund's net investment income (loss) ratio.
C The amount shown reflects reclassifications related to book to tax differences that were made in the year shown.
D Total distributions per share do not sum due to rounding.
E Total returns for periods of less than one year are not annualized.
F Total returns do not reflect charges attributable to your insurance company's separate account. Inclusion of these charges would reduce the total returns shown.
G Total returns would have been lower if certain expenses had not been reduced during the applicable periods shown.
H Fees and expenses of any underlying mutual funds or exchange-traded funds (ETFs) are not included in the Fund's expense ratio. The Fund indirectly bears its proportionate share of these expenses. For additional expense information related to investments in Fidelity Central Funds, please refer to the "Investments in Fidelity Central Funds" note found in the Notes to Financial Statements section of the most recent Annual or Semi-Annual report.
I Expense ratios reflect operating expenses of the class. Expenses before reductions do not reflect amounts reimbursed, waived, or reduced through arrangements with the investment adviser, brokerage services, or other offset arrangements, if applicable, and do not represent the amount paid by the class during periods when reimbursements, waivers or reductions occur.
J Annualized
K Amount does not include the portfolio activity of any underlying mutual funds or exchange-traded funds (ETFs).
See accompanying notes which are an integral part of the financial statements.
Notes to Financial Statements (Unaudited)
For the period ended June 30, 2022
1. Organization.
VIP Asset Manager Portfolio (the Fund) is a fund of Variable Insurance Products Fund V (the Trust) and is authorized to issue an unlimited number of shares. The Trust is registered under the Investment Company Act of 1940, as amended (the 1940 Act), as an open-end management investment company organized as a Massachusetts business trust. Shares of the Fund may only be purchased by insurance companies for the purpose of funding variable annuity or variable life insurance contracts. The Fund offers the following classes of shares: Initial Class shares, Service Class shares, Service Class 2 shares and Investor Class shares. All classes have equal rights and voting privileges, except for matters affecting a single class.
2. Investments in Fidelity Central Funds.
Funds may invest in Fidelity Central Funds, which are open-end investment companies generally available only to other investment companies and accounts managed by the investment adviser and its affiliates. The Schedule of Investments lists any Fidelity Central Funds held as an investment as of period end, but does not include the underlying holdings of each Fidelity Central Fund. An investing fund indirectly bears its proportionate share of the expenses of the underlying Fidelity Central Funds.
Based on its investment objective, each Fidelity Central Fund may invest or participate in various investment vehicles or strategies that are similar to those of the investing fund. These strategies are consistent with the investment objectives of the investing fund and may involve certain economic risks which may cause a decline in value of each of the Fidelity Central Funds and thus a decline in the value of the investing fund.
| Fidelity Central Fund | Investment Manager | Investment Objective | Investment Practices | Expense Ratio(a) |
| Fidelity Commodity Strategy Central Fund | Geode Capital Management, LLC (Geode) | Seeks to provide investment returns that correspond to the performance of the commodities market. | Investment in commodity-related investments through a wholly-owned subsidiary organized under the laws of the Cayman Islands Futures Swaps | Less than .005% |
| Fidelity Emerging Markets Debt Central Fund | Fidelity Management & Research Company LLC (FMR) | Seeks high total return by normally investing in debt securities of issuers in emerging markets and other debt investments that are tied economically to emerging markets. | Delayed Delivery & When Issued Securities Foreign Securities Restricted Securities | Less than .005% |
| Fidelity Emerging Markets Equity Central Fund | Fidelity Management & Research Company LLC (FMR) | Seeks capital appreciation by investing primarily in equity securities of issuers in emerging markets. | Foreign Securities Futures | .02% |
| Fidelity International Equity Central Fund | Fidelity Management & Research Company LLC (FMR) | Seeks capital appreciation by investing primarily in non-U.S. based common stocks, including securities of issuers located in emerging markets. | Foreign Securities Futures | Less than .005% |
| Fidelity Floating Rate Central Fund | Fidelity Management & Research Company LLC (FMR) | Seeks a high level of income by normally investing in floating rate loans and other floating rate securities. | Foreign Securities Loans & Direct Debt Instruments Restricted Securities | Less than .005% |
| Fidelity High Income Central Fund | Fidelity Management & Research Company LLC (FMR) | Seeks a high level of income and may also seek capital appreciation by investing primarily in debt securities, preferred stocks, and convertible securities, with an emphasis on lower-quality debt securities. | Loans & Direct Debt Instruments Restricted Securities | .01% |
| Fidelity Inflation-Protected Bond Index Central Fund | Fidelity Management & Research Company LLC (FMR) | Seeks to provide investment results that correspond to the performance of the inflation-protected United States Treasury market, and may invest in derivatives. | Less than .005% | |
| Fidelity VIP Investment Grade Central Fund | Fidelity Management & Research Company LLC (FMR) | Seeks a high level of current income by normally investing in investment-grade debt securities and repurchase agreements. | Delayed Delivery & When Issued Securities Restricted Securities | Less than .005% |
| Fidelity Real Estate Equity Central Fund | Fidelity Management & Research Company LLC (FMR) | Seeks above-average income and long-term capital growth by investing primarily in equity securities of issuers in the real estate industry. | Restricted Securities | Less than .005% |
| Fidelity International Credit Central Fund | Fidelity Management & Research Company LLC (FMR) | Seeks a high level of current income by normally investing in debt securities of foreign issuers, including debt securities of issuers located in emerging markets. Foreign currency exposure is hedged utilizing foreign currency contracts. | Foreign Securities Forward Foreign Currency Contracts Futures Options Restricted Securities Swaps | Less than .005% |
| Fidelity U.S. Equity Central Fund | Fidelity Management & Research Company LLC (FMR) | Seeks capital appreciation by investing primarily in common stocks, allocated across different market sectors. | Foreign Securities Futures Restricted Securities | Less than .005% |
| Fidelity Emerging Markets Debt Local Currency Central Fund | Fidelity Management & Research Company LLC (FMR) | Seeks high total return by normally investing in debt securities of issuers in emerging markets and other debt investments that are tied economically to emerging markets and denominated in the local currency of the issuer. | Foreign Securities Restricted Securities | .02% |
| Fidelity Money Market Central Funds | Fidelity Management & Research Company LLC (FMR) | Each fund seeks to obtain a high level of current income consistent with the preservation of capital and liquidity. | Short-term Investments | Less than .005% |
(a) Expenses expressed as a percentage of average net assets and are as of each underlying Central Fund's most recent annual or semi-annual shareholder report.
An unaudited holdings listing for the investing fund, which presents direct holdings as well as the pro-rata share of any securities and other investments held indirectly through its investment in underlying non-money market Fidelity Central Funds, is available at fidelity.com and/or institutional.fidelity.com, as applicable. A complete unaudited list of holdings for each Fidelity Central Fund is available upon request or at the Securities and Exchange Commission website at www.sec.gov. In addition, the financial statements of the Fidelity Central Funds which contain the significant accounting policies (including investment valuation policies) of those funds, and are not covered by the Report of Independent Registered Public Accounting Firm, are available on the Securities and Exchange Commission website or upon request.
3. Significant Accounting Policies.
The Fund is an investment company and applies the accounting and reporting guidance of the Financial Accounting Standards Board (FASB) Accounting Standards Codification Topic 946 Financial Services - Investment Companies. The financial statements have been prepared in conformity with accounting principles generally accepted in the United States of America (GAAP), which require management to make certain estimates and assumptions at the date of the financial statements. Actual results could differ from those estimates. Subsequent events, if any, through the date that the financial statements were issued have been evaluated in the preparation of the financial statements. The Fund's Schedule of Investments lists any underlying mutual funds or exchange-traded funds (ETFs) but does not include the underlying holdings of these funds. The following summarizes the significant accounting policies of the Fund:
Investment Valuation. Investments are valued as of 4:00 p.m. Eastern time on the last calendar day of the period. The Board of Trustees (the Board) has delegated the day to day responsibility for the valuation of the Fund's investments to the Fair Value Committee (the Committee) established by the Fund's investment adviser. In accordance with valuation policies and procedures approved by the Board, the Fund attempts to obtain prices from one or more third party pricing vendors or brokers to value its investments. When current market prices, quotations or currency exchange rates are not readily available or reliable, investments will be fair valued in good faith by the Committee, in accordance with procedures adopted by the Board. Factors used in determining fair value vary by investment type and may include market or investment specific events, changes in interest rates and credit quality. The frequency with which these procedures are used cannot be predicted and they may be utilized to a significant extent. The Committee oversees the Fund's valuation policies and procedures and reports to the Board on the Committee's activities and fair value determinations. The Board monitors the appropriateness of the procedures used in valuing the Fund's investments and ratifies the fair value determinations of the Committee. The Fund categorizes the inputs to valuation techniques used to value its investments into a disclosure hierarchy consisting of three levels as shown below:
- Level 1 – unadjusted quoted prices in active markets for identical investments
- Level 2 – other significant observable inputs (including quoted prices for similar investments, interest rates, prepayment speeds, etc.)
- Level 3 – unobservable inputs (including the Fund's own assumptions based on the best information available)
Valuation techniques used to value the Fund's investments by major category are as follows. Debt securities, including restricted securities, are valued based on evaluated prices received from third party pricing vendors or from brokers who make markets in such securities. U.S. government and government agency obligations are valued by pricing vendors who utilize matrix pricing which considers yield or price of bonds of comparable quality, coupon, maturity and type or by broker-supplied prices. When independent prices are unavailable or unreliable, debt securities may be valued utilizing pricing methodologies which consider similar factors that would be used by third party pricing vendors. Debt securities are generally categorized as Level 2 in the hierarchy but may be Level 3 depending on the circumstances.
ETFs are valued at their last sale price or official closing price as reported by a third party pricing vendor on the primary market or exchange on which they are traded and are categorized as Level 1 in the hierarchy. In the event there were no sales during the day but the exchange reports a closing bid level, ETFs are valued at the closing bid and would be categorized as Level 1 in the hierarchy. In the event there was no closing bid, ETFs may be valued by another method that the Board believes reflects fair value in accordance with the Board's fair value pricing policies and may be categorized as Level 2 in the hierarchy.
Futures contracts are valued at the settlement price established each day by the board of trade or exchange on which they are traded and are categorized as Level 1 in the hierarchy. Investments in open-end mutual funds, including the Fidelity Central Funds, are valued at their closing net asset value (NAV) each business day and are categorized as Level 1 in the hierarchy.
Changes in valuation techniques may result in transfers in or out of an assigned level within the disclosure hierarchy. The aggregate value of investments by input level, as of June 30, 2022, is included at the end of the Fund's Schedule of Investments.
Foreign Currency. Certain Funds may use foreign currency contracts to facilitate transactions in foreign-denominated securities. Gains and losses from these transactions may arise from changes in the value of the foreign currency or if the counterparties do not perform under the contracts' terms.
Foreign-denominated assets, including investment securities, and liabilities are translated into U.S. dollars at the exchange rates at period end. Purchases and sales of investment securities, income and dividends received, and expenses denominated in foreign currencies are translated into U.S. dollars at the exchange rate in effect on the transaction date.
The effects of exchange rate fluctuations on investments are included with the net realized and unrealized gain (loss) on investment securities. Other foreign currency transactions resulting in realized and unrealized gain (loss) are disclosed separately.
Investment Transactions and Income. For financial reporting purposes, the Fund's investment holdings and NAV include trades executed through the end of the last business day of the period. The NAV per share for processing shareholder transactions is calculated as of the close of business of the New York Stock Exchange (NYSE), normally 4:00 p.m. Eastern time and includes trades executed through the end of the prior business day. Gains and losses on securities sold are determined on the basis of identified cost and include proceeds received from litigation. Commissions paid to certain brokers with whom the investment adviser, or its affiliates, places trades on behalf of a fund include an amount in addition to trade execution, which may be rebated back to a fund. Any such rebates are included in net realized gain (loss) on investments in the Statement of Operations. Dividend income is recorded on the ex-dividend date, except for certain dividends from foreign securities where the ex-dividend date may have passed, which are recorded as soon as the Fund is informed of the ex-dividend date. Non-cash dividends included in dividend income, if any, are recorded at the fair market value of the securities received. Income and capital gain distributions from Fidelity Central Funds, if any, are recorded on the ex-dividend date. Interest income is accrued as earned and includes coupon interest and amortization of premium and accretion of discount on debt securities as applicable. Investment income is recorded net of foreign taxes withheld where recovery of such taxes is uncertain.
Class Allocations and Expenses. Investment income, realized and unrealized capital gains and losses, common expenses of a fund, and certain fund-level expense reductions, if any, are allocated daily on a pro-rata basis to each class based on the relative net assets of each class to the total net assets of a fund. Each class differs with respect to transfer agent and distribution and service plan fees incurred, as applicable. Certain expense reductions may also differ by class, if applicable. For the reporting period, the allocated portion of income and expenses to each class as a percent of its average net assets may vary due to the timing of recording these transactions in relation to fluctuating net assets of the classes. Expenses directly attributable to a fund are charged to that fund. Expenses attributable to more than one fund are allocated among the respective funds on the basis of relative net assets or other appropriate methods. Expenses included in the accompanying financial statements reflect the expenses of that fund and do not include any expenses associated with any underlying mutual funds or exchange-traded funds. Although not included in a fund's expenses, a fund indirectly bears its proportionate share of these expenses through the net asset value of each underlying mutual fund or exchange-traded fund. Expense estimates are accrued in the period to which they relate and adjustments are made when actual amounts are known.
Deferred Trustee Compensation. Under a Deferred Compensation Plan (the Plan) for certain Funds, certain independent Trustees have elected to defer receipt of a portion of their annual compensation. Deferred amounts are invested in affiliated mutual funds, are marked-to-market and remain in a fund until distributed in accordance with the Plan. The investment of deferred amounts and the offsetting payable to the Trustees presented below are included in the accompanying Statement of Assets and Liabilities in other receivables and other payables and accrued expenses, as applicable.
| VIP Asset Manager Portfolio | $15,530 |
Income Tax Information and Distributions to Shareholders. Each year, the Fund intends to qualify as a regulated investment company under Subchapter M of the Internal Revenue Code, including distributing substantially all of its taxable income and realized gains. As a result, no provision for U.S. Federal income taxes is required. The Fund files a U.S. federal tax return, in addition to state and local tax returns as required. The Fund's federal income tax returns are subject to examination by the Internal Revenue Service (IRS) for a period of three fiscal years after they are filed. State and local tax returns may be subject to examination for an additional fiscal year depending on the jurisdiction. Foreign taxes are provided for based on the Fund's understanding of the tax rules and rates that exist in the foreign markets in which it invests.
Distributions are declared and recorded on the ex-dividend date. Income and capital gain distributions are declared separately for each class. Income and capital gain distributions are determined in accordance with income tax regulations, which may differ from GAAP.
Capital accounts within the financial statements are adjusted for permanent book-tax differences. These adjustments have no impact on net assets or the results of operations. Capital accounts are not adjusted for temporary book-tax differences which will reverse in a subsequent period.
Book-tax differences are primarily due to the short-term gain distributions from the underlying mutual funds or exchange-traded funds (ETFs), futures contracts, deferred trustees compensation, capital loss carryforwards and losses deferred due to wash sales.
As of period end, the cost and unrealized appreciation (depreciation) in securities, and derivatives if applicable, for federal income tax purposes were as follows:
| Gross unrealized appreciation | $116,183,942 |
| Gross unrealized depreciation | (36,590,249) |
| Net unrealized appreciation (depreciation) | $79,593,693 |
| Tax cost | $918,562,044 |
4. Derivative Instruments.
Risk Exposures and the Use of Derivative Instruments. Investment objectives allow a fund to enter into various types of derivative contracts, including futures contracts. Derivatives are investments whose value is primarily derived from underlying assets, indices or reference rates and may be transacted on an exchange or over-the-counter (OTC). Derivatives may involve a future commitment to buy or sell a specified asset based on specified terms, to exchange future cash flows at periodic intervals based on a notional principal amount, or for one party to make one or more payments upon the occurrence of specified events in exchange for periodic payments from the other party.
Derivatives were used to increase returns and to manage exposure to certain risks as defined below. The success of any strategy involving derivatives depends on analysis of numerous economic factors, and if the strategies for investment do not work as intended, the objectives may not be achieved.
Derivatives were used to increase or decrease exposure to the following risk:
| Equity Risk | Equity risk relates to the fluctuations in the value of financial instruments as a result of changes in market prices (other than those arising from interest rate risk or foreign exchange risk), whether caused by factors specific to an individual investment, its issuer, or all factors affecting all instruments traded in a market or market segment. |
Funds are also exposed to additional risks from investing in derivatives, such as liquidity risk and counterparty credit risk. Liquidity risk is the risk that a fund will be unable to close out the derivative in the open market in a timely manner. Counterparty credit risk is the risk that the counterparty will not be able to fulfill its obligation to a fund. Exchange-traded contracts are not covered by the ISDA Master Agreement; however counterparty credit risk related to these contracts may be mitigated by the protection provided by the exchange on which they trade.
Investing in derivatives may involve greater risks than investing in the underlying assets directly and, to varying degrees, may involve risk of loss in excess of any initial investment and collateral received and amounts recognized in the Statement of Assets and Liabilities. In addition, there may be the risk that the change in value of the derivative contract does not correspond to the change in value of the underlying instrument.
Futures Contracts. A futures contract is an agreement between two parties to buy or sell a specified underlying instrument for a fixed price at a specified future date. Futures contracts were used to manage exposure to the stock market.
Upon entering into a futures contract, a fund is required to deposit either cash or securities (initial margin) with a clearing broker in an amount equal to a certain percentage of the face value of the contract. Futures contracts are marked-to-market daily and subsequent daily payments are made or received by a fund depending on the daily fluctuations in the value of the futures contracts and are recorded as unrealized appreciation or (depreciation). This receivable and/or payable, if any, is included in daily variation margin on futures contracts in the Statement of Assets and Liabilities. Realized gain or (loss) is recorded upon the expiration or closing of a futures contract. The net realized gain (loss) and change in net unrealized appreciation (depreciation) on futures contracts during the period is presented in the Statement of Operations.
Any open futures contracts at period end are presented in the Schedule of Investments under the caption "Futures Contracts". The notional amount at value reflects each contract's exposure to the underlying instrument or index at period end, and is representative of volume of activity during the period unless an average notional amount is presented. Any securities deposited to meet initial margin requirements are identified in the Schedule of Investments. Any cash deposited to meet initial margin requirements is presented as segregated cash with brokers for derivative instruments in the Statement of Assets and Liabilities.
5. Purchases and Sales of Investments.
Purchases and sales of securities, other than short-term securities, U.S. government securities and in-kind transactions, as applicable, are noted in the table below.
| Purchases ($) | Sales ($) | |
| VIP Asset Manager Portfolio | 183,676,462 | 180,813,260 |
6. Fees and Other Transactions with Affiliates.
Management Fee. Fidelity Management & Research Company LLC (the investment adviser) and its affiliates provide the Fund with investment management related services for which the Fund pays a monthly management fee. The management fee is the sum of an individual fund fee rate that is based on an annual rate of .25% of the Fund's average net assets and an annualized group fee rate that averaged .22% during the period. The group fee rate is based upon the monthly average net assets of a group of registered investment companies with which the investment adviser has management contracts. The group fee rate decreases as assets under management increase and increases as assets under management decrease. For the reporting period, the total annualized management fee rate was .48% of the Fund's average net assets.
The investment adviser pays a portion of the management fees received from the Fund to the Fidelity Central Funds' investment advisers, who are also affiliates, for managing the assets of the Fidelity Central Funds.
Distribution and Service Plan Fees. In accordance with Rule 12b-1 of the 1940 Act, the Fund has adopted separate 12b-1 Plans for each Service Class of shares. Each Service Class pays Fidelity Distributors Company LLC (FDC), an affiliate of the investment adviser, a service fee. For the period, the service fee is based on an annual rate of .10% of Service Class' average net assets and .25% of Service Class 2's average net assets.
For the period, total fees, all of which were re-allowed to insurance companies for the distribution of shares and providing shareholder support services, were as follows:
| Service Class | $1,609 |
| Service Class 2 | 22,444 |
| $24,053 |
Transfer Agent Fees. Fidelity Investments Institutional Operations Company LLC (FIIOC), an affiliate of the investment adviser, is the Fund's transfer, dividend disbursing, and shareholder servicing agent. FIIOC receives an asset-based fee with respect to each class. Each class pays a fee for transfer agent services, typesetting and printing and mailing of shareholder reports, excluding mailing of proxy statements. For the period, transfer agent fees for each class were as follows:
| Amount | % of Class-Level Average Net Assets(a) | |
| Initial Class | $248,226 | .06 |
| Service Class | 995 | .06 |
| Service Class 2 | 5,556 | .06 |
| Investor Class | 174,938 | .14 |
| $429,715 |
(a) Annualized
Accounting Fees. Fidelity Service Company, Inc. (FSC), an affiliate of the investment adviser, maintains the Fund's accounting records. The accounting fee is based on the level of average net assets for each month. For the period, the fees were equivalent to the following annualized rates:
| % of Average Net Assets | |
| VIP Asset Manager Portfolio | .04 |
Brokerage Commissions. A portion of portfolio transactions were placed with brokerage firms which are affiliates of the investment adviser. Brokerage commissions are included in net realized gain (loss) and change in net unrealized appreciation (depreciation) in the Statement of Operations. The commissions paid to these affiliated firms were as follows:
| Amount | |
| VIP Asset Manager Portfolio | $4 |
Interfund Trades. Funds may purchase from or sell securities to other Fidelity Funds under procedures adopted by the Board. The procedures have been designed to ensure these interfund trades are executed in accordance with Rule 17a-7 of the 1940 Act. Any interfund trades are included within the respective purchases and sales amounts shown in the Purchases and Sales of Investments note. Interfund trades during the period are noted in the table below.
| Purchases ($) | Sales ($) | Realized Gain (Loss) ($) | |
| VIP Asset Manager Portfolio | – | 68,554 | (21,758) |
7. Committed Line of Credit.
Certain Funds participate with other funds managed by the investment adviser or an affiliate in a $4.25 billion credit facility (the "line of credit") to be utilized for temporary or emergency purposes to fund shareholder redemptions or for other short-term liquidity purposes. The participating funds have agreed to pay commitment fees on their pro-rata portion of the line of credit, which are reflected in Miscellaneous expenses on the Statement of Operations, and are listed below. During the period, there were no borrowings on this line of credit.
| Amount | |
| VIP Asset Manager Portfolio | $965 |
8. Security Lending.
Funds lend portfolio securities from time to time in order to earn additional income. Lending agents are used, including National Financial Services (NFS), an affiliate of the investment adviser. Pursuant to a securities lending agreement, NFS will receive a fee, which is capped at 9.9% of a fund's daily lending revenue, for its services as lending agent. A fund may lend securities to certain qualified borrowers, including NFS. On the settlement date of the loan, a fund receives collateral (in the form of U.S. Treasury obligations, letters of credit and/or cash) against the loaned securities and maintains collateral in an amount not less than 100% of the market value of the loaned securities during the period of the loan. The market value of the loaned securities is determined at the close of business of a fund and any additional required collateral is delivered to a fund on the next business day. A fund or borrower may terminate the loan at any time, and if the borrower defaults on its obligation to return the securities loaned because of insolvency or other reasons, a fund may apply collateral received from the borrower against the obligation. A fund may experience delays and costs in recovering the securities loaned. Any cash collateral received is invested in the Fidelity Securities Lending Cash Central Fund. Any loaned securities are identified as such in the Schedule of Investments, and the value of loaned securities and cash collateral at period end, as applicable, are presented in the Statement of Assets and Liabilities. Security lending income represents the income earned on investing cash collateral, less rebates paid to borrowers and any lending agent fees associated with the loan, plus any premium payments received for lending certain types of securities. Security lending income is presented in the Statement of Operations as a component of income from Fidelity Central Funds. Affiliated security lending activity, if any, was as follows:
| Total Security Lending Fees Paid to NFS | Security Lending Income From Securities Loaned to NFS | Value of Securities Loaned to NFS at Period End | |
| VIP Asset Manager Portfolio | $596 | $– | $– |
9. Expense Reductions.
During the period the investment adviser or an affiliate reimbursed and/or waived a portion of fund-level operating expenses in the amount of $17,009.
10. Distributions to Shareholders.
Distributions to shareholders of each class were as follows:
| Six months ended June 30, 2022 | Year ended December 31, 2021 |
|
| VIP Asset Manager Portfolio | ||
| Distributions to shareholders | ||
| Initial Class | $51,744,143 | $19,036,251 |
| Service Class | 212,566 | 73,125 |
| Service Class 2 | 1,200,682 | 389,732 |
| Investor Class | 16,760,198 | 5,941,283 |
| Total | $69,917,589 | $25,440,391 |
11. Share Transactions.
Transactions for each class of shares were as follows and may contain in-kind transactions:
| Shares | Shares | Dollars | Dollars | |
| Six months ended June 30, 2022 | Year ended December 31, 2021 | Six months ended June 30, 2022 | Year ended December 31, 2021 | |
| VIP Asset Manager Portfolio | ||||
| Initial Class | ||||
| Shares sold | 628,090 | 1,565,172 | $10,070,388 | $28,027,268 |
| Reinvestment of distributions | 3,149,370 | 1,038,999 | 51,744,143 | 19,036,251 |
| Shares redeemed | (2,994,289) | (6,257,413) | (47,742,805) | (112,836,037) |
| Net increase (decrease) | 783,171 | (3,653,242) | $14,071,726 | $(65,772,518) |
| Service Class | ||||
| Shares sold | 50,052 | 11,808 | $775,190 | $207,827 |
| Reinvestment of distributions | 13,081 | 4,031 | 212,566 | 73,125 |
| Shares redeemed | (68,553) | (118,919) | (1,049,230) | (2,149,060) |
| Net increase (decrease) | (5,420) | (103,080) | $(61,474) | $(1,868,108) |
| Service Class 2 | ||||
| Shares sold | 86,808 | 115,026 | $1,303,178 | $2,006,571 |
| Reinvestment of distributions | 75,420 | 21,888 | 1,200,682 | 389,732 |
| Shares redeemed | (171,792) | (215,790) | (2,607,033) | (3,753,491) |
| Net increase (decrease) | (9,564) | (78,876) | $(103,173) | $(1,357,188) |
| Investor Class | ||||
| Shares sold | 147,287 | 1,293,616 | $2,305,051 | $22,760,339 |
| Reinvestment of distributions | 1,028,864 | 326,549 | 16,760,198 | 5,941,283 |
| Shares redeemed | (894,312) | (958,777) | (14,320,690) | (17,172,777) |
| Net increase (decrease) | 281,839 | 661,388 | $4,744,559 | $11,528,845 |
12. Other.
A fund's organizational documents provide former and current trustees and officers with a limited indemnification against liabilities arising in connection with the performance of their duties to the fund. In the normal course of business, a fund may also enter into contracts that provide general indemnifications. A fund's maximum exposure under these arrangements is unknown as this would be dependent on future claims that may be made against a fund. The risk of material loss from such claims is considered remote.
At the end of the period, the investment adviser or its affiliates were owners of record of more than 10% and certain otherwise unaffiliated shareholders each were owners of record of more than 10% of the outstanding shares as follows:
| Fund | Affiliated % | Number of Unaffiliated Shareholders | Unaffiliated Shareholders % |
| VIP Asset Manager Portfolio | 44% | 2 | 27% |
13. Coronavirus (COVID-19) Pandemic.
An outbreak of COVID-19 first detected in China during December 2019 has since spread globally and was declared a pandemic by the World Health Organization during March 2020. Developments that disrupt global economies and financial markets, such as the COVID-19 pandemic, may magnify factors that affect the Fund's performance.
Shareholder Expense Example
As a shareholder, you incur two types of costs: (1) transaction costs, which may include sales charges (loads) on purchase payments or redemption proceeds, as applicable and (2) ongoing costs, which generally include management fees, distribution and/or service (12b-1) fees and other Fund expenses. This Example is intended to help you understand your ongoing costs (in dollars) of investing in a fund and to compare these costs with the ongoing costs of investing in other mutual funds.
The Example is based on an investment of $1,000 invested at the beginning of the period and held for the entire period (January 1, 2022 to June 30, 2022).
Actual Expenses
The first line of the accompanying table provides information about actual account values and actual expenses. You may use the information in this line, together with the amount you invested, to estimate the expenses that you paid over the period. Simply divide your account value by $1,000.00 (for example, an $8,600 account value divided by $1,000.00 = 8.6), then multiply the result by the number in the first line for a class/Fund under the heading entitled "Expenses Paid During Period" to estimate the expenses you paid on your account during this period. If any fund is a shareholder of any underlying mutual funds or exchange-traded funds (ETFs) (the Underlying Funds), such fund indirectly bears its proportional share of the expenses of the Underlying Funds in addition to the direct expenses incurred presented in the table. These fees and expenses are not included in the annualized expense ratio used to calculate the expense estimate in the table below. The estimate of expenses does not include any fees or other expenses of any variable annuity or variable life insurance product. If they were, the estimate of expenses you paid during the period would be higher, and your ending account value would be lower.
Hypothetical Example for Comparison Purposes
The second line of the accompanying table provides information about hypothetical account values and hypothetical expenses based on the actual expense ratio and an assumed rate of return of 5% per year before expenses, which is not the actual return. The hypothetical account values and expenses may not be used to estimate the actual ending account balance or expenses you paid for the period. You may use this information to compare the ongoing costs of investing in the Fund and other funds. To do so, compare this 5% hypothetical example with the 5% hypothetical examples that appear in the shareholder reports of the other funds. If any fund is a shareholder of any Underlying Funds, such fund indirectly bears its proportional share of the expenses of the Underlying Funds in addition to the direct expenses as presented in the table. These fees and expenses are not included in the annualized expense ratio used to calculate the expense estimate in the table below. The estimate of expenses does not include any fees or other expenses of any variable annuity or variable life insurance product. If they were, the estimate of expenses you paid during the period would be higher, and your ending account value would be lower.
Please note that the expenses shown in the table are meant to highlight your ongoing costs only and do not reflect any transaction costs. Therefore, the second line of the table is useful in comparing ongoing costs only, and will not help you determine the relative total costs of owning different funds. In addition, if these transactional costs were included, your costs would have been higher.
| Annualized Expense Ratio-A | Beginning Account Value January 1, 2022 | Ending Account Value June 30, 2022 | Expenses Paid During Period-B January 1, 2022 to June 30, 2022 |
|
| VIP Asset Manager Portfolio | ||||
| Initial Class | .58% | |||
| Actual | $1,000.00 | $845.20 | $2.65 | |
| Hypothetical-C | $1,000.00 | $1,021.92 | $2.91 | |
| Service Class | .68% | |||
| Actual | $1,000.00 | $844.60 | $3.11 | |
| Hypothetical-C | $1,000.00 | $1,021.42 | $3.41 | |
| Service Class 2 | .83% | |||
| Actual | $1,000.00 | $844.00 | $3.79 | |
| Hypothetical-C | $1,000.00 | $1,020.68 | $4.16 | |
| Investor Class | .66% | |||
| Actual | $1,000.00 | $845.10 | $3.02 | |
| Hypothetical-C | $1,000.00 | $1,021.52 | $3.31 |
A Annualized expense ratio reflects expenses net of applicable fee waivers.
B Expenses are equal to the annualized expense ratio, multiplied by the average account value over the period, multiplied by 181/ 365 (to reflect the one-half year period). The fees and expenses of any Underlying Funds are not included in each annualized expense ratio.
C 5% return per year before expenses
Liquidity Risk Management Program
The Securities and Exchange Commission adopted Rule 22e-4 under the Investment Company Act of 1940 (the Liquidity Rule) to promote effective liquidity risk management throughout the open-end investment company industry, thereby reducing the risk that funds will be unable to meet their redemption obligations and mitigating dilution of the interests of fund shareholders.
The Fund has adopted and implemented a liquidity risk management program pursuant to the Liquidity Rule (the Program) effective December 1, 2018. The Program is reasonably designed to assess and manage the Fund’s liquidity risk and to comply with the requirements of the Liquidity Rule. The Fund’s Board of Trustees (the Board) has designated the Fund’s investment adviser as administrator of the Program. The Fidelity advisers have established a Liquidity Risk Management Committee (the LRM Committee) to manage the Program for each of the Fidelity Funds. The LRM Committee monitors the adequacy and effectiveness of implementation of the Program and on a periodic basis assesses each Fund’s liquidity risk based on a variety of factors including (1) the Fund’s investment strategy, (2) portfolio liquidity and cash flow projections during normal and reasonably foreseeable stressed conditions, (3) shareholder redemptions, (4) borrowings and other funding sources and (5) in the case of exchange-traded funds, certain additional factors including the effect of the Fund’s prices and spreads, market participants, and basket compositions on the overall liquidity of the Fund’s portfolio, as applicable.
In accordance with the Program, each of the Fund’s portfolio investments is classified into one of four liquidity categories described below based on a determination of a reasonable expectation for how long it would take to convert the investment to cash (or sell or dispose of the investment) without significantly changing its market value.
- Highly liquid investments – cash or convertible to cash within three business days or less
- Moderately liquid investments – convertible to cash in three to seven calendar days
- Less liquid investments – can be sold or disposed of, but not settled, within seven calendar days
- Illiquid investments – cannot be sold or disposed of within seven calendar days
Liquidity classification determinations take into account a variety of factors including various market, trading and investment-specific considerations, as well as market depth, and generally utilize analysis from a third-party liquidity metrics service.
The Liquidity Rule places a 15% limit on a fund’s illiquid investments and requires funds that do not primarily hold assets that are highly liquid investments to determine and maintain a minimum percentage of the fund’s net assets to be invested in highly liquid investments (highly liquid investment minimum or HLIM). The Program includes provisions reasonably designed to comply with the 15% limit on illiquid investments and for determining, periodically reviewing and complying with the HLIM requirement as applicable.
At a recent meeting of the Fund’s Board of Trustees, the LRM Committee provided a written report to the Board pertaining to the operation, adequacy, and effectiveness of implementation of the Program for the annual period from December 1, 2020 through November 30, 2021. The report concluded that the Program has been implemented and is operating effectively and is reasonably designed to assess and manage the Fund’s liquidity risk.
![]()
VIPAM-SANN-0822
1.705701.124
Fidelity® Variable Insurance Products:
Asset Manager: Growth Portfolio
Semi-Annual Report
June 30, 2022
Contents
To view a fund's proxy voting guidelines and proxy voting record for the 12-month period ended June 30, visit http://www.fidelity.com/proxyvotingresults or visit the Securities and Exchange Commission's (SEC) web site at http://www.sec.gov.
You may also call 1-877-208-0098 to request a free copy of the proxy voting guidelines.
Fidelity® Variable Insurance Products are separate account options which are purchased through a variable insurance contract.
Standard & Poor's, S&P and S&P 500 are registered service marks of The McGraw-Hill Companies, Inc. and have been licensed for use by Fidelity Distributors Corporation.
Other third-party marks appearing herein are the property of their respective owners.
All other marks appearing herein are registered or unregistered trademarks or service marks of FMR LLC or an affiliated company. © 2022 FMR LLC. All rights reserved.
This report and the financial statements contained herein are submitted for the general information of the shareholders of the Fund. This report is not authorized for distribution to prospective investors in the Fund unless preceded or accompanied by an effective prospectus.
A fund files its complete schedule of portfolio holdings with the SEC for the first and third quarters of each fiscal year on Form N-PORT. Forms N-PORT are available on the SEC’s web site at http://www.sec.gov. A fund's Forms N-PORT may be reviewed and copied at the SEC’s Public Reference Room in Washington, DC. Information regarding the operation of the SEC's Public Reference Room may be obtained by calling 1-800-SEC-0330.
For a complete list of a fund's portfolio holdings, view the most recent holdings listing, semiannual report, or annual report on Fidelity's web site at http://www.fidelity.com, http://www.institutional.fidelity.com, or http://www.401k.com, as applicable.
NOT FDIC INSURED •MAY LOSE VALUE •NO BANK GUARANTEE
Neither the Fund nor Fidelity Distributors Corporation is a bank.
Note to Shareholders:
Early in 2020, the outbreak and spread of COVID-19 emerged as a public health emergency that had a major influence on financial markets, primarily based on its impact on the global economy and corporate earnings. On March 11, 2020, the World Health Organization declared the COVID-19 outbreak a pandemic, citing sustained risk of further global spread. The pandemic prompted a number of measures to limit the spread of COVID-19, including travel and border restrictions, quarantines, and restrictions on large gatherings. In turn, these resulted in lower consumer activity, diminished demand for a wide range of products and services, disruption in manufacturing and supply chains, and – given the wide variability in outcomes regarding the outbreak – significant market uncertainty and volatility. To help stem the turmoil, the U.S. government took unprecedented action – in concert with the U.S. Federal Reserve and central banks around the world – to help support consumers, businesses, and the broader economy, and to limit disruption to the financial system.
In general, the overall impact of the pandemic lessened in 2021, amid a resilient economy and widespread distribution of three COVID-19 vaccines granted emergency use authorization from the U.S. Food and Drug Administration (FDA) early in the year. Still, the situation remains dynamic, and the extent and duration of its influence on financial markets and the economy is highly uncertain, due in part to a recent spike in cases based on highly contagious variants of the coronavirus.
Extreme events such as the COVID-19 crisis are exogenous shocks that can have significant adverse effects on mutual funds and their investments. Although multiple asset classes may be affected by market disruption, the duration and impact may not be the same for all types of assets. Fidelity is committed to helping you stay informed amid news about COVID-19 and during increased market volatility, and we continue to take extra steps to be responsive to customer needs. We encourage you to visit us online, where we offer ongoing updates, commentary, and analysis on the markets and our funds.
On June 1, 2022, the fund's composite benchmark began transitioning to a new domestic equity neutral allocation of 42% and new international equity neutral allocation of 28%. The fund will reach its new neutral allocations during the third quarter of 2022.
Investment Summary (Unaudited)
The information in the following tables is based on the combined investments of the Fund and its pro-rata share of the investments of Fidelity's Central Funds, other than the Commodity Strategy and Money Market Central Funds.Top Ten Stocks as of June 30, 2022
| % of fund's net assets | |
| Microsoft Corp. | 3.1 |
| Apple, Inc. | 3.0 |
| Alphabet, Inc. Class A | 1.8 |
| Amazon.com, Inc. | 1.3 |
| UnitedHealth Group, Inc. | 0.8 |
| Exxon Mobil Corp. | 0.7 |
| Bank of America Corp. | 0.6 |
| Meta Platforms, Inc. Class A | 0.6 |
| Taiwan Semiconductor Manufacturing Co. Ltd. | 0.6 |
| The Travelers Companies, Inc | 0.6 |
| 13.1 |
Market Sectors as of June 30, 2022
| % of fund's net assets | |
| Information Technology | 15.5 |
| Financials | 14.3 |
| Health Care | 9.6 |
| Consumer Discretionary | 9.2 |
| Industrials | 7.8 |
| Communication Services | 6.1 |
| Consumer Staples | 5.2 |
| Energy | 4.0 |
| Real Estate | 3.7 |
| Materials | 3.2 |
| Utilities | 2.3 |
Asset Allocation (% of fund's net assets)
| As of June 30, 2022 | ||
| Stock Class and Equity Futures | 75.2% | |
| Bonds | 24.4% | |
| Short-Term Class | 0.4% | |

Geographic Diversification (% of fund's net assets)
| As of June 30, 2022 | ||
| United States of America* | 73.4% | |
| Cayman Islands | 3.0% | |
| United Kingdom | 2.6% | |
| France | 2.6% | |
| Canada | 2.2% | |
| Switzerland | 2.0% | |
| Japan | 1.9% | |
| Germany | 1.4% | |
| Netherlands | 1.4% | |
| Other | 9.5% | |
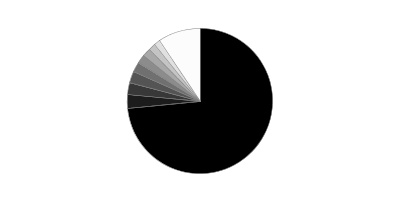
* Includes Short-Term investments and Net Other Assets (Liabilities).
Percentages are based on country or territory of incorporation and are adjusted for the effect of futures contracts, if applicable.
Asset allocations in the pie chart reflects the categorization of assets as defined in the Fund’s prospectus in effect as of the time periods indicated above. Financial Statement categorizations conform to accounting standards and will differ from the pie chart. Percentages are adjusted for the effect of future contracts and swap contracts, if applicable.
An unaudited holdings listing for the Fund, which presents direct holdings as well as the pro-rata share of any securities and other investments held indirectly through its investment in underlying Fidelity Central Funds, other than the Commodity Strategy and Money Market Central Funds, is available at institutional.fidelity.com.
Percentages in the above tables are adjusted for the effect of TBA Sale Commitments.
Schedule of Investments June 30, 2022 (Unaudited)
Showing Percentage of Net Assets
| U.S. Treasury Obligations - 0.3% | |||
| Principal Amount | Value | ||
| U.S. Treasury Bills, yield at date of purchase 1.04% to 1.22% 8/25/22 to 9/8/22 (a) | |||
| (Cost $738,537) | 740,000 | 738,049 | |
| Shares | Value | ||
| Fixed-Income Funds - 25.1% | |||
| Fidelity Emerging Markets Debt Central Fund (b) | 135,419 | $1,014,291 | |
| Fidelity Emerging Markets Debt Local Currency Central Fund (b) | 7,403 | 602,709 | |
| Fidelity Floating Rate Central Fund (b) | 79,786 | 7,492,705 | |
| Fidelity High Income Central Fund (b) | 18,125 | 1,805,020 | |
| Fidelity Inflation-Protected Bond Index Central Fund (b) | 47,327 | 4,763,447 | |
| Fidelity International Credit Central Fund (b) | 33,590 | 2,836,042 | |
| Fidelity VIP Investment Grade Central Fund (b) | 332,196 | 31,870,897 | |
| iShares 20+ Year Treasury Bond ETF (c) | 41,524 | 4,769,863 | |
| TOTAL FIXED-INCOME FUNDS | |||
| (Cost $59,855,833) | 55,154,974 | ||
| Money Market Funds - 2.6% | |||
| Fidelity Cash Central Fund 1.58% (d) | 786,561 | 786,718 | |
| Fidelity Securities Lending Cash Central Fund 1.58% (d)(e) | 4,823,893 | 4,824,375 | |
| TOTAL MONEY MARKET FUNDS | |||
| (Cost $5,611,093) | 5,611,093 | ||
| Equity Funds - 74.4% | |||
| Domestic Equity Funds - 51.7% | |||
| Fidelity Commodity Strategy Central Fund (b) | 702,779 | 4,174,504 | |
| Fidelity Real Estate Equity Central Fund (b) | 16,931 | 2,135,163 | |
| Fidelity U.S. Equity Central Fund (b) | 1,013,436 | 103,654,239 | |
| iShares MSCI USA Minimum Volatility ETF | 48,583 | 3,411,012 | |
| TOTAL DOMESTIC EQUITY FUNDS | 113,374,918 | ||
| International Equity Funds - 22.7% | |||
| Fidelity Emerging Markets Equity Central Fund (b) | 88,321 | 16,935,537 | |
| Fidelity International Equity Central Fund (b) | 413,968 | 32,947,710 | |
| TOTAL INTERNATIONAL EQUITY FUNDS | 49,883,247 | ||
| TOTAL EQUITY FUNDS | |||
| (Cost $133,981,523) | 163,258,165 | ||
| TOTAL INVESTMENT IN SECURITIES - 102.4% | |||
| (Cost $200,186,986) | 224,762,281 | ||
| NET OTHER ASSETS (LIABILITIES) - (2.4)% | (5,183,316) | ||
| NET ASSETS - 100% | $219,578,965 |
| Futures Contracts | |||||
| Number of contracts | Expiration Date | Notional Amount | Value | Unrealized Appreciation/(Depreciation) | |
| Purchased | |||||
| Equity Index Contracts | |||||
| ICE E-mini MSCI EAFE Index Contracts (United States) | 12 | Sept. 2022 | $1,113,960 | $981 | $981 |
| ICE E-mini MSCI Emerging Markets Index Contracts (United States) | 62 | Sept. 2022 | 3,108,370 | (1,784) | (1,784) |
| TOTAL PURCHASED | $(803) | ||||
| Sold | |||||
| Equity Index Contracts | |||||
| CME E-mini S&P 500 Index Contracts (United States) | 36 | Sept. 2022 | 6,821,100 | (57,102) | (57,102) |
| TOTAL FUTURES CONTRACTS | $(57,905) |
The notional amount of futures purchased as a percentage of Net Assets is 1.9%
The notional amount of futures sold as a percentage of Net Assets is 3.1%
Security Type Abbreviations
ETF – Exchange-Traded Fund
Legend
(a) Security or a portion of the security was pledged to cover margin requirements for futures contracts. At period end, the value of securities pledged amounted to $506,734.
(b) Affiliated fund that is generally available only to investment companies and other accounts managed by Fidelity Investments. A complete unaudited schedule of portfolio holdings for each Fidelity Central Fund is filed with the SEC for the first and third quarters of each fiscal year on Form N-PORT and is available upon request or at the SEC's website at www.sec.gov. An unaudited holdings listing for the Fund, which presents direct holdings as well as the pro-rata share of securities and other investments held indirectly through its investment in underlying non-money market Fidelity Central Funds, other than the Commodity Strategy Central Fund, is available at fidelity.com and/or institutional.fidelity.com, as applicable. In addition, each Fidelity Central Fund's financial statements are available on the SEC's website or upon request.
(c) Security or a portion of the security is on loan at period end.
(d) Affiliated fund that is generally available only to investment companies and other accounts managed by Fidelity Investments. The rate quoted is the annualized seven-day yield of the fund at period end. A complete unaudited listing of the fund's holdings as of its most recent quarter end is available upon request. In addition, each Fidelity Central Fund's financial statements are available on the SEC's website or upon request.
(e) Investment made with cash collateral received from securities on loan.
Affiliated Central Funds
Fiscal year to date information regarding the Fund's investments in Fidelity Central Funds, including the ownership percentage, is presented below.
| Affiliate | Value, beginning of period | Purchases | Sales Proceeds | Dividend Income | Realized Gain (loss) | Change in Unrealized appreciation (depreciation) | Value, end of period | % ownership, end of period |
| Fidelity Cash Central Fund 1.58% | $253,014 | $13,367,964 | $12,834,260 | $2,753 | $-- | $-- | $786,718 | 0.0% |
| Fidelity Commodity Strategy Central Fund | 4,419,654 | 571,890 | 1,713,810 | -- | 385,657 | 511,113 | 4,174,504 | 0.6% |
| Fidelity Emerging Markets Debt Central Fund | 1,229,893 | 57,242 | 69,978 | 25,258 | (9,374) | (193,492) | 1,014,291 | 0.0% |
| Fidelity Emerging Markets Debt Local Currency Central Fund | 683,888 | 7,056 | -- | 7,057 | -- | (88,235) | 602,709 | 0.7% |
| Fidelity Emerging Markets Equity Central Fund | 14,633,657 | 6,956,363 | 678,781 | 8 | 84,720 | (4,060,422) | 16,935,537 | 0.9% |
| Fidelity Floating Rate Central Fund | 10,232,956 | 419,509 | 2,548,453 | 212,461 | (51,172) | (560,135) | 7,492,705 | 0.3% |
| Fidelity High Income Central Fund | 2,077,275 | 92,712 | 79,564 | 53,389 | (2,211) | (283,192) | 1,805,020 | 0.1% |
| Fidelity Inflation-Protected Bond Index Central Fund | 7,906,056 | 117,990 | 2,994,922 | 2,598 | (23,336) | (242,341) | 4,763,447 | 0.8% |
| Fidelity International Credit Central Fund | 4,155,499 | 104,104 | 847,000 | 39,844 | (49,828) | (526,733) | 2,836,042 | 0.6% |
| Fidelity International Equity Central Fund | 37,206,841 | 6,323,426 | 1,258,510 | 369,277 | (98,878) | (9,225,169) | 32,947,710 | 0.9% |
| Fidelity Real Estate Equity Central Fund | 5,673,564 | 93,017 | 2,560,329 | 10,658 | (67,388) | (1,003,701) | 2,135,163 | 0.2% |
| Fidelity Securities Lending Cash Central Fund 1.58% | -- | 23,574,095 | 18,749,720 | 2,813 | -- | -- | 4,824,375 | 0.0% |
| Fidelity U.S. Equity Central Fund | 147,070,309 | 3,059,067 | 14,543,213 | 580,010 | (1,650,528) | (30,281,396) | 103,654,239 | 0.6% |
| Fidelity VIP Investment Grade Central Fund | 28,998,612 | 8,683,532 | 1,962,674 | 611,954 | (96,910) | (3,751,663) | 31,870,897 | 1.4% |
| $264,541,218 | $63,427,967 | $60,841,214 | $1,918,080 | $(1,579,248) | $(49,705,366) | $215,843,357 |
Amounts in the income column in the above table include any capital gain distributions from underlying funds, which are presented in the corresponding line-item in the Statement of Operations, if applicable. Amount for Fidelity Securities Lending Cash Central Fund represents the income earned on investing cash collateral, less rebates paid to borrowers and any lending agent fees associated with the loan, plus any premium payments received for lending certain types of securities.
Investment Valuation
The following is a summary of the inputs used, as of June 30, 2022, involving the Fund's assets and liabilities carried at fair value. The inputs or methodology used for valuing securities may not be an indication of the risk associated with investing in those securities. For more information on valuation inputs, and their aggregation into the levels used below, please refer to the Investment Valuation section in the accompanying Notes to Financial Statements.
| Valuation Inputs at Reporting Date: | ||||
| Description | Total | Level 1 | Level 2 | Level 3 |
| Investments in Securities: | ||||
| U.S. Government and Government Agency Obligations | $738,049 | $-- | $738,049 | $-- |
| Fixed-Income Funds | 55,154,974 | 55,154,974 | -- | -- |
| Money Market Funds | 5,611,093 | 5,611,093 | -- | -- |
| Equity Funds | 163,258,165 | 163,258,165 | -- | -- |
| Total Investments in Securities: | $224,762,281 | $224,024,232 | $738,049 | $-- |
| Derivative Instruments: | ||||
| Assets | ||||
| Futures Contracts | $981 | $981 | $-- | $-- |
| Total Assets | $981 | $981 | $-- | $-- |
| Liabilities | ||||
| Futures Contracts | $(58,886) | $(58,886) | $-- | $-- |
| Total Liabilities | $(58,886) | $(58,886) | $-- | $-- |
| Total Derivative Instruments: | $(57,905) | $(57,905) | $-- | $-- |
Value of Derivative Instruments
The following table is a summary of the Fund's value of derivative instruments by primary risk exposure as of June 30, 2022. For additional information on derivative instruments, please refer to the Derivative Instruments section in the accompanying Notes to Financial Statements.
| Primary Risk Exposure / Derivative Type | Value | |
| Asset | Liability | |
| Equity Risk | ||
| Futures Contracts(a) | $981 | $(58,886) |
| Total Equity Risk | 981 | (58,886) |
| Total Value of Derivatives | $981 | $(58,886) |
(a) Reflects gross cumulative appreciation (depreciation) on futures contracts as presented in the Schedule of Investments. In the Statement of Assets and Liabilities, the period end daily variation margin is included in receivable or payable for daily variation margin on futures contracts, and the net cumulative appreciation (depreciation) is included in Total accumulated earnings (loss).
Other Information
The information in the following tables is based on the combined investments of the Fund and its pro-rata share of the investments of Fidelity's Central Funds, other than the Commodity Strategy and Money Market Central Funds. Percentages in the below tables are adjusted for the effect of TBA Sale Commitments.
The composition of credit quality ratings as a percentage of Total Net Assets is as follows (Unaudited):
| U.S. Government and U.S. Government Agency Obligations | 10.7% |
| AAA,AA,A | 2.9% |
| BBB | 3.3% |
| BB | 1.8% |
| B | 2.7% |
| CCC,CC,C | 0.3% |
| D | 0.0%(a) |
| Not Rated | 0.8% |
| Equities | 75.0% |
| Short-Term Investments and Net Other Assets | 2.5% |
| 100.0% |
(a) Percentages shown as 0.0% may reflect amounts less than 0.05%.
We have used ratings from Moody's Investors Service, Inc. Where Moody's® ratings are not available, we have used S&P® ratings. All ratings are as of the date indicated and do not reflect subsequent changes.
See accompanying notes which are an integral part of the financial statements.
Financial Statements
Statement of Assets and Liabilities
| June 30, 2022 (Unaudited) | ||
| Assets | ||
| Investment in securities, at value (including securities loaned of $4,767,105) — See accompanying schedule: Unaffiliated issuers (cost $10,477,244) | $8,918,924 | |
| Fidelity Central Funds (cost $189,709,742) | 215,843,357 | |
| Total Investment in Securities (cost $200,186,986) | $224,762,281 | |
| Cash | 17,853 | |
| Receivable for investments sold | 4,923,134 | |
| Receivable for fund shares sold | 1,754 | |
| Distributions receivable from Fidelity Central Funds | 2,910 | |
| Receivable for daily variation margin on futures contracts | 40,734 | |
| Total assets | 229,748,666 | |
| Liabilities | ||
| Payable for investments purchased | $5,162,257 | |
| Payable for fund shares redeemed | 27,342 | |
| Accrued management fee | 99,340 | |
| Distribution and service plan fees payable | 972 | |
| Other affiliated payables | 28,993 | |
| Other payables and accrued expenses | 26,422 | |
| Collateral on securities loaned | 4,824,375 | |
| Total liabilities | 10,169,701 | |
| Net Assets | $219,578,965 | |
| Net Assets consist of: | ||
| Paid in capital | $193,465,853 | |
| Total accumulated earnings (loss) | 26,113,112 | |
| Net Assets | $219,578,965 | |
| Net Asset Value and Maximum Offering Price | ||
| Initial Class: | ||
| Net Asset Value, offering price and redemption price per share ($87,487,771 ÷ 4,655,458 shares) | $18.79 | |
| Service Class: | ||
| Net Asset Value, offering price and redemption price per share ($2,899,402 ÷ 155,883 shares) | $18.60 | |
| Service Class 2: | ||
| Net Asset Value, offering price and redemption price per share ($3,410,037 ÷ 184,867 shares) | $18.45 | |
| Investor Class: | ||
| Net Asset Value, offering price and redemption price per share ($125,781,755 ÷ 6,746,294 shares) | $18.64 |
See accompanying notes which are an integral part of the financial statements.
Statement of Operations
| Six months ended June 30, 2022 (Unaudited) | ||
| Investment Income | ||
| Dividends | $51,760 | |
| Interest | 1,105 | |
| Income from Fidelity Central Funds (including $2,813 from security lending) | 1,634,998 | |
| Total income | 1,687,863 | |
| Expenses | ||
| Management fee | $648,020 | |
| Transfer agent fees | 128,541 | |
| Distribution and service plan fees | 6,163 | |
| Accounting fees | 60,296 | |
| Custodian fees and expenses | 11,733 | |
| Independent trustees' fees and expenses | 384 | |
| Audit | 21,086 | |
| Legal | 806 | |
| Miscellaneous | 485 | |
| Total expenses before reductions | 877,514 | |
| Expense reductions | (3,861) | |
| Total expenses after reductions | 873,653 | |
| Net investment income (loss) | 814,210 | |
| Realized and Unrealized Gain (Loss) | ||
| Net realized gain (loss) on: | ||
| Investment securities: | ||
| Unaffiliated issuers | (356,430) | |
| Fidelity Central Funds | (1,579,248) | |
| Futures contracts | 2,324,187 | |
| Capital gain distributions from Fidelity Central Funds | 283,082 | |
| Total net realized gain (loss) | 671,591 | |
| Change in net unrealized appreciation (depreciation) on: | ||
| Investment securities: | ||
| Unaffiliated issuers | (1,159,336) | |
| Fidelity Central Funds | (49,705,366) | |
| Assets and liabilities in foreign currencies | (147) | |
| Futures contracts | 54,026 | |
| Total change in net unrealized appreciation (depreciation) | (50,810,823) | |
| Net gain (loss) | (50,139,232) | |
| Net increase (decrease) in net assets resulting from operations | $(49,325,022) |
See accompanying notes which are an integral part of the financial statements.
Statement of Changes in Net Assets
| Six months ended June 30, 2022 (Unaudited) | Year ended December 31, 2021 | |
| Increase (Decrease) in Net Assets | ||
| Operations | ||
| Net investment income (loss) | $814,210 | $3,737,846 |
| Net realized gain (loss) | 671,591 | 17,208,890 |
| Change in net unrealized appreciation (depreciation) | (50,810,823) | 12,938,904 |
| Net increase (decrease) in net assets resulting from operations | (49,325,022) | 33,885,640 |
| Distributions to shareholders | (15,098,425) | (7,380,601) |
| Share transactions - net increase (decrease) | 10,630,537 | 1,589,433 |
| Total increase (decrease) in net assets | (53,792,910) | 28,094,472 |
| Net Assets | ||
| Beginning of period | 273,371,875 | 245,277,403 |
| End of period | $219,578,965 | $273,371,875 |
See accompanying notes which are an integral part of the financial statements.
Financial Highlights
VIP Asset Manager: Growth Portfolio Initial Class
| Six months ended (Unaudited) June 30, | Years endedDecember 31, | |||||
| 2022 | 2021 | 2020 | 2019 | 2018 | 2017 | |
| Selected Per–Share Data | ||||||
| Net asset value, beginning of period | $24.38 | $22.00 | $19.20 | $16.76 | $19.21 | $18.81 |
| Income from Investment Operations | ||||||
| Net investment income (loss)A,B | .07 | .35 | .21 | .28 | .26 | .25 |
| Net realized and unrealized gain (loss) | (4.31) | 2.71 | 3.09 | 3.42 | (1.69) | 2.97 |
| Total from investment operations | (4.24) | 3.06 | 3.30 | 3.70 | (1.43) | 3.22 |
| Distributions from net investment income | (.01) | (.34) | (.22) | (.29) | (.28) | (.24) |
| Distributions from net realized gain | (1.34) | (.34) | (.27) | (.97) | (.74) | (2.58) |
| Total distributions | (1.35) | (.68) | (.50)C | (1.26) | (1.02) | (2.82) |
| Net asset value, end of period | $18.79 | $24.38 | $22.00 | $19.20 | $16.76 | $19.21 |
| Total ReturnD,E,F | (18.15)% | 13.96% | 17.27% | 22.83% | (7.65)% | 18.73% |
| Ratios to Average Net AssetsB,G,H | ||||||
| Expenses before reductions | .67%I | .67% | .67% | .68% | .68% | .69% |
| Expenses net of fee waivers, if any | .66%I | .66% | .67% | .68% | .68% | .69% |
| Expenses net of all reductions | .66%I | .66% | .67% | .68% | .68% | .69% |
| Net investment income (loss) | .71%I | 1.46% | 1.12% | 1.58% | 1.40% | 1.32% |
| Supplemental Data | ||||||
| Net assets, end of period (000 omitted) | $87,488 | $111,781 | $106,148 | $99,971 | $89,477 | $106,903 |
| Portfolio turnover rateJ | 24%I | 25% | 23% | 35% | 32% | 29% |
A Calculated based on average shares outstanding during the period.
B Net investment income (loss) is affected by the timing of the declaration of dividends by any underlying mutual funds or exchange-traded funds (ETFs). Net investment income (loss) of any such underlying funds is not included in the Fund's net investment income (loss) ratio.
C Total distributions per share do not sum due to rounding.
D Total returns for periods of less than one year are not annualized.
E Total returns do not reflect charges attributable to your insurance company's separate account. Inclusion of these charges would reduce the total returns shown.
F Total returns would have been lower if certain expenses had not been reduced during the applicable periods shown.
G Fees and expenses of any underlying mutual funds or exchange-traded funds (ETFs) are not included in the Fund's expense ratio. The Fund indirectly bears its proportionate share of these expenses. For additional expense information related to investments in Fidelity Central Funds, please refer to the "Investments in Fidelity Central Funds" note found in the Notes to Financial Statements section of the most recent Annual or Semi-Annual report.
H Expense ratios reflect operating expenses of the class. Expenses before reductions do not reflect amounts reimbursed, waived, or reduced through arrangements with the investment adviser, brokerage services, or other offset arrangements, if applicable, and do not represent the amount paid by the class during periods when reimbursements, waivers or reductions occur.
I Annualized
J Amount does not include the portfolio activity of any underlying mutual funds or exchange-traded funds (ETFs).
See accompanying notes which are an integral part of the financial statements.
VIP Asset Manager: Growth Portfolio Service Class
| Six months ended (Unaudited) June 30, | Years endedDecember 31, | |||||
| 2022 | 2021 | 2020 | 2019 | 2018 | 2017 | |
| Selected Per–Share Data | ||||||
| Net asset value, beginning of period | $24.16 | $21.80 | $19.04 | $16.63 | $19.07 | $18.68 |
| Income from Investment Operations | ||||||
| Net investment income (loss)A,B | .06 | .32 | .19 | .26 | .24 | .23 |
| Net realized and unrealized gain (loss) | (4.27) | 2.70 | 3.05 | 3.39 | (1.68) | 2.96 |
| Total from investment operations | (4.21) | 3.02 | 3.24 | 3.65 | (1.44) | 3.19 |
| Distributions from net investment income | (.01) | (.32) | (.20) | (.27) | (.26) | (.22) |
| Distributions from net realized gain | (1.34) | (.34) | (.27) | (.97) | (.74) | (2.58) |
| Total distributions | (1.35) | (.66) | (.48)C | (1.24) | (1.00) | (2.80) |
| Net asset value, end of period | $18.60 | $24.16 | $21.80 | $19.04 | $16.63 | $19.07 |
| Total ReturnD,E,F | (18.20)% | 13.89% | 17.09% | 22.72% | (7.75)% | 18.70% |
| Ratios to Average Net AssetsB,G,H | ||||||
| Expenses before reductions | .77%I | .77% | .77% | .78% | .78% | .79% |
| Expenses net of fee waivers, if any | .76%I | .76% | .77% | .78% | .78% | .79% |
| Expenses net of all reductions | .76%I | .76% | .77% | .78% | .78% | .79% |
| Net investment income (loss) | .61%I | 1.36% | 1.02% | 1.48% | 1.30% | 1.22% |
| Supplemental Data | ||||||
| Net assets, end of period (000 omitted) | $2,899 | $3,609 | $3,363 | $3,009 | $2,621 | $3,018 |
| Portfolio turnover rateJ | 24%I | 25% | 23% | 35% | 32% | 29% |
A Calculated based on average shares outstanding during the period.
B Net investment income (loss) is affected by the timing of the declaration of dividends by any underlying mutual funds or exchange-traded funds (ETFs). Net investment income (loss) of any such underlying funds is not included in the Fund's net investment income (loss) ratio.
C Total distributions per share do not sum due to rounding.
D Total returns for periods of less than one year are not annualized.
E Total returns do not reflect charges attributable to your insurance company's separate account. Inclusion of these charges would reduce the total returns shown.
F Total returns would have been lower if certain expenses had not been reduced during the applicable periods shown.
G Fees and expenses of any underlying mutual funds or exchange-traded funds (ETFs) are not included in the Fund's expense ratio. The Fund indirectly bears its proportionate share of these expenses. For additional expense information related to investments in Fidelity Central Funds, please refer to the "Investments in Fidelity Central Funds" note found in the Notes to Financial Statements section of the most recent Annual or Semi-Annual report.
H Expense ratios reflect operating expenses of the class. Expenses before reductions do not reflect amounts reimbursed, waived, or reduced through arrangements with the investment adviser, brokerage services, or other offset arrangements, if applicable, and do not represent the amount paid by the class during periods when reimbursements, waivers or reductions occur.
I Annualized
J Amount does not include the portfolio activity of any underlying mutual funds or exchange-traded funds (ETFs).
See accompanying notes which are an integral part of the financial statements.
VIP Asset Manager: Growth Portfolio Service Class 2
| Six months ended (Unaudited) June 30, | Years endedDecember 31, | |||||
| 2022 | 2021 | 2020 | 2019 | 2018 | 2017 | |
| Selected Per–Share Data | ||||||
| Net asset value, beginning of period | $23.98 | $21.65 | $18.91 | $16.53 | $18.95 | $18.58 |
| Income from Investment Operations | ||||||
| Net investment income (loss)A,B | .05 | .28 | .16 | .24 | .21 | .20 |
| Net realized and unrealized gain (loss) | (4.23) | 2.67 | 3.03 | 3.36 | (1.67) | 2.94 |
| Total from investment operations | (4.18) | 2.95 | 3.19 | 3.60 | (1.46) | 3.14 |
| Distributions from net investment income | (.01) | (.29) | (.17) | (.24) | (.22) | (.20) |
| Distributions from net realized gain | (1.34) | (.34) | (.27) | (.97) | (.74) | (2.57) |
| Total distributions | (1.35) | (.62)C | (.45)C | (1.22)C | (.96) | (2.77) |
| Net asset value, end of period | $18.45 | $23.98 | $21.65 | $18.91 | $16.53 | $18.95 |
| Total ReturnD,E,F | (18.21)% | 13.69% | 16.95% | 22.49% | (7.88)% | 18.49% |
| Ratios to Average Net AssetsB,G,H | ||||||
| Expenses before reductions | .92%I | .92% | .92% | .93% | .93% | .94% |
| Expenses net of fee waivers, if any | .91%I | .91% | .92% | .93% | .93% | .94% |
| Expenses net of all reductions | .91%I | .91% | .92% | .93% | .93% | .94% |
| Net investment income (loss) | .46%I | 1.21% | .87% | 1.33% | 1.15% | 1.07% |
| Supplemental Data | ||||||
| Net assets, end of period (000 omitted) | $3,410 | $3,948 | $3,359 | $3,199 | $2,904 | $3,755 |
| Portfolio turnover rateJ | 24%I | 25% | 23% | 35% | 32% | 29% |
A Calculated based on average shares outstanding during the period.
B Net investment income (loss) is affected by the timing of the declaration of dividends by any underlying mutual funds or exchange-traded funds (ETFs). Net investment income (loss) of any such underlying funds is not included in the Fund's net investment income (loss) ratio.
C Total distributions per share do not sum due to rounding.
D Total returns for periods of less than one year are not annualized.
E Total returns do not reflect charges attributable to your insurance company's separate account. Inclusion of these charges would reduce the total returns shown.
F Total returns would have been lower if certain expenses had not been reduced during the applicable periods shown.
G Fees and expenses of any underlying mutual funds or exchange-traded funds (ETFs) are not included in the Fund's expense ratio. The Fund indirectly bears its proportionate share of these expenses. For additional expense information related to investments in Fidelity Central Funds, please refer to the "Investments in Fidelity Central Funds" note found in the Notes to Financial Statements section of the most recent Annual or Semi-Annual report.
H Expense ratios reflect operating expenses of the class. Expenses before reductions do not reflect amounts reimbursed, waived, or reduced through arrangements with the investment adviser, brokerage services, or other offset arrangements, if applicable, and do not represent the amount paid by the class during periods when reimbursements, waivers or reductions occur.
I Annualized
J Amount does not include the portfolio activity of any underlying mutual funds or exchange-traded funds (ETFs).
See accompanying notes which are an integral part of the financial statements.
VIP Asset Manager: Growth Portfolio Investor Class
| Six months ended (Unaudited) June 30, | Years endedDecember 31, | |||||
| 2022 | 2021 | 2020 | 2019 | 2018 | 2017 | |
| Selected Per–Share Data | ||||||
| Net asset value, beginning of period | $24.21 | $21.85 | $19.07 | $16.66 | $19.10 | $18.71 |
| Income from Investment Operations | ||||||
| Net investment income (loss)A,B | .07 | .33 | .20 | .27 | .25 | .23 |
| Net realized and unrealized gain (loss) | (4.29) | 2.69 | 3.06 | 3.39 | (1.69) | 2.97 |
| Total from investment operations | (4.22) | 3.02 | 3.26 | 3.66 | (1.44) | 3.20 |
| Distributions from net investment income | (.01) | (.33) | (.21) | (.28) | (.26) | (.23) |
| Distributions from net realized gain | (1.34) | (.34) | (.27) | (.97) | (.74) | (2.58) |
| Total distributions | (1.35) | (.66)C | (.48) | (1.25) | (1.00) | (2.81) |
| Net asset value, end of period | $18.64 | $24.21 | $21.85 | $19.07 | $16.66 | $19.10 |
| Total ReturnD,E,F | (18.20)% | 13.89% | 17.19% | 22.70% | (7.72)% | 18.68% |
| Ratios to Average Net AssetsB,G,H | ||||||
| Expenses before reductions | .74%I | .74% | .75% | .76% | .76% | .77% |
| Expenses net of fee waivers, if any | .74%I | .74% | .75% | .76% | .76% | .77% |
| Expenses net of all reductions | .74%I | .74% | .75% | .76% | .76% | .77% |
| Net investment income (loss) | .63%I | 1.38% | 1.04% | 1.50% | 1.32% | 1.24% |
| Supplemental Data | ||||||
| Net assets, end of period (000 omitted) | $125,782 | $154,034 | $132,407 | $121,229 | $104,010 | $116,417 |
| Portfolio turnover rateJ | 24%I | 25% | 23% | 35% | 32% | 29% |
A Calculated based on average shares outstanding during the period.
B Net investment income (loss) is affected by the timing of the declaration of dividends by any underlying mutual funds or exchange-traded funds (ETFs). Net investment income (loss) of any such underlying funds is not included in the Fund's net investment income (loss) ratio.
C Total distributions per share do not sum due to rounding.
D Total returns for periods of less than one year are not annualized.
E Total returns do not reflect charges attributable to your insurance company's separate account. Inclusion of these charges would reduce the total returns shown.
F Total returns would have been lower if certain expenses had not been reduced during the applicable periods shown.
G Fees and expenses of any underlying mutual funds or exchange-traded funds (ETFs) are not included in the Fund's expense ratio. The Fund indirectly bears its proportionate share of these expenses. For additional expense information related to investments in Fidelity Central Funds, please refer to the "Investments in Fidelity Central Funds" note found in the Notes to Financial Statements section of the most recent Annual or Semi-Annual report.
H Expense ratios reflect operating expenses of the class. Expenses before reductions do not reflect amounts reimbursed, waived, or reduced through arrangements with the investment adviser, brokerage services, or other offset arrangements, if applicable, and do not represent the amount paid by the class during periods when reimbursements, waivers or reductions occur.
I Annualized
J Amount does not include the portfolio activity of any underlying mutual funds or exchange-traded funds (ETFs).
See accompanying notes which are an integral part of the financial statements.
Notes to Financial Statements (Unaudited)
For the period ended June 30, 2022
1. Organization.
VIP Asset Manager: Growth Portfolio (the Fund) is a fund of Variable Insurance Products Fund V (the Trust) and is authorized to issue an unlimited number of shares. The Trust is registered under the Investment Company Act of 1940, as amended (the 1940 Act), as an open-end management investment company organized as a Massachusetts business trust. Shares of the Fund may only be purchased by insurance companies for the purpose of funding variable annuity or variable life insurance contracts. The Fund offers the following classes of shares: Initial Class shares, Service Class shares, Service Class 2 shares and Investor Class shares. In order to disclose class level financial information dollar amounts presented in the notes are unrounded. All classes have equal rights and voting privileges, except for matters affecting a single class.
2. Investments in Fidelity Central Funds.
Funds may invest in Fidelity Central Funds, which are open-end investment companies generally available only to other investment companies and accounts managed by the investment adviser and its affiliates. The Schedule of Investments lists any Fidelity Central Funds held as an investment as of period end, but does not include the underlying holdings of each Fidelity Central Fund. An investing fund indirectly bears its proportionate share of the expenses of the underlying Fidelity Central Funds.
Based on its investment objective, each Fidelity Central Fund may invest or participate in various investment vehicles or strategies that are similar to those of the investing fund. These strategies are consistent with the investment objectives of the investing fund and may involve certain economic risks which may cause a decline in value of each of the Fidelity Central Funds and thus a decline in the value of the investing fund.
| Fidelity Central Fund | Investment Manager | Investment Objective | Investment Practices | Expense Ratio(a) |
| Fidelity Commodity Strategy Central Fund | Geode Capital Management, LLC (Geode) | Seeks to provide investment returns that correspond to the performance of the commodities market. | Investment in commodity-related investments through a wholly-owned subsidiary organized under the laws of the Cayman Islands Futures Swaps | Less than .005% |
| Fidelity Emerging Markets Debt Central Fund | Fidelity Management & Research Company LLC (FMR) | Seeks high total return by normally investing in debt securities of issuers in emerging markets and other debt investments that are tied economically to emerging markets. | Delayed Delivery & When Issued Securities Foreign Securities Restricted Securities | Less than .005% |
| Fidelity Emerging Markets Equity Central Fund | Fidelity Management & Research Company LLC (FMR) | Seeks capital appreciation by investing primarily in equity securities of issuers in emerging markets. | Foreign Securities Futures | .02% |
| Fidelity International Equity Central Fund | Fidelity Management & Research Company LLC (FMR) | Seeks capital appreciation by investing primarily in non-U.S. based common stocks, including securities of issuers located in emerging markets. | Foreign Securities Futures | Less than .005% |
| Fidelity Floating Rate Central Fund | Fidelity Management & Research Company LLC (FMR) | Seeks a high level of income by normally investing in floating rate loans and other floating rate securities. | Foreign Securities Loans & Direct Debt Instruments Restricted Securities | Less than .005% |
| Fidelity High Income Central Fund | Fidelity Management & Research Company LLC (FMR) | Seeks a high level of income and may also seek capital appreciation by investing primarily in debt securities, preferred stocks, and convertible securities, with an emphasis on lower-quality debt securities. | Loans & Direct Debt Instruments Restricted Securities | .01% |
| Fidelity Inflation-Protected Bond Index Central Fund | Fidelity Management & Research Company LLC (FMR) | Seeks to provide investment results that correspond to the performance of the inflation-protected United States Treasury market, and may invest in derivatives. | Less than .005% | |
| Fidelity VIP Investment Grade Central Fund | Fidelity Management & Research Company LLC (FMR) | Seeks a high level of current income by normally investing in investment-grade debt securities and repurchase agreements. | Delayed Delivery & When Issued Securities Restricted Securities | Less than .005% |
| Fidelity Real Estate Equity Central Fund | Fidelity Management & Research Company LLC (FMR) | Seeks above-average income and long-term capital growth by investing primarily in equity securities of issuers in the real estate industry. | Restricted Securities | Less than .005% |
| Fidelity International Credit Central Fund | Fidelity Management & Research Company LLC (FMR) | Seeks a high level of current income by normally investing in debt securities of foreign issuers, including debt securities of issuers located in emerging markets. Foreign currency exposure is hedged utilizing foreign currency contracts. | Foreign Securities Forward Foreign Currency Contracts Futures Options Restricted Securities Swaps | Less than .005% |
| Fidelity U.S. Equity Central Fund | Fidelity Management & Research Company LLC (FMR) | Seeks capital appreciation by investing primarily in common stocks, allocated across different market sectors. | Foreign Securities Futures Restricted Securities | Less than .005% |
| Fidelity Emerging Markets Debt Local Currency Central Fund | Fidelity Management & Research Company LLC (FMR) | Seeks high total return by normally investing in debt securities of issuers in emerging markets and other debt investments that are tied economically to emerging markets and denominated in the local currency of the issuer. | Foreign Securities Restricted Securities | .02% |
| Fidelity Money Market Central Funds | Fidelity Management & Research Company LLC (FMR) | Each fund seeks to obtain a high level of current income consistent with the preservation of capital and liquidity. | Short-term Investments | Less than .005% |
(a) Expenses expressed as a percentage of average net assets and are as of each underlying Central Fund's most recent annual or semi-annual shareholder report.
An unaudited holdings listing for the investing fund, which presents direct holdings as well as the pro-rata share of any securities and other investments held indirectly through its investment in underlying non-money market Fidelity Central Funds, is available at fidelity.com and/or institutional.fidelity.com, as applicable. A complete unaudited list of holdings for each Fidelity Central Fund is available upon request or at the Securities and Exchange Commission website at www.sec.gov. In addition, the financial statements of the Fidelity Central Funds which contain the significant accounting policies (including investment valuation policies) of those funds, and are not covered by the Report of Independent Registered Public Accounting Firm, are available on the Securities and Exchange Commission website or upon request.
3. Significant Accounting Policies.
The Fund is an investment company and applies the accounting and reporting guidance of the Financial Accounting Standards Board (FASB) Accounting Standards Codification Topic 946 Financial Services - Investment Companies. The financial statements have been prepared in conformity with accounting principles generally accepted in the United States of America (GAAP), which require management to make certain estimates and assumptions at the date of the financial statements. Actual results could differ from those estimates. Subsequent events, if any, through the date that the financial statements were issued have been evaluated in the preparation of the financial statements. The Fund's Schedule of Investments lists any underlying mutual funds or exchange-traded funds (ETFs) but does not include the underlying holdings of these funds. The following summarizes the significant accounting policies of the Fund:
Investment Valuation. Investments are valued as of 4:00 p.m. Eastern time on the last calendar day of the period. The Board of Trustees (the Board) has delegated the day to day responsibility for the valuation of the Fund's investments to the Fair Value Committee (the Committee) established by the Fund's investment adviser. In accordance with valuation policies and procedures approved by the Board, the Fund attempts to obtain prices from one or more third party pricing vendors or brokers to value its investments. When current market prices, quotations or currency exchange rates are not readily available or reliable, investments will be fair valued in good faith by the Committee, in accordance with procedures adopted by the Board. Factors used in determining fair value vary by investment type and may include market or investment specific events, changes in interest rates and credit quality. The frequency with which these procedures are used cannot be predicted and they may be utilized to a significant extent. The Committee oversees the Fund's valuation policies and procedures and reports to the Board on the Committee's activities and fair value determinations. The Board monitors the appropriateness of the procedures used in valuing the Fund's investments and ratifies the fair value determinations of the Committee. The Fund categorizes the inputs to valuation techniques used to value its investments into a disclosure hierarchy consisting of three levels as shown below:
- Level 1 – unadjusted quoted prices in active markets for identical investments
- Level 2 – other significant observable inputs (including quoted prices for similar investments, interest rates, prepayment speeds, etc.)
- Level 3 – unobservable inputs (including the Fund's own assumptions based on the best information available)
Valuation techniques used to value the Fund's investments by major category are as follows. Debt securities, including restricted securities, are valued based on evaluated prices received from third party pricing vendors or from brokers who make markets in such securities. U.S. government and government agency obligations are valued by pricing vendors who utilize matrix pricing which considers yield or price of bonds of comparable quality, coupon, maturity and type or by broker-supplied prices. When independent prices are unavailable or unreliable, debt securities may be valued utilizing pricing methodologies which consider similar factors that would be used by third party pricing vendors. Debt securities are generally categorized as Level 2 in the hierarchy but may be Level 3 depending on the circumstances.
ETFs are valued at their last sale price or official closing price as reported by a third party pricing vendor on the primary market or exchange on which they are traded and are categorized as Level 1 in the hierarchy. In the event there were no sales during the day but the exchange reports a closing bid level, ETFs are valued at the closing bid and would be categorized as Level 1 in the hierarchy. In the event there was no closing bid, ETFs may be valued by another method that the Board believes reflects fair value in accordance with the Board's fair value pricing policies and may be categorized as Level 2 in the hierarchy.
Futures contracts are valued at the settlement price established each day by the board of trade or exchange on which they are traded and are categorized as Level 1 in the hierarchy. Investments in open-end mutual funds, including the Fidelity Central Funds, are valued at their closing net asset value (NAV) each business day and are categorized as Level 1 in the hierarchy.
Changes in valuation techniques may result in transfers in or out of an assigned level within the disclosure hierarchy. The aggregate value of investments by input level, as of June 30, 2022, is included at the end of the Fund's Schedule of Investments.
Foreign Currency. Certain Funds may use foreign currency contracts to facilitate transactions in foreign-denominated securities. Gains and losses from these transactions may arise from changes in the value of the foreign currency or if the counterparties do not perform under the contracts' terms.
Foreign-denominated assets, including investment securities, and liabilities are translated into U.S. dollars at the exchange rates at period end. Purchases and sales of investment securities, income and dividends received, and expenses denominated in foreign currencies are translated into U.S. dollars at the exchange rate in effect on the transaction date.
The effects of exchange rate fluctuations on investments are included with the net realized and unrealized gain (loss) on investment securities. Other foreign currency transactions resulting in realized and unrealized gain (loss) are disclosed separately.
Investment Transactions and Income. For financial reporting purposes, the Fund's investment holdings and NAV include trades executed through the end of the last business day of the period. The NAV per share for processing shareholder transactions is calculated as of the close of business of the New York Stock Exchange (NYSE), normally 4:00 p.m. Eastern time and includes trades executed through the end of the prior business day. Gains and losses on securities sold are determined on the basis of identified cost and include proceeds received from litigation. Commissions paid to certain brokers with whom the investment adviser, or its affiliates, places trades on behalf of a fund include an amount in addition to trade execution, which may be rebated back to a fund. Any such rebates are included in net realized gain (loss) on investments in the Statement of Operations. Dividend income is recorded on the ex-dividend date, except for certain dividends from foreign securities where the ex-dividend date may have passed, which are recorded as soon as the Fund is informed of the ex-dividend date. Non-cash dividends included in dividend income, if any, are recorded at the fair market value of the securities received. Income and capital gain distributions from Fidelity Central Funds, if any, are recorded on the ex-dividend date. Interest income is accrued as earned and includes coupon interest and amortization of premium and accretion of discount on debt securities as applicable. Investment income is recorded net of foreign taxes withheld where recovery of such taxes is uncertain. Funds may file withholding tax reclaims in certain jurisdictions to recover a portion of amounts previously withheld. Any withholding tax reclaims income is included in the Statement of Operations in dividends. Any receivables for withholding tax reclaims are included in the Statement of Assets and Liabilities in dividends receivable.
Class Allocations and Expenses. Investment income, realized and unrealized capital gains and losses, common expenses of a fund, and certain fund-level expense reductions, if any, are allocated daily on a pro-rata basis to each class based on the relative net assets of each class to the total net assets of a fund. Each class differs with respect to transfer agent and distribution and service plan fees incurred, as applicable. Certain expense reductions may also differ by class, if applicable. For the reporting period, the allocated portion of income and expenses to each class as a percent of its average net assets may vary due to the timing of recording these transactions in relation to fluctuating net assets of the classes. Expenses directly attributable to a fund are charged to that fund. Expenses attributable to more than one fund are allocated among the respective funds on the basis of relative net assets or other appropriate methods. Expenses included in the accompanying financial statements reflect the expenses of that fund and do not include any expenses associated with any underlying mutual funds or exchange-traded funds. Although not included in a fund's expenses, a fund indirectly bears its proportionate share of these expenses through the net asset value of each underlying mutual fund or exchange-traded fund. Expense estimates are accrued in the period to which they relate and adjustments are made when actual amounts are known.
Income Tax Information and Distributions to Shareholders. Each year, the Fund intends to qualify as a regulated investment company under Subchapter M of the Internal Revenue Code, including distributing substantially all of its taxable income and realized gains. As a result, no provision for U.S. Federal income taxes is required. The Fund files a U.S. federal tax return, in addition to state and local tax returns as required. The Fund's federal income tax returns are subject to examination by the Internal Revenue Service (IRS) for a period of three fiscal years after they are filed. State and local tax returns may be subject to examination for an additional fiscal year depending on the jurisdiction. Foreign taxes are provided for based on the Fund's understanding of the tax rules and rates that exist in the foreign markets in which it invests.
Distributions are declared and recorded on the ex-dividend date. Income and capital gain distributions are declared separately for each class. Income and capital gain distributions are determined in accordance with income tax regulations, which may differ from GAAP.
Capital accounts within the financial statements are adjusted for permanent book-tax differences. These adjustments have no impact on net assets or the results of operations. Capital accounts are not adjusted for temporary book-tax differences which will reverse in a subsequent period.
Book-tax differences are primarily due to the short-term gain distributions from the underlying mutual funds or exchange-traded funds (ETFs), futures contracts and losses deferred due to wash sales and excise tax regulations.
As of period end, the cost and unrealized appreciation (depreciation) in securities, and derivatives if applicable, for federal income tax purposes were as follows:
| Gross unrealized appreciation | $33,362,372 |
| Gross unrealized depreciation | (7,955,551) |
| Net unrealized appreciation (depreciation) | $25,406,821 |
| Tax cost | $199,297,555 |
The Fund elected to defer to its next fiscal year approximately $572,426 of capital losses recognized during the period November 1, 2021 to December 31, 2021.
4. Derivative Instruments.
Risk Exposures and the Use of Derivative Instruments. Investment objectives allow a fund to enter into various types of derivative contracts, including futures contracts. Derivatives are investments whose value is primarily derived from underlying assets, indices or reference rates and may be transacted on an exchange or over-the-counter (OTC). Derivatives may involve a future commitment to buy or sell a specified asset based on specified terms, to exchange future cash flows at periodic intervals based on a notional principal amount, or for one party to make one or more payments upon the occurrence of specified events in exchange for periodic payments from the other party.
Derivatives were used to increase returns and to manage exposure to certain risks as defined below. The success of any strategy involving derivatives depends on analysis of numerous economic factors, and if the strategies for investment do not work as intended, the objectives may not be achieved.
Derivatives were used to increase or decrease exposure to the following risk:
| Equity Risk | Equity risk relates to the fluctuations in the value of financial instruments as a result of changes in market prices (other than those arising from interest rate risk or foreign exchange risk), whether caused by factors specific to an individual investment, its issuer, or all factors affecting all instruments traded in a market or market segment. |
Funds are also exposed to additional risks from investing in derivatives, such as liquidity risk and counterparty credit risk. Liquidity risk is the risk that a fund will be unable to close out the derivative in the open market in a timely manner. Counterparty credit risk is the risk that the counterparty will not be able to fulfill its obligation to a fund. Exchange-traded contracts are not covered by the ISDA Master Agreement; however counterparty credit risk related to these contracts may be mitigated by the protection provided by the exchange on which they trade.
Investing in derivatives may involve greater risks than investing in the underlying assets directly and, to varying degrees, may involve risk of loss in excess of any initial investment and collateral received and amounts recognized in the Statement of Assets and Liabilities. In addition, there may be the risk that the change in value of the derivative contract does not correspond to the change in value of the underlying instrument.
Futures Contracts. A futures contract is an agreement between two parties to buy or sell a specified underlying instrument for a fixed price at a specified future date. Futures contracts were used to manage exposure to the stock market.
Upon entering into a futures contract, a fund is required to deposit either cash or securities (initial margin) with a clearing broker in an amount equal to a certain percentage of the face value of the contract. Futures contracts are marked-to-market daily and subsequent daily payments are made or received by a fund depending on the daily fluctuations in the value of the futures contracts and are recorded as unrealized appreciation or (depreciation). This receivable and/or payable, if any, is included in daily variation margin on futures contracts in the Statement of Assets and Liabilities. Realized gain or (loss) is recorded upon the expiration or closing of a futures contract. The net realized gain (loss) and change in net unrealized appreciation (depreciation) on futures contracts during the period is presented in the Statement of Operations.
Any open futures contracts at period end are presented in the Schedule of Investments under the caption "Futures Contracts". The notional amount at value reflects each contract's exposure to the underlying instrument or index at period end, and is representative of volume of activity during the period unless an average notional amount is presented. Any securities deposited to meet initial margin requirements are identified in the Schedule of Investments. Any cash deposited to meet initial margin requirements is presented as segregated cash with brokers for derivative instruments in the Statement of Assets and Liabilities.
5. Purchases and Sales of Investments.
Purchases and sales of securities, other than short-term securities and in-kind transactions, as applicable, are noted in the table below.
| Purchases ($) | Sales ($) | |
| VIP Asset Manager: Growth Portfolio | 29,947,171 | 30,371,726 |
6. Fees and Other Transactions with Affiliates.
Management Fee. Fidelity Management & Research Company LLC (the investment adviser) and its affiliates provide the Fund with investment management related services for which the Fund pays a monthly management fee. The management fee is the sum of an individual fund fee rate that is based on an annual rate of .30% of the Fund's average net assets and an annualized group fee rate that averaged .22% during the period. The group fee rate is based upon the monthly average net assets of a group of registered investment companies with which the investment adviser has management contracts. The group fee rate decreases as assets under management increase and increases as assets under management decrease. For the reporting period, the total annualized management fee rate was .53% of the Fund's average net assets.
The investment adviser pays a portion of the management fees received from the Fund to the Fidelity Central Funds' investment advisers, who are also affiliates, for managing the assets of the Fidelity Central Funds.
Distribution and Service Plan Fees. In accordance with Rule 12b-1 of the 1940 Act, the Fund has adopted separate 12b-1 Plans for each Service Class of shares. Each Service Class pays Fidelity Distributors Company LLC (FDC), an affiliate of the investment adviser, a service fee. For the period, the service fee is based on an annual rate of .10% of Service Class' average net assets and .25% of Service Class 2's average net assets.
For the period, total fees, all of which were re-allowed to insurance companies for the distribution of shares and providing shareholder support services, were as follows:
| Service Class | $1,628 |
| Service Class 2 | 4,535 |
| $6,163 |
Transfer Agent Fees. Fidelity Investments Institutional Operations Company LLC (FIIOC), an affiliate of the investment adviser, is the Fund's transfer, dividend disbursing, and shareholder servicing agent. FIIOC receives an asset-based fee with respect to each class. Each class pays a fee for transfer agent services, typesetting and printing and mailing of shareholder reports, excluding mailing of proxy statements. For the period, transfer agent fees for each class were as follows:
| Amount | % of Class-Level Average Net Assets(a) | |
| Initial Class | $30,827 | .06 |
| Service Class | 1,008 | .06 |
| Service Class 2 | 1,123 | .06 |
| Investor Class | 95,583 | .14 |
| $128,541 |
(a) Annualized
Accounting Fees. Fidelity Service Company, Inc. (FSC), an affiliate of the investment adviser, maintains the Fund's accounting records. The accounting fee is based on the level of average net assets for each month. For the period, the fees were equivalent to the following annualized rates:
| % of Average Net Assets | |
| VIP Asset Manager: Growth Portfolio | .05 |
Brokerage Commissions. A portion of portfolio transactions were placed with brokerage firms which are affiliates of the investment adviser. Brokerage commissions are included in net realized gain (loss) and change in net unrealized appreciation (depreciation) in the Statement of Operations. The commissions paid to these affiliated firms were as follows:
| Amount | |
| VIP Asset Manager: Growth Portfolio | $1 |
Interfund Trades. Funds may purchase from or sell securities to other Fidelity Funds under procedures adopted by the Board. The procedures have been designed to ensure these interfund trades are executed in accordance with Rule 17a-7 of the 1940 Act. Any interfund trades are included within the respective purchases and sales amounts shown in the Purchases and Sales of Investments note. Interfund trades during the period are noted in the table below.
| Purchases ($) | Sales ($) | Realized Gain (Loss) ($) | |
| VIP Asset Manager: Growth Portfolio | – | 34,277 | (10,879) |
7. Committed Line of Credit.
Certain Funds participate with other funds managed by the investment adviser or an affiliate in a $4.25 billion credit facility (the "line of credit") to be utilized for temporary or emergency purposes to fund shareholder redemptions or for other short-term liquidity purposes. The participating funds have agreed to pay commitment fees on their pro-rata portion of the line of credit, which are reflected in Miscellaneous expenses on the Statement of Operations, and are listed below. During the period, there were no borrowings on this line of credit.
| Amount | |
| VIP Asset Manager: Growth Portfolio | $219 |
8. Security Lending.
Funds lend portfolio securities from time to time in order to earn additional income. Lending agents are used, including National Financial Services (NFS), an affiliate of the investment adviser. Pursuant to a securities lending agreement, NFS will receive a fee, which is capped at 9.9% of a fund's daily lending revenue, for its services as lending agent. A fund may lend securities to certain qualified borrowers, including NFS. On the settlement date of the loan, a fund receives collateral (in the form of U.S. Treasury obligations, letters of credit and/or cash) against the loaned securities and maintains collateral in an amount not less than 100% of the market value of the loaned securities during the period of the loan. The market value of the loaned securities is determined at the close of business of a fund and any additional required collateral is delivered to a fund on the next business day. A fund or borrower may terminate the loan at any time, and if the borrower defaults on its obligation to return the securities loaned because of insolvency or other reasons, a fund may apply collateral received from the borrower against the obligation. A fund may experience delays and costs in recovering the securities loaned. Any cash collateral received is invested in the Fidelity Securities Lending Cash Central Fund. Any loaned securities are identified as such in the Schedule of Investments, and the value of loaned securities and cash collateral at period end, as applicable, are presented in the Statement of Assets and Liabilities. Security lending income represents the income earned on investing cash collateral, less rebates paid to borrowers and any lending agent fees associated with the loan, plus any premium payments received for lending certain types of securities. Security lending income is presented in the Statement of Operations as a component of income from Fidelity Central Funds. Affiliated security lending activity, if any, was as follows:
| Total Security Lending Fees Paid to NFS | Security Lending Income From Securities Loaned to NFS | Value of Securities Loaned to NFS at Period End | |
| VIP Asset Manager: Growth Portfolio | $302 | $– | $– |
9. Expense Reductions.
During the period the investment adviser or an affiliate reimbursed and/or waived a portion of fund-level operating expenses in the amount of $3,861.
10. Distributions to Shareholders.
Distributions to shareholders of each class were as follows:
| Six months ended June 30, 2022 | Year ended December 31, 2021 |
|
| VIP Asset Manager: Growth Portfolio | ||
| Distributions to shareholders | ||
| Initial Class | $6,128,529 | $3,092,818 |
| Service Class | 201,591 | 96,780 |
| Service Class 2 | 221,752 | 99,648 |
| Investor Class | 8,546,553 | 4,091,355 |
| Total | $15,098,425 | $7,380,601 |
11. Share Transactions.
Transactions for each class of shares were as follows and may contain in-kind transactions:
| Shares | Shares | Dollars | Dollars | |
| Six months ended June 30, 2022 | Year ended December 31, 2021 | Six months ended June 30, 2022 | Year ended December 31, 2021 | |
| VIP Asset Manager: Growth Portfolio | ||||
| Initial Class | ||||
| Shares sold | 98,097 | 261,912 | $2,053,630 | $6,122,934 |
| Reinvestment of distributions | 281,771 | 128,495 | 6,128,529 | 3,092,818 |
| Shares redeemed | (309,416) | (631,037) | (6,484,287) | (15,106,667) |
| Net increase (decrease) | 70,452 | (240,630) | $1,697,872 | $(5,890,915) |
| Service Class | ||||
| Shares sold | 21,618 | 1,020 | $443,846 | $23,871 |
| Reinvestment of distributions | 9,359 | 4,059 | 201,591 | 96,780 |
| Shares redeemed | (24,500) | (9,938) | (493,391) | (227,423) |
| Net increase (decrease) | 6,477 | (4,859) | $152,046 | $(106,772) |
| Service Class 2 | ||||
| Shares sold | 36,867 | 21,643 | $758,766 | $511,878 |
| Reinvestment of distributions | 10,377 | 4,208 | 221,752 | 99,648 |
| Shares redeemed | (26,989) | (16,357) | (562,527) | (386,029) |
| Net increase (decrease) | 20,255 | 9,494 | $417,991 | $225,497 |
| Investor Class | ||||
| Shares sold | 172,001 | 607,150 | $3,669,860 | $14,266,762 |
| Reinvestment of distributions | 396,040 | 171,004 | 8,546,553 | 4,091,355 |
| Shares redeemed | (184,776) | (475,699) | (3,853,785) | (10,996,494) |
| Net increase (decrease) | 383,265 | 302,455 | $8,362,628 | $7,361,623 |
12. Other.
A fund's organizational documents provide former and current trustees and officers with a limited indemnification against liabilities arising in connection with the performance of their duties to the fund. In the normal course of business, a fund may also enter into contracts that provide general indemnifications. A fund's maximum exposure under these arrangements is unknown as this would be dependent on future claims that may be made against a fund. The risk of material loss from such claims is considered remote.
At the end of the period, the investment adviser or its affiliates were owners of record of more than 10% of the outstanding shares as follows:
| Fund | Affiliated % |
| VIP Asset Manager: Growth Portfolio | 87% |
13. Coronavirus (COVID-19) Pandemic.
An outbreak of COVID-19 first detected in China during December 2019 has since spread globally and was declared a pandemic by the World Health Organization during March 2020. Developments that disrupt global economies and financial markets, such as the COVID-19 pandemic, may magnify factors that affect the Fund's performance.
Shareholder Expense Example
As a shareholder, you incur two types of costs: (1) transaction costs, which may include sales charges (loads) on purchase payments or redemption proceeds, as applicable and (2) ongoing costs, which generally include management fees, distribution and/or service (12b-1) fees and other Fund expenses. This Example is intended to help you understand your ongoing costs (in dollars) of investing in a fund and to compare these costs with the ongoing costs of investing in other mutual funds.
The Example is based on an investment of $1,000 invested at the beginning of the period and held for the entire period (January 1, 2022 to June 30, 2022).
Actual Expenses
The first line of the accompanying table provides information about actual account values and actual expenses. You may use the information in this line, together with the amount you invested, to estimate the expenses that you paid over the period. Simply divide your account value by $1,000.00 (for example, an $8,600 account value divided by $1,000.00 = 8.6), then multiply the result by the number in the first line for a class/Fund under the heading entitled "Expenses Paid During Period" to estimate the expenses you paid on your account during this period. If any fund is a shareholder of any underlying mutual funds or exchange-traded funds (ETFs) (the Underlying Funds), such fund indirectly bears its proportional share of the expenses of the Underlying Funds in addition to the direct expenses incurred presented in the table. These fees and expenses are not included in the annualized expense ratio used to calculate the expense estimate in the table below. The estimate of expenses does not include any fees or other expenses of any variable annuity or variable life insurance product. If they were, the estimate of expenses you paid during the period would be higher, and your ending account value would be lower.
Hypothetical Example for Comparison Purposes
The second line of the accompanying table provides information about hypothetical account values and hypothetical expenses based on the actual expense ratio and an assumed rate of return of 5% per year before expenses, which is not the actual return. The hypothetical account values and expenses may not be used to estimate the actual ending account balance or expenses you paid for the period. You may use this information to compare the ongoing costs of investing in the Fund and other funds. To do so, compare this 5% hypothetical example with the 5% hypothetical examples that appear in the shareholder reports of the other funds. If any fund is a shareholder of any Underlying Funds, such fund indirectly bears its proportional share of the expenses of the Underlying Funds in addition to the direct expenses as presented in the table. These fees and expenses are not included in the annualized expense ratio used to calculate the expense estimate in the table below. The estimate of expenses does not include any fees or other expenses of any variable annuity or variable life insurance product. If they were, the estimate of expenses you paid during the period would be higher, and your ending account value would be lower.
Please note that the expenses shown in the table are meant to highlight your ongoing costs only and do not reflect any transaction costs. Therefore, the second line of the table is useful in comparing ongoing costs only, and will not help you determine the relative total costs of owning different funds. In addition, if these transactional costs were included, your costs would have been higher.
| Annualized Expense Ratio-A | Beginning Account Value January 1, 2022 | Ending Account Value June 30, 2022 | Expenses Paid During Period-B January 1, 2022 to June 30, 2022 |
|
| VIP Asset Manager: Growth Portfolio | ||||
| Initial Class | .66% | |||
| Actual | $1,000.00 | $818.50 | $2.98 | |
| Hypothetical-C | $1,000.00 | $1,021.52 | $3.31 | |
| Service Class | .76% | |||
| Actual | $1,000.00 | $818.00 | $3.43 | |
| Hypothetical-C | $1,000.00 | $1,021.03 | $3.81 | |
| Service Class 2 | .91% | |||
| Actual | $1,000.00 | $817.90 | $4.10 | |
| Hypothetical-C | $1,000.00 | $1,020.28 | $4.56 | |
| Investor Class | .74% | |||
| Actual | $1,000.00 | $818.00 | $3.34 | |
| Hypothetical-C | $1,000.00 | $1,021.12 | $3.71 |
A Annualized expense ratio reflects expenses net of applicable fee waivers.
B Expenses are equal to the annualized expense ratio, multiplied by the average account value over the period, multiplied by 181/ 365 (to reflect the one-half year period). The fees and expenses of any Underlying Funds are not included in each annualized expense ratio.
C 5% return per year before expenses
Liquidity Risk Management Program
The Securities and Exchange Commission adopted Rule 22e-4 under the Investment Company Act of 1940 (the Liquidity Rule) to promote effective liquidity risk management throughout the open-end investment company industry, thereby reducing the risk that funds will be unable to meet their redemption obligations and mitigating dilution of the interests of fund shareholders.
The Fund has adopted and implemented a liquidity risk management program pursuant to the Liquidity Rule (the Program) effective December 1, 2018. The Program is reasonably designed to assess and manage the Fund’s liquidity risk and to comply with the requirements of the Liquidity Rule. The Fund’s Board of Trustees (the Board) has designated the Fund’s investment adviser as administrator of the Program. The Fidelity advisers have established a Liquidity Risk Management Committee (the LRM Committee) to manage the Program for each of the Fidelity Funds. The LRM Committee monitors the adequacy and effectiveness of implementation of the Program and on a periodic basis assesses each Fund’s liquidity risk based on a variety of factors including (1) the Fund’s investment strategy, (2) portfolio liquidity and cash flow projections during normal and reasonably foreseeable stressed conditions, (3) shareholder redemptions, (4) borrowings and other funding sources and (5) in the case of exchange-traded funds, certain additional factors including the effect of the Fund’s prices and spreads, market participants, and basket compositions on the overall liquidity of the Fund’s portfolio, as applicable.
In accordance with the Program, each of the Fund’s portfolio investments is classified into one of four liquidity categories described below based on a determination of a reasonable expectation for how long it would take to convert the investment to cash (or sell or dispose of the investment) without significantly changing its market value.
- Highly liquid investments – cash or convertible to cash within three business days or less
- Moderately liquid investments – convertible to cash in three to seven calendar days
- Less liquid investments – can be sold or disposed of, but not settled, within seven calendar days
- Illiquid investments – cannot be sold or disposed of within seven calendar days
Liquidity classification determinations take into account a variety of factors including various market, trading and investment-specific considerations, as well as market depth, and generally utilize analysis from a third-party liquidity metrics service.
The Liquidity Rule places a 15% limit on a fund’s illiquid investments and requires funds that do not primarily hold assets that are highly liquid investments to determine and maintain a minimum percentage of the fund’s net assets to be invested in highly liquid investments (highly liquid investment minimum or HLIM). The Program includes provisions reasonably designed to comply with the 15% limit on illiquid investments and for determining, periodically reviewing and complying with the HLIM requirement as applicable.
At a recent meeting of the Fund’s Board of Trustees, the LRM Committee provided a written report to the Board pertaining to the operation, adequacy, and effectiveness of implementation of the Program for the annual period from December 1, 2020 through November 30, 2021. The report concluded that the Program has been implemented and is operating effectively and is reasonably designed to assess and manage the Fund’s liquidity risk.
![]()
VIPAMG-SANN-0822
1.705700.124
Fidelity® Variable Insurance Products:
Bond Index Portfolio
Semi-Annual Report
June 30, 2022
Contents
To view a fund's proxy voting guidelines and proxy voting record for the 12-month period ended June 30, visit http://www.fidelity.com/proxyvotingresults or visit the Securities and Exchange Commission's (SEC) web site at http://www.sec.gov.
You may also call 1-877-208-0098 to request a free copy of the proxy voting guidelines.
Fidelity® Variable Insurance Products are separate account options which are purchased through a variable insurance contract.
BLOOMBERG® is a trademark and service mark of Bloomberg Finance L.P. and its affiliates (collectively “Bloomberg”). Bloomberg or Bloomberg’s licensors own all proprietary rights in the Bloomberg Indices. Neither Bloomberg nor Bloomberg’s licensors approves or endorses this material, or guarantees the accuracy or completeness of any information herein, or makes any warranty, express or implied, as to the results to be obtained therefrom and, to the maximum extent allowed by law, neither shall have any liability or responsibility for injury or damages arising in connection therewith.
Standard & Poor's, S&P and S&P 500 are registered service marks of The McGraw-Hill Companies, Inc. and have been licensed for use by Fidelity Distributors Corporation.
Other third-party marks appearing herein are the property of their respective owners.
All other marks appearing herein are registered or unregistered trademarks or service marks of FMR LLC or an affiliated company. © 2022 FMR LLC. All rights reserved.
This report and the financial statements contained herein are submitted for the general information of the shareholders of the Fund. This report is not authorized for distribution to prospective investors in the Fund unless preceded or accompanied by an effective prospectus.
A fund files its complete schedule of portfolio holdings with the SEC for the first and third quarters of each fiscal year on Form N-PORT. Forms N-PORT are available on the SEC’s web site at http://www.sec.gov. A fund's Forms N-PORT may be reviewed and copied at the SEC’s Public Reference Room in Washington, DC. Information regarding the operation of the SEC's Public Reference Room may be obtained by calling 1-800-SEC-0330.
For a complete list of a fund's portfolio holdings, view the most recent holdings listing, semiannual report, or annual report on Fidelity's web site at http://www.fidelity.com, http://www.institutional.fidelity.com, or http://www.401k.com, as applicable.
NOT FDIC INSURED •MAY LOSE VALUE •NO BANK GUARANTEE
Neither the Fund nor Fidelity Distributors Corporation is a bank.
Note to Shareholders:
Early in 2020, the outbreak and spread of COVID-19 emerged as a public health emergency that had a major influence on financial markets, primarily based on its impact on the global economy and corporate earnings. On March 11, 2020, the World Health Organization declared the COVID-19 outbreak a pandemic, citing sustained risk of further global spread. The pandemic prompted a number of measures to limit the spread of COVID-19, including travel and border restrictions, quarantines, and restrictions on large gatherings. In turn, these resulted in lower consumer activity, diminished demand for a wide range of products and services, disruption in manufacturing and supply chains, and – given the wide variability in outcomes regarding the outbreak – significant market uncertainty and volatility. To help stem the turmoil, the U.S. government took unprecedented action – in concert with the U.S. Federal Reserve and central banks around the world – to help support consumers, businesses, and the broader economy, and to limit disruption to the financial system.
In general, the overall impact of the pandemic lessened in 2021, amid a resilient economy and widespread distribution of three COVID-19 vaccines granted emergency use authorization from the U.S. Food and Drug Administration (FDA) early in the year. Still, the situation remains dynamic, and the extent and duration of its influence on financial markets and the economy is highly uncertain, due in part to a recent spike in cases based on highly contagious variants of the coronavirus.
Extreme events such as the COVID-19 crisis are exogenous shocks that can have significant adverse effects on mutual funds and their investments. Although multiple asset classes may be affected by market disruption, the duration and impact may not be the same for all types of assets. Fidelity is committed to helping you stay informed amid news about COVID-19 and during increased market volatility, and we continue to take extra steps to be responsive to customer needs. We encourage you to visit us online, where we offer ongoing updates, commentary, and analysis on the markets and our funds.
Investment Summary (Unaudited)
Quality Diversification (% of fund's net assets)
| As of June 30, 2022 | ||
| U.S. Government and U.S. Government Agency Obligations | 68.3% | |
| AAA | 3.9% | |
| AA | 3.4% | |
| A | 10.7% | |
| BBB | 12.5% | |
| BB and Below | 0.2% | |
| Not Rated | 0.1% | |
| Short-Term Investments and Net Other Assets | 0.9% | |
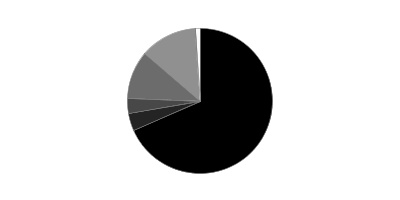
We have used ratings from Moody's Investors Service, Inc. Where Moody's® ratings are not available, we have used S&P® ratings. All ratings are as of the date indicated and do not reflect subsequent changes.
Asset Allocation (% of fund's net assets)
| As of June 30, 2022* | ||
| Corporate Bonds | 25.1% | |
| U.S. Government and U.S. Government Agency Obligations | 68.3% | |
| Asset-Backed Securities | 0.3% | |
| CMOs and Other Mortgage Related Securities | 0.9% | |
| Municipal Bonds | 0.6% | |
| Other Investments | 3.9% | |
| Short-Term Investments and Net Other Assets (Liabilities) | 0.9% | |
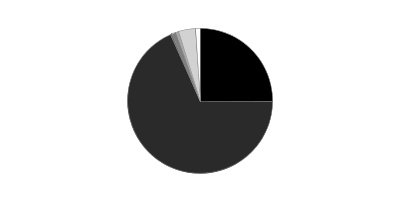
* Foreign investments – 8.7%
Schedule of Investments June 30, 2022 (Unaudited)
Showing Percentage of Net Assets
| Nonconvertible Bonds - 25.1% | |||
| Principal Amount | Value | ||
| COMMUNICATION SERVICES - 2.1% | |||
| Diversified Telecommunication Services - 0.8% | |||
| AT&T, Inc.: | |||
| 1.65% 2/1/28 | $200,000 | $173,022 | |
| 2.25% 2/1/32 | 50,000 | 40,849 | |
| 2.75% 6/1/31 | 300,000 | 259,052 | |
| 3.3% 2/1/52 | 50,000 | 36,697 | |
| 3.5% 6/1/41 | 1,000,000 | 798,477 | |
| 3.5% 9/15/53 | 347,000 | 263,026 | |
| 3.55% 9/15/55 | 340,000 | 254,742 | |
| 3.65% 6/1/51 | 280,000 | 218,996 | |
| 3.65% 9/15/59 | 257,000 | 192,480 | |
| 3.8% 2/15/27 | 43,000 | 42,125 | |
| 4.1% 2/15/28 | 143,000 | 140,066 | |
| 4.65% 6/1/44 | 40,000 | 36,315 | |
| Telefonica Emisiones S.A.U.: | |||
| 4.103% 3/8/27 | 150,000 | 146,855 | |
| 5.213% 3/8/47 | 250,000 | 221,556 | |
| Verizon Communications, Inc.: | |||
| 1.5% 9/18/30 | 270,000 | 215,787 | |
| 2.355% 3/15/32 | 9,000 | 7,462 | |
| 2.65% 11/20/40 | 60,000 | 44,014 | |
| 2.987% 10/30/56 | 227,000 | 157,600 | |
| 3.55% 3/22/51 | 500,000 | 400,836 | |
| 3.875% 2/8/29 | 210,000 | 203,172 | |
| 4% 3/22/50 | 114,000 | 98,517 | |
| 4.016% 12/3/29 | 100,000 | 96,852 | |
| 4.125% 8/15/46 | 54,000 | 47,868 | |
| 4.272% 1/15/36 | 276,000 | 259,859 | |
| 4.329% 9/21/28 | 643,000 | 639,498 | |
| 5.012% 8/21/54 | 38,000 | 38,602 | |
| 5,034,325 | |||
| Entertainment - 0.1% | |||
| The Walt Disney Co.: | |||
| 2% 9/1/29 | 50,000 | 42,968 | |
| 2.65% 1/13/31 | 200,000 | 176,018 | |
| 2.75% 9/1/49 | 100,000 | 71,379 | |
| 3.5% 5/13/40 | 30,000 | 25,575 | |
| 3.6% 1/13/51 | 30,000 | 25,039 | |
| 3.7% 9/15/24 | 300,000 | 300,735 | |
| 3.8% 3/22/30 | 110,000 | 106,354 | |
| 3.8% 5/13/60 | 30,000 | 25,079 | |
| 4.7% 3/23/50 | 100,000 | 98,627 | |
| 871,774 | |||
| Interactive Media & Services - 0.1% | |||
| Alphabet, Inc.: | |||
| 1.1% 8/15/30 | 200,000 | 164,145 | |
| 1.9% 8/15/40 | 264,000 | 189,250 | |
| 2.05% 8/15/50 | 170,000 | 113,970 | |
| 467,365 | |||
| Media - 0.8% | |||
| Charter Communications Operating LLC/Charter Communications Operating Capital Corp.: | |||
| 3.7% 4/1/51 | 30,000 | 20,301 | |
| 3.75% 2/15/28 | 100,000 | 92,346 | |
| 4.2% 3/15/28 | 48,000 | 44,846 | |
| 5.125% 7/1/49 | 60,000 | 49,663 | |
| 5.375% 4/1/38 | 42,000 | 37,331 | |
| 5.375% 5/1/47 | 190,000 | 161,778 | |
| 6.384% 10/23/35 | 621,000 | 624,548 | |
| Comcast Corp.: | |||
| 2.45% 8/15/52 | 135,000 | 89,601 | |
| 2.65% 2/1/30 | 80,000 | 71,584 | |
| 2.8% 1/15/51 | 180,000 | 127,351 | |
| 2.887% 11/1/51 | 179,000 | 127,872 | |
| 2.937% 11/1/56 | 385,000 | 267,534 | |
| 2.987% 11/1/63 | 305,000 | 208,032 | |
| 3.4% 4/1/30 | 87,000 | 81,630 | |
| 3.55% 5/1/28 | 76,000 | 73,670 | |
| 3.7% 4/15/24 | 30,000 | 30,072 | |
| 3.75% 4/1/40 | 31,000 | 27,170 | |
| 3.9% 3/1/38 | 50,000 | 45,219 | |
| 4.049% 11/1/52 | 146,000 | 127,593 | |
| Discovery Communications LLC: | |||
| 3.625% 5/15/30 | 220,000 | 195,609 | |
| 4% 9/15/55 | 85,000 | 59,543 | |
| 4.65% 5/15/50 | 100,000 | 78,636 | |
| 5.2% 9/20/47 | 18,000 | 15,440 | |
| Fox Corp.: | |||
| 4.709% 1/25/29 | 34,000 | 33,334 | |
| 5.476% 1/25/39 | 189,000 | 183,486 | |
| 5.576% 1/25/49 | 23,000 | 22,436 | |
| Magallanes, Inc.: | |||
| 3.755% 3/15/27 (a) | 100,000 | 93,799 | |
| 4.279% 3/15/32 (a) | 189,000 | 168,917 | |
| 5.05% 3/15/42 (a) | 100,000 | 85,079 | |
| 5.141% 3/15/52 (a) | 175,000 | 146,886 | |
| Paramount Global: | |||
| 4.2% 6/1/29 | 210,000 | 197,377 | |
| 4.95% 1/15/31 | 190,000 | 180,882 | |
| 5.85% 9/1/43 | 363,000 | 339,141 | |
| Time Warner Cable LLC 5.5% 9/1/41 | 351,000 | 306,393 | |
| TWDC Enterprises 18 Corp.: | |||
| 2.95% 6/15/27 | 98,000 | 93,442 | |
| 3% 2/13/26 | 210,000 | 203,803 | |
| 4,712,344 | |||
| Wireless Telecommunication Services - 0.3% | |||
| America Movil S.A.B. de CV 3.625% 4/22/29 | 200,000 | 189,788 | |
| T-Mobile U.S.A., Inc.: | |||
| 3% 2/15/41 | 529,000 | 394,524 | |
| 3.5% 4/15/25 | 410,000 | 400,996 | |
| 3.75% 4/15/27 | 80,000 | 77,034 | |
| 3.875% 4/15/30 | 80,000 | 74,660 | |
| 4.375% 4/15/40 | 74,000 | 66,054 | |
| 4.5% 4/15/50 | 80,000 | 70,984 | |
| Vodafone Group PLC: | |||
| 4.375% 5/30/28 | 97,000 | 96,552 | |
| 5.25% 5/30/48 | 170,000 | 161,732 | |
| 6.15% 2/27/37 | 392,000 | 423,040 | |
| 1,955,364 | |||
| TOTAL COMMUNICATION SERVICES | 13,041,172 | ||
| CONSUMER DISCRETIONARY - 1.7% | |||
| Automobiles - 0.2% | |||
| American Honda Finance Corp. 1.2% 7/8/25 | 330,000 | 304,537 | |
| General Motors Co.: | |||
| 5.95% 4/1/49 | 200,000 | 185,723 | |
| 6.125% 10/1/25 | 455,000 | 470,351 | |
| 6.75% 4/1/46 | 69,000 | 69,233 | |
| General Motors Financial Co., Inc.: | |||
| 4.35% 4/9/25 | 84,000 | 82,964 | |
| 5.65% 1/17/29 | 250,000 | 249,393 | |
| 1,362,201 | |||
| Diversified Consumer Services - 0.2% | |||
| American University 3.672% 4/1/49 | 130,000 | 111,154 | |
| Duke University 2.832% 10/1/55 | 30,000 | 22,878 | |
| George Washington University 4.126% 9/15/48 | 100,000 | 91,949 | |
| Ingersoll-Rand Global Holding Co. Ltd. 3.75% 8/21/28 | 210,000 | 198,272 | |
| Massachusetts Institute of Technology 2.989% 7/1/50 | 250,000 | 204,676 | |
| Northwestern University 3.662% 12/1/57 | 100,000 | 87,405 | |
| University of Chicago 3% 10/1/52 | 100,000 | 78,920 | |
| University of Southern California 2.945% 10/1/51 | 240,000 | 187,077 | |
| 982,331 | |||
| Hotels, Restaurants & Leisure - 0.4% | |||
| Expedia, Inc. 5% 2/15/26 | 160,000 | 159,985 | |
| Marriott International, Inc. 3.125% 6/15/26 | 390,000 | 372,112 | |
| McDonald's Corp.: | |||
| 2.125% 3/1/30 | 400,000 | 341,947 | |
| 2.625% 9/1/29 | 150,000 | 134,414 | |
| 3.3% 7/1/25 | 32,000 | 31,789 | |
| 3.5% 7/1/27 | 91,000 | 89,164 | |
| 3.6% 7/1/30 | 340,000 | 323,660 | |
| 3.8% 4/1/28 | 84,000 | 82,311 | |
| 4.2% 4/1/50 | 40,000 | 35,723 | |
| 4.7% 12/9/35 | 109,000 | 108,485 | |
| Starbucks Corp.: | |||
| 2.55% 11/15/30 | 597,000 | 509,232 | |
| 4.5% 11/15/48 | 50,000 | 45,204 | |
| 2,234,026 | |||
| Household Durables - 0.0% | |||
| Newell Brands, Inc. 4.35% 4/1/23 | 60,000 | 59,475 | |
| Internet & Direct Marketing Retail - 0.2% | |||
| Alibaba Group Holding Ltd.: | |||
| 2.125% 2/9/31 | 240,000 | 198,166 | |
| 3.15% 2/9/51 | 245,000 | 168,082 | |
| Amazon.com, Inc.: | |||
| 0.8% 6/3/25 | 110,000 | 102,412 | |
| 1% 5/12/26 | 6,000 | 5,456 | |
| 2.1% 5/12/31 | 105,000 | 89,949 | |
| 2.4% 2/22/23 | 50,000 | 49,920 | |
| 2.5% 6/3/50 | 110,000 | 77,527 | |
| 3.1% 5/12/51 | 105,000 | 82,684 | |
| 3.875% 8/22/37 | 440,000 | 417,083 | |
| 4.05% 8/22/47 | 280,000 | 262,081 | |
| 1,453,360 | |||
| Leisure Products - 0.0% | |||
| Hasbro, Inc. 3.55% 11/19/26 | 110,000 | 105,132 | |
| Multiline Retail - 0.2% | |||
| Dollar Tree, Inc. 4% 5/15/25 | 248,000 | 246,429 | |
| Kohl's Corp. 4.25% 7/17/25 | 265,000 | 251,954 | |
| Target Corp.: | |||
| 2.25% 4/15/25 | 508,000 | 490,371 | |
| 2.65% 9/15/30 | 77,000 | 69,094 | |
| 3.9% 11/15/47 | 40,000 | 35,858 | |
| 4% 7/1/42 | 15,000 | 13,843 | |
| 1,107,549 | |||
| Specialty Retail - 0.4% | |||
| AutoZone, Inc.: | |||
| 3.625% 4/15/25 | 62,000 | 61,229 | |
| 4% 4/15/30 | 150,000 | 142,424 | |
| Lowe's Companies, Inc.: | |||
| 3.5% 4/1/51 | 300,000 | 227,300 | |
| 3.65% 4/5/29 | 80,000 | 75,423 | |
| 4.05% 5/3/47 | 53,000 | 44,248 | |
| O'Reilly Automotive, Inc. 3.6% 9/1/27 | 260,000 | 251,072 | |
| The Home Depot, Inc.: | |||
| 2.7% 4/15/30 | 146,000 | 132,428 | |
| 2.8% 9/14/27 | 84,000 | 80,117 | |
| 2.95% 6/15/29 | 686,000 | 640,234 | |
| 3.35% 4/15/50 | 100,000 | 81,200 | |
| 3.9% 6/15/47 | 29,000 | 25,925 | |
| 4.25% 4/1/46 | 104,000 | 97,615 | |
| 4.5% 12/6/48 | 90,000 | 87,696 | |
| TJX Companies, Inc. 3.875% 4/15/30 | 687,000 | 668,510 | |
| 2,615,421 | |||
| Textiles, Apparel & Luxury Goods - 0.1% | |||
| NIKE, Inc.: | |||
| 2.4% 3/27/25 | 38,000 | 37,006 | |
| 2.85% 3/27/30 | 570,000 | 523,642 | |
| 3.375% 3/27/50 | 40,000 | 34,015 | |
| 594,663 | |||
| TOTAL CONSUMER DISCRETIONARY | 10,514,158 | ||
| CONSUMER STAPLES - 1.9% | |||
| Beverages - 0.5% | |||
| Anheuser-Busch InBev Worldwide, Inc.: | |||
| 4% 4/13/28 | 91,000 | 89,832 | |
| 4.5% 6/1/50 | 100,000 | 89,898 | |
| 4.6% 4/15/48 | 78,000 | 70,028 | |
| 4.6% 6/1/60 | 50,000 | 43,706 | |
| 4.95% 1/15/42 | 461,000 | 438,803 | |
| 5.45% 1/23/39 | 270,000 | 274,508 | |
| 5.55% 1/23/49 | 130,000 | 132,772 | |
| 5.8% 1/23/59 (Reg. S) | 170,000 | 176,814 | |
| Constellation Brands, Inc.: | |||
| 3.6% 2/15/28 | 63,000 | 59,769 | |
| 5.25% 11/15/48 | 50,000 | 49,083 | |
| Diageo Capital PLC: | |||
| 1.375% 9/29/25 | 200,000 | 186,605 | |
| 2% 4/29/30 | 200,000 | 170,615 | |
| Dr. Pepper Snapple Group, Inc.: | |||
| 2.55% 9/15/26 | 50,000 | 46,545 | |
| 3.8% 5/1/50 | 190,000 | 150,858 | |
| Molson Coors Beverage Co. 4.2% 7/15/46 | 92,000 | 75,530 | |
| PepsiCo, Inc.: | |||
| 1.4% 2/25/31 | 440,000 | 361,053 | |
| 1.625% 5/1/30 | 267,000 | 226,410 | |
| 4% 5/2/47 | 116,000 | 109,584 | |
| The Coca-Cola Co.: | |||
| 1.45% 6/1/27 | 30,000 | 27,149 | |
| 1.65% 6/1/30 | 30,000 | 25,439 | |
| 2.5% 6/1/40 | 30,000 | 23,471 | |
| 2.6% 6/1/50 | 30,000 | 22,340 | |
| 2.75% 6/1/60 | 30,000 | 21,217 | |
| 3.45% 3/25/30 | 186,000 | 180,922 | |
| 4.2% 3/25/50 | 150,000 | 147,522 | |
| 3,200,473 | |||
| Food & Staples Retailing - 0.8% | |||
| Costco Wholesale Corp. 1.375% 6/20/27 | 395,000 | 354,361 | |
| Kroger Co.: | |||
| 1.7% 1/15/31 | 400,000 | 318,932 | |
| 2.65% 10/15/26 | 230,000 | 215,150 | |
| 3.7% 8/1/27 | 100,000 | 96,944 | |
| 5.4% 1/15/49 | 28,000 | 29,298 | |
| Sysco Corp.: | |||
| 3.3% 2/15/50 | 50,000 | 37,283 | |
| 4.45% 3/15/48 | 52,000 | 45,647 | |
| 6.6% 4/1/50 | 220,000 | 253,697 | |
| Walgreens Boots Alliance, Inc.: | |||
| 3.2% 4/15/30 | 130,000 | 114,759 | |
| 3.45% 6/1/26 | 81,000 | 78,767 | |
| 4.1% 4/15/50 | 130,000 | 102,540 | |
| Walmart, Inc.: | |||
| 3.05% 7/8/26 | 10,000 | 9,916 | |
| 3.3% 4/22/24 | 3,220,000 | 3,226,189 | |
| 3.625% 12/15/47 | 20,000 | 17,755 | |
| 3.7% 6/26/28 | 170,000 | 169,521 | |
| 3.95% 6/28/38 | 150,000 | 144,615 | |
| 4.05% 6/29/48 | 80,000 | 78,192 | |
| 5,293,566 | |||
| Food Products - 0.2% | |||
| Archer Daniels Midland Co. 2.5% 8/11/26 | 350,000 | 335,019 | |
| Campbell Soup Co. 4.15% 3/15/28 | 80,000 | 78,561 | |
| Conagra Brands, Inc.: | |||
| 4.85% 11/1/28 | 190,000 | 187,390 | |
| 5.3% 11/1/38 | 13,000 | 12,257 | |
| 5.4% 11/1/48 | 60,000 | 56,663 | |
| General Mills, Inc.: | |||
| 2.875% 4/15/30 | 40,000 | 35,432 | |
| 3% 2/1/51 | 80,000 | 58,128 | |
| 4.2% 4/17/28 | 89,000 | 88,300 | |
| Kellogg Co. 4.5% 4/1/46 | 32,000 | 29,373 | |
| Tyson Foods, Inc.: | |||
| 4% 3/1/26 | 70,000 | 69,550 | |
| 5.1% 9/28/48 | 50,000 | 50,054 | |
| Unilever Capital Corp.: | |||
| 1.375% 9/14/30 | 135,000 | 109,745 | |
| 2% 7/28/26 | 280,000 | 263,455 | |
| 3.125% 3/22/23 | 100,000 | 100,239 | |
| 1,474,166 | |||
| Household Products - 0.1% | |||
| Kimberly-Clark Corp.: | |||
| 1.05% 9/15/27 | 110,000 | 96,032 | |
| 3.1% 3/26/30 | 22,000 | 20,565 | |
| Procter & Gamble Co.: | |||
| 3% 3/25/30 | 105,000 | 99,066 | |
| 3.55% 3/25/40 | 160,000 | 144,631 | |
| 360,294 | |||
| Personal Products - 0.0% | |||
| Estee Lauder Companies, Inc. 1.95% 3/15/31 | 200,000 | 168,450 | |
| Tobacco - 0.3% | |||
| Altria Group, Inc.: | |||
| 2.625% 9/16/26 | 110,000 | 101,257 | |
| 3.4% 5/6/30 | 300,000 | 254,479 | |
| 3.875% 9/16/46 | 38,000 | 25,563 | |
| 4.8% 2/14/29 | 120,000 | 114,021 | |
| 5.8% 2/14/39 | 100,000 | 90,878 | |
| 5.95% 2/14/49 | 30,000 | 26,288 | |
| BAT Capital Corp.: | |||
| 3.557% 8/15/27 | 130,000 | 118,929 | |
| 4.39% 8/15/37 | 521,000 | 413,304 | |
| 4.54% 8/15/47 | 213,000 | 156,173 | |
| Philip Morris International, Inc.: | |||
| 2.875% 5/1/24 | 80,000 | 79,084 | |
| 3.125% 3/2/28 | 54,000 | 49,248 | |
| 4.375% 11/15/41 | 265,000 | 220,146 | |
| 1,649,370 | |||
| TOTAL CONSUMER STAPLES | 12,146,319 | ||
| ENERGY - 1.6% | |||
| Energy Equipment & Services - 0.0% | |||
| Baker Hughes Co. 4.08% 12/15/47 | 172,000 | 145,408 | |
| Oil, Gas & Consumable Fuels - 1.6% | |||
| Canadian Natural Resources Ltd.: | |||
| 3.85% 6/1/27 | 558,000 | 534,755 | |
| 4.95% 6/1/47 | 19,000 | 17,994 | |
| Cenovus Energy, Inc. 5.4% 6/15/47 | 124,000 | 119,107 | |
| Chevron Corp.: | |||
| 1.141% 5/11/23 | 80,000 | 78,629 | |
| 1.554% 5/11/25 | 80,000 | 75,857 | |
| 1.995% 5/11/27 | 80,000 | 73,532 | |
| 2.236% 5/11/30 | 80,000 | 70,209 | |
| 2.978% 5/11/40 | 80,000 | 63,529 | |
| 3.078% 5/11/50 | 80,000 | 63,613 | |
| Chevron U.S.A., Inc.: | |||
| 3.85% 1/15/28 | 55,000 | 54,628 | |
| 4.95% 8/15/47 | 30,000 | 30,279 | |
| ConocoPhillips Co.: | |||
| 5.95% 3/15/46 | 86,000 | 97,547 | |
| 6.5% 2/1/39 | 260,000 | 305,124 | |
| Devon Energy Corp. 5% 6/15/45 | 80,000 | 74,187 | |
| Eastern Gas Transmission & Storage, Inc. 3.9% 11/15/49 (a) | 60,000 | 48,117 | |
| Enbridge Energy Partners LP 5.875% 10/15/25 | 76,000 | 79,168 | |
| Enbridge, Inc. 5.5% 12/1/46 | 60,000 | 61,714 | |
| Energy Transfer LP: | |||
| 4.2% 9/15/23 | 30,000 | 30,045 | |
| 4.5% 4/15/24 | 50,000 | 50,023 | |
| 5% 5/15/50 | 160,000 | 136,151 | |
| 5.8% 6/15/38 | 70,000 | 65,567 | |
| 6% 6/15/48 | 356,000 | 334,429 | |
| 6.25% 4/15/49 | 30,000 | 29,079 | |
| Enterprise Products Operating LP: | |||
| 3.125% 7/31/29 | 70,000 | 62,995 | |
| 3.95% 2/15/27 | 85,000 | 83,639 | |
| 4.2% 1/31/50 | 418,000 | 348,561 | |
| 4.25% 2/15/48 | 105,000 | 88,324 | |
| EOG Resources, Inc. 4.375% 4/15/30 | 510,000 | 512,018 | |
| Equinor ASA: | |||
| 3.125% 4/6/30 | 357,000 | 331,017 | |
| 3.25% 11/18/49 | 160,000 | 126,864 | |
| 3.625% 9/10/28 | 120,000 | 117,267 | |
| Exxon Mobil Corp.: | |||
| 3.452% 4/15/51 | 330,000 | 269,600 | |
| 4.227% 3/19/40 | 421,000 | 397,815 | |
| Hess Corp.: | |||
| 4.3% 4/1/27 | 150,000 | 146,218 | |
| 7.125% 3/15/33 | 130,000 | 144,690 | |
| Kinder Morgan Energy Partners LP: | |||
| 5% 8/15/42 | 100,000 | 87,556 | |
| 5% 3/1/43 | 215,000 | 188,097 | |
| Kinder Morgan, Inc.: | |||
| 3.15% 1/15/23 | 119,000 | 118,818 | |
| 4.3% 3/1/28 | 112,000 | 108,955 | |
| 5.2% 3/1/48 | 30,000 | 27,404 | |
| Magellan Midstream Partners LP: | |||
| 3.95% 3/1/50 | 75,000 | 59,154 | |
| 5% 3/1/26 | 72,000 | 73,608 | |
| Marathon Oil Corp. 4.4% 7/15/27 | 240,000 | 234,314 | |
| Marathon Petroleum Corp.: | |||
| 4.75% 9/15/44 | 21,000 | 18,501 | |
| 5.125% 12/15/26 | 410,000 | 419,574 | |
| MPLX LP: | |||
| 4.5% 7/15/23 | 82,000 | 82,233 | |
| 4.7% 4/15/48 | 28,000 | 23,538 | |
| 4.8% 2/15/29 | 30,000 | 29,500 | |
| 5.5% 2/15/49 | 310,000 | 287,533 | |
| ONEOK, Inc.: | |||
| 4.45% 9/1/49 | 40,000 | 31,857 | |
| 4.55% 7/15/28 | 59,000 | 57,041 | |
| Ovintiv, Inc. 6.5% 2/1/38 | 50,000 | 51,598 | |
| Phillips 66 Co.: | |||
| 3.15% 12/15/29 (a) | 170,000 | 152,685 | |
| 3.9% 3/15/28 | 94,000 | 91,307 | |
| Pioneer Natural Resources Co.: | |||
| 1.125% 1/15/26 | 230,000 | 205,506 | |
| 1.9% 8/15/30 | 19,000 | 15,518 | |
| Sabine Pass Liquefaction LLC 4.5% 5/15/30 | 850,000 | 814,570 | |
| Shell International Finance BV: | |||
| 3.125% 11/7/49 | 100,000 | 76,697 | |
| 3.25% 4/6/50 | 100,000 | 78,793 | |
| 3.75% 9/12/46 | 70,000 | 59,774 | |
| 4.375% 5/11/45 | 293,000 | 272,409 | |
| Spectra Energy Partners LP 3.375% 10/15/26 | 158,000 | 150,274 | |
| Suncor Energy, Inc. 4% 11/15/47 | 179,000 | 152,888 | |
| The Williams Companies, Inc.: | |||
| 3.75% 6/15/27 | 35,000 | 33,422 | |
| 4.85% 3/1/48 | 83,000 | 75,075 | |
| Total Capital International SA 3.127% 5/29/50 | 220,000 | 168,168 | |
| TransCanada PipeLines Ltd.: | |||
| 4.1% 4/15/30 | 190,000 | 181,476 | |
| 7.625% 1/15/39 | 231,000 | 284,031 | |
| Transcontinental Gas Pipe Line Co. LLC: | |||
| 3.25% 5/15/30 | 66,000 | 59,271 | |
| 3.95% 5/15/50 | 180,000 | 149,408 | |
| Valero Energy Corp.: | |||
| 2.85% 4/15/25 | 190,000 | 183,618 | |
| 4.35% 6/1/28 | 20,000 | 19,448 | |
| 10,245,910 | |||
| TOTAL ENERGY | 10,391,318 | ||
| FINANCIALS - 8.5% | |||
| Banks - 5.0% | |||
| Banco Santander SA: | |||
| 1.849% 3/25/26 | 200,000 | 179,745 | |
| 2.958% 3/25/31 | 200,000 | 167,539 | |
| Bank of America Corp.: | |||
| 0.81% 10/24/24 (b) | 500,000 | 476,525 | |
| 0.981% 9/25/25 (b) | 600,000 | 555,115 | |
| 1.197% 10/24/26 (b) | 924,000 | 826,803 | |
| 2.651% 3/11/32(b) | 180,000 | 151,265 | |
| 2.676% 6/19/41 (b) | 100,000 | 71,952 | |
| 2.687% 4/22/32 (b) | 356,000 | 298,868 | |
| 3.419% 12/20/28 (b) | 220,000 | 204,877 | |
| 3.458% 3/15/25 (b) | 1,900,000 | 1,872,588 | |
| 3.55% 3/5/24 (b) | 113,000 | 112,637 | |
| 3.946% 1/23/49 (b) | 23,000 | 19,540 | |
| 3.97% 3/5/29 (b) | 125,000 | 119,193 | |
| 3.974% 2/7/30 (b) | 60,000 | 56,675 | |
| 4% 1/22/25 | 370,000 | 368,356 | |
| 4.083% 3/20/51 (b) | 220,000 | 189,609 | |
| 4.271% 7/23/29 (b) | 80,000 | 76,865 | |
| 4.33% 3/15/50 (b) | 60,000 | 53,883 | |
| 5% 1/21/44 | 400,000 | 392,897 | |
| Bank of Nova Scotia 3.4% 2/11/24 | 140,000 | 139,325 | |
| Barclays PLC: | |||
| 2.279% 11/24/27 (b) | 400,000 | 354,605 | |
| 2.852% 5/7/26 (b) | 516,000 | 487,257 | |
| 4.337% 1/10/28 | 200,000 | 191,124 | |
| 5.088% 6/20/30 (b) | 726,000 | 685,270 | |
| Canadian Imperial Bank of Commerce 3.6% 4/7/32 | 143,000 | 129,809 | |
| Citigroup, Inc.: | |||
| 3 month U.S. LIBOR + 1.150% 3.52% 10/27/28 (b)(c) | 205,000 | 191,538 | |
| 2.976% 11/5/30 (b) | 270,000 | 235,659 | |
| 3.106% 4/8/26 (b) | 500,000 | 479,978 | |
| 3.98% 3/20/30 (b) | 160,000 | 149,642 | |
| 4.65% 7/23/48 | 78,000 | 72,609 | |
| 5.316% 3/26/41 (b) | 617,000 | 619,769 | |
| Citizens Financial Group, Inc. 2.638% 9/30/32 | 78,000 | 62,215 | |
| Export-Import Bank of Korea 2.875% 1/21/25 | 350,000 | 344,232 | |
| Fifth Third Bancorp 2.55% 5/5/27 | 200,000 | 183,288 | |
| HSBC Holdings PLC: | |||
| 4.292% 9/12/26 (b) | 1,060,000 | 1,035,609 | |
| 6.8% 6/1/38 | 449,000 | 484,504 | |
| ING Groep NV 2.727% 4/1/32 (b) | 200,000 | 166,441 | |
| Japan Bank International Cooperation: | |||
| 0.625% 7/15/25 | 750,000 | 693,124 | |
| 1.25% 1/21/31 | 580,000 | 488,207 | |
| JPMorgan Chase & Co.: | |||
| 0.653% 9/16/24 (b) | 790,000 | 757,118 | |
| 1.47% 9/22/27 (b) | 390,000 | 342,054 | |
| 1.578% 4/22/27 (b) | 188,000 | 167,304 | |
| 1.953% 2/4/32 (b) | 250,000 | 199,818 | |
| 2.083% 4/22/26 (b) | 200,000 | 187,015 | |
| 2.522% 4/22/31 (b) | 150,000 | 127,758 | |
| 2.545% 11/8/32 (b) | 40,000 | 33,234 | |
| 2.58% 4/22/32 (b) | 189,000 | 159,025 | |
| 2.739% 10/15/30 (b) | 720,000 | 628,203 | |
| 2.95% 10/1/26 | 224,000 | 213,145 | |
| 2.956% 5/13/31 (b) | 50,000 | 43,169 | |
| 3.109% 4/22/51 (b) | 100,000 | 73,291 | |
| 3.882% 7/24/38 (b) | 734,000 | 646,939 | |
| 4.005% 4/23/29 (b) | 43,000 | 41,214 | |
| 4.203% 7/23/29 (b) | 30,000 | 28,935 | |
| 4.452% 12/5/29 (b) | 200,000 | 194,781 | |
| 4.95% 6/1/45 | 135,000 | 128,833 | |
| Korea Development Bank 0.4% 6/19/24 | 300,000 | 283,770 | |
| Lloyds Banking Group PLC: | |||
| 4.45% 5/8/25 | 200,000 | 200,174 | |
| 4.582% 12/10/25 | 1,518,000 | 1,488,357 | |
| Mitsubishi UFJ Financial Group, Inc.: | |||
| 2.193% 2/25/25 | 740,000 | 702,313 | |
| 3.751% 7/18/39 | 290,000 | 251,402 | |
| 3.777% 3/2/25 | 84,000 | 83,373 | |
| Mizuho Financial Group, Inc.: | |||
| 0.849% 9/8/24 (b) | 400,000 | 384,578 | |
| 1.554% 7/9/27 (b) | 285,000 | 250,680 | |
| 2.226% 5/25/26 (b) | 400,000 | 373,849 | |
| NatWest Group PLC: | |||
| 3.073% 5/22/28 (b) | 290,000 | 263,625 | |
| 3.875% 9/12/23 | 220,000 | 219,275 | |
| Oesterreichische Kontrollbank AG 0.375% 9/17/25 | 83,000 | 76,017 | |
| PNC Financial Services Group, Inc.: | |||
| 1.15% 8/13/26 | 514,000 | 459,253 | |
| 2.2% 11/1/24 | 70,000 | 67,796 | |
| Rabobank Nederland New York Branch 0.375% 1/12/24 | 1,300,000 | 1,236,317 | |
| Royal Bank of Canada: | |||
| 0.75% 10/7/24 | 480,000 | 448,225 | |
| 2.55% 7/16/24 | 360,000 | 351,508 | |
| 4.65% 1/27/26 | 55,000 | 55,455 | |
| Santander Holdings U.S.A., Inc. 4.5% 7/17/25 | 82,000 | 81,192 | |
| Sumitomo Mitsui Financial Group, Inc.: | |||
| 1.474% 7/8/25 | 400,000 | 367,356 | |
| 2.174% 1/14/27 | 800,000 | 723,469 | |
| 2.348% 1/15/25 | 200,000 | 191,268 | |
| 2.75% 1/15/30 | 200,000 | 173,901 | |
| 3.784% 3/9/26 | 640,000 | 627,371 | |
| 3.936% 10/16/23 | 80,000 | 80,338 | |
| The Toronto-Dominion Bank 2.65% 6/12/24 | 510,000 | 500,470 | |
| Truist Financial Corp.: | |||
| 1.2% 8/5/25 | 700,000 | 643,076 | |
| 1.267% 3/2/27 (b) | 29,000 | 25,975 | |
| U.S. Bancorp 1.375% 7/22/30 | 210,000 | 167,341 | |
| Wells Fargo & Co.: | |||
| 2.164% 2/11/26 (b) | 310,000 | 291,358 | |
| 2.188% 4/30/26 (b) | 340,000 | 318,088 | |
| 2.572% 2/11/31 (b) | 690,000 | 593,143 | |
| 3.068% 4/30/41 (b) | 100,000 | 77,441 | |
| 3.584% 5/22/28 (b) | 82,000 | 77,794 | |
| 3.75% 1/24/24 | 150,000 | 150,355 | |
| 4.1% 6/3/26 | 1,194,000 | 1,174,428 | |
| 4.75% 12/7/46 | 157,000 | 143,726 | |
| 5.013% 4/4/51 (b) | 130,000 | 127,504 | |
| 5.375% 2/7/35 | 100,000 | 103,467 | |
| Westpac Banking Corp.: | |||
| 2.894% 2/4/30 (b) | 590,000 | 559,000 | |
| 4.11% 7/24/34 (b) | 320,000 | 292,481 | |
| 32,047,482 | |||
| Capital Markets - 1.3% | |||
| Ares Capital Corp. 2.15% 7/15/26 | 234,000 | 196,118 | |
| Bank of New York Mellon Corp.: | |||
| 0.35% 12/7/23 | 1,100,000 | 1,059,622 | |
| 1.8% 7/28/31 | 80,000 | 64,769 | |
| 3.85% 4/28/28 | 27,000 | 26,349 | |
| BlackRock, Inc. 3.5% 3/18/24 | 470,000 | 471,890 | |
| Brookfield Finance, Inc. 2.724% 4/15/31 | 312,000 | 263,663 | |
| Charles Schwab Corp. 2% 3/20/28 | 215,000 | 191,894 | |
| Credit Suisse AG 0.495% 2/2/24 | 700,000 | 659,800 | |
| Credit Suisse Group AG 4.55% 4/17/26 | 250,000 | 244,341 | |
| Deutsche Bank AG 4.1% 1/13/26 | 200,000 | 197,537 | |
| Deutsche Bank AG New York Branch: | |||
| 2.311% 11/16/27 (b) | 150,000 | 129,447 | |
| 3.7% 5/30/24 | 200,000 | 196,433 | |
| 4.1% 1/13/26 | 200,000 | 196,197 | |
| Goldman Sachs Group, Inc.: | |||
| 2.615% 4/22/32 (b) | 255,000 | 211,710 | |
| 3.691% 6/5/28 (b) | 440,000 | 417,244 | |
| 4.017% 10/31/38 (b) | 887,000 | 774,554 | |
| 4.223% 5/1/29 (b) | 60,000 | 57,672 | |
| 4.411% 4/23/39 (b) | 100,000 | 90,766 | |
| 4.75% 10/21/45 | 28,000 | 26,026 | |
| Intercontinental Exchange, Inc.: | |||
| 1.85% 9/15/32 | 180,000 | 140,391 | |
| 2.65% 9/15/40 | 80,000 | 58,142 | |
| 3% 6/15/50 | 138,000 | 99,376 | |
| 3.75% 9/21/28 | 50,000 | 48,024 | |
| Jefferies Group LLC / Jefferies Group Capital Finance, Inc. 4.85% 1/15/27 | 100,000 | 100,034 | |
| Moody's Corp. 4.875% 12/17/48 | 123,000 | 119,752 | |
| Morgan Stanley: | |||
| 3 month U.S. LIBOR + 1.430% 4.457% 4/22/39 (b)(c) | 295,000 | 274,787 | |
| 2.699% 1/22/31 (b) | 230,000 | 199,208 | |
| 3.625% 1/20/27 | 96,000 | 92,982 | |
| 3.971% 7/22/38 (b) | 120,000 | 107,369 | |
| 4.375% 1/22/47 | 148,000 | 134,298 | |
| 5.597% 3/24/51 (b) | 90,000 | 97,037 | |
| 6.375% 7/24/42 | 190,000 | 217,633 | |
| NASDAQ, Inc. 2.5% 12/21/40 | 100,000 | 69,660 | |
| Nomura Holdings, Inc. 3.103% 1/16/30 | 623,000 | 529,934 | |
| Northern Trust Corp. 1.95% 5/1/30 | 220,000 | 186,830 | |
| State Street Corp. 1.684% 11/18/27 (b) | 204,000 | 183,169 | |
| 8,134,658 | |||
| Consumer Finance - 0.9% | |||
| AerCap Ireland Capital Ltd./AerCap Global Aviation Trust: | |||
| 2.45% 10/29/26 | 250,000 | 217,691 | |
| 2.875% 8/14/24 | 150,000 | 142,890 | |
| 3.85% 10/29/41 | 150,000 | 108,086 | |
| 4.125% 7/3/23 | 300,000 | 297,011 | |
| 4.45% 4/3/26 | 150,000 | 143,238 | |
| 4.5% 9/15/23 | 150,000 | 149,282 | |
| 4.625% 10/15/27 | 220,000 | 207,103 | |
| 4.875% 1/16/24 | 150,000 | 149,216 | |
| Ally Financial, Inc.: | |||
| 3.05% 6/5/23 | 120,000 | 118,716 | |
| 5.125% 9/30/24 | 290,000 | 292,814 | |
| 5.8% 5/1/25 | 250,000 | 255,330 | |
| American Express Co.: | |||
| 2.5% 7/30/24 | 219,000 | 213,074 | |
| 3.3% 5/3/27 | 30,000 | 28,855 | |
| Capital One Financial Corp. 3.8% 1/31/28 | 251,000 | 236,085 | |
| GE Capital International Funding Co. 4.418% 11/15/35 | 200,000 | 186,799 | |
| John Deere Capital Corp.: | |||
| 2.6% 3/7/24 | 60,000 | 59,297 | |
| 2.8% 3/6/23 | 64,000 | 63,989 | |
| 2.8% 7/18/29 | 220,000 | 202,491 | |
| 3.65% 10/12/23 | 290,000 | 291,367 | |
| Synchrony Financial: | |||
| 3.95% 12/1/27 | 150,000 | 136,739 | |
| 4.375% 3/19/24 | 45,000 | 44,726 | |
| 5.15% 3/19/29 | 159,000 | 148,754 | |
| Toyota Motor Credit Corp.: | |||
| 0.5% 8/14/23 | 280,000 | 271,507 | |
| 2.15% 9/8/22 | 1,000,000 | 999,617 | |
| 2.25% 10/18/23 | 113,000 | 111,501 | |
| 3% 4/1/25 | 580,000 | 568,958 | |
| 5,645,136 | |||
| Diversified Financial Services - 0.7% | |||
| AB Svensk Exportkredit 0.25% 9/29/23 | 200,000 | 193,056 | |
| Berkshire Hathaway, Inc. 4.5% 2/11/43 | 33,000 | 31,470 | |
| Blackstone Private Credit Fund: | |||
| 2.7% 1/15/25 (a) | 160,000 | 145,994 | |
| 4.7% 3/24/25 (a) | 180,000 | 172,917 | |
| BP Capital Markets America, Inc. 3% 2/24/50 | 240,000 | 174,232 | |
| Brixmor Operating Partnership LP: | |||
| 4.05% 7/1/30 | 41,000 | 36,993 | |
| 4.125% 5/15/29 | 19,000 | 17,700 | |
| DH Europe Finance II SARL: | |||
| 2.2% 11/15/24 | 70,000 | 67,149 | |
| 2.6% 11/15/29 | 80,000 | 71,735 | |
| 3.4% 11/15/49 | 50,000 | 40,173 | |
| Equitable Holdings, Inc. 4.35% 4/20/28 | 360,000 | 347,276 | |
| Fedex Corp. 2020-1 Class AA pass-thru Trust equipment trust certificate 1.875% 8/20/35 | 35,872 | 31,119 | |
| Japan International Cooperation Agency 1.75% 4/28/31 | 200,000 | 172,072 | |
| KfW: | |||
| 0.25% 10/19/23 | 300,000 | 289,716 | |
| 0.375% 7/18/25 | 2,072,000 | 1,907,405 | |
| 2.625% 2/28/24 | 400,000 | 397,286 | |
| 2.875% 4/3/28 | 14,000 | 13,780 | |
| Landwirtschaftliche Rentenbank 3.125% 11/14/23 | 80,000 | 80,162 | |
| 4,190,235 | |||
| Insurance - 0.6% | |||
| ACE INA Holdings, Inc.: | |||
| 1.375% 9/15/30 | 350,000 | 279,306 | |
| 4.35% 11/3/45 | 128,000 | 120,734 | |
| AFLAC, Inc. 3.6% 4/1/30 | 224,000 | 212,127 | |
| Allstate Corp.: | |||
| 1.45% 12/15/30 | 110,000 | 87,389 | |
| 5.55% 5/9/35 | 156,000 | 168,706 | |
| American International Group, Inc.: | |||
| 2.5% 6/30/25 | 44,000 | 41,934 | |
| 4.25% 3/15/29 | 100,000 | 93,811 | |
| 4.375% 6/30/50 | 240,000 | 212,818 | |
| 4.5% 7/16/44 | 25,000 | 22,388 | |
| 4.75% 4/1/48 | 100,000 | 93,528 | |
| 5.75% 4/1/48 (b) | 280,000 | 250,194 | |
| Aon Corp. 3.75% 5/2/29 | 120,000 | 113,341 | |
| Baylor Scott & White Holdings Series 2021, 2.839% 11/15/50 | 120,000 | 87,835 | |
| Berkshire Hathaway Finance Corp.: | |||
| 1.45% 10/15/30 | 120,000 | 97,478 | |
| 2.85% 10/15/50 | 220,000 | 158,377 | |
| 4.2% 8/15/48 | 243,000 | 222,016 | |
| Brighthouse Financial, Inc. 4.7% 6/22/47 | 28,000 | 22,286 | |
| Hartford Financial Services Group, Inc. 4.4% 3/15/48 | 70,000 | 63,314 | |
| Lincoln National Corp. 4.35% 3/1/48 | 160,000 | 135,574 | |
| Marsh & McLennan Companies, Inc.: | |||
| 4.2% 3/1/48 | 110,000 | 97,266 | |
| 4.9% 3/15/49 | 50,000 | 49,012 | |
| MetLife, Inc.: | |||
| 4.05% 3/1/45 | 18,000 | 15,897 | |
| 4.55% 3/23/30 | 600,000 | 604,983 | |
| 4.875% 11/13/43 | 100,000 | 98,563 | |
| Progressive Corp. 4.2% 3/15/48 | 135,000 | 123,874 | |
| Prudential Financial, Inc.: | |||
| 3.878% 3/27/28 | 23,000 | 22,455 | |
| 3.935% 12/7/49 | 38,000 | 32,709 | |
| 4.35% 2/25/50 | 285,000 | 262,401 | |
| 5.125% 3/1/52 (b) | 50,000 | 46,158 | |
| The Travelers Companies, Inc. 4% 5/30/47 | 32,000 | 28,337 | |
| Willis Group North America, Inc. 2.95% 9/15/29 | 170,000 | 145,743 | |
| 4,010,554 | |||
| TOTAL FINANCIALS | 54,028,065 | ||
| HEALTH CARE - 2.2% | |||
| Biotechnology - 0.3% | |||
| AbbVie, Inc.: | |||
| 2.6% 11/21/24 | 60,000 | 58,078 | |
| 2.95% 11/21/26 | 50,000 | 47,377 | |
| 3.2% 11/21/29 | 80,000 | 73,595 | |
| 3.8% 3/15/25 | 61,000 | 60,512 | |
| 4.05% 11/21/39 | 50,000 | 44,587 | |
| 4.25% 11/21/49 | 390,000 | 346,215 | |
| 4.3% 5/14/36 | 40,000 | 37,572 | |
| 4.55% 3/15/35 | 80,000 | 77,816 | |
| 4.7% 5/14/45 | 120,000 | 112,958 | |
| 4.875% 11/14/48 | 100,000 | 95,828 | |
| Amgen, Inc.: | |||
| 3.15% 2/21/40 | 410,000 | 324,106 | |
| 3.2% 11/2/27 | 56,000 | 53,282 | |
| 3.375% 2/21/50 | 110,000 | 84,051 | |
| 4.4% 5/1/45 | 102,000 | 91,982 | |
| Biogen, Inc. 3.25% 2/15/51 | 270,000 | 189,006 | |
| Gilead Sciences, Inc.: | |||
| 2.8% 10/1/50 | 180,000 | 125,611 | |
| 4% 9/1/36 | 40,000 | 37,349 | |
| 4.15% 3/1/47 | 60,000 | 52,677 | |
| 4.5% 2/1/45 | 311,000 | 286,307 | |
| 2,198,909 | |||
| Health Care Equipment & Supplies - 0.2% | |||
| Abbott Laboratories: | |||
| 3.875% 9/15/25 | 240,000 | 242,359 | |
| 4.9% 11/30/46 | 20,000 | 20,958 | |
| Baxter International, Inc.: | |||
| 1.915% 2/1/27 | 180,000 | 161,195 | |
| 2.539% 2/1/32 | 180,000 | 151,950 | |
| Becton, Dickinson & Co.: | |||
| 2.823% 5/20/30 | 150,000 | 131,938 | |
| 3.7% 6/6/27 | 52,000 | 50,251 | |
| 4.669% 6/6/47 | 130,000 | 121,614 | |
| Boston Scientific Corp.: | |||
| 3.75% 3/1/26 | 120,000 | 118,445 | |
| 4% 3/1/29 | 100,000 | 96,090 | |
| 4.7% 3/1/49 | 140,000 | 133,717 | |
| Medtronic, Inc. 4.625% 3/15/45 | 168,000 | 168,474 | |
| Stryker Corp. 2.9% 6/15/50 | 100,000 | 72,217 | |
| 1,469,208 | |||
| Health Care Providers & Services - 1.1% | |||
| Aetna, Inc.: | |||
| 2.8% 6/15/23 | 110,000 | 108,635 | |
| 4.75% 3/15/44 | 60,000 | 55,024 | |
| AHS Hospital Corp. 2.78% 7/1/51 | 250,000 | 177,573 | |
| Allina Health System, Inc. 3.887% 4/15/49 | 20,000 | 17,680 | |
| Banner Health 2.913% 1/1/51 | 100,000 | 74,632 | |
| Baptist Healthcare System Obli 3.54% 8/15/50 | 100,000 | 79,573 | |
| Bon Secours Mercy Health, Inc. 2.095% 6/1/31 | 71,000 | 59,334 | |
| Cardinal Health, Inc. 3.41% 6/15/27 | 67,000 | 64,428 | |
| Children's Hospital of Philadelphia 2.704% 7/1/50 | 79,000 | 55,737 | |
| Cigna Corp.: | |||
| 3.75% 7/15/23 | 10,000 | 10,022 | |
| 4.125% 11/15/25 | 25,000 | 25,027 | |
| 4.375% 10/15/28 | 30,000 | 29,768 | |
| 4.5% 2/25/26 | 74,000 | 74,739 | |
| 4.8% 8/15/38 | 80,000 | 77,814 | |
| 4.8% 7/15/46 | 465,000 | 442,950 | |
| 4.9% 12/15/48 | 30,000 | 28,795 | |
| CommonSpirit Health 3.91% 10/1/50 | 125,000 | 100,331 | |
| CVS Health Corp.: | |||
| 2.7% 8/21/40 | 467,000 | 337,160 | |
| 3% 8/15/26 | 20,000 | 19,128 | |
| 3.25% 8/15/29 | 195,000 | 178,008 | |
| 3.75% 4/1/30 | 380,000 | 355,436 | |
| 4.1% 3/25/25 | 32,000 | 32,206 | |
| 4.25% 4/1/50 | 37,000 | 31,855 | |
| 4.3% 3/25/28 | 264,000 | 261,207 | |
| 5.05% 3/25/48 | 131,000 | 125,399 | |
| Elevance Health, Inc.: | |||
| 3.35% 12/1/24 | 89,000 | 87,771 | |
| 4.101% 3/1/28 | 50,000 | 49,481 | |
| 4.375% 12/1/47 | 175,000 | 161,065 | |
| 4.55% 3/1/48 | 120,000 | 113,471 | |
| Franciscan Missionaries of Our Lady Health System, Inc. 3.914% 7/1/49 | 120,000 | 104,046 | |
| HCA Holdings, Inc.: | |||
| 4.5% 2/15/27 | 1,013,000 | 973,901 | |
| 5.25% 6/15/49 | 100,000 | 86,125 | |
| Humana, Inc. 3.95% 3/15/27 | 445,000 | 436,467 | |
| INTEGRIS Baptist Medical Center, Inc. 3.875% 8/15/50 | 83,000 | 70,603 | |
| Kaiser Foundation Hospitals: | |||
| 2.81% 6/1/41 | 63,000 | 48,849 | |
| 3.266% 11/1/49 | 80,000 | 63,437 | |
| 4.15% 5/1/47 | 30,000 | 27,993 | |
| MidMichigan Health 3.409% 6/1/50 | 33,000 | 26,350 | |
| Novant Health, Inc. 3.168% 11/1/51 | 105,000 | 81,526 | |
| Orlando Health Obligated Group 3.327% 10/1/50 | 57,000 | 44,331 | |
| Piedmont Healthcare, Inc. 2.719% 1/1/42 | 37,000 | 27,711 | |
| Providence St. Joseph Health Obligated Group 2.7% 10/1/51 | 130,000 | 88,244 | |
| Sutter Health 3.361% 8/15/50 | 130,000 | 99,730 | |
| Trinity Health Corp. 2.632% 12/1/40 | 50,000 | 37,221 | |
| UnitedHealth Group, Inc.: | |||
| 1.15% 5/15/26 | 180,000 | 163,191 | |
| 1.25% 1/15/26 | 81,000 | 74,706 | |
| 2.375% 8/15/24 | 90,000 | 88,091 | |
| 2.9% 5/15/50 | 120,000 | 89,871 | |
| 3.5% 8/15/39 | 772,000 | 673,094 | |
| 3.7% 8/15/49 | 40,000 | 34,114 | |
| 3.75% 10/15/47 | 30,000 | 25,924 | |
| 4.45% 12/15/48 | 102,000 | 97,893 | |
| West Virginia University Health System Obligated Group 3.129% 6/1/50 | 70,000 | 51,079 | |
| 6,748,746 | |||
| Life Sciences Tools & Services - 0.0% | |||
| PerkinElmer, Inc. 2.25% 9/15/31 | 90,000 | 71,117 | |
| Pharmaceuticals - 0.6% | |||
| AstraZeneca Finance LLC: | |||
| 1.2% 5/28/26 | 290,000 | 262,343 | |
| 2.25% 5/28/31 | 290,000 | 252,444 | |
| AstraZeneca PLC: | |||
| 4.375% 11/16/45 | 45,000 | 43,310 | |
| 4.375% 8/17/48 | 50,000 | 49,012 | |
| Bristol-Myers Squibb Co.: | |||
| 2.9% 7/26/24 | 70,000 | 69,332 | |
| 4.125% 6/15/39 | 100,000 | 95,511 | |
| 4.55% 2/20/48 | 42,000 | 41,086 | |
| Eli Lilly & Co. 2.25% 5/15/50 | 200,000 | 141,359 | |
| GlaxoSmithKline Capital, Inc. 3.875% 5/15/28 | 130,000 | 129,291 | |
| GSK Consumer Healthcare Capital U.S. LLC 3.625% 3/24/32 (a) | 250,000 | 231,040 | |
| Johnson & Johnson: | |||
| 1.3% 9/1/30 | 110,000 | 92,529 | |
| 2.1% 9/1/40 | 220,000 | 160,765 | |
| 2.45% 9/1/60 | 110,000 | 74,574 | |
| 3.4% 1/15/38 | 116,000 | 104,341 | |
| Merck & Co., Inc.: | |||
| 3.7% 2/10/45 | 45,000 | 39,371 | |
| 4.15% 5/18/43 | 266,000 | 252,239 | |
| Mylan NV 4.55% 4/15/28 | 20,000 | 19,066 | |
| Novartis Capital Corp.: | |||
| 1.75% 2/14/25 | 100,000 | 96,450 | |
| 2.75% 8/14/50 | 50,000 | 38,925 | |
| 3.1% 5/17/27 | 90,000 | 87,593 | |
| 4% 11/20/45 | 35,000 | 32,553 | |
| Pfizer, Inc.: | |||
| 2.55% 5/28/40 | 125,000 | 97,860 | |
| 2.7% 5/28/50 | 380,000 | 289,237 | |
| 3.45% 3/15/29 | 70,000 | 67,972 | |
| 4% 12/15/36 | 36,000 | 34,989 | |
| Shire Acquisitions Investments Ireland DAC 3.2% 9/23/26 | 110,000 | 105,652 | |
| Takeda Pharmaceutical Co. Ltd.: | |||
| 2.05% 3/31/30 | 200,000 | 167,283 | |
| 3.025% 7/9/40 | 272,000 | 209,343 | |
| Viatris, Inc.: | |||
| 2.7% 6/22/30 | 100,000 | 80,256 | |
| 4% 6/22/50 | 100,000 | 66,959 | |
| Zoetis, Inc. 4.45% 8/20/48 | 60,000 | 56,042 | |
| 3,488,727 | |||
| TOTAL HEALTH CARE | 13,976,707 | ||
| INDUSTRIALS - 1.8% | |||
| Aerospace & Defense - 0.5% | |||
| General Dynamics Corp.: | |||
| 2.125% 8/15/26 | 160,000 | 149,972 | |
| 3.375% 5/15/23 | 81,000 | 81,497 | |
| 4.25% 4/1/50 | 50,000 | 48,076 | |
| Lockheed Martin Corp.: | |||
| 4.09% 9/15/52 | 70,000 | 65,169 | |
| 4.7% 5/15/46 | 28,000 | 28,265 | |
| Northrop Grumman Corp.: | |||
| 3.25% 1/15/28 | 80,000 | 76,042 | |
| 4.03% 10/15/47 | 106,000 | 94,124 | |
| 5.25% 5/1/50 | 120,000 | 127,040 | |
| Raytheon Technologies Corp.: | |||
| 3.65% 8/16/23 | 4,000 | 3,996 | |
| 3.75% 11/1/46 | 30,000 | 25,408 | |
| 4.05% 5/4/47 | 18,000 | 15,940 | |
| 4.125% 11/16/28 | 260,000 | 256,586 | |
| 4.35% 4/15/47 | 50,000 | 46,267 | |
| 4.45% 11/16/38 | 370,000 | 352,912 | |
| The Boeing Co.: | |||
| 3.2% 3/1/29 | 126,000 | 109,026 | |
| 4.875% 5/1/25 | 660,000 | 657,564 | |
| 5.705% 5/1/40 | 836,000 | 779,793 | |
| 5.805% 5/1/50 | 130,000 | 119,401 | |
| 3,037,078 | |||
| Air Freight & Logistics - 0.1% | |||
| FedEx Corp.: | |||
| 4.05% 2/15/48 | 150,000 | 125,534 | |
| 4.25% 5/15/30 | 175,000 | 169,862 | |
| 4.95% 10/17/48 | 102,000 | 97,115 | |
| United Parcel Service, Inc.: | |||
| 2.8% 11/15/24 | 88,000 | 86,952 | |
| 5.3% 4/1/50 | 170,000 | 186,819 | |
| 666,282 | |||
| Airlines - 0.1% | |||
| Southwest Airlines Co. 5.125% 6/15/27 | 595,000 | 600,503 | |
| United Airlines pass-thru trust equipment trust certificate 3.1% 1/7/30 | 209,702 | 191,485 | |
| 791,988 | |||
| Building Products - 0.1% | |||
| Carrier Global Corp.: | |||
| 2.493% 2/15/27 | 50,000 | 45,487 | |
| 2.722% 2/15/30 | 100,000 | 86,343 | |
| 3.377% 4/5/40 | 195,000 | 152,864 | |
| 3.577% 4/5/50 | 50,000 | 37,841 | |
| Masco Corp.: | |||
| 2% 2/15/31 | 103,000 | 80,929 | |
| 3.125% 2/15/51 | 52,000 | 35,719 | |
| 439,183 | |||
| Commercial Services & Supplies - 0.1% | |||
| Republic Services, Inc.: | |||
| 1.45% 2/15/31 | 500,000 | 392,514 | |
| 3.95% 5/15/28 | 28,000 | 27,449 | |
| 419,963 | |||
| Industrial Conglomerates - 0.2% | |||
| 3M Co.: | |||
| 2.375% 8/26/29 | 177,000 | 158,758 | |
| 2.65% 4/15/25 | 24,000 | 23,535 | |
| 3% 8/7/25 | 310,000 | 305,119 | |
| 3.05% 4/15/30 | 19,000 | 17,723 | |
| 3.7% 4/15/50 | 24,000 | 20,564 | |
| General Electric Co. 4.35% 5/1/50 | 489,000 | 415,361 | |
| Honeywell International, Inc.: | |||
| 2.8% 6/1/50 | 150,000 | 115,435 | |
| 3.812% 11/21/47 | 20,000 | 18,301 | |
| 1,074,796 | |||
| Machinery - 0.2% | |||
| Caterpillar Financial Services Corp.: | |||
| 0.45% 9/14/23 | 170,000 | 164,850 | |
| 1.1% 9/14/27 | 530,000 | 463,896 | |
| 3.45% 5/15/23 | 182,000 | 182,429 | |
| 3.65% 12/7/23 | 310,000 | 311,750 | |
| Caterpillar, Inc. 3.25% 9/19/49 | 110,000 | 90,399 | |
| Deere & Co. 2.875% 9/7/49 | 130,000 | 102,154 | |
| Ingersoll-Rand Luxembourg Finance SA 3.8% 3/21/29 | 125,000 | 117,054 | |
| Otis Worldwide Corp.: | |||
| 2.056% 4/5/25 | 48,000 | 45,456 | |
| 2.565% 2/15/30 | 70,000 | 60,470 | |
| 3.362% 2/15/50 | 50,000 | 37,802 | |
| Parker Hannifin Corp. 4% 6/14/49 | 110,000 | 92,543 | |
| 1,668,803 | |||
| Professional Services - 0.0% | |||
| Thomson Reuters Corp. 3.35% 5/15/26 | 76,000 | 73,727 | |
| Road & Rail - 0.4% | |||
| Burlington Northern Santa Fe LLC: | |||
| 3.05% 2/15/51 | 211,000 | 160,467 | |
| 3.25% 6/15/27 | 30,000 | 29,348 | |
| 4.05% 6/15/48 | 207,000 | 187,566 | |
| 4.45% 3/15/43 | 100,000 | 95,019 | |
| Canadian National Railway Co. 2.45% 5/1/50 | 210,000 | 141,279 | |
| Canadian Pacific Railway Co.: | |||
| 1.75% 12/2/26 | 140,000 | 126,697 | |
| 2.45% 12/2/31 | 140,000 | 119,782 | |
| 3.1% 12/2/51 | 140,000 | 103,120 | |
| CSX Corp.: | |||
| 4.3% 3/1/48 | 140,000 | 127,739 | |
| 4.5% 3/15/49 | 160,000 | 149,781 | |
| 4.75% 11/15/48 | 70,000 | 68,350 | |
| Norfolk Southern Corp.: | |||
| 3.8% 8/1/28 | 63,000 | 61,581 | |
| 4.05% 8/15/52 | 90,000 | 78,399 | |
| 4.15% 2/28/48 | 38,000 | 33,841 | |
| Union Pacific Corp.: | |||
| 2.75% 3/1/26 | 160,000 | 153,525 | |
| 2.891% 4/6/36 | 79,000 | 65,304 | |
| 2.973% 9/16/62 | 290,000 | 200,720 | |
| 3.25% 2/5/50 | 50,000 | 39,208 | |
| 3.5% 6/8/23 | 270,000 | 270,000 | |
| 3.6% 9/15/37 | 38,000 | 33,902 | |
| 3.839% 3/20/60 | 70,000 | 58,430 | |
| 2,304,058 | |||
| Trading Companies & Distributors - 0.1% | |||
| Air Lease Corp.: | |||
| 2.875% 1/15/26 | 120,000 | 110,148 | |
| 3.25% 3/1/25 | 88,000 | 83,992 | |
| 3.75% 6/1/26 | 158,000 | 148,712 | |
| 3.875% 7/3/23 | 526,000 | 521,356 | |
| 4.25% 2/1/24 | 170,000 | 167,943 | |
| 1,032,151 | |||
| TOTAL INDUSTRIALS | 11,508,029 | ||
| INFORMATION TECHNOLOGY - 2.0% | |||
| Electronic Equipment & Components - 0.1% | |||
| Corning, Inc. 5.35% 11/15/48 | 10,000 | 10,075 | |
| Dell International LLC/EMC Corp.: | |||
| 5.3% 10/1/29 | 390,000 | 384,474 | |
| 8.1% 7/15/36 | 80,000 | 93,383 | |
| 8.35% 7/15/46 | 187,000 | 232,876 | |
| 720,808 | |||
| IT Services - 0.6% | |||
| CDW LLC/CDW Finance Corp. 2.67% 12/1/26 | 150,000 | 133,640 | |
| Fidelity National Information Services, Inc.: | |||
| 1.15% 3/1/26 | 246,000 | 217,514 | |
| 2.25% 3/1/31 | 200,000 | 162,325 | |
| Fiserv, Inc.: | |||
| 2.75% 7/1/24 | 440,000 | 429,190 | |
| 3.5% 7/1/29 | 80,000 | 72,975 | |
| 4.4% 7/1/49 | 240,000 | 206,259 | |
| Global Payments, Inc. 1.2% 3/1/26 | 346,000 | 304,801 | |
| IBM Corp.: | |||
| 1.95% 5/15/30 | 175,000 | 146,656 | |
| 2.95% 5/15/50 | 175,000 | 126,707 | |
| 3.5% 5/15/29 | 843,000 | 801,457 | |
| MasterCard, Inc.: | |||
| 2% 11/18/31 | 240,000 | 202,266 | |
| 2.95% 6/1/29 | 50,000 | 46,848 | |
| 3.3% 3/26/27 | 38,000 | 37,340 | |
| 3.35% 3/26/30 | 53,000 | 50,585 | |
| 3.85% 3/26/50 | 115,000 | 105,294 | |
| PayPal Holdings, Inc.: | |||
| 1.65% 6/1/25 | 70,000 | 66,033 | |
| 2.3% 6/1/30 | 120,000 | 103,016 | |
| The Western Union Co. 2.85% 1/10/25 | 70,000 | 67,137 | |
| Visa, Inc.: | |||
| 1.1% 2/15/31 | 250,000 | 200,001 | |
| 2.05% 4/15/30 | 350,000 | 307,027 | |
| 2.7% 4/15/40 | 150,000 | 120,602 | |
| 4.15% 12/14/35 | 38,000 | 37,766 | |
| 3,945,439 | |||
| Semiconductors & Semiconductor Equipment - 0.5% | |||
| Analog Devices, Inc. 2.8% 10/1/41 | 130,000 | 101,853 | |
| Applied Materials, Inc. 4.35% 4/1/47 | 28,000 | 27,092 | |
| Broadcom Corp./Broadcom Cayman LP 3.5% 1/15/28 | 1,324,000 | 1,225,504 | |
| Broadcom, Inc.: | |||
| 3.419% 4/15/33 (a) | 82,000 | 67,793 | |
| 4.3% 11/15/32 | 250,000 | 227,060 | |
| 4.75% 4/15/29 | 50,000 | 48,447 | |
| 5% 4/15/30 | 50,000 | 49,025 | |
| Intel Corp.: | |||
| 3.25% 11/15/49 | 110,000 | 85,504 | |
| 3.734% 12/8/47 | 617,000 | 523,498 | |
| Lam Research Corp. 2.875% 6/15/50 | 150,000 | 110,015 | |
| Micron Technology, Inc. 4.663% 2/15/30 | 230,000 | 220,560 | |
| NVIDIA Corp.: | |||
| 2% 6/15/31 | 216,000 | 183,391 | |
| 2.85% 4/1/30 | 100,000 | 91,548 | |
| 3.5% 4/1/40 | 50,000 | 43,767 | |
| 3.5% 4/1/50 | 50,000 | 42,439 | |
| NXP BV/NXP Funding LLC/NXP U.S.A., Inc. 2.65% 2/15/32 | 270,000 | 221,790 | |
| Qualcomm, Inc. 1.65% 5/20/32 | 54,000 | 43,612 | |
| Texas Instruments, Inc. 4.15% 5/15/48 | 70,000 | 67,142 | |
| 3,380,040 | |||
| Software - 0.5% | |||
| Microsoft Corp.: | |||
| 2.525% 6/1/50 | 326,000 | 240,108 | |
| 2.921% 3/17/52 | 534,000 | 421,227 | |
| 3.3% 2/6/27 | 115,000 | 114,244 | |
| 3.45% 8/8/36 | 31,000 | 29,222 | |
| Oracle Corp.: | |||
| 1.65% 3/25/26 | 207,000 | 185,422 | |
| 2.5% 4/1/25 | 80,000 | 76,009 | |
| 2.95% 4/1/30 | 150,000 | 128,100 | |
| 3.25% 11/15/27 | 96,000 | 88,538 | |
| 3.6% 4/1/50 | 300,000 | 208,397 | |
| 3.8% 11/15/37 | 110,000 | 85,584 | |
| 3.85% 4/1/60 | 80,000 | 54,881 | |
| 4% 11/15/47 | 187,000 | 138,668 | |
| 5.375% 7/15/40 | 641,000 | 583,802 | |
| Roper Technologies, Inc.: | |||
| 1% 9/15/25 | 50,000 | 45,206 | |
| 1.4% 9/15/27 | 50,000 | 42,829 | |
| 1.75% 2/15/31 | 50,000 | 38,960 | |
| 2% 6/30/30 | 330,000 | 265,739 | |
| 2,746,936 | |||
| Technology Hardware, Storage & Peripherals - 0.3% | |||
| Apple, Inc.: | |||
| 1.125% 5/11/25 | 772,000 | 724,637 | |
| 1.25% 8/20/30 | 50,000 | 41,011 | |
| 2.375% 2/8/41 | 330,000 | 252,420 | |
| 2.55% 8/20/60 | 200,000 | 136,965 | |
| 2.95% 9/11/49 | 240,000 | 188,793 | |
| 3% 11/13/27 | 96,000 | 92,991 | |
| 3.75% 11/13/47 | 57,000 | 51,221 | |
| 3.85% 5/4/43 | 369,000 | 339,379 | |
| 4.5% 2/23/36 | 90,000 | 93,808 | |
| HP, Inc. 2.2% 6/17/25 | 160,000 | 151,203 | |
| 2,072,428 | |||
| TOTAL INFORMATION TECHNOLOGY | 12,865,651 | ||
| MATERIALS - 0.8% | |||
| Chemicals - 0.5% | |||
| Air Products & Chemicals, Inc.: | |||
| 1.5% 10/15/25 | 100,000 | 94,125 | |
| 2.05% 5/15/30 | 60,000 | 51,861 | |
| 2.7% 5/15/40 | 60,000 | 47,984 | |
| 2.8% 5/15/50 | 100,000 | 75,480 | |
| DuPont de Nemours, Inc.: | |||
| 4.205% 11/15/23 | 30,000 | 30,181 | |
| 4.725% 11/15/28 | 35,000 | 35,115 | |
| 5.319% 11/15/38 | 679,000 | 672,123 | |
| Eastman Chemical Co. 4.5% 12/1/28 | 174,000 | 170,766 | |
| Ecolab, Inc. 1.3% 1/30/31 | 300,000 | 239,979 | |
| LYB International Finance II BV 3.5% 3/2/27 | 166,000 | 158,410 | |
| LYB International Finance III LLC: | |||
| 3.375% 10/1/40 | 20,000 | 15,398 | |
| 3.625% 4/1/51 | 120,000 | 88,682 | |
| 4.2% 10/15/49 | 100,000 | 81,260 | |
| Nutrien Ltd.: | |||
| 4.2% 4/1/29 | 13,000 | 12,628 | |
| 5% 4/1/49 | 103,000 | 102,497 | |
| Sherwin-Williams Co.: | |||
| 3.45% 6/1/27 | 290,000 | 276,392 | |
| 3.8% 8/15/49 | 80,000 | 63,975 | |
| 4.5% 6/1/47 | 50,000 | 44,309 | |
| The Dow Chemical Co.: | |||
| 2.1% 11/15/30 | 250,000 | 205,997 | |
| 3.6% 11/15/50 | 150,000 | 114,512 | |
| 4.8% 5/15/49 | 50,000 | 45,443 | |
| 7.375% 11/1/29 | 46,000 | 53,390 | |
| The Mosaic Co. 4.05% 11/15/27 | 90,000 | 88,029 | |
| Westlake Corp. 3.6% 8/15/26 | 625,000 | 608,440 | |
| 3,376,976 | |||
| Containers & Packaging - 0.1% | |||
| International Paper Co. 4.8% 6/15/44 | 155,000 | 145,493 | |
| WRKCo, Inc. 4.65% 3/15/26 | 290,000 | 291,753 | |
| 437,246 | |||
| Metals & Mining - 0.2% | |||
| Barrick Gold Corp. 5.25% 4/1/42 | 163,000 | 160,426 | |
| BHP Billiton Financial (U.S.A.) Ltd. 5% 9/30/43 | 176,000 | 180,918 | |
| Newmont Corp.: | |||
| 2.25% 10/1/30 | 100,000 | 83,005 | |
| 2.8% 10/1/29 | 100,000 | 88,307 | |
| 5.45% 6/9/44 | 80,000 | 80,159 | |
| Southern Copper Corp. 5.875% 4/23/45 | 30,000 | 31,065 | |
| Vale Overseas Ltd. 3.75% 7/8/30 | 300,000 | 261,828 | |
| 885,708 | |||
| Paper & Forest Products - 0.0% | |||
| Suzano Austria GmbH 2.5% 9/15/28 | 298,000 | 241,008 | |
| TOTAL MATERIALS | 4,940,938 | ||
| REAL ESTATE - 0.8% | |||
| Equity Real Estate Investment Trusts (REITs) - 0.8% | |||
| Alexandria Real Estate Equities, Inc.: | |||
| 2% 5/18/32 | 125,000 | 98,723 | |
| 3% 5/18/51 | 125,000 | 84,030 | |
| 4.85% 4/15/49 | 90,000 | 83,416 | |
| American Tower Corp.: | |||
| 2.1% 6/15/30 | 160,000 | 128,136 | |
| 3.1% 6/15/50 | 160,000 | 110,606 | |
| 3.6% 1/15/28 | 32,000 | 29,920 | |
| 3.8% 8/15/29 | 70,000 | 64,252 | |
| AvalonBay Communities, Inc.: | |||
| 2.3% 3/1/30 | 130,000 | 111,812 | |
| 3.2% 1/15/28 | 63,000 | 59,337 | |
| Boston Properties, Inc. 3.65% 2/1/26 | 100,000 | 97,082 | |
| Crown Castle International Corp.: | |||
| 1.35% 7/15/25 | 79,000 | 72,210 | |
| 2.25% 1/15/31 | 100,000 | 81,114 | |
| 3.25% 1/15/51 | 40,000 | 28,693 | |
| 3.7% 6/15/26 | 100,000 | 96,471 | |
| Duke Realty LP 1.75% 2/1/31 | 370,000 | 300,814 | |
| ERP Operating LP: | |||
| 3.5% 3/1/28 | 61,000 | 58,077 | |
| 4.15% 12/1/28 | 330,000 | 323,987 | |
| Healthpeak Properties, Inc. 3% 1/15/30 | 140,000 | 123,592 | |
| Kimco Realty Corp.: | |||
| 1.9% 3/1/28 | 570,000 | 493,205 | |
| 3.3% 2/1/25 | 180,000 | 176,100 | |
| National Retail Properties, Inc. 3% 4/15/52 | 100,000 | 68,155 | |
| Omega Healthcare Investors, Inc. 5.25% 1/15/26 | 230,000 | 227,740 | |
| Prologis LP 3% 4/15/50 | 145,000 | 109,788 | |
| Realty Income Corp.: | |||
| 3.25% 1/15/31 | 220,000 | 199,995 | |
| 3.4% 1/15/28 | 230,000 | 217,272 | |
| Simon Property Group LP: | |||
| 2.65% 7/15/30 | 125,000 | 106,050 | |
| 3.375% 12/1/27 | 935,000 | 877,738 | |
| UDR, Inc. 2.1% 6/15/33 | 80,000 | 60,939 | |
| Ventas Realty LP: | |||
| 4.4% 1/15/29 | 40,000 | 38,513 | |
| 4.875% 4/15/49 | 160,000 | 148,008 | |
| VICI Properties LP: | |||
| 4.75% 2/15/28 | 70,000 | 66,813 | |
| 5.125% 5/15/32 | 70,000 | 65,964 | |
| Welltower, Inc. 4.95% 9/1/48 | 76,000 | 72,184 | |
| 4,880,736 | |||
| Real Estate Management & Development - 0.0% | |||
| Essex Portfolio LP 2.65% 3/15/32 | 170,000 | 141,134 | |
| TOTAL REAL ESTATE | 5,021,870 | ||
| UTILITIES - 1.7% | |||
| Electric Utilities - 1.2% | |||
| Alabama Power Co. 6% 3/1/39 | 180,000 | 198,982 | |
| Appalachian Power Co.: | |||
| 3.3% 6/1/27 | 110,000 | 105,452 | |
| 4.45% 6/1/45 | 18,000 | 15,697 | |
| 4.5% 3/1/49 | 90,000 | 80,544 | |
| Baltimore Gas & Electric Co.: | |||
| 2.9% 6/15/50 | 200,000 | 145,996 | |
| 3.2% 9/15/49 | 150,000 | 116,192 | |
| CenterPoint Energy Houston Electric LLC 3.35% 4/1/51 | 250,000 | 203,075 | |
| Commonwealth Edison Co. 4% 3/1/48 | 42,000 | 37,755 | |
| Duke Energy Carolinas LLC: | |||
| 2.45% 8/15/29 | 190,000 | 169,505 | |
| 3.95% 3/15/48 | 31,000 | 27,283 | |
| 4.25% 12/15/41 | 341,000 | 314,224 | |
| Duke Energy Corp.: | |||
| 2.45% 6/1/30 | 182,000 | 153,405 | |
| 3.75% 9/1/46 | 80,000 | 63,000 | |
| 3.95% 8/15/47 | 250,000 | 202,762 | |
| 4.2% 6/15/49 | 90,000 | 75,092 | |
| Entergy Corp. 0.9% 9/15/25 | 400,000 | 360,063 | |
| Entergy, Inc. 3.55% 9/30/49 | 29,000 | 23,115 | |
| Eversource Energy: | |||
| 2.55% 3/15/31 | 120,000 | 101,664 | |
| 3.3% 1/15/28 | 62,000 | 58,275 | |
| 3.45% 1/15/50 | 60,000 | 45,824 | |
| Exelon Corp.: | |||
| 3.4% 4/15/26 | 150,000 | 145,544 | |
| 4.05% 4/15/30 | 150,000 | 143,938 | |
| 4.45% 4/15/46 | 144,000 | 130,105 | |
| FirstEnergy Corp.: | |||
| 1.6% 1/15/26 | 85,000 | 74,163 | |
| 5.35% 7/15/47 | 140,000 | 118,215 | |
| Florida Power & Light Co.: | |||
| 2.85% 4/1/25 | 317,000 | 311,217 | |
| 4.125% 6/1/48 | 26,000 | 24,347 | |
| Interstate Power and Light Co. 2.3% 6/1/30 | 93,000 | 79,134 | |
| Kentucky Utilities Co. 5.125% 11/1/40 | 100,000 | 99,995 | |
| MidAmerican Energy Co.: | |||
| 3.65% 4/15/29 | 190,000 | 184,584 | |
| 3.65% 8/1/48 | 30,000 | 25,435 | |
| NextEra Energy Capital Holdings, Inc.: | |||
| 1.875% 1/15/27 | 500,000 | 450,958 | |
| 2.44% 1/15/32 | 500,000 | 416,427 | |
| 3.5% 4/1/29 | 140,000 | 130,667 | |
| Northern States Power Co.: | |||
| 2.9% 3/1/50 | 80,000 | 60,133 | |
| 3.6% 9/15/47 | 50,000 | 41,986 | |
| Oncor Electric Delivery Co. LLC: | |||
| 3.1% 9/15/49 | 100,000 | 77,362 | |
| 3.75% 4/1/45 | 120,000 | 103,004 | |
| Pacific Gas & Electric Co. 3.5% 8/1/50 | 682,000 | 455,545 | |
| PacifiCorp 6% 1/15/39 | 235,000 | 257,817 | |
| PECO Energy Co. 3.9% 3/1/48 | 96,000 | 85,899 | |
| PPL Capital Funding, Inc. 4% 9/15/47 | 20,000 | 17,117 | |
| PPL Electric Utilities Corp. 3% 10/1/49 | 100,000 | 75,453 | |
| Public Service Co. of Colorado: | |||
| 3.7% 6/15/28 | 87,000 | 85,613 | |
| 6.25% 9/1/37 | 182,000 | 211,515 | |
| Public Service Electric & Gas Co.: | |||
| 2.45% 1/15/30 | 70,000 | 62,348 | |
| 3.15% 1/1/50 | 70,000 | 54,350 | |
| 3.6% 12/1/47 | 44,000 | 37,216 | |
| Puget Sound Energy, Inc. 4.223% 6/15/48 | 45,000 | 39,855 | |
| Southern California Edison Co. 4% 4/1/47 | 562,000 | 455,865 | |
| Southern Co. 3.25% 7/1/26 | 112,000 | 107,175 | |
| Southwestern Electric Power Co. 3.85% 2/1/48 | 190,000 | 153,989 | |
| Tampa Electric Co. 4.45% 6/15/49 | 100,000 | 92,436 | |
| Virginia Electric & Power Co.: | |||
| 3.3% 12/1/49 | 60,000 | 47,740 | |
| 3.8% 9/15/47 | 50,000 | 42,870 | |
| 4.6% 12/1/48 | 52,000 | 50,010 | |
| Xcel Energy, Inc.: | |||
| 3.4% 6/1/30 | 63,000 | 57,888 | |
| 4% 6/15/28 | 76,000 | 74,283 | |
| 7,580,103 | |||
| Gas Utilities - 0.1% | |||
| Dominion Gas Holdings LLC 2.5% 11/15/24 | 50,000 | 48,298 | |
| Southern Co. Gas Capital Corp. 3.95% 10/1/46 | 308,000 | 251,909 | |
| 300,207 | |||
| Independent Power and Renewable Electricity Producers - 0.0% | |||
| Southern Power Co. 4.95% 12/15/46 | 80,000 | 73,541 | |
| Multi-Utilities - 0.4% | |||
| Berkshire Hathaway Energy Co.: | |||
| 4.25% 10/15/50 | 290,000 | 264,655 | |
| 4.45% 1/15/49 | 54,000 | 50,303 | |
| CenterPoint Energy, Inc. 3.7% 9/1/49 | 80,000 | 63,794 | |
| Consolidated Edison Co. of New York, Inc.: | |||
| 3.95% 4/1/50 | 130,000 | 112,837 | |
| 4.65% 12/1/48 | 50,000 | 47,170 | |
| 5.5% 12/1/39 | 256,000 | 265,189 | |
| Dominion Energy, Inc.: | |||
| 3.375% 4/1/30 | 720,000 | 658,180 | |
| 4.6% 3/15/49 | 50,000 | 46,451 | |
| 4.7% 12/1/44 | 26,000 | 24,031 | |
| 7% 6/15/38 | 130,000 | 150,400 | |
| NiSource, Inc.: | |||
| 0.95% 8/15/25 | 280,000 | 251,501 | |
| 2.95% 9/1/29 | 190,000 | 168,294 | |
| 3.49% 5/15/27 | 50,000 | 47,862 | |
| 3.95% 3/30/48 | 46,000 | 38,158 | |
| 5.25% 2/15/43 | 156,000 | 150,590 | |
| Puget Energy, Inc. 4.1% 6/15/30 | 200,000 | 185,896 | |
| Sempra Energy 6% 10/15/39 | 274,000 | 289,773 | |
| 2,815,084 | |||
| Water Utilities - 0.0% | |||
| American Water Capital Corp. 3.75% 9/1/47 | 240,000 | 199,703 | |
| TOTAL UTILITIES | 10,968,638 | ||
| TOTAL NONCONVERTIBLE BONDS | |||
| (Cost $186,564,477) | 159,402,865 | ||
| U.S. Government and Government Agency Obligations - 40.0% | |||
| U.S. Government Agency Obligations - 0.9% | |||
| Fannie Mae: | |||
| 0.375% 8/25/25 | $95,000 | $87,250 | |
| 0.5% 6/17/25 | 2,248,000 | 2,085,268 | |
| 0.625% 4/22/25 | 258,000 | 241,257 | |
| 0.875% 8/5/30 | 339,000 | 280,472 | |
| 1.75% 7/2/24 | 100,000 | 97,741 | |
| 1.875% 9/24/26 | 60,000 | 57,090 | |
| Federal Home Loan Bank: | |||
| 0.375% 9/4/25 | 160,000 | 146,934 | |
| 1.5% 8/15/24 | 100,000 | 96,848 | |
| Freddie Mac: | |||
| 0.25% 8/24/23 | 500,000 | 484,854 | |
| 0.375% 7/21/25 | 448,000 | 413,258 | |
| 0.375% 9/23/25 | 231,000 | 211,895 | |
| 6.25% 7/15/32 | 360,000 | 447,035 | |
| Tennessee Valley Authority: | |||
| 0.75% 5/15/25 | 600,000 | 561,196 | |
| 2.875% 2/1/27 | 130,000 | 128,246 | |
| 4.25% 9/15/65 | 30,000 | 30,701 | |
| 5.88% 4/1/36 | 260,000 | 313,572 | |
| TOTAL U.S. GOVERNMENT AGENCY OBLIGATIONS | 5,683,617 | ||
| U.S. Treasury Obligations - 39.1% | |||
| U.S. Treasury Bonds: | |||
| 1.125% 5/15/40 | 3,721,000 | 2,590,165 | |
| 1.125% 8/15/40 | 331,000 | 228,674 | |
| 1.25% 5/15/50 | 2,000 | 1,273 | |
| 1.375% 11/15/40 | 4,560,000 | 3,284,091 | |
| 1.375% 8/15/50 | 7,415,000 | 4,880,866 | |
| 1.625% 11/15/50 | 4,208,000 | 2,959,572 | |
| 1.75% 8/15/41 | 3,170,000 | 2,411,305 | |
| 1.875% 2/15/41 | 5,825,000 | 4,568,302 | |
| 1.875% 2/15/51 | 2,014,000 | 1,510,736 | |
| 1.875% 11/15/51 | 3,005,000 | 2,254,689 | |
| 2% 11/15/41 | 1,258,000 | 999,127 | |
| 2% 2/15/50 | 287,000 | 222,403 | |
| 2% 8/15/51 | 1,564,000 | 1,208,740 | |
| 2.25% 5/15/41 | 280,000 | 233,647 | |
| 2.25% 8/15/46 | 110,000 | 88,696 | |
| 2.25% 8/15/49 | 129,000 | 105,846 | |
| 2.25% 2/15/52 | 1,421,000 | 1,169,439 | |
| 2.375% 2/15/42 | 780,000 | 661,416 | |
| 2.375% 5/15/51 | 2,575,000 | 2,173,763 | |
| 2.5% 2/15/45 | 128,000 | 108,560 | |
| 2.5% 2/15/46 | 112,000 | 94,968 | |
| 2.5% 5/15/46 | 93,000 | 78,825 | |
| 2.75% 8/15/42 | 197,000 | 176,754 | |
| 2.75% 11/15/42 | 587,000 | 525,617 | |
| 2.75% 8/15/47 | 51,000 | 45,605 | |
| 2.75% 11/15/47 | 107,000 | 95,857 | |
| 2.875% 5/15/43 | 190,000 | 173,256 | |
| 2.875% 8/15/45 | 156,000 | 141,716 | |
| 2.875% 5/15/49 | 1,000 | 932 | |
| 2.875% 5/15/52 | 780,000 | 736,734 | |
| 3% 5/15/42 | 89,000 | 83,431 | |
| 3% 11/15/44 | 869,000 | 805,285 | |
| 3% 5/15/45 | 4,000 | 3,710 | |
| 3% 11/15/45 | 224,000 | 208,145 | |
| 3% 2/15/47 | 49,000 | 45,756 | |
| 3% 5/15/47 | 208,000 | 194,415 | |
| 3% 2/15/48 | 87,000 | 81,970 | |
| 3% 8/15/48 | 3,000 | 2,835 | |
| 3% 2/15/49 | 134,000 | 127,693 | |
| 3.125% 11/15/41 | 113,000 | 108,493 | |
| 3.125% 2/15/42 | 65,000 | 62,255 | |
| 3.125% 2/15/43 | 838,000 | 796,198 | |
| 3.125% 8/15/44 | 687,000 | 650,718 | |
| 3.125% 5/15/48 | 169,000 | 163,554 | |
| 3.375% 5/15/44 | 1,976,000 | 1,950,297 | |
| 3.375% 11/15/48 | 157,000 | 159,521 | |
| 3.5% 2/15/39 | 8,000 | 8,357 | |
| 3.625% 8/15/43 | 971,000 | 996,565 | |
| 3.625% 2/15/44 | 2,647,000 | 2,715,863 | |
| 3.75% 8/15/41 | 45,000 | 47,282 | |
| 3.75% 11/15/43 | 1,470,000 | 1,537,700 | |
| 3.875% 8/15/40 | 52,000 | 56,065 | |
| 4.375% 2/15/38 | 12,000 | 13,972 | |
| 4.375% 11/15/39 | 24,000 | 27,726 | |
| 4.375% 5/15/41 | 32,000 | 36,651 | |
| 4.5% 5/15/38 | 92,000 | 108,481 | |
| 4.5% 8/15/39 | 17,000 | 19,987 | |
| 4.75% 2/15/41 | 48,000 | 57,806 | |
| 5.5% 8/15/28 | 4,000 | 4,535 | |
| 7.125% 2/15/23 | 175,000 | 179,785 | |
| U.S. Treasury Notes: | |||
| 0.125% 9/30/22 | 42,000 | 41,825 | |
| 0.125% 10/31/22 | 55,000 | 54,638 | |
| 0.125% 1/31/23 | 93,000 | 91,689 | |
| 0.125% 2/28/23 | 88,000 | 86,505 | |
| 0.125% 3/31/23 | 16,000 | 15,689 | |
| 0.125% 4/30/23 | 751,000 | 734,103 | |
| 0.125% 5/15/23 | 806,000 | 786,920 | |
| 0.125% 7/15/23 | 534,000 | 518,627 | |
| 0.125% 9/15/23 | 1,233,000 | 1,191,627 | |
| 0.125% 10/15/23 | 28,000 | 26,994 | |
| 0.125% 12/15/23 | 357,000 | 342,553 | |
| 0.125% 1/15/24 | 908,000 | 869,162 | |
| 0.125% 2/15/24 | 2,144,000 | 2,048,441 | |
| 0.25% 6/15/23 | 3,000 | 2,924 | |
| 0.25% 5/15/24 | 524,000 | 498,025 | |
| 0.25% 5/31/25 | 3,034,000 | 2,799,695 | |
| 0.25% 6/30/25 | 635,000 | 584,646 | |
| 0.25% 7/31/25 | 45,000 | 41,317 | |
| 0.25% 8/31/25 | 154,000 | 141,006 | |
| 0.25% 9/30/25 | 14,303,000 | 13,067,690 | |
| 0.25% 10/31/25 | 2,234,000 | 2,035,733 | |
| 0.375% 10/31/23 | 599,000 | 578,877 | |
| 0.375% 4/15/24 | 2,669,000 | 2,547,852 | |
| 0.375% 7/15/24 | 120,000 | 113,822 | |
| 0.375% 8/15/24 | 1,798,000 | 1,700,866 | |
| 0.375% 4/30/25 | 1,297,000 | 1,203,727 | |
| 0.375% 1/31/26 | 1,602,000 | 1,456,694 | |
| 0.375% 7/31/27 | 1,259,000 | 1,100,592 | |
| 0.375% 9/30/27 | 1,151,000 | 1,001,190 | |
| 0.5% 11/30/23 | 4,620,000 | 4,462,992 | |
| 0.5% 2/28/26 | 9,118,000 | 8,310,558 | |
| 0.5% 4/30/27 | 718,000 | 635,486 | |
| 0.5% 5/31/27 | 3,333,000 | 2,943,456 | |
| 0.5% 6/30/27 | 2,827,000 | 2,491,846 | |
| 0.5% 10/31/27 | 3,232,000 | 2,823,708 | |
| 0.625% 7/31/26 | 5,694,000 | 5,163,746 | |
| 0.625% 3/31/27 | 2,260,000 | 2,017,491 | |
| 0.625% 11/30/27 | 1,680,000 | 1,475,250 | |
| 0.625% 12/31/27 | 4,690,000 | 4,109,796 | |
| 0.625% 5/15/30 | 3,069,000 | 2,559,019 | |
| 0.625% 8/15/30 | 360,000 | 298,463 | |
| 0.75% 12/31/23 | 2,213,000 | 2,140,905 | |
| 0.75% 11/15/24 | 3,110,000 | 2,948,912 | |
| 0.75% 3/31/26 | 2,331,000 | 2,140,969 | |
| 0.75% 4/30/26 | 1,731,000 | 1,586,840 | |
| 0.75% 5/31/26 | 1,269,000 | 1,161,085 | |
| 0.75% 1/31/28 | 598,000 | 526,660 | |
| 0.875% 1/31/24 | 2,980,000 | 2,883,616 | |
| 0.875% 11/15/30 | 5,093,000 | 4,300,203 | |
| 1% 12/15/24 | 1,610,000 | 1,533,211 | |
| 1% 7/31/28 | 1,229,000 | 1,086,945 | |
| 1.125% 1/15/25 | 1,860,000 | 1,773,830 | |
| 1.125% 10/31/26 | 2,630,000 | 2,424,223 | |
| 1.125% 2/28/27 | 691,000 | 633,048 | |
| 1.125% 2/29/28 | 3,054,000 | 2,745,975 | |
| 1.125% 8/31/28 | 110,000 | 97,896 | |
| 1.125% 2/15/31 | 4,289,000 | 3,685,524 | |
| 1.25% 8/31/24 | 1,923,000 | 1,852,615 | |
| 1.25% 12/31/26 | 2,240,000 | 2,070,425 | |
| 1.25% 3/31/28 | 2,218,000 | 2,003,824 | |
| 1.25% 4/30/28 | 2,488,000 | 2,244,157 | |
| 1.25% 6/30/28 | 2,989,000 | 2,688,816 | |
| 1.25% 9/30/28 | 748,000 | 669,957 | |
| 1.25% 8/15/31 | 8,334,000 | 7,174,402 | |
| 1.375% 1/31/25 | 1,386,000 | 1,329,315 | |
| 1.375% 8/31/26 | 253,000 | 236,446 | |
| 1.375% 10/31/28 | 580,000 | 522,929 | |
| 1.375% 11/15/31 | 10,000 | 8,673 | |
| 1.5% 9/15/22 | 174,000 | 173,940 | |
| 1.5% 1/15/23 | 2,000 | 1,988 | |
| 1.5% 9/30/24 | 1,783,000 | 1,724,774 | |
| 1.5% 10/31/24 | 2,714,000 | 2,622,084 | |
| 1.5% 11/30/24 | 2,519,000 | 2,429,949 | |
| 1.5% 2/15/25 | 1,480,000 | 1,422,419 | |
| 1.5% 8/15/26 | 557,000 | 523,101 | |
| 1.5% 1/31/27 | 5,287,000 | 4,936,323 | |
| 1.5% 11/30/28 | 1,801,000 | 1,635,392 | |
| 1.5% 2/15/30 | 876,000 | 786,826 | |
| 1.625% 2/15/26 | 261,000 | 248,062 | |
| 1.625% 5/15/26 | 264,000 | 250,192 | |
| 1.625% 9/30/26 | 653,000 | 615,988 | |
| 1.625% 10/31/26 | 457,000 | 430,419 | |
| 1.625% 11/30/26 | 180,000 | 169,369 | |
| 1.625% 8/15/29 | 66,000 | 60,091 | |
| 1.625% 5/15/31 | 4,543,000 | 4,059,241 | |
| 1.75% 7/15/22 | 58,000 | 58,012 | |
| 1.75% 6/30/24 | 805,000 | 785,693 | |
| 1.75% 7/31/24 | 2,907,000 | 2,834,098 | |
| 1.75% 12/31/24 | 2,363,000 | 2,290,079 | |
| 1.75% 12/31/26 | 527,000 | 498,262 | |
| 1.75% 1/31/29 | 581,000 | 535,677 | |
| 1.875% 9/30/22 | 358,000 | 358,054 | |
| 1.875% 6/30/26 | 589,000 | 563,300 | |
| 1.875% 7/31/26 | 909,000 | 868,308 | |
| 1.875% 2/28/29 | 230,000 | 213,765 | |
| 1.875% 2/15/32 | 1,466,000 | 1,326,386 | |
| 2% 10/31/22 | 48,000 | 47,979 | |
| 2% 5/31/24 | 442,000 | 434,006 | |
| 2% 2/15/25 | 82,000 | 79,896 | |
| 2% 8/15/25 | 50,000 | 48,439 | |
| 2% 11/15/26 | 585,000 | 559,315 | |
| 2.125% 12/31/22 | 19,000 | 18,960 | |
| 2.125% 3/31/24 | 1,201,000 | 1,183,313 | |
| 2.125% 5/15/25 | 13,000 | 12,682 | |
| 2.25% 3/31/24 | 9,680,000 | 9,558,244 | |
| 2.25% 4/30/24 | 283,000 | 279,308 | |
| 2.25% 10/31/24 | 279,000 | 274,314 | |
| 2.25% 12/31/24 | 160,000 | 157,013 | |
| 2.25% 2/15/27 | 393,000 | 378,923 | |
| 2.25% 8/15/27 | 639,000 | 613,764 | |
| 2.25% 11/15/27 | 682,000 | 653,841 | |
| 2.375% 2/29/24 | 394,000 | 390,275 | |
| 2.375% 4/30/26 | 405,000 | 395,286 | |
| 2.375% 5/15/27 | 46,000 | 44,530 | |
| 2.375% 5/15/29 | 108,000 | 103,465 | |
| 2.5% 8/15/23 | 57,000 | 56,693 | |
| 2.5% 1/31/24 | 3,559,000 | 3,532,308 | |
| 2.5% 5/15/24 | 217,000 | 215,050 | |
| 2.5% 5/31/24 | 4,850,000 | 4,806,236 | |
| 2.5% 1/31/25 | 238,000 | 234,876 | |
| 2.5% 2/28/26 | 191,000 | 187,329 | |
| 2.5% 3/31/27 | 2,220,000 | 2,165,974 | |
| 2.625% 2/28/23 | 262,000 | 261,857 | |
| 2.625% 6/30/23 | 1,031,000 | 1,028,261 | |
| 2.625% 12/31/25 | 331,000 | 326,319 | |
| 2.625% 1/31/26 | 461,000 | 454,319 | |
| 2.625% 5/31/27 | 2,770,000 | 2,717,630 | |
| 2.625% 2/15/29 | 391,000 | 380,690 | |
| 2.75% 4/30/23 | 84,000 | 83,911 | |
| 2.75% 5/31/23 | 176,000 | 175,766 | |
| 2.75% 7/31/23 | 700,000 | 698,332 | |
| 2.75% 8/31/23 | 1,634,000 | 1,629,851 | |
| 2.75% 2/15/24 | 1,118,000 | 1,114,070 | |
| 2.75% 6/30/25 | 113,000 | 112,122 | |
| 2.75% 4/30/27 | 2,550,000 | 2,515,535 | |
| 2.75% 2/15/28 | 363,000 | 356,662 | |
| 2.75% 5/31/29 | 530,000 | 519,566 | |
| 2.875% 10/31/23 | 810,000 | 809,114 | |
| 2.875% 11/30/23 | 1,045,000 | 1,043,653 | |
| 2.875% 5/31/25 | 144,000 | 143,381 | |
| 2.875% 5/15/28 | 216,000 | 213,477 | |
| 2.875% 8/15/28 | 113,000 | 111,623 | |
| 2.875% 5/15/32 | 1,910,000 | 1,888,513 | |
| 3% 6/30/24 | 1,000,000 | 1,000,508 | |
| 3% 9/30/25 | 148,000 | 147,786 | |
| 3% 10/31/25 | 130,000 | 129,787 | |
| 3.125% 11/15/28 | 940,000 | 941,946 | |
| TOTAL U.S. TREASURY OBLIGATIONS | 248,091,756 | ||
| TOTAL U.S. GOVERNMENT AND GOVERNMENT AGENCY OBLIGATIONS | |||
| (Cost $277,801,782) | 253,775,373 | ||
| U.S. Government Agency - Mortgage Securities - 27.8% | |||
| Fannie Mae - 13.1% | |||
| 1.5% 10/1/36 to 12/1/51 | 8,289,409 | 7,301,478 | |
| 2% 7/1/35 to 12/1/51 | 29,148,786 | 25,768,323 | |
| 2.5% 1/1/27 to 5/1/52 | 15,809,859 | 14,422,870 | |
| 3% 4/1/32 to 5/1/52 | 18,818,135 | 17,826,513 | |
| 3.5% 2/1/27 to 8/1/50 | 8,572,243 | 8,419,779 | |
| 4% 6/1/34 to 7/1/50 | 4,945,300 | 4,928,194 | |
| 4.5% 10/1/39 to 12/1/50 | 2,917,066 | 2,954,615 | |
| 5% 7/1/48 to 10/1/50 | 1,010,254 | 1,041,093 | |
| 5.5% 5/1/44 to 4/1/49 | 219,833 | 230,697 | |
| TOTAL FANNIE MAE | 82,893,562 | ||
| Freddie Mac - 8.9% | |||
| 1.5% 10/1/36 to 11/1/51 | 3,654,177 | 3,084,014 | |
| 2% 10/1/30 to 2/1/52 | 23,285,306 | 20,511,299 | |
| 2% 9/1/35 | 256,194 | 240,808 | |
| 2% 11/1/35 | 384,163 | 360,851 | |
| 2% 11/1/35 | 121,782 | 114,392 | |
| 2.5% 4/1/27 to 6/1/52 | 21,607,646 | 19,622,686 | |
| 3% 1/1/29 to 4/1/52 | 1,511,724 | 1,439,518 | |
| 3% 8/1/47 | 30,220 | 28,551 | |
| 3.5% 7/1/33 to 3/1/50 | 4,876,206 | 4,776,302 | |
| 4% 3/1/26 to 10/1/50 | 3,765,118 | 3,753,832 | |
| 4.5% 7/1/41 to 4/1/50 | 1,027,546 | 1,045,185 | |
| 5% 6/1/30 to 5/1/50 | 1,362,601 | 1,402,550 | |
| 5.5% 6/1/49 | 175,124 | 181,853 | |
| TOTAL FREDDIE MAC | 56,561,841 | ||
| Ginnie Mae - 5.8% | |||
| 1.5% 5/20/51 | 118,329 | 100,676 | |
| 2% 3/20/51 to 5/20/52 | 10,558,985 | 9,429,532 | |
| 2.5% 10/20/46 to 5/20/52 | 10,904,636 | 10,039,250 | |
| 3% 7/20/42 to 5/20/52 | 7,648,007 | 7,272,770 | |
| 3.5% 2/20/46 to 5/20/51 | 5,824,509 | 5,699,265 | |
| 4% 4/20/47 to 1/20/51 | 2,668,765 | 2,668,241 | |
| 4.5% 1/20/47 to 3/20/51 | 1,280,526 | 1,306,410 | |
| 5% 11/20/47 to 4/20/50 | 496,323 | 512,069 | |
| 5.5% 9/20/47 to 1/20/49 | 40,517 | 42,994 | |
| TOTAL GINNIE MAE | 37,071,207 | ||
| TOTAL U.S. GOVERNMENT AGENCY - MORTGAGE SECURITIES | |||
| (Cost $196,460,979) | 176,526,610 | ||
| Asset-Backed Securities - 0.3% | |||
| Capital One Multi-Asset Execution Trust Series 2019-A3 Class A3, 2.06% 8/15/28 | $116,000 | $109,894 | |
| CarMax Auto Owner Trust Series 2021-1 Class A3, 0.34% 12/15/25 | 400,000 | 389,903 | |
| Citibank Credit Card Issuance Trust: | |||
| Series 2018-A6 Class A6, 3.21% 12/7/24 | 100,000 | 100,212 | |
| Series 2018-A7 Class A7, 3.96% 10/13/30 | 250,000 | 252,890 | |
| Ford Credit Auto Lease Trust Series 2021-A Class A3, 0.26% 2/15/24 | 372,758 | 370,159 | |
| Ford Credit Floorplan Master Owner Trust Series 2018-4 Class A, 4.06% 11/15/30 | 30,000 | 29,790 | |
| GM Financial Consumer Automobile Receivables Trust Series 2021-1 Class A3, 0.35% 10/16/25 | 396,000 | 386,235 | |
| Mercedes-Benz Auto Lease Trust Series 2021-A Class A3, 0.25% 1/16/24 | 362,343 | 358,790 | |
| TOTAL ASSET-BACKED SECURITIES | |||
| (Cost $2,077,059) | 1,997,873 | ||
| Commercial Mortgage Securities - 1.6% | |||
| BANK sequential payer: | |||
| Series 2017-BNK4 Class ASB, 3.419% 5/15/50 | 186,652 | 184,359 | |
| Series 2020-BN25 Class A5, 2.649% 1/15/63 | 220,000 | 196,807 | |
| Series 2020-BN28 Class A4, 1.844% 3/15/63 | 360,000 | 299,796 | |
| Benchmark Mortgage Trust: | |||
| sequential payer: | |||
| Series 2020-B19 Class A5, 1.85% 9/15/53 | 410,000 | 343,910 | |
| Series 2021-B24 Class A5, 2.5843% 3/15/54 | 500,000 | 438,572 | |
| Series 2019-B12 Class A5, 3.1156% 8/15/52 | 95,000 | 88,161 | |
| Series 2019-B9 Class A5, 4.0156% 3/15/52 | 130,000 | 127,820 | |
| Citigroup Commercial Mortgage Trust sequential payer: | |||
| Series 2015-GC29 Class A4, 3.192% 4/10/48 | 80,000 | 77,623 | |
| Series 2016-C1 Class A4, 3.209% 5/10/49 | 90,000 | 86,641 | |
| Series 2018-B2 Class A4, 4.009% 3/10/51 | 1,000,000 | 985,866 | |
| CSAIL Commercial Mortgage Trust sequential payer Series 2019-C17: | |||
| Class A4, 2.7628% 9/15/52 | 200,000 | 179,245 | |
| Class A5, 3.0161% 9/15/52 | 200,000 | 182,585 | |
| Freddie Mac: | |||
| sequential payer: | |||
| Series 2016-K057 Class A2, 2.57% 7/25/26 | 159,400 | 154,510 | |
| Series 2020-K104 Class A2, 2.253% 1/25/30 | 680,000 | 624,201 | |
| Series 2020-K116 Class A2, 1.378% 7/25/30 | 770,000 | 653,755 | |
| Series 2020-K117 Class A2, 1.406% 8/25/30 | 590,000 | 500,935 | |
| Series 2020-K118 Class A2, 1.493% 9/25/30 | 590,000 | 504,271 | |
| Series 2020-K121 Class A2, 1.547% 10/25/30 | 890,000 | 761,182 | |
| Series 2021-K125 Class A2, 1.846% 1/25/31 | 100,000 | 87,349 | |
| Series 2021-K126 Class A2, 2.074% 1/25/31 | 200,000 | 178,075 | |
| Series 2021-K128 Class A2, 2.02% 3/25/31 | 200,000 | 177,138 | |
| Series K080 Class A2, 3.926% 7/25/28 | 80,000 | 81,722 | |
| Series 2017-K068 Class A2, 3.244% 8/25/27 | 130,000 | 128,648 | |
| Series 2019-K094 Class A2, 2.903% 6/25/29 | 300,000 | 288,919 | |
| Series 2019-K1510 Class A2, 3.718% 1/25/31 | 124,000 | 125,985 | |
| Series 2021-K123 Class A2, 1.621% 12/25/30 | 700,000 | 602,071 | |
| Series K079 Class A2, 3.926% 6/25/28 | 20,000 | 20,479 | |
| GS Mortgage Securities Trust sequential payer: | |||
| Series 2014-GC26 Class A4, 3.364% 11/10/47 | 74,971 | 73,100 | |
| Series 2020-GC45 Class A5, 2.9106% 2/13/53 | 260,000 | 235,344 | |
| JPMBB Commercial Mortgage Securities Trust sequential payer: | |||
| Series 2014-C21 Class A5, 3.7748% 8/15/47 | 150,000 | 148,900 | |
| Series 2014-C24 Class A5, 3.6385% 11/15/47 | 150,000 | 147,987 | |
| JPMDB Commercial Mortgage Securities Trust sequential payer Series 2020-COR7 Class A5, 2.1798% 5/13/53 | 500,000 | 426,325 | |
| Morgan Stanley Capital I Trust sequential payer Series 2020-L4 Class A3, 2.698% 2/15/53 | 100,000 | 89,246 | |
| UBS Commercial Mortgage Trust sequential payer Series 2019-C16 Class A4, 3.6048% 4/15/52 | 350,000 | 332,002 | |
| Wells Fargo Commercial Mortgage Trust: | |||
| sequential payer: | |||
| Series 2019-C52 Class A5, 2.892% 8/15/52 | 200,000 | 182,015 | |
| Series 2019-C54 Class A4, 3.146% 12/15/52 | 538,000 | 495,672 | |
| Series 2020-C55 Class A5, 2.725% 2/15/53 | 90,000 | 80,290 | |
| Series 2018-C48 Class A5, 4.302% 1/15/52 | 123,000 | 122,784 | |
| TOTAL COMMERCIAL MORTGAGE SECURITIES | |||
| (Cost $11,972,524) | 10,414,290 | ||
| Municipal Securities - 0.6% | |||
| American Muni. Pwr., Inc. Rev. (Combined Hydroelectric Proj.) Series 2010 B, 7.834% 2/15/41 | 55,000 | 74,021 | |
| Bay Area Toll Auth. San Francisco Bay Toll Bridge Rev.: | |||
| Series 2009 F2, 6.263% 4/1/49 | $75,000 | $95,708 | |
| Series 2010 S1, 7.043% 4/1/50 | 75,000 | 103,093 | |
| California Gen. Oblig.: | |||
| Series 2009, 7.55% 4/1/39 | 145,000 | 196,691 | |
| Series 2010, 7.6% 11/1/40 | 350,000 | 483,316 | |
| California State Univ. Rev. Series 2021 B, 2.719% 11/1/52 | 195,000 | 145,037 | |
| Chicago O'Hare Int'l. Arpt. Rev. Series 2010 B, 6.395% 1/1/40 | 250,000 | 308,306 | |
| Dallas Area Rapid Transit Sales Tax Rev. Series 2021 A, 2.613% 12/1/48 | 200,000 | 147,215 | |
| Dallas Fort Worth Int'l. Arpt. Rev.: | |||
| Series 2019 A, 3.144% 11/1/45 | 20,000 | 16,198 | |
| Series 2021 C, 2.843% 11/1/46 | 150,000 | 116,621 | |
| Series 2022 A, 4.507% 11/1/51 | 65,000 | 63,178 | |
| Golden State Tobacco Securitization Corp. Tobacco Settlement Rev. Series 2021 B: | |||
| 2.746% 6/1/34 | 80,000 | 68,963 | |
| 3.293% 6/1/42 | 40,000 | 32,264 | |
| Idaho Energy Resources Auth. Series 2021, 2.861% 9/1/46 | 45,000 | 34,738 | |
| Illinois Gen. Oblig. Series 2003, 5.1% 6/1/33 | 500,000 | 503,045 | |
| Massachusetts School Bldg. Auth. Dedicated Sales Tax Rev. Series 2019 B, 3.395% 10/15/40 | 100,000 | 84,459 | |
| Massachusetts Wtr. Resources Auth. Wtr. & Swr. Rev. Series 2021 C, 2.823% 8/1/41 | 100,000 | 82,439 | |
| Michigan Strategic Fund Ltd. Oblig. Rev. Series 2021 A, 3.225% 9/1/47 | 100,000 | 77,312 | |
| New Jersey Trans. Trust Fund Auth. Series B: | |||
| 4.081% 6/15/39 | 80,000 | 71,972 | |
| 4.131% 6/15/42 | 80,000 | 69,476 | |
| New York Metropolitan Trans. Auth. Rev. Series 2010 A, 6.668% 11/15/39 | 60,000 | 71,691 | |
| New York State Dorm. Auth. Series 2021 C, 2.202% 3/15/34 | 200,000 | 163,281 | |
| Port Auth. of New York & New Jersey Series 225, 3.175% 7/15/60 | 400,000 | 299,196 | |
| Univ. of California Regents Med. Ctr. Pool Rev. Series N: | |||
| 3.006% 5/15/50 | 175,000 | 132,026 | |
| 3.256% 5/15/60 | 150,000 | 111,496 | |
| Univ. of Virginia Gen. Rev. Series 2021 B, 2.584% 11/1/51 | 140,000 | 102,985 | |
| TOTAL MUNICIPAL SECURITIES | |||
| (Cost $4,503,462) | 3,654,727 | ||
| Foreign Government and Government Agency Obligations - 2.1% | |||
| Alberta Province: | |||
| 2.95% 1/23/24 | $110,000 | $109,617 | |
| 3.3% 3/15/28 | 75,000 | 74,368 | |
| Chilean Republic: | |||
| 3.24% 2/6/28 | 200,000 | 188,350 | |
| 3.86% 6/21/47 | 325,000 | 271,538 | |
| Export Development Canada: | |||
| 2.625% 2/21/24 | 120,000 | 119,454 | |
| 2.75% 3/15/23 | 145,000 | 144,916 | |
| Hungarian Republic: | |||
| 5.375% 3/25/24 | 964,000 | 983,160 | |
| 5.75% 11/22/23 | 50,000 | 51,025 | |
| Indonesian Republic: | |||
| 2.85% 2/14/30 | 200,000 | 178,038 | |
| 3.5% 2/14/50 | 200,000 | 157,475 | |
| 3.85% 10/15/30 | 348,000 | 330,448 | |
| Israeli State 3.375% 1/15/50 | 225,000 | 181,473 | |
| Italian Republic: | |||
| 2.375% 10/17/24 | 200,000 | 193,320 | |
| 4% 10/17/49 | 497,000 | 410,652 | |
| Manitoba Province 2.6% 4/16/24 | 410,000 | 405,617 | |
| Ontario Province: | |||
| 1.05% 5/21/27 | 1,413,000 | 1,266,726 | |
| 1.125% 10/7/30 | 175,000 | 145,560 | |
| 2.3% 6/15/26 | 50,000 | 48,002 | |
| 2.5% 4/27/26 | 115,000 | 111,788 | |
| 3.05% 1/29/24 | 90,000 | 89,735 | |
| Panamanian Republic: | |||
| 3.16% 1/23/30 | 800,000 | 712,650 | |
| 4.5% 4/16/50 | 200,000 | 163,413 | |
| 6.7% 1/26/36 | 100,000 | 108,300 | |
| Peruvian Republic: | |||
| 1.862% 12/1/32 | 340,000 | 258,570 | |
| 2.78% 12/1/60 | 100,000 | 61,800 | |
| 2.844% 6/20/30 | 190,000 | 165,633 | |
| 3.55% 3/10/51 | 170,000 | 126,735 | |
| 4.125% 8/25/27 | 50,000 | 49,025 | |
| Philippine Republic: | |||
| 2.65% 12/10/45 | 500,000 | 342,555 | |
| 3% 2/1/28 | 200,000 | 189,022 | |
| Polish Government 3.25% 4/6/26 | 73,000 | 70,778 | |
| Quebec Province: | |||
| 1.5% 2/11/25 | 2,149,000 | 2,059,301 | |
| 2.5% 4/9/24 | 140,000 | 138,431 | |
| 2.75% 4/12/27 | 95,000 | 92,633 | |
| United Mexican States: | |||
| 3.25% 4/16/30 | 1,971,000 | 1,733,618 | |
| 3.5% 2/12/34 | 619,000 | 511,913 | |
| 4.75% 4/27/32 | 387,000 | 371,907 | |
| 6.05% 1/11/40 | 170,000 | 166,951 | |
| Uruguay Republic 7.625% 3/21/36 | 678,000 | 847,415 | |
| TOTAL FOREIGN GOVERNMENT AND GOVERNMENT AGENCY OBLIGATIONS | |||
| (Cost $15,909,829) | 13,631,912 | ||
| Supranational Obligations - 1.7% | |||
| African Development Bank 0.875% 7/22/26 | 160,000 | 145,888 | |
| Asian Development Bank: | |||
| 0.375% 9/3/25 | 450,000 | 412,195 | |
| 0.75% 10/8/30 | 100,000 | 82,477 | |
| 1.5% 10/18/24 | 200,000 | 193,024 | |
| 1.875% 1/24/30 | 610,000 | 559,021 | |
| 2.625% 1/30/24 | 80,000 | 79,488 | |
| 2.75% 3/17/23 | 700,000 | 699,938 | |
| 5.82% 6/16/28 | 110,000 | 125,061 | |
| European Investment Bank: | |||
| 0.75% 9/23/30 | 250,000 | 207,358 | |
| 0.875% 5/17/30 | 18,000 | 15,187 | |
| 1.375% 5/15/23 | 350,000 | 345,377 | |
| 2% 12/15/22 | 510,000 | 508,585 | |
| 2.25% 6/24/24 | 1,678,000 | 1,653,139 | |
| 2.875% 8/15/23 | 260,000 | 259,698 | |
| Inter-American Development Bank: | |||
| 0.625% 7/15/25 | 390,000 | 361,170 | |
| 1.75% 3/14/25 | 194,000 | 187,202 | |
| 2.25% 6/18/29 | 1,029,000 | 966,981 | |
| 4.375% 1/24/44 | 39,000 | 43,027 | |
| International Bank for Reconstruction & Development: | |||
| 0.375% 7/28/25 | 270,000 | 248,309 | |
| 0.5% 10/28/25 | 218,000 | 199,898 | |
| 0.75% 8/26/30 | 160,000 | 132,115 | |
| 0.875% 5/14/30 | 176,000 | 147,629 | |
| 1.25% 2/10/31 | 110,000 | 94,002 | |
| 1.5% 8/28/24 | 1,012,000 | 979,633 | |
| 1.625% 1/15/25 | 155,000 | 149,618 | |
| 1.75% 4/19/23 | 55,000 | 54,531 | |
| 1.875% 6/19/23 | 20,000 | 19,799 | |
| 2.5% 3/19/24 | 130,000 | 128,875 | |
| 2.5% 11/22/27 | 92,000 | 88,868 | |
| 2.5% 3/29/32 | 290,000 | 271,668 | |
| 3% 9/27/23 | 100,000 | 99,976 | |
| International Finance Corp.: | |||
| 0.75% 8/27/30 | 60,000 | 50,048 | |
| 1.375% 10/16/24 | 1,051,000 | 1,011,455 | |
| 2.875% 7/31/23 | 112,000 | 111,986 | |
| TOTAL SUPRANATIONAL OBLIGATIONS | |||
| (Cost $11,405,201) | 10,633,226 | ||
| Bank Notes - 0.1% | |||
| Discover Bank 2.7% 2/6/30 | 500,000 | 417,542 | |
| PNC Bank NA 3.875% 4/10/25 | 260,000 | 257,800 | |
| TOTAL BANK NOTES | |||
| (Cost $781,206) | 675,342 | ||
| Shares | Value | ||
| Money Market Funds - 0.1% | |||
| Fidelity Cash Central Fund 1.58% (d) | |||
| (Cost $491,529) | 491,430 | 491,529 | |
| TOTAL INVESTMENT IN SECURITIES - 99.4% | |||
| (Cost $707,968,048) | 631,203,747 | ||
| NET OTHER ASSETS (LIABILITIES) - 0.6% | 3,806,009 | ||
| NET ASSETS - 100% | $635,009,756 |
| TBA Sale Commitments | ||
| Principal Amount | Value | |
| Uniform Mortgage Backed Securities | ||
| 1.5% 7/1/52 | $(500,000) | $(414,633) |
| 5% 7/1/52 | (900,000) | (918,140) |
| TOTAL TBA SALE COMMITMENTS | ||
| (Proceeds $1,332,234) | $(1,332,773) |
Legend
(a) Security exempt from registration under Rule 144A of the Securities Act of 1933. These securities may be resold in transactions exempt from registration, normally to qualified institutional buyers. At the end of the period, the value of these securities amounted to $1,313,227 or 0.2% of net assets.
(b) Coupon rates for floating and adjustable rate securities reflect the rates in effect at period end.
(c) Coupon is indexed to a floating interest rate which may be multiplied by a specified factor and/or subject to caps or floors.
(d) Affiliated fund that is generally available only to investment companies and other accounts managed by Fidelity Investments. The rate quoted is the annualized seven-day yield of the fund at period end. A complete unaudited listing of the fund's holdings as of its most recent quarter end is available upon request. In addition, each Fidelity Central Fund's financial statements are available on the SEC's website or upon request.
Affiliated Central Funds
Fiscal year to date information regarding the Fund's investments in Fidelity Central Funds, including the ownership percentage, is presented below.
| Fund | Value, beginning of period | Purchases | Sales Proceeds | Dividend Income | Realized Gain/Loss | Change in Unrealized appreciation (depreciation) | Value, end of period | % ownership, end of period |
| Fidelity Cash Central Fund 1.58% | $1,970,432 | $66,993,957 | $68,472,860 | $3,487 | $-- | $-- | $491,529 | 0.0% |
| Total | $1,970,432 | $66,993,957 | $68,472,860 | $3,487 | $-- | $-- | $491,529 |
Amounts in the income column in the above table include any capital gain distributions from underlying funds, which are presented in the corresponding line-item in the Statement of Operations, if applicable.
Investment Valuation
The following is a summary of the inputs used, as of June 30, 2022, involving the Fund's assets and liabilities carried at fair value. The inputs or methodology used for valuing securities may not be an indication of the risk associated with investing in those securities. For more information on valuation inputs, and their aggregation into the levels used below, please refer to the Investment Valuation section in the accompanying Notes to Financial Statements.
| Valuation Inputs at Reporting Date: | ||||
| Description | Total | Level 1 | Level 2 | Level 3 |
| Investments in Securities: | ||||
| Corporate Bonds | $159,402,865 | $-- | $159,402,865 | $-- |
| U.S. Government and Government Agency Obligations | 253,775,373 | -- | 253,775,373 | -- |
| U.S. Government Agency - Mortgage Securities | 176,526,610 | -- | 176,526,610 | -- |
| Asset-Backed Securities | 1,997,873 | -- | 1,997,873 | -- |
| Commercial Mortgage Securities | 10,414,290 | -- | 10,414,290 | -- |
| Municipal Securities | 3,654,727 | -- | 3,654,727 | -- |
| Foreign Government and Government Agency Obligations | 13,631,912 | -- | 13,631,912 | -- |
| Supranational Obligations | 10,633,226 | -- | 10,633,226 | -- |
| Bank Notes | 675,342 | -- | 675,342 | -- |
| Money Market Funds | 491,529 | 491,529 | -- | -- |
| Total Investments in Securities: | $631,203,747 | $491,529 | $630,712,218 | $-- |
| Other Financial Instruments: | ||||
| TBA Sale Commitments | $(1,332,773) | $-- | $(1,332,773) | $-- |
| Total Other Financial Instruments: | $(1,332,773) | $-- | $(1,332,773) | $-- |
See accompanying notes which are an integral part of the financial statements.
Financial Statements
Statement of Assets and Liabilities
| June 30, 2022 (Unaudited) | ||
| Assets | ||
| Investment in securities, at value — See accompanying schedule: Unaffiliated issuers (cost $707,476,519) | $630,712,218 | |
| Fidelity Central Funds (cost $491,529) | 491,529 | |
| Total Investment in Securities (cost $707,968,048) | $631,203,747 | |
| Receivable for investments sold | 6,292,177 | |
| Receivable for TBA sale commitments | 1,332,234 | |
| Receivable for fund shares sold | 602,536 | |
| Interest receivable | 3,048,756 | |
| Distributions receivable from Fidelity Central Funds | 961 | |
| Total assets | 642,480,411 | |
| Liabilities | ||
| Payable for investments purchased | $5,957,356 | |
| TBA sale commitments, at value | 1,332,773 | |
| Payable for fund shares redeemed | 64,048 | |
| Accrued management fee | 47,819 | |
| Distribution and service plan fees payable | 40,960 | |
| Other affiliated payables | 26,566 | |
| Other payables and accrued expenses | 1,133 | |
| Total liabilities | 7,470,655 | |
| Net Assets | $635,009,756 | |
| Net Assets consist of: | ||
| Paid in capital | $714,269,035 | |
| Total accumulated earnings (loss) | (79,259,279) | |
| Net Assets | $635,009,756 | |
| Net Asset Value and Maximum Offering Price | ||
| Initial Class: | ||
| Net Asset Value, offering price and redemption price per share ($437,625,276 ÷ 44,407,209 shares) | $9.85 | |
| Service Class: | ||
| Net Asset Value, offering price and redemption price per share ($2,617,284 ÷ 265,486 shares) | $9.86 | |
| Service Class 2: | ||
| Net Asset Value, offering price and redemption price per share ($194,767,196 ÷ 19,847,027 shares) | $9.81 |
See accompanying notes which are an integral part of the financial statements.
Statement of Operations
| Six months ended June 30, 2022 (Unaudited) | ||
| Investment Income | ||
| Interest | $6,122,024 | |
| Income from Fidelity Central Funds | 3,487 | |
| Total income | 6,125,511 | |
| Expenses | ||
| Management fee | $306,134 | |
| Transfer agent fees | 170,074 | |
| Distribution and service plan fees | 261,610 | |
| Independent trustees' fees and expenses | 1,053 | |
| Total expenses before reductions | 738,871 | |
| Expense reductions | (100) | |
| Total expenses after reductions | 738,771 | |
| Net investment income (loss) | 5,386,740 | |
| Realized and Unrealized Gain (Loss) | ||
| Net realized gain (loss) on: | ||
| Investment securities: | ||
| Unaffiliated issuers | (4,705,205) | |
| Total net realized gain (loss) | (4,705,205) | |
| Change in net unrealized appreciation (depreciation) on: | ||
| Investment securities: | ||
| Unaffiliated issuers | (76,676,109) | |
| TBA sale commitments | (539) | |
| Total change in net unrealized appreciation (depreciation) | (76,676,648) | |
| Net gain (loss) | (81,381,853) | |
| Net increase (decrease) in net assets resulting from operations | $(75,995,113) |
See accompanying notes which are an integral part of the financial statements.
Statement of Changes in Net Assets
| Six months ended June 30, 2022 (Unaudited) | Year ended December 31, 2021 | |
| Increase (Decrease) in Net Assets | ||
| Operations | ||
| Net investment income (loss) | $5,386,740 | $8,530,445 |
| Net realized gain (loss) | (4,705,205) | (3,502,735) |
| Change in net unrealized appreciation (depreciation) | (76,676,648) | (21,927,889) |
| Net increase (decrease) in net assets resulting from operations | (75,995,113) | (16,900,179) |
| Distributions to shareholders | (1,595,325) | (6,766,346) |
| Share transactions - net increase (decrease) | (30,842,953) | (19,010,948) |
| Total increase (decrease) in net assets | (108,433,391) | (42,677,473) |
| Net Assets | ||
| Beginning of period | 743,443,147 | 786,120,620 |
| End of period | $635,009,756 | $743,443,147 |
See accompanying notes which are an integral part of the financial statements.
Financial Highlights
VIP Bond Index Portfolio Initial Class
| Six months ended (Unaudited) June 30, | Years endedDecember 31, | ||||
| 2022 | 2021 | 2020 | 2019 | 2018 A | |
| Selected Per–Share Data | |||||
| Net asset value, beginning of period | $11.02 | $11.35 | $10.68 | $10.06 | $10.00 |
| Income from Investment Operations | |||||
| Net investment income (loss)B,C | .086 | .132 | .183 | .283 | .212 |
| Net realized and unrealized gain (loss) | (1.231) | (.353) | .621 | .560 | (.022) |
| Total from investment operations | (1.145) | (.221) | .804 | .843 | .190 |
| Distributions from net investment income | (.025) | (.109) | (.104) | (.191) | (.130) |
| Distributions from net realized gain | – | – | (.030) | (.032) | – |
| Total distributions | (.025) | (.109) | (.134) | (.223) | (.130) |
| Net asset value, end of period | $9.85 | $11.02 | $11.35 | $10.68 | $10.06 |
| Total ReturnD,E,F | (10.41)% | (1.95)% | 7.53% | 8.38% | 1.90% |
| Ratios to Average Net AssetsC,G,H | |||||
| Expenses before reductions | .14%I | .14% | .14% | .14% | .14%I |
| Expenses net of fee waivers, if any | .14%I | .14% | .14% | .14% | .14%I |
| Expenses net of all reductions | .14%I | .14% | .14% | .14% | .13%I |
| Net investment income (loss) | 1.68%I | 1.19% | 1.63% | 2.67% | 3.01%I |
| Supplemental Data | |||||
| Net assets, end of period (000 omitted) | $437,625 | $513,626 | $569,594 | $258,250 | $91,033 |
| Portfolio turnover rateJ | 28%I | 138% | 101% | 81% | 168%I |
A For the period April 19, 2018 (commencement of operations) through December 31, 2018.
B Calculated based on average shares outstanding during the period.
C Net investment income (loss) is affected by the timing of the declaration of dividends by any underlying mutual funds or exchange-traded funds (ETFs). Net investment income (loss) of any such underlying funds is not included in the Fund's net investment income (loss) ratio.
D Total returns for periods of less than one year are not annualized.
E Total returns do not reflect charges attributable to your insurance company's separate account. Inclusion of these charges would reduce the total returns shown.
F Total returns would have been lower if certain expenses had not been reduced during the applicable periods shown.
G Fees and expenses of any underlying mutual funds or exchange-traded funds (ETFs) are not included in the Fund's expense ratio. The Fund indirectly bears its proportionate share of these expenses. For additional expense information related to investments in Fidelity Central Funds, please refer to the "Investments in Fidelity Central Funds" note found in the Notes to Financial Statements section of the most recent Annual or Semi-Annual report.
H Expense ratios reflect operating expenses of the class. Expenses before reductions do not reflect amounts reimbursed, waived, or reduced through arrangements with the investment adviser, brokerage services, or other offset arrangements, if applicable, and do not represent the amount paid by the class during periods when reimbursements, waivers or reductions occur.
I Annualized
J Amount does not include the portfolio activity of any underlying mutual funds or exchange-traded funds (ETFs).
See accompanying notes which are an integral part of the financial statements.
VIP Bond Index Portfolio Service Class
| Six months ended (Unaudited) June 30, | Years endedDecember 31, | |||
| 2022 | 2021 | 2020 | 2019 A | |
| Selected Per–Share Data | ||||
| Net asset value, beginning of period | $11.03 | $11.37 | $10.67 | $10.33 |
| Income from Investment Operations | ||||
| Net investment income (loss)B,C | .081 | .119 | .171 | .197 |
| Net realized and unrealized gain (loss) | (1.229) | (.352) | .632 | .359 |
| Total from investment operations | (1.148) | (.233) | .803 | .556 |
| Distributions from net investment income | (.022) | (.107) | (.073) | (.184) |
| Distributions from net realized gain | – | – | (.030) | (.032) |
| Total distributions | (.022) | (.107) | (.103) | (.216) |
| Net asset value, end of period | $9.86 | $11.03 | $11.37 | $10.67 |
| Total ReturnD,E,F | (10.42)% | (2.05)% | 7.53% | 5.38% |
| Ratios to Average Net AssetsC,G,H | ||||
| Expenses before reductions | .24%I | .24% | .24% | .24%I |
| Expenses net of fee waivers, if any | .24%I | .24% | .24% | .24%I |
| Expenses net of all reductions | .24%I | .24% | .24% | .24%I |
| Net investment income (loss) | 1.58%I | 1.09% | 1.53% | 2.53%I |
| Supplemental Data | ||||
| Net assets, end of period (000 omitted) | $2,617 | $2,759 | $550 | $103 |
| Portfolio turnover rateJ | 28%I | 138% | 101% | 81% |
A For the period April 11, 2019 (commencement of sale of shares) through December 31, 2019.
B Calculated based on average shares outstanding during the period.
C Net investment income (loss) is affected by the timing of the declaration of dividends by any underlying mutual funds or exchange-traded funds (ETFs). Net investment income (loss) of any such underlying funds is not included in the Fund's net investment income (loss) ratio.
D Total returns for periods of less than one year are not annualized.
E Total returns do not reflect charges attributable to your insurance company's separate account. Inclusion of these charges would reduce the total returns shown.
F Total returns would have been lower if certain expenses had not been reduced during the applicable periods shown.
G Fees and expenses of any underlying mutual funds or exchange-traded funds (ETFs) are not included in the Fund's expense ratio. The Fund indirectly bears its proportionate share of these expenses. For additional expense information related to investments in Fidelity Central Funds, please refer to the "Investments in Fidelity Central Funds" note found in the Notes to Financial Statements section of the most recent Annual or Semi-Annual report.
H Expense ratios reflect operating expenses of the class. Expenses before reductions do not reflect amounts reimbursed, waived, or reduced through arrangements with the investment adviser, brokerage services, or other offset arrangements, if applicable, and do not represent the amount paid by the class during periods when reimbursements, waivers or reductions occur.
I Annualized
J Amount does not include the portfolio activity of any underlying mutual funds or exchange-traded funds (ETFs).
See accompanying notes which are an integral part of the financial statements.
VIP Bond Index Portfolio Service Class 2
| Six months ended (Unaudited) June 30, | Years endedDecember 31, | ||||
| 2022 | 2021 | 2020 | 2019 | 2018 A | |
| Selected Per–Share Data | |||||
| Net asset value, beginning of period | $10.98 | $11.32 | $10.68 | $10.06 | $10.00 |
| Income from Investment Operations | |||||
| Net investment income (loss)B,C | .072 | .104 | .161 | .262 | .195 |
| Net realized and unrealized gain (loss) | (1.221) | (.357) | .614 | .556 | (.023) |
| Total from investment operations | (1.149) | (.253) | .775 | .818 | .172 |
| Distributions from net investment income | (.021) | (.087) | (.105) | (.166) | (.112) |
| Distributions from net realized gain | – | – | (.030) | (.032) | – |
| Total distributions | (.021) | (.087) | (.135) | (.198) | (.112) |
| Net asset value, end of period | $9.81 | $10.98 | $11.32 | $10.68 | $10.06 |
| Total ReturnD,E,F | (10.48)% | (2.24)% | 7.26% | 8.13% | 1.72% |
| Ratios to Average Net AssetsC,G,H | |||||
| Expenses before reductions | .39%I | .39% | .37% | .39% | .39%I |
| Expenses net of fee waivers, if any | .39%I | .39% | .37% | .39% | .39%I |
| Expenses net of all reductions | .39%I | .39% | .37% | .39% | .38%I |
| Net investment income (loss) | 1.42%I | .94% | 1.40% | 2.48% | 2.76%I |
| Supplemental Data | |||||
| Net assets, end of period (000 omitted) | $194,767 | $227,058 | $215,977 | $1,167 | $1,006 |
| Portfolio turnover rateJ | 28%I | 138% | 101% | 81% | 168%I |
A For the period April 19, 2018 (commencement of operations) through December 31, 2018.
B Calculated based on average shares outstanding during the period.
C Net investment income (loss) is affected by the timing of the declaration of dividends by any underlying mutual funds or exchange-traded funds (ETFs). Net investment income (loss) of any such underlying funds is not included in the Fund's net investment income (loss) ratio.
D Total returns for periods of less than one year are not annualized.
E Total returns do not reflect charges attributable to your insurance company's separate account. Inclusion of these charges would reduce the total returns shown.
F Total returns would have been lower if certain expenses had not been reduced during the applicable periods shown.
G Fees and expenses of any underlying mutual funds or exchange-traded funds (ETFs) are not included in the Fund's expense ratio. The Fund indirectly bears its proportionate share of these expenses. For additional expense information related to investments in Fidelity Central Funds, please refer to the "Investments in Fidelity Central Funds" note found in the Notes to Financial Statements section of the most recent Annual or Semi-Annual report.
H Expense ratios reflect operating expenses of the class. Expenses before reductions do not reflect amounts reimbursed, waived, or reduced through arrangements with the investment adviser, brokerage services, or other offset arrangements, if applicable, and do not represent the amount paid by the class during periods when reimbursements, waivers or reductions occur.
I Annualized
J Amount does not include the portfolio activity of any underlying mutual funds or exchange-traded funds (ETFs).
See accompanying notes which are an integral part of the financial statements.
Notes to Financial Statements (Unaudited)
For the period ended June 30, 2022
1. Organization.
VIP Bond Index Portfolio (the Fund) is a fund of Variable Insurance Products Fund V (the Trust) and is authorized to issue an unlimited number of shares. The Trust is registered under the Investment Company Act of 1940, as amended (the 1940 Act), as an open-end management investment company organized as a Massachusetts business trust. Shares of the Fund may only be purchased by insurance companies for the purpose of funding variable annuity or variable life insurance contracts. The Fund offers the following classes of shares: Initial Class shares, Service Class shares and Service Class 2 shares. All classes have equal rights and voting privileges, except for matters affecting a single class.
2. Investments in Fidelity Central Funds.
Funds may invest in Fidelity Central Funds, which are open-end investment companies generally available only to other investment companies and accounts managed by the investment adviser and its affiliates. The Schedule of Investments lists any Fidelity Central Funds held as an investment as of period end, but does not include the underlying holdings of each Fidelity Central Fund. An investing fund indirectly bears its proportionate share of the expenses of the underlying Fidelity Central Funds.
Based on its investment objective, each Fidelity Central Fund may invest or participate in various investment vehicles or strategies that are similar to those of the investing fund. These strategies are consistent with the investment objectives of the investing fund and may involve certain economic risks which may cause a decline in value of each of the Fidelity Central Funds and thus a decline in the value of the investing fund.
| Fidelity Central Fund | Investment Manager | Investment Objective | Investment Practices | Expense Ratio(a) |
| Fidelity Money Market Central Funds | Fidelity Management & Research Company LLC (FMR) | Each fund seeks to obtain a high level of current income consistent with the preservation of capital and liquidity. | Short-term Investments | Less than .005% |
(a) Expenses expressed as a percentage of average net assets and are as of each underlying Central Fund's most recent annual or semi-annual shareholder report.
A complete unaudited list of holdings for each Fidelity Central Fund is available upon request or at the Securities and Exchange Commission website at www.sec.gov. In addition, the financial statements of the Fidelity Central Funds which contain the significant accounting policies (including investment valuation policies) of those funds, and are not covered by the Report of Independent Registered Public Accounting Firm, are available on the Securities and Exchange Commission website or upon request.
3. Significant Accounting Policies.
The Fund is an investment company and applies the accounting and reporting guidance of the Financial Accounting Standards Board (FASB) Accounting Standards Codification Topic 946 Financial Services - Investment Companies. The financial statements have been prepared in conformity with accounting principles generally accepted in the United States of America (GAAP), which require management to make certain estimates and assumptions at the date of the financial statements. Actual results could differ from those estimates. Subsequent events, if any, through the date that the financial statements were issued have been evaluated in the preparation of the financial statements. The Fund's Schedule of Investments lists any underlying mutual funds or exchange-traded funds (ETFs) but does not include the underlying holdings of these funds. The following summarizes the significant accounting policies of the Fund:
Investment Valuation. Investments are valued as of 4:00 p.m. Eastern time on the last calendar day of the period. The Board of Trustees (the Board) has delegated the day to day responsibility for the valuation of the Fund's investments to the Fair Value Committee (the Committee) established by the Fund's investment adviser. In accordance with valuation policies and procedures approved by the Board, the Fund attempts to obtain prices from one or more third party pricing vendors or brokers to value its investments. When current market prices, quotations or currency exchange rates are not readily available or reliable, investments will be fair valued in good faith by the Committee, in accordance with procedures adopted by the Board. Factors used in determining fair value vary by investment type and may include market or investment specific events, changes in interest rates and credit quality. The frequency with which these procedures are used cannot be predicted and they may be utilized to a significant extent. The Committee oversees the Fund's valuation policies and procedures and reports to the Board on the Committee's activities and fair value determinations. The Board monitors the appropriateness of the procedures used in valuing the Fund's investments and ratifies the fair value determinations of the Committee.
The Fund categorizes the inputs to valuation techniques used to value its investments into a disclosure hierarchy consisting of three levels as shown below:
- Level 1 – unadjusted quoted prices in active markets for identical investments
- Level 2 – other significant observable inputs (including quoted prices for similar investments, interest rates, prepayment speeds, etc.)
- Level 3 – unobservable inputs (including the Fund's own assumptions based on the best information available)
Valuation techniques used to value the Fund's investments by major category are as follows:
Debt securities, including restricted securities, are valued based on evaluated prices received from third party pricing vendors or from brokers who make markets in such securities. Corporate bonds, bank notes, foreign government and government agency obligations, municipal securities, supranational obligations and U.S. government and government agency obligations are valued by pricing vendors who utilize matrix pricing which considers yield or price of bonds of comparable quality, coupon, maturity and type or by broker-supplied prices. Asset backed securities, commercial mortgage securities and U.S. government agency mortgage securities are valued by pricing vendors who utilize matrix pricing which considers prepayment speed assumptions, attributes of the collateral, yield or price of bonds of comparable quality, coupon, maturity and type or by broker-supplied prices. When independent prices are unavailable or unreliable, debt securities may be valued utilizing pricing methodologies which consider similar factors that would be used by third party pricing vendors. Debt securities are generally categorized as Level 2 in the hierarchy but may be Level 3 depending on the circumstances.
Investments in open-end mutual funds, including the Fidelity Central Funds, are valued at their closing net asset value (NAV) each business day and are categorized as Level 1 in the hierarchy.
Changes in valuation techniques may result in transfers in or out of an assigned level within the disclosure hierarchy. The aggregate value of investments by input level as of June 30, 2022 is included at the end of the Fund's Schedule of Investments.
Investment Transactions and Income. For financial reporting purposes, the Fund's investment holdings and NAV include trades executed through the end of the last business day of the period. The NAV per share for processing shareholder transactions is calculated as of the close of business of the New York Stock Exchange (NYSE), normally 4:00 p.m. Eastern time and includes trades executed through the end of the prior business day. Gains and losses on securities sold are determined on the basis of identified cost and include proceeds received from litigation. Income and capital gain distributions from Fidelity Central Funds, if any, are recorded on the ex-dividend date. Interest income is accrued as earned and includes coupon interest and amortization of premium and accretion of discount on debt securities as applicable. Debt obligations may be placed on non-accrual status and related interest income may be reduced by ceasing current accruals and writing off interest receivables when the collection of all or a portion of interest has become doubtful based on consistently applied procedures. A debt obligation is removed from non-accrual status when the issuer resumes interest payments or when collectability of interest is reasonably assured.
Class Allocations and Expenses. Investment income, realized and unrealized capital gains and losses, common expenses of a fund, and certain fund-level expense reductions, if any, are allocated daily on a pro-rata basis to each class based on the relative net assets of each class to the total net assets of a fund. Each class differs with respect to transfer agent and distribution and service plan fees incurred, as applicable. Certain expense reductions may also differ by class, if applicable. For the reporting period, the allocated portion of income and expenses to each class as a percent of its average net assets may vary due to the timing of recording these transactions in relation to fluctuating net assets of the classes. Expenses directly attributable to a fund are charged to that fund. Expenses attributable to more than one fund are allocated among the respective funds on the basis of relative net assets or other appropriate methods. Expenses included in the accompanying financial statements reflect the expenses of that fund and do not include any expenses associated with any underlying mutual funds or exchange-traded funds. Although not included in a fund's expenses, a fund indirectly bears its proportionate share of these expenses through the net asset value of each underlying mutual fund or exchange-traded fund. Expense estimates are accrued in the period to which they relate and adjustments are made when actual amounts are known.
Income Tax Information and Distributions to Shareholders. Each year, the Fund intends to qualify as a regulated investment company under Subchapter M of the Internal Revenue Code, including distributing substantially all of its taxable income and realized gains. As a result, no provision for U.S. Federal income taxes is required. The Fund files a U.S. federal tax return, in addition to state and local tax returns as required. The Fund's federal income tax returns are subject to examination by the Internal Revenue Service (IRS) for a period of three fiscal years after they are filed. State and local tax returns may be subject to examination for an additional fiscal year depending on the jurisdiction.
Distributions are declared and recorded on the ex-dividend date. Income and capital gain distributions are declared separately for each class. Income and capital gain distributions are determined in accordance with income tax regulations, which may differ from GAAP.
Capital accounts within the financial statements are adjusted for permanent book-tax differences. These adjustments have no impact on net assets or the results of operations. Capital accounts are not adjusted for temporary book-tax differences which will reverse in a subsequent period.
Book-tax differences are primarily due to market discount, capital loss carryforwards and losses deferred due to wash sales.
As of period end, the cost and unrealized appreciation (depreciation) in securities, and derivatives if applicable, for federal income tax purposes were as follows:
| Gross unrealized appreciation | $249,513 |
| Gross unrealized depreciation | (76,477,453) |
| Net unrealized appreciation (depreciation) | $(76,227,940) |
| Tax cost | $707,431,687 |
Capital loss carryforwards are only available to offset future capital gains of the Fund to the extent provided by regulations and may be limited. The capital loss carryforward information presented below, including any applicable limitation, is estimated as of prior fiscal period end and is subject to adjustment.
| No expiration | |
| Sort-term | $(3,226,294) |
To-Be-Announced (TBA) Securities and Mortgage Dollar Rolls. TBA securities involve buying or selling mortgage-backed securities (MBS) on a forward commitment basis. A TBA transaction typically does not designate the actual security to be delivered and only includes an approximate principal amount; however delivered securities must meet specified terms defined by industry guidelines, including issuer, rate and current principal amount outstanding on underlying mortgage pools. Funds may enter into a TBA transaction with the intent to take possession of or deliver the underlying MBS, or a fund may elect to extend the settlement by entering into either a mortgage or reverse mortgage dollar roll. Mortgage dollar rolls are transactions where a fund sells TBA securities and simultaneously agrees to repurchase MBS on a later date at a lower price and with the same counterparty. Reverse mortgage dollar rolls involve the purchase and simultaneous agreement to sell TBA securities on a later date at a lower price. Transactions in mortgage dollar rolls and reverse mortgage dollar rolls are accounted for as purchases and sales and may result in an increase to a fund's portfolio turnover rate.
Purchases and sales of TBA securities involve risks similar to those discussed above for delayed delivery and when-issued securities. Also, if the counterparty in a mortgage dollar roll or a reverse mortgage dollar roll transaction files for bankruptcy or becomes insolvent, a fund's right to repurchase or sell securities may be limited. Additionally, when a fund sells TBA securities without already owning or having the right to obtain the deliverable securities (an uncovered forward commitment to sell), it incurs a risk of loss because it could have to purchase the securities at a price that is higher than the price at which it sold them. A fund may be unable to purchase the deliverable securities if the corresponding market is illiquid.
TBA securities subject to a forward commitment to sell at period end are included at the end of the Schedule of Investments under the caption "TBA Sale Commitments." The proceeds and value of these commitments are reflected in the Statement of Assets and Liabilities as "Receivable for TBA sale commitments" and "TBA sale commitments, at value," respectively.
Restricted Securities (including Private Placements). Funds may invest in securities that are subject to legal or contractual restrictions on resale. These securities generally may be resold in transactions exempt from registration or to the public if the securities are registered. Disposal of these securities may involve time-consuming negotiations and expense, and prompt sale at an acceptable price may be difficult. Information regarding restricted securities held at period end is included at the end of the Schedule of Investments, if applicable.
4. Purchases and Sales of Investments.
Purchases and sales of securities, other than short-term securities and in-kind transactions, as applicable, are noted in the table below.
| Purchases ($) | Sales ($) | |
| VIP Bond Index Portfolio | 5,010,889 | 7,852,819 |
5. Fees and Other Transactions with Affiliates.
Management Fee and Expense Contract. Fidelity Management & Research Company LLC (the investment adviser) and its affiliates provide the Fund with investment management related services for which the Fund pays a monthly management fee. The management fee is based on an annual rate of .09% of the Fund's average net assets. Under the management contract, the investment adviser pays all other fund-level expenses, except the compensation of the independent Trustees and certain miscellaneous expenses such as proxy and shareholder meeting expenses.
In addition, under the expense contract, the investment adviser pays class-level expenses as necessary so that the total expenses do not exceed certain amounts of each class' average net assets on an annual basis with certain exceptions, as noted in the following table:
| Initial Class | .14% |
| Service Class | .24% |
| Service Class 2 | .39% |
Distribution and Service Plan Fees. In accordance with Rule 12b-1 of the 1940 Act, the Fund has adopted separate 12b-1 Plans for each Service Class of shares. Each Service Class pays Fidelity Distributors Company LLC (FDC), an affiliate of the investment adviser, a service fee. For the period, the service fee is based on an annual rate of .10% of Service Class' average net assets and .25% of Service Class 2's average net assets.
For the period, total fees, all of which were re-allowed to insurance companies for the distribution of shares and providing shareholder support services, were as follows:
| Service Class | $945 |
| Service Class 2 | 260,665 |
| $261,610 |
Transfer Agent Fees. Fidelity Investments Institutional Operations Company LLC (FIIOC), an affiliate of the investment adviser, is the transfer, dividend disbursing, and shareholder servicing agent for each class. FIIOC receives asset-based fees based on each class's average net assets for transfer agent services, typesetting, and printing and mailing of shareholder reports, excluding mailing of proxy statements, equal to an annual rate of .06% of average net assets. Under the expense contract, each class pays a portion of the transfer agent fees equal to an annual rate of .05% of class-level average net assets. For the period, transfer agent fees for each class were as follows:
| Initial Class | $117,469 |
| Service Class | 472 |
| Service Class 2 | 52,133 |
| $170,074 |
Interfund Trades. Funds may purchase from or sell securities to other Fidelity Funds under procedures adopted by the Board. The procedures have been designed to ensure these interfund trades are executed in accordance with Rule 17a-7 of the 1940 Act. Any interfund trades are included within the respective purchases and sales amounts shown in the Purchases and Sales of Investments note. During the period, there were no interfund trades.
6. Committed Line of Credit.
Certain Funds participate with other funds managed by the investment adviser or an affiliate in a $4.25 billion credit facility (the "line of credit") to be utilized for temporary or emergency purposes to fund shareholder redemptions or for other short-term liquidity purposes. The commitment fees on the pro-rata portion of the line of credit are borne by the investment adviser. During the period, there were no borrowings on this line of credit.
7. Expense Reductions.
Through arrangements with the Fund's custodian, credits realized as a result of certain uninvested cash balances were used to reduce the Fund's expenses. During the period, custodian credits reduced the Fund's expenses by $100.
8. Distributions to Shareholders.
Distributions to shareholders of each class were as follows:
| Six months ended June 30, 2022 | Year ended December 31, 2021 |
|
| VIP Bond Index Portfolio | ||
| Distributions to shareholders | ||
| Initial Class | $1,159,265 | $4,980,718 |
| Service Class | 3,724 | 21,882 |
| Service Class 2 | 432,336 | 1,763,746 |
| Total | $1,595,325 | $6,766,346 |
9. Share Transactions.
Transactions for each class of shares were as follows and may contain in-kind transactions:
| Shares | Shares | Dollars | Dollars | |
| Six months ended June 30, 2022 | Year ended December 31, 2021 | Six months ended June 30, 2022 | Year ended December 31, 2021 | |
| VIP Bond Index Portfolio | ||||
| Initial Class | ||||
| Shares sold | 3,024,938 | 18,226,484 | $30,829,849 | $202,928,648 |
| Reinvestment of distributions | 108,647 | 449,929 | 1,159,265 | 4,980,718 |
| Shares redeemed | (5,334,011) | (22,251,821) | (54,502,666) | (246,900,783) |
| Net increase (decrease) | (2,200,426) | (3,575,408) | $(22,513,552) | $(38,991,417) |
| Service Class | ||||
| Shares sold | 379,053 | 256,218 | $3,905,898 | $2,857,806 |
| Reinvestment of distributions | 329 | 1,881 | 3,511 | 20,847 |
| Shares redeemed | (364,109) | (56,248) | (3,845,307) | (627,376) |
| Net increase (decrease) | 15,273 | 201,851 | $64,102 | $2,251,277 |
| Service Class 2 | ||||
| Shares sold | 1,542,491 | 4,874,226 | $15,888,082 | $54,057,998 |
| Reinvestment of distributions | 40,653 | 159,688 | 432,146 | 1,762,956 |
| Shares redeemed | (2,408,494) | (3,438,112) | (24,713,731) | (38,091,762) |
| Net increase (decrease) | (825,350) | 1,595,802 | $(8,393,503) | $17,729,192 |
10. Other.
A fund's organizational documents provide former and current trustees and officers with a limited indemnification against liabilities arising in connection with the performance of their duties to the fund. In the normal course of business, a fund may also enter into contracts that provide general indemnifications. A fund's maximum exposure under these arrangements is unknown as this would be dependent on future claims that may be made against a fund. The risk of material loss from such claims is considered remote.
At the end of the period, the investment adviser or its affiliates were owners of record of more than 10% and certain otherwise unaffiliated shareholders were owners of record of more than 10% of the outstanding shares as follows:
| Fund | Affiliated % | Number of Unaffiliated Shareholders | Unaffiliated Shareholders % |
| VIP Bond Index Portfolio | 58% | 1 | 39% |
11. Coronavirus (COVID-19) Pandemic.
An outbreak of COVID-19 first detected in China during December 2019 has since spread globally and was declared a pandemic by the World Health Organization during March 2020. Developments that disrupt global economies and financial markets, such as the COVID-19 pandemic, may magnify factors that affect the Fund's performance.
Shareholder Expense Example
As a shareholder, you incur two types of costs: (1) transaction costs, which may include sales charges (loads) on purchase payments or redemption proceeds, as applicable and (2) ongoing costs, which generally include management fees, distribution and/or service (12b-1) fees and other Fund expenses. This Example is intended to help you understand your ongoing costs (in dollars) of investing in a fund and to compare these costs with the ongoing costs of investing in other mutual funds.
The Example is based on an investment of $1,000 invested at the beginning of the period and held for the entire period (January 1, 2022 to June 30, 2022).
Actual Expenses
The first line of the accompanying table provides information about actual account values and actual expenses. You may use the information in this line, together with the amount you invested, to estimate the expenses that you paid over the period. Simply divide your account value by $1,000.00 (for example, an $8,600 account value divided by $1,000.00 = 8.6), then multiply the result by the number in the first line for a class/Fund under the heading entitled "Expenses Paid During Period" to estimate the expenses you paid on your account during this period. If any fund is a shareholder of any underlying mutual funds or exchange-traded funds (ETFs) (the Underlying Funds), such fund indirectly bears its proportional share of the expenses of the Underlying Funds in addition to the direct expenses incurred presented in the table. These fees and expenses are not included in the annualized expense ratio used to calculate the expense estimate in the table below. The estimate of expenses does not include any fees or other expenses of any variable annuity or variable life insurance product. If they were, the estimate of expenses you paid during the period would be higher, and your ending account value would be lower.
Hypothetical Example for Comparison Purposes
The second line of the accompanying table provides information about hypothetical account values and hypothetical expenses based on the actual expense ratio and an assumed rate of return of 5% per year before expenses, which is not the actual return. The hypothetical account values and expenses may not be used to estimate the actual ending account balance or expenses you paid for the period. You may use this information to compare the ongoing costs of investing in the Fund and other funds. To do so, compare this 5% hypothetical example with the 5% hypothetical examples that appear in the shareholder reports of the other funds. If any fund is a shareholder of any Underlying Funds, such fund indirectly bears its proportional share of the expenses of the Underlying Funds in addition to the direct expenses as presented in the table. These fees and expenses are not included in the annualized expense ratio used to calculate the expense estimate in the table below. The estimate of expenses does not include any fees or other expenses of any variable annuity or variable life insurance product. If they were, the estimate of expenses you paid during the period would be higher, and your ending account value would be lower.
Please note that the expenses shown in the table are meant to highlight your ongoing costs only and do not reflect any transaction costs. Therefore, the second line of the table is useful in comparing ongoing costs only, and will not help you determine the relative total costs of owning different funds. In addition, if these transactional costs were included, your costs would have been higher.
| Annualized Expense Ratio-A | Beginning Account Value January 1, 2022 | Ending Account Value June 30, 2022 | Expenses Paid During Period-B January 1, 2022 to June 30, 2022 |
|
| VIP Bond Index Portfolio | ||||
| Initial Class | .14% | |||
| Actual | $1,000.00 | $895.90 | $.66 | |
| Hypothetical-C | $1,000.00 | $1,024.10 | $.70 | |
| Service Class | .24% | |||
| Actual | $1,000.00 | $895.80 | $1.13 | |
| Hypothetical-C | $1,000.00 | $1,023.60 | $1.20 | |
| Service Class 2 | .39% | |||
| Actual | $1,000.00 | $895.20 | $1.83 | |
| Hypothetical-C | $1,000.00 | $1,022.86 | $1.96 |
A Annualized expense ratio reflects expenses net of applicable fee waivers.
B Expenses are equal to the annualized expense ratio, multiplied by the average account value over the period, multiplied by 181/ 365 (to reflect the one-half year period). The fees and expenses of any Underlying Funds are not included in each annualized expense ratio.
C 5% return per year before expenses
Liquidity Risk Management Program
The Securities and Exchange Commission adopted Rule 22e-4 under the Investment Company Act of 1940 (the Liquidity Rule) to promote effective liquidity risk management throughout the open-end investment company industry, thereby reducing the risk that funds will be unable to meet their redemption obligations and mitigating dilution of the interests of fund shareholders.
The Fund has adopted and implemented a liquidity risk management program pursuant to the Liquidity Rule (the Program) effective December 1, 2018. The Program is reasonably designed to assess and manage the Fund’s liquidity risk and to comply with the requirements of the Liquidity Rule. The Fund’s Board of Trustees (the Board) has designated the Fund’s investment adviser as administrator of the Program. The Fidelity advisers have established a Liquidity Risk Management Committee (the LRM Committee) to manage the Program for each of the Fidelity Funds. The LRM Committee monitors the adequacy and effectiveness of implementation of the Program and on a periodic basis assesses each Fund’s liquidity risk based on a variety of factors including (1) the Fund’s investment strategy, (2) portfolio liquidity and cash flow projections during normal and reasonably foreseeable stressed conditions, (3) shareholder redemptions, (4) borrowings and other funding sources and (5) in the case of exchange-traded funds, certain additional factors including the effect of the Fund’s prices and spreads, market participants, and basket compositions on the overall liquidity of the Fund’s portfolio, as applicable.
In accordance with the Program, each of the Fund’s portfolio investments is classified into one of four liquidity categories described below based on a determination of a reasonable expectation for how long it would take to convert the investment to cash (or sell or dispose of the investment) without significantly changing its market value.
- Highly liquid investments – cash or convertible to cash within three business days or less
- Moderately liquid investments – convertible to cash in three to seven calendar days
- Less liquid investments – can be sold or disposed of, but not settled, within seven calendar days
- Illiquid investments – cannot be sold or disposed of within seven calendar days
Liquidity classification determinations take into account a variety of factors including various market, trading and investment-specific considerations, as well as market depth, and generally utilize analysis from a third-party liquidity metrics service.
The Liquidity Rule places a 15% limit on a fund’s illiquid investments and requires funds that do not primarily hold assets that are highly liquid investments to determine and maintain a minimum percentage of the fund’s net assets to be invested in highly liquid investments (highly liquid investment minimum or HLIM). The Program includes provisions reasonably designed to comply with the 15% limit on illiquid investments and for determining, periodically reviewing and complying with the HLIM requirement as applicable.
At a recent meeting of the Fund’s Board of Trustees, the LRM Committee provided a written report to the Board pertaining to the operation, adequacy, and effectiveness of implementation of the Program for the annual period from December 1, 2020 through November 30, 2021. The report concluded that the Program has been implemented and is operating effectively and is reasonably designed to assess and manage the Fund’s liquidity risk.
![]()
VUSB-SANN-0822
1.9887311.104
Fidelity® Variable Insurance Products:
Investment Grade Bond Portfolio
Semi-Annual Report
June 30, 2022
Contents
To view a fund's proxy voting guidelines and proxy voting record for the 12-month period ended June 30, visit http://www.fidelity.com/proxyvotingresults or visit the Securities and Exchange Commission's (SEC) web site at http://www.sec.gov.
You may also call 1-877-208-0098 to request a free copy of the proxy voting guidelines.
Fidelity® Variable Insurance Products are separate account options which are purchased through a variable insurance contract.
Standard & Poor's, S&P and S&P 500 are registered service marks of The McGraw-Hill Companies, Inc. and have been licensed for use by Fidelity Distributors Corporation.
Other third-party marks appearing herein are the property of their respective owners.
All other marks appearing herein are registered or unregistered trademarks or service marks of FMR LLC or an affiliated company. © 2022 FMR LLC. All rights reserved.
This report and the financial statements contained herein are submitted for the general information of the shareholders of the Fund. This report is not authorized for distribution to prospective investors in the Fund unless preceded or accompanied by an effective prospectus.
A fund files its complete schedule of portfolio holdings with the SEC for the first and third quarters of each fiscal year on Form N-PORT. Forms N-PORT are available on the SEC’s web site at http://www.sec.gov. A fund's Forms N-PORT may be reviewed and copied at the SEC’s Public Reference Room in Washington, DC. Information regarding the operation of the SEC's Public Reference Room may be obtained by calling 1-800-SEC-0330.
For a complete list of a fund's portfolio holdings, view the most recent holdings listing, semiannual report, or annual report on Fidelity's web site at http://www.fidelity.com, http://www.institutional.fidelity.com, or http://www.401k.com, as applicable.
NOT FDIC INSURED •MAY LOSE VALUE •NO BANK GUARANTEE
Neither the Fund nor Fidelity Distributors Corporation is a bank.
Note to Shareholders:
Early in 2020, the outbreak and spread of COVID-19 emerged as a public health emergency that had a major influence on financial markets, primarily based on its impact on the global economy and corporate earnings. On March 11, 2020, the World Health Organization declared the COVID-19 outbreak a pandemic, citing sustained risk of further global spread. The pandemic prompted a number of measures to limit the spread of COVID-19, including travel and border restrictions, quarantines, and restrictions on large gatherings. In turn, these resulted in lower consumer activity, diminished demand for a wide range of products and services, disruption in manufacturing and supply chains, and – given the wide variability in outcomes regarding the outbreak – significant market uncertainty and volatility. To help stem the turmoil, the U.S. government took unprecedented action – in concert with the U.S. Federal Reserve and central banks around the world – to help support consumers, businesses, and the broader economy, and to limit disruption to the financial system.
In general, the overall impact of the pandemic lessened in 2021, amid a resilient economy and widespread distribution of three COVID-19 vaccines granted emergency use authorization from the U.S. Food and Drug Administration (FDA) early in the year. Still, the situation remains dynamic, and the extent and duration of its influence on financial markets and the economy is highly uncertain, due in part to a recent spike in cases based on highly contagious variants of the coronavirus.
Extreme events such as the COVID-19 crisis are exogenous shocks that can have significant adverse effects on mutual funds and their investments. Although multiple asset classes may be affected by market disruption, the duration and impact may not be the same for all types of assets. Fidelity is committed to helping you stay informed amid news about COVID-19 and during increased market volatility, and we continue to take extra steps to be responsive to customer needs. We encourage you to visit us online, where we offer ongoing updates, commentary, and analysis on the markets and our funds.
VIP Investment Grade Bond Portfolio
Investment Summary (Unaudited)
Quality Diversification (% of fund's net assets)
| As of June 30, 2022 | ||
| U.S. Government and U.S. Government Agency Obligations | 53.1% | |
| AAA | 8.4% | |
| AA | 1.9% | |
| A | 8.4% | |
| BBB | 22.9% | |
| BB and Below | 5.7% | |
| Not Rated | 2.6% | |
| Short-Term Investments and Net Other Assets* | (3.0)% | |

* Net Other Assets (Liabilities) are not included in the pie chart
We have used ratings from Moody’s Investors Service, Inc. Where Moody’s® ratings are not available, we have used S&P® ratings. All ratings are as of the date indicated and do not reflect subsequent changes. Securities rated BB or below were rated investment grade at the time of acquisition. The information in the above tables is based on the combined investments of the Fund and its pro-rata share of investments of Fidelity’s fixed-income central funds.
Asset Allocation (% of fund's net assets)
| As of June 30, 2022 *,** | ||
| Corporate Bonds | 35.1% | |
| U.S. Government and U.S. Government Agency Obligations | 53.1% | |
| Asset-Backed Securities | 6.6% | |
| CMOs and Other Mortgage Related Securities | 7.1% | |
| Municipal Bonds | 0.8% | |
| Other Investments | 0.3% | |
| Short-Term Investments and Net Other Assets (Liabilities)*** | (3.0)% | |
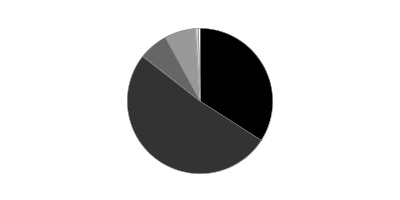
* Foreign investments - 12.2%
** Futures and Swaps - 0.9%
*** Net Other Assets (Liabilities) are not included in the pie chart
The information in the above table is based on the combined investments of the Fund and its pro rata share of the investments of Fidelity’s fixed-income central funds.
An unaudited holdings listing for the Fund, which presents direct holdings as well as the pro-rata share of any securities and other investments held indirectly through its investment in underlying non-money market Fidelity Central Funds, is available at fidelity.com and/orinstitutional.fidelity.com, as applicable.
Geographic Diversification (% of fund's net assets)
| As of June 30, 2022 | ||
| United States of America* | 87.8% | |
| Cayman Islands | 5.2% | |
| United Kingdom | 1.6% | |
| Mexico | 1.2% | |
| Ireland | 0.9% | |
| Switzerland | 0.6% | |
| Canada | 0.6% | |
| France | 0.4% | |
| Italy | 0.2% | |
| Other | 1.5% | |
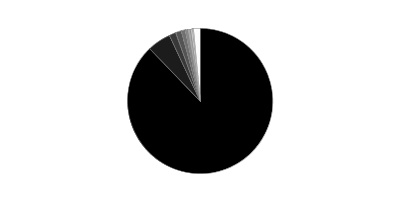
* Includes Short-Term investments and Net Other Assets (Liabilities).
Percentages in the above tables are adjusted for the effect of TBA Sale Commitments.
Percentages are based on country or territory of incorporation and are adjusted for the effect of futures contracts, if applicable.
VIP Investment Grade Bond Portfolio
Schedule of Investments June 30, 2022 (Unaudited)
Showing Percentage of Net Assets
| Nonconvertible Bonds - 33.6% | |||
| Principal Amount | Value | ||
| COMMUNICATION SERVICES - 3.2% | |||
| Diversified Telecommunication Services - 0.9% | |||
| AT&T, Inc.: | |||
| 2.55% 12/1/33 | $8,483,000 | $6,881,695 | |
| 3.8% 12/1/57 | 8,657,000 | 6,685,998 | |
| 4.3% 2/15/30 | 1,940,000 | 1,893,248 | |
| 4.75% 5/15/46 | 10,884,000 | 10,073,858 | |
| Verizon Communications, Inc.: | |||
| 2.1% 3/22/28 | 3,395,000 | 3,015,512 | |
| 2.55% 3/21/31 | 3,143,000 | 2,687,289 | |
| 3% 3/22/27 | 735,000 | 698,116 | |
| 4.862% 8/21/46 | 4,225,000 | 4,158,101 | |
| 5.012% 4/15/49 | 164,000 | 166,478 | |
| 36,260,295 | |||
| Entertainment - 0.4% | |||
| The Walt Disney Co.: | |||
| 3.8% 3/22/30 | 13,068,000 | 12,634,913 | |
| 4.7% 3/23/50 | 4,126,000 | 4,069,353 | |
| 16,704,266 | |||
| Media - 1.5% | |||
| Charter Communications Operating LLC/Charter Communications Operating Capital Corp.: | |||
| 4.4% 4/1/33 | 1,435,000 | 1,281,222 | |
| 4.908% 7/23/25 | 2,191,000 | 2,196,083 | |
| 5.25% 4/1/53 | 1,435,000 | 1,212,594 | |
| 5.375% 5/1/47 | 10,316,000 | 8,783,677 | |
| 5.5% 4/1/63 | 1,435,000 | 1,218,887 | |
| 6.484% 10/23/45 | 1,557,000 | 1,513,668 | |
| Comcast Corp.: | |||
| 3.9% 3/1/38 | 608,000 | 549,867 | |
| 4.65% 7/15/42 | 1,441,000 | 1,377,117 | |
| Discovery Communications LLC: | |||
| 3.625% 5/15/30 | 1,973,000 | 1,754,261 | |
| 4.65% 5/15/50 | 5,336,000 | 4,196,025 | |
| Fox Corp.: | |||
| 4.03% 1/25/24 | 720,000 | 720,062 | |
| 4.709% 1/25/29 | 1,042,000 | 1,021,595 | |
| 5.476% 1/25/39 | 1,027,000 | 997,039 | |
| 5.576% 1/25/49 | 682,000 | 665,265 | |
| Magallanes, Inc.: | |||
| 3.428% 3/15/24 (a) | 2,320,000 | 2,274,370 | |
| 3.638% 3/15/25 (a) | 1,270,000 | 1,230,007 | |
| 3.755% 3/15/27 (a) | 2,484,000 | 2,329,971 | |
| 4.054% 3/15/29 (a) | 861,000 | 788,656 | |
| 4.279% 3/15/32 (a) | 3,451,000 | 3,084,305 | |
| 5.05% 3/15/42 (a) | 1,789,000 | 1,522,063 | |
| 5.141% 3/15/52 (a) | 2,782,000 | 2,335,072 | |
| Time Warner Cable LLC: | |||
| 4.5% 9/15/42 | 525,000 | 409,826 | |
| 5.5% 9/1/41 | 965,000 | 842,361 | |
| 5.875% 11/15/40 | 852,000 | 780,761 | |
| 6.55% 5/1/37 | 11,472,000 | 11,486,625 | |
| 7.3% 7/1/38 | 2,146,000 | 2,240,766 | |
| 56,812,145 | |||
| Wireless Telecommunication Services - 0.4% | |||
| Rogers Communications, Inc.: | |||
| 3.2% 3/15/27 (a) | 2,687,000 | 2,548,641 | |
| 3.8% 3/15/32 (a) | 2,344,000 | 2,143,377 | |
| T-Mobile U.S.A., Inc.: | |||
| 3.75% 4/15/27 | 3,463,000 | 3,334,590 | |
| 3.875% 4/15/30 | 5,007,000 | 4,672,813 | |
| 4.375% 4/15/40 | 747,000 | 666,792 | |
| 4.5% 4/15/50 | 1,468,000 | 1,302,562 | |
| 14,668,775 | |||
| TOTAL COMMUNICATION SERVICES | 124,445,481 | ||
| CONSUMER DISCRETIONARY - 0.7% | |||
| Automobiles - 0.1% | |||
| General Motors Financial Co., Inc. 4.25% 5/15/23 | 1,181,000 | 1,185,022 | |
| Volkswagen Group of America Finance LLC 3.125% 5/12/23 (a) | 2,832,000 | 2,811,721 | |
| 3,996,743 | |||
| Diversified Consumer Services - 0.0% | |||
| Ingersoll-Rand Global Holding Co. Ltd. 4.25% 6/15/23 | 1,665,000 | 1,668,349 | |
| Hotels, Restaurants & Leisure - 0.1% | |||
| McDonald's Corp.: | |||
| 3.5% 7/1/27 | 956,000 | 936,710 | |
| 3.6% 7/1/30 | 1,138,000 | 1,083,309 | |
| 2,020,019 | |||
| Leisure Products - 0.1% | |||
| Hasbro, Inc. 3% 11/19/24 | 2,495,000 | 2,428,991 | |
| Specialty Retail - 0.4% | |||
| AutoNation, Inc. 4.75% 6/1/30 | 434,000 | 408,259 | |
| AutoZone, Inc.: | |||
| 3.625% 4/15/25 | 649,000 | 640,926 | |
| 4% 4/15/30 | 3,015,000 | 2,862,728 | |
| Lowe's Companies, Inc.: | |||
| 3.35% 4/1/27 | 384,000 | 369,534 | |
| 3.75% 4/1/32 | 1,183,000 | 1,097,548 | |
| 4.25% 4/1/52 | 4,817,000 | 4,171,270 | |
| 4.45% 4/1/62 | 4,962,000 | 4,238,583 | |
| 4.5% 4/15/30 | 2,166,000 | 2,140,014 | |
| O'Reilly Automotive, Inc. 4.2% 4/1/30 | 668,000 | 644,932 | |
| 16,573,794 | |||
| TOTAL CONSUMER DISCRETIONARY | 26,687,896 | ||
| CONSUMER STAPLES - 2.3% | |||
| Beverages - 1.4% | |||
| Anheuser-Busch InBev Finance, Inc.: | |||
| 4.7% 2/1/36 | 5,260,000 | 5,039,223 | |
| 4.9% 2/1/46 | 6,535,000 | 6,142,180 | |
| Anheuser-Busch InBev Worldwide, Inc.: | |||
| 3.5% 6/1/30 | 2,100,000 | 1,968,463 | |
| 4.35% 6/1/40 | 2,002,000 | 1,791,475 | |
| 4.5% 6/1/50 | 2,838,000 | 2,551,294 | |
| 4.6% 6/1/60 | 2,100,000 | 1,835,644 | |
| 4.75% 4/15/58 | 3,264,000 | 2,920,993 | |
| 5.45% 1/23/39 | 2,662,000 | 2,706,449 | |
| 5.55% 1/23/49 | 6,083,000 | 6,212,693 | |
| 5.8% 1/23/59 (Reg. S) | 6,427,000 | 6,684,627 | |
| Molson Coors Beverage Co.: | |||
| 3% 7/15/26 | 4,258,000 | 3,999,350 | |
| 5% 5/1/42 | 7,433,000 | 6,871,328 | |
| The Coca-Cola Co.: | |||
| 3.375% 3/25/27 | 3,224,000 | 3,196,562 | |
| 3.45% 3/25/30 | 1,970,000 | 1,916,215 | |
| 53,836,496 | |||
| Food Products - 0.4% | |||
| General Mills, Inc. 2.875% 4/15/30 | 408,000 | 361,409 | |
| JBS Finance Luxembourg SARL: | |||
| 2.5% 1/15/27 (a) | 5,004,000 | 4,342,171 | |
| 3.625% 1/15/32 (a) | 1,723,000 | 1,391,323 | |
| JBS U.S.A. Lux SA / JBS Food Co.: | |||
| 3% 5/15/32 (a) | 4,479,000 | 3,439,696 | |
| 5.125% 2/1/28 (a) | 1,885,000 | 1,840,740 | |
| 5.5% 1/15/30 (a) | 717,000 | 678,497 | |
| 5.75% 4/1/33 (a) | 3,880,000 | 3,694,885 | |
| 6.5% 4/15/29 (a) | 92,000 | 92,552 | |
| 15,841,273 | |||
| Tobacco - 0.5% | |||
| Altria Group, Inc.: | |||
| 4.25% 8/9/42 | 3,140,000 | 2,344,420 | |
| 4.5% 5/2/43 | 2,104,000 | 1,578,634 | |
| 4.8% 2/14/29 | 575,000 | 546,349 | |
| 5.375% 1/31/44 | 1,907,000 | 1,621,189 | |
| 5.95% 2/14/49 | 753,000 | 659,823 | |
| Imperial Tobacco Finance PLC 4.25% 7/21/25 (a) | 8,792,000 | 8,609,169 | |
| Reynolds American, Inc.: | |||
| 4.45% 6/12/25 | 1,329,000 | 1,320,998 | |
| 5.7% 8/15/35 | 689,000 | 653,482 | |
| 6.15% 9/15/43 | 2,271,000 | 2,102,037 | |
| 7.25% 6/15/37 | 1,681,000 | 1,748,216 | |
| 21,184,317 | |||
| TOTAL CONSUMER STAPLES | 90,862,086 | ||
| ENERGY - 3.8% | |||
| Energy Equipment & Services - 0.0% | |||
| Halliburton Co.: | |||
| 3.8% 11/15/25 | 34,000 | 33,662 | |
| 4.85% 11/15/35 | 1,223,000 | 1,175,976 | |
| 1,209,638 | |||
| Oil, Gas & Consumable Fuels - 3.8% | |||
| Canadian Natural Resources Ltd.: | |||
| 3.8% 4/15/24 | 3,850,000 | 3,823,260 | |
| 5.85% 2/1/35 | 1,417,000 | 1,437,459 | |
| Cenovus Energy, Inc. 4.25% 4/15/27 | 3,633,000 | 3,560,863 | |
| Columbia Pipeline Group, Inc. 4.5% 6/1/25 | 758,000 | 764,240 | |
| DCP Midstream Operating LP: | |||
| 3.875% 3/15/23 | 1,006,000 | 996,413 | |
| 5.6% 4/1/44 | 697,000 | 563,256 | |
| 6.45% 11/3/36 (a) | 1,406,000 | 1,377,880 | |
| Empresa Nacional de Petroleo 4.375% 10/30/24 (a) | 2,009,000 | 1,999,332 | |
| Enbridge, Inc.: | |||
| 4% 10/1/23 | 1,597,000 | 1,603,253 | |
| 4.25% 12/1/26 | 1,006,000 | 995,592 | |
| Energy Transfer LP: | |||
| 3.75% 5/15/30 | 1,314,000 | 1,184,201 | |
| 3.9% 5/15/24 (b) | 751,000 | 745,168 | |
| 4.2% 9/15/23 | 673,000 | 673,999 | |
| 4.25% 3/15/23 | 577,000 | 576,702 | |
| 4.5% 4/15/24 | 717,000 | 717,327 | |
| 4.95% 6/15/28 | 2,298,000 | 2,264,416 | |
| 5% 5/15/50 | 3,733,000 | 3,176,575 | |
| 5.25% 4/15/29 | 1,165,000 | 1,153,882 | |
| 5.4% 10/1/47 | 766,000 | 672,069 | |
| 5.8% 6/15/38 | 1,282,000 | 1,200,821 | |
| 6% 6/15/48 | 834,000 | 783,467 | |
| 6.25% 4/15/49 | 800,000 | 775,453 | |
| Enterprise Products Operating LP 3.7% 2/15/26 | 2,725,000 | 2,678,085 | |
| Exxon Mobil Corp. 3.482% 3/19/30 | 7,630,000 | 7,317,592 | |
| Hess Corp.: | |||
| 4.3% 4/1/27 | 2,776,000 | 2,706,011 | |
| 5.6% 2/15/41 | 6,796,000 | 6,621,292 | |
| 7.125% 3/15/33 | 569,000 | 633,296 | |
| 7.3% 8/15/31 | 762,000 | 852,807 | |
| 7.875% 10/1/29 | 2,490,000 | 2,863,012 | |
| Kinder Morgan Energy Partners LP: | |||
| 3.45% 2/15/23 | 965,000 | 965,978 | |
| 6.55% 9/15/40 | 261,000 | 271,290 | |
| Kinder Morgan, Inc. 5.55% 6/1/45 | 1,383,000 | 1,302,501 | |
| MPLX LP: | |||
| 4.5% 7/15/23 | 1,121,000 | 1,124,187 | |
| 4.8% 2/15/29 | 640,000 | 629,327 | |
| 4.875% 12/1/24 | 1,553,000 | 1,563,592 | |
| 5.5% 2/15/49 | 1,917,000 | 1,778,065 | |
| Occidental Petroleum Corp.: | |||
| 5.55% 3/15/26 | 3,587,000 | 3,561,999 | |
| 6.2% 3/15/40 | 965,000 | 950,525 | |
| 6.45% 9/15/36 | 2,612,000 | 2,677,300 | |
| 6.6% 3/15/46 | 3,240,000 | 3,440,880 | |
| 7.5% 5/1/31 | 4,360,000 | 4,687,000 | |
| Petroleos Mexicanos: | |||
| 4.5% 1/23/26 | 3,020,000 | 2,616,830 | |
| 5.95% 1/28/31 | 2,067,000 | 1,508,083 | |
| 6.35% 2/12/48 | 7,493,000 | 4,353,433 | |
| 6.49% 1/23/27 | 2,174,000 | 1,861,814 | |
| 6.5% 3/13/27 | 2,742,000 | 2,367,032 | |
| 6.5% 1/23/29 | 3,157,000 | 2,567,430 | |
| 6.7% 2/16/32 | 2,866,000 | 2,170,995 | |
| 6.75% 9/21/47 | 6,872,000 | 4,209,100 | |
| 6.84% 1/23/30 | 10,482,000 | 8,254,575 | |
| 6.95% 1/28/60 | 4,473,000 | 2,753,132 | |
| 7.69% 1/23/50 | 9,202,000 | 6,142,335 | |
| Phillips 66 Co.: | |||
| 3.7% 4/6/23 | 270,000 | 269,980 | |
| 3.85% 4/9/25 | 349,000 | 346,841 | |
| Plains All American Pipeline LP/PAA Finance Corp.: | |||
| 3.55% 12/15/29 | 751,000 | 661,676 | |
| 3.6% 11/1/24 | 789,000 | 771,703 | |
| Sabine Pass Liquefaction LLC 4.5% 5/15/30 | 4,528,000 | 4,339,263 | |
| The Williams Companies, Inc.: | |||
| 3.5% 11/15/30 | 4,829,000 | 4,352,231 | |
| 3.7% 1/15/23 | 685,000 | 686,097 | |
| 3.9% 1/15/25 | 690,000 | 681,642 | |
| 4.3% 3/4/24 | 3,094,000 | 3,107,387 | |
| 4.5% 11/15/23 | 994,000 | 1,000,904 | |
| 4.55% 6/24/24 | 7,571,000 | 7,630,979 | |
| Transcontinental Gas Pipe Line Co. LLC: | |||
| 3.25% 5/15/30 | 577,000 | 518,170 | |
| 3.95% 5/15/50 | 1,863,000 | 1,546,369 | |
| Valero Energy Corp. 2.85% 4/15/25 | 133,000 | 128,533 | |
| Western Gas Partners LP: | |||
| 3.95% 6/1/25 | 493,000 | 465,269 | |
| 4.5% 3/1/28 | 1,136,000 | 1,028,080 | |
| 4.65% 7/1/26 | 5,141,000 | 4,845,393 | |
| 4.75% 8/15/28 | 656,000 | 599,335 | |
| 149,454,978 | |||
| TOTAL ENERGY | 150,664,616 | ||
| FINANCIALS - 15.8% | |||
| Banks - 6.5% | |||
| Bank of America Corp.: | |||
| 2.299% 7/21/32 (b) | 8,618,000 | 6,964,175 | |
| 3.3% 1/11/23 | 2,465,000 | 2,468,942 | |
| 3.419% 12/20/28 (b) | 10,766,000 | 10,025,924 | |
| 3.5% 4/19/26 | 2,852,000 | 2,778,551 | |
| 3.864% 7/23/24 (b) | 2,481,000 | 2,470,105 | |
| 3.95% 4/21/25 | 2,342,000 | 2,309,922 | |
| 4.2% 8/26/24 | 11,341,000 | 11,362,686 | |
| 4.25% 10/22/26 | 2,419,000 | 2,384,914 | |
| 4.45% 3/3/26 | 861,000 | 856,836 | |
| Barclays PLC: | |||
| 2.852% 5/7/26 (b) | 4,594,000 | 4,338,095 | |
| 4.375% 1/12/26 | 3,532,000 | 3,495,636 | |
| 5.088% 6/20/30 (b) | 4,171,000 | 3,936,996 | |
| 5.2% 5/12/26 | 3,533,000 | 3,517,921 | |
| BNP Paribas SA 2.219% 6/9/26 (a)(b) | 4,281,000 | 3,952,102 | |
| Citigroup, Inc.: | |||
| 2.7% 10/27/22 | 5,676,000 | 5,680,672 | |
| 3.352% 4/24/25 (b) | 2,815,000 | 2,757,150 | |
| 3.875% 3/26/25 | 5,393,000 | 5,317,689 | |
| 4.05% 7/30/22 | 1,022,000 | 1,022,975 | |
| 4.3% 11/20/26 | 983,000 | 968,841 | |
| 4.412% 3/31/31 (b) | 6,030,000 | 5,759,065 | |
| 4.45% 9/29/27 | 9,708,000 | 9,507,350 | |
| 4.6% 3/9/26 | 1,246,000 | 1,247,575 | |
| 4.91% 5/24/33 (b) | 5,644,000 | 5,569,079 | |
| 5.5% 9/13/25 | 3,136,000 | 3,221,822 | |
| Citizens Financial Group, Inc. 2.638% 9/30/32 | 2,757,000 | 2,199,066 | |
| Commonwealth Bank of Australia 3.61% 9/12/34 (a)(b) | 1,485,000 | 1,321,510 | |
| Credit Suisse Group Funding Guernsey Ltd. 3.8% 9/15/22 | 4,110,000 | 4,113,286 | |
| Discover Bank 4.2% 8/8/23 | 1,617,000 | 1,622,577 | |
| First Citizens Bank & Trust Co. 3.929% 6/19/24 (b) | 948,000 | 941,912 | |
| HSBC Holdings PLC: | |||
| 4.25% 3/14/24 | 1,249,000 | 1,243,058 | |
| 4.95% 3/31/30 | 988,000 | 976,111 | |
| Intesa Sanpaolo SpA: | |||
| 5.017% 6/26/24 (a) | 2,462,000 | 2,351,001 | |
| 5.71% 1/15/26 (a) | 7,296,000 | 6,949,793 | |
| JPMorgan Chase & Co.: | |||
| 2.956% 5/13/31 (b) | 2,452,000 | 2,117,017 | |
| 3.797% 7/23/24 (b) | 3,247,000 | 3,234,912 | |
| 3.875% 9/10/24 | 24,838,000 | 24,789,215 | |
| 4.125% 12/15/26 | 7,993,000 | 7,921,195 | |
| 4.493% 3/24/31 (b) | 7,267,000 | 7,097,049 | |
| NatWest Group PLC: | |||
| 3.073% 5/22/28 (b) | 2,640,000 | 2,399,894 | |
| 5.125% 5/28/24 | 11,650,000 | 11,673,834 | |
| 6% 12/19/23 | 5,923,000 | 6,028,169 | |
| 6.1% 6/10/23 | 7,589,000 | 7,686,264 | |
| 6.125% 12/15/22 | 4,677,000 | 4,697,647 | |
| NatWest Markets PLC 2.375% 5/21/23 (a) | 4,936,000 | 4,865,954 | |
| Rabobank Nederland 4.375% 8/4/25 | 4,230,000 | 4,194,495 | |
| Santander Holdings U.S.A., Inc. 2.49% 1/6/28 (b) | 3,241,000 | 2,860,477 | |
| Societe Generale: | |||
| 1.038% 6/18/25 (a)(b) | 8,981,000 | 8,399,136 | |
| 1.488% 12/14/26 (a)(b) | 5,527,000 | 4,874,966 | |
| Wells Fargo & Co.: | |||
| 2.406% 10/30/25 (b) | 2,590,000 | 2,465,689 | |
| 3.526% 3/24/28 (b) | 5,273,000 | 4,994,308 | |
| 4.478% 4/4/31 (b) | 8,118,000 | 7,939,014 | |
| 5.013% 4/4/51 (b) | 11,974,000 | 11,744,083 | |
| Westpac Banking Corp. 4.11% 7/24/34 (b) | 2,107,000 | 1,925,805 | |
| 255,542,460 | |||
| Capital Markets - 4.1% | |||
| Affiliated Managers Group, Inc.: | |||
| 3.5% 8/1/25 | 3,145,000 | 3,102,846 | |
| 4.25% 2/15/24 | 2,434,000 | 2,449,172 | |
| Ares Capital Corp.: | |||
| 3.875% 1/15/26 | 7,074,000 | 6,496,337 | |
| 4.2% 6/10/24 | 5,056,000 | 4,964,140 | |
| Credit Suisse Group AG: | |||
| 2.593% 9/11/25 (a)(b) | 6,006,000 | 5,650,594 | |
| 3.75% 3/26/25 | 2,646,000 | 2,563,018 | |
| 3.8% 6/9/23 | 4,872,000 | 4,825,742 | |
| 3.869% 1/12/29 (a)(b) | 2,282,000 | 2,050,643 | |
| 4.194% 4/1/31 (a)(b) | 5,461,000 | 4,832,107 | |
| 4.55% 4/17/26 | 1,462,000 | 1,428,905 | |
| Deutsche Bank AG 4.5% 4/1/25 | 6,790,000 | 6,464,031 | |
| Deutsche Bank AG New York Branch 3.3% 11/16/22 | 5,285,000 | 5,283,459 | |
| Goldman Sachs Group, Inc.: | |||
| 2.383% 7/21/32 (b) | 5,355,000 | 4,330,355 | |
| 3.2% 2/23/23 | 4,059,000 | 4,060,413 | |
| 3.691% 6/5/28 (b) | 23,641,000 | 22,418,339 | |
| 3.8% 3/15/30 | 8,794,000 | 8,154,411 | |
| 4.25% 10/21/25 | 1,288,000 | 1,278,056 | |
| 6.75% 10/1/37 | 1,275,000 | 1,411,963 | |
| Moody's Corp.: | |||
| 3.25% 1/15/28 | 1,354,000 | 1,281,607 | |
| 3.75% 3/24/25 | 2,881,000 | 2,878,940 | |
| 4.875% 2/15/24 | 1,272,000 | 1,296,438 | |
| Morgan Stanley: | |||
| 3.125% 1/23/23 | 14,760,000 | 14,754,918 | |
| 3.125% 7/27/26 | 12,469,000 | 11,894,745 | |
| 3.622% 4/1/31 (b) | 5,698,000 | 5,233,866 | |
| 3.625% 1/20/27 | 6,245,000 | 6,048,650 | |
| 3.737% 4/24/24 (b) | 2,838,000 | 2,828,119 | |
| 4.431% 1/23/30 (b) | 2,495,000 | 2,424,201 | |
| 4.875% 11/1/22 | 4,401,000 | 4,431,960 | |
| 5% 11/24/25 | 8,309,000 | 8,442,287 | |
| Peachtree Corners Funding Trust 3.976% 2/15/25 (a) | 2,838,000 | 2,807,502 | |
| UBS Group AG: | |||
| 1.494% 8/10/27 (a)(b) | 3,309,000 | 2,895,649 | |
| 4.125% 9/24/25 (a) | 2,986,000 | 2,962,223 | |
| 161,945,636 | |||
| Consumer Finance - 2.7% | |||
| AerCap Ireland Capital Ltd./AerCap Global Aviation Trust: | |||
| 1.65% 10/29/24 | 6,272,000 | 5,791,137 | |
| 2.45% 10/29/26 | 2,289,000 | 1,993,176 | |
| 2.875% 8/14/24 | 3,404,000 | 3,242,645 | |
| 3% 10/29/28 | 2,397,000 | 2,019,038 | |
| 3.3% 1/30/32 | 2,564,000 | 2,052,460 | |
| 3.5% 1/15/25 | 4,712,000 | 4,500,131 | |
| 4.125% 7/3/23 | 2,380,000 | 2,356,287 | |
| 4.45% 4/3/26 | 1,774,000 | 1,694,033 | |
| 4.875% 1/16/24 | 2,847,000 | 2,832,119 | |
| 6.5% 7/15/25 | 2,058,000 | 2,105,700 | |
| Ally Financial, Inc.: | |||
| 1.45% 10/2/23 | 1,254,000 | 1,212,141 | |
| 3.05% 6/5/23 | 5,468,000 | 5,409,473 | |
| 5.125% 9/30/24 | 1,214,000 | 1,225,779 | |
| 5.8% 5/1/25 | 2,973,000 | 3,036,379 | |
| 8% 11/1/31 | 1,535,000 | 1,706,405 | |
| Capital One Financial Corp.: | |||
| 2.6% 5/11/23 | 4,242,000 | 4,212,425 | |
| 2.636% 3/3/26 (b) | 2,766,000 | 2,611,575 | |
| 3.273% 3/1/30 (b) | 3,538,000 | 3,130,972 | |
| 3.65% 5/11/27 | 7,652,000 | 7,288,167 | |
| 3.8% 1/31/28 | 4,006,000 | 3,767,954 | |
| Discover Financial Services: | |||
| 3.85% 11/21/22 | 2,861,000 | 2,868,000 | |
| 3.95% 11/6/24 | 1,616,000 | 1,592,337 | |
| 4.1% 2/9/27 | 1,620,000 | 1,553,664 | |
| 4.5% 1/30/26 | 2,660,000 | 2,606,341 | |
| Ford Motor Credit Co. LLC: | |||
| 4.063% 11/1/24 | 9,996,000 | 9,483,132 | |
| 5.584% 3/18/24 | 3,546,000 | 3,528,270 | |
| Synchrony Financial: | |||
| 3.95% 12/1/27 | 4,360,000 | 3,974,554 | |
| 4.25% 8/15/24 | 3,797,000 | 3,773,423 | |
| 4.375% 3/19/24 | 3,104,000 | 3,085,104 | |
| 5.15% 3/19/29 | 4,769,000 | 4,461,697 | |
| Toyota Motor Credit Corp. 2.9% 3/30/23 | 4,399,000 | 4,399,523 | |
| 103,514,041 | |||
| Diversified Financial Services - 0.9% | |||
| Blackstone Private Credit Fund 4.7% 3/24/25 (a) | 9,007,000 | 8,652,572 | |
| Brixmor Operating Partnership LP: | |||
| 4.05% 7/1/30 | 2,875,000 | 2,594,024 | |
| 4.125% 6/15/26 | 2,638,000 | 2,575,242 | |
| 4.125% 5/15/29 | 2,868,000 | 2,671,765 | |
| Equitable Holdings, Inc.: | |||
| 3.9% 4/20/23 | 384,000 | 385,908 | |
| 4.35% 4/20/28 | 2,412,000 | 2,326,746 | |
| Jackson Financial, Inc.: | |||
| 5.17% 6/8/27 | 1,735,000 | 1,719,966 | |
| 5.67% 6/8/32 | 2,190,000 | 2,115,729 | |
| Park Aerospace Holdings Ltd. 5.5% 2/15/24 (a) | 3,463,000 | 3,434,884 | |
| Pine Street Trust I 4.572% 2/15/29 (a) | 3,240,000 | 3,129,406 | |
| Pine Street Trust II 5.568% 2/15/49 (a) | 3,236,000 | 3,170,049 | |
| 32,776,291 | |||
| Insurance - 1.6% | |||
| AIA Group Ltd.: | |||
| 3.2% 9/16/40 (a) | 1,979,000 | 1,580,855 | |
| 3.375% 4/7/30 (a) | 4,177,000 | 3,908,769 | |
| American International Group, Inc. 2.5% 6/30/25 | 6,756,000 | 6,438,789 | |
| Five Corners Funding Trust II 2.85% 5/15/30 (a) | 6,263,000 | 5,448,428 | |
| Liberty Mutual Group, Inc. 4.569% 2/1/29 (a) | 2,324,000 | 2,285,090 | |
| Marsh & McLennan Companies, Inc.: | |||
| 4.375% 3/15/29 | 2,258,000 | 2,231,616 | |
| 4.75% 3/15/39 | 1,036,000 | 1,013,643 | |
| Massachusetts Mutual Life Insurance Co. 3.729% 10/15/70 (a) | 3,298,000 | 2,404,439 | |
| MetLife, Inc. 4.55% 3/23/30 | 6,529,000 | 6,583,219 | |
| Metropolitan Life Global Funding I 3% 1/10/23 (a) | 1,496,000 | 1,495,125 | |
| Pacific LifeCorp 5.125% 1/30/43 (a) | 2,981,000 | 2,861,074 | |
| SunAmerica, Inc.: | |||
| 3.5% 4/4/25 (a) | 1,148,000 | 1,115,379 | |
| 3.65% 4/5/27 (a) | 3,963,000 | 3,725,341 | |
| 3.85% 4/5/29 (a) | 1,606,000 | 1,484,153 | |
| 3.9% 4/5/32 (a) | 1,912,000 | 1,715,295 | |
| 4.35% 4/5/42 (a) | 435,000 | 370,960 | |
| 4.4% 4/5/52 (a) | 1,286,000 | 1,072,090 | |
| Swiss Re Finance Luxembourg SA 5% 4/2/49 (a)(b) | 1,400,000 | 1,324,750 | |
| Teachers Insurance & Annuity Association of America 4.9% 9/15/44 (a) | 3,036,000 | 2,910,854 | |
| TIAA Asset Management Finance LLC 4.125% 11/1/24 (a) | 1,006,000 | 998,661 | |
| Unum Group: | |||
| 3.875% 11/5/25 | 2,759,000 | 2,711,105 | |
| 4% 3/15/24 | 3,366,000 | 3,365,144 | |
| 4% 6/15/29 | 2,503,000 | 2,358,577 | |
| 5.75% 8/15/42 | 4,132,000 | 3,862,566 | |
| 63,265,922 | |||
| TOTAL FINANCIALS | 617,044,350 | ||
| HEALTH CARE - 1.4% | |||
| Health Care Providers & Services - 1.1% | |||
| Centene Corp.: | |||
| 2.45% 7/15/28 | 5,569,000 | 4,647,943 | |
| 2.625% 8/1/31 | 2,597,000 | 2,065,914 | |
| 3.375% 2/15/30 | 2,896,000 | 2,455,953 | |
| 4.25% 12/15/27 | 3,262,000 | 3,044,979 | |
| 4.625% 12/15/29 | 5,066,000 | 4,724,045 | |
| Cigna Corp.: | |||
| 3.05% 10/15/27 | 1,816,000 | 1,706,061 | |
| 4.375% 10/15/28 | 3,443,000 | 3,416,429 | |
| 4.8% 8/15/38 | 2,144,000 | 2,085,419 | |
| 4.9% 12/15/48 | 2,141,000 | 2,055,036 | |
| CVS Health Corp.: | |||
| 3% 8/15/26 | 355,000 | 339,518 | |
| 3.625% 4/1/27 | 1,019,000 | 992,643 | |
| 4.78% 3/25/38 | 3,388,000 | 3,206,930 | |
| HCA Holdings, Inc.: | |||
| 3.5% 9/1/30 | 1,791,000 | 1,523,622 | |
| 5.625% 9/1/28 | 2,246,000 | 2,209,379 | |
| 5.875% 2/1/29 | 1,744,000 | 1,745,334 | |
| Humana, Inc. 3.7% 3/23/29 | 1,508,000 | 1,427,540 | |
| Sabra Health Care LP 3.2% 12/1/31 | 5,311,000 | 4,214,892 | |
| Toledo Hospital 5.325% 11/15/28 | 1,197,000 | 1,131,870 | |
| 42,993,507 | |||
| Pharmaceuticals - 0.3% | |||
| Bayer U.S. Finance II LLC 4.25% 12/15/25 (a) | 2,477,000 | 2,444,642 | |
| Elanco Animal Health, Inc. 6.4% 8/28/28 (b) | 757,000 | 720,588 | |
| Mylan NV 4.55% 4/15/28 | 2,271,000 | 2,164,936 | |
| Utah Acquisition Sub, Inc. 3.95% 6/15/26 | 1,447,000 | 1,363,208 | |
| Viatris, Inc.: | |||
| 1.65% 6/22/25 | 558,000 | 505,134 | |
| 2.7% 6/22/30 | 2,837,000 | 2,276,866 | |
| 3.85% 6/22/40 | 1,236,000 | 875,466 | |
| 4% 6/22/50 | 2,134,000 | 1,428,899 | |
| Zoetis, Inc. 3.25% 2/1/23 | 936,000 | 932,681 | |
| 12,712,420 | |||
| TOTAL HEALTH CARE | 55,705,927 | ||
| INDUSTRIALS - 0.7% | |||
| Aerospace & Defense - 0.2% | |||
| BAE Systems PLC 3.4% 4/15/30 (a) | 1,287,000 | 1,174,840 | |
| The Boeing Co.: | |||
| 5.04% 5/1/27 | 1,681,000 | 1,660,439 | |
| 5.15% 5/1/30 | 1,681,000 | 1,613,555 | |
| 5.705% 5/1/40 | 1,703,000 | 1,588,501 | |
| 5.805% 5/1/50 | 1,703,000 | 1,564,157 | |
| 5.93% 5/1/60 | 1,680,000 | 1,529,505 | |
| 9,130,997 | |||
| Professional Services - 0.0% | |||
| Thomson Reuters Corp. 3.85% 9/29/24 | 587,000 | 582,753 | |
| Trading Companies & Distributors - 0.3% | |||
| Air Lease Corp.: | |||
| 2.25% 1/15/23 | 753,000 | 745,351 | |
| 3% 9/15/23 | 498,000 | 486,859 | |
| 3.375% 7/1/25 | 3,659,000 | 3,445,598 | |
| 3.875% 7/3/23 | 3,168,000 | 3,140,032 | |
| 4.25% 2/1/24 | 3,258,000 | 3,218,584 | |
| 4.25% 9/15/24 | 2,024,000 | 1,986,079 | |
| 13,022,503 | |||
| Transportation Infrastructure - 0.2% | |||
| Avolon Holdings Funding Ltd.: | |||
| 3.95% 7/1/24 (a) | 1,186,000 | 1,135,506 | |
| 4.25% 4/15/26 (a) | 897,000 | 830,664 | |
| 4.375% 5/1/26 (a) | 2,653,000 | 2,457,686 | |
| 5.25% 5/15/24 (a) | 2,164,000 | 2,126,058 | |
| 6,549,914 | |||
| TOTAL INDUSTRIALS | 29,286,167 | ||
| INFORMATION TECHNOLOGY - 1.1% | |||
| Electronic Equipment & Components - 0.1% | |||
| Dell International LLC/EMC Corp.: | |||
| 5.45% 6/15/23 | 983,000 | 992,932 | |
| 5.85% 7/15/25 | 735,000 | 758,010 | |
| 6.02% 6/15/26 | 888,000 | 921,706 | |
| 6.1% 7/15/27 | 1,349,000 | 1,414,369 | |
| 6.2% 7/15/30 | 1,167,000 | 1,214,492 | |
| 5,301,509 | |||
| Semiconductors & Semiconductor Equipment - 0.5% | |||
| Broadcom, Inc.: | |||
| 1.95% 2/15/28 (a) | 944,000 | 803,804 | |
| 2.45% 2/15/31 (a) | 8,034,000 | 6,454,825 | |
| 2.6% 2/15/33 (a) | 8,034,000 | 6,177,406 | |
| 3.5% 2/15/41 (a) | 6,488,000 | 4,892,729 | |
| 3.75% 2/15/51 (a) | 3,045,000 | 2,255,938 | |
| 20,584,702 | |||
| Software - 0.5% | |||
| Oracle Corp.: | |||
| 1.65% 3/25/26 | 3,687,000 | 3,302,662 | |
| 2.3% 3/25/28 | 5,824,000 | 5,010,913 | |
| 2.8% 4/1/27 | 3,325,000 | 3,032,425 | |
| 2.875% 3/25/31 | 6,114,000 | 5,037,403 | |
| 3.6% 4/1/40 | 3,327,000 | 2,486,267 | |
| 18,869,670 | |||
| TOTAL INFORMATION TECHNOLOGY | 44,755,881 | ||
| REAL ESTATE - 3.1% | |||
| Equity Real Estate Investment Trusts (REITs) - 2.6% | |||
| Alexandria Real Estate Equities, Inc. 4.9% 12/15/30 | 2,366,000 | 2,348,415 | |
| American Homes 4 Rent LP: | |||
| 2.375% 7/15/31 | 427,000 | 340,484 | |
| 3.625% 4/15/32 | 1,758,000 | 1,541,042 | |
| Boston Properties, Inc.: | |||
| 3.25% 1/30/31 | 2,203,000 | 1,889,526 | |
| 4.5% 12/1/28 | 2,209,000 | 2,147,707 | |
| Corporate Office Properties LP: | |||
| 2.25% 3/15/26 | 945,000 | 856,473 | |
| 2.75% 4/15/31 | 689,000 | 557,078 | |
| Healthcare Trust of America Holdings LP: | |||
| 3.1% 2/15/30 | 745,000 | 641,897 | |
| 3.5% 8/1/26 | 775,000 | 737,492 | |
| Healthpeak Properties, Inc.: | |||
| 3.25% 7/15/26 | 325,000 | 312,892 | |
| 3.5% 7/15/29 | 373,000 | 343,822 | |
| Hudson Pacific Properties LP 4.65% 4/1/29 | 4,395,000 | 4,217,402 | |
| Invitation Homes Operating Partnership LP 4.15% 4/15/32 | 2,644,000 | 2,400,574 | |
| Kimco Realty Corp. 3.375% 10/15/22 | 461,000 | 461,072 | |
| Kite Realty Group Trust: | |||
| 4% 3/15/25 | 3,537,000 | 3,463,768 | |
| 4.75% 9/15/30 | 5,514,000 | 5,133,483 | |
| LXP Industrial Trust (REIT): | |||
| 2.7% 9/15/30 | 1,037,000 | 851,168 | |
| 4.4% 6/15/24 | 818,000 | 814,587 | |
| Omega Healthcare Investors, Inc.: | |||
| 3.25% 4/15/33 | 3,556,000 | 2,693,024 | |
| 3.375% 2/1/31 | 1,901,000 | 1,543,526 | |
| 3.625% 10/1/29 | 3,357,000 | 2,848,931 | |
| 4.375% 8/1/23 | 704,000 | 706,165 | |
| 4.5% 1/15/25 | 1,520,000 | 1,506,482 | |
| 4.5% 4/1/27 | 9,194,000 | 8,715,780 | |
| 4.75% 1/15/28 | 3,623,000 | 3,432,245 | |
| 4.95% 4/1/24 | 769,000 | 771,629 | |
| 5.25% 1/15/26 | 3,228,000 | 3,196,277 | |
| Piedmont Operating Partnership LP 2.75% 4/1/32 | 834,000 | 644,300 | |
| Realty Income Corp.: | |||
| 2.2% 6/15/28 | 453,000 | 397,201 | |
| 2.85% 12/15/32 | 556,000 | 477,904 | |
| 3.25% 1/15/31 | 579,000 | 526,352 | |
| 3.4% 1/15/28 | 904,000 | 853,972 | |
| Retail Opportunity Investments Partnership LP: | |||
| 4% 12/15/24 | 555,000 | 539,467 | |
| 5% 12/15/23 | 418,000 | 420,656 | |
| Simon Property Group LP 2.45% 9/13/29 | 924,000 | 785,005 | |
| SITE Centers Corp.: | |||
| 3.625% 2/1/25 | 1,284,000 | 1,247,985 | |
| 4.25% 2/1/26 | 1,677,000 | 1,646,971 | |
| Store Capital Corp.: | |||
| 2.75% 11/18/30 | 4,952,000 | 4,035,867 | |
| 4.625% 3/15/29 | 1,018,000 | 993,218 | |
| Sun Communities Operating LP: | |||
| 2.3% 11/1/28 | 948,000 | 810,928 | |
| 2.7% 7/15/31 | 2,448,000 | 1,972,762 | |
| Ventas Realty LP: | |||
| 3% 1/15/30 | 4,331,000 | 3,789,278 | |
| 3.5% 2/1/25 | 3,658,000 | 3,568,359 | |
| 4% 3/1/28 | 1,273,000 | 1,215,609 | |
| 4.125% 1/15/26 | 884,000 | 874,512 | |
| 4.375% 2/1/45 | 433,000 | 369,169 | |
| 4.75% 11/15/30 | 5,686,000 | 5,561,261 | |
| VICI Properties LP: | |||
| 4.375% 5/15/25 | 446,000 | 435,599 | |
| 4.75% 2/15/28 | 3,531,000 | 3,370,234 | |
| 4.95% 2/15/30 | 4,599,000 | 4,358,518 | |
| 5.125% 5/15/32 | 481,000 | 453,266 | |
| Vornado Realty LP 2.15% 6/1/26 | 1,069,000 | 952,346 | |
| WP Carey, Inc.: | |||
| 2.4% 2/1/31 | 2,157,000 | 1,761,637 | |
| 3.85% 7/15/29 | 724,000 | 673,997 | |
| 4% 2/1/25 | 3,043,000 | 3,022,596 | |
| 100,231,910 | |||
| Real Estate Management & Development - 0.5% | |||
| Brandywine Operating Partnership LP: | |||
| 3.95% 2/15/23 | 3,128,000 | 3,120,437 | |
| 3.95% 11/15/27 | 2,619,000 | 2,470,420 | |
| 4.1% 10/1/24 | 2,878,000 | 2,850,416 | |
| 4.55% 10/1/29 | 3,316,000 | 3,162,894 | |
| CBRE Group, Inc. 2.5% 4/1/31 | 3,160,000 | 2,570,808 | |
| Post Apartment Homes LP 3.375% 12/1/22 | 224,000 | 224,068 | |
| Tanger Properties LP: | |||
| 2.75% 9/1/31 | 2,490,000 | 1,949,010 | |
| 3.125% 9/1/26 | 3,468,000 | 3,255,161 | |
| 19,603,214 | |||
| TOTAL REAL ESTATE | 119,835,124 | ||
| UTILITIES - 1.5% | |||
| Electric Utilities - 0.8% | |||
| Alabama Power Co. 3.05% 3/15/32 | 3,742,000 | 3,418,989 | |
| Cleco Corporate Holdings LLC: | |||
| 3.375% 9/15/29 | 1,957,000 | 1,746,112 | |
| 3.743% 5/1/26 | 7,482,000 | 7,217,783 | |
| Duke Energy Corp. 2.45% 6/1/30 | 1,580,000 | 1,331,759 | |
| Duquesne Light Holdings, Inc.: | |||
| 2.532% 10/1/30 (a) | 750,000 | 616,218 | |
| 2.775% 1/7/32 (a) | 2,595,000 | 2,126,640 | |
| Entergy Corp. 2.8% 6/15/30 | 1,621,000 | 1,390,275 | |
| Eversource Energy 2.8% 5/1/23 | 2,901,000 | 2,883,005 | |
| Exelon Corp.: | |||
| 2.75% 3/15/27 (a) | 829,000 | 774,938 | |
| 3.35% 3/15/32 (a) | 1,006,000 | 901,644 | |
| 4.05% 4/15/30 | 988,000 | 948,070 | |
| 4.1% 3/15/52 (a) | 745,000 | 642,245 | |
| 4.7% 4/15/50 | 440,000 | 412,280 | |
| FirstEnergy Corp. 7.375% 11/15/31 | 3,045,000 | 3,418,013 | |
| IPALCO Enterprises, Inc. 3.7% 9/1/24 | 1,224,000 | 1,210,243 | |
| 29,038,214 | |||
| Gas Utilities - 0.0% | |||
| Nakilat, Inc. 6.067% 12/31/33 (a) | 944,005 | 1,002,888 | |
| Independent Power and Renewable Electricity Producers - 0.2% | |||
| Emera U.S. Finance LP 3.55% 6/15/26 | 1,074,000 | 1,027,901 | |
| The AES Corp.: | |||
| 3.3% 7/15/25 (a) | 4,877,000 | 4,574,528 | |
| 3.95% 7/15/30 (a) | 4,253,000 | 3,834,930 | |
| 9,437,359 | |||
| Multi-Utilities - 0.5% | |||
| Berkshire Hathaway Energy Co. 4.05% 4/15/25 | 7,058,000 | 7,101,121 | |
| Consolidated Edison Co. of New York, Inc. 3.35% 4/1/30 | 449,000 | 418,275 | |
| NiSource, Inc. 2.95% 9/1/29 | 4,856,000 | 4,301,230 | |
| Puget Energy, Inc.: | |||
| 4.1% 6/15/30 | 1,909,000 | 1,774,374 | |
| 4.224% 3/15/32 | 3,417,000 | 3,150,009 | |
| WEC Energy Group, Inc. 3 month U.S. LIBOR + 2.610% 3.5238% 5/15/67 (b)(c) | 810,000 | 625,263 | |
| 17,370,272 | |||
| TOTAL UTILITIES | 56,848,733 | ||
| TOTAL NONCONVERTIBLE BONDS | |||
| (Cost $1,513,122,998) | 1,316,136,261 | ||
| U.S. Treasury Obligations - 34.8% | |||
| U.S. Treasury Bonds: | |||
| 1.125% 5/15/40 | $22,865,200 | $15,916,323 | |
| 1.75% 8/15/41 | 80,591,100 | 61,302,753 | |
| 1.875% 11/15/51 | 50,329,100 | 37,762,553 | |
| 2% 11/15/41 (d)(e) | 13,838,700 | 10,990,955 | |
| 2% 8/15/51 | 207,221,400 | 160,151,382 | |
| 2.25% 2/15/52 (f) | 38,732,200 | 31,875,390 | |
| 2.875% 5/15/52 | 20,900,000 | 19,740,703 | |
| 3% 2/15/47 | 55,093,200 | 51,445,427 | |
| U.S. Treasury Notes: | |||
| 0.125% 8/31/23 | 65,171,800 | 63,051,171 | |
| 0.25% 5/15/24 | 12,652,300 | 12,025,122 | |
| 0.25% 7/31/25 | 170,707,100 | 156,737,124 | |
| 0.75% 3/31/26 | 75,087,100 | 68,965,741 | |
| 0.75% 8/31/26 | 28,384,900 | 25,836,912 | |
| 0.875% 9/30/26 | 17,031,000 | 15,554,093 | |
| 1.125% 10/31/26 | 34,061,900 | 31,396,822 | |
| 1.125% 8/31/28 | 70,526,300 | 62,765,652 | |
| 1.125% 2/15/31 | 49,686,200 | 42,695,197 | |
| 1.25% 5/31/28 | 229,752,000 | 206,956,286 | |
| 1.25% 9/30/28 | 15,938,200 | 14,275,273 | |
| 1.375% 11/15/31 | 90,236,400 | 78,265,978 | |
| 1.5% 1/31/27 | 5,077,000 | 4,740,252 | |
| 1.5% 11/30/28 (d)(e) | 1,637,700 | 1,487,108 | |
| 1.625% 9/30/26 | 58,426,000 | 55,114,432 | |
| 1.75% 1/31/29 | 27,595,700 | 25,443,020 | |
| 2.25% 4/30/24 | 32,959,200 | 32,529,185 | |
| 2.75% 4/30/27 | 43,645,400 | 43,055,505 | |
| 2.875% 5/15/32 (f) | 32,200,000 | 31,837,750 | |
| TOTAL U.S. TREASURY OBLIGATIONS | |||
| (Cost $1,556,384,680) | 1,361,918,109 | ||
| U.S. Government Agency - Mortgage Securities - 21.1% | |||
| Fannie Mae - 6.2% | |||
| 12 month U.S. LIBOR + 1.480% 1.855% 7/1/34 (b)(c) | 4,097 | 4,196 | |
| 12 month U.S. LIBOR + 1.550% 1.803% 6/1/36 (b)(c) | 4,208 | 4,338 | |
| 12 month U.S. LIBOR + 1.630% 2.24% 11/1/36 (b)(c) | 54,039 | 55,299 | |
| 12 month U.S. LIBOR + 1.700% 3.183% 6/1/42 (b)(c) | 32,855 | 33,865 | |
| 12 month U.S. LIBOR + 1.730% 3.105% 5/1/36 (b)(c) | 32,807 | 33,750 | |
| 12 month U.S. LIBOR + 1.750% 2.281% 7/1/35 (b)(c) | 3,680 | 3,752 | |
| 12 month U.S. LIBOR + 1.780% 2.163% 2/1/36 (b)(c) | 21,764 | 22,200 | |
| 12 month U.S. LIBOR + 1.800% 2.05% 7/1/41 (b)(c) | 21,780 | 22,518 | |
| 12 month U.S. LIBOR + 1.810% 2.068% 9/1/41 (b)(c) | 11,460 | 11,836 | |
| 12 month U.S. LIBOR + 1.810% 2.245% 7/1/41 (b)(c) | 27,699 | 28,743 | |
| 12 month U.S. LIBOR + 1.820% 2.195% 12/1/35 (b)(c) | 13,241 | 13,565 | |
| 12 month U.S. LIBOR + 1.830% 2.08% 10/1/41 (b)(c) | 10,620 | 10,744 | |
| 12 month U.S. LIBOR + 1.950% 2.401% 9/1/36 (b)(c) | 24,359 | 24,862 | |
| 12 month U.S. LIBOR + 1.950% 3.496% 7/1/37 (b)(c) | 9,164 | 9,499 | |
| 6 month U.S. LIBOR + 1.310% 2.438% 5/1/34 (b)(c) | 20,510 | 20,843 | |
| 6 month U.S. LIBOR + 1.420% 1.571% 9/1/33 (b)(c) | 35,140 | 35,580 | |
| 6 month U.S. LIBOR + 1.550% 2.002% 10/1/33 (b)(c) | 2,563 | 2,633 | |
| 6 month U.S. LIBOR + 1.560% 1.815% 7/1/35 (b)(c) | 3,867 | 3,994 | |
| U.S. TREASURY 1 YEAR INDEX + 1.940% 1.87% 10/1/33 (b)(c) | 43,443 | 45,130 | |
| U.S. TREASURY 1 YEAR INDEX + 2.200% 2.583% 3/1/35 (b)(c) | 3,224 | 3,333 | |
| U.S. TREASURY 1 YEAR INDEX + 2.220% 2.571% 8/1/36 (b)(c) | 45,374 | 46,967 | |
| U.S. TREASURY 1 YEAR INDEX + 2.280% 2.408% 10/1/33 (b)(c) | 6,498 | 6,734 | |
| U.S. TREASURY 1 YEAR INDEX + 2.420% 2.75% 5/1/35 (b)(c) | 9,777 | 10,121 | |
| 1.5% 11/1/40 to 11/1/41 (e) | 5,160,160 | 4,439,847 | |
| 2% 12/1/36 to 3/1/52 | 56,554,878 | 49,454,547 | |
| 2.5% 7/1/31 to 3/1/52 | 55,680,138 | 50,885,802 | |
| 3% 8/1/32 to 5/1/52 (e) | 54,876,179 | 52,039,731 | |
| 3.5% 8/1/37 to 4/1/52 (d)(e) | 49,381,688 | 48,058,368 | |
| 4% 7/1/39 to 11/1/49 | 19,101,729 | 19,186,247 | |
| 4.5% to 4.5% 5/1/25 to 7/1/52 | 15,774,826 | 16,167,323 | |
| 5% 3/1/23 to 5/1/44 | 520,026 | 544,639 | |
| 6% 10/1/34 to 1/1/42 | 1,984,668 | 2,160,875 | |
| 6.5% 12/1/23 to 8/1/36 | 363,943 | 396,946 | |
| 7% to 7% 11/1/23 to 8/1/32 | 58,084 | 61,432 | |
| 7.5% to 7.5% 9/1/22 to 11/1/31 | 70,033 | 75,577 | |
| 8% 1/1/30 | 239 | 263 | |
| 8.5% 3/1/25 | 48 | 51 | |
| TOTAL FANNIE MAE | 243,926,150 | ||
| Freddie Mac - 3.8% | |||
| 12 month U.S. LIBOR + 1.370% 1.684% 3/1/36 (b)(c) | 30,365 | 30,647 | |
| 12 month U.S. LIBOR + 1.880% 2.13% 9/1/41 (b)(c) | 16,444 | 16,888 | |
| 12 month U.S. LIBOR + 1.880% 3.255% 4/1/41 (b)(c) | 4,131 | 4,251 | |
| 12 month U.S. LIBOR + 1.910% 2.16% 6/1/41 (b)(c) | 10,992 | 11,401 | |
| 12 month U.S. LIBOR + 1.910% 3.131% 6/1/41 (b)(c) | 42,954 | 44,438 | |
| 12 month U.S. LIBOR + 1.910% 3.22% 5/1/41 (b)(c) | 32,973 | 33,945 | |
| 12 month U.S. LIBOR + 1.910% 3.568% 5/1/41 (b)(c) | 34,595 | 35,741 | |
| 12 month U.S. LIBOR + 2.030% 2.271% 3/1/33 (b)(c) | 474 | 484 | |
| 12 month U.S. LIBOR + 2.160% 2.41% 11/1/35 (b)(c) | 8,235 | 8,414 | |
| 6 month U.S. LIBOR + 1.650% 2.184% 4/1/35 (b)(c) | 27,765 | 28,521 | |
| 6 month U.S. LIBOR + 2.680% 3.239% 10/1/35 (b)(c) | 5,617 | 5,836 | |
| U.S. TREASURY 1 YEAR INDEX + 2.240% 2.372% 1/1/35 (b)(c) | 3,548 | 3,661 | |
| 1.5% 12/1/40 to 4/1/41 | 856,081 | 738,144 | |
| 2% 4/1/41 to 4/1/52 (e) | 42,779,785 | 37,303,180 | |
| 2.5% 8/1/32 to 2/1/52 (d) | 37,214,845 | 33,829,268 | |
| 3% 6/1/31 to 2/1/52 | 18,625,483 | 17,653,641 | |
| 3.5% 3/1/32 to 3/1/52 (e) | 35,188,952 | 34,618,690 | |
| 4% 5/1/37 to 6/1/48 | 14,109,797 | 14,235,698 | |
| 4.5% 7/1/25 to 10/1/48 | 8,379,507 | 8,621,175 | |
| 5% 1/1/40 to 6/1/41 | 703,303 | 739,462 | |
| 6% 4/1/32 to 8/1/37 | 204,626 | 220,477 | |
| 7.5% 8/1/26 to 11/1/31 | 8,130 | 8,920 | |
| 8% 4/1/27 to 5/1/27 | 712 | 761 | |
| 8.5% 5/1/27 to 1/1/28 | 1,277 | 1,363 | |
| TOTAL FREDDIE MAC | 148,195,006 | ||
| Ginnie Mae - 4.6% | |||
| 3% 12/20/42 to 10/20/51 | 14,039,137 | 13,338,331 | |
| 3.5% 12/20/40 to 6/20/50 | 13,215,548 | 12,937,482 | |
| 4% 2/15/40 to 4/20/48 | 13,019,066 | 13,123,613 | |
| 4.5% 5/15/39 to 5/20/41 | 2,595,530 | 2,679,831 | |
| 5% 3/15/39 to 4/20/48 | 1,523,002 | 1,601,974 | |
| 6.5% 4/15/35 to 11/15/35 | 29,021 | 31,740 | |
| 7% 1/15/28 to 7/15/32 | 199,783 | 214,843 | |
| 7.5% to 7.5% 10/15/22 to 10/15/28 | 35,888 | 38,068 | |
| 8% 3/15/30 to 9/15/30 | 4,220 | 4,624 | |
| 2% 7/1/52 (g) | 16,650,000 | 14,782,644 | |
| 2% 7/1/52 (g) | 4,000,000 | 3,551,386 | |
| 2% 7/1/52 (g) | 4,000,000 | 3,551,386 | |
| 2% 7/1/52 (g) | 4,025,000 | 3,573,582 | |
| 2% 7/1/52 (g) | 8,050,000 | 7,147,164 | |
| 2% 7/1/52 (g) | 2,400,000 | 2,130,832 | |
| 2% 7/1/52 (g) | 2,400,000 | 2,130,832 | |
| 2% 7/1/52 (g) | 4,850,000 | 4,306,056 | |
| 2% 7/1/52 (g) | 1,025,000 | 910,043 | |
| 2% 7/1/52 (g) | 1,300,000 | 1,154,200 | |
| 2% 7/1/52 (g) | 6,750,000 | 5,992,964 | |
| 2% 8/1/52 (g) | 17,950,000 | 15,920,717 | |
| 2% 8/1/52 (g) | 4,600,000 | 4,079,961 | |
| 2% 8/1/52 (g) | 6,750,000 | 5,986,899 | |
| 2.5% 12/20/51 | 158,317 | 145,235 | |
| 2.5% 7/1/52 (g) | 7,350,000 | 6,722,421 | |
| 2.5% 7/1/52 (g) | 9,200,000 | 8,414,459 | |
| 2.5% 7/1/52 (g) | 4,600,000 | 4,207,229 | |
| 2.5% 7/1/52 (g) | 4,400,000 | 4,024,306 | |
| 2.5% 7/1/52 (g) | 2,850,000 | 2,606,653 | |
| 2.5% 7/1/52 (g) | 6,050,000 | 5,533,421 | |
| 2.5% 7/1/52 (g) | 3,450,000 | 3,155,422 | |
| 2.5% 7/1/52 (g) | 2,300,000 | 2,103,615 | |
| 3% 7/1/52 (g) | 8,500,000 | 8,008,923 | |
| 3% 7/1/52 (g) | 3,400,000 | 3,203,569 | |
| 3% 7/1/52 (g) | 3,500,000 | 3,297,792 | |
| 3.5% 7/1/52 (g) | 2,150,000 | 2,088,181 | |
| 5% 7/1/52 (g) | 7,400,000 | 7,580,429 | |
| TOTAL GINNIE MAE | 180,280,827 | ||
| Uniform Mortgage Backed Securities - 6.5% | |||
| 1.5% 7/1/37 (g) | 3,100,000 | 2,820,676 | |
| 1.5% 7/1/52 (g) | 3,650,000 | 3,026,821 | |
| 1.5% 7/1/52 (g) | 10,000,000 | 8,292,660 | |
| 1.5% 7/1/52 (g) | 6,050,000 | 5,017,059 | |
| 1.5% 7/1/52 (g) | 3,650,000 | 3,026,821 | |
| 2% 7/1/37 (g) | 7,800,000 | 7,280,114 | |
| 2% 7/1/37 (g) | 3,800,000 | 3,546,722 | |
| 2% 7/1/37 (g) | 5,750,000 | 5,366,751 | |
| 2% 7/1/52 (g) | 12,850,000 | 11,150,187 | |
| 2% 7/1/52 (g) | 2,250,000 | 1,952,367 | |
| 2% 7/1/52 (g) | 1,200,000 | 1,041,263 | |
| 2% 7/1/52 (g) | 7,050,000 | 6,117,418 | |
| 2% 7/1/52 (g) | 6,750,000 | 5,857,102 | |
| 2% 7/1/52 (g) | 4,400,000 | 3,817,963 | |
| 2% 7/1/52 (g) | 3,650,000 | 3,167,174 | |
| 2% 7/1/52 (g) | 2,750,000 | 2,386,227 | |
| 2% 7/1/52 (g) | 2,650,000 | 2,299,455 | |
| 2% 7/1/52 (g) | 12,100,000 | 10,499,397 | |
| 2% 8/1/52 (g) | 8,750,000 | 7,583,652 | |
| 2% 8/1/52 (g) | 7,850,000 | 6,803,619 | |
| 2% 8/1/52 (g) | 6,900,000 | 5,980,251 | |
| 2% 8/1/52 (g) | 5,550,000 | 4,810,202 | |
| 2.5% 7/1/37 (g) | 2,300,000 | 2,195,600 | |
| 2.5% 7/1/52 (g) | 19,050,000 | 17,121,178 | |
| 2.5% 7/1/52 (g) | 6,100,000 | 5,482,372 | |
| 2.5% 7/1/52 (g) | 7,800,000 | 7,010,246 | |
| 2.5% 7/1/52 (g) | 3,150,000 | 2,831,061 | |
| 2.5% 7/1/52 (g) | 15,550,000 | 13,975,555 | |
| 2.5% 8/1/52 (g) | 10,700,000 | 9,604,080 | |
| 2.5% 8/1/52 (g) | 4,850,000 | 4,353,251 | |
| 3% 7/1/52 (g) | 8,050,000 | 7,492,155 | |
| 3% 7/1/52 (g) | 1,950,000 | 1,814,870 | |
| 3% 7/1/52 (g) | 3,300,000 | 3,071,318 | |
| 3% 8/1/52 (g) | 4,800,000 | 4,461,747 | |
| 3.5% 7/1/52 (g) | 3,000,000 | 2,884,100 | |
| 3.5% 7/1/52 (g) | 475,000 | 456,649 | |
| 4% 7/1/52 (g) | 6,400,000 | 6,308,997 | |
| 4% 7/1/52 (g) | 3,500,000 | 3,450,233 | |
| 4% 7/1/52 (g) | 7,100,000 | 6,999,044 | |
| 4.5% 7/1/52 (g) | 7,900,000 | 7,929,009 | |
| 4.5% 7/1/52 (g) | 8,800,000 | 8,832,314 | |
| 5% 7/1/52 (g) | 7,400,000 | 7,549,154 | |
| 5% 7/1/52 (g) | 400,000 | 408,062 | |
| 5% 7/1/52 (g) | 10,900,000 | 11,119,700 | |
| 5% 8/1/52 (g) | 2,700,000 | 2,746,300 | |
| 5.5% 8/1/52 (g) | 1,700,000 | 1,746,967 | |
| 5.5% 8/1/52 (g) | 1,000,000 | 1,027,628 | |
| 5.5% 9/1/52 (g) | 3,300,000 | 3,376,733 | |
| TOTAL UNIFORM MORTGAGE BACKED SECURITIES | 256,092,224 | ||
| TOTAL U.S. GOVERNMENT AGENCY - MORTGAGE SECURITIES | |||
| (Cost $872,587,470) | 828,494,207 | ||
| Asset-Backed Securities - 6.6% | |||
| AASET Trust: | |||
| Series 2018-1A Class A, 3.844% 1/16/38 (a) | $1,590,193 | $1,070,816 | |
| Series 2019-1 Class A, 3.844% 5/15/39 (a) | 1,516,406 | 1,041,941 | |
| Series 2019-2: | |||
| Class A, 3.376% 10/16/39 (a) | 3,027,023 | 2,301,510 | |
| Class B, 4.458% 10/16/39 (a) | 713,637 | 453,439 | |
| Series 2021-1A Class A, 2.95% 11/16/41 (a) | 3,496,400 | 2,928,180 | |
| Series 2021-2A Class A, 2.798% 1/15/47 (a) | 6,480,508 | 5,534,716 | |
| Aimco Series 2021-BA Class AR, 3 month U.S. LIBOR + 1.100% 2.1443% 1/15/32 (a)(b)(c) | 1,196,595 | 1,164,684 | |
| AIMCO CLO Ltd. Series 2021-11A Class AR, 3 month U.S. LIBOR + 1.130% 2.1743% 10/17/34 (a)(b)(c) | 2,370,709 | 2,278,799 | |
| AIMCO CLO Ltd. / AIMCO CLO LLC Series 2021-14A Class A, 3 month U.S. LIBOR + 0.990% 2.0527% 4/20/34 (a)(b)(c) | 5,797,905 | 5,536,170 | |
| Allegro CLO XV, Ltd. / Allegro CLO VX LLC Series 2022-1A Class A, CME TERM SOFR 3 MONTH INDEX + 1.500% 3.1807% 7/20/35 (a)(b)(c) | 3,019,149 | 2,942,323 | |
| Allegro CLO, Ltd. Series 2021-1A Class A, 3 month U.S. LIBOR + 1.140% 2.2027% 7/20/34 (a)(b)(c) | 2,835,654 | 2,727,959 | |
| Apollo Aviation Securitization Equity Trust Series 2020-1A: | |||
| Class A, 3.351% 1/16/40 (a) | 934,777 | 784,072 | |
| Class B, 4.335% 1/16/40 (a) | 309,333 | 135,345 | |
| Ares CLO Series 2019-54A Class A, 3 month U.S. LIBOR + 1.320% 2.3643% 10/15/32 (a)(b)(c) | 3,103,607 | 3,031,551 | |
| Ares LIX CLO Ltd. Series 2021-59A Class A, 3 month U.S. LIBOR + 1.030% 2.214% 4/25/34 (a)(b)(c) | 1,923,930 | 1,847,721 | |
| Ares LV CLO Ltd. Series 2021-55A Class A1R, 3 month U.S. LIBOR + 1.130% 2.1743% 7/15/34 (a)(b)(c) | 3,574,230 | 3,461,921 | |
| Ares LVIII CLO LLC Series 2022-58A Class AR, U.S. 90-Day Avg. Secured Overnight Fin. Rate (SOFR) Indx + 1.330% 2.1764% 1/15/35 (a)(b)(c) | 4,768,241 | 4,571,129 | |
| Ares XLI CLO Ltd. / Ares XLI CLO LLC Series 2021-41A Class AR2, 3 month U.S. LIBOR + 1.070% 2.1143% 4/15/34 (a)(b)(c) | 4,022,144 | 3,871,458 | |
| Ares XXXIV CLO Ltd. Series 2020-2A Class AR2, 3 month U.S. LIBOR + 1.250% 2.2943% 4/17/33 (a)(b)(c) | 1,232,474 | 1,201,804 | |
| Babson CLO Ltd. Series 2021-1A Class AR, 3 month U.S. LIBOR + 1.150% 2.1943% 10/15/36 (a)(b)(c) | 2,392,281 | 2,309,030 | |
| Barings CLO Ltd.: | |||
| Series 2021-1A Class A, 3 month U.S. LIBOR + 1.020% 2.204% 4/25/34 (a)(b)(c) | 4,224,812 | 4,072,731 | |
| Series 2021-4A Class A, 3 month U.S. LIBOR + 1.220% 2.2827% 1/20/32 (a)(b)(c) | 3,831,965 | 3,750,609 | |
| Beechwood Park CLO Ltd. Series 2022-1A Class A1R, CME TERM SOFR 3 MONTH INDEX + 1.300% 2.1464% 1/17/35 (a)(b)(c) | 4,846,852 | 4,676,341 | |
| BETHP Series 2021-1A Class A, 3 month U.S. LIBOR + 1.130% 2.1743% 1/15/35 (a)(b)(c) | 3,615,104 | 3,481,269 | |
| Blackbird Capital Aircraft: | |||
| Series 2016-1A: | |||
| Class A, 4.213% 12/16/41 (a) | 3,766,525 | 3,328,305 | |
| Class AA, 2.487% 12/16/41 (a)(b) | 455,234 | 425,100 | |
| Series 2021-1A Class A, 2.443% 7/15/46 (a) | 4,723,099 | 4,042,911 | |
| Bristol Park CLO, Ltd. Series 2020-1A Class AR, 3 month U.S. LIBOR + 0.990% 2.0343% 4/15/29 (a)(b)(c) | 3,671,912 | 3,614,704 | |
| Castlelake Aircraft Securitization Trust Series 2019-1A: | |||
| Class A, 3.967% 4/15/39 (a) | 2,320,742 | 2,047,263 | |
| Class B, 5.095% 4/15/39 (a) | 1,232,658 | 976,375 | |
| Castlelake Aircraft Structured Trust: | |||
| Series 2018-1 Class A, 4.125% 6/15/43 (a) | 1,696,866 | 1,525,058 | |
| Series 2021-1A Class A, 3.474% 1/15/46 (a) | 978,611 | 871,638 | |
| Cedar Funding Ltd.: | |||
| Series 2021-10A Class AR, 3 month U.S. LIBOR + 1.100% 2.1627% 10/20/32 (a)(b)(c) | 2,890,154 | 2,804,525 | |
| Series 2022-15A Class A, CME TERM SOFR 3 MONTH INDEX + 1.320% 2.0327% 4/20/35 (a)(b)(c) | 4,498,016 | 4,303,903 | |
| Cedar Funding XII CLO Ltd. / Cedar Funding XII CLO LLC Series 2021-12A Class A1R, 3 month U.S. LIBOR + 1.130% 2.314% 10/25/34 (a)(b)(c) | 2,218,566 | 2,134,462 | |
| CEDF Series 2021-6A Class ARR, 3 month U.S. LIBOR + 1.050% 2.1127% 4/20/34 (a)(b)(c) | 3,494,185 | 3,342,331 | |
| Cent CLO Ltd. / Cent CLO Series 2021-29A Class AR, 3 month U.S. LIBOR + 1.170% 2.2327% 10/20/34 (a)(b)(c) | 3,598,073 | 3,458,047 | |
| Columbia Cent CLO 31 Ltd. Series 2021-31A Class A1, 3 month U.S. LIBOR + 1.200% 2.2627% 4/20/34 (a)(b)(c) | 3,860,350 | 3,719,250 | |
| Columbia Cent Clo 32 Ltd. / Coliseum Series 2022-32A Class A1, CME TERM SOFR 3 MONTH INDEX + 1.700% 1.75% 7/24/34 (b)(c)(g) | 4,457,000 | 4,416,468 | |
| Columbia Cent CLO Ltd. / Columbia Cent CLO Corp. Series 2021-30A Class A1, 3 month U.S. LIBOR + 1.310% 2.3727% 1/20/34 (a)(b)(c) | 5,052,517 | 4,919,828 | |
| DB Master Finance LLC Series 2017-1A Class A2II, 4.03% 11/20/47 (a) | 3,276,565 | 3,135,823 | |
| Dryden 98 CLO Ltd. Series 2022-98A Class A, CME TERM SOFR 3 MONTH INDEX + 1.300% 2.204% 4/20/35 (a)(b)(c) | 2,526,193 | 2,427,685 | |
| Dryden CLO, Ltd.: | |||
| Series 2021-76A Class A1R, 3 month U.S. LIBOR + 1.150% 2.2127% 10/20/34 (a)(b)(c) | 2,388,876 | 2,306,355 | |
| Series 2021-83A Class A, 3 month U.S. LIBOR + 1.220% 2.2643% 1/18/32 (a)(b)(c) | 2,929,325 | 2,865,762 | |
| Dryden Senior Loan Fund: | |||
| Series 2020-78A Class A, 3 month U.S. LIBOR + 1.180% 2.2243% 4/17/33 (a)(b)(c) | 2,441,104 | 2,371,464 | |
| Series 2021-85A Class AR, 3 month U.S. LIBOR + 1.150% 2.1943% 10/15/35 (a)(b)(c) | 3,177,977 | 3,061,695 | |
| Series 2021-90A Class A1A, 3 month U.S. LIBOR + 1.130% 2.608% 2/20/35 (a)(b)(c) | 1,889,869 | 1,818,470 | |
| Eaton Vance CLO, Ltd.: | |||
| Series 2021-1A Class AR, 3 month U.S. LIBOR + 1.100% 2.1443% 4/15/31 (a)(b)(c) | 1,638,378 | 1,597,635 | |
| Series 2021-2A Class AR, 3 month U.S. LIBOR + 1.150% 2.1943% 1/15/35 (a)(b)(c) | 4,330,149 | 4,187,761 | |
| Eaton Vance CLO, Ltd. / Eaton Vance CLO LLC Series 2021-1A Class A13R, 3 month U.S. LIBOR + 1.250% 2.2943% 1/15/34 (a)(b)(c) | 1,005,251 | 976,961 | |
| Flatiron CLO Ltd. Series 2021-1A: | |||
| Class A1, 3 month U.S. LIBOR + 1.110% 2.1543% 7/19/34 (a)(b)(c) | 2,577,919 | 2,485,624 | |
| Class AR, 3 month U.S. LIBOR + 1.080% 2.4913% 11/16/34 (a)(b)(c) | 3,690,041 | 3,574,664 | |
| Flatiron CLO Ltd. / Flatiron CLO LLC Series 2020-1A Class A, 3 month U.S. LIBOR + 1.300% 2.778% 11/20/33 (a)(b)(c) | 4,601,553 | 4,473,657 | |
| Ford Credit Auto Owner Trust Series 2020-2 Class A, 1.06% 4/15/33 (a) | 1,458,000 | 1,320,020 | |
| Horizon Aircraft Finance I Ltd. Series 2018-1 Class A, 4.458% 12/15/38 (a) | 1,389,526 | 1,208,957 | |
| Horizon Aircraft Finance Ltd. Series 2019-1 Class A, 3.721% 7/15/39 (a) | 1,397,399 | 1,236,488 | |
| Invesco CLO Ltd. Series 2021-3A Class A, 3 month U.S. LIBOR + 1.130% 2.2663% 10/22/34 (a)(b)(c) | 2,531,935 | 2,431,845 | |
| KKR CLO Ltd. Series 2022-41A Class A1, CME TERM SOFR 3 MONTH INDEX + 1.330% 2.0223% 4/15/35 (a)(b)(c) | 5,870,431 | 5,634,134 | |
| Lucali CLO Ltd. Series 2021-1A Class A, 3 month U.S. LIBOR + 1.210% 2.2543% 1/15/33 (a)(b)(c) | 1,816,635 | 1,772,565 | |
| Madison Park Funding Series 2020-19A Class A1R2, 3 month U.S. LIBOR + 0.920% 2.0563% 1/22/28 (a)(b)(c) | 2,474,942 | 2,438,707 | |
| Madison Park Funding L Ltd. / Madison Park Funding L LLC Series 2021-50A Class A, 3 month U.S. LIBOR + 1.140% 2.1843% 4/19/34 (a)(b)(c) | 4,047,691 | 3,926,438 | |
| Madison Park Funding LII Ltd. / Madison Park Funding LII LLC Series 2021-52A Class A, 3 month U.S. LIBOR + 1.100% 2.2363% 1/22/35 (a)(b)(c) | 4,115,814 | 3,945,716 | |
| Madison Park Funding XLV Ltd./Madison Park Funding XLV LLC Series 2021-45A Class AR, 3 month U.S. LIBOR + 1.120% 2.1643% 7/15/34 (a)(b)(c) | 2,572,810 | 2,493,441 | |
| Madison Park Funding XXXII, Ltd. / Madison Park Funding XXXII LLC Series 2021-32A Class A2R, 3 month U.S. LIBOR + 1.200% 2.3363% 1/22/31 (a)(b)(c) | 1,296,427 | 1,242,067 | |
| Magnetite CLO Ltd. Series 2021-27A Class AR, 3 month U.S. LIBOR + 1.140% 2.2027% 10/20/34 (a)(b)(c) | 1,041,994 | 1,005,065 | |
| Magnetite IX, Ltd. / Magnetite IX LLC Series 2021-30A Class A, 3 month U.S. LIBOR + 1.130% 2.314% 10/25/34 (a)(b)(c) | 4,363,331 | 4,212,142 | |
| Magnetite XXI Ltd. Series 2021-21A Class AR, 3 month U.S. LIBOR + 1.020% 2.0827% 4/20/34 (a)(b)(c) | 3,374,400 | 3,253,694 | |
| Magnetite XXIX, Ltd. / Magnetite XXIX LLC Series 2021-29A Class A, 3 month U.S. LIBOR + 0.990% 2.0343% 1/15/34 (a)(b)(c) | 3,525,408 | 3,435,066 | |
| Marlette Funding Trust Series 2022-1A Class A, 1.36% 4/15/32 (a) | 4,829,676 | 4,742,119 | |
| Milos CLO, Ltd. Series 2020-1A Class AR, 3 month U.S. LIBOR + 1.070% 2.1327% 10/20/30 (a)(b)(c) | 3,696,853 | 3,626,864 | |
| Park Place Securities, Inc. Series 2005-WCH1 Class M4, 1 month U.S. LIBOR + 1.240% 2.8686% 1/25/36 (b)(c) | 109,117 | 108,328 | |
| Peace Park CLO, Ltd. Series 2021-1A Class A, 3 month U.S. LIBOR + 1.130% 2.1927% 10/20/34 (a)(b)(c) | 1,408,460 | 1,363,991 | |
| Planet Fitness Master Issuer LLC: | |||
| Series 2019-1A Class A2, 3.858% 12/5/49 (a) | 2,682,225 | 2,384,584 | |
| Series 2022-1A: | |||
| Class A2I, 3.251% 12/5/51 (a) | 2,940,630 | 2,634,484 | |
| Class A2II, 4.008% 12/5/51 (a) | 2,627,415 | 2,343,077 | |
| Project Silver Series 2019-1 Class A, 3.967% 7/15/44 (a) | 2,610,478 | 2,240,355 | |
| Rockland Park CLO Ltd. Series 2021-1A Class A, 3 month U.S. LIBOR + 1.120% 2.1827% 4/20/34 (a)(b)(c) | 4,820,896 | 4,676,115 | |
| RR 7 Ltd. Series 2022-7A Class A1AB, 3 month U.S. LIBOR + 1.340% 1.5203% 1/15/37 (a)(b)(c) | 4,874,693 | 4,696,826 | |
| Sapphire Aviation Finance Series 2020-1A: | |||
| Class A, 3.228% 3/15/40 (a) | 2,718,535 | 2,379,685 | |
| Class B, 4.335% 3/15/40 (a) | 521,805 | 348,947 | |
| SBA Tower Trust: | |||
| Series 2019, 2.836% 1/15/50 (a) | 3,520,000 | 3,400,165 | |
| 1.884% 7/15/50 (a) | 1,356,000 | 1,253,577 | |
| 2.328% 7/15/52 (a) | 1,037,000 | 920,991 | |
| SYMP Series 2022-32A Class A1, CME TERM SOFR 3 MONTH INDEX + 1.320% 1.6326% 4/23/35 (a)(b)(c) | 5,044,198 | 4,822,968 | |
| Symphony CLO XXI, Ltd. Series 2021-21A Class AR, 3 month U.S. LIBOR + 1.060% 2.1043% 7/15/32 (a)(b)(c) | 580,272 | 564,474 | |
| Symphony CLO XXV Ltd. / Symphony CLO XXV LLC Series 2021-25A Class A, 3 month U.S. LIBOR + 0.980% 2.0243% 4/19/34 (a)(b)(c) | 4,282,717 | 4,115,040 | |
| Symphony CLO XXVI Ltd. / Symphony CLO XXVI LLC Series 2021-26A Class AR, 3 month U.S. LIBOR + 1.080% 2.1427% 4/20/33 (a)(b)(c) | 3,959,716 | 3,830,190 | |
| Terwin Mortgage Trust Series 2003-4HE Class A1, 1 month U.S. LIBOR + 0.860% 2.4836% 9/25/34 (b)(c) | 4,251 | 4,159 | |
| Thunderbolt Aircraft Lease Ltd. Series 2018-A Class A, 4.147% 9/15/38 (a)(b) | 3,219,801 | 2,839,557 | |
| Thunderbolt III Aircraft Lease Ltd. Series 2019-1 Class A, 3.671% 11/15/39 (a) | 4,015,166 | 3,443,470 | |
| Upstart Securitization Trust 3.12% 3/20/32 (a) | 1,585,512 | 1,549,882 | |
| Voya CLO Ltd. Series 2019-2A Class A, 3 month U.S. LIBOR + 1.270% 2.3327% 7/20/32 (a)(b)(c) | 3,719,561 | 3,636,723 | |
| Voya CLO Ltd./Voya CLO LLC: | |||
| Series 2021-2A Class A1R, 3 month U.S. LIBOR + 1.160% 2.2043% 7/19/34 (a)(b)(c) | 2,363,896 | 2,287,275 | |
| Series 2021-3A Class AR, 3 month U.S. LIBOR + 1.150% 2.2127% 10/20/34 (a)(b)(c) | 4,837,926 | 4,664,419 | |
| Voya CLO, Ltd. Series 2021-1A Class AR, 3 month U.S. LIBOR + 1.150% 2.1943% 7/16/34 (a)(b)(c) | 2,387,172 | 2,306,474 | |
| TOTAL ASSET-BACKED SECURITIES | |||
| (Cost $272,468,480) | 257,130,326 | ||
| Collateralized Mortgage Obligations - 0.8% | |||
| Private Sponsor - 0.8% | |||
| Binom Securitization Trust 202 Series 2022-RPL1 Class A1, 3% 2/25/61 (a) | 3,411,161 | 3,284,420 | |
| BRAVO Residential Funding Trust sequential payer Series 2022-RPL1 Class A1, 2.75% 9/25/61 (a) | 4,925,347 | 4,705,975 | |
| Cascade Funding Mortgage Trust: | |||
| sequential payer Series 2022-EBO2 Class A, 3.169% 7/25/54 (a) | 2,626,092 | 2,604,997 | |
| Series 2021-HB6 Class A, 0.8983% 6/25/36 (a) | 2,339,282 | 2,293,542 | |
| Cfmt 2022-Hb8 LLC sequential payer Series 2022-HB8 Class A, 3.75% 4/25/25 (a) | 4,803,152 | 4,731,773 | |
| Finance of America HECM Buyout sequential payer Series 2022-HB1 Class A, 2.6948% 2/25/32 (a)(b) | 5,681,970 | 5,586,971 | |
| NYMT Loan Trust sequential payer Series 2021-CP1 Class A1, 2.0424% 7/25/61 (a) | 1,934,426 | 1,829,293 | |
| Preston Ridge Partners Mortgage Trust Series 2021-2 Class A1, 2.115% 3/25/26 (a) | 3,414,315 | 3,229,454 | |
| RMF Buyout Issuance Trust sequential payer Series 2022-HB1 Class A, 4.272% 4/25/32 (a) | 1,723,396 | 1,710,934 | |
| Sequoia Mortgage Trust floater Series 2004-6 Class A3B, 6 month U.S. LIBOR + 0.880% 3.6276% 7/20/34 (b)(c) | 1,215 | 1,111 | |
| TOTAL PRIVATE SPONSOR | 29,978,470 | ||
| U.S. Government Agency - 0.0% | |||
| Fannie Mae planned amortization class: | |||
| Series 1999-54 Class PH, 6.5% 11/18/29 | 23,274 | 23,828 | |
| Series 1999-57 Class PH, 6.5% 12/25/29 | 47,830 | 49,995 | |
| Ginnie Mae guaranteed REMIC pass-thru certificates: | |||
| sequential payer Series 2013-H06 Class HA, 1.65% 1/20/63 (h) | 15,865 | 15,835 | |
| Series 2007-35 Class SC, 40.200% - 1 month U.S. LIBOR 31.1443% 6/16/37 (b)(i) | 9,878 | 13,354 | |
| TOTAL U.S. GOVERNMENT AGENCY | 103,012 | ||
| TOTAL COLLATERALIZED MORTGAGE OBLIGATIONS | |||
| (Cost $30,923,617) | 30,081,482 | ||
| Commercial Mortgage Securities - 6.4% | |||
| BAMLL Commercial Mortgage Securities Trust: | |||
| floater Series 2022-DKLX: | |||
| Class A, U.S. 30-Day Avg. Secured Overnight Fin. Rate (SOFR) Indx + 1.150% 2.429% 1/15/39 (a)(b)(c) | 2,741,961 | 2,663,812 | |
| Class B, U.S. 30-Day Avg. Secured Overnight Fin. Rate (SOFR) Indx + 1.550% 2.829% 1/15/39 (a)(b)(c) | 618,000 | 597,986 | |
| Class C, U.S. 30-Day Avg. Secured Overnight Fin. Rate (SOFR) Indx + 2.150% 3.429% 1/15/39 (a)(b)(c) | 437,000 | 420,021 | |
| sequential payer Series 2019-BPR Class ANM, 3.112% 11/5/32 (a) | 2,189,000 | 2,083,658 | |
| Series 2019-BPR: | |||
| Class BNM, 3.465% 11/5/32 (a) | 491,000 | 452,393 | |
| Class CNM, 3.8425% 11/5/32 (a)(b) | 248,000 | 212,333 | |
| BANK sequential payer: | |||
| Series 2018-BN10 Class A5, 3.688% 2/15/61 | 218,564 | 212,620 | |
| Series 2019-BN21 Class A5, 2.851% 10/17/52 | 373,546 | 340,874 | |
| Series 2022-BNK42, Class A5, 4.493% 6/15/55 (b) | 4,995,066 | 5,085,187 | |
| BBCMS Mortgage Trust Series 2022-C16 Class A5, 4.6% 6/15/55 | 1,000,000 | 1,024,058 | |
| Benchmark Mortgage Trust: | |||
| sequential payer: | |||
| Series 2018-B4 Class A5, 4.121% 7/15/51 | 778,315 | 772,740 | |
| Series 2019-B10 Class A4, 3.717% 3/15/62 | 721,545 | 696,702 | |
| Series 2018-B8 Class A5, 4.2317% 1/15/52 | 5,335,798 | 5,317,621 | |
| BFLD Trust floater sequential payer Series 2020-OBRK Class A, 1 month U.S. LIBOR + 2.050% 3.374% 11/15/28 (a)(b)(c) | 1,998,000 | 1,971,840 | |
| BPR Trust floater Series 2022-OANA: | |||
| Class A, CME TERM SOFR 1 MONTH INDEX + 1.890% 3.1767% 4/15/37 (a)(b)(c) | 8,749,555 | 8,570,550 | |
| Class B, CME TERM SOFR 1 MONTH INDEX + 2.440% 3.7257% 4/15/37 (a)(b)(c) | 2,324,753 | 2,273,919 | |
| BX Commercial Mortgage Trust floater: | |||
| Series 2021-PAC: | |||
| Class A, 1 month U.S. LIBOR + 0.680% 2.0141% 10/15/36 (a)(b)(c) | 5,017,787 | 4,763,222 | |
| Class B, 1 month U.S. LIBOR + 0.890% 2.2238% 10/15/36 (a)(b)(c) | 733,467 | 691,071 | |
| Class C, 1 month U.S. LIBOR + 1.090% 2.4236% 10/15/36 (a)(b)(c) | 981,551 | 913,479 | |
| Class D, 1 month U.S. LIBOR + 1.290% 2.6233% 10/15/36 (a)(b)(c) | 952,598 | 878,008 | |
| Class E, 1 month U.S. LIBOR + 1.940% 3.2725% 10/15/36 (a)(b)(c) | 3,312,521 | 3,074,531 | |
| Series 2021-VINO Class A, 1 month U.S. LIBOR + 0.650% 1.9763% 5/15/38 (a)(b)(c) | 450,000 | 428,526 | |
| Series 2022-LP2: | |||
| Class A, CME TERM SOFR 1 MONTH INDEX + 1.010% 2.3469% 2/15/39 (a)(b)(c) | 6,218,337 | 5,969,870 | |
| Class B, CME TERM SOFR 1 MONTH INDEX + 1.310% 2.6463% 2/15/39 (a)(b)(c) | 1,873,454 | 1,779,881 | |
| Class C, CME TERM SOFR 1 MONTH INDEX + 1.560% 2.8957% 2/15/39 (a)(b)(c) | 1,873,454 | 1,761,168 | |
| Class D, CME TERM SOFR 1 MONTH INDEX + 1.960% 3.2948% 2/15/39 (a)(b)(c) | 1,873,454 | 1,742,459 | |
| BX Trust: | |||
| floater: | |||
| Series 2018-EXCL Class D, 1 month U.S. LIBOR + 2.620% 3.949% 9/15/37 (a)(b)(c) | 842,862 | 702,043 | |
| Series 2019-IMC: | |||
| Class B, 1 month U.S. LIBOR + 1.300% 2.624% 4/15/34 (a)(b)(c) | 1,864,321 | 1,789,181 | |
| Class C, 1 month U.S. LIBOR + 1.600% 2.924% 4/15/34 (a)(b)(c) | 1,232,474 | 1,179,699 | |
| Class D, 1 month U.S. LIBOR + 1.900% 3.224% 4/15/34 (a)(b)(c) | 1,293,785 | 1,228,610 | |
| Series 2019-XL: | |||
| Class B, 1 month U.S. LIBOR + 1.080% 2.404% 10/15/36 (a)(b)(c) | 3,998,712 | 3,898,124 | |
| Class C, 1 month U.S. LIBOR + 1.250% 2.574% 10/15/36 (a)(b)(c) | 1,877,095 | 1,820,434 | |
| Class D, 1 month U.S. LIBOR + 1.450% 2.774% 10/15/36 (a)(b)(c) | 2,658,333 | 2,571,407 | |
| Class E, 1 month U.S. LIBOR + 1.800% 3.124% 10/15/36 (a)(b)(c) | 3,735,372 | 3,603,831 | |
| Series 2022-IND: | |||
| Class A, CME TERM SOFR 1 MONTH INDEX + 1.490% 2.8248% 4/15/37 (a)(b)(c) | 4,724,023 | 4,596,594 | |
| Class B, CME TERM SOFR 1 MONTH INDEX + 1.940% 3.2738% 4/15/37 (a)(b)(c) | 2,408,277 | 2,333,750 | |
| Class C, CME TERM SOFR 1 MONTH INDEX + 2.290% 3.6238% 4/15/37 (a)(b)(c) | 543,725 | 521,127 | |
| Class D, CME TERM SOFR 1 MONTH INDEX + 2.830% 4.1728% 4/15/37 (a)(b)(c) | 455,288 | 433,834 | |
| floater sequential payer Series 2021-SOAR Class A, 1.995% 6/15/38 (a)(b) | 7,082,741 | 6,798,132 | |
| floater, sequential payer: | |||
| Series 2019-IMC Class A, 1 month U.S. LIBOR + 1.000% 2.324% 4/15/34 (a)(b)(c) | 5,401,930 | 5,265,846 | |
| Series 2019-XL Class A, 1 month U.S. LIBOR + 0.920% 2.244% 10/15/36 (a)(b)(c) | 3,263,066 | 3,205,608 | |
| CAMB Commercial Mortgage Trust floater Series 2019-LIFE Class A, 1 month U.S. LIBOR + 1.070% 2.394% 12/15/37 (a)(b)(c) | 300,000 | 294,345 | |
| CF Hippolyta Issuer LLC sequential payer Series 2021-1A Class A1, 1.53% 3/15/61 (a) | 5,528,047 | 4,878,791 | |
| CHC Commercial Mortgage Trust floater Series 2019-CHC: | |||
| Class A, 1 month U.S. LIBOR + 1.120% 2.444% 6/15/34 (a)(b)(c) | 4,478,252 | 4,374,548 | |
| Class B, 1 month U.S. LIBOR + 1.500% 2.824% 6/15/34 (a)(b)(c) | 881,790 | 852,582 | |
| Class C, 1 month U.S. LIBOR + 1.750% 3.074% 6/15/34 (a)(b)(c) | 996,169 | 958,340 | |
| CIM Retail Portfolio Trust floater Series 2021-RETL: | |||
| Class C, 1 month U.S. LIBOR + 2.300% 3.625% 8/15/36 (a)(b)(c) | 195,690 | 185,231 | |
| Class D, 1 month U.S. LIBOR + 3.050% 4.375% 8/15/36 (a)(b)(c) | 651,750 | 610,767 | |
| COMM Mortgage Trust: | |||
| sequential payer Series 2014-CR18 Class A5, 3.828% 7/15/47 | 717,571 | 712,590 | |
| Series 2013-CR13 Class AM, 4.449% 11/10/46 | 3,340,144 | 3,325,749 | |
| Series 2013-LC13 Class AM, 4.557% 8/10/46 (a) | 2,047,158 | 2,047,824 | |
| Series 2014-CR14 Class AM, 4.526% 2/10/47 (b) | 4,110,694 | 4,104,937 | |
| Credit Suisse Mortgage Trust: | |||
| floater Series 2019-ICE4: | |||
| Class A, 1 month U.S. LIBOR + 0.980% 2.304% 5/15/36 (a)(b)(c) | 495,000 | 486,896 | |
| Class B, 1 month U.S. LIBOR + 1.230% 2.554% 5/15/36 (a)(b)(c) | 2,360,000 | 2,307,450 | |
| Class C, 1 month U.S. LIBOR + 1.430% 2.754% 5/15/36 (a)(b)(c) | 549,000 | 535,507 | |
| sequential payer Series 2020-NET Class A, 2.2569% 8/15/37 (a) | 1,095,806 | 1,011,552 | |
| Series 2018-SITE: | |||
| Class A, 4.284% 4/15/36 (a) | 2,090,266 | 2,029,660 | |
| Class B, 4.5349% 4/15/36 (a) | 642,635 | 617,725 | |
| Class C, 4.9414% 4/15/36 (a)(b) | 526,890 | 503,794 | |
| Class D, 4.9414% 4/15/36 (a)(b) | 862,334 | 806,735 | |
| ELP Commercial Mortgage Trust floater Series 2021-ELP: | |||
| Class A, 1 month U.S. LIBOR + 0.700% 2.026% 11/15/38 (a)(b)(c) | 6,770,941 | 6,464,878 | |
| Class B, 1 month U.S. LIBOR + 1.120% 2.4452% 11/15/38 (a)(b)(c) | 500,000 | 477,399 | |
| Extended Stay America Trust floater Series 2021-ESH: | |||
| Class A, 1 month U.S. LIBOR + 1.080% 2.405% 7/15/38 (a)(b)(c) | 2,231,268 | 2,175,234 | |
| Class B, 1 month U.S. LIBOR + 1.380% 2.705% 7/15/38 (a)(b)(c) | 1,270,183 | 1,231,903 | |
| Class C, 1 month U.S. LIBOR + 1.700% 3.025% 7/15/38 (a)(b)(c) | 937,232 | 906,635 | |
| Class D, 1 month U.S. LIBOR + 2.250% 3.575% 7/15/38 (a)(b)(c) | 1,887,384 | 1,821,032 | |
| Freddie Mac sequential payer: | |||
| Series 2021-K136 Class A2, 2.127% 11/25/31 | 3,300,019 | 2,916,002 | |
| Series 2022-K141 Class A2, 2.25% 2/25/32 | 4,500,000 | 4,009,555 | |
| Series 2022-K144 Class A2, 2.45% 4/25/32 | 800,000 | 723,807 | |
| Series 2022-K145 Class A2, 2.58% 6/25/55 | 2,700,000 | 2,470,100 | |
| GS Mortgage Securities Trust: | |||
| floater: | |||
| Series 2018-3PCK Class A, 1 month U.S. LIBOR + 1.700% 3.024% 9/15/31 (a)(b)(c) | 1,838,082 | 1,811,307 | |
| Series 2021-IP: | |||
| Class A, 1 month U.S. LIBOR + 0.950% 2.274% 10/15/36 (a)(b)(c) | 2,886,747 | 2,781,030 | |
| Class B, 1 month U.S. LIBOR + 1.150% 2.474% 10/15/36 (a)(b)(c) | 544,915 | 514,044 | |
| Class C, 1 month U.S. LIBOR + 1.550% 2.874% 10/15/36 (a)(b)(c) | 449,243 | 420,552 | |
| Series 2013-GC12 Class A/S, 3.375% 6/10/46 | 3,211,582 | 3,178,429 | |
| J.P. Morgan Chase Commercial Mortgage Securities Trust floater Series 2012-NLP Class A, CME TERM SOFR 1 MONTH INDEX + 0.590% 1.8752% 4/15/37 (a)(b)(c) | 1,474,000 | 1,385,477 | |
| JPMBB Commercial Mortgage Securities Trust Series 2013-C17 Class A/S, 4.4584% 1/15/47 | 4,667,521 | 4,657,836 | |
| JPMCC Commercial Mortgage Securities Trust Series 2016-JP4 Class ASB, 3.4743% 12/15/49 | 3,310,865 | 3,267,390 | |
| JPMorgan Chase Commercial Mortgage Securities Trust Series 2018-WPT: | |||
| Class AFX, 4.2475% 7/5/33 (a) | 277,000 | 274,649 | |
| Class CFX, 4.9498% 7/5/33 (a) | 505,398 | 498,002 | |
| Class DFX, 5.3503% 7/5/33 (a) | 715,868 | 704,448 | |
| Class EFX, 5.5422% 7/5/33 (a) | 870,282 | 844,185 | |
| Life Financial Services Trust floater Series 2022-BMR2: | |||
| Class A1, CME TERM SOFR 1 MONTH INDEX + 1.290% 2.5739% 5/15/39 (a)(b)(c) | 6,900,561 | 6,727,948 | |
| Class B, CME TERM SOFR 1 MONTH INDEX + 1.790% 3.0726% 5/15/39 (a)(b)(c) | 4,064,838 | 3,942,816 | |
| Class C, CME TERM SOFR 1 MONTH INDEX + 2.090% 3.3718% 5/15/39 (a)(b)(c) | 2,311,651 | 2,230,697 | |
| Class D, CME TERM SOFR 1 MONTH INDEX + 2.540% 3.8206% 5/15/39 (a)(b)(c) | 2,054,528 | 1,962,026 | |
| LIFE Mortgage Trust floater Series 2021-BMR: | |||
| Class A, 1 month U.S. LIBOR + 0.700% 2.024% 3/15/38 (a)(b)(c) | 5,486,932 | 5,310,420 | |
| Class B, 1 month U.S. LIBOR + 0.880% 2.204% 3/15/38 (a)(b)(c) | 982,134 | 940,199 | |
| Class C, 1 month U.S. LIBOR + 1.100% 2.424% 3/15/38 (a)(b)(c) | 617,740 | 589,812 | |
| Class D, 1 month U.S. LIBOR + 1.400% 2.724% 3/15/38 (a)(b)(c) | 859,367 | 816,200 | |
| Class E, 1 month U.S. LIBOR + 1.750% 3.074% 3/15/38 (a)(b)(c) | 751,109 | 700,180 | |
| MHC Commercial Mortgage Trust floater sequential payer Series 2021-MHC Class A, 1 month U.S. LIBOR + 0.800% 2.125% 4/15/38 (a)(b)(c) | 4,671,615 | 4,551,818 | |
| Morgan Stanley Capital I Trust: | |||
| floater Series 2018-BOP: | |||
| Class B, 1 month U.S. LIBOR + 1.250% 2.574% 8/15/33 (a)(b)(c) | 1,982,914 | 1,957,722 | |
| Class C, 1 month U.S. LIBOR + 1.500% 2.824% 8/15/33 (a)(b)(c) | 4,775,892 | 4,700,164 | |
| sequential payer Series 2019-MEAD Class A, 3.17% 11/10/36 (a) | 4,757,881 | 4,485,620 | |
| Series 2018-H4 Class A4, 4.31% 12/15/51 | 3,507,809 | 3,470,389 | |
| Series 2019-MEAD: | |||
| Class B, 3.283% 11/10/36 (a)(b) | 687,483 | 637,683 | |
| Class C, 3.283% 11/10/36 (a)(b) | 659,666 | 598,330 | |
| Natixis Commercial Mortgage Securities Trust sequential payer Series 2020-2PAC Class A, 2.966% 12/15/38 (a) | 6,830,958 | 6,525,277 | |
| OPG Trust floater Series 2021-PORT Class A, 1 month U.S. LIBOR + 0.480% 1.808% 10/15/36 (a)(b)(c) | 8,640,646 | 8,129,995 | |
| Prima Capital Ltd. floater sequential payer Series 2021-9A Class A, 1 month U.S. LIBOR + 1.450% 2.3773% 12/15/37 (a)(b)(c) | 257,834 | 257,834 | |
| Providence Place Group Ltd. Partnership Series 2000-C1 Class A2, 7.75% 7/20/28 (a) | 1,874,325 | 2,029,241 | |
| SPGN Mortgage Trust floater Series 2022-TFLM: | |||
| Class B, CME TERM SOFR 1 MONTH INDEX + 2.000% 3.2787% 2/15/39 (a)(b)(c) | 1,190,000 | 1,135,007 | |
| Class C, CME TERM SOFR 1 MONTH INDEX + 2.650% 3.9287% 2/15/39 (a)(b)(c) | 619,000 | 589,818 | |
| SREIT Trust floater: | |||
| Series 2021-FLWR Class A, 1 month U.S. LIBOR + 0.570% 1.9006% 7/15/36 (a)(b)(c) | 1,392,068 | 1,322,149 | |
| Series 2021-MFP: | |||
| Class A, 1 month U.S. LIBOR + 0.730% 2.0548% 11/15/38 (a)(b)(c) | 4,572,244 | 4,342,614 | |
| Class B, 1 month U.S. LIBOR + 1.070% 2.4038% 11/15/38 (a)(b)(c) | 2,618,793 | 2,467,546 | |
| Class C, 1 month U.S. LIBOR + 1.320% 2.653% 11/15/38 (a)(b)(c) | 1,626,457 | 1,524,358 | |
| Class D, 1 month U.S. LIBOR + 1.570% 2.9022% 11/15/38 (a)(b)(c) | 1,068,976 | 999,192 | |
| VLS Commercial Mortgage Trust: | |||
| sequential payer Series 2020-LAB Class A, 2.13% 10/10/42 (a) | 3,269,943 | 2,690,984 | |
| Series 2020-LAB Class B, 2.453% 10/10/42 (a) | 256,512 | 208,303 | |
| Wells Fargo Commercial Mortgage Trust: | |||
| floater Series 2021-FCMT Class A, 1 month U.S. LIBOR + 1.200% 2.524% 5/15/31 (a)(b)(c) | 2,496,000 | 2,383,516 | |
| sequential payer Series 2015-C26 Class A4, 3.166% 2/15/48 | 1,900,655 | 1,856,342 | |
| Series 2018-C48 Class A5, 4.302% 1/15/52 | 1,574,228 | 1,571,470 | |
| TOTAL COMMERCIAL MORTGAGE SECURITIES | |||
| (Cost $262,723,746) | 250,481,336 | ||
| Municipal Securities - 0.8% | |||
| California Gen. Oblig. Series 2009: | |||
| 7.35% 11/1/39 | $460,000 | $599,213 | |
| 7.55% 4/1/39 | 2,035,000 | 2,760,453 | |
| Chicago Gen. Oblig. (Taxable Proj.) Series 2010 C1, 7.781% 1/1/35 | 1,670,000 | 1,972,348 | |
| Illinois Gen. Oblig.: | |||
| Series 2003: | |||
| 4.95% 6/1/23 | 766,364 | 772,018 | |
| 5.1% 6/1/33 | 2,725,000 | 2,741,594 | |
| Series 2010-1, 6.63% 2/1/35 | 6,975,000 | 7,427,724 | |
| Series 2010-3: | |||
| 6.725% 4/1/35 | 5,380,000 | 5,700,448 | |
| 7.35% 7/1/35 | 3,145,000 | 3,430,559 | |
| New Jersey Econ. Dev. Auth. State Pension Fdg. Rev. Series 1997, 7.425% 2/15/29 (Nat'l. Pub. Fin. Guarantee Corp. Insured) | 4,110,000 | 4,617,458 | |
| TOTAL MUNICIPAL SECURITIES | |||
| (Cost $34,767,218) | 30,021,815 | ||
| Foreign Government and Government Agency Obligations - 0.2% | |||
| Emirate of Abu Dhabi 3.875% 4/16/50 (a) | $3,236,000 | $2,878,624 | |
| Kingdom of Saudi Arabia: | |||
| 3.25% 10/22/30 (a) | 1,788,000 | 1,680,720 | |
| 4.5% 4/22/60 (a) | 1,363,000 | 1,253,960 | |
| State of Qatar 4.4% 4/16/50 (a) | 4,036,000 | 3,869,515 | |
| TOTAL FOREIGN GOVERNMENT AND GOVERNMENT AGENCY OBLIGATIONS | |||
| (Cost $12,099,757) | 9,682,819 | ||
| Supranational Obligations - 0.1% | |||
| Corporacion Andina de Fomento 2.375% 5/12/23 (Cost $3,393,264) | 3,349,000 | 3,326,126 | |
| Bank Notes - 0.2% | |||
| Discover Bank: | |||
| 3.35% 2/6/23 | $1,820,000 | $1,820,067 | |
| 4.682% 8/9/28 (b) | 1,567,000 | 1,523,359 | |
| KeyBank NA 6.95% 2/1/28 | 800,000 | 876,321 | |
| Regions Bank 6.45% 6/26/37 | 4,383,000 | 4,871,843 | |
| TOTAL BANK NOTES | |||
| (Cost $10,601,689) | 9,091,590 | ||
| Shares | Value | ||
| Fixed-Income Funds - 1.6% | |||
| Fidelity Specialized High Income Central Fund (j) | |||
| (Cost $70,325,583) | 756,706 | 61,815,293 | |
| Money Market Funds - 5.2% | |||
| Fidelity Cash Central Fund 1.58% (k) | 140,756,945 | 140,785,096 | |
| Fidelity Securities Lending Cash Central Fund 1.58% (k)(l) | 61,643,581 | 61,649,745 | |
| TOTAL MONEY MARKET FUNDS | |||
| (Cost $202,434,482) | 202,434,841 | ||
| TOTAL INVESTMENT IN SECURITIES - 111.4% | |||
| (Cost $4,841,832,984) | 4,360,614,205 | ||
| NET OTHER ASSETS (LIABILITIES) - (11.4)% | (444,845,930) | ||
| NET ASSETS - 100% | $3,915,768,275 |
| TBA Sale Commitments | ||
| Principal Amount | Value | |
| Ginnie Mae | ||
| 2% 7/1/52 | $(17,950,000) | $(15,936,846) |
| 2% 7/1/52 | (6,750,000) | (5,992,964) |
| 2% 7/1/52 | (1,300,000) | (1,154,200) |
| 2% 7/1/52 | (6,750,000) | (5,992,964) |
| TOTAL GINNIE MAE | (29,076,974) | |
| Uniform Mortgage Backed Securities | ||
| 2% 7/1/52 | (5,550,000) | (4,815,839) |
| 2% 7/1/52 | (8,750,000) | (7,592,540) |
| 2% 7/1/52 | (7,850,000) | (6,811,593) |
| 2% 7/1/52 | (6,900,000) | (5,987,260) |
| 2% 7/1/52 | (12,100,000) | (10,499,397) |
| 2.5% 7/1/52 | (10,700,000) | (9,616,620) |
| 2.5% 7/1/52 | (4,850,000) | (4,358,935) |
| 2.5% 7/1/52 | (15,550,000) | (13,975,555) |
| 3% 7/1/52 | (4,800,000) | (4,467,372) |
| 3.5% 7/1/52 | (2,300,000) | (2,211,144) |
| 3.5% 7/1/52 | (700,000) | (672,957) |
| 4.5% 7/1/52 | (1,000,000) | (1,003,672) |
| 4.5% 7/1/52 | (1,700,000) | (1,706,242) |
| 4.5% 7/1/52 | (1,700,000) | (1,706,242) |
| 4.5% 7/1/52 | (725,000) | (727,662) |
| 4.5% 7/1/52 | (9,100,000) | (9,133,415) |
| 5% 7/1/52 | (7,400,000) | (7,549,154) |
| TOTAL UNIFORM MORTGAGE BACKED SECURITIES | (92,835,599) | |
| TOTAL TBA SALE COMMITMENTS | ||
| (Proceeds $121,370,877) | $(121,912,573) |
| Futures Contracts | |||||
| Number of contracts | Expiration Date | Notional Amount | Value | Unrealized Appreciation/(Depreciation) | |
| Purchased | |||||
| Treasury Contracts | |||||
| CBOT 10-Year U.S. Treasury Note Contracts (United States) | 45 | Sept. 2022 | $5,333,907 | $10,018 | $10,018 |
| Sold | |||||
| Treasury Contracts | |||||
| CBOT 2-Year U.S. Treasury Note Contracts (United States) | 24 | Sept. 2022 | 5,040,375 | (19,928) | (19,928) |
| CBOT 5-Year U.S. Treasury Note Contracts (United States) | 172 | Sept. 2022 | 19,307,000 | 116,884 | 116,884 |
| CBOT Long Term U.S. Treasury Bond Contracts (United States) | 208 | Sept. 2022 | 28,834,000 | 269,332 | 269,332 |
| TOTAL SOLD | 366,288 | ||||
| TOTAL FUTURES CONTRACTS | $376,306 |
The notional amount of futures purchased as a percentage of Net Assets is 0.1%
The notional amount of futures sold as a percentage of Net Assets is 1.4%
Swaps
| Underlying Reference | Maturity Date | Clearinghouse / Counterparty | Fixed Payment Received/(Paid) | Payment Frequency | Notional Amount(1) | Value(2) | Upfront Premium Received/(Paid)(3) | Unrealized Appreciation/(Depreciation) |
| Credit Default Swaps | ||||||||
| Buy Protection | ||||||||
| CMBX N.A. AAA Index Series 13 | Dec. 2072 | Citigroup Global Markets Ltd. | (0.5%) | Monthly | $1,390,000 | $24,446 | $(3,402) | $21,044 |
| CMBX N.A. AAA Index Series 13 | Dec. 2072 | Citigroup Global Markets Ltd. | (0.5%) | Monthly | 2,070,000 | 36,405 | (7,095) | 29,310 |
| CMBX N.A. AAA Index Series 13 | Dec. 2072 | JPMorgan Securities LLC | (0.5%) | Monthly | 2,460,000 | 43,264 | (14,299) | 28,965 |
| CMBX N.A. AAA Index Series 13 | Dec. 2072 | JPMorgan Securities LLC | (0.5%) | Monthly | 710,000 | 12,487 | (2,862) | 9,625 |
| CMBX N.A. AAA Index Series 13 | Dec. 2072 | Morgan Stanley Capital Services LLC | (0.5%) | Monthly | 2,150,000 | 37,812 | (35,746) | 2,066 |
| CMBX N.A. AAA Index Series 13 | Dec. 2072 | Morgan Stanley Capital Services LLC | (0.5%) | Monthly | 4,680,000 | 82,306 | (33,092) | 49,214 |
| TOTAL CREDIT DEFAULT SWAPS | $236,720 | $(96,496) | $140,224 | |||||
(1) The notional amount of each credit default swap where the Fund has sold protection approximates the maximum potential amount of future payments that the Fund could be required to make if a credit event were to occur.
(2) Ratings are presented for credit default swaps in which the Fund has sold protection on the underlying referenced debt. Ratings for an underlying index represent a weighted average of the ratings of all securities included in the index. The credit rating or value can be measures of the current payment/performance risk. Ratings are from Moody's Investors Service, Inc. Where Moody's® ratings are not available, S&P® ratings are disclosed and are indicated as such. All ratings are as of the report date and do not reflect subsequent changes.
(3) Any premiums for centrally cleared over-the-counter (OTC) swaps are recorded periodically throughout the term of the swap to variation margin and included in unrealized appreciation (depreciation).
Legend
(a) Security exempt from registration under Rule 144A of the Securities Act of 1933. These securities may be resold in transactions exempt from registration, normally to qualified institutional buyers. At the end of the period, the value of these securities amounted to $693,792,398 or 17.7% of net assets.
(b) Coupon rates for floating and adjustable rate securities reflect the rates in effect at period end.
(c) Coupon is indexed to a floating interest rate which may be multiplied by a specified factor and/or subject to caps or floors.
(d) Security or a portion of the security was pledged to cover margin requirements for futures contracts. At period end, the value of securities pledged amounted to $2,021,837.
(e) Security or a portion of the security has been segregated as collateral for mortgage-backed or asset-backed securities purchased on a delayed delivery or when-issued basis. At period end, the value of securities pledged amounted to $8,419,059.
(f) Security or a portion of the security is on loan at period end.
(g) Security or a portion of the security purchased on a delayed delivery or when-issued basis.
(h) Represents an investment in an underlying pool of reverse mortgages which typically do not require regular principal and interest payments as repayment is deferred until a maturity event.
(i) Coupon is inversely indexed to a floating interest rate multiplied by a specified factor. The price may be considerably more volatile than the price of a comparable fixed rate security.
(j) Affiliated fund that is generally available only to investment companies and other accounts managed by Fidelity Investments. A complete unaudited schedule of portfolio holdings for each Fidelity Central Fund is filed with the SEC for the first and third quarters of each fiscal year on Form N-PORT and is available upon request or at the SEC's website at www.sec.gov. An unaudited holdings listing for the Fund, which presents direct holdings as well as the pro-rata share of securities and other investments held indirectly through its investment in underlying non-money market Fidelity Central Funds, is available at fidelity.com and/or institutional.fidelity.com, as applicable. In addition, each Fidelity Central Fund's financial statements are available on the SEC's website or upon request.
(k) Affiliated fund that is generally available only to investment companies and other accounts managed by Fidelity Investments. The rate quoted is the annualized seven-day yield of the fund at period end. A complete unaudited listing of the fund's holdings as of its most recent quarter end is available upon request. In addition, each Fidelity Central Fund's financial statements are available on the SEC's website or upon request.
(l) Investment made with cash collateral received from securities on loan.
Affiliated Central Funds
Fiscal year to date information regarding the Fund's investments in Fidelity Central Funds, including the ownership percentage, is presented below.
| Fund | Value, beginning of period | Purchases | Sales Proceeds | Dividend Income | Realized Gain/Loss | Change in Unrealized appreciation (depreciation) | Value, end of period | % ownership, end of period |
| Fidelity Cash Central Fund 1.58% | $515,408,790 | $815,454,097 | $1,190,077,790 | $411,781 | $-- | $(1) | $140,785,096 | 0.3% |
| Fidelity Securities Lending Cash Central Fund 1.58% | 161,494,470 | 651,845,439 | 751,690,164 | 57,807 | -- | -- | 61,649,745 | 0.2% |
| Fidelity Specialized High Income Central Fund | 87,005,374 | 1,840,041 | 14,582,827 | 1,839,976 | 734,866 | (13,182,161) | 61,815,293 | 19.2% |
| Total | $763,908,634 | $1,469,139,577 | $1,956,350,781 | $2,309,564 | $734,866 | $(13,182,162) | $264,250,134 |
Amounts in the income column in the above table include any capital gain distributions from underlying funds, which are presented in the corresponding line-item in the Statement of Operations, if applicable. Amount for Fidelity Securities Lending Cash Central Fund represents the income earned on investing cash collateral, less rebates paid to borrowers and any lending agent fees associated with the loan, plus any premium payments received for lending certain types of securities.
Investment Valuation
The following is a summary of the inputs used, as of June 30, 2022, involving the Fund's assets and liabilities carried at fair value. The inputs or methodology used for valuing securities may not be an indication of the risk associated with investing in those securities. For more information on valuation inputs, and their aggregation into the levels used below, please refer to the Investment Valuation section in the accompanying Notes to Financial Statements.
| Valuation Inputs at Reporting Date: | ||||
| Description | Total | Level 1 | Level 2 | Level 3 |
| Investments in Securities: | ||||
| Corporate Bonds | $1,316,136,261 | $-- | $1,316,136,261 | $-- |
| U.S. Government and Government Agency Obligations | 1,361,918,109 | -- | 1,361,918,109 | -- |
| U.S. Government Agency - Mortgage Securities | 828,494,207 | -- | 828,494,207 | -- |
| Asset-Backed Securities | 257,130,326 | -- | 257,130,326 | -- |
| Collateralized Mortgage Obligations | 30,081,482 | -- | 30,081,482 | -- |
| Commercial Mortgage Securities | 250,481,336 | -- | 250,481,336 | -- |
| Municipal Securities | 30,021,815 | -- | 30,021,815 | -- |
| Foreign Government and Government Agency Obligations | 9,682,819 | -- | 9,682,819 | -- |
| Supranational Obligations | 3,326,126 | -- | 3,326,126 | -- |
| Bank Notes | 9,091,590 | -- | 9,091,590 | -- |
| Fixed-Income Funds | 61,815,293 | 61,815,293 | -- | -- |
| Money Market Funds | 202,434,841 | 202,434,841 | -- | -- |
| Total Investments in Securities: | $4,360,614,205 | $264,250,134 | $4,096,364,071 | $-- |
| Derivative Instruments: | ||||
| Assets | ||||
| Futures Contracts | $396,234 | $396,234 | $-- | $-- |
| Swaps | 236,720 | -- | 236,720 | -- |
| Total Assets | $632,954 | $396,234 | $236,720 | $-- |
| Liabilities | ||||
| Futures Contracts | $(19,928) | $(19,928) | $-- | $-- |
| Total Liabilities | $(19,928) | $(19,928) | $-- | $-- |
| Total Derivative Instruments: | $613,026 | $376,306 | $236,720 | $-- |
| Other Financial Instruments: | ||||
| TBA Sale Commitments | $(121,912,573) | $-- | $(121,912,573) | $-- |
| Total Other Financial Instruments: | $(121,912,573) | $-- | $(121,912,573) | $-- |
Value of Derivative Instruments
The following table is a summary of the Fund's value of derivative instruments by primary risk exposure as of June 30, 2022. For additional information on derivative instruments, please refer to the Derivative Instruments section in the accompanying Notes to Financial Statements.
| Primary Risk Exposure / Derivative Type | Value | |
| Asset | Liability | |
| Credit Risk | ||
| Swaps(a) | $236,720 | $-- |
| Total Credit Risk | 236,720 | -- |
| Interest Rate Risk | ||
| Futures Contracts(b) | 396,234 | (19,928) |
| Total Interest Rate Risk | 396,234 | (19,928) |
| Total Value of Derivatives | $632,954 | $(19,928) |
(a) For bi-lateral over-the-counter (OTC) swaps, reflects gross value which is presented in the Statement of Assets and Liabilities in the bi-lateral OTC swaps, at value line-items.
(b) Reflects gross cumulative appreciation (depreciation) on futures contracts as presented in the Schedule of Investments. In the Statement of Assets and Liabilities, the period end daily variation margin is included in receivable or payable for daily variation margin on futures contracts, and the net cumulative appreciation (depreciation) is included in Total accumulated earnings (loss).
See accompanying notes which are an integral part of the financial statements.
VIP Investment Grade Bond Portfolio
Financial Statements
Statement of Assets and Liabilities
| June 30, 2022 (Unaudited) | ||
| Assets | ||
| Investment in securities, at value (including securities loaned of $60,875,573) — See accompanying schedule: Unaffiliated issuers (cost $4,569,072,919) | $4,096,364,071 | |
| Fidelity Central Funds (cost $272,760,065) | 264,250,134 | |
| Total Investment in Securities (cost $4,841,832,984) | $4,360,614,205 | |
| Receivable for investments sold | 29,210 | |
| Receivable for TBA sale commitments | 121,370,877 | |
| Receivable for fund shares sold | 1,375,352 | |
| Interest receivable | 24,330,460 | |
| Distributions receivable from Fidelity Central Funds | 148,818 | |
| Bi-lateral OTC swaps, at value | 236,720 | |
| Other receivables | 7,074 | |
| Total assets | 4,508,112,716 | |
| Liabilities | ||
| Payable for investments purchased | ||
| Regular delivery | $3,423,008 | |
| Delayed delivery | 398,412,597 | |
| TBA sale commitments, at value | 121,912,573 | |
| Payable for fund shares redeemed | 4,636,444 | |
| Accrued management fee | 976,068 | |
| Distribution and service plan fees payable | 449,399 | |
| Payable for daily variation margin on futures contracts | 496,784 | |
| Other affiliated payables | 339,251 | |
| Other payables and accrued expenses | 48,572 | |
| Collateral on securities loaned | 61,649,745 | |
| Total liabilities | 592,344,441 | |
| Net Assets | $3,915,768,275 | |
| Net Assets consist of: | ||
| Paid in capital | $4,484,150,233 | |
| Total accumulated earnings (loss) | (568,381,958) | |
| Net Assets | $3,915,768,275 | |
| Net Asset Value and Maximum Offering Price | ||
| Initial Class: | ||
| Net Asset Value, offering price and redemption price per share ($571,493,406 ÷ 50,298,590 shares) | $11.36 | |
| Service Class: | ||
| Net Asset Value, offering price and redemption price per share ($663,202,608 ÷ 59,190,054 shares) | $11.20 | |
| Service Class 2: | ||
| Net Asset Value, offering price and redemption price per share ($1,886,537,793 ÷ 171,307,632 shares) | $11.01 | |
| Investor Class: | ||
| Net Asset Value, offering price and redemption price per share ($794,534,468 ÷ 70,282,767 shares) | $11.30 |
See accompanying notes which are an integral part of the financial statements.
Statement of Operations
| Six months ended June 30, 2022 (Unaudited) | ||
| Investment Income | ||
| Interest | $48,967,400 | |
| Income from Fidelity Central Funds (including $57,807 from security lending) | 2,309,564 | |
| Total income | 51,276,964 | |
| Expenses | ||
| Management fee | $7,387,833 | |
| Transfer agent fees | 1,886,187 | |
| Distribution and service plan fees | 2,852,880 | |
| Accounting fees | 585,377 | |
| Custodian fees and expenses | 64,187 | |
| Independent trustees' fees and expenses | 7,922 | |
| Registration fees | 26,922 | |
| Audit | 25,113 | |
| Legal | 1,508 | |
| Miscellaneous | 9,987 | |
| Total expenses before reductions | 12,847,916 | |
| Expense reductions | (43,233) | |
| Total expenses after reductions | 12,804,683 | |
| Net investment income (loss) | 38,472,281 | |
| Realized and Unrealized Gain (Loss) | ||
| Net realized gain (loss) on: | ||
| Investment securities: | ||
| Unaffiliated issuers | (46,640,688) | |
| Redemptions in-kind with affiliated entities | (80,678,663) | |
| Fidelity Central Funds | 734,866 | |
| Futures contracts | 1,981,373 | |
| Swaps | (9,568) | |
| Total net realized gain (loss) | (124,612,680) | |
| Change in net unrealized appreciation (depreciation) on: | ||
| Investment securities: | ||
| Unaffiliated issuers | (462,984,299) | |
| Fidelity Central Funds | (13,182,162) | |
| Futures contracts | 75,242 | |
| Swaps | 140,224 | |
| TBA sale commitments | (364,529) | |
| Total change in net unrealized appreciation (depreciation) | (476,315,524) | |
| Net gain (loss) | (600,928,204) | |
| Net increase (decrease) in net assets resulting from operations | $(562,455,923) |
See accompanying notes which are an integral part of the financial statements.
Statement of Changes in Net Assets
| Six months ended June 30, 2022 (Unaudited) | Year ended December 31, 2021 | |
| Increase (Decrease) in Net Assets | ||
| Operations | ||
| Net investment income (loss) | $38,472,281 | $85,191,726 |
| Net realized gain (loss) | (124,612,680) | 308,284,560 |
| Change in net unrealized appreciation (depreciation) | (476,315,524) | (432,476,248) |
| Net increase (decrease) in net assets resulting from operations | (562,455,923) | (38,999,962) |
| Distributions to shareholders | (263,675,735) | (259,145,498) |
| Share transactions - net increase (decrease) | (828,886,448) | 478,920,867 |
| Total increase (decrease) in net assets | (1,655,018,106) | 180,775,407 |
| Net Assets | ||
| Beginning of period | 5,570,786,381 | 5,390,010,974 |
| End of period | $3,915,768,275 | $5,570,786,381 |
See accompanying notes which are an integral part of the financial statements.
Financial Highlights
VIP Investment Grade Bond Portfolio Initial Class
| Six months ended (Unaudited) June 30, | Years endedDecember 31, | |||||
| 2022 | 2021 | 2020 | 2019 | 2018 | 2017 | |
| Selected Per–Share Data | ||||||
| Net asset value, beginning of period | $13.35 | $14.09 | $13.17 | $12.34 | $12.80 | $12.64 |
| Income from Investment Operations | ||||||
| Net investment income (loss)A,B | .101 | .228 | .328 | .382 | .311 | .325 |
| Net realized and unrealized gain (loss) | (1.463) | (.313) | .903 | .806 | (.381) | .204 |
| Total from investment operations | (1.362) | (.085) | 1.231 | 1.188 | (.070) | .529 |
| Distributions from net investment income | – | (.282) | (.306) | (.358) | (.313) | (.312) |
| Distributions from net realized gain | (.628) | (.373) | (.005) | – | (.077) | (.057) |
| Total distributions | (.628) | (.655) | (.311) | (.358) | (.390) | (.369) |
| Net asset value, end of period | $11.36 | $13.35 | $14.09 | $13.17 | $12.34 | $12.80 |
| Total ReturnC,D,E | (10.58)% | (.61)% | 9.39% | 9.67% | (.53)% | 4.22% |
| Ratios to Average Net AssetsB,F,G | ||||||
| Expenses before reductions | .40%H | .39% | .39% | .40% | .40% | .41% |
| Expenses net of fee waivers, if any | .40%H | .39% | .39% | .40% | .40% | .41% |
| Expenses net of all reductions | .40%H | .39% | .39% | .40% | .40% | .41% |
| Net investment income (loss) | 1.69%H | 1.66% | 2.38% | 2.93% | 2.49% | 2.53% |
| Supplemental Data | ||||||
| Net assets, end of period (000 omitted) | $571,493 | $1,347,145 | $1,322,750 | $1,146,767 | $928,285 | $1,069,371 |
| Portfolio turnover rateI | 165%H,J | 125% | 11% | 5% | 8% | 6% |
A Calculated based on average shares outstanding during the period.
B Net investment income (loss) is affected by the timing of the declaration of dividends by any underlying mutual funds or exchange-traded funds (ETFs). Net investment income (loss) of any such underlying funds is not included in the Fund's net investment income (loss) ratio.
C Total returns for periods of less than one year are not annualized.
D Total returns do not reflect charges attributable to your insurance company's separate account. Inclusion of these charges would reduce the total returns shown.
E Total returns would have been lower if certain expenses had not been reduced during the applicable periods shown.
F Fees and expenses of any underlying mutual funds or exchange-traded funds (ETFs) are not included in the Fund's expense ratio. The Fund indirectly bears its proportionate share of these expenses. For additional expense information related to investments in Fidelity Central Funds, please refer to the "Investments in Fidelity Central Funds" note found in the Notes to Financial Statements section of the most recent Annual or Semi-Annual report.
G Expense ratios reflect operating expenses of the class. Expenses before reductions do not reflect amounts reimbursed, waived, or reduced through arrangements with the investment adviser, brokerage services, or other offset arrangements, if applicable, and do not represent the amount paid by the class during periods when reimbursements, waivers or reductions occur.
H Annualized
I Amount does not include the portfolio activity of any underlying mutual funds or exchange-traded funds (ETFs).
J Portfolio turnover rate excludes securities received or delivered in-kind.
See accompanying notes which are an integral part of the financial statements.
VIP Investment Grade Bond Portfolio Service Class
| Six months ended (Unaudited) June 30, | Years endedDecember 31, | |||||
| 2022 | 2021 | 2020 | 2019 | 2018 | 2017 | |
| Selected Per–Share Data | ||||||
| Net asset value, beginning of period | $13.18 | $13.93 | $13.02 | $12.20 | $12.66 | $12.50 |
| Income from Investment Operations | ||||||
| Net investment income (loss)A,B | .093 | .212 | .310 | .364 | .295 | .309 |
| Net realized and unrealized gain (loss) | (1.445) | (.322) | .899 | .800 | (.377) | .207 |
| Total from investment operations | (1.352) | (.110) | 1.209 | 1.164 | (.082) | .516 |
| Distributions from net investment income | – | (.267) | (.294) | (.344) | (.301) | (.299) |
| Distributions from net realized gain | (.628) | (.373) | (.005) | – | (.077) | (.057) |
| Total distributions | (.628) | (.640) | (.299) | (.344) | (.378) | (.356) |
| Net asset value, end of period | $11.20 | $13.18 | $13.93 | $13.02 | $12.20 | $12.66 |
| Total ReturnC,D,E | (10.64)% | (.79)% | 9.33% | 9.58% | (.63)% | 4.16% |
| Ratios to Average Net AssetsB,F,G | ||||||
| Expenses before reductions | .50%H | .49% | .49% | .50% | .50% | .51% |
| Expenses net of fee waivers, if any | .50%H | .49% | .49% | .50% | .50% | .51% |
| Expenses net of all reductions | .50%H | .49% | .49% | .50% | .50% | .51% |
| Net investment income (loss) | 1.59%H | 1.56% | 2.28% | 2.83% | 2.39% | 2.43% |
| Supplemental Data | ||||||
| Net assets, end of period (000 omitted) | $663,203 | $732,762 | $692,787 | $582,182 | $553,442 | $587,652 |
| Portfolio turnover rateI | 165%H,J | 125% | 11% | 5% | 8% | 6% |
A Calculated based on average shares outstanding during the period.
B Net investment income (loss) is affected by the timing of the declaration of dividends by any underlying mutual funds or exchange-traded funds (ETFs). Net investment income (loss) of any such underlying funds is not included in the Fund's net investment income (loss) ratio.
C Total returns for periods of less than one year are not annualized.
D Total returns do not reflect charges attributable to your insurance company's separate account. Inclusion of these charges would reduce the total returns shown.
E Total returns would have been lower if certain expenses had not been reduced during the applicable periods shown.
F Fees and expenses of any underlying mutual funds or exchange-traded funds (ETFs) are not included in the Fund's expense ratio. The Fund indirectly bears its proportionate share of these expenses. For additional expense information related to investments in Fidelity Central Funds, please refer to the "Investments in Fidelity Central Funds" note found in the Notes to Financial Statements section of the most recent Annual or Semi-Annual report.
G Expense ratios reflect operating expenses of the class. Expenses before reductions do not reflect amounts reimbursed, waived, or reduced through arrangements with the investment adviser, brokerage services, or other offset arrangements, if applicable, and do not represent the amount paid by the class during periods when reimbursements, waivers or reductions occur.
H Annualized
I Amount does not include the portfolio activity of any underlying mutual funds or exchange-traded funds (ETFs).
J Portfolio turnover rate excludes securities received or delivered in-kind.
See accompanying notes which are an integral part of the financial statements.
VIP Investment Grade Bond Portfolio Service Class 2
| Six months ended (Unaudited) June 30, | Years endedDecember 31, | |||||
| 2022 | 2021 | 2020 | 2019 | 2018 | 2017 | |
| Selected Per–Share Data | ||||||
| Net asset value, beginning of period | $12.98 | $13.72 | $12.83 | $12.03 | $12.49 | $12.34 |
| Income from Investment Operations | ||||||
| Net investment income (loss)A,B | .083 | .188 | .285 | .340 | .272 | .286 |
| Net realized and unrealized gain (loss) | (1.425) | (.310) | .885 | .787 | (.372) | .203 |
| Total from investment operations | (1.342) | (.122) | 1.170 | 1.127 | (.100) | .489 |
| Distributions from net investment income | – | (.245) | (.275) | (.327) | (.283) | (.282) |
| Distributions from net realized gain | (.628) | (.373) | (.005) | – | (.077) | (.057) |
| Total distributions | (.628) | (.618) | (.280) | (.327) | (.360) | (.339) |
| Net asset value, end of period | $11.01 | $12.98 | $13.72 | $12.83 | $12.03 | $12.49 |
| Total ReturnC,D,E | (10.73)% | (.90)% | 9.16% | 9.40% | (.79)% | 3.99% |
| Ratios to Average Net AssetsB,F,G | ||||||
| Expenses before reductions | .65%H | .64% | .64% | .65% | .65% | .66% |
| Expenses net of fee waivers, if any | .65%H | .64% | .64% | .65% | .65% | .66% |
| Expenses net of all reductions | .65%H | .64% | .64% | .65% | .65% | .66% |
| Net investment income (loss) | 1.44%H | 1.41% | 2.13% | 2.68% | 2.24% | 2.28% |
| Supplemental Data | ||||||
| Net assets, end of period (000 omitted) | $1,886,538 | $2,135,986 | $1,935,645 | $1,698,902 | $1,505,566 | $1,514,502 |
| Portfolio turnover rateI | 165%H,J | 125% | 11% | 5% | 8% | 6% |
A Calculated based on average shares outstanding during the period.
B Net investment income (loss) is affected by the timing of the declaration of dividends by any underlying mutual funds or exchange-traded funds (ETFs). Net investment income (loss) of any such underlying funds is not included in the Fund's net investment income (loss) ratio.
C Total returns for periods of less than one year are not annualized.
D Total returns do not reflect charges attributable to your insurance company's separate account. Inclusion of these charges would reduce the total returns shown.
E Total returns would have been lower if certain expenses had not been reduced during the applicable periods shown.
F Fees and expenses of any underlying mutual funds or exchange-traded funds (ETFs) are not included in the Fund's expense ratio. The Fund indirectly bears its proportionate share of these expenses. For additional expense information related to investments in Fidelity Central Funds, please refer to the "Investments in Fidelity Central Funds" note found in the Notes to Financial Statements section of the most recent Annual or Semi-Annual report.
G Expense ratios reflect operating expenses of the class. Expenses before reductions do not reflect amounts reimbursed, waived, or reduced through arrangements with the investment adviser, brokerage services, or other offset arrangements, if applicable, and do not represent the amount paid by the class during periods when reimbursements, waivers or reductions occur.
H Annualized
I Amount does not include the portfolio activity of any underlying mutual funds or exchange-traded funds (ETFs).
J Portfolio turnover rate excludes securities received or delivered in-kind.
See accompanying notes which are an integral part of the financial statements.
VIP Investment Grade Bond Portfolio Investor Class
| Six months ended (Unaudited) June 30, | Years endedDecember 31, | |||||
| 2022 | 2021 | 2020 | 2019 | 2018 | 2017 | |
| Selected Per–Share Data | ||||||
| Net asset value, beginning of period | $13.29 | $14.03 | $13.12 | $12.29 | $12.75 | $12.59 |
| Income from Investment Operations | ||||||
| Net investment income (loss)A,B | .099 | .223 | .322 | .376 | .305 | .319 |
| Net realized and unrealized gain (loss) | (1.461) | (.313) | .896 | .808 | (.380) | .206 |
| Total from investment operations | (1.362) | (.090) | 1.218 | 1.184 | (.075) | .525 |
| Distributions from net investment income | – | (.277) | (.303) | (.354) | (.308) | (.308) |
| Distributions from net realized gain | (.628) | (.373) | (.005) | – | (.077) | (.057) |
| Total distributions | (.628) | (.650) | (.308) | (.354) | (.385) | (.365) |
| Net asset value, end of period | $11.30 | $13.29 | $14.03 | $13.12 | $12.29 | $12.75 |
| Total ReturnC,D,E | (10.63)% | (.64)% | 9.33% | 9.67% | (.57)% | 4.20% |
| Ratios to Average Net AssetsB,F,G | ||||||
| Expenses before reductions | .43%H | .42% | .43% | .43% | .44% | .44% |
| Expenses net of fee waivers, if any | .43%H | .42% | .43% | .43% | .44% | .44% |
| Expenses net of all reductions | .43%H | .42% | .43% | .43% | .44% | .44% |
| Net investment income (loss) | 1.66%H | 1.63% | 2.34% | 2.90% | 2.46% | 2.49% |
| Supplemental Data | ||||||
| Net assets, end of period (000 omitted) | $794,534 | $1,354,894 | $1,438,829 | $1,157,666 | $879,703 | $1,030,725 |
| Portfolio turnover rateI | 165%H,J | 125% | 11% | 5% | 8% | 6% |
A Calculated based on average shares outstanding during the period.
B Net investment income (loss) is affected by the timing of the declaration of dividends by any underlying mutual funds or exchange-traded funds (ETFs). Net investment income (loss) of any such underlying funds is not included in the Fund's net investment income (loss) ratio.
C Total returns for periods of less than one year are not annualized.
D Total returns do not reflect charges attributable to your insurance company's separate account. Inclusion of these charges would reduce the total returns shown.
E Total returns would have been lower if certain expenses had not been reduced during the applicable periods shown.
F Fees and expenses of any underlying mutual funds or exchange-traded funds (ETFs) are not included in the Fund's expense ratio. The Fund indirectly bears its proportionate share of these expenses. For additional expense information related to investments in Fidelity Central Funds, please refer to the "Investments in Fidelity Central Funds" note found in the Notes to Financial Statements section of the most recent Annual or Semi-Annual report.
G Expense ratios reflect operating expenses of the class. Expenses before reductions do not reflect amounts reimbursed, waived, or reduced through arrangements with the investment adviser, brokerage services, or other offset arrangements, if applicable, and do not represent the amount paid by the class during periods when reimbursements, waivers or reductions occur.
H Annualized
I Amount does not include the portfolio activity of any underlying mutual funds or exchange-traded funds (ETFs).
J Portfolio turnover rate excludes securities received or delivered in-kind.
See accompanying notes which are an integral part of the financial statements.
Notes to Financial Statements (Unaudited)
For the period ended June 30, 2022
1. Organization.
VIP Investment Grade Bond Portfolio (the Fund) is a fund of Variable Insurance Products Fund V (the Trust) and is authorized to issue an unlimited number of shares. The Trust is registered under the Investment Company Act of 1940, as amended (the 1940 Act), as an open-end management investment company organized as a Massachusetts business trust. Shares of the Fund may only be purchased by insurance companies for the purpose of funding variable annuity or variable life insurance contracts. The Fund offers the following classes of shares: Initial Class shares, Service Class shares, Service Class 2 shares and Investor Class shares. All classes have equal rights and voting privileges, except for matters affecting a single class.
2. Investments in Fidelity Central Funds.
Funds may invest in Fidelity Central Funds, which are open-end investment companies generally available only to other investment companies and accounts managed by the investment adviser and its affiliates. The Schedule of Investments lists any Fidelity Central Funds held as an investment as of period end, but does not include the underlying holdings of each Fidelity Central Fund. An investing fund indirectly bears its proportionate share of the expenses of the underlying Fidelity Central Funds.
Based on its investment objective, each Fidelity Central Fund may invest or participate in various investment vehicles or strategies that are similar to those of the investing fund. These strategies are consistent with the investment objectives of the investing fund and may involve certain economic risks which may cause a decline in value of each of the Fidelity Central Funds and thus a decline in the value of the investing fund.
| Fidelity Central Fund | Investment Manager | Investment Objective | Investment Practices | Expense Ratio(a) |
| Fidelity Specialized High Income Central Fund | Fidelity Management & Research Company LLC (FMR) | Seeks a high level of current income by normally investing in income-producing debt securities, with an emphasis on lower-quality debt securities. | Loans & Direct Debt Instruments Restricted Securities | Less than .005% |
| Fidelity Money Market Central Funds | Fidelity Management & Research Company LLC (FMR) | Each fund seeks to obtain a high level of current income consistent with the preservation of capital and liquidity. | Short-term Investments | Less than .005% |
(a) Expenses expressed as a percentage of average net assets and are as of each underlying Central Fund's most recent annual or semi-annual shareholder report.
An unaudited holdings listing for the investing fund, which presents direct holdings as well as the pro-rata share of any securities and other investments held indirectly through its investment in underlying non-money market Fidelity Central Funds, is available at fidelity.com and/or institutional.fidelity.com, as applicable. A complete unaudited list of holdings for each Fidelity Central Fund is available upon request or at the Securities and Exchange Commission website at www.sec.gov. In addition, the financial statements of the Fidelity Central Funds which contain the significant accounting policies (including investment valuation policies) of those funds, and are not covered by the Report of Independent Registered Public Accounting Firm, are available on the Securities and Exchange Commission website or upon request.
3. Significant Accounting Policies.
The Fund is an investment company and applies the accounting and reporting guidance of the Financial Accounting Standards Board (FASB) Accounting Standards Codification Topic 946 Financial Services - Investment Companies. The financial statements have been prepared in conformity with accounting principles generally accepted in the United States of America (GAAP), which require management to make certain estimates and assumptions at the date of the financial statements. Actual results could differ from those estimates. Subsequent events, if any, through the date that the financial statements were issued have been evaluated in the preparation of the financial statements. The Fund's Schedule of Investments lists any underlying mutual funds or exchange-traded funds (ETFs) but does not include the underlying holdings of these funds. The following summarizes the significant accounting policies of the Fund:
Investment Valuation. Investments are valued as of 4:00 p.m. Eastern time on the last calendar day of the period. The Board of Trustees (the Board) has delegated the day to day responsibility for the valuation of the Fund's investments to the Fair Value Committee (the Committee) established by the Fund's investment adviser. In accordance with valuation policies and procedures approved by the Board, the Fund attempts to obtain prices from one or more third party pricing vendors or brokers to value its investments. When current market prices, quotations or currency exchange rates are not readily available or reliable, investments will be fair valued in good faith by the Committee, in accordance with procedures adopted by the Board. Factors used in determining fair value vary by investment type and may include market or investment specific events, changes in interest rates and credit quality. The frequency with which these procedures are used cannot be predicted and they may be utilized to a significant extent. The Committee oversees the Fund's valuation policies and procedures and reports to the Board on the Committee's activities and fair value determinations. The Board monitors the appropriateness of the procedures used in valuing the Fund's investments and ratifies the fair value determinations of the Committee.
The Fund categorizes the inputs to valuation techniques used to value its investments into a disclosure hierarchy consisting of three levels as shown below:
- Level 1 – unadjusted quoted prices in active markets for identical investments
- Level 2 – other significant observable inputs (including quoted prices for similar investments, interest rates, prepayment speeds, etc.)
- Level 3 – unobservable inputs (including the Fund's own assumptions based on the best information available)
Valuation techniques used to value the Fund's investments by major category are as follows:
Debt securities, including restricted securities, are valued based on evaluated prices received from third party pricing vendors or from brokers who make markets in such securities. Corporate bonds, bank notes, foreign government and government agency obligations, municipal securities, supranational obligations and U.S. government and government agency obligations are valued by pricing vendors who utilize matrix pricing which considers yield or price of bonds of comparable quality, coupon, maturity and type or by broker-supplied prices. Asset backed securities, collateralized mortgage obligations, commercial mortgage securities and U.S. government agency mortgage securities are valued by pricing vendors who utilize matrix pricing which considers prepayment speed assumptions, attributes of the collateral, yield or price of bonds of comparable quality, coupon, maturity and type or by broker-supplied prices. Brokers which make markets in asset backed securities, collateralized mortgage obligations and commercial mortgage securities may also consider such factors as the structure of the issue, cash flow assumptions, the value of underlying assets as well as any guarantees. Swaps are marked-to-market daily based on valuations from third party pricing vendors, registered derivatives clearing organizations (clearinghouses) or broker-supplied valuations. These pricing sources may utilize inputs such as interest rate curves, credit spread curves, default possibilities and recovery rates. When independent prices are unavailable or unreliable, debt securities and swaps may be valued utilizing pricing methodologies which consider similar factors that would be used by third party pricing vendors. Debt securities and swaps are generally categorized as Level 2 in the hierarchy but may be Level 3 depending on the circumstances.
Futures contracts are valued at the settlement price established each day by the board of trade or exchange on which they are traded and are categorized as Level 1 in the hierarchy. Investments in open-end mutual funds, including the Fidelity Central Funds, are valued at their closing net asset value (NAV) each business day and are categorized as Level 1 in the hierarchy.
Changes in valuation techniques may result in transfers in or out of an assigned level within the disclosure hierarchy. The aggregate value of investments by input level as of June 30, 2022 is included at the end of the Fund's Schedule of Investments.
Investment Transactions and Income. For financial reporting purposes, the Fund's investment holdings and NAV include trades executed through the end of the last business day of the period. The NAV per share for processing shareholder transactions is calculated as of the close of business of the New York Stock Exchange (NYSE), normally 4:00 p.m. Eastern time and includes trades executed through the end of the prior business day. Gains and losses on securities sold are determined on the basis of identified cost and include proceeds received from litigation. Income and capital gain distributions from Fidelity Central Funds, if any, are recorded on the ex-dividend date. Interest income is accrued as earned and includes coupon interest and amortization of premium and accretion of discount on debt securities as applicable. The principal amount on inflation-indexed securities is periodically adjusted to the rate of inflation and interest is accrued based on the principal amount. The adjustments to principal due to inflation are reflected as increases or decreases to Interest in the accompanying Statement of Operations. Debt obligations may be placed on non-accrual status and related interest income may be reduced by ceasing current accruals and writing off interest receivables when the collection of all or a portion of interest has become doubtful based on consistently applied procedures. A debt obligation is removed from non-accrual status when the issuer resumes interest payments or when collectability of interest is reasonably assured.
Class Allocations and Expenses. Investment income, realized and unrealized capital gains and losses, common expenses of a fund, and certain fund-level expense reductions, if any, are allocated daily on a pro-rata basis to each class based on the relative net assets of each class to the total net assets of a fund. Each class differs with respect to transfer agent and distribution and service plan fees incurred, as applicable. Certain expense reductions may also differ by class, if applicable. For the reporting period, the allocated portion of income and expenses to each class as a percent of its average net assets may vary due to the timing of recording these transactions in relation to fluctuating net assets of the classes. Expenses directly attributable to a fund are charged to that fund. Expenses attributable to more than one fund are allocated among the respective funds on the basis of relative net assets or other appropriate methods. Expenses included in the accompanying financial statements reflect the expenses of that fund and do not include any expenses associated with any underlying mutual funds or exchange-traded funds. Although not included in a fund's expenses, a fund indirectly bears its proportionate share of these expenses through the net asset value of each underlying mutual fund or exchange-traded fund. Expense estimates are accrued in the period to which they relate and adjustments are made when actual amounts are known.
Income Tax Information and Distributions to Shareholders. Each year, the Fund intends to qualify as a regulated investment company under Subchapter M of the Internal Revenue Code, including distributing substantially all of its taxable income and realized gains. As a result, no provision for U.S. Federal income taxes is required. The Fund files a U.S. federal tax return, in addition to state and local tax returns as required. The Fund's federal income tax returns are subject to examination by the Internal Revenue Service (IRS) for a period of three fiscal years after they are filed. State and local tax returns may be subject to examination for an additional fiscal year depending on the jurisdiction.
Distributions are declared and recorded on the ex-dividend date. Income and capital gain distributions are declared separately for each class. Income and capital gain distributions are determined in accordance with income tax regulations, which may differ from GAAP.
Capital accounts within the financial statements are adjusted for permanent book-tax differences. These adjustments have no impact on net assets or the results of operations. Capital accounts are not adjusted for temporary book-tax differences which will reverse in a subsequent period.
Book-tax differences are primarily due to the short-term gain distributions from the underlying mutual funds or exchange-traded funds (ETFs), futures contracts, capital loss carryforwards and losses deferred due to wash sales.
As of period end, the cost and unrealized appreciation (depreciation) in securities, and derivatives if applicable, for federal income tax purposes were as follows:
| Gross unrealized appreciation | $1,944,358 |
| Gross unrealized depreciation | (483,213,735) |
| Net unrealized appreciation (depreciation) | $(481,269,377) |
| Tax cost | $4,841,858,416 |
Delayed Delivery Transactions and When-Issued Securities. During the period, certain Funds transacted in securities on a delayed delivery or when-issued basis. Payment and delivery may take place after the customary settlement period for that security. The price of the underlying securities and the date when the securities will be delivered and paid for are fixed at the time the transaction is negotiated. Securities purchased on a delayed delivery or when-issued basis are identified as such in the Schedule of Investments. Compensation for interest forgone in the purchase of a delayed delivery or when-issued debt security may be received. With respect to purchase commitments, each applicable Fund identifies securities as segregated in its records with a value at least equal to the amount of the commitment. Payables and receivables associated with the purchases and sales of delayed delivery securities having the same coupon, settlement date and broker are offset. Delayed delivery or when-issued securities that have been purchased from and sold to different brokers are reflected as both payables and receivables in the Statement of Assets and Liabilities under the caption "Delayed delivery", as applicable. Losses may arise due to changes in the value of the underlying securities or if the counterparty does not perform under the contract's terms, or if the issuer does not issue the securities due to political, economic, or other factors.
To-Be-Announced (TBA) Securities and Mortgage Dollar Rolls. TBA securities involve buying or selling mortgage-backed securities (MBS) on a forward commitment basis. A TBA transaction typically does not designate the actual security to be delivered and only includes an approximate principal amount; however delivered securities must meet specified terms defined by industry guidelines, including issuer, rate and current principal amount outstanding on underlying mortgage pools. Funds may enter into a TBA transaction with the intent to take possession of or deliver the underlying MBS, or a fund may elect to extend the settlement by entering into either a mortgage or reverse mortgage dollar roll. Mortgage dollar rolls are transactions where a fund sells TBA securities and simultaneously agrees to repurchase MBS on a later date at a lower price and with the same counterparty. Reverse mortgage dollar rolls involve the purchase and simultaneous agreement to sell TBA securities on a later date at a lower price. Transactions in mortgage dollar rolls and reverse mortgage dollar rolls are accounted for as purchases and sales and may result in an increase to a fund's portfolio turnover rate.
Purchases and sales of TBA securities involve risks similar to those discussed above for delayed delivery and when-issued securities. Also, if the counterparty in a mortgage dollar roll or a reverse mortgage dollar roll transaction files for bankruptcy or becomes insolvent, a fund's right to repurchase or sell securities may be limited. Additionally, when a fund sells TBA securities without already owning or having the right to obtain the deliverable securities (an uncovered forward commitment to sell), it incurs a risk of loss because it could have to purchase the securities at a price that is higher than the price at which it sold them. A fund may be unable to purchase the deliverable securities if the corresponding market is illiquid.
TBA securities subject to a forward commitment to sell at period end are included at the end of the Schedule of Investments under the caption "TBA Sale Commitments." The proceeds and value of these commitments are reflected in the Statement of Assets and Liabilities as "Receivable for TBA sale commitments" and "TBA sale commitments, at value," respectively.
Restricted Securities (including Private Placements). Funds may invest in securities that are subject to legal or contractual restrictions on resale. These securities generally may be resold in transactions exempt from registration or to the public if the securities are registered. Disposal of these securities may involve time-consuming negotiations and expense, and prompt sale at an acceptable price may be difficult. Information regarding restricted securities held at period end is included at the end of the Schedule of Investments, if applicable.
4. Derivative Instruments.
Risk Exposures and the Use of Derivative Instruments. Investment objectives allow a fund to enter into various types of derivative contracts, including futures contracts and swaps. Derivatives are investments whose value is primarily derived from underlying assets, indices or reference rates and may be transacted on an exchange or over-the-counter (OTC). Derivatives may involve a future commitment to buy or sell a specified asset based on specified terms, to exchange future cash flows at periodic intervals based on a notional principal amount, or for one party to make one or more payments upon the occurrence of specified events in exchange for periodic payments from the other party.
Derivatives were used to increase returns, to gain exposure to certain types of assets and to manage exposure to certain risks as defined below. The success of any strategy involving derivatives depends on analysis of numerous economic factors, and if the strategies for investment do not work as intended, the objectives may not be achieved.
Derivatives were used to increase or decrease exposure to the following risks:
| Credit Risk | Credit risk relates to the ability of the issuer of a financial instrument to make further principal or interest payments on an obligation or commitment that it has to a fund. |
| Interest Rate Risk | Interest rate risk relates to the fluctuations in the value of interest-bearing securities due to changes in the prevailing levels of market interest rates. |
Funds are also exposed to additional risks from investing in derivatives, such as liquidity risk and counterparty credit risk. Liquidity risk is the risk that a fund will be unable to close out the derivative in the open market in a timely manner. Counterparty credit risk is the risk that the counterparty will not be able to fulfill its obligation to a fund. Derivative counterparty credit risk is managed through formal evaluation of the creditworthiness of all potential counterparties. On certain OTC derivatives such as bi-lateral swaps, a fund attempts to reduce its exposure to counterparty credit risk by entering into an International Swaps and Derivatives Association, Inc. (ISDA) Master Agreement with each of its counterparties. The ISDA Master Agreement gives a fund the right to terminate all transactions traded under such agreement upon the deterioration in the credit quality of the counterparty beyond specified levels. The ISDA Master Agreement gives each party the right, upon an event of default by the other party or a termination of the agreement, to close out all transactions traded under such agreement and to net amounts owed under each transaction to one net payable by one party to the other. To mitigate counterparty credit risk on bi-lateral OTC derivatives, a fund receives collateral in the form of cash or securities once net unrealized appreciation on outstanding derivative contracts under an ISDA Master Agreement exceeds certain applicable thresholds, subject to certain minimum transfer provisions. The collateral received is held in segregated accounts with the custodian bank in accordance with the collateral agreements entered into between a fund, the counterparty and the custodian bank. A fund could experience delays and costs in gaining access to the collateral even though it is held by the custodian bank. The maximum risk of loss to a fund from counterparty credit risk related to bi-lateral OTC derivatives is generally the aggregate unrealized appreciation and unpaid counterparty payments in excess of any collateral pledged by the counterparty to a fund. A fund may be required to pledge collateral for the benefit of the counterparties on bi-lateral OTC derivatives in an amount not less than each counterparty's unrealized appreciation on outstanding derivative contracts, subject to certain minimum transfer provisions, and any such pledged collateral is identified in the Schedule of Investments. Exchange-traded contracts are not covered by the ISDA Master Agreement; however counterparty credit risk related to these contracts may be mitigated by the protection provided by the exchange on which they trade.
Investing in derivatives may involve greater risks than investing in the underlying assets directly and, to varying degrees, may involve risk of loss in excess of any initial investment and collateral received and amounts recognized in the Statement of Assets and Liabilities. In addition, there may be the risk that the change in value of the derivative contract does not correspond to the change in value of the underlying instrument.
Net Realized Gain (Loss) and Change in Net Unrealized Appreciation (Depreciation) on Derivatives. The table below, which reflects the impacts of derivatives on the financial performance, summarizes the net realized gain (loss) and change in net unrealized appreciation (depreciation) for derivatives during the period as presented in the Statement of Operations.
| Primary Risk Exposure / Derivative Type | Net Realized Gain (Loss) | Change in Net Unrealized Appreciation (Depreciation) |
| VIP Investment Grade Bond Portfolio | ||
| Credit Risk | ||
| Swaps | $(9,568) | $140,224 |
| Total Credit Risk | (9,568) | 140,224 |
| Interest Rate Risk | ||
| Futures Contracts | 1,981,373 | 75,242 |
| Total Interest Rate Risk | 1,981,373 | 75,242 |
| Totals | $1,971,805 | $215,466 |
If there are any open positions at period end, a summary of the value of derivatives by primary risk exposure is included at the end of the Schedule of Investments.
Futures Contracts. A futures contract is an agreement between two parties to buy or sell a specified underlying instrument for a fixed price at a specified future date. Futures contracts were used to manage exposure to the bond market and fluctuations in interest rates.
Upon entering into a futures contract, a fund is required to deposit either cash or securities (initial margin) with a clearing broker in an amount equal to a certain percentage of the face value of the contract. Futures contracts are marked-to-market daily and subsequent daily payments are made or received by a fund depending on the daily fluctuations in the value of the futures contracts and are recorded as unrealized appreciation or (depreciation). This receivable and/or payable, if any, is included in daily variation margin on futures contracts in the Statement of Assets and Liabilities. Realized gain or (loss) is recorded upon the expiration or closing of a futures contract. The net realized gain (loss) and change in net unrealized appreciation (depreciation) on futures contracts during the period is presented in the Statement of Operations.
Any open futures contracts at period end are presented in the Schedule of Investments under the caption "Futures Contracts". The notional amount at value reflects each contract's exposure to the underlying instrument or index at period end, and is representative of volume of activity during the period unless an average notional amount is presented. Any securities deposited to meet initial margin requirements are identified in the Schedule of Investments. Any cash deposited to meet initial margin requirements is presented as segregated cash with brokers for derivative instruments in the Statement of Assets and Liabilities.
Swaps. A swap is a contract between two parties to exchange future cash flows at periodic intervals based on a notional principal amount. A bi-lateral OTC swap is a transaction between a fund and a dealer counterparty where cash flows are exchanged between the two parties for the life of the swap.
Bi-lateral OTC swaps are marked-to-market daily and changes in value are reflected in the Statement of Assets and Liabilities in the bi-lateral OTC swaps at value line items. Any upfront premiums paid or received upon entering a bi-lateral OTC swap to compensate for differences between stated terms of the swap and prevailing market conditions (e.g. credit spreads, interest rates or other factors) are recorded in net unrealized appreciation (depreciation) in the Statement of Assets and Liabilities and amortized to realized gain or (loss) ratably over the term of the swap. Any unamortized upfront premiums are presented in the Schedule of Investments.
Any securities deposited to meet initial margin requirements are identified in the Schedule of Investments. Any cash deposited to meet initial margin requirements is presented in segregated cash with brokers for derivative instruments in the Statement of Assets and Liabilities.
Payments are exchanged at specified intervals, accrued daily commencing with the effective date of the contract and recorded as realized gain or (loss). Some swaps may be terminated prior to the effective date and realize a gain or loss upon termination. The net realized gain (loss) and change in net unrealized appreciation (depreciation) on swaps during the period is presented in the Statement of Operations.
Any open swaps at period end are included in the Schedule of Investments under the caption "Swaps", and are representative of volume of activity during the period unless an average notional amount is presented.
Credit Default Swaps. Credit default swaps enable a fund to buy or sell protection against specified credit events on a single-name issuer or a traded credit index. Under the terms of a credit default swap the buyer of protection (buyer) receives credit protection in exchange for making periodic payments to the seller of protection (seller) based on a fixed percentage applied to a notional principal amount. In return for these payments, the seller will be required to make a payment upon the occurrence of one or more specified credit events. A fund enters into credit default swaps as a seller to gain credit exposure to an issuer and/or as a buyer to obtain a measure of protection against defaults of an issuer. Periodic payments are made over the life of the contract by the buyer provided that no credit event occurs.
For credit default swaps on most corporate and sovereign issuers, credit events include bankruptcy, failure to pay or repudiation/moratorium. For credit default swaps on corporate or sovereign issuers, the obligation that may be put to the seller is not limited to the specific reference obligation described in the Schedule of Investments. For credit default swaps on asset-backed securities, a credit event may be triggered by events such as failure to pay principal, maturity extension, rating downgrade or write-down. For credit default swaps on asset-backed securities, the reference obligation described represents the security that may be put to the seller. For credit default swaps on a traded credit index, a specified credit event may affect all or individual underlying securities included in the index.
As a seller, if an underlying credit event occurs, a fund will pay a net settlement amount of cash equal to the notional amount of the swap less the recovery value of the reference obligation or underlying securities comprising an index. Only in the event of the industry's inability to value the underlying asset will a fund be required to take delivery of the reference obligation or underlying securities comprising an index and pay an amount equal to the notional amount of the swap.
As a buyer, if an underlying credit event occurs, a fund will receive a net settlement amount of cash equal to the notional amount of the swap less the recovery value of the reference obligation or underlying securities comprising an index. Only in the event of the industry's inability to value the underlying asset will a fund be required to deliver the reference obligation or underlying securities comprising an index in exchange for payment of an amount equal to the notional amount of the swap.
Typically, the value of each credit default swap and credit rating disclosed for each reference obligation in the Schedule of Investments, where a fund is the seller, can be used as measures of the current payment/performance risk of the swap. As the value of the swap changes as a positive or negative percentage of the total notional amount, the payment/performance risk may decrease or increase, respectively. In addition to these measures, the investment adviser monitors a variety of factors including cash flow assumptions, market activity and market sentiment as part of its ongoing process of assessing payment/performance risk.
5. Purchases and Sales of Investments.
Purchases and sales of securities, other than short-term securities, U.S. government securities, and in-kind transactions, as applicable, are noted in the table below.
| Purchases ($) | Sales ($) | |
| VIP Investment Grade Bond Portfolio | 2,456,995,414 | 2,226,375,629 |
6. Fees and Other Transactions with Affiliates.
Management Fee. Fidelity Management & Research Company LLC (the investment adviser) and its affiliates provide the Fund with investment management related services for which the Fund pays a monthly management fee. The management fee is the sum of an individual fund fee rate that is based on an annual rate of .20% of the Fund's average net assets and an annualized group fee rate that averaged .10% during the period. The group fee rate is based upon the monthly average net assets of a group of registered investment companies with which the investment adviser has management contracts. The group fee rate decreases as assets under management increase and increases as assets under management decrease. For the reporting period, the total annualized management fee rate was .30% of the Fund's average net assets.
Distribution and Service Plan Fees. In accordance with Rule 12b-1 of the 1940 Act, the Fund has adopted separate 12b-1 Plans for each Service Class of shares. Each Service Class pays Fidelity Distributors Company LLC (FDC), an affiliate of the investment adviser, a service fee. For the period, the service fee is based on an annual rate of .10% of Service Class' average net assets and .25% of Service Class 2's average net assets.
For the period, total fees, all of which were re-allowed to insurance companies for the distribution of shares and providing shareholder support services, were as follows:
| Service Class | $342,928 |
| Service Class 2 | 2,509,952 |
| $2,852,880 |
Transfer Agent Fees. Fidelity Investments Institutional Operations Company LLC (FIIOC), an affiliate of the investment adviser, is the Fund's transfer, dividend disbursing, and shareholder servicing agent. FIIOC receives an asset-based fee with respect to each class. Each class pays a fee for transfer agent services, typesetting and printing and mailing of shareholder reports, excluding mailing of proxy statements. For the period, transfer agent fees for each class were as follows:
| Amount | % of Class-Level Average Net Assets(a) | |
| Initial Class | $380,716 | .07 |
| Service Class | 233,191 | .07 |
| Service Class 2 | 682,707 | .07 |
| Investor Class | 589,573 | .10 |
| $1,886,187 |
(a) Annualized
Accounting Fees. Fidelity Service Company, Inc. (FSC), an affiliate of the investment adviser, maintains the Fund's accounting records. The accounting fee is based on the level of average net assets for each month. For the period, the fees were equivalent to the following annualized rates:
| % of Average Net Assets | |
| VIP Investment Grade Bond Portfolio | .02 |
Interfund Trades. Funds may purchase from or sell securities to other Fidelity Funds under procedures adopted by the Board. The procedures have been designed to ensure these interfund trades are executed in accordance with Rule 17a-7 of the 1940 Act. Any interfund trades are included within the respective purchases and sales amounts shown in the Purchases and Sales of Investments note. During the period, there were no interfund trades.
Affiliated Redemptions In-Kind. Shares that were redeemed in-kind for investments, including accrued interest and cash, if any, are shown in the table below. The net realized gain or loss on investments delivered through in-kind redemptions is included in the accompanying Statement of Operations. The amount of the in-kind redemptions is included in share transactions in the accompanying Statement of Changes in Net Assets. There was no gain or loss for federal income tax purposes.
| Shares | Total net realized gain or loss ($) | Total Proceeds ($) | Participating classes | |
| VIP Investment Grade Bond Portfolio | 76,985,281 | (80,678,663) | 894,442,739 | Initial Class & Investor Class |
Prior Fiscal Year Affiliated Exchanges In-Kind. During the prior period, the Fund redeemed 48,402,199 shares of Fidelity VIP Investment Grade Central Fund in exchange for investments, including accrued interest and cash, if any, with a value of $5,391,666,950. The Fund had a net realized gain of $211,422,352 on the Fund's redemptions of Fidelity VIP Investment Grade Central Fund shares. The Fund recognized net gain on the exchanges for federal income tax purposes.
7. Committed Line of Credit.
Certain Funds participate with other funds managed by the investment adviser or an affiliate in a $4.25 billion credit facility (the "line of credit") to be utilized for temporary or emergency purposes to fund shareholder redemptions or for other short-term liquidity purposes. The participating funds have agreed to pay commitment fees on their pro-rata portion of the line of credit, which are reflected in Miscellaneous expenses on the Statement of Operations, and are listed below. During the period, there were no borrowings on this line of credit.
| Amount | |
| VIP Investment Grade Bond Portfolio | $4,514 |
8. Security Lending.
Funds lend portfolio securities from time to time in order to earn additional income. Lending agents are used, including National Financial Services (NFS), an affiliate of the investment adviser. Pursuant to a securities lending agreement, NFS will receive a fee, which is capped at 9.9% of a fund's daily lending revenue, for its services as lending agent. A fund may lend securities to certain qualified borrowers, including NFS. On the settlement date of the loan, a fund receives collateral (in the form of U.S. Treasury obligations, letters of credit and/or cash) against the loaned securities and maintains collateral in an amount not less than 100% of the market value of the loaned securities during the period of the loan. The market value of the loaned securities is determined at the close of business of a fund and any additional required collateral is delivered to a fund on the next business day. A fund or borrower may terminate the loan at any time, and if the borrower defaults on its obligation to return the securities loaned because of insolvency or other reasons, a fund may apply collateral received from the borrower against the obligation. A fund may experience delays and costs in recovering the securities loaned. Any cash collateral received is invested in the Fidelity Securities Lending Cash Central Fund. Any loaned securities are identified as such in the Schedule of Investments, and the value of loaned securities and cash collateral at period end, as applicable, are presented in the Statement of Assets and Liabilities. Security lending income represents the income earned on investing cash collateral, less rebates paid to borrowers and any lending agent fees associated with the loan, plus any premium payments received for lending certain types of securities. Security lending income is presented in the Statement of Operations as a component of income from Fidelity Central Funds. Affiliated security lending activity, if any, was as follows:
| Total Security Lending Fees Paid to NFS | Security Lending Income From Securities Loaned to NFS | Value of Securities Loaned to NFS at Period End | |
| VIP Investment Grade Bond Portfolio | $6,226 | $– | $– |
9. Expense Reductions.
Through arrangements with the Fund's custodian, credits realized as a result of certain uninvested cash balances were used to reduce the Fund's expenses. During the period, custodian credits reduced the Fund's expenses by $32.
In addition, during the period the investment adviser or an affiliate reimbursed and/or waived a portion of fund-level operating expenses in the amount of $43,201.
10. Distributions to Shareholders.
Distributions to shareholders of each class were as follows:
| Six months ended June 30, 2022 | Year ended December 31, 2021 |
|
| VIP Investment Grade Bond Portfolio | ||
| Distributions to shareholders | ||
| Initial Class | $61,606,258 | $63,573,154 |
| Service Class | 34,558,149 | 33,731,276 |
| Service Class 2 | 104,830,942 | 96,642,003 |
| Investor Class | 62,680,386 | 65,199,065 |
| Total | $263,675,735 | $259,145,498 |
11. Share Transactions.
Transactions for each class of shares were as follows and may contain in-kind transactions:
| Shares | Shares | Dollars | Dollars | |
| Six months ended June 30, 2022 | Year ended December 31, 2021 | Six months ended June 30, 2022 | Year ended December 31, 2021 | |
| VIP Investment Grade Bond Portfolio | ||||
| Initial Class | ||||
| Shares sold | 34,349,875 | 23,787,330 | $400,433,348 | $326,447,227 |
| Reinvestment of distributions | 4,988,353 | 4,685,105 | 61,606,258 | 63,573,154 |
| Shares redeemed | (89,938,867) | (21,419,922) | (1,051,532,925) | (294,255,196) |
| Net increase (decrease) | (50,600,639) | 7,052,513 | $(589,493,319) | $95,765,185 |
| Service Class | ||||
| Shares sold | 10,115,168 | 14,736,969 | $119,134,268 | $200,617,709 |
| Reinvestment of distributions | 2,834,959 | 2,517,896 | 34,558,149 | 33,731,276 |
| Shares redeemed | (9,338,979) | (11,426,710) | (110,996,492) | (154,576,440) |
| Net increase (decrease) | 3,611,148 | 5,828,155 | $42,695,925 | $79,772,545 |
| Service Class 2 | ||||
| Shares sold | 7,513,990 | 29,363,179 | $91,400,645 | $392,701,313 |
| Reinvestment of distributions | 8,750,496 | 7,325,672 | 104,830,942 | 96,642,003 |
| Shares redeemed | (9,533,214) | (13,231,365) | (111,174,502) | (177,343,438) |
| Net increase (decrease) | 6,731,272 | 23,457,486 | $85,057,085 | $311,999,878 |
| Investor Class | ||||
| Shares sold | 2,953,658 | 11,506,591 | $35,646,284 | $157,377,309 |
| Reinvestment of distributions | 5,100,150 | 4,825,246 | 62,680,386 | 65,199,065 |
| Shares redeemed | (39,711,549) | (16,917,270) | (465,472,809) | (231,193,115) |
| Net increase (decrease) | (31,657,741) | (585,433) | $(367,146,139) | $(8,616,741) |
12. Other.
A fund's organizational documents provide former and current trustees and officers with a limited indemnification against liabilities arising in connection with the performance of their duties to the fund. In the normal course of business, a fund may also enter into contracts that provide general indemnifications. A fund's maximum exposure under these arrangements is unknown as this would be dependent on future claims that may be made against a fund. The risk of material loss from such claims is considered remote.
At the end of the period, the investment adviser or its affiliates were owners of record of more than 10% and certain otherwise unaffiliated shareholders were owners of record of more than 10% of the outstanding shares as follows:
| Fund | Affiliated % | Number of Unaffiliated Shareholders | Unaffiliated Shareholders % |
| VIP Investment Grade Bond Portfolio | 24% | 1 | 40% |
13. Coronavirus (COVID-19) Pandemic.
An outbreak of COVID-19 first detected in China during December 2019 has since spread globally and was declared a pandemic by the World Health Organization during March 2020. Developments that disrupt global economies and financial markets, such as the COVID-19 pandemic, may magnify factors that affect the Fund's performance.
Shareholder Expense Example
As a shareholder, you incur two types of costs: (1) transaction costs, which may include sales charges (loads) on purchase payments or redemption proceeds, as applicable and (2) ongoing costs, which generally include management fees, distribution and/or service (12b-1) fees and other Fund expenses. This Example is intended to help you understand your ongoing costs (in dollars) of investing in a fund and to compare these costs with the ongoing costs of investing in other mutual funds.
The Example is based on an investment of $1,000 invested at the beginning of the period and held for the entire period (January 1, 2022 to June 30, 2022).
Actual Expenses
The first line of the accompanying table provides information about actual account values and actual expenses. You may use the information in this line, together with the amount you invested, to estimate the expenses that you paid over the period. Simply divide your account value by $1,000.00 (for example, an $8,600 account value divided by $1,000.00 = 8.6), then multiply the result by the number in the first line for a class/Fund under the heading entitled "Expenses Paid During Period" to estimate the expenses you paid on your account during this period. If any fund is a shareholder of any underlying mutual funds or exchange-traded funds (ETFs) (the Underlying Funds), such fund indirectly bears its proportional share of the expenses of the Underlying Funds in addition to the direct expenses incurred presented in the table. These fees and expenses are not included in the annualized expense ratio used to calculate the expense estimate in the table below. The estimate of expenses does not include any fees or other expenses of any variable annuity or variable life insurance product. If they were, the estimate of expenses you paid during the period would be higher, and your ending account value would be lower.
Hypothetical Example for Comparison Purposes
The second line of the accompanying table provides information about hypothetical account values and hypothetical expenses based on the actual expense ratio and an assumed rate of return of 5% per year before expenses, which is not the actual return. The hypothetical account values and expenses may not be used to estimate the actual ending account balance or expenses you paid for the period. You may use this information to compare the ongoing costs of investing in the Fund and other funds. To do so, compare this 5% hypothetical example with the 5% hypothetical examples that appear in the shareholder reports of the other funds. If any fund is a shareholder of any Underlying Funds, such fund indirectly bears its proportional share of the expenses of the Underlying Funds in addition to the direct expenses as presented in the table. These fees and expenses are not included in the annualized expense ratio used to calculate the expense estimate in the table below. The estimate of expenses does not include any fees or other expenses of any variable annuity or variable life insurance product. If they were, the estimate of expenses you paid during the period would be higher, and your ending account value would be lower.
Please note that the expenses shown in the table are meant to highlight your ongoing costs only and do not reflect any transaction costs. Therefore, the second line of the table is useful in comparing ongoing costs only, and will not help you determine the relative total costs of owning different funds. In addition, if these transactional costs were included, your costs would have been higher.
| Annualized Expense Ratio-A | Beginning Account Value January 1, 2022 | Ending Account Value June 30, 2022 | Expenses Paid During Period-B January 1, 2022 to June 30, 2022 |
|
| VIP Investment Grade Bond Portfolio | ||||
| Initial Class | .40% | |||
| Actual | $1,000.00 | $894.20 | $1.88 | |
| Hypothetical-C | $1,000.00 | $1,022.81 | $2.01 | |
| Service Class | .50% | |||
| Actual | $1,000.00 | $893.60 | $2.35 | |
| Hypothetical-C | $1,000.00 | $1,022.32 | $2.51 | |
| Service Class 2 | .65% | |||
| Actual | $1,000.00 | $892.70 | $3.05 | |
| Hypothetical-C | $1,000.00 | $1,021.57 | $3.26 | |
| Investor Class | .43% | |||
| Actual | $1,000.00 | $893.70 | $2.02 | |
| Hypothetical-C | $1,000.00 | $1,022.66 | $2.16 |
A Annualized expense ratio reflects expenses net of applicable fee waivers.
B Expenses are equal to the annualized expense ratio, multiplied by the average account value over the period, multiplied by 181/ 365 (to reflect the one-half year period). The fees and expenses of any Underlying Funds are not included in each annualized expense ratio.
C 5% return per year before expenses
Liquidity Risk Management Program
The Securities and Exchange Commission adopted Rule 22e-4 under the Investment Company Act of 1940 (the Liquidity Rule) to promote effective liquidity risk management throughout the open-end investment company industry, thereby reducing the risk that funds will be unable to meet their redemption obligations and mitigating dilution of the interests of fund shareholders.
The Fund has adopted and implemented a liquidity risk management program pursuant to the Liquidity Rule (the Program) effective December 1, 2018. The Program is reasonably designed to assess and manage the Fund’s liquidity risk and to comply with the requirements of the Liquidity Rule. The Fund’s Board of Trustees (the Board) has designated the Fund’s investment adviser as administrator of the Program. The Fidelity advisers have established a Liquidity Risk Management Committee (the LRM Committee) to manage the Program for each of the Fidelity Funds. The LRM Committee monitors the adequacy and effectiveness of implementation of the Program and on a periodic basis assesses each Fund’s liquidity risk based on a variety of factors including (1) the Fund’s investment strategy, (2) portfolio liquidity and cash flow projections during normal and reasonably foreseeable stressed conditions, (3) shareholder redemptions, (4) borrowings and other funding sources and (5) in the case of exchange-traded funds, certain additional factors including the effect of the Fund’s prices and spreads, market participants, and basket compositions on the overall liquidity of the Fund’s portfolio, as applicable.
In accordance with the Program, each of the Fund’s portfolio investments is classified into one of four liquidity categories described below based on a determination of a reasonable expectation for how long it would take to convert the investment to cash (or sell or dispose of the investment) without significantly changing its market value.
- Highly liquid investments – cash or convertible to cash within three business days or less
- Moderately liquid investments – convertible to cash in three to seven calendar days
- Less liquid investments – can be sold or disposed of, but not settled, within seven calendar days
- Illiquid investments – cannot be sold or disposed of within seven calendar days
Liquidity classification determinations take into account a variety of factors including various market, trading and investment-specific considerations, as well as market depth, and generally utilize analysis from a third-party liquidity metrics service.
The Liquidity Rule places a 15% limit on a fund’s illiquid investments and requires funds that do not primarily hold assets that are highly liquid investments to determine and maintain a minimum percentage of the fund’s net assets to be invested in highly liquid investments (highly liquid investment minimum or HLIM). The Program includes provisions reasonably designed to comply with the 15% limit on illiquid investments and for determining, periodically reviewing and complying with the HLIM requirement as applicable.
At a recent meeting of the Fund’s Board of Trustees, the LRM Committee provided a written report to the Board pertaining to the operation, adequacy, and effectiveness of implementation of the Program for the annual period from December 1, 2020 through November 30, 2021. The report concluded that the Program has been implemented and is operating effectively and is reasonably designed to assess and manage the Fund’s liquidity risk.
![]()
VIPIGB-SANN-0822
1.705629.124
Investment Grade Bond II Portfolio
Semi-Annual Report
June 30, 2022
Contents
|
Board Approval of Investment Advisory Contracts and Management Fees |
To view a fund's proxy voting guidelines and proxy voting record for the 12-month period ended June 30, visit http://www.fidelity.com/proxyvotingresults or visit the Securities and Exchange Commission's (SEC) web site at http://www.sec.gov.
You may also call 1-877-208-0098 to request a free copy of the proxy voting guidelines.
Fidelity® Variable Insurance Products are separate account options which are purchased through a variable insurance contract.
Standard & Poor's, S&P and S&P 500 are registered service marks of The McGraw-Hill Companies, Inc. and have been licensed for use by Fidelity Distributors Corporation.
Other third-party marks appearing herein are the property of their respective owners.
All other marks appearing herein are registered or unregistered trademarks or service marks of FMR LLC or an affiliated company. © 2022 FMR LLC. All rights reserved.
This report and the financial statements contained herein are submitted for the general information of the shareholders of the Fund. This report is not authorized for distribution to prospective investors in the Fund unless preceded or accompanied by an effective prospectus.
A fund files its complete schedule of portfolio holdings with the SEC for the first and third quarters of each fiscal year on Form N-PORT. Forms N-PORT are available on the SEC’s web site at http://www.sec.gov. A fund's Forms N-PORT may be reviewed and copied at the SEC’s Public Reference Room in Washington, DC. Information regarding the operation of the SEC's Public Reference Room may be obtained by calling 1-800-SEC-0330.
For a complete list of a fund's portfolio holdings, view the most recent holdings listing, semiannual report, or annual report on Fidelity's web site at http://www.fidelity.com, http://www.institutional.fidelity.com, or http://www.401k.com, as applicable.
NOT FDIC INSURED •MAY LOSE VALUE •NO BANK GUARANTEE
Neither the Fund nor Fidelity Distributors Corporation is a bank.
Note to Shareholders:
Early in 2020, the outbreak and spread of COVID-19 emerged as a public health emergency that had a major influence on financial markets, primarily based on its impact on the global economy and corporate earnings. On March 11, 2020, the World Health Organization declared the COVID-19 outbreak a pandemic, citing sustained risk of further global spread. The pandemic prompted a number of measures to limit the spread of COVID-19, including travel and border restrictions, quarantines, and restrictions on large gatherings. In turn, these resulted in lower consumer activity, diminished demand for a wide range of products and services, disruption in manufacturing and supply chains, and – given the wide variability in outcomes regarding the outbreak – significant market uncertainty and volatility. To help stem the turmoil, the U.S. government took unprecedented action – in concert with the U.S. Federal Reserve and central banks around the world – to help support consumers, businesses, and the broader economy, and to limit disruption to the financial system.
In general, the overall impact of the pandemic lessened in 2021, amid a resilient economy and widespread distribution of three COVID-19 vaccines granted emergency use authorization from the U.S. Food and Drug Administration (FDA) early in the year. Still, the situation remains dynamic, and the extent and duration of its influence on financial markets and the economy is highly uncertain, due in part to a recent spike in cases based on highly contagious variants of the coronavirus.
Extreme events such as the COVID-19 crisis are exogenous shocks that can have significant adverse effects on mutual funds and their investments. Although multiple asset classes may be affected by market disruption, the duration and impact may not be the same for all types of assets. Fidelity is committed to helping you stay informed amid news about COVID-19 and during increased market volatility, and we continue to take extra steps to be responsive to customer needs. We encourage you to visit us online, where we offer ongoing updates, commentary, and analysis on the markets and our funds.
Investment Summary (Unaudited)
Quality Diversification (% of fund's net assets)
| As of June 30, 2022 | ||
| U.S. Government and U.S. Government Agency Obligations | 59.6% | |
| AAA | 5.7% | |
| AA | 2.1% | |
| A | 10.0% | |
| BBB | 18.6% | |
| BB and Below | 3.4% | |
| Not Rated | 1.7% | |
| Short-Term Investments and Net Other Assets* | (1.1)% | |

* Short-Term Investments and Net Other Assets are not included in the pie chart
We have used ratings from Moody's Investors Service, Inc. Where Moody's® ratings are not available, we have used S&P® ratings. All ratings are as of the date indicated and do not reflect subsequent changes.
Securities rated BB or below were rated investment grade at the time of acquisition. The information in the above tables is based on the combined investments of the Fund and its pro-rata share of investments of Fidelity's fixed-income central funds.
Asset Allocation (% of fund's net assets)
| As of June 30, 2022*,** | ||
| Corporate Bonds | 31.6% | |
| U.S. Government and U.S. Government Agency Obligations | 59.6% | |
| Asset-Backed Securities | 3.2% | |
| CMOs and Other Mortgage Related Securities | 4.5% | |
| Municipal Bonds | 0.7% | |
| Other Investments | 1.5% | |
| Short-Term Investments and Net Other Assets (Liabilities)*** | (1.1)% | |
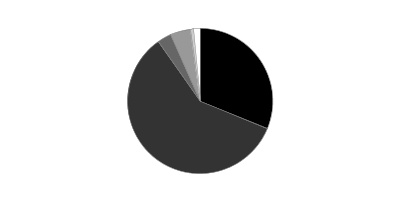
* Futures and Swaps - 0.9%
** Foreign investments - 9.0%
*** Short-Term Investments and Net Other Assets (Liabilities) are not included in the pie chart
The information in the above table is based on the combined investments of the fund and its pro-rata share of the investments in each non-money market Fidelity Central Fund.
An unaudited holdings listing for the Fund, which presents direct holdings as well as the pro-rata share of any securities and other investments held indirectly through its investment in underlying non-money market Fidelity Central Funds, is available at fidelity.com and/or institutional.fidelity.com, as applicable.
Percentages in the above tables are adjusted for the effect of TBA Sale Commitments.
Schedule of Investments June 30, 2022 (Unaudited)
Showing Percentage of Net Assets
| Nonconvertible Bonds - 31.1% | |||
| Principal Amount | Value | ||
| COMMUNICATION SERVICES - 3.0% | |||
| Diversified Telecommunication Services - 0.7% | |||
| AT&T, Inc.: | |||
| 1.65% 2/1/28 | $284,000 | $245,692 | |
| 2.25% 2/1/32 | 467,000 | 381,531 | |
| 2.55% 12/1/33 | 1,877,000 | 1,522,686 | |
| 2.75% 6/1/31 | 509,000 | 439,526 | |
| 2.95% 7/15/26 | 219,000 | 209,656 | |
| 3.3% 2/1/52 | 484,000 | 355,230 | |
| 3.5% 6/1/41 | 261,000 | 208,402 | |
| 3.5% 9/15/53 | 864,000 | 654,911 | |
| 3.55% 9/15/55 | 1,880,000 | 1,408,571 | |
| 3.65% 6/1/51 | 400,000 | 312,851 | |
| 3.65% 9/15/59 | 1,076,000 | 805,868 | |
| 3.8% 2/15/27 | 247,000 | 241,973 | |
| 3.8% 12/1/57 | 1,915,000 | 1,478,998 | |
| 4.35% 6/15/45 | 175,000 | 152,788 | |
| 4.5% 3/9/48 | 224,000 | 198,492 | |
| 4.65% 6/1/44 | 216,000 | 196,102 | |
| Orange SA 5.5% 2/6/44 | 82,000 | 85,426 | |
| Telefonica Emisiones S.A.U.: | |||
| 4.103% 3/8/27 | 367,000 | 359,305 | |
| 5.213% 3/8/47 | 180,000 | 159,520 | |
| 7.045% 6/20/36 | 71,000 | 79,242 | |
| Verizon Communications, Inc.: | |||
| 1.5% 9/18/30 | 110,000 | 87,913 | |
| 1.68% 10/30/30 | 92,000 | 74,144 | |
| 2.1% 3/22/28 | 751,000 | 667,054 | |
| 2.355% 3/15/32 | 1,607,000 | 1,332,426 | |
| 2.55% 3/21/31 | 2,142,000 | 1,831,426 | |
| 2.987% 10/30/56 | 2,392,000 | 1,660,699 | |
| 3% 3/22/27 | 163,000 | 154,820 | |
| 3.55% 3/22/51 | 299,000 | 239,700 | |
| 4.125% 3/16/27 | 192,000 | 191,536 | |
| 4.272% 1/15/36 | 666,000 | 627,052 | |
| 4.329% 9/21/28 | 419,000 | 416,718 | |
| 4.4% 11/1/34 | 103,000 | 98,695 | |
| 4.75% 11/1/41 | 27,000 | 25,810 | |
| 4.862% 8/21/46 | 934,000 | 919,211 | |
| 5.012% 4/15/49 | 67,000 | 68,012 | |
| 5.012% 8/21/54 | 344,000 | 349,449 | |
| 18,241,435 | |||
| Entertainment - 0.2% | |||
| The Walt Disney Co.: | |||
| 2% 9/1/29 | 286,000 | 245,776 | |
| 2.65% 1/13/31 | 435,000 | 382,839 | |
| 2.75% 9/1/49 | 286,000 | 204,145 | |
| 3.5% 5/13/40 | 187,000 | 159,415 | |
| 3.6% 1/13/51 | 186,000 | 155,243 | |
| 3.7% 10/15/25 | 192,000 | 191,793 | |
| 3.8% 3/22/30 | 2,891,000 | 2,795,189 | |
| 3.8% 5/13/60 | 187,000 | 156,327 | |
| 4.7% 3/23/50 | 1,046,000 | 1,031,639 | |
| 5.4% 10/1/43 | 106,000 | 112,208 | |
| 6.15% 3/1/37 | 108,000 | 124,354 | |
| 6.15% 2/15/41 | 288,000 | 328,566 | |
| 5,887,494 | |||
| Interactive Media & Services - 0.0% | |||
| Alphabet, Inc.: | |||
| 0.45% 8/15/25 | 204,000 | 187,494 | |
| 1.1% 8/15/30 | 404,000 | 331,572 | |
| 1.998% 8/15/26 | 63,000 | 59,653 | |
| 2.05% 8/15/50 | 404,000 | 270,846 | |
| Baidu, Inc. 3.425% 4/7/30 | 334,000 | 306,572 | |
| 1,156,137 | |||
| Media - 1.6% | |||
| Charter Communications Operating LLC/Charter Communications Operating Capital Corp.: | |||
| 2.8% 4/1/31 | 701,000 | 561,401 | |
| 3.5% 6/1/41 | 924,000 | 646,708 | |
| 3.7% 4/1/51 | 243,000 | 164,437 | |
| 3.85% 4/1/61 | 2,000,000 | 1,315,271 | |
| 3.9% 6/1/52 | 4,000,000 | 2,776,857 | |
| 4.2% 3/15/28 | 302,000 | 282,159 | |
| 4.4% 4/1/33 | 318,000 | 283,922 | |
| 4.8% 3/1/50 | 6,000,000 | 4,754,161 | |
| 4.908% 7/23/25 | 704,000 | 705,633 | |
| 5.05% 3/30/29 | 167,000 | 160,731 | |
| 5.125% 7/1/49 | 339,000 | 280,597 | |
| 5.25% 4/1/53 | 318,000 | 268,714 | |
| 5.375% 5/1/47 | 2,438,000 | 2,075,863 | |
| 5.5% 4/1/63 | 318,000 | 270,109 | |
| 5.75% 4/1/48 | 143,000 | 128,179 | |
| 6.384% 10/23/35 | 369,000 | 371,108 | |
| 6.484% 10/23/45 | 474,000 | 460,808 | |
| 6.834% 10/23/55 | 3,000,000 | 3,014,976 | |
| Comcast Corp.: | |||
| 1.5% 2/15/31 | 390,000 | 313,439 | |
| 1.95% 1/15/31 | 70,000 | 58,230 | |
| 2.35% 1/15/27 | 653,000 | 608,699 | |
| 2.45% 8/15/52 | 390,000 | 258,848 | |
| 2.65% 2/1/30 | 216,000 | 193,278 | |
| 2.8% 1/15/51 | 224,000 | 158,481 | |
| 3.15% 3/1/26 | 137,000 | 133,353 | |
| 3.3% 2/1/27 | 327,000 | 317,836 | |
| 3.375% 8/15/25 | 376,000 | 370,676 | |
| 3.4% 4/1/30 | 200,000 | 187,655 | |
| 3.45% 2/1/50 | 204,000 | 162,270 | |
| 3.7% 4/15/24 | 284,000 | 284,680 | |
| 3.75% 4/1/40 | 160,000 | 140,234 | |
| 3.9% 3/1/38 | 135,000 | 122,092 | |
| 3.969% 11/1/47 | 143,000 | 123,655 | |
| 4% 3/1/48 | 329,000 | 285,999 | |
| 4.15% 10/15/28 | 517,000 | 515,565 | |
| 4.65% 7/15/42 | 319,000 | 304,858 | |
| Discovery Communications LLC: | |||
| 3.25% 4/1/23 | 64,000 | 63,815 | |
| 3.625% 5/15/30 | 765,000 | 680,188 | |
| 4% 9/15/55 | 314,000 | 219,959 | |
| 4.65% 5/15/50 | 1,508,000 | 1,185,833 | |
| 5.2% 9/20/47 | 230,000 | 197,289 | |
| Fox Corp.: | |||
| 4.03% 1/25/24 | 288,000 | 288,025 | |
| 4.709% 1/25/29 | 515,000 | 504,915 | |
| 5.476% 1/25/39 | 331,000 | 321,344 | |
| 5.576% 1/25/49 | 406,000 | 396,038 | |
| Magallanes, Inc.: | |||
| 3.428% 3/15/24 (a) | 513,000 | 502,910 | |
| 3.638% 3/15/25 (a) | 281,000 | 272,151 | |
| 3.755% 3/15/27 (a) | 853,000 | 800,107 | |
| 4.054% 3/15/29 (a) | 190,000 | 174,036 | |
| 4.279% 3/15/32 (a) | 4,437,000 | 3,965,535 | |
| 5.05% 3/15/42 (a) | 692,000 | 588,747 | |
| 5.141% 3/15/52 (a) | 5,724,000 | 4,804,439 | |
| Time Warner Cable LLC: | |||
| 4.5% 9/15/42 | 418,000 | 326,299 | |
| 5.5% 9/1/41 | 214,000 | 186,803 | |
| 5.875% 11/15/40 | 188,000 | 172,281 | |
| 6.55% 5/1/37 | 2,538,000 | 2,541,235 | |
| 7.3% 7/1/38 | 585,000 | 610,833 | |
| TWDC Enterprises 18 Corp.: | |||
| 1.85% 7/30/26 | 140,000 | 129,293 | |
| 3% 7/30/46 | 123,000 | 93,918 | |
| 3.15% 9/17/25 | 260,000 | 255,780 | |
| 4.125% 6/1/44 | 156,000 | 141,130 | |
| 42,484,385 | |||
| Wireless Telecommunication Services - 0.5% | |||
| America Movil S.A.B. de CV: | |||
| 3.625% 4/22/29 | 230,000 | 218,256 | |
| 6.125% 11/15/37 | 229,000 | 248,651 | |
| Rogers Communications, Inc.: | |||
| 2.9% 11/15/26 | 69,000 | 65,167 | |
| 3.2% 3/15/27 (a) | 594,000 | 563,414 | |
| 3.625% 12/15/25 | 55,000 | 53,943 | |
| 3.7% 11/15/49 | 167,000 | 127,265 | |
| 3.8% 3/15/32 (a) | 1,320,000 | 1,207,021 | |
| 4.1% 10/1/23 | 132,000 | 132,775 | |
| 5.45% 10/1/43 | 158,000 | 154,741 | |
| T-Mobile U.S.A., Inc.: | |||
| 2.05% 2/15/28 | 412,000 | 357,694 | |
| 2.25% 11/15/31 | 5,000,000 | 4,058,082 | |
| 3.3% 2/15/51 | 412,000 | 300,012 | |
| 3.5% 4/15/25 | 241,000 | 235,708 | |
| 3.75% 4/15/27 | 997,000 | 960,031 | |
| 3.875% 4/15/30 | 1,339,000 | 1,249,630 | |
| 4.375% 4/15/40 | 396,000 | 353,480 | |
| 4.5% 4/15/50 | 723,000 | 641,520 | |
| Vodafone Group PLC: | |||
| 4.375% 5/30/28 | 702,000 | 698,759 | |
| 5.125% 6/19/59 | 180,000 | 165,480 | |
| 5.25% 5/30/48 | 655,000 | 623,145 | |
| 12,414,774 | |||
| TOTAL COMMUNICATION SERVICES | 80,184,225 | ||
| CONSUMER DISCRETIONARY - 1.1% | |||
| Automobiles - 0.2% | |||
| American Honda Finance Corp.: | |||
| 1.2% 7/8/25 | 321,000 | 296,231 | |
| 2.3% 9/9/26 | 137,000 | 127,918 | |
| 3.55% 1/12/24 | 669,000 | 669,930 | |
| General Motors Co.: | |||
| 5% 10/1/28 | 189,000 | 183,123 | |
| 5.2% 4/1/45 | 117,000 | 98,274 | |
| 5.95% 4/1/49 | 173,000 | 160,650 | |
| 6.6% 4/1/36 | 160,000 | 162,030 | |
| 6.75% 4/1/46 | 196,000 | 196,663 | |
| 6.8% 10/1/27 | 364,000 | 383,242 | |
| General Motors Financial Co., Inc.: | |||
| 3.25% 1/5/23 | 197,000 | 196,666 | |
| 3.85% 1/5/28 | 192,000 | 176,019 | |
| 4% 1/15/25 | 169,000 | 166,565 | |
| 4% 10/6/26 | 101,000 | 96,448 | |
| 4.25% 5/15/23 | 261,000 | 261,889 | |
| 4.3% 7/13/25 | 340,000 | 334,500 | |
| 4.35% 1/17/27 | 219,000 | 210,088 | |
| 5.65% 1/17/29 | 587,000 | 585,574 | |
| Honda Motor Co. Ltd. 2.534% 3/10/27 | 489,000 | 457,512 | |
| Toyota Motor Corp.: | |||
| 0.681% 3/25/24 | 760,000 | 725,047 | |
| 2.358% 7/2/24 | 170,000 | 166,308 | |
| 2.362% 3/25/31 | 367,000 | 322,033 | |
| Volkswagen Group of America Finance LLC 3.125% 5/12/23 (a) | 627,000 | 622,510 | |
| 6,599,220 | |||
| Diversified Consumer Services - 0.1% | |||
| American University 3.672% 4/1/49 | 66,000 | 56,432 | |
| Duke University 2.832% 10/1/55 | 128,000 | 97,613 | |
| George Washington University: | |||
| 4.126% 9/15/48 | 192,000 | 176,542 | |
| 4.3% 9/15/44 | 55,000 | 51,983 | |
| Ingersoll-Rand Global Holding Co. Ltd.: | |||
| 3.75% 8/21/28 | 127,000 | 119,908 | |
| 4.25% 6/15/23 | 368,000 | 368,740 | |
| 4.3% 2/21/48 | 136,000 | 117,484 | |
| Massachusetts Institute of Technology: | |||
| 2.989% 7/1/50 | 128,000 | 104,794 | |
| 3.885% 7/1/2116 | 78,000 | 65,078 | |
| 3.959% 7/1/38 | 130,000 | 127,975 | |
| Northwestern University: | |||
| 3.662% 12/1/57 | 152,000 | 132,856 | |
| 4.643% 12/1/44 | 92,000 | 95,662 | |
| President and Fellows of Harvard College: | |||
| 3.3% 7/15/56 | 133,000 | 113,187 | |
| 3.619% 10/1/37 | 27,000 | 25,693 | |
| Rice University 3.774% 5/15/55 | 50,000 | 46,334 | |
| Trustees of Princeton Univ. 5.7% 3/1/39 | 27,000 | 31,775 | |
| University Notre Dame du Lac 3.438% 2/15/45 | 91,000 | 81,234 | |
| University of Chicago 3% 10/1/52 | 173,000 | 136,531 | |
| University of Southern California: | |||
| 2.945% 10/1/51 | 314,000 | 244,759 | |
| 5.25% 10/1/2111 | 55,000 | 57,424 | |
| 2,252,004 | |||
| Hotels, Restaurants & Leisure - 0.2% | |||
| Expedia, Inc. 3.25% 2/15/30 | 237,000 | 197,653 | |
| McDonald's Corp.: | |||
| 3.3% 7/1/25 | 165,000 | 163,911 | |
| 3.5% 7/1/27 | 475,000 | 465,416 | |
| 3.6% 7/1/30 | 448,000 | 426,470 | |
| 3.625% 9/1/49 | 339,000 | 279,899 | |
| 3.7% 1/30/26 | 463,000 | 461,584 | |
| 4.2% 4/1/50 | 164,000 | 146,466 | |
| 4.45% 3/1/47 | 156,000 | 144,565 | |
| 4.875% 12/9/45 | 149,000 | 146,393 | |
| 6.3% 3/1/38 | 193,000 | 218,804 | |
| Metropolitan Museum of Art 3.4% 7/1/45 | 82,000 | 73,026 | |
| Starbucks Corp.: | |||
| 2% 3/12/27 | 328,000 | 297,976 | |
| 2.45% 6/15/26 | 274,000 | 258,400 | |
| 3% 2/14/32 | 100,000 | 86,924 | |
| 3.5% 11/15/50 | 113,000 | 88,412 | |
| 3.8% 8/15/25 | 191,000 | 190,155 | |
| 3.85% 10/1/23 | 51,000 | 51,359 | |
| 4% 11/15/28 | 192,000 | 188,185 | |
| 4.5% 11/15/48 | 129,000 | 116,627 | |
| 4,002,225 | |||
| Household Durables - 0.0% | |||
| Lennar Corp. 4.75% 11/29/27 | 217,000 | 210,679 | |
| Internet & Direct Marketing Retail - 0.2% | |||
| Alibaba Group Holding Ltd.: | |||
| 2.125% 2/9/31 | 572,000 | 472,295 | |
| 3.15% 2/9/51 | 589,000 | 404,083 | |
| Amazon.com, Inc.: | |||
| 0.8% 6/3/25 | 302,000 | 281,169 | |
| 1% 5/12/26 | 176,000 | 160,055 | |
| 1.5% 6/3/30 | 534,000 | 443,688 | |
| 2.1% 5/12/31 | 181,000 | 155,055 | |
| 2.4% 2/22/23 | 435,000 | 434,303 | |
| 2.5% 6/3/50 | 175,000 | 123,339 | |
| 2.8% 8/22/24 | 178,000 | 176,588 | |
| 3.1% 5/12/51 | 181,000 | 142,531 | |
| 3.15% 8/22/27 | 287,000 | 279,042 | |
| 3.875% 8/22/37 | 301,000 | 285,323 | |
| 4.05% 8/22/47 | 522,000 | 488,593 | |
| 4.25% 8/22/57 | 249,000 | 233,607 | |
| 4.8% 12/5/34 | 165,000 | 172,802 | |
| 4,252,473 | |||
| Leisure Products - 0.0% | |||
| Hasbro, Inc. 3% 11/19/24 | 552,000 | 537,396 | |
| Multiline Retail - 0.0% | |||
| Dollar Tree, Inc. 4% 5/15/25 | 219,000 | 217,613 | |
| Kohl's Corp.: | |||
| 4.25% 7/17/25 | 100,000 | 95,077 | |
| 9.5% 5/15/25 | 43,000 | 45,393 | |
| Macy's Retail Holdings LLC 4.3% 2/15/43 | 130,000 | 81,900 | |
| Nordstrom, Inc.: | |||
| 4% 3/15/27 | 124,000 | 109,120 | |
| 5% 1/15/44 | 55,000 | 39,188 | |
| Target Corp.: | |||
| 3.9% 11/15/47 | 405,000 | 363,066 | |
| 4% 7/1/42 | 192,000 | 177,186 | |
| 1,128,543 | |||
| Specialty Retail - 0.4% | |||
| AutoNation, Inc.: | |||
| 3.85% 3/1/32 | 210,000 | 180,947 | |
| 4.75% 6/1/30 | 96,000 | 90,306 | |
| AutoZone, Inc.: | |||
| 3.125% 7/15/23 | 105,000 | 104,574 | |
| 3.25% 4/15/25 | 110,000 | 107,914 | |
| 3.625% 4/15/25 | 461,000 | 455,265 | |
| 3.75% 6/1/27 | 159,000 | 154,064 | |
| 4% 4/15/30 | 996,000 | 945,697 | |
| Lowe's Companies, Inc.: | |||
| 1.3% 4/15/28 | 220,000 | 185,824 | |
| 1.7% 10/15/30 | 334,000 | 267,830 | |
| 3.35% 4/1/27 | 85,000 | 81,798 | |
| 3.65% 4/5/29 | 294,000 | 277,181 | |
| 3.7% 4/15/46 | 96,000 | 76,942 | |
| 3.75% 4/1/32 | 899,000 | 834,062 | |
| 4.05% 5/3/47 | 315,000 | 262,986 | |
| 4.25% 4/1/52 | 1,065,000 | 922,234 | |
| 4.45% 4/1/62 | 1,098,000 | 937,921 | |
| 4.5% 4/15/30 | 811,000 | 801,270 | |
| O'Reilly Automotive, Inc.: | |||
| 3.85% 6/15/23 | 77,000 | 76,746 | |
| 4.2% 4/1/30 | 148,000 | 142,889 | |
| The Home Depot, Inc.: | |||
| 2.375% 3/15/51 | 180,000 | 121,725 | |
| 2.5% 4/15/27 | 333,000 | 314,385 | |
| 2.8% 9/14/27 | 137,000 | 130,667 | |
| 2.95% 6/15/29 | 574,000 | 535,706 | |
| 3% 4/1/26 | 275,000 | 269,595 | |
| 3.125% 12/15/49 | 183,000 | 142,243 | |
| 3.3% 4/15/40 | 167,000 | 141,774 | |
| 3.75% 2/15/24 | 184,000 | 185,843 | |
| 3.9% 12/6/28 | 158,000 | 157,945 | |
| 3.9% 6/15/47 | 235,000 | 210,080 | |
| 4.2% 4/1/43 | 43,000 | 40,187 | |
| 4.25% 4/1/46 | 90,000 | 84,474 | |
| 4.5% 12/6/48 | 205,000 | 199,752 | |
| 4.875% 2/15/44 | 79,000 | 80,174 | |
| 5.875% 12/16/36 | 405,000 | 465,661 | |
| 9,986,661 | |||
| Textiles, Apparel & Luxury Goods - 0.0% | |||
| NIKE, Inc.: | |||
| 2.4% 3/27/25 | 171,000 | 166,525 | |
| 2.85% 3/27/30 | 165,000 | 151,581 | |
| 3.25% 3/27/40 | 334,000 | 286,026 | |
| 3.375% 11/1/46 | 123,000 | 105,055 | |
| 3.375% 3/27/50 | 165,000 | 140,313 | |
| Tapestry, Inc. 3.05% 3/15/32 | 80,000 | 65,177 | |
| 914,677 | |||
| TOTAL CONSUMER DISCRETIONARY | 29,883,878 | ||
| CONSUMER STAPLES - 2.2% | |||
| Beverages - 1.2% | |||
| Anheuser-Busch Companies LLC / Anheuser-Busch InBev Worldwide, Inc. 4.9% 2/1/46 | 10,000,000 | 9,398,898 | |
| Anheuser-Busch InBev Finance, Inc.: | |||
| 4.625% 2/1/44 | 158,000 | 141,666 | |
| 4.7% 2/1/36 | 1,297,000 | 1,242,561 | |
| 4.9% 2/1/46 | 1,943,000 | 1,826,206 | |
| Anheuser-Busch InBev Worldwide, Inc.: | |||
| 3.5% 6/1/30 | 465,000 | 435,874 | |
| 4.35% 6/1/40 | 443,000 | 396,415 | |
| 4.439% 10/6/48 | 203,000 | 178,043 | |
| 4.5% 6/1/50 | 628,000 | 564,557 | |
| 4.6% 4/15/48 | 514,000 | 461,465 | |
| 4.6% 6/1/60 | 465,000 | 406,464 | |
| 4.75% 4/15/58 | 722,000 | 646,127 | |
| 5.45% 1/23/39 | 589,000 | 598,835 | |
| 5.55% 1/23/49 | 2,509,000 | 2,562,493 | |
| 5.8% 1/23/59 (Reg. S) | 1,804,000 | 1,876,313 | |
| 8.2% 1/15/39 | 77,000 | 99,408 | |
| Constellation Brands, Inc.: | |||
| 3.5% 5/9/27 | 274,000 | 263,032 | |
| 3.7% 12/6/26 | 207,000 | 201,522 | |
| 5.25% 11/15/48 | 199,000 | 195,352 | |
| Diageo Capital PLC: | |||
| 1.375% 9/29/25 | 380,000 | 354,549 | |
| 2% 4/29/30 | 407,000 | 347,202 | |
| 2.125% 4/29/32 | 367,000 | 306,080 | |
| Dr. Pepper Snapple Group, Inc. 3.8% 5/1/50 | 87,000 | 69,077 | |
| Molson Coors Beverage Co.: | |||
| 3% 7/15/26 | 1,419,000 | 1,332,804 | |
| 4.2% 7/15/46 | 363,000 | 298,016 | |
| 5% 5/1/42 | 1,644,000 | 1,519,772 | |
| PepsiCo, Inc.: | |||
| 1.4% 2/25/31 | 430,000 | 352,847 | |
| 1.625% 5/1/30 | 1,184,000 | 1,004,007 | |
| 2.375% 10/6/26 | 185,000 | 177,192 | |
| 3% 10/15/27 | 499,000 | 485,728 | |
| 3.6% 8/13/42 | 82,000 | 72,679 | |
| 3.875% 3/19/60 | 167,000 | 155,117 | |
| 4.25% 10/22/44 | 165,000 | 157,716 | |
| 4.45% 4/14/46 | 159,000 | 159,805 | |
| The Coca-Cola Co.: | |||
| 1.375% 3/15/31 | 334,000 | 271,875 | |
| 1.45% 6/1/27 | 230,000 | 208,146 | |
| 1.65% 6/1/30 | 230,000 | 195,035 | |
| 2.5% 6/1/40 | 230,000 | 179,947 | |
| 2.5% 3/15/51 | 167,000 | 120,945 | |
| 2.6% 6/1/50 | 230,000 | 171,274 | |
| 2.75% 6/1/60 | 230,000 | 162,660 | |
| 3.375% 3/25/27 | 713,000 | 706,932 | |
| 3.45% 3/25/30 | 436,000 | 424,096 | |
| 30,728,732 | |||
| Food & Staples Retailing - 0.2% | |||
| Costco Wholesale Corp.: | |||
| 1.375% 6/20/27 | 483,000 | 433,307 | |
| 2.75% 5/18/24 | 165,000 | 163,873 | |
| Kroger Co.: | |||
| 1.7% 1/15/31 | 145,000 | 115,613 | |
| 2.65% 10/15/26 | 78,000 | 72,964 | |
| 3.5% 2/1/26 | 110,000 | 108,789 | |
| 3.95% 1/15/50 | 100,000 | 84,364 | |
| 5.15% 8/1/43 | 75,000 | 73,469 | |
| 5.4% 1/15/49 | 178,000 | 186,253 | |
| Sysco Corp.: | |||
| 3.3% 7/15/26 | 90,000 | 87,041 | |
| 3.3% 2/15/50 | 387,000 | 288,569 | |
| 3.75% 10/1/25 | 156,000 | 154,721 | |
| 6.6% 4/1/40 | 270,000 | 306,558 | |
| Walgreens Boots Alliance, Inc.: | |||
| 3.2% 4/15/30 | 344,000 | 303,671 | |
| 3.45% 6/1/26 | 137,000 | 133,223 | |
| 4.65% 6/1/46 | 151,000 | 134,009 | |
| Walmart, Inc.: | |||
| 2.95% 9/24/49 | 173,000 | 138,798 | |
| 3.3% 4/22/24 | 521,000 | 522,001 | |
| 3.4% 6/26/23 | 257,000 | 257,751 | |
| 3.7% 6/26/28 | 337,000 | 336,051 | |
| 4.05% 6/29/48 | 498,000 | 486,745 | |
| 4.3% 4/22/44 | 165,000 | 159,264 | |
| 5.625% 4/1/40 | 55,000 | 62,963 | |
| 5.625% 4/15/41 | 126,000 | 144,389 | |
| 6.5% 8/15/37 | 227,000 | 286,185 | |
| 5,040,571 | |||
| Food Products - 0.4% | |||
| Campbell Soup Co. 4.8% 3/15/48 | 384,000 | 356,923 | |
| Conagra Brands, Inc.: | |||
| 3.2% 1/25/23 | 126,000 | 125,893 | |
| 4.3% 5/1/24 | 246,000 | 246,942 | |
| 4.85% 11/1/28 | 374,000 | 368,862 | |
| 5.3% 11/1/38 | 136,000 | 128,225 | |
| 5.4% 11/1/48 | 246,000 | 232,320 | |
| General Mills, Inc.: | |||
| 2.875% 4/15/30 | 289,000 | 255,998 | |
| 3% 2/1/51 | 168,000 | 122,068 | |
| 4.2% 4/17/28 | 472,000 | 468,288 | |
| JBS Finance Luxembourg SARL: | |||
| 2.5% 1/15/27 (a) | 1,107,000 | 960,588 | |
| 3.625% 1/15/32 (a) | 381,000 | 307,658 | |
| JBS U.S.A. Lux SA / JBS Food Co.: | |||
| 3% 5/15/32 (a) | 991,000 | 761,049 | |
| 5.125% 2/1/28 (a) | 1,205,000 | 1,176,707 | |
| 5.5% 1/15/30 (a) | 159,000 | 150,462 | |
| 5.75% 4/1/33 (a) | 2,485,000 | 2,366,441 | |
| 6.5% 4/15/29 (a) | 21,000 | 21,126 | |
| Kraft Heinz Foods Co.: | |||
| 3.875% 5/15/27 | 1,001,000 | 968,018 | |
| 4.375% 6/1/46 | 500,000 | 416,703 | |
| Tyson Foods, Inc.: | |||
| 3.95% 8/15/24 | 208,000 | 207,601 | |
| 4% 3/1/26 | 202,000 | 200,701 | |
| 4.35% 3/1/29 | 247,000 | 244,231 | |
| 5.1% 9/28/48 | 256,000 | 256,277 | |
| Unilever Capital Corp. 1.375% 9/14/30 | 503,000 | 408,900 | |
| 10,751,981 | |||
| Household Products - 0.1% | |||
| Colgate-Palmolive Co. 3.25% 3/15/24 | 274,000 | 273,239 | |
| Kimberly-Clark Corp.: | |||
| 1.05% 9/15/27 | 579,000 | 505,476 | |
| 2.4% 6/1/23 | 219,000 | 217,268 | |
| 3.1% 3/26/30 | 116,000 | 108,434 | |
| 3.2% 7/30/46 | 69,000 | 55,233 | |
| 3.95% 11/1/28 | 234,000 | 233,248 | |
| Procter & Gamble Co.: | |||
| 1% 4/23/26 | 315,000 | 289,245 | |
| 1.95% 4/23/31 | 500,000 | 431,568 | |
| 2.85% 8/11/27 | 123,000 | 119,031 | |
| 3% 3/25/30 | 272,000 | 256,628 | |
| 3.1% 8/15/23 | 274,000 | 275,533 | |
| 2,764,903 | |||
| Personal Products - 0.0% | |||
| Estee Lauder Companies, Inc. 1.95% 3/15/31 | 467,000 | 393,330 | |
| Tobacco - 0.3% | |||
| Altria Group, Inc.: | |||
| 3.8% 2/14/24 | 127,000 | 126,778 | |
| 3.875% 9/16/46 | 274,000 | 184,324 | |
| 4.25% 8/9/42 | 963,000 | 719,005 | |
| 4.5% 5/2/43 | 466,000 | 349,640 | |
| 4.8% 2/14/29 | 491,000 | 466,535 | |
| 5.375% 1/31/44 | 422,000 | 358,753 | |
| 5.8% 2/14/39 | 256,000 | 232,648 | |
| 5.95% 2/14/49 | 452,000 | 396,069 | |
| BAT Capital Corp.: | |||
| 3.222% 8/15/24 | 282,000 | 274,106 | |
| 3.557% 8/15/27 | 580,000 | 530,606 | |
| 4.39% 8/15/37 | 298,000 | 236,401 | |
| 4.54% 8/15/47 | 459,000 | 336,542 | |
| 4.758% 9/6/49 | 334,000 | 251,831 | |
| Imperial Tobacco Finance PLC 4.25% 7/21/25 (a) | 1,945,000 | 1,904,554 | |
| Philip Morris International, Inc.: | |||
| 2.125% 5/10/23 | 85,000 | 84,280 | |
| 2.75% 2/25/26 | 103,000 | 98,676 | |
| 3.6% 11/15/23 | 101,000 | 101,293 | |
| 3.875% 8/21/42 | 132,000 | 103,234 | |
| 4.125% 3/4/43 | 274,000 | 221,195 | |
| 4.875% 11/15/43 | 165,000 | 146,832 | |
| 6.375% 5/16/38 | 40,000 | 41,806 | |
| Reynolds American, Inc.: | |||
| 4.45% 6/12/25 | 488,000 | 485,062 | |
| 4.85% 9/15/23 | 49,000 | 49,486 | |
| 5.7% 8/15/35 | 153,000 | 145,113 | |
| 5.85% 8/15/45 | 116,000 | 97,335 | |
| 6.15% 9/15/43 | 502,000 | 464,651 | |
| 7.25% 6/15/37 | 570,000 | 592,792 | |
| 8,999,547 | |||
| TOTAL CONSUMER STAPLES | 58,679,064 | ||
| ENERGY - 2.9% | |||
| Energy Equipment & Services - 0.0% | |||
| Baker Hughes Co.: | |||
| 4.08% 12/15/47 | 659,000 | 557,115 | |
| 5.125% 9/15/40 | 55,000 | 53,895 | |
| Halliburton Co.: | |||
| 2.92% 3/1/30 | 264,000 | 233,141 | |
| 3.8% 11/15/25 | 14,000 | 13,861 | |
| 4.85% 11/15/35 | 270,000 | 259,619 | |
| 5% 11/15/45 | 207,000 | 189,820 | |
| 7.45% 9/15/39 | 41,000 | 47,795 | |
| 1,355,246 | |||
| Oil, Gas & Consumable Fuels - 2.9% | |||
| Apache Corp. 5.1% 9/1/40 | 82,000 | 69,239 | |
| Boardwalk Pipelines LP 4.95% 12/15/24 | 130,000 | 130,891 | |
| BP Capital Markets PLC: | |||
| 2.5% 11/6/22 | 82,000 | 81,999 | |
| 3.279% 9/19/27 | 349,000 | 334,122 | |
| Canadian Natural Resources Ltd.: | |||
| 2.95% 1/15/23 | 320,000 | 318,839 | |
| 3.8% 4/15/24 | 852,000 | 846,082 | |
| 3.9% 2/1/25 | 51,000 | 50,458 | |
| 4.95% 6/1/47 | 175,000 | 165,736 | |
| 5.85% 2/1/35 | 644,000 | 653,298 | |
| 6.25% 3/15/38 | 188,000 | 198,778 | |
| Cenovus Energy, Inc.: | |||
| 2.65% 1/15/32 | 196,000 | 162,093 | |
| 4.25% 4/15/27 | 1,064,000 | 1,042,873 | |
| 5.4% 6/15/47 | 258,000 | 247,820 | |
| 6.75% 11/15/39 | 55,000 | 58,664 | |
| Chevron Corp.: | |||
| 1.141% 5/11/23 | 214,000 | 210,331 | |
| 1.554% 5/11/25 | 204,000 | 193,434 | |
| 1.995% 5/11/27 | 171,000 | 157,175 | |
| 2.236% 5/11/30 | 204,000 | 179,032 | |
| 2.895% 3/3/24 | 645,000 | 643,363 | |
| 2.954% 5/16/26 | 302,000 | 294,310 | |
| 2.978% 5/11/40 | 171,000 | 135,793 | |
| 3.078% 5/11/50 | 204,000 | 162,212 | |
| Chevron U.S.A., Inc.: | |||
| 4.2% 10/15/49 | 120,000 | 109,812 | |
| 4.95% 8/15/47 | 378,000 | 381,515 | |
| Columbia Pipeline Group, Inc. 4.5% 6/1/25 | 259,000 | 261,132 | |
| ConocoPhillips Co.: | |||
| 5.95% 3/15/46 | 165,000 | 187,153 | |
| 6.5% 2/1/39 | 206,000 | 241,752 | |
| DCP Midstream Operating LP: | |||
| 3.875% 3/15/23 | 325,000 | 321,903 | |
| 5.6% 4/1/44 | 154,000 | 124,450 | |
| 6.45% 11/3/36 (a) | 311,000 | 304,780 | |
| Devon Energy Corp.: | |||
| 5% 6/15/45 | 456,000 | 422,866 | |
| 5.6% 7/15/41 | 79,000 | 78,472 | |
| Eastern Gas Transmission & Storage, Inc. 3.9% 11/15/49 (a) | 334,000 | 267,852 | |
| Empresa Nacional de Petroleo 4.375% 10/30/24 (a) | 445,000 | 442,858 | |
| Enbridge, Inc.: | |||
| 3.5% 6/10/24 | 77,000 | 76,157 | |
| 4% 10/1/23 | 353,000 | 354,382 | |
| 4.25% 12/1/26 | 223,000 | 220,693 | |
| 5.5% 12/1/46 | 397,000 | 408,344 | |
| Energy Transfer LP: | |||
| 3.6% 2/1/23 | 234,000 | 233,335 | |
| 3.75% 5/15/30 | 750,000 | 675,914 | |
| 3.9% 5/15/24 (b) | 166,000 | 164,711 | |
| 3.9% 7/15/26 | 206,000 | 197,941 | |
| 4.2% 9/15/23 | 149,000 | 149,221 | |
| 4.25% 3/15/23 | 128,000 | 127,934 | |
| 4.5% 4/15/24 | 158,000 | 158,072 | |
| 4.95% 6/15/28 | 767,000 | 755,791 | |
| 5% 5/15/50 | 1,377,000 | 1,171,750 | |
| 5.15% 3/15/45 | 219,000 | 187,254 | |
| 5.25% 4/15/29 | 258,000 | 255,538 | |
| 5.3% 4/1/44 | 159,000 | 137,921 | |
| 5.4% 10/1/47 | 320,000 | 280,760 | |
| 5.8% 6/15/38 | 523,000 | 489,883 | |
| 6% 6/15/48 | 723,000 | 679,192 | |
| 6.25% 4/15/49 | 257,000 | 249,114 | |
| Enterprise Products Operating LP: | |||
| 3.3% 2/15/53 | 104,000 | 75,648 | |
| 3.7% 2/15/26 | 652,000 | 640,775 | |
| 3.95% 2/15/27 | 710,000 | 698,628 | |
| 4.2% 1/31/50 | 163,000 | 135,922 | |
| 4.25% 2/15/48 | 547,000 | 460,125 | |
| 4.8% 2/1/49 | 201,000 | 181,757 | |
| 4.85% 8/15/42 | 69,000 | 63,270 | |
| 4.85% 3/15/44 | 137,000 | 124,811 | |
| 4.9% 5/15/46 | 117,000 | 106,920 | |
| 5.7% 2/15/42 | 55,000 | 55,340 | |
| 7.55% 4/15/38 | 55,000 | 65,057 | |
| EOG Resources, Inc. 4.15% 1/15/26 | 154,000 | 155,175 | |
| Equinor ASA: | |||
| 2.375% 5/22/30 | 316,000 | 276,939 | |
| 3.125% 4/6/30 | 274,000 | 254,058 | |
| 3.625% 9/10/28 | 331,000 | 323,462 | |
| 3.7% 3/1/24 | 100,000 | 100,434 | |
| 3.7% 4/6/50 | 438,000 | 376,606 | |
| 5.1% 8/17/40 | 55,000 | 57,020 | |
| Exxon Mobil Corp.: | |||
| 1.571% 4/15/23 | 1,001,000 | 991,028 | |
| 2.726% 3/1/23 | 274,000 | 273,961 | |
| 3.043% 3/1/26 | 228,000 | 223,621 | |
| 3.452% 4/15/51 | 114,000 | 93,134 | |
| 3.482% 3/19/30 | 2,355,000 | 2,258,575 | |
| 3.567% 3/6/45 | 182,000 | 153,513 | |
| Hess Corp.: | |||
| 3.5% 7/15/24 | 104,000 | 102,384 | |
| 4.3% 4/1/27 | 614,000 | 598,520 | |
| 5.6% 2/15/41 | 1,596,000 | 1,554,971 | |
| 5.8% 4/1/47 | 117,000 | 116,685 | |
| 7.125% 3/15/33 | 126,000 | 140,238 | |
| 7.3% 8/15/31 | 168,000 | 188,021 | |
| 7.875% 10/1/29 | 551,000 | 633,542 | |
| Kinder Morgan Energy Partners LP: | |||
| 3.45% 2/15/23 | 548,000 | 548,555 | |
| 3.5% 9/1/23 | 55,000 | 54,832 | |
| 4.25% 9/1/24 | 411,000 | 411,219 | |
| 4.7% 11/1/42 | 104,000 | 87,352 | |
| 5% 3/1/43 | 27,000 | 23,622 | |
| 5.5% 3/1/44 | 192,000 | 179,865 | |
| 5.625% 9/1/41 | 27,000 | 25,124 | |
| 6.55% 9/15/40 | 140,000 | 145,520 | |
| Kinder Morgan, Inc.: | |||
| 4.3% 3/1/28 | 273,000 | 265,579 | |
| 5.2% 3/1/48 | 241,000 | 220,147 | |
| 5.3% 12/1/34 | 234,000 | 228,580 | |
| 5.55% 6/1/45 | 573,000 | 539,648 | |
| Magellan Midstream Partners LP: | |||
| 4.25% 9/15/46 | 151,000 | 125,973 | |
| 5% 3/1/26 | 82,000 | 83,831 | |
| Marathon Oil Corp. 5.2% 6/1/45 | 137,000 | 125,573 | |
| Marathon Petroleum Corp.: | |||
| 4.5% 4/1/48 | 160,000 | 134,531 | |
| 4.7% 5/1/25 | 601,000 | 608,037 | |
| 6.5% 3/1/41 | 27,000 | 29,470 | |
| MPLX LP: | |||
| 4.125% 3/1/27 | 259,000 | 250,406 | |
| 4.5% 7/15/23 | 248,000 | 248,705 | |
| 4.7% 4/15/48 | 535,000 | 449,738 | |
| 4.8% 2/15/29 | 393,000 | 386,446 | |
| 4.875% 12/1/24 | 344,000 | 346,346 | |
| 5.2% 3/1/47 | 168,000 | 152,295 | |
| 5.5% 2/15/49 | 662,000 | 614,021 | |
| Occidental Petroleum Corp.: | |||
| 6.2% 3/15/40 | 214,000 | 210,790 | |
| 6.45% 9/15/36 | 578,000 | 592,450 | |
| 6.6% 3/15/46 | 717,000 | 761,454 | |
| 7.5% 5/1/31 | 964,000 | 1,036,300 | |
| ONEOK Partners LP 3.375% 10/1/22 | 137,000 | 137,006 | |
| ONEOK, Inc.: | |||
| 4.45% 9/1/49 | 160,000 | 127,430 | |
| 4.95% 7/13/47 | 160,000 | 136,414 | |
| 5.2% 7/15/48 | 83,000 | 73,589 | |
| Ovintiv, Inc. 6.5% 2/1/38 | 244,000 | 251,798 | |
| Petroleos Mexicanos: | |||
| 4.5% 1/23/26 | 668,000 | 578,822 | |
| 5.95% 1/28/31 | 457,000 | 333,427 | |
| 6.35% 2/12/48 | 1,658,000 | 963,298 | |
| 6.49% 1/23/27 | 481,000 | 411,928 | |
| 6.5% 3/13/27 | 607,000 | 523,993 | |
| 6.5% 1/23/29 | 698,000 | 567,649 | |
| 6.7% 2/16/32 | 634,000 | 480,255 | |
| 6.75% 9/21/47 | 1,520,000 | 931,000 | |
| 6.84% 1/23/30 | 2,319,000 | 1,826,213 | |
| 6.95% 1/28/60 | 989,000 | 608,730 | |
| 7.69% 1/23/50 | 2,036,000 | 1,359,030 | |
| 8.75% 6/2/29 (a) | 15,000,000 | 13,418,438 | |
| Phillips 66 Co.: | |||
| 3.7% 4/6/23 | 60,000 | 59,996 | |
| 3.85% 4/9/25 | 77,000 | 76,524 | |
| 4.875% 11/15/44 | 27,000 | 26,186 | |
| 5.875% 5/1/42 | 260,000 | 282,531 | |
| Plains All American Pipeline LP/PAA Finance Corp.: | |||
| 3.55% 12/15/29 | 166,000 | 146,256 | |
| 3.6% 11/1/24 | 371,000 | 362,867 | |
| 4.65% 10/15/25 | 336,000 | 332,677 | |
| 4.9% 2/15/45 | 52,000 | 41,819 | |
| 6.65% 1/15/37 | 77,000 | 76,840 | |
| Sabine Pass Liquefaction LLC 4.5% 5/15/30 | 1,002,000 | 960,234 | |
| Shell International Finance BV: | |||
| 2% 11/7/24 | 270,000 | 262,099 | |
| 2.375% 11/7/29 | 907,000 | 800,668 | |
| 3.125% 11/7/49 | 384,000 | 294,517 | |
| 3.25% 5/11/25 | 388,000 | 383,239 | |
| 3.5% 11/13/23 | 192,000 | 193,266 | |
| 3.875% 11/13/28 | 234,000 | 230,838 | |
| 4% 5/10/46 | 110,000 | 97,952 | |
| 4.375% 5/11/45 | 365,000 | 339,349 | |
| 6.375% 12/15/38 | 115,000 | 133,490 | |
| Spectra Energy Partners LP: | |||
| 3.375% 10/15/26 | 447,000 | 425,143 | |
| 4.75% 3/15/24 | 132,000 | 133,043 | |
| Suncor Energy, Inc.: | |||
| 4% 11/15/47 | 137,000 | 117,014 | |
| 6.8% 5/15/38 | 232,000 | 260,389 | |
| 6.85% 6/1/39 | 55,000 | 62,267 | |
| The Williams Companies, Inc.: | |||
| 3.5% 11/15/30 | 1,068,000 | 962,556 | |
| 3.7% 1/15/23 | 152,000 | 152,243 | |
| 3.75% 6/15/27 | 640,000 | 611,136 | |
| 3.9% 1/15/25 | 250,000 | 246,972 | |
| 4.3% 3/4/24 | 684,000 | 686,959 | |
| 4.5% 11/15/23 | 220,000 | 221,528 | |
| 4.55% 6/24/24 | 1,831,000 | 1,845,506 | |
| 4.85% 3/1/48 | 231,000 | 208,943 | |
| 5.75% 6/24/44 | 52,000 | 51,861 | |
| Total Capital International SA: | |||
| 2.7% 1/25/23 | 52,000 | 51,944 | |
| 3.127% 5/29/50 | 98,000 | 74,911 | |
| 3.455% 2/19/29 | 585,000 | 556,851 | |
| 3.461% 7/12/49 | 179,000 | 144,688 | |
| 3.75% 4/10/24 | 55,000 | 55,153 | |
| TransCanada PipeLines Ltd.: | |||
| 2.5% 8/1/22 | 137,000 | 136,931 | |
| 4.75% 5/15/38 | 288,000 | 272,240 | |
| 4.875% 1/15/26 | 137,000 | 139,088 | |
| 4.875% 5/15/48 | 135,000 | 129,440 | |
| 5.1% 3/15/49 | 96,000 | 94,796 | |
| 6.1% 6/1/40 | 184,000 | 198,427 | |
| Transcontinental Gas Pipe Line Co. LLC: | |||
| 3.25% 5/15/30 | 288,000 | 258,636 | |
| 3.95% 5/15/50 | 572,000 | 474,784 | |
| 4.45% 8/1/42 | 212,000 | 187,437 | |
| 4.6% 3/15/48 | 110,000 | 99,698 | |
| Valero Energy Corp.: | |||
| 2.85% 4/15/25 | 483,000 | 466,776 | |
| 4% 4/1/29 | 256,000 | 242,174 | |
| 6.625% 6/15/37 | 149,000 | 161,884 | |
| Western Gas Partners LP: | |||
| 3.95% 6/1/25 | 109,000 | 102,869 | |
| 4.5% 3/1/28 | 251,000 | 227,155 | |
| 4.65% 7/1/26 | 1,137,000 | 1,071,623 | |
| 4.75% 8/15/28 | 145,000 | 132,475 | |
| 75,917,451 | |||
| TOTAL ENERGY | 77,272,697 | ||
| FINANCIALS - 12.8% | |||
| Banks - 6.5% | |||
| Banco Santander SA: | |||
| 1.849% 3/25/26 | 400,000 | 359,490 | |
| 2.958% 3/25/31 | 400,000 | 335,077 | |
| 3.225% 11/22/32 (b) | 200,000 | 158,181 | |
| Bank of America Corp.: | |||
| 3 month U.S. LIBOR + 0.640% 2.015% 2/13/26 (b)(c) | 692,000 | 648,563 | |
| U.S. Secured Overnight Fin. Rate (SOFR) Indx + 0.650% 1.53% 12/6/25 (b)(c) | 1,351,000 | 1,257,031 | |
| 1.658% 3/11/27 (b) | 532,000 | 476,794 | |
| 1.734% 7/22/27 (b) | 690,000 | 613,338 | |
| 2.087% 6/14/29 (b) | 157,000 | 134,452 | |
| 2.299% 7/21/32 (b) | 2,174,000 | 1,756,802 | |
| 2.651% 3/11/32 (b) | 506,000 | 425,222 | |
| 2.676% 6/19/41 (b) | 340,000 | 244,636 | |
| 2.687% 4/22/32 (b) | 246,000 | 206,521 | |
| 2.831% 10/24/51 (b) | 276,000 | 189,000 | |
| 2.972% 7/21/52 (b) | 268,000 | 190,273 | |
| 3.004% 12/20/23 (b) | 290,000 | 289,049 | |
| 3.194% 7/23/30 (b) | 1,318,000 | 1,181,527 | |
| 3.248% 10/21/27 | 103,000 | 96,811 | |
| 3.3% 1/11/23 | 545,000 | 545,871 | |
| 3.366% 1/23/26 (b) | 724,000 | 701,188 | |
| 3.419% 12/20/28 (b) | 3,213,000 | 2,992,132 | |
| 3.5% 4/19/26 | 631,000 | 614,750 | |
| 3.593% 7/21/28 (b) | 304,000 | 286,703 | |
| 3.705% 4/24/28 (b) | 241,000 | 229,733 | |
| 3.846% 3/8/37 (b) | 197,000 | 170,277 | |
| 3.864% 7/23/24 (b) | 1,215,000 | 1,209,664 | |
| 3.95% 4/21/25 | 518,000 | 510,905 | |
| 3.97% 3/5/29 (b) | 601,000 | 573,080 | |
| 3.974% 2/7/30 (b) | 388,000 | 366,498 | |
| 4% 4/1/24 | 133,000 | 133,913 | |
| 4% 1/22/25 | 165,000 | 164,267 | |
| 4.083% 3/20/51 (b) | 173,000 | 149,102 | |
| 4.1% 7/24/23 | 192,000 | 193,841 | |
| 4.183% 11/25/27 | 425,000 | 413,039 | |
| 4.2% 8/26/24 | 2,742,000 | 2,747,243 | |
| 4.25% 10/22/26 | 645,000 | 635,911 | |
| 4.271% 7/23/29 (b) | 494,000 | 474,642 | |
| 4.33% 3/15/50 (b) | 359,000 | 322,402 | |
| 4.443% 1/20/48 (b) | 418,000 | 382,109 | |
| 4.45% 3/3/26 | 547,000 | 544,355 | |
| 4.571% 4/27/33 (b) | 10,000,000 | 9,732,110 | |
| 5% 1/21/44 | 147,000 | 144,390 | |
| 5.875% 2/7/42 | 90,000 | 97,144 | |
| 6.11% 1/29/37 | 194,000 | 208,683 | |
| 7.75% 5/14/38 | 114,000 | 140,461 | |
| Bank of Montreal: | |||
| 3.3% 2/5/24 | 444,000 | 443,056 | |
| 3.803% 12/15/32 (b) | 320,000 | 296,603 | |
| Bank of Nova Scotia: | |||
| 3.4% 2/11/24 | 1,109,000 | 1,103,653 | |
| 4.5% 12/16/25 | 435,000 | 434,506 | |
| Barclays PLC: | |||
| 2.279% 11/24/27 (b) | 500,000 | 443,256 | |
| 2.852% 5/7/26 (b) | 1,383,000 | 1,305,961 | |
| 2.894% 11/24/32 (b) | 520,000 | 417,967 | |
| 3.932% 5/7/25 (b) | 435,000 | 427,915 | |
| 4.375% 1/12/26 | 781,000 | 772,959 | |
| 4.836% 5/9/28 | 263,000 | 253,007 | |
| 4.95% 1/10/47 | 443,000 | 417,141 | |
| 5.088% 6/20/30 (b) | 923,000 | 871,217 | |
| 5.2% 5/12/26 | 781,000 | 777,667 | |
| BB&T Corp. 3.75% 12/6/23 | 482,000 | 484,873 | |
| BNP Paribas SA 2.219% 6/9/26 (a)(b) | 947,000 | 874,245 | |
| Canadian Imperial Bank of Commerce 3.6% 4/7/32 | 398,000 | 361,286 | |
| Citigroup, Inc.: | |||
| 3 month U.S. LIBOR + 1.020% 4.044% 6/1/24 (b)(c) | 548,000 | 546,521 | |
| 3 month U.S. LIBOR + 1.150% 3.52% 10/27/28 (b)(c) | 632,000 | 590,498 | |
| 1.122% 1/28/27 (b) | 487,000 | 430,008 | |
| 2.561% 5/1/32 (b) | 414,000 | 340,872 | |
| 2.7% 10/27/22 | 1,255,000 | 1,256,033 | |
| 3.106% 4/8/26 (b) | 854,000 | 819,802 | |
| 3.352% 4/24/25 (b) | 623,000 | 610,197 | |
| 3.668% 7/24/28 (b) | 1,119,000 | 1,056,401 | |
| 3.7% 1/12/26 | 305,000 | 298,868 | |
| 3.875% 3/26/25 | 1,193,000 | 1,176,340 | |
| 3.887% 1/10/28 (b) | 123,000 | 118,259 | |
| 3.98% 3/20/30 (b) | 976,000 | 912,816 | |
| 4.05% 7/30/22 | 226,000 | 226,216 | |
| 4.125% 7/25/28 | 423,000 | 405,747 | |
| 4.3% 11/20/26 | 218,000 | 214,860 | |
| 4.4% 6/10/25 | 110,000 | 109,836 | |
| 4.412% 3/31/31 (b) | 1,601,000 | 1,529,065 | |
| 4.45% 9/29/27 | 3,118,000 | 3,053,556 | |
| 4.6% 3/9/26 | 441,000 | 441,558 | |
| 4.65% 7/23/48 | 389,000 | 362,112 | |
| 4.75% 5/18/46 | 216,000 | 192,853 | |
| 4.91% 5/24/33 (b) | 11,248,000 | 11,098,689 | |
| 5.3% 5/6/44 | 55,000 | 52,677 | |
| 5.5% 9/13/25 | 831,000 | 853,742 | |
| 5.875% 1/30/42 | 149,000 | 158,268 | |
| 8.125% 7/15/39 | 219,000 | 284,889 | |
| Citizens Financial Group, Inc. 2.638% 9/30/32 | 662,000 | 528,031 | |
| Comerica, Inc. 3.8% 7/22/26 | 100,000 | 98,186 | |
| Commonwealth Bank of Australia 3.61% 9/12/34 (a)(b) | 328,000 | 291,889 | |
| Credit Suisse Group Funding Guernsey Ltd. 3.8% 9/15/22 | 909,000 | 909,727 | |
| Discover Bank 4.2% 8/8/23 | 358,000 | 359,235 | |
| Export-Import Bank of Korea: | |||
| 0.625% 2/9/26 | 719,000 | 647,486 | |
| 2.875% 1/21/25 | 208,000 | 204,572 | |
| Fifth Third Bancorp: | |||
| 2.55% 5/5/27 | 407,000 | 372,990 | |
| 8.25% 3/1/38 | 57,000 | 73,074 | |
| First Citizens Bank & Trust Co. 3.929% 6/19/24 (b) | 210,000 | 208,651 | |
| HSBC Holdings PLC: | |||
| 2.013% 9/22/28 (b) | 1,336,000 | 1,142,729 | |
| 2.099% 6/4/26 (b) | 500,000 | 461,831 | |
| 3.803% 3/11/25 (b) | 891,000 | 878,524 | |
| 3.9% 5/25/26 | 302,000 | 295,159 | |
| 4.25% 3/14/24 | 276,000 | 274,687 | |
| 4.292% 9/12/26 (b) | 1,276,000 | 1,246,639 | |
| 4.375% 11/23/26 | 787,000 | 769,269 | |
| 4.95% 3/31/30 | 398,000 | 393,211 | |
| 6.5% 9/15/37 | 288,000 | 307,278 | |
| 6.8% 6/1/38 | 167,000 | 180,205 | |
| HSBC U.S.A., Inc. 3.5% 6/23/24 | 192,000 | 190,765 | |
| ING Groep NV: | |||
| 1.726% 4/1/27 (b) | 253,000 | 225,887 | |
| 2.727% 4/1/32 (b) | 256,000 | 213,044 | |
| Intesa Sanpaolo SpA: | |||
| 5.017% 6/26/24 (a) | 545,000 | 520,429 | |
| 5.71% 1/15/26 (a) | 1,614,000 | 1,537,413 | |
| Japan Bank International Cooperation: | |||
| 0.625% 5/22/23 | 778,000 | 762,289 | |
| 1.25% 1/21/31 | 1,072,000 | 902,341 | |
| 2.375% 4/20/26 | 358,000 | 345,819 | |
| 2.875% 6/1/27 | 208,000 | 203,052 | |
| 3.25% 7/20/28 | 246,000 | 243,609 | |
| 3.375% 10/31/23 | 890,000 | 892,870 | |
| JPMorgan Chase & Co.: | |||
| 0.768% 8/9/25 (b) | 1,241,000 | 1,150,988 | |
| 1.47% 9/22/27 (b) | 821,000 | 720,067 | |
| 1.953% 2/4/32 (b) | 440,000 | 351,680 | |
| 2.083% 4/22/26 (b) | 1,010,000 | 944,424 | |
| 2.522% 4/22/31 (b) | 329,000 | 280,215 | |
| 2.545% 11/8/32 (b) | 642,000 | 533,399 | |
| 2.95% 10/1/26 | 692,000 | 658,466 | |
| 2.956% 5/13/31 (b) | 884,000 | 763,231 | |
| 3.109% 4/22/51 (b) | 409,000 | 299,762 | |
| 3.22% 3/1/25 (b) | 478,000 | 469,400 | |
| 3.25% 9/23/22 | 110,000 | 110,170 | |
| 3.3% 4/1/26 | 247,000 | 239,807 | |
| 3.375% 5/1/23 | 52,000 | 52,001 | |
| 3.509% 1/23/29 (b) | 867,000 | 810,951 | |
| 3.54% 5/1/28 (b) | 466,000 | 441,816 | |
| 3.559% 4/23/24 (b) | 274,000 | 273,158 | |
| 3.797% 7/23/24 (b) | 1,098,000 | 1,093,912 | |
| 3.875% 9/10/24 | 6,391,000 | 6,378,447 | |
| 3.882% 7/24/38 (b) | 123,000 | 108,411 | |
| 3.9% 7/15/25 | 592,000 | 592,935 | |
| 3.96% 1/29/27 (b) | 334,000 | 325,867 | |
| 3.964% 11/15/48 (b) | 258,000 | 218,603 | |
| 4.005% 4/23/29 (b) | 563,000 | 539,618 | |
| 4.125% 12/15/26 | 1,929,000 | 1,911,671 | |
| 4.203% 7/23/29 (b) | 1,198,000 | 1,155,453 | |
| 4.323% 4/26/28 (b) | 326,000 | 320,629 | |
| 4.452% 12/5/29 (b) | 335,000 | 326,259 | |
| 4.493% 3/24/31 (b) | 1,607,000 | 1,569,418 | |
| 4.586% 4/26/33 (b) | 326,000 | 320,211 | |
| 4.85% 2/1/44 | 137,000 | 131,248 | |
| 4.95% 6/1/45 | 262,000 | 250,031 | |
| 5.5% 10/15/40 | 156,000 | 160,550 | |
| 5.6% 7/15/41 | 41,000 | 42,802 | |
| 5.625% 8/16/43 | 137,000 | 142,207 | |
| Korea Development Bank: | |||
| 0.4% 6/19/24 | 300,000 | 283,770 | |
| 1.625% 1/19/31 | 367,000 | 311,998 | |
| Lloyds Banking Group PLC: | |||
| 4.344% 1/9/48 | 411,000 | 335,802 | |
| 4.582% 12/10/25 | 320,000 | 313,751 | |
| 4.65% 3/24/26 | 236,000 | 231,218 | |
| Mitsubishi UFJ Financial Group, Inc.: | |||
| 1.538% 7/20/27 (b) | 309,000 | 272,911 | |
| 2.309% 7/20/32 (b) | 300,000 | 244,212 | |
| 2.801% 7/18/24 | 224,000 | 218,195 | |
| 3.195% 7/18/29 | 390,000 | 351,844 | |
| 3.455% 3/2/23 | 503,000 | 503,696 | |
| 3.751% 7/18/39 | 217,000 | 188,118 | |
| 3.961% 3/2/28 | 603,000 | 581,453 | |
| Mizuho Financial Group, Inc.: | |||
| 1.554% 7/9/27 (b) | 317,000 | 278,827 | |
| 2.226% 5/25/26 (b) | 374,000 | 349,549 | |
| 2.26% 7/9/32 (b) | 314,000 | 250,678 | |
| 2.591% 5/25/31 (b) | 454,000 | 380,011 | |
| 3.549% 3/5/23 | 329,000 | 329,992 | |
| NatWest Group PLC: | |||
| 3 month U.S. LIBOR + 1.750% 4.892% 5/18/29 (b)(c) | 234,000 | 226,770 | |
| 3.073% 5/22/28 (b) | 584,000 | 530,886 | |
| 3.754% 11/1/29 (b) | 354,000 | 339,979 | |
| 4.8% 4/5/26 | 358,000 | 356,631 | |
| 5.125% 5/28/24 | 2,577,000 | 2,582,272 | |
| 6% 12/19/23 | 1,310,000 | 1,333,260 | |
| 6.1% 6/10/23 | 1,679,000 | 1,700,519 | |
| 6.125% 12/15/22 | 1,035,000 | 1,039,569 | |
| NatWest Markets PLC 2.375% 5/21/23 (a) | 1,092,000 | 1,076,504 | |
| Oesterreichische Kontrollbank AG 0.375% 9/17/25 | 299,000 | 273,845 | |
| PNC Financial Services Group, Inc.: | |||
| U.S. Secured Overnight Fin. Rate (SOFR) Averages Indx + 0.000% 4.626% 6/6/33 (b)(c) | 15,000,000 | 14,486,524 | |
| 1.15% 8/13/26 | 345,000 | 308,253 | |
| 2.2% 11/1/24 | 185,000 | 179,174 | |
| 2.6% 7/23/26 | 667,000 | 631,415 | |
| 3.5% 1/23/24 | 479,000 | 479,067 | |
| 3.9% 4/29/24 | 155,000 | 155,376 | |
| Rabobank Nederland: | |||
| 3.75% 7/21/26 | 528,000 | 503,451 | |
| 4.375% 8/4/25 | 936,000 | 928,144 | |
| 5.25% 5/24/41 | 82,000 | 88,491 | |
| Rabobank Nederland New York Branch 2.75% 1/10/23 | 466,000 | 465,795 | |
| Royal Bank of Canada: | |||
| 1.2% 4/27/26 | 308,000 | 276,691 | |
| 2.05% 1/21/27 | 567,000 | 518,354 | |
| 4.65% 1/27/26 | 356,000 | 358,945 | |
| Santander Holdings U.S.A., Inc.: | |||
| 2.49% 1/6/28 (b) | 717,000 | 632,818 | |
| 3.4% 1/18/23 | 299,000 | 298,558 | |
| Santander UK Group Holdings PLC 2.469% 1/11/28 (b) | 334,000 | 295,116 | |
| Societe Generale: | |||
| 1.038% 6/18/25 (a)(b) | 1,987,000 | 1,858,266 | |
| 1.488% 12/14/26 (a)(b) | 1,222,000 | 1,077,838 | |
| Sumitomo Mitsui Financial Group, Inc.: | |||
| 1.474% 7/8/25 | 390,000 | 358,172 | |
| 2.142% 9/23/30 | 380,000 | 304,440 | |
| 2.174% 1/14/27 | 781,000 | 706,286 | |
| 2.348% 1/15/25 | 247,000 | 236,216 | |
| 2.75% 1/15/30 | 234,000 | 203,464 | |
| 2.778% 10/18/22 | 207,000 | 207,082 | |
| 3.05% 1/14/42 | 400,000 | 306,087 | |
| 3.102% 1/17/23 | 1,046,000 | 1,045,584 | |
| 3.936% 10/16/23 | 430,000 | 431,817 | |
| The Toronto-Dominion Bank: | |||
| 2.65% 6/12/24 | 637,000 | 625,097 | |
| 3.25% 3/11/24 | 834,000 | 828,358 | |
| 3.5% 7/19/23 | 274,000 | 274,564 | |
| Truist Financial Corp. 1.267% 3/2/27 (b) | 899,000 | 805,212 | |
| U.S. Bancorp: | |||
| 1.375% 7/22/30 | 334,000 | 266,151 | |
| 3% 7/30/29 | 297,000 | 270,211 | |
| 3.1% 4/27/26 | 247,000 | 238,073 | |
| Wells Fargo & Co.: | |||
| 2.164% 2/11/26 (b) | 1,018,000 | 956,782 | |
| 2.188% 4/30/26 (b) | 806,000 | 754,055 | |
| 2.406% 10/30/25 (b) | 1,970,000 | 1,875,447 | |
| 2.572% 2/11/31 (b) | 644,000 | 553,600 | |
| 3% 10/23/26 | 557,000 | 525,556 | |
| 3.068% 4/30/41 (b) | 487,000 | 377,140 | |
| 3.3% 9/9/24 | 127,000 | 125,295 | |
| 3.35% 3/2/33 (b) | 157,000 | 139,332 | |
| 3.526% 3/24/28 (b) | 1,167,000 | 1,105,321 | |
| 3.55% 9/29/25 | 116,000 | 113,931 | |
| 3.584% 5/22/28 (b) | 287,000 | 272,280 | |
| 3.75% 1/24/24 | 1,176,000 | 1,178,785 | |
| 3.9% 5/1/45 | 130,000 | 109,284 | |
| 4.1% 6/3/26 | 88,000 | 86,558 | |
| 4.4% 6/14/46 | 196,000 | 170,602 | |
| 4.478% 4/4/31 (b) | 1,796,000 | 1,756,402 | |
| 4.48% 1/16/24 | 105,000 | 106,259 | |
| 4.75% 12/7/46 | 439,000 | 401,885 | |
| 4.9% 11/17/45 | 265,000 | 245,615 | |
| 5.013% 4/4/51 (b) | 2,815,000 | 2,760,948 | |
| 5.375% 11/2/43 | 184,000 | 180,227 | |
| 5.606% 1/15/44 | 312,000 | 313,982 | |
| Westpac Banking Corp.: | |||
| 1.953% 11/20/28 | 200,000 | 174,513 | |
| 2.85% 5/13/26 | 130,000 | 124,552 | |
| 3.3% 2/26/24 | 891,000 | 889,416 | |
| 4.11% 7/24/34 (b) | 800,000 | 731,203 | |
| 4.421% 7/24/39 | 160,000 | 143,211 | |
| Zions Bancorp NA 4.5% 6/13/23 | 6,000 | 6,009 | |
| 171,155,413 | |||
| Capital Markets - 2.6% | |||
| Affiliated Managers Group, Inc.: | |||
| 3.5% 8/1/25 | 826,000 | 814,929 | |
| 4.25% 2/15/24 | 538,000 | 541,354 | |
| Ares Capital Corp.: | |||
| 2.15% 7/15/26 | 705,000 | 590,869 | |
| 3.25% 7/15/25 | 173,000 | 159,932 | |
| 3.875% 1/15/26 | 1,565,000 | 1,437,202 | |
| 4.2% 6/10/24 | 1,118,000 | 1,097,688 | |
| Bank of New York Mellon Corp.: | |||
| 1.8% 7/28/31 | 574,000 | 464,718 | |
| 2.8% 5/4/26 | 154,000 | 148,319 | |
| 2.95% 1/29/23 | 411,000 | 410,564 | |
| BlackRock, Inc.: | |||
| 2.1% 2/25/32 | 397,000 | 327,882 | |
| 3.5% 3/18/24 | 80,000 | 80,322 | |
| Brookfield Finance, Inc. 2.724% 4/15/31 | 690,000 | 583,100 | |
| Charles Schwab Corp.: | |||
| 0.75% 3/18/24 | 768,000 | 736,589 | |
| 2% 3/20/28 | 579,000 | 516,774 | |
| 2.45% 3/3/27 | 667,000 | 622,053 | |
| CME Group, Inc.: | |||
| 2.65% 3/15/32 | 97,000 | 85,896 | |
| 5.3% 9/15/43 | 170,000 | 184,858 | |
| Credit Suisse AG 3.625% 9/9/24 | 272,000 | 267,077 | |
| Credit Suisse Group AG: | |||
| 2.593% 9/11/25 (a)(b) | 1,329,000 | 1,250,356 | |
| 3.75% 3/26/25 | 585,000 | 566,654 | |
| 3.8% 6/9/23 | 1,626,000 | 1,610,562 | |
| 3.869% 1/12/29 (a)(b) | 505,000 | 453,801 | |
| 4.194% 4/1/31 (a)(b) | 1,208,000 | 1,068,886 | |
| 4.55% 4/17/26 | 323,000 | 315,688 | |
| 4.875% 5/15/45 | 310,000 | 263,661 | |
| Deutsche Bank AG: | |||
| 4.1% 1/13/26 | 330,000 | 325,936 | |
| 4.5% 4/1/25 | 1,502,000 | 1,429,893 | |
| Deutsche Bank AG New York Branch: | |||
| 2.311% 11/16/27 (b) | 171,000 | 147,570 | |
| 3.3% 11/16/22 | 1,421,000 | 1,420,586 | |
| 3.7% 5/30/24 | 269,000 | 264,202 | |
| 3.95% 2/27/23 | 473,000 | 471,964 | |
| 4.1% 1/13/26 | 598,000 | 586,628 | |
| Eaton Vance Corp. 3.625% 6/15/23 | 77,000 | 76,852 | |
| Goldman Sachs Group, Inc.: | |||
| 0.855% 2/12/26 (b) | 471,000 | 428,495 | |
| 1.093% 12/9/26 (b) | 1,144,000 | 1,018,914 | |
| 2.383% 7/21/32 (b) | 1,960,000 | 1,584,966 | |
| 2.6% 2/7/30 | 334,000 | 284,874 | |
| 2.615% 4/22/32 (b) | 848,000 | 704,039 | |
| 2.65% 10/21/32 (b) | 434,000 | 357,632 | |
| 3.2% 2/23/23 | 1,533,000 | 1,533,534 | |
| 3.272% 9/29/25 (b) | 167,000 | 162,252 | |
| 3.436% 2/24/43 (b) | 137,000 | 107,418 | |
| 3.5% 1/23/25 | 1,432,000 | 1,410,745 | |
| 3.625% 1/22/23 | 247,000 | 247,770 | |
| 3.625% 2/20/24 | 288,000 | 287,069 | |
| 3.691% 6/5/28 (b) | 5,717,000 | 5,421,329 | |
| 3.75% 2/25/26 | 160,000 | 156,840 | |
| 3.8% 3/15/30 | 1,945,000 | 1,803,540 | |
| 3.85% 7/8/24 | 104,000 | 104,224 | |
| 3.85% 1/26/27 | 829,000 | 801,394 | |
| 4% 3/3/24 | 167,000 | 167,522 | |
| 4.25% 10/21/25 | 422,000 | 418,742 | |
| 4.411% 4/23/39 (b) | 130,000 | 117,996 | |
| 4.75% 10/21/45 | 433,000 | 402,469 | |
| 5.95% 1/15/27 | 411,000 | 430,433 | |
| 6.75% 10/1/37 | 843,000 | 933,557 | |
| Intercontinental Exchange, Inc.: | |||
| 1.85% 9/15/32 | 310,000 | 241,785 | |
| 2.65% 9/15/40 | 310,000 | 225,301 | |
| 3.75% 12/1/25 | 158,000 | 157,028 | |
| 3.75% 9/21/28 | 256,000 | 245,885 | |
| 4.25% 9/21/48 | 290,000 | 257,937 | |
| Jefferies Group LLC / Jefferies Group Capital Finance, Inc.: | |||
| 2.625% 10/15/31 | 67,000 | 51,708 | |
| 4.15% 1/23/30 | 387,000 | 347,659 | |
| Moody's Corp.: | |||
| 3.25% 1/15/28 | 737,000 | 697,595 | |
| 3.75% 3/24/25 | 637,000 | 636,545 | |
| 4.875% 2/15/24 | 281,000 | 286,399 | |
| 4.875% 12/17/48 | 284,000 | 276,500 | |
| Morgan Stanley: | |||
| 3 month U.S. LIBOR + 1.430% 4.457% 4/22/39 (b)(c) | 207,000 | 192,817 | |
| 1.164% 10/21/25 (b) | 390,000 | 361,324 | |
| 1.512% 7/20/27 (b) | 270,000 | 236,798 | |
| 1.593% 5/4/27 (b) | 393,000 | 348,850 | |
| 2.188% 4/28/26 (b) | 672,000 | 629,095 | |
| 2.239% 7/21/32 (b) | 255,000 | 206,576 | |
| 2.511% 10/20/32 (b) | 137,000 | 113,197 | |
| 2.72% 7/22/25 (b) | 520,000 | 500,954 | |
| 3.125% 1/23/23 | 4,943,000 | 4,941,298 | |
| 3.125% 7/27/26 | 2,912,000 | 2,777,889 | |
| 3.217% 4/22/42 (b) | 498,000 | 391,936 | |
| 3.591% 7/22/28 (b) | 984,000 | 931,529 | |
| 3.622% 4/1/31 (b) | 1,260,000 | 1,157,366 | |
| 3.625% 1/20/27 | 1,381,000 | 1,337,580 | |
| 3.7% 10/23/24 | 165,000 | 164,646 | |
| 3.737% 4/24/24 (b) | 628,000 | 625,814 | |
| 3.75% 2/25/23 | 186,000 | 186,551 | |
| 3.772% 1/24/29 (b) | 337,000 | 319,761 | |
| 3.875% 4/29/24 | 402,000 | 402,512 | |
| 3.875% 1/27/26 | 144,000 | 141,819 | |
| 3.95% 4/23/27 | 937,000 | 907,331 | |
| 3.971% 7/22/38 (b) | 171,000 | 153,000 | |
| 4.3% 1/27/45 | 55,000 | 48,836 | |
| 4.375% 1/22/47 | 304,000 | 275,856 | |
| 4.431% 1/23/30 (b) | 552,000 | 536,336 | |
| 4.875% 11/1/22 | 973,000 | 979,845 | |
| 5% 11/24/25 | 1,838,000 | 1,867,484 | |
| 5.597% 3/24/51 (b) | 355,000 | 382,755 | |
| 6.375% 7/24/42 | 80,000 | 91,635 | |
| 7.25% 4/1/32 | 27,000 | 31,642 | |
| Nomura Holdings, Inc. 3.103% 1/16/30 | 660,000 | 561,406 | |
| Northern Trust Corp. 1.95% 5/1/30 | 592,000 | 502,743 | |
| Peachtree Corners Funding Trust 3.976% 2/15/25 (a) | 628,000 | 621,251 | |
| S&P Global, Inc.: | |||
| 2.9% 3/1/32 (a) | 1,181,000 | 1,052,526 | |
| 2.95% 1/22/27 | 167,000 | 160,205 | |
| State Street Corp.: | |||
| 1.684% 11/18/27 (b) | 548,000 | 492,042 | |
| 2.65% 5/19/26 | 207,000 | 197,968 | |
| UBS Group AG: | |||
| 1.494% 8/10/27 (a)(b) | 732,000 | 640,561 | |
| 4.125% 9/24/25 (a) | 661,000 | 655,737 | |
| 67,760,932 | |||
| Consumer Finance - 1.9% | |||
| AerCap Ireland Capital Ltd./AerCap Global Aviation Trust: | |||
| 1.65% 10/29/24 | 2,018,000 | 1,863,284 | |
| 2.45% 10/29/26 | 878,000 | 764,530 | |
| 2.875% 8/14/24 | 1,146,000 | 1,091,678 | |
| 3% 10/29/28 | 730,000 | 614,893 | |
| 3.3% 1/30/32 | 567,000 | 453,879 | |
| 3.4% 10/29/33 | 204,000 | 161,080 | |
| 3.5% 1/15/25 | 1,042,000 | 995,148 | |
| 3.85% 10/29/41 | 204,000 | 146,997 | |
| 3.875% 1/23/28 | 430,000 | 388,112 | |
| 4.125% 7/3/23 | 526,000 | 520,759 | |
| 4.45% 10/1/25 | 270,000 | 260,924 | |
| 4.45% 4/3/26 | 393,000 | 375,285 | |
| 4.875% 1/16/24 | 864,000 | 859,484 | |
| 6.5% 7/15/25 | 455,000 | 465,546 | |
| Ally Financial, Inc.: | |||
| 1.45% 10/2/23 | 277,000 | 267,754 | |
| 2.2% 11/2/28 | 330,000 | 268,736 | |
| 3.05% 6/5/23 | 1,381,000 | 1,366,218 | |
| 5.125% 9/30/24 | 268,000 | 270,600 | |
| 5.8% 5/1/25 | 1,168,000 | 1,192,900 | |
| 8% 11/1/31 | 5,339,000 | 5,935,178 | |
| American Express Co.: | |||
| 2.5% 7/30/24 | 1,065,000 | 1,036,180 | |
| 4.05% 12/3/42 | 191,000 | 174,694 | |
| Capital One Financial Corp.: | |||
| 2.6% 5/11/23 | 938,000 | 931,460 | |
| 2.636% 3/3/26 (b) | 612,000 | 577,832 | |
| 3.2% 1/30/23 | 382,000 | 382,195 | |
| 3.273% 3/1/30 (b) | 783,000 | 692,920 | |
| 3.3% 10/30/24 | 398,000 | 388,278 | |
| 3.65% 5/11/27 | 1,693,000 | 1,612,502 | |
| 3.75% 7/28/26 | 267,000 | 255,132 | |
| 3.75% 3/9/27 | 970,000 | 928,461 | |
| 3.8% 1/31/28 | 1,242,000 | 1,168,198 | |
| 3.9% 1/29/24 | 468,000 | 467,234 | |
| 5.268% 5/10/33 (b) | 8,000,000 | 7,855,652 | |
| Discover Financial Services: | |||
| 3.85% 11/21/22 | 633,000 | 634,549 | |
| 3.95% 11/6/24 | 358,000 | 352,758 | |
| 4.1% 2/9/27 | 358,000 | 343,341 | |
| 4.5% 1/30/26 | 1,105,000 | 1,082,709 | |
| Ford Motor Credit Co. LLC: | |||
| 4.063% 11/1/24 | 2,211,000 | 2,097,560 | |
| 5.584% 3/18/24 | 784,000 | 780,080 | |
| GE Capital International Funding Co.: | |||
| 3.373% 11/15/25 | 790,000 | 768,034 | |
| 4.418% 11/15/35 | 874,000 | 816,312 | |
| John Deere Capital Corp.: | |||
| 2.65% 6/24/24 | 287,000 | 283,252 | |
| 2.65% 6/10/26 | 137,000 | 131,601 | |
| 2.7% 1/6/23 | 274,000 | 273,852 | |
| 2.8% 1/27/23 | 137,000 | 137,374 | |
| 2.8% 3/6/23 | 89,000 | 88,984 | |
| 2.8% 9/8/27 | 192,000 | 183,206 | |
| 3.45% 3/7/29 | 548,000 | 529,327 | |
| Synchrony Financial: | |||
| 3.7% 8/4/26 | 129,000 | 119,440 | |
| 3.95% 12/1/27 | 965,000 | 879,689 | |
| 4.25% 8/15/24 | 840,000 | 834,784 | |
| 4.375% 3/19/24 | 996,000 | 989,937 | |
| 5.15% 3/19/29 | 1,802,000 | 1,685,883 | |
| Toyota Motor Credit Corp.: | |||
| 0.5% 8/14/23 | 500,000 | 484,834 | |
| 1.15% 8/13/27 | 577,000 | 502,289 | |
| 1.9% 1/13/27 | 304,000 | 279,323 | |
| 2.7% 1/11/23 | 274,000 | 273,117 | |
| 2.9% 3/30/23 | 973,000 | 973,116 | |
| 3.05% 3/22/27 | 330,000 | 317,275 | |
| 3.35% 1/8/24 | 384,000 | 384,384 | |
| 50,960,733 | |||
| Diversified Financial Services - 0.7% | |||
| AB Svensk Exportkredit 0.25% 9/29/23 | 466,000 | 449,821 | |
| Aon Corp. / Aon Global Holdings PLC 2.6% 12/2/31 | 547,000 | 458,580 | |
| Berkshire Hathaway, Inc.: | |||
| 3.125% 3/15/26 | 315,000 | 308,671 | |
| 4.5% 2/11/43 | 55,000 | 52,450 | |
| Blackstone Private Credit Fund: | |||
| 2.7% 1/15/25 (a) | 437,000 | 398,747 | |
| 4.7% 3/24/25 (a) | 2,482,000 | 2,384,333 | |
| BP Capital Markets America, Inc.: | |||
| 2.721% 1/12/32 | 1,001,000 | 861,651 | |
| 3% 2/24/50 | 384,000 | 278,771 | |
| 3.017% 1/16/27 | 260,000 | 247,710 | |
| 3.06% 6/17/41 | 234,000 | 182,341 | |
| Brixmor Operating Partnership LP: | |||
| 3.9% 3/15/27 | 155,000 | 148,262 | |
| 4.05% 7/1/30 | 804,000 | 725,424 | |
| 4.125% 6/15/26 | 791,000 | 772,182 | |
| 4.125% 5/15/29 | 819,000 | 762,962 | |
| DH Europe Finance II SARL: | |||
| 2.2% 11/15/24 | 227,000 | 217,754 | |
| 2.6% 11/15/29 | 265,000 | 237,624 | |
| 3.4% 11/15/49 | 287,000 | 230,592 | |
| Equitable Holdings, Inc.: | |||
| 3.9% 4/20/23 | 85,000 | 85,422 | |
| 4.35% 4/20/28 | 759,000 | 732,173 | |
| Jackson Financial, Inc.: | |||
| 5.17% 6/8/27 | 1,172,000 | 1,161,845 | |
| 5.67% 6/8/32 | 1,479,000 | 1,428,841 | |
| Japan International Cooperation Agency 1.75% 4/28/31 | 274,000 | 235,738 | |
| KfW: | |||
| 0.25% 10/19/23 | 404,000 | 390,151 | |
| 0.375% 7/18/25 | 472,000 | 434,505 | |
| 0.625% 1/22/26 | 1,471,000 | 1,349,056 | |
| 2% 5/2/25 | 105,000 | 101,787 | |
| 2.5% 11/20/24 | 286,000 | 282,205 | |
| 2.625% 2/28/24 | 559,000 | 555,207 | |
| 2.875% 4/3/28 | 421,000 | 414,378 | |
| Landwirtschaftliche Rentenbank: | |||
| 1.75% 7/27/26 | 233,000 | 220,768 | |
| 2.5% 11/15/27 | 242,000 | 233,250 | |
| Park Aerospace Holdings Ltd. 5.5% 2/15/24 (a) | 766,000 | 759,781 | |
| Pine Street Trust I 4.572% 2/15/29 (a) | 717,000 | 692,526 | |
| Pine Street Trust II 5.568% 2/15/49 (a) | 716,000 | 701,408 | |
| Voya Financial, Inc.: | |||
| 3.65% 6/15/26 | 433,000 | 419,175 | |
| 5.7% 7/15/43 | 103,000 | 104,612 | |
| 19,020,703 | |||
| Insurance - 1.1% | |||
| ACE INA Holdings, Inc.: | |||
| 1.375% 9/15/30 | 739,000 | 589,734 | |
| 3.35% 5/3/26 | 116,000 | 113,443 | |
| 4.35% 11/3/45 | 110,000 | 103,756 | |
| AFLAC, Inc.: | |||
| 3.6% 4/1/30 | 167,000 | 158,148 | |
| 3.625% 11/15/24 | 167,000 | 167,217 | |
| 4% 10/15/46 | 104,000 | 89,627 | |
| AIA Group Ltd.: | |||
| 3.2% 9/16/40 (a) | 438,000 | 349,881 | |
| 3.375% 4/7/30 (a) | 924,000 | 864,664 | |
| Allstate Corp.: | |||
| 3.28% 12/15/26 | 129,000 | 126,387 | |
| 4.2% 12/15/46 | 207,000 | 188,281 | |
| American International Group, Inc.: | |||
| 2.5% 6/30/25 | 1,494,000 | 1,423,853 | |
| 3.75% 7/10/25 | 78,000 | 76,941 | |
| 3.875% 1/15/35 | 74,000 | 66,827 | |
| 3.9% 4/1/26 | 103,000 | 100,918 | |
| 4.2% 4/1/28 | 509,000 | 500,973 | |
| 4.375% 6/30/50 | 157,000 | 139,219 | |
| 4.5% 7/16/44 | 243,000 | 217,609 | |
| 4.7% 7/10/35 | 159,000 | 154,798 | |
| 4.75% 4/1/48 | 269,000 | 251,590 | |
| Aon PLC: | |||
| 3.5% 6/14/24 | 223,000 | 221,621 | |
| 4% 11/27/23 | 82,000 | 82,334 | |
| 4.6% 6/14/44 | 44,000 | 39,622 | |
| 4.75% 5/15/45 | 161,000 | 148,282 | |
| Athene Holding Ltd. 3.5% 1/15/31 | 187,000 | 158,312 | |
| Baylor Scott & White Holdings: | |||
| Series 2021, 2.839% 11/15/50 | 484,000 | 354,269 | |
| 3.967% 11/15/46 | 69,000 | 63,119 | |
| Berkshire Hathaway Finance Corp.: | |||
| 1.45% 10/15/30 | 262,000 | 212,826 | |
| 2.85% 10/15/50 | 367,000 | 264,202 | |
| 4.2% 8/15/48 | 325,000 | 296,936 | |
| 5.75% 1/15/40 | 387,000 | 425,960 | |
| Brighthouse Financial, Inc. 4.7% 6/22/47 | 260,000 | 206,945 | |
| Brown & Brown, Inc. 4.2% 3/17/32 | 217,000 | 197,522 | |
| Fairfax Financial Holdings Ltd. 4.625% 4/29/30 | 177,000 | 169,936 | |
| Five Corners Funding Trust II 2.85% 5/15/30 (a) | 1,385,000 | 1,204,866 | |
| Hartford Financial Services Group, Inc.: | |||
| 2.8% 8/19/29 | 195,000 | 173,871 | |
| 3.6% 8/19/49 | 233,000 | 184,946 | |
| 4.4% 3/15/48 | 266,000 | 240,592 | |
| Liberty Mutual Group, Inc. 4.569% 2/1/29 (a) | 514,000 | 505,394 | |
| Lincoln National Corp.: | |||
| 3.625% 12/12/26 | 165,000 | 159,780 | |
| 4.35% 3/1/48 | 83,000 | 70,329 | |
| 4.375% 6/15/50 | 167,000 | 143,149 | |
| Manulife Financial Corp. 4.15% 3/4/26 | 334,000 | 329,734 | |
| Markel Corp. 3.35% 9/17/29 | 167,000 | 153,360 | |
| Marsh & McLennan Companies, Inc.: | |||
| 3.5% 6/3/24 | 52,000 | 51,828 | |
| 3.875% 3/15/24 | 260,000 | 260,565 | |
| 4.05% 10/15/23 | 186,000 | 186,514 | |
| 4.2% 3/1/48 | 134,000 | 118,487 | |
| 4.35% 1/30/47 | 77,000 | 69,630 | |
| 4.375% 3/15/29 | 711,000 | 702,692 | |
| 4.75% 3/15/39 | 229,000 | 224,058 | |
| 4.9% 3/15/49 | 255,000 | 249,960 | |
| Massachusetts Mutual Life Insurance Co. 3.729% 10/15/70 (a) | 730,000 | 532,214 | |
| MetLife, Inc.: | |||
| 3.6% 11/13/25 | 334,000 | 331,858 | |
| 4.125% 8/13/42 | 171,000 | 153,754 | |
| 4.55% 3/23/30 | 1,754,000 | 1,768,566 | |
| 4.6% 5/13/46 | 55,000 | 53,273 | |
| 4.721% 12/15/44 (b) | 137,000 | 128,516 | |
| Metropolitan Life Global Funding I 3% 1/10/23 (a) | 331,000 | 330,806 | |
| Pacific LifeCorp 5.125% 1/30/43 (a) | 660,000 | 633,448 | |
| Principal Financial Group, Inc. 4.3% 11/15/46 | 219,000 | 201,945 | |
| Progressive Corp.: | |||
| 2.45% 1/15/27 | 130,000 | 122,534 | |
| 2.5% 3/15/27 | 254,000 | 240,087 | |
| 3% 3/15/32 | 478,000 | 428,157 | |
| 4.2% 3/15/48 | 152,000 | 139,472 | |
| Prudential Financial, Inc.: | |||
| 3.878% 3/27/28 | 114,000 | 111,300 | |
| 3.905% 12/7/47 | 15,000 | 12,933 | |
| 3.935% 12/7/49 | 294,000 | 253,066 | |
| 4.35% 2/25/50 | 343,000 | 315,802 | |
| 4.418% 3/27/48 | 174,000 | 161,006 | |
| 5.125% 3/1/52 (b) | 115,000 | 106,162 | |
| 5.7% 12/14/36 | 10,000 | 10,866 | |
| SunAmerica, Inc.: | |||
| 3.5% 4/4/25 (a) | 254,000 | 246,782 | |
| 3.65% 4/5/27 (a) | 4,362,000 | 4,100,413 | |
| 3.85% 4/5/29 (a) | 355,000 | 328,066 | |
| 3.9% 4/5/32 (a) | 423,000 | 379,482 | |
| 4.35% 4/5/42 (a) | 96,000 | 81,867 | |
| 4.4% 4/5/52 (a) | 285,000 | 237,594 | |
| Swiss Re Finance Luxembourg SA 5% 4/2/49 (a)(b) | 200,000 | 189,250 | |
| Teachers Insurance & Annuity Association of America 4.9% 9/15/44 (a) | 671,000 | 643,341 | |
| The Chubb Corp. 6.5% 5/15/38 | 96,000 | 112,579 | |
| The Travelers Companies, Inc.: | |||
| 4.1% 3/4/49 | 167,000 | 150,844 | |
| 4.3% 8/25/45 | 40,000 | 36,968 | |
| 6.25% 6/15/37 | 229,000 | 268,957 | |
| TIAA Asset Management Finance LLC 4.125% 11/1/24 (a) | 222,000 | 220,381 | |
| Unum Group: | |||
| 3.875% 11/5/25 | 610,000 | 599,411 | |
| 4% 3/15/24 | 745,000 | 744,811 | |
| 4% 6/15/29 | 554,000 | 522,034 | |
| 5.75% 8/15/42 | 914,000 | 854,401 | |
| 29,308,453 | |||
| TOTAL FINANCIALS | 338,206,234 | ||
| HEALTH CARE - 2.3% | |||
| Biotechnology - 0.3% | |||
| AbbVie, Inc.: | |||
| 2.6% 11/21/24 | 424,000 | 410,415 | |
| 2.9% 11/6/22 | 156,000 | 155,982 | |
| 2.95% 11/21/26 | 310,000 | 293,739 | |
| 3.2% 11/21/29 | 530,000 | 487,569 | |
| 3.25% 10/1/22 | 82,000 | 82,000 | |
| 3.6% 5/14/25 | 247,000 | 242,983 | |
| 3.8% 3/15/25 | 242,000 | 240,063 | |
| 4.05% 11/21/39 | 310,000 | 276,437 | |
| 4.25% 11/14/28 | 227,000 | 224,819 | |
| 4.25% 11/21/49 | 514,000 | 456,294 | |
| 4.3% 5/14/36 | 172,000 | 161,561 | |
| 4.4% 11/6/42 | 131,000 | 119,053 | |
| 4.45% 5/14/46 | 192,000 | 174,165 | |
| 4.55% 3/15/35 | 182,000 | 177,031 | |
| 4.7% 5/14/45 | 361,000 | 339,814 | |
| 4.75% 3/15/45 | 174,000 | 163,618 | |
| 4.875% 11/14/48 | 160,000 | 153,325 | |
| Amgen, Inc.: | |||
| 1.65% 8/15/28 | 532,000 | 456,176 | |
| 1.9% 2/21/25 | 224,000 | 213,759 | |
| 2.6% 8/19/26 | 288,000 | 272,380 | |
| 2.8% 8/15/41 | 544,000 | 403,158 | |
| 3.125% 5/1/25 | 55,000 | 53,914 | |
| 3.35% 2/22/32 | 160,000 | 146,467 | |
| 3.375% 2/21/50 | 307,000 | 234,579 | |
| 4.4% 5/1/45 | 272,000 | 245,286 | |
| 4.663% 6/15/51 | 342,000 | 319,839 | |
| Gilead Sciences, Inc.: | |||
| 1.65% 10/1/30 | 412,000 | 337,588 | |
| 2.8% 10/1/50 | 408,000 | 284,719 | |
| 3.65% 3/1/26 | 169,000 | 165,967 | |
| 4.15% 3/1/47 | 341,000 | 299,382 | |
| 4.75% 3/1/46 | 302,000 | 289,518 | |
| 7,881,600 | |||
| Health Care Equipment & Supplies - 0.2% | |||
| Abbott Laboratories: | |||
| 3.75% 11/30/26 | 191,000 | 191,992 | |
| 4.75% 11/30/36 | 123,000 | 130,316 | |
| 4.9% 11/30/46 | 285,000 | 298,653 | |
| Baxter International, Inc.: | |||
| 1.915% 2/1/27 | 405,000 | 362,688 | |
| 2.539% 2/1/32 | 446,000 | 376,497 | |
| Becton, Dickinson & Co.: | |||
| 2.823% 5/20/30 | 241,000 | 211,981 | |
| 3.363% 6/6/24 | 124,000 | 122,719 | |
| 3.7% 6/6/27 | 761,000 | 735,398 | |
| 4.685% 12/15/44 | 298,000 | 275,320 | |
| Boston Scientific Corp.: | |||
| 3.45% 3/1/24 | 595,000 | 594,212 | |
| 4% 3/1/29 | 296,000 | 284,427 | |
| 4.7% 3/1/49 | 478,000 | 456,547 | |
| Stryker Corp.: | |||
| 1.95% 6/15/30 | 255,000 | 211,798 | |
| 2.9% 6/15/50 | 255,000 | 184,152 | |
| Zimmer Biomet Holdings, Inc. 3.55% 4/1/25 | 312,000 | 307,908 | |
| 4,744,608 | |||
| Health Care Providers & Services - 1.3% | |||
| Aetna, Inc.: | |||
| 2.8% 6/15/23 | 411,000 | 405,902 | |
| 3.875% 8/15/47 | 143,000 | 118,128 | |
| 4.125% 11/15/42 | 311,000 | 264,053 | |
| Allina Health System, Inc. 3.887% 4/15/49 | 182,000 | 160,888 | |
| Banner Health: | |||
| 2.907% 1/1/42 | 45,000 | 35,243 | |
| 2.913% 1/1/51 | 377,000 | 281,363 | |
| Baptist Healthcare System Obli 3.54% 8/15/50 | 368,000 | 292,830 | |
| Bon Secours Mercy Health, Inc. 2.095% 6/1/31 | 252,000 | 210,595 | |
| Cardinal Health, Inc. 4.368% 6/15/47 | 381,000 | 323,751 | |
| Centene Corp.: | |||
| 2.45% 7/15/28 | 1,232,000 | 1,028,240 | |
| 2.625% 8/1/31 | 575,000 | 457,413 | |
| 3.375% 2/15/30 | 640,000 | 542,752 | |
| 4.25% 12/15/27 | 721,000 | 673,032 | |
| 4.625% 12/15/29 | 1,121,000 | 1,045,333 | |
| Children's Hospital Medical Center 4.268% 5/15/44 | 91,000 | 85,757 | |
| Children's Hospital of Philadelphia 2.704% 7/1/50 | 277,000 | 195,432 | |
| Cigna Corp.: | |||
| 3% 7/15/23 | 274,000 | 271,944 | |
| 3.05% 10/15/27 | 402,000 | 377,663 | |
| 3.75% 7/15/23 | 185,000 | 185,402 | |
| 4.125% 11/15/25 | 270,000 | 270,296 | |
| 4.375% 10/15/28 | 1,489,000 | 1,477,509 | |
| 4.5% 2/25/26 | 320,000 | 323,194 | |
| 4.8% 8/15/38 | 1,120,000 | 1,089,398 | |
| 4.8% 7/15/46 | 208,000 | 198,137 | |
| 4.9% 12/15/48 | 707,000 | 678,613 | |
| 6.125% 11/15/41 | 82,000 | 90,887 | |
| CommonSpirit Health: | |||
| 3.91% 10/1/50 | 425,000 | 341,125 | |
| 4.35% 11/1/42 | 55,000 | 49,679 | |
| CVS Health Corp.: | |||
| 2.7% 8/21/40 | 415,000 | 299,617 | |
| 2.875% 6/1/26 | 206,000 | 196,040 | |
| 3% 8/15/26 | 532,000 | 508,800 | |
| 3.25% 8/15/29 | 482,000 | 439,999 | |
| 3.625% 4/1/27 | 225,000 | 219,180 | |
| 3.875% 7/20/25 | 128,000 | 127,194 | |
| 4.1% 3/25/25 | 113,000 | 113,729 | |
| 4.3% 3/25/28 | 655,000 | 648,070 | |
| 4.78% 3/25/38 | 749,000 | 708,970 | |
| 4.875% 7/20/35 | 85,000 | 84,120 | |
| 5.05% 3/25/48 | 751,000 | 718,893 | |
| 5.125% 7/20/45 | 242,000 | 233,100 | |
| 5.3% 12/5/43 | 120,000 | 119,835 | |
| Elevance Health, Inc.: | |||
| 3.125% 5/15/50 | 234,000 | 176,638 | |
| 3.3% 1/15/23 | 55,000 | 55,075 | |
| 3.65% 12/1/27 | 952,000 | 926,518 | |
| 4.375% 12/1/47 | 287,000 | 264,146 | |
| 4.55% 3/1/48 | 129,000 | 121,981 | |
| 4.625% 5/15/42 | 71,000 | 67,421 | |
| 4.65% 1/15/43 | 55,000 | 52,373 | |
| Franciscan Missionaries of Our Lady Health System, Inc. 3.914% 7/1/49 | 292,000 | 253,177 | |
| HCA Holdings, Inc.: | |||
| 3.5% 9/1/30 | 6,208,000 | 5,281,208 | |
| 5.25% 6/15/49 | 475,000 | 409,094 | |
| 5.625% 9/1/28 | 1,513,000 | 1,488,331 | |
| 5.875% 2/1/29 | 1,179,000 | 1,179,902 | |
| Humana, Inc.: | |||
| 1.35% 2/3/27 | 346,000 | 302,520 | |
| 2.15% 2/3/32 | 347,000 | 280,978 | |
| 3.125% 8/15/29 | 223,000 | 201,502 | |
| 3.7% 3/23/29 | 333,000 | 315,233 | |
| 4.95% 10/1/44 | 69,000 | 67,076 | |
| INTEGRIS Baptist Medical Center, Inc. 3.875% 8/15/50 | 313,000 | 266,249 | |
| Kaiser Foundation Hospitals: | |||
| 3.266% 11/1/49 | 251,000 | 199,034 | |
| 4.15% 5/1/47 | 180,000 | 167,960 | |
| 4.875% 4/1/42 | 49,000 | 50,051 | |
| Memorial Sloan-Kettring Cancer Center 4.2% 7/1/55 | 82,000 | 75,097 | |
| MidMichigan Health 3.409% 6/1/50 | 129,000 | 103,005 | |
| New York & Presbyterian Hospital: | |||
| 4.024% 8/1/45 | 96,000 | 87,306 | |
| 4.063% 8/1/56 | 72,000 | 66,228 | |
| Novant Health, Inc. 3.168% 11/1/51 | 227,000 | 176,252 | |
| NYU Hospitals Center 4.784% 7/1/44 | 208,000 | 204,974 | |
| Orlando Health Obligated Group 3.327% 10/1/50 | 208,000 | 161,768 | |
| Partners Healthcare System, Inc. 4.117% 7/1/55 | 96,000 | 88,321 | |
| Piedmont Healthcare, Inc. 2.719% 1/1/42 | 42,000 | 31,456 | |
| Providence St. Joseph Health Obligated Group 2.7% 10/1/51 | 74,000 | 50,231 | |
| Sabra Health Care LP 3.2% 12/1/31 | 1,175,000 | 932,498 | |
| Sutter Health 3.361% 8/15/50 | 504,000 | 386,644 | |
| Toledo Hospital 5.325% 11/15/28 | 265,000 | 250,581 | |
| Trinity Health Corp. 2.632% 12/1/40 | 121,000 | 90,075 | |
| UnitedHealth Group, Inc.: | |||
| 1.15% 5/15/26 | 109,000 | 98,821 | |
| 1.25% 1/15/26 | 216,000 | 199,215 | |
| 2% 5/15/30 | 100,000 | 85,691 | |
| 2.3% 5/15/31 | 92,000 | 79,678 | |
| 2.375% 8/15/24 | 270,000 | 264,273 | |
| 2.9% 5/15/50 | 217,000 | 162,517 | |
| 3.25% 5/15/51 | 105,000 | 82,388 | |
| 3.375% 4/15/27 | 148,000 | 145,587 | |
| 3.5% 6/15/23 | 244,000 | 244,809 | |
| 3.7% 8/15/49 | 288,000 | 245,621 | |
| 3.75% 7/15/25 | 96,000 | 95,870 | |
| 3.75% 10/15/47 | 262,000 | 226,404 | |
| 3.85% 6/15/28 | 318,000 | 315,990 | |
| 3.875% 12/15/28 | 411,000 | 408,786 | |
| 3.875% 8/15/59 | 344,000 | 297,134 | |
| 4.2% 1/15/47 | 99,000 | 92,212 | |
| 4.375% 3/15/42 | 324,000 | 308,000 | |
| 4.75% 7/15/45 | 46,000 | 46,260 | |
| West Virginia University Health System Obligated Group 3.129% 6/1/50 | 170,000 | 124,049 | |
| 34,246,314 | |||
| Life Sciences Tools & Services - 0.0% | |||
| Danaher Corp. 4.375% 9/15/45 | 65,000 | 60,251 | |
| PerkinElmer, Inc.: | |||
| 0.85% 9/15/24 | 154,000 | 142,533 | |
| 2.25% 9/15/31 | 191,000 | 150,926 | |
| Thermo Fisher Scientific, Inc.: | |||
| 2.6% 10/1/29 | 447,000 | 405,084 | |
| 5.3% 2/1/44 | 160,000 | 171,568 | |
| 930,362 | |||
| Pharmaceuticals - 0.5% | |||
| AstraZeneca Finance LLC: | |||
| 1.2% 5/28/26 | 249,000 | 225,253 | |
| 2.25% 5/28/31 | 242,000 | 210,660 | |
| AstraZeneca PLC: | |||
| 4.375% 11/16/45 | 207,000 | 199,227 | |
| 4.375% 8/17/48 | 339,000 | 332,303 | |
| 6.45% 9/15/37 | 89,000 | 106,869 | |
| Bayer U.S. Finance II LLC: | |||
| 2.85% 4/15/25 (a) | 105,000 | 100,604 | |
| 3.95% 4/15/45 (a) | 38,000 | 28,921 | |
| 4.25% 12/15/25 (a) | 548,000 | 540,841 | |
| Bristol-Myers Squibb Co.: | |||
| 2.9% 7/26/24 | 312,000 | 309,021 | |
| 3.2% 6/15/26 | 73,000 | 71,963 | |
| 3.25% 8/1/42 | 77,000 | 63,445 | |
| 3.4% 7/26/29 | 156,000 | 150,584 | |
| 3.55% 3/15/42 | 334,000 | 293,418 | |
| 4.125% 6/15/39 | 78,000 | 74,498 | |
| 4.25% 10/26/49 | 332,000 | 311,776 | |
| 4.35% 11/15/47 | 183,000 | 174,379 | |
| 4.55% 2/20/48 | 388,000 | 379,556 | |
| Elanco Animal Health, Inc. 6.4% 8/28/28 (b) | 168,000 | 159,919 | |
| Eli Lilly & Co. 2.25% 5/15/50 | 592,000 | 418,422 | |
| GlaxoSmithKline Capital PLC 3% 6/1/24 | 320,000 | 317,499 | |
| GlaxoSmithKline Capital, Inc. 6.375% 5/15/38 | 198,000 | 236,440 | |
| GSK Consumer Healthcare Capital U.S. LLC: | |||
| 3.375% 3/24/27 (a) | 498,000 | 476,651 | |
| 3.625% 3/24/32 (a) | 499,000 | 461,156 | |
| Johnson & Johnson: | |||
| 0.55% 9/1/25 | 221,000 | 203,828 | |
| 1.3% 9/1/30 | 221,000 | 185,898 | |
| 2.1% 9/1/40 | 221,000 | 161,496 | |
| 2.45% 3/1/26 | 153,000 | 148,810 | |
| 2.45% 9/1/60 | 221,000 | 149,827 | |
| 3.4% 1/15/38 | 256,000 | 230,270 | |
| 3.5% 1/15/48 | 165,000 | 146,446 | |
| 3.625% 3/3/37 | 110,000 | 104,227 | |
| 4.5% 12/5/43 | 182,000 | 182,379 | |
| 4.85% 5/15/41 | 117,000 | 122,534 | |
| Merck & Co., Inc.: | |||
| 2.4% 9/15/22 | 55,000 | 55,016 | |
| 2.45% 6/24/50 | 152,000 | 106,746 | |
| 2.9% 3/7/24 | 315,000 | 313,031 | |
| 3.6% 9/15/42 | 55,000 | 48,137 | |
| 3.7% 2/10/45 | 175,000 | 153,109 | |
| 3.9% 3/7/39 | 334,000 | 315,644 | |
| Mylan NV: | |||
| 4.55% 4/15/28 | 502,000 | 478,555 | |
| 5.2% 4/15/48 | 82,000 | 65,480 | |
| Novartis Capital Corp.: | |||
| 1.75% 2/14/25 | 257,000 | 247,878 | |
| 2.4% 9/21/22 | 103,000 | 103,036 | |
| 2.75% 8/14/50 | 377,000 | 293,497 | |
| 3% 11/20/25 | 287,000 | 283,480 | |
| 3.1% 5/17/27 | 162,000 | 157,667 | |
| 3.7% 9/21/42 | 77,000 | 69,547 | |
| 4% 11/20/45 | 144,000 | 133,931 | |
| Shire Acquisitions Investments Ireland DAC: | |||
| 2.875% 9/23/23 | 104,000 | 102,836 | |
| 3.2% 9/23/26 | 1,074,000 | 1,031,543 | |
| Utah Acquisition Sub, Inc.: | |||
| 3.95% 6/15/26 | 398,000 | 374,953 | |
| 5.25% 6/15/46 | 90,000 | 72,593 | |
| Viatris, Inc.: | |||
| 1.65% 6/22/25 | 123,000 | 111,347 | |
| 2.7% 6/22/30 | 1,067,000 | 856,333 | |
| 3.85% 6/22/40 | 273,000 | 193,367 | |
| 4% 6/22/50 | 722,000 | 483,442 | |
| Zoetis, Inc.: | |||
| 3.25% 2/1/23 | 344,000 | 342,780 | |
| 3.95% 9/12/47 | 55,000 | 48,001 | |
| 4.7% 2/1/43 | 36,000 | 34,454 | |
| 13,755,523 | |||
| TOTAL HEALTH CARE | 61,558,407 | ||
| INDUSTRIALS - 1.3% | |||
| Aerospace & Defense - 0.3% | |||
| BAE Systems PLC 3.4% 4/15/30 (a) | 285,000 | 260,163 | |
| Lockheed Martin Corp. 3.55% 1/15/26 | 104,000 | 104,188 | |
| Northrop Grumman Corp.: | |||
| 3.25% 1/15/28 | 230,000 | 218,620 | |
| 3.85% 4/15/45 | 51,000 | 42,932 | |
| 4.03% 10/15/47 | 516,000 | 458,187 | |
| 4.75% 6/1/43 | 110,000 | 105,412 | |
| Raytheon Technologies Corp.: | |||
| 1.9% 9/1/31 | 330,000 | 270,394 | |
| 3.15% 12/15/24 | 244,000 | 240,976 | |
| 3.65% 8/16/23 | 18,000 | 17,981 | |
| 3.75% 11/1/46 | 205,000 | 173,623 | |
| 4.05% 5/4/47 | 64,000 | 56,674 | |
| 4.125% 11/16/28 | 403,000 | 397,709 | |
| 4.35% 4/15/47 | 181,000 | 167,488 | |
| 4.45% 11/16/38 | 145,000 | 138,303 | |
| 4.5% 6/1/42 | 202,000 | 192,627 | |
| 4.625% 11/16/48 | 362,000 | 353,345 | |
| 4.875% 10/15/40 | 27,000 | 26,371 | |
| 5.7% 4/15/40 | 55,000 | 59,463 | |
| The Boeing Co.: | |||
| 2.5% 3/1/25 | 126,000 | 119,118 | |
| 2.7% 2/1/27 | 217,000 | 193,115 | |
| 2.8% 3/1/23 | 135,000 | 134,223 | |
| 2.95% 2/1/30 | 278,000 | 231,325 | |
| 3.625% 3/1/48 | 110,000 | 73,674 | |
| 3.65% 3/1/47 | 76,000 | 51,423 | |
| 3.75% 2/1/50 | 424,000 | 299,189 | |
| 4.875% 5/1/25 | 479,000 | 477,232 | |
| 5.04% 5/1/27 | 372,000 | 367,450 | |
| 5.15% 5/1/30 | 706,000 | 677,674 | |
| 5.705% 5/1/40 | 1,466,000 | 1,367,436 | |
| 5.805% 5/1/50 | 869,000 | 798,152 | |
| 5.93% 5/1/60 | 372,000 | 338,676 | |
| 6.875% 3/15/39 | 90,000 | 93,728 | |
| 8,506,871 | |||
| Air Freight & Logistics - 0.1% | |||
| FedEx Corp.: | |||
| 3.1% 8/5/29 | 173,000 | 157,672 | |
| 3.9% 2/1/35 | 162,000 | 144,300 | |
| 4.05% 2/15/48 | 100,000 | 83,689 | |
| 4.4% 1/15/47 | 219,000 | 191,746 | |
| 4.55% 4/1/46 | 41,000 | 36,796 | |
| 4.95% 10/17/48 | 216,000 | 205,656 | |
| 5.25% 5/15/50 | 117,000 | 116,494 | |
| United Parcel Service, Inc.: | |||
| 2.4% 11/15/26 | 206,000 | 195,448 | |
| 3.4% 11/15/46 | 73,000 | 60,824 | |
| 3.75% 11/15/47 | 236,000 | 210,213 | |
| 4.25% 3/15/49 | 110,000 | 104,776 | |
| 4.45% 4/1/30 | 167,000 | 170,770 | |
| 5.3% 4/1/50 | 161,000 | 176,929 | |
| 6.2% 1/15/38 | 69,000 | 80,488 | |
| 1,935,801 | |||
| Airlines - 0.0% | |||
| American Airlines Pass Through Trust equipment trust certificate 2.875% 1/11/36 | 228,000 | 194,098 | |
| American Airlines pass-thru trust equipment trust certificate 4.95% 7/15/24 | 18,386 | 18,046 | |
| American Airlines, Inc. equipment trust certificate 3.2% 12/15/29 | 158,788 | 145,136 | |
| Southwest Airlines Co. 5.125% 6/15/27 | 167,000 | 168,544 | |
| United Airlines 2015-1 Class AA pass-thru trust 3.45% 6/1/29 | 13,488 | 12,555 | |
| United Airlines pass-thru trust equipment trust certificate 3.1% 1/7/30 | 327,135 | 298,717 | |
| United Airlines, Inc. equipment trust certificate Series 2012-2B 4% 4/29/26 | 74,339 | 71,417 | |
| 908,513 | |||
| Building Products - 0.1% | |||
| Carrier Global Corp.: | |||
| 2.242% 2/15/25 | 347,000 | 329,730 | |
| 2.493% 2/15/27 | 245,000 | 222,889 | |
| 2.722% 2/15/30 | 427,000 | 368,686 | |
| 3.377% 4/5/40 | 171,000 | 134,050 | |
| 3.577% 4/5/50 | 387,000 | 292,890 | |
| Masco Corp.: | |||
| 2% 2/15/31 | 255,000 | 200,358 | |
| 3.125% 2/15/51 | 129,000 | 88,611 | |
| Owens Corning 3.95% 8/15/29 | 187,000 | 173,459 | |
| 1,810,673 | |||
| Commercial Services & Supplies - 0.1% | |||
| Republic Services, Inc.: | |||
| 1.45% 2/15/31 | 614,000 | 482,007 | |
| 2.9% 7/1/26 | 116,000 | 110,790 | |
| 3.2% 3/15/25 | 309,000 | 303,025 | |
| 3.95% 5/15/28 | 288,000 | 282,336 | |
| Waste Management, Inc.: | |||
| 2.4% 5/15/23 | 145,000 | 144,050 | |
| 4.15% 7/15/49 | 352,000 | 320,241 | |
| 1,642,449 | |||
| Electrical Equipment - 0.0% | |||
| Eaton Corp.: | |||
| 2.75% 11/2/22 | 157,000 | 156,893 | |
| 4% 11/2/32 | 52,000 | 50,221 | |
| 4.15% 11/2/42 | 52,000 | 46,665 | |
| 253,779 | |||
| Industrial Conglomerates - 0.1% | |||
| 3M Co.: | |||
| 2% 2/14/25 | 173,000 | 166,607 | |
| 2.375% 8/26/29 | 305,000 | 273,566 | |
| 2.65% 4/15/25 | 125,000 | 122,580 | |
| 2.875% 10/15/27 | 110,000 | 105,786 | |
| 3.05% 4/15/30 | 101,000 | 94,214 | |
| 3.125% 9/19/46 | 76,000 | 59,665 | |
| 3.25% 8/26/49 | 235,000 | 186,644 | |
| 3.7% 4/15/50 | 124,000 | 106,248 | |
| General Electric Co.: | |||
| 3.625% 5/1/30 | 328,000 | 291,220 | |
| 6.875% 1/10/39 | 4,000 | 4,506 | |
| Honeywell International, Inc.: | |||
| 1.35% 6/1/25 | 280,000 | 263,539 | |
| 1.95% 6/1/30 | 304,000 | 261,028 | |
| 2.5% 11/1/26 | 196,000 | 186,958 | |
| 2.8% 6/1/50 | 282,000 | 217,017 | |
| 3.812% 11/21/47 | 38,000 | 34,773 | |
| 2,374,351 | |||
| Machinery - 0.1% | |||
| Caterpillar Financial Services Corp.: | |||
| 0.45% 9/14/23 | 382,000 | 370,428 | |
| 1.1% 9/14/27 | 394,000 | 344,859 | |
| 2.4% 8/9/26 | 78,000 | 74,095 | |
| 3.45% 5/15/23 | 384,000 | 384,904 | |
| Caterpillar, Inc.: | |||
| 3.25% 9/19/49 | 456,000 | 374,745 | |
| 3.803% 8/15/42 | 69,000 | 62,828 | |
| 5.3% 9/15/35 | 192,000 | 208,095 | |
| Cummins, Inc. 1.5% 9/1/30 | 167,000 | 135,348 | |
| Deere & Co.: | |||
| 2.875% 9/7/49 | 331,000 | 260,100 | |
| 5.375% 10/16/29 | 27,000 | 29,106 | |
| Ingersoll-Rand Luxembourg Finance SA: | |||
| 3.8% 3/21/29 | 393,000 | 368,019 | |
| 4.65% 11/1/44 | 165,000 | 148,693 | |
| Otis Worldwide Corp.: | |||
| 2.565% 2/15/30 | 367,000 | 317,036 | |
| 3.362% 2/15/50 | 279,000 | 210,937 | |
| Parker Hannifin Corp.: | |||
| 3.25% 3/1/27 | 155,000 | 148,171 | |
| 4% 6/14/49 | 163,000 | 137,132 | |
| 4.1% 3/1/47 | 155,000 | 132,960 | |
| 3,707,456 | |||
| Professional Services - 0.0% | |||
| Thomson Reuters Corp.: | |||
| 3.35% 5/15/26 | 192,000 | 186,258 | |
| 3.85% 9/29/24 | 130,000 | 129,059 | |
| 315,317 | |||
| Road & Rail - 0.3% | |||
| Burlington Northern Santa Fe LLC: | |||
| 3% 3/15/23 | 77,000 | 76,936 | |
| 3.05% 2/15/51 | 121,000 | 92,021 | |
| 3.25% 6/15/27 | 206,000 | 201,521 | |
| 3.55% 2/15/50 | 167,000 | 139,405 | |
| 3.9% 8/1/46 | 127,000 | 112,760 | |
| 4.05% 6/15/48 | 462,000 | 418,626 | |
| 4.125% 6/15/47 | 78,000 | 71,558 | |
| 4.15% 4/1/45 | 47,000 | 42,702 | |
| 4.375% 9/1/42 | 123,000 | 116,171 | |
| 4.55% 9/1/44 | 82,000 | 78,814 | |
| 4.9% 4/1/44 | 110,000 | 110,509 | |
| Canadian National Railway Co.: | |||
| 2.45% 5/1/50 | 457,000 | 307,449 | |
| 3.2% 8/2/46 | 90,000 | 70,234 | |
| Canadian Pacific Railway Co.: | |||
| 1.75% 12/2/26 | 310,000 | 280,543 | |
| 2.45% 12/2/31 | 654,000 | 559,553 | |
| 3.1% 12/2/51 | 325,000 | 239,386 | |
| CSX Corp.: | |||
| 3.25% 6/1/27 | 137,000 | 131,460 | |
| 3.4% 8/1/24 | 127,000 | 125,923 | |
| 3.8% 11/1/46 | 157,000 | 133,043 | |
| 3.95% 5/1/50 | 98,000 | 84,724 | |
| 4.1% 3/15/44 | 186,000 | 163,326 | |
| 4.5% 3/15/49 | 378,000 | 353,858 | |
| 4.75% 11/15/48 | 159,000 | 155,253 | |
| Norfolk Southern Corp.: | |||
| 3.65% 8/1/25 | 329,000 | 327,779 | |
| 3.8% 8/1/28 | 257,000 | 251,213 | |
| 3.95% 10/1/42 | 52,000 | 45,299 | |
| 4.05% 8/15/52 | 237,000 | 206,450 | |
| 4.65% 1/15/46 | 89,000 | 85,807 | |
| Union Pacific Corp.: | |||
| 2.15% 2/5/27 | 247,000 | 228,833 | |
| 2.75% 3/1/26 | 183,000 | 175,595 | |
| 2.8% 2/14/32 | 334,000 | 297,302 | |
| 2.891% 4/6/36 | 252,000 | 208,310 | |
| 3% 4/15/27 | 137,000 | 131,059 | |
| 3.25% 2/5/50 | 370,000 | 290,137 | |
| 3.35% 8/15/46 | 129,000 | 103,618 | |
| 3.6% 9/15/37 | 90,000 | 80,294 | |
| 3.799% 10/1/51 | 77,000 | 65,864 | |
| 3.839% 3/20/60 | 386,000 | 322,199 | |
| 6,885,534 | |||
| Trading Companies & Distributors - 0.2% | |||
| Air Lease Corp.: | |||
| 2.2% 1/15/27 | 237,000 | 206,555 | |
| 2.25% 1/15/23 | 166,000 | 164,314 | |
| 2.625% 7/1/22 | 258,000 | 258,000 | |
| 2.75% 1/15/23 | 274,000 | 272,049 | |
| 3% 9/15/23 | 110,000 | 107,539 | |
| 3.125% 12/1/30 | 334,000 | 272,988 | |
| 3.375% 7/1/25 | 809,000 | 761,817 | |
| 3.625% 12/1/27 | 262,000 | 233,751 | |
| 3.875% 7/3/23 | 701,000 | 694,811 | |
| 4.25% 2/1/24 | 1,082,000 | 1,068,910 | |
| 4.25% 9/15/24 | 448,000 | 439,606 | |
| 4,480,340 | |||
| Transportation Infrastructure - 0.0% | |||
| Avolon Holdings Funding Ltd.: | |||
| 3.95% 7/1/24 (a) | 262,000 | 250,845 | |
| 4.25% 4/15/26 (a) | 198,000 | 183,357 | |
| 4.375% 5/1/26 (a) | 587,000 | 543,785 | |
| 5.25% 5/15/24 (a) | 479,000 | 470,601 | |
| 1,448,588 | |||
| TOTAL INDUSTRIALS | 34,269,672 | ||
| INFORMATION TECHNOLOGY - 1.7% | |||
| Communications Equipment - 0.0% | |||
| Cisco Systems, Inc.: | |||
| 2.2% 9/20/23 | 206,000 | 204,223 | |
| 2.5% 9/20/26 | 137,000 | 131,602 | |
| 3.5% 6/15/25 | 117,000 | 117,403 | |
| 5.9% 2/15/39 | 340,000 | 387,090 | |
| 840,318 | |||
| Electronic Equipment & Components - 0.2% | |||
| Dell International LLC/EMC Corp.: | |||
| 4% 7/15/24 | 315,000 | 313,896 | |
| 4.9% 10/1/26 | 259,000 | 259,093 | |
| 5.3% 10/1/29 | 690,000 | 680,223 | |
| 5.45% 6/15/23 | 217,000 | 219,193 | |
| 5.85% 7/15/25 | 162,000 | 167,072 | |
| 6.02% 6/15/26 | 638,000 | 662,216 | |
| 6.1% 7/15/27 | 298,000 | 312,440 | |
| 6.2% 7/15/30 | 258,000 | 268,499 | |
| 8.1% 7/15/36 | 287,000 | 335,011 | |
| 8.35% 7/15/46 | 329,000 | 409,712 | |
| Tyco Electronics Group SA: | |||
| 3.45% 8/1/24 | 100,000 | 99,678 | |
| 3.7% 2/15/26 | 147,000 | 146,299 | |
| 7.125% 10/1/37 | 68,000 | 84,431 | |
| 3,957,763 | |||
| IT Services - 0.3% | |||
| CDW LLC/CDW Finance Corp. 2.67% 12/1/26 | 394,000 | 351,028 | |
| Fidelity National Information Services, Inc.: | |||
| 1.15% 3/1/26 | 585,000 | 517,259 | |
| 2.25% 3/1/31 | 485,000 | 393,639 | |
| Fiserv, Inc.: | |||
| 3.5% 7/1/29 | 304,000 | 277,305 | |
| 4.4% 7/1/49 | 504,000 | 433,144 | |
| Global Payments, Inc. 1.2% 3/1/26 | 810,000 | 713,552 | |
| MasterCard, Inc.: | |||
| 3.3% 3/26/27 | 198,000 | 194,559 | |
| 3.35% 3/26/30 | 276,000 | 263,422 | |
| 3.8% 11/21/46 | 104,000 | 93,914 | |
| 3.85% 3/26/50 | 488,000 | 446,813 | |
| PayPal Holdings, Inc.: | |||
| 1.65% 6/1/25 | 375,000 | 353,748 | |
| 2.3% 6/1/30 | 434,000 | 372,573 | |
| The Western Union Co. 2.85% 1/10/25 | 300,000 | 287,730 | |
| Visa, Inc.: | |||
| 1.1% 2/15/31 | 560,000 | 448,002 | |
| 1.9% 4/15/27 | 393,000 | 362,499 | |
| 2.05% 4/15/30 | 509,000 | 446,504 | |
| 2.7% 4/15/40 | 327,000 | 262,913 | |
| 2.75% 9/15/27 | 327,000 | 312,514 | |
| 3.15% 12/14/25 | 247,000 | 243,148 | |
| 4.3% 12/14/45 | 182,000 | 179,784 | |
| 6,954,050 | |||
| Semiconductors & Semiconductor Equipment - 0.4% | |||
| Analog Devices, Inc. 2.8% 10/1/41 | 408,000 | 319,663 | |
| Applied Materials, Inc. 4.35% 4/1/47 | 354,000 | 342,517 | |
| Broadcom Corp./Broadcom Cayman LP: | |||
| 3.5% 1/15/28 | 192,000 | 177,717 | |
| 3.875% 1/15/27 | 105,000 | 101,031 | |
| Broadcom, Inc.: | |||
| 1.95% 2/15/28 (a) | 209,000 | 177,961 | |
| 2.45% 2/15/31 (a) | 2,705,000 | 2,173,301 | |
| 2.6% 2/15/33 (a) | 1,777,000 | 1,366,349 | |
| 3.459% 9/15/26 | 346,000 | 331,490 | |
| 3.469% 4/15/34 (a) | 117,000 | 95,223 | |
| 3.5% 2/15/41 (a) | 1,435,000 | 1,082,162 | |
| 3.75% 2/15/51 (a) | 1,267,000 | 938,678 | |
| 4.3% 11/15/32 | 344,000 | 312,434 | |
| 4.75% 4/15/29 | 469,000 | 454,431 | |
| Intel Corp.: | |||
| 2% 8/12/31 | 246,000 | 205,758 | |
| 2.45% 11/15/29 | 284,000 | 253,401 | |
| 3.05% 8/12/51 | 246,000 | 183,152 | |
| 3.25% 11/15/49 | 287,000 | 223,088 | |
| 3.734% 12/8/47 | 90,000 | 76,361 | |
| 3.9% 3/25/30 | 312,000 | 305,642 | |
| 4.1% 5/19/46 | 192,000 | 173,962 | |
| 4.1% 5/11/47 | 66,000 | 59,724 | |
| 4.75% 3/25/50 | 328,000 | 321,710 | |
| Lam Research Corp. 2.875% 6/15/50 | 402,000 | 294,841 | |
| Micron Technology, Inc. 4.663% 2/15/30 | 227,000 | 217,683 | |
| NVIDIA Corp.: | |||
| 2% 6/15/31 | 697,000 | 591,776 | |
| 2.85% 4/1/30 | 297,000 | 271,899 | |
| 3.5% 4/1/50 | 165,000 | 140,048 | |
| NXP BV/NXP Funding LLC/NXP U.S.A., Inc. 2.65% 2/15/32 | 609,000 | 500,260 | |
| Texas Instruments, Inc. 4.15% 5/15/48 | 191,000 | 183,202 | |
| 11,875,464 | |||
| Software - 0.5% | |||
| Microsoft Corp.: | |||
| 2.525% 6/1/50 | 1,110,000 | 817,544 | |
| 2.675% 6/1/60 | 184,000 | 131,920 | |
| 2.7% 2/12/25 | 471,000 | 468,118 | |
| 2.875% 2/6/24 | 320,000 | 318,957 | |
| 2.921% 3/17/52 | 1,274,000 | 1,004,949 | |
| 3.041% 3/17/62 | 113,000 | 87,589 | |
| 3.45% 8/8/36 | 80,000 | 75,411 | |
| 3.625% 12/15/23 | 717,000 | 722,482 | |
| Oracle Corp.: | |||
| 1.65% 3/25/26 | 1,129,000 | 1,011,312 | |
| 2.3% 3/25/28 | 1,288,000 | 1,108,183 | |
| 2.5% 4/1/25 | 296,000 | 281,235 | |
| 2.625% 2/15/23 | 274,000 | 272,872 | |
| 2.65% 7/15/26 | 247,000 | 227,650 | |
| 2.8% 4/1/27 | 736,000 | 671,237 | |
| 2.875% 3/25/31 | 1,708,000 | 1,407,243 | |
| 2.95% 5/15/25 | 137,000 | 131,136 | |
| 2.95% 4/1/30 | 393,000 | 335,621 | |
| 3.25% 11/15/27 | 469,000 | 432,543 | |
| 3.4% 7/8/24 | 130,000 | 128,143 | |
| 3.6% 4/1/40 | 736,000 | 550,013 | |
| 3.6% 4/1/50 | 427,000 | 296,619 | |
| 3.85% 7/15/36 | 278,000 | 223,381 | |
| 3.85% 4/1/60 | 497,000 | 340,950 | |
| 3.95% 3/25/51 | 365,000 | 268,091 | |
| 4% 7/15/46 | 269,000 | 198,879 | |
| 4% 11/15/47 | 480,000 | 355,938 | |
| 4.125% 5/15/45 | 82,000 | 62,365 | |
| 4.3% 7/8/34 | 106,000 | 92,476 | |
| 5.375% 7/15/40 | 343,000 | 312,393 | |
| Roper Technologies, Inc.: | |||
| 1% 9/15/25 | 257,000 | 232,358 | |
| 1.4% 9/15/27 | 250,000 | 214,143 | |
| 1.75% 2/15/31 | 250,000 | 194,800 | |
| 2% 6/30/30 | 494,000 | 397,803 | |
| 3.8% 12/15/26 | 233,000 | 227,422 | |
| VMware, Inc. 1.4% 8/15/26 | 702,000 | 621,067 | |
| 14,222,843 | |||
| Technology Hardware, Storage & Peripherals - 0.3% | |||
| Apple, Inc.: | |||
| 0.55% 8/20/25 | 487,000 | 445,783 | |
| 0.7% 2/8/26 | 377,000 | 343,234 | |
| 1.25% 8/20/30 | 452,000 | 370,735 | |
| 1.7% 8/5/31 | 272,000 | 228,309 | |
| 2.375% 2/8/41 | 392,000 | 299,845 | |
| 2.4% 1/13/23 | 822,000 | 820,955 | |
| 2.45% 8/4/26 | 565,000 | 540,443 | |
| 2.55% 8/20/60 | 178,000 | 121,899 | |
| 2.65% 5/11/50 | 143,000 | 105,478 | |
| 2.85% 8/5/61 | 272,000 | 197,086 | |
| 2.9% 9/12/27 | 385,000 | 371,608 | |
| 2.95% 9/11/49 | 733,000 | 576,606 | |
| 3% 11/13/27 | 274,000 | 265,413 | |
| 3.2% 5/13/25 | 288,000 | 287,999 | |
| 3.2% 5/11/27 | 449,000 | 442,685 | |
| 3.75% 9/12/47 | 167,000 | 150,613 | |
| 3.75% 11/13/47 | 191,000 | 171,634 | |
| 3.85% 5/4/43 | 356,000 | 327,422 | |
| 4.25% 2/9/47 | 69,000 | 67,272 | |
| 4.375% 5/13/45 | 129,000 | 127,590 | |
| 4.5% 2/23/36 | 254,000 | 264,748 | |
| 4.65% 2/23/46 | 155,000 | 159,558 | |
| Hewlett Packard Enterprise Co.: | |||
| 4.9% 10/15/25 (b) | 267,000 | 271,029 | |
| 6.2% 10/15/35 (b) | 107,000 | 113,239 | |
| 6.35% 10/15/45 (b) | 52,000 | 52,304 | |
| HP, Inc.: | |||
| 2.2% 6/17/25 | 389,000 | 367,611 | |
| 6% 9/15/41 | 41,000 | 41,409 | |
| 7,532,507 | |||
| TOTAL INFORMATION TECHNOLOGY | 45,382,945 | ||
| MATERIALS - 0.4% | |||
| Chemicals - 0.2% | |||
| Air Products & Chemicals, Inc.: | |||
| 1.5% 10/15/25 | 165,000 | 155,306 | |
| 2.05% 5/15/30 | 180,000 | 155,583 | |
| 2.7% 5/15/40 | 155,000 | 123,959 | |
| 2.8% 5/15/50 | 184,000 | 138,884 | |
| Eastman Chemical Co. 4.65% 10/15/44 | 82,000 | 70,665 | |
| Ecolab, Inc.: | |||
| 1.3% 1/30/31 | 219,000 | 175,185 | |
| 2.7% 11/1/26 | 181,000 | 174,422 | |
| 2.75% 8/18/55 | 303,000 | 211,022 | |
| LYB International Finance BV: | |||
| 4% 7/15/23 | 87,000 | 86,928 | |
| 4.875% 3/15/44 | 160,000 | 144,252 | |
| LYB International Finance II BV 3.5% 3/2/27 | 671,000 | 640,322 | |
| LYB International Finance III LLC: | |||
| 3.375% 10/1/40 | 254,000 | 195,550 | |
| 3.625% 4/1/51 | 254,000 | 187,711 | |
| LyondellBasell Industries NV 4.625% 2/26/55 | 103,000 | 88,080 | |
| Nutrien Ltd.: | |||
| 4% 12/15/26 | 313,000 | 310,198 | |
| 4.2% 4/1/29 | 142,000 | 137,941 | |
| 5% 4/1/49 | 247,000 | 245,794 | |
| 5.25% 1/15/45 | 96,000 | 95,382 | |
| 5.625% 12/1/40 | 49,000 | 51,158 | |
| Sherwin-Williams Co.: | |||
| 3.45% 6/1/27 | 608,000 | 579,471 | |
| 3.8% 8/15/49 | 101,000 | 80,768 | |
| 4.5% 6/1/47 | 234,000 | 207,365 | |
| The Dow Chemical Co.: | |||
| 2.1% 11/15/30 | 237,000 | 195,285 | |
| 3.6% 11/15/50 | 244,000 | 186,273 | |
| 4.375% 11/15/42 | 134,000 | 118,034 | |
| 4.8% 11/30/28 | 234,000 | 234,889 | |
| 4.8% 5/15/49 | 211,000 | 191,771 | |
| 9.4% 5/15/39 | 82,000 | 117,151 | |
| The Mosaic Co.: | |||
| 4.05% 11/15/27 | 158,000 | 154,540 | |
| 4.25% 11/15/23 | 298,000 | 300,072 | |
| 5.625% 11/15/43 | 103,000 | 106,347 | |
| Westlake Corp. 5% 8/15/46 | 55,000 | 52,573 | |
| 5,912,881 | |||
| Containers & Packaging - 0.0% | |||
| International Paper Co.: | |||
| 4.4% 8/15/47 | 238,000 | 212,574 | |
| 5.15% 5/15/46 | 50,000 | 48,536 | |
| WRKCo, Inc. 4.2% 6/1/32 | 167,000 | 157,752 | |
| 418,862 | |||
| Metals & Mining - 0.2% | |||
| Barrick Gold Corp. 5.25% 4/1/42 | 123,000 | 121,058 | |
| BHP Billiton Financial (U.S.A.) Ltd. 5% 9/30/43 | 82,000 | 84,291 | |
| Freeport-McMoRan, Inc. 4.625% 8/1/30 | 1,118,000 | 1,037,258 | |
| Newmont Corp.: | |||
| 2.25% 10/1/30 | 460,000 | 381,825 | |
| 2.8% 10/1/29 | 93,000 | 82,126 | |
| 5.45% 6/9/44 | 176,000 | 176,350 | |
| Nucor Corp.: | |||
| 2.979% 12/15/55 | 110,000 | 74,426 | |
| 6.4% 12/1/37 | 167,000 | 187,735 | |
| Rio Tinto Finance (U.S.A.) Ltd.: | |||
| 5.2% 11/2/40 | 357,000 | 371,800 | |
| 7.125% 7/15/28 | 55,000 | 63,328 | |
| Southern Copper Corp.: | |||
| 3.875% 4/23/25 | 101,000 | 99,630 | |
| 5.25% 11/8/42 | 158,000 | 153,441 | |
| 7.5% 7/27/35 | 167,000 | 197,718 | |
| Vale Overseas Ltd. 3.75% 7/8/30 | 667,000 | 582,131 | |
| Vale SA 5.625% 9/11/42 | 181,000 | 168,255 | |
| 3,781,372 | |||
| Paper & Forest Products - 0.0% | |||
| Suzano Austria GmbH: | |||
| 2.5% 9/15/28 | 412,000 | 333,205 | |
| 6% 1/15/29 | 330,000 | 324,316 | |
| 657,521 | |||
| TOTAL MATERIALS | 10,770,636 | ||
| REAL ESTATE - 1.5% | |||
| Equity Real Estate Investment Trusts (REITs) - 1.3% | |||
| Alexandria Real Estate Equities, Inc.: | |||
| 2% 5/18/32 | 254,000 | 200,606 | |
| 3% 5/18/51 | 193,000 | 129,743 | |
| 4.85% 4/15/49 | 316,000 | 292,882 | |
| 4.9% 12/15/30 | 523,000 | 519,113 | |
| American Homes 4 Rent LP: | |||
| 2.375% 7/15/31 | 95,000 | 75,752 | |
| 3.625% 4/15/32 | 389,000 | 340,993 | |
| 4.25% 2/15/28 | 264,000 | 252,129 | |
| AvalonBay Communities, Inc. 2.3% 3/1/30 | 167,000 | 143,636 | |
| Boston Properties, Inc.: | |||
| 2.75% 10/1/26 | 192,000 | 178,959 | |
| 3.125% 9/1/23 | 52,000 | 51,624 | |
| 3.25% 1/30/31 | 1,011,000 | 867,141 | |
| 4.5% 12/1/28 | 489,000 | 475,432 | |
| Corporate Office Properties LP: | |||
| 2.25% 3/15/26 | 209,000 | 189,421 | |
| 2.75% 4/15/31 | 153,000 | 123,705 | |
| Crown Castle International Corp.: | |||
| 1.35% 7/15/25 | 741,000 | 677,311 | |
| 2.25% 1/15/31 | 199,000 | 161,416 | |
| 3.25% 1/15/51 | 180,000 | 129,120 | |
| Duke Realty LP 1.75% 2/1/31 | 807,000 | 656,100 | |
| ERP Operating LP: | |||
| 1.85% 8/1/31 | 500,000 | 410,212 | |
| 3% 4/15/23 | 51,000 | 50,900 | |
| 3.25% 8/1/27 | 356,000 | 336,548 | |
| Healthcare Trust of America Holdings LP: | |||
| 3.1% 2/15/30 | 165,000 | 142,165 | |
| 3.5% 8/1/26 | 172,000 | 163,676 | |
| Healthpeak Properties, Inc.: | |||
| 3% 1/15/30 | 343,000 | 302,800 | |
| 3.25% 7/15/26 | 72,000 | 69,318 | |
| 3.4% 2/1/25 | 13,000 | 12,787 | |
| 3.5% 7/15/29 | 82,000 | 75,586 | |
| Hudson Pacific Properties LP 4.65% 4/1/29 | 972,000 | 932,722 | |
| Invitation Homes Operating Partnership LP 4.15% 4/15/32 | 799,000 | 725,438 | |
| Kimco Realty Corp.: | |||
| 1.9% 3/1/28 | 284,000 | 245,737 | |
| 3.375% 10/15/22 | 102,000 | 102,016 | |
| 3.5% 4/15/23 | 104,000 | 104,200 | |
| 3.8% 4/1/27 | 110,000 | 106,190 | |
| 4.125% 12/1/46 | 274,000 | 226,878 | |
| 4.45% 9/1/47 | 142,000 | 124,589 | |
| Kite Realty Group Trust: | |||
| 4% 3/15/25 | 783,000 | 766,788 | |
| 4.75% 9/15/30 | 1,220,000 | 1,135,809 | |
| LXP Industrial Trust (REIT): | |||
| 2.375% 10/1/31 | 83,000 | 64,182 | |
| 2.7% 9/15/30 | 230,000 | 188,784 | |
| 4.4% 6/15/24 | 181,000 | 180,245 | |
| National Retail Properties, Inc. 3% 4/15/52 | 234,000 | 159,483 | |
| Omega Healthcare Investors, Inc.: | |||
| 3.25% 4/15/33 | 786,000 | 595,252 | |
| 3.375% 2/1/31 | 527,000 | 427,900 | |
| 3.625% 10/1/29 | 742,000 | 629,701 | |
| 4.375% 8/1/23 | 201,000 | 201,618 | |
| 4.5% 1/15/25 | 556,000 | 551,055 | |
| 4.5% 4/1/27 | 2,294,000 | 2,174,679 | |
| 4.75% 1/15/28 | 801,000 | 758,826 | |
| 4.95% 4/1/24 | 170,000 | 170,581 | |
| 5.25% 1/15/26 | 714,000 | 706,983 | |
| Piedmont Operating Partnership LP 2.75% 4/1/32 | 184,000 | 142,148 | |
| Prologis LP: | |||
| 1.625% 3/15/31 | 325,000 | 261,812 | |
| 2.125% 4/15/27 | 328,000 | 299,271 | |
| 3.25% 10/1/26 | 128,000 | 124,204 | |
| Realty Income Corp.: | |||
| 2.2% 6/15/28 | 100,000 | 87,682 | |
| 2.85% 12/15/32 | 123,000 | 105,723 | |
| 3.25% 1/15/31 | 128,000 | 116,361 | |
| 3.4% 1/15/28 | 200,000 | 188,932 | |
| Retail Opportunity Investments Partnership LP: | |||
| 4% 12/15/24 | 123,000 | 119,558 | |
| 5% 12/15/23 | 93,000 | 93,591 | |
| Simon Property Group LP: | |||
| 2.2% 2/1/31 | 731,000 | 593,395 | |
| 2.45% 9/13/29 | 205,000 | 174,162 | |
| 3.25% 9/13/49 | 320,000 | 232,182 | |
| 3.375% 12/1/27 | 547,000 | 513,500 | |
| SITE Centers Corp.: | |||
| 3.625% 2/1/25 | 284,000 | 276,034 | |
| 4.25% 2/1/26 | 371,000 | 364,357 | |
| Store Capital Corp.: | |||
| 2.75% 11/18/30 | 1,096,000 | 893,237 | |
| 4.625% 3/15/29 | 225,000 | 219,523 | |
| Sun Communities Operating LP: | |||
| 2.3% 11/1/28 | 210,000 | 179,636 | |
| 2.7% 7/15/31 | 542,000 | 436,780 | |
| UDR, Inc. 2.1% 6/15/33 | 446,000 | 339,736 | |
| Ventas Realty LP: | |||
| 3% 1/15/30 | 958,000 | 838,173 | |
| 3.25% 10/15/26 | 96,000 | 90,665 | |
| 3.5% 2/1/25 | 919,000 | 896,480 | |
| 3.85% 4/1/27 | 260,000 | 251,003 | |
| 4% 3/1/28 | 876,000 | 836,507 | |
| 4.125% 1/15/26 | 235,000 | 232,478 | |
| 4.375% 2/1/45 | 178,000 | 151,760 | |
| 4.75% 11/15/30 | 1,258,000 | 1,230,402 | |
| 4.875% 4/15/49 | 78,000 | 72,154 | |
| VICI Properties LP: | |||
| 4.375% 5/15/25 | 99,000 | 96,691 | |
| 4.75% 2/15/28 | 964,000 | 920,109 | |
| 4.95% 2/15/30 | 1,228,000 | 1,163,788 | |
| 5.125% 5/15/32 | 309,000 | 291,183 | |
| Vornado Realty LP 2.15% 6/1/26 | 237,000 | 211,138 | |
| Welltower, Inc. 4.95% 9/1/48 | 274,000 | 260,241 | |
| Weyerhaeuser Co. 4% 4/15/30 | 317,000 | 298,387 | |
| WP Carey, Inc.: | |||
| 2.4% 2/1/31 | 477,000 | 389,569 | |
| 3.85% 7/15/29 | 160,000 | 148,950 | |
| 4% 2/1/25 | 673,000 | 668,487 | |
| 33,118,720 | |||
| Real Estate Management & Development - 0.2% | |||
| Brandywine Operating Partnership LP: | |||
| 3.95% 2/15/23 | 796,000 | 794,075 | |
| 3.95% 11/15/27 | 579,000 | 546,152 | |
| 4.1% 10/1/24 | 637,000 | 630,895 | |
| 4.55% 10/1/29 | 734,000 | 700,110 | |
| CBRE Group, Inc.: | |||
| 2.5% 4/1/31 | 699,000 | 568,669 | |
| 4.875% 3/1/26 | 156,000 | 157,524 | |
| Digital Realty Trust LP 3.7% 8/15/27 | 219,000 | 208,612 | |
| Essex Portfolio LP: | |||
| 3% 1/15/30 | 51,000 | 45,070 | |
| 4% 3/1/29 | 167,000 | 159,418 | |
| Mid-America Apartments LP 3.95% 3/15/29 | 190,000 | 181,425 | |
| Post Apartment Homes LP 3.375% 12/1/22 | 50,000 | 50,015 | |
| Tanger Properties LP: | |||
| 2.75% 9/1/31 | 551,000 | 431,287 | |
| 3.125% 9/1/26 | 767,000 | 719,927 | |
| 3.875% 7/15/27 | 170,000 | 161,267 | |
| 5,354,446 | |||
| TOTAL REAL ESTATE | 38,473,166 | ||
| UTILITIES - 1.9% | |||
| Electric Utilities - 1.2% | |||
| AEP Texas, Inc. 3.8% 10/1/47 | 117,000 | 94,305 | |
| AEP Transmission Co. LLC 2.75% 8/15/51 | 197,000 | 138,067 | |
| Alabama Power Co.: | |||
| 1.45% 9/15/30 | 500,000 | 405,753 | |
| 3.05% 3/15/32 | 828,000 | 756,527 | |
| 3.7% 12/1/47 | 162,000 | 135,042 | |
| 3.75% 3/1/45 | 27,000 | 22,268 | |
| 4.15% 8/15/44 | 127,000 | 112,002 | |
| 4.3% 7/15/48 | 161,000 | 147,101 | |
| 5.2% 6/1/41 | 106,000 | 105,434 | |
| American Electric Power Co., Inc.: | |||
| 2.95% 12/15/22 | 110,000 | 109,635 | |
| 3.25% 3/1/50 | 86,000 | 61,727 | |
| 4.3% 12/1/28 | 480,000 | 467,566 | |
| Appalachian Power Co.: | |||
| 4.45% 6/1/45 | 165,000 | 143,886 | |
| 4.5% 3/1/49 | 251,000 | 224,627 | |
| Baltimore Gas & Electric Co.: | |||
| 2.9% 6/15/50 | 220,000 | 160,595 | |
| 3.35% 7/1/23 | 78,000 | 77,761 | |
| 3.5% 8/15/46 | 69,000 | 56,543 | |
| CenterPoint Energy Houston Electric LLC: | |||
| 3.35% 4/1/51 | 313,000 | 254,249 | |
| 3.55% 8/1/42 | 52,000 | 44,579 | |
| 4.25% 2/1/49 | 71,000 | 66,944 | |
| Cincinnati Gas & Electric Co. 4.3% 2/1/49 | 744,000 | 675,041 | |
| Cleco Corporate Holdings LLC: | |||
| 3.375% 9/15/29 | 433,000 | 386,340 | |
| 3.743% 5/1/26 | 1,810,000 | 1,746,082 | |
| Commonwealth Edison Co.: | |||
| 3.1% 11/1/24 | 274,000 | 272,263 | |
| 3.2% 11/15/49 | 467,000 | 365,422 | |
| 3.65% 6/15/46 | 78,000 | 66,119 | |
| 3.7% 3/1/45 | 85,000 | 71,307 | |
| 3.75% 8/15/47 | 169,000 | 145,509 | |
| 4% 3/1/48 | 187,000 | 168,097 | |
| 4% 3/1/49 | 164,000 | 146,860 | |
| DTE Electric Co. 3.95% 3/1/49 | 100,000 | 89,633 | |
| Duke Energy Carolinas LLC: | |||
| 2.85% 3/15/32 | 83,000 | 73,643 | |
| 2.95% 12/1/26 | 165,000 | 159,472 | |
| 3.2% 8/15/49 | 219,000 | 171,091 | |
| 3.75% 6/1/45 | 55,000 | 46,042 | |
| 3.875% 3/15/46 | 107,000 | 94,145 | |
| 4% 9/30/42 | 103,000 | 91,460 | |
| Duke Energy Corp.: | |||
| 2.45% 6/1/30 | 529,000 | 445,886 | |
| 2.65% 9/1/26 | 366,000 | 342,778 | |
| 3.75% 4/15/24 | 165,000 | 164,826 | |
| 3.75% 9/1/46 | 250,000 | 196,874 | |
| 3.95% 10/15/23 | 67,000 | 67,281 | |
| 4.2% 6/15/49 | 260,000 | 216,933 | |
| 4.8% 12/15/45 | 76,000 | 69,372 | |
| Duke Energy Florida LLC 3.4% 10/1/46 | 69,000 | 54,331 | |
| Duke Energy Progress LLC: | |||
| 3.4% 4/1/32 | 334,000 | 310,482 | |
| 4.15% 12/1/44 | 49,000 | 43,820 | |
| 4.375% 3/30/44 | 55,000 | 51,094 | |
| Duquesne Light Holdings, Inc.: | |||
| 2.532% 10/1/30 (a) | 166,000 | 136,390 | |
| 2.775% 1/7/32 (a) | 574,000 | 470,401 | |
| Edison International 2.95% 3/15/23 | 225,000 | 223,093 | |
| Entergy Corp.: | |||
| 0.9% 9/15/25 | 464,000 | 417,673 | |
| 2.8% 6/15/30 | 359,000 | 307,902 | |
| 2.95% 9/1/26 | 129,000 | 122,261 | |
| 3.75% 6/15/50 | 113,000 | 88,667 | |
| Entergy Louisiana LLC 4.2% 9/1/48 | 87,000 | 79,827 | |
| Entergy, Inc.: | |||
| 3.55% 9/30/49 | 111,000 | 88,475 | |
| 4% 3/30/29 | 485,000 | 473,517 | |
| Eversource Energy: | |||
| 2.55% 3/15/31 | 440,000 | 372,767 | |
| 2.8% 5/1/23 | 642,000 | 638,018 | |
| 2.9% 10/1/24 | 234,000 | 228,755 | |
| 3.35% 3/15/26 | 181,000 | 175,759 | |
| 3.45% 1/15/50 | 122,000 | 93,175 | |
| Exelon Corp.: | |||
| 2.75% 3/15/27 (a) | 183,000 | 171,066 | |
| 3.35% 3/15/32 (a) | 222,000 | 198,971 | |
| 3.95% 6/15/25 | 539,000 | 537,144 | |
| 4.05% 4/15/30 | 218,000 | 209,190 | |
| 4.1% 3/15/52 (a) | 165,000 | 142,242 | |
| 4.7% 4/15/50 | 97,000 | 90,889 | |
| 5.1% 6/15/45 | 30,000 | 29,480 | |
| FirstEnergy Corp.: | |||
| 1.6% 1/15/26 | 344,000 | 300,140 | |
| 2.25% 9/1/30 | 370,000 | 293,225 | |
| 3.4% 3/1/50 | 100,000 | 67,790 | |
| 4.4% 7/15/27 | 233,000 | 219,773 | |
| 5.35% 7/15/47 | 129,000 | 108,926 | |
| 7.375% 11/15/31 | 673,000 | 755,443 | |
| Florida Power & Light Co.: | |||
| 3.125% 12/1/25 | 140,000 | 138,738 | |
| 3.15% 10/1/49 | 192,000 | 152,495 | |
| 3.25% 6/1/24 | 130,000 | 129,910 | |
| 4.05% 10/1/44 | 149,000 | 137,250 | |
| 4.125% 6/1/48 | 337,000 | 315,580 | |
| Indiana Michigan Power Co.: | |||
| 3.2% 3/15/23 | 76,000 | 75,569 | |
| 3.25% 5/1/51 | 133,000 | 100,606 | |
| Interstate Power and Light Co. 2.3% 6/1/30 | 381,000 | 324,195 | |
| IPALCO Enterprises, Inc.: | |||
| 3.7% 9/1/24 | 271,000 | 267,954 | |
| 4.25% 5/1/30 | 1,025,000 | 951,656 | |
| NextEra Energy Capital Holdings, Inc.: | |||
| 1.875% 1/15/27 | 474,000 | 427,508 | |
| 1.9% 6/15/28 | 334,000 | 290,419 | |
| 2.44% 1/15/32 | 470,000 | 391,441 | |
| Northern States Power Co.: | |||
| 2.6% 6/1/51 | 360,000 | 253,421 | |
| 2.9% 3/1/50 | 327,000 | 245,793 | |
| 3.4% 8/15/42 | 55,000 | 46,186 | |
| 4.125% 5/15/44 | 123,000 | 111,473 | |
| NSTAR Electric Co. 3.2% 5/15/27 | 210,000 | 202,460 | |
| Oncor Electric Delivery Co. LLC: | |||
| 0.55% 10/1/25 | 878,000 | 792,089 | |
| 3.1% 9/15/49 | 525,000 | 406,150 | |
| 3.8% 9/30/47 | 267,000 | 235,240 | |
| Pacific Gas & Electric Co.: | |||
| 3.15% 1/1/26 | 400,355 | 366,466 | |
| 3.25% 6/1/31 | 167,000 | 134,880 | |
| 3.45% 7/1/25 | 166,815 | 156,867 | |
| 3.5% 6/15/25 | 334,000 | 314,814 | |
| 4.2% 6/1/41 | 834,000 | 610,710 | |
| 4.55% 7/1/30 | 1,037,586 | 921,927 | |
| 4.75% 2/15/44 | 33,000 | 25,298 | |
| PacifiCorp: | |||
| 3.6% 4/1/24 | 110,000 | 110,160 | |
| 4.125% 1/15/49 | 369,000 | 330,441 | |
| 4.15% 2/15/50 | 100,000 | 90,170 | |
| 6% 1/15/39 | 170,000 | 186,506 | |
| Potomac Electric Power Co. 6.5% 11/15/37 | 104,000 | 120,879 | |
| PPL Capital Funding, Inc. 3.1% 5/15/26 | 219,000 | 208,338 | |
| PPL Electric Utilities Corp.: | |||
| 3% 10/1/49 | 364,000 | 274,650 | |
| 4.15% 10/1/45 | 96,000 | 85,875 | |
| Progress Energy, Inc. 6% 12/1/39 | 143,000 | 150,624 | |
| Public Service Co. of Colorado: | |||
| 2.9% 5/15/25 | 302,000 | 293,632 | |
| 3.8% 6/15/47 | 127,000 | 111,963 | |
| Public Service Electric & Gas Co.: | |||
| 2.45% 1/15/30 | 279,000 | 248,503 | |
| 3.15% 1/1/50 | 315,000 | 244,577 | |
| 3.65% 9/1/42 | 77,000 | 65,713 | |
| 4% 6/1/44 | 137,000 | 122,678 | |
| Puget Sound Energy, Inc. 4.3% 5/20/45 | 176,000 | 157,326 | |
| Southern California Edison Co.: | |||
| 2.25% 6/1/30 | 248,000 | 208,205 | |
| 2.95% 2/1/51 | 550,000 | 372,917 | |
| 4% 4/1/47 | 274,000 | 222,254 | |
| 4.125% 3/1/48 | 194,000 | 159,605 | |
| Southern Co.: | |||
| 3.25% 7/1/26 | 302,000 | 288,990 | |
| 4.4% 7/1/46 | 201,000 | 174,817 | |
| Tampa Electric Co.: | |||
| 4.45% 6/15/49 | 321,000 | 296,718 | |
| 6.15% 5/15/37 | 172,000 | 192,416 | |
| Union Electric Co. 3.9% 9/15/42 | 101,000 | 89,336 | |
| Virginia Electric & Power Co.: | |||
| 3.1% 5/15/25 | 110,000 | 108,216 | |
| 3.3% 12/1/49 | 200,000 | 159,134 | |
| 3.45% 2/15/24 | 75,000 | 74,831 | |
| 3.8% 4/1/28 | 409,000 | 399,770 | |
| 3.8% 9/15/47 | 225,000 | 192,916 | |
| 4.2% 5/15/45 | 289,000 | 258,534 | |
| 4.45% 2/15/44 | 75,000 | 69,755 | |
| 4.6% 12/1/48 | 194,000 | 186,577 | |
| 6% 5/15/37 | 55,000 | 61,001 | |
| Wisconsin Electric Power Co. 4.25% 6/1/44 | 129,000 | 112,884 | |
| Xcel Energy, Inc. 3.35% 12/1/26 | 82,000 | 79,167 | |
| 32,394,946 | |||
| Gas Utilities - 0.1% | |||
| Dominion Gas Holdings LLC 2.5% 11/15/24 | 304,000 | 293,651 | |
| Nakilat, Inc. 6.067% 12/31/33 (a) | 208,859 | 221,886 | |
| Southern California Gas Co. 2.6% 6/15/26 | 363,000 | 343,839 | |
| Southern Co. Gas Capital Corp. 3.95% 10/1/46 | 371,000 | 303,436 | |
| 1,162,812 | |||
| Independent Power and Renewable Electricity Producers - 0.1% | |||
| Emera U.S. Finance LP: | |||
| 3.55% 6/15/26 | 237,000 | 226,827 | |
| 4.75% 6/15/46 | 143,000 | 125,861 | |
| Exelon Generation Co. LLC 3.25% 6/1/25 | 334,000 | 319,884 | |
| The AES Corp.: | |||
| 3.3% 7/15/25 (a) | 1,079,000 | 1,012,080 | |
| 3.95% 7/15/30 (a) | 941,000 | 848,500 | |
| 2,533,152 | |||
| Multi-Utilities - 0.5% | |||
| Ameren Illinois Co. 4.5% 3/15/49 | 207,000 | 199,280 | |
| Berkshire Hathaway Energy Co.: | |||
| 3.25% 4/15/28 | 274,000 | 260,465 | |
| 3.7% 7/15/30 | 275,000 | 263,848 | |
| 3.8% 7/15/48 | 274,000 | 229,626 | |
| 4.05% 4/15/25 | 1,561,000 | 1,570,537 | |
| 4.25% 10/15/50 | 237,000 | 216,287 | |
| 4.5% 2/1/45 | 182,000 | 168,505 | |
| 5.15% 11/15/43 | 212,000 | 216,734 | |
| CenterPoint Energy, Inc. 3.7% 9/1/49 | 167,000 | 133,170 | |
| CMS Energy Corp. 4.875% 3/1/44 | 137,000 | 130,241 | |
| Consolidated Edison Co. of New York, Inc.: | |||
| 3.35% 4/1/30 | 99,000 | 92,225 | |
| 3.875% 6/15/47 | 78,000 | 65,300 | |
| 4.45% 3/15/44 | 219,000 | 200,208 | |
| 4.5% 5/15/58 | 260,000 | 233,637 | |
| 4.65% 12/1/48 | 287,000 | 270,758 | |
| 5.5% 12/1/39 | 69,000 | 71,477 | |
| Consumers Energy Co.: | |||
| 2.65% 8/15/52 | 344,000 | 240,854 | |
| 3.5% 8/1/51 | 100,000 | 83,154 | |
| Delmarva Power & Light Co. 4% 6/1/42 | 110,000 | 95,169 | |
| Dominion Energy, Inc.: | |||
| 3.375% 4/1/30 | 632,000 | 577,735 | |
| 3.9% 10/1/25 | 354,000 | 351,989 | |
| 4.9% 8/1/41 | 55,000 | 52,794 | |
| DTE Energy Co.: | |||
| 2.85% 10/1/26 | 165,000 | 155,991 | |
| 3.8% 3/15/27 | 370,000 | 357,747 | |
| NiSource, Inc.: | |||
| 0.95% 8/15/25 | 374,000 | 335,933 | |
| 1.7% 2/15/31 | 444,000 | 347,086 | |
| 2.95% 9/1/29 | 1,074,000 | 951,302 | |
| 3.49% 5/15/27 | 210,000 | 201,021 | |
| 3.95% 3/30/48 | 274,000 | 227,289 | |
| 4.375% 5/15/47 | 131,000 | 115,281 | |
| 4.8% 2/15/44 | 151,000 | 135,162 | |
| Puget Energy, Inc.: | |||
| 3.65% 5/15/25 | 221,000 | 216,359 | |
| 4.1% 6/15/30 | 1,710,000 | 1,589,408 | |
| 4.224% 3/15/32 | 756,000 | 696,929 | |
| San Diego Gas & Electric Co. 4.5% 8/15/40 | 27,000 | 25,378 | |
| Sempra Energy: | |||
| 3.25% 6/15/27 | 167,000 | 158,393 | |
| 3.8% 2/1/38 | 233,000 | 196,666 | |
| 4% 2/1/48 | 604,000 | 502,266 | |
| 6% 10/15/39 | 27,000 | 28,554 | |
| WEC Energy Group, Inc. 3 month U.S. LIBOR + 2.610% 3.5238% 5/15/67 (b)(c) | 295,000 | 227,719 | |
| 12,192,477 | |||
| Water Utilities - 0.0% | |||
| American Water Capital Corp.: | |||
| 2.95% 9/1/27 | 167,000 | 156,703 | |
| 3.45% 6/1/29 | 167,000 | 157,121 | |
| 6.593% 10/15/37 | 179,000 | 207,430 | |
| 521,254 | |||
| TOTAL UTILITIES | 48,804,641 | ||
| TOTAL NONCONVERTIBLE BONDS | |||
| (Cost $854,211,962) | 823,485,565 | ||
| U.S. Government and Government Agency Obligations - 39.9% | |||
| U.S. Government Agency Obligations - 0.6% | |||
| Fannie Mae: | |||
| 0.375% 8/25/25 | $981,000 | $900,974 | |
| 0.5% 6/17/25 | 1,103,000 | 1,023,154 | |
| 0.625% 4/22/25 | 1,170,000 | 1,094,071 | |
| 0.75% 10/8/27 | 581,000 | 513,948 | |
| 0.875% 8/5/30 | 1,394,000 | 1,153,328 | |
| 1.625% 10/15/24 | 616,000 | 596,930 | |
| 1.75% 7/2/24 | 791,000 | 773,128 | |
| 1.875% 9/24/26 | 366,000 | 348,247 | |
| 2.125% 4/24/26 | 110,000 | 106,227 | |
| 2.625% 9/6/24 | 110,000 | 108,981 | |
| 2.875% 9/12/23 | 211,000 | 210,981 | |
| 6.625% 11/15/30 | 334,000 | 412,741 | |
| Federal Home Loan Bank: | |||
| 0.375% 9/4/25 | 245,000 | 224,993 | |
| 0.5% 4/14/25 | 1,535,000 | 1,430,942 | |
| 1.5% 8/15/24 | 135,000 | 130,745 | |
| 2.5% 2/13/24 | 135,000 | 134,008 | |
| 3.25% 11/16/28 | 650,000 | 652,146 | |
| 5.5% 7/15/36 | 40,000 | 48,208 | |
| Freddie Mac: | |||
| 0.25% 8/24/23 | 577,000 | 559,521 | |
| 0.25% 12/4/23 | 1,462,000 | 1,406,722 | |
| 0.375% 7/21/25 | 724,000 | 667,855 | |
| 0.375% 9/23/25 | 818,000 | 750,347 | |
| 2.75% 6/19/23 | 664,000 | 662,437 | |
| 6.25% 7/15/32 | 211,000 | 262,012 | |
| 6.75% 3/15/31 | 713,000 | 893,836 | |
| Tennessee Valley Authority: | |||
| 0.75% 5/15/25 | 946,000 | 884,818 | |
| 4.25% 9/15/65 | 204,000 | 208,767 | |
| 5.25% 9/15/39 | 548,000 | 626,851 | |
| 5.375% 4/1/56 | 148,000 | 184,358 | |
| TOTAL U.S. GOVERNMENT AGENCY OBLIGATIONS | 16,971,276 | ||
| U.S. Treasury Obligations - 39.3% | |||
| U.S. Treasury Bonds: | |||
| 1.125% 5/15/40 | 15,985,600 | 11,127,476 | |
| 1.125% 8/15/40 | 6,051,800 | 4,180,943 | |
| 1.25% 5/15/50 | 2,379,700 | 1,514,084 | |
| 1.375% 11/15/40 | 6,351,300 | 4,574,176 | |
| 1.375% 8/15/50 | 2,276,200 | 1,498,291 | |
| 1.625% 11/15/50 | 5,702,800 | 4,010,895 | |
| 1.75% 8/15/41 | 23,171,800 | 17,625,955 | |
| 1.875% 2/15/51 | 6,083,800 | 4,563,563 | |
| 1.875% 11/15/51 | 14,846,000 | 11,139,139 | |
| 2% 11/15/41 (d) | 5,734,200 | 4,554,209 | |
| 2% 2/15/50 | 607,100 | 470,455 | |
| 2% 8/15/51 | 55,633,600 | 42,996,515 | |
| 2.25% 5/15/41 | 5,968,700 | 4,980,600 | |
| 2.25% 8/15/46 | 1,754,400 | 1,414,622 | |
| 2.25% 8/15/49 | 527,700 | 432,982 | |
| 2.25% 2/15/52 | 11,359,700 | 9,348,678 | |
| 2.375% 11/15/49 | 6,448,000 | 5,446,041 | |
| 2.375% 5/15/51 | 8,558,600 | 7,224,996 | |
| 2.5% 2/15/45 | 2,793,600 | 2,369,322 | |
| 2.5% 2/15/46 | 3,850,000 | 3,264,529 | |
| 2.5% 5/15/46 | 3,809,000 | 3,228,425 | |
| 2.75% 8/15/47 | 2,714,200 | 2,427,089 | |
| 2.75% 11/15/47 | 954,600 | 855,187 | |
| 2.875% 5/15/43 | 3,083,700 | 2,811,949 | |
| 2.875% 8/15/45 | 3,195,800 | 2,903,185 | |
| 2.875% 11/15/46 | 3,370,300 | 3,072,766 | |
| 2.875% 5/15/52 | 15,000,000 | 14,167,969 | |
| 3% 11/15/44 | 2,658,000 | 2,463,115 | |
| 3% 5/15/45 | 4,136,700 | 3,837,112 | |
| 3% 2/15/47 | 15,804,500 | 14,758,069 | |
| 3% 5/15/47 | 1,290,700 | 1,206,401 | |
| 3% 2/15/48 | 1,258,000 | 1,185,272 | |
| 3.125% 2/15/43 | 2,164,300 | 2,056,339 | |
| 3.125% 8/15/44 | 2,501,500 | 2,369,390 | |
| 3.125% 5/15/48 | 354,700 | 343,269 | |
| 3.375% 5/15/44 | 5,091,800 | 5,025,567 | |
| 3.375% 11/15/48 | 159,900 | 162,467 | |
| 3.625% 8/15/43 | 2,254,700 | 2,314,062 | |
| 3.625% 2/15/44 | 1,433,100 | 1,470,383 | |
| 3.75% 11/15/43 | 1,227,700 | 1,284,241 | |
| 4.375% 5/15/41 | 228,200 | 261,369 | |
| U.S. Treasury Notes: | |||
| 0.125% 6/30/23 | 6,837,100 | 6,650,415 | |
| 0.125% 8/31/23 | 30,164,800 | 29,183,266 | |
| 0.125% 1/15/24 | 8,692,100 | 8,320,309 | |
| 0.25% 9/30/23 | 6,294,000 | 6,086,495 | |
| 0.25% 5/15/24 | 2,798,700 | 2,659,968 | |
| 0.25% 6/30/25 | 10,067,700 | 9,269,363 | |
| 0.25% 7/31/25 | 47,270,100 | 43,401,707 | |
| 0.25% 9/30/25 | 6,026,800 | 5,506,282 | |
| 0.25% 10/31/25 | 6,277,200 | 5,720,099 | |
| 0.375% 10/31/23 | 12,586,300 | 12,163,479 | |
| 0.375% 11/30/25 | 12,167,400 | 11,113,209 | |
| 0.375% 12/31/25 | 8,362,600 | 7,621,399 | |
| 0.375% 7/31/27 | 8,695,100 | 7,601,080 | |
| 0.5% 11/30/23 | 8,625,700 | 8,332,561 | |
| 0.5% 3/31/25 | 14,856,100 | 13,864,920 | |
| 0.5% 2/28/26 | 4,712,900 | 4,295,551 | |
| 0.5% 10/31/27 | 12,237,600 | 10,691,647 | |
| 0.625% 10/15/24 | 6,792,700 | 6,435,818 | |
| 0.625% 7/31/26 | 6,372,400 | 5,778,970 | |
| 0.625% 5/15/30 | 13,371,300 | 11,149,366 | |
| 0.75% 11/15/24 | 9,198,200 | 8,721,762 | |
| 0.75% 3/31/26 | 16,609,700 | 15,255,620 | |
| 0.75% 5/31/26 | 3,534,900 | 3,234,295 | |
| 0.75% 8/31/26 | 16,677,700 | 15,180,616 | |
| 0.875% 1/31/24 | 8,330,800 | 8,061,351 | |
| 0.875% 6/30/26 | 2,572,600 | 2,361,667 | |
| 0.875% 9/30/26 | 14,753,700 | 13,474,278 | |
| 0.875% 11/15/30 | 16,325,000 | 13,783,784 | |
| 1% 12/15/24 | 14,172,600 | 13,496,633 | |
| 1.125% 10/31/26 | 11,868,500 | 10,939,883 | |
| 1.125% 2/28/27 | 5,628,000 | 5,155,995 | |
| 1.125% 2/29/28 | 9,043,800 | 8,131,648 | |
| 1.125% 8/31/28 | 17,817,900 | 15,857,235 | |
| 1.125% 2/15/31 | 25,364,100 | 21,795,292 | |
| 1.25% 8/31/24 | 2,523,500 | 2,431,136 | |
| 1.25% 12/31/26 | 10,596,100 | 9,793,942 | |
| 1.25% 5/31/28 | 53,521,400 | 48,211,074 | |
| 1.25% 6/30/28 | 12,849,100 | 11,558,669 | |
| 1.25% 8/15/31 | 19,173,600 | 16,505,773 | |
| 1.375% 1/31/25 | 8,268,800 | 7,930,619 | |
| 1.375% 10/31/28 | 5,931,900 | 5,348,210 | |
| 1.375% 11/15/31 | 23,537,300 | 20,414,930 | |
| 1.5% 9/30/24 | 2,300,300 | 2,225,181 | |
| 1.5% 10/31/24 | 7,620,500 | 7,362,415 | |
| 1.5% 11/30/24 | 3,259,400 | 3,144,175 | |
| 1.5% 2/15/25 | 4,440,600 | 4,267,833 | |
| 1.5% 8/15/26 | 3,613,600 | 3,393,679 | |
| 1.5% 1/31/27 | 18,609,600 | 17,375,260 | |
| 1.5% 11/30/28 (d) | 362,300 | 328,985 | |
| 1.5% 2/15/30 | 24,988,100 | 22,444,389 | |
| 1.625% 9/30/26 | 12,924,100 | 12,191,566 | |
| 1.625% 5/15/31 | 10,884,500 | 9,725,471 | |
| 1.75% 7/31/24 | 6,198,300 | 6,042,858 | |
| 1.75% 12/31/24 | 11,637,400 | 11,278,277 | |
| 1.75% 1/31/29 | 9,931,000 | 9,156,304 | |
| 2% 5/31/24 | 2,706,800 | 2,657,845 | |
| 2% 6/30/24 | 2,682,200 | 2,631,594 | |
| 2.125% 3/31/24 | 11,272,500 | 11,106,495 | |
| 2.125% 9/30/24 | 2,463,400 | 2,417,500 | |
| 2.125% 11/30/24 | 1,511,700 | 1,480,462 | |
| 2.25% 3/31/24 | 20,141,200 | 19,887,862 | |
| 2.25% 4/30/24 | 12,287,400 | 12,127,088 | |
| 2.25% 10/31/24 | 3,671,900 | 3,610,224 | |
| 2.25% 11/15/24 | 2,355,900 | 2,315,960 | |
| 2.25% 12/31/24 | 1,117,700 | 1,096,830 | |
| 2.25% 11/15/25 | 2,913,000 | 2,837,217 | |
| 2.25% 2/15/27 | 6,285,100 | 6,059,966 | |
| 2.25% 8/15/27 | 18,256,900 | 17,535,895 | |
| 2.25% 11/15/27 | 8,316,200 | 7,972,832 | |
| 2.5% 1/31/24 | 13,133,500 | 13,034,999 | |
| 2.5% 1/31/25 | 4,099,600 | 4,045,793 | |
| 2.5% 2/28/26 | 2,496,900 | 2,448,913 | |
| 2.625% 12/31/25 | 3,689,300 | 3,637,131 | |
| 2.625% 5/31/27 | 50,000,000 | 49,054,688 | |
| 2.75% 8/31/23 | 5,011,700 | 4,998,975 | |
| 2.75% 2/15/24 | 4,503,500 | 4,487,667 | |
| 2.75% 4/30/27 | 9,654,600 | 9,524,112 | |
| 2.875% 9/30/23 | 7,504,500 | 7,497,171 | |
| 2.875% 10/31/23 | 5,206,600 | 5,200,905 | |
| 2.875% 5/31/25 | 3,310,500 | 3,296,275 | |
| 2.875% 5/15/28 | 4,819,100 | 4,762,814 | |
| 2.875% 8/15/28 | 5,199,100 | 5,135,736 | |
| 2.875% 5/15/32 | 15,000,000 | 14,831,250 | |
| 3% 10/31/25 | 788,900 | 787,606 | |
| TOTAL U.S. TREASURY OBLIGATIONS | 1,039,849,611 | ||
| TOTAL U.S. GOVERNMENT AND GOVERNMENT AGENCY OBLIGATIONS | |||
| (Cost $1,073,938,003) | 1,056,820,887 | ||
| U.S. Government Agency - Mortgage Securities - 23.4% | |||
| Fannie Mae - 6.7% | |||
| 12 month U.S. LIBOR + 1.480% 1.855% 7/1/34 (b)(c) | 906 | 928 | |
| 12 month U.S. LIBOR + 1.510% 1.788% 11/1/34 (b)(c) | 55,789 | 57,029 | |
| 12 month U.S. LIBOR + 1.550% 1.803% 6/1/36 (b)(c) | 931 | 960 | |
| 12 month U.S. LIBOR + 1.630% 2.24% 11/1/36 (b)(c) | 11,954 | 12,232 | |
| 12 month U.S. LIBOR + 1.640% 2.534% 4/1/41 (b)(c) | 12,713 | 12,959 | |
| 12 month U.S. LIBOR + 1.700% 3.183% 6/1/42 (b)(c) | 7,268 | 7,491 | |
| 12 month U.S. LIBOR + 1.730% 3.105% 5/1/36 (b)(c) | 7,257 | 7,466 | |
| 12 month U.S. LIBOR + 1.750% 2.281% 7/1/35 (b)(c) | 814 | 830 | |
| 12 month U.S. LIBOR + 1.780% 2.163% 2/1/36 (b)(c) | 4,814 | 4,911 | |
| 12 month U.S. LIBOR + 1.800% 2.05% 7/1/41 (b)(c) | 4,818 | 4,981 | |
| 12 month U.S. LIBOR + 1.810% 2.068% 9/1/41 (b)(c) | 2,535 | 2,618 | |
| 12 month U.S. LIBOR + 1.810% 2.245% 7/1/41 (b)(c) | 6,127 | 6,358 | |
| 12 month U.S. LIBOR + 1.820% 2.195% 12/1/35 (b)(c) | 2,929 | 3,001 | |
| 12 month U.S. LIBOR + 1.830% 2.08% 10/1/41 (b)(c) | 2,349 | 2,377 | |
| 12 month U.S. LIBOR + 1.880% 2.287% 11/1/34 (b)(c) | 4,716 | 4,819 | |
| 12 month U.S. LIBOR + 1.950% 2.401% 9/1/36 (b)(c) | 5,388 | 5,500 | |
| 12 month U.S. LIBOR + 1.950% 3.496% 7/1/37 (b)(c) | 2,027 | 2,101 | |
| 6 month U.S. LIBOR + 1.310% 2.438% 5/1/34 (b)(c) | 4,537 | 4,611 | |
| 6 month U.S. LIBOR + 1.420% 1.571% 9/1/33 (b)(c) | 7,773 | 7,870 | |
| 6 month U.S. LIBOR + 1.550% 2.002% 10/1/33 (b)(c) | 567 | 582 | |
| 6 month U.S. LIBOR + 1.560% 1.815% 7/1/35 (b)(c) | 855 | 883 | |
| U.S. TREASURY 1 YEAR INDEX + 1.940% 1.87% 10/1/33 (b)(c) | 9,610 | 9,983 | |
| U.S. TREASURY 1 YEAR INDEX + 2.200% 2.583% 3/1/35 (b)(c) | 713 | 737 | |
| U.S. TREASURY 1 YEAR INDEX + 2.220% 2.571% 8/1/36 (b)(c) | 10,037 | 10,389 | |
| U.S. TREASURY 1 YEAR INDEX + 2.280% 2.408% 10/1/33 (b)(c) | 1,437 | 1,490 | |
| U.S. TREASURY 1 YEAR INDEX + 2.420% 2.75% 5/1/35 (b)(c) | 2,163 | 2,239 | |
| 1.5% 9/1/35 to 6/1/51 | 9,680,419 | 8,393,471 | |
| 2% 5/1/23 to 3/1/52 | 40,043,892 | 35,717,476 | |
| 2.5% 7/1/26 to 3/1/52 | 34,012,339 | 31,351,270 | |
| 3% 8/1/26 to 5/1/52 (e) | 49,353,843 | 46,874,469 | |
| 3.5% 5/1/28 to 4/1/52 (d) | 25,735,776 | 25,188,571 | |
| 4% 7/1/30 to 1/1/52 | 15,802,195 | 15,799,427 | |
| 4.5% to 4.5% 11/1/22 to 12/1/50 | 9,177,814 | 9,381,410 | |
| 5% 3/1/23 to 1/1/51 | 3,234,292 | 3,357,187 | |
| 5.5% 12/1/23 to 6/1/49 | 1,336,440 | 1,426,073 | |
| 6% to 6% 2/1/23 to 1/1/42 | 834,483 | 907,302 | |
| 6.5% 12/1/23 to 10/1/39 | 225,727 | 248,018 | |
| 7% to 7% 11/1/23 to 2/1/32 | 12,553 | 13,275 | |
| 7.5% to 7.5% 9/1/25 to 11/1/31 | 15,385 | 16,605 | |
| TOTAL FANNIE MAE | 178,849,899 | ||
| Freddie Mac - 4.3% | |||
| 12 month U.S. LIBOR + 1.370% 1.684% 3/1/36 (b)(c) | 6,717 | 6,779 | |
| 12 month U.S. LIBOR + 1.880% 2.13% 9/1/41 (b)(c) | 3,638 | 3,736 | |
| 12 month U.S. LIBOR + 1.880% 3.255% 4/1/41 (b)(c) | 914 | 940 | |
| 12 month U.S. LIBOR + 1.910% 2.16% 6/1/41 (b)(c) | 2,431 | 2,522 | |
| 12 month U.S. LIBOR + 1.910% 3.131% 6/1/41 (b)(c) | 9,502 | 9,830 | |
| 12 month U.S. LIBOR + 1.910% 3.22% 5/1/41 (b)(c) | 7,294 | 7,509 | |
| 12 month U.S. LIBOR + 1.910% 3.568% 5/1/41 (b)(c) | 7,653 | 7,906 | |
| 12 month U.S. LIBOR + 1.940% 2.228% 9/1/37 (b)(c) | 5,968 | 6,156 | |
| 12 month U.S. LIBOR + 2.030% 2.271% 3/1/33 (b)(c) | 105 | 107 | |
| 12 month U.S. LIBOR + 2.160% 2.41% 11/1/35 (b)(c) | 1,822 | 1,861 | |
| 6 month U.S. LIBOR + 1.650% 2.184% 4/1/35 (b)(c) | 6,142 | 6,309 | |
| 6 month U.S. LIBOR + 2.680% 3.239% 10/1/35 (b)(c) | 1,243 | 1,291 | |
| U.S. TREASURY 1 YEAR INDEX + 1.710% 1.948% 3/1/36 (b)(c) | 51,414 | 52,772 | |
| U.S. TREASURY 1 YEAR INDEX + 2.230% 2.339% 12/1/35 (b)(c) | 23,152 | 24,017 | |
| U.S. TREASURY 1 YEAR INDEX + 2.240% 2.372% 1/1/35 (b)(c) | 785 | 810 | |
| U.S. TREASURY 1 YEAR INDEX + 2.250% 2.463% 3/1/35 (b)(c) | 10,454 | 10,728 | |
| 1.5% 7/1/35 to 12/1/50 | 3,460,991 | 3,000,968 | |
| 2% 6/1/23 to 4/1/52 (e) | 43,640,968 | 38,204,474 | |
| 2% 9/1/35 | 291,696 | 274,177 | |
| 2% 10/1/35 | 1,889,747 | 1,776,254 | |
| 2.5% 2/1/27 to 3/1/52 | 23,040,564 | 21,182,844 | |
| 3% 10/1/26 to 1/1/52 | 20,030,721 | 19,054,918 | |
| 3% 8/1/47 | 5,633 | 5,322 | |
| 3.5% 4/1/28 to 3/1/52 (e) | 17,647,192 | 17,344,139 | |
| 3.5% 8/1/47 | 10,081 | 9,856 | |
| 3.5% 9/1/47 | 270,959 | 265,478 | |
| 4% 8/1/33 to 1/1/52 | 5,074,505 | 5,076,104 | |
| 4.5% 5/1/23 to 9/1/50 | 4,985,812 | 5,104,470 | |
| 5% 4/1/23 to 5/1/50 | 1,015,026 | 1,055,641 | |
| 5.5% 5/1/23 to 6/1/49 | 517,679 | 549,403 | |
| 6% 4/1/32 to 8/1/37 | 59,230 | 63,789 | |
| 6.5% 8/1/36 to 12/1/37 | 2,873 | 3,178 | |
| 7.5% 8/1/26 to 9/1/31 | 1,717 | 1,883 | |
| 8% 5/1/27 | 35 | 38 | |
| 8.5% 5/1/27 to 1/1/28 | 282 | 302 | |
| TOTAL FREDDIE MAC | 113,116,511 | ||
| Ginnie Mae - 4.4% | |||
| 3.5% 12/15/40 to 6/20/51 | 17,634,752 | 17,319,036 | |
| 4% 1/15/25 to 1/20/51 | 9,830,409 | 9,884,971 | |
| 5% 1/20/39 to 4/20/49 | 1,601,215 | 1,675,204 | |
| 6.5% 4/15/35 to 1/15/39 | 26,897 | 29,561 | |
| 7% 1/15/28 to 7/15/32 | 42,614 | 45,822 | |
| 7.5% to 7.5% 10/15/22 to 10/15/28 | 7,268 | 7,715 | |
| 8% 3/15/30 to 9/15/30 | 934 | 1,023 | |
| 1.5% 3/20/51 to 12/20/51 | 320,020 | 272,261 | |
| 2% 10/20/50 to 11/20/51 | 24,127,333 | 21,557,032 | |
| 2% 7/1/52 (f) | 4,650,000 | 4,128,486 | |
| 2% 7/1/52 (f) | 12,450,000 | 11,053,689 | |
| 2.5% 7/20/43 to 5/20/52 | 30,236,075 | 27,834,270 | |
| 3% 7/15/42 to 10/20/51 | 17,115,663 | 16,307,903 | |
| 3% 7/1/52 (f) | 1,900,000 | 1,790,230 | |
| 4.5% to 4.5% 11/20/33 to 5/20/51 | 3,852,618 | 3,967,732 | |
| 5.5% 12/20/32 to 12/20/48 | 290,985 | 308,746 | |
| 6% to 6% 5/20/34 to 12/15/40 | 108,497 | 117,523 | |
| TOTAL GINNIE MAE | 116,301,204 | ||
| Uniform Mortgage Backed Securities - 8.0% | |||
| 1.5% 7/1/37 (f) | 10,900,000 | 9,917,861 | |
| 1.5% 7/1/52 (f) | 5,450,000 | 4,519,500 | |
| 1.5% 7/1/52 (f) | 3,300,000 | 2,736,578 | |
| 1.5% 7/1/52 (f) | 2,000,000 | 1,658,532 | |
| 2% 7/1/37 (f) | 600,000 | 560,009 | |
| 2% 7/1/37 (f) | 950,000 | 886,681 | |
| 2% 7/1/52 (f) | 2,050,000 | 1,778,824 | |
| 2% 7/1/52 (f) | 34,200,000 | 29,675,983 | |
| 2% 7/1/52 (f) | 33,525,000 | 29,090,273 | |
| 2% 7/1/52 (f) | 10,900,000 | 9,458,135 | |
| 2% 8/1/52 (f) | 450,000 | 390,016 | |
| 2% 8/1/52 (f) | 15,650,000 | 13,563,904 | |
| 2% 8/1/52 (f) | 2,200,000 | 1,906,747 | |
| 2% 8/1/52 (f) | 1,750,000 | 1,516,730 | |
| 2.5% 7/1/52 (f) | 62,250,000 | 55,947,141 | |
| 2.5% 8/1/52 (f) | 11,850,000 | 10,636,295 | |
| 3% 7/1/52 (f) | 450,000 | 418,816 | |
| 3% 7/1/52 (f) | 1,900,000 | 1,768,335 | |
| 3.5% 7/1/37 (f) | 975,000 | 968,487 | |
| 3.5% 7/1/52 (f) | 6,000,000 | 5,768,201 | |
| 3.5% 7/1/52 (f) | 600,000 | 576,820 | |
| 4% 7/1/37 (f) | 350,000 | 352,625 | |
| 4% 7/1/52 (f) | 800,000 | 788,625 | |
| 4% 7/1/52 (f) | 900,000 | 887,203 | |
| 4% 7/1/52 (f) | 3,675,000 | 3,622,744 | |
| 4% 7/1/52 (f) | 3,475,000 | 3,425,588 | |
| 4% 7/1/52 (f) | 1,425,000 | 1,404,738 | |
| 4.5% 7/1/52 (f) | 2,600,000 | 2,609,547 | |
| 5% 7/1/52 (f) | 2,900,000 | 2,958,452 | |
| 5% 8/1/52 (f) | 9,200,000 | 9,357,763 | |
| 5.5% 8/1/52(f) | 1,100,000 | 1,130,390 | |
| 5.5% 8/1/52 (f) | 2,500,000 | 2,569,069 | |
| TOTAL UNIFORM MORTGAGE BACKED SECURITIES | 212,850,612 | ||
| TOTAL U.S. GOVERNMENT AGENCY - MORTGAGE SECURITIES | |||
| (Cost $631,705,019) | 621,118,226 | ||
| Asset-Backed Securities - 3.2% | |||
| AASET Trust: | |||
| Series 2018-1A Class A, 3.844% 1/16/38 (a) | $351,545 | $236,726 | |
| Series 2019-1 Class A, 3.844% 5/15/39 (a) | 335,389 | 230,450 | |
| Series 2019-2 Class A, 3.376% 10/16/39 (a) | 669,816 | 509,275 | |
| Series 2021-1A Class A, 2.95% 11/16/41 (a) | 773,846 | 648,084 | |
| Series 2021-2A Class A, 2.798% 1/15/47 (a) | 1,433,964 | 1,224,686 | |
| AASET, Ltd. Series 2022-1A Class A, 6% 5/16/47 (a) | 13,300,000 | 13,039,324 | |
| AIMCO CLO Series 2021-AA Class AR2, 3 month U.S. LIBOR + 1.140% 2.1843% 10/17/34 (a)(b)(c) | 313,000 | 299,684 | |
| AIMCO CLO Ltd. Series 2021-11A Class AR, 3 month U.S. LIBOR + 1.130% 2.1743% 10/17/34 (a)(b)(c) | 524,413 | 504,082 | |
| AIMCO CLO Ltd. / AIMCO CLO LLC Series 2021-14A Class A, 3 month U.S. LIBOR + 0.990% 2.0527% 4/20/34 (a)(b)(c) | 1,282,526 | 1,224,629 | |
| Allegro CLO XV, Ltd. / Allegro CLO VX LLC Series 2022-1A Class A, CME TERM SOFR 3 MONTH INDEX + 1.500% 3.1807% 7/20/35 (a)(b)(c) | 667,851 | 650,857 | |
| Allegro CLO, Ltd. Series 2021-1A Class A, 3 month U.S. LIBOR + 1.140% 2.2027% 7/20/34 (a)(b)(c) | 627,261 | 603,438 | |
| Apollo Aviation Securitization Equity Trust Series 2020-1A Class A, 3.351% 1/16/40 (a) | 206,703 | 173,379 | |
| Ares CLO Series 2019-54A Class A, 3 month U.S. LIBOR + 1.320% 2.3643% 10/15/32 (a)(b)(c) | 686,534 | 670,595 | |
| Ares LIX CLO Ltd. Series 2021-59A Class A, 3 month U.S. LIBOR + 1.030% 2.214% 4/25/34 (a)(b)(c) | 425,583 | 408,725 | |
| Ares LV CLO Ltd. Series 2021-55A Class A1R, 3 month U.S. LIBOR + 1.130% 2.1743% 7/15/34 (a)(b)(c) | 790,637 | 765,794 | |
| Ares LVIII CLO LLC Series 2022-58A Class AR, U.S. 90-Day Avg. Secured Overnight Fin. Rate (SOFR) Indx + 1.330% 2.1764% 1/15/35 (a)(b)(c) | 1,054,759 | 1,011,157 | |
| Ares XLI CLO Ltd. / Ares XLI CLO LLC Series 2021-41A Class AR2, 3 month U.S. LIBOR + 1.070% 2.1143% 4/15/34 (a)(b)(c) | 889,718 | 856,386 | |
| Ares XXXIV CLO Ltd. Series 2020-2A Class AR2, 3 month U.S. LIBOR + 1.250% 2.2943% 4/17/33 (a)(b)(c) | 272,629 | 265,845 | |
| Babson CLO Ltd. Series 2021-1A Class AR, 3 month U.S. LIBOR + 1.150% 2.1943% 10/15/36 (a)(b)(c) | 529,185 | 510,769 | |
| Barings CLO Ltd.: | |||
| Series 2021-1A Class A, 3 month U.S. LIBOR + 1.020% 2.204% 4/25/34 (a)(b)(c) | 934,550 | 900,909 | |
| Series 2021-4A Class A, 3 month U.S. LIBOR + 1.220% 2.2827% 1/20/32 (a)(b)(c) | 847,650 | 829,654 | |
| Beechwood Park CLO Ltd. Series 2022-1A Class A1R, CME TERM SOFR 3 MONTH INDEX + 1.300% 2.1464% 1/17/35 (a)(b)(c) | 1,072,148 | 1,034,430 | |
| BETHP Series 2021-1A Class A, 3 month U.S. LIBOR + 1.130% 2.1743% 1/15/35 (a)(b)(c) | 799,679 | 770,074 | |
| Blackbird Capital Aircraft: | |||
| Series 2016-1A: | |||
| Class A, 4.213% 12/16/41 (a) | 832,891 | 735,987 | |
| Class AA, 2.487% 12/16/41 (a)(b) | 100,601 | 93,941 | |
| Series 2021-1A Class A, 2.443% 7/15/46 (a) | 1,045,150 | 894,635 | |
| Bristol Park CLO, Ltd. Series 2020-1A Class AR, 3 month U.S. LIBOR + 0.990% 2.0343% 4/15/29 (a)(b)(c) | 1,509,665 | 1,486,144 | |
| Capital One Multi-Asset Execution Trust Series 2019-A3 Class A3, 2.06% 8/15/28 | 283,000 | 268,103 | |
| CarMax Auto Owner Trust Series 2021-1 Class A3, 0.34% 12/15/25 | 965,000 | 940,640 | |
| Castlelake Aircraft Securitization Trust Series 2019-1A: | |||
| Class A, 3.967% 4/15/39 (a) | 513,733 | 453,194 | |
| Class B, 5.095% 4/15/39 (a) | 272,765 | 216,054 | |
| Castlelake Aircraft Structured Trust: | |||
| Series 2018-1 Class A, 4.125% 6/15/43 (a) | 375,559 | 337,534 | |
| Series 2021-1A Class A, 3.474% 1/15/46 (a) | 216,878 | 193,171 | |
| Cedar Funding Ltd.: | |||
| Series 2021-10A Class AR, 3 month U.S. LIBOR + 1.100% 2.1627% 10/20/32 (a)(b)(c) | 639,316 | 620,374 | |
| Series 2022-15A Class A, CME TERM SOFR 3 MONTH INDEX + 1.320% 2.0327% 4/20/35 (a)(b)(c) | 994,984 | 952,045 | |
| Cedar Funding XII CLO Ltd. / Cedar Funding XII CLO LLC Series 2021-12A Class A1R, 3 month U.S. LIBOR + 1.130% 2.314% 10/25/34 (a)(b)(c) | 490,758 | 472,154 | |
| CEDF Series 2021-6A Class ARR, 3 month U.S. LIBOR + 1.050% 2.1127% 4/20/34 (a)(b)(c) | 772,931 | 739,340 | |
| Cent CLO Ltd. / Cent CLO Series 2021-29A Class AR, 3 month U.S. LIBOR + 1.170% 2.2327% 10/20/34 (a)(b)(c) | 795,912 | 764,937 | |
| Chase Issuance Trust Series 2012-A7 Class A7, 2.16% 9/15/24 | 256,000 | 256,001 | |
| Citibank Credit Card Issuance Trust: | |||
| Series 2013-A9 Class A9, 3.72% 9/8/25 | 128,000 | 127,847 | |
| Series 2018-A6 Class A6, 3.21% 12/7/24 | 260,000 | 260,550 | |
| Series 2018-A7 Class A7, 3.96% 10/13/30 | 442,000 | 447,109 | |
| Columbia Cent CLO 31 Ltd. Series 2021-31A Class A1, 3 month U.S. LIBOR + 1.200% 2.2627% 4/20/34 (a)(b)(c) | 853,929 | 822,717 | |
| Columbia Cent Clo 32 Ltd. / Coliseum Series 2022-32A Class A1, CME TERM SOFR 3 MONTH INDEX + 1.700% 1.75% 7/24/34 (b)(c)(f) | 3,009,000 | 2,981,636 | |
| Columbia Cent CLO Ltd. / Columbia Cent CLO Corp. Series 2021-30A Class A1, 3 month U.S. LIBOR + 1.310% 2.3727% 1/20/34 (a)(b)(c) | 1,117,642 | 1,088,290 | |
| DB Master Finance LLC Series 2017-1A Class A2II, 4.03% 11/20/47 (a) | 724,828 | 693,693 | |
| Discover Card Execution Note Trust Series 2018-A1 Class A1, 3.03% 8/15/25 | 526,000 | 525,667 | |
| Dryden 98 CLO Ltd. Series 2022-98A Class A, CME TERM SOFR 3 MONTH INDEX + 1.300% 2.204% 4/20/35 (a)(b)(c) | 558,807 | 537,017 | |
| Dryden CLO, Ltd.: | |||
| Series 2021-76A Class A1R, 3 month U.S. LIBOR + 1.150% 2.2127% 10/20/34 (a)(b)(c) | 528,431 | 510,177 | |
| Series 2021-83A Class A, 3 month U.S. LIBOR + 1.220% 2.2643% 1/18/32 (a)(b)(c) | 647,981 | 633,920 | |
| Dryden Senior Loan Fund: | |||
| Series 2018-58A Class A1, 3 month U.S. LIBOR + 1.000% 2.0443% 7/17/31 (a)(b)(c) | 813,000 | 795,148 | |
| Series 2020-78A Class A, 3 month U.S. LIBOR + 1.180% 2.2243% 4/17/33 (a)(b)(c) | 539,984 | 524,579 | |
| Series 2021-85A Class AR, 3 month U.S. LIBOR + 1.150% 2.1943% 10/15/35 (a)(b)(c) | 702,984 | 677,262 | |
| Series 2021-90A Class A1A, 3 month U.S. LIBOR + 1.130% 2.608% 2/20/35 (a)(b)(c) | 418,048 | 402,254 | |
| Eaton Vance CLO, Ltd.: | |||
| Series 2021-1A Class AR, 3 month U.S. LIBOR + 1.100% 2.1443% 4/15/31 (a)(b)(c) | 362,417 | 353,404 | |
| Series 2021-2A Class AR, 3 month U.S. LIBOR + 1.150% 2.1943% 1/15/35 (a)(b)(c) | 1,957,851 | 1,893,471 | |
| Flatiron CLO Ltd. Series 2021-1A: | |||
| Class A1, 3 month U.S. LIBOR + 1.110% 2.1543% 7/19/34 (a)(b)(c) | 570,249 | 549,833 | |
| Class AR, 3 month U.S. LIBOR + 1.080% 2.4913% 11/16/34 (a)(b)(c) | 816,255 | 790,733 | |
| Flatiron CLO Ltd. / Flatiron CLO LLC Series 2020-1A Class A, 3 month U.S. LIBOR + 1.300% 2.778% 11/20/33 (a)(b)(c) | 1,017,886 | 989,595 | |
| Ford Credit Auto Lease Trust Series 2021-A Class A3, 0.26% 2/15/24 | 899,280 | 893,009 | |
| Ford Credit Auto Owner Trust Series 2020-2 Class A, 1.06% 4/15/33 (a) | 322,000 | 291,527 | |
| Ford Credit Floorplan Master Owner Trust Series 2018-2 Class A, 3.17% 3/15/25 | 522,000 | 521,234 | |
| GM Financial Consumer Automobile Receivables Trust Series 2021-1 Class A3, 0.35% 10/16/25 | 737,000 | 718,827 | |
| Horizon Aircraft Finance I Ltd. Series 2018-1 Class A, 4.458% 12/15/38 (a) | 307,268 | 267,339 | |
| Horizon Aircraft Finance Ltd. Series 2019-1 Class A, 3.721% 7/15/39 (a) | 309,406 | 273,778 | |
| Invesco CLO Ltd. Series 2021-3A Class A, 3 month U.S. LIBOR + 1.130% 2.2663% 10/22/34 (a)(b)(c) | 560,077 | 537,937 | |
| KKR CLO Ltd. Series 2022-41A Class A1, CME TERM SOFR 3 MONTH INDEX + 1.330% 2.0223% 4/15/35 (a)(b)(c) | 1,298,569 | 1,246,299 | |
| Lucali CLO Ltd. Series 2021-1A Class A, 3 month U.S. LIBOR + 1.210% 2.2543% 1/15/33 (a)(b)(c) | 401,849 | 392,101 | |
| Madison Park Funding Series 2020-19A Class A1R2, 3 month U.S. LIBOR + 0.920% 2.0563% 1/22/28 (a)(b)(c) | 547,469 | 539,454 | |
| Madison Park Funding L Ltd. / Madison Park Funding L LLC Series 2021-50A Class A, 3 month U.S. LIBOR + 1.140% 2.1843% 4/19/34 (a)(b)(c) | 895,369 | 868,547 | |
| Madison Park Funding LII Ltd. / Madison Park Funding LII LLC Series 2021-52A Class A, 3 month U.S. LIBOR + 1.100% 2.2363% 1/22/35 (a)(b)(c) | 910,439 | 872,812 | |
| Madison Park Funding XLV Ltd./Madison Park Funding XLV LLC Series 2021-45A Class AR, 3 month U.S. LIBOR + 1.120% 2.1643% 7/15/34 (a)(b)(c) | 569,118 | 551,561 | |
| Magnetite IX, Ltd. / Magnetite IX LLC Series 2021-30A Class A, 3 month U.S. LIBOR + 1.130% 2.314% 10/25/34 (a)(b)(c) | 965,191 | 931,747 | |
| Magnetite XXI Ltd. Series 2021-21A Class AR, 3 month U.S. LIBOR + 1.020% 2.0827% 4/20/34 (a)(b)(c) | 746,434 | 719,733 | |
| Magnetite XXIX, Ltd. / Magnetite XXIX LLC Series 2021-29A Class A, 3 month U.S. LIBOR + 0.990% 2.0343% 1/15/34 (a)(b)(c) | 779,838 | 759,854 | |
| Marlette Funding Trust Series 2022-1A Class A, 1.36% 4/15/32 (a) | 1,067,972 | 1,048,610 | |
| Mercedes-Benz Auto Lease Trust Series 2021-A Class A3, 0.25% 1/16/24 | 874,152 | 865,580 | |
| Milos CLO, Ltd. Series 2020-1A Class AR, 3 month U.S. LIBOR + 1.070% 2.1327% 10/20/30 (a)(b)(c) | 817,762 | 802,280 | |
| Park Place Securities, Inc. Series 2005-WCH1 Class M4, 1 month U.S. LIBOR + 1.240% 2.8686% 1/25/36 (b)(c) | 24,137 | 23,963 | |
| Peace Park CLO, Ltd. Series 2021-1A Class A, 3 month U.S. LIBOR + 1.130% 2.1927% 10/20/34 (a)(b)(c) | 1,605,558 | 1,554,866 | |
| Planet Fitness Master Issuer LLC: | |||
| Series 2019-1A Class A2, 3.858% 12/5/49 (a) | 593,775 | 527,885 | |
| Series 2022-1A: | |||
| Class A2I, 3.251% 12/5/51 (a) | 650,370 | 582,661 | |
| Class A2II, 4.008% 12/5/51 (a) | 581,543 | 518,608 | |
| Project Silver Series 2019-1 Class A, 3.967% 7/15/44 (a) | 577,779 | 495,859 | |
| Rockland Park CLO Ltd. Series 2021-1A Class A, 3 month U.S. LIBOR + 1.120% 2.1827% 4/20/34 (a)(b)(c) | 1,066,406 | 1,034,380 | |
| RR 7 Ltd. Series 2022-7A Class A1AB, 3 month U.S. LIBOR + 1.340% 1.5203% 1/15/37 (a)(b)(c) | 1,078,307 | 1,038,962 | |
| Sapphire Aviation Finance Series 2020-1A Class A, 3.228% 3/15/40 (a) | 601,771 | 526,764 | |
| SBA Tower Trust: | |||
| Series 2019, 2.836% 1/15/50 (a) | 779,000 | 752,480 | |
| 1.884% 7/15/50 (a) | 300,000 | 277,340 | |
| 2.328% 7/15/52 (a) | 229,000 | 203,382 | |
| Stratus CLO, Ltd. Series 2022-1A Class A, CME TERM SOFR 3 MONTH INDEX + 1.750% 1.75% 7/20/30 (a)(b)(c)(f) | 481,000 | 476,626 | |
| SYMP Series 2022-32A Class A1, CME TERM SOFR 3 MONTH INDEX + 1.320% 1.6326% 4/23/35 (a)(b)(c) | 1,115,802 | 1,066,865 | |
| Symphony CLO XIX, Ltd. / Symphon CLO XIX LLC Series 2018-19A Class A, 3 month U.S. LIBOR + 0.960% 2.0043% 4/16/31 (a)(b)(c) | 1,280,000 | 1,249,527 | |
| Symphony CLO XXV Ltd. / Symphony CLO XXV LLC Series 2021-25A Class A, 3 month U.S. LIBOR + 0.980% 2.0243% 4/19/34 (a)(b)(c) | 947,359 | 910,268 | |
| Symphony CLO XXVI Ltd. / Symphony CLO XXVI LLC Series 2021-26A Class AR, 3 month U.S. LIBOR + 1.080% 2.1427% 4/20/33 (a)(b)(c) | 875,909 | 847,257 | |
| Terwin Mortgage Trust Series 2003-4HE Class A1, 1 month U.S. LIBOR + 0.860% 2.4836% 9/25/34 (b)(c) | 940 | 920 | |
| Thunderbolt Aircraft Lease Ltd. Series 2018-A Class A, 4.147% 9/15/38 (a)(b) | 711,855 | 627,788 | |
| Thunderbolt III Aircraft Lease Ltd. Series 2019-1 Class A, 3.671% 11/15/39 (a) | 888,234 | 761,764 | |
| Upstart Securitization Trust 3.12% 3/20/32 (a) | 350,287 | 342,416 | |
| Verizon Master Trust Series 2021-1 Class B, 0.69% 5/20/27 | 2,008,000 | 1,876,902 | |
| Voya CLO Ltd. Series 2019-2A Class A, 3 month U.S. LIBOR + 1.270% 2.3327% 7/20/32 (a)(b)(c) | 822,785 | 804,461 | |
| Voya CLO Ltd./Voya CLO LLC: | |||
| Series 2021-2A Class A1R, 3 month U.S. LIBOR + 1.160% 2.2043% 7/19/34 (a)(b)(c) | 522,906 | 505,957 | |
| Series 2021-3A Class AR, 3 month U.S. LIBOR + 1.150% 2.2127% 10/20/34 (a)(b)(c) | 1,070,174 | 1,031,793 | |
| Voya CLO, Ltd. Series 2021-1A Class AR, 3 month U.S. LIBOR + 1.150% 2.1943% 7/16/34 (a)(b)(c) | 528,055 | 510,204 | |
| TOTAL ASSET-BACKED SECURITIES | |||
| (Cost $84,536,728) | 84,050,235 | ||
| Collateralized Mortgage Obligations - 0.5% | |||
| Private Sponsor - 0.5% | |||
| Binom Securitization Trust 202 Series 2022-RPL1 Class A1, 3% 2/25/61 (a) | 754,566 | 726,531 | |
| BRAVO Residential Funding Trust sequential payer Series 2022-RPL1 Class A1, 2.75% 9/25/61 (a) | 1,089,511 | 1,040,985 | |
| Bvebo 2022-3 A sequential payer Series 2022-3 Class A, 3.242% 5/29/52 (a) | 3,852,002 | 3,875,484 | |
| Cascade Funding Mortgage Trust: | |||
| sequential payer Series 2022-EBO2 Class A, 3.169% 7/25/54 (a) | 580,905 | 576,238 | |
| Series 2021-HB6 Class A, 0.8983% 6/25/36 (a) | 517,461 | 507,343 | |
| Cfmt 2022-Hb8 LLC sequential payer Series 2022-HB8 Class A, 3.75% 4/25/25 (a) | 3,332,800 | 3,283,271 | |
| Finance of America HECM Buyout sequential payer Series 2022-HB1 Class A, 2.6948% 2/25/32 (a)(b) | 1,256,881 | 1,235,866 | |
| NYMT Loan Trust sequential payer Series 2021-CP1 Class A1, 2.0424% 7/25/61 (a) | 427,905 | 404,649 | |
| Preston Ridge Partners Mortgage Trust Series 2021-2 Class A1, 2.115% 3/25/26 (a) | 755,263 | 714,371 | |
| RMF Buyout Issuance Trust sequential payer Series 2022-HB1 Class A, 4.272% 4/25/32 (a) | 381,224 | 378,467 | |
| TOTAL PRIVATE SPONSOR | 12,743,205 | ||
| U.S. Government Agency - 0.0% | |||
| Fannie Mae planned amortization class: | |||
| Series 1999-54 Class PH, 6.5% 11/18/29 | 5,148 | 5,271 | |
| Series 1999-57 Class PH, 6.5% 12/25/29 | 10,580 | 11,059 | |
| Ginnie Mae guaranteed REMIC pass-thru certificates sequential payer Series 2013-H06 Class HA, 1.65% 1/20/63 (g) | 3,509 | 3,503 | |
| TOTAL U.S. GOVERNMENT AGENCY | 19,833 | ||
| TOTAL COLLATERALIZED MORTGAGE OBLIGATIONS | |||
| (Cost $12,769,734) | 12,763,038 | ||
| Commercial Mortgage Securities - 4.6% | |||
| BAMLL Commercial Mortgage Securities Trust: | |||
| floater Series 2022-DKLX Class A, U.S. 30-Day Avg. Secured Overnight Fin. Rate (SOFR) Indx + 1.150% 2.429% 1/15/39 (a)(b)(c) | 497,039 | 482,873 | |
| sequential payer Series 2019-BPR Class ANM, 3.112% 11/5/32 (a) | 484,000 | 460,708 | |
| Series 2019-BPR Class BNM, 3.465% 11/5/32 (a) | 109,000 | 100,429 | |
| BANK sequential payer: | |||
| Series 2017-BNK4 Class ASB, 3.419% 5/15/50 | 615,191 | 607,631 | |
| Series 2018-BN10 Class A5, 3.688% 2/15/61 | 48,347 | 47,032 | |
| Series 2019-BN21 Class A5, 2.851% 10/17/52 | 82,630 | 75,403 | |
| Series 2020-BN25 Class A5, 2.649% 1/15/63 | 462,410 | 413,660 | |
| Series 2020-BN28 Class A4, 1.844% 3/15/63 | 1,148,351 | 956,307 | |
| Series 2021-BN35 Class A5, 2.285% 6/15/64 | 567,169 | 482,623 | |
| Series 2022-BNK41 Class A4, 3.9163% 4/15/65 (b) | 963,521 | 931,066 | |
| Series 2022-BNK42, Class A5, 4.493% 6/15/55 (b) | 1,104,934 | 1,124,869 | |
| BBCMS Mortgage Trust: | |||
| sequential payer Series 2021-C11 Class A5, 2.322% 9/15/54 | 722,307 | 614,814 | |
| Series 2022-C16 Class A5, 4.6% 6/15/55 | 4,300,000 | 4,403,447 | |
| Benchmark Mortgage Trust: | |||
| sequential payer: | |||
| Series 2018-B4 Class A5, 4.121% 7/15/51 | 172,167 | 170,934 | |
| Series 2019-B10 Class A4, 3.717% 3/15/62 | 159,609 | 154,114 | |
| Series 2020-B19 Class A5, 1.85% 9/15/53 | 468,749 | 393,189 | |
| Series 2021-B24 Class A5, 2.5843% 3/15/54 | 2,900,621 | 2,544,263 | |
| Series 2021-B28 Class A5, 2.2237% 8/15/54 | 2,250,000 | 1,904,158 | |
| Series 2018-B8 Class A5, 4.2317% 1/15/52 | 1,180,306 | 1,176,285 | |
| Series 2019-B12 Class A5, 3.1156% 8/15/52 | 726,144 | 673,868 | |
| Series 2019-B9 Class A5, 4.0156% 3/15/52 | 642,936 | 632,156 | |
| BFLD Trust floater sequential payer Series 2020-OBRK Class A, 1 month U.S. LIBOR + 2.050% 3.374% 11/15/28 (a)(b)(c) | 441,000 | 435,226 | |
| BPR Trust floater Series 2022-OANA: | |||
| Class A, CME TERM SOFR 1 MONTH INDEX + 1.890% 3.1767% 4/15/37 (a)(b)(c) | 2,535,445 | 2,483,573 | |
| Class B, CME TERM SOFR 1 MONTH INDEX + 2.440% 3.7257% 4/15/37 (a)(b)(c) | 841,247 | 822,852 | |
| BX Commercial Mortgage Trust floater: | |||
| Series 2021-PAC: | |||
| Class A, 1 month U.S. LIBOR + 0.680% 2.0141% 10/15/36 (a)(b)(c) | 1,109,960 | 1,053,649 | |
| Class B, 1 month U.S. LIBOR + 0.890% 2.2238% 10/15/36 (a)(b)(c) | 162,246 | 152,868 | |
| Class C, 1 month U.S. LIBOR + 1.090% 2.4236% 10/15/36 (a)(b)(c) | 217,124 | 202,066 | |
| Class D, 1 month U.S. LIBOR + 1.290% 2.6233% 10/15/36 (a)(b)(c) | 210,720 | 194,220 | |
| Class E, 1 month U.S. LIBOR + 1.940% 3.2725% 10/15/36 (a)(b)(c) | 732,746 | 680,101 | |
| Series 2022-LP2: | |||
| Class A, CME TERM SOFR 1 MONTH INDEX + 1.010% 2.3469% 2/15/39 (a)(b)(c) | 1,375,528 | 1,320,566 | |
| Class B, CME TERM SOFR 1 MONTH INDEX + 1.310% 2.6463% 2/15/39 (a)(b)(c) | 414,418 | 393,719 | |
| Class C, CME TERM SOFR 1 MONTH INDEX + 1.560% 2.8957% 2/15/39 (a)(b)(c) | 414,418 | 389,579 | |
| Class D, CME TERM SOFR 1 MONTH INDEX + 1.960% 3.2948% 2/15/39 (a)(b)(c) | 414,418 | 385,441 | |
| BX Trust: | |||
| floater: | |||
| Series 2018-EXCL Class D, 1 month U.S. LIBOR + 2.620% 3.949% 9/15/37 (a)(b)(c) | 186,445 | 155,295 | |
| Series 2019-IMC: | |||
| Class B, 1 month U.S. LIBOR + 1.300% 2.624% 4/15/34 (a)(b)(c) | 412,398 | 395,777 | |
| Class C, 1 month U.S. LIBOR + 1.600% 2.924% 4/15/34 (a)(b)(c) | 272,629 | 260,955 | |
| Class D, 1 month U.S. LIBOR + 1.900% 3.224% 4/15/34 (a)(b)(c) | 286,192 | 271,775 | |
| Series 2019-XL: | |||
| Class B, 1 month U.S. LIBOR + 1.080% 2.404% 10/15/36 (a)(b)(c) | 1,734,536 | 1,690,903 | |
| Class C, 1 month U.S. LIBOR + 1.250% 2.574% 10/15/36 (a)(b)(c) | 415,223 | 402,689 | |
| Class D, 1 month U.S. LIBOR + 1.450% 2.774% 10/15/36 (a)(b)(c) | 1,077,637 | 1,042,399 | |
| Class E, 1 month U.S. LIBOR + 1.800% 3.124% 10/15/36 (a)(b)(c) | 826,282 | 797,185 | |
| Series 2022-IND: | |||
| Class A, CME TERM SOFR 1 MONTH INDEX + 1.490% 2.8248% 4/15/37 (a)(b)(c) | 1,044,977 | 1,016,789 | |
| Class B, CME TERM SOFR 1 MONTH INDEX + 1.940% 3.2738% 4/15/37 (a)(b)(c) | 532,723 | 516,237 | |
| Class C, CME TERM SOFR 1 MONTH INDEX + 2.290% 3.6238% 4/15/37 (a)(b)(c) | 120,275 | 115,276 | |
| Class D, CME TERM SOFR 1 MONTH INDEX + 2.830% 4.1728% 4/15/37 (a)(b)(c) | 100,712 | 95,966 | |
| floater sequential payer Series 2021-SOAR Class A, 1.995% 6/15/38 (a)(b) | 1,566,738 | 1,503,781 | |
| floater, sequential payer: | |||
| Series 2019-IMC Class A, 1 month U.S. LIBOR + 1.000% 2.324% 4/15/34 (a)(b)(c) | 1,194,934 | 1,164,832 | |
| Series 2019-XL Class A, 1 month U.S. LIBOR + 0.920% 2.244% 10/15/36 (a)(b)(c) | 721,806 | 709,097 | |
| CAMB Commercial Mortgage Trust floater Series 2019-LIFE Class E, 1 month U.S. LIBOR + 2.150% 3.474% 12/15/37 (a)(b)(c) | 520,000 | 499,754 | |
| CF Hippolyta Issuer LLC sequential payer Series 2021-1A Class A1, 1.53% 3/15/61 (a) | 1,222,832 | 1,079,213 | |
| CHC Commercial Mortgage Trust floater Series 2019-CHC: | |||
| Class A, 1 month U.S. LIBOR + 1.120% 2.444% 6/15/34 (a)(b)(c) | 990,612 | 967,672 | |
| Class B, 1 month U.S. LIBOR + 1.500% 2.824% 6/15/34 (a)(b)(c) | 195,056 | 188,595 | |
| Class C, 1 month U.S. LIBOR + 1.750% 3.074% 6/15/34 (a)(b)(c) | 220,357 | 211,989 | |
| CIM Retail Portfolio Trust floater Series 2021-RETL: | |||
| Class C, 1 month U.S. LIBOR + 2.300% 3.625% 8/15/36 (a)(b)(c) | 43,363 | 41,046 | |
| Class D, 1 month U.S. LIBOR + 3.050% 4.375% 8/15/36 (a)(b)(c) | 144,000 | 134,945 | |
| Citigroup Commercial Mortgage Trust sequential payer: | |||
| Series 2014-GC25 Class A4, 3.635% 10/10/47 | 825,999 | 813,647 | |
| Series 2015-GC29 Class A4, 3.192% 4/10/48 | 311,943 | 302,676 | |
| Series 2015-P1 Class A5, 3.717% 9/15/48 | 160,809 | 158,558 | |
| Series 2016-C1 Class A4, 3.209% 5/10/49 | 508,851 | 489,857 | |
| Series 2016-P4 Class A4, 2.902% 7/10/49 | 589,456 | 562,039 | |
| COMM Mortgage Trust: | |||
| sequential payer: | |||
| Series 2013-CR7 Class A4, 3.213% 3/10/46 | 317,174 | 315,245 | |
| Series 2014-CR18 Class A5, 3.828% 7/15/47 | 158,730 | 157,628 | |
| Series 2013-CR13 Class AM, 4.449% 11/10/46 | 738,856 | 735,672 | |
| Series 2013-CR6 Class A4, 3.101% 3/10/46 | 514,489 | 511,982 | |
| Series 2013-LC13 Class AM, 4.557% 8/10/46 (a) | 452,842 | 452,989 | |
| Series 2014-CR14 Class AM, 4.526% 2/10/47 (b) | 909,306 | 908,033 | |
| Series 2015-CR22 Class A5, 3.309% 3/10/48 | 532,572 | 520,272 | |
| Credit Suisse Mortgage Trust: | |||
| floater Series 2019-ICE4 Class B, 1 month U.S. LIBOR + 1.230% 2.554% 5/15/36 (a)(b)(c) | 522,000 | 510,377 | |
| sequential payer Series 2020-NET Class A, 2.2569% 8/15/37 (a) | 242,397 | 223,760 | |
| Series 2018-SITE: | |||
| Class A, 4.284% 4/15/36 (a) | 462,377 | 448,971 | |
| Class B, 4.5349% 4/15/36 (a) | 142,154 | 136,644 | |
| Class D, 4.9414% 4/15/36 (a)(b) | 190,753 | 178,454 | |
| CSAIL Commercial Mortgage Trust sequential payer: | |||
| Series 2015-C3 Class A4, 3.7182% 8/15/48 | 344,472 | 338,728 | |
| Series 2019-C17: | |||
| Class A4, 2.7628% 9/15/52 | 516,958 | 463,310 | |
| Class A5, 3.0161% 9/15/52 | 516,958 | 471,944 | |
| ELP Commercial Mortgage Trust floater Series 2021-ELP Class A, 1 month U.S. LIBOR + 0.700% 2.026% 11/15/38 (a)(b)(c) | 1,497,765 | 1,430,062 | |
| Extended Stay America Trust floater Series 2021-ESH: | |||
| Class A, 1 month U.S. LIBOR + 1.080% 2.405% 7/15/38 (a)(b)(c) | 794,113 | 774,170 | |
| Class B, 1 month U.S. LIBOR + 1.380% 2.705% 7/15/38 (a)(b)(c) | 1,603,133 | 1,554,819 | |
| Class C, 1 month U.S. LIBOR + 1.700% 3.025% 7/15/38 (a)(b)(c) | 206,728 | 199,979 | |
| Class D, 1 month U.S. LIBOR + 2.250% 3.575% 7/15/38 (a)(b)(c) | 11,502,210 | 11,097,840 | |
| Freddie Mac: | |||
| sequential payer: | |||
| Series 2016-K057 Class A2, 2.57% 7/25/26 | 437,441 | 424,021 | |
| Series 2020-K104 Class A2, 2.253% 1/25/30 | 2,053,820 | 1,885,289 | |
| Series 2020-K116 Class A2, 1.378% 7/25/30 | 1,745,881 | 1,482,310 | |
| Series 2020-K117 Class A2, 1.406% 8/25/30 | 890,789 | 756,318 | |
| Series 2020-K118 Class A2, 1.493% 9/25/30 | 423,042 | 361,573 | |
| Series 2020-K121 Class A2, 1.547% 10/25/30 | 593,860 | 507,905 | |
| Series 2021-K125 Class A2, 1.846% 1/25/31 | 230,204 | 201,081 | |
| Series 2021-K126 Class A2, 2.074% 1/25/31 | 327,624 | 291,709 | |
| Series 2021-K130 Class A2, 1.723% 6/25/31 | 281,917 | 242,419 | |
| Series 2021-K136 Class A2, 2.127% 11/25/31 | 1,500,998 | 1,326,330 | |
| Series 2022-K144 Class A2, 2.45% 4/25/32 | 2,700,000 | 2,442,849 | |
| Series 2022-K145 Class A2, 2.58% 6/25/55 | 5,400,000 | 4,940,201 | |
| Series K034 Class A2, 3.531% 7/25/23 | 246,752 | 247,245 | |
| Series K080 Class A2, 3.926% 7/25/28 | 454,836 | 464,629 | |
| Series 2017-K064 Class A2, 3.224% 3/25/27 | 472,919 | 468,081 | |
| Series 2017-K068 Class A2, 3.244% 8/25/27 | 652,712 | 645,925 | |
| Series 2017-K727 Class A2, 2.946% 7/25/24 | 726,571 | 721,197 | |
| Series 2018-K730 Class A2, 3.59% 1/25/25 | 1,060,473 | 1,064,799 | |
| Series 2019-K094 Class A2, 2.903% 6/25/29 | 1,410,116 | 1,358,030 | |
| Series 2019-K1510 Class A2, 3.718% 1/25/31 | 407,161 | 413,678 | |
| Series 2021-K123 Class A2, 1.621% 12/25/30 | 781,693 | 672,335 | |
| Series K036 Class A2, 3.527% 10/25/23 | 246,051 | 246,409 | |
| Series K046 Class A2, 3.205% 3/25/25 | 912,976 | 907,362 | |
| Series K047 Class A2, 3.329% 5/25/25 | 105,827 | 105,537 | |
| Series K053 Class A2, 2.995% 12/25/25 | 194,973 | 192,387 | |
| Series K056 Class A2, 2.525% 5/25/26 | 568,904 | 551,024 | |
| Series K062 Class A1, 3.032% 9/25/26 | 329,804 | 328,450 | |
| Series K079 Class A2, 3.926% 6/25/28 | 213,322 | 218,436 | |
| GS Mortgage Securities Trust: | |||
| floater: | |||
| Series 2018-3PCK Class A, 1 month U.S. LIBOR + 1.700% 3.024% 9/15/31 (a)(b)(c) | 406,593 | 400,670 | |
| Series 2021-IP Class A, 1 month U.S. LIBOR + 0.950% 2.274% 10/15/36 (a)(b)(c) | 638,563 | 615,178 | |
| sequential payer: | |||
| Series 2013-GC10 Class A4, 2.681% 2/10/46 | 196,342 | 195,846 | |
| Series 2014-GC26 Class A4, 3.364% 11/10/47 | 465,276 | 453,669 | |
| Series 2020-GC45 Class A5, 2.9106% 2/13/53 | 1,245,771 | 1,127,634 | |
| Series 2013-GC12 Class A/S, 3.375% 6/10/46 | 2,410,418 | 2,385,536 | |
| J.P. Morgan Chase Commercial Mortgage Securities Trust floater Series 2012-NLP Class A, CME TERM SOFR 1 MONTH INDEX + 0.590% 1.8752% 4/15/37 (a)(b)(c) | 326,000 | 306,422 | |
| JPMBB Commercial Mortgage Securities Trust: | |||
| sequential payer: | |||
| Series 2014-C21 Class A5, 3.7748% 8/15/47 | 925,287 | 918,503 | |
| Series 2014-C23 Class A5, 3.9342% 9/15/47 | 261,832 | 260,485 | |
| Series 2014-C24 Class A5, 3.6385% 11/15/47 | 714,600 | 705,010 | |
| Series 2015-C29 Class A4, 3.6108% 5/15/48 | 246,754 | 241,737 | |
| Series 2013-C17 Class A/S, 4.4584% 1/15/47 | 1,032,479 | 1,030,337 | |
| JPMCC Commercial Mortgage Securities Trust Series 2016-JP4 Class ASB, 3.4743% 12/15/49 | 732,380 | 722,763 | |
| JPMorgan Chase Commercial Mortgage Securities Corp. sequential payer Series 2012-LC9 Class A5, 2.84% 12/15/47 | 357,934 | 356,959 | |
| JPMorgan Chase Commercial Mortgage Securities Trust Series 2018-WPT: | |||
| Class DFX, 5.3503% 7/5/33 (a) | 158,353 | 155,827 | |
| Class EFX, 5.5422% 7/5/33 (a) | 192,511 | 186,738 | |
| Life Financial Services Trust floater Series 2022-BMR2: | |||
| Class A1, CME TERM SOFR 1 MONTH INDEX + 1.290% 2.5739% 5/15/39 (a)(b)(c) | 1,526,439 | 1,488,256 | |
| Class B, CME TERM SOFR 1 MONTH INDEX + 1.790% 3.0726% 5/15/39 (a)(b)(c) | 899,162 | 872,170 | |
| Class C, CME TERM SOFR 1 MONTH INDEX + 2.090% 3.3718% 5/15/39 (a)(b)(c) | 511,349 | 493,442 | |
| Class D, CME TERM SOFR 1 MONTH INDEX + 2.540% 3.8206% 5/15/39 (a)(b)(c) | 454,472 | 434,010 | |
| LIFE Mortgage Trust floater Series 2021-BMR: | |||
| Class A, 1 month U.S. LIBOR + 0.700% 2.024% 3/15/38 (a)(b)(c) | 1,213,736 | 1,174,691 | |
| Class B, 1 month U.S. LIBOR + 0.880% 2.204% 3/15/38 (a)(b)(c) | 217,253 | 207,977 | |
| Class C, 1 month U.S. LIBOR + 1.100% 2.424% 3/15/38 (a)(b)(c) | 136,648 | 130,470 | |
| Class D, 1 month U.S. LIBOR + 1.400% 2.724% 3/15/38 (a)(b)(c) | 190,097 | 180,548 | |
| Class E, 1 month U.S. LIBOR + 1.750% 3.074% 3/15/38 (a)(b)(c) | 166,149 | 154,884 | |
| MHC Commercial Mortgage Trust floater sequential payer Series 2021-MHC Class A, 1 month U.S. LIBOR + 0.800% 2.125% 4/15/38 (a)(b)(c) | 1,033,385 | 1,006,885 | |
| Morgan Stanley BAML Trust Series 2015-C20 Class A4, 3.249% 2/15/48 | 403,691 | 394,201 | |
| Morgan Stanley Capital I Trust: | |||
| floater Series 2018-BOP: | |||
| Class B, 1 month U.S. LIBOR + 1.250% 2.574% 8/15/33 (a)(b)(c) | 438,631 | 433,058 | |
| Class C, 1 month U.S. LIBOR + 1.500% 2.824% 8/15/33 (a)(b)(c) | 1,056,452 | 1,039,700 | |
| sequential payer: | |||
| Series 2019-MEAD Class A, 3.17% 11/10/36 (a) | 1,052,468 | 992,243 | |
| Series 2020-L4 Class A3, 2.698% 2/15/53 | 487,766 | 435,313 | |
| Series 2021-L6 Class A4, 2.444% 6/15/54 (b) | 5,000,000 | 4,273,220 | |
| Series 2018-H4 Class A4, 4.31% 12/15/51 | 775,945 | 767,668 | |
| Series 2019-MEAD: | |||
| Class B, 3.283% 11/10/36 (a)(b) | 152,075 | 141,059 | |
| Class C, 3.283% 11/10/36 (a)(b) | 145,921 | 132,353 | |
| Natixis Commercial Mortgage Securities Trust sequential payer Series 2020-2PAC Class A, 2.966% 12/15/38 (a) | 1,511,042 | 1,443,424 | |
| OPG Trust floater Series 2021-PORT Class A, 1 month U.S. LIBOR + 0.480% 1.808% 10/15/36 (a)(b)(c) | 1,911,354 | 1,798,395 | |
| Prima Capital Ltd. floater sequential payer Series 2021-9A Class A, 1 month U.S. LIBOR + 1.450% 2.3773% 12/15/37 (a)(b)(c) | 57,034 | 57,034 | |
| Providence Place Group Ltd. Partnership Series 2000-C1 Class A2, 7.75% 7/20/28 (a) | 294,776 | 319,140 | |
| SPGN Mortgage Trust floater Series 2022-TFLM: | |||
| Class B, CME TERM SOFR 1 MONTH INDEX + 2.000% 3.2787% 2/15/39 (a)(b)(c) | 263,000 | 250,846 | |
| Class C, CME TERM SOFR 1 MONTH INDEX + 2.650% 3.9287% 2/15/39 (a)(b)(c) | 137,000 | 130,541 | |
| SREIT Trust floater: | |||
| Series 2021-FLWR Class A, 1 month U.S. LIBOR + 0.570% 1.9006% 7/15/36 (a)(b)(c) | 813,932 | 773,051 | |
| Series 2021-MFP: | |||
| Class A, 1 month U.S. LIBOR + 0.730% 2.0548% 11/15/38 (a)(b)(c) | 1,011,403 | 960,608 | |
| Class B, 1 month U.S. LIBOR + 1.070% 2.4038% 11/15/38 (a)(b)(c) | 579,290 | 545,833 | |
| Class C, 1 month U.S. LIBOR + 1.320% 2.653% 11/15/38 (a)(b)(c) | 359,780 | 337,195 | |
| Class D, 1 month U.S. LIBOR + 1.570% 2.9022% 11/15/38 (a)(b)(c) | 236,463 | 221,026 | |
| VLS Commercial Mortgage Trust sequential payer Series 2020-LAB Class A, 2.13% 10/10/42 (a) | 723,328 | 595,259 | |
| Wells Fargo Commercial Mortgage Trust: | |||
| floater Series 2021-FCMT Class A, 1 month U.S. LIBOR + 1.200% 2.524% 5/15/31 (a)(b)(c) | 552,000 | 527,124 | |
| sequential payer: | |||
| Series 2015-C26 Class A4, 3.166% 2/15/48 | 420,434 | 410,632 | |
| Series 2019-C52 Class A5, 2.892% 8/15/52 | 887,720 | 807,894 | |
| Series 2019-C54 Class A4, 3.146% 12/15/52 | 63,390 | 58,403 | |
| Series 2020-C55 Class A5, 2.725% 2/15/53 | 438,989 | 391,625 | |
| Series 2018-C48 Class A5, 4.302% 1/15/52 | 884,202 | 882,653 | |
| WF-RBS Commercial Mortgage Trust Series 2014-C25 Class A5, 3.631% 11/15/47 | 396,151 | 391,324 | |
| TOTAL COMMERCIAL MORTGAGE SECURITIES | |||
| (Cost $124,053,524) | 123,068,513 | ||
| Municipal Securities - 0.7% | |||
| American Muni. Pwr., Inc. Rev. (Combined Hydroelectric Proj.) Series 2010 B, 8.084% 2/15/50 | 265,000 | 388,851 | |
| Bay Area Toll Auth. San Francisco Bay Toll Bridge Rev.: | |||
| Series 2009 F2, 6.263% 4/1/49 | $130,000 | $165,894 | |
| Series 2010 S1, 7.043% 4/1/50 | 195,000 | 268,041 | |
| California Gen. Oblig.: | |||
| Series 2009: | |||
| 7.35% 11/1/39 | 100,000 | 130,264 | |
| 7.55% 4/1/39 | 1,130,000 | 1,532,831 | |
| Series 2010, 7.6% 11/1/40 | 355,000 | 490,220 | |
| Series 2018, 3.5% 4/1/28 | 355,000 | 350,740 | |
| California State Univ. Rev. Series 2021 B, 2.719% 11/1/52 | 235,000 | 174,788 | |
| Chicago Gen. Oblig. (Taxable Proj.) Series 2010 C1, 7.781% 1/1/35 | 370,000 | 436,987 | |
| Chicago O'Hare Int'l. Arpt. Rev. Series 2010 B, 6.395% 1/1/40 | 250,000 | 308,306 | |
| Commonwealth Fing. Auth. Rev. Series 2016 A, 4.144% 6/1/38 | 210,000 | 206,865 | |
| Dallas Area Rapid Transit Sales Tax Rev. Series 2021 A, 2.613% 12/1/48 | 435,000 | 320,193 | |
| Dallas Fort Worth Int'l. Arpt. Rev.: | |||
| Series 2019 A, 3.144% 11/1/45 | 65,000 | 52,642 | |
| Series 2021 C, 2.843% 11/1/46 | 400,000 | 310,990 | |
| Series 2022 A, 4.507% 11/1/51 | 155,000 | 150,654 | |
| Golden State Tobacco Securitization Corp. Tobacco Settlement Rev. Series 2021 B: | |||
| 2.746% 6/1/34 | 175,000 | 150,856 | |
| 3.293% 6/1/42 | 85,000 | 68,562 | |
| Idaho Energy Resources Auth. Series 2021, 2.861% 9/1/46 | 100,000 | 77,196 | |
| Illinois Gen. Oblig.: | |||
| Series 2003: | |||
| 4.95% 6/1/23 | 169,091 | 170,338 | |
| 5.1% 6/1/33 | 1,355,000 | 1,363,251 | |
| Series 2010-1, 6.63% 2/1/35 | 1,545,000 | 1,645,281 | |
| Series 2010-3: | |||
| 6.725% 4/1/35 | 1,190,000 | 1,260,880 | |
| 7.35% 7/1/35 | 695,000 | 758,104 | |
| Kansas St Dev. Fin. Auth. Rev. Series 2015 H, 4.927% 4/15/45 | 210,000 | 220,118 | |
| Los Angeles Cmnty. College District Series 2008 E, 6.75% 8/1/49 | 260,000 | 358,048 | |
| Los Angeles Dept. Arpt. Rev. Series 2009 C, 6.582% 5/15/39 | 130,000 | 149,109 | |
| Massachusetts Gen. Oblig. Series F, 3.277% 6/1/46 | 130,000 | 108,924 | |
| Massachusetts Wtr. Resources Auth. Wtr. & Swr. Rev. Series 2021 C, 2.823% 8/1/41 | 155,000 | 127,781 | |
| Michigan Strategic Fund Ltd. Oblig. Rev. Series 2021 A, 3.225% 9/1/47 | 235,000 | 181,684 | |
| New Jersey Econ. Dev. Auth. State Pension Fdg. Rev. Series 1997, 7.425% 2/15/29 (Nat'l. Pub. Fin. Guarantee Corp. Insured) | 942,000 | 1,058,308 | |
| New Jersey Tpk. Auth. Tpk. Rev. Series 2009 E, 7.414% 1/1/40 | 129,000 | 171,197 | |
| New Jersey Trans. Trust Fund Auth. Series B: | |||
| 4.081% 6/15/39 | 395,000 | 355,361 | |
| 4.131% 6/15/42 | 395,000 | 343,037 | |
| New York City Muni. Wtr. Fin. Auth. Wtr. & Swr. Sys. Rev. Series 2010 DD, 5.952% 6/15/42 | 245,000 | 296,783 | |
| New York City Transitional Fin. Auth. Rev. Series 2011 A, 5.508% 8/1/37 | 295,000 | 324,286 | |
| New York Metropolitan Trans. Auth. Rev. Series 2010 A, 6.668% 11/15/39 | 170,000 | 203,125 | |
| New York State Dorm. Auth. Series 2021 C, 2.202% 3/15/34 | 560,000 | 457,186 | |
| Port Auth. of New York & New Jersey: | |||
| Series 180, 4.96% 8/1/46 | 140,000 | 145,922 | |
| Series 2010 164, 5.647% 11/1/40 | 145,000 | 162,400 | |
| Series 225, 3.175% 7/15/60 | 635,000 | 474,973 | |
| Port of Morrow Transmission Facilities Rev. (Bonneville Coorporation Proj.) Series 2016 1, 2.987% 9/1/36 | 155,000 | 133,322 | |
| San Francisco Pub. Utils. Commission Wtr. Rev. Series 2010 E, 6% 11/1/40 | 175,000 | 200,975 | |
| South Carolina Pub. Svc. Auth. Rev. Series 2013 C, 5.784% 12/1/41 | 310,000 | 346,628 | |
| Univ. of California Regents Med. Ctr. Pool Rev. Series N: | |||
| 3.006% 5/15/50 | 360,000 | 271,597 | |
| 3.256% 5/15/60 | 365,000 | 271,308 | |
| Univ. of California Revs.: | |||
| Series 2009 R, 5.77% 5/15/43 | 30,000 | 34,241 | |
| Series 2015 AP, 3.931% 5/15/45 | 105,000 | 98,607 | |
| Univ. of Virginia Gen. Rev.: | |||
| (Multi-Year Cap. Proj. Fing. Prog.) Series 2017 C, 4.179% 9/1/2117 | 130,000 | 112,507 | |
| Series 2021 B, 2.584% 11/1/51 | 65,000 | 47,815 | |
| TOTAL MUNICIPAL SECURITIES | |||
| (Cost $17,711,579) | 17,437,976 | ||
| Foreign Government and Government Agency Obligations - 0.8% | |||
| Alberta Province: | |||
| 1% 5/20/25 | $968,000 | $908,613 | |
| 3.3% 3/15/28 | 274,000 | 271,690 | |
| British Columbia Province 2.25% 6/2/26 | 654,000 | 628,324 | |
| Canadian Government 2% 11/15/22 | 130,000 | 129,877 | |
| Chilean Republic: | |||
| 2.55% 7/27/33 | 854,000 | 697,291 | |
| 3.24% 2/6/28 | 318,000 | 299,477 | |
| 3.625% 10/30/42 | 358,000 | 287,250 | |
| Emirate of Abu Dhabi 3.875% 4/16/50 (a) | 716,000 | 636,927 | |
| Export Development Canada 2.625% 2/21/24 | 320,000 | 318,544 | |
| Hungarian Republic: | |||
| 5.75% 11/22/23 | 518,000 | 528,619 | |
| 7.625% 3/29/41 | 200,000 | 231,413 | |
| Indonesian Republic: | |||
| 2.85% 2/14/30 | 961,000 | 855,470 | |
| 3.5% 2/14/50 | 734,000 | 577,933 | |
| Israeli State: | |||
| 3.25% 1/17/28 | 395,000 | 384,631 | |
| 3.375% 1/15/50 | 813,000 | 655,722 | |
| Italian Republic: | |||
| 2.875% 10/17/29 | 734,000 | 644,166 | |
| 6.875% 9/27/23 | 165,000 | 171,191 | |
| Kingdom of Saudi Arabia: | |||
| 3.25% 10/22/30 (a) | 396,000 | 372,240 | |
| 4.5% 4/22/60 (a) | 301,000 | 276,920 | |
| Manitoba Province: | |||
| 2.1% 9/6/22 | 52,000 | 52,028 | |
| 3.05% 5/14/24 | 41,000 | 40,871 | |
| Ontario Province: | |||
| 0.625% 1/21/26 | 70,000 | 63,719 | |
| 1.125% 10/7/30 | 658,000 | 547,305 | |
| 2.3% 6/15/26 | 391,000 | 375,376 | |
| 2.5% 4/27/26 | 137,000 | 133,174 | |
| 3.05% 1/29/24 | 320,000 | 319,056 | |
| Panamanian Republic: | |||
| 3.16% 1/23/30 | 517,000 | 460,550 | |
| 4.5% 4/16/50 | 353,000 | 288,423 | |
| 4.5% 4/1/56 | 547,000 | 435,651 | |
| Peruvian Republic: | |||
| 1.862% 12/1/32 | 689,000 | 523,985 | |
| 2.392% 1/23/26 | 133,000 | 123,590 | |
| 2.78% 12/1/60 | 113,000 | 69,834 | |
| 2.844% 6/20/30 | 448,000 | 390,544 | |
| 3.55% 3/10/51 | 517,000 | 385,424 | |
| 4.125% 8/25/27 | 396,000 | 388,278 | |
| 6.55% 3/14/37 | 84,000 | 91,681 | |
| 7.35% 7/21/25 | 133,000 | 143,499 | |
| Polish Government: | |||
| 3.25% 4/6/26 | 181,000 | 175,491 | |
| 4% 1/22/24 | 992,000 | 991,566 | |
| Quebec Province: | |||
| 1.5% 2/11/25 | 791,000 | 757,984 | |
| 2.5% 4/20/26 | 322,000 | 312,498 | |
| 2.75% 4/12/27 | 350,000 | 341,278 | |
| 2.875% 10/16/24 | 57,000 | 56,657 | |
| State of Qatar 4.4% 4/16/50 (a) | 893,000 | 856,164 | |
| United Mexican States: | |||
| 3.25% 4/16/30 | 366,000 | 321,920 | |
| 3.5% 2/12/34 | 1,114,000 | 921,278 | |
| 4.28% 8/14/41 | 1,201,000 | 950,892 | |
| 4.35% 1/15/47 | 395,000 | 301,262 | |
| 4.5% 1/31/50 | 254,000 | 197,374 | |
| 4.6% 2/10/48 | 481,000 | 381,132 | |
| 4.75% 3/8/44 | 266,000 | 220,331 | |
| 5.55% 1/21/45 | 107,000 | 98,193 | |
| 6.05% 1/11/40 | 132,000 | 129,632 | |
| Uruguay Republic: | |||
| 4.125% 11/20/45 | 130,228 | 119,346 | |
| 4.375% 10/27/27 | 33,363 | 33,745 | |
| 4.375% 1/23/31 | 434,418 | 439,115 | |
| 4.975% 4/20/55 | 321,625 | 317,062 | |
| TOTAL FOREIGN GOVERNMENT AND GOVERNMENT AGENCY OBLIGATIONS | |||
| (Cost $22,611,946) | 21,632,206 | ||
| Supranational Obligations - 0.7% | |||
| African Development Bank 0.875% 7/22/26 | 419,000 | 382,044 | |
| Asian Development Bank: | |||
| 0.375% 9/3/25 | 1,103,000 | 1,010,336 | |
| 0.5% 2/4/26 | 611,000 | 555,645 | |
| 0.75% 10/8/30 | 534,000 | 440,427 | |
| 1.5% 10/18/24 | 617,000 | 595,478 | |
| 2% 4/24/26 | 173,000 | 165,886 | |
| 2.5% 11/2/27 | 184,000 | 177,908 | |
| 2.625% 1/30/24 | 412,000 | 409,362 | |
| 2.625% 1/12/27 | 178,000 | 174,150 | |
| 2.75% 1/19/28 | 1,032,000 | 1,008,254 | |
| Corporacion Andina de Fomento 2.375% 5/12/23 | 741,000 | 735,939 | |
| European Investment Bank: | |||
| 0.75% 9/23/30 | 762,000 | 632,026 | |
| 0.875% 5/17/30 | 183,000 | 154,396 | |
| 1.25% 2/14/31 | 331,000 | 283,691 | |
| 1.375% 5/15/23 | 667,000 | 658,189 | |
| 1.875% 2/10/25 | 82,000 | 79,528 | |
| 2.25% 8/15/22 | 52,000 | 52,013 | |
| 2.25% 6/24/24 | 620,000 | 610,814 | |
| 2.375% 5/24/27 | 110,000 | 106,160 | |
| 2.5% 10/15/24 | 157,000 | 155,088 | |
| 2.875% 8/15/23 | 290,000 | 289,663 | |
| 3.125% 12/14/23 | 378,000 | 378,457 | |
| 3.25% 1/29/24 | 55,000 | 55,176 | |
| Inter-American Development Bank: | |||
| 0.625% 7/15/25 | 607,000 | 562,129 | |
| 0.875% 4/20/26 | 1,388,000 | 1,274,711 | |
| 1.75% 3/14/25 | 505,000 | 487,305 | |
| 2% 6/2/26 | 110,000 | 105,232 | |
| 2.125% 1/15/25 | 50,000 | 48,790 | |
| 2.25% 6/18/29 | 524,000 | 492,418 | |
| 2.375% 7/7/27 | 184,000 | 176,797 | |
| 3% 10/4/23 | 98,000 | 97,918 | |
| 4.375% 1/24/44 | 239,000 | 263,678 | |
| International Bank for Reconstruction & Development: | |||
| 0.375% 7/28/25 | 717,000 | 659,399 | |
| 0.5% 10/28/25 | 905,000 | 829,853 | |
| 0.75% 8/26/30 | 454,000 | 374,877 | |
| 0.875% 5/14/30 | 555,000 | 465,536 | |
| 1.25% 2/10/31 | 497,000 | 424,718 | |
| 1.5% 8/28/24 | 543,000 | 525,633 | |
| 1.625% 1/15/25 | 488,000 | 471,056 | |
| 1.875% 6/19/23 | 374,000 | 370,244 | |
| 1.875% 10/27/26 | 130,000 | 123,392 | |
| 2.5% 3/19/24 | 104,000 | 103,100 | |
| 2.5% 11/25/24 | 156,000 | 153,911 | |
| 2.5% 7/29/25 | 104,000 | 102,001 | |
| 2.5% 3/29/32 | 1,000,000 | 936,786 | |
| International Finance Corp.: | |||
| 0.75% 8/27/30 | 303,000 | 252,743 | |
| 2.875% 7/31/23 | 118,000 | 117,985 | |
| TOTAL SUPRANATIONAL OBLIGATIONS | |||
| (Cost $18,798,097) | 18,530,842 | ||
| Bank Notes - 0.2% | |||
| Citibank NA 3.65% 1/23/24 | 685,000 | 686,983 | |
| Citizens Bank NA: | |||
| 2.25% 4/28/25 | $359,000 | $341,937 | |
| 3.75% 2/18/26 | 370,000 | 363,330 | |
| Discover Bank: | |||
| 3.35% 2/6/23 | 403,000 | 403,015 | |
| 3.45% 7/27/26 | 350,000 | 330,665 | |
| 4.682% 8/9/28 (b) | 347,000 | 337,336 | |
| Regions Bank 6.45% 6/26/37 | 969,000 | 1,077,074 | |
| Truist Bank 3.3% 5/15/26 | 208,000 | 200,482 | |
| U.S. Bank NA, Cincinnati 3.4% 7/24/23 | 274,000 | 273,769 | |
| TOTAL BANK NOTES | |||
| (Cost $4,127,162) | 4,014,591 | ||
| Shares | Value | ||
| Fixed-Income Funds - 0.5% | |||
| Fidelity Specialized High Income Central Fund (h) | |||
| (Cost $14,642,894) | 166,580 | 13,607,882 | |
| Money Market Funds - 2.4% | |||
| Fidelity Cash Central Fund 1.58% (i) | |||
| (Cost $64,292,399) | 64,279,543 | 64,292,399 | |
| TOTAL INVESTMENT IN SECURITIES - 108.0% | |||
| (Cost $2,923,399,047) | 2,860,822,360 | ||
| NET OTHER ASSETS (LIABILITIES) - (8.0)% | (212,274,080) | ||
| NET ASSETS - 100% | $2,648,548,280 |
| TBA Sale Commitments | ||
| Principal Amount | Value | |
| Uniform Mortgage Backed Securities | ||
| 1.5% 7/1/37 | $(8,500,000) | $(7,734,112) |
| 2% 7/1/52 | (450,000) | (390,473) |
| 2% 7/1/52 | (15,650,000) | (13,579,799) |
| 2% 7/1/52 | (45,100,000) | (39,134,118) |
| 2% 7/1/52 | (2,200,000) | (1,908,981) |
| 2% 7/1/52 | (10,900,000) | (9,458,135) |
| 2% 7/1/52 | (1,750,000) | (1,518,508) |
| 2.5% 7/1/52 | (11,850,000) | (10,650,182) |
| 2.5% 7/1/52 | (22,600,000) | (20,311,739) |
| 3% 7/1/52 | (5,400,000) | (5,025,794) |
| 3% 7/1/52 | (1,900,000) | (1,768,335) |
| 3.5% 7/1/52 | (4,000,000) | (3,845,467) |
| 4% 7/1/52 | (425,000) | (418,957) |
| 4% 7/1/52 | (400,000) | (394,311) |
| TOTAL TBA SALE COMMITMENTS | ||
| (Proceeds $114,108,545) | $(116,138,911) |
| Futures Contracts | |||||
| Number of contracts | Expiration Date | Notional Amount | Value | Unrealized Appreciation/(Depreciation) | |
| Purchased | |||||
| Treasury Contracts | |||||
| CBOT 5-Year U.S. Treasury Note Contracts (United States) | 84 | Sept. 2022 | $9,429,000 | $(3,245) | $(3,245) |
| Sold | |||||
| Treasury Contracts | |||||
| CBOT 10-Year U.S. Treasury Note Contracts (United States) | 222 | Sept. 2022 | 26,313,938 | (669,129) | (669,129) |
| CBOT 2-Year U.S. Treasury Note Contracts (United States) | 7 | Sept. 2022 | 1,470,109 | (5,152) | (5,152) |
| CBOT Long Term U.S. Treasury Bond Contracts (United States) | 94 | Sept. 2022 | 13,030,750 | (4,331) | (4,331) |
| TOTAL SOLD | (678,612) | ||||
| TOTAL FUTURES CONTRACTS | $(681,857) |
The notional amount of futures purchased as a percentage of Net Assets is 0.4%
The notional amount of futures sold as a percentage of Net Assets is 1.6%
Swaps
| Underlying Reference | Rating | Maturity Date | Clearinghouse / Counterparty | Fixed Payment Received/(Paid) | Payment Frequency | Notional Amount | Value | Upfront Premium Received/(Paid) | Unrealized Appreciation/(Depreciation) |
| Credit Default Swaps | |||||||||
| Buy Protection | |||||||||
| CMBX N.A. AAA Index Series 13 | Dec. 2072 | Morgan Stanley Capital Services LLC | (0.5%) | Monthly | $6,230,000 | $109,566 | $(93,649) | $15,917 | |
| CMBX N.A. AAA Index Series 13 | Dec. 2072 | Morgan Stanley Capital Services LLC | (0.5%) | Monthly | 990,000 | 17,411 | (16,460) | 951 | |
| TOTAL CREDIT DEFAULT SWAPS | $126,977 | $(110,109) | $16,868 | ||||||
Legend
(a) Security exempt from registration under Rule 144A of the Securities Act of 1933. These securities may be resold in transactions exempt from registration, normally to qualified institutional buyers. At the end of the period, the value of these securities amounted to $223,262,328 or 8.4% of net assets.
(b) Coupon rates for floating and adjustable rate securities reflect the rates in effect at period end.
(c) Coupon is indexed to a floating interest rate which may be multiplied by a specified factor and/or subject to caps or floors.
(d) Security or a portion of the security was pledged to cover margin requirements for futures contracts. At period end, the value of securities pledged amounted to $845,421.
(e) Security or a portion of the security has been segregated as collateral for mortgage-backed or asset-backed securities purchased on a delayed delivery or when-issued basis. At period end, the value of securities pledged amounted to $4,245,073.
(f) Security or a portion of the security purchased on a delayed delivery or when-issued basis.
(g) Represents an investment in an underlying pool of reverse mortgages which typically do not require regular principal and interest payments as repayment is deferred until a maturity event.
(h) Affiliated fund that is generally available only to investment companies and other accounts managed by Fidelity Investments. A complete unaudited schedule of portfolio holdings for each Fidelity Central Fund is filed with the SEC for the first and third quarters of each fiscal year on Form N-PORT and is available upon request or at the SEC's website at www.sec.gov. An unaudited holdings listing for the Fund, which presents direct holdings as well as the pro-rata share of securities and other investments held indirectly through its investment in underlying non-money market Fidelity Central Funds, is available at fidelity.com and/or institutional.fidelity.com, as applicable. In addition, each Fidelity Central Fund's financial statements are available on the SEC's website or upon request.
(i) Affiliated fund that is generally available only to investment companies and other accounts managed by Fidelity Investments. The rate quoted is the annualized seven-day yield of the fund at period end. A complete unaudited listing of the fund's holdings as of its most recent quarter end is available upon request. In addition, each Fidelity Central Fund's financial statements are available on the SEC's website or upon request.
Affiliated Central Funds
Fiscal year to date information regarding the Fund's investments in Fidelity Central Funds, including the ownership percentage, is presented below.
| Fund | Value, beginning of period | Purchases | Sales Proceeds | Dividend Income | Realized Gain/Loss | Change in Unrealized appreciation (depreciation) | Value, end of period | % ownership, end of period |
| Fidelity Cash Central Fund 1.58% | $-- | $396,964,629 | $332,672,230 | $73,328 | $-- | $-- | $64,292,399 | 0.1% |
| Fidelity Specialized High Income Central Fund | -- | 14,642,894 | -- | 60,053 | -- | (1,035,012) | 13,607,882 | 4.2% |
| Total | $-- | $411,607,523 | $332,672,230 | $133,381 | $-- | $(1,035,012) | $77,900,281 |
Amounts in the income column in the above table include any capital gain distributions from underlying funds, which are presented in the corresponding line-item in the Statement of Operations, if applicable.
Investment Valuation
The following is a summary of the inputs used, as of June 30, 2022, involving the Fund's assets and liabilities carried at fair value. The inputs or methodology used for valuing securities may not be an indication of the risk associated with investing in those securities. For more information on valuation inputs, and their aggregation into the levels used below, please refer to the Investment Valuation section in the accompanying Notes to Financial Statements.
| Valuation Inputs at Reporting Date: | ||||
| Description | Total | Level 1 | Level 2 | Level 3 |
| Investments in Securities: | ||||
| Corporate Bonds | $823,485,565 | $-- | $823,485,565 | $-- |
| U.S. Government and Government Agency Obligations | 1,056,820,887 | -- | 1,056,820,887 | -- |
| U.S. Government Agency - Mortgage Securities | 621,118,226 | -- | 621,118,226 | -- |
| Asset-Backed Securities | 84,050,235 | -- | 84,050,235 | -- |
| Collateralized Mortgage Obligations | 12,763,038 | -- | 12,763,038 | -- |
| Commercial Mortgage Securities | 123,068,513 | -- | 123,068,513 | -- |
| Municipal Securities | 17,437,976 | -- | 17,437,976 | -- |
| Foreign Government and Government Agency Obligations | 21,632,206 | -- | 21,632,206 | -- |
| Supranational Obligations | 18,530,842 | -- | 18,530,842 | -- |
| Bank Notes | 4,014,591 | -- | 4,014,591 | -- |
| Fixed-Income Funds | 13,607,882 | 13,607,882 | -- | -- |
| Money Market Funds | 64,292,399 | 64,292,399 | -- | -- |
| Total Investments in Securities: | $2,860,822,360 | $77,900,281 | $2,782,922,079 | $-- |
| Derivative Instruments: | ||||
| Assets | ||||
| Swaps | $126,977 | $-- | $126,977 | $-- |
| Total Assets | $126,977 | $-- | $126,977 | $-- |
| Liabilities | ||||
| Futures Contracts | $(681,857) | $(681,857) | $-- | $-- |
| Total Liabilities | $(681,857) | $(681,857) | $-- | $-- |
| Total Derivative Instruments: | $(554,880) | $(681,857) | $126,977 | $-- |
| Other Financial Instruments: | ||||
| TBA Sale Commitments | $(116,138,911) | $-- | $(116,138,911) | $-- |
| Total Other Financial Instruments: | $(116,138,911) | $-- | $(116,138,911) | $-- |
Value of Derivative Instruments
The following table is a summary of the Fund's value of derivative instruments by primary risk exposure as of June 30, 2022. For additional information on derivative instruments, please refer to the Derivative Instruments section in the accompanying Notes to Financial Statements.
| Primary Risk Exposure / Derivative Type | Value | |
| Asset | Liability | |
| Credit Risk | ||
| Swaps(a) | $126,977 | $0 |
| Total Credit Risk | 126,977 | 0 |
| Interest Rate Risk | ||
| Futures Contracts(b) | 0 | (681,857) |
| Total Interest Rate Risk | 0 | (681,857) |
| Total Value of Derivatives | $126,977 | $(681,857) |
(a) For bi-lateral over-the-counter (OTC) swaps, reflects gross value which is presented in the Statement of Assets and Liabilities in the bi-lateral OTC swaps, at value line-items.
(b) Reflects gross cumulative appreciation (depreciation) on futures contracts as presented in the Schedule of Investments. In the Statement of Assets and Liabilities, the period end daily variation margin is included in receivable or payable for daily variation margin on futures contracts, and the net cumulative appreciation (depreciation) is included in Total accumulated earnings (loss).
See accompanying notes which are an integral part of the financial statements.
Financial Statements
Statement of Assets and Liabilities
| June 30, 2022 (Unaudited) | ||
| Assets | ||
| Investment in securities, at value — See accompanying schedule: Unaffiliated issuers (cost $2,844,463,754) | $2,782,922,079 | |
| Fidelity Central Funds (cost $78,935,293) | 77,900,281 | |
| Total Investment in Securities (cost $2,923,399,047) | $2,860,822,360 | |
| Cash | 9,648 | |
| Receivable for investments sold | 7,741 | |
| Receivable for TBA sale commitments | 114,108,545 | |
| Receivable for fund shares sold | 36,208,108 | |
| Interest receivable | 14,962,355 | |
| Distributions receivable from Fidelity Central Funds | 72,000 | |
| Bi-lateral OTC swaps, at value | 126,977 | |
| Total assets | 3,026,317,734 | |
| Liabilities | ||
| Payable for investments purchased | ||
| Regular delivery | $1,630,045 | |
| Delayed delivery | 234,167,848 | |
| TBA sale commitments, at value | 116,138,911 | |
| Payable for fund shares redeemed | 24,527,715 | |
| Accrued management fee | 652,441 | |
| Payable for daily variation margin on futures contracts | 361,087 | |
| Other affiliated payables | 278,886 | |
| Other payables and accrued expenses | 12,521 | |
| Total liabilities | 377,769,454 | |
| Net Assets | $2,648,548,280 | |
| Net Assets consist of: | ||
| Paid in capital | $2,712,831,342 | |
| Total accumulated earnings (loss) | (64,283,062) | |
| Net Assets | $2,648,548,280 | |
| Net Asset Value and Maximum Offering Price | ||
| Initial Class: | ||
| Net Asset Value, offering price and redemption price per share ($513,191,758 ÷ 52,569,653 shares) | $9.76 | |
| Investor Class: | ||
| Net Asset Value, offering price and redemption price per share ($2,135,356,522 ÷ 218,742,206 shares) | $9.76 |
See accompanying notes which are an integral part of the financial statements.
Statement of Operations
| For the period May 27, 2022 (commencement of operations) through June 30, 2022 (Unaudited) |
||
| Investment Income | ||
| Interest | $7,611,981 | |
| Income from Fidelity Central Funds | 133,381 | |
| Total income | 7,745,362 | |
| Expenses | ||
| Management fee | $684,751 | |
| Transfer agent fees | 218,544 | |
| Accounting fees and expenses | 74,344 | |
| Custodian fees and expenses | 2,004 | |
| Independent trustees' fees and expenses | 259 | |
| Audit | 6,095 | |
| Miscellaneous | 111 | |
| Total expenses | 986,108 | |
| Net investment income (loss) | 6,759,254 | |
| Realized and Unrealized Gain (Loss) | ||
| Net realized gain (loss) on: | ||
| Investment securities: | ||
| Unaffiliated issuers | (5,565,432) | |
| Futures contracts | (203,808) | |
| Swaps | (1,034) | |
| Total net realized gain (loss) | (5,770,274) | |
| Change in net unrealized appreciation (depreciation) on: | ||
| Investment securities: | ||
| Unaffiliated issuers | (61,541,675) | |
| Fidelity Central Funds | (1,035,012) | |
| Futures contracts | (681,857) | |
| Swaps | 16,868 | |
| TBA sale commitments | (2,030,366) | |
| Total change in net unrealized appreciation (depreciation) | (65,272,042) | |
| Net gain (loss) | (71,042,316) | |
| Net increase (decrease) in net assets resulting from operations | $(64,283,062) |
See accompanying notes which are an integral part of the financial statements.
Statement of Changes in Net Assets
| For the period May 27, 2022 (commencement of operations) through June 30, 2022 (Unaudited) |
|
| Increase (Decrease) in Net Assets | |
| Operations | |
| Net investment income (loss) | $6,759,254 |
| Net realized gain (loss) | (5,770,274) |
| Change in net unrealized appreciation (depreciation) | (65,272,042) |
| Net increase (decrease) in net assets resulting from operations | (64,283,062) |
| Share transactions - net increase (decrease) | 2,712,831,342 |
| Total increase (decrease) in net assets | 2,648,548,280 |
| Net Assets | |
| Beginning of period | – |
| End of period | $2,648,548,280 |
See accompanying notes which are an integral part of the financial statements.
Financial Highlights
VIP Investment Grade Bond II Portfolio Initial Class
| Six months ended (Unaudited) June 30, | |
| 2022 A | |
| Selected Per–Share Data | |
| Net asset value, beginning of period | $10.00 |
| Income from Investment Operations | |
| Net investment income (loss)B,C | .025 |
| Net realized and unrealized gain (loss) | (.265) |
| Total from investment operations | (.240) |
| Net asset value, end of period | $9.76 |
| Total ReturnD,E | (2.40)% |
| Ratios to Average Net AssetsC,F,G | |
| Expenses before reductions | .38%H |
| Expenses net of fee waivers, if any | .38%H |
| Expenses net of all reductions | .38%H |
| Net investment income (loss) | 2.83%H |
| Supplemental Data | |
| Net assets, end of period (000 omitted) | $513,192 |
| Portfolio turnover rateI | 57%J,K |
A For the period May 27, 2022 (commencement of operations) through June 30, 2022.
B Calculated based on average shares outstanding during the period.
C Net investment income (loss) is affected by the timing of the declaration of dividends by any underlying mutual funds or exchange-traded funds (ETFs). Net investment income (loss) of any such underlying funds is not included in the Fund's net investment income (loss) ratio.
D Total returns for periods of less than one year are not annualized.
E Total returns do not reflect charges attributable to your insurance company's separate account. Inclusion of these charges would reduce the total returns shown.
F Fees and expenses of any underlying mutual funds or exchange-traded funds (ETFs) are not included in the Fund's expense ratio. The Fund indirectly bears its proportionate share of these expenses. For additional expense information related to investments in Fidelity Central Funds, please refer to the "Investments in Fidelity Central Funds" note found in the Notes to Financial Statements section of the most recent Annual or Semi-Annual report.
G Expense ratios reflect operating expenses of the class. Expenses before reductions do not reflect amounts reimbursed, waived, or reduced through arrangements with the investment adviser, brokerage services, or other offset arrangements, if applicable, and do not represent the amount paid by the class during periods when reimbursements, waivers or reductions occur.
H Annualized
I Amount does not include the portfolio activity of any underlying mutual funds or exchange-traded funds (ETFs).
J Portfolio turnover rate excludes securities received or delivered in-kind.
K Amount not annualized.
See accompanying notes which are an integral part of the financial statements.
VIP Investment Grade Bond II Portfolio Investor Class
| Six months ended (Unaudited) June 30, | |
| 2022 A | |
| Selected Per–Share Data | |
| Net asset value, beginning of period | $10.00 |
| Income from Investment Operations | |
| Net investment income (loss)B,C | .025 |
| Net realized and unrealized gain (loss) | (.265) |
| Total from investment operations | (.240) |
| Net asset value, end of period | $9.76 |
| Total ReturnD,E | (2.40)% |
| Ratios to Average Net AssetsC,F,G | |
| Expenses before reductions | .42%H |
| Expenses net of fee waivers, if any | .42%H |
| Expenses net of all reductions | .42%H |
| Net investment income (loss) | 2.79%H |
| Supplemental Data | |
| Net assets, end of period (000 omitted) | $2,135,357 |
| Portfolio turnover rateI | 57%J,K |
A For the period May 27, 2022 (commencement of operations) through June 30, 2022.
B Calculated based on average shares outstanding during the period.
C Net investment income (loss) is affected by the timing of the declaration of dividends by any underlying mutual funds or exchange-traded funds (ETFs). Net investment income (loss) of any such underlying funds is not included in the Fund's net investment income (loss) ratio.
D Total returns for periods of less than one year are not annualized.
E Total returns do not reflect charges attributable to your insurance company's separate account. Inclusion of these charges would reduce the total returns shown.
F Fees and expenses of any underlying mutual funds or exchange-traded funds (ETFs) are not included in the Fund's expense ratio. The Fund indirectly bears its proportionate share of these expenses. For additional expense information related to investments in Fidelity Central Funds, please refer to the "Investments in Fidelity Central Funds" note found in the Notes to Financial Statements section of the most recent Annual or Semi-Annual report.
G Expense ratios reflect operating expenses of the class. Expenses before reductions do not reflect amounts reimbursed, waived, or reduced through arrangements with the investment adviser, brokerage services, or other offset arrangements, if applicable, and do not represent the amount paid by the class during periods when reimbursements, waivers or reductions occur.
H Annualized
I Amount does not include the portfolio activity of any underlying mutual funds or exchange-traded funds (ETFs).
J Portfolio turnover rate excludes securities received or delivered in-kind.
K Amount not annualized.
See accompanying notes which are an integral part of the financial statements.
Notes to Financial Statements (Unaudited)
For the period ended June 30, 2022
1. Organization.
VIP Investment Grade Bond II Portfolio (the Fund) is a fund of Variable Insurance Products Fund V (the Trust) and is authorized to issue an unlimited number of shares. The Trust is registered under the Investment Company Act of 1940, as amended (the 1940 Act), as an open-end management investment company organized as a Massachusetts business trust. Shares of the Fund may only be purchased by insurance companies for the purpose of funding variable annuity or variable life insurance contracts. The Fund offers the following classes of shares: Initial Class shares and Investor Class shares. All classes have equal rights and voting privileges, except for matters affecting a single class.
2. Investments in Fidelity Central Funds.
Funds may invest in Fidelity Central Funds, which are open-end investment companies generally available only to other investment companies and accounts managed by the investment adviser and its affiliates. The Schedule of Investments lists any Fidelity Central Funds held as an investment as of period end, but does not include the underlying holdings of each Fidelity Central Fund. An investing fund indirectly bears its proportionate share of the expenses of the underlying Fidelity Central Funds.
Based on its investment objective, each Fidelity Central Fund may invest or participate in various investment vehicles or strategies that are similar to those of the investing fund. These strategies are consistent with the investment objectives of the investing fund and may involve certain economic risks which may cause a decline in value of each of the Fidelity Central Funds and thus a decline in the value of the investing fund.
| Fidelity Central Fund | Investment Manager | Investment Objective | Investment Practices | Expense Ratio(a) |
| Fidelity Money Market Central Funds | Fidelity Management & Research Company LLC (FMR) | Each fund seeks to obtain a high level of current income consistent with the preservation of capital and liquidity. | Short-term Investments | Less than .005% |
(a) Expenses expressed as a percentage of average net assets and are as of each underlying Central Fund's most recent annual or semi-annual shareholder report.
A complete unaudited list of holdings for each Fidelity Central Fund is available upon request or at the Securities and Exchange Commission website at www.sec.gov. In addition, the financial statements of the Fidelity Central Funds which contain the significant accounting policies (including investment valuation policies) of those funds, and are not covered by the Report of Independent Registered Public Accounting Firm, are available on the Securities and Exchange Commission website or upon request.
3. Significant Accounting Policies.
The Fund is an investment company and applies the accounting and reporting guidance of the Financial Accounting Standards Board (FASB) Accounting Standards Codification Topic 946 Financial Services - Investment Companies. The financial statements have been prepared in conformity with accounting principles generally accepted in the United States of America (GAAP), which require management to make certain estimates and assumptions at the date of the financial statements. Actual results could differ from those estimates. Subsequent events, if any, through the date that the financial statements were issued have been evaluated in the preparation of the financial statements. The Fund's Schedule of Investments lists any underlying mutual funds or exchange-traded funds (ETFs) but does not include the underlying holdings of these funds. The following summarizes the significant accounting policies of the Fund:
Investment Valuation. Investments are valued as of 4:00 p.m. Eastern time on the last calendar day of the period. The Board of Trustees (the Board) has delegated the day to day responsibility for the valuation of the Fund's investments to the Fair Value Committee (the Committee) established by the Fund's investment adviser. In accordance with valuation policies and procedures approved by the Board, the Fund attempts to obtain prices from one or more third party pricing vendors or brokers to value its investments. When current market prices, quotations or currency exchange rates are not readily available or reliable, investments will be fair valued in good faith by the Committee, in accordance with procedures adopted by the Board. Factors used in determining fair value vary by investment type and may include market or investment specific events, changes in interest rates and credit quality. The frequency with which these procedures are used cannot be predicted and they may be utilized to a significant extent. The Committee oversees the Fund's valuation policies and procedures and reports to the Board on the Committee's activities and fair value determinations. The Board monitors the appropriateness of the procedures used in valuing the Fund's investments and ratifies the fair value determinations of the Committee.
The Fund categorizes the inputs to valuation techniques used to value its investments into a disclosure hierarchy consisting of three levels as shown below:
- Level 1 – unadjusted quoted prices in active markets for identical investments
- Level 2 – other significant observable inputs (including quoted prices for similar investments, interest rates, prepayment speeds, etc.)
- Level 3 – unobservable inputs (including the Fund's own assumptions based on the best information available)
Valuation techniques used to value the Fund's investments by major category are as follows:
Debt securities, including restricted securities, are valued based on evaluated prices received from third party pricing vendors or from brokers who make markets in such securities. Corporate bonds, bank notes, foreign government and government agency obligations, municipal securities, supranational obligations and U.S. government and government agency obligations are valued by pricing vendors who utilize matrix pricing which considers yield or price of bonds of comparable quality, coupon, maturity and type or by broker-supplied prices. Asset backed securities, collateralized mortgage obligations, commercial mortgage securities and U.S. government agency mortgage securities are valued by pricing vendors who utilize matrix pricing which considers prepayment speed assumptions, attributes of the collateral, yield or price of bonds of comparable quality, coupon, maturity and type or by broker-supplied prices. Brokers which make markets in asset backed securities, collateralized mortgage obligations and commercial mortgage securities may also consider such factors as the structure of the issue, cash flow assumptions, the value of underlying assets as well as any guarantees. Swaps are marked-to-market daily based on valuations from third party pricing vendors, registered derivatives clearing organizations (clearinghouses) or broker-supplied valuations. These pricing sources may utilize inputs such as interest rate curves, credit spread curves, default possibilities and recovery rates. When independent prices are unavailable or unreliable, debt securities and swaps may be valued utilizing pricing methodologies which consider similar factors that would be used by third party pricing vendors. Debt securities and swaps are generally categorized as Level 2 in the hierarchy but may be Level 3 depending on the circumstances.
Futures contracts are valued at the settlement price established each day by the board of trade or exchange on which they are traded and are categorized as Level 1 in the hierarchy. Investments in open-end mutual funds, including the Fidelity Central Funds, are valued at their closing net asset value (NAV) each business day and are categorized as Level 1 in the hierarchy.
Changes in valuation techniques may result in transfers in or out of an assigned level within the disclosure hierarchy. The aggregate value of investments by input level as of June 30, 2022 is included at the end of the Fund's Schedule of Investments.
Investment Transactions and Income. For financial reporting purposes, the Fund's investment holdings and NAV include trades executed through the end of the last business day of the period. The NAV per share for processing shareholder transactions is calculated as of the close of business of the New York Stock Exchange (NYSE), normally 4:00 p.m. Eastern time and includes trades executed through the end of the prior business day. Gains and losses on securities sold are determined on the basis of identified cost. Income and capital gain distributions from Fidelity Central Funds, if any, are recorded on the ex-dividend date. Interest income is accrued as earned and includes coupon interest and amortization of premium and accretion of discount on debt securities as applicable.
Class Allocations and Expenses. Investment income, realized and unrealized capital gains and losses, common expenses of a fund, and certain fund-level expense reductions, if any, are allocated daily on a pro-rata basis to each class based on the relative net assets of each class to the total net assets of a fund. Each class differs with respect to transfer agent and distribution and service plan fees incurred, as applicable. Certain expense reductions may also differ by class, if applicable. For the reporting period, the allocated portion of income and expenses to each class as a percent of its average net assets may vary due to the timing of recording these transactions in relation to fluctuating net assets of the classes. Expenses directly attributable to a fund are charged to that fund. Expenses attributable to more than one fund are allocated among the respective funds on the basis of relative net assets or other appropriate methods. Expenses included in the accompanying financial statements reflect the expenses of that fund and do not include any expenses associated with any underlying mutual funds or exchange-traded funds. Although not included in a fund's expenses, a fund indirectly bears its proportionate share of these expenses through the net asset value of each underlying mutual fund or exchange-traded fund. Expense estimates are accrued in the period to which they relate and adjustments are made when actual amounts are known.
Income Tax Information and Distributions to Shareholders. Each year, the Fund intends to qualify as a regulated investment company under Subchapter M of the Internal Revenue Code, including distributing substantially all of its taxable income and realized gains. As a result, no provision for U.S. Federal income taxes is required. The Fund files a U.S. federal tax return, in addition to state and local tax returns as required. The Fund's federal income tax returns are subject to examination by the Internal Revenue Service (IRS) for a period of three fiscal years after they are filed. State and local tax returns may be subject to examination for an additional fiscal year depending on the jurisdiction.
Distributions are declared and recorded on the ex-dividend date. Income and capital gain distributions are declared separately for each class. Income and capital gain distributions are determined in accordance with income tax regulations, which may differ from GAAP.
Capital accounts within the financial statements are adjusted for permanent book-tax differences. These adjustments have no impact on net assets or the results of operations. Capital accounts are not adjusted for temporary book-tax differences which will reverse in a subsequent period.
As of period end, the cost and unrealized appreciation (depreciation) in securities, and derivatives if applicable, for federal income tax purposes were as follows:
| Gross unrealized appreciation | $2,500,069 |
| Gross unrealized depreciation | (67,772,111) |
| Net unrealized appreciation (depreciation) | $(65,272,042) |
| Tax cost | $2,923,399,047 |
Delayed Delivery Transactions and When-Issued Securities. During the period, certain Funds transacted in securities on a delayed delivery or when-issued basis. Payment and delivery may take place after the customary settlement period for that security. The price of the underlying securities and the date when the securities will be delivered and paid for are fixed at the time the transaction is negotiated. Securities purchased on a delayed delivery or when-issued basis are identified as such in the Schedule of Investments. Compensation for interest forgone in the purchase of a delayed delivery or when-issued debt security may be received. With respect to purchase commitments, each applicable Fund identifies securities as segregated in its records with a value at least equal to the amount of the commitment. Payables and receivables associated with the purchases and sales of delayed delivery securities having the same coupon, settlement date and broker are offset. Delayed delivery or when-issued securities that have been purchased from and sold to different brokers are reflected as both payables and receivables in the Statement of Assets and Liabilities under the caption "Delayed delivery", as applicable. Losses may arise due to changes in the value of the underlying securities or if the counterparty does not perform under the contract's terms, or if the issuer does not issue the securities due to political, economic, or other factors.
To-Be-Announced (TBA) Securities and Mortgage Dollar Rolls. TBA securities involve buying or selling mortgage-backed securities (MBS) on a forward commitment basis. A TBA transaction typically does not designate the actual security to be delivered and only includes an approximate principal amount; however delivered securities must meet specified terms defined by industry guidelines, including issuer, rate and current principal amount outstanding on underlying mortgage pools. Funds may enter into a TBA transaction with the intent to take possession of or deliver the underlying MBS, or a fund may elect to extend the settlement by entering into either a mortgage or reverse mortgage dollar roll. Mortgage dollar rolls are transactions where a fund sells TBA securities and simultaneously agrees to repurchase MBS on a later date at a lower price and with the same counterparty. Reverse mortgage dollar rolls involve the purchase and simultaneous agreement to sell TBA securities on a later date at a lower price. Transactions in mortgage dollar rolls and reverse mortgage dollar rolls are accounted for as purchases and sales and may result in an increase to a fund's portfolio turnover rate.
Purchases and sales of TBA securities involve risks similar to those discussed above for delayed delivery and when-issued securities. Also, if the counterparty in a mortgage dollar roll or a reverse mortgage dollar roll transaction files for bankruptcy or becomes insolvent, a fund's right to repurchase or sell securities may be limited. Additionally, when a fund sells TBA securities without already owning or having the right to obtain the deliverable securities (an uncovered forward commitment to sell), it incurs a risk of loss because it could have to purchase the securities at a price that is higher than the price at which it sold them. A fund may be unable to purchase the deliverable securities if the corresponding market is illiquid.
TBA securities subject to a forward commitment to sell at period end are included at the end of the Schedule of Investments under the caption "TBA Sale Commitments." The proceeds and value of these commitments are reflected in the Statement of Assets and Liabilities as "Receivable for TBA sale commitments" and "TBA sale commitments, at value," respectively.
Restricted Securities (including Private Placements). Funds may invest in securities that are subject to legal or contractual restrictions on resale. These securities generally may be resold in transactions exempt from registration or to the public if the securities are registered. Disposal of these securities may involve time-consuming negotiations and expense, and prompt sale at an acceptable price may be difficult. Information regarding restricted securities held at period end is included at the end of the Schedule of Investments, if applicable.
4. Derivative Instruments.
Risk Exposures and the Use of Derivative Instruments. Investment objectives allow a fund to enter into various types of derivative contracts, including futures contracts and swaps. Derivatives are investments whose value is primarily derived from underlying assets, indices or reference rates and may be transacted on an exchange or over-the-counter (OTC). Derivatives may involve a future commitment to buy or sell a specified asset based on specified terms, to exchange future cash flows at periodic intervals based on a notional principal amount, or for one party to make one or more payments upon the occurrence of specified events in exchange for periodic payments from the other party.
Derivatives were used to increase returns, to gain exposure to certain types of assets and to manage exposure to certain risks as defined below. The success of any strategy involving derivatives depends on analysis of numerous economic factors, and if the strategies for investment do not work as intended, the objectives may not be achieved.
Derivatives were used to increase or decrease exposure to the following risks:
| Credit Risk | Credit risk relates to the ability of the issuer of a financial instrument to make further principal or interest payments on an obligation or commitment that it has to a fund. |
| Interest Rate Risk | Interest rate risk relates to the fluctuations in the value of interest-bearing securities due to changes in the prevailing levels of market interest rates. |
Funds are also exposed to additional risks from investing in derivatives, such as liquidity risk and counterparty credit risk. Liquidity risk is the risk that a fund will be unable to close out the derivative in the open market in a timely manner. Counterparty credit risk is the risk that the counterparty will not be able to fulfill its obligation to a fund. Derivative counterparty credit risk is managed through formal evaluation of the creditworthiness of all potential counterparties. On certain OTC derivatives such as bi-lateral swaps, a fund attempts to reduce its exposure to counterparty credit risk by entering into an International Swaps and Derivatives Association, Inc. (ISDA) Master Agreement with each of its counterparties. The ISDA Master Agreement gives a fund the right to terminate all transactions traded under such agreement upon the deterioration in the credit quality of the counterparty beyond specified levels. The ISDA Master Agreement gives each party the right, upon an event of default by the other party or a termination of the agreement, to close out all transactions traded under such agreement and to net amounts owed under each transaction to one net payable by one party to the other. To mitigate counterparty credit risk on bi-lateral OTC derivatives, a fund receives collateral in the form of cash or securities once net unrealized appreciation on outstanding derivative contracts under an ISDA Master Agreement exceeds certain applicable thresholds, subject to certain minimum transfer provisions. The collateral received is held in segregated accounts with the custodian bank in accordance with the collateral agreements entered into between a fund, the counterparty and the custodian bank. A fund could experience delays and costs in gaining access to the collateral even though it is held by the custodian bank. The maximum risk of loss to a fund from counterparty credit risk related to bi-lateral OTC derivatives is generally the aggregate unrealized appreciation and unpaid counterparty payments in excess of any collateral pledged by the counterparty to a fund. A fund may be required to pledge collateral for the benefit of the counterparties on bi-lateral OTC derivatives in an amount not less than each counterparty's unrealized appreciation on outstanding derivative contracts, subject to certain minimum transfer provisions, and any such pledged collateral is identified in the Schedule of Investments. Exchange-traded contracts are not covered by the ISDA Master Agreement; however counterparty credit risk related to these contracts may be mitigated by the protection provided by the exchange on which they trade.
Investing in derivatives may involve greater risks than investing in the underlying assets directly and, to varying degrees, may involve risk of loss in excess of any initial investment and collateral received and amounts recognized in the Statement of Assets and Liabilities. In addition, there may be the risk that the change in value of the derivative contract does not correspond to the change in value of the underlying instrument.
Net Realized Gain (Loss) and Change in Net Unrealized Appreciation (Depreciation) on Derivatives. The table below, which reflects the impacts of derivatives on the financial performance, summarizes the net realized gain (loss) and change in net unrealized appreciation (depreciation) for derivatives during the period as presented in the Statement of Operations.
| Primary Risk Exposure / Derivative Type | Net Realized Gain (Loss) | Change in Net Unrealized Appreciation (Depreciation) |
| VIP Investment Grade Bond II Portfolio | ||
| Credit Risk | ||
| Swaps | $(1,034) | $16,868 |
| Total Credit Risk | (1,034) | 16,868 |
| Interest Rate Risk | ||
| Futures Contracts | (203,808) | (681,857) |
| Total Interest Rate Risk | (203,808) | (681,857) |
| Totals | $(204,842) | $(664,989) |
If there are any open positions at period end, a summary of the value of derivatives by primary risk exposure is included at the end of the Schedule of Investments.
Futures Contracts. A futures contract is an agreement between two parties to buy or sell a specified underlying instrument for a fixed price at a specified future date. Futures contracts were used to manage exposure to the bond market and fluctuations in interest rates.
Upon entering into a futures contract, a fund is required to deposit either cash or securities (initial margin) with a clearing broker in an amount equal to a certain percentage of the face value of the contract. Futures contracts are marked-to-market daily and subsequent daily payments are made or received by a fund depending on the daily fluctuations in the value of the futures contracts and are recorded as unrealized appreciation or (depreciation). This receivable and/or payable, if any, is included in daily variation margin on futures contracts in the Statement of Assets and Liabilities. Realized gain or (loss) is recorded upon the expiration or closing of a futures contract. The net realized gain (loss) and change in net unrealized appreciation (depreciation) on futures contracts during the period is presented in the Statement of Operations.
Any open futures contracts at period end are presented in the Schedule of Investments under the caption "Futures Contracts". The notional amount at value reflects each contract's exposure to the underlying instrument or index at period end, and is representative of volume of activity during the period unless an average notional amount is presented. Any securities deposited to meet initial margin requirements are identified in the Schedule of Investments. Any cash deposited to meet initial margin requirements is presented as segregated cash with brokers for derivative instruments in the Statement of Assets and Liabilities.
Swaps. A swap is a contract between two parties to exchange future cash flows at periodic intervals based on a notional principal amount. A bi-lateral OTC swap is a transaction between a fund and a dealer counterparty where cash flows are exchanged between the two parties for the life of the swap.
Bi-lateral OTC swaps are marked-to-market daily and changes in value are reflected in the Statement of Assets and Liabilities in the bi-lateral OTC swaps at value line items. Any upfront premiums paid or received upon entering a bi-lateral OTC swap to compensate for differences between stated terms of the swap and prevailing market conditions (e.g. credit spreads, interest rates or other factors) are recorded in net unrealized appreciation (depreciation) in the Statement of Assets and Liabilities and amortized to realized gain or (loss) ratably over the term of the swap. Any unamortized upfront premiums are presented in the Schedule of Investments.
Any securities deposited to meet initial margin requirements are identified in the Schedule of Investments. Any cash deposited to meet initial margin requirements is presented in segregated cash with brokers for derivative instruments in the Statement of Assets and Liabilities.
Payments are exchanged at specified intervals, accrued daily commencing with the effective date of the contract and recorded as realized gain or (loss). Some swaps may be terminated prior to the effective date and realize a gain or loss upon termination. The net realized gain (loss) and change in net unrealized appreciation (depreciation) on swaps during the period is presented in the Statement of Operations.
Any open swaps at period end are included in the Schedule of Investments under the caption "Swaps", and are representative of volume of activity during the period unless an average notional amount is presented.
Credit Default Swaps. Credit default swaps enable a fund to buy or sell protection against specified credit events on a single-name issuer or a traded credit index. Under the terms of a credit default swap the buyer of protection (buyer) receives credit protection in exchange for making periodic payments to the seller of protection (seller) based on a fixed percentage applied to a notional principal amount. In return for these payments, the seller will be required to make a payment upon the occurrence of one or more specified credit events. A fund enters into credit default swaps as a seller to gain credit exposure to an issuer and/or as a buyer to obtain a measure of protection against defaults of an issuer. Periodic payments are made over the life of the contract by the buyer provided that no credit event occurs.
For credit default swaps on most corporate and sovereign issuers, credit events include bankruptcy, failure to pay or repudiation/moratorium. For credit default swaps on corporate or sovereign issuers, the obligation that may be put to the seller is not limited to the specific reference obligation described in the Schedule of Investments. For credit default swaps on asset-backed securities, a credit event may be triggered by events such as failure to pay principal, maturity extension, rating downgrade or write-down. For credit default swaps on asset-backed securities, the reference obligation described represents the security that may be put to the seller. For credit default swaps on a traded credit index, a specified credit event may affect all or individual underlying securities included in the index.
As a seller, if an underlying credit event occurs, a fund will pay a net settlement amount of cash equal to the notional amount of the swap less the recovery value of the reference obligation or underlying securities comprising an index. Only in the event of the industry's inability to value the underlying asset will a fund be required to take delivery of the reference obligation or underlying securities comprising an index and pay an amount equal to the notional amount of the swap.
As a buyer, if an underlying credit event occurs, a fund will receive a net settlement amount of cash equal to the notional amount of the swap less the recovery value of the reference obligation or underlying securities comprising an index. Only in the event of the industry's inability to value the underlying asset will a fund be required to deliver the reference obligation or underlying securities comprising an index in exchange for payment of an amount equal to the notional amount of the swap.
Typically, the value of each credit default swap and credit rating disclosed for each reference obligation in the Schedule of Investments, where a fund is the seller, can be used as measures of the current payment/performance risk of the swap. As the value of the swap changes as a positive or negative percentage of the total notional amount, the payment/performance risk may decrease or increase, respectively. In addition to these measures, the investment adviser monitors a variety of factors including cash flow assumptions, market activity and market sentiment as part of its ongoing process of assessing payment/performance risk.
5. Purchases and Sales of Investments.
Purchases and sales of securities, other than short-term securities, U.S. government securities and in-kind transactions, as applicable, are noted in the table below.
| Purchases ($) | Sales ($) | |
| VIP Investment Grade Bond II Portfolio | 693,535,046 | 429,769,856 |
6. Fees and Other Transactions with Affiliates.
Management Fee. Fidelity Management & Research Company LLC (the investment adviser) and its affiliates provide the Fund with investment management related services for which the Fund pays a monthly management fee. The management fee is the sum of an individual fund fee rate that is based on an annual rate of .20% of the Fund's average net assets and an annualized group fee rate that averaged .10% during the period. The group fee rate is based upon the monthly average net assets of a group of registered investment companies with which the investment adviser has management contracts. The group fee rate decreases as assets under management increase and increases as assets under management decrease. For the reporting period, the total annualized management fee rate was .28% of the Fund's average net assets.
Transfer Agent Fees. Fidelity Investments Institutional Operations Company LLC (FIIOC), an affiliate of the investment adviser, is the Fund's transfer, dividend disbursing, and shareholder servicing agent. FIIOC receives an asset-based fee with respect to each class. Each class pays a fee for transfer agent services, typesetting and printing and mailing of shareholder reports, excluding mailing of proxy statements. For the period, transfer agent fees for each class were as follows:
| Amount | % of Class-Level Average Net Assets(a) | |
| Initial Class | $31,510 | .06 |
| Investor Class | 187,034 | .10 |
| $218,544 |
(a) Annualized
Accounting Fees. Fidelity Service Company, Inc. (FSC), an affiliate of the investment adviser, maintains the Fund's accounting records. The accounting fee is based on the level of average net assets for each month. For the period, the fees were equivalent to the following annualized rates:
| % of Average Net Assets | |
| VIP Investment Grade Bond II Portfolio | .03 |
Interfund Trades. Funds may purchase from or sell securities to other Fidelity Funds under procedures adopted by the Board. The procedures have been designed to ensure these interfund trades are executed in accordance with Rule 17a-7 of the 1940 Act. Any interfund trades are included within the respective purchases and sales amounts shown in the Purchases and Sales of Investments note. During the period, there were no interfund trades.
Affiliated Exchanges In-Kind. Shares that were exchanged for investments, including accrued interest and cash, if any, are shown in the table below. The amount of in-kind exchanges is included in share transactions in the accompanying Statement of Changes in Net Assets.
| Shares | Total Proceeds ($) | Participating classes | |
| VIP Investment Grade Bond II Portfolio | 274,659,704 | 2,746,597,038 | Initial Class, Investor Class |
7. Share Transactions.
Transactions for each class of shares were as follows and may contain in-kind transactions:
| Shares | Dollars | |
| Six months ended June 30, 2022(a) | Six months ended June 30, 2022(a) | |
| VIP Investment Grade Bond II Portfolio | ||
| Initial Class | ||
| Shares sold | 58,183,057 | $581,585,179 |
| Shares redeemed | (5,613,404) | (55,305,082) |
| Net increase (decrease) | 52,569,653 | $526,280,097 |
| Investor Class | ||
| Shares sold | 223,452,262 | $2,232,816,491 |
| Shares redeemed | (4,710,056) | (46,265,246) |
| Net increase (decrease) | 218,742,206 | $2,186,551,245 |
(a) For the period May 27, 2022 (commencement of operations) through June 30, 2022.
8. Other.
A fund's organizational documents provide former and current trustees and officers with a limited indemnification against liabilities arising in connection with the performance of their duties to the fund. In the normal course of business, a fund may also enter into contracts that provide general indemnifications. A fund's maximum exposure under these arrangements is unknown as this would be dependent on future claims that may be made against a fund. The risk of material loss from such claims is considered remote.
At the end of the period, the following mutual funds managed by the investment adviser or its affiliates were the owners of record of 10% or more of the total outstanding shares.
| VIP Funds Manager 50% Portfolio | VIP Funds Manager 60% Portfolio | |
| VIP Investment Grade Bond Portfolio II | 29% | 28% |
Mutual funds managed by the investment adviser or its affiliates, in aggregate, were the owners of record of more than 20% of the total outstanding shares.
| Fund | % of shares held |
| VIP Investment Grade Bond Portfolio II | 100% |
9. Coronavirus (COVID-19) Pandemic.
An outbreak of COVID-19 first detected in China during December 2019 has since spread globally and was declared a pandemic by the World Health Organization during March 2020. Developments that disrupt global economies and financial markets, such as the COVID-19 pandemic, may magnify factors that affect the Fund's performance.
Shareholder Expense Example
As a shareholder, you incur two types of costs: (1) transaction costs, which may include sales charges (loads) on purchase payments or redemption proceeds, as applicable and (2) ongoing costs, which generally include management fees, distribution and/or service (12b-1) fees and other Fund expenses. This Example is intended to help you understand your ongoing costs (in dollars) of investing in a fund and to compare these costs with the ongoing costs of investing in other mutual funds.
The actual expense Example is based on an investment of $1,000 invested at the beginning of the period and held for the entire period (May 27, 2022 to June 30, 2022). The hypothetical expense Example is based on an investment of $1,000 invested for the one-half year period (May 27, 2022 to June 30, 2022).
Actual Expenses
The first line of the accompanying table provides information about actual account values and actual expenses. You may use the information in this line, together with the amount you invested, to estimate the expenses that you paid over the period. Simply divide your account value by $1,000.00 (for example, an $8,600 account value divided by $1,000.00 = 8.6), then multiply the result by the number in the first line for a class/Fund under the heading entitled "Expenses Paid During Period" to estimate the expenses you paid on your account during this period. If any fund is a shareholder of any underlying mutual funds or exchange-traded funds (ETFs) (the Underlying Funds), such fund indirectly bears its proportional share of the expenses of the Underlying Funds in addition to the direct expenses incurred presented in the table. These fees and expenses are not included in the annualized expense ratio used to calculate the expense estimate in the table below. The estimate of expenses does not include any fees or other expenses of any variable annuity or variable life insurance product. If they were, the estimate of expenses you paid during the period would be higher, and your ending account value would be lower.
Hypothetical Example for Comparison Purposes
The second line of the accompanying table provides information about hypothetical account values and hypothetical expenses based on the actual expense ratio and an assumed rate of return of 5% per year before expenses, which is not the actual return. The hypothetical account values and expenses may not be used to estimate the actual ending account balance or expenses you paid for the period. You may use this information to compare the ongoing costs of investing in the Fund and other funds. To do so, compare this 5% hypothetical example with the 5% hypothetical examples that appear in the shareholder reports of the other funds. If any fund is a shareholder of any Underlying Funds, such fund indirectly bears its proportional share of the expenses of the Underlying Funds in addition to the direct expenses as presented in the table. These fees and expenses are not included in the annualized expense ratio used to calculate the expense estimate in the table below. The estimate of expenses does not include any fees or other expenses of any variable annuity or variable life insurance product. If they were, the estimate of expenses you paid during the period would be higher, and your ending account value would be lower.
Please note that the expenses shown in the table are meant to highlight your ongoing costs only and do not reflect any transaction costs. Therefore, the second line of the table is useful in comparing ongoing costs only, and will not help you determine the relative total costs of owning different funds. In addition, if these transactional costs were included, your costs would have been higher.
| Annualized Expense Ratio-A | Beginning Account Value | Ending Account Value June 30, 2022 | Expenses Paid During Period |
|
| VIP Investment Grade Bond II Portfolio | ||||
| Initial Class | .38% | |||
| Actual | $1,000.00 | $976.00 | $.36-B | |
| Hypothetical-C | $1,000.00 | $1,022.91 | $1.91-D | |
| Investor Class | .42% | |||
| Actual | $1,000.00 | $976.00 | $.40-B | |
| Hypothetical-C | $1,000.00 | $1,022.71 | $2.11-D |
A Annualized expense ratio reflects expenses net of applicable fee waivers.
B Actual expenses are equal to the annualized expense ratio, multiplied by the average account value over the period, multiplied by 35/365 (to reflect the period May 27, 2022 to June 30, 2022.)
C 5% return per year before expenses
D Hypothetical expenses are equal to the annualized expense ratio, multiplied by the average account value over the period, multiplied by 181/365 (to reflect the one-half year period).
Board Approval of Investment Advisory Contracts and Management Fees
VIP Investment Grade Bond II Portfolio
![]()
VIGBI-SANN-0822
1.9905667.100
Fidelity® Variable Insurance Products:
Freedom Funds - Income, 2005, 2010, 2015, 2020, 2025, 2030, 2035, 2040, 2045, 2050, 2055, 2060, 2065
Semi-Annual Report
June 30, 2022
Contents
To view a fund's proxy voting guidelines and proxy voting record for the 12-month period ended June 30, visit http://www.fidelity.com/proxyvotingresults or visit the Securities and Exchange Commission's (SEC) web site at http://www.sec.gov.
You may also call 1-877-208-0098 to request a free copy of the proxy voting guidelines.
Fidelity® Variable Insurance Products are separate account options which are purchased through a variable insurance contract.
Standard & Poor's, S&P and S&P 500 are registered service marks of The McGraw-Hill Companies, Inc. and have been licensed for use by Fidelity Distributors Corporation.
Other third-party marks appearing herein are the property of their respective owners.
All other marks appearing herein are registered or unregistered trademarks or service marks of FMR LLC or an affiliated company. © 2022 FMR LLC. All rights reserved.
This report and the financial statements contained herein are submitted for the general information of the shareholders of the Funds. This report is not authorized for distribution to prospective investors in the Funds unless preceded or accompanied by an effective prospectus.
A fund files its complete schedule of portfolio holdings with the SEC for the first and third quarters of each fiscal year on Form N-PORT. Forms N-PORT are available on the SEC’s web site at http://www.sec.gov. A fund's Forms N-PORT may be reviewed and copied at the SEC’s Public Reference Room in Washington, DC. Information regarding the operation of the SEC's Public Reference Room may be obtained by calling 1-800-SEC-0330.
For a complete list of a fund's portfolio holdings, view the most recent holdings listing, semiannual report, or annual report on Fidelity's web site at http://www.fidelity.com, http://www.institutional.fidelity.com, or http://www.401k.com, as applicable.
NOT FDIC INSURED •MAY LOSE VALUE •NO BANK GUARANTEE
Neither the Funds nor Fidelity Distributors Corporation is a bank.
Note to Shareholders:
Early in 2020, the outbreak and spread of COVID-19 emerged as a public health emergency that had a major influence on financial markets, primarily based on its impact on the global economy and corporate earnings. On March 11, 2020, the World Health Organization declared the COVID-19 outbreak a pandemic, citing sustained risk of further global spread. The pandemic prompted a number of measures to limit the spread of COVID-19, including travel and border restrictions, quarantines, and restrictions on large gatherings. In turn, these resulted in lower consumer activity, diminished demand for a wide range of products and services, disruption in manufacturing and supply chains, and – given the wide variability in outcomes regarding the outbreak – significant market uncertainty and volatility. To help stem the turmoil, the U.S. government took unprecedented action – in concert with the U.S. Federal Reserve and central banks around the world – to help support consumers, businesses, and the broader economy, and to limit disruption to the financial system.
In general, the overall impact of the pandemic lessened in 2021, amid a resilient economy and widespread distribution of three COVID-19 vaccines granted emergency use authorization from the U.S. Food and Drug Administration (FDA) early in the year. Still, the situation remains dynamic, and the extent and duration of its influence on financial markets and the economy is highly uncertain, due in part to a recent spike in cases based on highly contagious variants of the coronavirus.
Extreme events such as the COVID-19 crisis are exogenous shocks that can have significant adverse effects on mutual funds and their investments. Although multiple asset classes may be affected by market disruption, the duration and impact may not be the same for all types of assets. Fidelity is committed to helping you stay informed amid news about COVID-19 and during increased market volatility, and we continue to take extra steps to be responsive to customer needs. We encourage you to visit us online, where we offer ongoing updates, commentary, and analysis on the markets and our funds.
VIP Freedom Income Portfolio℠
Investment Summary (Unaudited)
The information in the following tables is based on the direct investments of the Fund.Top Holdings as of June 30, 2022
| % of fund's net assets | |
| VIP Investment Grade Bond II Portfolio Initial Class | 36.1 |
| VIP Government Money Market Portfolio Initial Class 1.18% | 19.0 |
| Fidelity Inflation-Protected Bond Index Fund | 16.6 |
| VIP Overseas Portfolio Initial Class | 7.3 |
| VIP Emerging Markets Portfolio Initial Class | 6.8 |
| Fidelity Long-Term Treasury Bond Index Fund | 3.7 |
| Fidelity International Bond Index Fund | 2.6 |
| VIP High Income Portfolio Initial Class | 1.6 |
| VIP Growth Portfolio Initial Class | 1.3 |
| VIP Growth & Income Portfolio Initial Class | 1.3 |
| 96.3 |
Asset Allocation (% of fund's net assets)
| Period end | ||
| Domestic Equity Funds | 6.3% | |
| International Equity Funds | 14.1% | |
| Bond Funds | 60.6% | |
| Short-Term Funds | 19.0% | |

VIP Freedom Income Portfolio℠
Schedule of Investments June 30, 2022 (Unaudited)
Showing Percentage of Net Assets
| Domestic Equity Funds - 6.3% | |||
| Shares | Value | ||
| VIP Contrafund Portfolio Initial Class (a) | 17,537 | $687,969 | |
| VIP Equity-Income Portfolio Initial Class (a) | 30,335 | 707,716 | |
| VIP Growth & Income Portfolio Initial Class (a) | 36,413 | 838,586 | |
| VIP Growth Portfolio Initial Class (a) | 11,617 | 865,792 | |
| VIP Mid Cap Portfolio Initial Class (a) | 6,446 | 204,466 | |
| VIP Value Portfolio Initial Class (a) | 31,454 | 517,099 | |
| VIP Value Strategies Portfolio Initial Class (a) | 17,704 | 252,630 | |
| TOTAL DOMESTIC EQUITY FUNDS | |||
| (Cost $3,040,410) | 4,074,258 | ||
| International Equity Funds - 14.1% | |||
| VIP Emerging Markets Portfolio Initial Class (a) | 434,715 | 4,373,238 | |
| VIP Overseas Portfolio Initial Class (a) | 225,403 | 4,697,406 | |
| TOTAL INTERNATIONAL EQUITY FUNDS | |||
| (Cost $8,763,604) | 9,070,644 | ||
| Bond Funds - 60.6% | |||
| Fidelity Inflation-Protected Bond Index Fund (a) | 1,048,498 | 10,642,257 | |
| Fidelity International Bond Index Fund (a) | 181,175 | 1,648,695 | |
| Fidelity Long-Term Treasury Bond Index Fund (a) | 206,100 | 2,376,336 | |
| VIP High Income Portfolio Initial Class (a) | 233,483 | 1,055,345 | |
| VIP Investment Grade Bond II Portfolio Initial Class (a) | 2,376,478 | 23,194,425 | |
| TOTAL BOND FUNDS | |||
| (Cost $40,012,797) | 38,917,058 | ||
| Short-Term Funds - 19.0% | |||
| VIP Government Money Market Portfolio Initial Class 1.18% (a)(b) | |||
| (Cost $12,174,719) | 12,174,719 | 12,174,719 | |
| TOTAL INVESTMENT IN SECURITIES - 100.0% | |||
| (Cost $63,991,530) | 64,236,679 | ||
| NET OTHER ASSETS (LIABILITIES) - 0.0% | (7,165) | ||
| NET ASSETS - 100% | $64,229,514 |
Legend
(a) Affiliated Fund
(b) The rate quoted is the annualized seven-day yield of the fund at period end.
Affiliated Underlying Funds
Fiscal year to date information regarding the Fund's investments in affiliated Underlying Funds is presented below. Exchanges between classes of the same affiliated Underlying Funds may occur, and are excluded from purchases and sales below if applicable. If an underlying Fund changes its name, the name presented below is the name in effect at period end.
| Affiliate | Value, beginning of period | Purchases(a) | Sales Proceeds(a) | Dividend Income | Realized Gain (loss) | Change in Unrealized appreciation (depreciation) | Value, end of period |
| Fidelity Inflation-Protected Bond Index Fund | $11,367,795 | $3,460,810 | $3,157,802 | $-- | $(58,139) | $(970,407) | $10,642,257 |
| Fidelity International Bond Index Fund | 1,170,859 | 1,000,421 | 392,193 | 2,499 | (9,042) | (121,350) | 1,648,695 |
| Fidelity Long-Term Treasury Bond Index Fund | 2,168,551 | 1,356,662 | 681,902 | 22,455 | (41,108) | (425,867) | 2,376,336 |
| VIP Contrafund Portfolio Initial Class | 934,738 | 369,927 | 363,196 | 8,244 | (9,399) | (244,101) | 687,969 |
| VIP Emerging Markets Portfolio Initial Class | 5,301,766 | 1,818,779 | 1,760,342 | -- | (77,969) | (908,996) | 4,373,238 |
| VIP Equity-Income Portfolio Initial Class | 988,776 | 311,853 | 501,116 | 1,181 | 23,743 | (115,540) | 707,716 |
| VIP Government Money Market Portfolio Initial Class 1.18% | 15,989,051 | 2,791,269 | 6,605,601 | 16,249 | -- | -- | 12,174,719 |
| VIP Growth & Income Portfolio Initial Class | 1,125,586 | 388,580 | 563,152 | 2,039 | 66,215 | (178,643) | 838,586 |
| VIP Growth Portfolio Initial Class | 955,875 | 565,335 | 389,972 | 42,224 | (20,420) | (245,026) | 865,792 |
| VIP High Income Portfolio Initial Class | 1,559,293 | 269,811 | 593,333 | 564 | (48,380) | (132,046) | 1,055,345 |
| VIP Investment Grade Bond Portfolio II Initial Class | -- | 25,083,731 | 1,305,129 | -- | (28,924) | (555,253) | 23,194,425 |
| VIP Investment Grade Bond Portfolio Initial Class | 29,871,096 | 5,274,180 | 31,513,290 | 1,300,585 | (2,846,558) | (785,428) | -- |
| VIP Mid Cap Portfolio Initial Class | 274,233 | 89,201 | 99,915 | 5,979 | (4,443) | (54,610) | 204,466 |
| VIP Overseas Portfolio Initial Class | 5,390,772 | 2,214,393 | 1,264,491 | 39,399 | (60,522) | (1,582,746) | 4,697,406 |
| VIP Value Portfolio Initial Class | 724,943 | 202,580 | 349,868 | 8,899 | 39,087 | (99,643) | 517,099 |
| VIP Value Strategies Portfolio Initial Class | 355,161 | 88,527 | 152,624 | 2,844 | 16,942 | (55,376) | 252,630 |
| $78,178,495 | $45,286,059 | $49,693,926 | $1,453,161 | $(3,058,917) | $(6,475,032) | $64,236,679 |
(a) Includes the value of shares purchased or redeemed through in-kind transactions, as applicable.
Amounts in the income column in the above table include any capital gain distributions from underlying funds, which are presented in the corresponding line-item in the Statement of Operations, if applicable.
Investment Valuation
The following is a summary of the inputs used, as of June 30, 2022, involving the Fund's assets and liabilities carried at fair value. The inputs or methodology used for valuing securities may not be an indication of the risk associated with investing in those securities. For more information on valuation inputs, and their aggregation into the levels used below, please refer to the Investment Valuation section in the accompanying Notes to Financial Statements.
| Valuation Inputs at Reporting Date: | ||||
| Description | Total | Level 1 | Level 2 | Level 3 |
| Investments in Securities: | ||||
| Domestic Equity Funds | $4,074,258 | $4,074,258 | $-- | $-- |
| International Equity Funds | 9,070,644 | 9,070,644 | -- | -- |
| Bond Funds | 38,917,058 | 38,917,058 | -- | -- |
| Short-Term Funds | 12,174,719 | 12,174,719 | -- | -- |
| Total Investments in Securities: | $64,236,679 | $64,236,679 | $-- | $-- |
See accompanying notes which are an integral part of the financial statements.
VIP Freedom Income Portfolio℠
Financial Statements
Statement of Assets and Liabilities
| June 30, 2022 (Unaudited) | ||
| Assets | ||
| Investment in securities, at value — See accompanying schedule: | ||
| Affiliated issuers (cost $63,991,530) | $64,236,679 | |
| Total Investment in Securities (cost $63,991,530) | $64,236,679 | |
| Receivable for investments sold | 117,454 | |
| Receivable for fund shares sold | 1,334,123 | |
| Total assets | 65,688,256 | |
| Liabilities | ||
| Payable for investments purchased | $1,439,542 | |
| Payable for fund shares redeemed | 12,039 | |
| Distribution and service plan fees payable | 7,161 | |
| Total liabilities | 1,458,742 | |
| Net Assets | $64,229,514 | |
| Net Assets consist of: | ||
| Paid in capital | $66,011,903 | |
| Total accumulated earnings (loss) | (1,782,389) | |
| Net Assets | $64,229,514 | |
| Net Asset Value and Maximum Offering Price | ||
| Initial Class: | ||
| Net Asset Value, offering price and redemption price per share ($14,701,890 ÷ 1,350,829 shares) | $10.88 | |
| Service Class: | ||
| Net Asset Value, offering price and redemption price per share ($25,999,728 ÷ 2,392,575 shares) | $10.87 | |
| Service Class 2: | ||
| Net Asset Value, offering price and redemption price per share ($23,527,896 ÷ 2,176,728 shares) | $10.81 |
See accompanying notes which are an integral part of the financial statements.
Statement of Operations
| Six months ended June 30, 2022 (Unaudited) | ||
| Investment Income | ||
| Dividends: | ||
| Affiliated issuers | $44,861 | |
| Expenses | ||
| Distribution and service plan fees | $45,642 | |
| Independent trustees' fees and expenses | 108 | |
| Total expenses | 45,750 | |
| Net investment income (loss) | (889) | |
| Realized and Unrealized Gain (Loss) | ||
| Net realized gain (loss) on: | ||
| Investment securities: | ||
| Affiliated issuers | (3,058,917) | |
| Capital gain distributions from underlying funds: | ||
| Affiliated issuers | 1,408,300 | |
| Total net realized gain (loss) | (1,650,617) | |
| Change in net unrealized appreciation (depreciation) on: | ||
| Investment securities: | ||
| Affiliated issuers | (6,475,032) | |
| Total change in net unrealized appreciation (depreciation) | (6,475,032) | |
| Net gain (loss) | (8,125,649) | |
| Net increase (decrease) in net assets resulting from operations | $(8,126,538) |
See accompanying notes which are an integral part of the financial statements.
Statement of Changes in Net Assets
| Six months ended June 30, 2022 (Unaudited) | Year ended December 31, 2021 | |
| Increase (Decrease) in Net Assets | ||
| Operations | ||
| Net investment income (loss) | $(889) | $1,363,822 |
| Net realized gain (loss) | (1,650,617) | 2,945,032 |
| Change in net unrealized appreciation (depreciation) | (6,475,032) | (1,855,194) |
| Net increase (decrease) in net assets resulting from operations | (8,126,538) | 2,453,660 |
| Distributions to shareholders | (2,993,736) | (2,360,060) |
| Share transactions - net increase (decrease) | (2,820,080) | 893,465 |
| Total increase (decrease) in net assets | (13,940,354) | 987,065 |
| Net Assets | ||
| Beginning of period | 78,169,868 | 77,182,803 |
| End of period | $64,229,514 | $78,169,868 |
See accompanying notes which are an integral part of the financial statements.
Financial Highlights
VIP Freedom Income Portfolio Initial Class
| Six months ended (Unaudited) June 30, | Years endedDecember 31, | |||||
| 2022 | 2021 | 2020 | 2019 | 2018 | 2017 | |
| Selected Per–Share Data | ||||||
| Net asset value, beginning of period | $12.76 | $12.74 | $11.89 | $11.08 | $11.63 | $10.98 |
| Income from Investment Operations | ||||||
| Net investment income (loss)A,B | .01 | .24 | .17 | .27 | .22 | .19 |
| Net realized and unrealized gain (loss) | (1.37) | .18 | 1.06 | 1.03 | (.45) | .74 |
| Total from investment operations | (1.36) | .42 | 1.23 | 1.30 | (.23) | .93 |
| Distributions from net investment income | (.12) | (.13) | (.16) | (.25) | (.20) | (.18) |
| Distributions from net realized gain | (.40) | (.27) | (.22) | (.25) | (.13) | (.10) |
| Total distributions | (.52) | (.40) | (.38) | (.49)C | (.32)C | (.28) |
| Net asset value, end of period | $10.88 | $12.76 | $12.74 | $11.89 | $11.08 | $11.63 |
| Total ReturnD,E,F | (11.03)% | 3.35% | 10.47% | 11.94% | (1.96)% | 8.48% |
| Ratios to Average Net AssetsB,G,H | ||||||
| Expenses before reductionsI | - %J | -% | -% | -% | -% | -% |
| Expenses net of fee waivers, if any | - %I,J | - %I | - %I | - %I | - %I | -% |
| Expenses net of all reductions | - %I,J | - %I | - %I | - %I | - %I | -% |
| Net investment income (loss) | .13%J | 1.85% | 1.40% | 2.31% | 1.90% | 1.67% |
| Supplemental Data | ||||||
| Net assets, end of period (000 omitted) | $14,702 | $17,011 | $16,854 | $14,870 | $14,582 | $16,086 |
| Portfolio turnover rateK | 130%J | 52% | 66% | 40% | 48% | 35% |
A Calculated based on average shares outstanding during the period.
B Net investment income (loss) is affected by the timing of the declaration of dividends by any underlying mutual funds or exchange-traded funds (ETFs). Net investment income (loss) of any such underlying funds is not included in the Fund's net investment income (loss) ratio.
C Total distributions per share do not sum due to rounding.
D Total returns for periods of less than one year are not annualized.
E Total returns do not reflect charges attributable to your insurance company's separate account. Inclusion of these charges would reduce the total returns shown.
F Total returns would have been lower if certain expenses had not been reduced during the applicable periods shown.
G Fees and expenses of any underlying mutual funds or exchange-traded funds (ETFs) are not included in the Fund's expense ratio. The Fund indirectly bears its proportionate share of these expenses.
H Expense ratios reflect operating expenses of the class. Expenses before reductions do not reflect amounts reimbursed, waived, or reduced through arrangements with the investment adviser, brokerage services, or other offset arrangements, if applicable, and do not represent the amount paid by the class during periods when reimbursements, waivers or reductions occur.
I Amount represents less than .005%.
J Annualized
K Amount does not include the portfolio activity of any underlying mutual funds or exchange-traded funds (ETFs).
See accompanying notes which are an integral part of the financial statements.
VIP Freedom Income Portfolio Service Class
| Six months ended (Unaudited) June 30, | Years endedDecember 31, | |||||
| 2022 | 2021 | 2020 | 2019 | 2018 | 2017 | |
| Selected Per–Share Data | ||||||
| Net asset value, beginning of period | $12.74 | $12.73 | $11.88 | $11.07 | $11.63 | $10.97 |
| Income from Investment Operations | ||||||
| Net investment income (loss)A,B | –C | .22 | .16 | .26 | .21 | .18 |
| Net realized and unrealized gain (loss) | (1.35) | .18 | 1.06 | 1.03 | (.46) | .75 |
| Total from investment operations | (1.35) | .40 | 1.22 | 1.29 | (.25) | .93 |
| Distributions from net investment income | (.12) | (.12) | (.15) | (.24) | (.19) | (.17) |
| Distributions from net realized gain | (.40) | (.27) | (.22) | (.25) | (.13) | (.10) |
| Total distributions | (.52) | (.39) | (.37) | (.48)D | (.31)D | (.27) |
| Net asset value, end of period | $10.87 | $12.74 | $12.73 | $11.88 | $11.07 | $11.63 |
| Total ReturnE,F,G | (10.97)% | 3.17% | 10.38% | 11.87% | (2.12)% | 8.49% |
| Ratios to Average Net AssetsB,H,I | ||||||
| Expenses before reductions | .10%J | .10% | .10% | .10% | .10% | .10% |
| Expenses net of fee waivers, if any | .10%J | .10% | .10% | .10% | .10% | .10% |
| Expenses net of all reductions | .10%J | .10% | .10% | .10% | .10% | .10% |
| Net investment income (loss) | .03%J | 1.75% | 1.30% | 2.21% | 1.80% | 1.57% |
| Supplemental Data | ||||||
| Net assets, end of period (000 omitted) | $26,000 | $32,637 | $32,810 | $24,831 | $14,591 | $11,227 |
| Portfolio turnover rateK | 130%J | 52% | 66% | 40% | 48% | 35% |
A Calculated based on average shares outstanding during the period.
B Net investment income (loss) is affected by the timing of the declaration of dividends by any underlying mutual funds or exchange-traded funds (ETFs). Net investment income (loss) of any such underlying funds is not included in the Fund's net investment income (loss) ratio.
C Amount represents less than $.005 per share.
D Total distributions per share do not sum due to rounding.
E Total returns for periods of less than one year are not annualized.
F Total returns do not reflect charges attributable to your insurance company's separate account. Inclusion of these charges would reduce the total returns shown.
G Total returns would have been lower if certain expenses had not been reduced during the applicable periods shown.
H Fees and expenses of any underlying mutual funds or exchange-traded funds (ETFs) are not included in the Fund's expense ratio. The Fund indirectly bears its proportionate share of these expenses.
I Expense ratios reflect operating expenses of the class. Expenses before reductions do not reflect amounts reimbursed, waived, or reduced through arrangements with the investment adviser, brokerage services, or other offset arrangements, if applicable, and do not represent the amount paid by the class during periods when reimbursements, waivers or reductions occur.
J Annualized
K Amount does not include the portfolio activity of any underlying mutual funds or exchange-traded funds (ETFs).
See accompanying notes which are an integral part of the financial statements.
VIP Freedom Income Portfolio Service Class 2
| Six months ended (Unaudited) June 30, | Years endedDecember 31, | |||||
| 2022 | 2021 | 2020 | 2019 | 2018 | 2017 | |
| Selected Per–Share Data | ||||||
| Net asset value, beginning of period | $12.69 | $12.68 | $11.83 | $11.03 | $11.59 | $10.93 |
| Income from Investment Operations | ||||||
| Net investment income (loss)A,B | (.01) | .20 | .14 | .24 | .19 | .16 |
| Net realized and unrealized gain (loss) | (1.35) | .18 | 1.06 | 1.02 | (.45) | .75 |
| Total from investment operations | (1.36) | .38 | 1.20 | 1.26 | (.26) | .91 |
| Distributions from net investment income | (.12) | (.10) | (.13) | (.22) | (.17) | (.15) |
| Distributions from net realized gain | (.40) | (.27) | (.22) | (.25) | (.13) | (.10) |
| Total distributions | (.52) | (.37) | (.35) | (.46)C | (.30) | (.25) |
| Net asset value, end of period | $10.81 | $12.69 | $12.68 | $11.83 | $11.03 | $11.59 |
| Total ReturnD,E,F | (11.09)% | 3.03% | 10.29% | 11.63% | (2.27)% | 8.36% |
| Ratios to Average Net AssetsB,G,H | ||||||
| Expenses before reductions | .25%I | .25% | .25% | .25% | .25% | .25% |
| Expenses net of fee waivers, if any | .25%I | .25% | .25% | .25% | .25% | .25% |
| Expenses net of all reductions | .25%I | .25% | .25% | .25% | .25% | .25% |
| Net investment income (loss) | (.12)%I | 1.60% | 1.15% | 2.06% | 1.65% | 1.42% |
| Supplemental Data | ||||||
| Net assets, end of period (000 omitted) | $23,528 | $28,521 | $27,518 | $18,333 | $15,459 | $14,911 |
| Portfolio turnover rateJ | 130%I | 52% | 66% | 40% | 48% | 35% |
A Calculated based on average shares outstanding during the period.
B Net investment income (loss) is affected by the timing of the declaration of dividends by any underlying mutual funds or exchange-traded funds (ETFs). Net investment income (loss) of any such underlying funds is not included in the Fund's net investment income (loss) ratio.
C Total distributions per share do not sum due to rounding.
D Total returns for periods of less than one year are not annualized.
E Total returns do not reflect charges attributable to your insurance company's separate account. Inclusion of these charges would reduce the total returns shown.
F Total returns would have been lower if certain expenses had not been reduced during the applicable periods shown.
G Fees and expenses of any underlying mutual funds or exchange-traded funds (ETFs) are not included in the Fund's expense ratio. The Fund indirectly bears its proportionate share of these expenses.
H Expense ratios reflect operating expenses of the class. Expenses before reductions do not reflect amounts reimbursed, waived, or reduced through arrangements with the investment adviser, brokerage services, or other offset arrangements, if applicable, and do not represent the amount paid by the class during periods when reimbursements, waivers or reductions occur.
I Annualized
J Amount does not include the portfolio activity of any underlying mutual funds or exchange-traded funds (ETFs).
See accompanying notes which are an integral part of the financial statements.
VIP Freedom 2005 Portfolio℠
Investment Summary (Unaudited)
The information in the following tables is based on the direct investments of the Fund.Top Holdings as of June 30, 2022
| % of fund's net assets | |
| VIP Investment Grade Bond II Portfolio Initial Class | 35.5 |
| VIP Government Money Market Portfolio Initial Class 1.18% | 17.6 |
| Fidelity Inflation-Protected Bond Index Fund | 16.3 |
| VIP Overseas Portfolio Initial Class | 7.9 |
| VIP Emerging Markets Portfolio Initial Class | 7.1 |
| Fidelity Long-Term Treasury Bond Index Fund | 3.8 |
| Fidelity International Bond Index Fund | 2.6 |
| VIP High Income Portfolio Initial Class | 1.6 |
| VIP Growth Portfolio Initial Class | 1.6 |
| VIP Growth & Income Portfolio Initial Class | 1.6 |
| 95.6 |
Asset Allocation (% of fund's net assets)
| Period end | ||
| Domestic Equity Funds | 7.6% | |
| International Equity Funds | 15.0% | |
| Bond Funds | 59.8% | |
| Short-Term Funds | 17.6% | |

VIP Freedom 2005 Portfolio℠
Schedule of Investments June 30, 2022 (Unaudited)
Showing Percentage of Net Assets
| Domestic Equity Funds - 7.6% | |||
| Shares | Value | ||
| VIP Contrafund Portfolio Initial Class (a) | 3,596 | $141,061 | |
| VIP Equity-Income Portfolio Initial Class (a) | 6,217 | 145,041 | |
| VIP Growth & Income Portfolio Initial Class (a) | 7,466 | 171,935 | |
| VIP Growth Portfolio Initial Class (a) | 2,385 | 177,771 | |
| VIP Mid Cap Portfolio Initial Class (a) | 1,322 | 41,928 | |
| VIP Value Portfolio Initial Class (a) | 6,442 | 105,907 | |
| VIP Value Strategies Portfolio Initial Class (a) | 3,625 | 51,733 | |
| TOTAL DOMESTIC EQUITY FUNDS | |||
| (Cost $560,756) | 835,376 | ||
| International Equity Funds - 15.0% | |||
| VIP Emerging Markets Portfolio Initial Class (a) | 77,094 | 775,569 | |
| VIP Overseas Portfolio Initial Class (a) | 41,730 | 869,647 | |
| TOTAL INTERNATIONAL EQUITY FUNDS | |||
| (Cost $1,532,374) | 1,645,216 | ||
| Bond Funds - 59.8% | |||
| Fidelity Inflation-Protected Bond Index Fund (a) | 176,527 | 1,791,749 | |
| Fidelity International Bond Index Fund (a) | 31,865 | 289,974 | |
| Fidelity Long-Term Treasury Bond Index Fund (a) | 36,344 | 419,043 | |
| VIP High Income Portfolio Initial Class (a) | 39,957 | 180,608 | |
| VIP Investment Grade Bond II Portfolio Initial Class (a) | 399,315 | 3,897,311 | |
| TOTAL BOND FUNDS | |||
| (Cost $6,743,665) | 6,578,685 | ||
| Short-Term Funds - 17.6% | |||
| VIP Government Money Market Portfolio Initial Class 1.18% (a)(b) | |||
| (Cost $1,933,035) | 1,933,035 | 1,933,035 | |
| TOTAL INVESTMENT IN SECURITIES - 100.0% | |||
| (Cost $10,769,830) | 10,992,312 | ||
| NET OTHER ASSETS (LIABILITIES) - 0.0% | (256) | ||
| NET ASSETS - 100% | $10,992,056 |
Legend
(a) Affiliated Fund
(b) The rate quoted is the annualized seven-day yield of the fund at period end.
Affiliated Underlying Funds
Fiscal year to date information regarding the Fund's investments in affiliated Underlying Funds is presented below. Exchanges between classes of the same affiliated Underlying Funds may occur, and are excluded from purchases and sales below if applicable. If an underlying Fund changes its name, the name presented below is the name in effect at period end.
| Affiliate | Value, beginning of period | Purchases(a) | Sales Proceeds(a) | Dividend Income | Realized Gain (loss) | Change in Unrealized appreciation (depreciation) | Value, end of period |
| Fidelity Inflation-Protected Bond Index Fund | $1,992,125 | $436,434 | $457,943 | $-- | $(13,612) | $(165,255) | $1,791,749 |
| Fidelity International Bond Index Fund | 218,817 | 157,899 | 62,838 | 472 | (1,560) | (22,344) | 289,974 |
| Fidelity Long-Term Treasury Bond Index Fund | 402,147 | 207,187 | 103,558 | 4,150 | (4,543) | (82,190) | 419,043 |
| VIP Contrafund Portfolio Initial Class | 213,143 | 54,197 | 69,600 | 1,829 | 1,866 | (58,545) | 141,061 |
| VIP Emerging Markets Portfolio Initial Class | 1,007,343 | 239,362 | 280,064 | -- | (19,421) | (171,651) | 775,569 |
| VIP Equity-Income Portfolio Initial Class | 225,474 | 41,071 | 101,477 | 264 | 7,435 | (27,462) | 145,041 |
| VIP Government Money Market Portfolio Initial Class 1.18% | 2,654,771 | 278,624 | 1,000,354 | 2,658 | (6) | -- | 1,933,035 |
| VIP Growth & Income Portfolio Initial Class | 256,664 | 55,023 | 115,428 | 455 | 33,281 | (57,605) | 171,935 |
| VIP Growth Portfolio Initial Class | 217,982 | 94,991 | 75,972 | 9,376 | (4,401) | (54,829) | 177,771 |
| VIP High Income Portfolio Initial Class | 282,012 | 25,960 | 95,416 | 101 | (6,010) | (25,938) | 180,608 |
| VIP Investment Grade Bond Portfolio II Initial Class | -- | 4,256,347 | 261,712 | -- | (2,153) | (95,171) | 3,897,311 |
| VIP Investment Grade Bond Portfolio Initial Class | 5,262,425 | 655,292 | 5,275,252 | 227,667 | (386,709) | (255,756) | -- |
| VIP Mid Cap Portfolio Initial Class | 62,536 | 12,725 | 20,192 | 1,333 | (735) | (12,406) | 41,928 |
| VIP Overseas Portfolio Initial Class | 1,096,126 | 320,882 | 220,714 | 7,891 | (15,697) | (310,950) | 869,647 |
| VIP Value Portfolio Initial Class | 165,310 | 27,700 | 74,248 | 1,986 | 13,031 | (25,886) | 105,907 |
| VIP Value Strategies Portfolio Initial Class | 80,987 | 10,961 | 31,921 | 636 | 5,142 | (13,436) | 51,733 |
| $14,137,862 | $6,874,655 | $8,246,689 | $258,818 | $(394,092) | $(1,379,424) | $10,992,312 |
(a) Includes the value of shares purchased or redeemed through in-kind transactions, as applicable.
Amounts in the income column in the above table include any capital gain distributions from underlying funds, which are presented in the corresponding line-item in the Statement of Operations, if applicable.
Investment Valuation
The following is a summary of the inputs used, as of June 30, 2022, involving the Fund's assets and liabilities carried at fair value. The inputs or methodology used for valuing securities may not be an indication of the risk associated with investing in those securities. For more information on valuation inputs, and their aggregation into the levels used below, please refer to the Investment Valuation section in the accompanying Notes to Financial Statements.
| Valuation Inputs at Reporting Date: | ||||
| Description | Total | Level 1 | Level 2 | Level 3 |
| Investments in Securities: | ||||
| Domestic Equity Funds | $835,376 | $835,376 | $-- | $-- |
| International Equity Funds | 1,645,216 | 1,645,216 | -- | -- |
| Bond Funds | 6,578,685 | 6,578,685 | -- | -- |
| Short-Term Funds | 1,933,035 | 1,933,035 | -- | -- |
| Total Investments in Securities: | $10,992,312 | $10,992,312 | $-- | $-- |
See accompanying notes which are an integral part of the financial statements.
VIP Freedom 2005 Portfolio℠
Financial Statements
Statement of Assets and Liabilities
| June 30, 2022 (Unaudited) | ||
| Assets | ||
| Investment in securities, at value — See accompanying schedule: | ||
| Affiliated issuers (cost $10,769,830) | $10,992,312 | |
| Total Investment in Securities (cost $10,769,830) | $10,992,312 | |
| Cash | 14 | |
| Receivable for investments sold | 111,617 | |
| Receivable for fund shares sold | 533 | |
| Total assets | 11,104,476 | |
| Liabilities | ||
| Payable for investments purchased | $81,383 | |
| Payable for fund shares redeemed | 30,763 | |
| Distribution and service plan fees payable | 274 | |
| Total liabilities | 112,420 | |
| Net Assets | $10,992,056 | |
| Net Assets consist of: | ||
| Paid in capital | $10,950,606 | |
| Total accumulated earnings (loss) | 41,450 | |
| Net Assets | $10,992,056 | |
| Net Asset Value and Maximum Offering Price | ||
| Initial Class: | ||
| Net Asset Value, offering price and redemption price per share ($8,027,442 ÷ 710,421 shares) | $11.30 | |
| Service Class: | ||
| Net Asset Value, offering price and redemption price per share ($2,790,466 ÷ 245,330 shares) | $11.37 | |
| Service Class 2: | ||
| Net Asset Value, offering price and redemption price per share ($174,148 ÷ 15,468 shares) | $11.26 |
See accompanying notes which are an integral part of the financial statements.
Statement of Operations
| Six months ended June 30, 2022 (Unaudited) | ||
| Investment Income | ||
| Dividends: | ||
| Affiliated issuers | $8,068 | |
| Expenses | ||
| Distribution and service plan fees | $1,931 | |
| Independent trustees' fees and expenses | 19 | |
| Total expenses | 1,950 | |
| Net investment income (loss) | 6,118 | |
| Realized and Unrealized Gain (Loss) | ||
| Net realized gain (loss) on: | ||
| Investment securities: | ||
| Affiliated issuers | (394,092) | |
| Capital gain distributions from underlying funds: | ||
| Affiliated issuers | 250,750 | |
| Total net realized gain (loss) | (143,342) | |
| Change in net unrealized appreciation (depreciation) on: | ||
| Investment securities: | ||
| Affiliated issuers | (1,379,424) | |
| Total change in net unrealized appreciation (depreciation) | (1,379,424) | |
| Net gain (loss) | (1,522,766) | |
| Net increase (decrease) in net assets resulting from operations | $(1,516,648) |
See accompanying notes which are an integral part of the financial statements.
Statement of Changes in Net Assets
| Six months ended June 30, 2022 (Unaudited) | Year ended December 31, 2021 | |
| Increase (Decrease) in Net Assets | ||
| Operations | ||
| Net investment income (loss) | $6,118 | $260,834 |
| Net realized gain (loss) | (143,342) | 884,110 |
| Change in net unrealized appreciation (depreciation) | (1,379,424) | (552,765) |
| Net increase (decrease) in net assets resulting from operations | (1,516,648) | 592,179 |
| Distributions to shareholders | (857,260) | (542,304) |
| Share transactions - net increase (decrease) | (771,546) | (1,953,374) |
| Total increase (decrease) in net assets | (3,145,454) | (1,903,499) |
| Net Assets | ||
| Beginning of period | 14,137,510 | 16,041,009 |
| End of period | $10,992,056 | $14,137,510 |
See accompanying notes which are an integral part of the financial statements.
Financial Highlights
VIP Freedom 2005 Portfolio Initial Class
| Six months ended (Unaudited) June 30, | Years endedDecember 31, | |||||
| 2022 | 2021 | 2020 | 2019 | 2018 | 2017 | |
| Selected Per–Share Data | ||||||
| Net asset value, beginning of period | $13.67 | $13.63 | $12.75 | $11.65 | $12.39 | $11.51 |
| Income from Investment Operations | ||||||
| Net investment income (loss)A,B | .01 | .25 | .17 | .27 | .22 | .20 |
| Net realized and unrealized gain (loss) | (1.49) | .30 | 1.23 | 1.32 | (.58) | 1.06 |
| Total from investment operations | (1.48) | .55 | 1.40 | 1.59 | (.36) | 1.26 |
| Distributions from net investment income | (.12) | (.15) | (.17) | (.27) | (.20) | (.19) |
| Distributions from net realized gain | (.77) | (.36) | (.35) | (.22) | (.17) | (.19) |
| Total distributions | (.89) | (.51) | (.52) | (.49) | (.38)C | (.38) |
| Net asset value, end of period | $11.30 | $13.67 | $13.63 | $12.75 | $11.65 | $12.39 |
| Total ReturnD,E,F | (11.42)% | 4.09% | 11.25% | 13.81% | (2.95)% | 11.06% |
| Ratios to Average Net AssetsB,G,H | ||||||
| Expenses before reductionsI | - %J | -% | -% | -% | -% | -% |
| Expenses net of fee waivers, if any | - %I,J | - %I | - %I | - %I | - %I | -% |
| Expenses net of all reductions | - %I,J | - %I | - %I | - %I | - %I | -% |
| Net investment income (loss) | .13%J | 1.82% | 1.31% | 2.18% | 1.80% | 1.65% |
| Supplemental Data | ||||||
| Net assets, end of period (000 omitted) | $8,027 | $9,853 | $10,082 | $9,364 | $8,191 | $7,931 |
| Portfolio turnover rateK | 111%J | 31% | 54% | 24% | 32% | 33% |
A Calculated based on average shares outstanding during the period.
B Net investment income (loss) is affected by the timing of the declaration of dividends by any underlying mutual funds or exchange-traded funds (ETFs). Net investment income (loss) of any such underlying funds is not included in the Fund's net investment income (loss) ratio.
C Total distributions per share do not sum due to rounding.
D Total returns for periods of less than one year are not annualized.
E Total returns do not reflect charges attributable to your insurance company's separate account. Inclusion of these charges would reduce the total returns shown.
F Total returns would have been lower if certain expenses had not been reduced during the applicable periods shown.
G Fees and expenses of any underlying mutual funds or exchange-traded funds (ETFs) are not included in the Fund's expense ratio. The Fund indirectly bears its proportionate share of these expenses.
H Expense ratios reflect operating expenses of the class. Expenses before reductions do not reflect amounts reimbursed, waived, or reduced through arrangements with the investment adviser, brokerage services, or other offset arrangements, if applicable, and do not represent the amount paid by the class during periods when reimbursements, waivers or reductions occur.
I Amount represents less than .005%.
J Annualized
K Amount does not include the portfolio activity of any underlying mutual funds or exchange-traded funds (ETFs).
See accompanying notes which are an integral part of the financial statements.
VIP Freedom 2005 Portfolio Service Class
| Six months ended (Unaudited) June 30, | Years endedDecember 31, | |||||
| 2022 | 2021 | 2020 | 2019 | 2018 | 2017 | |
| Selected Per–Share Data | ||||||
| Net asset value, beginning of period | $13.76 | $13.71 | $12.83 | $11.72 | $12.46 | $11.58 |
| Income from Investment Operations | ||||||
| Net investment income (loss)A,B | –C | .24 | .16 | .26 | .21 | .19 |
| Net realized and unrealized gain (loss) | (1.50) | .30 | 1.23 | 1.33 | (.58) | 1.06 |
| Total from investment operations | (1.50) | .54 | 1.39 | 1.59 | (.37) | 1.25 |
| Distributions from net investment income | (.12) | (.14) | (.16) | (.26) | (.20) | (.18) |
| Distributions from net realized gain | (.77) | (.36) | (.35) | (.22) | (.17) | (.19) |
| Total distributions | (.89) | (.49)D | (.51) | (.48) | (.37) | (.37) |
| Net asset value, end of period | $11.37 | $13.76 | $13.71 | $12.83 | $11.72 | $12.46 |
| Total ReturnE,F,G | (11.50)% | 4.02% | 11.07% | 13.71% | (3.01)% | 10.90% |
| Ratios to Average Net AssetsB,H,I | ||||||
| Expenses before reductions | .10%J | .10% | .10% | .10% | .10% | .10% |
| Expenses net of fee waivers, if any | .10%J | .10% | .10% | .10% | .10% | .10% |
| Expenses net of all reductions | .10%J | .10% | .10% | .10% | .10% | .10% |
| Net investment income (loss) | .03%J | 1.72% | 1.21% | 2.08% | 1.70% | 1.55% |
| Supplemental Data | ||||||
| Net assets, end of period (000 omitted) | $2,790 | $4,080 | $5,673 | $4,248 | $2,279 | $1,222 |
| Portfolio turnover rateK | 111%J | 31% | 54% | 24% | 32% | 33% |
A Calculated based on average shares outstanding during the period.
B Net investment income (loss) is affected by the timing of the declaration of dividends by any underlying mutual funds or exchange-traded funds (ETFs). Net investment income (loss) of any such underlying funds is not included in the Fund's net investment income (loss) ratio.
C Amount represents less than $.005 per share.
D Total distributions per share do not sum due to rounding.
E Total returns for periods of less than one year are not annualized.
F Total returns do not reflect charges attributable to your insurance company's separate account. Inclusion of these charges would reduce the total returns shown.
G Total returns would have been lower if certain expenses had not been reduced during the applicable periods shown.
H Fees and expenses of any underlying mutual funds or exchange-traded funds (ETFs) are not included in the Fund's expense ratio. The Fund indirectly bears its proportionate share of these expenses.
I Expense ratios reflect operating expenses of the class. Expenses before reductions do not reflect amounts reimbursed, waived, or reduced through arrangements with the investment adviser, brokerage services, or other offset arrangements, if applicable, and do not represent the amount paid by the class during periods when reimbursements, waivers or reductions occur.
J Annualized
K Amount does not include the portfolio activity of any underlying mutual funds or exchange-traded funds (ETFs).
See accompanying notes which are an integral part of the financial statements.
VIP Freedom 2005 Portfolio Service Class 2
| Six months ended (Unaudited) June 30, | Years endedDecember 31, | |||||
| 2022 | 2021 | 2020 | 2019 | 2018 | 2017 | |
| Selected Per–Share Data | ||||||
| Net asset value, beginning of period | $13.64 | $13.59 | $12.72 | $11.62 | $12.37 | $11.50 |
| Income from Investment Operations | ||||||
| Net investment income (loss)A,B | (.01) | .21 | .14 | .24 | .19 | .17 |
| Net realized and unrealized gain (loss) | (1.48) | .30 | 1.22 | 1.32 | (.59) | 1.05 |
| Total from investment operations | (1.49) | .51 | 1.36 | 1.56 | (.40) | 1.22 |
| Distributions from net investment income | (.12) | (.10) | (.14) | (.24) | (.18) | (.16) |
| Distributions from net realized gain | (.77) | (.36) | (.35) | (.22) | (.17) | (.19) |
| Total distributions | (.89) | (.46) | (.49) | (.46) | (.35) | (.35) |
| Net asset value, end of period | $11.26 | $13.64 | $13.59 | $12.72 | $11.62 | $12.37 |
| Total ReturnC,D | (11.53)% | 3.82% | 10.93% | 13.60% | (3.24)% | 10.74% |
| Ratios to Average Net AssetsB,E,F | ||||||
| Expenses before reductions | .25%G | .25% | .25% | .25% | .25% | .25% |
| Expenses net of fee waivers, if any | .25%G | .25% | .25% | .25% | .25% | .25% |
| Expenses net of all reductions | .25%G | .25% | .25% | .25% | .25% | .25% |
| Net investment income (loss) | (.12)%G | 1.57% | 1.06% | 1.93% | 1.55% | 1.40% |
| Supplemental Data | ||||||
| Net assets, end of period (000 omitted) | $174 | $204 | $286 | $178 | $121 | $104 |
| Portfolio turnover rateH | 111%G | 31% | 54% | 24% | 32% | 33% |
A Calculated based on average shares outstanding during the period.
B Net investment income (loss) is affected by the timing of the declaration of dividends by any underlying mutual funds or exchange-traded funds (ETFs). Net investment income (loss) of any such underlying funds is not included in the Fund's net investment income (loss) ratio.
C Total returns for periods of less than one year are not annualized.
D Total returns do not reflect charges attributable to your insurance company's separate account. Inclusion of these charges would reduce the total returns shown.
E Fees and expenses of any underlying mutual funds or exchange-traded funds (ETFs) are not included in the Fund's expense ratio. The Fund indirectly bears its proportionate share of these expenses.
F Expense ratios reflect operating expenses of the class. Expenses before reductions do not reflect amounts reimbursed, waived, or reduced through arrangements with the investment adviser, brokerage services, or other offset arrangements, if applicable, and do not represent the amount paid by the class during periods when reimbursements, waivers or reductions occur.
G Annualized
H Amount does not include the portfolio activity of any underlying mutual funds or exchange-traded funds (ETFs).
See accompanying notes which are an integral part of the financial statements.
VIP Freedom 2010 Portfolio℠
Investment Summary (Unaudited)
The information in the following tables is based on the direct investments of the Fund.Top Holdings as of June 30, 2022
| % of fund's net assets | |
| VIP Investment Grade Bond II Portfolio Initial Class | 32.6 |
| Fidelity Inflation-Protected Bond Index Fund | 15.2 |
| VIP Government Money Market Portfolio Initial Class 1.18% | 12.1 |
| VIP Overseas Portfolio Initial Class | 10.5 |
| VIP Emerging Markets Portfolio Initial Class | 8.1 |
| Fidelity Long-Term Treasury Bond Index Fund | 4.0 |
| Fidelity International Bond Index Fund | 2.9 |
| VIP Growth Portfolio Initial Class | 2.8 |
| VIP Growth & Income Portfolio Initial Class | 2.7 |
| VIP Equity-Income Portfolio Initial Class | 2.2 |
| 93.1 |
Asset Allocation (% of fund's net assets)
| Period end | ||
| Domestic Equity Funds | 12.9% | |
| International Equity Funds | 18.6% | |
| Bond Funds | 56.4% | |
| Short-Term Funds | 12.1% | |
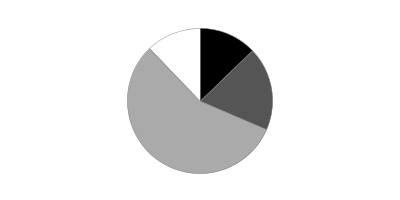
VIP Freedom 2010 Portfolio℠
Schedule of Investments June 30, 2022 (Unaudited)
Showing Percentage of Net Assets
| Domestic Equity Funds - 12.9% | |||
| Shares | Value | ||
| VIP Contrafund Portfolio Initial Class (a) | 169,172 | $6,636,616 | |
| VIP Equity-Income Portfolio Initial Class (a) | 292,514 | 6,824,348 | |
| VIP Growth & Income Portfolio Initial Class (a) | 351,272 | 8,089,800 | |
| VIP Growth Portfolio Initial Class (a) | 112,209 | 8,362,905 | |
| VIP Mid Cap Portfolio Initial Class (a) | 62,184 | 1,972,484 | |
| VIP Value Portfolio Initial Class (a) | 303,068 | 4,982,442 | |
| VIP Value Strategies Portfolio Initial Class (a) | 170,588 | 2,434,286 | |
| TOTAL DOMESTIC EQUITY FUNDS | |||
| (Cost $38,505,381) | 39,302,881 | ||
| International Equity Funds - 18.6% | |||
| VIP Emerging Markets Portfolio Initial Class (a) | 2,449,851 | 24,645,497 | |
| VIP Overseas Portfolio Initial Class (a) | 1,520,274 | 31,682,509 | |
| TOTAL INTERNATIONAL EQUITY FUNDS | |||
| (Cost $57,665,769) | 56,328,006 | ||
| Bond Funds - 56.4% | |||
| Fidelity Inflation-Protected Bond Index Fund (a) | 4,552,887 | 46,211,803 | |
| Fidelity International Bond Index Fund (a) | 972,078 | 8,845,909 | |
| Fidelity Long-Term Treasury Bond Index Fund (a) | 1,055,760 | 12,172,917 | |
| VIP High Income Portfolio Initial Class (a) | 1,105,047 | 4,994,812 | |
| VIP Investment Grade Bond II Portfolio Initial Class (a) | 10,155,504 | 99,117,715 | |
| TOTAL BOND FUNDS | |||
| (Cost $175,825,451) | 171,343,156 | ||
| Short-Term Funds - 12.1% | |||
| VIP Government Money Market Portfolio Initial Class 1.18% (a)(b) | |||
| (Cost $36,784,101) | 36,784,101 | 36,784,101 | |
| TOTAL INVESTMENT IN SECURITIES - 100.0% | |||
| (Cost $308,780,702) | 303,758,144 | ||
| NET OTHER ASSETS (LIABILITIES) - 0.0% | (58,657) | ||
| NET ASSETS - 100% | $303,699,487 |
Legend
(a) Affiliated Fund
(b) The rate quoted is the annualized seven-day yield of the fund at period end.
Affiliated Underlying Funds
Fiscal year to date information regarding the Fund's investments in affiliated Underlying Funds is presented below. Exchanges between classes of the same affiliated Underlying Funds may occur, and are excluded from purchases and sales below if applicable. If an underlying Fund changes its name, the name presented below is the name in effect at period end.
| Affiliate | Value, beginning of period | Purchases(a) | Sales Proceeds(a) | Dividend Income | Realized Gain (loss) | Change in Unrealized appreciation (depreciation) | Value, end of period |
| Fidelity Inflation-Protected Bond Index Fund | $47,495,943 | $86,971,384 | $83,785,024 | $-- | $461,703 | $(4,932,203) | $46,211,803 |
| Fidelity International Bond Index Fund | 6,273,471 | 17,980,184 | 14,690,825 | 14,021 | (561,616) | (155,305) | 8,845,909 |
| Fidelity Long-Term Treasury Bond Index Fund | 10,872,986 | 20,759,472 | 17,005,461 | 117,968 | (1,036,600) | (1,417,480) | 12,172,917 |
| VIP Contrafund Portfolio Initial Class | 9,089,903 | 14,024,105 | 13,947,784 | 82,501 | 2,645,262 | (5,174,870) | 6,636,616 |
| VIP Emerging Markets Portfolio Initial Class | 30,346,002 | 48,073,312 | 47,817,586 | -- | 1,732,711 | (7,688,942) | 24,645,497 |
| VIP Equity-Income Portfolio Initial Class | 9,615,670 | 13,927,710 | 15,808,373 | 11,885 | 2,059,095 | (2,969,754) | 6,824,348 |
| VIP Government Money Market Portfolio Initial Class 1.18% | 51,966,048 | 74,288,520 | 89,470,467 | 50,987 | -- | -- | 36,784,101 |
| VIP Growth & Income Portfolio Initial Class | 10,945,941 | 16,219,752 | 17,952,066 | 20,503 | 4,656,101 | (5,779,928) | 8,089,800 |
| VIP Growth Portfolio Initial Class | 9,296,427 | 16,201,292 | 14,499,537 | 422,942 | 3,153,500 | (5,788,777) | 8,362,905 |
| VIP High Income Portfolio Initial Class | 7,415,524 | 9,022,376 | 10,570,510 | 2,798 | (521,092) | (351,486) | 4,994,812 |
| VIP Investment Grade Bond Portfolio II Initial Class | -- | 106,209,264 | 4,586,527 | -- | (80,855) | (2,424,167) | 99,117,715 |
| VIP Investment Grade Bond Portfolio Initial Class | 126,808,735 | 184,553,109 | 295,357,842 | 5,783,783 | (11,465,648) | (4,538,354) | -- |
| VIP Mid Cap Portfolio Initial Class | 2,666,893 | 4,014,016 | 4,120,069 | 59,761 | 372,899 | (961,255) | 1,972,484 |
| VIP Overseas Portfolio Initial Class | 38,344,118 | 65,490,943 | 60,379,911 | 290,046 | 5,825,667 | (17,598,308) | 31,682,509 |
| VIP Value Portfolio Initial Class | 7,049,870 | 10,175,192 | 11,650,387 | 89,419 | 2,257,793 | (2,850,026) | 4,982,442 |
| VIP Value Strategies Portfolio Initial Class | 3,453,793 | 4,862,046 | 5,501,036 | 28,656 | 1,264,023 | (1,644,540) | 2,434,286 |
| $371,641,324 | $692,772,677 | $707,143,405 | $6,975,270 | $10,762,943 | $(64,275,395) | $303,758,144 |
(a) Includes the value of shares purchased or redeemed through in-kind transactions, as applicable.
Amounts in the income column in the above table include any capital gain distributions from underlying funds, which are presented in the corresponding line-item in the Statement of Operations, if applicable.
Investment Valuation
The following is a summary of the inputs used, as of June 30, 2022, involving the Fund's assets and liabilities carried at fair value. The inputs or methodology used for valuing securities may not be an indication of the risk associated with investing in those securities. For more information on valuation inputs, and their aggregation into the levels used below, please refer to the Investment Valuation section in the accompanying Notes to Financial Statements.
| Valuation Inputs at Reporting Date: | ||||
| Description | Total | Level 1 | Level 2 | Level 3 |
| Investments in Securities: | ||||
| Domestic Equity Funds | $39,302,881 | $39,302,881 | $-- | $-- |
| International Equity Funds | 56,328,006 | 56,328,006 | -- | -- |
| Bond Funds | 171,343,156 | 171,343,156 | -- | -- |
| Short-Term Funds | 36,784,101 | 36,784,101 | -- | -- |
| Total Investments in Securities: | $303,758,144 | $303,758,144 | $-- | $-- |
See accompanying notes which are an integral part of the financial statements.
VIP Freedom 2010 Portfolio℠
Financial Statements
Statement of Assets and Liabilities
| June 30, 2022 (Unaudited) | ||
| Assets | ||
| Investment in securities, at value — See accompanying schedule: | ||
| Affiliated issuers (cost $308,780,702) | $303,758,144 | |
| Total Investment in Securities (cost $308,780,702) | $303,758,144 | |
| Receivable for investments sold | 3,185,047 | |
| Receivable for fund shares sold | 2,635 | |
| Total assets | 306,945,826 | |
| Liabilities | ||
| Payable for investments purchased | $3,116,783 | |
| Payable for fund shares redeemed | 70,897 | |
| Distribution and service plan fees payable | 58,659 | |
| Total liabilities | 3,246,339 | |
| Net Assets | $303,699,487 | |
| Net Assets consist of: | ||
| Paid in capital | $292,452,687 | |
| Total accumulated earnings (loss) | 11,246,800 | |
| Net Assets | $303,699,487 | |
| Net Asset Value and Maximum Offering Price | ||
| Initial Class: | ||
| Net Asset Value, offering price and redemption price per share ($12,539,056 ÷ 1,062,919 shares) | $11.80 | |
| Service Class: | ||
| Net Asset Value, offering price and redemption price per share ($23,483,305 ÷ 1,995,041 shares) | $11.77 | |
| Service Class 2: | ||
| Net Asset Value, offering price and redemption price per share ($267,677,126 ÷ 22,912,499 shares) | $11.68 |
See accompanying notes which are an integral part of the financial statements.
Statement of Operations
| Six months ended June 30, 2022 (Unaudited) | ||
| Investment Income | ||
| Dividends: | ||
| Affiliated issuers | $216,766 | |
| Expenses | ||
| Distribution and service plan fees | $382,479 | |
| Independent trustees' fees and expenses | 522 | |
| Total expenses | 383,001 | |
| Net investment income (loss) | (166,235) | |
| Realized and Unrealized Gain (Loss) | ||
| Net realized gain (loss) on: | ||
| Investment securities: | ||
| Affiliated issuers | 10,762,943 | |
| Capital gain distributions from underlying funds: | ||
| Affiliated issuers | 6,758,504 | |
| Total net realized gain (loss) | 17,521,447 | |
| Change in net unrealized appreciation (depreciation) on: | ||
| Investment securities: | ||
| Affiliated issuers | (64,275,395) | |
| Total change in net unrealized appreciation (depreciation) | (64,275,395) | |
| Net gain (loss) | (46,753,948) | |
| Net increase (decrease) in net assets resulting from operations | $(46,920,183) |
See accompanying notes which are an integral part of the financial statements.
Statement of Changes in Net Assets
| Six months ended June 30, 2022 (Unaudited) | Year ended December 31, 2021 | |
| Increase (Decrease) in Net Assets | ||
| Operations | ||
| Net investment income (loss) | $(166,235) | $5,971,829 |
| Net realized gain (loss) | 17,521,447 | 23,262,138 |
| Change in net unrealized appreciation (depreciation) | (64,275,395) | (8,646,332) |
| Net increase (decrease) in net assets resulting from operations | (46,920,183) | 20,587,635 |
| Distributions to shareholders | (22,676,794) | (16,036,037) |
| Share transactions - net increase (decrease) | 1,725,433 | 3,567,481 |
| Total increase (decrease) in net assets | (67,871,544) | 8,119,079 |
| Net Assets | ||
| Beginning of period | 371,571,031 | 363,451,952 |
| End of period | $303,699,487 | $371,571,031 |
See accompanying notes which are an integral part of the financial statements.
Financial Highlights
VIP Freedom 2010 Portfolio Initial Class
| Six months ended (Unaudited) June 30, | Years endedDecember 31, | |||||
| 2022 | 2021 | 2020 | 2019 | 2018 | 2017 | |
| Selected Per–Share Data | ||||||
| Net asset value, beginning of period | $14.45 | $14.28 | $13.42 | $12.32 | $13.43 | $12.31 |
| Income from Investment Operations | ||||||
| Net investment income (loss)A,B | .01 | .26 | .18 | .28 | .22 | .20 |
| Net realized and unrealized gain (loss) | (1.78) | .56 | 1.44 | 1.65 | (.75) | 1.39 |
| Total from investment operations | (1.77) | .82 | 1.62 | 1.93 | (.53) | 1.59 |
| Distributions from net investment income | (.11) | (.15) | (.18) | (.28) | (.22) | (.21) |
| Distributions from net realized gain | (.77) | (.50) | (.58) | (.55) | (.37) | (.26) |
| Total distributions | (.88) | (.65) | (.76) | (.83) | (.58)C | (.47) |
| Net asset value, end of period | $11.80 | $14.45 | $14.28 | $13.42 | $12.32 | $13.43 |
| Total ReturnD,E,F | (12.84)% | 5.89% | 12.49% | 16.09% | (4.00)% | 13.08% |
| Ratios to Average Net AssetsB,G,H | ||||||
| Expenses before reductionsI | - %J | -% | -% | -% | -% | -% |
| Expenses net of fee waivers, if any | - %I,J | - %I | - %I | - %I | - %I | -% |
| Expenses net of all reductions | - %I,J | - %I | - %I | - %I | - %I | -% |
| Net investment income (loss) | .13%J | 1.82% | 1.34% | 2.15% | 1.66% | 1.56% |
| Supplemental Data | ||||||
| Net assets, end of period (000 omitted) | $12,539 | $16,685 | $19,195 | $17,895 | $16,991 | $18,519 |
| Portfolio turnover rateK | 410%J | 29% | 40% | 28% | 31% | 22% |
A Calculated based on average shares outstanding during the period.
B Net investment income (loss) is affected by the timing of the declaration of dividends by any underlying mutual funds or exchange-traded funds (ETFs). Net investment income (loss) of any such underlying funds is not included in the Fund's net investment income (loss) ratio.
C Total distributions per share do not sum due to rounding.
D Total returns for periods of less than one year are not annualized.
E Total returns do not reflect charges attributable to your insurance company's separate account. Inclusion of these charges would reduce the total returns shown.
F Total returns would have been lower if certain expenses had not been reduced during the applicable periods shown.
G Fees and expenses of any underlying mutual funds or exchange-traded funds (ETFs) are not included in the Fund's expense ratio. The Fund indirectly bears its proportionate share of these expenses.
H Expense ratios reflect operating expenses of the class. Expenses before reductions do not reflect amounts reimbursed, waived, or reduced through arrangements with the investment adviser, brokerage services, or other offset arrangements, if applicable, and do not represent the amount paid by the class during periods when reimbursements, waivers or reductions occur.
I Amount represents less than .005%.
J Annualized
K Amount does not include the portfolio activity of any underlying mutual funds or exchange-traded funds (ETFs).
See accompanying notes which are an integral part of the financial statements.
VIP Freedom 2010 Portfolio Service Class
| Six months ended (Unaudited) June 30, | Years endedDecember 31, | |||||
| 2022 | 2021 | 2020 | 2019 | 2018 | 2017 | |
| Selected Per–Share Data | ||||||
| Net asset value, beginning of period | $14.43 | $14.26 | $13.40 | $12.30 | $13.41 | $12.30 |
| Income from Investment Operations | ||||||
| Net investment income (loss)A,B | –C | .25 | .16 | .27 | .20 | .19 |
| Net realized and unrealized gain (loss) | (1.78) | .56 | 1.44 | 1.64 | (.74) | 1.38 |
| Total from investment operations | (1.78) | .81 | 1.60 | 1.91 | (.54) | 1.57 |
| Distributions from net investment income | (.11) | (.14) | (.16) | (.27) | (.20) | (.19) |
| Distributions from net realized gain | (.77) | (.50) | (.58) | (.55) | (.37) | (.26) |
| Total distributions | (.88) | (.64) | (.74) | (.81)D | (.57) | (.46)D |
| Net asset value, end of period | $11.77 | $14.43 | $14.26 | $13.40 | $12.30 | $13.41 |
| Total ReturnE,F,G | (12.94)% | 5.79% | 12.39% | 16.00% | (4.10)% | 12.90% |
| Ratios to Average Net AssetsB,H,I | ||||||
| Expenses before reductions | .10%J | .10% | .10% | .10% | .10% | .10% |
| Expenses net of fee waivers, if any | .10%J | .10% | .10% | .10% | .10% | .10% |
| Expenses net of all reductions | .10%J | .10% | .10% | .10% | .10% | .10% |
| Net investment income (loss) | .03%J | 1.72% | 1.24% | 2.05% | 1.56% | 1.46% |
| Supplemental Data | ||||||
| Net assets, end of period (000 omitted) | $23,483 | $27,360 | $26,484 | $26,232 | $23,851 | $27,597 |
| Portfolio turnover rateK | 410%J | 29% | 40% | 28% | 31% | 22% |
A Calculated based on average shares outstanding during the period.
B Net investment income (loss) is affected by the timing of the declaration of dividends by any underlying mutual funds or exchange-traded funds (ETFs). Net investment income (loss) of any such underlying funds is not included in the Fund's net investment income (loss) ratio.
C Amount represents less than $.005 per share.
D Total distributions per share do not sum due to rounding.
E Total returns for periods of less than one year are not annualized.
F Total returns do not reflect charges attributable to your insurance company's separate account. Inclusion of these charges would reduce the total returns shown.
G Total returns would have been lower if certain expenses had not been reduced during the applicable periods shown.
H Fees and expenses of any underlying mutual funds or exchange-traded funds (ETFs) are not included in the Fund's expense ratio. The Fund indirectly bears its proportionate share of these expenses.
I Expense ratios reflect operating expenses of the class. Expenses before reductions do not reflect amounts reimbursed, waived, or reduced through arrangements with the investment adviser, brokerage services, or other offset arrangements, if applicable, and do not represent the amount paid by the class during periods when reimbursements, waivers or reductions occur.
J Annualized
K Amount does not include the portfolio activity of any underlying mutual funds or exchange-traded funds (ETFs).
See accompanying notes which are an integral part of the financial statements.
VIP Freedom 2010 Portfolio Service Class 2
| Six months ended (Unaudited) June 30, | Years endedDecember 31, | |||||
| 2022 | 2021 | 2020 | 2019 | 2018 | 2017 | |
| Selected Per–Share Data | ||||||
| Net asset value, beginning of period | $14.33 | $14.17 | $13.32 | $12.24 | $13.35 | $12.24 |
| Income from Investment Operations | ||||||
| Net investment income (loss)A,B | (.01) | .22 | .14 | .24 | .18 | .17 |
| Net realized and unrealized gain (loss) | (1.76) | .56 | 1.43 | 1.63 | (.74) | 1.38 |
| Total from investment operations | (1.77) | .78 | 1.57 | 1.87 | (.56) | 1.55 |
| Distributions from net investment income | (.11) | (.12) | (.14) | (.25) | (.19) | (.17) |
| Distributions from net realized gain | (.77) | (.50) | (.58) | (.55) | (.37) | (.26) |
| Total distributions | (.88) | (.62) | (.72) | (.79)C | (.55)C | (.44)C |
| Net asset value, end of period | $11.68 | $14.33 | $14.17 | $13.32 | $12.24 | $13.35 |
| Total ReturnD,E,F | (12.96)% | 5.60% | 12.24% | 15.75% | (4.26)% | 12.80% |
| Ratios to Average Net AssetsB,G,H | ||||||
| Expenses before reductions | .25%I | .25% | .25% | .25% | .25% | .25% |
| Expenses net of fee waivers, if any | .25%I | .25% | .25% | .25% | .25% | .25% |
| Expenses net of all reductions | .25%I | .25% | .25% | .25% | .25% | .25% |
| Net investment income (loss) | (.12)%I | 1.57% | 1.09% | 1.90% | 1.41% | 1.31% |
| Supplemental Data | ||||||
| Net assets, end of period (000 omitted) | $267,677 | $327,526 | $317,773 | $280,783 | $243,940 | $269,507 |
| Portfolio turnover rateJ | 410%I | 29% | 40% | 28% | 31% | 22% |
A Calculated based on average shares outstanding during the period.
B Net investment income (loss) is affected by the timing of the declaration of dividends by any underlying mutual funds or exchange-traded funds (ETFs). Net investment income (loss) of any such underlying funds is not included in the Fund's net investment income (loss) ratio.
C Total distributions per share do not sum due to rounding.
D Total returns for periods of less than one year are not annualized.
E Total returns do not reflect charges attributable to your insurance company's separate account. Inclusion of these charges would reduce the total returns shown.
F Total returns would have been lower if certain expenses had not been reduced during the applicable periods shown.
G Fees and expenses of any underlying mutual funds or exchange-traded funds (ETFs) are not included in the Fund's expense ratio. The Fund indirectly bears its proportionate share of these expenses.
H Expense ratios reflect operating expenses of the class. Expenses before reductions do not reflect amounts reimbursed, waived, or reduced through arrangements with the investment adviser, brokerage services, or other offset arrangements, if applicable, and do not represent the amount paid by the class during periods when reimbursements, waivers or reductions occur.
I Annualized
J Amount does not include the portfolio activity of any underlying mutual funds or exchange-traded funds (ETFs).
See accompanying notes which are an integral part of the financial statements.
VIP Freedom 2015 Portfolio℠
Investment Summary (Unaudited)
The information in the following tables is based on the direct investments of the Fund.Top Holdings as of June 30, 2022
| % of fund's net assets | |
| VIP Investment Grade Bond II Portfolio Initial Class | 29.7 |
| Fidelity Inflation-Protected Bond Index Fund | 14.1 |
| VIP Overseas Portfolio Initial Class | 13.0 |
| VIP Emerging Markets Portfolio Initial Class | 9.2 |
| VIP Government Money Market Portfolio Initial Class 1.18% | 6.6 |
| Fidelity Long-Term Treasury Bond Index Fund | 4.1 |
| VIP Growth Portfolio Initial Class | 3.9 |
| VIP Growth & Income Portfolio Initial Class | 3.8 |
| VIP Equity-Income Portfolio Initial Class | 3.2 |
| Fidelity International Bond Index Fund | 3.2 |
| 90.8 |
Asset Allocation (% of fund's net assets)
| Period end | ||
| Domestic Equity Funds | 18.4% | |
| International Equity Funds | 22.2% | |
| Bond Funds | 52.8% | |
| Short-Term Funds | 6.6% | |
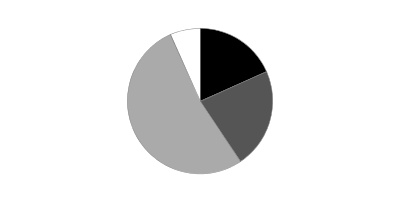
VIP Freedom 2015 Portfolio℠
Schedule of Investments June 30, 2022 (Unaudited)
Showing Percentage of Net Assets
| Domestic Equity Funds - 18.4% | |||
| Shares | Value | ||
| VIP Contrafund Portfolio Initial Class (a) | 56,647 | $2,222,270 | |
| VIP Equity-Income Portfolio Initial Class (a) | 97,961 | 2,285,436 | |
| VIP Growth & Income Portfolio Initial Class (a) | 117,646 | 2,709,377 | |
| VIP Growth Portfolio Initial Class (a) | 37,567 | 2,799,863 | |
| VIP Mid Cap Portfolio Initial Class (a) | 20,825 | 660,562 | |
| VIP Value Portfolio Initial Class (a) | 101,497 | 1,668,608 | |
| VIP Value Strategies Portfolio Initial Class (a) | 57,133 | 815,293 | |
| TOTAL DOMESTIC EQUITY FUNDS | |||
| (Cost $5,907,115) | 13,161,409 | ||
| International Equity Funds - 22.2% | |||
| VIP Emerging Markets Portfolio Initial Class (a) | 654,578 | 6,585,056 | |
| VIP Overseas Portfolio Initial Class (a) | 446,279 | 9,300,461 | |
| TOTAL INTERNATIONAL EQUITY FUNDS | |||
| (Cost $12,665,424) | 15,885,517 | ||
| Bond Funds - 52.8% | |||
| Fidelity Inflation-Protected Bond Index Fund (a) | 994,647 | 10,095,670 | |
| Fidelity International Bond Index Fund (a) | 251,077 | 2,284,805 | |
| Fidelity Long-Term Treasury Bond Index Fund (a) | 253,634 | 2,924,402 | |
| VIP High Income Portfolio Initial Class (a) | 260,212 | 1,176,157 | |
| VIP Investment Grade Bond II Portfolio Initial Class (a) | 2,172,859 | 21,207,107 | |
| TOTAL BOND FUNDS | |||
| (Cost $38,818,765) | 37,688,141 | ||
| Short-Term Funds - 6.6% | |||
| VIP Government Money Market Portfolio Initial Class 1.18% (a)(b) | |||
| (Cost $4,735,639) | 4,735,639 | 4,735,639 | |
| TOTAL INVESTMENT IN SECURITIES - 100.0% | |||
| (Cost $62,126,943) | 71,470,706 | ||
| NET OTHER ASSETS (LIABILITIES) - 0.0% | (7,315) | ||
| NET ASSETS - 100% | $71,463,391 |
Legend
(a) Affiliated Fund
(b) The rate quoted is the annualized seven-day yield of the fund at period end.
Affiliated Underlying Funds
Fiscal year to date information regarding the Fund's investments in affiliated Underlying Funds is presented below. Exchanges between classes of the same affiliated Underlying Funds may occur, and are excluded from purchases and sales below if applicable. If an underlying Fund changes its name, the name presented below is the name in effect at period end.
| Affiliate | Value, beginning of period | Purchases(a) | Sales Proceeds(a) | Dividend Income | Realized Gain (loss) | Change in Unrealized appreciation (depreciation) | Value, end of period |
| Fidelity Inflation-Protected Bond Index Fund | $10,560,985 | $2,959,772 | $2,438,893 | $-- | $(53,850) | $(932,344) | $10,095,670 |
| Fidelity International Bond Index Fund | 1,659,989 | 1,232,905 | 420,554 | 3,720 | (12,753) | (174,782) | 2,284,805 |
| Fidelity Long-Term Treasury Bond Index Fund | 2,717,346 | 1,502,767 | 690,544 | 28,933 | (35,163) | (570,004) | 2,924,402 |
| VIP Contrafund Portfolio Initial Class | 3,104,087 | 706,005 | 735,211 | 27,410 | (44,602) | (808,009) | 2,222,270 |
| VIP Emerging Markets Portfolio Initial Class | 8,431,594 | 1,772,355 | 1,987,078 | -- | (141,401) | (1,490,414) | 6,585,056 |
| VIP Equity-Income Portfolio Initial Class | 3,283,575 | 403,619 | 1,100,315 | 3,982 | 157,318 | (458,761) | 2,285,436 |
| VIP Government Money Market Portfolio Initial Class 1.18% | 8,384,578 | 1,203,571 | 4,852,510 | 6,931 | -- | -- | 4,735,639 |
| VIP Growth & Income Portfolio Initial Class | 3,737,872 | 581,349 | 1,239,184 | 6,870 | 481,750 | (852,410) | 2,709,377 |
| VIP Growth Portfolio Initial Class | 3,174,616 | 1,354,452 | 842,169 | 140,538 | (55,845) | (831,191) | 2,799,863 |
| VIP High Income Portfolio Initial Class | 1,822,024 | 160,271 | 596,638 | 672 | (27,539) | (181,961) | 1,176,157 |
| VIP Investment Grade Bond Portfolio II Initial Class | -- | 22,913,341 | 1,166,612 | -- | (25,116) | (514,506) | 21,207,107 |
| VIP Investment Grade Bond Portfolio Initial Class | 28,114,446 | 4,046,278 | 28,651,317 | 1,257,602 | (1,963,492) | (1,545,915) | -- |
| VIP Mid Cap Portfolio Initial Class | 910,684 | 180,779 | 232,191 | 19,982 | (15,065) | (183,645) | 660,562 |
| VIP Overseas Portfolio Initial Class | 11,797,215 | 3,244,331 | 2,198,864 | 87,438 | (146,297) | (3,395,924) | 9,300,461 |
| VIP Value Portfolio Initial Class | 2,407,382 | 302,972 | 845,815 | 29,949 | 241,178 | (437,109) | 1,668,608 |
| VIP Value Strategies Portfolio Initial Class | 1,179,399 | 129,316 | 366,411 | 9,587 | 92,609 | (219,620) | 815,293 |
| $91,285,792 | $42,694,083 | $48,364,306 | $1,623,614 | $(1,548,268) | $(12,596,595) | $71,470,706 |
(a) Includes the value of shares purchased or redeemed through in-kind transactions, as applicable.
Amounts in the income column in the above table include any capital gain distributions from underlying funds, which are presented in the corresponding line-item in the Statement of Operations, if applicable.
Investment Valuation
The following is a summary of the inputs used, as of June 30, 2022, involving the Fund's assets and liabilities carried at fair value. The inputs or methodology used for valuing securities may not be an indication of the risk associated with investing in those securities. For more information on valuation inputs, and their aggregation into the levels used below, please refer to the Investment Valuation section in the accompanying Notes to Financial Statements.
| Valuation Inputs at Reporting Date: | ||||
| Description | Total | Level 1 | Level 2 | Level 3 |
| Investments in Securities: | ||||
| Domestic Equity Funds | $13,161,409 | $13,161,409 | $-- | $-- |
| International Equity Funds | 15,885,517 | 15,885,517 | -- | -- |
| Bond Funds | 37,688,141 | 37,688,141 | -- | -- |
| Short-Term Funds | 4,735,639 | 4,735,639 | -- | -- |
| Total Investments in Securities: | $71,470,706 | $71,470,706 | $-- | $-- |
See accompanying notes which are an integral part of the financial statements.
VIP Freedom 2015 Portfolio℠
Financial Statements
Statement of Assets and Liabilities
| June 30, 2022 (Unaudited) | ||
| Assets | ||
| Investment in securities, at value — See accompanying schedule: | ||
| Affiliated issuers (cost $62,126,943) | $71,470,706 | |
| Total Investment in Securities (cost $62,126,943) | $71,470,706 | |
| Cash | 206 | |
| Receivable for investments sold | 771,792 | |
| Receivable for fund shares sold | 212,317 | |
| Total assets | 72,455,021 | |
| Liabilities | ||
| Payable for investments purchased | $924,854 | |
| Payable for fund shares redeemed | 59,253 | |
| Distribution and service plan fees payable | 7,523 | |
| Total liabilities | 991,630 | |
| Net Assets | $71,463,391 | |
| Net Assets consist of: | ||
| Paid in capital | $62,430,138 | |
| Total accumulated earnings (loss) | 9,033,253 | |
| Net Assets | $71,463,391 | |
| Net Asset Value and Maximum Offering Price | ||
| Initial Class: | ||
| Net Asset Value, offering price and redemption price per share ($24,396,603 ÷ 2,190,623 shares) | $11.14 | |
| Service Class: | ||
| Net Asset Value, offering price and redemption price per share ($19,362,762 ÷ 1,744,364 shares) | $11.10 | |
| Service Class 2: | ||
| Net Asset Value, offering price and redemption price per share ($27,704,026 ÷ 2,507,813 shares) | $11.05 |
See accompanying notes which are an integral part of the financial statements.
Statement of Operations
| Six months ended June 30, 2022 (Unaudited) | ||
| Investment Income | ||
| Dividends: | ||
| Affiliated issuers | $50,554 | |
| Expenses | ||
| Distribution and service plan fees | $49,958 | |
| Independent trustees' fees and expenses | 127 | |
| Total expenses | 50,085 | |
| Net investment income (loss) | 469 | |
| Realized and Unrealized Gain (Loss) | ||
| Net realized gain (loss) on: | ||
| Investment securities: | ||
| Affiliated issuers | (1,548,268) | |
| Capital gain distributions from underlying funds: | ||
| Affiliated issuers | 1,573,060 | |
| Total net realized gain (loss) | 24,792 | |
| Change in net unrealized appreciation (depreciation) on: | ||
| Investment securities: | ||
| Affiliated issuers | (12,596,595) | |
| Total change in net unrealized appreciation (depreciation) | (12,596,595) | |
| Net gain (loss) | (12,571,803) | |
| Net increase (decrease) in net assets resulting from operations | $(12,571,334) |
See accompanying notes which are an integral part of the financial statements.
Statement of Changes in Net Assets
| Six months ended June 30, 2022 (Unaudited) | Year ended December 31, 2021 | |
| Increase (Decrease) in Net Assets | ||
| Operations | ||
| Net investment income (loss) | $469 | $1,552,113 |
| Net realized gain (loss) | 24,792 | 8,853,932 |
| Change in net unrealized appreciation (depreciation) | (12,596,595) | (3,437,206) |
| Net increase (decrease) in net assets resulting from operations | (12,571,334) | 6,968,839 |
| Distributions to shareholders | (8,506,785) | (4,911,196) |
| Share transactions - net increase (decrease) | 1,264,945 | (9,839,978) |
| Total increase (decrease) in net assets | (19,813,174) | (7,782,335) |
| Net Assets | ||
| Beginning of period | 91,276,565 | 99,058,900 |
| End of period | $71,463,391 | $91,276,565 |
See accompanying notes which are an integral part of the financial statements.
Financial Highlights
VIP Freedom 2015 Portfolio Initial Class
| Six months ended (Unaudited) June 30, | Years endedDecember 31, | |||||
| 2022 | 2021 | 2020 | 2019 | 2018 | 2017 | |
| Selected Per–Share Data | ||||||
| Net asset value, beginning of period | $14.42 | $14.12 | $13.20 | $12.26 | $13.68 | $12.39 |
| Income from Investment Operations | ||||||
| Net investment income (loss)A,B | .01 | .25 | .17 | .28 | .20 | .20 |
| Net realized and unrealized gain (loss) | (1.92) | .81 | 1.57 | 1.86 | (.87) | 1.64 |
| Total from investment operations | (1.91) | 1.06 | 1.74 | 2.14 | (.67) | 1.84 |
| Distributions from net investment income | (.11) | (.16) | (.17) | (.27) | (.22) | (.21) |
| Distributions from net realized gain | (1.26) | (.60) | (.65) | (.94) | (.53) | (.34) |
| Total distributions | (1.37) | (.76) | (.82) | (1.20)C | (.75) | (.55) |
| Net asset value, end of period | $11.14 | $14.42 | $14.12 | $13.20 | $12.26 | $13.68 |
| Total ReturnD,E,F | (14.30)% | 7.69% | 13.76% | 18.35% | (5.07)% | 15.10% |
| Ratios to Average Net AssetsB,G,H | ||||||
| Expenses before reductionsI | - %J | -% | -% | -% | -% | -% |
| Expenses net of fee waivers, if any | - %I,J | - %I | - %I | - %I | - %I | -% |
| Expenses net of all reductions | - %I,J | - %I | - %I | - %I | - %I | -% |
| Net investment income (loss) | .13%J | 1.75% | 1.33% | 2.22% | 1.52% | 1.51% |
| Supplemental Data | ||||||
| Net assets, end of period (000 omitted) | $24,397 | $33,325 | $35,010 | $32,215 | $29,361 | $33,249 |
| Portfolio turnover rateK | 105%J | 43% | 58% | 39% | 33% | 27% |
A Calculated based on average shares outstanding during the period.
B Net investment income (loss) is affected by the timing of the declaration of dividends by any underlying mutual funds or exchange-traded funds (ETFs). Net investment income (loss) of any such underlying funds is not included in the Fund's net investment income (loss) ratio.
C Total distributions per share do not sum due to rounding.
D Total returns for periods of less than one year are not annualized.
E Total returns do not reflect charges attributable to your insurance company's separate account. Inclusion of these charges would reduce the total returns shown.
F Total returns would have been lower if certain expenses had not been reduced during the applicable periods shown.
G Fees and expenses of any underlying mutual funds or exchange-traded funds (ETFs) are not included in the Fund's expense ratio. The Fund indirectly bears its proportionate share of these expenses.
H Expense ratios reflect operating expenses of the class. Expenses before reductions do not reflect amounts reimbursed, waived, or reduced through arrangements with the investment adviser, brokerage services, or other offset arrangements, if applicable, and do not represent the amount paid by the class during periods when reimbursements, waivers or reductions occur.
I Amount represents less than .005%.
J Annualized
K Amount does not include the portfolio activity of any underlying mutual funds or exchange-traded funds (ETFs).
See accompanying notes which are an integral part of the financial statements.
VIP Freedom 2015 Portfolio Service Class
| Six months ended (Unaudited) June 30, | Years endedDecember 31, | |||||
| 2022 | 2021 | 2020 | 2019 | 2018 | 2017 | |
| Selected Per–Share Data | ||||||
| Net asset value, beginning of period | $14.38 | $14.08 | $13.17 | $12.24 | $13.65 | $12.37 |
| Income from Investment Operations | ||||||
| Net investment income (loss)A,B | –C | .24 | .16 | .27 | .19 | .18 |
| Net realized and unrealized gain (loss) | (1.91) | .80 | 1.56 | 1.85 | (.86) | 1.64 |
| Total from investment operations | (1.91) | 1.04 | 1.72 | 2.12 | (.67) | 1.82 |
| Distributions from net investment income | (.11) | (.14) | (.16) | (.26) | (.20) | (.19) |
| Distributions from net realized gain | (1.26) | (.60) | (.65) | (.94) | (.53) | (.34) |
| Total distributions | (1.37) | (.74) | (.81) | (1.19)D | (.74)D | (.54)D |
| Net asset value, end of period | $11.10 | $14.38 | $14.08 | $13.17 | $12.24 | $13.65 |
| Total ReturnE,F,G | (14.34)% | 7.59% | 13.62% | 18.21% | (5.11)% | 14.93% |
| Ratios to Average Net AssetsB,H,I | ||||||
| Expenses before reductions | .10%J | .10% | .10% | .10% | .10% | .10% |
| Expenses net of fee waivers, if any | .10%J | .10% | .10% | .10% | .10% | .10% |
| Expenses net of all reductions | .10%J | .10% | .10% | .10% | .10% | .10% |
| Net investment income (loss) | .03%J | 1.65% | 1.23% | 2.12% | 1.42% | 1.41% |
| Supplemental Data | ||||||
| Net assets, end of period (000 omitted) | $19,363 | $20,808 | $27,209 | $22,763 | $11,777 | $17,058 |
| Portfolio turnover rateK | 105%J | 43% | 58% | 39% | 33% | 27% |
A Calculated based on average shares outstanding during the period.
B Net investment income (loss) is affected by the timing of the declaration of dividends by any underlying mutual funds or exchange-traded funds (ETFs). Net investment income (loss) of any such underlying funds is not included in the Fund's net investment income (loss) ratio.
C Amount represents less than $.005 per share.
D Total distributions per share do not sum due to rounding.
E Total returns for periods of less than one year are not annualized.
F Total returns do not reflect charges attributable to your insurance company's separate account. Inclusion of these charges would reduce the total returns shown.
G Total returns would have been lower if certain expenses had not been reduced during the applicable periods shown.
H Fees and expenses of any underlying mutual funds or exchange-traded funds (ETFs) are not included in the Fund's expense ratio. The Fund indirectly bears its proportionate share of these expenses.
I Expense ratios reflect operating expenses of the class. Expenses before reductions do not reflect amounts reimbursed, waived, or reduced through arrangements with the investment adviser, brokerage services, or other offset arrangements, if applicable, and do not represent the amount paid by the class during periods when reimbursements, waivers or reductions occur.
J Annualized
K Amount does not include the portfolio activity of any underlying mutual funds or exchange-traded funds (ETFs).
See accompanying notes which are an integral part of the financial statements.
VIP Freedom 2015 Portfolio Service Class 2
| Six months ended (Unaudited) June 30, | Years endedDecember 31, | |||||
| 2022 | 2021 | 2020 | 2019 | 2018 | 2017 | |
| Selected Per–Share Data | ||||||
| Net asset value, beginning of period | $14.33 | $14.04 | $13.12 | $12.20 | $13.61 | $12.33 |
| Income from Investment Operations | ||||||
| Net investment income (loss)A,B | (.01) | .21 | .14 | .25 | .17 | .16 |
| Net realized and unrealized gain (loss) | (1.90) | .80 | 1.57 | 1.84 | (.86) | 1.63 |
| Total from investment operations | (1.91) | 1.01 | 1.71 | 2.09 | (.69) | 1.79 |
| Distributions from net investment income | (.11) | (.12) | (.14) | (.23) | (.18) | (.17) |
| Distributions from net realized gain | (1.26) | (.60) | (.65) | (.94) | (.53) | (.34) |
| Total distributions | (1.37) | (.72) | (.79) | (1.17) | (.72)C | (.51) |
| Net asset value, end of period | $11.05 | $14.33 | $14.04 | $13.12 | $12.20 | $13.61 |
| Total ReturnD,E,F | (14.39)% | 7.39% | 13.56% | 17.97% | (5.28)% | 14.80% |
| Ratios to Average Net AssetsB,G,H | ||||||
| Expenses before reductions | .25%I | .25% | .25% | .25% | .25% | .25% |
| Expenses net of fee waivers, if any | .25%I | .25% | .25% | .25% | .25% | .25% |
| Expenses net of all reductions | .25%I | .25% | .25% | .25% | .25% | .25% |
| Net investment income (loss) | (.13)%I | 1.50% | 1.08% | 1.97% | 1.27% | 1.26% |
| Supplemental Data | ||||||
| Net assets, end of period (000 omitted) | $27,704 | $37,143 | $36,840 | $38,963 | $35,222 | $49,688 |
| Portfolio turnover rateJ | 105%I | 43% | 58% | 39% | 33% | 27% |
A Calculated based on average shares outstanding during the period.
B Net investment income (loss) is affected by the timing of the declaration of dividends by any underlying mutual funds or exchange-traded funds (ETFs). Net investment income (loss) of any such underlying funds is not included in the Fund's net investment income (loss) ratio.
C Total distributions per share do not sum due to rounding.
D Total returns for periods of less than one year are not annualized.
E Total returns do not reflect charges attributable to your insurance company's separate account. Inclusion of these charges would reduce the total returns shown.
F Total returns would have been lower if certain expenses had not been reduced during the applicable periods shown.
G Fees and expenses of any underlying mutual funds or exchange-traded funds (ETFs) are not included in the Fund's expense ratio. The Fund indirectly bears its proportionate share of these expenses.
H Expense ratios reflect operating expenses of the class. Expenses before reductions do not reflect amounts reimbursed, waived, or reduced through arrangements with the investment adviser, brokerage services, or other offset arrangements, if applicable, and do not represent the amount paid by the class during periods when reimbursements, waivers or reductions occur.
I Annualized
J Amount does not include the portfolio activity of any underlying mutual funds or exchange-traded funds (ETFs).
See accompanying notes which are an integral part of the financial statements.
VIP Freedom 2020 Portfolio℠
Investment Summary (Unaudited)
The information in the following tables is based on the direct investments of the Fund.Top Holdings as of June 30, 2022
| % of fund's net assets | |
| VIP Investment Grade Bond II Portfolio Initial Class | 26.7 |
| VIP Overseas Portfolio Initial Class | 15.6 |
| Fidelity Inflation-Protected Bond Index Fund | 13.1 |
| VIP Emerging Markets Portfolio Initial Class | 10.3 |
| VIP Growth Portfolio Initial Class | 5.1 |
| VIP Growth & Income Portfolio Initial Class | 4.9 |
| VIP Equity-Income Portfolio Initial Class | 4.2 |
| Fidelity Long-Term Treasury Bond Index Fund | 4.1 |
| VIP Contrafund Portfolio Initial Class | 4.1 |
| Fidelity International Bond Index Fund | 3.5 |
| 91.6 |
Asset Allocation (% of fund's net assets)
| Period end | ||
| Domestic Equity Funds | 24.0% | |
| International Equity Funds | 25.9% | |
| Bond Funds | 49.0% | |
| Short-Term Funds | 1.1% | |
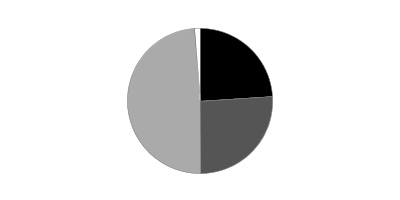
VIP Freedom 2020 Portfolio℠
Schedule of Investments June 30, 2022 (Unaudited)
Showing Percentage of Net Assets
| Domestic Equity Funds - 24.0% | |||
| Shares | Value | ||
| VIP Contrafund Portfolio Initial Class (a) | 614,771 | $24,117,473 | |
| VIP Equity-Income Portfolio Initial Class (a) | 1,063,091 | 24,801,913 | |
| VIP Growth & Income Portfolio Initial Class (a) | 1,276,821 | 29,405,181 | |
| VIP Growth Portfolio Initial Class (a) | 407,833 | 30,395,820 | |
| VIP Mid Cap Portfolio Initial Class (a) | 226,022 | 7,169,411 | |
| VIP Value Portfolio Initial Class (a) | 1,101,426 | 18,107,436 | |
| VIP Value Strategies Portfolio Initial Class (a) | 619,989 | 8,847,248 | |
| TOTAL DOMESTIC EQUITY FUNDS | |||
| (Cost $77,818,797) | 142,844,482 | ||
| International Equity Funds - 25.9% | |||
| VIP Emerging Markets Portfolio Initial Class (a) | 6,112,246 | 61,489,199 | |
| VIP Overseas Portfolio Initial Class (a) | 4,475,278 | 93,264,784 | |
| TOTAL INTERNATIONAL EQUITY FUNDS | |||
| (Cost $126,288,747) | 154,753,983 | ||
| Bond Funds - 49.0% | |||
| Fidelity Inflation-Protected Bond Index Fund (a) | 7,669,746 | 77,847,917 | |
| Fidelity International Bond Index Fund (a) | 2,276,767 | 20,718,578 | |
| Fidelity Long-Term Treasury Bond Index Fund (a) | 2,145,739 | 24,740,367 | |
| VIP High Income Portfolio Initial Class (a) | 2,174,148 | 9,827,147 | |
| VIP Investment Grade Bond II Portfolio Initial Class (a) | 16,311,807 | 159,203,237 | |
| TOTAL BOND FUNDS | |||
| (Cost $297,594,562) | 292,337,246 | ||
| Short-Term Funds - 1.1% | |||
| VIP Government Money Market Portfolio Initial Class 1.18% (a)(b) | |||
| (Cost $6,764,316) | 6,764,316 | 6,764,316 | |
| TOTAL INVESTMENT IN SECURITIES - 100.0% | |||
| (Cost $508,466,422) | 596,700,027 | ||
| NET OTHER ASSETS (LIABILITIES) - 0.0% | (96,324) | ||
| NET ASSETS - 100% | $596,603,703 |
Legend
(a) Affiliated Fund
(b) The rate quoted is the annualized seven-day yield of the fund at period end.
Affiliated Underlying Funds
Fiscal year to date information regarding the Fund's investments in affiliated Underlying Funds is presented below. Exchanges between classes of the same affiliated Underlying Funds may occur, and are excluded from purchases and sales below if applicable. If an underlying Fund changes its name, the name presented below is the name in effect at period end.
| Affiliate | Value, beginning of period | Purchases(a) | Sales Proceeds(a) | Dividend Income | Realized Gain (loss) | Change in Unrealized appreciation (depreciation) | Value, end of period |
| Fidelity Inflation-Protected Bond Index Fund | $78,898,191 | $64,509,435 | $57,998,716 | $-- | $(2,412,758) | $(5,148,235) | $77,847,917 |
| Fidelity International Bond Index Fund | 14,864,445 | 21,260,216 | 13,707,272 | 33,840 | (974,411) | (724,400) | 20,718,578 |
| Fidelity Long-Term Treasury Bond Index Fund | 22,745,767 | 22,417,014 | 15,306,237 | 245,213 | (2,073,464) | (3,042,713) | 24,740,367 |
| VIP Contrafund Portfolio Initial Class | 33,129,677 | 20,522,273 | 20,276,688 | 296,439 | (561,888) | (8,695,901) | 24,117,473 |
| VIP Emerging Markets Portfolio Initial Class | 78,219,127 | 47,818,094 | 49,323,570 | -- | (1,945,905) | (13,278,547) | 61,489,199 |
| VIP Equity-Income Portfolio Initial Class | 35,044,442 | 18,278,732 | 25,208,464 | 42,666 | 1,173,419 | (4,486,216) | 24,801,913 |
| VIP Government Money Market Portfolio Initial Class 1.18% | 33,191,715 | 15,228,815 | 41,656,166 | 15,026 | (48) | -- | 6,764,316 |
| VIP Growth & Income Portfolio Initial Class | 39,893,530 | 21,905,361 | 28,306,206 | 73,613 | 3,783,597 | (7,871,101) | 29,405,181 |
| VIP Growth Portfolio Initial Class | 33,882,375 | 27,905,960 | 21,762,544 | 1,519,743 | (758,816) | (8,871,155) | 30,395,820 |
| VIP High Income Portfolio Initial Class | 15,150,144 | 6,404,757 | 9,969,088 | 5,599 | (734,104) | (1,024,562) | 9,827,147 |
| VIP Investment Grade Bond Portfolio II Initial Class | -- | 173,241,643 | 9,937,105 | -- | (213,536) | (3,887,765) | 159,203,237 |
| VIP Investment Grade Bond Portfolio Initial Class | 207,633,401 | 118,614,314 | 300,206,517 | 9,329,378 | (18,542,078) | (7,499,120) | -- |
| VIP Mid Cap Portfolio Initial Class | 9,719,372 | 5,757,375 | 6,146,947 | 213,864 | (187,678) | (1,972,711) | 7,169,411 |
| VIP Overseas Portfolio Initial Class | 118,151,966 | 81,420,175 | 70,548,370 | 878,347 | (2,451,751) | (33,307,236) | 93,264,784 |
| VIP Value Portfolio Initial Class | 25,693,279 | 13,604,737 | 19,029,934 | 320,855 | 1,385,716 | (3,546,362) | 18,107,436 |
| VIP Value Strategies Portfolio Initial Class | 12,587,111 | 6,387,420 | 8,729,322 | 102,646 | 781,836 | (2,179,797) | 8,847,248 |
| $758,804,542 | $665,276,321 | $698,113,146 | $13,077,229 | $(23,731,869) | $(105,535,821) | $596,700,027 |
(a) Includes the value of shares purchased or redeemed through in-kind transactions, as applicable.
Amounts in the income column in the above table include any capital gain distributions from underlying funds, which are presented in the corresponding line-item in the Statement of Operations, if applicable.
Investment Valuation
The following is a summary of the inputs used, as of June 30, 2022, involving the Fund's assets and liabilities carried at fair value. The inputs or methodology used for valuing securities may not be an indication of the risk associated with investing in those securities. For more information on valuation inputs, and their aggregation into the levels used below, please refer to the Investment Valuation section in the accompanying Notes to Financial Statements.
| Valuation Inputs at Reporting Date: | ||||
| Description | Total | Level 1 | Level 2 | Level 3 |
| Investments in Securities: | ||||
| Domestic Equity Funds | $142,844,482 | $142,844,482 | $-- | $-- |
| International Equity Funds | 154,753,983 | 154,753,983 | -- | -- |
| Bond Funds | 292,337,246 | 292,337,246 | -- | -- |
| Short-Term Funds | 6,764,316 | 6,764,316 | -- | -- |
| Total Investments in Securities: | $596,700,027 | $596,700,027 | $-- | $-- |
See accompanying notes which are an integral part of the financial statements.
VIP Freedom 2020 Portfolio℠
Financial Statements
Statement of Assets and Liabilities
| June 30, 2022 (Unaudited) | ||
| Assets | ||
| Investment in securities, at value — See accompanying schedule: | ||
| Affiliated issuers (cost $508,466,422) | $596,700,027 | |
| Total Investment in Securities (cost $508,466,422) | $596,700,027 | |
| Cash | 76 | |
| Receivable for investments sold | 7,401,916 | |
| Receivable for fund shares sold | 339,082 | |
| Total assets | 604,441,101 | |
| Liabilities | ||
| Payable for investments purchased | $7,033,606 | |
| Payable for fund shares redeemed | 707,390 | |
| Distribution and service plan fees payable | 96,402 | |
| Total liabilities | 7,837,398 | |
| Net Assets | $596,603,703 | |
| Net Assets consist of: | ||
| Paid in capital | $521,514,124 | |
| Total accumulated earnings (loss) | 75,089,579 | |
| Net Assets | $596,603,703 | |
| Net Asset Value and Maximum Offering Price | ||
| Initial Class: | ||
| Net Asset Value, offering price and redemption price per share ($63,717,542 ÷ 5,442,507 shares) | $11.71 | |
| Service Class: | ||
| Net Asset Value, offering price and redemption price per share ($136,661,925 ÷ 11,726,361 shares) | $11.65 | |
| Service Class 2: | ||
| Net Asset Value, offering price and redemption price per share ($396,224,236 ÷ 34,171,147 shares) | $11.60 |
See accompanying notes which are an integral part of the financial statements.
Statement of Operations
| Six months ended June 30, 2022 (Unaudited) | ||
| Investment Income | ||
| Dividends: | ||
| Affiliated issuers | $411,039 | |
| Expenses | ||
| Distribution and service plan fees | $638,759 | |
| Independent trustees' fees and expenses | 1,054 | |
| Total expenses | 639,813 | |
| Net investment income (loss) | (228,774) | |
| Realized and Unrealized Gain (Loss) | ||
| Net realized gain (loss) on: | ||
| Investment securities: | ||
| Affiliated issuers | (23,731,869) | |
| Capital gain distributions from underlying funds: | ||
| Affiliated issuers | 12,666,190 | |
| Total net realized gain (loss) | (11,065,679) | |
| Change in net unrealized appreciation (depreciation) on: | ||
| Investment securities: | ||
| Affiliated issuers | (105,535,821) | |
| Total change in net unrealized appreciation (depreciation) | (105,535,821) | |
| Net gain (loss) | (116,601,500) | |
| Net increase (decrease) in net assets resulting from operations | $(116,830,274) |
See accompanying notes which are an integral part of the financial statements.
Statement of Changes in Net Assets
| Six months ended June 30, 2022 (Unaudited) | Year ended December 31, 2021 | |
| Increase (Decrease) in Net Assets | ||
| Operations | ||
| Net investment income (loss) | $(228,774) | $12,153,237 |
| Net realized gain (loss) | (11,065,679) | 74,933,835 |
| Change in net unrealized appreciation (depreciation) | (105,535,821) | (18,121,565) |
| Net increase (decrease) in net assets resulting from operations | (116,830,274) | 68,965,507 |
| Distributions to shareholders | (71,387,037) | (48,417,894) |
| Share transactions - net increase (decrease) | 26,135,635 | (43,232,044) |
| Total increase (decrease) in net assets | (162,081,676) | (22,684,431) |
| Net Assets | ||
| Beginning of period | 758,685,379 | 781,369,810 |
| End of period | $596,603,703 | $758,685,379 |
See accompanying notes which are an integral part of the financial statements.
Financial Highlights
VIP Freedom 2020 Portfolio Initial Class
| Six months ended (Unaudited) June 30, | Years endedDecember 31, | |||||
| 2022 | 2021 | 2020 | 2019 | 2018 | 2017 | |
| Selected Per–Share Data | ||||||
| Net asset value, beginning of period | $15.42 | $15.03 | $14.01 | $12.58 | $14.03 | $12.56 |
| Income from Investment Operations | ||||||
| Net investment income (loss)A,B | .01 | .27 | .17 | .28 | .21 | .21 |
| Net realized and unrealized gain (loss) | (2.25) | 1.11 | 1.84 | 2.16 | (1.01) | 1.84 |
| Total from investment operations | (2.24) | 1.38 | 2.01 | 2.44 | (.80) | 2.05 |
| Distributions from net investment income | (.11) | (.17) | (.18) | (.28) | (.21) | (.21) |
| Distributions from net realized gain | (1.36) | (.81) | (.80) | (.73) | (.44) | (.37) |
| Total distributions | (1.47) | (.99)C | (.99)C | (1.01) | (.65) | (.58) |
| Net asset value, end of period | $11.71 | $15.42 | $15.03 | $14.01 | $12.58 | $14.03 |
| Total ReturnD,E,F | (15.73)% | 9.47% | 15.06% | 20.13% | (5.86)% | 16.62% |
| Ratios to Average Net AssetsB,G,H | ||||||
| Expenses before reductionsI | - %J | -% | -% | -% | -% | -% |
| Expenses net of fee waivers, if any | - %I,J | - %I | - %I | - %I | - %I | -% |
| Expenses net of all reductions | - %I,J | - %I | - %I | - %I | - %I | -% |
| Net investment income (loss) | .12%J | 1.77% | 1.27% | 2.08% | 1.50% | 1.54% |
| Supplemental Data | ||||||
| Net assets, end of period (000 omitted) | $63,718 | $82,875 | $80,503 | $74,801 | $63,490 | $75,021 |
| Portfolio turnover rateK | 196%J | 34% | 40% | 31% | 28% | 21% |
A Calculated based on average shares outstanding during the period.
B Net investment income (loss) is affected by the timing of the declaration of dividends by any underlying mutual funds or exchange-traded funds (ETFs). Net investment income (loss) of any such underlying funds is not included in the Fund's net investment income (loss) ratio.
C Total distributions per share do not sum due to rounding.
D Total returns for periods of less than one year are not annualized.
E Total returns do not reflect charges attributable to your insurance company's separate account. Inclusion of these charges would reduce the total returns shown.
F Total returns would have been lower if certain expenses had not been reduced during the applicable periods shown.
G Fees and expenses of any underlying mutual funds or exchange-traded funds (ETFs) are not included in the Fund's expense ratio. The Fund indirectly bears its proportionate share of these expenses.
H Expense ratios reflect operating expenses of the class. Expenses before reductions do not reflect amounts reimbursed, waived, or reduced through arrangements with the investment adviser, brokerage services, or other offset arrangements, if applicable, and do not represent the amount paid by the class during periods when reimbursements, waivers or reductions occur.
I Amount represents less than .005%.
J Annualized
K Amount does not include the portfolio activity of any underlying mutual funds or exchange-traded funds (ETFs).
See accompanying notes which are an integral part of the financial statements.
VIP Freedom 2020 Portfolio Service Class
| Six months ended (Unaudited) June 30, | Years endedDecember 31, | |||||
| 2022 | 2021 | 2020 | 2019 | 2018 | 2017 | |
| Selected Per–Share Data | ||||||
| Net asset value, beginning of period | $15.37 | $14.97 | $13.96 | $12.54 | $13.99 | $12.53 |
| Income from Investment Operations | ||||||
| Net investment income (loss)A,B | –C | .25 | .16 | .26 | .19 | .19 |
| Net realized and unrealized gain (loss) | (2.25) | 1.12 | 1.82 | 2.16 | (1.00) | 1.84 |
| Total from investment operations | (2.25) | 1.37 | 1.98 | 2.42 | (.81) | 2.03 |
| Distributions from net investment income | (.11) | (.16) | (.17) | (.27) | (.20) | (.20) |
| Distributions from net realized gain | (1.36) | (.81) | (.80) | (.73) | (.44) | (.37) |
| Total distributions | (1.47) | (.97) | (.97) | (1.00) | (.64) | (.57) |
| Net asset value, end of period | $11.65 | $15.37 | $14.97 | $13.96 | $12.54 | $13.99 |
| Total ReturnD,E,F | (15.86)% | 9.47% | 14.92% | 20.01% | (5.98)% | 16.47% |
| Ratios to Average Net AssetsB,G,H | ||||||
| Expenses before reductions | .10%I | .10% | .10% | .10% | .10% | .10% |
| Expenses net of fee waivers, if any | .10%I | .10% | .10% | .10% | .10% | .10% |
| Expenses net of all reductions | .10%I | .10% | .10% | .10% | .10% | .10% |
| Net investment income (loss) | .02%I | 1.67% | 1.17% | 1.98% | 1.40% | 1.44% |
| Supplemental Data | ||||||
| Net assets, end of period (000 omitted) | $136,662 | $167,097 | $178,229 | $171,842 | $132,086 | $140,686 |
| Portfolio turnover rateJ | 196%I | 34% | 40% | 31% | 28% | 21% |
A Calculated based on average shares outstanding during the period.
B Net investment income (loss) is affected by the timing of the declaration of dividends by any underlying mutual funds or exchange-traded funds (ETFs). Net investment income (loss) of any such underlying funds is not included in the Fund's net investment income (loss) ratio.
C Amount represents less than $.005 per share.
D Total returns for periods of less than one year are not annualized.
E Total returns do not reflect charges attributable to your insurance company's separate account. Inclusion of these charges would reduce the total returns shown.
F Total returns would have been lower if certain expenses had not been reduced during the applicable periods shown.
G Fees and expenses of any underlying mutual funds or exchange-traded funds (ETFs) are not included in the Fund's expense ratio. The Fund indirectly bears its proportionate share of these expenses.
H Expense ratios reflect operating expenses of the class. Expenses before reductions do not reflect amounts reimbursed, waived, or reduced through arrangements with the investment adviser, brokerage services, or other offset arrangements, if applicable, and do not represent the amount paid by the class during periods when reimbursements, waivers or reductions occur.
I Annualized
J Amount does not include the portfolio activity of any underlying mutual funds or exchange-traded funds (ETFs).
See accompanying notes which are an integral part of the financial statements.
VIP Freedom 2020 Portfolio Service Class 2
| Six months ended (Unaudited) June 30, | Years endedDecember 31, | |||||
| 2022 | 2021 | 2020 | 2019 | 2018 | 2017 | |
| Selected Per–Share Data | ||||||
| Net asset value, beginning of period | $15.31 | $14.92 | $13.92 | $12.50 | $13.94 | $12.49 |
| Income from Investment Operations | ||||||
| Net investment income (loss)A,B | (.01) | .23 | .14 | .24 | .17 | .17 |
| Net realized and unrealized gain (loss) | (2.23) | 1.11 | 1.81 | 2.16 | (.99) | 1.83 |
| Total from investment operations | (2.24) | 1.34 | 1.95 | 2.40 | (.82) | 2.00 |
| Distributions from net investment income | (.11) | (.13) | (.14) | (.25) | (.18) | (.17) |
| Distributions from net realized gain | (1.36) | (.81) | (.80) | (.73) | (.44) | (.37) |
| Total distributions | (1.47) | (.95)C | (.95)C | (.98) | (.62) | (.55)C |
| Net asset value, end of period | $11.60 | $15.31 | $14.92 | $13.92 | $12.50 | $13.94 |
| Total ReturnD,E,F | (15.85)% | 9.26% | 14.72% | 19.88% | (6.08)% | 16.26% |
| Ratios to Average Net AssetsB,G,H | ||||||
| Expenses before reductions | .25%I | .25% | .25% | .25% | .25% | .25% |
| Expenses net of fee waivers, if any | .25%I | .25% | .25% | .25% | .25% | .25% |
| Expenses net of all reductions | .25%I | .25% | .25% | .25% | .25% | .25% |
| Net investment income (loss) | (.13)%I | 1.51% | 1.02% | 1.83% | 1.25% | 1.29% |
| Supplemental Data | ||||||
| Net assets, end of period (000 omitted) | $396,224 | $508,713 | $522,637 | $506,978 | $464,178 | $556,429 |
| Portfolio turnover rateJ | 196%I | 34% | 40% | 31% | 28% | 21% |
A Calculated based on average shares outstanding during the period.
B Net investment income (loss) is affected by the timing of the declaration of dividends by any underlying mutual funds or exchange-traded funds (ETFs). Net investment income (loss) of any such underlying funds is not included in the Fund's net investment income (loss) ratio.
C Total distributions per share do not sum due to rounding.
D Total returns for periods of less than one year are not annualized.
E Total returns do not reflect charges attributable to your insurance company's separate account. Inclusion of these charges would reduce the total returns shown.
F Total returns would have been lower if certain expenses had not been reduced during the applicable periods shown.
G Fees and expenses of any underlying mutual funds or exchange-traded funds (ETFs) are not included in the Fund's expense ratio. The Fund indirectly bears its proportionate share of these expenses.
H Expense ratios reflect operating expenses of the class. Expenses before reductions do not reflect amounts reimbursed, waived, or reduced through arrangements with the investment adviser, brokerage services, or other offset arrangements, if applicable, and do not represent the amount paid by the class during periods when reimbursements, waivers or reductions occur.
I Annualized
J Amount does not include the portfolio activity of any underlying mutual funds or exchange-traded funds (ETFs).
See accompanying notes which are an integral part of the financial statements.
VIP Freedom 2025 Portfolio℠
Investment Summary (Unaudited)
The information in the following tables is based on the direct investments of the Fund.Top Holdings as of June 30, 2022
| % of fund's net assets | |
| VIP Investment Grade Bond II Portfolio Initial Class | 22.4 |
| VIP Overseas Portfolio Initial Class | 17.6 |
| VIP Emerging Markets Portfolio Initial Class | 11.1 |
| Fidelity Inflation-Protected Bond Index Fund | 10.3 |
| VIP Growth Portfolio Initial Class | 6.0 |
| VIP Growth & Income Portfolio Initial Class | 5.8 |
| Fidelity Long-Term Treasury Bond Index Fund | 5.6 |
| VIP Equity-Income Portfolio Initial Class | 4.9 |
| VIP Contrafund Portfolio Initial Class | 4.7 |
| VIP Value Portfolio Initial Class | 3.5 |
| 91.9 |
Asset Allocation (% of fund's net assets)
| Period end | ||
| Domestic Equity Funds | 28.0% | |
| International Equity Funds | 28.7% | |
| Bond Funds | 43.3% | |

VIP Freedom 2025 Portfolio℠
Schedule of Investments June 30, 2022 (Unaudited)
Showing Percentage of Net Assets
| Domestic Equity Funds - 28.0% | |||
| Shares | Value | ||
| VIP Contrafund Portfolio Initial Class (a) | 390,820 | $15,331,853 | |
| VIP Equity-Income Portfolio Initial Class (a) | 675,902 | 15,768,803 | |
| VIP Growth & Income Portfolio Initial Class (a) | 811,696 | 18,693,368 | |
| VIP Growth Portfolio Initial Class (a) | 259,273 | 19,323,598 | |
| VIP Mid Cap Portfolio Initial Class (a) | 143,690 | 4,557,858 | |
| VIP Value Portfolio Initial Class (a) | 700,328 | 11,513,394 | |
| VIP Value Strategies Portfolio Initial Class (a) | 394,201 | 5,625,253 | |
| TOTAL DOMESTIC EQUITY FUNDS | |||
| (Cost $68,534,437) | 90,814,127 | ||
| International Equity Funds - 28.7% | |||
| VIP Emerging Markets Portfolio Initial Class (a) | 3,582,715 | 36,042,113 | |
| VIP Overseas Portfolio Initial Class (a) | 2,727,390 | 56,838,801 | |
| TOTAL INTERNATIONAL EQUITY FUNDS | |||
| (Cost $94,083,566) | 92,880,914 | ||
| Bond Funds - 43.3% | |||
| Fidelity Inflation-Protected Bond Index Fund (a) | 3,300,131 | 33,496,329 | |
| Fidelity International Bond Index Fund (a) | 1,164,748 | 10,599,210 | |
| Fidelity Long-Term Treasury Bond Index Fund (a) | 1,573,000 | 18,136,695 | |
| VIP High Income Portfolio Initial Class (a) | 1,180,895 | 5,337,645 | |
| VIP Investment Grade Bond II Portfolio Initial Class (a) | 7,447,414 | 72,686,760 | |
| TOTAL BOND FUNDS | |||
| (Cost $146,861,372) | 140,256,639 | ||
| TOTAL INVESTMENT IN SECURITIES - 100.0% | |||
| (Cost $309,479,375) | 323,951,680 | ||
| NET OTHER ASSETS (LIABILITIES) - 0.0% | (33,402) | ||
| NET ASSETS - 100% | $323,918,278 |
Legend
(a) Affiliated Fund
Affiliated Underlying Funds
Fiscal year to date information regarding the Fund's investments in affiliated Underlying Funds is presented below. Exchanges between classes of the same affiliated Underlying Funds may occur, and are excluded from purchases and sales below if applicable. If an underlying Fund changes its name, the name presented below is the name in effect at period end.
| Affiliate | Value, beginning of period | Purchases(a) | Sales Proceeds(a) | Dividend Income | Realized Gain (loss) | Change in Unrealized appreciation (depreciation) | Value, end of period |
| Fidelity Inflation-Protected Bond Index Fund | $32,945,426 | $10,759,192 | $7,036,985 | $-- | $(196,954) | $(2,974,350) | $33,496,329 |
| Fidelity International Bond Index Fund | 7,091,139 | 5,946,547 | 1,610,504 | 16,669 | (60,717) | (767,255) | 10,599,210 |
| Fidelity Long-Term Treasury Bond Index Fund | 13,374,126 | 11,487,730 | 3,479,780 | 159,264 | (314,837) | (2,930,544) | 18,136,695 |
| VIP Contrafund Portfolio Initial Class | 19,678,366 | 4,777,967 | 3,463,244 | 170,265 | (268,523) | (5,392,713) | 15,331,853 |
| VIP Emerging Markets Portfolio Initial Class | 43,133,138 | 10,593,465 | 9,126,163 | -- | (774,417) | (7,783,910) | 36,042,113 |
| VIP Equity-Income Portfolio Initial Class | 20,815,467 | 3,000,791 | 5,987,588 | 24,373 | (11,238) | (2,048,629) | 15,768,803 |
| VIP Government Money Market Portfolio Initial Class 1.18% | 7,981,124 | 2,849,262 | 10,830,381 | 1,420 | (5) | -- | -- |
| VIP Growth & Income Portfolio Initial Class | 23,695,903 | 4,232,246 | 6,669,333 | 42,080 | 467,536 | (3,032,984) | 18,693,368 |
| VIP Growth Portfolio Initial Class | 20,125,466 | 9,220,879 | 4,177,275 | 872,867 | (371,399) | (5,474,073) | 19,323,598 |
| VIP High Income Portfolio Initial Class | 7,783,442 | 937,301 | 2,460,317 | 2,762 | (132,240) | (790,541) | 5,337,645 |
| VIP Investment Grade Bond Portfolio II Initial Class | -- | 85,771,943 | 11,201,787 | -- | (146,956) | (1,736,440) | 72,686,760 |
| VIP Investment Grade Bond Portfolio Initial Class | 96,640,695 | 18,102,509 | 102,789,813 | 4,166,820 | (11,165,964) | (787,427) | -- |
| VIP Mid Cap Portfolio Initial Class | 5,773,032 | 1,272,494 | 1,163,707 | 122,246 | (77,257) | (1,246,704) | 4,557,858 |
| VIP Overseas Portfolio Initial Class | 67,973,251 | 20,140,300 | 10,269,788 | 485,903 | (824,700) | (20,180,262) | 56,838,801 |
| VIP Value Portfolio Initial Class | 15,261,149 | 2,376,139 | 4,769,649 | 183,432 | 61,069 | (1,415,314) | 11,513,394 |
| VIP Value Strategies Portfolio Initial Class | 7,476,361 | 1,018,513 | 1,997,298 | 58,677 | 86,418 | (958,741) | 5,625,253 |
| $389,748,085 | $192,487,278 | $187,033,612 | $6,306,778 | $(13,730,184) | $(57,519,887) | $323,951,680 |
(a) Includes the value of shares purchased or redeemed through in-kind transactions, as applicable.
Amounts in the income column in the above table include any capital gain distributions from underlying funds, which are presented in the corresponding line-item in the Statement of Operations, if applicable.
Investment Valuation
The following is a summary of the inputs used, as of June 30, 2022, involving the Fund's assets and liabilities carried at fair value. The inputs or methodology used for valuing securities may not be an indication of the risk associated with investing in those securities. For more information on valuation inputs, and their aggregation into the levels used below, please refer to the Investment Valuation section in the accompanying Notes to Financial Statements.
| Valuation Inputs at Reporting Date: | ||||
| Description | Total | Level 1 | Level 2 | Level 3 |
| Investments in Securities: | ||||
| Domestic Equity Funds | $90,814,127 | $90,814,127 | $-- | $-- |
| International Equity Funds | 92,880,914 | 92,880,914 | -- | -- |
| Bond Funds | 140,256,639 | 140,256,639 | -- | -- |
| Total Investments in Securities: | $323,951,680 | $323,951,680 | $-- | $-- |
See accompanying notes which are an integral part of the financial statements.
VIP Freedom 2025 Portfolio℠
Financial Statements
Statement of Assets and Liabilities
| June 30, 2022 (Unaudited) | ||
| Assets | ||
| Investment in securities, at value — See accompanying schedule: | ||
| Affiliated issuers (cost $309,479,375) | $323,951,680 | |
| Total Investment in Securities (cost $309,479,375) | $323,951,680 | |
| Cash | 3,462 | |
| Receivable for investments sold | 4,046,465 | |
| Receivable for fund shares sold | 501,462 | |
| Total assets | 328,503,069 | |
| Liabilities | ||
| Payable for investments purchased | $4,152,457 | |
| Payable for fund shares redeemed | 395,472 | |
| Distribution and service plan fees payable | 36,862 | |
| Total liabilities | 4,584,791 | |
| Net Assets | $323,918,278 | |
| Net Assets consist of: | ||
| Paid in capital | $318,790,576 | |
| Total accumulated earnings (loss) | 5,127,702 | |
| Net Assets | $323,918,278 | |
| Net Asset Value and Maximum Offering Price | ||
| Initial Class: | ||
| Net Asset Value, offering price and redemption price per share ($47,412,735 ÷ 3,419,155 shares) | $13.87 | |
| Service Class: | ||
| Net Asset Value, offering price and redemption price per share ($170,579,561 ÷ 12,349,964 shares) | $13.81 | |
| Service Class 2: | ||
| Net Asset Value, offering price and redemption price per share ($105,925,982 ÷ 7,724,812 shares) | $13.71 |
See accompanying notes which are an integral part of the financial statements.
Statement of Operations
| Six months ended June 30, 2022 (Unaudited) | ||
| Investment Income | ||
| Dividends: | ||
| Affiliated issuers | $244,075 | |
| Expenses | ||
| Distribution and service plan fees | $237,032 | |
| Independent trustees' fees and expenses | 545 | |
| Total expenses before reductions | 237,577 | |
| Expense reductions | (2) | |
| Total expenses after reductions | 237,575 | |
| Net investment income (loss) | 6,500 | |
| Realized and Unrealized Gain (Loss) | ||
| Net realized gain (loss) on: | ||
| Investment securities: | ||
| Affiliated issuers | (13,730,184) | |
| Capital gain distributions from underlying funds: | ||
| Affiliated issuers | 6,062,703 | |
| Total net realized gain (loss) | (7,667,481) | |
| Change in net unrealized appreciation (depreciation) on: | ||
| Investment securities: | ||
| Affiliated issuers | (57,519,887) | |
| Total change in net unrealized appreciation (depreciation) | (57,519,887) | |
| Net gain (loss) | (65,187,368) | |
| Net increase (decrease) in net assets resulting from operations | $(65,180,868) |
See accompanying notes which are an integral part of the financial statements.
Statement of Changes in Net Assets
| Six months ended June 30, 2022 (Unaudited) | Year ended December 31, 2021 | |
| Increase (Decrease) in Net Assets | ||
| Operations | ||
| Net investment income (loss) | $6,500 | $6,072,172 |
| Net realized gain (loss) | (7,667,481) | 25,643,764 |
| Change in net unrealized appreciation (depreciation) | (57,519,887) | 4,109,554 |
| Net increase (decrease) in net assets resulting from operations | (65,180,868) | 35,825,490 |
| Distributions to shareholders | (23,399,847) | (15,855,305) |
| Share transactions - net increase (decrease) | 22,790,775 | 54,096,423 |
| Total increase (decrease) in net assets | (65,789,940) | 74,066,608 |
| Net Assets | ||
| Beginning of period | 389,708,218 | 315,641,610 |
| End of period | $323,918,278 | $389,708,218 |
See accompanying notes which are an integral part of the financial statements.
Financial Highlights
VIP Freedom 2025 Portfolio Initial Class
| Six months ended (Unaudited) June 30, | Years endedDecember 31, | |||||
| 2022 | 2021 | 2020 | 2019 | 2018 | 2017 | |
| Selected Per–Share Data | ||||||
| Net asset value, beginning of period | $17.82 | $16.84 | $15.34 | $13.21 | $14.64 | $12.95 |
| Income from Investment Operations | ||||||
| Net investment income (loss)A,B | .01 | .32 | .20 | .30 | .23 | .22 |
| Net realized and unrealized gain (loss) | (2.84) | 1.47 | 2.16 | 2.53 | (1.17) | 2.06 |
| Total from investment operations | (2.83) | 1.79 | 2.36 | 2.83 | (.94) | 2.28 |
| Distributions from net investment income | (.12) | (.19) | (.19) | (.30) | (.21) | (.21) |
| Distributions from net realized gain | (1.00) | (.62) | (.67) | (.41) | (.28) | (.38) |
| Total distributions | (1.12) | (.81) | (.86) | (.70)C | (.49) | (.59) |
| Net asset value, end of period | $13.87 | $17.82 | $16.84 | $15.34 | $13.21 | $14.64 |
| Total ReturnD,E,F | (16.70)% | 10.83% | 15.95% | 21.86% | (6.52)% | 17.89% |
| Ratios to Average Net AssetsB,G,H | ||||||
| Expenses before reductionsI | - %J | -% | -% | -% | -% | -% |
| Expenses net of fee waivers, if any | - %I,J | - %I | - %I | - %I | - %I | -% |
| Expenses net of all reductions | - %I,J | - %I | - %I | - %I | - %I | -% |
| Net investment income (loss) | .14%J | 1.82% | 1.33% | 2.04% | 1.57% | 1.58% |
| Supplemental Data | ||||||
| Net assets, end of period (000 omitted) | $47,413 | $59,715 | $55,624 | $47,253 | $38,096 | $37,773 |
| Portfolio turnover rateK | 106%J | 32% | 61% | 51% | 32% | 29% |
A Calculated based on average shares outstanding during the period.
B Net investment income (loss) is affected by the timing of the declaration of dividends by any underlying mutual funds or exchange-traded funds (ETFs). Net investment income (loss) of any such underlying funds is not included in the Fund's net investment income (loss) ratio.
C Total distributions per share do not sum due to rounding.
D Total returns for periods of less than one year are not annualized.
E Total returns do not reflect charges attributable to your insurance company's separate account. Inclusion of these charges would reduce the total returns shown.
F Total returns would have been lower if certain expenses had not been reduced during the applicable periods shown.
G Fees and expenses of any underlying mutual funds or exchange-traded funds (ETFs) are not included in the Fund's expense ratio. The Fund indirectly bears its proportionate share of these expenses.
H Expense ratios reflect operating expenses of the class. Expenses before reductions do not reflect amounts reimbursed, waived, or reduced through arrangements with the investment adviser, brokerage services, or other offset arrangements, if applicable, and do not represent the amount paid by the class during periods when reimbursements, waivers or reductions occur.
I Amount represents less than .005%.
J Annualized
K Amount does not include the portfolio activity of any underlying mutual funds or exchange-traded funds (ETFs).
See accompanying notes which are an integral part of the financial statements.
VIP Freedom 2025 Portfolio Service Class
| Six months ended (Unaudited) June 30, | Years endedDecember 31, | |||||
| 2022 | 2021 | 2020 | 2019 | 2018 | 2017 | |
| Selected Per–Share Data | ||||||
| Net asset value, beginning of period | $17.76 | $16.79 | $15.30 | $13.18 | $14.61 | $12.92 |
| Income from Investment Operations | ||||||
| Net investment income (loss)A,B | –C | .30 | .18 | .28 | .21 | .21 |
| Net realized and unrealized gain (loss) | (2.83) | 1.46 | 2.15 | 2.53 | (1.16) | 2.06 |
| Total from investment operations | (2.83) | 1.76 | 2.33 | 2.81 | (.95) | 2.27 |
| Distributions from net investment income | (.12) | (.17) | (.18) | (.28) | (.19) | (.20) |
| Distributions from net realized gain | (1.00) | (.62) | (.67) | (.41) | (.28) | (.38) |
| Total distributions | (1.12) | (.79) | (.84)D | (.69) | (.48)D | (.58) |
| Net asset value, end of period | $13.81 | $17.76 | $16.79 | $15.30 | $13.18 | $14.61 |
| Total ReturnE,F,G | (16.76)% | 10.71% | 15.83% | 21.70% | (6.61)% | 17.84% |
| Ratios to Average Net AssetsB,H,I | ||||||
| Expenses before reductions | .10%J | .10% | .10% | .10% | .10% | .10% |
| Expenses net of fee waivers, if any | .10%J | .10% | .10% | .10% | .10% | .10% |
| Expenses net of all reductions | .10%J | .10% | .10% | .10% | .10% | .10% |
| Net investment income (loss) | .04%J | 1.72% | 1.23% | 1.94% | 1.47% | 1.48% |
| Supplemental Data | ||||||
| Net assets, end of period (000 omitted) | $170,580 | $199,248 | $147,904 | $96,430 | $79,033 | $69,430 |
| Portfolio turnover rateK | 106%J | 32% | 61% | 51% | 32% | 29% |
A Calculated based on average shares outstanding during the period.
B Net investment income (loss) is affected by the timing of the declaration of dividends by any underlying mutual funds or exchange-traded funds (ETFs). Net investment income (loss) of any such underlying funds is not included in the Fund's net investment income (loss) ratio.
C Amount represents less than $.005 per share.
D Total distributions per share do not sum due to rounding.
E Total returns for periods of less than one year are not annualized.
F Total returns do not reflect charges attributable to your insurance company's separate account. Inclusion of these charges would reduce the total returns shown.
G Total returns would have been lower if certain expenses had not been reduced during the applicable periods shown.
H Fees and expenses of any underlying mutual funds or exchange-traded funds (ETFs) are not included in the Fund's expense ratio. The Fund indirectly bears its proportionate share of these expenses.
I Expense ratios reflect operating expenses of the class. Expenses before reductions do not reflect amounts reimbursed, waived, or reduced through arrangements with the investment adviser, brokerage services, or other offset arrangements, if applicable, and do not represent the amount paid by the class during periods when reimbursements, waivers or reductions occur.
J Annualized
K Amount does not include the portfolio activity of any underlying mutual funds or exchange-traded funds (ETFs).
See accompanying notes which are an integral part of the financial statements.
VIP Freedom 2025 Portfolio Service Class 2
| Six months ended (Unaudited) June 30, | Years endedDecember 31, | |||||
| 2022 | 2021 | 2020 | 2019 | 2018 | 2017 | |
| Selected Per–Share Data | ||||||
| Net asset value, beginning of period | $17.65 | $16.69 | $15.21 | $13.11 | $14.54 | $12.87 |
| Income from Investment Operations | ||||||
| Net investment income (loss)A,B | (.01) | .27 | .16 | .26 | .19 | .18 |
| Net realized and unrealized gain (loss) | (2.81) | 1.46 | 2.14 | 2.51 | (1.16) | 2.04 |
| Total from investment operations | (2.82) | 1.73 | 2.30 | 2.77 | (.97) | 2.22 |
| Distributions from net investment income | (.12) | (.15) | (.15) | (.26) | (.18) | (.18) |
| Distributions from net realized gain | (1.00) | (.62) | (.67) | (.41) | (.28) | (.38) |
| Total distributions | (1.12) | (.77) | (.82) | (.67) | (.46) | (.55)C |
| Net asset value, end of period | $13.71 | $17.65 | $16.69 | $15.21 | $13.11 | $14.54 |
| Total ReturnD,E,F | (16.81)% | 10.55% | 15.68% | 21.51% | (6.78)% | 17.57% |
| Ratios to Average Net AssetsB,G,H | ||||||
| Expenses before reductions | .25%I | .25% | .25% | .25% | .25% | .25% |
| Expenses net of fee waivers, if any | .25%I | .25% | .25% | .25% | .25% | .25% |
| Expenses net of all reductions | .25%I | .25% | .25% | .25% | .25% | .25% |
| Net investment income (loss) | (.11)%I | 1.57% | 1.08% | 1.79% | 1.32% | 1.33% |
| Supplemental Data | ||||||
| Net assets, end of period (000 omitted) | $105,926 | $130,746 | $112,114 | $97,802 | $69,234 | $63,568 |
| Portfolio turnover rateJ | 106%I | 32% | 61% | 51% | 32% | 29% |
A Calculated based on average shares outstanding during the period.
B Net investment income (loss) is affected by the timing of the declaration of dividends by any underlying mutual funds or exchange-traded funds (ETFs). Net investment income (loss) of any such underlying funds is not included in the Fund's net investment income (loss) ratio.
C Total distributions per share do not sum due to rounding.
D Total returns for periods of less than one year are not annualized.
E Total returns do not reflect charges attributable to your insurance company's separate account. Inclusion of these charges would reduce the total returns shown.
F Total returns would have been lower if certain expenses had not been reduced during the applicable periods shown.
G Fees and expenses of any underlying mutual funds or exchange-traded funds (ETFs) are not included in the Fund's expense ratio. The Fund indirectly bears its proportionate share of these expenses.
H Expense ratios reflect operating expenses of the class. Expenses before reductions do not reflect amounts reimbursed, waived, or reduced through arrangements with the investment adviser, brokerage services, or other offset arrangements, if applicable, and do not represent the amount paid by the class during periods when reimbursements, waivers or reductions occur.
I Annualized
J Amount does not include the portfolio activity of any underlying mutual funds or exchange-traded funds (ETFs).
See accompanying notes which are an integral part of the financial statements.
VIP Freedom 2030 Portfolio℠
Investment Summary (Unaudited)
The information in the following tables is based on the direct investments of the Fund.Top Holdings as of June 30, 2022
| % of fund's net assets | |
| VIP Investment Grade Bond II Portfolio Initial Class | 19.6 |
| VIP Overseas Portfolio Initial Class | 19.4 |
| VIP Emerging Markets Portfolio Initial Class | 11.9 |
| VIP Growth Portfolio Initial Class | 6.8 |
| Fidelity Inflation-Protected Bond Index Fund | 6.7 |
| VIP Growth & Income Portfolio Initial Class | 6.6 |
| Fidelity Long-Term Treasury Bond Index Fund | 6.0 |
| VIP Equity-Income Portfolio Initial Class | 5.5 |
| VIP Contrafund Portfolio Initial Class | 5.4 |
| VIP Value Portfolio Initial Class | 4.1 |
| 92.0 |
Asset Allocation (% of fund's net assets)
| Period end | ||
| Domestic Equity Funds | 32.0% | |
| International Equity Funds | 31.3% | |
| Bond Funds | 36.7% | |

VIP Freedom 2030 Portfolio℠
Schedule of Investments June 30, 2022 (Unaudited)
Showing Percentage of Net Assets
| Domestic Equity Funds - 32.0% | |||
| Shares | Value | ||
| VIP Contrafund Portfolio Initial Class (a) | 788,025 | $30,914,233 | |
| VIP Equity-Income Portfolio Initial Class (a) | 1,362,896 | 31,796,374 | |
| VIP Growth & Income Portfolio Initial Class (a) | 1,636,661 | 37,692,314 | |
| VIP Growth Portfolio Initial Class (a) | 522,787 | 38,963,323 | |
| VIP Mid Cap Portfolio Initial Class (a) | 289,737 | 9,190,447 | |
| VIP Value Portfolio Initial Class (a) | 1,412,126 | 23,215,356 | |
| VIP Value Strategies Portfolio Initial Class (a) | 794,841 | 11,342,377 | |
| TOTAL DOMESTIC EQUITY FUNDS | |||
| (Cost $133,707,007) | 183,114,424 | ||
| International Equity Funds - 31.3% | |||
| VIP Emerging Markets Portfolio Initial Class (a) | 6,781,420 | 68,221,089 | |
| VIP Overseas Portfolio Initial Class (a) | 5,334,280 | 111,166,397 | |
| TOTAL INTERNATIONAL EQUITY FUNDS | |||
| (Cost $173,444,798) | 179,387,486 | ||
| Bond Funds - 36.7% | |||
| Fidelity Inflation-Protected Bond Index Fund (a) | 3,753,488 | 38,097,906 | |
| Fidelity International Bond Index Fund (a) | 1,736,575 | 15,802,833 | |
| Fidelity Long-Term Treasury Bond Index Fund (a) | 2,995,157 | 34,534,163 | |
| VIP High Income Portfolio Initial Class (a) | 2,089,391 | 9,444,050 | |
| VIP Investment Grade Bond II Portfolio Initial Class (a) | 11,529,199 | 112,524,981 | |
| TOTAL BOND FUNDS | |||
| (Cost $219,412,289) | 210,403,933 | ||
| Short-Term Funds - 0.0% | |||
| Fidelity Cash Central Fund 1.58% (b) | |||
| (Cost $2,724) | 2,724 | 2,724 | |
| TOTAL INVESTMENT IN SECURITIES - 100.0% | |||
| (Cost $526,566,818) | 572,908,567 | ||
| NET OTHER ASSETS (LIABILITIES) - 0.0% | (64,229) | ||
| NET ASSETS - 100% | $572,844,338 |
Legend
(a) Affiliated Fund
(b) Affiliated fund that is generally available only to investment companies and other accounts managed by Fidelity Investments. The rate quoted is the annualized seven-day yield of the fund at period end. A complete unaudited listing of the fund's holdings as of its most recent quarter end is available upon request. In addition, each Fidelity Central Fund's financial statements are available on the SEC's website or upon request.
Affiliated Central Funds
Fiscal year to date information regarding the Fund's investments in Fidelity Central Funds, including the ownership percentage, is presented below.
| Fund | Value, beginning of period | Purchases | Sales Proceeds | Dividend Income | Realized Gain/Loss | Change in Unrealized appreciation (depreciation) | Value, end of period | % ownership, end of period |
| Fidelity Cash Central Fund 1.58% | $-- | $72,462 | $69,738 | $4 | $-- | $-- | $2,724 | 0.0% |
| Total | $-- | $72,462 | $69,738 | $4 | $-- | $-- | $2,724 |
Amounts in the income column in the above table include any capital gain distributions from underlying funds, which are presented in the corresponding line-item in the Statement of Operations, if applicable.
Affiliated Underlying Funds
Fiscal year to date information regarding the Fund's investments in affiliated Underlying Funds is presented below. Exchanges between classes of the same affiliated Underlying Funds may occur, and are excluded from purchases and sales below if applicable. If an underlying Fund changes its name, the name presented below is the name in effect at period end.
| Affiliate | Value, beginning of period | Purchases(a) | Sales Proceeds(a) | Dividend Income | Realized Gain (loss) | Change in Unrealized appreciation (depreciation) | Value, end of period |
| Fidelity Inflation-Protected Bond Index Fund | $42,086,896 | $13,728,099 | $13,948,463 | $-- | $(592,477) | $(3,176,149) | $38,097,906 |
| Fidelity International Bond Index Fund | 10,611,029 | 10,534,835 | 4,089,498 | 24,765 | (271,444) | (982,089) | 15,802,833 |
| Fidelity Long-Term Treasury Bond Index Fund | 24,629,023 | 25,160,339 | 9,041,851 | 305,239 | (1,417,285) | (4,796,063) | 34,534,163 |
| VIP Contrafund Portfolio Initial Class | 38,769,905 | 13,675,630 | 10,145,169 | 352,712 | (1,121,824) | (10,264,309) | 30,914,233 |
| VIP Emerging Markets Portfolio Initial Class | 80,003,541 | 28,380,528 | 23,967,868 | -- | (4,468,551) | (11,726,561) | 68,221,089 |
| VIP Equity-Income Portfolio Initial Class | 41,009,253 | 10,258,064 | 15,295,720 | 50,552 | (281,589) | (3,893,634) | 31,796,374 |
| VIP Government Money Market Portfolio Initial Class 1.18% | 2,836,451 | 4,501,702 | 7,338,153 | 1,001 | -- | -- | -- |
| VIP Growth & Income Portfolio Initial Class | 46,685,013 | 13,050,586 | 16,814,683 | 87,277 | 394,181 | (5,622,783) | 37,692,314 |
| VIP Growth Portfolio Initial Class | 39,650,760 | 22,753,922 | 11,659,190 | 1,808,186 | (1,576,017) | (10,206,152) | 38,963,323 |
| VIP High Income Portfolio Initial Class | 13,501,658 | 2,837,872 | 5,254,156 | 5,042 | (427,306) | (1,214,018) | 9,444,050 |
| VIP Investment Grade Bond Portfolio II Initial Class | -- | 134,575,745 | 19,106,555 | -- | (243,865) | (2,700,344) | 112,524,981 |
| VIP Investment Grade Bond Portfolio Initial Class | 149,358,215 | 47,063,280 | 177,375,224 | 6,774,092 | (18,241,002) | (805,269) | -- |
| VIP Mid Cap Portfolio Initial Class | 11,373,487 | 3,731,675 | 3,239,740 | 254,215 | (365,847) | (2,309,128) | 9,190,447 |
| VIP Overseas Portfolio Initial Class | 130,592,101 | 52,545,583 | 30,796,505 | 983,436 | (5,630,557) | (35,544,225) | 111,166,397 |
| VIP Value Portfolio Initial Class | 30,066,582 | 7,922,726 | 12,015,132 | 380,821 | (169,956) | (2,588,864) | 23,215,356 |
| VIP Value Strategies Portfolio Initial Class | 14,729,371 | 3,556,102 | 5,164,794 | 121,796 | (65,545) | (1,712,757) | 11,342,377 |
| $675,903,285 | $394,276,688 | $365,252,701 | $11,149,134 | $(34,479,084) | $(97,542,345) | $572,905,843 |
(a) Includes the value of shares purchased or redeemed through in-kind transactions, as applicable.
Amounts in the income column in the above table include any capital gain distributions from underlying funds, which are presented in the corresponding line-item in the Statement of Operations, if applicable.
Investment Valuation
The following is a summary of the inputs used, as of June 30, 2022, involving the Fund's assets and liabilities carried at fair value. The inputs or methodology used for valuing securities may not be an indication of the risk associated with investing in those securities. For more information on valuation inputs, and their aggregation into the levels used below, please refer to the Investment Valuation section in the accompanying Notes to Financial Statements.
| Valuation Inputs at Reporting Date: | ||||
| Description | Total | Level 1 | Level 2 | Level 3 |
| Investments in Securities: | ||||
| Domestic Equity Funds | $183,114,424 | $183,114,424 | $-- | $-- |
| International Equity Funds | 179,387,486 | 179,387,486 | -- | -- |
| Bond Funds | 210,403,933 | 210,403,933 | -- | -- |
| Short-Term Funds | 2,724 | 2,724 | -- | -- |
| Total Investments in Securities: | $572,908,567 | $572,908,567 | $-- | $-- |
See accompanying notes which are an integral part of the financial statements.
VIP Freedom 2030 Portfolio℠
Financial Statements
Statement of Assets and Liabilities
| June 30, 2022 (Unaudited) | ||
| Assets | ||
| Investment in securities, at value — See accompanying schedule: | ||
| Fidelity Central Funds (cost $2,724) | $2,724 | |
| Other affiliated issuers (cost $526,564,094) | 572,905,843 | |
| Total Investment in Securities (cost $526,566,818) | $572,908,567 | |
| Receivable for investments sold | 6,910,057 | |
| Receivable for fund shares sold | 381,924 | |
| Distributions receivable from Fidelity Central Funds | 4 | |
| Total assets | 580,200,552 | |
| Liabilities | ||
| Payable for investments purchased | $6,876,769 | |
| Payable for fund shares redeemed | 415,218 | |
| Distribution and service plan fees payable | 64,227 | |
| Total liabilities | 7,356,214 | |
| Net Assets | $572,844,338 | |
| Net Assets consist of: | ||
| Paid in capital | $554,747,302 | |
| Total accumulated earnings (loss) | 18,097,036 | |
| Net Assets | $572,844,338 | |
| Net Asset Value and Maximum Offering Price | ||
| Initial Class: | ||
| Net Asset Value, offering price and redemption price per share ($115,648,150 ÷ 8,378,358 shares) | $13.80 | |
| Service Class: | ||
| Net Asset Value, offering price and redemption price per share ($259,228,305 ÷ 18,846,266 shares) | $13.75 | |
| Service Class 2: | ||
| Net Asset Value, offering price and redemption price per share ($197,967,883 ÷ 14,465,483 shares) | $13.69 |
See accompanying notes which are an integral part of the financial statements.
Statement of Operations
| Six months ended June 30, 2022 (Unaudited) | ||
| Investment Income | ||
| Dividends: | ||
| Affiliated issuers | $468,543 | |
| Income from Fidelity Central Funds | 4 | |
| Total income | 468,547 | |
| Expenses | ||
| Distribution and service plan fees | $412,009 | |
| Independent trustees' fees and expenses | 962 | |
| Total expenses before reductions | 412,971 | |
| Expense reductions | (2) | |
| Total expenses after reductions | 412,969 | |
| Net investment income (loss) | 55,578 | |
| Realized and Unrealized Gain (Loss) | ||
| Net realized gain (loss) on: | ||
| Investment securities: | ||
| Affiliated issuers | (34,479,084) | |
| Capital gain distributions from underlying funds: | ||
| Affiliated issuers | 10,680,591 | |
| Total net realized gain (loss) | (23,798,493) | |
| Change in net unrealized appreciation (depreciation) on: | ||
| Investment securities: | ||
| Affiliated issuers | (97,542,345) | |
| Total change in net unrealized appreciation (depreciation) | (97,542,345) | |
| Net gain (loss) | (121,340,838) | |
| Net increase (decrease) in net assets resulting from operations | $(121,285,260) |
See accompanying notes which are an integral part of the financial statements.
Statement of Changes in Net Assets
| Six months ended June 30, 2022 (Unaudited) | Year ended December 31, 2021 | |
| Increase (Decrease) in Net Assets | ||
| Operations | ||
| Net investment income (loss) | $55,578 | $10,042,183 |
| Net realized gain (loss) | (23,798,493) | 48,121,155 |
| Change in net unrealized appreciation (depreciation) | (97,542,345) | 10,401,157 |
| Net increase (decrease) in net assets resulting from operations | (121,285,260) | 68,564,495 |
| Distributions to shareholders | (43,506,353) | (31,178,354) |
| Share transactions - net increase (decrease) | 61,804,036 | 105,572,827 |
| Total increase (decrease) in net assets | (102,987,577) | 142,958,968 |
| Net Assets | ||
| Beginning of period | 675,831,915 | 532,872,947 |
| End of period | $572,844,338 | $675,831,915 |
See accompanying notes which are an integral part of the financial statements.
Financial Highlights
VIP Freedom 2030 Portfolio Initial Class
| Six months ended (Unaudited) June 30, | Years endedDecember 31, | |||||
| 2022 | 2021 | 2020 | 2019 | 2018 | 2017 | |
| Selected Per–Share Data | ||||||
| Net asset value, beginning of period | $17.93 | $16.83 | $15.28 | $12.98 | $14.67 | $12.75 |
| Income from Investment Operations | ||||||
| Net investment income (loss)A,B | .01 | .31 | .19 | .30 | .20 | .20 |
| Net realized and unrealized gain (loss) | (2.99) | 1.72 | 2.28 | 2.80 | (1.32) | 2.41 |
| Total from investment operations | (2.98) | 2.03 | 2.47 | 3.10 | (1.12) | 2.61 |
| Distributions from net investment income | (.10) | (.19) | (.19) | (.29) | (.20) | (.20) |
| Distributions from net realized gain | (1.05) | (.74) | (.74) | (.51) | (.37) | (.49) |
| Total distributions | (1.15) | (.93) | (.92)C | (.80) | (.57) | (.69) |
| Net asset value, end of period | $13.80 | $17.93 | $16.83 | $15.28 | $12.98 | $14.67 |
| Total ReturnD,E,F | (17.52)% | 12.37% | 16.89% | 24.43% | (7.78)% | 20.96% |
| Ratios to Average Net AssetsB,G,H | ||||||
| Expenses before reductionsI | - %J | -% | -% | -% | -% | -% |
| Expenses net of fee waivers, if any | - %I,J | - %I | - %I | - %I | - %I | -% |
| Expenses net of all reductions | - %I,J | - %I | - %I | - %I | - %I | -% |
| Net investment income (loss) | .15%J | 1.77% | 1.31% | 2.09% | 1.42% | 1.48% |
| Supplemental Data | ||||||
| Net assets, end of period (000 omitted) | $115,648 | $138,193 | $113,727 | $93,564 | $71,004 | $74,247 |
| Portfolio turnover rateK | 116%J | 28% | 46% | 30% | 29% | 26% |
A Calculated based on average shares outstanding during the period.
B Net investment income (loss) is affected by the timing of the declaration of dividends by any underlying mutual funds or exchange-traded funds (ETFs). Net investment income (loss) of any such underlying funds is not included in the Fund's net investment income (loss) ratio.
C Total distributions per share do not sum due to rounding.
D Total returns for periods of less than one year are not annualized.
E Total returns do not reflect charges attributable to your insurance company's separate account. Inclusion of these charges would reduce the total returns shown.
F Total returns would have been lower if certain expenses had not been reduced during the applicable periods shown.
G Fees and expenses of any underlying mutual funds or exchange-traded funds (ETFs) are not included in the Fund's expense ratio. The Fund indirectly bears its proportionate share of these expenses. For additional expense information related to investments in Fidelity Central Funds, please refer to the "Investments in Fidelity Central Funds" note found in the Notes to Financial Statements section of the most recent Annual or Semi-Annual report.
H Expense ratios reflect operating expenses of the class. Expenses before reductions do not reflect amounts reimbursed, waived, or reduced through arrangements with the investment adviser, brokerage services, or other offset arrangements, if applicable, and do not represent the amount paid by the class during periods when reimbursements, waivers or reductions occur.
I Amount represents less than .005%.
J Annualized
K Amount does not include the portfolio activity of any underlying mutual funds or exchange-traded funds (ETFs).
See accompanying notes which are an integral part of the financial statements.
VIP Freedom 2030 Portfolio Service Class
| Six months ended (Unaudited) June 30, | Years endedDecember 31, | |||||
| 2022 | 2021 | 2020 | 2019 | 2018 | 2017 | |
| Selected Per–Share Data | ||||||
| Net asset value, beginning of period | $17.88 | $16.79 | $15.25 | $12.95 | $14.64 | $12.73 |
| Income from Investment Operations | ||||||
| Net investment income (loss)A,B | –C | .29 | .18 | .29 | .19 | .19 |
| Net realized and unrealized gain (loss) | (2.98) | 1.72 | 2.27 | 2.79 | (1.32) | 2.40 |
| Total from investment operations | (2.98) | 2.01 | 2.45 | 3.08 | (1.13) | 2.59 |
| Distributions from net investment income | (.10) | (.18) | (.17) | (.28) | (.19) | (.19) |
| Distributions from net realized gain | (1.05) | (.74) | (.74) | (.51) | (.37) | (.49) |
| Total distributions | (1.15) | (.92) | (.91) | (.78)D | (.56) | (.68) |
| Net asset value, end of period | $13.75 | $17.88 | $16.79 | $15.25 | $12.95 | $14.64 |
| Total ReturnE,F,G | (17.58)% | 12.24% | 16.76% | 24.37% | (7.88)% | 20.82% |
| Ratios to Average Net AssetsB,H,I | ||||||
| Expenses before reductions | .10%J | .10% | .10% | .10% | .10% | .10% |
| Expenses net of fee waivers, if any | .10%J | .10% | .10% | .10% | .10% | .10% |
| Expenses net of all reductions | .10%J | .10% | .10% | .10% | .10% | .10% |
| Net investment income (loss) | .05%J | 1.67% | 1.21% | 1.99% | 1.32% | 1.38% |
| Supplemental Data | ||||||
| Net assets, end of period (000 omitted) | $259,228 | $294,595 | $225,149 | $168,105 | $121,155 | $111,029 |
| Portfolio turnover rateK | 116%J | 28% | 46% | 30% | 29% | 26% |
A Calculated based on average shares outstanding during the period.
B Net investment income (loss) is affected by the timing of the declaration of dividends by any underlying mutual funds or exchange-traded funds (ETFs). Net investment income (loss) of any such underlying funds is not included in the Fund's net investment income (loss) ratio.
C Amount represents less than $.005 per share.
D Total distributions per share do not sum due to rounding.
E Total returns for periods of less than one year are not annualized.
F Total returns do not reflect charges attributable to your insurance company's separate account. Inclusion of these charges would reduce the total returns shown.
G Total returns would have been lower if certain expenses had not been reduced during the applicable periods shown.
H Fees and expenses of any underlying mutual funds or exchange-traded funds (ETFs) are not included in the Fund's expense ratio. The Fund indirectly bears its proportionate share of these expenses. For additional expense information related to investments in Fidelity Central Funds, please refer to the "Investments in Fidelity Central Funds" note found in the Notes to Financial Statements section of the most recent Annual or Semi-Annual report.
I Expense ratios reflect operating expenses of the class. Expenses before reductions do not reflect amounts reimbursed, waived, or reduced through arrangements with the investment adviser, brokerage services, or other offset arrangements, if applicable, and do not represent the amount paid by the class during periods when reimbursements, waivers or reductions occur.
J Annualized
K Amount does not include the portfolio activity of any underlying mutual funds or exchange-traded funds (ETFs).
See accompanying notes which are an integral part of the financial statements.
VIP Freedom 2030 Portfolio Service Class 2
| Six months ended (Unaudited) June 30, | Years endedDecember 31, | |||||
| 2022 | 2021 | 2020 | 2019 | 2018 | 2017 | |
| Selected Per–Share Data | ||||||
| Net asset value, beginning of period | $17.81 | $16.73 | $15.19 | $12.91 | $14.60 | $12.69 |
| Income from Investment Operations | ||||||
| Net investment income (loss)A,B | (.01) | .27 | .16 | .26 | .17 | .17 |
| Net realized and unrealized gain (loss) | (2.96) | 1.70 | 2.26 | 2.78 | (1.32) | 2.40 |
| Total from investment operations | (2.97) | 1.97 | 2.42 | 3.04 | (1.15) | 2.57 |
| Distributions from net investment income | (.10) | (.15) | (.15) | (.26) | (.17) | (.16) |
| Distributions from net realized gain | (1.05) | (.74) | (.74) | (.51) | (.37) | (.49) |
| Total distributions | (1.15) | (.89) | (.88)C | (.76)C | (.54) | (.66)C |
| Net asset value, end of period | $13.69 | $17.81 | $16.73 | $15.19 | $12.91 | $14.60 |
| Total ReturnD,E,F | (17.59)% | 12.07% | 16.64% | 24.11% | (8.05)% | 20.69% |
| Ratios to Average Net AssetsB,G,H | ||||||
| Expenses before reductions | .25%I | .25% | .25% | .25% | .25% | .25% |
| Expenses net of fee waivers, if any | .25%I | .25% | .25% | .25% | .25% | .25% |
| Expenses net of all reductions | .25%I | .25% | .25% | .25% | .25% | .25% |
| Net investment income (loss) | (.10)%I | 1.52% | 1.06% | 1.84% | 1.17% | 1.23% |
| Supplemental Data | ||||||
| Net assets, end of period (000 omitted) | $197,968 | $243,043 | $193,997 | $173,271 | $130,567 | $144,577 |
| Portfolio turnover rateJ | 116%I | 28% | 46% | 30% | 29% | 26% |
A Calculated based on average shares outstanding during the period.
B Net investment income (loss) is affected by the timing of the declaration of dividends by any underlying mutual funds or exchange-traded funds (ETFs). Net investment income (loss) of any such underlying funds is not included in the Fund's net investment income (loss) ratio.
C Total distributions per share do not sum due to rounding.
D Total returns for periods of less than one year are not annualized.
E Total returns do not reflect charges attributable to your insurance company's separate account. Inclusion of these charges would reduce the total returns shown.
F Total returns would have been lower if certain expenses had not been reduced during the applicable periods shown.
G Fees and expenses of any underlying mutual funds or exchange-traded funds (ETFs) are not included in the Fund's expense ratio. The Fund indirectly bears its proportionate share of these expenses. For additional expense information related to investments in Fidelity Central Funds, please refer to the "Investments in Fidelity Central Funds" note found in the Notes to Financial Statements section of the most recent Annual or Semi-Annual report.
H Expense ratios reflect operating expenses of the class. Expenses before reductions do not reflect amounts reimbursed, waived, or reduced through arrangements with the investment adviser, brokerage services, or other offset arrangements, if applicable, and do not represent the amount paid by the class during periods when reimbursements, waivers or reductions occur.
I Annualized
J Amount does not include the portfolio activity of any underlying mutual funds or exchange-traded funds (ETFs).
See accompanying notes which are an integral part of the financial statements.
VIP Freedom 2035 Portfolio℠
Investment Summary (Unaudited)
The information in the following tables is based on the direct investments of the Fund.Top Holdings as of June 30, 2022
| % of fund's net assets | |
| VIP Overseas Portfolio Initial Class | 23.5 |
| VIP Emerging Markets Portfolio Initial Class | 13.6 |
| VIP Investment Grade Bond II Portfolio Initial Class | 9.8 |
| VIP Growth Portfolio Initial Class | 8.6 |
| VIP Growth & Income Portfolio Initial Class | 8.4 |
| VIP Equity-Income Portfolio Initial Class | 7.1 |
| VIP Contrafund Portfolio Initial Class | 6.9 |
| Fidelity Long-Term Treasury Bond Index Fund | 6.4 |
| VIP Value Portfolio Initial Class | 5.1 |
| VIP Value Strategies Portfolio Initial Class | 2.5 |
| 91.9 |
Asset Allocation (% of fund's net assets)
| Period end | ||
| Domestic Equity Funds | 40.6% | |
| International Equity Funds | 37.1% | |
| Bond Funds | 22.3% | |
VIP Freedom 2035 Portfolio℠
Schedule of Investments June 30, 2022 (Unaudited)
Showing Percentage of Net Assets
| Domestic Equity Funds - 40.6% | |||
| Shares | Value | ||
| VIP Contrafund Portfolio Initial Class (a) | 343,466 | $13,474,169 | |
| VIP Equity-Income Portfolio Initial Class (a) | 594,095 | 13,860,243 | |
| VIP Growth & Income Portfolio Initial Class (a) | 713,295 | 16,427,194 | |
| VIP Growth Portfolio Initial Class (a) | 227,812 | 16,978,833 | |
| VIP Mid Cap Portfolio Initial Class (a) | 126,287 | 4,005,811 | |
| VIP Value Portfolio Initial Class (a) | 615,556 | 10,119,740 | |
| VIP Value Strategies Portfolio Initial Class (a) | 346,483 | 4,944,319 | |
| TOTAL DOMESTIC EQUITY FUNDS | |||
| (Cost $73,858,363) | 79,810,309 | ||
| International Equity Funds - 37.1% | |||
| VIP Emerging Markets Portfolio Initial Class (a) | 2,663,136 | 26,791,143 | |
| VIP Overseas Portfolio Initial Class (a) | 2,215,841 | 46,178,128 | |
| TOTAL INTERNATIONAL EQUITY FUNDS | |||
| (Cost $80,661,261) | 72,969,271 | ||
| Bond Funds - 22.3% | |||
| Fidelity Inflation-Protected Bond Index Fund (a) | 439,291 | 4,458,808 | |
| Fidelity International Bond Index Fund (a) | 485,575 | 4,418,733 | |
| Fidelity Long-Term Treasury Bond Index Fund (a) | 1,087,109 | 12,534,368 | |
| VIP High Income Portfolio Initial Class (a) | 718,483 | 3,247,545 | |
| VIP Investment Grade Bond II Portfolio Initial Class (a) | 1,974,972 | 19,275,727 | |
| TOTAL BOND FUNDS | |||
| (Cost $46,956,771) | 43,935,181 | ||
| TOTAL INVESTMENT IN SECURITIES - 100.0% | |||
| (Cost $201,476,395) | 196,714,761 | ||
| NET OTHER ASSETS (LIABILITIES) - 0.0% | (27,041) | ||
| NET ASSETS - 100% | $196,687,720 |
Legend
(a) Affiliated Fund
Affiliated Underlying Funds
Fiscal year to date information regarding the Fund's investments in affiliated Underlying Funds is presented below. Exchanges between classes of the same affiliated Underlying Funds may occur, and are excluded from purchases and sales below if applicable. If an underlying Fund changes its name, the name presented below is the name in effect at period end.
| Affiliate | Value, beginning of period | Purchases(a) | Sales Proceeds(a) | Dividend Income | Realized Gain (loss) | Change in Unrealized appreciation (depreciation) | Value, end of period |
| Fidelity Inflation-Protected Bond Index Fund | $4,772,420 | $1,566,832 | $1,460,949 | $-- | $(32,700) | $(386,795) | $4,458,808 |
| Fidelity International Bond Index Fund | 2,791,522 | 2,483,545 | 510,124 | 6,776 | (29,177) | (317,033) | 4,418,733 |
| Fidelity Long-Term Treasury Bond Index Fund | 8,065,134 | 8,266,692 | 1,603,647 | 108,745 | (210,394) | (1,983,417) | 12,534,368 |
| VIP Contrafund Portfolio Initial Class | 15,616,284 | 4,393,622 | 1,739,666 | 149,093 | (175,840) | (4,620,231) | 13,474,169 |
| VIP Emerging Markets Portfolio Initial Class | 28,987,255 | 8,500,900 | 4,433,630 | -- | (525,613) | (5,737,769) | 26,791,143 |
| VIP Equity-Income Portfolio Initial Class | 16,517,751 | 3,102,635 | 3,987,006 | 21,157 | (136,971) | (1,636,166) | 13,860,243 |
| VIP Growth & Income Portfolio Initial Class | 18,804,297 | 3,920,155 | 4,042,777 | 36,530 | (38,692) | (2,215,789) | 16,427,194 |
| VIP Growth Portfolio Initial Class | 15,971,085 | 8,045,142 | 2,084,935 | 764,263 | (218,826) | (4,733,633) | 16,978,833 |
| VIP High Income Portfolio Initial Class | 3,192,751 | 1,024,666 | 470,304 | 1,241 | (20,359) | (479,209) | 3,247,545 |
| VIP Investment Grade Bond Portfolio II Initial Class | -- | 25,323,492 | 5,547,475 | -- | (55,817) | (444,473) | 19,275,727 |
| VIP Investment Grade Bond Portfolio Initial Class | 25,701,690 | 7,325,364 | 29,632,439 | 1,202,167 | (3,667,874) | 273,259 | -- |
| VIP Mid Cap Portfolio Initial Class | 4,581,003 | 1,187,238 | 634,499 | 107,023 | (47,269) | (1,080,662) | 4,005,811 |
| VIP Overseas Portfolio Initial Class | 49,915,329 | 17,409,840 | 4,572,006 | 391,195 | (387,064) | (16,187,971) | 46,178,128 |
| VIP Value Portfolio Initial Class | 12,110,363 | 2,208,456 | 3,028,917 | 159,399 | (72,385) | (1,097,777) | 10,119,740 |
| VIP Value Strategies Portfolio Initial Class | 5,932,671 | 1,085,182 | 1,317,608 | 50,978 | (28,368) | (727,558) | 4,944,319 |
| $212,959,555 | $95,843,761 | $65,065,982 | $2,998,567 | $(5,647,349) | $(41,375,224) | $196,714,761 |
(a) Includes the value of shares purchased or redeemed through in-kind transactions, as applicable.
Amounts in the income column in the above table include any capital gain distributions from underlying funds, which are presented in the corresponding line-item in the Statement of Operations, if applicable.
Investment Valuation
The following is a summary of the inputs used, as of June 30, 2022, involving the Fund's assets and liabilities carried at fair value. The inputs or methodology used for valuing securities may not be an indication of the risk associated with investing in those securities. For more information on valuation inputs, and their aggregation into the levels used below, please refer to the Investment Valuation section in the accompanying Notes to Financial Statements.
| Valuation Inputs at Reporting Date: | ||||
| Description | Total | Level 1 | Level 2 | Level 3 |
| Investments in Securities: | ||||
| Domestic Equity Funds | $79,810,309 | $79,810,309 | $-- | $-- |
| International Equity Funds | 72,969,271 | 72,969,271 | -- | -- |
| Bond Funds | 43,935,181 | 43,935,181 | -- | -- |
| Total Investments in Securities: | $196,714,761 | $196,714,761 | $-- | $-- |
See accompanying notes which are an integral part of the financial statements.
VIP Freedom 2035 Portfolio℠
Financial Statements
Statement of Assets and Liabilities
| June 30, 2022 (Unaudited) | ||
| Assets | ||
| Investment in securities, at value — See accompanying schedule: | ||
| Affiliated issuers (cost $201,476,395) | $196,714,761 | |
| Total Investment in Securities (cost $201,476,395) | $196,714,761 | |
| Cash | 9 | |
| Receivable for investments sold | 1,493,898 | |
| Receivable for fund shares sold | 425,520 | |
| Total assets | 198,634,188 | |
| Liabilities | ||
| Payable for investments purchased | $1,901,305 | |
| Payable for fund shares redeemed | 18,105 | |
| Distribution and service plan fees payable | 27,058 | |
| Total liabilities | 1,946,468 | |
| Net Assets | $196,687,720 | |
| Net Assets consist of: | ||
| Paid in capital | $205,592,042 | |
| Total accumulated earnings (loss) | (8,904,322) | |
| Net Assets | $196,687,720 | |
| Net Asset Value and Maximum Offering Price | ||
| Initial Class: | ||
| Net Asset Value, offering price and redemption price per share ($15,950,924 ÷ 704,592 shares) | $22.64 | |
| Service Class: | ||
| Net Asset Value, offering price and redemption price per share ($88,560,665 ÷ 3,925,650 shares) | $22.56 | |
| Service Class 2: | ||
| Net Asset Value, offering price and redemption price per share ($92,176,131 ÷ 4,115,840 shares) | $22.40 |
See accompanying notes which are an integral part of the financial statements.
Statement of Operations
| Six months ended June 30, 2022 (Unaudited) | ||
| Investment Income | ||
| Dividends: | ||
| Affiliated issuers | $172,763 | |
| Expenses | ||
| Distribution and service plan fees | $172,712 | |
| Independent trustees' fees and expenses | 317 | |
| Total expenses | 173,029 | |
| Net investment income (loss) | (266) | |
| Realized and Unrealized Gain (Loss) | ||
| Net realized gain (loss) on: | ||
| Investment securities: | ||
| Affiliated issuers | (5,647,349) | |
| Capital gain distributions from underlying funds: | ||
| Affiliated issuers | 2,825,804 | |
| Total net realized gain (loss) | (2,821,545) | |
| Change in net unrealized appreciation (depreciation) on: | ||
| Investment securities: | ||
| Affiliated issuers | (41,375,224) | |
| Total change in net unrealized appreciation (depreciation) | (41,375,224) | |
| Net gain (loss) | (44,196,769) | |
| Net increase (decrease) in net assets resulting from operations | $(44,197,035) |
See accompanying notes which are an integral part of the financial statements.
Statement of Changes in Net Assets
| Six months ended June 30, 2022 (Unaudited) | Year ended December 31, 2021 | |
| Increase (Decrease) in Net Assets | ||
| Operations | ||
| Net investment income (loss) | $(266) | $2,570,825 |
| Net realized gain (loss) | (2,821,545) | 17,115,249 |
| Change in net unrealized appreciation (depreciation) | (41,375,224) | 6,347,272 |
| Net increase (decrease) in net assets resulting from operations | (44,197,035) | 26,033,346 |
| Distributions to shareholders | (14,922,812) | (8,795,165) |
| Share transactions - net increase (decrease) | 42,877,727 | 39,118,407 |
| Total increase (decrease) in net assets | (16,242,120) | 56,356,588 |
| Net Assets | ||
| Beginning of period | 212,929,840 | 156,573,252 |
| End of period | $196,687,720 | $212,929,840 |
See accompanying notes which are an integral part of the financial statements.
Financial Highlights
VIP Freedom 2035 Portfolio Initial Class
| Six months ended (Unaudited) June 30, | Years endedDecember 31, | |||||
| 2022 | 2021 | 2020 | 2019 | 2018 | 2017 | |
| Selected Per–Share Data | ||||||
| Net asset value, beginning of period | $30.05 | $27.34 | $24.35 | $20.07 | $22.88 | $19.39 |
| Income from Investment Operations | ||||||
| Net investment income (loss)A,B | .02 | .45 | .28 | .48 | .29 | .30 |
| Net realized and unrealized gain (loss) | (5.44) | 3.69 | 4.01 | 4.92 | (2.39) | 4.14 |
| Total from investment operations | (5.42) | 4.14 | 4.29 | 5.40 | (2.10) | 4.44 |
| Distributions from net investment income | (.11) | (.30) | (.27) | (.41) | (.26) | (.27) |
| Distributions from net realized gain | (1.88) | (1.13) | (1.04) | (.71) | (.45) | (.69) |
| Total distributions | (1.99) | (1.43) | (1.30)C | (1.12) | (.71) | (.95)C |
| Net asset value, end of period | $22.64 | $30.05 | $27.34 | $24.35 | $20.07 | $22.88 |
| Total ReturnD,E,F | (19.04)% | 15.46% | 18.28% | 27.49% | (9.30)% | 23.35% |
| Ratios to Average Net AssetsB,G,H | ||||||
| Expenses before reductionsI | - %J | -% | -% | -% | -% | -% |
| Expenses net of fee waivers, if any | - %I,J | - %I | - %I | - %I | - %I | -% |
| Expenses net of all reductions | - %I,J | - %I | - %I | - %I | - %I | -% |
| Net investment income (loss) | .17%J | 1.53% | 1.20% | 2.13% | 1.30% | 1.42% |
| Supplemental Data | ||||||
| Net assets, end of period (000 omitted) | $15,951 | $17,426 | $17,852 | $12,846 | $7,977 | $6,197 |
| Portfolio turnover rateK | 62%J | 34% | 55% | 29% | 27% | 25% |
A Calculated based on average shares outstanding during the period.
B Net investment income (loss) is affected by the timing of the declaration of dividends by any underlying mutual funds or exchange-traded funds (ETFs). Net investment income (loss) of any such underlying funds is not included in the Fund's net investment income (loss) ratio.
C Total distributions per share do not sum due to rounding.
D Total returns for periods of less than one year are not annualized.
E Total returns do not reflect charges attributable to your insurance company's separate account. Inclusion of these charges would reduce the total returns shown.
F Total returns would have been lower if certain expenses had not been reduced during the applicable periods shown.
G Fees and expenses of any underlying mutual funds or exchange-traded funds (ETFs) are not included in the Fund's expense ratio. The Fund indirectly bears its proportionate share of these expenses.
H Expense ratios reflect operating expenses of the class. Expenses before reductions do not reflect amounts reimbursed, waived, or reduced through arrangements with the investment adviser, brokerage services, or other offset arrangements, if applicable, and do not represent the amount paid by the class during periods when reimbursements, waivers or reductions occur.
I Amount represents less than .005%.
J Annualized
K Amount does not include the portfolio activity of any underlying mutual funds or exchange-traded funds (ETFs).
See accompanying notes which are an integral part of the financial statements.
VIP Freedom 2035 Portfolio Service Class
| Six months ended (Unaudited) June 30, | Years endedDecember 31, | |||||
| 2022 | 2021 | 2020 | 2019 | 2018 | 2017 | |
| Selected Per–Share Data | ||||||
| Net asset value, beginning of period | $29.96 | $27.27 | $24.30 | $20.04 | $22.84 | $19.36 |
| Income from Investment Operations | ||||||
| Net investment income (loss)A,B | .01 | .42 | .26 | .46 | .27 | .28 |
| Net realized and unrealized gain (loss) | (5.42) | 3.67 | 3.99 | 4.90 | (2.38) | 4.13 |
| Total from investment operations | (5.41) | 4.09 | 4.25 | 5.36 | (2.11) | 4.41 |
| Distributions from net investment income | (.11) | (.27) | (.25) | (.39) | (.25) | (.25) |
| Distributions from net realized gain | (1.88) | (1.13) | (1.04) | (.71) | (.45) | (.69) |
| Total distributions | (1.99) | (1.40) | (1.28)C | (1.10) | (.69)C | (.93)C |
| Net asset value, end of period | $22.56 | $29.96 | $27.27 | $24.30 | $20.04 | $22.84 |
| Total ReturnD,E,F | (19.07)% | 15.32% | 18.15% | 27.33% | (9.36)% | 23.24% |
| Ratios to Average Net AssetsB,G,H | ||||||
| Expenses before reductions | .10%I | .10% | .10% | .10% | .10% | .10% |
| Expenses net of fee waivers, if any | .10%I | .10% | .10% | .10% | .10% | .10% |
| Expenses net of all reductions | .10%I | .10% | .10% | .10% | .10% | .10% |
| Net investment income (loss) | .07%I | 1.43% | 1.10% | 2.03% | 1.20% | 1.32% |
| Supplemental Data | ||||||
| Net assets, end of period (000 omitted) | $88,561 | $82,275 | $51,598 | $30,573 | $12,303 | $8,385 |
| Portfolio turnover rateJ | 62%I | 34% | 55% | 29% | 27% | 25% |
A Calculated based on average shares outstanding during the period.
B Net investment income (loss) is affected by the timing of the declaration of dividends by any underlying mutual funds or exchange-traded funds (ETFs). Net investment income (loss) of any such underlying funds is not included in the Fund's net investment income (loss) ratio.
C Total distributions per share do not sum due to rounding.
D Total returns for periods of less than one year are not annualized.
E Total returns do not reflect charges attributable to your insurance company's separate account. Inclusion of these charges would reduce the total returns shown.
F Total returns would have been lower if certain expenses had not been reduced during the applicable periods shown.
G Fees and expenses of any underlying mutual funds or exchange-traded funds (ETFs) are not included in the Fund's expense ratio. The Fund indirectly bears its proportionate share of these expenses.
H Expense ratios reflect operating expenses of the class. Expenses before reductions do not reflect amounts reimbursed, waived, or reduced through arrangements with the investment adviser, brokerage services, or other offset arrangements, if applicable, and do not represent the amount paid by the class during periods when reimbursements, waivers or reductions occur.
I Annualized
J Amount does not include the portfolio activity of any underlying mutual funds or exchange-traded funds (ETFs).
See accompanying notes which are an integral part of the financial statements.
VIP Freedom 2035 Portfolio Service Class 2
| Six months ended (Unaudited) June 30, | Years endedDecember 31, | |||||
| 2022 | 2021 | 2020 | 2019 | 2018 | 2017 | |
| Selected Per–Share Data | ||||||
| Net asset value, beginning of period | $29.78 | $27.11 | $24.17 | $19.94 | $22.73 | $19.27 |
| Income from Investment Operations | ||||||
| Net investment income (loss)A,B | (.01) | .37 | .22 | .42 | .24 | .25 |
| Net realized and unrealized gain (loss) | (5.38) | 3.66 | 3.97 | 4.88 | (2.37) | 4.11 |
| Total from investment operations | (5.39) | 4.03 | 4.19 | 5.30 | (2.13) | 4.36 |
| Distributions from net investment income | (.11) | (.23) | (.21) | (.36) | (.22) | (.22) |
| Distributions from net realized gain | (1.88) | (1.13) | (1.04) | (.71) | (.45) | (.69) |
| Total distributions | (1.99) | (1.36) | (1.25) | (1.07) | (.66)C | (.90)C |
| Net asset value, end of period | $22.40 | $29.78 | $27.11 | $24.17 | $19.94 | $22.73 |
| Total ReturnD,E,F | (19.12)% | 15.18% | 17.96% | 27.13% | (9.50)% | 23.07% |
| Ratios to Average Net AssetsB,G,H | ||||||
| Expenses before reductions | .25%I | .25% | .25% | .25% | .25% | .25% |
| Expenses net of fee waivers, if any | .25%I | .25% | .25% | .25% | .25% | .25% |
| Expenses net of all reductions | .25%I | .25% | .25% | .25% | .25% | .25% |
| Net investment income (loss) | (.09)%I | 1.28% | .95% | 1.88% | 1.05% | 1.17% |
| Supplemental Data | ||||||
| Net assets, end of period (000 omitted) | $92,176 | $113,228 | $87,124 | $71,380 | $45,013 | $41,677 |
| Portfolio turnover rateJ | 62%I | 34% | 55% | 29% | 27% | 25% |
A Calculated based on average shares outstanding during the period.
B Net investment income (loss) is affected by the timing of the declaration of dividends by any underlying mutual funds or exchange-traded funds (ETFs). Net investment income (loss) of any such underlying funds is not included in the Fund's net investment income (loss) ratio.
C Total distributions per share do not sum due to rounding.
D Total returns for periods of less than one year are not annualized.
E Total returns do not reflect charges attributable to your insurance company's separate account. Inclusion of these charges would reduce the total returns shown.
F Total returns would have been lower if certain expenses had not been reduced during the applicable periods shown.
G Fees and expenses of any underlying mutual funds or exchange-traded funds (ETFs) are not included in the Fund's expense ratio. The Fund indirectly bears its proportionate share of these expenses.
H Expense ratios reflect operating expenses of the class. Expenses before reductions do not reflect amounts reimbursed, waived, or reduced through arrangements with the investment adviser, brokerage services, or other offset arrangements, if applicable, and do not represent the amount paid by the class during periods when reimbursements, waivers or reductions occur.
I Annualized
J Amount does not include the portfolio activity of any underlying mutual funds or exchange-traded funds (ETFs).
See accompanying notes which are an integral part of the financial statements.
VIP Freedom 2040 Portfolio℠
Investment Summary (Unaudited)
The information in the following tables is based on the direct investments of the Fund.Top Holdings as of June 30, 2022
| % of fund's net assets | |
| VIP Overseas Portfolio Initial Class | 27.0 |
| VIP Emerging Markets Portfolio Initial Class | 15.1 |
| VIP Growth Portfolio Initial Class | 10.2 |
| VIP Growth & Income Portfolio Initial Class | 9.9 |
| VIP Equity-Income Portfolio Initial Class | 8.3 |
| VIP Contrafund Portfolio Initial Class | 8.1 |
| VIP Value Portfolio Initial Class | 6.1 |
| Fidelity Long-Term Treasury Bond Index Fund | 6.1 |
| VIP Value Strategies Portfolio Initial Class | 3.0 |
| VIP Mid Cap Portfolio Initial Class | 2.4 |
| 96.2 |
Asset Allocation (% of fund's net assets)
| Period end | ||
| Domestic Equity Funds | 48.0% | |
| International Equity Funds | 42.1% | |
| Bond Funds | 9.9% | |

VIP Freedom 2040 Portfolio℠
Schedule of Investments June 30, 2022 (Unaudited)
Showing Percentage of Net Assets
| Domestic Equity Funds - 48.0% | |||
| Shares | Value | ||
| VIP Contrafund Portfolio Initial Class (a) | 377,473 | $14,808,279 | |
| VIP Equity-Income Portfolio Initial Class (a) | 652,866 | 15,231,354 | |
| VIP Growth & Income Portfolio Initial Class (a) | 783,908 | 18,053,407 | |
| VIP Growth Portfolio Initial Class (a) | 250,431 | 18,664,632 | |
| VIP Mid Cap Portfolio Initial Class (a) | 138,794 | 4,402,548 | |
| VIP Value Portfolio Initial Class (a) | 676,375 | 11,119,602 | |
| VIP Value Strategies Portfolio Initial Class (a) | 380,722 | 5,432,903 | |
| TOTAL DOMESTIC EQUITY FUNDS | |||
| (Cost $79,737,153) | 87,712,725 | ||
| International Equity Funds - 42.1% | |||
| VIP Emerging Markets Portfolio Initial Class (a) | 2,743,353 | 27,598,130 | |
| VIP Overseas Portfolio Initial Class (a) | 2,366,114 | 49,309,817 | |
| TOTAL INTERNATIONAL EQUITY FUNDS | |||
| (Cost $83,907,439) | 76,907,947 | ||
| Bond Funds - 9.9% | |||
| Fidelity Inflation-Protected Bond Index Fund (a) | 289,070 | 2,934,060 | |
| Fidelity International Bond Index Fund (a) | 160,597 | 1,461,429 | |
| Fidelity Long-Term Treasury Bond Index Fund (a) | 963,821 | 11,112,852 | |
| VIP High Income Portfolio Initial Class (a) | 109,287 | 493,979 | |
| VIP Investment Grade Bond II Portfolio Initial Class (a) | 202,105 | 1,972,541 | |
| TOTAL BOND FUNDS | |||
| (Cost $19,693,036) | 17,974,861 | ||
| TOTAL INVESTMENT IN SECURITIES - 100.0% | |||
| (Cost $183,337,628) | 182,595,533 | ||
| NET OTHER ASSETS (LIABILITIES) - 0.0% | (15,324) | ||
| NET ASSETS - 100% | $182,580,209 |
Legend
(a) Affiliated Fund
Affiliated Central Funds
Fiscal year to date information regarding the Fund's investments in Fidelity Central Funds, including the ownership percentage, is presented below.
| Fund | Value, beginning of period | Purchases | Sales Proceeds | Dividend Income | Realized Gain/Loss | Change in Unrealized appreciation (depreciation) | Value, end of period | % ownership, end of period |
| Fidelity Cash Central Fund 1.58% | $824 | $-- | $824 | $1 | $-- | $-- | $-- | 0.0% |
| Total | $824 | $-- | $824 | $1 | $-- | $-- | $-- |
Amounts in the income column in the above table include any capital gain distributions from underlying funds, which are presented in the corresponding line-item in the Statement of Operations, if applicable.
Affiliated Underlying Funds
Fiscal year to date information regarding the Fund's investments in affiliated Underlying Funds is presented below. Exchanges between classes of the same affiliated Underlying Funds may occur, and are excluded from purchases and sales below if applicable. If an underlying Fund changes its name, the name presented below is the name in effect at period end.
| Affiliate | Value, beginning of period | Purchases(a) | Sales Proceeds(a) | Dividend Income | Realized Gain (loss) | Change in Unrealized appreciation (depreciation) | Value, end of period |
| Fidelity Inflation-Protected Bond Index Fund | $4,151,241 | $767,620 | $1,675,420 | $-- | $(19,310) | $(290,071) | $2,934,060 |
| Fidelity International Bond Index Fund | 1,115,740 | 996,296 | 530,566 | 1,978 | (26,976) | (93,065) | 1,461,429 |
| Fidelity Long-Term Treasury Bond Index Fund | 7,821,260 | 7,040,809 | 1,700,237 | 100,600 | (215,925) | (1,833,055) | 11,112,852 |
| VIP Contrafund Portfolio Initial Class | 17,659,408 | 4,266,259 | 1,804,155 | 161,175 | (176,956) | (5,136,277) | 14,808,279 |
| VIP Emerging Markets Portfolio Initial Class | 30,903,098 | 8,217,368 | 5,067,736 | -- | (587,456) | (5,867,144) | 27,598,130 |
| VIP Equity-Income Portfolio Initial Class | 18,678,220 | 2,868,901 | 4,348,992 | 22,807 | (161,564) | (1,805,211) | 15,231,354 |
| VIP Growth & Income Portfolio Initial Class | 21,264,053 | 3,870,067 | 4,579,353 | 39,375 | (35,012) | (2,466,348) | 18,053,407 |
| VIP Growth Portfolio Initial Class | 18,060,762 | 8,361,491 | 2,259,528 | 823,436 | (201,459) | (5,296,634) | 18,664,632 |
| VIP High Income Portfolio Initial Class | 3,096,099 | 893,071 | 3,221,759 | 1,145 | (249,834) | (23,598) | 493,979 |
| VIP Investment Grade Bond Portfolio II Initial Class | -- | 2,917,630 | 900,609 | -- | (12,962) | (31,518) | 1,972,541 |
| VIP Investment Grade Bond Portfolio Initial Class | 2,795,247 | 1,724,347 | 4,197,719 | 108,335 | (307,844) | (14,031) | -- |
| VIP Mid Cap Portfolio Initial Class | 5,180,173 | 1,134,774 | 657,134 | 115,376 | (47,941) | (1,207,324) | 4,402,548 |
| VIP Overseas Portfolio Initial Class | 55,297,478 | 17,238,200 | 5,265,163 | 413,933 | (469,014) | (17,491,684) | 49,309,817 |
| VIP Value Portfolio Initial Class | 13,694,335 | 2,293,819 | 3,557,934 | 171,801 | (102,419) | (1,208,199) | 11,119,602 |
| VIP Value Strategies Portfolio Initial Class | 6,708,545 | 1,066,537 | 1,498,030 | 54,936 | (36,321) | (807,828) | 5,432,903 |
| $206,425,659 | $63,657,189 | $41,264,335 | $2,014,897 | $(2,650,993) | $(43,571,987) | $182,595,533 |
(a) Includes the value of shares purchased or redeemed through in-kind transactions, as applicable.
Amounts in the income column in the above table include any capital gain distributions from underlying funds, which are presented in the corresponding line-item in the Statement of Operations, if applicable.
Investment Valuation
The following is a summary of the inputs used, as of June 30, 2022, involving the Fund's assets and liabilities carried at fair value. The inputs or methodology used for valuing securities may not be an indication of the risk associated with investing in those securities. For more information on valuation inputs, and their aggregation into the levels used below, please refer to the Investment Valuation section in the accompanying Notes to Financial Statements.
| Valuation Inputs at Reporting Date: | ||||
| Description | Total | Level 1 | Level 2 | Level 3 |
| Investments in Securities: | ||||
| Domestic Equity Funds | $87,712,725 | $87,712,725 | $-- | $-- |
| International Equity Funds | 76,907,947 | 76,907,947 | -- | -- |
| Bond Funds | 17,974,861 | 17,974,861 | -- | -- |
| Total Investments in Securities: | $182,595,533 | $182,595,533 | $-- | $-- |
See accompanying notes which are an integral part of the financial statements.
VIP Freedom 2040 Portfolio℠
Financial Statements
Statement of Assets and Liabilities
| June 30, 2022 (Unaudited) | ||
| Assets | ||
| Investment in securities, at value — See accompanying schedule: | ||
| Affiliated issuers (cost $183,337,628) | $182,595,533 | |
| Total Investment in Securities (cost $183,337,628) | $182,595,533 | |
| Cash | 1,282 | |
| Receivable for investments sold | 1,090,262 | |
| Receivable for fund shares sold | 119,457 | |
| Total assets | 183,806,534 | |
| Liabilities | ||
| Payable for investments purchased | $771,878 | |
| Payable for fund shares redeemed | 437,842 | |
| Distribution and service plan fees payable | 16,605 | |
| Total liabilities | 1,226,325 | |
| Net Assets | $182,580,209 | |
| Net Assets consist of: | ||
| Paid in capital | $185,521,771 | |
| Total accumulated earnings (loss) | (2,941,562) | |
| Net Assets | $182,580,209 | |
| Net Asset Value and Maximum Offering Price | ||
| Initial Class: | ||
| Net Asset Value, offering price and redemption price per share ($38,512,892 ÷ 1,805,858 shares) | $21.33 | |
| Service Class: | ||
| Net Asset Value, offering price and redemption price per share ($111,363,268 ÷ 5,237,835 shares) | $21.26 | |
| Service Class 2: | ||
| Net Asset Value, offering price and redemption price per share ($32,704,049 ÷ 1,547,240 shares) | $21.14 |
See accompanying notes which are an integral part of the financial statements.
Statement of Operations
| Six months ended June 30, 2022 (Unaudited) | ||
| Investment Income | ||
| Dividends: | ||
| Affiliated issuers | $164,063 | |
| Income from Fidelity Central Funds | 1 | |
| Total income | 164,064 | |
| Expenses | ||
| Distribution and service plan fees | $104,680 | |
| Independent trustees' fees and expenses | 299 | |
| Total expenses | 104,979 | |
| Net investment income (loss) | 59,085 | |
| Realized and Unrealized Gain (Loss) | ||
| Net realized gain (loss) on: | ||
| Investment securities: | ||
| Affiliated issuers | (2,650,993) | |
| Capital gain distributions from underlying funds: | ||
| Affiliated issuers | 1,850,834 | |
| Total net realized gain (loss) | (800,159) | |
| Change in net unrealized appreciation (depreciation) on: | ||
| Investment securities: | ||
| Affiliated issuers | (43,571,987) | |
| Total change in net unrealized appreciation (depreciation) | (43,571,987) | |
| Net gain (loss) | (44,372,146) | |
| Net increase (decrease) in net assets resulting from operations | $(44,313,061) |
See accompanying notes which are an integral part of the financial statements.
Statement of Changes in Net Assets
| Six months ended June 30, 2022 (Unaudited) | Year ended December 31, 2021 | |
| Increase (Decrease) in Net Assets | ||
| Operations | ||
| Net investment income (loss) | $59,085 | $2,433,295 |
| Net realized gain (loss) | (800,159) | 17,910,268 |
| Change in net unrealized appreciation (depreciation) | (43,571,987) | 8,109,146 |
| Net increase (decrease) in net assets resulting from operations | (44,313,061) | 28,452,709 |
| Distributions to shareholders | (15,861,962) | (9,012,010) |
| Share transactions - net increase (decrease) | 36,346,308 | 36,426,608 |
| Total increase (decrease) in net assets | (23,828,715) | 55,867,307 |
| Net Assets | ||
| Beginning of period | 206,408,924 | 150,541,617 |
| End of period | $182,580,209 | $206,408,924 |
See accompanying notes which are an integral part of the financial statements.
Financial Highlights
VIP Freedom 2040 Portfolio Initial Class
| Six months ended (Unaudited) June 30, | Years endedDecember 31, | |||||
| 2022 | 2021 | 2020 | 2019 | 2018 | 2017 | |
| Selected Per–Share Data | ||||||
| Net asset value, beginning of period | $29.04 | $25.96 | $23.08 | $18.94 | $21.76 | $18.39 |
| Income from Investment Operations | ||||||
| Net investment income (loss)A,B | .02 | .41 | .24 | .40 | .27 | .28 |
| Net realized and unrealized gain (loss) | (5.52) | 4.11 | 4.02 | 4.88 | (2.39) | 3.98 |
| Total from investment operations | (5.50) | 4.52 | 4.26 | 5.28 | (2.12) | 4.26 |
| Distributions from net investment income | (.11) | (.26) | (.23) | (.39) | (.25) | (.25) |
| Distributions from net realized gain | (2.10) | (1.18) | (1.16) | (.75) | (.45) | (.64) |
| Total distributions | (2.21) | (1.44) | (1.38)C | (1.14) | (.70) | (.89) |
| Net asset value, end of period | $21.33 | $29.04 | $25.96 | $23.08 | $18.94 | $21.76 |
| Total ReturnD,E,F | (20.18)% | 17.83% | 19.28% | 28.52% | (9.88)% | 23.60% |
| Ratios to Average Net AssetsB,G,H | ||||||
| Expenses before reductionsI | - %J | -% | -% | -% | -% | -% |
| Expenses net of fee waivers, if any | - %I,J | - %I | - %I | - %I | - %I | -% |
| Expenses net of all reductions | - %I,J | - %I | - %I | - %I | - %I | -% |
| Net investment income (loss) | .17%J | 1.45% | 1.07% | 1.86% | 1.26% | 1.39% |
| Supplemental Data | ||||||
| Net assets, end of period (000 omitted) | $38,513 | $45,822 | $34,365 | $27,284 | $19,652 | $16,561 |
| Portfolio turnover rateK | 42%J | 32% | 49% | 36% | 39% | 26% |
A Calculated based on average shares outstanding during the period.
B Net investment income (loss) is affected by the timing of the declaration of dividends by any underlying mutual funds or exchange-traded funds (ETFs). Net investment income (loss) of any such underlying funds is not included in the Fund's net investment income (loss) ratio.
C Total distributions per share do not sum due to rounding.
D Total returns for periods of less than one year are not annualized.
E Total returns do not reflect charges attributable to your insurance company's separate account. Inclusion of these charges would reduce the total returns shown.
F Total returns would have been lower if certain expenses had not been reduced during the applicable periods shown.
G Fees and expenses of any underlying mutual funds or exchange-traded funds (ETFs) are not included in the Fund's expense ratio. The Fund indirectly bears its proportionate share of these expenses. For additional expense information related to investments in Fidelity Central Funds, please refer to the "Investments in Fidelity Central Funds" note found in the Notes to Financial Statements section of the most recent Annual or Semi-Annual report.
H Expense ratios reflect operating expenses of the class. Expenses before reductions do not reflect amounts reimbursed, waived, or reduced through arrangements with the investment adviser, brokerage services, or other offset arrangements, if applicable, and do not represent the amount paid by the class during periods when reimbursements, waivers or reductions occur.
I Amount represents less than .005%.
J Annualized
K Amount does not include the portfolio activity of any underlying mutual funds or exchange-traded funds (ETFs).
See accompanying notes which are an integral part of the financial statements.
VIP Freedom 2040 Portfolio Service Class
| Six months ended (Unaudited) June 30, | Years endedDecember 31, | |||||
| 2022 | 2021 | 2020 | 2019 | 2018 | 2017 | |
| Selected Per–Share Data | ||||||
| Net asset value, beginning of period | $28.97 | $25.91 | $23.04 | $18.91 | $21.72 | $18.37 |
| Income from Investment Operations | ||||||
| Net investment income (loss)A,B | .01 | .38 | .21 | .37 | .25 | .26 |
| Net realized and unrealized gain (loss) | (5.51) | 4.10 | 4.02 | 4.88 | (2.38) | 3.96 |
| Total from investment operations | (5.50) | 4.48 | 4.23 | 5.25 | (2.13) | 4.22 |
| Distributions from net investment income | (.11) | (.24) | (.21) | (.37) | (.23) | (.23) |
| Distributions from net realized gain | (2.10) | (1.18) | (1.16) | (.75) | (.45) | (.64) |
| Total distributions | (2.21) | (1.42) | (1.36)C | (1.12) | (.68) | (.87) |
| Net asset value, end of period | $21.26 | $28.97 | $25.91 | $23.04 | $18.91 | $21.72 |
| Total ReturnD,E,F | (20.23)% | 17.68% | 19.16% | 28.39% | (9.94)% | 23.42% |
| Ratios to Average Net AssetsB,G,H | ||||||
| Expenses before reductions | .10%I | .10% | .10% | .10% | .10% | .10% |
| Expenses net of fee waivers, if any | .10%I | .10% | .10% | .10% | .10% | .10% |
| Expenses net of all reductions | .10%I | .10% | .10% | .10% | .10% | .10% |
| Net investment income (loss) | .07%I | 1.35% | .97% | 1.76% | 1.16% | 1.29% |
| Supplemental Data | ||||||
| Net assets, end of period (000 omitted) | $111,363 | $119,062 | $85,197 | $63,170 | $48,429 | $45,492 |
| Portfolio turnover rateJ | 42%I | 32% | 49% | 36% | 39% | 26% |
A Calculated based on average shares outstanding during the period.
B Net investment income (loss) is affected by the timing of the declaration of dividends by any underlying mutual funds or exchange-traded funds (ETFs). Net investment income (loss) of any such underlying funds is not included in the Fund's net investment income (loss) ratio.
C Total distributions per share do not sum due to rounding.
D Total returns for periods of less than one year are not annualized.
E Total returns do not reflect charges attributable to your insurance company's separate account. Inclusion of these charges would reduce the total returns shown.
F Total returns would have been lower if certain expenses had not been reduced during the applicable periods shown.
G Fees and expenses of any underlying mutual funds or exchange-traded funds (ETFs) are not included in the Fund's expense ratio. The Fund indirectly bears its proportionate share of these expenses. For additional expense information related to investments in Fidelity Central Funds, please refer to the "Investments in Fidelity Central Funds" note found in the Notes to Financial Statements section of the most recent Annual or Semi-Annual report.
H Expense ratios reflect operating expenses of the class. Expenses before reductions do not reflect amounts reimbursed, waived, or reduced through arrangements with the investment adviser, brokerage services, or other offset arrangements, if applicable, and do not represent the amount paid by the class during periods when reimbursements, waivers or reductions occur.
I Annualized
J Amount does not include the portfolio activity of any underlying mutual funds or exchange-traded funds (ETFs).
See accompanying notes which are an integral part of the financial statements.
VIP Freedom 2040 Portfolio Service Class 2
| Six months ended (Unaudited) June 30, | Years endedDecember 31, | |||||
| 2022 | 2021 | 2020 | 2019 | 2018 | 2017 | |
| Selected Per–Share Data | ||||||
| Net asset value, beginning of period | $28.83 | $25.80 | $22.95 | $18.84 | $21.65 | $18.30 |
| Income from Investment Operations | ||||||
| Net investment income (loss)A,B | (.01) | .33 | .18 | .34 | .22 | .23 |
| Net realized and unrealized gain (loss) | (5.47) | 4.08 | 4.00 | 4.86 | (2.38) | 3.95 |
| Total from investment operations | (5.48) | 4.41 | 4.18 | 5.20 | (2.16) | 4.18 |
| Distributions from net investment income | (.11) | (.20) | (.17) | (.34) | (.20) | (.19) |
| Distributions from net realized gain | (2.10) | (1.18) | (1.15) | (.75) | (.45) | (.64) |
| Total distributions | (2.21) | (1.38) | (1.33)C | (1.09) | (.65) | (.83) |
| Net asset value, end of period | $21.14 | $28.83 | $25.80 | $22.95 | $18.84 | $21.65 |
| Total ReturnD,E,F | (20.26)% | 17.50% | 18.99% | 28.23% | (10.12)% | 23.30% |
| Ratios to Average Net AssetsB,G,H | ||||||
| Expenses before reductions | .25%I | .25% | .25% | .25% | .25% | .25% |
| Expenses net of fee waivers, if any | .25%I | .25% | .25% | .25% | .25% | .25% |
| Expenses net of all reductions | .25%I | .25% | .25% | .25% | .25% | .25% |
| Net investment income (loss) | (.08)%I | 1.20% | .82% | 1.61% | 1.01% | 1.14% |
| Supplemental Data | ||||||
| Net assets, end of period (000 omitted) | $32,704 | $41,525 | $30,980 | $23,721 | $15,391 | $16,380 |
| Portfolio turnover rateJ | 42%I | 32% | 49% | 36% | 39% | 26% |
A Calculated based on average shares outstanding during the period.
B Net investment income (loss) is affected by the timing of the declaration of dividends by any underlying mutual funds or exchange-traded funds (ETFs). Net investment income (loss) of any such underlying funds is not included in the Fund's net investment income (loss) ratio.
C Total distributions per share do not sum due to rounding.
D Total returns for periods of less than one year are not annualized.
E Total returns do not reflect charges attributable to your insurance company's separate account. Inclusion of these charges would reduce the total returns shown.
F Total returns would have been lower if certain expenses had not been reduced during the applicable periods shown.
G Fees and expenses of any underlying mutual funds or exchange-traded funds (ETFs) are not included in the Fund's expense ratio. The Fund indirectly bears its proportionate share of these expenses. For additional expense information related to investments in Fidelity Central Funds, please refer to the "Investments in Fidelity Central Funds" note found in the Notes to Financial Statements section of the most recent Annual or Semi-Annual report.
H Expense ratios reflect operating expenses of the class. Expenses before reductions do not reflect amounts reimbursed, waived, or reduced through arrangements with the investment adviser, brokerage services, or other offset arrangements, if applicable, and do not represent the amount paid by the class during periods when reimbursements, waivers or reductions occur.
I Annualized
J Amount does not include the portfolio activity of any underlying mutual funds or exchange-traded funds (ETFs).
See accompanying notes which are an integral part of the financial statements.
VIP Freedom 2045 Portfolio℠
Investment Summary (Unaudited)
The information in the following tables is based on the direct investments of the Fund.Top Holdings as of June 30, 2022
| % of fund's net assets | |
| VIP Overseas Portfolio Initial Class | 27.4 |
| VIP Emerging Markets Portfolio Initial Class | 15.3 |
| VIP Growth Portfolio Initial Class | 10.4 |
| VIP Growth & Income Portfolio Initial Class | 10.1 |
| VIP Equity-Income Portfolio Initial Class | 8.5 |
| VIP Contrafund Portfolio Initial Class | 8.2 |
| VIP Value Portfolio Initial Class | 6.2 |
| Fidelity Long-Term Treasury Bond Index Fund | 6.1 |
| VIP Value Strategies Portfolio Initial Class | 3.0 |
| VIP Mid Cap Portfolio Initial Class | 2.4 |
| 97.6 |
Asset Allocation (% of fund's net assets)
| Period end | ||
| Domestic Equity Funds | 48.8% | |
| International Equity Funds | 42.7% | |
| Bond Funds | 8.5% | |

VIP Freedom 2045 Portfolio℠
Schedule of Investments June 30, 2022 (Unaudited)
Showing Percentage of Net Assets
| Domestic Equity Funds - 48.8% | |||
| Shares | Value | ||
| VIP Contrafund Portfolio Initial Class (a) | 201,846 | $7,918,414 | |
| VIP Equity-Income Portfolio Initial Class (a) | 349,092 | 8,144,311 | |
| VIP Growth & Income Portfolio Initial Class (a) | 419,173 | 9,653,551 | |
| VIP Growth Portfolio Initial Class (a) | 133,916 | 9,980,795 | |
| VIP Mid Cap Portfolio Initial Class (a) | 74,221 | 2,354,294 | |
| VIP Value Portfolio Initial Class (a) | 361,658 | 5,945,653 | |
| VIP Value Strategies Portfolio Initial Class (a) | 203,572 | 2,904,979 | |
| TOTAL DOMESTIC EQUITY FUNDS | |||
| (Cost $43,858,887) | 46,901,997 | ||
| International Equity Funds - 42.7% | |||
| VIP Emerging Markets Portfolio Initial Class (a) | 1,457,565 | 14,663,099 | |
| VIP Overseas Portfolio Initial Class (a) | 1,261,903 | 26,298,056 | |
| TOTAL INTERNATIONAL EQUITY FUNDS | |||
| (Cost $45,234,954) | 40,961,155 | ||
| Bond Funds - 8.5% | |||
| Fidelity Inflation-Protected Bond Index Fund (a) | 152,081 | 1,543,620 | |
| Fidelity International Bond Index Fund (a) | 58,833 | 535,376 | |
| Fidelity Long-Term Treasury Bond Index Fund (a) | 507,074 | 5,846,567 | |
| VIP High Income Portfolio Initial Class (a) | 57,502 | 259,908 | |
| TOTAL BOND FUNDS | |||
| (Cost $9,074,374) | 8,185,471 | ||
| TOTAL INVESTMENT IN SECURITIES - 100.0% | |||
| (Cost $98,168,215) | 96,048,623 | ||
| NET OTHER ASSETS (LIABILITIES) - 0.0% | (15,544) | ||
| NET ASSETS - 100% | $96,033,079 |
Legend
(a) Affiliated Fund
Affiliated Underlying Funds
Fiscal year to date information regarding the Fund's investments in affiliated Underlying Funds is presented below. Exchanges between classes of the same affiliated Underlying Funds may occur, and are excluded from purchases and sales below if applicable. If an underlying Fund changes its name, the name presented below is the name in effect at period end.
| Affiliate | Value, beginning of period | Purchases(a) | Sales Proceeds(a) | Dividend Income | Realized Gain (loss) | Change in Unrealized appreciation (depreciation) | Value, end of period |
| Fidelity Inflation-Protected Bond Index Fund | $2,161,858 | $446,098 | $903,144 | $-- | $(8,461) | $(152,731) | $1,543,620 |
| Fidelity International Bond Index Fund | 538,081 | 347,377 | 298,810 | 777 | (15,531) | (35,741) | 535,376 |
| Fidelity Long-Term Treasury Bond Index Fund | 4,073,020 | 3,772,761 | 925,289 | 52,857 | (117,325) | (956,600) | 5,846,567 |
| VIP Contrafund Portfolio Initial Class | 9,246,885 | 2,391,234 | 911,116 | 86,796 | (81,611) | (2,726,978) | 7,918,414 |
| VIP Emerging Markets Portfolio Initial Class | 16,147,255 | 4,575,741 | 2,656,570 | -- | (311,062) | (3,092,265) | 14,663,099 |
| VIP Equity-Income Portfolio Initial Class | 9,780,201 | 1,539,882 | 2,131,797 | 12,170 | (73,228) | (970,747) | 8,144,311 |
| VIP Growth & Income Portfolio Initial Class | 11,134,256 | 2,071,510 | 2,224,315 | 21,010 | (20,082) | (1,307,818) | 9,653,551 |
| VIP Growth Portfolio Initial Class | 9,457,011 | 4,592,093 | 1,160,005 | 443,441 | (101,399) | (2,806,905) | 9,980,795 |
| VIP High Income Portfolio Initial Class | 1,612,399 | 474,604 | 1,683,847 | 607 | (131,481) | (11,767) | 259,908 |
| VIP Investment Grade Bond Portfolio II Initial Class | -- | 630,792 | 630,561 | -- | (231) | -- | -- |
| VIP Investment Grade Bond Portfolio Initial Class | 1,024,783 | 630,305 | 1,565,044 | 32,164 | (79,721) | (10,323) | -- |
| VIP Mid Cap Portfolio Initial Class | 2,712,422 | 629,957 | 325,008 | 61,562 | (19,717) | (643,360) | 2,354,294 |
| VIP Overseas Portfolio Initial Class | 28,925,248 | 9,503,352 | 2,656,021 | 220,628 | (237,367) | (9,237,156) | 26,298,056 |
| VIP Value Portfolio Initial Class | 7,170,600 | 1,245,279 | 1,774,404 | 91,671 | (51,015) | (644,807) | 5,945,653 |
| VIP Value Strategies Portfolio Initial Class | 3,512,688 | 593,776 | 754,039 | 29,314 | (17,541) | (429,905) | 2,904,979 |
| $107,496,707 | $33,444,761 | $20,599,970 | $1,052,997 | $(1,265,772) | $(23,027,103) | $96,048,623 |
(a) Includes the value of shares purchased or redeemed through in-kind transactions, as applicable.
Amounts in the income column in the above table include any capital gain distributions from underlying funds, which are presented in the corresponding line-item in the Statement of Operations, if applicable.
Investment Valuation
The following is a summary of the inputs used, as of June 30, 2022, involving the Fund's assets and liabilities carried at fair value. The inputs or methodology used for valuing securities may not be an indication of the risk associated with investing in those securities. For more information on valuation inputs, and their aggregation into the levels used below, please refer to the Investment Valuation section in the accompanying Notes to Financial Statements.
| Valuation Inputs at Reporting Date: | ||||
| Description | Total | Level 1 | Level 2 | Level 3 |
| Investments in Securities: | ||||
| Domestic Equity Funds | $46,901,997 | $46,901,997 | $-- | $-- |
| International Equity Funds | 40,961,155 | 40,961,155 | -- | -- |
| Bond Funds | 8,185,471 | 8,185,471 | -- | -- |
| Total Investments in Securities: | $96,048,623 | $96,048,623 | $-- | $-- |
See accompanying notes which are an integral part of the financial statements.
VIP Freedom 2045 Portfolio℠
Financial Statements
Statement of Assets and Liabilities
| June 30, 2022 (Unaudited) | ||
| Assets | ||
| Investment in securities, at value — See accompanying schedule: | ||
| Affiliated issuers (cost $98,168,215) | $96,048,623 | |
| Total Investment in Securities (cost $98,168,215) | $96,048,623 | |
| Cash | 900 | |
| Receivable for investments sold | 692,705 | |
| Receivable for fund shares sold | 22,835 | |
| Total assets | 96,765,063 | |
| Liabilities | ||
| Payable for investments purchased | $424,946 | |
| Payable for fund shares redeemed | 290,594 | |
| Distribution and service plan fees payable | 16,444 | |
| Total liabilities | 731,984 | |
| Net Assets | $96,033,079 | |
| Net Assets consist of: | ||
| Paid in capital | $99,276,300 | |
| Total accumulated earnings (loss) | (3,243,221) | |
| Net Assets | $96,033,079 | |
| Net Asset Value and Maximum Offering Price | ||
| Initial Class: | ||
| Net Asset Value, offering price and redemption price per share ($6,528,606 ÷ 303,983 shares) | $21.48 | |
| Service Class: | ||
| Net Asset Value, offering price and redemption price per share ($22,049,606 ÷ 1,030,095 shares) | $21.41 | |
| Service Class 2: | ||
| Net Asset Value, offering price and redemption price per share ($67,454,867 ÷ 3,171,731 shares) | $21.27 |
See accompanying notes which are an integral part of the financial statements.
Statement of Operations
| Six months ended June 30, 2022 (Unaudited) | ||
| Investment Income | ||
| Dividends: | ||
| Affiliated issuers | $86,735 | |
| Expenses | ||
| Distribution and service plan fees | $102,859 | |
| Independent trustees' fees and expenses | 157 | |
| Total expenses | 103,016 | |
| Net investment income (loss) | (16,281) | |
| Realized and Unrealized Gain (Loss) | ||
| Net realized gain (loss) on: | ||
| Investment securities: | ||
| Affiliated issuers | (1,265,772) | |
| Capital gain distributions from underlying funds: | ||
| Affiliated issuers | 966,262 | |
| Total net realized gain (loss) | (299,510) | |
| Change in net unrealized appreciation (depreciation) on: | ||
| Investment securities: | ||
| Affiliated issuers | (23,027,103) | |
| Total change in net unrealized appreciation (depreciation) | (23,027,103) | |
| Net gain (loss) | (23,326,613) | |
| Net increase (decrease) in net assets resulting from operations | $(23,342,894) |
See accompanying notes which are an integral part of the financial statements.
Statement of Changes in Net Assets
| Six months ended June 30, 2022 (Unaudited) | Year ended December 31, 2021 | |
| Increase (Decrease) in Net Assets | ||
| Operations | ||
| Net investment income (loss) | $(16,281) | $1,174,437 |
| Net realized gain (loss) | (299,510) | 9,616,862 |
| Change in net unrealized appreciation (depreciation) | (23,027,103) | 4,313,289 |
| Net increase (decrease) in net assets resulting from operations | (23,342,894) | 15,104,588 |
| Distributions to shareholders | (8,515,014) | (4,377,051) |
| Share transactions - net increase (decrease) | 20,411,138 | 15,022,841 |
| Total increase (decrease) in net assets | (11,446,770) | 25,750,378 |
| Net Assets | ||
| Beginning of period | 107,479,849 | 81,729,471 |
| End of period | $96,033,079 | $107,479,849 |
See accompanying notes which are an integral part of the financial statements.
Financial Highlights
VIP Freedom 2045 Portfolio Initial Class
| Six months ended (Unaudited) June 30, | Years endedDecember 31, | |||||
| 2022 | 2021 | 2020 | 2019 | 2018 | 2017 | |
| Selected Per–Share Data | ||||||
| Net asset value, beginning of period | $29.30 | $26.09 | $23.08 | $18.91 | $21.64 | $18.31 |
| Income from Investment Operations | ||||||
| Net investment income (loss)A,B | .02 | .40 | .25 | .43 | .27 | .30 |
| Net realized and unrealized gain (loss) | (5.59) | 4.16 | 4.03 | 4.85 | (2.39) | 3.93 |
| Total from investment operations | (5.57) | 4.56 | 4.28 | 5.28 | (2.12) | 4.23 |
| Distributions from net investment income | (.11) | (.27) | (.22) | (.37) | (.25) | (.24) |
| Distributions from net realized gain | (2.14) | (1.08) | (1.05) | (.74) | (.37) | (.66) |
| Total distributions | (2.25) | (1.35) | (1.27) | (1.11) | (.61)C | (.90) |
| Net asset value, end of period | $21.48 | $29.30 | $26.09 | $23.08 | $18.91 | $21.64 |
| Total ReturnD,E,F | (20.26)% | 17.83% | 19.27% | 28.57% | (9.89)% | 23.59% |
| Ratios to Average Net AssetsB,G,H | ||||||
| Expenses before reductionsI | - %J | -% | -% | -% | -% | -% |
| Expenses net of fee waivers, if any | - %I,J | - %I | - %I | - %I | - %I | -% |
| Expenses net of all reductions | - %I,J | - %I | - %I | - %I | - %I | -% |
| Net investment income (loss) | .17%J | 1.42% | 1.12% | 2.01% | 1.25% | 1.46% |
| Supplemental Data | ||||||
| Net assets, end of period (000 omitted) | $6,529 | $6,866 | $5,282 | $3,686 | $2,583 | $1,491 |
| Portfolio turnover rateK | 40%J | 29% | 38% | 25% | 42% | 23% |
A Calculated based on average shares outstanding during the period.
B Net investment income (loss) is affected by the timing of the declaration of dividends by any underlying mutual funds or exchange-traded funds (ETFs). Net investment income (loss) of any such underlying funds is not included in the Fund's net investment income (loss) ratio.
C Total distributions per share do not sum due to rounding.
D Total returns for periods of less than one year are not annualized.
E Total returns do not reflect charges attributable to your insurance company's separate account. Inclusion of these charges would reduce the total returns shown.
F Total returns would have been lower if certain expenses had not been reduced during the applicable periods shown.
G Fees and expenses of any underlying mutual funds or exchange-traded funds (ETFs) are not included in the Fund's expense ratio. The Fund indirectly bears its proportionate share of these expenses.
H Expense ratios reflect operating expenses of the class. Expenses before reductions do not reflect amounts reimbursed, waived, or reduced through arrangements with the investment adviser, brokerage services, or other offset arrangements, if applicable, and do not represent the amount paid by the class during periods when reimbursements, waivers or reductions occur.
I Amount represents less than .005%.
J Annualized
K Amount does not include the portfolio activity of any underlying mutual funds or exchange-traded funds (ETFs).
See accompanying notes which are an integral part of the financial statements.
VIP Freedom 2045 Portfolio Service Class
| Six months ended (Unaudited) June 30, | Years endedDecember 31, | |||||
| 2022 | 2021 | 2020 | 2019 | 2018 | 2017 | |
| Selected Per–Share Data | ||||||
| Net asset value, beginning of period | $29.22 | $26.03 | $23.03 | $18.88 | $21.61 | $18.30 |
| Income from Investment Operations | ||||||
| Net investment income (loss)A,B | .01 | .37 | .23 | .41 | .24 | .28 |
| Net realized and unrealized gain (loss) | (5.57) | 4.14 | 4.02 | 4.83 | (2.37) | 3.92 |
| Total from investment operations | (5.56) | 4.51 | 4.25 | 5.24 | (2.13) | 4.20 |
| Distributions from net investment income | (.11) | (.24) | (.21) | (.35) | (.23) | (.23) |
| Distributions from net realized gain | (2.14) | (1.08) | (1.05) | (.74) | (.37) | (.66) |
| Total distributions | (2.25) | (1.32) | (1.25)C | (1.09) | (.60) | (.89) |
| Net asset value, end of period | $21.41 | $29.22 | $26.03 | $23.03 | $18.88 | $21.61 |
| Total ReturnD,E,F | (20.28)% | 17.69% | 19.18% | 28.40% | (9.97)% | 23.42% |
| Ratios to Average Net AssetsB,G,H | ||||||
| Expenses before reductions | .10%I | .10% | .10% | .10% | .10% | .10% |
| Expenses net of fee waivers, if any | .10%I | .10% | .10% | .10% | .10% | .10% |
| Expenses net of all reductions | .10%I | .10% | .10% | .10% | .10% | .10% |
| Net investment income (loss) | .07%I | 1.32% | 1.02% | 1.91% | 1.15% | 1.36% |
| Supplemental Data | ||||||
| Net assets, end of period (000 omitted) | $22,050 | $22,218 | $13,322 | $7,345 | $3,900 | $1,923 |
| Portfolio turnover rateJ | 40%I | 29% | 38% | 25% | 42% | 23% |
A Calculated based on average shares outstanding during the period.
B Net investment income (loss) is affected by the timing of the declaration of dividends by any underlying mutual funds or exchange-traded funds (ETFs). Net investment income (loss) of any such underlying funds is not included in the Fund's net investment income (loss) ratio.
C Total distributions per share do not sum due to rounding.
D Total returns for periods of less than one year are not annualized.
E Total returns do not reflect charges attributable to your insurance company's separate account. Inclusion of these charges would reduce the total returns shown.
F Total returns would have been lower if certain expenses had not been reduced during the applicable periods shown.
G Fees and expenses of any underlying mutual funds or exchange-traded funds (ETFs) are not included in the Fund's expense ratio. The Fund indirectly bears its proportionate share of these expenses.
H Expense ratios reflect operating expenses of the class. Expenses before reductions do not reflect amounts reimbursed, waived, or reduced through arrangements with the investment adviser, brokerage services, or other offset arrangements, if applicable, and do not represent the amount paid by the class during periods when reimbursements, waivers or reductions occur.
I Annualized
J Amount does not include the portfolio activity of any underlying mutual funds or exchange-traded funds (ETFs).
See accompanying notes which are an integral part of the financial statements.
VIP Freedom 2045 Portfolio Service Class 2
| Six months ended (Unaudited) June 30, | Years endedDecember 31, | |||||
| 2022 | 2021 | 2020 | 2019 | 2018 | 2017 | |
| Selected Per–Share Data | ||||||
| Net asset value, beginning of period | $29.07 | $25.90 | $22.93 | $18.80 | $21.52 | $18.22 |
| Income from Investment Operations | ||||||
| Net investment income (loss)A,B | (.01) | .33 | .19 | .37 | .21 | .24 |
| Net realized and unrealized gain (loss) | (5.54) | 4.12 | 4.00 | 4.82 | (2.37) | 3.92 |
| Total from investment operations | (5.55) | 4.45 | 4.19 | 5.19 | (2.16) | 4.16 |
| Distributions from net investment income | (.11) | (.20) | (.17) | (.33) | (.20) | (.20) |
| Distributions from net realized gain | (2.14) | (1.08) | (1.05) | (.74) | (.37) | (.66) |
| Total distributions | (2.25) | (1.28) | (1.22) | (1.06)C | (.56)C | (.86) |
| Net asset value, end of period | $21.27 | $29.07 | $25.90 | $22.93 | $18.80 | $21.52 |
| Total ReturnD,E,F | (20.36)% | 17.53% | 18.97% | 28.25% | (10.13)% | 23.30% |
| Ratios to Average Net AssetsB,G,H | ||||||
| Expenses before reductions | .25%I | .25% | .25% | .25% | .25% | .25% |
| Expenses net of fee waivers, if any | .25%I | .25% | .25% | .25% | .25% | .25% |
| Expenses net of all reductions | .25%I | .25% | .25% | .25% | .25% | .25% |
| Net investment income (loss) | (.08)%I | 1.17% | .87% | 1.76% | 1.00% | 1.21% |
| Supplemental Data | ||||||
| Net assets, end of period (000 omitted) | $67,455 | $78,396 | $63,126 | $45,871 | $28,298 | $27,399 |
| Portfolio turnover rateJ | 40%I | 29% | 38% | 25% | 42% | 23% |
A Calculated based on average shares outstanding during the period.
B Net investment income (loss) is affected by the timing of the declaration of dividends by any underlying mutual funds or exchange-traded funds (ETFs). Net investment income (loss) of any such underlying funds is not included in the Fund's net investment income (loss) ratio.
C Total distributions per share do not sum due to rounding.
D Total returns for periods of less than one year are not annualized.
E Total returns do not reflect charges attributable to your insurance company's separate account. Inclusion of these charges would reduce the total returns shown.
F Total returns would have been lower if certain expenses had not been reduced during the applicable periods shown.
G Fees and expenses of any underlying mutual funds or exchange-traded funds (ETFs) are not included in the Fund's expense ratio. The Fund indirectly bears its proportionate share of these expenses.
H Expense ratios reflect operating expenses of the class. Expenses before reductions do not reflect amounts reimbursed, waived, or reduced through arrangements with the investment adviser, brokerage services, or other offset arrangements, if applicable, and do not represent the amount paid by the class during periods when reimbursements, waivers or reductions occur.
I Annualized
J Amount does not include the portfolio activity of any underlying mutual funds or exchange-traded funds (ETFs).
See accompanying notes which are an integral part of the financial statements.
VIP Freedom 2050 Portfolio℠
Investment Summary (Unaudited)
The information in the following tables is based on the direct investments of the Fund.Top Holdings as of June 30, 2022
| % of fund's net assets | |
| VIP Overseas Portfolio Initial Class | 27.4 |
| VIP Emerging Markets Portfolio Initial Class | 15.3 |
| VIP Growth Portfolio Initial Class | 10.4 |
| VIP Growth & Income Portfolio Initial Class | 10.1 |
| VIP Equity-Income Portfolio Initial Class | 8.5 |
| VIP Contrafund Portfolio Initial Class | 8.2 |
| VIP Value Portfolio Initial Class | 6.2 |
| Fidelity Long-Term Treasury Bond Index Fund | 6.1 |
| VIP Value Strategies Portfolio Initial Class | 3.0 |
| VIP Mid Cap Portfolio Initial Class | 2.4 |
| 97.6 |
Asset Allocation (% of fund's net assets)
| Period end | ||
| Domestic Equity Funds | 48.8% | |
| International Equity Funds | 42.7% | |
| Bond Funds | 8.5% | |

VIP Freedom 2050 Portfolio℠
Schedule of Investments June 30, 2022 (Unaudited)
Showing Percentage of Net Assets
| Domestic Equity Funds - 48.8% | |||
| Shares | Value | ||
| VIP Contrafund Portfolio Initial Class (a) | 180,017 | $7,062,080 | |
| VIP Equity-Income Portfolio Initial Class (a) | 311,330 | 7,263,326 | |
| VIP Growth & Income Portfolio Initial Class (a) | 373,842 | 8,609,574 | |
| VIP Growth Portfolio Initial Class (a) | 119,443 | 8,902,113 | |
| VIP Mid Cap Portfolio Initial Class (a) | 66,195 | 2,099,704 | |
| VIP Value Portfolio Initial Class (a) | 322,528 | 5,302,366 | |
| VIP Value Strategies Portfolio Initial Class (a) | 181,548 | 2,590,683 | |
| TOTAL DOMESTIC EQUITY FUNDS | |||
| (Cost $39,485,379) | 41,829,846 | ||
| International Equity Funds - 42.7% | |||
| VIP Emerging Markets Portfolio Initial Class (a) | 1,299,932 | 13,077,319 | |
| VIP Overseas Portfolio Initial Class (a) | 1,125,450 | 23,454,369 | |
| TOTAL INTERNATIONAL EQUITY FUNDS | |||
| (Cost $40,905,784) | 36,531,688 | ||
| Bond Funds - 8.5% | |||
| Fidelity Inflation-Protected Bond Index Fund (a) | 135,635 | 1,376,694 | |
| Fidelity International Bond Index Fund (a) | 52,471 | 477,486 | |
| Fidelity Long-Term Treasury Bond Index Fund (a) | 452,237 | 5,214,298 | |
| VIP High Income Portfolio Initial Class (a) | 51,284 | 231,803 | |
| TOTAL BOND FUNDS | |||
| (Cost $8,075,237) | 7,300,281 | ||
| TOTAL INVESTMENT IN SECURITIES - 100.0% | |||
| (Cost $88,466,400) | 85,661,815 | ||
| NET OTHER ASSETS (LIABILITIES) - 0.0% | (10,597) | ||
| NET ASSETS - 100% | $85,651,218 |
Legend
(a) Affiliated Fund
Affiliated Underlying Funds
Fiscal year to date information regarding the Fund's investments in affiliated Underlying Funds is presented below. Exchanges between classes of the same affiliated Underlying Funds may occur, and are excluded from purchases and sales below if applicable. If an underlying Fund changes its name, the name presented below is the name in effect at period end.
| Affiliate | Value, beginning of period | Purchases(a) | Sales Proceeds(a) | Dividend Income | Realized Gain (loss) | Change in Unrealized appreciation (depreciation) | Value, end of period |
| Fidelity Inflation-Protected Bond Index Fund | $1,951,188 | $376,095 | $806,024 | $-- | $(10,260) | $(134,305) | $1,376,694 |
| Fidelity International Bond Index Fund | 485,638 | 300,378 | 262,684 | 700 | (13,952) | (31,894) | 477,486 |
| Fidelity Long-Term Treasury Bond Index Fund | 3,676,148 | 3,315,465 | 816,257 | 47,187 | (107,868) | (853,190) | 5,214,298 |
| VIP Contrafund Portfolio Initial Class | 8,345,650 | 1,987,368 | 750,930 | 77,703 | (63,471) | (2,456,537) | 7,062,080 |
| VIP Emerging Markets Portfolio Initial Class | 14,573,282 | 3,792,452 | 2,231,053 | -- | (267,056) | (2,790,306) | 13,077,319 |
| VIP Equity-Income Portfolio Initial Class | 8,826,950 | 1,349,192 | 1,983,266 | 10,936 | (74,402) | (855,148) | 7,263,326 |
| VIP Growth & Income Portfolio Initial Class | 10,048,982 | 1,801,452 | 2,058,678 | 18,880 | (15,786) | (1,166,396) | 8,609,574 |
| VIP Growth Portfolio Initial Class | 8,535,341 | 3,958,200 | 981,112 | 396,979 | (81,764) | (2,528,552) | 8,902,113 |
| VIP High Income Portfolio Initial Class | 1,455,253 | 398,698 | 1,493,217 | 545 | (117,154) | (11,777) | 231,803 |
| VIP Investment Grade Bond Portfolio II Initial Class | -- | 557,422 | 557,220 | -- | (202) | -- | -- |
| VIP Investment Grade Bond Portfolio Initial Class | 924,917 | 578,314 | 1,422,175 | 28,906 | (74,377) | (6,679) | -- |
| VIP Mid Cap Portfolio Initial Class | 2,448,058 | 533,545 | 287,768 | 55,318 | (21,111) | (573,020) | 2,099,704 |
| VIP Overseas Portfolio Initial Class | 26,106,477 | 7,973,619 | 2,137,139 | 198,255 | (215,351) | (8,273,237) | 23,454,369 |
| VIP Value Portfolio Initial Class | 6,471,684 | 1,095,775 | 1,646,093 | 82,378 | (51,608) | (567,392) | 5,302,366 |
| VIP Value Strategies Portfolio Initial Class | 3,170,293 | 511,589 | 692,845 | 26,342 | (17,558) | (380,796) | 2,590,683 |
| $97,019,861 | $28,529,564 | $18,126,461 | $944,129 | $(1,131,920) | $(20,629,229) | $85,661,815 |
(a) Includes the value of shares purchased or redeemed through in-kind transactions, as applicable.
Amounts in the income column in the above table include any capital gain distributions from underlying funds, which are presented in the corresponding line-item in the Statement of Operations, if applicable.
Investment Valuation
The following is a summary of the inputs used, as of June 30, 2022, involving the Fund's assets and liabilities carried at fair value. The inputs or methodology used for valuing securities may not be an indication of the risk associated with investing in those securities. For more information on valuation inputs, and their aggregation into the levels used below, please refer to the Investment Valuation section in the accompanying Notes to Financial Statements.
| Valuation Inputs at Reporting Date: | ||||
| Description | Total | Level 1 | Level 2 | Level 3 |
| Investments in Securities: | ||||
| Domestic Equity Funds | $41,829,846 | $41,829,846 | $-- | $-- |
| International Equity Funds | 36,531,688 | 36,531,688 | -- | -- |
| Bond Funds | 7,300,281 | 7,300,281 | -- | -- |
| Total Investments in Securities: | $85,661,815 | $85,661,815 | $-- | $-- |
See accompanying notes which are an integral part of the financial statements.
VIP Freedom 2050 Portfolio℠
Financial Statements
Statement of Assets and Liabilities
| June 30, 2022 (Unaudited) | ||
| Assets | ||
| Investment in securities, at value — See accompanying schedule: | ||
| Affiliated issuers (cost $88,466,400) | $85,661,815 | |
| Total Investment in Securities (cost $88,466,400) | $85,661,815 | |
| Cash | 617 | |
| Receivable for investments sold | 702,248 | |
| Receivable for fund shares sold | 48,223 | |
| Total assets | 86,412,903 | |
| Liabilities | ||
| Payable for investments purchased | $354,905 | |
| Payable for fund shares redeemed | 395,563 | |
| Distribution and service plan fees payable | 11,217 | |
| Total liabilities | 761,685 | |
| Net Assets | $85,651,218 | |
| Net Assets consist of: | ||
| Paid in capital | $89,713,539 | |
| Total accumulated earnings (loss) | (4,062,321) | |
| Net Assets | $85,651,218 | |
| Net Asset Value and Maximum Offering Price | ||
| Initial Class: | ||
| Net Asset Value, offering price and redemption price per share ($16,276,958 ÷ 839,467 shares) | $19.39 | |
| Service Class: | ||
| Net Asset Value, offering price and redemption price per share ($27,994,074 ÷ 1,448,943 shares) | $19.32 | |
| Service Class 2: | ||
| Net Asset Value, offering price and redemption price per share ($41,380,186 ÷ 2,153,154 shares) | $19.22 |
See accompanying notes which are an integral part of the financial statements.
Statement of Operations
| Six months ended June 30, 2022 (Unaudited) | ||
| Investment Income | ||
| Dividends: | ||
| Affiliated issuers | $77,524 | |
| Expenses | ||
| Distribution and service plan fees | $70,460 | |
| Independent trustees' fees and expenses | 141 | |
| Total expenses | 70,601 | |
| Net investment income (loss) | 6,923 | |
| Realized and Unrealized Gain (Loss) | ||
| Net realized gain (loss) on: | ||
| Investment securities: | ||
| Affiliated issuers | (1,131,920) | |
| Capital gain distributions from underlying funds: | ||
| Affiliated issuers | 866,605 | |
| Total net realized gain (loss) | (265,315) | |
| Change in net unrealized appreciation (depreciation) on: | ||
| Investment securities: | ||
| Affiliated issuers | (20,629,229) | |
| Total change in net unrealized appreciation (depreciation) | (20,629,229) | |
| Net gain (loss) | (20,894,544) | |
| Net increase (decrease) in net assets resulting from operations | $(20,887,621) |
See accompanying notes which are an integral part of the financial statements.
Statement of Changes in Net Assets
| Six months ended June 30, 2022 (Unaudited) | Year ended December 31, 2021 | |
| Increase (Decrease) in Net Assets | ||
| Operations | ||
| Net investment income (loss) | $6,923 | $1,111,937 |
| Net realized gain (loss) | (265,315) | 8,350,953 |
| Change in net unrealized appreciation (depreciation) | (20,629,229) | 3,543,714 |
| Net increase (decrease) in net assets resulting from operations | (20,887,621) | 13,006,604 |
| Distributions to shareholders | (7,332,391) | (3,806,546) |
| Share transactions - net increase (decrease) | 16,863,014 | 19,315,048 |
| Total increase (decrease) in net assets | (11,356,998) | 28,515,106 |
| Net Assets | ||
| Beginning of period | 97,008,216 | 68,493,110 |
| End of period | $85,651,218 | $97,008,216 |
See accompanying notes which are an integral part of the financial statements.
Financial Highlights
VIP Freedom 2050 Portfolio Initial Class
| Six months ended (Unaudited) June 30, | Years endedDecember 31, | |||||
| 2022 | 2021 | 2020 | 2019 | 2018 | 2017 | |
| Selected Per–Share Data | ||||||
| Net asset value, beginning of period | $26.36 | $23.45 | $20.68 | $16.88 | $19.50 | $16.55 |
| Income from Investment Operations | ||||||
| Net investment income (loss)A,B | .02 | .38 | .22 | .37 | .26 | .23 |
| Net realized and unrealized gain (loss) | (5.04) | 3.72 | 3.63 | 4.36 | (2.15) | 3.58 |
| Total from investment operations | (5.02) | 4.10 | 3.85 | 4.73 | (1.89) | 3.81 |
| Distributions from net investment income | (.10) | (.24) | (.20) | (.34) | (.21) | (.24) |
| Distributions from net realized gain | (1.85) | (.95) | (.88) | (.59) | (.52) | (.63) |
| Total distributions | (1.95) | (1.19) | (1.08) | (.93) | (.73) | (.86)C |
| Net asset value, end of period | $19.39 | $26.36 | $23.45 | $20.68 | $16.88 | $19.50 |
| Total ReturnD,E,F | (20.27)% | 17.83% | 19.28% | 28.51% | (9.89)% | 23.52% |
| Ratios to Average Net AssetsB,G,H | ||||||
| Expenses before reductionsI | - %J | -% | -% | -% | -% | -% |
| Expenses net of fee waivers, if any | - %I,J | - %I | - %I | - %I | - %I | -% |
| Expenses net of all reductions | - %I,J | - %I | - %I | - %I | - %I | -% |
| Net investment income (loss) | .17%J | 1.48% | 1.08% | 1.96% | 1.35% | 1.27% |
| Supplemental Data | ||||||
| Net assets, end of period (000 omitted) | $16,277 | $19,102 | $13,644 | $10,317 | $7,056 | $5,826 |
| Portfolio turnover rateK | 39%J | 30% | 43% | 30% | 111% | 46% |
A Calculated based on average shares outstanding during the period.
B Net investment income (loss) is affected by the timing of the declaration of dividends by any underlying mutual funds or exchange-traded funds (ETFs). Net investment income (loss) of any such underlying funds is not included in the Fund's net investment income (loss) ratio.
C Total distributions per share do not sum due to rounding.
D Total returns for periods of less than one year are not annualized.
E Total returns do not reflect charges attributable to your insurance company's separate account. Inclusion of these charges would reduce the total returns shown.
F Total returns would have been lower if certain expenses had not been reduced during the applicable periods shown.
G Fees and expenses of any underlying mutual funds or exchange-traded funds (ETFs) are not included in the Fund's expense ratio. The Fund indirectly bears its proportionate share of these expenses.
H Expense ratios reflect operating expenses of the class. Expenses before reductions do not reflect amounts reimbursed, waived, or reduced through arrangements with the investment adviser, brokerage services, or other offset arrangements, if applicable, and do not represent the amount paid by the class during periods when reimbursements, waivers or reductions occur.
I Amount represents less than .005%.
J Annualized
K Amount does not include the portfolio activity of any underlying mutual funds or exchange-traded funds (ETFs).
See accompanying notes which are an integral part of the financial statements.
VIP Freedom 2050 Portfolio Service Class
| Six months ended (Unaudited) June 30, | Years endedDecember 31, | |||||
| 2022 | 2021 | 2020 | 2019 | 2018 | 2017 | |
| Selected Per–Share Data | ||||||
| Net asset value, beginning of period | $26.29 | $23.39 | $20.63 | $16.84 | $19.47 | $16.52 |
| Income from Investment Operations | ||||||
| Net investment income (loss)A,B | .01 | .35 | .20 | .35 | .24 | .21 |
| Net realized and unrealized gain (loss) | (5.03) | 3.72 | 3.62 | 4.35 | (2.15) | 3.59 |
| Total from investment operations | (5.02) | 4.07 | 3.82 | 4.70 | (1.91) | 3.80 |
| Distributions from net investment income | (.10) | (.22) | (.18) | (.32) | (.20) | (.22) |
| Distributions from net realized gain | (1.85) | (.95) | (.88) | (.59) | (.52) | (.63) |
| Total distributions | (1.95) | (1.17) | (1.06) | (.91) | (.72) | (.85) |
| Net asset value, end of period | $19.32 | $26.29 | $23.39 | $20.63 | $16.84 | $19.47 |
| Total ReturnC,D,E | (20.33)% | 17.73% | 19.17% | 28.39% | (10.03)% | 23.46% |
| Ratios to Average Net AssetsB,F,G | ||||||
| Expenses before reductions | .10%H | .10% | .10% | .10% | .10% | .10% |
| Expenses net of fee waivers, if any | .10%H | .10% | .10% | .10% | .10% | .10% |
| Expenses net of all reductions | .10%H | .10% | .10% | .10% | .10% | .10% |
| Net investment income (loss) | .07%H | 1.38% | .98% | 1.86% | 1.25% | 1.17% |
| Supplemental Data | ||||||
| Net assets, end of period (000 omitted) | $27,994 | $30,244 | $21,593 | $14,242 | $10,203 | $6,748 |
| Portfolio turnover rateI | 39%H | 30% | 43% | 30% | 111% | 46% |
A Calculated based on average shares outstanding during the period.
B Net investment income (loss) is affected by the timing of the declaration of dividends by any underlying mutual funds or exchange-traded funds (ETFs). Net investment income (loss) of any such underlying funds is not included in the Fund's net investment income (loss) ratio.
C Total returns for periods of less than one year are not annualized.
D Total returns do not reflect charges attributable to your insurance company's separate account. Inclusion of these charges would reduce the total returns shown.
E Total returns would have been lower if certain expenses had not been reduced during the applicable periods shown.
F Fees and expenses of any underlying mutual funds or exchange-traded funds (ETFs) are not included in the Fund's expense ratio. The Fund indirectly bears its proportionate share of these expenses.
G Expense ratios reflect operating expenses of the class. Expenses before reductions do not reflect amounts reimbursed, waived, or reduced through arrangements with the investment adviser, brokerage services, or other offset arrangements, if applicable, and do not represent the amount paid by the class during periods when reimbursements, waivers or reductions occur.
H Annualized
I Amount does not include the portfolio activity of any underlying mutual funds or exchange-traded funds (ETFs).
See accompanying notes which are an integral part of the financial statements.
VIP Freedom 2050 Portfolio Service Class 2
| Six months ended (Unaudited) June 30, | Years endedDecember 31, | |||||
| 2022 | 2021 | 2020 | 2019 | 2018 | 2017 | |
| Selected Per–Share Data | ||||||
| Net asset value, beginning of period | $26.18 | $23.31 | $20.57 | $16.80 | $19.42 | $16.47 |
| Income from Investment Operations | ||||||
| Net investment income (loss)A,B | (.01) | .31 | .17 | .32 | .21 | .18 |
| Net realized and unrealized gain (loss) | (5.00) | 3.69 | 3.60 | 4.34 | (2.13) | 3.58 |
| Total from investment operations | (5.01) | 4.00 | 3.77 | 4.66 | (1.92) | 3.76 |
| Distributions from net investment income | (.10) | (.18) | (.15) | (.30) | (.18) | (.18) |
| Distributions from net realized gain | (1.85) | (.95) | (.88) | (.59) | (.52) | (.63) |
| Total distributions | (1.95) | (1.13) | (1.03) | (.89) | (.70) | (.81) |
| Net asset value, end of period | $19.22 | $26.18 | $23.31 | $20.57 | $16.80 | $19.42 |
| Total ReturnC,D,E | (20.38)% | 17.51% | 18.99% | 28.22% | (10.13)% | 23.30% |
| Ratios to Average Net AssetsB,F,G | ||||||
| Expenses before reductions | .25%H | .25% | .25% | .25% | .25% | .25% |
| Expenses net of fee waivers, if any | .25%H | .25% | .25% | .25% | .25% | .25% |
| Expenses net of all reductions | .25%H | .25% | .25% | .25% | .25% | .25% |
| Net investment income (loss) | (.08)%H | 1.23% | .83% | 1.71% | 1.10% | 1.02% |
| Supplemental Data | ||||||
| Net assets, end of period (000 omitted) | $41,380 | $47,661 | $33,256 | $20,551 | $10,262 | $8,285 |
| Portfolio turnover rateI | 39%H | 30% | 43% | 30% | 111% | 46% |
A Calculated based on average shares outstanding during the period.
B Net investment income (loss) is affected by the timing of the declaration of dividends by any underlying mutual funds or exchange-traded funds (ETFs). Net investment income (loss) of any such underlying funds is not included in the Fund's net investment income (loss) ratio.
C Total returns for periods of less than one year are not annualized.
D Total returns do not reflect charges attributable to your insurance company's separate account. Inclusion of these charges would reduce the total returns shown.
E Total returns would have been lower if certain expenses had not been reduced during the applicable periods shown.
F Fees and expenses of any underlying mutual funds or exchange-traded funds (ETFs) are not included in the Fund's expense ratio. The Fund indirectly bears its proportionate share of these expenses.
G Expense ratios reflect operating expenses of the class. Expenses before reductions do not reflect amounts reimbursed, waived, or reduced through arrangements with the investment adviser, brokerage services, or other offset arrangements, if applicable, and do not represent the amount paid by the class during periods when reimbursements, waivers or reductions occur.
H Annualized
I Amount does not include the portfolio activity of any underlying mutual funds or exchange-traded funds (ETFs).
See accompanying notes which are an integral part of the financial statements.
VIP Freedom 2055 Portfolio℠
Investment Summary (Unaudited)
The information in the following tables is based on the direct investments of the Fund.Top Holdings as of June 30, 2022
| % of fund's net assets | |
| VIP Overseas Portfolio Initial Class | 27.4 |
| VIP Emerging Markets Portfolio Initial Class | 15.3 |
| VIP Growth Portfolio Initial Class | 10.4 |
| VIP Growth & Income Portfolio Initial Class | 10.1 |
| VIP Equity-Income Portfolio Initial Class | 8.5 |
| VIP Contrafund Portfolio Initial Class | 8.2 |
| VIP Value Portfolio Initial Class | 6.2 |
| Fidelity Long-Term Treasury Bond Index Fund | 6.1 |
| VIP Value Strategies Portfolio Initial Class | 3.0 |
| VIP Mid Cap Portfolio Initial Class | 2.4 |
| 97.6 |
Asset Allocation (% of fund's net assets)
| Period end | ||
| Domestic Equity Funds | 48.8% | |
| International Equity Funds | 42.7% | |
| Bond Funds | 8.5% | |

VIP Freedom 2055 Portfolio℠
Schedule of Investments June 30, 2022 (Unaudited)
Showing Percentage of Net Assets
| Domestic Equity Funds - 48.8% | |||
| Shares | Value | ||
| VIP Contrafund Portfolio Initial Class (a) | 12,164 | $477,198 | |
| VIP Equity-Income Portfolio Initial Class (a) | 21,040 | 490,874 | |
| VIP Growth & Income Portfolio Initial Class (a) | 25,261 | 581,763 | |
| VIP Growth Portfolio Initial Class (a) | 8,068 | 601,300 | |
| VIP Mid Cap Portfolio Initial Class (a) | 4,473 | 141,877 | |
| VIP Value Portfolio Initial Class (a) | 21,800 | 358,391 | |
| VIP Value Strategies Portfolio Initial Class (a) | 12,271 | 175,104 | |
| TOTAL DOMESTIC EQUITY FUNDS | |||
| (Cost $2,978,255) | 2,826,507 | ||
| International Equity Funds - 42.7% | |||
| VIP Emerging Markets Portfolio Initial Class (a) | 87,841 | 883,676 | |
| VIP Overseas Portfolio Initial Class (a) | 76,044 | 1,584,767 | |
| TOTAL INTERNATIONAL EQUITY FUNDS | |||
| (Cost $2,961,500) | 2,468,443 | ||
| Bond Funds - 8.5% | |||
| Fidelity Inflation-Protected Bond Index Fund (a) | 9,165 | 93,022 | |
| Fidelity International Bond Index Fund (a) | 3,545 | 32,261 | |
| Fidelity Long-Term Treasury Bond Index Fund (a) | 30,554 | 352,291 | |
| VIP High Income Portfolio Initial Class (a) | 3,465 | 15,663 | |
| TOTAL BOND FUNDS | |||
| (Cost $548,462) | 493,237 | ||
| TOTAL INVESTMENT IN SECURITIES - 100.0% | |||
| (Cost $6,488,217) | 5,788,187 | ||
| NET OTHER ASSETS (LIABILITIES) - 0.0% | (742) | ||
| NET ASSETS - 100% | $5,787,445 |
Legend
(a) Affiliated Fund
Affiliated Underlying Funds
Fiscal year to date information regarding the Fund's investments in affiliated Underlying Funds is presented below. Exchanges between classes of the same affiliated Underlying Funds may occur, and are excluded from purchases and sales below if applicable. If an underlying Fund changes its name, the name presented below is the name in effect at period end.
| Affiliate | Value, beginning of period | Purchases(a) | Sales Proceeds(a) | Dividend Income | Realized Gain (loss) | Change in Unrealized appreciation (depreciation) | Value, end of period |
| Fidelity Inflation-Protected Bond Index Fund | $114,909 | $44,594 | $57,460 | $-- | $(1,113) | $(7,908) | $93,022 |
| Fidelity International Bond Index Fund | 28,599 | 25,052 | 18,547 | 43 | (896) | (1,947) | 32,261 |
| Fidelity Long-Term Treasury Bond Index Fund | 216,499 | 260,162 | 65,347 | 2,962 | (7,610) | (51,413) | 352,291 |
| VIP Contrafund Portfolio Initial Class | 491,432 | 225,204 | 84,702 | 4,652 | (8,358) | (146,378) | 477,198 |
| VIP Emerging Markets Portfolio Initial Class | 858,167 | 423,389 | 209,965 | -- | (30,265) | (157,650) | 883,676 |
| VIP Equity-Income Portfolio Initial Class | 519,799 | 189,517 | 159,558 | 672 | (4,586) | (54,298) | 490,874 |
| VIP Growth & Income Portfolio Initial Class | 591,747 | 234,754 | 168,833 | 1,160 | (1,492) | (74,413) | 581,763 |
| VIP Growth Portfolio Initial Class | 502,599 | 357,656 | 99,396 | 23,768 | (9,554) | (150,005) | 601,300 |
| VIP High Income Portfolio Initial Class | 85,698 | 40,746 | 102,939 | 33 | (7,345) | (497) | 15,663 |
| VIP Investment Grade Bond Portfolio II Initial Class | -- | 36,336 | 36,328 | -- | (8) | -- | -- |
| VIP Investment Grade Bond Portfolio Initial Class | 54,468 | 38,876 | 88,412 | 1,775 | (5,172) | 240 | -- |
| VIP Mid Cap Portfolio Initial Class | 144,164 | 64,813 | 30,252 | 3,398 | (2,144) | (34,704) | 141,877 |
| VIP Overseas Portfolio Initial Class | 1,537,470 | 836,840 | 266,948 | 12,176 | (24,293) | (498,302) | 1,584,767 |
| VIP Value Portfolio Initial Class | 381,102 | 145,463 | 128,084 | 5,059 | (2,895) | (37,195) | 358,391 |
| VIP Value Strategies Portfolio Initial Class | 186,691 | 70,688 | 56,663 | 1,618 | (1,333) | (24,279) | 175,104 |
| $5,713,344 | $2,994,090 | $1,573,434 | $57,316 | $(107,064) | $(1,238,749) | $5,788,187 |
(a) Includes the value of shares purchased or redeemed through in-kind transactions, as applicable.
Amounts in the income column in the above table include any capital gain distributions from underlying funds, which are presented in the corresponding line-item in the Statement of Operations, if applicable.
Investment Valuation
The following is a summary of the inputs used, as of June 30, 2022, involving the Fund's assets and liabilities carried at fair value. The inputs or methodology used for valuing securities may not be an indication of the risk associated with investing in those securities. For more information on valuation inputs, and their aggregation into the levels used below, please refer to the Investment Valuation section in the accompanying Notes to Financial Statements.
| Valuation Inputs at Reporting Date: | ||||
| Description | Total | Level 1 | Level 2 | Level 3 |
| Investments in Securities: | ||||
| Domestic Equity Funds | $2,826,507 | $2,826,507 | $-- | $-- |
| International Equity Funds | 2,468,443 | 2,468,443 | -- | -- |
| Bond Funds | 493,237 | 493,237 | -- | -- |
| Total Investments in Securities: | $5,788,187 | $5,788,187 | $-- | $-- |
See accompanying notes which are an integral part of the financial statements.
VIP Freedom 2055 Portfolio℠
Financial Statements
Statement of Assets and Liabilities
| June 30, 2022 (Unaudited) | ||
| Assets | ||
| Investment in securities, at value — See accompanying schedule: | ||
| Affiliated issuers (cost $6,488,217) | $5,788,187 | |
| Total Investment in Securities (cost $6,488,217) | $5,788,187 | |
| Cash | 16 | |
| Receivable for investments sold | 43,227 | |
| Receivable for fund shares sold | 28,735 | |
| Total assets | 5,860,165 | |
| Liabilities | ||
| Payable for investments purchased | $52,107 | |
| Payable for fund shares redeemed | 19,851 | |
| Distribution and service plan fees payable | 762 | |
| Total liabilities | 72,720 | |
| Net Assets | $5,787,445 | |
| Net Assets consist of: | ||
| Paid in capital | $6,569,322 | |
| Total accumulated earnings (loss) | (781,877) | |
| Net Assets | $5,787,445 | |
| Net Asset Value and Maximum Offering Price | ||
| Initial Class: | ||
| Net Asset Value, offering price and redemption price per share ($655,808 ÷ 60,516 shares) | $10.84 | |
| Service Class: | ||
| Net Asset Value, offering price and redemption price per share ($2,498,278 ÷ 230,841 shares) | $10.82 | |
| Service Class 2: | ||
| Net Asset Value, offering price and redemption price per share ($2,633,359 ÷ 243,858 shares) | $10.80 |
See accompanying notes which are an integral part of the financial statements.
Statement of Operations
| Six months ended June 30, 2022 (Unaudited) | ||
| Investment Income | ||
| Dividends: | ||
| Affiliated issuers | $4,780 | |
| Expenses | ||
| Distribution and service plan fees | $4,556 | |
| Independent trustees' fees and expenses | 8 | |
| Total expenses | 4,564 | |
| Net investment income (loss) | 216 | |
| Realized and Unrealized Gain (Loss) | ||
| Net realized gain (loss) on: | ||
| Investment securities: | ||
| Affiliated issuers | (107,064) | |
| Capital gain distributions from underlying funds: | ||
| Affiliated issuers | 52,536 | |
| Total net realized gain (loss) | (54,528) | |
| Change in net unrealized appreciation (depreciation) on: | ||
| Investment securities: | ||
| Affiliated issuers | (1,238,749) | |
| Total change in net unrealized appreciation (depreciation) | (1,238,749) | |
| Net gain (loss) | (1,293,277) | |
| Net increase (decrease) in net assets resulting from operations | $(1,293,061) |
See accompanying notes which are an integral part of the financial statements.
Statement of Changes in Net Assets
| Six months ended June 30, 2022 (Unaudited) | Year ended December 31, 2021 | |
| Increase (Decrease) in Net Assets | ||
| Operations | ||
| Net investment income (loss) | $216 | $61,529 |
| Net realized gain (loss) | (54,528) | 420,907 |
| Change in net unrealized appreciation (depreciation) | (1,238,749) | 124,786 |
| Net increase (decrease) in net assets resulting from operations | (1,293,061) | 607,222 |
| Distributions to shareholders | (278,875) | (235,468) |
| Share transactions - net increase (decrease) | 1,646,754 | 2,923,390 |
| Total increase (decrease) in net assets | 74,818 | 3,295,144 |
| Net Assets | ||
| Beginning of period | 5,712,627 | 2,417,483 |
| End of period | $5,787,445 | $5,712,627 |
See accompanying notes which are an integral part of the financial statements.
Financial Highlights
VIP Freedom 2055 Portfolio Initial Class
| Six months ended (Unaudited) June 30, | Years endedDecember 31, | |||
| 2022 | 2021 | 2020 | 2019 A | |
| Selected Per–Share Data | ||||
| Net asset value, beginning of period | $14.28 | $12.67 | $10.98 | $10.00 |
| Income from Investment Operations | ||||
| Net investment income (loss)B,C | .01 | .23 | .12 | .16 |
| Net realized and unrealized gain (loss) | (2.79) | 2.02 | 1.99 | 1.02 |
| Total from investment operations | (2.78) | 2.25 | 2.11 | 1.18 |
| Distributions from net investment income | – | (.17) | (.10) | (.15) |
| Distributions from net realized gain | (.66) | (.46) | (.32) | (.06) |
| Total distributions | (.66) | (.64)D | (.42) | (.20)D |
| Net asset value, end of period | $10.84 | $14.28 | $12.67 | $10.98 |
| Total ReturnE,F | (20.26)% | 17.79% | 19.28% | 11.85% |
| Ratios to Average Net AssetsC,G,H | ||||
| Expenses before reductionsI | - %J | -% | -% | - %J |
| Expenses net of fee waivers, if anyI | - %J | -% | -% | - %J |
| Expenses net of all reductionsI | - %J | -% | -% | - %J |
| Net investment income (loss) | .17%J | 1.64% | 1.09% | 2.12%J |
| Supplemental Data | ||||
| Net assets, end of period (000 omitted) | $656 | $501 | $423 | $366 |
| Portfolio turnover rateK | 55%J | 35% | 64% | 24%J |
A For the period April 11, 2019 (commencement of operations) through December 31, 2019.
B Calculated based on average shares outstanding during the period.
C Net investment income (loss) is affected by the timing of the declaration of dividends by any underlying mutual funds or exchange-traded funds (ETFs). Net investment income (loss) of any such underlying funds is not included in the Fund's net investment income (loss) ratio.
D Total distributions per share do not sum due to rounding.
E Total returns for periods of less than one year are not annualized.
F Total returns do not reflect charges attributable to your insurance company's separate account. Inclusion of these charges would reduce the total returns shown.
G Fees and expenses of any underlying mutual funds or exchange-traded funds (ETFs) are not included in the Fund's expense ratio. The Fund indirectly bears its proportionate share of these expenses.
H Expense ratios reflect operating expenses of the class. Expenses before reductions do not reflect amounts reimbursed, waived, or reduced through arrangements with the investment adviser, brokerage services, or other offset arrangements, if applicable, and do not represent the amount paid by the class during periods when reimbursements, waivers or reductions occur.
I Amount represents less than .005%.
J Annualized
K Amount does not include the portfolio activity of any underlying mutual funds or exchange-traded funds (ETFs).
See accompanying notes which are an integral part of the financial statements.
VIP Freedom 2055 Portfolio Service Class
| Six months ended (Unaudited) June 30, | Years endedDecember 31, | |||
| 2022 | 2021 | 2020 | 2019 A | |
| Selected Per–Share Data | ||||
| Net asset value, beginning of period | $14.27 | $12.66 | $10.98 | $10.00 |
| Income from Investment Operations | ||||
| Net investment income (loss)B,C | –D | .22 | .11 | .15 |
| Net realized and unrealized gain (loss) | (2.79) | 2.02 | 1.99 | 1.03 |
| Total from investment operations | (2.79) | 2.24 | 2.10 | 1.18 |
| Distributions from net investment income | – | (.16) | (.09) | (.14) |
| Distributions from net realized gain | (.66) | (.46) | (.32) | (.06) |
| Total distributions | (.66) | (.63)E | (.42)E | (.20) |
| Net asset value, end of period | $10.82 | $14.27 | $12.66 | $10.98 |
| Total ReturnF,G | (20.34)% | 17.72% | 19.11% | 11.78% |
| Ratios to Average Net AssetsC,H,I | ||||
| Expenses before reductions | .10%J | .10% | .10% | .10%J |
| Expenses net of fee waivers, if any | .10%J | .10% | .10% | .10%J |
| Expenses net of all reductions | .10%J | .10% | .10% | .10%J |
| Net investment income (loss) | .07%J | 1.54% | .99% | 2.02%J |
| Supplemental Data | ||||
| Net assets, end of period (000 omitted) | $2,498 | $2,549 | $814 | $399 |
| Portfolio turnover rateK | 55%J | 35% | 64% | 24%J |
A For the period April 11, 2019 (commencement of operations) through December 31, 2019.
B Calculated based on average shares outstanding during the period.
C Net investment income (loss) is affected by the timing of the declaration of dividends by any underlying mutual funds or exchange-traded funds (ETFs). Net investment income (loss) of any such underlying funds is not included in the Fund's net investment income (loss) ratio.
D Amount represents less than $.005 per share.
E Total distributions per share do not sum due to rounding.
F Total returns for periods of less than one year are not annualized.
G Total returns do not reflect charges attributable to your insurance company's separate account. Inclusion of these charges would reduce the total returns shown.
H Fees and expenses of any underlying mutual funds or exchange-traded funds (ETFs) are not included in the Fund's expense ratio. The Fund indirectly bears its proportionate share of these expenses.
I Expense ratios reflect operating expenses of the class. Expenses before reductions do not reflect amounts reimbursed, waived, or reduced through arrangements with the investment adviser, brokerage services, or other offset arrangements, if applicable, and do not represent the amount paid by the class during periods when reimbursements, waivers or reductions occur.
J Annualized
K Amount does not include the portfolio activity of any underlying mutual funds or exchange-traded funds (ETFs).
See accompanying notes which are an integral part of the financial statements.
VIP Freedom 2055 Portfolio Service Class 2
| Six months ended (Unaudited) June 30, | Years endedDecember 31, | |||
| 2022 | 2021 | 2020 | 2019 A | |
| Selected Per–Share Data | ||||
| Net asset value, beginning of period | $14.25 | $12.65 | $10.97 | $10.00 |
| Income from Investment Operations | ||||
| Net investment income (loss)B,C | (.01) | .20 | .09 | .14 |
| Net realized and unrealized gain (loss) | (2.78) | 2.01 | 1.99 | 1.02 |
| Total from investment operations | (2.79) | 2.21 | 2.08 | 1.16 |
| Distributions from net investment income | – | (.15) | (.08) | (.13) |
| Distributions from net realized gain | (.66) | (.46) | (.32) | (.06) |
| Total distributions | (.66) | (.61) | (.40) | (.19) |
| Net asset value, end of period | $10.80 | $14.25 | $12.65 | $10.97 |
| Total ReturnD,E | (20.37)% | 17.52% | 19.01% | 11.60% |
| Ratios to Average Net AssetsC,F,G | ||||
| Expenses before reductions | .25%H | .25% | .25% | .25%H |
| Expenses net of fee waivers, if any | .25%H | .25% | .25% | .25%H |
| Expenses net of all reductions | .25%H | .25% | .25% | .25%H |
| Net investment income (loss) | (.08)%H | 1.39% | .84% | 1.87%H |
| Supplemental Data | ||||
| Net assets, end of period (000 omitted) | $2,633 | $2,663 | $1,180 | $590 |
| Portfolio turnover rateI | 55%H | 35% | 64% | 24%H |
A For the period April 11, 2019 (commencement of operations) through December 31, 2019.
B Calculated based on average shares outstanding during the period.
C Net investment income (loss) is affected by the timing of the declaration of dividends by any underlying mutual funds or exchange-traded funds (ETFs). Net investment income (loss) of any such underlying funds is not included in the Fund's net investment income (loss) ratio.
D Total returns for periods of less than one year are not annualized.
E Total returns do not reflect charges attributable to your insurance company's separate account. Inclusion of these charges would reduce the total returns shown.
F Fees and expenses of any underlying mutual funds or exchange-traded funds (ETFs) are not included in the Fund's expense ratio. The Fund indirectly bears its proportionate share of these expenses.
G Expense ratios reflect operating expenses of the class. Expenses before reductions do not reflect amounts reimbursed, waived, or reduced through arrangements with the investment adviser, brokerage services, or other offset arrangements, if applicable, and do not represent the amount paid by the class during periods when reimbursements, waivers or reductions occur.
H Annualized
I Amount does not include the portfolio activity of any underlying mutual funds or exchange-traded funds (ETFs).
See accompanying notes which are an integral part of the financial statements.
VIP Freedom 2060 Portfolio℠
Investment Summary (Unaudited)
The information in the following tables is based on the direct investments of the Fund.Top Holdings as of June 30, 2022
| % of fund's net assets | |
| VIP Overseas Portfolio Initial Class | 27.4 |
| VIP Emerging Markets Portfolio Initial Class | 15.3 |
| VIP Growth Portfolio Initial Class | 10.4 |
| VIP Growth & Income Portfolio Initial Class | 10.1 |
| VIP Equity-Income Portfolio Initial Class | 8.5 |
| VIP Contrafund Portfolio Initial Class | 8.2 |
| VIP Value Portfolio Initial Class | 6.2 |
| Fidelity Long-Term Treasury Bond Index Fund | 6.1 |
| VIP Value Strategies Portfolio Initial Class | 3.0 |
| VIP Mid Cap Portfolio Initial Class | 2.4 |
| 97.6 |
Asset Allocation (% of fund's net assets)
| Period end | ||
| Domestic Equity Funds | 48.8% | |
| International Equity Funds | 42.7% | |
| Bond Funds | 8.5% | |

VIP Freedom 2060 Portfolio℠
Schedule of Investments June 30, 2022 (Unaudited)
Showing Percentage of Net Assets
| Domestic Equity Funds - 48.8% | |||
| Shares | Value | ||
| VIP Contrafund Portfolio Initial Class (a) | 17,743 | $696,066 | |
| VIP Equity-Income Portfolio Initial Class (a) | 30,691 | 716,010 | |
| VIP Growth & Income Portfolio Initial Class (a) | 36,847 | 848,589 | |
| VIP Growth Portfolio Initial Class (a) | 11,768 | 877,104 | |
| VIP Mid Cap Portfolio Initial Class (a) | 6,524 | 206,949 | |
| VIP Value Portfolio Initial Class (a) | 31,798 | 522,759 | |
| VIP Value Strategies Portfolio Initial Class (a) | 17,899 | 255,413 | |
| TOTAL DOMESTIC EQUITY FUNDS | |||
| (Cost $4,187,384) | 4,122,890 | ||
| International Equity Funds - 42.7% | |||
| VIP Emerging Markets Portfolio Initial Class (a) | 128,129 | 1,288,975 | |
| VIP Overseas Portfolio Initial Class (a) | 110,923 | 2,311,634 | |
| TOTAL INTERNATIONAL EQUITY FUNDS | |||
| (Cost $4,268,543) | 3,600,609 | ||
| Bond Funds - 8.5% | |||
| Fidelity Inflation-Protected Bond Index Fund (a) | 13,368 | 135,688 | |
| Fidelity International Bond Index Fund (a) | 5,171 | 47,059 | |
| Fidelity Long-Term Treasury Bond Index Fund (a) | 44,569 | 513,884 | |
| VIP High Income Portfolio Initial Class (a) | 5,055 | 22,847 | |
| TOTAL BOND FUNDS | |||
| (Cost $805,520) | 719,478 | ||
| TOTAL INVESTMENT IN SECURITIES - 100.0% | |||
| (Cost $9,261,447) | 8,442,977 | ||
| NET OTHER ASSETS (LIABILITIES) - 0.0% | (960) | ||
| NET ASSETS - 100% | $8,442,017 |
Legend
(a) Affiliated Fund
Affiliated Underlying Funds
Fiscal year to date information regarding the Fund's investments in affiliated Underlying Funds is presented below. Exchanges between classes of the same affiliated Underlying Funds may occur, and are excluded from purchases and sales below if applicable. If an underlying Fund changes its name, the name presented below is the name in effect at period end.
| Affiliate | Value, beginning of period | Purchases(a) | Sales Proceeds(a) | Dividend Income | Realized Gain (loss) | Change in Unrealized appreciation (depreciation) | Value, end of period |
| Fidelity Inflation-Protected Bond Index Fund | $179,029 | $52,584 | $82,135 | $-- | $(1,350) | $(12,440) | $135,688 |
| Fidelity International Bond Index Fund | 44,559 | 34,508 | 27,616 | 68 | (1,275) | (3,117) | 47,059 |
| Fidelity Long-Term Treasury Bond Index Fund | 337,297 | 362,824 | 94,183 | 4,546 | (9,950) | (82,104) | 513,884 |
| VIP Contrafund Portfolio Initial Class | 765,743 | 291,850 | 126,101 | 7,304 | (13,301) | (222,125) | 696,066 |
| VIP Emerging Markets Portfolio Initial Class | 1,337,151 | 528,177 | 283,232 | -- | (43,260) | (249,861) | 1,288,975 |
| VIP Equity-Income Portfolio Initial Class | 809,906 | 222,898 | 229,789 | 1,048 | (6,246) | (80,759) | 716,010 |
| VIP Growth & Income Portfolio Initial Class | 922,033 | 277,013 | 238,759 | 1,810 | (2,085) | (109,613) | 848,589 |
| VIP Growth Portfolio Initial Class | 783,146 | 481,730 | 144,672 | 37,318 | (13,234) | (229,866) | 877,104 |
| VIP High Income Portfolio Initial Class | 133,525 | 50,334 | 148,760 | 52 | (11,447) | (805) | 22,847 |
| VIP Investment Grade Bond Portfolio II Initial Class | -- | 54,137 | 54,120 | -- | (17) | -- | -- |
| VIP Investment Grade Bond Portfolio Initial Class | 84,863 | 56,942 | 134,079 | 2,771 | (7,806) | 80 | -- |
| VIP Mid Cap Portfolio Initial Class | 224,618 | 78,116 | 40,042 | 5,303 | (2,957) | (52,786) | 206,949 |
| VIP Overseas Portfolio Initial Class | 2,395,363 | 1,069,677 | 351,977 | 19,002 | (35,456) | (765,973) | 2,311,634 |
| VIP Value Portfolio Initial Class | 593,802 | 166,558 | 179,776 | 7,896 | (2,399) | (55,426) | 522,759 |
| VIP Value Strategies Portfolio Initial Class | 290,886 | 79,947 | 78,118 | 2,525 | (918) | (36,384) | 255,413 |
| $8,901,921 | $3,807,295 | $2,213,359 | $89,643 | $(151,701) | $(1,901,179) | $8,442,977 |
(a) Includes the value of shares purchased or redeemed through in-kind transactions, as applicable.
Amounts in the income column in the above table include any capital gain distributions from underlying funds, which are presented in the corresponding line-item in the Statement of Operations, if applicable.
Investment Valuation
The following is a summary of the inputs used, as of June 30, 2022, involving the Fund's assets and liabilities carried at fair value. The inputs or methodology used for valuing securities may not be an indication of the risk associated with investing in those securities. For more information on valuation inputs, and their aggregation into the levels used below, please refer to the Investment Valuation section in the accompanying Notes to Financial Statements.
| Valuation Inputs at Reporting Date: | ||||
| Description | Total | Level 1 | Level 2 | Level 3 |
| Investments in Securities: | ||||
| Domestic Equity Funds | $4,122,890 | $4,122,890 | $-- | $-- |
| International Equity Funds | 3,600,609 | 3,600,609 | -- | -- |
| Bond Funds | 719,478 | 719,478 | -- | -- |
| Total Investments in Securities: | $8,442,977 | $8,442,977 | $-- | $-- |
See accompanying notes which are an integral part of the financial statements.
VIP Freedom 2060 Portfolio℠
Financial Statements
Statement of Assets and Liabilities
| June 30, 2022 (Unaudited) | ||
| Assets | ||
| Investment in securities, at value — See accompanying schedule: | ||
| Affiliated issuers (cost $9,261,447) | $8,442,977 | |
| Total Investment in Securities (cost $9,261,447) | $8,442,977 | |
| Cash | 1 | |
| Receivable for investments sold | 45,621 | |
| Receivable for fund shares sold | 7,327 | |
| Total assets | 8,495,926 | |
| Liabilities | ||
| Payable for investments purchased | $51,610 | |
| Payable for fund shares redeemed | 1,339 | |
| Distribution and service plan fees payable | 960 | |
| Total liabilities | 53,909 | |
| Net Assets | $8,442,017 | |
| Net Assets consist of: | ||
| Paid in capital | $9,433,530 | |
| Total accumulated earnings (loss) | (991,513) | |
| Net Assets | $8,442,017 | |
| Net Asset Value and Maximum Offering Price | ||
| Initial Class: | ||
| Net Asset Value, offering price and redemption price per share ($411,566 ÷ 38,287 shares) | $10.75 | |
| Service Class: | ||
| Net Asset Value, offering price and redemption price per share ($5,775,367 ÷ 537,948 shares) | $10.74 | |
| Service Class 2: | ||
| Net Asset Value, offering price and redemption price per share ($2,255,084 ÷ 210,530 shares) | $10.71 |
See accompanying notes which are an integral part of the financial statements.
Statement of Operations
| Six months ended June 30, 2022 (Unaudited) | ||
| Investment Income | ||
| Dividends: | ||
| Affiliated issuers | $7,401 | |
| Expenses | ||
| Distribution and service plan fees | $5,864 | |
| Independent trustees' fees and expenses | 13 | |
| Total expenses | 5,877 | |
| Net investment income (loss) | 1,524 | |
| Realized and Unrealized Gain (Loss) | ||
| Net realized gain (loss) on: | ||
| Investment securities: | ||
| Affiliated issuers | (151,701) | |
| Capital gain distributions from underlying funds: | ||
| Affiliated issuers | 82,242 | |
| Total net realized gain (loss) | (69,459) | |
| Change in net unrealized appreciation (depreciation) on: | ||
| Investment securities: | ||
| Affiliated issuers | (1,901,179) | |
| Total change in net unrealized appreciation (depreciation) | (1,901,179) | |
| Net gain (loss) | (1,970,638) | |
| Net increase (decrease) in net assets resulting from operations | $(1,969,114) |
See accompanying notes which are an integral part of the financial statements.
Statement of Changes in Net Assets
| Six months ended June 30, 2022 (Unaudited) | Year ended December 31, 2021 | |
| Increase (Decrease) in Net Assets | ||
| Operations | ||
| Net investment income (loss) | $1,524 | $100,627 |
| Net realized gain (loss) | (69,459) | 739,328 |
| Change in net unrealized appreciation (depreciation) | (1,901,179) | 271,403 |
| Net increase (decrease) in net assets resulting from operations | (1,969,114) | 1,111,358 |
| Distributions to shareholders | (447,325) | (423,109) |
| Share transactions - net increase (decrease) | 1,957,484 | 3,099,350 |
| Total increase (decrease) in net assets | (458,955) | 3,787,599 |
| Net Assets | ||
| Beginning of period | 8,900,972 | 5,113,373 |
| End of period | $8,442,017 | $8,900,972 |
See accompanying notes which are an integral part of the financial statements.
Financial Highlights
VIP Freedom 2060 Portfolio Initial Class
| Six months ended (Unaudited) June 30, | Years endedDecember 31, | |||
| 2022 | 2021 | 2020 | 2019 A | |
| Selected Per–Share Data | ||||
| Net asset value, beginning of period | $14.18 | $12.65 | $10.99 | $10.00 |
| Income from Investment Operations | ||||
| Net investment income (loss)B,C | .01 | .21 | .13 | .16 |
| Net realized and unrealized gain (loss) | (2.77) | 2.04 | 1.99 | 1.02 |
| Total from investment operations | (2.76) | 2.25 | 2.12 | 1.18 |
| Distributions from net investment income | – | (.18) | (.11) | (.15) |
| Distributions from net realized gain | (.67) | (.54) | (.35) | (.05) |
| Total distributions | (.67) | (.72) | (.46) | (.19)D |
| Net asset value, end of period | $10.75 | $14.18 | $12.65 | $10.99 |
| Total ReturnE,F | (20.25)% | 17.79% | 19.30% | 11.86% |
| Ratios to Average Net AssetsC,G,H | ||||
| Expenses before reductionsI | - %J | -% | -% | - %J |
| Expenses net of fee waivers, if anyI | - %J | -% | -% | - %J |
| Expenses net of all reductionsI | - %J | -% | -% | - %J |
| Net investment income (loss) | .17%J | 1.51% | 1.18% | 2.18%J |
| Supplemental Data | ||||
| Net assets, end of period (000 omitted) | $412 | $523 | $422 | $366 |
| Portfolio turnover rateK | 50%J | 60% | 68% | 23%J |
A For the period April 11, 2019 (commencement of operations) through December 31, 2019.
B Calculated based on average shares outstanding during the period.
C Net investment income (loss) is affected by the timing of the declaration of dividends by any underlying mutual funds or exchange-traded funds (ETFs). Net investment income (loss) of any such underlying funds is not included in the Fund's net investment income (loss) ratio.
D Total distributions per share do not sum due to rounding.
E Total returns for periods of less than one year are not annualized.
F Total returns do not reflect charges attributable to your insurance company's separate account. Inclusion of these charges would reduce the total returns shown.
G Fees and expenses of any underlying mutual funds or exchange-traded funds (ETFs) are not included in the Fund's expense ratio. The Fund indirectly bears its proportionate share of these expenses.
H Expense ratios reflect operating expenses of the class. Expenses before reductions do not reflect amounts reimbursed, waived, or reduced through arrangements with the investment adviser, brokerage services, or other offset arrangements, if applicable, and do not represent the amount paid by the class during periods when reimbursements, waivers or reductions occur.
I Amount represents less than .005%.
J Annualized
K Amount does not include the portfolio activity of any underlying mutual funds or exchange-traded funds (ETFs).
See accompanying notes which are an integral part of the financial statements.
VIP Freedom 2060 Portfolio Service Class
| Six months ended (Unaudited) June 30, | Years endedDecember 31, | |||
| 2022 | 2021 | 2020 | 2019 A | |
| Selected Per–Share Data | ||||
| Net asset value, beginning of period | $14.17 | $12.65 | $10.99 | $10.00 |
| Income from Investment Operations | ||||
| Net investment income (loss)B,C | –D | .20 | .12 | .15 |
| Net realized and unrealized gain (loss) | (2.76) | 2.03 | 1.99 | 1.03 |
| Total from investment operations | (2.76) | 2.23 | 2.11 | 1.18 |
| Distributions from net investment income | – | (.17) | (.10) | (.14) |
| Distributions from net realized gain | (.67) | (.54) | (.35) | (.05) |
| Total distributions | (.67) | (.71) | (.45) | (.19) |
| Net asset value, end of period | $10.74 | $14.17 | $12.65 | $10.99 |
| Total ReturnE,F | (20.26)% | 17.62% | 19.22% | 11.80% |
| Ratios to Average Net AssetsC,G,H | ||||
| Expenses before reductions | .10%I | .10% | .10% | .10%I |
| Expenses net of fee waivers, if any | .10%I | .10% | .10% | .10%I |
| Expenses net of all reductions | .10%I | .10% | .10% | .10%I |
| Net investment income (loss) | .07%I | 1.41% | 1.08% | 2.08%I |
| Supplemental Data | ||||
| Net assets, end of period (000 omitted) | $5,775 | $6,124 | $3,530 | $445 |
| Portfolio turnover rateJ | 50%I | 60% | 68% | 23%I |
A For the period April 11, 2019 (commencement of operations) through December 31, 2019.
B Calculated based on average shares outstanding during the period.
C Net investment income (loss) is affected by the timing of the declaration of dividends by any underlying mutual funds or exchange-traded funds (ETFs). Net investment income (loss) of any such underlying funds is not included in the Fund's net investment income (loss) ratio.
D Amount represents less than $.005 per share.
E Total returns for periods of less than one year are not annualized.
F Total returns do not reflect charges attributable to your insurance company's separate account. Inclusion of these charges would reduce the total returns shown.
G Fees and expenses of any underlying mutual funds or exchange-traded funds (ETFs) are not included in the Fund's expense ratio. The Fund indirectly bears its proportionate share of these expenses.
H Expense ratios reflect operating expenses of the class. Expenses before reductions do not reflect amounts reimbursed, waived, or reduced through arrangements with the investment adviser, brokerage services, or other offset arrangements, if applicable, and do not represent the amount paid by the class during periods when reimbursements, waivers or reductions occur.
I Annualized
J Amount does not include the portfolio activity of any underlying mutual funds or exchange-traded funds (ETFs).
See accompanying notes which are an integral part of the financial statements.
VIP Freedom 2060 Portfolio Service Class 2
| Six months ended (Unaudited) June 30, | Years endedDecember 31, | |||
| 2022 | 2021 | 2020 | 2019 A | |
| Selected Per–Share Data | ||||
| Net asset value, beginning of period | $14.15 | $12.63 | $10.98 | $10.00 |
| Income from Investment Operations | ||||
| Net investment income (loss)B,C | –D | .18 | .10 | .14 |
| Net realized and unrealized gain (loss) | (2.77) | 2.03 | 1.99 | 1.02 |
| Total from investment operations | (2.77) | 2.21 | 2.09 | 1.16 |
| Distributions from net investment income | – | (.15) | (.09) | (.13) |
| Distributions from net realized gain | (.67) | (.54) | (.35) | (.05) |
| Total distributions | (.67) | (.69) | (.44) | (.18) |
| Net asset value, end of period | $10.71 | $14.15 | $12.63 | $10.98 |
| Total ReturnE,F | (20.37)% | 17.52% | 19.04% | 11.61% |
| Ratios to Average Net AssetsC,G,H | ||||
| Expenses before reductions | .25%I | .25% | .25% | .25%I |
| Expenses net of fee waivers, if any | .25%I | .25% | .25% | .25%I |
| Expenses net of all reductions | .25%I | .25% | .25% | .25%I |
| Net investment income (loss) | (.08)%I | 1.26% | .93% | 1.93%I |
| Supplemental Data | ||||
| Net assets, end of period (000 omitted) | $2,255 | $2,254 | $1,161 | $475 |
| Portfolio turnover rateJ | 50%I | 60% | 68% | 23%I |
A For the period April 11, 2019 (commencement of operations) through December 31, 2019.
B Calculated based on average shares outstanding during the period.
C Net investment income (loss) is affected by the timing of the declaration of dividends by any underlying mutual funds or exchange-traded funds (ETFs). Net investment income (loss) of any such underlying funds is not included in the Fund's net investment income (loss) ratio.
D Amount represents less than $.005 per share.
E Total returns for periods of less than one year are not annualized.
F Total returns do not reflect charges attributable to your insurance company's separate account. Inclusion of these charges would reduce the total returns shown.
G Fees and expenses of any underlying mutual funds or exchange-traded funds (ETFs) are not included in the Fund's expense ratio. The Fund indirectly bears its proportionate share of these expenses.
H Expense ratios reflect operating expenses of the class. Expenses before reductions do not reflect amounts reimbursed, waived, or reduced through arrangements with the investment adviser, brokerage services, or other offset arrangements, if applicable, and do not represent the amount paid by the class during periods when reimbursements, waivers or reductions occur.
I Annualized
J Amount does not include the portfolio activity of any underlying mutual funds or exchange-traded funds (ETFs).
See accompanying notes which are an integral part of the financial statements.
VIP Freedom 2065 Portfolio℠
Investment Summary (Unaudited)
The information in the following tables is based on the direct investments of the Fund.Top Holdings as of June 30, 2022
| % of fund's net assets | |
| VIP Overseas Portfolio Initial Class | 27.4 |
| VIP Emerging Markets Portfolio Initial Class | 15.3 |
| VIP Growth Portfolio Initial Class | 10.4 |
| VIP Growth & Income Portfolio Initial Class | 10.1 |
| VIP Equity-Income Portfolio Initial Class | 8.5 |
| VIP Contrafund Portfolio Initial Class | 8.2 |
| VIP Value Portfolio Initial Class | 6.2 |
| Fidelity Long-Term Treasury Bond Index Fund | 6.1 |
| VIP Value Strategies Portfolio Initial Class | 3.0 |
| VIP Mid Cap Portfolio Initial Class | 2.4 |
| 97.6 |
Asset Allocation (% of fund's net assets)
| Period end | ||
| Domestic Equity Funds | 48.8% | |
| International Equity Funds | 42.7% | |
| Bond Funds | 8.5% | |

VIP Freedom 2065 Portfolio℠
Schedule of Investments June 30, 2022 (Unaudited)
Showing Percentage of Net Assets
| Domestic Equity Funds - 48.8% | |||
| Shares | Value | ||
| VIP Contrafund Portfolio Initial Class (a) | 4,410 | $172,990 | |
| VIP Equity-Income Portfolio Initial Class (a) | 7,627 | 177,933 | |
| VIP Growth & Income Portfolio Initial Class (a) | 9,158 | 210,897 | |
| VIP Growth Portfolio Initial Class (a) | 2,925 | 218,022 | |
| VIP Mid Cap Portfolio Initial Class (a) | 1,621 | 51,433 | |
| VIP Value Portfolio Initial Class (a) | 7,902 | 129,902 | |
| VIP Value Strategies Portfolio Initial Class (a) | 4,448 | 63,469 | |
| TOTAL DOMESTIC EQUITY FUNDS | |||
| (Cost $1,053,044) | 1,024,646 | ||
| International Equity Funds - 42.7% | |||
| VIP Emerging Markets Portfolio Initial Class (a) | 31,843 | 320,339 | |
| VIP Overseas Portfolio Initial Class (a) | 27,568 | 574,515 | |
| TOTAL INTERNATIONAL EQUITY FUNDS | |||
| (Cost $1,062,651) | 894,854 | ||
| Bond Funds - 8.5% | |||
| Fidelity Inflation-Protected Bond Index Fund (a) | 3,322 | 33,722 | |
| Fidelity International Bond Index Fund (a) | 1,285 | 11,696 | |
| Fidelity Long-Term Treasury Bond Index Fund (a) | 11,077 | 127,714 | |
| VIP High Income Portfolio Initial Class (a) | 1,256 | 5,678 | |
| TOTAL BOND FUNDS | |||
| (Cost $198,630) | 178,810 | ||
| TOTAL INVESTMENT IN SECURITIES - 100.0% | |||
| (Cost $2,314,325) | 2,098,310 | ||
| NET OTHER ASSETS (LIABILITIES) - 0.0% | (187) | ||
| NET ASSETS - 100% | $2,098,123 |
Legend
(a) Affiliated Fund
Affiliated Underlying Funds
Fiscal year to date information regarding the Fund's investments in affiliated Underlying Funds is presented below. Exchanges between classes of the same affiliated Underlying Funds may occur, and are excluded from purchases and sales below if applicable. If an underlying Fund changes its name, the name presented below is the name in effect at period end.
| Affiliate | Value, beginning of period | Purchases(a) | Sales Proceeds(a) | Dividend Income | Realized Gain (loss) | Change in Unrealized appreciation (depreciation) | Value, end of period |
| Fidelity Inflation-Protected Bond Index Fund | $45,569 | $11,582 | $19,984 | $-- | $(787) | $(2,658) | $33,722 |
| Fidelity International Bond Index Fund | 11,340 | 8,045 | 6,606 | 17 | (324) | (759) | 11,696 |
| Fidelity Long-Term Treasury Bond Index Fund | 85,861 | 86,008 | 21,495 | 1,124 | (2,218) | (20,442) | 127,714 |
| VIP Contrafund Portfolio Initial Class | 194,870 | 64,166 | 26,234 | 1,845 | (2,886) | (56,926) | 172,990 |
| VIP Emerging Markets Portfolio Initial Class | 340,266 | 119,877 | 68,175 | -- | (5,595) | (66,034) | 320,339 |
| VIP Equity-Income Portfolio Initial Class | 206,114 | 48,722 | 54,655 | 259 | (2,182) | (20,066) | 177,933 |
| VIP Growth & Income Portfolio Initial Class | 234,638 | 62,307 | 57,838 | 448 | (1,384) | (26,826) | 210,897 |
| VIP Growth Portfolio Initial Class | 199,303 | 113,055 | 32,338 | 9,422 | (4,707) | (57,291) | 218,022 |
| VIP High Income Portfolio Initial Class | 33,983 | 10,600 | 35,855 | 13 | (3,099) | 49 | 5,678 |
| VIP Investment Grade Bond Portfolio II Initial Class | -- | 13,344 | 13,340 | -- | (4) | -- | -- |
| VIP Investment Grade Bond Portfolio Initial Class | 21,600 | 14,151 | 33,839 | 685 | (1,801) | (111) | -- |
| VIP Mid Cap Portfolio Initial Class | 57,166 | 17,323 | 8,901 | 1,312 | (905) | (13,250) | 51,433 |
| VIP Overseas Portfolio Initial Class | 609,706 | 241,729 | 75,302 | 4,701 | (6,471) | (195,147) | 574,515 |
| VIP Value Portfolio Initial Class | 151,115 | 36,558 | 42,903 | 1,953 | (2,222) | (12,646) | 129,902 |
| VIP Value Strategies Portfolio Initial Class | 74,025 | 16,995 | 17,996 | 625 | (689) | (8,866) | 63,469 |
| $2,265,556 | $864,462 | $515,461 | $22,404 | $(35,274) | $(480,973) | $2,098,310 |
(a) Includes the value of shares purchased or redeemed through in-kind transactions, as applicable.
Amounts in the income column in the above table include any capital gain distributions from underlying funds, which are presented in the corresponding line-item in the Statement of Operations, if applicable.
Investment Valuation
The following is a summary of the inputs used, as of June 30, 2022, involving the Fund's assets and liabilities carried at fair value. The inputs or methodology used for valuing securities may not be an indication of the risk associated with investing in those securities. For more information on valuation inputs, and their aggregation into the levels used below, please refer to the Investment Valuation section in the accompanying Notes to Financial Statements.
| Valuation Inputs at Reporting Date: | ||||
| Description | Total | Level 1 | Level 2 | Level 3 |
| Investments in Securities: | ||||
| Domestic Equity Funds | $1,024,646 | $1,024,646 | $-- | $-- |
| International Equity Funds | 894,854 | 894,854 | -- | -- |
| Bond Funds | 178,810 | 178,810 | -- | -- |
| Total Investments in Securities: | $2,098,310 | $2,098,310 | $-- | $-- |
See accompanying notes which are an integral part of the financial statements.
VIP Freedom 2065 Portfolio℠
Financial Statements
Statement of Assets and Liabilities
| June 30, 2022 (Unaudited) | ||
| Assets | ||
| Investment in securities, at value — See accompanying schedule: | ||
| Affiliated issuers (cost $2,314,325) | $2,098,310 | |
| Total Investment in Securities (cost $2,314,325) | $2,098,310 | |
| Cash | 12 | |
| Receivable for investments sold | 12,635 | |
| Receivable for fund shares sold | 202 | |
| Total assets | 2,111,159 | |
| Liabilities | ||
| Payable for investments purchased | $10,126 | |
| Payable for fund shares redeemed | 2,706 | |
| Distribution and service plan fees payable | 204 | |
| Total liabilities | 13,036 | |
| Net Assets | $2,098,123 | |
| Net Assets consist of: | ||
| Paid in capital | $2,337,312 | |
| Total accumulated earnings (loss) | (239,189) | |
| Net Assets | $2,098,123 | |
| Net Asset Value and Maximum Offering Price | ||
| Initial Class: | ||
| Net Asset Value, offering price and redemption price per share ($415,455 ÷ 39,353 shares) | $10.56 | |
| Service Class: | ||
| Net Asset Value, offering price and redemption price per share ($1,184,972 ÷ 112,397 shares) | $10.54 | |
| Service Class 2: | ||
| Net Asset Value, offering price and redemption price per share ($497,696 ÷ 47,257 shares) | $10.53 |
See accompanying notes which are an integral part of the financial statements.
Statement of Operations
| Six months ended June 30, 2022 (Unaudited) | ||
| Investment Income | ||
| Dividends: | ||
| Affiliated issuers | $1,844 | |
| Expenses | ||
| Distribution and service plan fees | $1,276 | |
| Independent trustees' fees and expenses | 3 | |
| Total expenses | 1,279 | |
| Net investment income (loss) | 565 | |
| Realized and Unrealized Gain (Loss) | ||
| Net realized gain (loss) on: | ||
| Investment securities: | ||
| Affiliated issuers | (35,274) | |
| Capital gain distributions from underlying funds: | ||
| Affiliated issuers | 20,560 | |
| Total net realized gain (loss) | (14,714) | |
| Change in net unrealized appreciation (depreciation) on: | ||
| Investment securities: | ||
| Affiliated issuers | (480,973) | |
| Total change in net unrealized appreciation (depreciation) | (480,973) | |
| Net gain (loss) | (495,687) | |
| Net increase (decrease) in net assets resulting from operations | $(495,122) |
See accompanying notes which are an integral part of the financial statements.
Statement of Changes in Net Assets
| Six months ended June 30, 2022 (Unaudited) | Year ended December 31, 2021 | |
| Increase (Decrease) in Net Assets | ||
| Operations | ||
| Net investment income (loss) | $565 | $26,701 |
| Net realized gain (loss) | (14,714) | 185,193 |
| Change in net unrealized appreciation (depreciation) | (480,973) | 19,247 |
| Net increase (decrease) in net assets resulting from operations | (495,122) | 231,141 |
| Distributions to shareholders | (108,699) | (116,286) |
| Share transactions - net increase (decrease) | 436,591 | 860,127 |
| Total increase (decrease) in net assets | (167,230) | 974,982 |
| Net Assets | ||
| Beginning of period | 2,265,353 | 1,290,371 |
| End of period | $2,098,123 | $2,265,353 |
See accompanying notes which are an integral part of the financial statements.
Financial Highlights
VIP Freedom 2065 Portfolio Initial Class
| Six months ended (Unaudited) June 30, | Years endedDecember 31, | |||
| 2022 | 2021 | 2020 | 2019 A | |
| Selected Per–Share Data | ||||
| Net asset value, beginning of period | $13.92 | $12.47 | $10.96 | $10.00 |
| Income from Investment Operations | ||||
| Net investment income (loss)B,C | .01 | .25 | .12 | .15 |
| Net realized and unrealized gain (loss) | (2.72) | 1.96 | 1.99 | 1.03 |
| Total from investment operations | (2.71) | 2.21 | 2.11 | 1.18 |
| Distributions from net investment income | – | (.18) | (.11) | (.15) |
| Distributions from net realized gain | (.65) | (.58) | (.49) | (.07) |
| Total distributions | (.65) | (.76) | (.60) | (.22) |
| Net asset value, end of period | $10.56 | $13.92 | $12.47 | $10.96 |
| Total ReturnD,E | (20.27)% | 17.81% | 19.35% | 11.79% |
| Ratios to Average Net AssetsC,F,G | ||||
| Expenses before reductionsH | - %I | -% | -% | - %I |
| Expenses net of fee waivers, if anyH | - %I | -% | -% | - %I |
| Expenses net of all reductionsH | - %I | -% | -% | - %I |
| Net investment income (loss) | .17%I | 1.82% | 1.07% | 2.01%I |
| Supplemental Data | ||||
| Net assets, end of period (000 omitted) | $415 | $482 | $416 | $365 |
| Portfolio turnover rateJ | 47%I | 24% | 34% | 24%I |
A For the period April 11, 2019 (commencement of operations) through December 31, 2019.
B Calculated based on average shares outstanding during the period.
C Net investment income (loss) is affected by the timing of the declaration of dividends by any underlying mutual funds or exchange-traded funds (ETFs). Net investment income (loss) of any such underlying funds is not included in the Fund's net investment income (loss) ratio.
D Total returns for periods of less than one year are not annualized.
E Total returns do not reflect charges attributable to your insurance company's separate account. Inclusion of these charges would reduce the total returns shown.
F Fees and expenses of any underlying mutual funds or exchange-traded funds (ETFs) are not included in the Fund's expense ratio. The Fund indirectly bears its proportionate share of these expenses.
G Expense ratios reflect operating expenses of the class. Expenses before reductions do not reflect amounts reimbursed, waived, or reduced through arrangements with the investment adviser, brokerage services, or other offset arrangements, if applicable, and do not represent the amount paid by the class during periods when reimbursements, waivers or reductions occur.
H Amount represents less than .005%.
I Annualized
J Amount does not include the portfolio activity of any underlying mutual funds or exchange-traded funds (ETFs).
See accompanying notes which are an integral part of the financial statements.
VIP Freedom 2065 Portfolio Service Class
| Six months ended (Unaudited) June 30, | Years endedDecember 31, | |||
| 2022 | 2021 | 2020 | 2019 A | |
| Selected Per–Share Data | ||||
| Net asset value, beginning of period | $13.91 | $12.46 | $10.96 | $10.00 |
| Income from Investment Operations | ||||
| Net investment income (loss)B,C | –D | .24 | .11 | .14 |
| Net realized and unrealized gain (loss) | (2.72) | 1.97 | 1.98 | 1.03 |
| Total from investment operations | (2.72) | 2.21 | 2.09 | 1.17 |
| Distributions from net investment income | – | (.17) | (.10) | (.14) |
| Distributions from net realized gain | (.65) | (.58) | (.49) | (.07) |
| Total distributions | (.65) | (.76)E | (.59) | (.21) |
| Net asset value, end of period | $10.54 | $13.91 | $12.46 | $10.96 |
| Total ReturnF,G | (20.36)% | 17.77% | 19.16% | 11.72% |
| Ratios to Average Net AssetsC,H,I | ||||
| Expenses before reductions | .10%J | .10% | .10% | .10%J |
| Expenses net of fee waivers, if any | .10%J | .10% | .10% | .10%J |
| Expenses net of all reductions | .10%J | .10% | .10% | .10%J |
| Net investment income (loss) | .07%J | 1.72% | .97% | 1.91%J |
| Supplemental Data | ||||
| Net assets, end of period (000 omitted) | $1,185 | $1,224 | $416 | $365 |
| Portfolio turnover rateK | 47%J | 24% | 34% | 24%J |
A For the period April 11, 2019 (commencement of operations) through December 31, 2019.
B Calculated based on average shares outstanding during the period.
C Net investment income (loss) is affected by the timing of the declaration of dividends by any underlying mutual funds or exchange-traded funds (ETFs). Net investment income (loss) of any such underlying funds is not included in the Fund's net investment income (loss) ratio.
D Amount represents less than $.005 per share.
E Total distributions per share do not sum due to rounding.
F Total returns for periods of less than one year are not annualized.
G Total returns do not reflect charges attributable to your insurance company's separate account. Inclusion of these charges would reduce the total returns shown.
H Fees and expenses of any underlying mutual funds or exchange-traded funds (ETFs) are not included in the Fund's expense ratio. The Fund indirectly bears its proportionate share of these expenses.
I Expense ratios reflect operating expenses of the class. Expenses before reductions do not reflect amounts reimbursed, waived, or reduced through arrangements with the investment adviser, brokerage services, or other offset arrangements, if applicable, and do not represent the amount paid by the class during periods when reimbursements, waivers or reductions occur.
J Annualized
K Amount does not include the portfolio activity of any underlying mutual funds or exchange-traded funds (ETFs).
See accompanying notes which are an integral part of the financial statements.
VIP Freedom 2065 Portfolio Service Class 2
| Six months ended (Unaudited) June 30, | Years endedDecember 31, | |||
| 2022 | 2021 | 2020 | 2019 A | |
| Selected Per–Share Data | ||||
| Net asset value, beginning of period | $13.90 | $12.46 | $10.96 | $10.00 |
| Income from Investment Operations | ||||
| Net investment income (loss)B,C | –D | .22 | .09 | .13 |
| Net realized and unrealized gain (loss) | (2.72) | 1.95 | 1.99 | 1.03 |
| Total from investment operations | (2.72) | 2.17 | 2.08 | 1.16 |
| Distributions from net investment income | – | (.15) | (.09) | (.13) |
| Distributions from net realized gain | (.65) | (.58) | (.49) | (.07) |
| Total distributions | (.65) | (.73) | (.58) | (.20) |
| Net asset value, end of period | $10.53 | $13.90 | $12.46 | $10.96 |
| Total ReturnE,F | (20.37)% | 17.47% | 19.03% | 11.61% |
| Ratios to Average Net AssetsC,G,H | ||||
| Expenses before reductions | .25%I | .25% | .25% | .25%I |
| Expenses net of fee waivers, if any | .25%I | .25% | .25% | .25%I |
| Expenses net of all reductions | .25%I | .25% | .25% | .25%I |
| Net investment income (loss) | (.08)%I | 1.57% | .82% | 1.76%I |
| Supplemental Data | ||||
| Net assets, end of period (000 omitted) | $498 | $559 | $459 | $365 |
| Portfolio turnover rateJ | 47%I | 24% | 34% | 24%I |
A For the period April 11, 2019 (commencement of operations) through December 31, 2019.
B Calculated based on average shares outstanding during the period.
C Net investment income (loss) is affected by the timing of the declaration of dividends by any underlying mutual funds or exchange-traded funds (ETFs). Net investment income (loss) of any such underlying funds is not included in the Fund's net investment income (loss) ratio.
D Amount represents less than $.005 per share.
E Total returns for periods of less than one year are not annualized.
F Total returns do not reflect charges attributable to your insurance company's separate account. Inclusion of these charges would reduce the total returns shown.
G Fees and expenses of any underlying mutual funds or exchange-traded funds (ETFs) are not included in the Fund's expense ratio. The Fund indirectly bears its proportionate share of these expenses.
H Expense ratios reflect operating expenses of the class. Expenses before reductions do not reflect amounts reimbursed, waived, or reduced through arrangements with the investment adviser, brokerage services, or other offset arrangements, if applicable, and do not represent the amount paid by the class during periods when reimbursements, waivers or reductions occur.
I Annualized
J Amount does not include the portfolio activity of any underlying mutual funds or exchange-traded funds (ETFs).
See accompanying notes which are an integral part of the financial statements.
Notes to Financial Statements (Unaudited)
For the period ended June 30, 2022
1. Organization.
VIP Freedom Income Portfolio, VIP Freedom 2005 Portfolio, VIP Freedom 2010 Portfolio, VIP Freedom 2015 Portfolio, VIP Freedom 2020 Portfolio, VIP Freedom 2025 Portfolio, VIP Freedom 2030 Portfolio, VIP Freedom 2035 Portfolio, VIP Freedom 2040 Portfolio, VIP Freedom 2045 Portfolio, VIP Freedom 2050 Portfolio, VIP Freedom 2055 Portfolio, VIP Freedom 2060 Portfolio and VIP Freedom 2065 Portfolio (the Funds) are funds of Variable Insurance Products Fund V (the Trust). The Trust is registered under the Investment Company Act of 1940, as amended (the 1940 Act), as an open-end management investment company organized as a Massachusetts business trust. Each Fund is authorized to issue an unlimited number of shares. Shares of each Fund may only be purchased by insurance companies for the purpose of funding variable annuity or variable life insurance contracts. Each Fund offers three classes of shares: Initial Class shares, Service Class shares, and Service Class 2 shares. All classes have equal rights and voting privileges, except for matters affecting a single class.
2. Investments in Fidelity Central Funds.
Funds may invest in Fidelity Central Funds, which are open-end investment companies generally available only to other investment companies and accounts managed by the investment adviser and its affiliates. The Schedule of Investments lists any Fidelity Central Funds held as an investment as of period end, but does not include the underlying holdings of each Fidelity Central Fund. An investing fund indirectly bears its proportionate share of the expenses of the underlying Fidelity Central Funds.
Based on its investment objective, each Fidelity Central Fund may invest or participate in various investment vehicles or strategies that are similar to those of the investing fund. These strategies are consistent with the investment objectives of the investing fund and may involve certain economic risks which may cause a decline in value of each of the Fidelity Central Funds and thus a decline in the value of the investing fund.
| Fidelity Central Fund | Investment Manager | Investment Objective | Investment Practices | Expense Ratio(a) |
| Fidelity Money Market Central Funds | Fidelity Management & Research Company LLC (FMR) | Each fund seeks to obtain a high level of current income consistent with the preservation of capital and liquidity. | Short-term Investments | Less than .005% |
(a) Expenses expressed as a percentage of average net assets and are as of each underlying Central Fund's most recent annual or semi-annual shareholder report.
A complete unaudited list of holdings for each Fidelity Central Fund is available upon request or at the Securities and Exchange Commission website at www.sec.gov. In addition, the financial statements of the Fidelity Central Funds which contain the significant accounting policies (including investment valuation policies) of those funds, and are not covered by the Report of Independent Registered Public Accounting Firm, are available on the Securities and Exchange Commission website or upon request.
3. Significant Accounting Policies.
Each Fund is an investment company and applies the accounting and reporting guidance of the Financial Accounting Standards Board (FASB) Accounting Standards Codification Topic 946 Financial Services - Investment Companies. The financial statements have been prepared in conformity with accounting principles generally accepted in the United States of America (GAAP), which require management to make certain estimates and assumptions at the date of the financial statements. Actual results could differ from those estimates. Subsequent events, if any, through the date that the financial statements were issued have been evaluated in the preparation of the financial statements. Each Fund's Schedule of Investments lists any underlying mutual funds or exchange-traded funds (ETFs) but does not include the underlying holdings of these funds. The following summarizes the significant accounting policies of each Fund:
Investment Valuation. Investments are valued as of 4:00 p.m. Eastern time on the last calendar day of the period. Each Fund categorizes the inputs to valuation techniques used to value its investments into a disclosure hierarchy consisting of three levels as shown below:
- Level 1 – unadjusted quoted prices in active markets for identical investments
- Level 2 – other significant observable inputs (including quoted prices for similar investments, interest rates, prepayment speeds, etc.)
- Level 3 – unobservable inputs (including the Fund's own assumptions based on the best information available)
Valuation techniques used to value each Fund's investments by major category are as follows. Investments in open-end mutual funds are valued at their closing net asset value (NAV) each business day and are categorized as Level 1 in the hierarchy. The aggregate value of investments by input level as of June 30, 2022 is included at the end of each Fund's Schedule of Investments.
Investment Transactions and Income. For financial reporting purposes, the Funds' investment holdings and NAV include trades executed through the end of the last business day of the period. The NAV per share for processing shareholder transactions is calculated as of the close of business of the New York Stock Exchange (NYSE), normally 4:00 p.m. Eastern time and includes trades executed through the end of the prior business day. Gains and losses on securities sold are determined on the basis of identified cost. Income and capital gain distributions from any underlying mutual funds or exchange-traded funds (ETFs) are recorded on the ex-dividend date.
Class Allocations and Expenses. Investment income, realized and unrealized capital gains and losses, common expenses of a fund, and certain fund-level expense reductions, if any, are allocated daily on a pro-rata basis to each class based on the relative net assets of each class to the total net assets of a fund. Each class differs with respect to transfer agent and distribution and service plan fees incurred, as applicable. Certain expense reductions may also differ by class, if applicable. For the reporting period, the allocated portion of income and expenses to each class as a percent of its average net assets may vary due to the timing of recording these transactions in relation to fluctuating net assets of the classes. Expenses directly attributable to a fund are charged to that fund. Expenses attributable to more than one fund are allocated among the respective funds on the basis of relative net assets or other appropriate methods. Expenses included in the accompanying financial statements reflect the expenses of that fund and do not include any expenses associated with any underlying mutual funds or exchange-traded funds. Although not included in a fund's expenses, a fund indirectly bears its proportionate share of these expenses through the net asset value of each underlying mutual fund or exchange-traded fund. Expense estimates are accrued in the period to which they relate and adjustments are made when actual amounts are known.
Income Tax Information and Distributions to Shareholders. Each year, each Fund intends to qualify as a regulated investment company under Subchapter M of the Internal Revenue Code, including distributing substantially all of its taxable income and realized gains. As a result, no provision for U.S. Federal income taxes is required. Each Fund files a U.S. federal tax return, in addition to state and local tax returns as required. Each Fund's federal income tax returns are subject to examination by the Internal Revenue Service (IRS) for a period of three fiscal years after they are filed. State and local tax returns may be subject to examination for an additional fiscal year depending on the jurisdiction.
Distributions are declared and recorded on the ex-dividend date. Income and capital gain distributions are declared separately for each class. Income and capital gain distributions are determined in accordance with income tax regulations, which may differ from GAAP.
Capital accounts within the financial statements are adjusted for permanent book-tax differences. These adjustments have no impact on net assets or the results of operations. Capital accounts are not adjusted for temporary book-tax differences which will reverse in a subsequent period.
Book-tax differences are primarily due to the short-term gain distributions from the underlying mutual funds or exchange-traded funds (ETFs) and losses deferred due to wash sales.
As of period end, the cost and unrealized appreciation (depreciation) in securities, and derivatives if applicable, for federal income tax purposes were as follows for each Fund:
| Tax cost | Gross unrealized appreciation | Gross unrealized depreciation | Net unrealized appreciation (depreciation) | |
| VIP Freedom Income Portfolio | $64,323,779 | $2,101,287 | $(2,188,387) | $(87,100) |
| VIP Freedom 2005 Portfolio | 10,832,699 | 478,934 | (319,321) | 159,613 |
| VIP Freedom 2010 Portfolio | 313,873,827 | 7,568,528 | (17,684,211) | (10,115,683) |
| VIP Freedom 2015 Portfolio | 62,534,775 | 11,105,633 | (2,169,702) | 8,935,931 |
| VIP Freedom 2020 Portfolio | 518,573,431 | 96,835,172 | (18,708,576) | 78,126,596 |
| VIP Freedom 2025 Portfolio | 312,478,418 | 30,561,581 | (19,088,319) | 11,473,262 |
| VIP Freedom 2030 Portfolio | 543,884,026 | 64,779,930 | (35,755,389) | 29,024,541 |
| VIP Freedom 2035 Portfolio | 203,963,453 | 10,696,207 | (17,944,899) | (7,248,692) |
| VIP Freedom 2040 Portfolio | 185,782,516 | 14,202,893 | (17,389,876) | (3,186,983) |
| VIP Freedom 2045 Portfolio | 99,460,651 | 5,854,494 | (9,266,522) | (3,412,028) |
| VIP Freedom 2050 Portfolio | 89,765,388 | 5,192,794 | (9,296,367) | (4,103,573) |
| VIP Freedom 2055 Portfolio | 6,580,275 | 139,142 | (931,230) | (792,088) |
| VIP Freedom 2060 Portfolio | 9,471,655 | 222,524 | (1,251,202) | (1,028,678) |
| VIP Freedom 2065 Portfolio | 2,346,279 | 71,454 | (319,423) | (247,969) |
Due to large subscriptions in a prior period, VIP Freedom 2060 Portfolio is subject to an annual limit on its use of some of its unrealized capital losses to offset capital gains in future periods. If those capital losses are realized and the limitation prevents the Fund from using any of those capital losses in a future period, those capital losses will be available to offset capital gains in subsequent periods.
4. Purchases and Sales of Investments.
Purchases and sales of securities, other than short-term securities and in-kind transactions, as applicable, are noted in the table below.
| Purchases ($) | Sales ($) | |
| VIP Freedom Income Portfolio | 45,286,059 | 49,693,926 |
| VIP Freedom 2005 Portfolio | 6,874,655 | 8,246,689 |
| VIP Freedom 2010 Portfolio | 692,772,677 | 707,143,405 |
| VIP Freedom 2015 Portfolio | 42,694,083 | 48,364,306 |
| VIP Freedom 2020 Portfolio | 665,276,321 | 698,113,146 |
| VIP Freedom 2025 Portfolio | 192,487,278 | 187,033,612 |
| VIP Freedom 2030 Portfolio | 394,276,688 | 365,252,701 |
| VIP Freedom 2035 Portfolio | 95,843,761 | 65,065,982 |
| VIP Freedom 2040 Portfolio | 63,657,189 | 41,264,335 |
| VIP Freedom 2045 Portfolio | 33,444,761 | 20,599,970 |
| VIP Freedom 2050 Portfolio | 28,529,564 | 18,126,461 |
| VIP Freedom 2055 Portfolio | 2,994,090 | 1,573,434 |
| VIP Freedom 2060 Portfolio | 3,807,295 | 2,213,359 |
| VIP Freedom 2065 Portfolio | 864,462 | 515,461 |
5. Fees and Other Transactions with Affiliates.
Management Fee. Fidelity Management & Research Company LLC (the investment adviser), provides the Funds with investment management related services. The Funds do not pay any fees for these services.
Distribution and Service Plan Fees. In accordance with Rule 12b-1 of the 1940 Act, the Funds have adopted separate 12b-1 Plans for each Service Class of shares. Each Service Class pays Fidelity Distributors Company LLC (FDC), an affiliate of the investment adviser, a service fee. For the period, the service fee is based on an annual rate of .10% of Service Class' average net assets and .25% of Service Class 2's average net assets.
For the period, total fees, all of which were reallowed to insurance companies for the distribution of shares and providing shareholder support services were as follows:
| Service Class | Service Class 2 | Total | |
| VIP Freedom Income Portfolio | $13,681 | $31,961 | $45,642 |
| VIP Freedom 2005 Portfolio | 1,693 | 238 | 1,931 |
| VIP Freedom 2010 Portfolio | 12,794 | 369,685 | 382,479 |
| VIP Freedom 2015 Portfolio | 9,897 | 40,061 | 49,958 |
| VIP Freedom 2020 Portfolio | 75,446 | 563,313 | 638,759 |
| VIP Freedom 2025 Portfolio | 90,043 | 146,989 | 237,032 |
| VIP Freedom 2030 Portfolio | 138,847 | 273,162 | 412,009 |
| VIP Freedom 2035 Portfolio | 44,559 | 128,153 | 172,712 |
| VIP Freedom 2040 Portfolio | 58,057 | 46,623 | 104,680 |
| VIP Freedom 2045 Portfolio | 11,324 | 91,535 | 102,859 |
| VIP Freedom 2050 Portfolio | 14,745 | 55,715 | 70,460 |
| VIP Freedom 2055 Portfolio | 1,244 | 3,312 | 4,556 |
| VIP Freedom 2060 Portfolio | 3,066 | 2,798 | 5,864 |
| VIP Freedom 2065 Portfolio | 594 | 682 | 1,276 |
Interfund Trades. Funds may purchase from or sell securities to other Fidelity Funds under procedures adopted by the Board. The procedures have been designed to ensure these interfund trades are executed in accordance with Rule 17a-7 of the 1940 Act. Any interfund trades are included within the respective purchases and sales amounts shown in the Purchases and Sales of Investments note. During the period, there were no interfund trades.
Reallocation of Underlying Fund Investments. During the period, the investment adviser reallocated investments of the Funds. This involved taxable redemptions of the Funds' interest in VIP Investment Grade Bond Portfolio Initial Class, ("Underlying Fund") for investments and cash and non-taxable exchanges of those investments and cash for shares of VIP Investment Grade Bond Portfolio II Initial Class which is affiliated investment company managed by FMR. Net realized gain (loss) on the redemptions of the Underlying Fund in connection with the reallocation is included in the accompanying Statements of Operations as "Net realized gain (loss) on Affiliated issuers."
Details of these transactions with the net related gain (loss) for the Funds are presented in the accompanying table:
| Value of Investments and Cash reallocated ($) | Net realized Gain (Loss) on redemptions of Underlying Fund ($) | |
| VIP Freedom Income Portfolio | 24,063,653 | (2,225,116) |
| VIP Freedom 2005 Portfolio | 4,228,828 | (340,290) |
| VIP Freedom 2010 Portfolio | 105,753,642 | 7,009 |
| VIP Freedom 2015 Portfolio | 22,630,876 | (1,609,011) |
| VIP Freedom 2020 Portfolio | 172,263,520 | (4,804,929) |
| VIP Freedom 2025 Portfolio | 83,934,925 | (10,205,652) |
| VIP Freedom 2030 Portfolio | 132,331,625 | (12,266,991) |
| VIP Freedom 2035 Portfolio | 24,445,585 | (3,282,347) |
| VIP Freedom 2040 Portfolio | 2,452,480 | (203,764) |
| VIP Freedom 2045 Portfolio | 396,953 | (14,383) |
| VIP Freedom 2050 Portfolio | 351,354 | (12,600) |
| VIP Freedom 2055 Portfolio | 22,559 | (931) |
| VIP Freedom 2060 Portfolio | 33,969 | (1,241) |
| VIP Freedom 2065 Portfolio | 8,415 | (408) |
6. Expense Reductions.
Through arrangements with each applicable Fund's custodian, credits realized as a result of certain uninvested cash balances were used to reduce each applicable Fund's or class' expenses. All of the applicable expense reductions are noted in the table below.
| Custodian credits | |
| VIP Freedom 2025 Portfolio | $2 |
| VIP Freedom 2030 Portfolio | 2 |
7. Distributions to Shareholders.
Distributions to shareholders of each class were as follows:
| Six months ended June 30, 2022 | Year ended December 31, 2021 |
|
| VIP Freedom Income Portfolio | ||
| Distributions to shareholders | ||
| Initial Class | $707,049 | $520,146 |
| Service Class | 1,193,133 | 1,014,662 |
| Service Class 2 | 1,093,554 | 825,252 |
| Total | $2,993,736 | $2,360,060 |
| VIP Freedom 2005 Portfolio | ||
| Distributions to shareholders | ||
| Initial Class | $617,088 | $365,421 |
| Service Class | 226,810 | 168,577 |
| Service Class 2 | 13,362 | 8,306 |
| Total | $857,260 | $542,304 |
| VIP Freedom 2010 Portfolio | ||
| Distributions to shareholders | ||
| Initial Class | $942,102 | $824,964 |
| Service Class | 1,719,284 | 1,179,118 |
| Service Class 2 | 20,015,408 | 14,031,955 |
| Total | $22,676,794 | $16,036,037 |
| VIP Freedom 2015 Portfolio | ||
| Distributions to shareholders | ||
| Initial Class | $3,113,623 | $1,774,737 |
| Service Class | 1,869,157 | 1,274,657 |
| Service Class 2 | 3,524,005 | 1,861,802 |
| Total | $8,506,785 | $4,911,196 |
| VIP Freedom 2020 Portfolio | ||
| Distributions to shareholders | ||
| Initial Class | $7,634,037 | $5,188,585 |
| Service Class | 15,541,388 | 10,935,604 |
| Service Class 2 | 48,211,612 | 32,293,705 |
| Total | $71,387,037 | $48,417,894 |
| VIP Freedom 2025 Portfolio | ||
| Distributions to shareholders | ||
| Initial Class | $3,716,019 | $2,652,492 |
| Service Class | 11,440,542 | 7,818,315 |
| Service Class 2 | 8,243,286 | 5,384,498 |
| Total | $23,399,847 | $15,855,305 |
| VIP Freedom 2030 Portfolio | ||
| Distributions to shareholders | ||
| Initial Class | $8,977,064 | $6,616,973 |
| Service Class | 18,911,142 | 13,521,497 |
| Service Class 2 | 15,618,147 | 11,039,884 |
| Total | $43,506,353 | $31,178,354 |
| VIP Freedom 2035 Portfolio | ||
| Distributions to shareholders | ||
| Initial Class | $1,271,983 | $711,419 |
| Service Class | 6,044,181 | 3,336,825 |
| Service Class 2 | 7,606,648 | 4,746,921 |
| Total | $14,922,812 | $8,795,165 |
| VIP Freedom 2040 Portfolio | ||
| Distributions to shareholders | ||
| Initial Class | $3,535,943 | $2,057,211 |
| Service Class | 9,107,708 | 5,162,679 |
| Service Class 2 | 3,218,311 | 1,792,120 |
| Total | $15,861,962 | $9,012,010 |
| VIP Freedom 2045 Portfolio | ||
| Distributions to shareholders | ||
| Initial Class | $548,895 | $266,012 |
| Service Class | 1,817,771 | 863,207 |
| Service Class 2 | 6,148,348 | 3,247,832 |
| Total | $8,515,014 | $4,377,051 |
| VIP Freedom 2050 Portfolio | ||
| Distributions to shareholders | ||
| Initial Class | $1,475,214 | $760,959 |
| Service Class | 2,244,684 | 1,215,158 |
| Service Class 2 | 3,612,493 | 1,830,429 |
| Total | $7,332,391 | $3,806,546 |
| VIP Freedom 2055 Portfolio | ||
| Distributions to shareholders | ||
| Initial Class | $23,234 | $22,272 |
| Service Class | 123,978 | 105,576 |
| Service Class 2 | 131,663 | 107,620 |
| Total | $278,875 | $235,468 |
| VIP Freedom 2060 Portfolio | ||
| Distributions to shareholders | ||
| Initial Class | $24,720 | $26,394 |
| Service Class | 310,017 | 291,414 |
| Service Class 2 | 112,588 | 105,301 |
| Total | $447,325 | $423,109 |
| VIP Freedom 2065 Portfolio | ||
| Distributions to shareholders | ||
| Initial Class | $23,799 | $26,253 |
| Service Class | 56,297 | 61,118 |
| Service Class 2 | 28,603 | 28,915 |
| Total | $108,699 | $116,286 |
8. Share Transactions.
Transactions for each class of shares were as follows and may contain in-kind transactions:
| Shares | Shares | Dollars | Dollars | |
| Six months ended June 30, 2022 | Year ended December 31, 2021 | Six months ended June 30, 2022 | Year ended December 31, 2021 | |
| VIP Freedom Income Portfolio | ||||
| Initial Class | ||||
| Shares sold | 126,704 | 358,189 | $1,484,880 | $4,588,127 |
| Reinvestment of distributions | 59,416 | 41,021 | 707,049 | 520,146 |
| Shares redeemed | (168,844) | (388,318) | (1,919,879) | (4,961,909) |
| Net increase (decrease) | 17,276 | 10,892 | $272,050 | $146,364 |
| Service Class | ||||
| Shares sold | 967,363 | 1,600,092 | $11,110,387 | $20,377,343 |
| Reinvestment of distributions | 100,432 | 80,084 | 1,193,133 | 1,014,662 |
| Shares redeemed | (1,236,338) | (1,696,496) | (14,533,952) | (21,622,979) |
| Net increase (decrease) | (168,543) | (16,320) | $(2,230,432) | $(230,974) |
| Service Class 2 | ||||
| Shares sold | 215,095 | 950,903 | $2,471,231 | $12,082,840 |
| Reinvestment of distributions | 92,439 | 65,416 | 1,093,554 | 825,252 |
| Shares redeemed | (378,764) | (939,259) | (4,426,483) | (11,930,017) |
| Net increase (decrease) | (71,230) | 77,060 | $(861,698) | $978,075 |
| VIP Freedom 2005 Portfolio | ||||
| Initial Class | ||||
| Shares sold | 462 | 3,446 | $5,805 | $47,400 |
| Reinvestment of distributions | 49,765 | 26,966 | 617,088 | 365,421 |
| Shares redeemed | (60,774) | (49,308) | (754,938) | (677,936) |
| Net increase (decrease) | (10,547) | (18,896) | $(132,045) | $(265,115) |
| Service Class | ||||
| Shares sold | 79,145 | 130,776 | $1,002,336 | $1,787,955 |
| Reinvestment of distributions | 18,159 | 12,364 | 226,810 | 168,577 |
| Shares redeemed | (148,529) | (260,296) | (1,876,085) | (3,559,968) |
| Net increase (decrease) | (51,225) | (117,156) | $(646,939) | $(1,603,436) |
| Service Class 2 | ||||
| Shares sold | 6,700 | 10,669 | $82,312 | $144,020 |
| Reinvestment of distributions | 1,080 | 615 | 13,362 | 8,306 |
| Shares redeemed | (7,276) | (17,396) | (88,236) | (237,149) |
| Net increase (decrease) | 504 | (6,112) | $7,438 | $(84,823) |
| VIP Freedom 2010 Portfolio | ||||
| Initial Class | ||||
| Shares sold | 37,596 | 179,853 | $481,140 | $2,581,137 |
| Reinvestment of distributions | 71,807 | 58,074 | 942,102 | 824,964 |
| Shares redeemed | (201,288) | (427,107) | (2,704,151) | (6,102,315) |
| Net increase (decrease) | (91,885) | (189,180) | $(1,280,909) | $(2,696,214) |
| Service Class | ||||
| Shares sold | 1,241,752 | 389,588 | $15,536,801 | $5,560,403 |
| Reinvestment of distributions | 131,243 | 83,107 | 1,719,284 | 1,179,118 |
| Shares redeemed | (1,274,555) | (433,308) | (15,701,211) | (6,235,828) |
| Net increase (decrease) | 98,440 | 39,387 | $1,554,874 | $503,693 |
| Service Class 2 | ||||
| Shares sold | 207,636 | 2,756,110 | $2,624,578 | $39,085,291 |
| Reinvestment of distributions | 1,538,463 | 995,668 | 20,015,408 | 14,031,955 |
| Shares redeemed | (1,682,241) | (3,323,054) | (21,188,518) | (47,357,244) |
| Net increase (decrease) | 63,858 | 428,724 | $1,451,468 | $5,760,002 |
| VIP Freedom 2015 Portfolio | ||||
| Initial Class | ||||
| Shares sold | 51,624 | 277,058 | $654,153 | $3,975,397 |
| Reinvestment of distributions | 247,900 | 126,112 | 3,113,623 | 1,774,737 |
| Shares redeemed | (419,952) | (571,619) | (5,105,664) | (8,195,215) |
| Net increase (decrease) | (120,428) | (168,449) | $(1,337,888) | $(2,445,081) |
| Service Class | ||||
| Shares sold | 540,211 | 641,202 | $6,643,222 | $9,110,496 |
| Reinvestment of distributions | 149,294 | 90,966 | 1,869,157 | 1,274,657 |
| Shares redeemed | (391,825) | (1,217,382) | (4,991,677) | (17,291,685) |
| Net increase (decrease) | 297,680 | (485,214) | $3,520,702 | $(6,906,532) |
| Service Class 2 | ||||
| Shares sold | 128,677 | 868,218 | $1,625,919 | $12,305,767 |
| Reinvestment of distributions | 282,599 | 133,189 | 3,524,005 | 1,861,802 |
| Shares redeemed | (495,203) | (1,034,161) | (6,067,793) | (14,655,934) |
| Net increase (decrease) | (83,927) | (32,754) | $(917,869) | $(488,365) |
| VIP Freedom 2020 Portfolio | ||||
| Initial Class | ||||
| Shares sold | 390,873 | 1,430,874 | $5,099,935 | $21,753,158 |
| Reinvestment of distributions | 570,556 | 347,867 | 7,634,037 | 5,188,585 |
| Shares redeemed | (892,706) | (1,762,447) | (11,841,920) | (26,729,953) |
| Net increase (decrease) | 68,723 | 16,294 | $892,052 | $211,790 |
| Service Class | ||||
| Shares sold | 3,046,304 | 2,735,016 | $39,204,877 | $41,162,814 |
| Reinvestment of distributions | 1,165,896 | 736,652 | 15,541,388 | 10,935,604 |
| Shares redeemed | (3,360,202) | (4,499,252) | (43,329,592) | (67,703,468) |
| Net increase (decrease) | 851,998 | (1,027,584) | $11,416,673 | $(15,605,050) |
| Service Class 2 | ||||
| Shares sold | 359,215 | 1,467,186 | $4,732,684 | $22,086,029 |
| Reinvestment of distributions | 3,633,128 | 2,185,191 | 48,211,612 | 32,293,705 |
| Shares redeemed | (3,055,865) | (5,447,540) | (39,117,386) | (82,218,518) |
| Net increase (decrease) | 936,478 | (1,795,163) | $13,826,910 | $(27,838,784) |
| VIP Freedom 2025 Portfolio | ||||
| Initial Class | ||||
| Shares sold | 295,689 | 683,306 | $4,581,831 | $11,859,005 |
| Reinvestment of distributions | 232,251 | 153,765 | 3,716,019 | 2,652,492 |
| Shares redeemed | (460,262) | (789,018) | (6,963,816) | (13,881,934) |
| Net increase (decrease) | 67,678 | 48,053 | $1,334,034 | $629,563 |
| Service Class | ||||
| Shares sold | 3,051,809 | 4,053,650 | $47,067,061 | $70,364,320 |
| Reinvestment of distributions | 717,725 | 453,741 | 11,440,542 | 7,818,315 |
| Shares redeemed | (2,638,272) | (2,098,476) | (42,217,147) | (36,573,439) |
| Net increase (decrease) | 1,131,262 | 2,408,915 | $16,290,456 | $41,609,196 |
| Service Class 2 | ||||
| Shares sold | 729,165 | 1,913,234 | $11,232,508 | $33,251,596 |
| Reinvestment of distributions | 520,409 | 315,106 | 8,243,286 | 5,384,498 |
| Shares redeemed | (931,148) | (1,538,377) | (14,309,509) | (26,778,430) |
| Net increase (decrease) | 318,426 | 689,963 | $5,166,285 | $11,857,664 |
| VIP Freedom 2030 Portfolio | ||||
| Initial Class | ||||
| Shares sold | 861,713 | 1,741,665 | $13,499,196 | $30,689,811 |
| Reinvestment of distributions | 559,319 | 383,653 | 8,977,064 | 6,616,973 |
| Shares redeemed | (751,008) | (1,172,674) | (11,424,566) | (20,626,295) |
| Net increase (decrease) | 670,024 | 952,644 | $11,051,694 | $16,680,489 |
| Service Class | ||||
| Shares sold | 4,529,395 | 5,043,335 | $69,207,183 | $87,778,513 |
| Reinvestment of distributions | 1,181,946 | 786,039 | 18,911,142 | 13,521,497 |
| Shares redeemed | (3,343,412) | (2,759,531) | (50,393,226) | (48,040,103) |
| Net increase (decrease) | 2,367,929 | 3,069,843 | $37,725,099 | $53,259,907 |
| Service Class 2 | ||||
| Shares sold | 1,171,934 | 3,003,042 | $17,956,969 | $52,397,892 |
| Reinvestment of distributions | 980,424 | 644,889 | 15,618,147 | 11,039,884 |
| Shares redeemed | (1,336,212) | (1,594,589) | (20,547,873) | (27,805,345) |
| Net increase (decrease) | 816,146 | 2,053,342 | $13,027,243 | $35,632,431 |
| VIP Freedom 2035 Portfolio | ||||
| Initial Class | ||||
| Shares sold | 112,254 | 157,522 | $3,062,856 | $4,647,283 |
| Reinvestment of distributions | 47,533 | 24,766 | 1,271,983 | 711,419 |
| Shares redeemed | (35,152) | (255,386) | (884,802) | (7,262,497) |
| Net increase (decrease) | 124,635 | (73,098) | $3,450,037 | $(1,903,795) |
| Service Class | ||||
| Shares sold | 1,271,761 | 1,529,539 | $33,179,726 | $43,947,826 |
| Reinvestment of distributions | 226,628 | 116,424 | 6,044,181 | 3,336,825 |
| Shares redeemed | (318,518) | (792,525) | (8,105,145) | (23,072,580) |
| Net increase (decrease) | 1,179,871 | 853,438 | $31,118,762 | $24,212,071 |
| Service Class 2 | ||||
| Shares sold | 479,784 | 1,083,211 | $12,160,923 | $31,352,246 |
| Reinvestment of distributions | 287,043 | 167,006 | 7,606,648 | 4,746,921 |
| Shares redeemed | (452,802) | (661,775) | (11,458,643) | (19,289,036) |
| Net increase (decrease) | 314,025 | 588,442 | $8,308,928 | $16,810,131 |
| VIP Freedom 2040 Portfolio | ||||
| Initial Class | ||||
| Shares sold | 176,644 | 383,881 | $4,360,812 | $10,680,284 |
| Reinvestment of distributions | 138,664 | 74,970 | 3,535,943 | 2,057,211 |
| Shares redeemed | (87,419) | (204,399) | (2,132,623) | (5,735,042) |
| Net increase (decrease) | 227,889 | 254,452 | $5,764,132 | $7,002,453 |
| Service Class | ||||
| Shares sold | 1,225,632 | 1,532,626 | $30,043,433 | $42,423,198 |
| Reinvestment of distributions | 358,148 | 188,520 | 9,107,708 | 5,162,679 |
| Shares redeemed | (455,731) | (899,581) | (11,363,669) | (24,907,500) |
| Net increase (decrease) | 1,128,049 | 821,565 | $27,787,472 | $22,678,377 |
| Service Class 2 | ||||
| Shares sold | 221,690 | 486,777 | $5,319,141 | $13,670,651 |
| Reinvestment of distributions | 127,206 | 65,826 | 3,218,311 | 1,792,120 |
| Shares redeemed | (241,751) | (313,215) | (5,742,748) | (8,716,993) |
| Net increase (decrease) | 107,145 | 239,388 | $2,794,704 | $6,745,778 |
| VIP Freedom 2045 Portfolio | ||||
| Initial Class | ||||
| Shares sold | 65,444 | 72,375 | $1,651,358 | $2,051,727 |
| Reinvestment of distributions | 21,349 | 9,560 | 548,895 | 266,012 |
| Shares redeemed | (17,126) | (50,025) | (431,824) | (1,396,699) |
| Net increase (decrease) | 69,667 | 31,910 | $1,768,429 | $921,040 |
| Service Class | ||||
| Shares sold | 357,794 | 362,971 | $8,814,852 | $10,150,113 |
| Reinvestment of distributions | 70,924 | 31,105 | 1,817,771 | 863,207 |
| Shares redeemed | (158,876) | (145,573) | (3,925,674) | (4,074,959) |
| Net increase (decrease) | 269,842 | 248,503 | $6,706,949 | $6,938,361 |
| Service Class 2 | ||||
| Shares sold | 446,913 | 554,421 | $10,873,822 | $15,570,080 |
| Reinvestment of distributions | 241,301 | 118,258 | 6,148,348 | 3,247,832 |
| Shares redeemed | (213,094) | (412,972) | (5,086,410) | (11,654,472) |
| Net increase (decrease) | 475,120 | 259,707 | $11,935,760 | $7,163,440 |
| VIP Freedom 2050 Portfolio | ||||
| Initial Class | ||||
| Shares sold | 139,554 | 224,467 | $3,173,139 | $5,743,259 |
| Reinvestment of distributions | 63,559 | 30,419 | 1,475,214 | 760,959 |
| Shares redeemed | (88,299) | (111,941) | (1,944,490) | (2,850,566) |
| Net increase (decrease) | 114,814 | 142,945 | $2,703,863 | $3,653,652 |
| Service Class | ||||
| Shares sold | 357,012 | 474,852 | $7,894,425 | $12,033,089 |
| Reinvestment of distributions | 97,005 | 48,761 | 2,244,684 | 1,215,158 |
| Shares redeemed | (155,656) | (296,057) | (3,464,585) | (7,543,563) |
| Net increase (decrease) | 298,361 | 227,556 | $6,674,524 | $5,704,684 |
| Service Class 2 | ||||
| Shares sold | 304,569 | 572,988 | $6,642,374 | $14,512,083 |
| Reinvestment of distributions | 156,860 | 73,786 | 3,612,493 | 1,830,429 |
| Shares redeemed | (129,025) | (252,960) | (2,770,240) | (6,385,800) |
| Net increase (decrease) | 332,404 | 393,814 | $7,484,627 | $9,956,712 |
| VIP Freedom 2055 Portfolio | ||||
| Initial Class | ||||
| Shares sold | 29,592 | 2,606 | $353,518 | $36,840 |
| Reinvestment of distributions | 108 | 70 | 1,401 | 1,006 |
| Shares redeemed | (4,270) | (988) | (48,081) | (14,558) |
| Net increase (decrease) | 25,430 | 1,688 | $306,838 | $23,288 |
| Service Class | ||||
| Shares sold | 97,816 | 141,156 | $1,198,490 | $1,980,170 |
| Reinvestment of distributions | 8,252 | 6,227 | 106,941 | 88,926 |
| Shares redeemed | (53,848) | (33,068) | (669,752) | (471,496) |
| Net increase (decrease) | 52,220 | 114,315 | $635,679 | $1,597,600 |
| Service Class 2 | ||||
| Shares sold | 70,798 | 108,597 | $871,522 | $1,518,650 |
| Reinvestment of distributions | 8,904 | 6,452 | 115,218 | 91,926 |
| Shares redeemed | (22,747) | (21,462) | (282,503) | (308,074) |
| Net increase (decrease) | 56,955 | 93,587 | $704,237 | $1,302,502 |
| VIP Freedom 2060 Portfolio | ||||
| Initial Class | ||||
| Shares sold | 1,258 | 3,378 | $14,630 | $48,051 |
| Reinvestment of distributions | 188 | 168 | 2,420 | 2,394 |
| Shares redeemed | (22) | (30) | (265) | (436) |
| Net increase (decrease) | 1,424 | 3,516 | $16,785 | $50,009 |
| Service Class | ||||
| Shares sold | 163,691 | 302,250 | $2,012,039 | $4,222,893 |
| Reinvestment of distributions | 23,331 | 19,756 | 300,034 | 280,665 |
| Shares redeemed | (81,142) | (169,112) | (991,610) | (2,388,594) |
| Net increase (decrease) | 105,880 | 152,894 | $1,320,463 | $2,114,964 |
| Service Class 2 | ||||
| Shares sold | 57,248 | 81,341 | $690,784 | $1,138,823 |
| Reinvestment of distributions | 7,392 | 6,128 | 94,913 | 86,950 |
| Shares redeemed | (13,368) | (20,128) | (165,461) | (291,396) |
| Net increase (decrease) | 51,272 | 67,341 | $620,236 | $934,377 |
| VIP Freedom 2065 Portfolio | ||||
| Initial Class | ||||
| Shares sold | 4,583 | 1,230 | $58,357 | $16,991 |
| Reinvestment of distributions | 182 | 61 | 2,299 | 853 |
| Shares redeemed | (30) | (7) | (346) | (96) |
| Net increase (decrease) | 4,735 | 1,284 | $60,310 | $17,748 |
| Service Class | ||||
| Shares sold | 34,719 | 52,267 | $411,687 | $762,467 |
| Reinvestment of distributions | 2,755 | 2,578 | 34,797 | 35,951 |
| Shares redeemed | (13,111) | (145) | (161,198) | (2,084) |
| Net increase (decrease) | 24,363 | 54,700 | $285,286 | $796,334 |
| Service Class 2 | ||||
| Shares sold | 6,592 | 3,363 | $85,345 | $45,834 |
| Reinvestment of distributions | 563 | 332 | 7,103 | 4,616 |
| Shares redeemed | (131) | (325) | (1,453) | (4,405) |
| Net increase (decrease) | 7,024 | 3,370 | $90,995 | $46,045 |
9. Other.
A fund's organizational documents provide former and current trustees and officers with a limited indemnification against liabilities arising in connection with the performance of their duties to the fund. In the normal course of business, a fund may also enter into contracts that provide general indemnifications. A fund's maximum exposure under these arrangements is unknown as this would be dependent on future claims that may be made against a fund. The risk of material loss from such claims is considered remote.
Funds do not invest in underlying mutual funds for the purpose of exercising management or control; however, investments by funds within their principal investment strategies may represent a significant portion of the underlying mutual fund's net assets. At the end of the period, certain Funds were the owners of record of 10% or more of the total outstanding shares of the following underlying mutual funds as shown below.
| Fund | Affiliated % | Number of Unaffiliated Shareholders | Unaffiliated Shareholders % |
| VIP Freedom Income Portfolio | 16% | 3 | 53% |
| VIP Freedom 2005 Portfolio | 72% | 1 | 18% |
| VIP Freedom 2010 Portfolio | – | 1 | 88% |
| VIP Freedom 2015 Portfolio | 26% | 2 | 33% |
| VIP Freedom 2020 Portfolio | – | 1 | 69% |
| VIP Freedom 2025 Portfolio | – | 2 | 47% |
| VIP Freedom 2030 Portfolio | – | 1 | 45% |
| VIP Freedom 2035 Portfolio | – | 5 | 81% |
| VIP Freedom 2040 Portfolio | – | 2 | 54% |
| VIP Freedom 2045 Portfolio | – | 4 | 75% |
| VIP Freedom 2050 Portfolio | – | 4 | 74% |
| VIP Freedom 2055 Portfolio | 12% | 3 | 82% |
| VIP Freedom 2060 Portfolio | – | 2 | 86% |
| VIP Freedom 2065 Portfolio | 48% | 1 | 39% |
The Funds, in aggregate, were the owners of record of more than 20% of the total outstanding shares of the following underlying mutual funds.
| Fund | % of shares held |
| VIP Emerging Markets Portfolio | 26% |
| VIP Overseas Portfolio | 29% |
10. Coronavirus (COVID-19) Pandemic.
An outbreak of COVID-19 first detected in China during December 2019 has since spread globally and was declared a pandemic by the World Health Organization during March 2020. Developments that disrupt global economies and financial markets, such as the COVID-19 pandemic, may magnify factors that affect the Funds' performance.
Shareholder Expense Example
As a shareholder, you incur two types of costs: (1) transaction costs, which may include sales charges (loads) on purchase payments or redemption proceeds, as applicable and (2) ongoing costs, which generally include management fees, distribution and/or service (12b-1) fees and other Fund expenses. This Example is intended to help you understand your ongoing costs (in dollars) of investing in a fund and to compare these costs with the ongoing costs of investing in other mutual funds.
The Example is based on an investment of $1,000 invested at the beginning of the period and held for the entire period (January 1, 2022 to June 30, 2022).
Actual Expenses
The first line of the accompanying table provides information about actual account values and actual expenses. You may use the information in this line, together with the amount you invested, to estimate the expenses that you paid over the period. Simply divide your account value by $1,000.00 (for example, an $8,600 account value divided by $1,000.00 = 8.6), then multiply the result by the number in the first line for a class/Fund under the heading entitled "Expenses Paid During Period" to estimate the expenses you paid on your account during this period. If any fund is a shareholder of any underlying mutual funds or exchange-traded funds (ETFs) (the Underlying Funds), such fund indirectly bears its proportional share of the expenses of the Underlying Funds in addition to the direct expenses incurred presented in the table. These fees and expenses are not included in the annualized expense ratio used to calculate the expense estimate in the table below. The estimate of expenses does not include any fees or other expenses of any variable annuity or variable life insurance product. If they were, the estimate of expenses you paid during the period would be higher, and your ending account value would be lower.
Hypothetical Example for Comparison Purposes
The second line of the accompanying table provides information about hypothetical account values and hypothetical expenses based on the actual expense ratio and an assumed rate of return of 5% per year before expenses, which is not the actual return. The hypothetical account values and expenses may not be used to estimate the actual ending account balance or expenses you paid for the period. You may use this information to compare the ongoing costs of investing in the Fund and other funds. To do so, compare this 5% hypothetical example with the 5% hypothetical examples that appear in the shareholder reports of the other funds. If any fund is a shareholder of any Underlying Funds, such fund indirectly bears its proportional share of the expenses of the Underlying Funds in addition to the direct expenses as presented in the table. These fees and expenses are not included in the annualized expense ratio used to calculate the expense estimate in the table below. The estimate of expenses does not include any fees or other expenses of any variable annuity or variable life insurance product. If they were, the estimate of expenses you paid during the period would be higher, and your ending account value would be lower.
Please note that the expenses shown in the table are meant to highlight your ongoing costs only and do not reflect any transaction costs. Therefore, the second line of the table is useful in comparing ongoing costs only, and will not help you determine the relative total costs of owning different funds. In addition, if these transactional costs were included, your costs would have been higher.
| Annualized Expense Ratio-A | Beginning Account Value January 1, 2022 | Ending Account Value June 30, 2022 | Expenses Paid During Period-B January 1, 2022 to June 30, 2022 |
|
| VIP Freedom Income Portfolio | ||||
| Initial Class | - %-C | |||
| Actual | $1,000.00 | $889.70 | $--D | |
| Hypothetical-E | $1,000.00 | $1,024.79 | $--D | |
| Service Class | .10% | |||
| Actual | $1,000.00 | $890.30 | $.47 | |
| Hypothetical-E | $1,000.00 | $1,024.30 | $.50 | |
| Service Class 2 | .25% | |||
| Actual | $1,000.00 | $889.10 | $1.17 | |
| Hypothetical-E | $1,000.00 | $1,023.55 | $1.25 | |
| VIP Freedom 2005 Portfolio | ||||
| Initial Class | - %-C | |||
| Actual | $1,000.00 | $885.80 | $--D | |
| Hypothetical-E | $1,000.00 | $1,024.79 | $--D | |
| Service Class | .10% | |||
| Actual | $1,000.00 | $885.00 | $.47 | |
| Hypothetical-E | $1,000.00 | $1,024.30 | $.50 | |
| Service Class 2 | .25% | |||
| Actual | $1,000.00 | $884.70 | $1.17 | |
| Hypothetical-E | $1,000.00 | $1,023.55 | $1.25 | |
| VIP Freedom 2010 Portfolio | ||||
| Initial Class | - %-C | |||
| Actual | $1,000.00 | $871.60 | $--D | |
| Hypothetical-E | $1,000.00 | $1,024.79 | $--D | |
| Service Class | .10% | |||
| Actual | $1,000.00 | $870.60 | $.46 | |
| Hypothetical-E | $1,000.00 | $1,024.30 | $.50 | |
| Service Class 2 | .25% | |||
| Actual | $1,000.00 | $870.40 | $1.16 | |
| Hypothetical-E | $1,000.00 | $1,023.55 | $1.25 | |
| VIP Freedom 2015 Portfolio | ||||
| Initial Class | - %-C | |||
| Actual | $1,000.00 | $857.00 | $--D | |
| Hypothetical-E | $1,000.00 | $1,024.79 | $--D | |
| Service Class | .10% | |||
| Actual | $1,000.00 | $856.60 | $.46 | |
| Hypothetical-E | $1,000.00 | $1,024.30 | $.50 | |
| Service Class 2 | .25% | |||
| Actual | $1,000.00 | $856.10 | $1.15 | |
| Hypothetical-E | $1,000.00 | $1,023.55 | $1.25 | |
| VIP Freedom 2020 Portfolio | ||||
| Initial Class | - %-C | |||
| Actual | $1,000.00 | $842.70 | $--D | |
| Hypothetical-E | $1,000.00 | $1,024.79 | $--D | |
| Service Class | .10% | |||
| Actual | $1,000.00 | $841.40 | $.46 | |
| Hypothetical-E | $1,000.00 | $1,024.30 | $.50 | |
| Service Class 2 | .25% | |||
| Actual | $1,000.00 | $841.50 | $1.14 | |
| Hypothetical-E | $1,000.00 | $1,023.55 | $1.25 | |
| VIP Freedom 2025 Portfolio | ||||
| Initial Class | - %-C | |||
| Actual | $1,000.00 | $833.00 | $--D | |
| Hypothetical-E | $1,000.00 | $1,024.79 | $--D | |
| Service Class | .10% | |||
| Actual | $1,000.00 | $832.40 | $.45 | |
| Hypothetical-E | $1,000.00 | $1,024.30 | $.50 | |
| Service Class 2 | .25% | |||
| Actual | $1,000.00 | $831.90 | $1.14 | |
| Hypothetical-E | $1,000.00 | $1,023.55 | $1.25 | |
| VIP Freedom 2030 Portfolio | ||||
| Initial Class | - %-C | |||
| Actual | $1,000.00 | $824.80 | $--D | |
| Hypothetical-E | $1,000.00 | $1,024.79 | $--D | |
| Service Class | .10% | |||
| Actual | $1,000.00 | $824.20 | $.45 | |
| Hypothetical-E | $1,000.00 | $1,024.30 | $.50 | |
| Service Class 2 | .25% | |||
| Actual | $1,000.00 | $824.10 | $1.13 | |
| Hypothetical-E | $1,000.00 | $1,023.55 | $1.25 | |
| VIP Freedom 2035 Portfolio | ||||
| Initial Class | - %-C | |||
| Actual | $1,000.00 | $809.60 | $--D | |
| Hypothetical-E | $1,000.00 | $1,024.79 | $--D | |
| Service Class | .10% | |||
| Actual | $1,000.00 | $809.30 | $.45 | |
| Hypothetical-E | $1,000.00 | $1,024.30 | $.50 | |
| Service Class 2 | .25% | |||
| Actual | $1,000.00 | $808.80 | $1.12 | |
| Hypothetical-E | $1,000.00 | $1,023.55 | $1.25 | |
| VIP Freedom 2040 Portfolio | ||||
| Initial Class | - %-C | |||
| Actual | $1,000.00 | $798.20 | $--D | |
| Hypothetical-E | $1,000.00 | $1,024.79 | $--D | |
| Service Class | .10% | |||
| Actual | $1,000.00 | $797.70 | $.45 | |
| Hypothetical-E | $1,000.00 | $1,024.30 | $.50 | |
| Service Class 2 | .25% | |||
| Actual | $1,000.00 | $797.40 | $1.11 | |
| Hypothetical-E | $1,000.00 | $1,023.55 | $1.25 | |
| VIP Freedom 2045 Portfolio | ||||
| Initial Class | - %-C | |||
| Actual | $1,000.00 | $797.40 | $--D | |
| Hypothetical-E | $1,000.00 | $1,024.79 | $--D | |
| Service Class | .10% | |||
| Actual | $1,000.00 | $797.20 | $.45 | |
| Hypothetical-E | $1,000.00 | $1,024.30 | $.50 | |
| Service Class 2 | .25% | |||
| Actual | $1,000.00 | $796.40 | $1.11 | |
| Hypothetical-E | $1,000.00 | $1,023.55 | $1.25 | |
| VIP Freedom 2050 Portfolio | ||||
| Initial Class | - %-C | |||
| Actual | $1,000.00 | $797.30 | $--D | |
| Hypothetical-E | $1,000.00 | $1,024.79 | $--D | |
| Service Class | .10% | |||
| Actual | $1,000.00 | $796.70 | $.45 | |
| Hypothetical-E | $1,000.00 | $1,024.30 | $.50 | |
| Service Class 2 | .25% | |||
| Actual | $1,000.00 | $796.20 | $1.11 | |
| Hypothetical-E | $1,000.00 | $1,023.55 | $1.25 | |
| VIP Freedom 2055 Portfolio | ||||
| Initial Class | - %-C | |||
| Actual | $1,000.00 | $797.40 | $--D | |
| Hypothetical-E | $1,000.00 | $1,024.79 | $--D | |
| Service Class | .10% | |||
| Actual | $1,000.00 | $796.60 | $.45 | |
| Hypothetical-E | $1,000.00 | $1,024.30 | $.50 | |
| Service Class 2 | .25% | |||
| Actual | $1,000.00 | $796.30 | $1.11 | |
| Hypothetical-E | $1,000.00 | $1,023.55 | $1.25 | |
| VIP Freedom 2060 Portfolio | ||||
| Initial Class | - %-C | |||
| Actual | $1,000.00 | $797.50 | $--D | |
| Hypothetical-E | $1,000.00 | $1,024.79 | $--D | |
| Service Class | .10% | |||
| Actual | $1,000.00 | $797.40 | $.45 | |
| Hypothetical-E | $1,000.00 | $1,024.30 | $.50 | |
| Service Class 2 | .25% | |||
| Actual | $1,000.00 | $796.30 | $1.11 | |
| Hypothetical-E | $1,000.00 | $1,023.55 | $1.25 | |
| VIP Freedom 2065 Portfolio | ||||
| Initial Class | - %-C | |||
| Actual | $1,000.00 | $797.30 | $--D | |
| Hypothetical-E | $1,000.00 | $1,024.79 | $--D | |
| Service Class | .10% | |||
| Actual | $1,000.00 | $796.40 | $.45 | |
| Hypothetical-E | $1,000.00 | $1,024.30 | $.50 | |
| Service Class 2 | .25% | |||
| Actual | $1,000.00 | $796.30 | $1.11 | |
| Hypothetical-E | $1,000.00 | $1,023.55 | $1.25 |
A Annualized expense ratio reflects expenses net of applicable fee waivers.
B Expenses are equal to the annualized expense ratio, multiplied by the average account value over the period, multiplied by 181/ 365 (to reflect the one-half year period). The fees and expenses of any Underlying Funds are not included in each annualized expense ratio.
C Amount represents less than .005%.
D Amount represents less than $.005.
E 5% return per year before expenses
Liquidity Risk Management Program
The Securities and Exchange Commission adopted Rule 22e-4 under the Investment Company Act of 1940 (the Liquidity Rule) to promote effective liquidity risk management throughout the open-end investment company industry, thereby reducing the risk that funds will be unable to meet their redemption obligations and mitigating dilution of the interests of fund shareholders.
The Funds have adopted and implemented a liquidity risk management program pursuant to the Liquidity Rule (the Program) effective December 1, 2018. The Program is reasonably designed to assess and manage each Fund’s liquidity risk and to comply with the requirements of the Liquidity Rule. Each Fund’s Board of Trustees (the Board) has designated each Fund’s investment adviser as administrator of the Program. The Fidelity advisers have established a Liquidity Risk Management Committee (the LRM Committee) to manage the Program for each of the Fidelity Funds. The LRM Committee monitors the adequacy and effectiveness of implementation of the Program and on a periodic basis assesses each Fund’s liquidity risk based on a variety of factors including (1) the Fund’s investment strategy, (2) portfolio liquidity and cash flow projections during normal and reasonably foreseeable stressed conditions, (3) shareholder redemptions, (4) borrowings and other funding sources and (5) in the case of exchange-traded funds, certain additional factors including the effect of the Fund’s prices and spreads, market participants, and basket compositions on the overall liquidity of the Fund’s portfolio, as applicable.
In accordance with the Program, each of the Fund’s portfolio investments is classified into one of four liquidity categories described below based on a determination of a reasonable expectation for how long it would take to convert the investment to cash (or sell or dispose of the investment) without significantly changing its market value.
- Highly liquid investments – cash or convertible to cash within three business days or less
- Moderately liquid investments – convertible to cash in three to seven calendar days
- Less liquid investments – can be sold or disposed of, but not settled, within seven calendar days
- Illiquid investments – cannot be sold or disposed of within seven calendar days
Liquidity classification determinations take into account a variety of factors including various market, trading and investment-specific considerations, as well as market depth, and generally utilize analysis from a third-party liquidity metrics service.
The Liquidity Rule places a 15% limit on a fund’s illiquid investments and requires funds that do not primarily hold assets that are highly liquid investments to determine and maintain a minimum percentage of the fund’s net assets to be invested in highly liquid investments (highly liquid investment minimum or HLIM). The Program includes provisions reasonably designed to comply with the 15% limit on illiquid investments and for determining, periodically reviewing and complying with the HLIM requirement as applicable.
At a recent meeting of the Fund’s Board of Trustees, the LRM Committee provided a written report to the Board pertaining to the operation, adequacy, and effectiveness of implementation of the Program for the annual period from December 1, 2020 through November 30, 2021. The report concluded that the Program has been implemented and is operating effectively and is reasonably designed to assess and manage the Fund’s liquidity risk.
![]()
VIPFF2K-SANN-0822
1.819548.118
Fidelity® Variable Insurance Products:
Freedom Lifetime Income Funds - Portfolios I, II & III
Freedom Lifetime Income I Portfolio
Freedom Lifetime Income II Portfolio
Freedom Lifetime Income III Portfolio
Semi-Annual Report
June 30, 2022
Contents
|
VIP Freedom Lifetime Income® I Portfolio | |
|
VIP Freedom Lifetime Income® II Portfolio | |
|
VIP Freedom Lifetime Income® III Portfolio | |
To view a fund's proxy voting guidelines and proxy voting record for the 12-month period ended June 30, visit http://www.fidelity.com/proxyvotingresults or visit the Securities and Exchange Commission's (SEC) web site at http://www.sec.gov.
You may also call 1-877-208-0098 to request a free copy of the proxy voting guidelines.
Fidelity® Variable Insurance Products are separate account options which are purchased through a variable insurance contract.
Standard & Poor's, S&P and S&P 500 are registered service marks of The McGraw-Hill Companies, Inc. and have been licensed for use by Fidelity Distributors Corporation.
Other third-party marks appearing herein are the property of their respective owners.
All other marks appearing herein are registered or unregistered trademarks or service marks of FMR LLC or an affiliated company. © 2022 FMR LLC. All rights reserved.
This report and the financial statements contained herein are submitted for the general information of the shareholders of the Funds. This report is not authorized for distribution to prospective investors in the Funds unless preceded or accompanied by an effective prospectus.
A fund files its complete schedule of portfolio holdings with the SEC for the first and third quarters of each fiscal year on Form N-PORT. Forms N-PORT are available on the SEC’s web site at http://www.sec.gov. A fund's Forms N-PORT may be reviewed and copied at the SEC’s Public Reference Room in Washington, DC. Information regarding the operation of the SEC's Public Reference Room may be obtained by calling 1-800-SEC-0330.
For a complete list of a fund's portfolio holdings, view the most recent holdings listing, semiannual report, or annual report on Fidelity's web site at http://www.fidelity.com, http://www.institutional.fidelity.com, or http://www.401k.com, as applicable.
NOT FDIC INSURED •MAY LOSE VALUE •NO BANK GUARANTEE
Neither the Funds nor Fidelity Distributors Corporation is a bank.
Note to Shareholders:
Early in 2020, the outbreak and spread of COVID-19 emerged as a public health emergency that had a major influence on financial markets, primarily based on its impact on the global economy and corporate earnings. On March 11, 2020, the World Health Organization declared the COVID-19 outbreak a pandemic, citing sustained risk of further global spread. The pandemic prompted a number of measures to limit the spread of COVID-19, including travel and border restrictions, quarantines, and restrictions on large gatherings. In turn, these resulted in lower consumer activity, diminished demand for a wide range of products and services, disruption in manufacturing and supply chains, and – given the wide variability in outcomes regarding the outbreak – significant market uncertainty and volatility. To help stem the turmoil, the U.S. government took unprecedented action – in concert with the U.S. Federal Reserve and central banks around the world – to help support consumers, businesses, and the broader economy, and to limit disruption to the financial system.
In general, the overall impact of the pandemic lessened in 2021, amid a resilient economy and widespread distribution of three COVID-19 vaccines granted emergency use authorization from the U.S. Food and Drug Administration (FDA) early in the year. Still, the situation remains dynamic, and the extent and duration of its influence on financial markets and the economy is highly uncertain, due in part to a recent spike in cases based on highly contagious variants of the coronavirus.
Extreme events such as the COVID-19 crisis are exogenous shocks that can have significant adverse effects on mutual funds and their investments. Although multiple asset classes may be affected by market disruption, the duration and impact may not be the same for all types of assets. Fidelity is committed to helping you stay informed amid news about COVID-19 and during increased market volatility, and we continue to take extra steps to be responsive to customer needs. We encourage you to visit us online, where we offer ongoing updates, commentary, and analysis on the markets and our funds.
VIP Freedom Lifetime Income® I Portfolio
Investment Summary (Unaudited)
The information in the following tables is based on the direct investments of the Fund.Top Holdings as of June 30, 2022
| % of fund's net assets | |
| VIP Investment Grade Bond II Portfolio - Investor Class | 36.1 |
| VIP Government Money Market Portfolio Investor Class 1.16% | 19.0 |
| Fidelity Inflation-Protected Bond Index Fund | 16.6 |
| VIP Overseas Portfolio Investor Class | 7.3 |
| VIP Emerging Markets Portfolio Investor Class | 6.8 |
| Fidelity Long-Term Treasury Bond Index Fund | 3.7 |
| Fidelity International Bond Index Fund | 2.6 |
| VIP High Income Portfolio Investor Class | 1.6 |
| VIP Growth Portfolio Investor Class | 1.3 |
| VIP Growth & Income Portfolio Investor Class | 1.3 |
| 96.3 |
Asset Allocation (% of fund's net assets)
| Period end | ||
| Domestic Equity Funds | 6.3% | |
| International Equity Funds | 14.1% | |
| Bond Funds | 60.6% | |
| Short-Term Funds | 19.0% | |

VIP Freedom Lifetime Income® I Portfolio
Schedule of Investments June 30, 2022 (Unaudited)
Showing Percentage of Net Assets
| Domestic Equity Funds - 6.3% | |||
| Shares | Value | ||
| VIP Contrafund Portfolio Investor Class (a) | 2,738 | $106,523 | |
| VIP Equity-Income Portfolio Investor Class (a) | 4,731 | 109,533 | |
| VIP Growth & Income Portfolio Investor Class (a) | 5,672 | 129,893 | |
| VIP Growth Portfolio Investor Class (a) | 1,816 | 134,236 | |
| VIP Mid Cap Portfolio Investor Class (a) | 1,007 | 31,661 | |
| VIP Value Portfolio Investor Class (a) | 4,881 | 80,044 | |
| VIP Value Strategies Portfolio Investor Class (a) | 2,765 | 39,074 | |
| TOTAL DOMESTIC EQUITY FUNDS | |||
| (Cost $454,135) | 630,964 | ||
| International Equity Funds - 14.1% | |||
| VIP Emerging Markets Portfolio Investor Class (a) | 67,713 | 677,129 | |
| VIP Overseas Portfolio Investor Class (a) | 35,060 | 727,140 | |
| TOTAL INTERNATIONAL EQUITY FUNDS | |||
| (Cost $1,396,376) | 1,404,269 | ||
| Bond Funds - 60.6% | |||
| Fidelity Inflation-Protected Bond Index Fund (a) | 162,381 | 1,648,163 | |
| Fidelity International Bond Index Fund (a) | 28,064 | 255,378 | |
| Fidelity Long-Term Treasury Bond Index Fund (a) | 31,926 | 368,112 | |
| VIP High Income Portfolio Investor Class (a) | 36,398 | 163,428 | |
| VIP Investment Grade Bond II Portfolio - Investor Class (a) | 368,083 | 3,592,487 | |
| TOTAL BOND FUNDS | |||
| (Cost $6,168,870) | 6,027,568 | ||
| Short-Term Funds - 19.0% | |||
| VIP Government Money Market Portfolio Investor Class 1.16% (a)(b) | |||
| (Cost $1,885,549) | 1,885,549 | 1,885,549 | |
| TOTAL INVESTMENT IN SECURITIES - 100.0% | |||
| (Cost $9,904,930) | 9,948,350 | ||
| NET OTHER ASSETS (LIABILITIES) - 0.0% | 0 | ||
| NET ASSETS - 100% | $9,948,350 |
Legend
(a) Affiliated Fund
(b) The rate quoted is the annualized seven-day yield of the fund at period end.
Affiliated Underlying Funds
Fiscal year to date information regarding the Fund's investments in affiliated Underlying Funds is presented below. Exchanges between classes of the same affiliated Underlying Funds may occur, and are excluded from purchases and sales below if applicable. If an underlying Fund changes its name, the name presented below is the name in effect at period end.
| Affiliate | Value, beginning of period | Purchases(a) | Sales Proceeds(a) | Dividend Income | Realized Gain (loss) | Change in Unrealized appreciation (depreciation) | Value, end of period |
| Fidelity Inflation-Protected Bond Index Fund | $1,735,253 | $258,988 | $186,914 | $-- | $(3,986) | $(155,178) | $1,648,163 |
| Fidelity International Bond Index Fund | 178,724 | 119,768 | 22,833 | 391 | (802) | (19,479) | 255,378 |
| Fidelity Long-Term Treasury Bond Index Fund | 331,016 | 161,126 | 51,427 | 3,511 | (2,899) | (69,704) | 368,112 |
| VIP Contrafund Portfolio Investor Class | 142,685 | 36,777 | 33,386 | 1,303 | (2,216) | (37,337) | 106,523 |
| VIP Emerging Markets Portfolio Investor Class | 809,815 | 157,858 | 132,439 | -- | (9,857) | (148,248) | 677,129 |
| VIP Equity-Income Portfolio Investor Class | 150,912 | 29,168 | 56,145 | 187 | 5,473 | (19,875) | 109,533 |
| VIP Government Money Market Portfolio Investor Class 1.16% | 2,440,646 | 95,841 | 650,938 | 2,399 | -- | -- | 1,885,549 |
| VIP Growth & Income Portfolio Investor Class | 171,790 | 38,321 | 62,563 | 322 | 11,456 | (29,111) | 129,893 |
| VIP Growth Portfolio Investor Class | 145,920 | 66,734 | 37,012 | 6,654 | (3,391) | (38,015) | 134,236 |
| VIP High Income Portfolio Investor Class | 238,018 | 8,004 | 54,383 | 89 | (3,687) | (24,524) | 163,428 |
| VIP Investment Grade Bond II Portfolio - Investor Class | -- | 3,816,175 | 133,592 | -- | (2,016) | (88,080) | 3,592,487 |
| VIP Investment Grade Bond Portfolio Investor Class | 4,559,737 | 291,543 | 4,281,599 | 204,849 | (307,487) | (262,194) | -- |
| VIP Mid Cap Portfolio Investor Class | 41,864 | 8,102 | 9,142 | 945 | (688) | (8,475) | 31,661 |
| VIP Overseas Portfolio Investor Class | 823,151 | 226,659 | 66,117 | 6,203 | (5,558) | (250,995) | 727,140 |
| VIP Value Portfolio Investor Class | 110,587 | 17,414 | 38,573 | 1,399 | 4,758 | (14,142) | 80,044 |
| VIP Value Strategies Portfolio Investor Class | 54,205 | 6,972 | 16,115 | 450 | 2,320 | (8,308) | 39,074 |
| Total | $11,934,323 | $5,339,450 | $5,833,178 | $228,702 | $(318,580) | $(1,173,665) | $9,948,350 |
(a) Includes the value of shares purchased or redeemed through in-kind transactions, as applicable.
Amounts in the income column in the above table include any capital gain distributions from underlying funds, which are presented in the corresponding line-item in the Statement of Operations, if applicable.
Investment Valuation
The following is a summary of the inputs used, as of June 30, 2022, involving the Fund's assets and liabilities carried at fair value. The inputs or methodology used for valuing securities may not be an indication of the risk associated with investing in those securities. For more information on valuation inputs, and their aggregation into the levels used below, please refer to the Investment Valuation section in the accompanying Notes to Financial Statements.
| Valuation Inputs at Reporting Date: | ||||
| Description | Total | Level 1 | Level 2 | Level 3 |
| Investments in Securities: | ||||
| Domestic Equity Funds | $630,964 | $630,964 | $-- | $-- |
| International Equity Funds | 1,404,269 | 1,404,269 | -- | -- |
| Bond Funds | 6,027,568 | 6,027,568 | -- | -- |
| Short-Term Funds | 1,885,549 | 1,885,549 | -- | -- |
| Total Investments in Securities: | $9,948,350 | $9,948,350 | $-- | $-- |
See accompanying notes which are an integral part of the financial statements.
VIP Freedom Lifetime Income® I Portfolio
Financial Statements
Statement of Assets and Liabilities
| June 30, 2022 (Unaudited) | ||
| Assets | ||
| Investment in securities, at value — See accompanying schedule: | ||
| Affiliated issuers (cost $9,904,930) | $9,948,350 | |
| Total Investment in Securities (cost $9,904,930) | $9,948,350 | |
| Receivable for investments sold | 91,957 | |
| Total assets | 10,040,307 | |
| Liabilities | ||
| Payable for investments purchased | $91,792 | |
| Payable for fund shares redeemed | 165 | |
| Total liabilities | 91,957 | |
| Net Assets | $9,948,350 | |
| Net Assets consist of: | ||
| Paid in capital | $10,011,674 | |
| Total accumulated earnings (loss) | (63,324) | |
| Net Assets | $9,948,350 | |
| Net Asset Value, offering price and redemption price per share ($9,948,350 ÷ 976,999 shares) | $10.18 |
See accompanying notes which are an integral part of the financial statements.
Statement of Operations
| Six months ended June 30, 2022 (Unaudited) | ||
| Investment Income | ||
| Dividends: | ||
| Affiliated issuers | $6,862 | |
| Expenses | ||
| Independent trustees' fees and expenses | $17 | |
| Total expenses | 17 | |
| Net investment income (loss) | 6,845 | |
| Realized and Unrealized Gain (Loss) | ||
| Net realized gain (loss) on: | ||
| Investment securities: | ||
| Affiliated issuers | (318,580) | |
| Capital gain distributions from underlying funds: | ||
| Affiliated issuers | 221,840 | |
| Total net realized gain (loss) | (96,740) | |
| Change in net unrealized appreciation (depreciation) on: | ||
| Investment securities: | ||
| Affiliated issuers | (1,173,665) | |
| Total change in net unrealized appreciation (depreciation) | (1,173,665) | |
| Net gain (loss) | (1,270,405) | |
| Net increase (decrease) in net assets resulting from operations | $(1,263,560) |
See accompanying notes which are an integral part of the financial statements.
Statement of Changes in Net Assets
| Six months ended June 30, 2022 (Unaudited) | Year ended December 31, 2021 | |
| Increase (Decrease) in Net Assets | ||
| Operations | ||
| Net investment income (loss) | $6,845 | $222,359 |
| Net realized gain (loss) | (96,740) | 528,979 |
| Change in net unrealized appreciation (depreciation) | (1,173,665) | (358,900) |
| Net increase (decrease) in net assets resulting from operations | (1,263,560) | 392,438 |
| Distributions to shareholders | (531,840) | (490,116) |
| Share transactions | ||
| Proceeds from sales of shares | – | 135,512 |
| Reinvestment of distributions | 531,840 | 490,116 |
| Cost of shares redeemed | (722,412) | (1,147,079) |
| Net increase (decrease) in net assets resulting from share transactions | (190,572) | (521,451) |
| Total increase (decrease) in net assets | (1,985,972) | (619,129) |
| Net Assets | ||
| Beginning of period | 11,934,322 | 12,553,451 |
| End of period | $9,948,350 | $11,934,322 |
| Other Information | ||
| Shares | ||
| Sold | – | 11,144 |
| Issued in reinvestment of distributions | 47,957 | 40,971 |
| Redeemed | (64,488) | (95,179) |
| Net increase (decrease) | (16,531) | (43,064) |
See accompanying notes which are an integral part of the financial statements.
Financial Highlights
VIP Freedom Lifetime Income I Portfolio
| Six months ended (Unaudited) June 30, | Years endedDecember 31, | |||||
| 2022 | 2021 | 2020 | 2019 | 2018 | 2017 | |
| Selected Per–Share Data | ||||||
| Net asset value, beginning of period | $12.01 | $12.11 | $11.49 | $10.57 | $11.21 | $10.76 |
| Income from Investment Operations | ||||||
| Net investment income (loss)A,B | .01 | .22 | .15 | .24 | .19 | .22 |
| Net realized and unrealized gain (loss) | (1.29) | .17 | 1.02 | 1.05 | (.48) | .59 |
| Total from investment operations | (1.28) | .39 | 1.17 | 1.29 | (.29) | .81 |
| Distributions from net investment income | (.11) | (.13) | (.16) | (.25) | (.19) | (.23) |
| Distributions from net realized gain | (.45) | (.36) | (.39) | (.12) | (.17) | (.13) |
| Total distributions | (.55)C | (.49) | (.55) | (.37) | (.35)C | (.36) |
| Net asset value, end of period | $10.18 | $12.01 | $12.11 | $11.49 | $10.57 | $11.21 |
| Total ReturnD,E,F | (11.01)% | 3.26% | 10.44% | 12.28% | (2.58)% | 7.62% |
| Ratios to Average Net AssetsB,G,H | ||||||
| Expenses before reductionsI | - %J | -% | -% | -% | -% | -% |
| Expenses net of fee waivers, if any | - %I,J | - %I | - %I | - %I | - %I | -% |
| Expenses net of all reductions | - %I,J | - %I | - %I | - %I | - %I | -% |
| Net investment income (loss) | .13%J | 1.83% | 1.29% | 2.13% | 1.69% | 1.97% |
| Supplemental Data | ||||||
| Net assets, end of period (000 omitted) | $9,948 | $11,934 | $12,553 | $12,606 | $12,208 | $13,690 |
| Portfolio turnover rateK | 98%J | 18% | 26% | 19% | 39% | 9% |
A Calculated based on average shares outstanding during the period.
B Net investment income (loss) is affected by the timing of the declaration of dividends by any underlying mutual funds or exchange-traded funds (ETFs). Net investment income (loss) of any such underlying funds is not included in the Fund's net investment income (loss) ratio.
C Total distributions per share do not sum due to rounding.
D Total returns for periods of less than one year are not annualized.
E Total returns do not reflect charges attributable to your insurance company's separate account. Inclusion of these charges would reduce the total returns shown.
F Total returns would have been lower if certain expenses had not been reduced during the applicable periods shown.
G Fees and expenses of any underlying mutual funds or exchange-traded funds (ETFs) are not included in the Fund's expense ratio. The Fund indirectly bears its proportionate share of these expenses.
H Expense ratios reflect operating expenses of the class. Expenses before reductions do not reflect amounts reimbursed, waived, or reduced through arrangements with the investment adviser, brokerage services, or other offset arrangements, if applicable, and do not represent the amount paid by the class during periods when reimbursements, waivers or reductions occur.
I Amount represents less than .005%.
J Annualized
K Amount does not include the portfolio activity of any underlying mutual funds or exchange-traded funds (ETFs).
See accompanying notes which are an integral part of the financial statements.
VIP Freedom Lifetime Income® II Portfolio
Investment Summary (Unaudited)
The information in the following tables is based on the direct investments of the Fund.Top Holdings as of June 30, 2022
| % of fund's net assets | |
| VIP Investment Grade Bond II Portfolio - Investor Class | 31.9 |
| Fidelity Inflation-Protected Bond Index Fund | 14.7 |
| VIP Overseas Portfolio Investor Class | 11.1 |
| VIP Government Money Market Portfolio Investor Class 1.16% | 11.0 |
| VIP Emerging Markets Portfolio Investor Class | 8.4 |
| Fidelity Long-Term Treasury Bond Index Fund | 4.1 |
| VIP Growth Portfolio Investor Class | 3.0 |
| VIP Growth & Income Portfolio Investor Class | 3.0 |
| Fidelity International Bond Index Fund | 2.9 |
| VIP Equity-Income Portfolio Investor Class | 2.5 |
| 92.6 |
Asset Allocation (% of fund's net assets)
| Period end | ||
| Domestic Equity Funds | 14.3% | |
| International Equity Funds | 19.5% | |
| Bond Funds | 55.2% | |
| Short-Term Funds | 11.0% | |
VIP Freedom Lifetime Income® II Portfolio
Schedule of Investments June 30, 2022 (Unaudited)
Showing Percentage of Net Assets
| Domestic Equity Funds - 14.3% | |||
| Shares | Value | ||
| VIP Contrafund Portfolio Investor Class (a) | 17,119 | $665,937 | |
| VIP Equity-Income Portfolio Investor Class (a) | 29,582 | 684,825 | |
| VIP Growth & Income Portfolio Investor Class (a) | 35,464 | 812,135 | |
| VIP Growth Portfolio Investor Class (a) | 11,354 | 839,277 | |
| VIP Mid Cap Portfolio Investor Class (a) | 6,296 | 197,935 | |
| VIP Value Portfolio Investor Class (a) | 30,505 | 500,281 | |
| VIP Value Strategies Portfolio Investor Class (a) | 17,288 | 244,274 | |
| TOTAL DOMESTIC EQUITY FUNDS | |||
| (Cost $2,804,316) | 3,944,664 | ||
| International Equity Funds - 19.5% | |||
| VIP Emerging Markets Portfolio Investor Class (a) | 231,178 | 2,311,782 | |
| VIP Overseas Portfolio Investor Class (a) | 147,086 | 3,050,562 | |
| TOTAL INTERNATIONAL EQUITY FUNDS | |||
| (Cost $5,149,316) | 5,362,344 | ||
| Bond Funds - 55.2% | |||
| Fidelity Inflation-Protected Bond Index Fund (a) | 398,018 | 4,039,881 | |
| Fidelity International Bond Index Fund (a) | 89,078 | 810,610 | |
| Fidelity Long-Term Treasury Bond Index Fund (a) | 98,658 | 1,137,524 | |
| VIP High Income Portfolio Investor Class (a) | 100,891 | 453,002 | |
| VIP Investment Grade Bond II Portfolio - Investor Class (a) | 899,251 | 8,776,688 | |
| TOTAL BOND FUNDS | |||
| (Cost $15,697,334) | 15,217,705 | ||
| Short-Term Funds - 11.0% | |||
| VIP Government Money Market Portfolio Investor Class 1.16% (a)(b) | |||
| (Cost $3,018,783) | 3,018,783 | 3,018,783 | |
| TOTAL INVESTMENT IN SECURITIES - 100.0% | |||
| (Cost $26,669,749) | 27,543,496 | ||
| NET OTHER ASSETS (LIABILITIES) - 0.0% | 0 | ||
| NET ASSETS - 100% | $27,543,496 |
Legend
(a) Affiliated Fund
(b) The rate quoted is the annualized seven-day yield of the fund at period end.
Affiliated Underlying Funds
Fiscal year to date information regarding the Fund's investments in affiliated Underlying Funds is presented below. Exchanges between classes of the same affiliated Underlying Funds may occur, and are excluded from purchases and sales below if applicable. If an underlying Fund changes its name, the name presented below is the name in effect at period end.
| Affiliate | Value, beginning of period | Purchases(a) | Sales Proceeds(a) | Dividend Income | Realized Gain (loss) | Change in Unrealized appreciation (depreciation) | Value, end of period |
| Fidelity Inflation-Protected Bond Index Fund | $4,092,592 | $743,972 | $410,092 | $-- | $(11,634) | $(374,957) | $4,039,881 |
| Fidelity International Bond Index Fund | 564,604 | 363,310 | 52,394 | 1,274 | (2,603) | (62,307) | 810,610 |
| Fidelity Long-Term Treasury Bond Index Fund | 999,535 | 506,714 | 140,749 | 10,997 | (11,766) | (216,210) | 1,137,524 |
| VIP Contrafund Portfolio Investor Class | 893,388 | 150,379 | 127,774 | 8,177 | (13,373) | (236,683) | 665,937 |
| VIP Emerging Markets Portfolio Investor Class | 2,807,309 | 434,616 | 375,129 | -- | (28,378) | (526,636) | 2,311,782 |
| VIP Equity-Income Portfolio Investor Class | 944,944 | 73,661 | 243,671 | 1,174 | 19,131 | (109,240) | 684,825 |
| VIP Government Money Market Portfolio Investor Class 1.16% | 4,284,312 | 242,525 | 1,508,054 | 3,948 | -- | -- | 3,018,783 |
| VIP Growth & Income Portfolio Investor Class | 1,075,654 | 118,987 | 271,662 | 2,022 | 84,697 | (195,541) | 812,135 |
| VIP Growth Portfolio Investor Class | 913,726 | 339,478 | 153,501 | 41,792 | (16,611) | (243,815) | 839,277 |
| VIP High Income Portfolio Investor Class | 663,459 | 15,931 | 147,292 | 251 | (14,121) | (64,975) | 453,002 |
| VIP Investment Grade Bond II Portfolio - Investor Class | -- | 9,385,344 | 387,144 | -- | (6,641) | (214,871) | 8,776,688 |
| VIP Investment Grade Bond Portfolio Investor Class | 11,062,752 | 822,721 | 10,481,988 | 505,498 | (854,677) | (548,808) | -- |
| VIP Mid Cap Portfolio Investor Class | 262,132 | 35,516 | 41,499 | 5,908 | (3,534) | (54,680) | 197,935 |
| VIP Overseas Portfolio Investor Class | 3,653,919 | 796,393 | 274,559 | 27,647 | (24,766) | (1,100,425) | 3,050,562 |
| VIP Value Portfolio Investor Class | 692,431 | 50,182 | 184,296 | 8,793 | 23,273 | (81,309) | 500,281 |
| VIP Value Strategies Portfolio Investor Class | 339,407 | 17,611 | 75,065 | 2,836 | 12,771 | (50,450) | 244,274 |
| Total | $33,250,164 | $14,097,340 | $14,874,869 | $620,317 | $(848,232) | $(4,080,907) | $27,543,496 |
(a) Includes the value of shares purchased or redeemed through in-kind transactions, as applicable.
Amounts in the income column in the above table include any capital gain distributions from underlying funds, which are presented in the corresponding line-item in the Statement of Operations, if applicable.
Investment Valuation
The following is a summary of the inputs used, as of June 30, 2022, involving the Fund's assets and liabilities carried at fair value. The inputs or methodology used for valuing securities may not be an indication of the risk associated with investing in those securities. For more information on valuation inputs, and their aggregation into the levels used below, please refer to the Investment Valuation section in the accompanying Notes to Financial Statements.
| Valuation Inputs at Reporting Date: | ||||
| Description | Total | Level 1 | Level 2 | Level 3 |
| Investments in Securities: | ||||
| Domestic Equity Funds | $3,944,664 | $3,944,664 | $-- | $-- |
| International Equity Funds | 5,362,344 | 5,362,344 | -- | -- |
| Bond Funds | 15,217,705 | 15,217,705 | -- | -- |
| Short-Term Funds | 3,018,783 | 3,018,783 | -- | -- |
| Total Investments in Securities: | $27,543,496 | $27,543,496 | $-- | $-- |
See accompanying notes which are an integral part of the financial statements.
VIP Freedom Lifetime Income® II Portfolio
Financial Statements
Statement of Assets and Liabilities
| June 30, 2022 (Unaudited) | ||
| Assets | ||
| Investment in securities, at value — See accompanying schedule: | ||
| Affiliated issuers (cost $26,669,749) | $27,543,496 | |
| Total Investment in Securities (cost $26,669,749) | $27,543,496 | |
| Cash | 6 | |
| Receivable for investments sold | 295,090 | |
| Total assets | 27,838,592 | |
| Liabilities | ||
| Payable for investments purchased | $294,635 | |
| Payable for fund shares redeemed | 461 | |
| Total liabilities | 295,096 | |
| Net Assets | $27,543,496 | |
| Net Assets consist of: | ||
| Paid in capital | $26,979,040 | |
| Total accumulated earnings (loss) | 564,456 | |
| Net Assets | $27,543,496 | |
| Net Asset Value, offering price and redemption price per share ($27,543,496 ÷ 2,445,342 shares) | $11.26 |
See accompanying notes which are an integral part of the financial statements.
Statement of Operations
| Six months ended June 30, 2022 (Unaudited) | ||
| Investment Income | ||
| Dividends: | ||
| Affiliated issuers | $19,428 | |
| Expenses | ||
| Independent trustees' fees and expenses | $47 | |
| Total expenses | 47 | |
| Net investment income (loss) | 19,381 | |
| Realized and Unrealized Gain (Loss) | ||
| Net realized gain (loss) on: | ||
| Investment securities: | ||
| Affiliated issuers | (848,232) | |
| Capital gain distributions from underlying funds: | ||
| Affiliated issuers | 600,889 | |
| Total net realized gain (loss) | (247,343) | |
| Change in net unrealized appreciation (depreciation) on: | ||
| Investment securities: | ||
| Affiliated issuers | (4,080,907) | |
| Total change in net unrealized appreciation (depreciation) | (4,080,907) | |
| Net gain (loss) | (4,328,250) | |
| Net increase (decrease) in net assets resulting from operations | $(4,308,869) |
See accompanying notes which are an integral part of the financial statements.
Statement of Changes in Net Assets
| Six months ended June 30, 2022 (Unaudited) | Year ended December 31, 2021 | |
| Increase (Decrease) in Net Assets | ||
| Operations | ||
| Net investment income (loss) | $19,381 | $598,990 |
| Net realized gain (loss) | (247,343) | 2,287,088 |
| Change in net unrealized appreciation (depreciation) | (4,080,907) | (827,802) |
| Net increase (decrease) in net assets resulting from operations | (4,308,869) | 2,058,276 |
| Distributions to shareholders | (2,213,986) | (1,715,383) |
| Share transactions | ||
| Proceeds from sales of shares | – | 207,993 |
| Reinvestment of distributions | 2,213,986 | 1,715,383 |
| Cost of shares redeemed | (1,397,801) | (3,248,017) |
| Net increase (decrease) in net assets resulting from share transactions | 816,185 | (1,324,641) |
| Total increase (decrease) in net assets | (5,706,670) | (981,748) |
| Net Assets | ||
| Beginning of period | 33,250,166 | 34,231,914 |
| End of period | $27,543,496 | $33,250,166 |
| Other Information | ||
| Shares | ||
| Sold | – | 14,720 |
| Issued in reinvestment of distributions | 176,977 | 124,692 |
| Redeemed | (113,337) | (233,226) |
| Net increase (decrease) | 63,640 | (93,814) |
See accompanying notes which are an integral part of the financial statements.
Financial Highlights
VIP Freedom Lifetime Income II Portfolio
| Six months ended (Unaudited) June 30, | Years endedDecember 31, | |||||
| 2022 | 2021 | 2020 | 2019 | 2018 | 2017 | |
| Selected Per–Share Data | ||||||
| Net asset value, beginning of period | $13.96 | $13.83 | $12.98 | $11.78 | $12.70 | $11.72 |
| Income from Investment Operations | ||||||
| Net investment income (loss)A,B | .01 | .25 | .16 | .26 | .20 | .21 |
| Net realized and unrealized gain (loss) | (1.77) | .60 | 1.44 | 1.65 | (.70) | 1.22 |
| Total from investment operations | (1.76) | .85 | 1.60 | 1.91 | (.50) | 1.43 |
| Distributions from net investment income | (.11) | (.15) | (.17) | (.27) | (.20) | (.22) |
| Distributions from net realized gain | (.83) | (.57) | (.58) | (.44) | (.22) | (.23) |
| Total distributions | (.94) | (.72) | (.75) | (.71) | (.42) | (.45) |
| Net asset value, end of period | $11.26 | $13.96 | $13.83 | $12.98 | $11.78 | $12.70 |
| Total ReturnC,D,E | (13.28)% | 6.27% | 12.78% | 16.58% | (3.96)% | 12.29% |
| Ratios to Average Net AssetsB,F,G | ||||||
| Expenses before reductionsH | - %I | -% | -% | -% | -% | -% |
| Expenses net of fee waivers, if any | - %H,I | - %H | - %H | - %H | - %H | -% |
| Expenses net of all reductions | - %H,I | - %H | - %H | - %H | - %H | -% |
| Net investment income (loss) | .13%I | 1.78% | 1.29% | 2.07% | 1.57% | 1.71% |
| Supplemental Data | ||||||
| Net assets, end of period (000 omitted) | $27,543 | $33,250 | $34,232 | $33,602 | $31,060 | $34,818 |
| Portfolio turnover rateJ | 93%I | 23% | 33% | 24% | 34% | 12% |
A Calculated based on average shares outstanding during the period.
B Net investment income (loss) is affected by the timing of the declaration of dividends by any underlying mutual funds or exchange-traded funds (ETFs). Net investment income (loss) of any such underlying funds is not included in the Fund's net investment income (loss) ratio.
C Total returns for periods of less than one year are not annualized.
D Total returns do not reflect charges attributable to your insurance company's separate account. Inclusion of these charges would reduce the total returns shown.
E Total returns would have been lower if certain expenses had not been reduced during the applicable periods shown.
F Fees and expenses of any underlying mutual funds or exchange-traded funds (ETFs) are not included in the Fund's expense ratio. The Fund indirectly bears its proportionate share of these expenses.
G Expense ratios reflect operating expenses of the class. Expenses before reductions do not reflect amounts reimbursed, waived, or reduced through arrangements with the investment adviser, brokerage services, or other offset arrangements, if applicable, and do not represent the amount paid by the class during periods when reimbursements, waivers or reductions occur.
H Amount represents less than .005%.
I Annualized
J Amount does not include the portfolio activity of any underlying mutual funds or exchange-traded funds (ETFs).
See accompanying notes which are an integral part of the financial statements.
VIP Freedom Lifetime Income® III Portfolio
Investment Summary (Unaudited)
The information in the following tables is based on the direct investments of the Fund.Top Holdings as of June 30, 2022
| % of fund's net assets | |
| VIP Investment Grade Bond II Portfolio - Investor Class | 24.5 |
| VIP Overseas Portfolio Investor Class | 16.2 |
| Fidelity Inflation-Protected Bond Index Fund | 12.1 |
| VIP Emerging Markets Portfolio Investor Class | 10.5 |
| VIP Growth Portfolio Investor Class | 5.3 |
| Fidelity Long-Term Treasury Bond Index Fund | 5.3 |
| VIP Growth & Income Portfolio Investor Class | 5.2 |
| VIP Equity-Income Portfolio Investor Class | 4.4 |
| VIP Contrafund Portfolio Investor Class | 4.2 |
| Fidelity International Bond Index Fund | 3.5 |
| 91.2 |
Asset Allocation (% of fund's net assets)
| Period end | ||
| Domestic Equity Funds | 25.1% | |
| International Equity Funds | 26.7% | |
| Bond Funds | 47.1% | |
| Short-Term Funds | 1.1% | |
VIP Freedom Lifetime Income® III Portfolio
Schedule of Investments June 30, 2022 (Unaudited)
Showing Percentage of Net Assets
| Domestic Equity Funds - 25.1% | |||
| Shares | Value | ||
| VIP Contrafund Portfolio Investor Class (a) | 31,917 | $1,241,582 | |
| VIP Equity-Income Portfolio Investor Class (a) | 55,159 | 1,276,938 | |
| VIP Growth & Income Portfolio Investor Class (a) | 66,134 | 1,514,477 | |
| VIP Growth Portfolio Investor Class (a) | 21,173 | 1,565,104 | |
| VIP Mid Cap Portfolio Investor Class (a) | 11,740 | 369,097 | |
| VIP Value Portfolio Investor Class (a) | 56,883 | 932,876 | |
| VIP Value Strategies Portfolio Investor Class (a) | 32,236 | 455,496 | |
| TOTAL DOMESTIC EQUITY FUNDS | |||
| (Cost $5,407,206) | 7,355,570 | ||
| International Equity Funds - 26.7% | |||
| VIP Emerging Markets Portfolio Investor Class (a) | 308,546 | 3,085,463 | |
| VIP Overseas Portfolio Investor Class (a) | 228,325 | 4,735,459 | |
| TOTAL INTERNATIONAL EQUITY FUNDS | |||
| (Cost $7,649,488) | 7,820,922 | ||
| Bond Funds - 47.1% | |||
| Fidelity Inflation-Protected Bond Index Fund (a) | 349,332 | 3,545,718 | |
| Fidelity International Bond Index Fund (a) | 110,691 | 1,007,285 | |
| Fidelity Long-Term Treasury Bond Index Fund (a) | 135,085 | 1,557,525 | |
| VIP High Income Portfolio Investor Class (a) | 107,339 | 481,953 | |
| VIP Investment Grade Bond II Portfolio - Investor Class (a) | 734,879 | 7,172,416 | |
| TOTAL BOND FUNDS | |||
| (Cost $14,322,518) | 13,764,897 | ||
| Short-Term Funds - 1.1% | |||
| VIP Government Money Market Portfolio Investor Class 1.16% (a)(b) | |||
| (Cost $320,009) | 320,009 | 320,009 | |
| TOTAL INVESTMENT IN SECURITIES - 100.0% | |||
| (Cost $27,699,221) | 29,261,398 | ||
| NET OTHER ASSETS (LIABILITIES) - 0.0% | 2 | ||
| NET ASSETS - 100% | $29,261,400 |
Legend
(a) Affiliated Fund
(b) The rate quoted is the annualized seven-day yield of the fund at period end.
Affiliated Underlying Funds
Fiscal year to date information regarding the Fund's investments in affiliated Underlying Funds is presented below. Exchanges between classes of the same affiliated Underlying Funds may occur, and are excluded from purchases and sales below if applicable. If an underlying Fund changes its name, the name presented below is the name in effect at period end.
| Affiliate | Value, beginning of period | Purchases(a) | Sales Proceeds(a) | Dividend Income | Realized Gain (loss) | Change in Unrealized appreciation (depreciation) | Value, end of period |
| Fidelity Inflation-Protected Bond Index Fund | $3,524,960 | $777,803 | $418,040 | $-- | $(14,745) | $(324,260) | $3,545,718 |
| Fidelity International Bond Index Fund | 704,210 | 461,846 | 77,581 | 1,619 | (4,352) | (76,838) | 1,007,285 |
| Fidelity Long-Term Treasury Bond Index Fund | 1,188,676 | 842,018 | 190,828 | 13,855 | (19,424) | (262,917) | 1,557,525 |
| VIP Contrafund Portfolio Investor Class | 1,640,917 | 228,517 | 162,788 | 14,953 | (19,375) | (445,689) | 1,241,582 |
| VIP Emerging Markets Portfolio Investor Class | 3,796,362 | 468,674 | 429,507 | -- | (32,908) | (717,158) | 3,085,463 |
| VIP Equity-Income Portfolio Investor Class | 1,735,521 | 71,583 | 362,748 | 2,149 | 25,122 | (192,540) | 1,276,938 |
| VIP Government Money Market Portfolio Investor Class 1.16% | 1,320,724 | 227,033 | 1,227,748 | 521 | -- | -- | 320,009 |
| VIP Growth & Income Portfolio Investor Class | 1,975,654 | 138,299 | 393,204 | 3,699 | 108,434 | (314,706) | 1,514,477 |
| VIP Growth Portfolio Investor Class | 1,678,275 | 579,003 | 209,079 | 76,422 | (26,589) | (456,506) | 1,565,104 |
| VIP High Income Portfolio Investor Class | 721,425 | 8,481 | 162,530 | 270 | (12,840) | (72,583) | 481,953 |
| VIP Investment Grade Bond II Portfolio - Investor Class | -- | 8,277,943 | 919,996 | -- | (11,036) | (174,495) | 7,172,416 |
| VIP Investment Grade Bond Portfolio Investor Class | 9,670,153 | 896,593 | 9,341,420 | 440,017 | (868,708) | (356,618) | -- |
| VIP Mid Cap Portfolio Investor Class | 481,432 | 55,098 | 58,796 | 10,779 | (6,190) | (102,447) | 369,097 |
| VIP Overseas Portfolio Investor Class | 5,801,129 | 1,090,364 | 377,036 | 43,677 | (30,810) | (1,748,188) | 4,735,459 |
| VIP Value Portfolio Investor Class | 1,271,761 | 63,383 | 293,628 | 16,083 | 33,374 | (142,014) | 932,876 |
| VIP Value Strategies Portfolio Investor Class | 623,354 | 17,608 | 114,715 | 5,179 | 15,428 | (86,179) | 455,496 |
| Total | $36,134,553 | $14,204,246 | $14,739,644 | $629,223 | $(864,619) | $(5,473,138) | $29,261,398 |
(a) Includes the value of shares purchased or redeemed through in-kind transactions, as applicable.
Amounts in the income column in the above table include any capital gain distributions from underlying funds, which are presented in the corresponding line-item in the Statement of Operations, if applicable.
Investment Valuation
The following is a summary of the inputs used, as of June 30, 2022, involving the Fund's assets and liabilities carried at fair value. The inputs or methodology used for valuing securities may not be an indication of the risk associated with investing in those securities. For more information on valuation inputs, and their aggregation into the levels used below, please refer to the Investment Valuation section in the accompanying Notes to Financial Statements.
| Valuation Inputs at Reporting Date: | ||||
| Description | Total | Level 1 | Level 2 | Level 3 |
| Investments in Securities: | ||||
| Domestic Equity Funds | $7,355,570 | $7,355,570 | $-- | $-- |
| International Equity Funds | 7,820,922 | 7,820,922 | -- | -- |
| Bond Funds | 13,764,897 | 13,764,897 | -- | -- |
| Short-Term Funds | 320,009 | 320,009 | -- | -- |
| Total Investments in Securities: | $29,261,398 | $29,261,398 | $-- | $-- |
See accompanying notes which are an integral part of the financial statements.
VIP Freedom Lifetime Income® III Portfolio
Financial Statements
Statement of Assets and Liabilities
| June 30, 2022 (Unaudited) | ||
| Assets | ||
| Investment in securities, at value — See accompanying schedule: | ||
| Affiliated issuers (cost $27,699,221) | $29,261,398 | |
| Total Investment in Securities (cost $27,699,221) | $29,261,398 | |
| Cash | 4 | |
| Receivable for investments sold | 374,620 | |
| Total assets | 29,636,022 | |
| Liabilities | ||
| Payable for investments purchased | $374,136 | |
| Payable for fund shares redeemed | 486 | |
| Total liabilities | 374,622 | |
| Net Assets | $29,261,400 | |
| Net Assets consist of: | ||
| Paid in capital | $28,034,080 | |
| Total accumulated earnings (loss) | 1,227,320 | |
| Net Assets | $29,261,400 | |
| Net Asset Value, offering price and redemption price per share ($29,261,400 ÷ 2,485,290 shares) | $11.77 |
See accompanying notes which are an integral part of the financial statements.
Statement of Operations
| Six months ended June 30, 2022 (Unaudited) | ||
| Investment Income | ||
| Dividends: | ||
| Affiliated issuers | $21,673 | |
| Expenses | ||
| Independent trustees' fees and expenses | $50 | |
| Total expenses | 50 | |
| Net investment income (loss) | 21,623 | |
| Realized and Unrealized Gain (Loss) | ||
| Net realized gain (loss) on: | ||
| Investment securities: | ||
| Affiliated issuers | (864,619) | |
| Capital gain distributions from underlying funds: | ||
| Affiliated issuers | 607,550 | |
| Total net realized gain (loss) | (257,069) | |
| Change in net unrealized appreciation (depreciation) on: | ||
| Investment securities: | ||
| Affiliated issuers | (5,473,138) | |
| Total change in net unrealized appreciation (depreciation) | (5,473,138) | |
| Net gain (loss) | (5,730,207) | |
| Net increase (decrease) in net assets resulting from operations | $(5,708,584) |
See accompanying notes which are an integral part of the financial statements.
Statement of Changes in Net Assets
| Six months ended June 30, 2022 (Unaudited) | Year ended December 31, 2021 | |
| Increase (Decrease) in Net Assets | ||
| Operations | ||
| Net investment income (loss) | $21,623 | $623,475 |
| Net realized gain (loss) | (257,069) | 2,992,028 |
| Change in net unrealized appreciation (depreciation) | (5,473,138) | (261,283) |
| Net increase (decrease) in net assets resulting from operations | (5,708,584) | 3,354,220 |
| Distributions to shareholders | (2,809,100) | (1,973,678) |
| Share transactions | ||
| Proceeds from sales of shares | – | 480,105 |
| Reinvestment of distributions | 2,809,100 | 1,973,678 |
| Cost of shares redeemed | (1,164,572) | (2,974,517) |
| Net increase (decrease) in net assets resulting from share transactions | 1,644,528 | (520,734) |
| Total increase (decrease) in net assets | (6,873,156) | 859,808 |
| Net Assets | ||
| Beginning of period | 36,134,556 | 35,274,748 |
| End of period | $29,261,400 | $36,134,556 |
| Other Information | ||
| Shares | ||
| Sold | – | 31,605 |
| Issued in reinvestment of distributions | 209,478 | 132,610 |
| Redeemed | (87,803) | (197,335) |
| Net increase (decrease) | 121,675 | (33,120) |
See accompanying notes which are an integral part of the financial statements.
Financial Highlights
VIP Freedom Lifetime Income III Portfolio
| Six months ended (Unaudited) June 30, | Years endedDecember 31, | |||||
| 2022 | 2021 | 2020 | 2019 | 2018 | 2017 | |
| Selected Per–Share Data | ||||||
| Net asset value, beginning of period | $15.29 | $14.72 | $13.53 | $11.89 | $13.07 | $11.79 |
| Income from Investment Operations | ||||||
| Net investment income (loss)A,B | .01 | .26 | .16 | .26 | .19 | .22 |
| Net realized and unrealized gain (loss) | (2.33) | 1.15 | 1.83 | 2.11 | (.92) | 1.62 |
| Total from investment operations | (2.32) | 1.41 | 1.99 | 2.37 | (.73) | 1.84 |
| Distributions from net investment income | (.11) | (.16) | (.17) | (.27) | (.19) | (.23) |
| Distributions from net realized gain | (1.10) | (.67) | (.62) | (.47) | (.26) | (.33) |
| Total distributions | (1.20)C | (.84)C | (.80)C | (.73)C | (.45) | (.56) |
| Net asset value, end of period | $11.77 | $15.29 | $14.72 | $13.53 | $11.89 | $13.07 |
| Total ReturnD,E,F | (16.13)% | 9.78% | 15.23% | 20.44% | (5.68)% | 15.85% |
| Ratios to Average Net AssetsB,G,H | ||||||
| Expenses before reductionsI | - %J | -% | -% | -% | -% | -% |
| Expenses net of fee waivers, if any | - %I,J | - %I | - %I | - %I | - %I | -% |
| Expenses net of all reductions | - %I,J | - %I | - %I | - %I | - %I | -% |
| Net investment income (loss) | .13%J | 1.73% | 1.24% | 2.02% | 1.45% | 1.74% |
| Supplemental Data | ||||||
| Net assets, end of period (000 omitted) | $29,261 | $36,135 | $35,275 | $33,018 | $28,469 | $32,383 |
| Portfolio turnover rateK | 87%J | 28% | 35% | 26% | 35% | 15% |
A Calculated based on average shares outstanding during the period.
B Net investment income (loss) is affected by the timing of the declaration of dividends by any underlying mutual funds or exchange-traded funds (ETFs). Net investment income (loss) of any such underlying funds is not included in the Fund's net investment income (loss) ratio.
C Total distributions per share do not sum due to rounding.
D Total returns for periods of less than one year are not annualized.
E Total returns do not reflect charges attributable to your insurance company's separate account. Inclusion of these charges would reduce the total returns shown.
F Total returns would have been lower if certain expenses had not been reduced during the applicable periods shown.
G Fees and expenses of any underlying mutual funds or exchange-traded funds (ETFs) are not included in the Fund's expense ratio. The Fund indirectly bears its proportionate share of these expenses.
H Expense ratios reflect operating expenses of the class. Expenses before reductions do not reflect amounts reimbursed, waived, or reduced through arrangements with the investment adviser, brokerage services, or other offset arrangements, if applicable, and do not represent the amount paid by the class during periods when reimbursements, waivers or reductions occur.
I Amount represents less than .005%.
J Annualized
K Amount does not include the portfolio activity of any underlying mutual funds or exchange-traded funds (ETFs).
See accompanying notes which are an integral part of the financial statements.
Notes to Financial Statements (Unaudited)
For the period ended June 30, 2022
1. Organization.
VIP Freedom Lifetime Income I Portfolio, VIP Freedom Lifetime Income II Portfolio, and VIP Freedom Lifetime Income III Portfolio (the Funds) are funds of Variable Insurance Products Fund V (the Trust). The Trust is registered under the Investment Company Act of 1940, as amended (the 1940 Act), as an open-end management investment company organized as a Massachusetts business trust. Each Fund is authorized to issue an unlimited number of shares. Shares of each Fund may only be purchased by insurance companies for the purpose of funding variable annuity or variable life insurance contracts.
2. Significant Accounting Policies.
Each Fund is an investment company and applies the accounting and reporting guidance of the Financial Accounting Standards Board (FASB) Accounting Standards Codification Topic 946 Financial Services - Investment Companies. The financial statements have been prepared in conformity with accounting principles generally accepted in the United States of America (GAAP), which require management to make certain estimates and assumptions at the date of the financial statements. Actual results could differ from those estimates. Subsequent events, if any, through the date that the financial statements were issued have been evaluated in the preparation of the financial statements. Each Fund's Schedule of Investments lists any underlying mutual funds or exchange-traded funds (ETFs) but does not include the underlying holdings of these funds. The following summarizes the significant accounting policies of each Fund:
Investment Valuation. Investments are valued as of 4:00 p.m. Eastern time on the last calendar day of the period. Each Fund categorizes the inputs to valuation techniques used to value its investments into a disclosure hierarchy consisting of three levels as shown below:
- Level 1 – unadjusted quoted prices in active markets for identical investments
- Level 2 – other significant observable inputs (including quoted prices for similar investments, interest rates, prepayment speeds, etc.)
- Level 3 – unobservable inputs (including the Fund's own assumptions based on the best information available)
Valuation techniques used to value each Fund's investments by major category are as follows. Investments in open-end mutual funds are valued at their closing net asset value (NAV) each business day and are categorized as Level 1 in the hierarchy. The aggregate value of investments by input level as of June 30, 2022 is included at the end of the Fund's Schedule of Investments.
Investment Transactions and Income. For financial reporting purposes, the Funds' investment holdings and NAV include trades executed through the end of the last business day of the period. The NAV per share for processing shareholder transactions is calculated as of the close of business of the New York Stock Exchange (NYSE), normally 4:00 p.m. Eastern time and includes trades executed through the end of the prior business day. Gains and losses on securities sold are determined on the basis of identified cost. Income and capital gain distributions from any underlying mutual funds or exchange-traded funds (ETFs) are recorded on the ex-dividend date.
Expenses. Expenses directly attributable to a fund are charged to that fund. Expenses attributable to more than one fund are allocated among the respective funds on the basis of relative net assets or other appropriate methods. Expenses included in the accompanying financial statements reflect the expenses of that fund and do not include any expenses associated with any underlying mutual funds or exchange-traded funds. Although not included in a fund's expenses, a fund indirectly bears its proportionate share of these expenses through the net asset value of each underlying mutual fund or exchange-traded fund. Expense estimates are accrued in the period to which they relate and adjustments are made when actual amounts are known.
Income Tax Information and Distributions to Shareholders. Each year, each Fund intends to qualify as a regulated investment company under Subchapter M of the Internal Revenue Code, including distributing substantially all of its taxable income and realized gains. As a result, no provision for U.S. Federal income taxes is required. Each Fund files a U.S. federal tax return, in addition to state and local tax returns as required. Each Fund's federal income tax returns are subject to examination by the Internal Revenue Service (IRS) for a period of three fiscal years after they are filed. State and local tax returns may be subject to examination for an additional fiscal year depending on the jurisdiction.
Distributions are declared and recorded on the ex-dividend date. Income and capital gain distributions are determined in accordance with income tax regulations, which may differ from GAAP.
Capital accounts within the financial statements are adjusted for permanent book-tax differences. These adjustments have no impact on net assets or the results of operations. Capital accounts are not adjusted for temporary book-tax differences which will reverse in a subsequent period.
Book-tax differences are primarily due to short-term gain distributions from the Underlying Funds and losses deferred due to wash sales.
As of period end, the cost and unrealized appreciation (depreciation) in securities, and derivatives if applicable, for federal income tax purposes were as follows for each Fund:
| Tax cost | Gross unrealized appreciation | Gross unrealized depreciation | Net unrealized appreciation (depreciation) | |
| VIP Freedom Lifetime Income I Portfolio | $9,934,790 | $321,000 | $(307,440) | $13,560 |
| VIP Freedom Lifetime Income II Portfolio | 26,783,215 | 1,707,188 | (946,907) | 760,281 |
| VIP Freedom Lifetime Income III Portfolio | 27,825,651 | 2,657,740 | (1,221,993) | 1,435,747 |
3. Purchases and Sales of Investments.
Purchases and sales of securities, other than short-term securities and in-kind transactions, as applicable, are noted in the table below.
| Purchases ($) | Sales ($) | |
| VIP Freedom Lifetime Income I Portfolio | 5,339,450 | 5,833,178 |
| VIP Freedom Lifetime Income II Portfolio | 14,097,340 | 14,874,869 |
| VIP Freedom Lifetime Income III Portfolio | 14,204,246 | 14,739,644 |
4. Fees and Other Transactions with Affiliates.
Management Fee. Fidelity Management & Research Company LLC (the investment adviser) provides the Funds with investment management related services. The Funds do not pay any fees for these services.
Interfund Trades. Funds may purchase from or sell securities to other Fidelity Funds under procedures adopted by the Board. The procedures have been designed to ensure these interfund trades are executed in accordance with Rule 17a-7 of the 1940 Act. Any interfund trades are included within the respective purchases and sales amounts shown in the Purchases and Sales of Investments note. During the period, there were no interfund trades.
Reallocation of Underlying Fund Investments. During the period, the investment adviser reallocated investments of the Funds. This involved taxable redemptions of the Funds' interest in VIP Investment Grade Bond Portfolio Investor Class, ("Underlying Fund") for investments and cash and non-taxable exchanges of those investments and cash for shares of VIP Investment Grade Bond Portfolio II - Investor Class which is affiliated investment company managed by FMR. Net realized gain (loss) on the redemptions of the Underlying Fund in connection with the reallocation is included in the accompanying Statements of Operations as "Net realized gain (loss) on Affiliated issuers."
Details of these transactions with the net related gain (loss) for the Funds are presented in the accompanying table:
| Value of Investments and Cash reallocated ($) | Net realized Gain (Loss) on redemptions of Underlying Fund ($) | |
| VIP Freedom Lifetime Income I Portfolio | 3,808,654 | (303,778) |
| VIP Freedom Lifetime Income II Portfolio | 9,362,250 | (795,525) |
| VIP Freedom Lifetime Income III Portfolio | 8,228,729 | (785,806) |
5. Other.
A fund's organizational documents provide former and current trustees and officers with a limited indemnification against liabilities arising in connection with the performance of their duties to the fund. In the normal course of business, a fund may also enter into contracts that provide general indemnifications. A fund's maximum exposure under these arrangements is unknown as this would be dependent on future claims that may be made against a fund. The risk of material loss from such claims is considered remote.
At the end of the period, the investment adviser or its affiliates were owners of record of more than 10% of the outstanding shares as follows:
| Affiliated % | |
| VIP Freedom Lifetime Income I Portfolio | 100% |
| VIP Freedom Lifetime Income II Portfolio | 100% |
| VIP Freedom Lifetime Income III Portfolio | 100% |
6. Coronavirus (COVID-19) Pandemic.
An outbreak of COVID-19 first detected in China during December 2019 has since spread globally and was declared a pandemic by the World Health Organization during March 2020. Developments that disrupt global economies and financial markets, such as the COVID-19 pandemic, may magnify factors that affect the Funds' performance.
Shareholder Expense Example
As a shareholder, you incur two types of costs: (1) transaction costs, which may include sales charges (loads) on purchase payments or redemption proceeds, as applicable and (2) ongoing costs, which generally include management fees, distribution and/or service (12b-1) fees and other Fund expenses. This Example is intended to help you understand your ongoing costs (in dollars) of investing in a fund and to compare these costs with the ongoing costs of investing in other mutual funds.
The Example is based on an investment of $1,000 invested at the beginning of the period and held for the entire period (January 1, 2022 to June 30, 2022).
Actual Expenses
The first line of the accompanying table provides information about actual account values and actual expenses. You may use the information in this line, together with the amount you invested, to estimate the expenses that you paid over the period. Simply divide your account value by $1,000.00 (for example, an $8,600 account value divided by $1,000.00 = 8.6), then multiply the result by the number in the first line for a class/Fund under the heading entitled "Expenses Paid During Period" to estimate the expenses you paid on your account during this period. If any fund is a shareholder of any underlying mutual funds or exchange-traded funds (ETFs) (the Underlying Funds), such fund indirectly bears its proportional share of the expenses of the Underlying Funds in addition to the direct expenses incurred presented in the table. These fees and expenses are not included in the annualized expense ratio used to calculate the expense estimate in the table below. The estimate of expenses does not include any fees or other expenses of any variable annuity or variable life insurance product. If they were, the estimate of expenses you paid during the period would be higher, and your ending account value would be lower.
Hypothetical Example for Comparison Purposes
The second line of the accompanying table provides information about hypothetical account values and hypothetical expenses based on the actual expense ratio and an assumed rate of return of 5% per year before expenses, which is not the actual return. The hypothetical account values and expenses may not be used to estimate the actual ending account balance or expenses you paid for the period. You may use this information to compare the ongoing costs of investing in the Fund and other funds. To do so, compare this 5% hypothetical example with the 5% hypothetical examples that appear in the shareholder reports of the other funds. If any fund is a shareholder of any Underlying Funds, such fund indirectly bears its proportional share of the expenses of the Underlying Funds in addition to the direct expenses as presented in the table. These fees and expenses are not included in the annualized expense ratio used to calculate the expense estimate in the table below. The estimate of expenses does not include any fees or other expenses of any variable annuity or variable life insurance product. If they were, the estimate of expenses you paid during the period would be higher, and your ending account value would be lower.
Please note that the expenses shown in the table are meant to highlight your ongoing costs only and do not reflect any transaction costs. Therefore, the second line of the table is useful in comparing ongoing costs only, and will not help you determine the relative total costs of owning different funds. In addition, if these transactional costs were included, your costs would have been higher.
| Annualized Expense Ratio-A | Beginning Account Value January 1, 2022 | Ending Account Value June 30, 2022 | Expenses Paid During Period-B January 1, 2022 to June 30, 2022 |
|
| VIP Freedom Lifetime Income I Portfolio | - %-C | |||
| Actual | $1,000.00 | $889.90 | $--D | |
| Hypothetical-E | $1,000.00 | $1,024.79 | $--D | |
| VIP Freedom Lifetime Income II Portfolio | - %-C | |||
| Actual | $1,000.00 | $867.20 | $--D | |
| Hypothetical-E | $1,000.00 | $1,024.79 | $--D | |
| VIP Freedom Lifetime Income III Portfolio | - %-C | |||
| Actual | $1,000.00 | $838.70 | $--D | |
| Hypothetical-E | $1,000.00 | $1,024.79 | $--D |
A Annualized expense ratio reflects expenses net of applicable fee waivers.
B Expenses are equal to the annualized expense ratio, multiplied by the average account value over the period, multiplied by 181/ 365 (to reflect the one-half year period). The fees and expenses of any Underlying Funds are not included in each annualized expense ratio.
C Amount represent less than .005%.
D Amount represent less than $.01.
E 5% return per year before expenses
Liquidity Risk Management Program
The Securities and Exchange Commission adopted Rule 22e-4 under the Investment Company Act of 1940 (the Liquidity Rule) to promote effective liquidity risk management throughout the open-end investment company industry, thereby reducing the risk that funds will be unable to meet their redemption obligations and mitigating dilution of the interests of fund shareholders.
The Funds have adopted and implemented a liquidity risk management program pursuant to the Liquidity Rule (the Program) effective December 1, 2018. The Program is reasonably designed to assess and manage each Fund’s liquidity risk and to comply with the requirements of the Liquidity Rule. Each Fund’s Board of Trustees (the Board) has designated each Fund’s investment adviser as administrator of the Program. The Fidelity advisers have established a Liquidity Risk Management Committee (the LRM Committee) to manage the Program for each of the Fidelity Funds. The LRM Committee monitors the adequacy and effectiveness of implementation of the Program and on a periodic basis assesses each Fund’s liquidity risk based on a variety of factors including (1) the Fund’s investment strategy, (2) portfolio liquidity and cash flow projections during normal and reasonably foreseeable stressed conditions, (3) shareholder redemptions, (4) borrowings and other funding sources and (5) in the case of exchange-traded funds, certain additional factors including the effect of the Fund’s prices and spreads, market participants, and basket compositions on the overall liquidity of the Fund’s portfolio, as applicable.
In accordance with the Program, each of the Fund’s portfolio investments is classified into one of four liquidity categories described below based on a determination of a reasonable expectation for how long it would take to convert the investment to cash (or sell or dispose of the investment) without significantly changing its market value.
- Highly liquid investments – cash or convertible to cash within three business days or less
- Moderately liquid investments – convertible to cash in three to seven calendar days
- Less liquid investments – can be sold or disposed of, but not settled, within seven calendar days
- Illiquid investments – cannot be sold or disposed of within seven calendar days
Liquidity classification determinations take into account a variety of factors including various market, trading and investment-specific considerations, as well as market depth, and generally utilize analysis from a third-party liquidity metrics service.
The Liquidity Rule places a 15% limit on a fund’s illiquid investments and requires funds that do not primarily hold assets that are highly liquid investments to determine and maintain a minimum percentage of the fund’s net assets to be invested in highly liquid investments (highly liquid investment minimum or HLIM). The Program includes provisions reasonably designed to comply with the 15% limit on illiquid investments and for determining, periodically reviewing and complying with the HLIM requirement as applicable.
At a recent meeting of the Fund’s Board of Trustees, the LRM Committee provided a written report to the Board pertaining to the operation, adequacy, and effectiveness of implementation of the Program for the annual period from December 1, 2020 through November 30, 2021. The report concluded that the Program has been implemented and is operating effectively and is reasonably designed to assess and manage the Fund’s liquidity risk.
![]()
VIPFLI-SANN-0822
1.816202.116
Fidelity® Variable Insurance Products:
Investor Freedom Funds - Income, 2005, 2010, 2015, 2020, 2025, 2030
Investor Freedom Income® Portfolio
Investor Freedom® 2005 Portfolio
Investor Freedom® 2010 Portfolio
Investor Freedom® 2015 Portfolio
Investor Freedom® 2020 Portfolio
Investor Freedom® 2025 Portfolio
Investor Freedom® 2030 Portfolio
Semi-Annual Report
June 30, 2022
Contents
To view a fund's proxy voting guidelines and proxy voting record for the 12-month period ended June 30, visit http://www.fidelity.com/proxyvotingresults or visit the Securities and Exchange Commission's (SEC) web site at http://www.sec.gov.
You may also call 1-877-208-0098 to request a free copy of the proxy voting guidelines.
Fidelity® Variable Insurance Products are separate account options which are purchased through a variable insurance contract.
Standard & Poor's, S&P and S&P 500 are registered service marks of The McGraw-Hill Companies, Inc. and have been licensed for use by Fidelity Distributors Corporation.
Other third-party marks appearing herein are the property of their respective owners.
All other marks appearing herein are registered or unregistered trademarks or service marks of FMR LLC or an affiliated company. © 2022 FMR LLC. All rights reserved.
This report and the financial statements contained herein are submitted for the general information of the shareholders of the Funds. This report is not authorized for distribution to prospective investors in the Funds unless preceded or accompanied by an effective prospectus.
A fund files its complete schedule of portfolio holdings with the SEC for the first and third quarters of each fiscal year on Form N-PORT. Forms N-PORT are available on the SEC’s web site at http://www.sec.gov. A fund's Forms N-PORT may be reviewed and copied at the SEC’s Public Reference Room in Washington, DC. Information regarding the operation of the SEC's Public Reference Room may be obtained by calling 1-800-SEC-0330.
For a complete list of a fund's portfolio holdings, view the most recent holdings listing, semiannual report, or annual report on Fidelity's web site at http://www.fidelity.com, http://www.institutional.fidelity.com, or http://www.401k.com, as applicable.
NOT FDIC INSURED •MAY LOSE VALUE •NO BANK GUARANTEE
Neither the Funds nor Fidelity Distributors Corporation is a bank.
Note to Shareholders:
Early in 2020, the outbreak and spread of COVID-19 emerged as a public health emergency that had a major influence on financial markets, primarily based on its impact on the global economy and corporate earnings. On March 11, 2020, the World Health Organization declared the COVID-19 outbreak a pandemic, citing sustained risk of further global spread. The pandemic prompted a number of measures to limit the spread of COVID-19, including travel and border restrictions, quarantines, and restrictions on large gatherings. In turn, these resulted in lower consumer activity, diminished demand for a wide range of products and services, disruption in manufacturing and supply chains, and – given the wide variability in outcomes regarding the outbreak – significant market uncertainty and volatility. To help stem the turmoil, the U.S. government took unprecedented action – in concert with the U.S. Federal Reserve and central banks around the world – to help support consumers, businesses, and the broader economy, and to limit disruption to the financial system.
In general, the overall impact of the pandemic lessened in 2021, amid a resilient economy and widespread distribution of three COVID-19 vaccines granted emergency use authorization from the U.S. Food and Drug Administration (FDA) early in the year. Still, the situation remains dynamic, and the extent and duration of its influence on financial markets and the economy is highly uncertain, due in part to a recent spike in cases based on highly contagious variants of the coronavirus.
Extreme events such as the COVID-19 crisis are exogenous shocks that can have significant adverse effects on mutual funds and their investments. Although multiple asset classes may be affected by market disruption, the duration and impact may not be the same for all types of assets. Fidelity is committed to helping you stay informed amid news about COVID-19 and during increased market volatility, and we continue to take extra steps to be responsive to customer needs. We encourage you to visit us online, where we offer ongoing updates, commentary, and analysis on the markets and our funds.
VIP Investor Freedom Income Portfolio℠
Investment Summary (Unaudited)
The information in the following tables is based on the direct investments of the Fund.Top Holdings as of June 30, 2022
| % of fund's net assets | |
| VIP Investment Grade Bond II Portfolio Investor Class | 36.1 |
| VIP Government Money Market Portfolio Investor Class 1.16% | 19.0 |
| Fidelity Inflation-Protected Bond Index Fund | 16.6 |
| VIP Overseas Portfolio Investor Class | 7.3 |
| VIP Emerging Markets Portfolio Investor Class | 6.8 |
| Fidelity Long-Term Treasury Bond Index Fund | 3.7 |
| Fidelity International Bond Index Fund | 2.6 |
| VIP High Income Portfolio Investor Class | 1.6 |
| VIP Growth Portfolio Investor Class | 1.3 |
| VIP Growth & Income Portfolio Investor Class | 1.3 |
| 96.3 |
Asset Allocation (% of fund's net assets)
| Period end | ||
| Domestic Equity Funds | 6.3% | |
| International Equity Funds | 14.1% | |
| Bond Funds | 60.6% | |
| Short-Term Funds | 19.0% | |
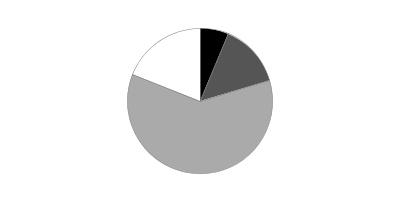
VIP Investor Freedom Income Portfolio℠
Schedule of Investments June 30, 2022 (Unaudited)
Showing Percentage of Net Assets
| Domestic Equity Funds - 6.3% | |||
| Shares | Value | ||
| VIP Contrafund Portfolio Investor Class (a) | 22,775 | $885,940 | |
| VIP Equity-Income Portfolio Investor Class (a) | 39,350 | 910,963 | |
| VIP Growth & Income Portfolio Investor Class (a) | 47,175 | 1,080,306 | |
| VIP Growth Portfolio Investor Class (a) | 15,104 | 1,116,456 | |
| VIP Mid Cap Portfolio Investor Class (a) | 8,375 | 263,323 | |
| VIP Value Portfolio Investor Class (a) | 40,592 | 665,714 | |
| VIP Value Strategies Portfolio Investor Class (a) | 22,998 | 324,966 | |
| TOTAL DOMESTIC EQUITY FUNDS | |||
| (Cost $3,604,809) | 5,247,668 | ||
| International Equity Funds - 14.1% | |||
| VIP Emerging Markets Portfolio Investor Class (a) | 563,164 | 5,631,642 | |
| VIP Overseas Portfolio Investor Class (a) | 291,592 | 6,047,608 | |
| TOTAL INTERNATIONAL EQUITY FUNDS | |||
| (Cost $11,156,996) | 11,679,250 | ||
| Bond Funds - 60.6% | |||
| Fidelity Inflation-Protected Bond Index Fund (a) | 1,350,514 | 13,707,716 | |
| Fidelity International Bond Index Fund (a) | 233,404 | 2,123,979 | |
| Fidelity Long-Term Treasury Bond Index Fund (a) | 265,535 | 3,061,618 | |
| VIP High Income Portfolio Investor Class (a) | 302,723 | 1,359,225 | |
| VIP Investment Grade Bond II Portfolio Investor Class (a) | 3,061,338 | 29,878,663 | |
| TOTAL BOND FUNDS | |||
| (Cost $51,545,445) | 50,131,201 | ||
| Short-Term Funds - 19.0% | |||
| VIP Government Money Market Portfolio Investor Class 1.16% (a)(b) | |||
| (Cost $15,682,096) | 15,682,096 | 15,682,096 | |
| TOTAL INVESTMENT IN SECURITIES - 100.0% | |||
| (Cost $81,989,346) | 82,740,215 | ||
| NET OTHER ASSETS (LIABILITIES) - 0.0% | 36 | ||
| NET ASSETS - 100% | $82,740,251 |
Legend
(a) Affiliated Fund
(b) The rate quoted is the annualized seven-day yield of the fund at period end.
Affiliated Underlying Funds
Fiscal year to date information regarding the Fund's investments in affiliated Underlying Funds is presented below. Exchanges between classes of the same affiliated Underlying Funds may occur, and are excluded from purchases and sales below if applicable. If an underlying Fund changes its name, the name presented below is the name in effect at period end.
| Affiliate | Value, beginning of period | Purchases(a) | Sales Proceeds(a) | Dividend Income | Realized Gain (loss) | Change in Unrealized appreciation (depreciation) | Value, end of period |
| Fidelity Inflation-Protected Bond Index Fund | $14,893,005 | $2,446,205 | $2,274,258 | $-- | $(65,409) | $(1,291,827) | $13,707,716 |
| Fidelity International Bond Index Fund | 1,533,905 | 1,067,795 | 302,997 | 3,353 | (9,797) | (164,927) | 2,123,979 |
| Fidelity Long-Term Treasury Bond Index Fund | 2,840,989 | 1,393,411 | 545,546 | 30,045 | (42,911) | (584,325) | 3,061,618 |
| VIP Contrafund Portfolio Investor Class | 1,224,565 | 344,483 | 342,210 | 11,510 | (21,543) | (319,355) | 885,940 |
| VIP Emerging Markets Portfolio Investor Class | 6,950,320 | 1,423,368 | 1,369,098 | -- | (90,455) | (1,282,493) | 5,631,642 |
| VIP Equity-Income Portfolio Investor Class | 1,295,195 | 276,468 | 537,145 | 1,650 | 32,056 | (155,611) | 910,963 |
| VIP Government Money Market Portfolio Investor Class 1.16% | 20,946,846 | 1,211,506 | 6,476,256 | 20,156 | -- | -- | 15,682,096 |
| VIP Growth & Income Portfolio Investor Class | 1,474,368 | 362,172 | 605,001 | 2,844 | 93,419 | (244,652) | 1,080,306 |
| VIP Growth Portfolio Investor Class | 1,252,318 | 601,639 | 379,087 | 58,774 | (36,097) | (322,317) | 1,116,456 |
| VIP High Income Portfolio Investor Class | 2,042,784 | 99,100 | 540,948 | 786 | (46,770) | (194,941) | 1,359,225 |
| VIP Investment Grade Bond Portfolio II Investor Class | -- | 32,129,753 | 1,494,280 | -- | (24,368) | (732,442) | 29,878,663 |
| VIP Investment Grade Bond Portfolio Investor Class | 39,134,218 | 3,186,523 | 37,336,203 | 1,811,764 | (3,532,546) | (1,451,992) | -- |
| VIP Mid Cap Portfolio Investor Class | 359,298 | 75,587 | 92,607 | 8,353 | (7,904) | (71,051) | 263,323 |
| VIP Overseas Portfolio Investor Class | 7,064,767 | 1,924,495 | 725,181 | 54,845 | (48,093) | (2,168,380) | 6,047,608 |
| VIP Value Portfolio Investor Class | 949,105 | 167,339 | 370,467 | 12,363 | 42,860 | (123,123) | 665,714 |
| VIP Value Strategies Portfolio Investor Class | 465,198 | 67,557 | 156,691 | 3,980 | 22,706 | (73,804) | 324,966 |
| $102,426,881 | $46,777,401 | $53,547,975 | $2,020,423 | $(3,734,852) | $(9,181,240) | $82,740,215 |
(a) Includes the value of shares purchased or redeemed through in-kind transactions, as applicable.
Amounts in the income column in the above table include any capital gain distributions from underlying funds, which are presented in the corresponding line-item in the Statement of Operations, if applicable.
Investment Valuation
The following is a summary of the inputs used, as of June 30, 2022, involving the Fund's assets and liabilities carried at fair value. The inputs or methodology used for valuing securities may not be an indication of the risk associated with investing in those securities. For more information on valuation inputs, and their aggregation into the levels used below, please refer to the Investment Valuation section in the accompanying Notes to Financial Statements.
| Valuation Inputs at Reporting Date: | ||||
| Description | Total | Level 1 | Level 2 | Level 3 |
| Investments in Securities: | ||||
| Domestic Equity Funds | $5,247,668 | $5,247,668 | $-- | $-- |
| International Equity Funds | 11,679,250 | 11,679,250 | -- | -- |
| Bond Funds | 50,131,201 | 50,131,201 | -- | -- |
| Short-Term Funds | 15,682,096 | 15,682,096 | -- | -- |
| Total Investments in Securities: | $82,740,215 | $82,740,215 | $-- | $-- |
See accompanying notes which are an integral part of the financial statements.
VIP Investor Freedom Income Portfolio℠
Financial Statements
Statement of Assets and Liabilities
| June 30, 2022 (Unaudited) | ||
| Assets | ||
| Investment in securities, at value — See accompanying schedule: | ||
| Affiliated issuers (cost $81,989,346) | $82,740,215 | |
| Total Investment in Securities (cost $81,989,346) | $82,740,215 | |
| Cash | 34 | |
| Receivable for investments sold | 785,291 | |
| Total assets | 83,525,540 | |
| Liabilities | ||
| Payable for investments purchased | $750,514 | |
| Payable for fund shares redeemed | 34,775 | |
| Total liabilities | 785,289 | |
| Net Assets | $82,740,251 | |
| Net Assets consist of: | ||
| Paid in capital | $84,078,272 | |
| Total accumulated earnings (loss) | (1,338,021) | |
| Net Assets | $82,740,251 | |
| Net Asset Value, offering price and redemption price per share ($82,740,251 ÷ 7,668,262 shares) | $10.79 |
See accompanying notes which are an integral part of the financial statements.
Statement of Operations
| Six months ended June 30, 2022 (Unaudited) | ||
| Investment Income | ||
| Dividends: | ||
| Affiliated issuers | $58,498 | |
| Expenses | ||
| Independent trustees' fees and expenses | $144 | |
| Total expenses | 144 | |
| Net investment income (loss) | 58,354 | |
| Realized and Unrealized Gain (Loss) | ||
| Net realized gain (loss) on: | ||
| Investment securities: | ||
| Affiliated issuers | (3,734,852) | |
| Capital gain distributions from underlying funds: | ||
| Affiliated issuers | 1,961,925 | |
| Total net realized gain (loss) | (1,772,927) | |
| Change in net unrealized appreciation (depreciation) on: | ||
| Investment securities: | ||
| Affiliated issuers | (9,181,240) | |
| Total change in net unrealized appreciation (depreciation) | (9,181,240) | |
| Net gain (loss) | (10,954,167) | |
| Net increase (decrease) in net assets resulting from operations | $(10,895,813) |
See accompanying notes which are an integral part of the financial statements.
Statement of Changes in Net Assets
| Six months ended June 30, 2022 (Unaudited) | Year ended December 31, 2021 | |
| Increase (Decrease) in Net Assets | ||
| Operations | ||
| Net investment income (loss) | $58,354 | $1,881,636 |
| Net realized gain (loss) | (1,772,927) | 3,847,569 |
| Change in net unrealized appreciation (depreciation) | (9,181,240) | (2,516,909) |
| Net increase (decrease) in net assets resulting from operations | (10,895,813) | 3,212,296 |
| Distributions to shareholders | (3,904,684) | (3,665,175) |
| Share transactions | ||
| Proceeds from sales of shares | 2,605,944 | 16,910,466 |
| Reinvestment of distributions | 3,904,684 | 3,665,175 |
| Cost of shares redeemed | (11,396,796) | (15,585,140) |
| Net increase (decrease) in net assets resulting from share transactions | (4,886,168) | 4,990,501 |
| Total increase (decrease) in net assets | (19,686,665) | 4,537,622 |
| Net Assets | ||
| Beginning of period | 102,426,916 | 97,889,294 |
| End of period | $82,740,251 | $102,426,916 |
| Other Information | ||
| Shares | ||
| Sold | 222,565 | 1,336,934 |
| Issued in reinvestment of distributions | 332,031 | 291,689 |
| Redeemed | (1,001,174) | (1,231,887) |
| Net increase (decrease) | (446,578) | 396,736 |
See accompanying notes which are an integral part of the financial statements.
Financial Highlights
VIP Investor Freedom Income Portfolio
| Six months ended (Unaudited) June 30, | Years endedDecember 31, | |||||
| 2022 | 2021 | 2020 | 2019 | 2018 | 2017 | |
| Selected Per–Share Data | ||||||
| Net asset value, beginning of period | $12.62 | $12.68 | $11.91 | $11.10 | $11.67 | $11.03 |
| Income from Investment Operations | ||||||
| Net investment income (loss)A,B | .01 | .24 | .16 | .26 | .21 | .18 |
| Net realized and unrealized gain (loss) | (1.36) | .17 | 1.06 | 1.05 | (.45) | .75 |
| Total from investment operations | (1.35) | .41 | 1.22 | 1.31 | (.24) | .93 |
| Distributions from net investment income | (.11) | (.13) | (.16) | (.25) | (.20) | (.18) |
| Distributions from net realized gain | (.38) | (.34) | (.29) | (.25) | (.13) | (.11) |
| Total distributions | (.48)C | (.47) | (.45) | (.50) | (.33) | (.29) |
| Net asset value, end of period | $10.79 | $12.62 | $12.68 | $11.91 | $11.10 | $11.67 |
| Total ReturnD,E,F | (10.99)% | 3.28% | 10.40% | 12.02% | (2.03)% | 8.45% |
| Ratios to Average Net AssetsB,G,H | ||||||
| Expenses before reductionsI | - %J | -% | -% | -% | -% | -% |
| Expenses net of fee waivers, if any | - %I,J | - %I | - %I | - %I | - %I | -% |
| Expenses net of all reductions | - %I,J | - %I | - %I | - %I | - %I | -% |
| Net investment income (loss) | .13%J | 1.88% | 1.32% | 2.19% | 1.79% | 1.59% |
| Supplemental Data | ||||||
| Net assets, end of period (000 omitted) | $82,740 | $102,427 | $97,889 | $85,736 | $74,748 | $75,445 |
| Portfolio turnover rateK | 101%J | 27% | 49% | 25% | 42% | 25% |
A Calculated based on average shares outstanding during the period.
B Net investment income (loss) is affected by the timing of the declaration of dividends by any underlying mutual funds or exchange-traded funds (ETFs). Net investment income (loss) of any such underlying funds is not included in the Fund's net investment income (loss) ratio.
C Total distributions per share do not sum due to rounding.
D Total returns for periods of less than one year are not annualized.
E Total returns do not reflect charges attributable to your insurance company's separate account. Inclusion of these charges would reduce the total returns shown.
F Total returns would have been lower if certain expenses had not been reduced during the applicable periods shown.
G Fees and expenses of any underlying mutual funds or exchange-traded funds (ETFs) are not included in the Fund's expense ratio. The Fund indirectly bears its proportionate share of these expenses.
H Expense ratios reflect operating expenses of the class. Expenses before reductions do not reflect amounts reimbursed, waived, or reduced through arrangements with the investment adviser, brokerage services, or other offset arrangements, if applicable, and do not represent the amount paid by the class during periods when reimbursements, waivers or reductions occur.
I Amount represents less than .005%.
J Annualized
K Amount does not include the portfolio activity of any underlying mutual funds or exchange-traded funds (ETFs).
See accompanying notes which are an integral part of the financial statements.
VIP Investor Freedom 2005 Portfolio℠
Investment Summary (Unaudited)
The information in the following tables is based on the direct investments of the Fund.Top Holdings as of June 30, 2022
| % of fund's net assets | |
| VIP Investment Grade Bond II Portfolio Investor Class | 35.5 |
| VIP Government Money Market Portfolio Investor Class 1.16% | 17.6 |
| Fidelity Inflation-Protected Bond Index Fund | 16.3 |
| VIP Overseas Portfolio Investor Class | 7.9 |
| VIP Emerging Markets Portfolio Investor Class | 7.1 |
| Fidelity Long-Term Treasury Bond Index Fund | 3.8 |
| Fidelity International Bond Index Fund | 2.6 |
| VIP High Income Portfolio Investor Class | 1.6 |
| VIP Growth Portfolio Investor Class | 1.6 |
| VIP Growth & Income Portfolio Investor Class | 1.6 |
| 95.6 |
Asset Allocation (% of fund's net assets)
| Period end | ||
| Domestic Equity Funds | 7.6% | |
| International Equity Funds | 15.0% | |
| Bond Funds | 59.8% | |
| Short-Term Funds | 17.6% | |

VIP Investor Freedom 2005 Portfolio℠
Schedule of Investments June 30, 2022 (Unaudited)
Showing Percentage of Net Assets
| Domestic Equity Funds - 7.6% | |||
| Shares | Value | ||
| VIP Contrafund Portfolio Investor Class (a) | 8,506 | $330,902 | |
| VIP Equity-Income Portfolio Investor Class (a) | 14,699 | 340,283 | |
| VIP Growth & Income Portfolio Investor Class (a) | 17,620 | 403,503 | |
| VIP Growth Portfolio Investor Class (a) | 5,641 | 416,989 | |
| VIP Mid Cap Portfolio Investor Class (a) | 3,128 | 98,355 | |
| VIP Value Portfolio Investor Class (a) | 15,161 | 248,635 | |
| VIP Value Strategies Portfolio Investor Class (a) | 8,590 | 121,378 | |
| TOTAL DOMESTIC EQUITY FUNDS | |||
| (Cost $1,315,077) | 1,960,045 | ||
| International Equity Funds - 15.0% | |||
| VIP Emerging Markets Portfolio Investor Class (a) | 181,947 | 1,819,473 | |
| VIP Overseas Portfolio Investor Class (a) | 98,323 | 2,039,219 | |
| TOTAL INTERNATIONAL EQUITY FUNDS | |||
| (Cost $3,463,707) | 3,858,692 | ||
| Bond Funds - 59.8% | |||
| Fidelity Inflation-Protected Bond Index Fund (a) | 414,136 | 4,203,477 | |
| Fidelity International Bond Index Fund (a) | 74,755 | 680,269 | |
| Fidelity Long-Term Treasury Bond Index Fund (a) | 85,262 | 983,067 | |
| VIP High Income Portfolio Investor Class (a) | 94,365 | 423,700 | |
| VIP Investment Grade Bond II Portfolio - Investor Class (a) | 936,787 | 9,143,041 | |
| TOTAL BOND FUNDS | |||
| (Cost $15,784,229) | 15,433,554 | ||
| Short-Term Funds - 17.6% | |||
| VIP Government Money Market Portfolio Investor Class 1.16% (a)(b) | |||
| (Cost $4,534,831) | 4,534,831 | 4,534,831 | |
| TOTAL INVESTMENT IN SECURITIES - 100.0% | |||
| (Cost $25,097,844) | 25,787,122 | ||
| NET OTHER ASSETS (LIABILITIES) - 0.0% | (1) | ||
| NET ASSETS - 100% | $25,787,121 |
Legend
(a) Affiliated Fund
(b) The rate quoted is the annualized seven-day yield of the fund at period end.
Affiliated Underlying Funds
Fiscal year to date information regarding the Fund's investments in affiliated Underlying Funds is presented below. Exchanges between classes of the same affiliated Underlying Funds may occur, and are excluded from purchases and sales below if applicable. If an underlying Fund changes its name, the name presented below is the name in effect at period end.
| Affiliate | Value, beginning of period | Purchases(a) | Sales Proceeds(a) | Dividend Income | Realized Gain (loss) | Change in Unrealized appreciation (depreciation) | Value, end of period |
| Fidelity Inflation-Protected Bond Index Fund | $4,326,793 | $832,549 | $548,009 | $-- | $(8,709) | $(399,147) | $4,203,477 |
| Fidelity International Bond Index Fund | 475,255 | 339,034 | 78,533 | 1,078 | (2,249) | (53,238) | 680,269 |
| Fidelity Long-Term Treasury Bond Index Fund | 873,470 | 444,063 | 135,470 | 9,549 | (8,806) | (190,190) | 983,067 |
| VIP Contrafund Portfolio Investor Class | 462,919 | 106,280 | 109,418 | 4,289 | (4,812) | (124,067) | 330,902 |
| VIP Emerging Markets Portfolio Investor Class | 2,189,325 | 483,678 | 409,432 | -- | (29,784) | (414,314) | 1,819,473 |
| VIP Equity-Income Portfolio Investor Class | 489,651 | 77,514 | 180,195 | 616 | 16,152 | (62,839) | 340,283 |
| VIP Government Money Market Portfolio Investor Class 1.16% | 5,765,973 | 374,138 | 1,605,280 | 5,824 | -- | -- | 4,534,831 |
| VIP Growth & Income Portfolio Investor Class | 557,367 | 108,763 | 205,440 | 1,060 | 57,241 | (114,428) | 403,503 |
| VIP Growth Portfolio Investor Class | 473,451 | 201,477 | 122,977 | 21,916 | (10,780) | (124,182) | 416,989 |
| VIP High Income Portfolio Investor Class | 612,507 | 36,191 | 150,707 | 235 | (15,333) | (58,958) | 423,700 |
| VIP Investment Grade Bond Portfolio II Investor Class | -- | 9,876,468 | 498,593 | -- | (10,983) | (223,851) | 9,143,041 |
| VIP Investment Grade Bond Portfolio Investor Class | 11,429,832 | 1,041,738 | 10,997,356 | 529,678 | (898,182) | (576,032) | -- |
| VIP Mid Cap Portfolio Investor Class | 135,837 | 24,414 | 31,924 | 3,114 | (2,728) | (27,244) | 98,355 |
| VIP Overseas Portfolio Investor Class | 2,381,563 | 654,258 | 247,320 | 18,296 | (17,076) | (732,206) | 2,039,219 |
| VIP Value Portfolio Investor Class | 358,807 | 51,787 | 132,150 | 4,614 | 19,236 | (49,045) | 248,635 |
| VIP Value Strategies Portfolio Investor Class | 175,881 | 19,361 | 54,586 | 1,487 | 10,578 | (29,856) | 121,378 |
| $30,708,631 | $14,671,713 | $15,507,390 | $601,756 | $(906,235) | $(3,179,597) | $25,787,122 |
(a) Includes the value of shares purchased or redeemed through in-kind transactions, as applicable.
Amounts in the income column in the above table include any capital gain distributions from underlying funds, which are presented in the corresponding line-item in the Statement of Operations, if applicable.
Investment Valuation
The following is a summary of the inputs used, as of June 30, 2022, involving the Fund's assets and liabilities carried at fair value. The inputs or methodology used for valuing securities may not be an indication of the risk associated with investing in those securities. For more information on valuation inputs, and their aggregation into the levels used below, please refer to the Investment Valuation section in the accompanying Notes to Financial Statements.
| Valuation Inputs at Reporting Date: | ||||
| Description | Total | Level 1 | Level 2 | Level 3 |
| Investments in Securities: | ||||
| Domestic Equity Funds | $1,960,045 | $1,960,045 | $-- | $-- |
| International Equity Funds | 3,858,692 | 3,858,692 | -- | -- |
| Bond Funds | 15,433,554 | 15,433,554 | -- | -- |
| Short-Term Funds | 4,534,831 | 4,534,831 | -- | -- |
| Total Investments in Securities: | $25,787,122 | $25,787,122 | $-- | $-- |
See accompanying notes which are an integral part of the financial statements.
VIP Investor Freedom 2005 Portfolio℠
Financial Statements
Statement of Assets and Liabilities
| June 30, 2022 (Unaudited) | ||
| Assets | ||
| Investment in securities, at value — See accompanying schedule: | ||
| Affiliated issuers (cost $25,097,844) | $25,787,122 | |
| Total Investment in Securities (cost $25,097,844) | $25,787,122 | |
| Receivable for investments sold | 218,464 | |
| Total assets | 26,005,586 | |
| Liabilities | ||
| Payable for investments purchased | $218,314 | |
| Payable for fund shares redeemed | 151 | |
| Total liabilities | 218,465 | |
| Net Assets | $25,787,121 | |
| Net Assets consist of: | ||
| Paid in capital | $25,471,178 | |
| Total accumulated earnings (loss) | 315,943 | |
| Net Assets | $25,787,121 | |
| Net Asset Value, offering price and redemption price per share ($25,787,121 ÷ 2,407,953 shares) | $10.71 |
See accompanying notes which are an integral part of the financial statements.
Statement of Operations
| Six months ended June 30, 2022 (Unaudited) | ||
| Investment Income | ||
| Dividends: | ||
| Affiliated issuers | $18,238 | |
| Expenses | ||
| Independent trustees' fees and expenses | $44 | |
| Total expenses | 44 | |
| Net investment income (loss) | 18,194 | |
| Realized and Unrealized Gain (Loss) | ||
| Net realized gain (loss) on: | ||
| Investment securities: | ||
| Affiliated issuers | (906,235) | |
| Capital gain distributions from underlying funds: | ||
| Affiliated issuers | 583,518 | |
| Total net realized gain (loss) | (322,717) | |
| Change in net unrealized appreciation (depreciation) on: | ||
| Investment securities: | ||
| Affiliated issuers | (3,179,597) | |
| Total change in net unrealized appreciation (depreciation) | (3,179,597) | |
| Net gain (loss) | (3,502,314) | |
| Net increase (decrease) in net assets resulting from operations | $(3,484,120) |
See accompanying notes which are an integral part of the financial statements.
Statement of Changes in Net Assets
| Six months ended June 30, 2022 (Unaudited) | Year ended December 31, 2021 | |
| Increase (Decrease) in Net Assets | ||
| Operations | ||
| Net investment income (loss) | $18,194 | $579,791 |
| Net realized gain (loss) | (322,717) | 2,113,026 |
| Change in net unrealized appreciation (depreciation) | (3,179,597) | (1,170,321) |
| Net increase (decrease) in net assets resulting from operations | (3,484,120) | 1,522,496 |
| Distributions to shareholders | (1,981,832) | (1,372,181) |
| Share transactions | ||
| Proceeds from sales of shares | 824,373 | 8,476,320 |
| Reinvestment of distributions | 1,981,832 | 1,372,181 |
| Cost of shares redeemed | (2,261,763) | (15,465,345) |
| Net increase (decrease) in net assets resulting from share transactions | 544,442 | (5,616,844) |
| Total increase (decrease) in net assets | (4,921,510) | (5,466,529) |
| Net Assets | ||
| Beginning of period | 30,708,631 | 36,175,160 |
| End of period | $25,787,121 | $30,708,631 |
| Other Information | ||
| Shares | ||
| Sold | 71,118 | 657,614 |
| Issued in reinvestment of distributions | 169,243 | 106,449 |
| Redeemed | (202,319) | (1,183,200) |
| Net increase (decrease) | 38,042 | (419,137) |
See accompanying notes which are an integral part of the financial statements.
Financial Highlights
VIP Investor Freedom 2005 Portfolio
| Six months ended (Unaudited) June 30, | Years endedDecember 31, | |||||
| 2022 | 2021 | 2020 | 2019 | 2018 | 2017 | |
| Selected Per–Share Data | ||||||
| Net asset value, beginning of period | $12.96 | $12.97 | $12.20 | $11.17 | $11.85 | $10.97 |
| Income from Investment Operations | ||||||
| Net investment income (loss)A,B | .01 | .21 | .16 | .25 | .20 | .20 |
| Net realized and unrealized gain (loss) | (1.42) | .31 | 1.16 | 1.28 | (.56) | 1.00 |
| Total from investment operations | (1.41) | .52 | 1.32 | 1.53 | (.36) | 1.20 |
| Distributions from net investment income | (.11) | (.14) | (.17) | (.26) | (.20) | (.17) |
| Distributions from net realized gain | (.73) | (.39) | (.38) | (.24) | (.13) | (.14) |
| Total distributions | (.84) | (.53) | (.55) | (.50) | (.32)C | (.32)C |
| Net asset value, end of period | $10.71 | $12.96 | $12.97 | $12.20 | $11.17 | $11.85 |
| Total ReturnD,E,F | (11.45)% | 4.09% | 11.08% | 13.89% | (3.04)% | 10.97% |
| Ratios to Average Net AssetsB,G,H | ||||||
| Expenses before reductionsI | - %J | -% | -% | -% | -% | -% |
| Expenses net of fee waivers, if any | - %I,J | - %I | - %I | - %I | - %I | -% |
| Expenses net of all reductions | - %I,J | - %I | - %I | - %I | - %I | -% |
| Net investment income (loss) | .13%J | 1.60% | 1.32% | 2.12% | 1.70% | 1.74% |
| Supplemental Data | ||||||
| Net assets, end of period (000 omitted) | $25,787 | $30,709 | $36,175 | $33,315 | $28,603 | $28,889 |
| Portfolio turnover rateK | 103%J | 42% | 51% | 35% | 42% | 28% |
A Calculated based on average shares outstanding during the period.
B Net investment income (loss) is affected by the timing of the declaration of dividends by any underlying mutual funds or exchange-traded funds (ETFs). Net investment income (loss) of any such underlying funds is not included in the Fund's net investment income (loss) ratio.
C Total distributions per share do not sum due to rounding.
D Total returns for periods of less than one year are not annualized.
E Total returns do not reflect charges attributable to your insurance company's separate account. Inclusion of these charges would reduce the total returns shown.
F Total returns would have been lower if certain expenses had not been reduced during the applicable periods shown.
G Fees and expenses of any underlying mutual funds or exchange-traded funds (ETFs) are not included in the Fund's expense ratio. The Fund indirectly bears its proportionate share of these expenses.
H Expense ratios reflect operating expenses of the class. Expenses before reductions do not reflect amounts reimbursed, waived, or reduced through arrangements with the investment adviser, brokerage services, or other offset arrangements, if applicable, and do not represent the amount paid by the class during periods when reimbursements, waivers or reductions occur.
I Amount represents less than .005%.
J Annualized
K Amount does not include the portfolio activity of any underlying mutual funds or exchange-traded funds (ETFs).
See accompanying notes which are an integral part of the financial statements.
VIP Investor Freedom 2010 Portfolio℠
Investment Summary (Unaudited)
The information in the following tables is based on the direct investments of the Fund.Top Holdings as of June 30, 2022
| % of fund's net assets | |
| VIP Investment Grade Bond II Portfolio Investor Class | 32.6 |
| Fidelity Inflation-Protected Bond Index Fund | 15.2 |
| VIP Government Money Market Portfolio Investor Class 1.16% | 12.1 |
| VIP Overseas Portfolio Investor Class | 10.4 |
| VIP Emerging Markets Portfolio Investor Class | 8.1 |
| Fidelity Long-Term Treasury Bond Index Fund | 4.0 |
| Fidelity International Bond Index Fund | 2.9 |
| VIP Growth Portfolio Investor Class | 2.8 |
| VIP Growth & Income Portfolio Investor Class | 2.7 |
| VIP Equity-Income Portfolio Investor Class | 2.2 |
| 93.0 |
Asset Allocation (% of fund's net assets)
| Period end | ||
| Domestic Equity Funds | 13.0% | |
| International Equity Funds | 18.5% | |
| Bond Funds | 56.4% | |
| Short-Term Funds | 12.1% | |

VIP Investor Freedom 2010 Portfolio℠
Schedule of Investments June 30, 2022 (Unaudited)
Showing Percentage of Net Assets
| Domestic Equity Funds - 13.0% | |||
| Shares | Value | ||
| VIP Contrafund Portfolio Investor Class (a) | 37,940 | $1,475,870 | |
| VIP Equity-Income Portfolio Investor Class (a) | 65,559 | 1,517,695 | |
| VIP Growth & Income Portfolio Investor Class (a) | 78,595 | 1,799,815 | |
| VIP Growth Portfolio Investor Class (a) | 25,162 | 1,859,966 | |
| VIP Mid Cap Portfolio Investor Class (a) | 13,952 | 438,656 | |
| VIP Value Portfolio Investor Class (a) | 67,606 | 1,108,740 | |
| VIP Value Strategies Portfolio Investor Class (a) | 38,312 | 541,352 | |
| TOTAL DOMESTIC EQUITY FUNDS | |||
| (Cost $6,198,486) | 8,742,094 | ||
| International Equity Funds - 18.5% | |||
| VIP Emerging Markets Portfolio Investor Class (a) | 548,099 | 5,480,991 | |
| VIP Overseas Portfolio Investor Class (a) | 339,577 | 7,042,825 | |
| TOTAL INTERNATIONAL EQUITY FUNDS | |||
| (Cost $11,946,663) | 12,523,816 | ||
| Bond Funds - 56.4% | |||
| Fidelity Inflation-Protected Bond Index Fund (a) | 1,012,574 | 10,277,624 | |
| Fidelity International Bond Index Fund (a) | 216,192 | 1,967,349 | |
| Fidelity Long-Term Treasury Bond Index Fund (a) | 234,803 | 2,707,283 | |
| VIP High Income Portfolio Investor Class (a) | 247,402 | 1,110,837 | |
| VIP Investment Grade Bond II Portfolio Investor Class (a) | 2,258,607 | 22,044,006 | |
| TOTAL BOND FUNDS | |||
| (Cost $39,513,669) | 38,107,099 | ||
| Short-Term Funds - 12.1% | |||
| VIP Government Money Market Portfolio Investor Class 1.16% (a)(b) | |||
| (Cost $8,180,712) | 8,180,712 | 8,180,712 | |
| TOTAL INVESTMENT IN SECURITIES - 100.0% | |||
| (Cost $65,839,530) | 67,553,721 | ||
| NET OTHER ASSETS (LIABILITIES) - 0.0% | 12 | ||
| NET ASSETS - 100% | $67,553,733 |
Legend
(a) Affiliated Fund
(b) The rate quoted is the annualized seven-day yield of the fund at period end.
Affiliated Underlying Funds
Fiscal year to date information regarding the Fund's investments in affiliated Underlying Funds is presented below. Exchanges between classes of the same affiliated Underlying Funds may occur, and are excluded from purchases and sales below if applicable. If an underlying Fund changes its name, the name presented below is the name in effect at period end.
| Affiliate | Value, beginning of period | Purchases(a) | Sales Proceeds(a) | Dividend Income | Realized Gain (loss) | Change in Unrealized appreciation (depreciation) | Value, end of period |
| Fidelity Inflation-Protected Bond Index Fund | $10,897,566 | $2,037,378 | $1,648,088 | $-- | $(36,822) | $(972,410) | $10,277,624 |
| Fidelity International Bond Index Fund | 1,439,406 | 922,129 | 232,118 | 3,164 | (8,146) | (153,922) | 1,967,349 |
| Fidelity Long-Term Treasury Bond Index Fund | 2,494,701 | 1,237,147 | 469,102 | 26,564 | (33,698) | (521,765) | 2,707,283 |
| VIP Contrafund Portfolio Investor Class | 2,085,629 | 389,908 | 430,365 | 18,821 | (23,889) | (545,413) | 1,475,870 |
| VIP Emerging Markets Portfolio Investor Class | 6,967,200 | 1,216,140 | 1,366,813 | -- | (117,567) | (1,217,969) | 5,480,991 |
| VIP Equity-Income Portfolio Investor Class | 2,205,984 | 225,565 | 712,005 | 2,723 | 52,560 | (254,409) | 1,517,695 |
| VIP Government Money Market Portfolio Investor Class 1.16% | 11,923,262 | 750,880 | 4,493,430 | 10,721 | -- | -- | 8,180,712 |
| VIP Growth & Income Portfolio Investor Class | 2,511,130 | 336,471 | 801,612 | 4,688 | 232,323 | (478,497) | 1,799,815 |
| VIP Growth Portfolio Investor Class | 2,133,108 | 820,206 | 499,523 | 96,190 | (36,990) | (556,835) | 1,859,966 |
| VIP High Income Portfolio Investor Class | 1,701,438 | 61,725 | 454,629 | 640 | (54,289) | (143,408) | 1,110,837 |
| VIP Investment Grade Bond Portfolio II Investor Class | -- | 23,877,266 | 1,270,323 | -- | (26,063) | (536,874) | 22,044,006 |
| VIP Investment Grade Bond Portfolio Investor Class | 29,095,654 | 2,242,492 | 27,690,210 | 1,321,520 | (2,775,334) | (872,602) | -- |
| VIP Mid Cap Portfolio Investor Class | 611,952 | 92,831 | 134,053 | 13,707 | (9,538) | (122,536) | 438,656 |
| VIP Overseas Portfolio Investor Class | 8,800,720 | 2,036,652 | 1,143,935 | 66,245 | (62,996) | (2,587,616) | 7,042,825 |
| VIP Value Portfolio Investor Class | 1,616,492 | 158,394 | 536,786 | 20,394 | 70,593 | (199,953) | 1,108,740 |
| VIP Value Strategies Portfolio Investor Class | 792,351 | 57,086 | 223,777 | 6,580 | 36,793 | (121,101) | 541,352 |
| $85,276,593 | $36,462,270 | $42,106,769 | $1,591,957 | $(2,793,063) | $(9,285,310) | $67,553,721 |
(a) Includes the value of shares purchased or redeemed through in-kind transactions, as applicable.
Amounts in the income column in the above table include any capital gain distributions from underlying funds, which are presented in the corresponding line-item in the Statement of Operations, if applicable.
Investment Valuation
The following is a summary of the inputs used, as of June 30, 2022, involving the Fund's assets and liabilities carried at fair value. The inputs or methodology used for valuing securities may not be an indication of the risk associated with investing in those securities. For more information on valuation inputs, and their aggregation into the levels used below, please refer to the Investment Valuation section in the accompanying Notes to Financial Statements.
| Valuation Inputs at Reporting Date: | ||||
| Description | Total | Level 1 | Level 2 | Level 3 |
| Investments in Securities: | ||||
| Domestic Equity Funds | $8,742,094 | $8,742,094 | $-- | $-- |
| International Equity Funds | 12,523,816 | 12,523,816 | -- | -- |
| Bond Funds | 38,107,099 | 38,107,099 | -- | -- |
| Short-Term Funds | 8,180,712 | 8,180,712 | -- | -- |
| Total Investments in Securities: | $67,553,721 | $67,553,721 | $-- | $-- |
See accompanying notes which are an integral part of the financial statements.
VIP Investor Freedom 2010 Portfolio℠
Financial Statements
Statement of Assets and Liabilities
| June 30, 2022 (Unaudited) | ||
| Assets | ||
| Investment in securities, at value — See accompanying schedule: | ||
| Affiliated issuers (cost $65,839,530) | $67,553,721 | |
| Total Investment in Securities (cost $65,839,530) | $67,553,721 | |
| Cash | 10 | |
| Receivable for investments sold | 693,834 | |
| Total assets | 68,247,565 | |
| Liabilities | ||
| Payable for investments purchased | $693,414 | |
| Payable for fund shares redeemed | 418 | |
| Total liabilities | 693,832 | |
| Net Assets | $67,553,733 | |
| Net Assets consist of: | ||
| Paid in capital | $67,371,296 | |
| Total accumulated earnings (loss) | 182,437 | |
| Net Assets | $67,553,733 | |
| Net Asset Value, offering price and redemption price per share ($67,553,733 ÷ 5,872,363 shares) | $11.50 |
See accompanying notes which are an integral part of the financial statements.
Statement of Operations
| Six months ended June 30, 2022 (Unaudited) | ||
| Investment Income | ||
| Dividends: | ||
| Affiliated issuers | $47,893 | |
| Expenses | ||
| Independent trustees' fees and expenses | $118 | |
| Total expenses | 118 | |
| Net investment income (loss) | 47,775 | |
| Realized and Unrealized Gain (Loss) | ||
| Net realized gain (loss) on: | ||
| Investment securities: | ||
| Affiliated issuers | (2,793,063) | |
| Capital gain distributions from underlying funds: | ||
| Affiliated issuers | 1,544,064 | |
| Total net realized gain (loss) | (1,248,999) | |
| Change in net unrealized appreciation (depreciation) on: | ||
| Investment securities: | ||
| Affiliated issuers | (9,285,310) | |
| Total change in net unrealized appreciation (depreciation) | (9,285,310) | |
| Net gain (loss) | (10,534,309) | |
| Net increase (decrease) in net assets resulting from operations | $(10,486,534) |
See accompanying notes which are an integral part of the financial statements.
Statement of Changes in Net Assets
| Six months ended June 30, 2022 (Unaudited) | Year ended December 31, 2021 | |
| Increase (Decrease) in Net Assets | ||
| Operations | ||
| Net investment income (loss) | $47,775 | $1,522,787 |
| Net realized gain (loss) | (1,248,999) | 4,298,014 |
| Change in net unrealized appreciation (depreciation) | (9,285,310) | (1,263,796) |
| Net increase (decrease) in net assets resulting from operations | (10,486,534) | 4,557,005 |
| Distributions to shareholders | (4,188,261) | (3,374,407) |
| Share transactions | ||
| Proceeds from sales of shares | 1,091,590 | 10,948,214 |
| Reinvestment of distributions | 4,188,261 | 3,374,407 |
| Cost of shares redeemed | (8,327,928) | (6,236,356) |
| Net increase (decrease) in net assets resulting from share transactions | (3,048,077) | 8,086,265 |
| Total increase (decrease) in net assets | (17,722,872) | 9,268,863 |
| Net Assets | ||
| Beginning of period | 85,276,605 | 76,007,742 |
| End of period | $67,553,733 | $85,276,605 |
| Other Information | ||
| Shares | ||
| Sold | 88,338 | 788,288 |
| Issued in reinvestment of distributions | 328,749 | 245,170 |
| Redeemed | (664,806) | (448,941) |
| Net increase (decrease) | (247,719) | 584,517 |
See accompanying notes which are an integral part of the financial statements.
Financial Highlights
VIP Investor Freedom 2010 Portfolio
| Six months ended (Unaudited) June 30, | Years endedDecember 31, | |||||
| 2022 | 2021 | 2020 | 2019 | 2018 | 2017 | |
| Selected Per–Share Data | ||||||
| Net asset value, beginning of period | $13.93 | $13.73 | $12.84 | $11.79 | $12.78 | $11.68 |
| Income from Investment Operations | ||||||
| Net investment income (loss)A,B | .01 | .26 | .17 | .27 | .20 | .19 |
| Net realized and unrealized gain (loss) | (1.74) | .52 | 1.37 | 1.57 | (.71) | 1.32 |
| Total from investment operations | (1.73) | .78 | 1.54 | 1.84 | (.51) | 1.51 |
| Distributions from net investment income | (.11) | (.14) | (.17) | (.26) | (.21) | (.19) |
| Distributions from net realized gain | (.59) | (.44) | (.49) | (.53) | (.27) | (.22) |
| Total distributions | (.70) | (.58) | (.65)C | (.79) | (.48) | (.41) |
| Net asset value, end of period | $11.50 | $13.93 | $13.73 | $12.84 | $11.79 | $12.78 |
| Total ReturnD,E,F | (12.90)% | 5.81% | 12.40% | 16.10% | (4.06)% | 13.05% |
| Ratios to Average Net AssetsB,G,H | ||||||
| Expenses before reductionsI | - %J | -% | -% | -% | -% | -% |
| Expenses net of fee waivers, if any | - %I,J | - %I | - %I | - %I | - %I | -% |
| Expenses net of all reductions | - %I,J | - %I | - %I | - %I | - %I | -% |
| Net investment income (loss) | .13%J | 1.87% | 1.33% | 2.15% | 1.57% | 1.55% |
| Supplemental Data | ||||||
| Net assets, end of period (000 omitted) | $67,554 | $85,277 | $76,008 | $66,651 | $56,452 | $66,993 |
| Portfolio turnover rateK | 96%J | 23% | 39% | 31% | 35% | 25% |
A Calculated based on average shares outstanding during the period.
B Net investment income (loss) is affected by the timing of the declaration of dividends by any underlying mutual funds or exchange-traded funds (ETFs). Net investment income (loss) of any such underlying funds is not included in the Fund's net investment income (loss) ratio.
C Total distributions per share do not sum due to rounding.
D Total returns for periods of less than one year are not annualized.
E Total returns do not reflect charges attributable to your insurance company's separate account. Inclusion of these charges would reduce the total returns shown.
F Total returns would have been lower if certain expenses had not been reduced during the applicable periods shown.
G Fees and expenses of any underlying mutual funds or exchange-traded funds (ETFs) are not included in the Fund's expense ratio. The Fund indirectly bears its proportionate share of these expenses.
H Expense ratios reflect operating expenses of the class. Expenses before reductions do not reflect amounts reimbursed, waived, or reduced through arrangements with the investment adviser, brokerage services, or other offset arrangements, if applicable, and do not represent the amount paid by the class during periods when reimbursements, waivers or reductions occur.
I Amount represents less than .005%.
J Annualized
K Amount does not include the portfolio activity of any underlying mutual funds or exchange-traded funds (ETFs).
See accompanying notes which are an integral part of the financial statements.
VIP Investor Freedom 2015 Portfolio℠
Investment Summary (Unaudited)
The information in the following tables is based on the direct investments of the Fund.Top Holdings as of June 30, 2022
| % of fund's net assets | |
| VIP Investment Grade Bond II Portfolio Investor Class | 29.7 |
| Fidelity Inflation-Protected Bond Index Fund | 14.1 |
| VIP Overseas Portfolio Investor Class | 13.0 |
| VIP Emerging Markets Portfolio Investor Class | 9.2 |
| VIP Government Money Market Portfolio Investor Class 1.16% | 6.6 |
| Fidelity Long-Term Treasury Bond Index Fund | 4.1 |
| VIP Growth Portfolio Investor Class | 3.9 |
| VIP Growth & Income Portfolio Investor Class | 3.8 |
| VIP Equity-Income Portfolio Investor Class | 3.2 |
| Fidelity International Bond Index Fund | 3.2 |
| 90.8 |
Asset Allocation (% of fund's net assets)
| Period end | ||
| Domestic Equity Funds | 18.4% | |
| International Equity Funds | 22.2% | |
| Bond Funds | 52.8% | |
| Short-Term Funds | 6.6% | |

VIP Investor Freedom 2015 Portfolio℠
Schedule of Investments June 30, 2022 (Unaudited)
Showing Percentage of Net Assets
| Domestic Equity Funds - 18.4% | |||
| Shares | Value | ||
| VIP Contrafund Portfolio Investor Class (a) | 81,885 | $3,185,324 | |
| VIP Equity-Income Portfolio Investor Class (a) | 141,533 | 3,276,494 | |
| VIP Growth & Income Portfolio Investor Class (a) | 169,660 | 3,885,219 | |
| VIP Growth Portfolio Investor Class (a) | 54,276 | 4,012,066 | |
| VIP Mid Cap Portfolio Investor Class (a) | 30,115 | 946,821 | |
| VIP Value Portfolio Investor Class (a) | 145,973 | 2,393,959 | |
| VIP Value Strategies Portfolio Investor Class (a) | 82,725 | 1,168,900 | |
| TOTAL DOMESTIC EQUITY FUNDS | |||
| (Cost $13,343,762) | 18,868,783 | ||
| International Equity Funds - 22.2% | |||
| VIP Emerging Markets Portfolio Investor Class (a) | 943,914 | 9,439,144 | |
| VIP Overseas Portfolio Investor Class (a) | 642,471 | 13,324,839 | |
| TOTAL INTERNATIONAL EQUITY FUNDS | |||
| (Cost $20,912,679) | 22,763,983 | ||
| Bond Funds - 52.8% | |||
| Fidelity Inflation-Protected Bond Index Fund (a) | 1,425,736 | 14,471,219 | |
| Fidelity International Bond Index Fund (a) | 359,878 | 3,274,888 | |
| Fidelity Long-Term Treasury Bond Index Fund (a) | 363,535 | 4,191,561 | |
| VIP High Income Portfolio Investor Class (a) | 375,474 | 1,685,877 | |
| VIP Investment Grade Bond II Portfolio Investor Class (a) | 3,114,507 | 30,397,591 | |
| TOTAL BOND FUNDS | |||
| (Cost $56,131,222) | 54,021,136 | ||
| Short-Term Funds - 6.6% | |||
| VIP Government Money Market Portfolio Investor Class 1.16% (a)(b) | |||
| (Cost $6,787,862) | 6,787,862 | 6,787,862 | |
| TOTAL INVESTMENT IN SECURITIES - 100.0% | |||
| (Cost $97,175,525) | 102,441,764 | ||
| NET OTHER ASSETS (LIABILITIES) - 0.0% | 9 | ||
| NET ASSETS - 100% | $102,441,773 |
Legend
(a) Affiliated Fund
(b) The rate quoted is the annualized seven-day yield of the fund at period end.
Affiliated Underlying Funds
Fiscal year to date information regarding the Fund's investments in affiliated Underlying Funds is presented below. Exchanges between classes of the same affiliated Underlying Funds may occur, and are excluded from purchases and sales below if applicable. If an underlying Fund changes its name, the name presented below is the name in effect at period end.
| Affiliate | Value, beginning of period | Purchases(a) | Sales Proceeds(a) | Dividend Income | Realized Gain (loss) | Change in Unrealized appreciation (depreciation) | Value, end of period |
| Fidelity Inflation-Protected Bond Index Fund | $14,266,178 | $3,558,162 | $1,973,215 | $-- | $(45,508) | $(1,334,398) | $14,471,219 |
| Fidelity International Bond Index Fund | 2,242,399 | 1,589,152 | 292,933 | 5,232 | (10,157) | (253,573) | 3,274,888 |
| Fidelity Long-Term Treasury Bond Index Fund | 3,670,662 | 1,988,313 | 622,844 | 40,753 | (51,046) | (793,524) | 4,191,561 |
| VIP Contrafund Portfolio Investor Class | 4,193,199 | 850,847 | 663,702 | 38,992 | (73,441) | (1,121,579) | 3,185,324 |
| VIP Emerging Markets Portfolio Investor Class | 11,397,214 | 2,146,380 | 1,816,240 | -- | (144,919) | (2,143,291) | 9,439,144 |
| VIP Equity-Income Portfolio Investor Class | 4,435,103 | 474,360 | 1,204,234 | 5,614 | 48,576 | (477,311) | 3,276,494 |
| VIP Government Money Market Portfolio Investor Class 1.16% | 11,326,341 | 1,244,509 | 5,782,988 | 9,288 | -- | -- | 6,787,862 |
| VIP Growth & Income Portfolio Investor Class | 5,048,660 | 687,522 | 1,323,221 | 9,665 | 356,291 | (884,033) | 3,885,219 |
| VIP Growth Portfolio Investor Class | 4,288,659 | 1,758,610 | 790,809 | 199,278 | (89,117) | (1,155,277) | 4,012,066 |
| VIP High Income Portfolio Investor Class | 2,461,281 | 143,649 | 622,809 | 946 | (78,932) | (217,312) | 1,685,877 |
| VIP Investment Grade Bond Portfolio II Investor Class | -- | 32,902,949 | 1,732,144 | -- | (30,386) | (742,828) | 30,397,591 |
| VIP Investment Grade Bond Portfolio Investor Class | 37,978,737 | 4,512,776 | 37,589,698 | 1,768,145 | (3,410,849) | (1,490,966) | -- |
| VIP Mid Cap Portfolio Investor Class | 1,230,304 | 218,507 | 223,523 | 28,199 | (21,068) | (257,399) | 946,821 |
| VIP Overseas Portfolio Investor Class | 15,941,530 | 3,873,509 | 1,524,018 | 122,867 | (133,617) | (4,832,565) | 13,324,839 |
| VIP Value Portfolio Investor Class | 3,249,932 | 352,049 | 932,315 | 42,028 | 96,223 | (371,930) | 2,393,959 |
| VIP Value Strategies Portfolio Investor Class | 1,592,991 | 144,930 | 389,399 | 13,544 | 62,805 | (242,427) | 1,168,900 |
| $123,323,190 | $56,446,224 | $57,484,092 | $2,284,551 | $(3,525,145) | $(16,318,413) | $102,441,764 |
(a) Includes the value of shares purchased or redeemed through in-kind transactions, as applicable.
Amounts in the income column in the above table include any capital gain distributions from underlying funds, which are presented in the corresponding line-item in the Statement of Operations, if applicable.
Investment Valuation
The following is a summary of the inputs used, as of June 30, 2022, involving the Fund's assets and liabilities carried at fair value. The inputs or methodology used for valuing securities may not be an indication of the risk associated with investing in those securities. For more information on valuation inputs, and their aggregation into the levels used below, please refer to the Investment Valuation section in the accompanying Notes to Financial Statements.
| Valuation Inputs at Reporting Date: | ||||
| Description | Total | Level 1 | Level 2 | Level 3 |
| Investments in Securities: | ||||
| Domestic Equity Funds | $18,868,783 | $18,868,783 | $-- | $-- |
| International Equity Funds | 22,763,983 | 22,763,983 | -- | -- |
| Bond Funds | 54,021,136 | 54,021,136 | -- | -- |
| Short-Term Funds | 6,787,862 | 6,787,862 | -- | -- |
| Total Investments in Securities: | $102,441,764 | $102,441,764 | $-- | $-- |
See accompanying notes which are an integral part of the financial statements.
VIP Investor Freedom 2015 Portfolio℠
Financial Statements
Statement of Assets and Liabilities
| June 30, 2022 (Unaudited) | ||
| Assets | ||
| Investment in securities, at value — See accompanying schedule: | ||
| Affiliated issuers (cost $97,175,525) | $102,441,764 | |
| Total Investment in Securities (cost $97,175,525) | $102,441,764 | |
| Cash | 9 | |
| Receivable for investments sold | 715,864 | |
| Receivable for fund shares sold | 820,366 | |
| Total assets | 103,978,003 | |
| Liabilities | ||
| Payable for investments purchased | $1,536,180 | |
| Payable for fund shares redeemed | 50 | |
| Total liabilities | 1,536,230 | |
| Net Assets | $102,441,773 | |
| Net Assets consist of: | ||
| Paid in capital | $98,841,739 | |
| Total accumulated earnings (loss) | 3,600,034 | |
| Net Assets | $102,441,773 | |
| Net Asset Value, offering price and redemption price per share ($102,441,773 ÷ 9,105,575 shares) | $11.25 |
See accompanying notes which are an integral part of the financial statements.
Statement of Operations
| Six months ended June 30, 2022 (Unaudited) | ||
| Investment Income | ||
| Dividends: | ||
| Affiliated issuers | $70,318 | |
| Expenses | ||
| Independent trustees' fees and expenses | $176 | |
| Total expenses | 176 | |
| Net investment income (loss) | 70,142 | |
| Realized and Unrealized Gain (Loss) | ||
| Net realized gain (loss) on: | ||
| Investment securities: | ||
| Affiliated issuers | (3,525,145) | |
| Capital gain distributions from underlying funds: | ||
| Affiliated issuers | 2,214,233 | |
| Total net realized gain (loss) | (1,310,912) | |
| Change in net unrealized appreciation (depreciation) on: | ||
| Investment securities: | ||
| Affiliated issuers | (16,318,413) | |
| Total change in net unrealized appreciation (depreciation) | (16,318,413) | |
| Net gain (loss) | (17,629,325) | |
| Net increase (decrease) in net assets resulting from operations | $(17,559,183) |
See accompanying notes which are an integral part of the financial statements.
Statement of Changes in Net Assets
| Six months ended June 30, 2022 (Unaudited) | Year ended December 31, 2021 | |
| Increase (Decrease) in Net Assets | ||
| Operations | ||
| Net investment income (loss) | $70,142 | $2,179,585 |
| Net realized gain (loss) | (1,310,912) | 7,957,271 |
| Change in net unrealized appreciation (depreciation) | (16,318,413) | (1,180,555) |
| Net increase (decrease) in net assets resulting from operations | (17,559,183) | 8,956,301 |
| Distributions to shareholders | (7,563,866) | (6,255,287) |
| Share transactions | ||
| Proceeds from sales of shares | 5,624,233 | 15,831,819 |
| Reinvestment of distributions | 7,563,866 | 6,255,287 |
| Cost of shares redeemed | (8,946,475) | (15,690,743) |
| Net increase (decrease) in net assets resulting from share transactions | 4,241,624 | 6,396,363 |
| Total increase (decrease) in net assets | (20,881,425) | 9,097,377 |
| Net Assets | ||
| Beginning of period | 123,323,198 | 114,225,821 |
| End of period | $102,441,773 | $123,323,198 |
| Other Information | ||
| Shares | ||
| Sold | 437,594 | 1,141,280 |
| Issued in reinvestment of distributions | 599,355 | 454,618 |
| Redeemed | (725,015) | (1,120,747) |
| Net increase (decrease) | 311,934 | 475,151 |
See accompanying notes which are an integral part of the financial statements.
Financial Highlights
VIP Investor Freedom 2015 Portfolio
| Six months ended (Unaudited) June 30, | Years endedDecember 31, | |||||
| 2022 | 2021 | 2020 | 2019 | 2018 | 2017 | |
| Selected Per–Share Data | ||||||
| Net asset value, beginning of period | $14.02 | $13.73 | $12.86 | $11.59 | $12.72 | $11.48 |
| Income from Investment Operations | ||||||
| Net investment income (loss)A,B | .01 | .25 | .16 | .25 | .19 | .19 |
| Net realized and unrealized gain (loss) | (1.93) | .78 | 1.53 | 1.80 | (.82) | 1.51 |
| Total from investment operations | (1.92) | 1.03 | 1.69 | 2.05 | (.63) | 1.70 |
| Distributions from net investment income | (.10) | (.15) | (.17) | (.26) | (.19) | (.19) |
| Distributions from net realized gain | (.75) | (.59) | (.66) | (.52) | (.31) | (.27) |
| Total distributions | (.85) | (.74) | (.82)C | (.78) | (.50) | (.46) |
| Net asset value, end of period | $11.25 | $14.02 | $13.73 | $12.86 | $11.59 | $12.72 |
| Total ReturnD,E,F | (14.33)% | 7.64% | 13.70% | 18.24% | (5.02)% | 14.99% |
| Ratios to Average Net AssetsB,G,H | ||||||
| Expenses before reductionsI | - %J | -% | -% | -% | -% | -% |
| Expenses net of fee waivers, if any | - %I,J | - %I | - %I | - %I | - %I | -% |
| Expenses net of all reductions | - %I,J | - %I | - %I | - %I | - %I | -% |
| Net investment income (loss) | .12%J | 1.78% | 1.28% | 2.05% | 1.53% | 1.52% |
| Supplemental Data | ||||||
| Net assets, end of period (000 omitted) | $102,442 | $123,323 | $114,226 | $107,298 | $96,781 | $110,704 |
| Portfolio turnover rateK | 99%J | 31% | 42% | 30% | 33% | 23% |
A Calculated based on average shares outstanding during the period.
B Net investment income (loss) is affected by the timing of the declaration of dividends by any underlying mutual funds or exchange-traded funds (ETFs). Net investment income (loss) of any such underlying funds is not included in the Fund's net investment income (loss) ratio.
C Total distributions per share do not sum due to rounding.
D Total returns for periods of less than one year are not annualized.
E Total returns do not reflect charges attributable to your insurance company's separate account. Inclusion of these charges would reduce the total returns shown.
F Total returns would have been lower if certain expenses had not been reduced during the applicable periods shown.
G Fees and expenses of any underlying mutual funds or exchange-traded funds (ETFs) are not included in the Fund's expense ratio. The Fund indirectly bears its proportionate share of these expenses.
H Expense ratios reflect operating expenses of the class. Expenses before reductions do not reflect amounts reimbursed, waived, or reduced through arrangements with the investment adviser, brokerage services, or other offset arrangements, if applicable, and do not represent the amount paid by the class during periods when reimbursements, waivers or reductions occur.
I Amount represents less than .005%.
J Annualized
K Amount does not include the portfolio activity of any underlying mutual funds or exchange-traded funds (ETFs).
See accompanying notes which are an integral part of the financial statements.
VIP Investor Freedom 2020 Portfolio℠
Investment Summary (Unaudited)
The information in the following tables is based on the direct investments of the Fund.Top Holdings as of June 30, 2022
| % of fund's net assets | |
| VIP Investment Grade Bond II Portfolio Investor Class | 26.7 |
| VIP Overseas Portfolio Investor Class | 15.6 |
| Fidelity Inflation-Protected Bond Index Fund | 13.0 |
| VIP Emerging Markets Portfolio Investor Class | 10.3 |
| VIP Growth Portfolio Investor Class | 5.1 |
| VIP Growth & Income Portfolio Investor Class | 4.9 |
| VIP Equity-Income Portfolio Investor Class | 4.2 |
| Fidelity Long-Term Treasury Bond Index Fund | 4.1 |
| VIP Contrafund Portfolio Investor Class | 4.1 |
| Fidelity International Bond Index Fund | 3.5 |
| 91.5 |
Asset Allocation (% of fund's net assets)
| Period end | ||
| Domestic Equity Funds | 24.0% | |
| International Equity Funds | 25.9% | |
| Bond Funds | 49.0% | |
| Short-Term Funds | 1.1% | |

VIP Investor Freedom 2020 Portfolio℠
Schedule of Investments June 30, 2022 (Unaudited)
Showing Percentage of Net Assets
| Domestic Equity Funds - 24.0% | |||
| Shares | Value | ||
| VIP Contrafund Portfolio Investor Class (a) | 207,227 | $8,061,119 | |
| VIP Equity-Income Portfolio Investor Class (a) | 358,125 | 8,290,603 | |
| VIP Growth & Income Portfolio Investor Class (a) | 429,385 | 9,832,913 | |
| VIP Growth Portfolio Investor Class (a) | 137,447 | 10,160,076 | |
| VIP Mid Cap Portfolio Investor Class (a) | 76,221 | 2,396,382 | |
| VIP Value Portfolio Investor Class (a) | 369,312 | 6,056,712 | |
| VIP Value Strategies Portfolio Investor Class (a) | 209,294 | 2,957,320 | |
| TOTAL DOMESTIC EQUITY FUNDS | |||
| (Cost $33,756,678) | 47,755,125 | ||
| International Equity Funds - 25.9% | |||
| VIP Emerging Markets Portfolio Investor Class (a) | 2,055,347 | 20,553,470 | |
| VIP Overseas Portfolio Investor Class (a) | 1,502,434 | 31,160,487 | |
| TOTAL INTERNATIONAL EQUITY FUNDS | |||
| (Cost $48,166,394) | 51,713,957 | ||
| Bond Funds - 49.0% | |||
| Fidelity Inflation-Protected Bond Index Fund (a) | 2,563,792 | 26,022,490 | |
| Fidelity International Bond Index Fund (a) | 761,059 | 6,925,638 | |
| Fidelity Long-Term Treasury Bond Index Fund (a) | 717,256 | 8,269,961 | |
| VIP High Income Portfolio Investor Class (a) | 731,595 | 3,284,860 | |
| VIP Investment Grade Bond II Portfolio - Investor Class (a) | 5,452,588 | 53,217,260 | |
| TOTAL BOND FUNDS | |||
| (Cost $101,599,513) | 97,720,209 | ||
| Short-Term Funds - 1.1% | |||
| VIP Government Money Market Portfolio Investor Class 1.16% (a)(b) | |||
| (Cost $2,261,079) | 2,261,079 | 2,261,079 | |
| TOTAL INVESTMENT IN SECURITIES - 100.0% | |||
| (Cost $185,783,664) | 199,450,370 | ||
| NET OTHER ASSETS (LIABILITIES) - 0.0% | 3,417 | ||
| NET ASSETS - 100% | $199,453,787 |
Legend
(a) Affiliated Fund
(b) The rate quoted is the annualized seven-day yield of the fund at period end.
Affiliated Underlying Funds
Fiscal year to date information regarding the Fund's investments in affiliated Underlying Funds is presented below. Exchanges between classes of the same affiliated Underlying Funds may occur, and are excluded from purchases and sales below if applicable. If an underlying Fund changes its name, the name presented below is the name in effect at period end.
| Affiliate | Value, beginning of period | Purchases(a) | Sales Proceeds(a) | Dividend Income | Realized Gain (loss) | Change in Unrealized appreciation (depreciation) | Value, end of period |
| Fidelity Inflation-Protected Bond Index Fund | $26,202,138 | $6,285,511 | $3,965,521 | $-- | $(114,067) | $(2,385,571) | $26,022,490 |
| Fidelity International Bond Index Fund | 4,936,522 | 3,239,390 | 684,750 | 11,222 | (31,258) | (534,266) | 6,925,638 |
| Fidelity Long-Term Treasury Bond Index Fund | 7,553,797 | 3,773,466 | 1,358,153 | 81,743 | (115,729) | (1,583,420) | 8,269,961 |
| VIP Contrafund Portfolio Investor Class | 11,002,491 | 1,696,922 | 1,554,142 | 100,073 | (171,516) | (2,912,636) | 8,061,119 |
| VIP Emerging Markets Portfolio Investor Class | 25,993,607 | 3,223,917 | 3,560,409 | -- | (370,494) | (4,733,151) | 20,553,470 |
| VIP Equity-Income Portfolio Investor Class | 11,636,954 | 675,097 | 2,917,478 | 14,397 | 155,875 | (1,259,845) | 8,290,603 |
| VIP Government Money Market Portfolio Investor Class 1.16% | 11,023,062 | 1,731,051 | 10,493,034 | 4,607 | -- | -- | 2,261,079 |
| VIP Growth & Income Portfolio Investor Class | 13,247,011 | 1,117,105 | 3,178,194 | 24,788 | 939,865 | (2,292,874) | 9,832,913 |
| VIP Growth Portfolio Investor Class | 11,252,966 | 4,041,238 | 1,921,713 | 511,446 | (201,720) | (3,010,695) | 10,160,076 |
| VIP High Income Portfolio Investor Class | 5,031,393 | 109,971 | 1,266,893 | 1,887 | (147,531) | (442,080) | 3,284,860 |
| VIP Investment Grade Bond Portfolio II Investor Class | -- | 57,965,495 | 3,381,000 | -- | (66,004) | (1,301,231) | 53,217,260 |
| VIP Investment Grade Bond Portfolio Investor Class | 68,956,166 | 6,951,758 | 67,200,115 | 3,139,141 | (6,376,527) | (2,331,282) | -- |
| VIP Mid Cap Portfolio Investor Class | 3,228,085 | 419,728 | 532,433 | 72,235 | (55,998) | (663,000) | 2,396,382 |
| VIP Overseas Portfolio Investor Class | 39,251,483 | 7,199,521 | 3,363,837 | 295,417 | (223,602) | (11,703,078) | 31,160,487 |
| VIP Value Portfolio Investor Class | 8,527,339 | 567,266 | 2,325,668 | 107,766 | 263,824 | (976,049) | 6,056,712 |
| VIP Value Strategies Portfolio Investor Class | 4,179,703 | 184,996 | 942,166 | 34,708 | 183,909 | (649,122) | 2,957,320 |
| $252,022,717 | $99,182,432 | $108,645,506 | $4,399,430 | $(6,330,973) | $(36,778,300) | $199,450,370 |
(a) Includes the value of shares purchased or redeemed through in-kind transactions, as applicable.
Amounts in the income column in the above table include any capital gain distributions from underlying funds, which are presented in the corresponding line-item in the Statement of Operations, if applicable.
Investment Valuation
The following is a summary of the inputs used, as of June 30, 2022, involving the Fund's assets and liabilities carried at fair value. The inputs or methodology used for valuing securities may not be an indication of the risk associated with investing in those securities. For more information on valuation inputs, and their aggregation into the levels used below, please refer to the Investment Valuation section in the accompanying Notes to Financial Statements.
| Valuation Inputs at Reporting Date: | ||||
| Description | Total | Level 1 | Level 2 | Level 3 |
| Investments in Securities: | ||||
| Domestic Equity Funds | $47,755,125 | $47,755,125 | $-- | $-- |
| International Equity Funds | 51,713,957 | 51,713,957 | -- | -- |
| Bond Funds | 97,720,209 | 97,720,209 | -- | -- |
| Short-Term Funds | 2,261,079 | 2,261,079 | -- | -- |
| Total Investments in Securities: | $199,450,370 | $199,450,370 | $-- | $-- |
See accompanying notes which are an integral part of the financial statements.
VIP Investor Freedom 2020 Portfolio℠
Financial Statements
Statement of Assets and Liabilities
| June 30, 2022 (Unaudited) | ||
| Assets | ||
| Investment in securities, at value — See accompanying schedule: | ||
| Affiliated issuers (cost $185,783,664) | $199,450,370 | |
| Total Investment in Securities (cost $185,783,664) | $199,450,370 | |
| Cash | 3,422 | |
| Receivable for investments sold | 2,377,977 | |
| Total assets | 201,831,769 | |
| Liabilities | ||
| Payable for investments purchased | $2,349,578 | |
| Payable for fund shares redeemed | 28,404 | |
| Total liabilities | 2,377,982 | |
| Net Assets | $199,453,787 | |
| Net Assets consist of: | ||
| Paid in capital | $188,795,558 | |
| Total accumulated earnings (loss) | 10,658,229 | |
| Net Assets | $199,453,787 | |
| Net Asset Value, offering price and redemption price per share ($199,453,787 ÷ 17,285,417 shares) | $11.54 |
See accompanying notes which are an integral part of the financial statements.
Statement of Operations
| Six months ended June 30, 2022 (Unaudited) | ||
| Investment Income | ||
| Dividends: | ||
| Affiliated issuers | $135,641 | |
| Expenses | ||
| Independent trustees' fees and expenses | $351 | |
| Total expenses before reductions | 351 | |
| Expense reductions | (2) | |
| Total expenses after reductions | 349 | |
| Net investment income (loss) | 135,292 | |
| Realized and Unrealized Gain (Loss) | ||
| Net realized gain (loss) on: | ||
| Investment securities: | ||
| Affiliated issuers | (6,330,973) | |
| Capital gain distributions from underlying funds: | ||
| Affiliated issuers | 4,263,789 | |
| Total net realized gain (loss) | (2,067,184) | |
| Change in net unrealized appreciation (depreciation) on: | ||
| Investment securities: | ||
| Affiliated issuers | (36,778,300) | |
| Total change in net unrealized appreciation (depreciation) | (36,778,300) | |
| Net gain (loss) | (38,845,484) | |
| Net increase (decrease) in net assets resulting from operations | $(38,710,192) |
See accompanying notes which are an integral part of the financial statements.
Statement of Changes in Net Assets
| Six months ended June 30, 2022 (Unaudited) | Year ended December 31, 2021 | |
| Increase (Decrease) in Net Assets | ||
| Operations | ||
| Net investment income (loss) | $135,292 | $4,355,079 |
| Net realized gain (loss) | (2,067,184) | 19,238,173 |
| Change in net unrealized appreciation (depreciation) | (36,778,300) | (1,550,419) |
| Net increase (decrease) in net assets resulting from operations | (38,710,192) | 22,042,833 |
| Distributions to shareholders | (18,039,405) | (14,019,021) |
| Share transactions | ||
| Proceeds from sales of shares | 3,006,992 | 25,862,525 |
| Reinvestment of distributions | 18,039,405 | 14,019,021 |
| Cost of shares redeemed | (16,869,152) | (32,540,843) |
| Net increase (decrease) in net assets resulting from share transactions | 4,177,245 | 7,340,703 |
| Total increase (decrease) in net assets | (52,572,352) | 15,364,515 |
| Net Assets | ||
| Beginning of period | 252,026,139 | 236,661,624 |
| End of period | $199,453,787 | $252,026,139 |
| Other Information | ||
| Shares | ||
| Sold | 233,803 | 1,765,199 |
| Issued in reinvestment of distributions | 1,376,003 | 970,259 |
| Redeemed | (1,324,385) | (2,211,064) |
| Net increase (decrease) | 285,421 | 524,394 |
See accompanying notes which are an integral part of the financial statements.
Financial Highlights
VIP Investor Freedom 2020 Portfolio
| Six months ended (Unaudited) June 30, | Years endedDecember 31, | |||||
| 2022 | 2021 | 2020 | 2019 | 2018 | 2017 | |
| Selected Per–Share Data | ||||||
| Net asset value, beginning of period | $14.83 | $14.36 | $13.29 | $11.73 | $12.94 | $11.51 |
| Income from Investment Operations | ||||||
| Net investment income (loss)A,B | .01 | .26 | .16 | .26 | .18 | .19 |
| Net realized and unrealized gain (loss) | (2.23) | 1.07 | 1.75 | 2.04 | (.94) | 1.69 |
| Total from investment operations | (2.22) | 1.33 | 1.91 | 2.30 | (.76) | 1.88 |
| Distributions from net investment income | (.11) | (.16) | (.17) | (.26) | (.19) | (.18) |
| Distributions from net realized gain | (.97) | (.71) | (.67) | (.48) | (.26) | (.27) |
| Total distributions | (1.07)C | (.86)C | (.84) | (.74) | (.45) | (.45) |
| Net asset value, end of period | $11.54 | $14.83 | $14.36 | $13.29 | $11.73 | $12.94 |
| Total ReturnD,E,F | (15.82)% | 9.54% | 14.95% | 20.11% | (5.94)% | 16.55% |
| Ratios to Average Net AssetsB,G,H | ||||||
| Expenses before reductionsI | - %J | -% | -% | -% | -% | -% |
| Expenses net of fee waivers, if any | - %I,J | - %I | - %I | - %I | - %I | -% |
| Expenses net of all reductions | - %I,J | - %I | - %I | - %I | - %I | -% |
| Net investment income (loss) | .12%J | 1.78% | 1.25% | 2.05% | 1.46% | 1.52% |
| Supplemental Data | ||||||
| Net assets, end of period (000 omitted) | $199,454 | $252,026 | $236,662 | $229,641 | $196,527 | $222,819 |
| Portfolio turnover rateK | 88%J | 32% | 42% | 32% | 33% | 21% |
A Calculated based on average shares outstanding during the period.
B Net investment income (loss) is affected by the timing of the declaration of dividends by any underlying mutual funds or exchange-traded funds (ETFs). Net investment income (loss) of any such underlying funds is not included in the Fund's net investment income (loss) ratio.
C Total distributions per share do not sum due to rounding.
D Total returns for periods of less than one year are not annualized.
E Total returns do not reflect charges attributable to your insurance company's separate account. Inclusion of these charges would reduce the total returns shown.
F Total returns would have been lower if certain expenses had not been reduced during the applicable periods shown.
G Fees and expenses of any underlying mutual funds or exchange-traded funds (ETFs) are not included in the Fund's expense ratio. The Fund indirectly bears its proportionate share of these expenses.
H Expense ratios reflect operating expenses of the class. Expenses before reductions do not reflect amounts reimbursed, waived, or reduced through arrangements with the investment adviser, brokerage services, or other offset arrangements, if applicable, and do not represent the amount paid by the class during periods when reimbursements, waivers or reductions occur.
I Amount represents less than .005%.
J Annualized
K Amount does not include the portfolio activity of any underlying mutual funds or exchange-traded funds (ETFs).
See accompanying notes which are an integral part of the financial statements.
VIP Investor Freedom 2025 Portfolio℠
Investment Summary (Unaudited)
The information in the following tables is based on the direct investments of the Fund.Top Holdings as of June 30, 2022
| % of fund's net assets | |
| VIP Investment Grade Bond II Portfolio Investor Class | 22.4 |
| VIP Overseas Portfolio Investor Class | 17.6 |
| VIP Emerging Markets Portfolio Investor Class | 11.1 |
| Fidelity Inflation-Protected Bond Index Fund | 10.3 |
| VIP Growth Portfolio Investor Class | 6.0 |
| VIP Growth & Income Portfolio Investor Class | 5.8 |
| Fidelity Long-Term Treasury Bond Index Fund | 5.6 |
| VIP Equity-Income Portfolio Investor Class | 4.9 |
| VIP Contrafund Portfolio Investor Class | 4.7 |
| VIP Value Portfolio Investor Class | 3.5 |
| 91.9 |
Asset Allocation (% of fund's net assets)
| Period end | ||
| Domestic Equity Funds | 28.0% | |
| International Equity Funds | 28.7% | |
| Bond Funds | 43.3% | |

VIP Investor Freedom 2025 Portfolio℠
Schedule of Investments June 30, 2022 (Unaudited)
Showing Percentage of Net Assets
| Domestic Equity Funds - 28.0% | |||
| Shares | Value | ||
| VIP Contrafund Portfolio Investor Class (a) | 305,972 | $11,902,311 | |
| VIP Equity-Income Portfolio Investor Class (a) | 528,789 | 12,241,471 | |
| VIP Growth & Income Portfolio Investor Class (a) | 633,994 | 14,518,459 | |
| VIP Growth Portfolio Investor Class (a) | 202,979 | 15,004,209 | |
| VIP Mid Cap Portfolio Investor Class (a) | 112,544 | 3,538,383 | |
| VIP Value Portfolio Investor Class (a) | 545,320 | 8,943,252 | |
| VIP Value Strategies Portfolio Investor Class (a) | 309,034 | 4,366,643 | |
| TOTAL DOMESTIC EQUITY FUNDS | |||
| (Cost $49,370,740) | 70,514,728 | ||
| International Equity Funds - 28.7% | |||
| VIP Emerging Markets Portfolio Investor Class (a) | 2,798,081 | 27,980,806 | |
| VIP Overseas Portfolio Investor Class (a) | 2,126,658 | 44,106,882 | |
| TOTAL INTERNATIONAL EQUITY FUNDS | |||
| (Cost $69,268,489) | 72,087,688 | ||
| Bond Funds - 43.3% | |||
| Fidelity Inflation-Protected Bond Index Fund (a) | 2,562,167 | 26,005,990 | |
| Fidelity International Bond Index Fund (a) | 904,297 | 8,229,102 | |
| Fidelity Long-Term Treasury Bond Index Fund (a) | 1,221,279 | 14,081,342 | |
| VIP High Income Portfolio Investor Class (a) | 922,872 | 4,143,694 | |
| VIP Investment Grade Bond II Portfolio - Investor Class (a) | 5,782,054 | 56,432,854 | |
| TOTAL BOND FUNDS | |||
| (Cost $113,741,959) | 108,892,982 | ||
| Short-Term Funds - 0.0% | |||
| Fidelity Cash Central Fund 1.58% (b) | |||
| (Cost $920) | 920 | 920 | |
| TOTAL INVESTMENT IN SECURITIES - 100.0% | |||
| (Cost $232,382,108) | 251,496,318 | ||
| NET OTHER ASSETS (LIABILITIES) - 0.0% | 7 | ||
| NET ASSETS - 100% | $251,496,325 |
Legend
(a) Affiliated Fund
(b) Affiliated fund that is generally available only to investment companies and other accounts managed by Fidelity Investments. The rate quoted is the annualized seven-day yield of the fund at period end. A complete unaudited listing of the fund's holdings as of its most recent quarter end is available upon request. In addition, each Fidelity Central Fund's financial statements are available on the SEC's website or upon request.
Affiliated Central Funds
Fiscal year to date information regarding the Fund's investments in Fidelity Central Funds, including the ownership percentage, is presented below.
| Fund | Value, beginning of period | Purchases | Sales Proceeds | Dividend Income | Realized Gain/Loss | Change in Unrealized appreciation (depreciation) | Value, end of period | % ownership, end of period |
| Fidelity Cash Central Fund 1.58% | $920 | $-- | $-- | $2 | $-- | $-- | $920 | 0.0% |
| Total | $920 | $-- | $-- | $2 | $-- | $-- | $920 |
Amounts in the income column in the above table include any capital gain distributions from underlying funds, which are presented in the corresponding line-item in the Statement of Operations, if applicable.
Affiliated Underlying Funds
Fiscal year to date information regarding the Fund's investments in affiliated Underlying Funds is presented below. Exchanges between classes of the same affiliated Underlying Funds may occur, and are excluded from purchases and sales below if applicable. If an underlying Fund changes its name, the name presented below is the name in effect at period end.
| Affiliate | Value, beginning of period | Purchases(a) | Sales Proceeds(a) | Dividend Income | Realized Gain (loss) | Change in Unrealized appreciation (depreciation) | Value, end of period |
| Fidelity Inflation-Protected Bond Index Fund | $26,843,815 | $5,804,367 | $4,127,544 | $-- | $(133,178) | $(2,381,470) | $26,005,990 |
| Fidelity International Bond Index Fund | 5,777,688 | 3,968,488 | 848,029 | 13,240 | (42,360) | (626,685) | 8,229,102 |
| Fidelity Long-Term Treasury Bond Index Fund | 10,897,157 | 7,948,496 | 2,153,632 | 127,591 | (238,250) | (2,372,429) | 14,081,342 |
| VIP Contrafund Portfolio Investor Class | 16,033,985 | 2,315,036 | 1,927,745 | 146,081 | (207,418) | (4,311,547) | 11,902,311 |
| VIP Emerging Markets Portfolio Investor Class | 35,167,151 | 4,790,122 | 5,040,410 | -- | (441,597) | (6,494,460) | 27,980,806 |
| VIP Equity-Income Portfolio Investor Class | 16,958,316 | 783,747 | 3,878,654 | 21,021 | 214,189 | (1,836,127) | 12,241,471 |
| VIP Government Money Market Portfolio Investor Class 1.16% | 6,503,015 | 1,966,489 | 8,469,504 | 985 | -- | -- | -- |
| VIP Growth & Income Portfolio Investor Class | 19,304,664 | 1,506,145 | 4,297,556 | 36,217 | 986,983 | (2,981,777) | 14,518,459 |
| VIP Growth Portfolio Investor Class | 16,399,058 | 5,771,548 | 2,470,862 | 746,588 | (248,089) | (4,447,446) | 15,004,209 |
| VIP High Income Portfolio Investor Class | 6,341,734 | 140,864 | 1,593,292 | 2,378 | (153,291) | (592,321) | 4,143,694 |
| VIP Investment Grade Bond Portfolio II Investor Class | -- | 66,252,689 | 8,338,723 | -- | (103,909) | (1,377,203) | 56,432,854 |
| VIP Investment Grade Bond Portfolio Investor Class | 78,743,562 | 8,408,341 | 77,203,956 | 3,583,243 | (8,601,505) | (1,346,442) | -- |
| VIP Mid Cap Portfolio Investor Class | 4,704,229 | 569,681 | 679,966 | 105,511 | (68,227) | (987,334) | 3,538,383 |
| VIP Overseas Portfolio Investor Class | 55,403,226 | 10,108,613 | 4,539,020 | 417,669 | (339,786) | (16,526,151) | 44,106,882 |
| VIP Value Portfolio Investor Class | 12,426,669 | 715,702 | 3,149,402 | 157,448 | 342,878 | (1,392,595) | 8,943,252 |
| VIP Value Strategies Portfolio Investor Class | 6,090,934 | 233,062 | 1,271,844 | 50,702 | 232,087 | (917,596) | 4,366,643 |
| $317,595,203 | $121,283,390 | $129,990,139 | $5,408,674 | $(8,801,473) | $(48,591,583) | $251,495,398 |
(a) Includes the value of shares purchased or redeemed through in-kind transactions, as applicable.
Amounts in the income column in the above table include any capital gain distributions from underlying funds, which are presented in the corresponding line-item in the Statement of Operations, if applicable.
Investment Valuation
The following is a summary of the inputs used, as of June 30, 2022, involving the Fund's assets and liabilities carried at fair value. The inputs or methodology used for valuing securities may not be an indication of the risk associated with investing in those securities. For more information on valuation inputs, and their aggregation into the levels used below, please refer to the Investment Valuation section in the accompanying Notes to Financial Statements.
| Valuation Inputs at Reporting Date: | ||||
| Description | Total | Level 1 | Level 2 | Level 3 |
| Investments in Securities: | ||||
| Domestic Equity Funds | $70,514,728 | $70,514,728 | $-- | $-- |
| International Equity Funds | 72,087,688 | 72,087,688 | -- | -- |
| Bond Funds | 108,892,982 | 108,892,982 | -- | -- |
| Short-Term Funds | 920 | 920 | -- | -- |
| Total Investments in Securities: | $251,496,318 | $251,496,318 | $-- | $-- |
See accompanying notes which are an integral part of the financial statements.
VIP Investor Freedom 2025 Portfolio℠
Financial Statements
Statement of Assets and Liabilities
| June 30, 2022 (Unaudited) | ||
| Assets | ||
| Investment in securities, at value — See accompanying schedule: | ||
| Fidelity Central Funds (cost $920) | $920 | |
| Other affiliated issuers (cost $232,381,188) | 251,495,398 | |
| Total Investment in Securities (cost $232,382,108) | $251,496,318 | |
| Cash | 2 | |
| Receivable for investments sold | 3,174,687 | |
| Distributions receivable from Fidelity Central Funds | 1 | |
| Total assets | 254,671,008 | |
| Liabilities | ||
| Payable for investments purchased | $3,159,988 | |
| Payable for fund shares redeemed | 14,695 | |
| Total liabilities | 3,174,683 | |
| Net Assets | $251,496,325 | |
| Net Assets consist of: | ||
| Paid in capital | $237,032,220 | |
| Total accumulated earnings (loss) | 14,464,105 | |
| Net Assets | $251,496,325 | |
| Net Asset Value, offering price and redemption price per share ($251,496,325 ÷ 19,656,526 shares) | $12.79 |
See accompanying notes which are an integral part of the financial statements.
Statement of Operations
| Six months ended June 30, 2022 (Unaudited) | ||
| Investment Income | ||
| Dividends: | ||
| Affiliated issuers | $197,013 | |
| Income from Fidelity Central Funds | 2 | |
| Total income | 197,015 | |
| Expenses | ||
| Independent trustees' fees and expenses | $443 | |
| Total expenses | 443 | |
| Net investment income (loss) | 196,572 | |
| Realized and Unrealized Gain (Loss) | ||
| Net realized gain (loss) on: | ||
| Investment securities: | ||
| Affiliated issuers | (8,801,473) | |
| Capital gain distributions from underlying funds: | ||
| Affiliated issuers | 5,211,661 | |
| Total net realized gain (loss) | (3,589,812) | |
| Change in net unrealized appreciation (depreciation) on: | ||
| Investment securities: | ||
| Affiliated issuers | (48,591,583) | |
| Total change in net unrealized appreciation (depreciation) | (48,591,583) | |
| Net gain (loss) | (52,181,395) | |
| Net increase (decrease) in net assets resulting from operations | $(51,984,823) |
See accompanying notes which are an integral part of the financial statements.
Statement of Changes in Net Assets
| Six months ended June 30, 2022 (Unaudited) | Year ended December 31, 2021 | |
| Increase (Decrease) in Net Assets | ||
| Operations | ||
| Net investment income (loss) | $196,572 | $5,360,289 |
| Net realized gain (loss) | (3,589,812) | 23,687,024 |
| Change in net unrealized appreciation (depreciation) | (48,591,583) | 1,939,262 |
| Net increase (decrease) in net assets resulting from operations | (51,984,823) | 30,986,575 |
| Distributions to shareholders | (21,493,952) | (15,755,683) |
| Share transactions | ||
| Proceeds from sales of shares | 5,135,818 | 35,734,708 |
| Reinvestment of distributions | 21,493,952 | 15,755,683 |
| Cost of shares redeemed | (19,250,793) | (34,663,906) |
| Net increase (decrease) in net assets resulting from share transactions | 7,378,977 | 16,826,485 |
| Total increase (decrease) in net assets | (66,099,798) | 32,057,377 |
| Net Assets | ||
| Beginning of period | 317,596,123 | 285,538,746 |
| End of period | $251,496,325 | $317,596,123 |
| Other Information | ||
| Shares | ||
| Sold | 353,299 | 2,187,772 |
| Issued in reinvestment of distributions | 1,466,163 | 978,638 |
| Redeemed | (1,351,992) | (2,116,175) |
| Net increase (decrease) | 467,470 | 1,050,235 |
See accompanying notes which are an integral part of the financial statements.
Financial Highlights
VIP Investor Freedom 2025 Portfolio
| Six months ended (Unaudited) June 30, | Years endedDecember 31, | |||||
| 2022 | 2021 | 2020 | 2019 | 2018 | 2017 | |
| Selected Per–Share Data | ||||||
| Net asset value, beginning of period | $16.55 | $15.74 | $14.38 | $12.45 | $13.78 | $12.15 |
| Income from Investment Operations | ||||||
| Net investment income (loss)A,B | .01 | .28 | .18 | .28 | .20 | .20 |
| Net realized and unrealized gain (loss) | (2.64) | 1.38 | 2.02 | 2.37 | (1.09) | 1.94 |
| Total from investment operations | (2.63) | 1.66 | 2.20 | 2.65 | (.89) | 2.14 |
| Distributions from net investment income | (.11) | (.18) | (.18) | (.28) | (.19) | (.19) |
| Distributions from net realized gain | (1.02) | (.67) | (.66) | (.44) | (.25) | (.32) |
| Total distributions | (1.13) | (.85) | (.84) | (.72) | (.44) | (.51) |
| Net asset value, end of period | $12.79 | $16.55 | $15.74 | $14.38 | $12.45 | $13.78 |
| Total ReturnC,D,E | (16.77)% | 10.78% | 15.88% | 21.73% | (6.56)% | 17.82% |
| Ratios to Average Net AssetsB,F,G | ||||||
| Expenses before reductionsH | - %I | -% | -% | -% | -% | -% |
| Expenses net of fee waivers, if any | - %H,I | - %H | - %H | - %H | - %H | -% |
| Expenses net of all reductions | - %H,I | - %H | - %H | - %H | - %H | -% |
| Net investment income (loss) | .14%I | 1.74% | 1.26% | 2.03% | 1.44% | 1.53% |
| Supplemental Data | ||||||
| Net assets, end of period (000 omitted) | $251,496 | $317,596 | $285,539 | $248,822 | $203,463 | $216,200 |
| Portfolio turnover rateJ | 85%I | 30% | 43% | 29% | 30% | 17% |
A Calculated based on average shares outstanding during the period.
B Net investment income (loss) is affected by the timing of the declaration of dividends by any underlying mutual funds or exchange-traded funds (ETFs). Net investment income (loss) of any such underlying funds is not included in the Fund's net investment income (loss) ratio.
C Total returns for periods of less than one year are not annualized.
D Total returns do not reflect charges attributable to your insurance company's separate account. Inclusion of these charges would reduce the total returns shown.
E Total returns would have been lower if certain expenses had not been reduced during the applicable periods shown.
F Fees and expenses of any underlying mutual funds or exchange-traded funds (ETFs) are not included in the Fund's expense ratio. The Fund indirectly bears its proportionate share of these expenses. For additional expense information related to investments in Fidelity Central Funds, please refer to the "Investments in Fidelity Central Funds" note found in the Notes to Financial Statements section of the most recent Annual or Semi-Annual report.
G Expense ratios reflect operating expenses of the class. Expenses before reductions do not reflect amounts reimbursed, waived, or reduced through arrangements with the investment adviser, brokerage services, or other offset arrangements, if applicable, and do not represent the amount paid by the class during periods when reimbursements, waivers or reductions occur.
H Amount represents less than .005%.
I Annualized
J Amount does not include the portfolio activity of any underlying mutual funds or exchange-traded funds (ETFs).
See accompanying notes which are an integral part of the financial statements.
VIP Investor Freedom 2030 Portfolio℠
Investment Summary (Unaudited)
The information in the following tables is based on the direct investments of the Fund.Top Holdings as of June 30, 2022
| % of fund's net assets | |
| VIP Investment Grade Bond II Portfolio Investor Class | 19.6 |
| VIP Overseas Portfolio Investor Class | 19.4 |
| VIP Emerging Markets Portfolio Investor Class | 11.9 |
| VIP Growth Portfolio Investor Class | 6.8 |
| Fidelity Inflation-Protected Bond Index Fund | 6.7 |
| VIP Growth & Income Portfolio Investor Class | 6.6 |
| Fidelity Long-Term Treasury Bond Index Fund | 6.0 |
| VIP Equity-Income Portfolio Investor Class | 5.5 |
| VIP Contrafund Portfolio Investor Class | 5.4 |
| VIP Value Portfolio Investor Class | 4.1 |
| 92.0 |
Asset Allocation (% of fund's net assets)
| Period end | ||
| Domestic Equity Funds | 32.0% | |
| International Equity Funds | 31.3% | |
| Bond Funds | 36.7% | |

VIP Investor Freedom 2030 Portfolio℠
Schedule of Investments June 30, 2022 (Unaudited)
Showing Percentage of Net Assets
| Domestic Equity Funds - 32.0% | |||
| Shares | Value | ||
| VIP Contrafund Portfolio Investor Class (a) | 471,753 | $18,351,192 | |
| VIP Equity-Income Portfolio Investor Class (a) | 815,333 | 18,874,948 | |
| VIP Growth & Income Portfolio Investor Class (a) | 977,507 | 22,384,919 | |
| VIP Growth Portfolio Investor Class (a) | 312,964 | 23,134,312 | |
| VIP Mid Cap Portfolio Investor Class (a) | 173,529 | 5,455,756 | |
| VIP Value Portfolio Investor Class (a) | 840,813 | 13,789,338 | |
| VIP Value Strategies Portfolio Investor Class (a) | 476,480 | 6,732,669 | |
| TOTAL DOMESTIC EQUITY FUNDS | |||
| (Cost $85,866,315) | 108,723,134 | ||
| International Equity Funds - 31.3% | |||
| VIP Emerging Markets Portfolio Investor Class (a) | 4,049,898 | 40,498,977 | |
| VIP Overseas Portfolio Investor Class (a) | 3,180,527 | 65,964,138 | |
| TOTAL INTERNATIONAL EQUITY FUNDS | |||
| (Cost $109,398,177) | 106,463,115 | ||
| Bond Funds - 36.7% | |||
| Fidelity Inflation-Protected Bond Index Fund (a) | 2,228,335 | 22,617,603 | |
| Fidelity International Bond Index Fund (a) | 1,030,958 | 9,381,713 | |
| Fidelity Long-Term Treasury Bond Index Fund (a) | 1,778,143 | 20,501,984 | |
| VIP High Income Portfolio Investor Class (a) | 1,248,750 | 5,606,890 | |
| VIP Investment Grade Bond II Portfolio Investor Class (a) | 6,844,560 | 66,802,909 | |
| TOTAL BOND FUNDS | |||
| (Cost $131,213,950) | 124,911,099 | ||
| TOTAL INVESTMENT IN SECURITIES - 100.0% | |||
| (Cost $326,478,442) | 340,097,348 | ||
| NET OTHER ASSETS (LIABILITIES) - 0.0% | 5 | ||
| NET ASSETS - 100% | $340,097,353 |
Legend
(a) Affiliated Fund
Affiliated Underlying Funds
Fiscal year to date information regarding the Fund's investments in affiliated Underlying Funds is presented below. Exchanges between classes of the same affiliated Underlying Funds may occur, and are excluded from purchases and sales below if applicable. If an underlying Fund changes its name, the name presented below is the name in effect at period end.
| Affiliate | Value, beginning of period | Purchases(a) | Sales Proceeds(a) | Dividend Income | Realized Gain (loss) | Change in Unrealized appreciation (depreciation) | Value, end of period |
| Fidelity Inflation-Protected Bond Index Fund | $25,849,797 | $3,279,345 | $4,269,657 | $-- | $(116,582) | $(2,125,300) | $22,617,603 |
| Fidelity International Bond Index Fund | 6,517,350 | 4,477,612 | 858,920 | 14,937 | (49,643) | (704,686) | 9,381,713 |
| Fidelity Long-Term Treasury Bond Index Fund | 15,126,984 | 11,927,519 | 2,818,605 | 183,592 | (295,839) | (3,438,075) | 20,501,984 |
| VIP Contrafund Portfolio Investor Class | 23,812,976 | 3,708,980 | 2,313,065 | 219,049 | (250,144) | (6,607,555) | 18,351,192 |
| VIP Emerging Markets Portfolio Investor Class | 49,170,341 | 7,575,825 | 6,359,493 | -- | (809,589) | (9,078,107) | 40,498,977 |
| VIP Equity-Income Portfolio Investor Class | 25,185,139 | 1,475,152 | 5,303,297 | 31,378 | (29,478) | (2,452,568) | 18,874,948 |
| VIP Government Money Market Portfolio Investor Class 1.16% | 1,742,167 | 2,500,019 | 4,242,186 | 524 | -- | -- | -- |
| VIP Growth & Income Portfolio Investor Class | 28,670,546 | 2,432,755 | 5,642,384 | 54,080 | 523,652 | (3,599,650) | 22,384,919 |
| VIP Growth Portfolio Investor Class | 24,355,101 | 9,043,539 | 3,150,159 | 1,119,483 | (308,925) | (6,805,244) | 23,134,312 |
| VIP High Income Portfolio Investor Class | 8,292,788 | 414,310 | 2,107,746 | 3,125 | (172,392) | (820,070) | 5,606,890 |
| VIP Investment Grade Bond Portfolio II Investor Class | -- | 79,670,025 | 11,123,383 | -- | (137,302) | (1,606,431) | 66,802,909 |
| VIP Investment Grade Bond Portfolio Investor Class | 91,737,308 | 11,924,033 | 92,001,842 | 4,192,285 | (11,186,432) | (473,067) | -- |
| VIP Mid Cap Portfolio Investor Class | 6,986,283 | 945,200 | 867,280 | 157,913 | (101,043) | (1,507,404) | 5,455,756 |
| VIP Overseas Portfolio Investor Class | 80,236,232 | 16,153,580 | 5,480,203 | 608,368 | (576,581) | (24,368,890) | 65,964,138 |
| VIP Value Portfolio Investor Class | 18,455,309 | 1,358,492 | 4,408,197 | 235,143 | 15,689 | (1,631,955) | 13,789,338 |
| VIP Value Strategies Portfolio Investor Class | 9,045,758 | 459,385 | 1,717,726 | 75,713 | 76,320 | (1,131,068) | 6,732,669 |
| $415,184,079 | $157,345,771 | $152,664,143 | $6,895,590 | $(13,418,289) | $(66,350,070) | $340,097,348 |
(a) Includes the value of shares purchased or redeemed through in-kind transactions, as applicable.
Amounts in the income column in the above table include any capital gain distributions from underlying funds, which are presented in the corresponding line-item in the Statement of Operations, if applicable.
Investment Valuation
The following is a summary of the inputs used, as of June 30, 2022, involving the Fund's assets and liabilities carried at fair value. The inputs or methodology used for valuing securities may not be an indication of the risk associated with investing in those securities. For more information on valuation inputs, and their aggregation into the levels used below, please refer to the Investment Valuation section in the accompanying Notes to Financial Statements.
| Valuation Inputs at Reporting Date: | ||||
| Description | Total | Level 1 | Level 2 | Level 3 |
| Investments in Securities: | ||||
| Domestic Equity Funds | $108,723,134 | $108,723,134 | $-- | $-- |
| International Equity Funds | 106,463,115 | 106,463,115 | -- | -- |
| Bond Funds | 124,911,099 | 124,911,099 | -- | -- |
| Total Investments in Securities: | $340,097,348 | $340,097,348 | $-- | $-- |
See accompanying notes which are an integral part of the financial statements.
VIP Investor Freedom 2030 Portfolio℠
Financial Statements
Statement of Assets and Liabilities
| June 30, 2022 (Unaudited) | ||
| Assets | ||
| Investment in securities, at value — See accompanying schedule: | ||
| Affiliated issuers (cost $326,478,442) | $340,097,348 | |
| Total Investment in Securities (cost $326,478,442) | $340,097,348 | |
| Cash | 2 | |
| Receivable for investments sold | 4,139,080 | |
| Total assets | 344,236,430 | |
| Liabilities | ||
| Payable for investments purchased | $3,949,635 | |
| Payable for fund shares redeemed | 189,442 | |
| Total liabilities | 4,139,077 | |
| Net Assets | $340,097,353 | |
| Net Assets consist of: | ||
| Paid in capital | $334,918,049 | |
| Total accumulated earnings (loss) | 5,179,304 | |
| Net Assets | $340,097,353 | |
| Net Asset Value, offering price and redemption price per share ($340,097,353 ÷ 26,431,796 shares) | $12.87 |
See accompanying notes which are an integral part of the financial statements.
Statement of Operations
| Six months ended June 30, 2022 (Unaudited) | ||
| Investment Income | ||
| Dividends: | ||
| Affiliated issuers | $281,378 | |
| Expenses | ||
| Independent trustees' fees and expenses | $584 | |
| Total expenses | 584 | |
| Net investment income (loss) | 280,794 | |
| Realized and Unrealized Gain (Loss) | ||
| Net realized gain (loss) on: | ||
| Investment securities: | ||
| Affiliated issuers | (13,418,289) | |
| Capital gain distributions from underlying funds: | ||
| Affiliated issuers | 6,614,212 | |
| Total net realized gain (loss) | (6,804,077) | |
| Change in net unrealized appreciation (depreciation) on: | ||
| Investment securities: | ||
| Affiliated issuers | (66,350,070) | |
| Total change in net unrealized appreciation (depreciation) | (66,350,070) | |
| Net gain (loss) | (73,154,147) | |
| Net increase (decrease) in net assets resulting from operations | $(72,873,353) |
See accompanying notes which are an integral part of the financial statements.
Statement of Changes in Net Assets
| Six months ended June 30, 2022 (Unaudited) | Year ended December 31, 2021 | |
| Increase (Decrease) in Net Assets | ||
| Operations | ||
| Net investment income (loss) | $280,794 | $6,466,492 |
| Net realized gain (loss) | (6,804,077) | 29,766,472 |
| Change in net unrealized appreciation (depreciation) | (66,350,070) | 6,440,787 |
| Net increase (decrease) in net assets resulting from operations | (72,873,353) | 42,673,751 |
| Distributions to shareholders | (26,822,347) | (19,294,793) |
| Share transactions | ||
| Proceeds from sales of shares | 15,957,454 | 63,710,754 |
| Reinvestment of distributions | 26,822,347 | 19,294,793 |
| Cost of shares redeemed | (18,170,832) | (16,867,496) |
| Net increase (decrease) in net assets resulting from share transactions | 24,608,969 | 66,138,051 |
| Total increase (decrease) in net assets | (75,086,731) | 89,517,009 |
| Net Assets | ||
| Beginning of period | 415,184,084 | 325,667,075 |
| End of period | $340,097,353 | $415,184,084 |
| Other Information | ||
| Shares | ||
| Sold | 1,094,414 | 3,899,731 |
| Issued in reinvestment of distributions | 1,806,219 | 1,190,368 |
| Redeemed | (1,279,014) | (1,021,891) |
| Net increase (decrease) | 1,621,619 | 4,068,208 |
See accompanying notes which are an integral part of the financial statements.
Financial Highlights
VIP Investor Freedom 2030 Portfolio
| Six months ended (Unaudited) June 30, | Years endedDecember 31, | |||||
| 2022 | 2021 | 2020 | 2019 | 2018 | 2017 | |
| Selected Per–Share Data | ||||||
| Net asset value, beginning of period | $16.73 | $15.70 | $14.26 | $12.10 | $13.61 | $11.76 |
| Income from Investment Operations | ||||||
| Net investment income (loss)A,B | .01 | .28 | .17 | .27 | .18 | .19 |
| Net realized and unrealized gain (loss) | (2.79) | 1.60 | 2.14 | 2.62 | (1.24) | 2.23 |
| Total from investment operations | (2.78) | 1.88 | 2.31 | 2.89 | (1.06) | 2.42 |
| Distributions from net investment income | (.09) | (.17) | (.17) | (.27) | (.18) | (.17) |
| Distributions from net realized gain | (.99) | (.68) | (.69) | (.46) | (.28) | (.39) |
| Total distributions | (1.08) | (.85) | (.87)C | (.73) | (.45)C | (.57)C |
| Net asset value, end of period | $12.87 | $16.73 | $15.70 | $14.26 | $12.10 | $13.61 |
| Total ReturnD,E,F | (17.49)% | 12.25% | 16.82% | 24.42% | (7.87)% | 20.92% |
| Ratios to Average Net AssetsB,G,H | ||||||
| Expenses before reductionsI | - %J | -% | -% | -% | -% | -% |
| Expenses net of fee waivers, if any | - %I,J | - %I | - %I | - %I | - %I | -% |
| Expenses net of all reductions | - %I,J | - %I | - %I | - %I | - %I | -% |
| Net investment income (loss) | .15%J | 1.71% | 1.26% | 2.03% | 1.36% | 1.46% |
| Supplemental Data | ||||||
| Net assets, end of period (000 omitted) | $340,097 | $415,184 | $325,667 | $276,764 | $213,871 | $214,597 |
| Portfolio turnover rateK | 80%J | 23% | 41% | 29% | 24% | 19% |
A Calculated based on average shares outstanding during the period.
B Net investment income (loss) is affected by the timing of the declaration of dividends by any underlying mutual funds or exchange-traded funds (ETFs). Net investment income (loss) of any such underlying funds is not included in the Fund's net investment income (loss) ratio.
C Total distributions per share do not sum due to rounding.
D Total returns for periods of less than one year are not annualized.
E Total returns do not reflect charges attributable to your insurance company's separate account. Inclusion of these charges would reduce the total returns shown.
F Total returns would have been lower if certain expenses had not been reduced during the applicable periods shown.
G Fees and expenses of any underlying mutual funds or exchange-traded funds (ETFs) are not included in the Fund's expense ratio. The Fund indirectly bears its proportionate share of these expenses.
H Expense ratios reflect operating expenses of the class. Expenses before reductions do not reflect amounts reimbursed, waived, or reduced through arrangements with the investment adviser, brokerage services, or other offset arrangements, if applicable, and do not represent the amount paid by the class during periods when reimbursements, waivers or reductions occur.
I Amount represents less than .005%.
J Annualized
K Amount does not include the portfolio activity of any underlying mutual funds or exchange-traded funds (ETFs).
See accompanying notes which are an integral part of the financial statements.
Notes to Financial Statements (Unaudited)
For the period ended June 30, 2022
1. Organization.
VIP Investor Freedom Income Portfolio, VIP Investor Freedom 2005 Portfolio, VIP Investor Freedom 2010 Portfolio, VIP Investor Freedom 2015 Portfolio, VIP Investor Freedom 2020 Portfolio, VIP Investor Freedom 2025 Portfolio and VIP Investor Freedom 2030 Portfolio (the Funds) are funds of Variable Insurance Products Fund V (the Trust). The Trust is registered under the Investment Company Act of 1940, as amended (the 1940 Act), as an open-end management investment company organized as a Massachusetts business trust. Each Fund is authorized to issue an unlimited number of shares. Shares of each Fund may only be purchased by insurance companies for the purpose of funding variable annuity or variable life insurance contracts.
2. Investments in Fidelity Central Funds.
Funds may invest in Fidelity Central Funds, which are open-end investment companies generally available only to other investment companies and accounts managed by the investment adviser and its affiliates. The Schedule of Investments lists any Fidelity Central Funds held as an investment as of period end, but does not include the underlying holdings of each Fidelity Central Fund. An investing fund indirectly bears its proportionate share of the expenses of the underlying Fidelity Central Funds.
Based on its investment objective, each Fidelity Central Fund may invest or participate in various investment vehicles or strategies that are similar to those of the investing fund. These strategies are consistent with the investment objectives of the investing fund and may involve certain economic risks which may cause a decline in value of each of the Fidelity Central Funds and thus a decline in the value of the investing fund.
| Fidelity Central Fund | Investment Manager | Investment Objective | Investment Practices | Expense Ratio(a) |
| Fidelity Money Market Central Funds | Fidelity Management & Research Company LLC (FMR) | Each fund seeks to obtain a high level of current income consistent with the preservation of capital and liquidity. | Short-term Investments | Less than .005% |
(a) Expenses expressed as a percentage of average net assets and are as of each underlying Central Fund's most recent annual or semi-annual shareholder report.
A complete unaudited list of holdings for each Fidelity Central Fund is available upon request or at the Securities and Exchange Commission website at www.sec.gov. In addition, the financial statements of the Fidelity Central Funds which contain the significant accounting policies (including investment valuation policies) of those funds, and are not covered by the Report of Independent Registered Public Accounting Firm, are available on the Securities and Exchange Commission website or upon request.
3. Significant Accounting Policies.
Each Fund is an investment company and applies the accounting and reporting guidance of the Financial Accounting Standards Board (FASB) Accounting Standards Codification Topic 946 Financial Services - Investment Companies. The financial statements have been prepared in conformity with accounting principles generally accepted in the United States of America (GAAP), which require management to make certain estimates and assumptions at the date of the financial statements. Actual results could differ from those estimates. Subsequent events, if any, through the date that the financial statements were issued have been evaluated in the preparation of the financial statements. Each Fund's Schedule of Investments lists any underlying mutual funds or exchange-traded funds (ETFs) but does not include the underlying holdings of these funds. The following summarizes the significant accounting policies of each Fund:
Investment Valuation. Investments are valued as of 4:00 p.m. Eastern time on the last calendar day of the period. Each Fund categorizes the inputs to valuation techniques used to value its investments into a disclosure hierarchy consisting of three levels as shown below:
- Level 1 – unadjusted quoted prices in active markets for identical investments
- Level 2 – other significant observable inputs (including quoted prices for similar investments, interest rates, prepayment speeds, etc.)
- Level 3 – unobservable inputs (including the Fund's own assumptions based on the best information available)
Valuation techniques used to value each Fund's investments by major category are as follows. Investments in open-end mutual funds are valued at their closing net asset value (NAV) each business day and are categorized as Level 1 in the hierarchy. The aggregate value of investments by input level as of June 30, 2022 is included at the end of each Fund's Schedule of Investments.
Investment Transactions and Income. For financial reporting purposes, the Funds' investment holdings and NAV include trades executed through the end of the last business day of the period. The NAV per share for processing shareholder transactions is calculated as of the close of business of the New York Stock Exchange (NYSE), normally 4:00 p.m. Eastern time and includes trades executed through the end of the prior business day. Gains and losses on securities sold are determined on the basis of identified cost. Income and capital gain distributions from any underlying mutual funds or exchange-traded funds (ETFs) are recorded on the ex-dividend date.
Expenses. Expenses directly attributable to a fund are charged to that fund. Expenses attributable to more than one fund are allocated among the respective funds on the basis of relative net assets or other appropriate methods. Expenses included in the accompanying financial statements reflect the expenses of that fund and do not include any expenses associated with any underlying mutual funds or exchange-traded funds. Although not included in a fund's expenses, a fund indirectly bears its proportionate share of these expenses through the net asset value of each underlying mutual fund or exchange-traded fund. Expense estimates are accrued in the period to which they relate and adjustments are made when actual amounts are known.
Income Tax Information and Distributions to Shareholders. Each year, each Fund intends to qualify as a regulated investment company under Subchapter M of the Internal Revenue Code, including distributing substantially all of its taxable income and realized gains. As a result, no provision for U.S. Federal income taxes is required. Each Fund files a U.S. federal tax return, in addition to state and local tax returns as required. Each Fund's federal income tax returns are subject to examination by the Internal Revenue Service (IRS) for a period of three fiscal years after they are filed. State and local tax returns may be subject to examination for an additional fiscal year depending on the jurisdiction.
Distributions are declared and recorded on the ex-dividend date. Income and capital gain distributions are determined in accordance with income tax regulations, which may differ from GAAP.
Capital accounts within the financial statements are adjusted for permanent book-tax differences. These adjustments have no impact on net assets or the results of operations. Capital accounts are not adjusted for temporary book-tax differences which will reverse in a subsequent period.
Book-tax differences are primarily due to the short-term gain distributions from the underlying mutual funds or exchange-traded funds (ETFs) and losses deferred due to wash sales.
As of period end, the cost and unrealized appreciation (depreciation) in securities, and derivatives if applicable, for federal income tax purposes were as follows for each Fund:
| Tax cost | Gross unrealized appreciation | Gross unrealized depreciation | Net unrealized appreciation (depreciation) | |
| VIP Investor Freedom Income Portfolio | $82,298,204 | $3,361,754 | $(2,919,743) | $442,011 |
| VIP Investor Freedom 2005 Portfolio | 25,170,547 | 1,246,642 | (630,067) | 616,575 |
| VIP Investor Freedom 2010 Portfolio | 66,175,801 | 3,947,623 | (2,569,703) | 1,377,920 |
| VIP Investor Freedom 2015 Portfolio | 97,716,287 | 8,550,998 | (3,825,521) | 4,725,477 |
| VIP Investor Freedom 2020 Portfolio | 186,910,132 | 20,323,947 | (7,783,709) | 12,540,238 |
| VIP Investor Freedom 2025 Portfolio | 233,542,598 | 28,544,395 | (10,590,675) | 17,953,720 |
| VIP Investor Freedom 2030 Portfolio | 329,073,730 | 31,541,702 | (20,518,084) | 11,023,618 |
4. Purchases and Sales of Investments.
Purchases and sales of securities, other than short-term securities and in-kind transactions, as applicable, are noted in the table below.
| Purchases ($) | Sales ($) | |
| VIP Investor Freedom Income Portfolio | 46,777,401 | 53,547,975 |
| VIP Investor Freedom 2005 Portfolio | 14,671,713 | 15,507,390 |
| VIP Investor Freedom 2010 Portfolio | 36,462,270 | 42,106,769 |
| VIP Investor Freedom 2015 Portfolio | 56,446,224 | 57,484,092 |
| VIP Investor Freedom 2020 Portfolio | 99,182,432 | 108,645,506 |
| VIP Investor Freedom 2025 Portfolio | 121,283,390 | 129,990,139 |
| VIP Investor Freedom 2030 Portfolio | 157,345,771 | 152,664,143 |
5. Fees and Other Transactions with Affiliates.
Management Fee. Fidelity Management & Research Company LLC (the investment adviser) provides the Funds with investment management related services. The Funds do not pay any fees for these services.
Interfund Trades. Funds may purchase from or sell securities to other Fidelity Funds under procedures adopted by the Board. The procedures have been designed to ensure these interfund trades are executed in accordance with Rule 17a-7 of the 1940 Act. Any interfund trades are included within the respective purchases and sales amounts shown in the Purchases and Sales of Investments note. During the period, there were no interfund trades.
Reallocation of Underlying Fund Investments. During the period, the investment adviser reallocated investments of the Funds. This involved taxable redemptions of the Funds' interest in VIP Investment Grade Bond Portfolio Investor Class, ("Underlying Fund") for investments and cash and non-taxable exchanges of those investments and cash for shares of VIP Investment Grade Bond Portfolio II Investor Class which is an affiliated investment company managed by FMR. Net realized gain (loss) on the redemptions of the Underlying Fund in connection with the reallocation is included in the accompanying Statements of Operations as "Net realized gain (loss) on Affiliated issuers."
Details of these transactions with the net related gain (loss) for the Funds are presented in the accompanying table:
| Value of Investments and Cash reallocated ($) | Net realized Gain (Loss) on redemptions of Underlying Fund ($) | |
| VIP Investor Freedom Income Portfolio | 32,004,007 | (3,078,835) |
| VIP Investor Freedom 2005 Portfolio | 9,833,586 | (849,949) |
| VIP Investor Freedom 2010 Portfolio | 23,637,688 | (2,497,171) |
| VIP Investor Freedom 2015 Portfolio | 32,728,190 | (3,134,560) |
| VIP Investor Freedom 2020 Portfolio | 57,664,743 | (5,837,004) |
| VIP Investor Freedom 2025 Portfolio | 65,850,286 | (7,836,810) |
| VIP Investor Freedom 2030 Portfolio | 78,406,222 | (10,300,993) |
6. Expense Reductions.
Through arrangements with each applicable Fund's custodian, credits realized as a result of certain uninvested cash balances were used to reduce each applicable Fund's expenses. All of the applicable expense reductions are noted in the table below.
| Custodian credits | |
| VIP Investor Freedom 2020 Portfolio | 2 |
7. Other.
A fund's organizational documents provide former and current trustees and officers with a limited indemnification against liabilities arising in connection with the performance of their duties to the fund. In the normal course of business, a fund may also enter into contracts that provide general indemnifications. A fund's maximum exposure under these arrangements is unknown as this would be dependent on future claims that may be made against a fund. The risk of material loss from such claims is considered remote.
At the end of the period, the investment adviser or its affiliates were owners of record of more than 10% of the outstanding shares as follows:
| Fund | Affiliated % |
| VIP Investor Freedom Income Portfolio | 100% |
| VIP Investor Freedom 2005 Portfolio | 100% |
| VIP Investor Freedom 2010 Portfolio | 100% |
| VIP Investor Freedom 2015 Portfolio | 100% |
| VIP Investor Freedom 2020 Portfolio | 100% |
| VIP Investor Freedom 2025 Portfolio | 100% |
| VIP Investor Freedom 2030 Portfolio | 100% |
8. Coronavirus (COVID-19) Pandemic.
An outbreak of COVID-19 first detected in China during December 2019 has since spread globally and was declared a pandemic by the World Health Organization during March 2020. Developments that disrupt global economies and financial markets, such as the COVID-19 pandemic, may magnify factors that affect the Funds' performance.
Shareholder Expense Example
As a shareholder, you incur two types of costs: (1) transaction costs, which may include sales charges (loads) on purchase payments or redemption proceeds, as applicable and (2) ongoing costs, which generally include management fees, distribution and/or service (12b-1) fees and other Fund expenses. This Example is intended to help you understand your ongoing costs (in dollars) of investing in a fund and to compare these costs with the ongoing costs of investing in other mutual funds.
The Example is based on an investment of $1,000 invested at the beginning of the period and held for the entire period (January 1, 2022 to June 30, 2022).
Actual Expenses
The first line of the accompanying table provides information about actual account values and actual expenses. You may use the information in this line, together with the amount you invested, to estimate the expenses that you paid over the period. Simply divide your account value by $1,000.00 (for example, an $8,600 account value divided by $1,000.00 = 8.6), then multiply the result by the number in the first line for a class/Fund under the heading entitled "Expenses Paid During Period" to estimate the expenses you paid on your account during this period. If any fund is a shareholder of any underlying mutual funds or exchange-traded funds (ETFs) (the Underlying Funds), such fund indirectly bears its proportional share of the expenses of the Underlying Funds in addition to the direct expenses incurred presented in the table. These fees and expenses are not included in the annualized expense ratio used to calculate the expense estimate in the table below. The estimate of expenses does not include any fees or other expenses of any variable annuity or variable life insurance product. If they were, the estimate of expenses you paid during the period would be higher, and your ending account value would be lower.
Hypothetical Example for Comparison Purposes
The second line of the accompanying table provides information about hypothetical account values and hypothetical expenses based on the actual expense ratio and an assumed rate of return of 5% per year before expenses, which is not the actual return. The hypothetical account values and expenses may not be used to estimate the actual ending account balance or expenses you paid for the period. You may use this information to compare the ongoing costs of investing in the Fund and other funds. To do so, compare this 5% hypothetical example with the 5% hypothetical examples that appear in the shareholder reports of the other funds. If any fund is a shareholder of any Underlying Funds, such fund indirectly bears its proportional share of the expenses of the Underlying Funds in addition to the direct expenses as presented in the table. These fees and expenses are not included in the annualized expense ratio used to calculate the expense estimate in the table below. The estimate of expenses does not include any fees or other expenses of any variable annuity or variable life insurance product. If they were, the estimate of expenses you paid during the period would be higher, and your ending account value would be lower.
Please note that the expenses shown in the table are meant to highlight your ongoing costs only and do not reflect any transaction costs. Therefore, the second line of the table is useful in comparing ongoing costs only, and will not help you determine the relative total costs of owning different funds. In addition, if these transactional costs were included, your costs would have been higher.
| Annualized Expense Ratio--A,B- | Beginning Account Value January 1, 2022 | Ending Account Value June 30, 2022 | Expenses Paid During Period--C,D- January 1, 2022 to June 30, 2022 |
|
| VIP Investor Freedom Income Portfolio | - % | |||
| Actual | $1,000.00 | $890.10 | $- | |
| Hypothetical-E | $1,000.00 | $1,024.79 | $- | |
| VIP Investor Freedom 2005 Portfolio | - % | |||
| Actual | $1,000.00 | $885.50 | $- | |
| Hypothetical-E | $1,000.00 | $1,024.79 | $- | |
| VIP Investor Freedom 2010 Portfolio | - % | |||
| Actual | $1,000.00 | $871.00 | $- | |
| Hypothetical-E | $1,000.00 | $1,024.79 | $- | |
| VIP Investor Freedom 2015 Portfolio | - % | |||
| Actual | $1,000.00 | $856.70 | $- | |
| Hypothetical-E | $1,000.00 | $1,024.79 | $- | |
| VIP Investor Freedom 2020 Portfolio | - % | |||
| Actual | $1,000.00 | $841.80 | $- | |
| Hypothetical-E | $1,000.00 | $1,024.79 | $- | |
| VIP Investor Freedom 2025 Portfolio | - % | |||
| Actual | $1,000.00 | $832.30 | $- | |
| Hypothetical-E | $1,000.00 | $1,024.79 | $- | |
| VIP Investor Freedom 2030 Portfolio | - % | |||
| Actual | $1,000.00 | $825.10 | $- | |
| Hypothetical-E | $1,000.00 | $1,024.79 | $- |
A Annualized expense ratio reflects expenses net of applicable fee waivers.
B Amount represents less than .005%.
C Expenses are equal to the annualized expense ratio, multiplied by the average account value over the period, multiplied by 181/ 365 (to reflect the one-half year period). The fees and expenses of any Underlying Funds are not included in each annualized expense ratio.
D Amount represents less than $.005.
E 5% return per year before expenses
Liquidity Risk Management Program
The Securities and Exchange Commission adopted Rule 22e-4 under the Investment Company Act of 1940 (the Liquidity Rule) to promote effective liquidity risk management throughout the open-end investment company industry, thereby reducing the risk that funds will be unable to meet their redemption obligations and mitigating dilution of the interests of fund shareholders.
The Funds have adopted and implemented a liquidity risk management program pursuant to the Liquidity Rule (the Program) effective December 1, 2018. The Program is reasonably designed to assess and manage each Fund’s liquidity risk and to comply with the requirements of the Liquidity Rule. Each Fund’s Board of Trustees (the Board) has designated each Fund’s investment adviser as administrator of the Program. The Fidelity advisers have established a Liquidity Risk Management Committee (the LRM Committee) to manage the Program for each of the Fidelity Funds. The LRM Committee monitors the adequacy and effectiveness of implementation of the Program and on a periodic basis assesses each Fund’s liquidity risk based on a variety of factors including (1) the Fund’s investment strategy, (2) portfolio liquidity and cash flow projections during normal and reasonably foreseeable stressed conditions, (3) shareholder redemptions, (4) borrowings and other funding sources and (5) in the case of exchange-traded funds, certain additional factors including the effect of the Fund’s prices and spreads, market participants, and basket compositions on the overall liquidity of the Fund’s portfolio, as applicable.
In accordance with the Program, each of the Fund’s portfolio investments is classified into one of four liquidity categories described below based on a determination of a reasonable expectation for how long it would take to convert the investment to cash (or sell or dispose of the investment) without significantly changing its market value.
- Highly liquid investments – cash or convertible to cash within three business days or less
- Moderately liquid investments – convertible to cash in three to seven calendar days
- Less liquid investments – can be sold or disposed of, but not settled, within seven calendar days
- Illiquid investments – cannot be sold or disposed of within seven calendar days
Liquidity classification determinations take into account a variety of factors including various market, trading and investment-specific considerations, as well as market depth, and generally utilize analysis from a third-party liquidity metrics service.
The Liquidity Rule places a 15% limit on a fund’s illiquid investments and requires funds that do not primarily hold assets that are highly liquid investments to determine and maintain a minimum percentage of the fund’s net assets to be invested in highly liquid investments (highly liquid investment minimum or HLIM). The Program includes provisions reasonably designed to comply with the 15% limit on illiquid investments and for determining, periodically reviewing and complying with the HLIM requirement as applicable.
At a recent meeting of the Fund’s Board of Trustees, the LRM Committee provided a written report to the Board pertaining to the operation, adequacy, and effectiveness of implementation of the Program for the annual period from December 1, 2020 through November 30, 2021. The report concluded that the Program has been implemented and is operating effectively and is reasonably designed to assess and manage the Fund’s liquidity risk.
![]()
VIPIFF-SANN-0822
1.833440.116
Fidelity® Variable Insurance Products:
FundsManager - 20%, 50%, 60%, 70%, 85% Portfolio
FundsManager 20% Portfolio
FundsManager 50% Portfolio
FundsManager 60% Portfolio
FundsManager 70% Portfolio
FundsManager 85% Portfolio
Semi-Annual Report
June 30, 2022
Contents
|
VIP FundsManager® 20% Portfolio | |
|
VIP FundsManager® 50% Portfolio | |
|
VIP FundsManager® 60% Portfolio | |
|
VIP FundsManager® 70% Portfolio | |
|
VIP FundsManager® 85% Portfolio | |
|
Board Approval of Investment Advisory Contracts and Management Fees | |
To view a fund's proxy voting guidelines and proxy voting record for the 12-month period ended June 30, visit http://www.fidelity.com/proxyvotingresults or visit the Securities and Exchange Commission's (SEC) web site at http://www.sec.gov.
You may also call 1-877-208-0098 to request a free copy of the proxy voting guidelines.
Fidelity® Variable Insurance Products are separate account options which are purchased through a variable insurance contract.
Standard & Poor's, S&P and S&P 500 are registered service marks of The McGraw-Hill Companies, Inc. and have been licensed for use by Fidelity Distributors Corporation.
Other third-party marks appearing herein are the property of their respective owners.
All other marks appearing herein are registered or unregistered trademarks or service marks of FMR LLC or an affiliated company. © 2022 FMR LLC. All rights reserved.
This report and the financial statements contained herein are submitted for the general information of the shareholders of the Funds. This report is not authorized for distribution to prospective investors in the Funds unless preceded or accompanied by an effective prospectus.
A fund files its complete schedule of portfolio holdings with the SEC for the first and third quarters of each fiscal year on Form N-PORT. Forms N-PORT are available on the SEC’s web site at http://www.sec.gov. A fund's Forms N-PORT may be reviewed and copied at the SEC’s Public Reference Room in Washington, DC. Information regarding the operation of the SEC's Public Reference Room may be obtained by calling 1-800-SEC-0330.
For a complete list of a fund's portfolio holdings, view the most recent holdings listing, semiannual report, or annual report on Fidelity's web site at http://www.fidelity.com, http://www.institutional.fidelity.com, or http://www.401k.com, as applicable.
NOT FDIC INSURED •MAY LOSE VALUE •NO BANK GUARANTEE
Neither the Funds nor Fidelity Distributors Corporation is a bank.
Note to Shareholders:
Early in 2020, the outbreak and spread of COVID-19 emerged as a public health emergency that had a major influence on financial markets, primarily based on its impact on the global economy and corporate earnings. On March 11, 2020, the World Health Organization declared the COVID-19 outbreak a pandemic, citing sustained risk of further global spread. The pandemic prompted a number of measures to limit the spread of COVID-19, including travel and border restrictions, quarantines, and restrictions on large gatherings. In turn, these resulted in lower consumer activity, diminished demand for a wide range of products and services, disruption in manufacturing and supply chains, and – given the wide variability in outcomes regarding the outbreak – significant market uncertainty and volatility. To help stem the turmoil, the U.S. government took unprecedented action – in concert with the U.S. Federal Reserve and central banks around the world – to help support consumers, businesses, and the broader economy, and to limit disruption to the financial system.
In general, the overall impact of the pandemic lessened in 2021, amid a resilient economy and widespread distribution of three COVID-19 vaccines granted emergency use authorization from the U.S. Food and Drug Administration (FDA) early in the year. Still, the situation remains dynamic, and the extent and duration of its influence on financial markets and the economy is highly uncertain, due in part to a recent spike in cases based on highly contagious variants of the coronavirus.
Extreme events such as the COVID-19 crisis are exogenous shocks that can have significant adverse effects on mutual funds and their investments. Although multiple asset classes may be affected by market disruption, the duration and impact may not be the same for all types of assets. Fidelity is committed to helping you stay informed amid news about COVID-19 and during increased market volatility, and we continue to take extra steps to be responsive to customer needs. We encourage you to visit us online, where we offer ongoing updates, commentary, and analysis on the markets and our funds.
VIP FundsManager® 20% Portfolio
Investment Summary (Unaudited)
The information in the following tables is based on the direct investments of the Fund.Top Holdings as of June 30, 2022
| % of fund's net assets | |
| Fidelity Investments Money Market Government Portfolio Institutional Class 1.25% | 22.4 |
| VIP Investment Grade Bond II Portfolio - Investor Class | 21.7 |
| Fidelity Total Bond Fund | 21.5 |
| VIP Stock Selector All Cap Portfolio Investor Class | 13.4 |
| Fidelity Cash Central Fund 1.58% | 4.6 |
| Fidelity Floating Rate High Income Fund | 3.3 |
| Fidelity Emerging Markets Fund | 1.6 |
| Fidelity Inflation-Protected Bond Index Fund | 1.5 |
| Fidelity Long-Term Treasury Bond Index Fund | 1.3 |
| Fidelity Overseas Fund | 1.2 |
| 92.5 |
Asset Allocation (% of fund's net assets)
| Period end* | ||
| Domestic Equity Funds | 17.3% | |
| International Equity Funds | 6.1% | |
| Bond Funds | 50.2% | |
| Short-Term Funds | 27.0% | |
| Short-Term Investments | 0.1% | |
| Net Other Assets (Liabilities)** | (0.7)% | |
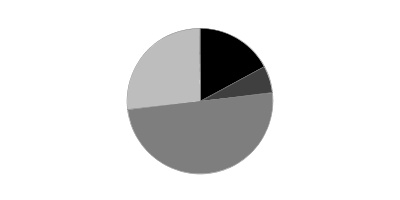
* Futures – (1.4)%
** Net Other Assets (Liabilities) are not included in the pie chart
VIP FundsManager® 20% Portfolio
Schedule of Investments June 30, 2022 (Unaudited)
Showing Percentage of Net Assets
| Equity Funds - 23.4% | |||
| Shares | Value | ||
| Fidelity Canada Fund (a) | 13,325 | $797,754 | |
| Fidelity Commodity Strategy Fund (a) | 666,857 | 6,861,957 | |
| Fidelity Contrafund (a) | 113,874 | 1,514,526 | |
| Fidelity Emerging Markets Discovery Fund (a) | 399,095 | 5,375,815 | |
| Fidelity Emerging Markets Fund (a) | 415,846 | 13,639,733 | |
| Fidelity Equity-Income Fund (a) | 51,074 | 3,195,202 | |
| Fidelity Global Commodity Stock Fund (a) | 564,541 | 9,817,367 | |
| Fidelity International Capital Appreciation Fund (a) | 105,037 | 2,104,935 | |
| Fidelity International Discovery Fund (a) | 71,128 | 2,764,036 | |
| Fidelity International Enhanced Index Fund (a) | 314,359 | 2,854,381 | |
| Fidelity International Small Cap Fund (a) | 45,073 | 1,184,061 | |
| Fidelity International Small Cap Opportunities Fund (a) | 121,613 | 2,185,388 | |
| Fidelity International Value Fund (a) | 217,040 | 1,727,637 | |
| Fidelity Large Cap Value Enhanced Index Fund (a) | 64,894 | 920,198 | |
| Fidelity Low-Priced Stock Fund (a) | 82,161 | 3,822,120 | |
| Fidelity Overseas Fund (a) | 219,729 | 10,632,667 | |
| Fidelity Real Estate Investment Portfolio (a) | 184,651 | 8,113,582 | |
| Fidelity U.S. Low Volatility Equity Fund (a) | 634,548 | 6,358,170 | |
| Fidelity Value Discovery Fund (a) | 45,632 | 1,579,783 | |
| VIP Stock Selector All Cap Portfolio Investor Class (a) | 14,459,729 | 114,521,050 | |
| TOTAL EQUITY FUNDS | |||
| (Cost $222,835,713) | 199,970,362 | ||
| Fixed-Income Funds - 50.2% | |||
| Fidelity Floating Rate High Income Fund (a) | 3,141,146 | 27,861,967 | |
| Fidelity High Income Fund (a) | 854,213 | 6,210,129 | |
| Fidelity Inflation-Protected Bond Index Fund (a) | 1,244,871 | 12,635,442 | |
| Fidelity Long-Term Treasury Bond Index Fund (a) | 965,586 | 11,133,207 | |
| Fidelity New Markets Income Fund (a) | 143,884 | 1,644,591 | |
| Fidelity Total Bond Fund (a) | 19,007,921 | 184,186,753 | |
| VIP Investment Grade Bond II Portfolio - Investor Class (a) | 19,002,852 | 185,467,833 | |
| TOTAL FIXED-INCOME FUNDS | |||
| (Cost $439,912,632) | 429,139,922 | ||
| Money Market Funds - 27.0% | |||
| Fidelity Cash Central Fund 1.58% (b) | 38,930,011 | 38,937,797 | |
| Fidelity Investments Money Market Government Portfolio Institutional Class 1.25% (a)(c) | 191,790,673 | 191,790,673 | |
| TOTAL MONEY MARKET FUNDS | |||
| (Cost $230,728,470) | 230,728,470 | ||
| Principal Amount | Value | ||
| U.S. Treasury Obligations - 0.1% | |||
| U.S. Treasury Bills, yield at date of purchase 0.66% to 1.7% 7/7/22 to 9/29/22 (d) | |||
| (Cost $617,828) | 620,000 | 617,750 | |
| TOTAL INVESTMENT IN SECURITIES - 100.7% | |||
| (Cost $894,094,643) | 860,456,504 | ||
| NET OTHER ASSETS (LIABILITIES) - (0.7)% | (5,813,460) | ||
| NET ASSETS - 100% | $854,643,044 |
| Futures Contracts | |||||
| Number of contracts | Expiration Date | Notional Amount | Value | Unrealized Appreciation/(Depreciation) | |
| Purchased | |||||
| Equity Index Contracts | |||||
| ICE E-mini MSCI Emerging Markets Index Contracts (United States) | 95 | Sept. 2022 | $4,762,825 | $2,685 | $2,685 |
| Sold | |||||
| Equity Index Contracts | |||||
| CME E-mini S&P 500 Index Contracts (United States) | 86 | Sept. 2022 | 16,294,850 | (87,187) | (87,187) |
| ICE E-mini MSCI EAFE Index Contracts (United States) | 10 | Sept. 2022 | 928,300 | (5,391) | (5,391) |
| TOTAL SOLD | $(92,578) | ||||
| TOTAL FUTURES CONTRACTS | $(89,893) |
The notional amount of futures purchased as a percentage of Net Assets is 0.6%
The notional amount of futures sold as a percentage of Net Assets is 2.0%
For the period, the average monthly notional amount at value for futures contracts in the aggregate was $38,893,263.
Legend
(a) Affiliated Fund
(b) Affiliated fund that is generally available only to investment companies and other accounts managed by Fidelity Investments. The rate quoted is the annualized seven-day yield of the fund at period end. A complete unaudited listing of the fund's holdings as of its most recent quarter end is available upon request. In addition, each Fidelity Central Fund's financial statements are available on the SEC's website or upon request.
(c) The rate quoted is the annualized seven-day yield of the fund at period end.
(d) Security or a portion of the security was pledged to cover margin requirements for futures contracts. At period end, the value of securities pledged amounted to $617,750.
Affiliated Central Funds
Fiscal year to date information regarding the Fund's investments in Fidelity Central Funds, including the ownership percentage, is presented below.
| Fund | Value, beginning of period | Purchases | Sales Proceeds | Dividend Income | Realized Gain/Loss | Change in Unrealized appreciation (depreciation) | Value, end of period | % ownership, end of period |
| Fidelity Cash Central Fund 1.58% | $225,746,149 | $37,962,539 | $224,770,891 | $148,585 | $-- | $-- | $38,937,797 | 0.1% |
| Total | $225,746,149 | $37,962,539 | $224,770,891 | $148,585 | $-- | $-- | $38,937,797 |
Amounts in the income column in the above table include any capital gain distributions from underlying funds, which are presented in the corresponding line-item in the Statement of Operations, if applicable.
Affiliated Underlying Funds
Fiscal year to date information regarding the Fund's investments in affiliated Underlying Funds is presented below. Exchanges between classes of the same affiliated Underlying Funds may occur, and are excluded from purchases and sales below if applicable. If an underlying Fund changes its name, the name presented below is the name in effect at period end.
| Affiliate | Value, beginning of period | Purchases(a) | Sales Proceeds(a) | Dividend Income | Realized Gain (loss) | Change in Unrealized appreciation (depreciation) | Value, end of period |
| Fidelity Canada Fund | $-- | $850,074 | $13,976 | $-- | $(863) | $(37,481) | $797,754 |
| Fidelity Commodity Strategy Fund | 8,429,872 | 1,888,503 | 5,204,989 | -- | 1,418,299 | 330,272 | 6,861,957 |
| Fidelity Contrafund | 2,399,788 | 131,866 | 333,292 | 27,575 | (61,218) | (622,618) | 1,514,526 |
| Fidelity Emerging Markets Discovery Fund | 3,852,210 | 2,383,014 | 146,643 | -- | (20,347) | (692,419) | 5,375,815 |
| Fidelity Emerging Markets Fund | 18,684,409 | 179,880 | 590,813 | -- | (136,616) | (4,497,127) | 13,639,733 |
| Fidelity Equity-Income Fund | 4,154,910 | 267,823 | 802,220 | 14,977 | (18,454) | (406,857) | 3,195,202 |
| Fidelity Floating Rate High Income Fund | 32,167,333 | 1,394,935 | 3,747,859 | 520,527 | (102,010) | (1,850,432) | 27,861,967 |
| Fidelity Global Commodity Stock Fund | 10,555,648 | 527,087 | 2,094,658 | -- | 246,888 | 582,402 | 9,817,367 |
| Fidelity High Income Fund | 7,652,550 | 364,004 | 569,323 | 155,737 | (19,326) | (1,217,776) | 6,210,129 |
| Fidelity Inflation-Protected Bond Index Fund | 26,532,651 | 492,547 | 12,897,969 | -- | 1,016,461 | (2,508,248) | 12,635,442 |
| Fidelity International Capital Appreciation Fund | 3,305,032 | 70,762 | 319,656 | -- | (69,870) | (881,333) | 2,104,935 |
| Fidelity International Discovery Fund | 4,168,918 | 92,977 | 418,308 | -- | (138,589) | (940,962) | 2,764,036 |
| Fidelity International Enhanced Index Fund | 3,853,134 | 81,879 | 392,112 | -- | (56,216) | (632,304) | 2,854,381 |
| Fidelity International Small Cap Fund | 1,609,428 | 37,469 | 172,891 | -- | (12,900) | (277,045) | 1,184,061 |
| Fidelity International Small Cap Opportunities Fund | 3,167,545 | 48,576 | -- | -- | -- | (1,030,733) | 2,185,388 |
| Fidelity International Value Fund | 2,218,390 | 48,576 | 233,952 | -- | (9,051) | (296,326) | 1,727,637 |
| Fidelity Investments Money Market Government Portfolio Institutional Class 1.25% | -- | 202,675,284 | 10,884,611 | 267,529 | -- | -- | 191,790,673 |
| Fidelity Large Cap Value Enhanced Index Fund | 1,299,784 | 123,526 | 370,258 | -- | (6,068) | (126,786) | 920,198 |
| Fidelity Long-Term Treasury Bond Index Fund | 22,664,579 | 623,279 | 8,388,352 | 174,710 | (1,509,629) | (2,256,670) | 11,133,207 |
| Fidelity Low-Priced Stock Fund | 5,134,244 | 308,577 | 979,824 | -- | (43,088) | (597,789) | 3,822,120 |
| Fidelity New Markets Income Fund | 2,143,622 | 108,869 | 189,774 | 39,446 | (19,989) | (398,137) | 1,644,591 |
| Fidelity Overseas Fund | 16,461,272 | 349,701 | 1,595,505 | -- | (343,081) | (4,239,720) | 10,632,667 |
| Fidelity Real Estate Investment Portfolio | 13,819,513 | 289,057 | 3,727,158 | -- | 394,170 | (2,662,000) | 8,113,582 |
| Fidelity Total Bond Fund | -- | 185,273,193 | 269,447 | 238,341 | (6,636) | (810,357) | 184,186,753 |
| Fidelity U.S. Bond Index Fund | 404,221,641 | 35,122,039 | 396,675,274 | 3,425,799 | (22,924,251) | (19,744,155) | -- |
| Fidelity U.S. Low Volatility Equity Fund | 7,708,147 | 460,823 | 577,879 | 248,815 | (34,630) | (1,198,291) | 6,358,170 |
| Fidelity Value Discovery Fund | 2,049,355 | 135,604 | 424,475 | -- | 19,060 | (199,761) | 1,579,783 |
| VIP Investment Grade Bond Portfolio II Investor Class | -- | 191,680,234 | 1,722,349 | -- | (47,185) | (4,442,867) | 185,467,833 |
| VIP Stock Selector All Cap Portfolio Investor Class | 157,776,597 | 2,992,696 | 12,188,759 | -- | (1,649,043) | (32,410,441) | 114,521,050 |
| $766,030,572 | $629,002,854 | $465,932,326 | $5,113,456 | $(24,134,182) | $(84,065,961) | $820,900,957 |
(a) Includes the value of shares purchased or redeemed through in-kind transactions, as applicable.
Amounts in the income column in the above table include any capital gain distributions from underlying funds, which are presented in the corresponding line-item in the Statement of Operations, if applicable.
Investment Valuation
The following is a summary of the inputs used, as of June 30, 2022, involving the Fund's assets and liabilities carried at fair value. The inputs or methodology used for valuing securities may not be an indication of the risk associated with investing in those securities. For more information on valuation inputs, and their aggregation into the levels used below, please refer to the Investment Valuation section in the accompanying Notes to Financial Statements.
| Valuation Inputs at Reporting Date: | ||||
| Description | Total | Level 1 | Level 2 | Level 3 |
| Investments in Securities: | ||||
| Equity Funds | $199,970,362 | $199,970,362 | $-- | $-- |
| Fixed-Income Funds | 429,139,922 | 429,139,922 | -- | -- |
| Money Market Funds | 230,728,470 | 230,728,470 | -- | -- |
| Other Short-Term Investments and Net Other Assets | 617,750 | -- | 617,750 | -- |
| Total Investments in Securities: | $860,456,504 | $859,838,754 | $617,750 | $-- |
| Derivative Instruments: | ||||
| Assets | ||||
| Futures Contracts | $2,685 | $2,685 | $-- | $-- |
| Total Assets | $2,685 | $2,685 | $-- | $-- |
| Liabilities | ||||
| Futures Contracts | $(92,578) | $(92,578) | $-- | $-- |
| Total Liabilities | $(92,578) | $(92,578) | $-- | $-- |
| Total Derivative Instruments: | $(89,893) | $(89,893) | $-- | $-- |
Value of Derivative Instruments
The following table is a summary of the Fund's value of derivative instruments by primary risk exposure as of June 30, 2022. For additional information on derivative instruments, please refer to the Derivative Instruments section in the accompanying Notes to Financial Statements.
| Primary Risk Exposure / Derivative Type | Value | |
| Asset | Liability | |
| Equity Risk | ||
| Futures Contracts(a) | $2,685 | $(92,578) |
| Total Equity Risk | 2,685 | (92,578) |
| Total Value of Derivatives | $2,685 | $(92,578) |
(a) Reflects gross cumulative appreciation (depreciation) on futures contracts as presented in the Schedule of Investments. In the Statement of Assets and Liabilities, the period end daily variation margin is included in receivable or payable for daily variation margin on futures contracts, and the net cumulative appreciation (depreciation) is included in Total accumulated earnings (loss).
See accompanying notes which are an integral part of the financial statements.
VIP FundsManager® 20% Portfolio
Financial Statements
Statement of Assets and Liabilities
| June 30, 2022 (Unaudited) | ||
| Assets | ||
| Investment in securities, at value — See accompanying schedule: Unaffiliated issuers (cost $617,828) | $617,750 | |
| Fidelity Central Funds (cost $38,937,797) | 38,937,797 | |
| Other affiliated issuers (cost $854,539,018) | 820,900,957 | |
| Total Investment in Securities (cost $894,094,643) | $860,456,504 | |
| Receivable for investments sold | 22,452 | |
| Receivable for fund shares sold | 879 | |
| Distributions receivable from Fidelity Central Funds | 38,791 | |
| Receivable for daily variation margin on futures contracts | 89,737 | |
| Total assets | 860,608,363 | |
| Liabilities | ||
| Payable for investments purchased | $5,806,193 | |
| Payable for fund shares redeemed | 85,691 | |
| Accrued management fee | 71,930 | |
| Distribution and service plan fees payable | 1,505 | |
| Total liabilities | 5,965,319 | |
| Net Assets | $854,643,044 | |
| Net Assets consist of: | ||
| Paid in capital | $899,651,037 | |
| Total accumulated earnings (loss) | (45,007,993) | |
| Net Assets | $854,643,044 | |
| Net Asset Value and Maximum Offering Price | ||
| Service Class: | ||
| Net Asset Value, offering price and redemption price per share ($55,429 ÷ 5,399 shares) | $10.27 | |
| Service Class 2: | ||
| Net Asset Value, offering price and redemption price per share ($11,925,565 ÷ 1,166,237 shares) | $10.23 | |
| Investor Class: | ||
| Net Asset Value, offering price and redemption price per share ($842,662,050 ÷ 82,136,914 shares) | $10.26 |
See accompanying notes which are an integral part of the financial statements.
Statement of Operations
| Six months ended June 30, 2022 (Unaudited) | ||
| Investment Income | ||
| Dividends: | ||
| Affiliated issuers | $4,851,739 | |
| Interest | 2,631 | |
| Income from Fidelity Central Funds | 148,585 | |
| Total income | 5,002,955 | |
| Expenses | ||
| Management fee | $1,087,623 | |
| Distribution and service plan fees | 14,289 | |
| Independent trustees' fees and expenses | 1,436 | |
| Total expenses before reductions | 1,103,348 | |
| Expense reductions | (238,601) | |
| Total expenses after reductions | 864,747 | |
| Net investment income (loss) | 4,138,208 | |
| Realized and Unrealized Gain (Loss) | ||
| Net realized gain (loss) on: | ||
| Investment securities: | ||
| Unaffiliated issuers | (2) | |
| Affiliated issuers | (24,134,182) | |
| Futures contracts | 8,919,707 | |
| Capital gain distributions from underlying funds: | ||
| Affiliated issuers | 261,717 | |
| Total net realized gain (loss) | (14,952,760) | |
| Change in net unrealized appreciation (depreciation) on: | ||
| Investment securities: | ||
| Unaffiliated issuers | (133) | |
| Affiliated issuers | (84,065,961) | |
| Futures contracts | 460,007 | |
| Total change in net unrealized appreciation (depreciation) | (83,606,087) | |
| Net gain (loss) | (98,558,847) | |
| Net increase (decrease) in net assets resulting from operations | $(94,420,639) |
See accompanying notes which are an integral part of the financial statements.
Statement of Changes in Net Assets
| Six months ended June 30, 2022 (Unaudited) | Year ended December 31, 2021 | |
| Increase (Decrease) in Net Assets | ||
| Operations | ||
| Net investment income (loss) | $4,138,208 | $10,744,584 |
| Net realized gain (loss) | (14,952,760) | 64,198,197 |
| Change in net unrealized appreciation (depreciation) | (83,606,087) | (40,433,333) |
| Net increase (decrease) in net assets resulting from operations | (94,420,639) | 34,509,448 |
| Distributions to shareholders | (65,297,388) | (12,303,562) |
| Share transactions - net increase (decrease) | 17,965,188 | 39,709,707 |
| Total increase (decrease) in net assets | (141,752,839) | 61,915,593 |
| Net Assets | ||
| Beginning of period | 996,395,883 | 934,480,290 |
| End of period | $854,643,044 | $996,395,883 |
See accompanying notes which are an integral part of the financial statements.
Financial Highlights
VIP FundsManager 20% Portfolio Service Class
| Six months ended (Unaudited) June 30, | Years endedDecember 31, | |||||
| 2022 | 2021 | 2020 | 2019 | 2018 | 2017 | |
| Selected Per–Share Data | ||||||
| Net asset value, beginning of period | $12.18 | $11.89 | $11.19 | $10.75 | $11.63 | $11.04 |
| Income from Investment Operations | ||||||
| Net investment income (loss)A,B | .05 | .14 | .13 | .22 | .21 | .16 |
| Net realized and unrealized gain (loss) | (1.16) | .30 | .77 | .86 | (.40) | .65 |
| Total from investment operations | (1.11) | .44 | .90 | 1.08 | (.19) | .81 |
| Distributions from net investment income | (.03) | (.13) | (.13) | (.21) | (.21) | (.15) |
| Distributions from net realized gain | (.77) | (.03) | (.07) | (.43) | (.48) | (.07) |
| Total distributions | (.80) | (.15)C | (.20) | (.64) | (.69) | (.22) |
| Net asset value, end of period | $10.27 | $12.18 | $11.89 | $11.19 | $10.75 | $11.63 |
| Total ReturnD,E,F | (9.61)% | 3.74% | 8.11% | 10.39% | (1.67)% | 7.33% |
| Ratios to Average Net AssetsB,G,H | ||||||
| Expenses before reductions | .33%I | .35% | .35% | .35% | .35% | .35% |
| Expenses net of fee waivers, if any | .18%I | .20% | .20% | .20% | .20% | .20% |
| Expenses net of all reductions | .18%I | .20% | .20% | .20% | .20% | .20% |
| Net investment income (loss) | .90%I | 1.12% | 1.17% | 2.01% | 1.87% | 1.41% |
| Supplemental Data | ||||||
| Net assets, end of period (000 omitted) | $55 | $63 | $61 | $57 | $55 | $59 |
| Portfolio turnover rateJ | 119%I | 45%K | 32%K | 33% | 47% | 61% |
A Calculated based on average shares outstanding during the period.
B Net investment income (loss) is affected by the timing of the declaration of dividends by any underlying mutual funds or exchange-traded funds (ETFs). Net investment income (loss) of any such underlying funds is not included in the Fund's net investment income (loss) ratio.
C Total distributions per share do not sum due to rounding.
D Total returns for periods of less than one year are not annualized.
E Total returns do not reflect charges attributable to your insurance company's separate account. Inclusion of these charges would reduce the total returns shown.
F Total returns would have been lower if certain expenses had not been reduced during the applicable periods shown.
G Fees and expenses of any underlying mutual funds or exchange-traded funds (ETFs) are not included in the Fund's expense ratio. The Fund indirectly bears its proportionate share of these expenses. For additional expense information related to investments in Fidelity Central Funds, please refer to the "Investments in Fidelity Central Funds" note found in the Notes to Financial Statements section of the most recent Annual or Semi-Annual report.
H Expense ratios reflect operating expenses of the class. Expenses before reductions do not reflect amounts reimbursed, waived, or reduced through arrangements with the investment adviser, brokerage services, or other offset arrangements, if applicable, and do not represent the amount paid by the class during periods when reimbursements, waivers or reductions occur.
I Annualized
J Amount does not include the portfolio activity of any underlying mutual funds or exchange-traded funds (ETFs).
K Portfolio turnover rate excludes securities received or delivered in-kind.
See accompanying notes which are an integral part of the financial statements.
VIP FundsManager 20% Portfolio Service Class 2
| Six months ended (Unaudited) June 30, | Years endedDecember 31, | |||||
| 2022 | 2021 | 2020 | 2019 | 2018 | 2017 | |
| Selected Per–Share Data | ||||||
| Net asset value, beginning of period | $12.14 | $11.86 | $11.16 | $10.72 | $11.60 | $11.01 |
| Income from Investment Operations | ||||||
| Net investment income (loss)A,B | .04 | .12 | .12 | .20 | .19 | .14 |
| Net realized and unrealized gain (loss) | (1.15) | .30 | .77 | .87 | (.40) | .65 |
| Total from investment operations | (1.11) | .42 | .89 | 1.07 | (.21) | .79 |
| Distributions from net investment income | (.03) | (.11) | (.11) | (.20) | (.19) | (.13) |
| Distributions from net realized gain | (.77) | (.03) | (.07) | (.43) | (.48) | (.07) |
| Total distributions | (.80) | (.14) | (.19)C | (.63) | (.67) | (.20) |
| Net asset value, end of period | $10.23 | $12.14 | $11.86 | $11.16 | $10.72 | $11.60 |
| Total ReturnD,E,F | (9.65)% | 3.52% | 7.97% | 10.26% | (1.82)% | 7.19% |
| Ratios to Average Net AssetsB,G,H | ||||||
| Expenses before reductions | .48%I | .50% | .50% | .50% | .50% | .50% |
| Expenses net of fee waivers, if any | .33%I | .35% | .35% | .35% | .35% | .35% |
| Expenses net of all reductions | .33%I | .35% | .35% | .35% | .35% | .35% |
| Net investment income (loss) | .74%I | .97% | 1.02% | 1.86% | 1.72% | 1.26% |
| Supplemental Data | ||||||
| Net assets, end of period (000 omitted) | $11,926 | $10,257 | $9,323 | $8,978 | $8,286 | $8,188 |
| Portfolio turnover rateJ | 119%I | 45%K | 32%K | 33% | 47% | 61% |
A Calculated based on average shares outstanding during the period.
B Net investment income (loss) is affected by the timing of the declaration of dividends by any underlying mutual funds or exchange-traded funds (ETFs). Net investment income (loss) of any such underlying funds is not included in the Fund's net investment income (loss) ratio.
C Total distributions per share do not sum due to rounding.
D Total returns for periods of less than one year are not annualized.
E Total returns do not reflect charges attributable to your insurance company's separate account. Inclusion of these charges would reduce the total returns shown.
F Total returns would have been lower if certain expenses had not been reduced during the applicable periods shown.
G Fees and expenses of any underlying mutual funds or exchange-traded funds (ETFs) are not included in the Fund's expense ratio. The Fund indirectly bears its proportionate share of these expenses. For additional expense information related to investments in Fidelity Central Funds, please refer to the "Investments in Fidelity Central Funds" note found in the Notes to Financial Statements section of the most recent Annual or Semi-Annual report.
H Expense ratios reflect operating expenses of the class. Expenses before reductions do not reflect amounts reimbursed, waived, or reduced through arrangements with the investment adviser, brokerage services, or other offset arrangements, if applicable, and do not represent the amount paid by the class during periods when reimbursements, waivers or reductions occur.
I Annualized
J Amount does not include the portfolio activity of any underlying mutual funds or exchange-traded funds (ETFs).
K Portfolio turnover rate excludes securities received or delivered in-kind.
See accompanying notes which are an integral part of the financial statements.
VIP FundsManager 20% Portfolio Investor Class
| Six months ended (Unaudited) June 30, | Years endedDecember 31, | |||||
| 2022 | 2021 | 2020 | 2019 | 2018 | 2017 | |
| Selected Per–Share Data | ||||||
| Net asset value, beginning of period | $12.17 | $11.89 | $11.18 | $10.74 | $11.62 | $11.04 |
| Income from Investment Operations | ||||||
| Net investment income (loss)A,B | .05 | .14 | .13 | .22 | .21 | .16 |
| Net realized and unrealized gain (loss) | (1.16) | .29 | .78 | .86 | (.40) | .64 |
| Total from investment operations | (1.11) | .43 | .91 | 1.08 | (.19) | .80 |
| Distributions from net investment income | (.03) | (.13) | (.13) | (.21) | (.21) | (.15) |
| Distributions from net realized gain | (.77) | (.03) | (.07) | (.43) | (.48) | (.07) |
| Total distributions | (.80) | (.15)C | (.20) | (.64) | (.69) | (.22) |
| Net asset value, end of period | $10.26 | $12.17 | $11.89 | $11.18 | $10.74 | $11.62 |
| Total ReturnD,E,F | (9.62)% | 3.65% | 8.21% | 10.40% | (1.67)% | 7.24% |
| Ratios to Average Net AssetsB,G,H | ||||||
| Expenses before reductions | .23%I | .25% | .25% | .25% | .25% | .25% |
| Expenses net of fee waivers, if any | .18%I | .20% | .20% | .20% | .20% | .20% |
| Expenses net of all reductions | .18%I | .20% | .20% | .20% | .20% | .20% |
| Net investment income (loss) | .89%I | 1.12% | 1.17% | 2.01% | 1.87% | 1.41% |
| Supplemental Data | ||||||
| Net assets, end of period (000 omitted) | $842,662 | $986,076 | $925,096 | $812,070 | $719,784 | $777,291 |
| Portfolio turnover rateJ | 119%I | 45%K | 32%K | 33% | 47% | 61% |
A Calculated based on average shares outstanding during the period.
B Net investment income (loss) is affected by the timing of the declaration of dividends by any underlying mutual funds or exchange-traded funds (ETFs). Net investment income (loss) of any such underlying funds is not included in the Fund's net investment income (loss) ratio.
C Total distributions per share do not sum due to rounding.
D Total returns for periods of less than one year are not annualized.
E Total returns do not reflect charges attributable to your insurance company's separate account. Inclusion of these charges would reduce the total returns shown.
F Total returns would have been lower if certain expenses had not been reduced during the applicable periods shown.
G Fees and expenses of any underlying mutual funds or exchange-traded funds (ETFs) are not included in the Fund's expense ratio. The Fund indirectly bears its proportionate share of these expenses. For additional expense information related to investments in Fidelity Central Funds, please refer to the "Investments in Fidelity Central Funds" note found in the Notes to Financial Statements section of the most recent Annual or Semi-Annual report.
H Expense ratios reflect operating expenses of the class. Expenses before reductions do not reflect amounts reimbursed, waived, or reduced through arrangements with the investment adviser, brokerage services, or other offset arrangements, if applicable, and do not represent the amount paid by the class during periods when reimbursements, waivers or reductions occur.
I Annualized
J Amount does not include the portfolio activity of any underlying mutual funds or exchange-traded funds (ETFs).
K Portfolio turnover rate excludes securities received or delivered in-kind.
See accompanying notes which are an integral part of the financial statements.
VIP FundsManager® 50% Portfolio
Investment Summary (Unaudited)
The information in the following tables is based on the direct investments of the Fund.Top Holdings as of June 30, 2022
| % of fund's net assets | |
| VIP Stock Selector All Cap Portfolio Investor Class | 30.1 |
| VIP Investment Grade Bond II Portfolio - Investor Class | 15.8 |
| Fidelity Total Bond Fund | 15.8 |
| Fidelity Overseas Fund | 4.7 |
| Fidelity Cash Central Fund 1.58% | 4.5 |
| Fidelity Emerging Markets Fund | 3.7 |
| Fidelity Floating Rate High Income Fund | 3.6 |
| Fidelity Inflation-Protected Bond Index Fund | 2.1 |
| Fidelity U.S. Low Volatility Equity Fund | 2.0 |
| Fidelity Long-Term Treasury Bond Index Fund | 1.8 |
| 84.1 |
Asset Allocation (% of fund's net assets)
| Period end* | ||
| Domestic Equity Funds | 38.2% | |
| International Equity Funds | 17.4% | |
| Bond Funds | 40.1% | |
| Short-Term Funds | 6.3% | |
| Short-Term Investments | 0.1% | |
| Net Other Assets (Liabilities)** | (2.1)% | |
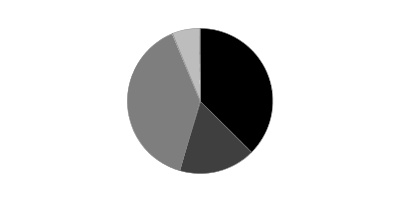
* Futures – (2.7)%
** Net Other Assets (Liabilities) are not included in the pie chart
VIP FundsManager® 50% Portfolio
Schedule of Investments June 30, 2022 (Unaudited)
Showing Percentage of Net Assets
| Equity Funds - 55.6% | |||
| Shares | Value | ||
| Fidelity Canada Fund (a) | 299,326 | $17,920,641 | |
| Fidelity Commodity Strategy Fund (a) | 3,869,379 | 39,815,915 | |
| Fidelity Contrafund (a) | 1,269,564 | 16,885,198 | |
| Fidelity Emerging Markets Discovery Fund (a) | 2,677,282 | 36,062,987 | |
| Fidelity Emerging Markets Fund (a) | 5,464,790 | 179,245,128 | |
| Fidelity Equity-Income Fund (a) | 892,275 | 55,820,750 | |
| Fidelity Global Commodity Stock Fund (a) | 5,170,691 | 89,918,316 | |
| Fidelity International Capital Appreciation Fund (a) | 2,241,040 | 44,910,435 | |
| Fidelity International Discovery Fund (a) | 1,516,337 | 58,924,871 | |
| Fidelity International Enhanced Index Fund (a) | 6,698,416 | 60,821,614 | |
| Fidelity International Small Cap Fund (a) | 964,686 | 25,342,291 | |
| Fidelity International Small Cap Opportunities Fund (a) | 1,895,305 | 34,058,637 | |
| Fidelity International Value Fund (a) | 4,636,729 | 36,908,363 | |
| Fidelity Japan Smaller Companies Fund (a) | 2,802,780 | 35,427,143 | |
| Fidelity Large Cap Value Enhanced Index Fund (a) | 2,058,785 | 29,193,573 | |
| Fidelity Low-Priced Stock Fund (a) | 1,647,583 | 76,645,551 | |
| Fidelity Overseas Fund (a) | 4,693,260 | 227,106,859 | |
| Fidelity Real Estate Investment Portfolio (a) | 1,109,063 | 48,732,220 | |
| Fidelity U.S. Low Volatility Equity Fund (a) | 9,586,935 | 96,061,092 | |
| Fidelity Value Discovery Fund (a) | 968,312 | 33,522,968 | |
| VIP Stock Selector All Cap Portfolio Investor Class (a) | 185,229,973 | 1,467,021,386 | |
| TOTAL EQUITY FUNDS | |||
| (Cost $2,973,920,572) | 2,710,345,938 | ||
| Fixed-Income Funds - 40.1% | |||
| Fidelity Floating Rate High Income Fund (a) | 19,888,330 | 176,409,486 | |
| Fidelity High Income Fund (a) | 5,120,780 | 37,228,070 | |
| Fidelity Inflation-Protected Bond Index Fund (a) | 9,873,180 | 100,212,774 | |
| Fidelity Long-Term Treasury Bond Index Fund (a) | 7,801,084 | 89,946,501 | |
| Fidelity New Markets Income Fund (a) | 986,965 | 11,281,004 | |
| Fidelity Total Bond Fund (a) | 79,249,935 | 767,931,870 | |
| VIP Investment Grade Bond II Portfolio - Investor Class (a) | 79,012,051 | 771,157,621 | |
| TOTAL FIXED-INCOME FUNDS | |||
| (Cost $2,018,629,439) | 1,954,167,326 | ||
| Money Market Funds - 6.3% | |||
| Fidelity Cash Central Fund 1.58% (b) | 218,477,465 | 218,521,160 | |
| Fidelity Investments Money Market Government Portfolio Institutional Class 1.25% (a)(c) | 87,921,097 | 87,921,097 | |
| TOTAL MONEY MARKET FUNDS | |||
| (Cost $306,442,257) | 306,442,257 | ||
| Principal Amount | Value | ||
| U.S. Treasury Obligations - 0.1% | |||
| U.S. Treasury Bills, yield at date of purchase 0.66% to 1.7% 7/7/22 to 9/29/22 (d) | |||
| (Cost $5,392,962) | 5,410,000 | 5,393,288 | |
| TOTAL INVESTMENT IN SECURITIES - 102.1% | |||
| (Cost $5,304,385,230) | 4,976,348,809 | ||
| NET OTHER ASSETS (LIABILITIES) - (2.1)% | (101,441,089) | ||
| NET ASSETS - 100% | $4,874,907,720 |
| Futures Contracts | |||||
| Number of contracts | Expiration Date | Notional Amount | Value | Unrealized Appreciation/(Depreciation) | |
| Purchased | |||||
| Equity Index Contracts | |||||
| ICE E-mini MSCI Emerging Markets Index Contracts (United States) | 953 | Sept. 2022 | $47,778,655 | $6,802 | $6,802 |
| Sold | |||||
| Equity Index Contracts | |||||
| CME E-mini S&P 500 Index Contracts (United States) | 892 | Sept. 2022 | 169,011,700 | (812,836) | (812,836) |
| ICE E-mini MSCI EAFE Index Contracts (United States) | 130 | Sept. 2022 | 12,067,900 | (65,496) | (65,496) |
| TOTAL SOLD | $(878,332) | ||||
| TOTAL FUTURES CONTRACTS | $(871,530) |
The notional amount of futures purchased as a percentage of Net Assets is 1.0%
The notional amount of futures sold as a percentage of Net Assets is 3.7%
For the period, the average monthly notional amount at value for futures contracts in the aggregate was $268,569,995.
Legend
(a) Affiliated Fund
(b) Affiliated fund that is generally available only to investment companies and other accounts managed by Fidelity Investments. The rate quoted is the annualized seven-day yield of the fund at period end. A complete unaudited listing of the fund's holdings as of its most recent quarter end is available upon request. In addition, each Fidelity Central Fund's financial statements are available on the SEC's website or upon request.
(c) The rate quoted is the annualized seven-day yield of the fund at period end.
(d) Security or a portion of the security was pledged to cover margin requirements for futures contracts. At period end, the value of securities pledged amounted to $5,393,288.
Affiliated Central Funds
Fiscal year to date information regarding the Fund's investments in Fidelity Central Funds, including the ownership percentage, is presented below.
| Fund | Value, beginning of period | Purchases | Sales Proceeds | Dividend Income | Realized Gain/Loss | Change in Unrealized appreciation (depreciation) | Value, end of period | % ownership, end of period |
| Fidelity Cash Central Fund 1.58% | $240,620,688 | $312,134,726 | $334,234,254 | $516,266 | $-- | $-- | $218,521,160 | 0.4% |
| Total | $240,620,688 | $312,134,726 | $334,234,254 | $516,266 | $-- | $-- | $218,521,160 |
Amounts in the income column in the above table include any capital gain distributions from underlying funds, which are presented in the corresponding line-item in the Statement of Operations, if applicable.
Affiliated Underlying Funds
Fiscal year to date information regarding the Fund's investments in affiliated Underlying Funds is presented below. Exchanges between classes of the same affiliated Underlying Funds may occur, and are excluded from purchases and sales below if applicable. If an underlying Fund changes its name, the name presented below is the name in effect at period end.
| Affiliate | Value, beginning of period | Purchases(a) | Sales Proceeds(a) | Dividend Income | Realized Gain (loss) | Change in Unrealized appreciation (depreciation) | Value, end of period |
| Fidelity Canada Fund | $-- | $19,196,216 | $376,199 | $-- | $(18,514) | $(880,862) | $17,920,641 |
| Fidelity Commodity Strategy Fund | 46,184,585 | 12,924,154 | 28,516,480 | -- | 7,665,872 | 1,557,784 | 39,815,915 |
| Fidelity Contrafund | 26,928,546 | 578,264 | 3,090,684 | 303,000 | (247,408) | (7,283,520) | 16,885,198 |
| Fidelity Emerging Markets Discovery Fund | 28,162,801 | 13,596,261 | 634,699 | -- | (77,989) | (4,983,387) | 36,062,987 |
| Fidelity Emerging Markets Fund | 85,564,823 | 120,999,590 | 2,582,656 | -- | (393,200) | (24,343,429) | 179,245,128 |
| Fidelity Equity-Income Fund | 69,589,597 | 872,928 | 7,485,131 | 252,952 | 207,000 | (7,363,644) | 55,820,750 |
| Fidelity Floating Rate High Income Fund | 206,003,852 | 4,336,682 | 21,545,340 | 3,325,357 | (643,950) | (11,741,758) | 176,409,486 |
| Fidelity Global Commodity Stock Fund | 94,953,263 | 703,803 | 12,622,882 | -- | 2,090,126 | 4,794,006 | 89,918,316 |
| Fidelity High Income Fund | 45,407,977 | 1,136,574 | 1,983,529 | 924,150 | (37,011) | (7,295,941) | 37,228,070 |
| Fidelity Inflation-Protected Bond Index Fund | 178,483,279 | 667,038 | 67,849,021 | -- | 6,058,682 | (17,147,204) | 100,212,774 |
| Fidelity International Capital Appreciation Fund | 69,561,632 | 309,215 | 5,047,326 | -- | (937,050) | (18,976,036) | 44,910,435 |
| Fidelity International Discovery Fund | 87,809,314 | 405,729 | 6,690,474 | -- | (2,260,763) | (20,338,935) | 58,924,871 |
| Fidelity International Enhanced Index Fund | 81,199,208 | 359,917 | 6,310,430 | -- | (855,927) | (13,571,154) | 60,821,614 |
| Fidelity International Small Cap Fund | 33,991,641 | 159,283 | 2,714,394 | -- | (100,656) | (5,993,583) | 25,342,291 |
| Fidelity International Small Cap Opportunities Fund | 50,047,565 | 210,760 | -- | -- | -- | (16,199,688) | 34,058,637 |
| Fidelity International Value Fund | 46,904,553 | 210,761 | 3,782,959 | -- | (68,180) | (6,355,812) | 36,908,363 |
| Fidelity Investments Money Market Government Portfolio Institutional Class 1.25% | -- | 91,538,868 | 3,617,771 | 124,140 | -- | -- | 87,921,097 |
| Fidelity Japan Smaller Companies Fund | 44,171,817 | -- | -- | -- | -- | (8,744,674) | 35,427,143 |
| Fidelity Large Cap Value Enhanced Index Fund | 36,543,576 | 301,212 | 3,720,788 | -- | (28,262) | (3,902,165) | 29,193,573 |
| Fidelity Long-Term Treasury Bond Index Fund | 159,226,200 | 1,961,416 | 42,746,964 | 1,326,230 | (8,371,750) | (20,122,401) | 89,946,501 |
| Fidelity Low-Priced Stock Fund | 97,738,692 | 757,677 | 9,464,959 | -- | (185,392) | (12,200,467) | 76,645,551 |
| Fidelity New Markets Income Fund | 14,413,594 | 336,993 | 661,176 | 266,184 | (83,904) | (2,724,503) | 11,281,004 |
| Fidelity Overseas Fund | 347,123,964 | 1,529,486 | 25,409,963 | -- | (4,827,384) | (91,309,244) | 227,106,859 |
| Fidelity Real Estate Investment Portfolio | 81,569,943 | 306,748 | 19,778,573 | -- | 2,601,696 | (15,967,594) | 48,732,220 |
| Fidelity Total Bond Fund | -- | 772,749,756 | 1,449,021 | 990,084 | (39,351) | (3,329,514) | 767,931,870 |
| Fidelity U.S. Bond Index Fund | 1,620,378,871 | 164,104,162 | 1,612,896,908 | 13,826,421 | (91,870,873) | (79,715,252) | -- |
| Fidelity U.S. Low Volatility Equity Fund | 115,189,015 | 4,305,166 | 5,019,028 | 3,773,698 | (231,819) | (18,182,242) | 96,061,092 |
| Fidelity Value Discovery Fund | 40,995,515 | 333,169 | 4,134,796 | -- | 611,455 | (4,282,375) | 33,522,968 |
| VIP Investment Grade Bond Portfolio II Investor Class | -- | 797,860,255 | 8,087,722 | -- | (167,975) | (18,446,937) | 771,157,621 |
| VIP Stock Selector All Cap Portfolio Investor Class | 2,003,817,452 | 7,346,790 | 113,212,200 | -- | (14,572,519) | (416,358,137) | 1,467,021,386 |
| $5,711,961,275 | $2,020,098,873 | $2,021,432,073 | $25,112,216 | $(106,785,046) | $(851,408,668) | $4,752,434,361 |
(a) Includes the value of shares purchased or redeemed through in-kind transactions, as applicable.
Amounts in the income column in the above table include any capital gain distributions from underlying funds, which are presented in the corresponding line-item in the Statement of Operations, if applicable.
Investment Valuation
The following is a summary of the inputs used, as of June 30, 2022, involving the Fund's assets and liabilities carried at fair value. The inputs or methodology used for valuing securities may not be an indication of the risk associated with investing in those securities. For more information on valuation inputs, and their aggregation into the levels used below, please refer to the Investment Valuation section in the accompanying Notes to Financial Statements.
| Valuation Inputs at Reporting Date: | ||||
| Description | Total | Level 1 | Level 2 | Level 3 |
| Investments in Securities: | ||||
| Equity Funds | $2,710,345,938 | $2,710,345,938 | $-- | $-- |
| Fixed-Income Funds | 1,954,167,326 | 1,954,167,326 | -- | -- |
| Money Market Funds | 306,442,257 | 306,442,257 | -- | -- |
| Other Short-Term Investments and Net Other Assets | 5,393,288 | -- | 5,393,288 | -- |
| Total Investments in Securities: | $4,976,348,809 | $4,970,955,521 | $5,393,288 | $-- |
| Derivative Instruments: | ||||
| Assets | ||||
| Futures Contracts | $6,802 | $6,802 | $-- | $-- |
| Total Assets | $6,802 | $6,802 | $-- | $-- |
| Liabilities | ||||
| Futures Contracts | $(878,332) | $(878,332) | $-- | $-- |
| Total Liabilities | $(878,332) | $(878,332) | $-- | $-- |
| Total Derivative Instruments: | $(871,530) | $(871,530) | $-- | $-- |
Value of Derivative Instruments
The following table is a summary of the Fund's value of derivative instruments by primary risk exposure as of June 30, 2022. For additional information on derivative instruments, please refer to the Derivative Instruments section in the accompanying Notes to Financial Statements.
| Primary Risk Exposure / Derivative Type | Value | |
| Asset | Liability | |
| Equity Risk | ||
| Futures Contracts(a) | $6,802 | $(878,332) |
| Total Equity Risk | 6,802 | (878,332) |
| Total Value of Derivatives | $6,802 | $(878,332) |
(a) Reflects gross cumulative appreciation (depreciation) on futures contracts as presented in the Schedule of Investments. In the Statement of Assets and Liabilities, the period end daily variation margin is included in receivable or payable for daily variation margin on futures contracts, and the net cumulative appreciation (depreciation) is included in Total accumulated earnings (loss).
See accompanying notes which are an integral part of the financial statements.
VIP FundsManager® 50% Portfolio
Financial Statements
Statement of Assets and Liabilities
| June 30, 2022 (Unaudited) | ||
| Assets | ||
| Investment in securities, at value — See accompanying schedule: Unaffiliated issuers (cost $5,392,962) | $5,393,288 | |
| Fidelity Central Funds (cost $218,521,160) | 218,521,160 | |
| Other affiliated issuers (cost $5,080,471,108) | 4,752,434,361 | |
| Total Investment in Securities (cost $5,304,385,230) | $4,976,348,809 | |
| Receivable for investments sold | 1,514,229 | |
| Receivable for fund shares sold | 15,547 | |
| Distributions receivable from Fidelity Central Funds | 217,519 | |
| Receivable for daily variation margin on futures contracts | 679,027 | |
| Total assets | 4,978,775,131 | |
| Liabilities | ||
| Payable for investments purchased | $100,834,277 | |
| Payable for fund shares redeemed | 2,606,796 | |
| Accrued management fee | 416,582 | |
| Distribution and service plan fees payable | 9,756 | |
| Total liabilities | 103,867,411 | |
| Net Assets | $4,874,907,720 | |
| Net Assets consist of: | ||
| Paid in capital | $5,231,565,742 | |
| Total accumulated earnings (loss) | (356,658,022) | |
| Net Assets | $4,874,907,720 | |
| Net Asset Value and Maximum Offering Price | ||
| Service Class: | ||
| Net Asset Value, offering price and redemption price per share ($49,613 ÷ 4,771 shares) | $10.40 | |
| Service Class 2: | ||
| Net Asset Value, offering price and redemption price per share ($75,435,886 ÷ 7,297,837 shares) | $10.34 | |
| Investor Class: | ||
| Net Asset Value, offering price and redemption price per share ($4,799,422,221 ÷ 461,796,743 shares) | $10.39 |
See accompanying notes which are an integral part of the financial statements.
Statement of Operations
| Six months ended June 30, 2022 (Unaudited) | ||
| Investment Income | ||
| Dividends: | ||
| Affiliated issuers | $21,258,044 | |
| Interest | 18,660 | |
| Income from Fidelity Central Funds | 516,266 | |
| Total income | 21,792,970 | |
| Expenses | ||
| Management fee | $6,354,050 | |
| Distribution and service plan fees | 106,236 | |
| Independent trustees' fees and expenses | 8,433 | |
| Total expenses before reductions | 6,468,719 | |
| Expense reductions | (1,398,325) | |
| Total expenses after reductions | 5,070,394 | |
| Net investment income (loss) | 16,722,576 | |
| Realized and Unrealized Gain (Loss) | ||
| Net realized gain (loss) on: | ||
| Investment securities: | ||
| Unaffiliated issuers | 2 | |
| Affiliated issuers | (106,785,046) | |
| Futures contracts | 58,997,502 | |
| Capital gain distributions from underlying funds: | ||
| Affiliated issuers | 3,854,172 | |
| Total net realized gain (loss) | (43,933,370) | |
| Change in net unrealized appreciation (depreciation) on: | ||
| Investment securities: | ||
| Unaffiliated issuers | 41 | |
| Affiliated issuers | (851,408,668) | |
| Futures contracts | 2,689,425 | |
| Total change in net unrealized appreciation (depreciation) | (848,719,202) | |
| Net gain (loss) | (892,652,572) | |
| Net increase (decrease) in net assets resulting from operations | $(875,929,996) |
See accompanying notes which are an integral part of the financial statements.
Statement of Changes in Net Assets
| Six months ended June 30, 2022 (Unaudited) | Year ended December 31, 2021 | |
| Increase (Decrease) in Net Assets | ||
| Operations | ||
| Net investment income (loss) | $16,722,576 | $65,026,799 |
| Net realized gain (loss) | (43,933,370) | 895,910,930 |
| Change in net unrealized appreciation (depreciation) | (848,719,202) | (396,365,735) |
| Net increase (decrease) in net assets resulting from operations | (875,929,996) | 564,571,994 |
| Distributions to shareholders | (897,373,115) | (167,003,158) |
| Share transactions - net increase (decrease) | 666,244,348 | (261,609,865) |
| Total increase (decrease) in net assets | (1,107,058,763) | 135,958,971 |
| Net Assets | ||
| Beginning of period | 5,981,966,483 | 5,846,007,512 |
| End of period | $4,874,907,720 | $5,981,966,483 |
See accompanying notes which are an integral part of the financial statements.
Financial Highlights
VIP FundsManager 50% Portfolio Service Class
| Six months ended (Unaudited) June 30, | Years endedDecember 31, | |||||
| 2022 | 2021 | 2020 | 2019 | 2018 | 2017 | |
| Selected Per–Share Data | ||||||
| Net asset value, beginning of period | $14.51 | $13.57 | $12.28 | $11.68 | $13.53 | $12.03 |
| Income from Investment Operations | ||||||
| Net investment income (loss)A,B | .04 | .15 | .14 | .20 | .19 | .16 |
| Net realized and unrealized gain (loss) | (1.96) | 1.19 | 1.55 | 1.76 | (.86) | 1.58 |
| Total from investment operations | (1.92) | 1.34 | 1.69 | 1.96 | (.67) | 1.74 |
| Distributions from net investment income | (.04) | (.16) | (.14) | (.20) | (.18) | (.15) |
| Distributions from net realized gain | (2.16) | (.24) | (.26) | (1.15) | (1.00) | (.08) |
| Total distributions | (2.19)C | (.40) | (.40) | (1.36)C | (1.18) | (.24)C |
| Net asset value, end of period | $10.40 | $14.51 | $13.57 | $12.28 | $11.68 | $13.53 |
| Total ReturnD,E,F | (14.91)% | 10.01% | 14.06% | 17.89% | (5.28)% | 14.45% |
| Ratios to Average Net AssetsB,G,H | ||||||
| Expenses before reductions | .34%I | .35% | .35% | .35% | .35% | .35% |
| Expenses net of fee waivers, if any | .18%I | .20% | .20% | .20% | .20% | .20% |
| Expenses net of all reductions | .18%I | .20% | .20% | .20% | .20% | .20% |
| Net investment income (loss) | .62%I | 1.10% | 1.12% | 1.68% | 1.52% | 1.21% |
| Supplemental Data | ||||||
| Net assets, end of period (000 omitted) | $50 | $69 | $64 | $58 | $55 | $64 |
| Portfolio turnover rateJ | 78%I | 51%K | 24%K | 25% | 80% | 47% |
A Calculated based on average shares outstanding during the period.
B Net investment income (loss) is affected by the timing of the declaration of dividends by any underlying mutual funds or exchange-traded funds (ETFs). Net investment income (loss) of any such underlying funds is not included in the Fund's net investment income (loss) ratio.
C Total distributions per share do not sum due to rounding.
D Total returns for periods of less than one year are not annualized.
E Total returns do not reflect charges attributable to your insurance company's separate account. Inclusion of these charges would reduce the total returns shown.
F Total returns would have been lower if certain expenses had not been reduced during the applicable periods shown.
G Fees and expenses of any underlying mutual funds or exchange-traded funds (ETFs) are not included in the Fund's expense ratio. The Fund indirectly bears its proportionate share of these expenses. For additional expense information related to investments in Fidelity Central Funds, please refer to the "Investments in Fidelity Central Funds" note found in the Notes to Financial Statements section of the most recent Annual or Semi-Annual report.
H Expense ratios reflect operating expenses of the class. Expenses before reductions do not reflect amounts reimbursed, waived, or reduced through arrangements with the investment adviser, brokerage services, or other offset arrangements, if applicable, and do not represent the amount paid by the class during periods when reimbursements, waivers or reductions occur.
I Annualized
J Amount does not include the portfolio activity of any underlying mutual funds or exchange-traded funds (ETFs).
K Portfolio turnover rate excludes securities received or delivered in-kind.
See accompanying notes which are an integral part of the financial statements.
VIP FundsManager 50% Portfolio Service Class 2
| Six months ended (Unaudited) June 30, | Years endedDecember 31, | |||||
| 2022 | 2021 | 2020 | 2019 | 2018 | 2017 | |
| Selected Per–Share Data | ||||||
| Net asset value, beginning of period | $14.45 | $13.51 | $12.23 | $11.64 | $13.48 | $11.99 |
| Income from Investment Operations | ||||||
| Net investment income (loss)A,B | .03 | .13 | .12 | .18 | .17 | .14 |
| Net realized and unrealized gain (loss) | (1.95) | 1.18 | 1.55 | 1.75 | (.85) | 1.57 |
| Total from investment operations | (1.92) | 1.31 | 1.67 | 1.93 | (.68) | 1.71 |
| Distributions from net investment income | (.04) | (.14) | (.13) | (.19) | (.16) | (.13) |
| Distributions from net realized gain | (2.16) | (.24) | (.26) | (1.15) | (1.00) | (.08) |
| Total distributions | (2.19)C | (.37)C | (.39) | (1.34) | (1.16) | (.22)C |
| Net asset value, end of period | $10.34 | $14.45 | $13.51 | $12.23 | $11.64 | $13.48 |
| Total ReturnD,E,F | (14.98)% | 9.88% | 13.89% | 17.69% | (5.38)% | 14.24% |
| Ratios to Average Net AssetsB,G,H | ||||||
| Expenses before reductions | .49%I | .50% | .50% | .50% | .50% | .50% |
| Expenses net of fee waivers, if any | .34%I | .35% | .35% | .35% | .35% | .35% |
| Expenses net of all reductions | .34%I | .35% | .35% | .35% | .35% | .35% |
| Net investment income (loss) | .47%I | .95% | .97% | 1.53% | 1.37% | 1.06% |
| Supplemental Data | ||||||
| Net assets, end of period (000 omitted) | $75,436 | $94,708 | $114,211 | $103,031 | $90,234 | $100,867 |
| Portfolio turnover rateJ | 78%I | 51%K | 24%K | 25% | 80% | 47% |
A Calculated based on average shares outstanding during the period.
B Net investment income (loss) is affected by the timing of the declaration of dividends by any underlying mutual funds or exchange-traded funds (ETFs). Net investment income (loss) of any such underlying funds is not included in the Fund's net investment income (loss) ratio.
C Total distributions per share do not sum due to rounding.
D Total returns for periods of less than one year are not annualized.
E Total returns do not reflect charges attributable to your insurance company's separate account. Inclusion of these charges would reduce the total returns shown.
F Total returns would have been lower if certain expenses had not been reduced during the applicable periods shown.
G Fees and expenses of any underlying mutual funds or exchange-traded funds (ETFs) are not included in the Fund's expense ratio. The Fund indirectly bears its proportionate share of these expenses. For additional expense information related to investments in Fidelity Central Funds, please refer to the "Investments in Fidelity Central Funds" note found in the Notes to Financial Statements section of the most recent Annual or Semi-Annual report.
H Expense ratios reflect operating expenses of the class. Expenses before reductions do not reflect amounts reimbursed, waived, or reduced through arrangements with the investment adviser, brokerage services, or other offset arrangements, if applicable, and do not represent the amount paid by the class during periods when reimbursements, waivers or reductions occur.
I Annualized
J Amount does not include the portfolio activity of any underlying mutual funds or exchange-traded funds (ETFs).
K Portfolio turnover rate excludes securities received or delivered in-kind.
See accompanying notes which are an integral part of the financial statements.
VIP FundsManager 50% Portfolio Investor Class
| Six months ended (Unaudited) June 30, | Years endedDecember 31, | |||||
| 2022 | 2021 | 2020 | 2019 | 2018 | 2017 | |
| Selected Per–Share Data | ||||||
| Net asset value, beginning of period | $14.50 | $13.56 | $12.28 | $11.68 | $13.52 | $12.02 |
| Income from Investment Operations | ||||||
| Net investment income (loss)A,B | .04 | .15 | .14 | .20 | .19 | .16 |
| Net realized and unrealized gain (loss) | (1.96) | 1.19 | 1.54 | 1.76 | (.85) | 1.58 |
| Total from investment operations | (1.92) | 1.34 | 1.68 | 1.96 | (.66) | 1.74 |
| Distributions from net investment income | (.04) | (.16) | (.14) | (.20) | (.18) | (.15) |
| Distributions from net realized gain | (2.16) | (.24) | (.26) | (1.15) | (1.00) | (.08) |
| Total distributions | (2.19)C | (.40) | (.40) | (1.36)C | (1.18) | (.24)C |
| Net asset value, end of period | $10.39 | $14.50 | $13.56 | $12.28 | $11.68 | $13.52 |
| Total ReturnD,E,F | (14.94)% | 10.02% | 13.98% | 17.89% | (5.20)% | 14.46% |
| Ratios to Average Net AssetsB,G,H | ||||||
| Expenses before reductions | .23%I | .25% | .25% | .25% | .25% | .25% |
| Expenses net of fee waivers, if any | .18%I | .20% | .20% | .20% | .20% | .20% |
| Expenses net of all reductions | .18%I | .20% | .20% | .20% | .20% | .20% |
| Net investment income (loss) | .62%I | 1.10% | 1.12% | 1.68% | 1.52% | 1.21% |
| Supplemental Data | ||||||
| Net assets, end of period (000 omitted) | $4,799,422 | $5,887,190 | $5,731,732 | $5,630,795 | $5,535,648 | $6,623,127 |
| Portfolio turnover rateJ | 78%I | 51%K | 24%K | 25% | 80% | 47% |
A Calculated based on average shares outstanding during the period.
B Net investment income (loss) is affected by the timing of the declaration of dividends by any underlying mutual funds or exchange-traded funds (ETFs). Net investment income (loss) of any such underlying funds is not included in the Fund's net investment income (loss) ratio.
C Total distributions per share do not sum due to rounding.
D Total returns for periods of less than one year are not annualized.
E Total returns do not reflect charges attributable to your insurance company's separate account. Inclusion of these charges would reduce the total returns shown.
F Total returns would have been lower if certain expenses had not been reduced during the applicable periods shown.
G Fees and expenses of any underlying mutual funds or exchange-traded funds (ETFs) are not included in the Fund's expense ratio. The Fund indirectly bears its proportionate share of these expenses. For additional expense information related to investments in Fidelity Central Funds, please refer to the "Investments in Fidelity Central Funds" note found in the Notes to Financial Statements section of the most recent Annual or Semi-Annual report.
H Expense ratios reflect operating expenses of the class. Expenses before reductions do not reflect amounts reimbursed, waived, or reduced through arrangements with the investment adviser, brokerage services, or other offset arrangements, if applicable, and do not represent the amount paid by the class during periods when reimbursements, waivers or reductions occur.
I Annualized
J Amount does not include the portfolio activity of any underlying mutual funds or exchange-traded funds (ETFs).
K Portfolio turnover rate excludes securities received or delivered in-kind.
See accompanying notes which are an integral part of the financial statements.
VIP FundsManager® 60% Portfolio
Investment Summary (Unaudited)
The information in the following tables is based on the direct investments of the Fund.Top Holdings as of June 30, 2022
| % of fund's net assets | |
| VIP Stock Selector All Cap Portfolio Investor Class | 30.6 |
| VIP Investment Grade Bond II Portfolio - Investor Class | 12.6 |
| Fidelity Total Bond Fund | 12.6 |
| Fidelity Overseas Fund | 6.3 |
| Fidelity Emerging Markets Fund | 4.6 |
| Fidelity Floating Rate High Income Fund | 3.6 |
| Fidelity Low-Priced Stock Fund | 2.5 |
| Fidelity U.S. Low Volatility Equity Fund | 2.4 |
| Fidelity Long-Term Treasury Bond Index Fund | 2.4 |
| Fidelity Equity-Income Fund | 2.4 |
| 80.0 |
Asset Allocation (% of fund's net assets)
| Period end* | ||
| Domestic Equity Funds | 42.7% | |
| International Equity Funds | 21.6% | |
| Bond Funds | 34.5% | |
| Short-Term Funds | 2.2% | |
| Short-Term Investments | 0.1% | |
| Net Other Assets (Liabilities)** | (1.1)% | |
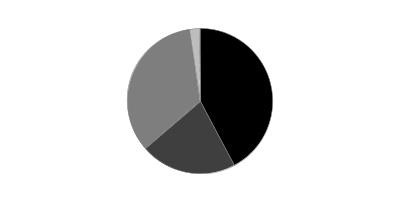
* Futures - (1.2)%
** Net Other Assets (Liabilities) are not included in the pie chart
VIP FundsManager® 60% Portfolio
Schedule of Investments June 30, 2022 (Unaudited)
Showing Percentage of Net Assets
| Equity Funds - 64.3% | |||
| Shares | Value | ||
| Fidelity Canada Fund (a) | 492,473 | $29,484,336 | |
| Fidelity Commodity Strategy Fund (a) | 3,487,303 | 35,884,353 | |
| Fidelity Contrafund (a) | 4,358,847 | 57,972,668 | |
| Fidelity Emerging Markets Discovery Fund (a) | 2,627,326 | 35,390,078 | |
| Fidelity Emerging Markets Fund (a) | 8,243,246 | 270,378,480 | |
| Fidelity Equity-Income Fund (a) | 2,224,968 | 139,193,978 | |
| Fidelity Global Commodity Stock Fund (a) | 7,017,214 | 122,029,358 | |
| Fidelity International Capital Appreciation Fund (a) | 3,635,272 | 72,850,853 | |
| Fidelity International Discovery Fund (a) | 2,511,511 | 97,597,322 | |
| Fidelity International Enhanced Index Fund (a) | 10,468,162 | 95,050,912 | |
| Fidelity International Small Cap Fund (a) | 1,643,606 | 43,177,517 | |
| Fidelity International Small Cap Opportunities Fund (a) | 2,499,042 | 44,907,784 | |
| Fidelity International Value Fund (a) | 7,458,127 | 59,366,690 | |
| Fidelity Japan Smaller Companies Fund (a) | 2,910,367 | 36,787,035 | |
| Fidelity Large Cap Value Enhanced Index Fund (a) | 4,117,516 | 58,386,374 | |
| Fidelity Low-Priced Stock Fund (a) | 3,184,593 | 148,147,252 | |
| Fidelity Overseas Fund (a) | 7,676,143 | 371,448,557 | |
| Fidelity Real Estate Investment Portfolio (a) | 1,365,256 | 59,989,359 | |
| Fidelity U.S. Low Volatility Equity Fund (a) | 14,148,166 | 141,764,628 | |
| Fidelity Value Discovery Fund (a) | 2,036,409 | 70,500,475 | |
| VIP Stock Selector All Cap Portfolio Investor Class (a) | 228,141,953 | 1,806,884,269 | |
| TOTAL EQUITY FUNDS | |||
| (Cost $4,112,305,711) | 3,797,192,278 | ||
| Fixed-Income Funds - 34.5% | |||
| Fidelity Floating Rate High Income Fund (a) | 24,320,909 | 215,726,465 | |
| Fidelity High Income Fund (a) | 6,302,703 | 45,820,649 | |
| Fidelity Inflation-Protected Bond Index Fund (a) | 13,585,318 | 137,890,974 | |
| Fidelity Long-Term Treasury Bond Index Fund (a) | 12,100,621 | 139,520,156 | |
| Fidelity New Markets Income Fund (a) | 1,259,699 | 14,398,363 | |
| Fidelity Total Bond Fund (a) | 76,666,233 | 742,895,797 | |
| VIP Investment Grade Bond II Portfolio - Investor Class (a) | 76,370,363 | 745,374,745 | |
| TOTAL FIXED-INCOME FUNDS | |||
| (Cost $2,120,677,457) | 2,041,627,149 | ||
| Money Market Funds - 2.2% | |||
| Fidelity Cash Central Fund 1.58% (b) | |||
| (Cost $129,017,361) | 128,991,563 | 129,017,361 | |
| Principal Amount | Value | ||
| U.S. Treasury Obligations - 0.1% | |||
| U.S. Treasury Bills, yield at date of purchase 0.81% to 1.7% 7/21/22 to 9/29/22 (c) | |||
| (Cost $4,034,210) | 4,050,000 | 4,034,633 | |
| TOTAL INVESTMENT IN SECURITIES - 101.1% | |||
| (Cost $6,366,034,739) | 5,971,871,421 | ||
| NET OTHER ASSETS (LIABILITIES) - (1.1)% | (63,765,683) | ||
| NET ASSETS - 100% | $5,908,105,738 |
| Futures Contracts | |||||
| Number of contracts | Expiration Date | Notional Amount | Value | Unrealized Appreciation/(Depreciation) | |
| Purchased | |||||
| Equity Index Contracts | |||||
| ICE E-mini MSCI Emerging Markets Index Contracts (United States) | 1,500 | Sept. 2022 | $75,202,500 | $2,284 | $2,284 |
| Sold | |||||
| Equity Index Contracts | |||||
| CME E-mini S&P 500 Index Contracts (United States) | 457 | Sept. 2022 | 86,590,075 | (426,846) | (426,846) |
| ICE E-mini MSCI EAFE Index Contracts (United States) | 628 | Sept. 2022 | 58,297,240 | (318,373) | (318,373) |
| TOTAL SOLD | $(745,219) | ||||
| TOTAL FUTURES CONTRACTS | $(742,935) |
The notional amount of futures purchased as a percentage of Net Assets is 1.3%
The notional amount of futures sold as a percentage of Net Assets is 2.5%
For the period, the average monthly notional amount at value for futures contracts in the aggregate was $293,303,959.
Legend
(a) Affiliated Fund
(b) Affiliated fund that is generally available only to investment companies and other accounts managed by Fidelity Investments. The rate quoted is the annualized seven-day yield of the fund at period end. A complete unaudited listing of the fund's holdings as of its most recent quarter end is available upon request. In addition, each Fidelity Central Fund's financial statements are available on the SEC's website or upon request.
(c) Security or a portion of the security was pledged to cover margin requirements for futures contracts. At period end, the value of securities pledged amounted to $4,034,633.
Affiliated Central Funds
Fiscal year to date information regarding the Fund's investments in Fidelity Central Funds, including the ownership percentage, is presented below.
| Fund | Value, beginning of period | Purchases | Sales Proceeds | Dividend Income | Realized Gain/Loss | Change in Unrealized appreciation (depreciation) | Value, end of period | % ownership, end of period |
| Fidelity Cash Central Fund 1.58% | $36,080,874 | $347,708,151 | $254,771,664 | $243,743 | $-- | $-- | $129,017,361 | 0.2% |
| Total | $36,080,874 | $347,708,151 | $254,771,664 | $243,743 | $-- | $-- | $129,017,361 |
Amounts in the income column in the above table include any capital gain distributions from underlying funds, which are presented in the corresponding line-item in the Statement of Operations, if applicable.
Affiliated Underlying Funds
Fiscal year to date information regarding the Fund's investments in affiliated Underlying Funds is presented below. Exchanges between classes of the same affiliated Underlying Funds may occur, and are excluded from purchases and sales below if applicable. If an underlying Fund changes its name, the name presented below is the name in effect at period end.
| Affiliate | Value, beginning of period | Purchases(a) | Sales Proceeds(a) | Dividend Income | Realized Gain (loss) | Change in Unrealized appreciation (depreciation) | Value, end of period |
| Fidelity Canada Fund | $-- | $31,345,054 | $386,233 | $-- | $(15,567) | $(1,458,918) | $29,484,336 |
| Fidelity Commodity Strategy Fund | 42,400,536 | 11,088,593 | 26,180,034 | -- | 7,017,014 | 1,558,244 | 35,884,353 |
| Fidelity Contrafund | 89,376,965 | 2,125,254 | 7,734,276 | 1,023,400 | (1,932,764) | (23,862,511) | 57,972,668 |
| Fidelity Emerging Markets Discovery Fund | 23,860,340 | 16,611,484 | 569,305 | -- | (42,116) | (4,470,325) | 35,390,078 |
| Fidelity Emerging Markets Fund | 104,537,123 | 199,976,907 | 2,328,787 | -- | (320,026) | (31,486,737) | 270,378,480 |
| Fidelity Equity-Income Fund | 172,261,174 | 3,038,031 | 17,874,031 | 644,398 | (561,813) | (17,669,383) | 139,193,978 |
| Fidelity Floating Rate High Income Fund | 246,611,909 | 7,328,909 | 23,135,693 | 4,032,789 | (654,284) | (14,424,376) | 215,726,465 |
| Fidelity Global Commodity Stock Fund | 132,927,542 | 2,287,729 | 22,856,081 | -- | 3,386,631 | 6,283,537 | 122,029,358 |
| Fidelity High Income Fund | 54,508,561 | 1,816,432 | 1,571,729 | 1,123,857 | (38,346) | (8,894,269) | 45,820,649 |
| Fidelity Inflation-Protected Bond Index Fund | 214,135,399 | 2,314,693 | 63,628,400 | -- | 4,623,396 | (19,554,114) | 137,890,974 |
| Fidelity International Capital Appreciation Fund | 109,359,281 | 1,251,179 | 6,064,757 | -- | (1,139,051) | (30,555,799) | 72,850,853 |
| Fidelity International Discovery Fund | 140,880,985 | 1,637,738 | 8,147,362 | -- | (2,505,569) | (34,268,470) | 97,597,322 |
| Fidelity International Enhanced Index Fund | 123,444,638 | 1,455,232 | 7,576,929 | -- | (952,455) | (21,319,574) | 95,050,912 |
| Fidelity International Small Cap Fund | 56,155,938 | 644,109 | 3,385,062 | -- | (226,091) | (10,011,377) | 43,177,517 |
| Fidelity International Small Cap Opportunities Fund | 65,279,771 | 866,788 | -- | -- | -- | (21,238,775) | 44,907,784 |
| Fidelity International Value Fund | 73,425,016 | 849,388 | 4,644,580 | -- | (106,012) | (10,157,122) | 59,366,690 |
| Fidelity Japan Smaller Companies Fund | 45,867,380 | -- | -- | -- | -- | (9,080,345) | 36,787,035 |
| Fidelity Large Cap Value Enhanced Index Fund | 73,224,609 | 1,162,448 | 7,927,790 | -- | (271,318) | (7,801,575) | 58,386,374 |
| Fidelity Long-Term Treasury Bond Index Fund | 225,253,707 | 4,529,879 | 47,972,064 | 1,973,609 | (8,976,348) | (33,315,018) | 139,520,156 |
| Fidelity Low-Priced Stock Fund | 189,869,467 | 2,929,907 | 20,091,563 | -- | (1,213,264) | (23,347,295) | 148,147,252 |
| Fidelity New Markets Income Fund | 17,893,733 | 566,023 | 523,910 | 335,165 | (21,642) | (3,515,841) | 14,398,363 |
| Fidelity Overseas Fund | 550,550,664 | 6,179,586 | 30,811,991 | -- | (6,476,166) | (147,993,536) | 371,448,557 |
| Fidelity Real Estate Investment Portfolio | 97,561,501 | 992,822 | 22,404,186 | -- | 2,269,607 | (18,430,385) | 59,989,359 |
| Fidelity Total Bond Fund | -- | 747,411,040 | 1,314,315 | 950,720 | (38,035) | (3,162,893) | 742,895,797 |
| Fidelity U.S. Bond Index Fund | 1,468,036,781 | 211,098,427 | 1,518,427,764 | 12,970,918 | (69,222,323) | (91,485,121) | -- |
| Fidelity U.S. Low Volatility Equity Fund | 165,575,072 | 7,571,954 | 4,600,189 | 5,548,261 | (177,198) | (26,605,011) | 141,764,628 |
| Fidelity Value Discovery Fund | 86,361,718 | 1,288,830 | 9,232,455 | -- | 816,072 | (8,733,690) | 70,500,475 |
| VIP Investment Grade Bond Portfolio II Investor Class | -- | 769,331,125 | 6,169,951 | -- | (105,132) | (17,681,297) | 745,374,745 |
| VIP Stock Selector All Cap Portfolio Investor Class | 2,558,075,715 | 28,156,541 | 226,646,214 | -- | (39,774,857) | (512,926,916) | 1,806,884,269 |
| $7,127,435,525 | $2,065,856,102 | $2,092,205,651 | $28,603,117 | $(116,657,657) | $(1,145,608,892) | $5,838,819,427 |
(a) Includes the value of shares purchased or redeemed through in-kind transactions, as applicable.
Amounts in the income column in the above table include any capital gain distributions from underlying funds, which are presented in the corresponding line-item in the Statement of Operations, if applicable.
Investment Valuation
The following is a summary of the inputs used, as of June 30, 2022, involving the Fund's assets and liabilities carried at fair value. The inputs or methodology used for valuing securities may not be an indication of the risk associated with investing in those securities. For more information on valuation inputs, and their aggregation into the levels used below, please refer to the Investment Valuation section in the accompanying Notes to Financial Statements.
| Valuation Inputs at Reporting Date: | ||||
| Description | Total | Level 1 | Level 2 | Level 3 |
| Investments in Securities: | ||||
| Equity Funds | $3,797,192,278 | $3,797,192,278 | $-- | $-- |
| Fixed-Income Funds | 2,041,627,149 | 2,041,627,149 | -- | -- |
| Money Market Funds | 129,017,361 | 129,017,361 | -- | -- |
| Other Short-Term Investments and Net Other Assets | 4,034,633 | -- | 4,034,633 | -- |
| Total Investments in Securities: | $5,971,871,421 | $5,967,836,788 | $4,034,633 | $-- |
| Derivative Instruments: | ||||
| Assets | ||||
| Futures Contracts | $2,284 | $2,284 | $-- | $-- |
| Total Assets | $2,284 | $2,284 | $-- | $-- |
| Liabilities | ||||
| Futures Contracts | $(745,219) | $(745,219) | $-- | $-- |
| Total Liabilities | $(745,219) | $(745,219) | $-- | $-- |
| Total Derivative Instruments: | $(742,935) | $(742,935) | $-- | $-- |
Value of Derivative Instruments
The following table is a summary of the Fund's value of derivative instruments by primary risk exposure as of June 30, 2022. For additional information on derivative instruments, please refer to the Derivative Instruments section in the accompanying Notes to Financial Statements.
| Primary Risk Exposure / Derivative Type | Value | |
| Asset | Liability | |
| Equity Risk | ||
| Futures Contracts(a) | $2,284 | $(745,219) |
| Total Equity Risk | 2,284 | (745,219) |
| Total Value of Derivatives | $2,284 | $(745,219) |
(a) Reflects gross cumulative appreciation (depreciation) on futures contracts as presented in the Schedule of Investments. In the Statement of Assets and Liabilities, the period end daily variation margin is included in receivable or payable for daily variation margin on futures contracts, and the net cumulative appreciation (depreciation) is included in Total accumulated earnings (loss).
See accompanying notes which are an integral part of the financial statements.
VIP FundsManager® 60% Portfolio
Financial Statements
Statement of Assets and Liabilities
| June 30, 2022 (Unaudited) | ||
| Assets | ||
| Investment in securities, at value — See accompanying schedule: Unaffiliated issuers (cost $4,034,210) | $4,034,633 | |
| Fidelity Central Funds (cost $129,017,361) | 129,017,361 | |
| Other affiliated issuers (cost $6,232,983,168) | 5,838,819,427 | |
| Total Investment in Securities (cost $6,366,034,739) | $5,971,871,421 | |
| Receivable for investments sold | 91,488,768 | |
| Receivable for fund shares sold | 301,895 | |
| Distributions receivable from Fidelity Central Funds | 124,973 | |
| Receivable for daily variation margin on futures contracts | 495,295 | |
| Total assets | 6,064,282,352 | |
| Liabilities | ||
| Payable for investments purchased | $153,831,760 | |
| Payable for fund shares redeemed | 1,770,831 | |
| Accrued management fee | 505,520 | |
| Distribution and service plan fees payable | 68,503 | |
| Total liabilities | 156,176,614 | |
| Net Assets | $5,908,105,738 | |
| Net Assets consist of: | ||
| Paid in capital | $6,335,924,010 | |
| Total accumulated earnings (loss) | (427,818,272) | |
| Net Assets | $5,908,105,738 | |
| Net Asset Value and Maximum Offering Price | ||
| Service Class: | ||
| Net Asset Value, offering price and redemption price per share ($61,705,477 ÷ 7,101,050 shares) | $8.69 | |
| Service Class 2: | ||
| Net Asset Value, offering price and redemption price per share ($534,350,064 ÷ 61,770,718 shares) | $8.65 | |
| Investor Class: | ||
| Net Asset Value, offering price and redemption price per share ($5,312,050,197 ÷ 611,317,711 shares) | $8.69 |
See accompanying notes which are an integral part of the financial statements.
Statement of Operations
| Six months ended June 30, 2022 (Unaudited) | ||
| Investment Income | ||
| Dividends: | ||
| Affiliated issuers | $22,358,626 | |
| Interest | 18,040 | |
| Income from Fidelity Central Funds | 243,743 | |
| Total income | 22,620,409 | |
| Expenses | ||
| Management fee | $7,678,926 | |
| Distribution and service plan fees | 765,336 | |
| Independent trustees' fees and expenses | 10,171 | |
| Total expenses before reductions | 8,454,433 | |
| Expense reductions | (1,963,373) | |
| Total expenses after reductions | 6,491,060 | |
| Net investment income (loss) | 16,129,349 | |
| Realized and Unrealized Gain (Loss) | ||
| Net realized gain (loss) on: | ||
| Investment securities: | ||
| Unaffiliated issuers | (5) | |
| Affiliated issuers | (116,657,657) | |
| Futures contracts | 62,917,752 | |
| Capital gain distributions from underlying funds: | ||
| Affiliated issuers | 6,244,491 | |
| Total net realized gain (loss) | (47,495,419) | |
| Change in net unrealized appreciation (depreciation) on: | ||
| Investment securities: | ||
| Unaffiliated issuers | 315 | |
| Affiliated issuers | (1,145,608,892) | |
| Futures contracts | 3,641,648 | |
| Total change in net unrealized appreciation (depreciation) | (1,141,966,929) | |
| Net gain (loss) | (1,189,462,348) | |
| Net increase (decrease) in net assets resulting from operations | $(1,173,332,999) |
See accompanying notes which are an integral part of the financial statements.
Statement of Changes in Net Assets
| Six months ended June 30, 2022 (Unaudited) | Year ended December 31, 2021 | |
| Increase (Decrease) in Net Assets | ||
| Operations | ||
| Net investment income (loss) | $16,129,349 | $74,043,003 |
| Net realized gain (loss) | (47,495,419) | 1,114,429,649 |
| Change in net unrealized appreciation (depreciation) | (1,141,966,929) | (388,552,934) |
| Net increase (decrease) in net assets resulting from operations | (1,173,332,999) | 799,919,718 |
| Distributions to shareholders | (1,107,792,753) | (190,170,063) |
| Share transactions - net increase (decrease) | 997,151,126 | (21,798,783) |
| Total increase (decrease) in net assets | (1,283,974,626) | 587,950,872 |
| Net Assets | ||
| Beginning of period | 7,192,080,364 | 6,604,129,492 |
| End of period | $5,908,105,738 | $7,192,080,364 |
See accompanying notes which are an integral part of the financial statements.
Financial Highlights
VIP FundsManager 60% Portfolio Service Class
| Six months ended (Unaudited) June 30, | Years endedDecember 31, | |||||
| 2022 | 2021 | 2020 | 2019 | 2018 | 2017 | |
| Selected Per–Share Data | ||||||
| Net asset value, beginning of period | $12.40 | $11.35 | $10.20 | $10.22 | $12.50 | $11.03 |
| Income from Investment Operations | ||||||
| Net investment income (loss)A,B | .02 | .13 | .11 | .16 | .16 | .13 |
| Net realized and unrealized gain (loss) | (1.82) | 1.25 | 1.40 | 1.71 | (.87) | 1.73 |
| Total from investment operations | (1.80) | 1.38 | 1.51 | 1.87 | (.71) | 1.86 |
| Distributions from net investment income | (.03) | (.14) | (.11) | (.15) | (.14) | (.13) |
| Distributions from net realized gain | (1.88) | (.20) | (.25) | (1.74) | (1.42) | (.25) |
| Total distributions | (1.91) | (.33)C | (.36) | (1.89) | (1.57)C | (.39)C |
| Net asset value, end of period | $8.69 | $12.40 | $11.35 | $10.20 | $10.22 | $12.50 |
| Total ReturnD,E,F | (16.44)% | 12.34% | 15.12% | 20.49% | (6.44)% | 16.99% |
| Ratios to Average Net AssetsB,G,H | ||||||
| Expenses before reductions | .33%I | .35% | .35% | .35% | .35% | .35% |
| Expenses net of fee waivers, if any | .18%I | .20% | .20% | .20% | .20% | .20% |
| Expenses net of all reductions | .18%I | .20% | .20% | .20% | .20% | .20% |
| Net investment income (loss) | .51%I | 1.08% | 1.06% | 1.61% | 1.40% | 1.11% |
| Supplemental Data | ||||||
| Net assets, end of period (000 omitted) | $61,705 | $58,353 | $28,621 | $9,951 | $50 | $61 |
| Portfolio turnover rateJ | 64%I | 54%K | 22%K | 33% | 91% | 47% |
A Calculated based on average shares outstanding during the period.
B Net investment income (loss) is affected by the timing of the declaration of dividends by any underlying mutual funds or exchange-traded funds (ETFs). Net investment income (loss) of any such underlying funds is not included in the Fund's net investment income (loss) ratio.
C Total distributions per share do not sum due to rounding.
D Total returns for periods of less than one year are not annualized.
E Total returns do not reflect charges attributable to your insurance company's separate account. Inclusion of these charges would reduce the total returns shown.
F Total returns would have been lower if certain expenses had not been reduced during the applicable periods shown.
G Fees and expenses of any underlying mutual funds or exchange-traded funds (ETFs) are not included in the Fund's expense ratio. The Fund indirectly bears its proportionate share of these expenses. For additional expense information related to investments in Fidelity Central Funds, please refer to the "Investments in Fidelity Central Funds" note found in the Notes to Financial Statements section of the most recent Annual or Semi-Annual report.
H Expense ratios reflect operating expenses of the class. Expenses before reductions do not reflect amounts reimbursed, waived, or reduced through arrangements with the investment adviser, brokerage services, or other offset arrangements, if applicable, and do not represent the amount paid by the class during periods when reimbursements, waivers or reductions occur.
I Annualized
J Amount does not include the portfolio activity of any underlying mutual funds or exchange-traded funds (ETFs).
K Portfolio turnover rate excludes securities received or delivered in-kind.
See accompanying notes which are an integral part of the financial statements.
VIP FundsManager 60% Portfolio Service Class 2
| Six months ended (Unaudited) June 30, | Years endedDecember 31, | |||||
| 2022 | 2021 | 2020 | 2019 | 2018 | 2017 | |
| Selected Per–Share Data | ||||||
| Net asset value, beginning of period | $12.36 | $11.31 | $10.17 | $10.20 | $12.47 | $11.01 |
| Income from Investment Operations | ||||||
| Net investment income (loss)A,B | .02 | .11 | .09 | .14 | .14 | .11 |
| Net realized and unrealized gain (loss) | (1.82) | 1.25 | 1.39 | 1.71 | (.86) | 1.72 |
| Total from investment operations | (1.80) | 1.36 | 1.48 | 1.85 | (.72) | 1.83 |
| Distributions from net investment income | (.03) | (.12) | (.09) | (.14) | (.13) | (.12) |
| Distributions from net realized gain | (1.88) | (.20) | (.25) | (1.74) | (1.42) | (.25) |
| Total distributions | (1.91) | (.31)C | (.34) | (1.88) | (1.55) | (.37) |
| Net asset value, end of period | $8.65 | $12.36 | $11.31 | $10.17 | $10.20 | $12.47 |
| Total ReturnD,E,F | (16.50)% | 12.21% | 14.92% | 20.25% | (6.51)% | 16.76% |
| Ratios to Average Net AssetsB,G,H | ||||||
| Expenses before reductions | .49%I | .50% | .50% | .50% | .50% | .50% |
| Expenses net of fee waivers, if any | .33%I | .35% | .35% | .35% | .35% | .35% |
| Expenses net of all reductions | .33%I | .35% | .35% | .35% | .35% | .35% |
| Net investment income (loss) | .36%I | .93% | .91% | 1.46% | 1.25% | .96% |
| Supplemental Data | ||||||
| Net assets, end of period (000 omitted) | $534,350 | $640,658 | $656,402 | $594,140 | $533,024 | $585,346 |
| Portfolio turnover rateJ | 64%I | 54%K | 22%K | 33% | 91% | 47% |
A Calculated based on average shares outstanding during the period.
B Net investment income (loss) is affected by the timing of the declaration of dividends by any underlying mutual funds or exchange-traded funds (ETFs). Net investment income (loss) of any such underlying funds is not included in the Fund's net investment income (loss) ratio.
C Total distributions per share do not sum due to rounding.
D Total returns for periods of less than one year are not annualized.
E Total returns do not reflect charges attributable to your insurance company's separate account. Inclusion of these charges would reduce the total returns shown.
F Total returns would have been lower if certain expenses had not been reduced during the applicable periods shown.
G Fees and expenses of any underlying mutual funds or exchange-traded funds (ETFs) are not included in the Fund's expense ratio. The Fund indirectly bears its proportionate share of these expenses. For additional expense information related to investments in Fidelity Central Funds, please refer to the "Investments in Fidelity Central Funds" note found in the Notes to Financial Statements section of the most recent Annual or Semi-Annual report.
H Expense ratios reflect operating expenses of the class. Expenses before reductions do not reflect amounts reimbursed, waived, or reduced through arrangements with the investment adviser, brokerage services, or other offset arrangements, if applicable, and do not represent the amount paid by the class during periods when reimbursements, waivers or reductions occur.
I Annualized
J Amount does not include the portfolio activity of any underlying mutual funds or exchange-traded funds (ETFs).
K Portfolio turnover rate excludes securities received or delivered in-kind.
See accompanying notes which are an integral part of the financial statements.
VIP FundsManager 60% Portfolio Investor Class
| Six months ended (Unaudited) June 30, | Years endedDecember 31, | |||||
| 2022 | 2021 | 2020 | 2019 | 2018 | 2017 | |
| Selected Per–Share Data | ||||||
| Net asset value, beginning of period | $12.40 | $11.35 | $10.20 | $10.22 | $12.50 | $11.03 |
| Income from Investment Operations | ||||||
| Net investment income (loss)A,B | .02 | .13 | .11 | .16 | .16 | .13 |
| Net realized and unrealized gain (loss) | (1.82) | 1.25 | 1.40 | 1.71 | (.87) | 1.73 |
| Total from investment operations | (1.80) | 1.38 | 1.51 | 1.87 | (.71) | 1.86 |
| Distributions from net investment income | (.03) | (.14) | (.11) | (.15) | (.14) | (.13) |
| Distributions from net realized gain | (1.88) | (.20) | (.25) | (1.74) | (1.42) | (.25) |
| Total distributions | (1.91) | (.33)C | (.36) | (1.89) | (1.57)C | (.39)C |
| Net asset value, end of period | $8.69 | $12.40 | $11.35 | $10.20 | $10.22 | $12.50 |
| Total ReturnD,E,F | (16.44)% | 12.34% | 15.12% | 20.49% | (6.44)% | 16.99% |
| Ratios to Average Net AssetsB,G,H | ||||||
| Expenses before reductions | .23%I | .25% | .25% | .25% | .25% | .25% |
| Expenses net of fee waivers, if any | .18%I | .20% | .20% | .20% | .20% | .20% |
| Expenses net of all reductions | .18%I | .20% | .20% | .20% | .20% | .20% |
| Net investment income (loss) | .51%I | 1.08% | 1.06% | 1.61% | 1.40% | 1.11% |
| Supplemental Data | ||||||
| Net assets, end of period (000 omitted) | $5,312,050 | $6,493,070 | $5,919,107 | $5,375,333 | $4,777,580 | $5,745,537 |
| Portfolio turnover rateJ | 64%I | 54%K | 22%K | 33% | 91% | 47% |
A Calculated based on average shares outstanding during the period.
B Net investment income (loss) is affected by the timing of the declaration of dividends by any underlying mutual funds or exchange-traded funds (ETFs). Net investment income (loss) of any such underlying funds is not included in the Fund's net investment income (loss) ratio.
C Total distributions per share do not sum due to rounding.
D Total returns for periods of less than one year are not annualized.
E Total returns do not reflect charges attributable to your insurance company's separate account. Inclusion of these charges would reduce the total returns shown.
F Total returns would have been lower if certain expenses had not been reduced during the applicable periods shown.
G Fees and expenses of any underlying mutual funds or exchange-traded funds (ETFs) are not included in the Fund's expense ratio. The Fund indirectly bears its proportionate share of these expenses. For additional expense information related to investments in Fidelity Central Funds, please refer to the "Investments in Fidelity Central Funds" note found in the Notes to Financial Statements section of the most recent Annual or Semi-Annual report.
H Expense ratios reflect operating expenses of the class. Expenses before reductions do not reflect amounts reimbursed, waived, or reduced through arrangements with the investment adviser, brokerage services, or other offset arrangements, if applicable, and do not represent the amount paid by the class during periods when reimbursements, waivers or reductions occur.
I Annualized
J Amount does not include the portfolio activity of any underlying mutual funds or exchange-traded funds (ETFs).
K Portfolio turnover rate excludes securities received or delivered in-kind.
See accompanying notes which are an integral part of the financial statements.
VIP FundsManager® 70% Portfolio
Investment Summary (Unaudited)
The information in the following tables is based on the direct investments of the Fund.Top Holdings as of June 30, 2022
| % of fund's net assets | |
| VIP Stock Selector All Cap Portfolio Investor Class | 36.0 |
| Fidelity Overseas Fund | 7.4 |
| VIP Investment Grade Bond II Portfolio - Investor Class | 7.3 |
| Fidelity Total Bond Fund | 7.3 |
| Fidelity Emerging Markets Fund | 5.3 |
| Fidelity Floating Rate High Income Fund | 3.9 |
| Fidelity Low-Priced Stock Fund | 2.9 |
| Fidelity Equity-Income Fund | 2.6 |
| Fidelity Cash Central Fund 1.58% | 2.6 |
| Fidelity U.S. Low Volatility Equity Fund | 2.5 |
| 77.8 |
Asset Allocation (% of fund's net assets)
| Period end* | ||
| Domestic Equity Funds | 49.7% | |
| International Equity Funds | 24.8% | |
| Bond Funds | 24.3% | |
| Short-Term Funds | 2.6% | |
| Short-Term Investments | 0.1% | |
| Net Other Assets (Liabilities)** | (1.5)% | |

* Futures - (1.3)%
** Net Other Assets (Liabilities) are not included in the pie chart
VIP FundsManager® 70% Portfolio
Schedule of Investments June 30, 2022 (Unaudited)
Showing Percentage of Net Assets
| Equity Funds - 74.5% | |||
| Shares | Value | ||
| Fidelity Canada Fund (a) | 177,693 | $10,638,458 | |
| Fidelity Commodity Strategy Fund (a) | 1,230,715 | 12,664,057 | |
| Fidelity Contrafund (a) | 1,708,081 | 22,717,478 | |
| Fidelity Emerging Markets Discovery Fund (a) | 808,010 | 10,883,892 | |
| Fidelity Emerging Markets Fund (a) | 2,943,702 | 96,553,412 | |
| Fidelity Equity-Income Fund (a) | 753,203 | 47,120,362 | |
| Fidelity Global Commodity Stock Fund (a) | 2,116,079 | 36,798,607 | |
| Fidelity International Capital Appreciation Fund (a) | 1,334,278 | 26,738,938 | |
| Fidelity International Discovery Fund (a) | 916,802 | 35,626,943 | |
| Fidelity International Enhanced Index Fund (a) | 3,826,382 | 34,743,552 | |
| Fidelity International Small Cap Fund (a) | 598,471 | 15,721,846 | |
| Fidelity International Small Cap Opportunities Fund (a) | 867,146 | 15,582,611 | |
| Fidelity International Value Fund (a) | 2,724,144 | 21,684,185 | |
| Fidelity Japan Smaller Companies Fund (a) | 963,470 | 12,178,266 | |
| Fidelity Large Cap Value Enhanced Index Fund (a) | 1,919,217 | 27,214,500 | |
| Fidelity Low-Priced Stock Fund (a) | 1,148,504 | 53,428,417 | |
| Fidelity Overseas Fund (a) | 2,813,078 | 136,124,857 | |
| Fidelity Real Estate Investment Portfolio (a) | 427,066 | 18,765,301 | |
| Fidelity U.S. Low Volatility Equity Fund (a) | 4,638,921 | 46,481,985 | |
| Fidelity Value Discovery Fund (a) | 699,008 | 24,199,662 | |
| VIP Stock Selector All Cap Portfolio Investor Class (a) | 83,233,090 | 659,206,078 | |
| TOTAL EQUITY FUNDS | |||
| (Cost $1,503,901,589) | 1,365,073,407 | ||
| Fixed-Income Funds - 24.3% | |||
| Fidelity Floating Rate High Income Fund (a) | 8,145,236 | 72,248,242 | |
| Fidelity High Income Fund (a) | 1,976,431 | 14,368,654 | |
| Fidelity Inflation-Protected Bond Index Fund (a) | 4,246,148 | 43,098,402 | |
| Fidelity Long-Term Treasury Bond Index Fund (a) | 3,782,729 | 43,614,862 | |
| Fidelity New Markets Income Fund (a) | 410,743 | 4,694,793 | |
| Fidelity Total Bond Fund (a) | 13,771,565 | 133,446,460 | |
| VIP Investment Grade Bond II Portfolio - Investor Class (a) | 13,717,441 | 133,882,227 | |
| TOTAL FIXED-INCOME FUNDS | |||
| (Cost $467,684,982) | 445,353,640 | ||
| Money Market Funds - 2.6% | |||
| Fidelity Cash Central Fund 1.58% (b) | |||
| (Cost $46,969,757) | 46,960,365 | 46,969,757 | |
| Principal Amount | Value | ||
| U.S. Treasury Obligations - 0.1% | |||
| U.S. Treasury Bills, yield at date of purchase 1.24% to 1.7% 9/8/22 to 9/29/22 (c) | |||
| (Cost $1,365,375) | 1,370,000 | 1,365,105 | |
| TOTAL INVESTMENT IN SECURITIES - 101.5% | |||
| (Cost $2,019,921,703) | 1,858,761,909 | ||
| NET OTHER ASSETS (LIABILITIES) - (1.5)% | (27,525,697) | ||
| NET ASSETS - 100% | $1,831,236,212 |
| Futures Contracts | |||||
| Number of contracts | Expiration Date | Notional Amount | Value | Unrealized Appreciation/(Depreciation) | |
| Purchased | |||||
| Equity Index Contracts | |||||
| ICE E-mini MSCI Emerging Markets Index Contracts (United States) | 507 | Sept. 2022 | $25,418,445 | $(3,525) | $(3,525) |
| Sold | |||||
| Equity Index Contracts | |||||
| CME E-mini S&P 500 Index Contracts (United States) | 187 | Sept. 2022 | 35,431,825 | (147,404) | (147,404) |
| ICE E-mini MSCI EAFE Index Contracts (United States) | 145 | Sept. 2022 | 13,460,350 | (62,867) | (62,867) |
| TOTAL SOLD | $(210,271) | ||||
| TOTAL FUTURES CONTRACTS | $(213,796) |
The notional amount of futures purchased as a percentage of Net Assets is 1.4%
The notional amount of futures sold as a percentage of Net Assets is 2.7%
Legend
(a) Affiliated Fund
(b) Affiliated fund that is generally available only to investment companies and other accounts managed by Fidelity Investments. The rate quoted is the annualized seven-day yield of the fund at period end. A complete unaudited listing of the fund's holdings as of its most recent quarter end is available upon request. In addition, each Fidelity Central Fund's financial statements are available on the SEC's website or upon request.
(c) Security or a portion of the security was pledged to cover margin requirements for futures contracts. At period end, the value of securities pledged amounted to $1,365,105.
Affiliated Central Funds
Fiscal year to date information regarding the Fund's investments in Fidelity Central Funds, including the ownership percentage, is presented below.
| Fund | Value, beginning of period | Purchases | Sales Proceeds | Dividend Income | Realized Gain/Loss | Change in Unrealized appreciation (depreciation) | Value, end of period | % ownership, end of period |
| Fidelity Cash Central Fund 1.58% | $20,022,171 | $96,502,838 | $69,555,252 | $99,767 | $-- | $-- | $46,969,757 | 0.1% |
| Total | $20,022,171 | $96,502,838 | $69,555,252 | $99,767 | $-- | $-- | $46,969,757 |
Amounts in the income column in the above table include any capital gain distributions from underlying funds, which are presented in the corresponding line-item in the Statement of Operations, if applicable.
Affiliated Underlying Funds
Fiscal year to date information regarding the Fund's investments in affiliated Underlying Funds is presented below. Exchanges between classes of the same affiliated Underlying Funds may occur, and are excluded from purchases and sales below if applicable. If an underlying Fund changes its name, the name presented below is the name in effect at period end.
| Affiliate | Value, beginning of period | Purchases(a) | Sales Proceeds(a) | Dividend Income | Realized Gain (loss) | Change in Unrealized appreciation (depreciation) | Value, end of period |
| Fidelity Canada Fund | $-- | $11,279,368 | $108,654 | $-- | $(3,971) | $(528,285) | $10,638,458 |
| Fidelity Commodity Strategy Fund | 14,445,549 | 4,286,643 | 8,919,344 | -- | 2,408,770 | 442,439 | 12,664,057 |
| Fidelity Contrafund | 34,064,918 | 1,107,568 | 2,506,883 | 390,730 | (729,061) | (9,219,064) | 22,717,478 |
| Fidelity Emerging Markets Discovery Fund | 7,212,699 | 5,183,778 | 137,377 | -- | (18,078) | (1,357,130) | 10,883,892 |
| Fidelity Emerging Markets Fund | 24,450,352 | 81,118,823 | 551,710 | -- | (91,017) | (8,373,036) | 96,553,412 |
| Fidelity Equity-Income Fund | 56,691,746 | 1,757,826 | 5,210,990 | 214,816 | (297,987) | (5,820,233) | 47,120,362 |
| Fidelity Floating Rate High Income Fund | 80,763,528 | 3,232,773 | 6,717,927 | 1,337,071 | (206,523) | (4,823,609) | 72,248,242 |
| Fidelity Global Commodity Stock Fund | 38,926,406 | 1,237,838 | 6,083,764 | -- | 636,394 | 2,081,733 | 36,798,607 |
| Fidelity High Income Fund | 16,746,900 | 722,931 | 320,906 | 349,269 | (10,017) | (2,770,254) | 14,368,654 |
| Fidelity Inflation-Protected Bond Index Fund | 65,317,812 | 1,125,098 | 18,727,910 | -- | (280,756) | (4,335,842) | 43,098,402 |
| Fidelity International Capital Appreciation Fund | 39,256,286 | 823,148 | 1,842,491 | -- | (412,753) | (11,085,252) | 26,738,938 |
| Fidelity International Discovery Fund | 50,300,051 | 1,076,194 | 2,479,014 | -- | (702,703) | (12,567,585) | 35,626,943 |
| Fidelity International Enhanced Index Fund | 44,182,929 | 956,126 | 2,328,408 | -- | (278,360) | (7,788,735) | 34,743,552 |
| Fidelity International Small Cap Fund | 20,033,920 | 424,030 | 1,040,739 | -- | (138,971) | (3,556,394) | 15,721,846 |
| Fidelity International Small Cap Opportunities Fund | 22,334,731 | 559,122 | -- | -- | -- | (7,311,242) | 15,582,611 |
| Fidelity International Value Fund | 26,290,115 | 559,122 | 1,437,164 | -- | (70,167) | (3,657,721) | 21,684,185 |
| Fidelity Japan Smaller Companies Fund | 15,184,294 | -- | -- | -- | -- | (3,006,028) | 12,178,266 |
| Fidelity Large Cap Value Enhanced Index Fund | 33,110,776 | 750,904 | 2,916,934 | -- | (153,911) | (3,576,335) | 27,214,500 |
| Fidelity Long-Term Treasury Bond Index Fund | 68,827,122 | 1,864,070 | 14,010,172 | 610,818 | (2,560,312) | (10,505,846) | 43,614,862 |
| Fidelity Low-Priced Stock Fund | 66,402,023 | 1,886,040 | 6,088,722 | -- | (400,353) | (8,370,571) | 53,428,417 |
| Fidelity New Markets Income Fund | 5,710,467 | 232,790 | 106,968 | 108,237 | (4,676) | (1,136,820) | 4,694,793 |
| Fidelity Overseas Fund | 197,438,752 | 4,062,251 | 9,405,243 | -- | (2,075,409) | (53,895,494) | 136,124,857 |
| Fidelity Real Estate Investment Portfolio | 29,830,611 | 516,564 | 6,584,592 | -- | 339,980 | (5,337,262) | 18,765,301 |
| Fidelity Total Bond Fund | -- | 134,063,116 | 64,229 | 167,481 | (1,810) | (550,617) | 133,446,460 |
| Fidelity U.S. Bond Index Fund | 232,831,271 | 57,353,361 | 263,537,871 | 2,159,525 | (9,950,509) | (16,696,252) | -- |
| Fidelity U.S. Low Volatility Equity Fund | 53,180,557 | 3,111,622 | 1,096,886 | 1,817,256 | (43,154) | (8,670,154) | 46,481,985 |
| Fidelity Value Discovery Fund | 28,777,219 | 830,097 | 2,709,488 | -- | (87,913) | (2,610,253) | 24,199,662 |
| VIP Investment Grade Bond Portfolio II Investor Class | -- | 137,940,403 | 951,387 | -- | (19,480) | (3,087,309) | 133,882,227 |
| VIP Stock Selector All Cap Portfolio Investor Class | 910,626,490 | 18,167,239 | 70,364,660 | 124 | (12,366,430) | (186,856,561) | 659,206,078 |
| $2,182,937,524 | $476,228,845 | $436,250,433 | $7,155,327 | $(27,519,177) | $(384,969,712) | $1,810,427,047 |
(a) Includes the value of shares purchased or redeemed through in-kind transactions, as applicable.
Amounts in the income column in the above table include any capital gain distributions from underlying funds, which are presented in the corresponding line-item in the Statement of Operations, if applicable.
Investment Valuation
The following is a summary of the inputs used, as of June 30, 2022, involving the Fund's assets and liabilities carried at fair value. The inputs or methodology used for valuing securities may not be an indication of the risk associated with investing in those securities. For more information on valuation inputs, and their aggregation into the levels used below, please refer to the Investment Valuation section in the accompanying Notes to Financial Statements.
| Valuation Inputs at Reporting Date: | ||||
| Description | Total | Level 1 | Level 2 | Level 3 |
| Investments in Securities: | ||||
| Equity Funds | $1,365,073,407 | $1,365,073,407 | $-- | $-- |
| Fixed-Income Funds | 445,353,640 | 445,353,640 | -- | -- |
| Money Market Funds | 46,969,757 | 46,969,757 | -- | -- |
| Other Short-Term Investments and Net Other Assets | 1,365,105 | -- | 1,365,105 | -- |
| Total Investments in Securities: | $1,858,761,909 | $1,857,396,804 | $1,365,105 | $-- |
| Derivative Instruments: | ||||
| Liabilities | ||||
| Futures Contracts | $(213,796) | $(213,796) | $-- | $-- |
| Total Liabilities | $(213,796) | $(213,796) | $-- | $-- |
| Total Derivative Instruments: | $(213,796) | $(213,796) | $-- | $-- |
Value of Derivative Instruments
The following table is a summary of the Fund's value of derivative instruments by primary risk exposure as of June 30, 2022. For additional information on derivative instruments, please refer to the Derivative Instruments section in the accompanying Notes to Financial Statements.
| Primary Risk Exposure / Derivative Type | Value | |
| Asset | Liability | |
| Equity Risk | ||
| Futures Contracts(a) | $0 | $(213,796) |
| Total Equity Risk | 0 | (213,796) |
| Total Value of Derivatives | $0 | $(213,796) |
(a) Reflects gross cumulative appreciation (depreciation) on futures contracts as presented in the Schedule of Investments. In the Statement of Assets and Liabilities, the period end daily variation margin is included in receivable or payable for daily variation margin on futures contracts, and the net cumulative appreciation (depreciation) is included in Total accumulated earnings (loss).
See accompanying notes which are an integral part of the financial statements.
VIP FundsManager® 70% Portfolio
Financial Statements
Statement of Assets and Liabilities
| June 30, 2022 (Unaudited) | ||
| Assets | ||
| Investment in securities, at value — See accompanying schedule: Unaffiliated issuers (cost $1,365,375) | $1,365,105 | |
| Fidelity Central Funds (cost $46,969,757) | 46,969,757 | |
| Other affiliated issuers (cost $1,971,586,571) | 1,810,427,047 | |
| Total Investment in Securities (cost $2,019,921,703) | $1,858,761,909 | |
| Receivable for investments sold | 30,733,046 | |
| Receivable for fund shares sold | 101,722 | |
| Distributions receivable from Fidelity Central Funds | 46,832 | |
| Receivable for daily variation margin on futures contracts | 113,600 | |
| Total assets | 1,889,757,109 | |
| Liabilities | ||
| Payable for investments purchased | $58,321,929 | |
| Payable for fund shares redeemed | 34,095 | |
| Accrued management fee | 157,054 | |
| Distribution and service plan fees payable | 7,819 | |
| Total liabilities | 58,520,897 | |
| Net Assets | $1,831,236,212 | |
| Net Assets consist of: | ||
| Paid in capital | $1,997,641,999 | |
| Total accumulated earnings (loss) | (166,405,787) | |
| Net Assets | $1,831,236,212 | |
| Net Asset Value and Maximum Offering Price | ||
| Service Class: | ||
| Net Asset Value, offering price and redemption price per share ($57,653 ÷ 5,408 shares) | $10.66 | |
| Service Class 2: | ||
| Net Asset Value, offering price and redemption price per share ($60,754,755 ÷ 5,740,492 shares) | $10.58 | |
| Investor Class: | ||
| Net Asset Value, offering price and redemption price per share ($1,770,423,804 ÷ 166,167,976 shares) | $10.65 |
See accompanying notes which are an integral part of the financial statements.
Statement of Operations
| Six months ended June 30, 2022 (Unaudited) | ||
| Investment Income | ||
| Dividends: | ||
| Affiliated issuers | $5,054,500 | |
| Interest | 4,799 | |
| Income from Fidelity Central Funds | 99,767 | |
| Total income | 5,159,066 | |
| Expenses | ||
| Management fee | $2,375,865 | |
| Distribution and service plan fees | 85,003 | |
| Independent trustees' fees and expenses | 3,138 | |
| Total expenses before reductions | 2,464,006 | |
| Expense reductions | (541,236) | |
| Total expenses after reductions | 1,922,770 | |
| Net investment income (loss) | 3,236,296 | |
| Realized and Unrealized Gain (Loss) | ||
| Net realized gain (loss) on: | ||
| Investment securities: | ||
| Unaffiliated issuers | (1) | |
| Affiliated issuers | (27,519,177) | |
| Futures contracts | 17,389,484 | |
| Capital gain distributions from underlying funds: | ||
| Affiliated issuers | 2,100,827 | |
| Total net realized gain (loss) | (8,028,867) | |
| Change in net unrealized appreciation (depreciation) on: | ||
| Investment securities: | ||
| Unaffiliated issuers | (363) | |
| Affiliated issuers | (384,969,712) | |
| Futures contracts | 931,335 | |
| Total change in net unrealized appreciation (depreciation) | (384,038,740) | |
| Net gain (loss) | (392,067,607) | |
| Net increase (decrease) in net assets resulting from operations | $(388,831,311) |
See accompanying notes which are an integral part of the financial statements.
Statement of Changes in Net Assets
| Six months ended June 30, 2022 (Unaudited) | Year ended December 31, 2021 | |
| Increase (Decrease) in Net Assets | ||
| Operations | ||
| Net investment income (loss) | $3,236,296 | $20,041,859 |
| Net realized gain (loss) | (8,028,867) | 359,026,485 |
| Change in net unrealized appreciation (depreciation) | (384,038,740) | (106,631,519) |
| Net increase (decrease) in net assets resulting from operations | (388,831,311) | 272,436,825 |
| Distributions to shareholders | (357,247,461) | (48,133,724) |
| Share transactions - net increase (decrease) | 366,304,941 | 151,097,916 |
| Total increase (decrease) in net assets | (379,773,831) | 375,401,017 |
| Net Assets | ||
| Beginning of period | 2,211,010,043 | 1,835,609,026 |
| End of period | $1,831,236,212 | $2,211,010,043 |
See accompanying notes which are an integral part of the financial statements.
Financial Highlights
VIP FundsManager 70% Portfolio Service Class
| Six months ended (Unaudited) June 30, | Years endedDecember 31, | |||||
| 2022 | 2021 | 2020 | 2019 | 2018 | 2017 | |
| Selected Per–Share Data | ||||||
| Net asset value, beginning of period | $15.55 | $13.90 | $12.37 | $11.71 | $14.04 | $11.97 |
| Income from Investment Operations | ||||||
| Net investment income (loss)A,B | .02 | .15 | .12 | .17 | .17 | .13 |
| Net realized and unrealized gain (loss) | (2.40) | 1.86 | 1.82 | 2.26 | (1.13) | 2.16 |
| Total from investment operations | (2.38) | 2.01 | 1.94 | 2.43 | (.96) | 2.29 |
| Distributions from net investment income | (.03) | (.16) | (.12) | (.16) | (.13) | (.12) |
| Distributions from net realized gain | (2.47) | (.20) | (.30) | (1.61) | (1.24) | (.09) |
| Total distributions | (2.51)C | (.36) | (.41)C | (1.77) | (1.37) | (.22)C |
| Net asset value, end of period | $10.66 | $15.55 | $13.90 | $12.37 | $11.71 | $14.04 |
| Total ReturnD,E,F | (17.47)% | 14.60% | 16.10% | 22.65% | (7.50)% | 19.11% |
| Ratios to Average Net AssetsB,G,H | ||||||
| Expenses before reductions | .33%I | .35% | .35% | .35% | .35% | .35% |
| Expenses net of fee waivers, if any | .18%I | .20% | .20% | .20% | .20% | .20% |
| Expenses net of all reductions | .18%I | .20% | .20% | .20% | .20% | .20% |
| Net investment income (loss) | .33%I | .99% | .95% | 1.47% | 1.27% | 1.01% |
| Supplemental Data | ||||||
| Net assets, end of period (000 omitted) | $58 | $84 | $75 | $67 | $63 | $76 |
| Portfolio turnover rateJ | 44%I | 60%K | 24%K | 39% | 98% | 57% |
A Calculated based on average shares outstanding during the period.
B Net investment income (loss) is affected by the timing of the declaration of dividends by any underlying mutual funds or exchange-traded funds (ETFs). Net investment income (loss) of any such underlying funds is not included in the Fund's net investment income (loss) ratio.
C Total distributions per share do not sum due to rounding.
D Total returns for periods of less than one year are not annualized.
E Total returns do not reflect charges attributable to your insurance company's separate account. Inclusion of these charges would reduce the total returns shown.
F Total returns would have been lower if certain expenses had not been reduced during the applicable periods shown.
G Fees and expenses of any underlying mutual funds or exchange-traded funds (ETFs) are not included in the Fund's expense ratio. The Fund indirectly bears its proportionate share of these expenses. For additional expense information related to investments in Fidelity Central Funds, please refer to the "Investments in Fidelity Central Funds" note found in the Notes to Financial Statements section of the most recent Annual or Semi-Annual report.
H Expense ratios reflect operating expenses of the class. Expenses before reductions do not reflect amounts reimbursed, waived, or reduced through arrangements with the investment adviser, brokerage services, or other offset arrangements, if applicable, and do not represent the amount paid by the class during periods when reimbursements, waivers or reductions occur.
I Annualized
J Amount does not include the portfolio activity of any underlying mutual funds or exchange-traded funds (ETFs).
K Portfolio turnover rate excludes securities received or delivered in-kind.
See accompanying notes which are an integral part of the financial statements.
VIP FundsManager 70% Portfolio Service Class 2
| Six months ended (Unaudited) June 30, | Years endedDecember 31, | |||||
| 2022 | 2021 | 2020 | 2019 | 2018 | 2017 | |
| Selected Per–Share Data | ||||||
| Net asset value, beginning of period | $15.47 | $13.83 | $12.31 | $11.67 | $13.99 | $11.93 |
| Income from Investment Operations | ||||||
| Net investment income (loss)A,B | .01 | .12 | .10 | .15 | .15 | .11 |
| Net realized and unrealized gain (loss) | (2.39) | 1.85 | 1.82 | 2.25 | (1.12) | 2.15 |
| Total from investment operations | (2.38) | 1.97 | 1.92 | 2.40 | (.97) | 2.26 |
| Distributions from net investment income | (.03) | (.13) | (.10) | (.15) | (.11) | (.10) |
| Distributions from net realized gain | (2.47) | (.20) | (.30) | (1.61) | (1.24) | (.09) |
| Total distributions | (2.51)C | (.33) | (.40) | (1.76) | (1.35) | (.20)C |
| Net asset value, end of period | $10.58 | $15.47 | $13.83 | $12.31 | $11.67 | $13.99 |
| Total ReturnD,E,F | (17.57)% | 14.44% | 15.94% | 22.39% | (7.60)% | 18.94% |
| Ratios to Average Net AssetsB,G,H | ||||||
| Expenses before reductions | .49%I | .50% | .50% | .50% | .50% | .50% |
| Expenses net of fee waivers, if any | .33%I | .35% | .35% | .35% | .35% | .35% |
| Expenses net of all reductions | .33%I | .35% | .35% | .35% | .35% | .35% |
| Net investment income (loss) | .17%I | .84% | .80% | 1.32% | 1.13% | .86% |
| Supplemental Data | ||||||
| Net assets, end of period (000 omitted) | $60,755 | $74,699 | $66,433 | $57,129 | $46,406 | $48,977 |
| Portfolio turnover rateJ | 44%I | 60%K | 24%K | 39% | 98% | 57% |
A Calculated based on average shares outstanding during the period.
B Net investment income (loss) is affected by the timing of the declaration of dividends by any underlying mutual funds or exchange-traded funds (ETFs). Net investment income (loss) of any such underlying funds is not included in the Fund's net investment income (loss) ratio.
C Total distributions per share do not sum due to rounding.
D Total returns for periods of less than one year are not annualized.
E Total returns do not reflect charges attributable to your insurance company's separate account. Inclusion of these charges would reduce the total returns shown.
F Total returns would have been lower if certain expenses had not been reduced during the applicable periods shown.
G Fees and expenses of any underlying mutual funds or exchange-traded funds (ETFs) are not included in the Fund's expense ratio. The Fund indirectly bears its proportionate share of these expenses. For additional expense information related to investments in Fidelity Central Funds, please refer to the "Investments in Fidelity Central Funds" note found in the Notes to Financial Statements section of the most recent Annual or Semi-Annual report.
H Expense ratios reflect operating expenses of the class. Expenses before reductions do not reflect amounts reimbursed, waived, or reduced through arrangements with the investment adviser, brokerage services, or other offset arrangements, if applicable, and do not represent the amount paid by the class during periods when reimbursements, waivers or reductions occur.
I Annualized
J Amount does not include the portfolio activity of any underlying mutual funds or exchange-traded funds (ETFs).
K Portfolio turnover rate excludes securities received or delivered in-kind.
See accompanying notes which are an integral part of the financial statements.
VIP FundsManager 70% Portfolio Investor Class
| Six months ended (Unaudited) June 30, | Years endedDecember 31, | |||||
| 2022 | 2021 | 2020 | 2019 | 2018 | 2017 | |
| Selected Per–Share Data | ||||||
| Net asset value, beginning of period | $15.54 | $13.90 | $12.37 | $11.71 | $14.04 | $11.96 |
| Income from Investment Operations | ||||||
| Net investment income (loss)A,B | .02 | .15 | .12 | .17 | .17 | .13 |
| Net realized and unrealized gain (loss) | (2.40) | 1.85 | 1.82 | 2.26 | (1.13) | 2.17 |
| Total from investment operations | (2.38) | 2.00 | 1.94 | 2.43 | (.96) | 2.30 |
| Distributions from net investment income | (.03) | (.16) | (.12) | (.16) | (.13) | (.12) |
| Distributions from net realized gain | (2.47) | (.20) | (.30) | (1.61) | (1.24) | (.09) |
| Total distributions | (2.51)C | (.36) | (.41)C | (1.77) | (1.37) | (.22)C |
| Net asset value, end of period | $10.65 | $15.54 | $13.90 | $12.37 | $11.71 | $14.04 |
| Total ReturnD,E,F | (17.49)% | 14.52% | 16.10% | 22.66% | (7.49)% | 19.21% |
| Ratios to Average Net AssetsB,G,H | ||||||
| Expenses before reductions | .23%I | .25% | .25% | .25% | .25% | .25% |
| Expenses net of fee waivers, if any | .18%I | .20% | .20% | .20% | .20% | .20% |
| Expenses net of all reductions | .18%I | .20% | .20% | .20% | .20% | .20% |
| Net investment income (loss) | .32%I | .99% | .95% | 1.47% | 1.28% | 1.01% |
| Supplemental Data | ||||||
| Net assets, end of period (000 omitted) | $1,770,424 | $2,136,227 | $1,769,102 | $1,605,820 | $1,335,076 | $1,426,071 |
| Portfolio turnover rateJ | 44%I | 60%K | 24%K | 39% | 98% | 57% |
A Calculated based on average shares outstanding during the period.
B Net investment income (loss) is affected by the timing of the declaration of dividends by any underlying mutual funds or exchange-traded funds (ETFs). Net investment income (loss) of any such underlying funds is not included in the Fund's net investment income (loss) ratio.
C Total distributions per share do not sum due to rounding.
D Total returns for periods of less than one year are not annualized.
E Total returns do not reflect charges attributable to your insurance company's separate account. Inclusion of these charges would reduce the total returns shown.
F Total returns would have been lower if certain expenses had not been reduced during the applicable periods shown.
G Fees and expenses of any underlying mutual funds or exchange-traded funds (ETFs) are not included in the Fund's expense ratio. The Fund indirectly bears its proportionate share of these expenses. For additional expense information related to investments in Fidelity Central Funds, please refer to the "Investments in Fidelity Central Funds" note found in the Notes to Financial Statements section of the most recent Annual or Semi-Annual report.
H Expense ratios reflect operating expenses of the class. Expenses before reductions do not reflect amounts reimbursed, waived, or reduced through arrangements with the investment adviser, brokerage services, or other offset arrangements, if applicable, and do not represent the amount paid by the class during periods when reimbursements, waivers or reductions occur.
I Annualized
J Amount does not include the portfolio activity of any underlying mutual funds or exchange-traded funds (ETFs).
K Portfolio turnover rate excludes securities received or delivered in-kind.
See accompanying notes which are an integral part of the financial statements.
VIP FundsManager® 85% Portfolio
Investment Summary (Unaudited)
The information in the following tables is based on the direct investments of the Fund.Top Holdings as of June 30, 2022
| % of fund's net assets | |
| VIP Stock Selector All Cap Portfolio Investor Class | 40.8 |
| Fidelity Overseas Fund | 8.8 |
| Fidelity Emerging Markets Fund | 6.6 |
| Fidelity Low-Priced Stock Fund | 4.1 |
| Fidelity Equity-Income Fund | 3.5 |
| Fidelity Long-Term Treasury Bond Index Fund | 3.4 |
| Fidelity U.S. Low Volatility Equity Fund | 3.0 |
| Fidelity International Discovery Fund | 2.4 |
| Fidelity Large Cap Value Enhanced Index Fund | 2.4 |
| Fidelity Value Discovery Fund | 2.3 |
| 77.3 |
Asset Allocation (% of fund's net assets)
| Period end* | ||
| Domestic Equity Funds | 59.6% | |
| International Equity Funds | 29.9% | |
| Bond Funds | 9.3% | |
| Short-Term Funds | 2.0% | |
| Short-Term Investments | 0.2% | |
| Net Other Assets (Liabilities)** | (1.0)% | |

* Futures - 0.4%
** Net Other Assets (Liabilities) are not included in the pie chart
VIP FundsManager® 85% Portfolio
Schedule of Investments June 30, 2022 (Unaudited)
Showing Percentage of Net Assets
| Equity Funds - 89.5% | |||
| Shares | Value | ||
| Fidelity Canada Fund (a) | 79,606 | $4,766,018 | |
| Fidelity Commodity Strategy Fund (a) | 258,397 | 2,658,909 | |
| Fidelity Contrafund (a) | 726,985 | 9,668,906 | |
| Fidelity Emerging Markets Discovery Fund (a) | 242,212 | 3,262,594 | |
| Fidelity Emerging Markets Fund (a) | 1,339,036 | 43,920,394 | |
| Fidelity Equity-Income Fund (a) | 375,734 | 23,505,928 | |
| Fidelity Global Commodity Stock Fund (a) | 890,237 | 15,481,230 | |
| Fidelity International Capital Appreciation Fund (a) | 594,702 | 11,917,828 | |
| Fidelity International Discovery Fund (a) | 406,747 | 15,806,207 | |
| Fidelity International Enhanced Index Fund (a) | 1,701,806 | 15,452,395 | |
| Fidelity International Small Cap Fund (a) | 265,945 | 6,986,385 | |
| Fidelity International Small Cap Opportunities Fund (a) | 379,251 | 6,815,143 | |
| Fidelity International Value Fund (a) | 1,205,652 | 9,596,993 | |
| Fidelity Japan Fund (a) | 109,232 | 1,505,213 | |
| Fidelity Japan Smaller Companies Fund (a) | 440,506 | 5,567,994 | |
| Fidelity Large Cap Value Enhanced Index Fund (a) | 1,107,387 | 15,702,754 | |
| Fidelity Low-Priced Stock Fund (a) | 593,868 | 27,626,722 | |
| Fidelity Overseas Fund (a) | 1,211,872 | 58,642,480 | |
| Fidelity Real Estate Investment Portfolio (a) | 238,284 | 10,470,182 | |
| Fidelity U.S. Low Volatility Equity Fund (a) | 2,012,819 | 20,168,449 | |
| Fidelity Value Discovery Fund (a) | 448,628 | 15,531,496 | |
| VIP Stock Selector All Cap Portfolio Investor Class (a) | 34,317,548 | 271,794,980 | |
| TOTAL EQUITY FUNDS | |||
| (Cost $660,630,716) | 596,849,200 | ||
| Fixed-Income Funds - 9.3% | |||
| Fidelity Floating Rate High Income Fund (a) | 1,097,193 | 9,732,106 | |
| Fidelity Inflation-Protected Bond Index Fund (a) | 352,302 | 3,575,864 | |
| Fidelity Long-Term Treasury Bond Index Fund (a) | 1,982,133 | 22,853,995 | |
| Fidelity New Markets Income Fund (a) | 247,132 | 2,824,714 | |
| Fidelity Total Bond Fund (a) | 1,191,048 | 11,541,257 | |
| VIP Investment Grade Bond II Portfolio - Investor Class (a) | 1,186,841 | 11,583,572 | |
| TOTAL FIXED-INCOME FUNDS | |||
| (Cost $70,334,913) | 62,111,508 | ||
| Money Market Funds - 2.0% | |||
| Fidelity Cash Central Fund 1.58% (b) | |||
| (Cost $13,365,350) | 13,362,678 | 13,365,350 | |
| Principal Amount | Value | ||
| U.S. Treasury Obligations - 0.2% | |||
| U.S. Treasury Bills, yield at date of purchase 0.66% to 1.24% 7/7/22 to 9/8/22 (c) | |||
| (Cost $947,939) | 950,000 | 947,341 | |
| TOTAL INVESTMENT IN SECURITIES - 101.0% | |||
| (Cost $745,278,918) | 673,273,399 | ||
| NET OTHER ASSETS (LIABILITIES) - (1.0)% | (6,377,549) | ||
| NET ASSETS - 100% | $666,895,850 |
| Futures Contracts | |||||
| Number of contracts | Expiration Date | Notional Amount | Value | Unrealized Appreciation/(Depreciation) | |
| Purchased | |||||
| Equity Index Contracts | |||||
| ICE E-mini MSCI Emerging Markets Index Contracts (United States) | 184 | Sept. 2022 | $9,224,840 | $(2,997) | $(2,997) |
| Sold | |||||
| Equity Index Contracts | |||||
| CME E-mini S&P 500 Index Contracts (United States) | 26 | Sept. 2022 | 4,926,350 | (6,438) | (6,438) |
| ICE E-mini MSCI EAFE Index Contracts (United States) | 20 | Sept. 2022 | 1,856,600 | (3,894) | (3,894) |
| TOTAL SOLD | $(10,332) | ||||
| TOTAL FUTURES CONTRACTS | $(13,329) |
The notional amount of futures purchased as a percentage of Net Assets is 1.4%
The notional amount of futures sold as a percentage of Net Assets is 1.0%
Legend
(a) Affiliated Fund
(b) Affiliated fund that is generally available only to investment companies and other accounts managed by Fidelity Investments. The rate quoted is the annualized seven-day yield of the fund at period end. A complete unaudited listing of the fund's holdings as of its most recent quarter end is available upon request. In addition, each Fidelity Central Fund's financial statements are available on the SEC's website or upon request.
(c) Security or a portion of the security was pledged to cover margin requirements for futures contracts. At period end, the value of securities pledged amounted to $389,922.
Affiliated Central Funds
Fiscal year to date information regarding the Fund's investments in Fidelity Central Funds, including the ownership percentage, is presented below.
| Fund | Value, beginning of period | Purchases | Sales Proceeds | Dividend Income | Realized Gain/Loss | Change in Unrealized appreciation (depreciation) | Value, end of period | % ownership, end of period |
| Fidelity Cash Central Fund 1.58% | $4,697,360 | $26,038,052 | $17,370,062 | $28,804 | $-- | $-- | $13,365,350 | 0.0% |
| Total | $4,697,360 | $26,038,052 | $17,370,062 | $28,804 | $-- | $-- | $13,365,350 |
Amounts in the income column in the above table include any capital gain distributions from underlying funds, which are presented in the corresponding line-item in the Statement of Operations, if applicable.
Affiliated Underlying Funds
Fiscal year to date information regarding the Fund's investments in affiliated Underlying Funds is presented below. Exchanges between classes of the same affiliated Underlying Funds may occur, and are excluded from purchases and sales below if applicable. If an underlying Fund changes its name, the name presented below is the name in effect at period end.
| Affiliate | Value, beginning of period | Purchases(a) | Sales Proceeds(a) | Dividend Income | Realized Gain (loss) | Change in Unrealized appreciation (depreciation) | Value, end of period |
| Fidelity Canada Fund | $-- | $5,035,250 | $30,309 | $-- | $(2,213) | $(236,710) | $4,766,018 |
| Fidelity Commodity Strategy Fund | 5,108,850 | -- | 3,750,127 | -- | 1,010,715 | 289,471 | 2,658,909 |
| Fidelity Contrafund | 14,713,133 | 710,536 | 1,432,256 | 170,556 | (383,310) | (3,939,197) | 9,668,906 |
| Fidelity Emerging Markets Discovery Fund | 1,749,841 | 1,919,187 | 43,688 | -- | (10,392) | (352,354) | 3,262,594 |
| Fidelity Emerging Markets Fund | 9,609,452 | 37,997,142 | 178,811 | -- | (31,665) | (3,475,724) | 43,920,394 |
| Fidelity Equity-Income Fund | 28,726,503 | 1,244,565 | 3,351,072 | 109,619 | (204,527) | (2,909,541) | 23,505,928 |
| Fidelity Floating Rate High Income Fund | -- | 10,402,122 | 169,894 | 122,479 | (1,748) | (498,374) | 9,732,106 |
| Fidelity Global Commodity Stock Fund | 14,632,019 | 774,708 | 916,537 | -- | 3,725 | 987,315 | 15,481,230 |
| Fidelity High Income Fund | 7,493,739 | 4,090 | 7,471,946 | 4,069 | 701,215 | (727,098) | -- |
| Fidelity Inflation-Protected Bond Index Fund | 12,307,913 | 282,381 | 8,531,349 | -- | 331,913 | (814,994) | 3,575,864 |
| Fidelity International Capital Appreciation Fund | 17,118,950 | 604,907 | 747,276 | -- | (150,819) | (4,907,934) | 11,917,828 |
| Fidelity International Discovery Fund | 21,837,861 | 792,767 | 1,000,383 | -- | (233,124) | (5,590,914) | 15,806,207 |
| Fidelity International Enhanced Index Fund | 19,241,026 | 703,645 | 932,512 | -- | (94,251) | (3,465,513) | 15,452,395 |
| Fidelity International Small Cap Fund | 8,719,476 | 311,547 | 415,688 | -- | (50,437) | (1,578,513) | 6,986,385 |
| Fidelity International Small Cap Opportunities Fund | 9,571,526 | 411,802 | -- | -- | -- | (3,168,185) | 6,815,143 |
| Fidelity International Value Fund | 11,401,444 | 411,802 | 570,283 | -- | (30,671) | (1,615,299) | 9,596,993 |
| Fidelity Japan Fund | 1,992,792 | 65,140 | 35,661 | -- | (3,230) | (513,828) | 1,505,213 |
| Fidelity Japan Smaller Companies Fund | 6,942,373 | -- | -- | -- | -- | (1,374,379) | 5,567,994 |
| Fidelity Large Cap Value Enhanced Index Fund | 19,490,435 | 550,339 | 2,139,609 | -- | (135,414) | (2,062,997) | 15,702,754 |
| Fidelity Long-Term Treasury Bond Index Fund | 31,139,528 | 1,369,347 | 3,176,494 | 302,493 | (516,597) | (5,961,789) | 22,853,995 |
| Fidelity Low-Priced Stock Fund | 34,874,696 | 1,386,657 | 4,007,496 | -- | (388,620) | (4,238,515) | 27,626,722 |
| Fidelity New Markets Income Fund | 3,380,651 | 210,026 | 82,932 | 64,742 | (5,246) | (677,785) | 2,824,714 |
| Fidelity Overseas Fund | 83,216,082 | 2,988,127 | 3,731,656 | -- | (674,941) | (23,155,132) | 58,642,480 |
| Fidelity Real Estate Investment Portfolio | 15,242,774 | 473,549 | 2,598,680 | -- | (149,180) | (2,498,281) | 10,470,182 |
| Fidelity Total Bond Fund | -- | 11,579,637 | 4,499 | 12,425 | (109) | (33,772) | 11,541,257 |
| Fidelity U.S. Bond Index Fund | 5,024,995 | 15,376,090 | 19,155,551 | 104,883 | (805,737) | (439,797) | -- |
| Fidelity U.S. Low Volatility Equity Fund | 22,732,700 | 1,716,887 | 529,964 | 787,813 | (20,840) | (3,730,334) | 20,168,449 |
| Fidelity Value Discovery Fund | 18,820,104 | 610,155 | 2,133,871 | -- | (86,322) | (1,678,570) | 15,531,496 |
| VIP Investment Grade Bond Portfolio II Investor Class | -- | 11,850,352 | 54,657 | -- | (2,031) | (210,092) | 11,583,572 |
| VIP Stock Selector All Cap Portfolio Investor Class | 381,552,293 | 13,292,784 | 39,161,149 | -- | (7,052,208) | (76,836,740) | 271,794,980 |
| $806,641,156 | $123,075,541 | $106,354,350 | $1,679,079 | $(8,986,064) | $(155,415,575) | $658,960,708 |
(a) Includes the value of shares purchased or redeemed through in-kind transactions, as applicable.
Amounts in the income column in the above table include any capital gain distributions from underlying funds, which are presented in the corresponding line-item in the Statement of Operations, if applicable.
Investment Valuation
The following is a summary of the inputs used, as of June 30, 2022, involving the Fund's assets and liabilities carried at fair value. The inputs or methodology used for valuing securities may not be an indication of the risk associated with investing in those securities. For more information on valuation inputs, and their aggregation into the levels used below, please refer to the Investment Valuation section in the accompanying Notes to Financial Statements.
| Valuation Inputs at Reporting Date: | ||||
| Description | Total | Level 1 | Level 2 | Level 3 |
| Investments in Securities: | ||||
| Equity Funds | $596,849,200 | $596,849,200 | $-- | $-- |
| Fixed-Income Funds | 62,111,508 | 62,111,508 | -- | -- |
| Money Market Funds | 13,365,350 | 13,365,350 | -- | -- |
| Other Short-Term Investments and Net Other Assets | 947,341 | -- | 947,341 | -- |
| Total Investments in Securities: | $673,273,399 | $672,326,058 | $947,341 | $-- |
| Derivative Instruments: | ||||
| Liabilities | ||||
| Futures Contracts | $(13,329) | $(13,329) | $-- | $-- |
| Total Liabilities | $(13,329) | $(13,329) | $-- | $-- |
| Total Derivative Instruments: | $(13,329) | $(13,329) | $-- | $-- |
Value of Derivative Instruments
The following table is a summary of the Fund's value of derivative instruments by primary risk exposure as of June 30, 2022. For additional information on derivative instruments, please refer to the Derivative Instruments section in the accompanying Notes to Financial Statements.
| Primary Risk Exposure / Derivative Type | Value | |
| Asset | Liability | |
| Equity Risk | ||
| Futures Contracts(a) | $0 | $(13,329) |
| Total Equity Risk | 0 | (13,329) |
| Total Value of Derivatives | $0 | $(13,329) |
(a) Reflects gross cumulative appreciation (depreciation) on futures contracts as presented in the Schedule of Investments. In the Statement of Assets and Liabilities, the period end daily variation margin is included in receivable or payable for daily variation margin on futures contracts, and the net cumulative appreciation (depreciation) is included in Total accumulated earnings (loss).
See accompanying notes which are an integral part of the financial statements.
VIP FundsManager® 85% Portfolio
Financial Statements
Statement of Assets and Liabilities
| June 30, 2022 (Unaudited) | ||
| Assets | ||
| Investment in securities, at value — See accompanying schedule: Unaffiliated issuers (cost $947,939) | $947,341 | |
| Fidelity Central Funds (cost $13,365,350) | 13,365,350 | |
| Other affiliated issuers (cost $730,965,629) | 658,960,708 | |
| Total Investment in Securities (cost $745,278,918) | $673,273,399 | |
| Receivable for investments sold | 22,286,249 | |
| Receivable for fund shares sold | 831 | |
| Distributions receivable from Fidelity Central Funds | 13,878 | |
| Total assets | 695,574,357 | |
| Liabilities | ||
| Payable for investments purchased | $28,491,832 | |
| Payable for fund shares redeemed | 101,041 | |
| Accrued management fee | 57,379 | |
| Distribution and service plan fees payable | 6,161 | |
| Payable for daily variation margin on futures contracts | 22,094 | |
| Total liabilities | 28,678,507 | |
| Net Assets | $666,895,850 | |
| Net Assets consist of: | ||
| Paid in capital | $744,161,832 | |
| Total accumulated earnings (loss) | (77,265,982) | |
| Net Assets | $666,895,850 | |
| Net Asset Value and Maximum Offering Price | ||
| Service Class: | ||
| Net Asset Value, offering price and redemption price per share ($292 ÷ 28.21 shares) | $10.35 | |
| Service Class 2: | ||
| Net Asset Value, offering price and redemption price per share ($47,690,737 ÷ 4,673,072.00 shares) | $10.21 | |
| Investor Class: | ||
| Net Asset Value, offering price and redemption price per share ($619,204,821 ÷ 60,054,056.00 shares) | $10.31 |
See accompanying notes which are an integral part of the financial statements.
Statement of Operations
| Six months ended June 30, 2022 (Unaudited) | ||
| Investment Income | ||
| Dividends: | ||
| Affiliated issuers | $766,967 | |
| Interest | 1,472 | |
| Income from Fidelity Central Funds | 28,804 | |
| Total income | 797,243 | |
| Expenses | ||
| Management fee | $872,071 | |
| Distribution and service plan fees | 66,160 | |
| Independent trustees' fees and expenses | 1,153 | |
| Total expenses before reductions | 939,384 | |
| Expense reductions | (212,587) | |
| Total expenses after reductions | 726,797 | |
| Net investment income (loss) | 70,446 | |
| Realized and Unrealized Gain (Loss) | ||
| Net realized gain (loss) on: | ||
| Investment securities: | ||
| Unaffiliated issuers | (5) | |
| Affiliated issuers | (8,986,064) | |
| Futures contracts | 3,360,862 | |
| Capital gain distributions from underlying funds: | ||
| Affiliated issuers | 912,112 | |
| Total net realized gain (loss) | (4,713,095) | |
| Change in net unrealized appreciation (depreciation) on: | ||
| Investment securities: | ||
| Unaffiliated issuers | (626) | |
| Affiliated issuers | (155,415,575) | |
| Futures contracts | 207,618 | |
| Total change in net unrealized appreciation (depreciation) | (155,208,583) | |
| Net gain (loss) | (159,921,678) | |
| Net increase (decrease) in net assets resulting from operations | $(159,851,232) |
See accompanying notes which are an integral part of the financial statements.
Statement of Changes in Net Assets
| Six months ended June 30, 2022 (Unaudited) | Year ended December 31, 2021 | |
| Increase (Decrease) in Net Assets | ||
| Operations | ||
| Net investment income (loss) | $70,446 | $6,140,775 |
| Net realized gain (loss) | (4,713,095) | 153,275,269 |
| Change in net unrealized appreciation (depreciation) | (155,208,583) | (39,343,746) |
| Net increase (decrease) in net assets resulting from operations | (159,851,232) | 120,072,298 |
| Distributions to shareholders | (147,158,214) | (25,442,763) |
| Share transactions - net increase (decrease) | 160,614,434 | 54,479,855 |
| Total increase (decrease) in net assets | (146,395,012) | 149,109,390 |
| Net Assets | ||
| Beginning of period | 813,290,862 | 664,181,472 |
| End of period | $666,895,850 | $813,290,862 |
See accompanying notes which are an integral part of the financial statements.
Financial Highlights
VIP FundsManager 85% Portfolio Service Class
| Six months ended (Unaudited) June 30, | Years endedDecember 31, | |||||
| 2022 | 2021 | 2020 | 2019 | 2018 | 2017 | |
| Selected Per–Share Data | ||||||
| Net asset value, beginning of period | $15.82 | $13.88 | $12.25 | $11.65 | $14.30 | $11.81 |
| Income from Investment Operations | ||||||
| Net investment income (loss)A,B | –C | .12 | .09 | .15 | .15 | .11 |
| Net realized and unrealized gain (loss) | (2.65) | 2.34 | 2.04 | 2.58 | (1.29) | 2.61 |
| Total from investment operations | (2.65) | 2.46 | 2.13 | 2.73 | (1.14) | 2.72 |
| Distributions from net investment income | (.02) | (.15) | (.10) | (.14) | (.10) | (.10) |
| Distributions from net realized gain | (2.80) | (.37) | (.39) | (1.99) | (1.41) | (.13) |
| Total distributions | (2.82) | (.52) | (.50)D | (2.13) | (1.51) | (.23) |
| Net asset value, end of period | $10.35 | $15.82 | $13.88 | $12.25 | $11.65 | $14.30 |
| Total ReturnE,F,G | (19.41)% | 18.02% | 17.93% | 26.05% | (8.90)% | 23.05% |
| Ratios to Average Net AssetsB,H,I | ||||||
| Expenses before reductions | .24%J | .25% | .25% | .25% | .33%K | .35% |
| Expenses net of fee waivers, if any | .18%J | .20% | .20% | .20% | .17%K | .20% |
| Expenses net of all reductions | .18%J | .20% | .20% | .20% | .17%K | .20% |
| Net investment income (loss) | (.02)%J | .78% | .82% | 1.26% | 1.11% | .81% |
| Supplemental Data | ||||||
| Net assets, end of period (000 omitted) | $– | $– | $– | $– | $– | $2 |
| Portfolio turnover rateL | 29%J | 68%M | 37%M | 38% | 116% | 70% |
A Calculated based on average shares outstanding during the period.
B Net investment income (loss) is affected by the timing of the declaration of dividends by any underlying mutual funds or exchange-traded funds (ETFs). Net investment income (loss) of any such underlying funds is not included in the Fund's net investment income (loss) ratio.
C Amount represents less than $.005 per share.
D Total distributions per share do not sum due to rounding.
E Total returns for periods of less than one year are not annualized.
F Total returns do not reflect charges attributable to your insurance company's separate account. Inclusion of these charges would reduce the total returns shown.
G Total returns would have been lower if certain expenses had not been reduced during the applicable periods shown.
H Fees and expenses of any underlying mutual funds or exchange-traded funds (ETFs) are not included in the Fund's expense ratio. The Fund indirectly bears its proportionate share of these expenses. For additional expense information related to investments in Fidelity Central Funds, please refer to the "Investments in Fidelity Central Funds" note found in the Notes to Financial Statements section of the most recent Annual or Semi-Annual report.
I Expense ratios reflect operating expenses of the class. Expenses before reductions do not reflect amounts reimbursed, waived, or reduced through arrangements with the investment adviser, brokerage services, or other offset arrangements, if applicable, and do not represent the amount paid by the class during periods when reimbursements, waivers or reductions occur.
J Annualized
K On certain classes, the size and fluctuation of net assets and expense amounts may cause ratios to differ from contractual rates.
L Amount does not include the portfolio activity of any underlying mutual funds or exchange-traded funds (ETFs).
M Portfolio turnover rate excludes securities received or delivered in-kind.
See accompanying notes which are an integral part of the financial statements.
VIP FundsManager 85% Portfolio Service Class 2
| Six months ended (Unaudited) June 30, | Years endedDecember 31, | |||||
| 2022 | 2021 | 2020 | 2019 | 2018 | 2017 | |
| Selected Per–Share Data | ||||||
| Net asset value, beginning of period | $15.65 | $13.76 | $12.20 | $11.59 | $14.24 | $11.76 |
| Income from Investment Operations | ||||||
| Net investment income (loss)A,B | (.01) | .10 | .08 | .13 | .12 | .09 |
| Net realized and unrealized gain (loss) | (2.61) | 2.29 | 1.96 | 2.60 | (1.28) | 2.60 |
| Total from investment operations | (2.62) | 2.39 | 2.04 | 2.73 | (1.16) | 2.69 |
| Distributions from net investment income | (.02) | (.13) | (.09) | (.13) | (.09) | (.08) |
| Distributions from net realized gain | (2.80) | (.37) | (.39) | (1.99) | (1.41) | (.13) |
| Total distributions | (2.82) | (.50) | (.48) | (2.12) | (1.49)C | (.21) |
| Net asset value, end of period | $10.21 | $15.65 | $13.76 | $12.20 | $11.59 | $14.24 |
| Total ReturnD,E,F | (19.42)% | 17.64% | 17.27% | 26.14% | (9.08)% | 22.90% |
| Ratios to Average Net AssetsB,G,H | ||||||
| Expenses before reductions | .49%I | .50% | .50% | .50% | .50% | .50% |
| Expenses net of fee waivers, if any | .33%I | .35% | .35% | .35% | .35% | .35% |
| Expenses net of all reductions | .33%I | .35% | .35% | .35% | .35% | .35% |
| Net investment income (loss) | (.12)%I | .68% | .68% | 1.16% | .93% | .66% |
| Supplemental Data | ||||||
| Net assets, end of period (000 omitted) | $47,691 | $58,047 | $48,373 | $40,928 | $31,555 | $33,540 |
| Portfolio turnover rateJ | 29%I | 68%K | 37%K | 38% | 116% | 70% |
A Calculated based on average shares outstanding during the period.
B Net investment income (loss) is affected by the timing of the declaration of dividends by any underlying mutual funds or exchange-traded funds (ETFs). Net investment income (loss) of any such underlying funds is not included in the Fund's net investment income (loss) ratio.
C Total distributions per share do not sum due to rounding.
D Total returns for periods of less than one year are not annualized.
E Total returns do not reflect charges attributable to your insurance company's separate account. Inclusion of these charges would reduce the total returns shown.
F Total returns would have been lower if certain expenses had not been reduced during the applicable periods shown.
G Fees and expenses of any underlying mutual funds or exchange-traded funds (ETFs) are not included in the Fund's expense ratio. The Fund indirectly bears its proportionate share of these expenses. For additional expense information related to investments in Fidelity Central Funds, please refer to the "Investments in Fidelity Central Funds" note found in the Notes to Financial Statements section of the most recent Annual or Semi-Annual report.
H Expense ratios reflect operating expenses of the class. Expenses before reductions do not reflect amounts reimbursed, waived, or reduced through arrangements with the investment adviser, brokerage services, or other offset arrangements, if applicable, and do not represent the amount paid by the class during periods when reimbursements, waivers or reductions occur.
I Annualized
J Amount does not include the portfolio activity of any underlying mutual funds or exchange-traded funds (ETFs).
K Portfolio turnover rate excludes securities received or delivered in-kind.
See accompanying notes which are an integral part of the financial statements.
VIP FundsManager 85% Portfolio Investor Class
| Six months ended (Unaudited) June 30, | Years endedDecember 31, | |||||
| 2022 | 2021 | 2020 | 2019 | 2018 | 2017 | |
| Selected Per–Share Data | ||||||
| Net asset value, beginning of period | $15.77 | $13.86 | $12.28 | $11.66 | $14.31 | $11.81 |
| Income from Investment Operations | ||||||
| Net investment income (loss)A,B | –C | .12 | .10 | .15 | .14 | .11 |
| Net realized and unrealized gain (loss) | (2.64) | 2.31 | 1.98 | 2.60 | (1.28) | 2.62 |
| Total from investment operations | (2.64) | 2.43 | 2.08 | 2.75 | (1.14) | 2.73 |
| Distributions from net investment income | (.02) | (.15) | (.10) | (.14) | (.10) | (.10) |
| Distributions from net realized gain | (2.80) | (.37) | (.39) | (1.99) | (1.41) | (.13) |
| Total distributions | (2.82) | (.52) | (.50)D | (2.13) | (1.51) | (.23) |
| Net asset value, end of period | $10.31 | $15.77 | $13.86 | $12.28 | $11.66 | $14.31 |
| Total ReturnE,F,G | (19.40)% | 17.83% | 17.46% | 26.21% | (8.89)% | 23.13% |
| Ratios to Average Net AssetsB,H,I | ||||||
| Expenses before reductions | .23%J | .25% | .25% | .25% | .25% | .25% |
| Expenses net of fee waivers, if any | .18%J | .20% | .20% | .20% | .20% | .20% |
| Expenses net of all reductions | .18%J | .20% | .20% | .20% | .20% | .20% |
| Net investment income (loss) | .03%J | .83% | .83% | 1.31% | 1.08% | .81% |
| Supplemental Data | ||||||
| Net assets, end of period (000 omitted) | $619,205 | $755,243 | $615,808 | $548,925 | $459,354 | $492,831 |
| Portfolio turnover rateK | 29%J | 68%L | 37%L | 38% | 116% | 70% |
A Calculated based on average shares outstanding during the period.
B Net investment income (loss) is affected by the timing of the declaration of dividends by any underlying mutual funds or exchange-traded funds (ETFs). Net investment income (loss) of any such underlying funds is not included in the Fund's net investment income (loss) ratio.
C Amount represents less than $.005 per share.
D Total distributions per share do not sum due to rounding.
E Total returns for periods of less than one year are not annualized.
F Total returns do not reflect charges attributable to your insurance company's separate account. Inclusion of these charges would reduce the total returns shown.
G Total returns would have been lower if certain expenses had not been reduced during the applicable periods shown.
H Fees and expenses of any underlying mutual funds or exchange-traded funds (ETFs) are not included in the Fund's expense ratio. The Fund indirectly bears its proportionate share of these expenses. For additional expense information related to investments in Fidelity Central Funds, please refer to the "Investments in Fidelity Central Funds" note found in the Notes to Financial Statements section of the most recent Annual or Semi-Annual report.
I Expense ratios reflect operating expenses of the class. Expenses before reductions do not reflect amounts reimbursed, waived, or reduced through arrangements with the investment adviser, brokerage services, or other offset arrangements, if applicable, and do not represent the amount paid by the class during periods when reimbursements, waivers or reductions occur.
J Annualized
K Amount does not include the portfolio activity of any underlying mutual funds or exchange-traded funds (ETFs).
L Portfolio turnover rate excludes securities received or delivered in-kind.
See accompanying notes which are an integral part of the financial statements.
Notes to Financial Statements (Unaudited)
For the period ended June 30, 2022
1. Organization.
VIP FundsManager 20% Portfolio, VIP FundsManager 50% Portfolio, VIP FundsManager 60% Portfolio, VIP FundsManager 70% Portfolio, and VIP FundsManager 85% Portfolio (the Funds) are funds of Variable Insurance Products Fund V (the Trust). The Trust is registered under the Investment Company Act of 1940, as amended (the 1940 Act), as an open-end management investment company organized as a Massachusetts business trust. Each Fund is authorized to issue an unlimited number of shares. Shares of each Fund may only be purchased by insurance companies for the purpose of funding variable annuity or variable life insurance contracts. Each Fund offers three classes of shares: Initial shares, Service Class shares and Service Class 2 shares. All classes have equal rights and voting privileges, except for matters affecting a single class.
2. Investments in Fidelity Central Funds.
Funds may invest in Fidelity Central Funds, which are open-end investment companies generally available only to other investment companies and accounts managed by the investment adviser and its affiliates. The Schedule of Investments lists any Fidelity Central Funds held as an investment as of period end, but does not include the underlying holdings of each Fidelity Central Fund. An investing fund indirectly bears its proportionate share of the expenses of the underlying Fidelity Central Funds.
Based on its investment objective, each Fidelity Central Fund may invest or participate in various investment vehicles or strategies that are similar to those of the investing fund. These strategies are consistent with the investment objectives of the investing fund and may involve certain economic risks which may cause a decline in value of each of the Fidelity Central Funds and thus a decline in the value of the investing fund.
| Fidelity Central Fund | Investment Manager | Investment Objective | Investment Practices | Expense Ratio(a) |
| Fidelity Money Market Central Funds | Fidelity Management & Research Company LLC (FMR) | Each fund seeks to obtain a high level of current income consistent with the preservation of capital and liquidity. | Short-term Investments | Less than .005% |
(a) Expenses expressed as a percentage of average net assets and are as of each underlying Central Fund's most recent annual or semi-annual shareholder report.
A complete unaudited list of holdings for each Fidelity Central Fund is available upon request or at the Securities and Exchange Commission website at www.sec.gov. In addition, the financial statements of the Fidelity Central Funds which contain the significant accounting policies (including investment valuation policies) of those funds, and are not covered by the Report of Independent Registered Public Accounting Firm, are available on the Securities and Exchange Commission website or upon request.
3. Significant Accounting Policies.
Each Fund is an investment company and applies the accounting and reporting guidance of the Financial Accounting Standards Board (FASB) Accounting Standards Codification Topic 946 Financial Services - Investment Companies. The financial statements have been prepared in conformity with accounting principles generally accepted in the United States of America (GAAP), which require management to make certain estimates and assumptions at the date of the financial statements. Actual results could differ from those estimates. Subsequent events, if any, through the date that the financial statements were issued have been evaluated in the preparation of the financial statements. Each Fund's Schedule of Investments lists any underlying mutual funds or exchange-traded funds (ETFs) but does not include the underlying holdings of these funds. The following summarizes the significant accounting policies of each Fund:
Investment Valuation. Investments are valued as of 4:00 p.m. Eastern time on the last calendar day of the period. The Board of Trustees (the Board) has delegated the day to day responsibility for the valuation of each Fund's investments to the Fair Value Committee (the Committee) established by the each Fund's investment adviser. In accordance with valuation policies and procedures approved by the Board, each Fund attempts to obtain prices from one or more third party pricing vendors or brokers to value its investments. When current market prices, quotations or currency exchange rates are not readily available or reliable, investments will be fair valued in good faith by the Committee, in accordance with procedures adopted by the Board. Factors used in determining fair value vary by investment type and may include market or investment specific events, changes in interest rates and credit quality. The frequency with which these procedures are used cannot be predicted and they may be utilized to a significant extent. The Committee oversees each Fund's valuation policies and procedures and reports to the Board on the Committee's activities and fair value determinations. The Board monitors the appropriateness of the procedures used in valuing each Fund's investments and ratifies the fair value determinations of the Committee. Each Fund categorizes the inputs to valuation techniques used to value its investments into a disclosure hierarchy consisting of three levels as shown below:
- Level 1 – unadjusted quoted prices in active markets for identical investments
- Level 2 – other significant observable inputs (including quoted prices for similar investments, interest rates, prepayment speeds, etc.)
- Level 3 – unobservable inputs (including the Fund's own assumptions based on the best information available)
Valuation techniques used to value each Fund's investments by major category are as follows. Investments in open-end mutual funds are valued at their closing net asset value (NAV) each business day and are categorized as Level 1 in the hierarchy. Debt securities, including restricted securities, are valued based on evaluated prices received from third party pricing vendors or from brokers who make markets in such securities. U.S. government and government agency obligations are valued by pricing vendors who utilize matrix pricing which considers yield or price of bonds of comparable quality, coupon, maturity and type or by broker-supplied prices. When independent prices are unavailable or unreliable, debt securities may be valued utilizing pricing methodologies which consider similar factors that would be used by third party pricing vendors. Debt securities are generally categorized as Level 2 in the hierarchy but may be Level 3 depending on the circumstances. The aggregate value of investments by input level as of June 30, 2022 is included at the end of each Fund's Schedule of Investments.
Futures contracts are valued at the settlement price established each day by the board of trade or exchange on which they are traded and are categorized as Level 1 in the hierarchy.
Investment Transactions and Income. For financial reporting purposes, the Funds' investment holdings and NAV include trades executed through the end of the last business day of the period. The NAV per share for processing shareholder transactions is calculated as of the close of business of the New York Stock Exchange (NYSE), normally 4:00 p.m. Eastern time and includes trades executed through the end of the prior business day. Gains and losses on securities sold are determined on the basis of identified cost. Income and capital gain distributions from any underlying mutual funds or exchange-traded funds (ETFs) are recorded on the ex-dividend date. Interest income is accrued as earned. Interest income includes coupon interest and amortization of premium and accretion of discount on debt securities as applicable.
Class Allocations and Expenses. Investment income, realized and unrealized capital gains and losses, common expenses of a fund, and certain fund-level expense reductions, if any, are allocated daily on a pro-rata basis to each class based on the relative net assets of each class to the total net assets of a fund. Each class differs with respect to transfer agent and distribution and service plan fees incurred, as applicable. Certain expense reductions may also differ by class, if applicable. For the reporting period, the allocated portion of income and expenses to each class as a percent of its average net assets may vary due to the timing of recording these transactions in relation to fluctuating net assets of the classes. Expenses directly attributable to a fund are charged to that fund. Expenses attributable to more than one fund are allocated among the respective funds on the basis of relative net assets or other appropriate methods. Expenses included in the accompanying financial statements reflect the expenses of that fund and do not include any expenses associated with any underlying mutual funds or exchange-traded funds. Although not included in a fund's expenses, a fund indirectly bears its proportionate share of these expenses through the net asset value of each underlying mutual fund or exchange-traded fund. Expense estimates are accrued in the period to which they relate and adjustments are made when actual amounts are known.
Income Tax Information and Distributions to Shareholders. Each year, each Fund intends to qualify as a regulated investment company under Subchapter M of the Internal Revenue Code, including distributing substantially all of its taxable income and realized gains. As a result, no provision for U.S. Federal income taxes is required. Each Fund files a U.S. federal tax return, in addition to state and local tax returns as required. Each Fund's federal income tax returns are subject to examination by the Internal Revenue Service (IRS) for a period of three fiscal years after they are filed. State and local tax returns may be subject to examination for an additional fiscal year depending on the jurisdiction.
Distributions are declared and recorded on the ex-dividend date. Income and capital gain distributions are declared separately for each class. Income and capital gain distributions are determined in accordance with income tax regulations, which may differ from GAAP.
Capital accounts within the financial statements are adjusted for permanent book-tax differences. These adjustments have no impact on net assets or the results of operations. Capital accounts are not adjusted for temporary book-tax differences which will reverse in a subsequent period.
Book-tax differences are primarily due to the short-term gain distributions from the underlying mutual funds or exchange-traded funds (ETFs), futures contracts and losses deferred due to wash sales.
As of period end, the cost and unrealized appreciation (depreciation) in securities, and derivatives if applicable, for federal income tax purposes were as follows for each Fund:
| Tax cost | Gross unrealized appreciation | Gross unrealized depreciation | Net unrealized appreciation (depreciation) | |
| VIP FundsManager 20% Portfolio | $894,466,831 | $10,486,662 | $(44,586,882) | $(34,100,220) |
| VIP FundsManager 50% Portfolio | 5,306,729,754 | 156,265,401 | (487,517,876) | (331,252,475) |
| VIP FundsManager 60% Portfolio | 6,371,524,538 | 225,994,719 | (626,390,771) | (400,396,052) |
| VIP FundsManager 70% Portfolio | 2,020,865,253 | 64,840,246 | (227,157,386) | (162,317,140) |
| VIP FundsManager 85% Portfolio | 746,312,729 | 25,151,058 | (98,203,717) | (73,052,659) |
4. Derivative Instruments.
Risk Exposures and the Use of Derivative Instruments. Investment objectives allow a fund to enter into various types of derivative contracts, including futures contracts. Derivatives are investments whose value is primarily derived from underlying assets, indices or reference rates and may be transacted on an exchange or over-the-counter (OTC). Derivatives may involve a future commitment to buy or sell a specified asset based on specified terms, to exchange future cash flows at periodic intervals based on a notional principal amount, or for one party to make one or more payments upon the occurrence of specified events in exchange for periodic payments from the other party.
Derivatives were used to increase returns and to manage exposure to certain risks as defined below. The success of any strategy involving derivatives depends on analysis of numerous economic factors, and if the strategies for investment do not work as intended, the objectives may not be achieved.
Derivatives were used to increase or decrease exposure to the following risk(s):
| Equity Risk | Equity risk relates to the fluctuations in the value of financial instruments as a result of changes in market prices (other than those arising from interest rate risk or foreign exchange risk), whether caused by factors specific to an individual investment, its issuer, or all factors affecting all instruments traded in a market or market segment. |
Funds are also exposed to additional risks from investing in derivatives, such as liquidity risk and counterparty credit risk. Liquidity risk is the risk that a fund will be unable to close out the derivative in the open market in a timely manner. Counterparty credit risk is the risk that the counterparty will not be able to fulfill its obligation to a fund. Exchange-traded contracts are not covered by the ISDA Master Agreement; however counterparty credit risk related to these contracts may be mitigated by the protection provided by the exchange on which they trade.
Investing in derivatives may involve greater risks than investing in the underlying assets directly and, to varying degrees, may involve risk of loss in excess of any initial investment and collateral received and amounts recognized in the Statement of Assets and Liabilities. In addition, there may be the risk that the change in value of the derivative contract does not correspond to the change in value of the underlying instrument.
Futures Contracts. A futures contract is an agreement between two parties to buy or sell a specified underlying instrument for a fixed price at a specified future date. Futures contracts were used to manage exposure to the stock market.
Upon entering into a futures contract, a fund is required to deposit either cash or securities (initial margin) with a clearing broker in an amount equal to a certain percentage of the face value of the contract. Futures contracts are marked-to-market daily and subsequent daily payments are made or received by a fund depending on the daily fluctuations in the value of the futures contracts and are recorded as unrealized appreciation or (depreciation). This receivable and/or payable, if any, is included in daily variation margin on futures contracts in the Statement of Assets and Liabilities. Realized gain or (loss) is recorded upon the expiration or closing of a futures contract. The net realized gain (loss) and change in net unrealized appreciation (depreciation) on futures contracts during the period is presented in the Statement of Operations.
Any open futures contracts at period end are presented in the Schedule of Investments under the caption "Futures Contracts". The notional amount at value reflects each contract's exposure to the underlying instrument or index at period end, and is representative of volume of activity during the period unless an average notional amount is presented. Any securities deposited to meet initial margin requirements are identified in the Schedule of Investments. Any cash deposited to meet initial margin requirements is presented as segregated cash with brokers for derivative instruments in the Statement of Assets and Liabilities.
5. Purchases and Sales of Investments.
Purchases and sales of securities, other than short-term securities and in-kind transactions, as applicable, are noted in the table below.
| Purchases ($) | Sales ($) | |
| VIP FundsManager 20% Portfolio | 629,002,854 | 465,932,326 |
| VIP FundsManager 50% Portfolio | 2,020,098,873 | 2,021,432,073 |
| VIP FundsManager 60% Portfolio | 2,065,856,102 | 2,092,205,651 |
| VIP FundsManager 70% Portfolio | 476,228,845 | 436,250,433 |
| VIP FundsManager 85% Portfolio | 123,075,541 | 106,354,350 |
6. Fees and Other Transactions with Affiliates.
Management Fee. Fidelity Management & Research Company LLC (the investment adviser) provides the Funds with investment management related services. For these services each Fund pays a monthly management fee to the investment adviser. The management fee is based on an annual rate of .15% of each fund's average net assets. During January 2022 the Board approved a change in the management fee rate from .25% to .15% effective June 1, 2022. For the reporting period, the annualized management fee rate was .23% of each Fund's average net assets. Under the management contract, the investment adviser pays all other fund-level operating expenses, except the compensation of the independent Trustees and certain other expenses such as interest expense. The management fee is reduced by an amount equal to the fees and expenses paid by the Funds to the independent Trustees.
During the period, the investment adviser waived a portion of its management fee as described in the Expense Reductions note.
Distribution and Service Plan Fees. In accordance with Rule 12b-1 of the 1940 Act, the Funds have adopted separate 12b-1 Plans for each Service Class of shares. Each Service Class pays Fidelity Distributors Company LLC (FDC), an affiliate of the investment adviser, a service fee. For the period, the service fee is based on an annual rate of .10% of Service Class' average net assets and .25% of Service Class 2's average net assets.
For the period, total fees, all of which were reallowed to insurance companies for the distribution of shares and providing shareholder support services were as follows:
| Service Class | Service Class 2 | Total | |
| VIP FundsManager 20% Portfolio | $29 | $14,260 | $14,289 |
| VIP FundsManager 50% Portfolio | 28 | 106,208 | 106,236 |
| VIP FundsManager 60% Portfolio | 30,525 | 734,811 | 765,336 |
| VIP FundsManager 70% Portfolio | 33 | 84,970 | 85,003 |
| VIP FundsManager 85% Portfolio | – | 66,160 | 66,160 |
Interfund Trades. Funds may purchase from or sell securities to other Fidelity Funds under procedures adopted by the Board. The procedures have been designed to ensure these interfund trades are executed in accordance with Rule 17a-7 of the 1940 Act. Any interfund trades are included within the respective purchases and sales amounts shown in the Purchases and Sales of Investments note. During the period, there were no interfund trades.
Reallocation of Underlying Fund Investments. During the period, the investment adviser reallocated investments of the Funds. This involved taxable redemptions of the Funds' interest in Fidelity U.S. Bond Index, ("Underlying Fund") for investments and cash and non-taxable exchanges of those investments and cash for shares of VIP Investment Grade Bond Fund II which is affiliated investment company managed by FMR. Net realized gain (loss) on the redemptions of the Underlying Fund in connection with the reallocation is included in the accompanying Statements of Operations as "Net realized gain (loss) on Affiliated issuers."
Details of these transactions with the net related gain (loss) for the Funds are presented in the accompanying table:
| Value of Investments and Cash reallocated ($) | Net realized Gain (Loss) on redemptions of Underlying Fund ($) | |
| VIP FundsManager 20% | $187,389,729 | $(14,920,156) |
| VIP FundsManager 50% | 779,091,389 | (46,361,043) |
| VIP FundsManager 60% | 745,543,252 | (40,143,696) |
| VIP FundsManager 70% | 130,830,130 | (6,126,544) |
| VIP FundsManager 85% | 9,299,799 | (528,879) |
Prior Fiscal Year Reallocation of Underlying Fund Investments. During the prior period, the investment adviser reallocated investments of the Funds. This involved taxable redemptions of each Fund's interest in Fidelity Mega Cap Stock Fund for investments and cash, as shown in the table below.
| Value of investments redeemed from Fidelity Stock Selector All Cap Fund | Shares of Fidelity Stock Selector All Cap Fund sold | Net realized gain on redemptions of Fidelity Stock Selector All Cap Fund | |
| VIP FundsManager 20% | $154,557,290 | 2,245,819 | $53,054,450 |
| VIP FundsManager 50% | 1,988,993,289 | 28,901,385 | 700,418,382 |
| VIP FundsManager 60% | 2,526,923,741 | 36,717,869 | 889,281,531 |
| VIP FundsManager 70% | 888,413,592 | 12,909,236 | 301,748,243 |
| VIP FundsManager 85% | 381,510,492 | 5,543,599 | 128,227,568 |
In addition, each Fund exchanged investments for shares of VIP Stock Selector All Cap Fund, as shown in the table below. Each fund did not recognize any gains or losses for book, or federal income tax, purposes.
| Value of investments delivered to VIP Stock Selector All Cap Fund | Shares of VIP Stock Selector All Cap received | |
| VIP FundsManager 20% | $154,557,290 | 15,455,729 |
| VIP FundsManager 50% | 1,988,993,289 | 198,899,329 |
| VIP FundsManager 60% | 2,526,923,741 | 252,692,374 |
| VIP FundsManager 70% | 888,413,592 | 88,841,359 |
| VIP FundsManager 85% | 381,510,492 | 38,151,049 |
7. Expense Reductions.
The investment adviser contractually agreed to waive each Funds' management fee in an amount equal to .05% of each Funds' average net assets until April 30, 2024. During the period, each Fund's management fees were reduced by the following amounts:
| Management Fee Waiver | |
| VIP FundsManager 20% Portfolio | $232,198 |
| VIP FundsManager 50% Portfolio | $1,355,813 |
| VIP FundsManager 60% Portfolio | $1,638,924 |
| VIP FundsManager 70% Portfolio | $507,214 |
| VIP FundsManager 85% Portfolio | $186,121 |
In addition, FMR has contractually agreed to reimburse 0.10% of class-level expenses for each Fund's Service Class and Service Class 2. During the period, this reimbursement reduced each Fund's Service Class and Service Class 2's expenses by the following amounts:
| Reimbursement |
|
| VIP FundsManager 20% Portfolio | |
| Service Class | $29 |
| Service Class 2 | 5,704 |
| VIP FundsManager 50% Portfolio | |
| Service Class | 28 |
| Service Class 2 | 42,483 |
| VIP FundsManager 60% Portfolio | |
| Service Class | 30,525 |
| Service Class 2 | 293,924 |
| VIP FundsManager 70% Portfolio | |
| Service Class | 33 |
| Service Class 2 | 33,988 |
| VIP FundsManager 85% Portfolio | |
| Service Class | – |
| Service Class 2 | 26,464 |
Through arrangements with each applicable Fund's custodian, credits realized as a result of certain uninvested cash balances were used to reduce each applicable Fund's or class' expenses. All of the applicable expense reductions are noted in the table below.
| Custodian credits | |
| VIP FundsManager 20% Portfolio | $670 |
| VIP FundsManager 50% Portfolio | 1 |
| VIP FundsManager 70% Portfolio | 1 |
| VIP FundsManager 85% Portfolio | 2 |
8. Distributions to Shareholders.
Distributions to shareholders of each class were as follows:
| Six months ended June 30, 2022 | Year ended December 31, 2021 |
|
| VIP FundsManager 20% Portfolio | ||
| Distributions to shareholders | ||
| Service Class | $4,154 | $793 |
| Service Class 2 | 689,140 | 112,260 |
| Investor Class | 64,604,094 | 12,190,509 |
| Total | $65,297,388 | $12,303,562 |
| VIP FundsManager 50% Portfolio | ||
| Distributions to shareholders | ||
| Service Class | $10,353 | $1,880 |
| Service Class 2 | 14,176,394 | 2,882,211 |
| Investor Class | 883,186,368 | 164,119,067 |
| Total | $897,373,115 | $167,003,158 |
| VIP FundsManager 60% Portfolio | ||
| Distributions to shareholders | ||
| Service Class | $9,571,073 | $1,130,612 |
| Service Class 2 | 99,170,612 | 17,246,503 |
| Investor Class | 999,051,068 | 171,792,948 |
| Total | $1,107,792,753 | $190,170,063 |
| VIP FundsManager 70% Portfolio | ||
| Distributions to shareholders | ||
| Service Class | $13,494 | $1,912 |
| Service Class 2 | 12,118,603 | 1,598,471 |
| Investor Class | 345,115,364 | 46,533,341 |
| Total | $357,247,461 | $48,133,724 |
| VIP FundsManager 85% Portfolio | ||
| Distributions to shareholders | ||
| Service Class | $32 | $8 |
| Service Class 2 | 10,454,437 | 1,783,208 |
| Investor Class | 136,703,745 | 23,659,547 |
| Total | $147,158,214 | $25,442,763 |
9. Share Transactions.
Transactions for each class of shares were as follows and may contain in-kind transactions:
| Shares | Shares | Dollars | Dollars | |
| Six months ended June 30, 2022 | Year endedDecember 31, 2021 | Six months ended June 30, 2022 | Year endedDecember 31, 2021 | |
| VIP FundsManager 20% Portfolio | ||||
| Service Class | ||||
| Shares sold | 422 | 528 | $4,632 | $6,363 |
| Reinvestment of distributions | 17 | 2 | 184 | 30 |
| Shares redeemed | (240) | (441) | (2,680) | (5,307) |
| Net increase (decrease) | 199 | 89 | $2,136 | $1,086 |
| Service Class 2 | ||||
| Shares sold | 368,127 | 197,201 | $4,032,645 | $2,382,380 |
| Reinvestment of distributions | 62,535 | 9,310 | 689,140 | 112,260 |
| Shares redeemed | (109,257) | (147,791) | (1,208,560) | (1,775,664) |
| Net increase (decrease) | 321,405 | 58,720 | $3,513,225 | $718,976 |
| Investor Class | ||||
| Shares sold | 2,553,105 | 7,907,223 | $28,151,440 | $95,430,912 |
| Reinvestment of distributions | 5,846,524 | 1,008,393 | 64,604,094 | 12,190,509 |
| Shares redeemed | (7,294,983) | (5,712,453) | (78,305,707) | (68,631,776) |
| Net increase (decrease) | 1,104,646 | 3,203,163 | $14,449,827 | $38,989,645 |
| VIP FundsManager 50% Portfolio | ||||
| Service Class | ||||
| Shares sold | 63 | 47 | $687 | $655 |
| Reinvestment of distributions | 9 | – | 110 | 21 |
| Shares redeemed | (29) | (47) | (346) | (659) |
| Net increase (decrease) | 43 | – | $451 | $17 |
| Service Class 2 | ||||
| Shares sold | 382,081 | 754,694 | $4,432,611 | $10,570,413 |
| Reinvestment of distributions | 1,215,814 | 209,707 | 14,176,394 | 2,882,211 |
| Shares redeemed | (855,846) | (2,862,261) | (9,851,736) | (39,779,129) |
| Net increase (decrease) | 742,049 | (1,897,860) | $8,757,269 | $(26,326,505) |
| Investor Class | ||||
| Shares sold | 2,974,068 | 9,414,923 | $35,651,832 | $132,105,164 |
| Reinvestment of distributions | 75,357,199 | 11,826,378 | 883,186,368 | 164,119,067 |
| Shares redeemed | (22,462,960) | (37,887,366) | (261,351,572) | (531,507,608) |
| Net increase (decrease) | 55,868,307 | (16,646,065) | $657,486,628 | $(235,283,377) |
| VIP FundsManager 60% Portfolio | ||||
| Service Class | ||||
| Shares sold | 2,266,401 | 2,829,775 | $22,388,776 | $33,878,504 |
| Reinvestment of distributions | 962,938 | 94,841 | 9,561,972 | 1,129,035 |
| Shares redeemed | (835,685) | (739,024) | (8,014,945) | (8,866,814) |
| Net increase (decrease) | 2,393,654 | 2,185,592 | $23,935,803 | $26,140,725 |
| Service Class 2 | ||||
| Shares sold | 1,902,970 | 4,373,427 | $19,081,056 | $51,873,871 |
| Reinvestment of distributions | 10,027,362 | 1,477,761 | 99,170,612 | 17,246,502 |
| Shares redeemed | (2,004,496) | (12,025,241) | (19,769,494) | (142,037,016) |
| Net increase (decrease) | 9,925,836 | (6,174,053) | $98,482,174 | $(72,916,643) |
| Investor Class | ||||
| Shares sold | 16,379,116 | 26,302,140 | $163,633,070 | $314,489,507 |
| Reinvestment of distributions | 100,609,372 | 14,595,596 | 999,051,068 | 171,792,948 |
| Shares redeemed | (29,485,322) | (38,628,317) | (287,950,989) | (461,305,320) |
| Net increase (decrease) | 87,503,166 | 2,269,419 | $874,733,149 | $24,977,135 |
| VIP FundsManager 70% Portfolio | ||||
| Service Class | ||||
| Shares sold | 111 | 145 | $1,337 | $2,167 |
| Reinvestment of distributions | 8 | 1 | 98 | 15 |
| Shares redeemed | (105) | (138) | (1,343) | (2,034) |
| Net increase (decrease) | 14 | 8 | $92 | $148 |
| Service Class 2 | ||||
| Shares sold | 213,882 | 369,661 | $2,606,960 | $5,425,100 |
| Reinvestment of distributions | 991,702 | 110,090 | 12,118,603 | 1,598,471 |
| Shares redeemed | (294,292) | (452,745) | (3,505,749) | (6,727,459) |
| Net increase (decrease) | 911,292 | 27,006 | $11,219,814 | $296,112 |
| Investor Class | ||||
| Shares sold | 4,207,152 | 10,385,377 | $52,575,806 | $154,631,206 |
| Reinvestment of distributions | 28,058,160 | 3,171,428 | 345,115,364 | 46,533,341 |
| Shares redeemed | (3,527,052) | (3,411,456) | (42,606,135) | (50,362,891) |
| Net increase (decrease) | 28,738,260 | 10,145,349 | $355,085,035 | $150,801,656 |
| VIP FundsManager 85% Portfolio | ||||
| Service Class | ||||
| Shares sold | 56 | 103 | $678 | $1,532 |
| Reinvestment of distributions | 3 | 1 | 32 | 9 |
| Shares redeemed | (47) | (90) | (600) | (1,328) |
| Net increase (decrease) | 12 | 14 | $110 | $213 |
| Service Class 2 | ||||
| Shares sold | 275,023 | 411,538 | $3,246,037 | $6,091,662 |
| Reinvestment of distributions | 871,930 | 122,405 | 10,454,437 | 1,783,208 |
| Shares redeemed | (183,494) | (340,453) | (2,197,748) | (5,034,374) |
| Net increase (decrease) | 963,459 | 193,490 | $11,502,726 | $2,840,496 |
| Investor Class | ||||
| Shares sold | 2,232,747 | 4,272,678 | $28,537,088 | $64,168,756 |
| Reinvestment of distributions | 11,288,501 | 1,605,393 | 136,703,745 | 23,659,547 |
| Shares redeemed | (1,362,807) | (2,414,817) | (16,129,235) | (36,189,157) |
| Net increase (decrease) | 12,158,441 | 3,463,254 | $149,111,598 | $51,639,146 |
10. Other.
A fund's organizational documents provide former and current trustees and officers with a limited indemnification against liabilities arising in connection with the performance of their duties to the fund. In the normal course of business, a fund may also enter into contracts that provide general indemnifications. A fund's maximum exposure under these arrangements is unknown as this would be dependent on future claims that may be made against a fund. The risk of material loss from such claims is considered remote.
Funds do not invest in underlying mutual funds for the purpose of exercising management or control; however, investments by funds within their principal investment strategies may represent a significant portion of the underlying mutual fund's net assets. At the end of the period, certain Funds were the owners of record of 10% or more of the total outstanding shares of the following underlying mutual funds as shown below.
| Fund | VIP FundsManager 50% Portfolio | VIP FundsManager 60% Portfolio | VIP FundsManager 70% Portfolio |
| Fidelity Commodity Strategy Fund | 40% | 36% | 13% |
| Fidelity Emerging Markets Discovery Fund | 11% | 10% | – |
| Fidelity International Value Fund | – | 10% | – |
| Fidelity U.S. Low Volatility Equity Fund | 29% | 42% | 14% |
| VIP Investment Grade Bond Portfolio II | 29% | 28% | – |
| VIP Stock Selector All Cap Portfolio | 34% | 41% | 15% |
The Funds, in aggregate, were the owners of record of more than 20% of the total outstanding shares of the following underlying mutual funds.
| Fund | % of shares held |
| Fidelity Commodity Strategy Fund | 99% |
| Fidelity Emerging Markets Discovery Fund | 27% |
| Fidelity International Value Fund | 22% |
| Fidelity Japan Smaller Companies Fund | 24% |
| Fidelity U.S. Low Volatility Equity Fund | 92% |
| VIP Investment Grade Bond Portfolio II | 70% |
| VIP Stock Selector All Cap Portfolio | 99% |
In addition, at the end of the period the investment adviser or its affiliates were owners of record of more than 10%, respectively, of the outstanding shares of the following Funds:
| Affiliated % | Number of Unaffiliated Shareholders | Unaffiliated Shareholders % | |
| VIP FundsManager 20% Portfolio | 99% | – | – |
| VIP FundsManager 50% Portfolio | 37% | 1 | 57% |
| VIP FundsManager 60% Portfolio | 35% | 2 | 43% |
| VIP FundsManager 70% Portfolio | 97% | – | – |
| VIP FundsManager 85% Portfolio | 93% | – | – |
11. Coronavirus (COVID-19) Pandemic.
An outbreak of COVID-19 first detected in China during December 2019 has since spread globally and was declared a pandemic by the World Health Organization during March 2020. Developments that disrupt global economies and financial markets, such as the COVID-19 pandemic, may magnify factors that affect the Funds' performance.
Shareholder Expense Example
As a shareholder, you incur two types of costs: (1) transaction costs, which may include sales charges (loads) on purchase payments or redemption proceeds, as applicable and (2) ongoing costs, which generally include management fees, distribution and/or service (12b-1) fees and other Fund expenses. This Example is intended to help you understand your ongoing costs (in dollars) of investing in a fund and to compare these costs with the ongoing costs of investing in other mutual funds.
The Example is based on an investment of $1,000 invested at the beginning of the period and held for the entire period (January 1, 2022 to June 30, 2022).
Actual Expenses
The first line of the accompanying table provides information about actual account values and actual expenses. You may use the information in this line, together with the amount you invested, to estimate the expenses that you paid over the period. Simply divide your account value by $1,000.00 (for example, an $8,600 account value divided by $1,000.00 = 8.6), then multiply the result by the number in the first line for a class/Fund under the heading entitled "Expenses Paid During Period" to estimate the expenses you paid on your account during this period. If any fund is a shareholder of any underlying mutual funds or exchange-traded funds (ETFs) (the Underlying Funds), such fund indirectly bears its proportional share of the expenses of the Underlying Funds in addition to the direct expenses incurred presented in the table. These fees and expenses are not included in the annualized expense ratio used to calculate the expense estimate in the table below. The estimate of expenses does not include any fees or other expenses of any variable annuity or variable life insurance product. If they were, the estimate of expenses you paid during the period would be higher, and your ending account value would be lower.
Hypothetical Example for Comparison Purposes
The second line of the accompanying table provides information about hypothetical account values and hypothetical expenses based on the actual expense ratio and an assumed rate of return of 5% per year before expenses, which is not the actual return. The hypothetical account values and expenses may not be used to estimate the actual ending account balance or expenses you paid for the period. You may use this information to compare the ongoing costs of investing in the Fund and other funds. To do so, compare this 5% hypothetical example with the 5% hypothetical examples that appear in the shareholder reports of the other funds. If any fund is a shareholder of any Underlying Funds, such fund indirectly bears its proportional share of the expenses of the Underlying Funds in addition to the direct expenses as presented in the table. These fees and expenses are not included in the annualized expense ratio used to calculate the expense estimate in the table below. The estimate of expenses does not include any fees or other expenses of any variable annuity or variable life insurance product. If they were, the estimate of expenses you paid during the period would be higher, and your ending account value would be lower.
Please note that the expenses shown in the table are meant to highlight your ongoing costs only and do not reflect any transaction costs. Therefore, the second line of the table is useful in comparing ongoing costs only, and will not help you determine the relative total costs of owning different funds. In addition, if these transactional costs were included, your costs would have been higher.
| Annualized Expense Ratio-A | Beginning Account Value January 1, 2022 | Ending Account Value June 30, 2022 | Expenses Paid During Period-B January 1, 2022 to June 30, 2022 |
|
| VIP FundsManager 20% Portfolio | ||||
| Service Class | .18% | |||
| Actual | $1,000.00 | $903.90 | $.85 -C | |
| Hypothetical-D | $1,000.00 | $1,023.90 | $.90-C | |
| Service Class 2 | .33% | |||
| Actual | $1,000.00 | $903.50 | $1.56-C | |
| Hypothetical-D | $1,000.00 | $1,023.16 | $1.66-C | |
| Investor Class | .18% | |||
| Actual | $1,000.00 | $903.80 | $.85-C | |
| Hypothetical-D | $1,000.00 | $1,023.90 | $.90-C | |
| VIP FundsManager 50% Portfolio | ||||
| Service Class | .18% | |||
| Actual | $1,000.00 | $850.90 | $.83-C | |
| Hypothetical-D | $1,000.00 | $1,023.90 | $.90-C | |
| Service Class 2 | .34% | |||
| Actual | $1,000.00 | $850.20 | $1.56-C | |
| Hypothetical-D | $1,000.00 | $1,023.11 | $1.71-C | |
| Investor Class | .18% | |||
| Actual | $1,000.00 | $850.60 | $.83-C | |
| Hypothetical-D | $1,000.00 | $1,023.90 | $.90-C | |
| VIP FundsManager 60% Portfolio | ||||
| Service Class | .18% | |||
| Actual | $1,000.00 | $835.60 | $.82-C | |
| Hypothetical-D | $1,000.00 | $1,023.90 | $.90-C | |
| Service Class 2 | .33% | |||
| Actual | $1,000.00 | $835.00 | $1.50-C | |
| Hypothetical-D | $1,000.00 | $1,023.16 | $1.66-C | |
| Investor Class | .18% | |||
| Actual | $1,000.00 | $835.60 | $.82-C | |
| Hypothetical-D | $1,000.00 | $1,023.90 | $.90-C | |
| VIP FundsManager 70% Portfolio | ||||
| Service Class | .18% | |||
| Actual | $1,000.00 | $825.30 | $.81-C | |
| Hypothetical-D | $1,000.00 | $1,023.90 | $.90-C | |
| Service Class 2 | .33% | |||
| Actual | $1,000.00 | $824.30 | $1.49-C | |
| Hypothetical-D | $1,000.00 | $1,023.16 | $1.66-C | |
| Investor Class | .18% | |||
| Actual | $1,000.00 | $825.10 | $.81-C | |
| Hypothetical-D | $1,000.00 | $1,023.90 | $.90-C | |
| VIP FundsManager 85% Portfolio | ||||
| Service Class | .18% | |||
| Actual | $1,000.00 | $805.90 | $.81-C | |
| Hypothetical-D | $1,000.00 | $1,023.90 | $.90-C | |
| Service Class 2 | .33% | |||
| Actual | $1,000.00 | $805.80 | $1.48-C | |
| Hypothetical-D | $1,000.00 | $1,023.16 | $1.66-C | |
| Investor Class | .18% | |||
| Actual | $1,000.00 | $806.00 | $.81-C | |
| Hypothetical-D | $1,000.00 | $1,023.90 | $.90-C |
A Annualized expense ratio reflects expenses net of applicable fee waivers.
B Expenses are equal to the annualized expense ratio, multiplied by the average account value over the period, multiplied by 181/ 365 (to reflect the one-half year period). The fees and expenses of any Underlying Funds are not included in each annualized expense ratio.
C If fees and changes to the expense contract and/ or expense cap, effective June 1, 2022, had been in effect during the entire current period, the restated annualized expense ratio and the expenses paid in the actual and hypothetical examples above would be as shown in table below:
D 5% return per year before expenses
| Annualized Expense Ratio-(a)
| Expenses Paid |
|
| VIP FundsManager 20% Portfolio | ||
| Service Class | .10% | |
| Actual | $.47 | |
| Hypothetical-(b) | $.50 | |
| Service Class 2 | .25% | |
| Actual | $1.18 | |
| Hypothetical-(b) | $1.25 | |
| Investor Class | .10% | |
| Actual | $.47 | |
| Hypothetical-(b) | $.50 | |
| VIP FundsManager 50% Portfolio | ||
| Service Class | .10% | |
| Actual | $.46 | |
| Hypothetical-(b) | $.50 | |
| Service Class 2 | .26% | |
| Actual | $1.19 | |
| Hypothetical-(b) | $1.30 | |
| Investor Class | .10% | |
| Actual | $.46 | |
| Hypothetical-(b) | $.50 | |
| VIP FundsManager 60% Portfolio | ||
| Service Class | .10% | |
| Actual | $.46 | |
| Hypothetical-(b) | $.50 | |
| Service Class 2 | .25% | |
| Actual | $1.14 | |
| Hypothetical-(b) | $1.25 | |
| Investor Class | .10% | |
| Actual | $.46 | |
| Hypothetical-(b) | $.50 | |
| VIP FundsManager 70% Portfolio | ||
| Service Class | .10% | |
| Actual | $.45 | |
| Hypothetical-(b) | $.50 | |
| Service Class 2 | .25% | |
| Actual | $1.13 | |
| Hypothetical-(b) | $1.25 | |
| Investor Class | .10% | |
| Actual | $.45 | |
| Hypothetical-(b) | $.50 | |
| VIP FundsManager 85% Portfolio | ||
| Service Class | .10% | |
| Actual | $.45 | |
| Hypothetical-(b) | $.50 | |
| Service Class 2 | .25% | |
| Actual | $1.12 | |
| Hypothetical-(b) | $1.25 | |
| Investor Class | .10% | |
| Actual | $.45 | |
| Hypothetical-(b) | $.50 | |
(a) Annualized expense ratio reflects expenses net of applicable fee waivers.
(b) 5% return per year before expenses
Board Approval of Investment Advisory Contracts and Management Fees
VIP FundsManager Portfolios
At its May 2022 meeting the Board of Trustees, including the Independent Trustees (together, the Board), voted to approve an amended and restated management contract (the Amended Contract) for the funds to decrease the management fees paid to Fidelity Management & Research Company LLC (FMR), the funds' investment adviser, by 10 basis points, effective June 1, 2022. The Board, assisted by the advice of fund counsel and Independent Trustees' counsel, considered a broad range of information. Nature, Extent, and Quality of Services Provided. The Board previously received and considered materials relating to the nature, extent and quality of services provided by FMR to the funds, including the resources dedicated to investment management and support services, shareholder and administrative services, the benefits to shareholders of investment in a large fund family, and the investment performance of the funds in connection with the annual renewal of the funds' current management contracts. At its September 2021 meeting, the Board concluded that the nature, extent and quality of the services provided to the funds under the existing management contract should continue to benefit each fund's shareholders. In connection with its approval of the Amended Contract at its May 2022 meeting, the Board noted that such approval would not change the funds' portfolio managers, the investment processes, the level or nature of services provided, the resources and personnel allocated or trading and compliance operations. The Board concluded that the nature, extent, and quality of services to be provided to the funds under the Amended Contract will continue to benefit the funds' shareholders. Competitiveness of Management Fee and Total Expense Ratio. The Board considered that it received and reviewed information regarding the funds' management fee rate and total expense ratio compared to "mapped groups" of competitive funds and classes at the current management fee and expense levels in connection with the annual renewal of the management contract. Based on its review, the Board concluded at its September 2021 meeting that each fund's current management fee and total expenses are fair and reasonable in light of the services that each fund receives and the other factors considered. In its review of the proposed management fee rate under the Amended Contract, the Board considered that the proposed fee rate is lower by 10 basis points than the current management fee rate. The Board also considered that FMR will retain its obligation to pay fund-level operating expenses, with certain limited exceptions, under the management contract and that FMR also will continue to waive 0.05% of its management fee until April 30, 2024. Based on its review, the Board concluded that the management fee and the total expense ratio of each class of each fund continue to be fair and reasonable in light of the services that each fund receives and the other factors considered. Costs of the Services and Profitability. The Board considered that it previously reviewed information regarding the revenues earned, the expenses incurred by FMR in providing services to each fund and the level of FMR's profitability. At its September 2021 meeting, the Board concluded that it was satisfied that the profitability of FMR in connection with the operation of each fund was not excessive. Because the Board was approving an arrangement under which the management fees were being reduced, the Board did not consider FMR's costs of services, revenues, or profitability to be significant factors in its decision to approve the Amended Contract. Economies of Scale. The Board considered that it previously received and reviewed information regarding whether there have been economies of scale in respect of the management of the Fidelity funds, whether the Fidelity funds (including the funds) have appropriately benefited from any such economies of scale, and whether there is a potential realization of any further economies of scale and that it concluded, at its September 2021 meeting, that economies of scale, if any, are being appropriately shared between fund shareholders and Fidelity. In connection with the approval of each fund's Amended Contract, the Board did not consider economies of scale because the proposed fee arrangement lowers each fund's management fee and FMR will continue to contractually limit expenses. The Board will continue to review economies of scale in connection with future renewals of the Amended Contract.Based on its evaluation of all of the conclusions noted above, and after considering all factors it believed relevant, the Board ultimately concluded that the advisory fee structures are fair and reasonable, and that each fund's Amended Contract should be ratified and approved.Liquidity Risk Management Program
The Securities and Exchange Commission adopted Rule 22e-4 under the Investment Company Act of 1940 (the Liquidity Rule) to promote effective liquidity risk management throughout the open-end investment company industry, thereby reducing the risk that funds will be unable to meet their redemption obligations and mitigating dilution of the interests of fund shareholders.
The Funds have adopted and implemented a liquidity risk management program pursuant to the Liquidity Rule (the Program) effective December 1, 2018. The Program is reasonably designed to assess and manage each Fund’s liquidity risk and to comply with the requirements of the Liquidity Rule. Each Fund’s Board of Trustees (the Board) has designated each Fund’s investment adviser as administrator of the Program. The Fidelity advisers have established a Liquidity Risk Management Committee (the LRM Committee) to manage the Program for each of the Fidelity Funds. The LRM Committee monitors the adequacy and effectiveness of implementation of the Program and on a periodic basis assesses each Fund’s liquidity risk based on a variety of factors including (1) the Fund’s investment strategy, (2) portfolio liquidity and cash flow projections during normal and reasonably foreseeable stressed conditions, (3) shareholder redemptions, (4) borrowings and other funding sources and (5) in the case of exchange-traded funds, certain additional factors including the effect of the Fund’s prices and spreads, market participants, and basket compositions on the overall liquidity of the Fund’s portfolio, as applicable.
In accordance with the Program, each of the Fund’s portfolio investments is classified into one of four liquidity categories described below based on a determination of a reasonable expectation for how long it would take to convert the investment to cash (or sell or dispose of the investment) without significantly changing its market value.
- Highly liquid investments – cash or convertible to cash within three business days or less
- Moderately liquid investments – convertible to cash in three to seven calendar days
- Less liquid investments – can be sold or disposed of, but not settled, within seven calendar days
- Illiquid investments – cannot be sold or disposed of within seven calendar days
Liquidity classification determinations take into account a variety of factors including various market, trading and investment-specific considerations, as well as market depth, and generally utilize analysis from a third-party liquidity metrics service.
The Liquidity Rule places a 15% limit on a fund’s illiquid investments and requires funds that do not primarily hold assets that are highly liquid investments to determine and maintain a minimum percentage of the fund’s net assets to be invested in highly liquid investments (highly liquid investment minimum or HLIM). The Program includes provisions reasonably designed to comply with the 15% limit on illiquid investments and for determining, periodically reviewing and complying with the HLIM requirement as applicable.
At a recent meeting of the Fund’s Board of Trustees, the LRM Committee provided a written report to the Board pertaining to the operation, adequacy, and effectiveness of implementation of the Program for the annual period from December 1, 2020 through November 30, 2021. The report concluded that the Program has been implemented and is operating effectively and is reasonably designed to assess and manage the Fund’s liquidity risk.
![]()
VIPFM-SANN-0822
1.833444.116
Fidelity® Variable Insurance Products:
Government Money Market Portfolio
Semi-Annual Report
June 30, 2022
Contents
To view a fund's proxy voting guidelines and proxy voting record for the 12-month period ended June 30, visit http://www.fidelity.com/proxyvotingresults or visit the Securities and Exchange Commission's (SEC) web site at http://www.sec.gov.
You may also call 1-877-208-0098 to request a free copy of the proxy voting guidelines.
Fidelity® Variable Insurance Products are separate account options which are purchased through a variable insurance contract.
Standard & Poor's, S&P and S&P 500 are registered service marks of The McGraw-Hill Companies, Inc. and have been licensed for use by Fidelity Distributors Corporation.
Other third-party marks appearing herein are the property of their respective owners.
All other marks appearing herein are registered or unregistered trademarks or service marks of FMR LLC or an affiliated company. © 2022 FMR LLC. All rights reserved.
This report and the financial statements contained herein are submitted for the general information of the shareholders of the Fund. This report is not authorized for distribution to prospective investors in the Fund unless preceded or accompanied by an effective prospectus.
A fund files its complete schedule of portfolio holdings with the SEC for the first and third quarters of each fiscal year on Form N-PORT. Forms N-PORT are available on the SEC’s web site at http://www.sec.gov. A fund's Forms N-PORT may be reviewed and copied at the SEC’s Public Reference Room in Washington, DC. Information regarding the operation of the SEC's Public Reference Room may be obtained by calling 1-800-SEC-0330.
For a complete list of a fund's portfolio holdings, view the most recent holdings listing, semiannual report, or annual report on Fidelity's web site at http://www.fidelity.com, http://www.institutional.fidelity.com, or http://www.401k.com, as applicable.
NOT FDIC INSURED •MAY LOSE VALUE •NO BANK GUARANTEE
Neither the Fund nor Fidelity Distributors Corporation is a bank.
Note to Shareholders:
Early in 2020, the outbreak and spread of COVID-19 emerged as a public health emergency that had a major influence on financial markets, primarily based on its impact on the global economy and corporate earnings. On March 11, 2020, the World Health Organization declared the COVID-19 outbreak a pandemic, citing sustained risk of further global spread. The pandemic prompted a number of measures to limit the spread of COVID-19, including travel and border restrictions, quarantines, and restrictions on large gatherings. In turn, these resulted in lower consumer activity, diminished demand for a wide range of products and services, disruption in manufacturing and supply chains, and – given the wide variability in outcomes regarding the outbreak – significant market uncertainty and volatility. To help stem the turmoil, the U.S. government took unprecedented action – in concert with the U.S. Federal Reserve and central banks around the world – to help support consumers, businesses, and the broader economy, and to limit disruption to the financial system.
In general, the overall impact of the pandemic lessened in 2021, amid a resilient economy and widespread distribution of three COVID-19 vaccines granted emergency use authorization from the U.S. Food and Drug Administration (FDA) early in the year. Still, the situation remains dynamic, and the extent and duration of its influence on financial markets and the economy is highly uncertain, due in part to a recent spike in cases based on highly contagious variants of the coronavirus.
Extreme events such as the COVID-19 crisis are exogenous shocks that can have significant adverse effects on mutual funds and their investments. Although multiple asset classes may be affected by market disruption, the duration and impact may not be the same for all types of assets. Fidelity is committed to helping you stay informed amid news about COVID-19 and during increased market volatility, and we continue to take extra steps to be responsive to customer needs. We encourage you to visit us online, where we offer ongoing updates, commentary, and analysis on the markets and our funds.
Investment Summary/Performance (Unaudited)
Effective Maturity Diversification
| Days | % of fund's investments 6/30/22 |
| 1 - 7 | 83.5 |
| 8 - 30 | 3.0 |
| 31 - 60 | 3.4 |
| 61 - 90 | 3.6 |
| 91 - 180 | 4.6 |
| > 180 | 1.9 |
Effective maturity is determined in accordance with the requirements of Rule 2a-7 under the Investment Company Act of 1940.
Asset Allocation (% of fund's net assets)
| As of June 30, 2022 | ||
| U.S. Treasury Debt | 17.1% | |
| U.S. Government Agency Debt | 5.6% | |
| Repurchase Agreements | 77.2% | |
| Net Other Assets (Liabilities) | 0.1% | |

Current 7-Day Yields
| 6/30/22 | |
| Initial Class | 1.18% |
| Service Class | 1.08% |
| Service Class 2 | 0.93% |
| Investor Class | 1.16% |
Yield refers to the income paid by the Fund over a given period. Yield for money market funds is usually for seven-day periods, as it is here, though it is expressed as an annual percentage rate. Past performance is no guarantee of future results. Yield will vary and it's possible to lose money investing in the Fund.
Schedule of Investments June 30, 2022 (Unaudited)
Showing Percentage of Net Assets
| U.S. Treasury Debt - 17.1% | ||||
| Yield(a) | Principal Amount | Value | ||
| U.S. Treasury Inflation Protected Obligations - 0.1% | ||||
| U.S. Treasury Notes | ||||
| 7/15/22 | 0.37 to 1.10% | $3,771,600 | $3,785,466 | |
| U.S. Treasury Obligations - 17.0% | ||||
| U.S. Treasury Bills | ||||
| 7/12/22 to 1/26/23 | 0.08 to 2.53 | 448,800,000 | 446,580,121 | |
| U.S. Treasury Notes | ||||
| 7/15/22 to 1/31/24 | 0.07 to 2.18 (b) | 598,609,000 | 599,088,569 | |
| 1,045,668,690 | ||||
| TOTAL U.S. TREASURY DEBT | ||||
| (Cost $1,049,454,156) | 1,049,454,156 | |||
| U.S. Government Agency Debt - 5.6% | ||||
| Federal Agencies - 5.6% | ||||
| Fannie Mae | ||||
| 7/6/22 to 7/29/22 | 1.63 to 1.70 (b)(c) | 9,588,000 | 9,588,000 | |
| Federal Farm Credit Bank | ||||
| 7/29/22 to 6/7/23 | 0.11 to 2.59 (b) | 12,000,000 | 11,997,429 | |
| Federal Home Loan Bank | ||||
| 7/1/22 to 9/1/23 | 0.10 to 1.68 (b) | 285,152,000 | 284,994,392 | |
| Federal Home Loan Bank | ||||
| 3/30/23 | 1.02 (d) | 9,000,000 | 9,000,000 | |
| Freddie Mac | ||||
| 7/29/22 to 9/9/22 | 1.61 to 1.61 (b)(c) | 30,000,000 | 30,000,000 | |
| TOTAL U.S. GOVERNMENT AGENCY DEBT | ||||
| (Cost $345,579,821) | 345,579,821 |
| U.S. Government Agency Repurchase Agreement - 8.0% | |||
| Maturity Amount | Value | ||
| In a joint trading account at 1.55% dated 6/30/22 due 7/1/22 (Collateralized by (U.S. Government Obligations)) # | $196,909,499 | $196,901,000 | |
| With: | |||
| ABN AMRO Bank NV at 1.55%, dated 6/30/22 due 7/1/22 (Collateralized by U.S. Government Obligations valued at $14,280,615, 2.00% - 4.50%, 5/1/40 - 12/1/51) | 14,000,603 | 14,000,000 | |
| BMO Harris Bank NA at 1.55%, dated 6/16/22 due 7/7/22 (Collateralized by U.S. Government Obligations valued at $3,061,976, 2.13% - 4.50%, 3/1/30 - 6/1/52) | 3,005,425 | 3,000,000 | |
| BNP Paribas, SA at: | |||
| 1.34%, dated 5/5/22 due 7/7/22 (Collateralized by U.S. Treasury Obligations valued at $15,481,364, 0.00% - 6.50%, 5/5/23 - 3/1/52) | 15,069,233 | 15,000,000 | |
| 1.45%, dated 5/24/22 due 7/7/22 (Collateralized by U.S. Government Obligations valued at $2,043,153, 1.50% - 4.50%, 10/1/36 - 3/1/52) | 2,010,069 | 2,000,000 | |
| CIBC Bank U.S.A. at: | |||
| 0.35%, dated 1/25/22 due 7/5/22 (Collateralized by U.S. Government Obligations valued at $1,021,557, 2.00% - 4.50%, 8/1/23 - 5/1/58) | 1,001,565 | 1,000,000 | |
| 0.38%, dated 1/25/22 due 7/7/22 (Collateralized by U.S. Government Obligations valued at $1,021,690, 2.00% - 4.00%, 8/1/23 - 4/1/52) | 1,001,794 | 1,000,000 | |
| 1.55%, dated 6/16/22 due 7/7/22 (Collateralized by U.S. Government Obligations valued at $12,247,905, 0.00% - 6.50%, 1/4/27 - 5/1/52) | 12,021,700 | 12,000,000 | |
| 1.61%, dated 6/16/22 due 7/28/22 (Collateralized by U.S. Government Obligations valued at $2,043,059, 2.50% - 4.50%, 2/1/31 - 4/1/52) | 2,003,757 | 2,000,000 | |
| Citibank NA at 1.56%, dated 6/30/22 due 7/7/22: | |||
| (Collateralized by U.S. Treasury Obligations valued at $3,060,134, 2.38% - 4.25%, 2/15/29 - 9/15/65) | 3,000,910 | 3,000,000 | |
| (Collateralized by U.S. Treasury Obligations valued at $15,409,275, 0.25% - 6.25%, 7/13/23 - 9/15/65) | 15,004,550 | 15,000,000 | |
| Citigroup Global Capital Markets, Inc. at 1.56%, dated 6/30/22 due 7/7/22 (Collateralized by U.S. Government Obligations valued at $10,200,915, 2.61% - 3.50%, 3/20/72 - 5/20/72) | 10,003,033 | 10,000,000 | |
| Deutsche Bank AG, New York at: | |||
| 1.55%, dated 6/30/22 due 7/1/22 (Collateralized by U.S. Government Obligations valued at $2,060,089, 3.75%, 11/15/46) | 2,000,086 | 2,000,000 | |
| 1.56%, dated 6/30/22 due 7/7/22 (Collateralized by U.S. Government Obligations valued at $5,150,223, 3.75%, 11/15/46) | 5,001,512 | 5,000,000 | |
| Deutsche Bank Securities, Inc. at 1.55%, dated 6/30/22 due 7/1/22 (Collateralized by U.S. Government Obligations valued at $10,200,440, 2.50% - 3.50%, 1/1/52 - 3/1/52) | 10,000,431 | 10,000,000 | |
| Goldman Sachs & Co. at 1.55%, dated 6/30/22 due 7/7/22 (Collateralized by U.S. Government Obligations valued at $40,801,757, 4.00%, 2/20/49) | 40,012,056 | 40,000,000 | |
| ING Financial Markets LLC at 1.78%, dated 6/24/22 due 8/9/22 (Collateralized by U.S. Government Obligations valued at $2,040,706, 3.50%, 10/1/42) | 2,004,549 | 2,000,000 | |
| Mitsubishi UFJ Securities (U.S.A.), Inc. at 1.58%, dated 6/16/22 due 8/15/22 (Collateralized by U.S. Government Obligations valued at $7,144,701, 2.00% - 4.50%, 3/1/27 - 6/1/52) | 7,018,433 | 7,000,000 | |
| Morgan Stanley & Co., LLC at 1.55%, dated 6/30/22 due 7/1/22 (Collateralized by U.S. Government Obligations valued at $2,040,088, 2.50% - 6.00%, 2/1/37 - 9/1/50) | 2,000,086 | 2,000,000 | |
| MUFG Securities (Canada), Ltd. at 1.58%, dated 6/28/22 due 7/28/22 (Collateralized by U.S. Government Obligations valued at $10,201,343, 3.50% - 4.50%, 3/1/44 - 1/1/47) | 10,013,167 | 10,000,000 | |
| RBC Dominion Securities at 1.56%, dated 6/30/22 due 7/5/22 (Collateralized by U.S. Treasury Obligations valued at $28,572,593, 0.00% - 6.13%, 4/15/23 - 4/20/52) | 28,006,047 | 28,000,000 | |
| RBC Financial Group at: | |||
| 1.04%, dated 4/29/22 due 7/7/22 (Collateralized by U.S. Government Obligations valued at $48,027,251, 2.50% - 5.00%, 2/15/24 - 3/1/52) | 47,127,631 | 47,000,000 | |
| 1.28%, dated 5/6/22 due 7/7/22 (Collateralized by U.S. Government Obligations valued at $33,727,290, 0.00% - 7.50%, 8/15/22 - 1/1/58) | 33,138,453 | 33,000,000 | |
| 1.55%, dated 5/12/22 due 7/7/22 (Collateralized by U.S. Government Obligations valued at $5,107,098, 1.50% - 5.00%, 2/15/24 - 1/1/58)(b)(c)(e) | 5,040,127 | 5,000,000 | |
| TD Securities (U.S.A.) at 1.55%, dated 6/30/22 due 7/1/22 (Collateralized by U.S. Government Obligations valued at $24,481,054, 3.00% - 4.00%, 6/1/50 - 5/1/52) | 24,001,033 | 24,000,000 | |
| TOTAL U.S. GOVERNMENT AGENCY REPURCHASE AGREEMENT | |||
| (Cost $489,901,000) | 489,901,000 | ||
| U.S. Treasury Repurchase Agreement - 69.2% | |||
| With: | |||
| ABN AMRO Bank NV at 1.55%, dated 6/30/22 due 7/1/22 (Collateralized by U.S. Treasury Obligations valued at $6,120,333, 0.75% - 2.75%, 3/31/26 - 5/31/29) | 6,000,258 | 6,000,000 | |
| Barclays Bank PLC at 1.55%, dated 6/30/22 due 7/1/22 (Collateralized by U.S. Treasury Obligations valued at $6,120,265, 2.00%, 11/15/26) | 6,000,258 | 6,000,000 | |
| BNP Paribas, SA at: | |||
| 0.97%, dated 5/2/22 due 7/5/22 (Collateralized by U.S. Treasury Obligations valued at $24,519,646, 1.81% - 2.00%, 7/31/22 - 11/15/41) | 24,041,387 | 24,000,000 | |
| 1.06%, dated: | |||
| 4/29/22 due 7/7/22 (Collateralized by U.S. Treasury Obligations valued at $33,007,107, 0.13% - 4.25%, 7/15/23 - 5/15/49) | 32,085,338 | 32,000,000 | |
| 5/16/22 due 7/7/22 (Collateralized by U.S. Treasury Obligations valued at $16,359,208, 0.13% - 2.75%, 7/31/22 - 11/15/51) | 16,029,680 | 16,000,000 | |
| 1.17%, dated 5/10/22 due 7/7/22 (Collateralized by U.S. Treasury Obligations valued at $4,086,927, 1.25% - 3.00%, 3/31/28 - 11/15/47) | 4,011,960 | 4,000,000 | |
| 1.18%, dated 5/9/22 due 7/7/22 (Collateralized by U.S. Treasury Obligations valued at $23,500,767, 1.00% - 3.25%, 2/15/27 - 5/15/50) | 23,069,358 | 23,000,000 | |
| 1.19%, dated 5/12/22 due 7/7/22 (Collateralized by U.S. Treasury Obligations valued at $9,236,637, 0.50% - 4.25%, 7/31/22 - 8/15/51) | 9,027,370 | 9,000,000 | |
| 1.33%, dated 5/5/22 due 7/7/22 (Collateralized by U.S. Treasury Obligations valued at $26,575,913, 0.50% - 6.75%, 1/31/24 - 11/15/50) | 26,119,109 | 26,000,000 | |
| 1.35%, dated: | |||
| 5/10/22 due 7/7/22 (Collateralized by U.S. Treasury Obligations valued at $25,549,565, 0.38% - 4.25%, 1/31/23 - 11/15/50) | 25,116,753 | 25,000,000 | |
| 5/11/22 due 7/7/22 (Collateralized by U.S. Treasury Obligations valued at $9,287,751, 1.63%, 11/15/50) | 9,041,850 | 9,000,000 | |
| 1.36%, dated 5/13/22 due 7/7/22 (Collateralized by U.S. Treasury Obligations valued at $26,775,820, 0.38% - 6.38%, 7/31/22 - 11/15/51) | 26,120,813 | 26,000,000 | |
| 1.41%, dated 5/17/22 due 7/7/22 (Collateralized by U.S. Treasury Obligations valued at $9,196,179, 0.25% - 6.63%, 2/29/24 - 8/15/50) | 9,043,906 | 9,000,000 | |
| 1.57%, dated 5/25/22 due 7/7/22 (Collateralized by U.S. Treasury Obligations valued at $2,043,294, 0.50% - 3.25%, 8/31/27 - 5/15/42) | 2,013,303 | 2,000,000 | |
| CIBC Bank U.S.A. at 0.36%, dated 1/18/22 due 7/7/22 (Collateralized by U.S. Treasury Obligations valued at $4,087,415, 0.13% - 3.00%, 5/15/23 - 8/15/50) | 4,007,560 | 4,000,000 | |
| Citigroup Global Capital Markets, Inc. at 1.55%, dated 6/16/22 due 7/7/22 (Collateralized by U.S. Treasury Obligations valued at $13,332,149, 1.88% - 3.25%, 6/30/24 - 5/15/52) | 13,023,508 | 13,000,000 | |
| Commerz Markets LLC at 1.55%, dated: | |||
| 6/29/22 due 7/6/22 (Collateralized by U.S. Treasury Obligations valued at $15,301,348, 0.25% - 2.75%, 5/15/24 - 5/31/29) | 15,004,521 | 15,000,000 | |
| 6/30/22 due 7/7/22 (Collateralized by U.S. Treasury Obligations valued at $15,300,744, 1.00% - 1.25%, 12/31/26 - 7/31/28) | 15,004,521 | 15,000,000 | |
| DNB Bank ASA at 1.55%, dated 6/30/22 due 7/1/22 (Collateralized by U.S. Treasury Obligations valued at $2,066,116, 0.88% - 3.13%, 11/15/24 - 11/15/28) | 2,000,086 | 2,000,000 | |
| Federal Reserve Bank of New York at 1.55%, dated 6/30/22 due 7/1/22 (Collateralized by U.S. Treasury Obligations valued at $3,887,167,449, 1.50% - 1.63%, 11/15/22 - 2/15/30) | 3,887,167,357 | 3,887,000,000 | |
| ING Financial Markets LLC at 1.55%, dated 6/30/22 due 7/1/22 (Collateralized by U.S. Treasury Obligations valued at $4,089,312, 2.50% - 2.63%, 8/15/23 - 2/15/29) | 4,000,172 | 4,000,000 | |
| Lloyds Bank Corp. Markets PLC at: | |||
| 1.03%, dated 4/28/22 due 7/28/22 (Collateralized by U.S. Treasury Obligations valued at $4,100,893, 1.75% - 1.88%, 12/31/24 - 2/28/27) | 4,010,414 | 4,000,000 | |
| 1.05%, dated: | |||
| 4/29/22 due 7/29/22 (Collateralized by U.S. Treasury Obligations valued at $4,114,292, 0.38% - 1.88%, 11/30/25 - 2/28/27) | 4,010,617 | 4,000,000 | |
| 6/1/22 due 7/1/22 (Collateralized by U.S. Treasury Obligations valued at $2,054,396, 0.13% - 1.88%, 7/15/23 - 2/28/27) | 2,001,750 | 2,000,000 | |
| 1.09%, dated 4/29/22 due 8/3/22 (Collateralized by U.S. Treasury Obligations valued at $4,141,142, 1.88% - 4.38%, 2/28/27 - 11/15/39) | 4,011,627 | 4,000,000 | |
| 1.15%, dated 5/4/22 due 8/5/22 (Collateralized by U.S. Treasury Obligations valued at $4,095,554, 1.88% - 2.38%, 1/31/23 - 2/28/27) | 4,011,883 | 4,000,000 | |
| Lloyds Bank PLC at: | |||
| 1.04%, dated 4/29/22 due 7/29/22 (Collateralized by U.S. Treasury Obligations valued at $4,122,435, 2.38% - 6.00%, 8/15/24 - 2/15/26) | 4,010,516 | 4,000,000 | |
| 1.15%, dated 5/3/22 due 8/3/22 (Collateralized by U.S. Treasury Obligations valued at $2,074,721, 6.00%, 2/15/26) | 2,005,878 | 2,000,000 | |
| 1.2%, dated 5/5/22 due 8/3/22 (Collateralized by U.S. Treasury Obligations valued at $4,135,586, 2.00% - 6.00%, 5/31/24 - 8/15/27) | 4,012,000 | 4,000,000 | |
| 1.22%, dated 5/5/22 due 8/5/22 (Collateralized by U.S. Treasury Obligations valued at $2,068,273, 2.75% - 6.00%, 2/28/25 - 2/15/26) | 2,006,236 | 2,000,000 | |
| 1.36%, dated 5/26/22 due 8/26/22 (Collateralized by U.S. Treasury Obligations valued at $2,073,700, 0.25% - 6.00%, 5/31/24 - 2/15/26) | 2,006,951 | 2,000,000 | |
| 1.5%, dated 6/8/22 due 9/8/22 (Collateralized by U.S. Treasury Obligations valued at $3,072,051, 0.13% - 6.00%, 11/15/22 - 2/15/26) | 3,011,500 | 3,000,000 | |
| Mizuho Bank, Ltd. at 1.55%, dated 6/30/22 due 7/1/22 (Collateralized by U.S. Treasury Obligations valued at $16,328,422, 0.25%, 3/15/24) | 16,000,689 | 16,000,000 | |
| MUFG Securities EMEA PLC at 1.55%, dated 6/30/22 due 7/1/22 (Collateralized by U.S. Treasury Obligations valued at $25,493,659, 0.13% - 2.25%, 12/15/23 - 7/31/27) | 25,001,076 | 25,000,000 | |
| Norinchukin Bank at: | |||
| 1.28%, dated 6/13/22 due 7/13/22 (Collateralized by U.S. Treasury Obligations valued at $4,082,516, 1.25% - 6.75%, 8/15/26 - 2/15/32) | 4,004,267 | 4,000,000 | |
| 1.58%, dated 6/22/22 due 7/28/22 (Collateralized by U.S. Treasury Obligations valued at $5,101,853, 1.25% - 5.38%, 3/31/29 - 2/15/32) | 5,007,900 | 5,000,000 | |
| Royal Bank of Canada at 1.55%, dated 6/30/22 due 7/5/22 (Collateralized by U.S. Treasury Obligations valued at $12,293,497, 1.38% - 3.13%, 8/15/23 - 8/15/44) | 12,002,583 | 12,000,000 | |
| TOTAL U.S. TREASURY REPURCHASE AGREEMENT | |||
| (Cost $4,254,000,000) | 4,254,000,000 | ||
| TOTAL INVESTMENT IN SECURITIES - 99.9% | |||
| (Cost $6,138,934,977) | 6,138,934,977 | ||
| NET OTHER ASSETS (LIABILITIES) - 0.1% | 3,714,557 | ||
| NET ASSETS - 100% | $6,142,649,534 |
The date shown for securities represents the date when principal payments must be paid, taking into account any call options exercised by the issuer and any permissible maturity shortening features other than interest rate resets.
Legend
(a) Yield represents either the annualized yield at the date of purchase, or the stated coupon rate, or, for floating and adjustable rate securities, the rate at period end.
(b) Coupon rates for floating and adjustable rate securities reflect the rates in effect at period end.
(c) Coupon is indexed to a floating interest rate which may be multiplied by a specified factor and/or subject to caps or floors.
(d) Security initially issued at one coupon which converts to a higher coupon at a specified date. The rate shown is the rate at period end.
(e) The maturity amount is based on the rate at period end.
Investment Valuation
All investments are categorized as Level 2 under the Fair Value Hierarchy. The inputs or methodology used for valuing securities may not be an indication of the risk associated with investing in those securities. For more information on valuation inputs please refer to the Investment Valuation section in the accompanying Notes to Financial Statements.
Other Information
# Additional information on each counterparty to the repurchase agreement is as follows:
| Repurchase Agreement / Counterparty | Value |
| $196,901,000 due 7/01/22 at 1.55% | |
| BNY Mellon Capital Markets LLC | $14,537,000 |
| Bank Of America, N.A. | 32,064,000 |
| Bank of America Securities, Inc. | 17,815,000 |
| Citigroup Global Markets, Inc. | 13,360,000 |
| HSBC Securities (USA), Inc. | 4,008,000 |
| JPMorgan Securities LLC | 6,680,000 |
| Mitsubishi UFJ Securities Holdings Ltd. | 4,453,000 |
| Mizuho Securities USA, Inc. | 2,227,000 |
| Nomura Securities International | 22,269,000 |
| RBC Dominion Securities, Inc. | 1,277,000 |
| Sumitomo Mitsui Banking Corporation NY (DI) | 38,131,000 |
| Sumitomo Mitsui Banking Corporation (REPO) | 38,299,000 |
| Wells Fargo Securities LLC | 1,781,000 |
| $196,901,000 |
See accompanying notes which are an integral part of the financial statements.
Financial Statements
Statement of Assets and Liabilities
| June 30, 2022 (Unaudited) | ||
| Assets | ||
| Investment in securities, at value (including repurchase agreements of $4,743,901,000) — See accompanying schedule: Unaffiliated issuers (cost $6,138,934,977) | $6,138,934,977 | |
| Cash | 1,704 | |
| Receivable for investments sold | 3,986,325 | |
| Receivable for fund shares sold | 22,410,313 | |
| Interest receivable | 3,144,679 | |
| Total assets | 6,168,477,998 | |
| Liabilities | ||
| Payable for investments purchased | $10,943,332 | |
| Payable for fund shares redeemed | 13,402,832 | |
| Accrued management fee | 830,178 | |
| Distribution and service plan fees payable | 188,829 | |
| Other affiliated payables | 429,587 | |
| Other payables and accrued expenses | 33,706 | |
| Total liabilities | 25,828,464 | |
| Net Assets | $6,142,649,534 | |
| Net Assets consist of: | ||
| Paid in capital | $6,142,401,212 | |
| Total accumulated earnings (loss) | 248,322 | |
| Net Assets | $6,142,649,534 | |
| Net Asset Value and Maximum Offering Price | ||
| Initial Class: | ||
| Net Asset Value, offering price and redemption price per share ($1,710,203,981 ÷ 1,710,301,804 shares) | $1.00 | |
| Service Class: | ||
| Net Asset Value, offering price and redemption price per share ($1,728,344,132 ÷ 1,728,387,682 shares) | $1.00 | |
| Service Class 2: | ||
| Net Asset Value, offering price and redemption price per share ($233,451,205 ÷ 233,453,008 shares) | $1.00 | |
| Investor Class: | ||
| Net Asset Value, offering price and redemption price per share ($2,470,650,216 ÷ 2,470,067,601 shares) | $1.00 |
See accompanying notes which are an integral part of the financial statements.
Statement of Operations
| Six months ended June 30, 2022 (Unaudited) | ||
| Investment Income | ||
| Interest | $12,436,012 | |
| Expenses | ||
| Management fee | $4,396,805 | |
| Transfer agent fees | 2,183,897 | |
| Distribution and service plan fees | 1,076,415 | |
| Accounting fees and expenses | 239,827 | |
| Custodian fees and expenses | 30,998 | |
| Independent trustees' fees and expenses | 8,313 | |
| Audit | 23,751 | |
| Legal | 1,513 | |
| Miscellaneous | 5,349 | |
| Total expenses before reductions | 7,966,868 | |
| Expense reductions | (2,212,446) | |
| Total expenses after reductions | 5,754,422 | |
| Net investment income (loss) | 6,681,590 | |
| Realized and Unrealized Gain (Loss) | ||
| Net realized gain (loss) on: | ||
| Investment securities: | ||
| Unaffiliated issuers | 13,258 | |
| Total net realized gain (loss) | 13,258 | |
| Net increase in net assets resulting from operations | $6,694,848 |
See accompanying notes which are an integral part of the financial statements.
Statement of Changes in Net Assets
| Six months ended June 30, 2022 (Unaudited) | Year ended December 31, 2021 | |
| Increase (Decrease) in Net Assets | ||
| Operations | ||
| Net investment income (loss) | $6,681,590 | $573,891 |
| Net realized gain (loss) | 13,258 | (912) |
| Net increase in net assets resulting from operations | 6,694,848 | 572,979 |
| Distributions to shareholders | (6,737,914) | (542,266) |
| Share transactions - net increase (decrease) | 1,044,750,012 | (1,115,001,983) |
| Total increase (decrease) in net assets | 1,044,706,946 | (1,114,971,270) |
| Net Assets | ||
| Beginning of period | 5,097,942,588 | 6,212,913,858 |
| End of period | $6,142,649,534 | $5,097,942,588 |
See accompanying notes which are an integral part of the financial statements.
Financial Highlights
VIP Government Money Market Portfolio Initial Class
| Six months ended (Unaudited) June 30, | Years endedDecember 31, | |||||
| 2022 | 2021 | 2020 | 2019 | 2018 | 2017 | |
| Selected Per–Share Data | ||||||
| Net asset value, beginning of period | $1.00 | $1.00 | $1.00 | $1.00 | $1.00 | $1.00 |
| Income from Investment Operations | ||||||
| Net investment income (loss)A | .001 | –B | .003 | .020 | .016 | .007 |
| Net realized and unrealized gain (loss)B | – | – | – | – | – | – |
| Total from investment operations | .001 | –B | .003 | .020 | .016 | .007 |
| Distributions from net investment income | (.001) | –B | (.003) | (.020) | (.016) | (.007) |
| Total distributions | (.001) | –B | (.003) | (.020) | (.016) | (.007) |
| Net asset value, end of period | $1.00 | $1.00 | $1.00 | $1.00 | $1.00 | $1.00 |
| Total ReturnC,D,E | .13% | .01% | .32% | 2.02% | 1.65% | .67% |
| Ratios to Average Net AssetsA,F,G | ||||||
| Expenses before reductions | .24%H | .23% | .24% | .26% | .26% | .26% |
| Expenses net of fee waivers, if any | .18%H | .08% | .20% | .26% | .26% | .26% |
| Expenses net of all reductions | .18%H | .08% | .20% | .26% | .26% | .26% |
| Net investment income (loss) | .27%H | .01% | .29% | 1.99% | 1.65% | .68% |
| Supplemental Data | ||||||
| Net assets, end of period (000 omitted) | $1,710,204 | $1,477,559 | $2,255,440 | $2,182,100 | $2,166,787 | $1,310,275 |
A Net investment income (loss) is affected by the timing of the declaration of dividends by any underlying mutual funds or exchange-traded funds (ETFs). Net investment income (loss) of any such underlying funds is not included in the Fund's net investment income (loss) ratio.
B Amount represents less than $.0005 per share.
C Total returns for periods of less than one year are not annualized.
D Total returns do not reflect charges attributable to your insurance company's separate account. Inclusion of these charges would reduce the total returns shown.
E Total returns would have been lower if certain expenses had not been reduced during the applicable periods shown.
F Fees and expenses of any underlying mutual funds or exchange-traded funds (ETFs) are not included in the Fund's expense ratio. The Fund indirectly bears its proportionate share of these expenses.
G Expense ratios reflect operating expenses of the class. Expenses before reductions do not reflect amounts reimbursed, waived, or reduced through arrangements with the investment adviser, brokerage services, or other offset arrangements, if applicable, and do not represent the amount paid by the class during periods when reimbursements, waivers or reductions occur.
H Annualized
See accompanying notes which are an integral part of the financial statements.
VIP Government Money Market Portfolio Service Class
| Six months ended (Unaudited) June 30, | Years endedDecember 31, | |||||
| 2022 | 2021 | 2020 | 2019 | 2018 | 2017 | |
| Selected Per–Share Data | ||||||
| Net asset value, beginning of period | $1.00 | $1.00 | $1.00 | $1.00 | $1.00 | $1.00 |
| Income from Investment Operations | ||||||
| Net investment income (loss)A | .001 | –B | .003 | .019 | .015 | .006 |
| Net realized and unrealized gain (loss)B | – | – | – | – | – | – |
| Total from investment operations | .001 | –B | .003 | .019 | .015 | .006 |
| Distributions from net investment income | (.001) | –B | (.003) | (.019) | (.015) | (.006) |
| Total distributions | (.001) | –B | (.003) | (.019) | (.015) | (.006) |
| Net asset value, end of period | $1.00 | $1.00 | $1.00 | $1.00 | $1.00 | $1.00 |
| Total ReturnC,D,E | .10% | .01% | .28% | 1.92% | 1.55% | .57% |
| Ratios to Average Net AssetsA,F,G | ||||||
| Expenses before reductions | .34%H | .33% | .34% | .36% | .36% | .36% |
| Expenses net of fee waivers, if any | .23%H | .08% | .23% | .36% | .36% | .36% |
| Expenses net of all reductions | .23%H | .08% | .23% | .36% | .36% | .36% |
| Net investment income (loss) | .21%H | .01% | .26% | 1.89% | 1.55% | .58% |
| Supplemental Data | ||||||
| Net assets, end of period (000 omitted) | $1,728,344 | $1,447,279 | $1,641,207 | $1,179,143 | $1,191,142 | $1,025,081 |
A Net investment income (loss) is affected by the timing of the declaration of dividends by any underlying mutual funds or exchange-traded funds (ETFs). Net investment income (loss) of any such underlying funds is not included in the Fund's net investment income (loss) ratio.
B Amount represents less than $.0005 per share.
C Total returns for periods of less than one year are not annualized.
D Total returns do not reflect charges attributable to your insurance company's separate account. Inclusion of these charges would reduce the total returns shown.
E Total returns would have been lower if certain expenses had not been reduced during the applicable periods shown.
F Fees and expenses of any underlying mutual funds or exchange-traded funds (ETFs) are not included in the Fund's expense ratio. The Fund indirectly bears its proportionate share of these expenses.
G Expense ratios reflect operating expenses of the class. Expenses before reductions do not reflect amounts reimbursed, waived, or reduced through arrangements with the investment adviser, brokerage services, or other offset arrangements, if applicable, and do not represent the amount paid by the class during periods when reimbursements, waivers or reductions occur.
H Annualized
See accompanying notes which are an integral part of the financial statements.
VIP Government Money Market Portfolio Service Class 2
| Six months ended (Unaudited) June 30, | Years endedDecember 31, | |||||
| 2022 | 2021 | 2020 | 2019 | 2018 | 2017 | |
| Selected Per–Share Data | ||||||
| Net asset value, beginning of period | $1.00 | $1.00 | $1.00 | $1.00 | $1.00 | $1.00 |
| Income from Investment Operations | ||||||
| Net investment income (loss)A | .001 | –B | .002 | .017 | .014 | .004 |
| Net realized and unrealized gain (loss)B | – | – | – | – | – | – |
| Total from investment operations | .001 | –B | .002 | .017 | .014 | .004 |
| Distributions from net investment income | (.001) | –B | (.002) | (.017) | (.014) | (.004) |
| Total distributions | (.001) | –B | (.002) | (.017) | (.014) | (.004) |
| Net asset value, end of period | $1.00 | $1.00 | $1.00 | $1.00 | $1.00 | $1.00 |
| Total ReturnC,D,E | .08% | .01% | .24% | 1.76% | 1.40% | .42% |
| Ratios to Average Net AssetsA,F,G | ||||||
| Expenses before reductions | .49%H | .48% | .49% | .51% | .51% | .51% |
| Expenses net of fee waivers, if any | .29%H | .08% | .28% | .51% | .51% | .51% |
| Expenses net of all reductions | .29%H | .08% | .28% | .51% | .51% | .51% |
| Net investment income (loss) | .16%H | .01% | .21% | 1.74% | 1.40% | .43% |
| Supplemental Data | ||||||
| Net assets, end of period (000 omitted) | $233,451 | $203,035 | $221,428 | $220,990 | $220,358 | $202,591 |
A Net investment income (loss) is affected by the timing of the declaration of dividends by any underlying mutual funds or exchange-traded funds (ETFs). Net investment income (loss) of any such underlying funds is not included in the Fund's net investment income (loss) ratio.
B Amount represents less than $.0005 per share.
C Total returns for periods of less than one year are not annualized.
D Total returns do not reflect charges attributable to your insurance company's separate account. Inclusion of these charges would reduce the total returns shown.
E Total returns would have been lower if certain expenses had not been reduced during the applicable periods shown.
F Fees and expenses of any underlying mutual funds or exchange-traded funds (ETFs) are not included in the Fund's expense ratio. The Fund indirectly bears its proportionate share of these expenses.
G Expense ratios reflect operating expenses of the class. Expenses before reductions do not reflect amounts reimbursed, waived, or reduced through arrangements with the investment adviser, brokerage services, or other offset arrangements, if applicable, and do not represent the amount paid by the class during periods when reimbursements, waivers or reductions occur.
H Annualized
See accompanying notes which are an integral part of the financial statements.
VIP Government Money Market Portfolio Investor Class
| Six months ended (Unaudited) June 30, | Years endedDecember 31, | |||||
| 2022 | 2021 | 2020 | 2019 | 2018 | 2017 | |
| Selected Per–Share Data | ||||||
| Net asset value, beginning of period | $1.00 | $1.00 | $1.00 | $1.00 | $1.00 | $1.00 |
| Income from Investment Operations | ||||||
| Net investment income (loss)A | .001 | –B | .003 | .020 | .016 | .006 |
| Net realized and unrealized gain (loss)B | – | – | – | – | – | – |
| Total from investment operations | .001 | –B | .003 | .020 | .016 | .006 |
| Distributions from net investment income | (.001) | –B | (.003) | (.020) | (.016) | (.006) |
| Total distributions | (.001) | –B | (.003) | (.020) | (.016) | (.006) |
| Net asset value, end of period | $1.00 | $1.00 | $1.00 | $1.00 | $1.00 | $1.00 |
| Total ReturnC,D,E | .12% | .01% | .31% | 1.99% | 1.63% | .65% |
| Ratios to Average Net AssetsA,F,G | ||||||
| Expenses before reductions | .26%H | .25% | .26% | .28% | .28% | .28% |
| Expenses net of fee waivers, if any | .20%H | .08% | .21% | .28% | .28% | .28% |
| Expenses net of all reductions | .20%H | .08% | .21% | .28% | .28% | .28% |
| Net investment income (loss) | .25%H | .01% | .28% | 1.97% | 1.62% | .65% |
| Supplemental Data | ||||||
| Net assets, end of period (000 omitted) | $2,470,650 | $1,970,069 | $2,094,839 | $1,939,981 | $1,764,836 | $1,287,257 |
A Net investment income (loss) is affected by the timing of the declaration of dividends by any underlying mutual funds or exchange-traded funds (ETFs). Net investment income (loss) of any such underlying funds is not included in the Fund's net investment income (loss) ratio.
B Amount represents less than $.0005 per share.
C Total returns for periods of less than one year are not annualized.
D Total returns do not reflect charges attributable to your insurance company's separate account. Inclusion of these charges would reduce the total returns shown.
E Total returns would have been lower if certain expenses had not been reduced during the applicable periods shown.
F Fees and expenses of any underlying mutual funds or exchange-traded funds (ETFs) are not included in the Fund's expense ratio. The Fund indirectly bears its proportionate share of these expenses.
G Expense ratios reflect operating expenses of the class. Expenses before reductions do not reflect amounts reimbursed, waived, or reduced through arrangements with the investment adviser, brokerage services, or other offset arrangements, if applicable, and do not represent the amount paid by the class during periods when reimbursements, waivers or reductions occur.
H Annualized
See accompanying notes which are an integral part of the financial statements.
Notes to Financial Statements (Unaudited)
For the period ended June 30, 2022
1. Organization.
VIP Government Money Market Portfolio (the Fund) is a fund of Variable Insurance Products Fund V (the Trust) and is authorized to issue an unlimited number of shares. The Trust is registered under the Investment Company Act of 1940, as amended (the 1940 Act), as an open-end management investment company organized as a Massachusetts business trust. Shares of the Fund may only be purchased by insurance companies for the purpose of funding variable annuity or variable life insurance contracts. The Fund offers the following classes of shares: Initial Class shares, Service Class shares, Service Class 2 shares and Investor Class shares. All classes have equal rights and voting privileges, except for matters affecting a single class.
2. Significant Accounting Policies.
The Fund is an investment company and applies the accounting and reporting guidance of the Financial Accounting Standards Board (FASB) Accounting Standards Codification Topic 946 Financial Services - Investment Companies. The financial statements have been prepared in conformity with accounting principles generally accepted in the United States of America (GAAP), which require management to make certain estimates and assumptions at the date of the financial statements. Actual results could differ from those estimates. Subsequent events, if any, through the date that the financial statements were issued have been evaluated in the preparation of the financial statements. The Fund's Schedule of Investments lists any underlying mutual funds or exchange-traded funds (ETFs) but does not include the underlying holdings of these funds. The following summarizes the significant accounting policies of the Fund:
Investment Valuation. The Fund categorizes the inputs to valuation techniques used to value its investments into a disclosure hierarchy consisting of three levels as shown below:
- Level 1 – unadjusted quoted prices in active markets for identical investments
- Level 2 – other significant observable inputs (including quoted prices for similar investments, interest rates, prepayment speeds, etc.)
- Level 3 – unobservable inputs (including the Fund's own assumptions based on the best information available)
As permitted by compliance with certain conditions under Rule 2a-7 of the 1940 Act, securities are valued at amortized cost, which approximates fair value. The amortized cost of an instrument is determined by valuing it at its original cost and thereafter amortizing any discount or premium from its face value at a constant rate until maturity. Securities held by a money market fund are generally high quality and liquid; however, they are reflected as Level 2 because the inputs used to determine fair value are not quoted prices in an active market.
Investment Transactions and Income. Gains and losses on securities sold are determined on the basis of identified cost and include proceeds received from litigation. Interest income is accrued as earned and includes coupon interest and amortization of premium and accretion of discount on debt securities as applicable. The principal amount on inflation-indexed securities is periodically adjusted to the rate of inflation and interest is accrued based on the principal amount. The adjustments to principal due to inflation are reflected as increases or decreases to Interest in the accompanying Statement of Operations.
Class Allocations and Expenses. Investment income, realized and unrealized capital gains and losses, common expenses of a fund, and certain fund-level expense reductions, if any, are allocated daily on a pro-rata basis to each class based on the relative net assets of each class to the total net assets of a fund. Each class differs with respect to transfer agent and distribution and service plan fees incurred, as applicable. Certain expense reductions may also differ by class, if applicable. For the reporting period, the allocated portion of income and expenses to each class as a percent of its average net assets may vary due to the timing of recording these transactions in relation to fluctuating net assets of the classes. Expenses directly attributable to a fund are charged to that fund. Expenses attributable to more than one fund are allocated among the respective funds on the basis of relative net assets or other appropriate methods. Expenses included in the accompanying financial statements reflect the expenses of that fund and do not include any expenses associated with any underlying mutual funds or exchange-traded funds. Although not included in a fund's expenses, a fund indirectly bears its proportionate share of these expenses through the net asset value of each underlying mutual fund or exchange-traded fund. Expense estimates are accrued in the period to which they relate and adjustments are made when actual amounts are known.
Income Tax Information and Distributions to Shareholders. Each year, the Fund intends to qualify as a regulated investment company under Subchapter M of the Internal Revenue Code, including distributing substantially all of its taxable income and realized gains. As a result, no provision for U.S. Federal income taxes is required. The Fund files a U.S. federal tax return, in addition to state and local tax returns as required. The Fund's federal income tax returns are subject to examination by the Internal Revenue Service (IRS) for a period of three fiscal years after they are filed. State and local tax returns may be subject to examination for an additional fiscal year depending on the jurisdiction.
Distributions are declared and recorded daily and paid monthly from net investment income. Distributions from realized gains, if any, are declared and recorded on the ex-dividend date. Income and capital gain distributions are declared separately for each class. Income and capital gain distributions are determined in accordance with income tax regulations, which may differ from GAAP.
Capital accounts within the financial statements are adjusted for permanent book-tax differences. These adjustments have no impact on net assets or the results of operations. Capital accounts are not adjusted for temporary book-tax differences which will reverse in a subsequent period.
Book-tax differences are primarily due to deferred Trustee compensation and losses deferred due to wash sales.
As of period end, the cost and unrealized appreciation (depreciation) in securities for federal income tax purposes were as follows:
| Gross unrealized appreciation | $– |
| Gross unrealized depreciation | – |
| Net unrealized appreciation (depreciation) | $– |
| Tax cost | $6,138,934,977 |
Capital loss carryforwards are only available to offset future capital gains of the Fund to the extent provided by regulations and may be limited. The capital loss carryforward information presented below, including any applicable limitation, is estimated as of prior fiscal period end and is subject to adjustment.
| Short-term | $(437) |
| Total capital loss carryforward | $(437) |
Repurchase Agreements. Pursuant to an Exemptive Order issued by the Securities and Exchange Commission, funds and other registered investment companies having management contracts with Fidelity Management and Research Company LLC, or its affiliates are permitted to transfer uninvested cash balances into joint trading accounts which are then invested in repurchase agreements. Funds may also invest directly with institutions in repurchase agreements. Repurchase agreements may be collateralized by cash or government securities. Upon settlement date, collateral is held in segregated accounts with custodian banks and may be obtained in the event of a default of the counterparty. The collateral balance is monitored on a daily basis to ensure it is at least equal to the principal amount of the repurchase agreement (including accrued interest). In the event of a default by the counterparty, realization of the collateral proceeds could be delayed, during which time the value of the collateral may decline.
3. Fees and Other Transactions with Affiliates.
Management Fee. Fidelity Management & Research Company LLC (the investment adviser) and its affiliates provide the Fund with investment management related services for which the Fund pays a monthly management fee. The management fee is calculated on the basis of a group fee rate plus a total income-based component. The annualized group fee rate averaged .10% during the period. The group fee rate is based upon the monthly average net assets of a group of registered investment companies with which the investment adviser has management contracts. The group fee rate decreases as assets under management increase and increases as assets under management decrease. The total income-based component is comprised of an income-based fee and an asset-based fee, and is calculated according to a graduated schedule providing for different rates based on the Fund's gross annualized yield. The rate increases as the Fund's gross yield increases.
During the period the income-based portion of this fee was $1,650,683 or an annualized rate of .06% of the Fund's average net assets. For the reporting period, the Fund's total annualized management fee rate was .16% of the Fund's average net assets.
During the period, the investment adviser or its affiliates waived a portion of these fees.
Distribution and Service Plan Fees. In accordance with Rule 12b-1 of the 1940 Act, the Fund has adopted separate 12b-1 Plans for each Service Class of shares. Each Service Class pays Fidelity Distributors Company LLC (FDC), an affiliate of the investment adviser, a service fee. For the period, the service fee is based on an annual rate of .10% of Service Class' average net assets and .25% of Service Class 2's average net assets.
For the period, total fees, all of which were re-allowed to insurance companies for the distribution of shares and providing shareholder support services, were as follows:
| Service Class | $800,515 |
| Service Class 2 | 275,900 |
| $1,076,415 |
Transfer Agent Fees. Fidelity Investments Institutional Operations Company LLC (FIIOC), an affiliate of the investment adviser, is the Fund's transfer, dividend disbursing, and shareholder servicing agent. FIIOC receives an asset-based fee with respect to each class. Each class pays a fee for transfer agent services, typesetting and printing and mailing of shareholder reports, excluding mailing of proxy statements. For the period, transfer agent fees for each class were as follows:
| Amount | % of Class-Level Average Net Assets(a) | |
| Initial Class | $555,959 | .07 |
| Service Class | 544,350 | .07 |
| Service Class 2 | 75,045 | .07 |
| Investor Class | 1,008,543 | .09 |
| $2,183,897 |
(a) Annualized
During the period, the investment adviser or its affiliates waived a portion of these fees.
Accounting Fees. Fidelity Service Company, Inc. (FSC), an affiliate of the investment adviser, maintains the Fund's accounting records. The accounting fee is based on the level of average net assets for each month. For the period, the fees were equivalent to the following annualized rates:
| % of Average Net Assets | |
| VIP Government Money Market Portfolio | .01 |
Interfund Trades. Funds may purchase from or sell securities to other Fidelity Funds under procedures adopted by the Board. The procedures have been designed to ensure these interfund trades are executed in accordance with Rule 17a-7 of the 1940 Act. During the period, there were no interfund trades.
4. Expense Reductions.
The investment adviser or its affiliates voluntarily agreed to waive certain fees in order to avoid a negative yield. Such arrangements may be discontinued by the investment adviser at any time. For the period, the amount of the waiver for each class was as follows:
| Initial Class | $455,466 |
| Service Class | 803,603 |
| Service Class 2 | 220,252 |
| Investor Class | 686,134 |
Through arrangements with the Fund's custodian, credits realized as a result of certain uninvested cash balances were used to reduce the Fund's expenses. During the period, custodian credits reduced the Fund's expenses by $3,741.
In addition, during the period the investment adviser or an affiliate reimbursed and/or waived a portion of fund-level operating expenses in the amount of $43,250.
5. Distributions to Shareholders.
Distributions to shareholders of each class were as follows:
| Six months ended June 30, 2022 | Year ended December 31, 2021 |
|
| VIP Government Money Market Portfolio | ||
| Distributions to shareholders | ||
| Initial Class | $2,103,537 | $167,465 |
| Service Class | 1,655,988 | 154,032 |
| Service Class 2 | 175,661 | 21,336 |
| Investor Class | 2,802,728 | 199,433 |
| Total | $6,737,914 | $542,266 |
6. Share Transactions.
Transactions for each class of shares at a $1.00 per share were as follows and may contain in-kind transactions:
| Shares | Shares | Dollars | Dollars | |
| Six months ended June 30, 2022 | Year ended December 31, 2021 | Six months ended June 30, 2022 | Year ended December 31, 2021 | |
| VIP Government Money Market Portfolio | ||||
| Initial Class | ||||
| Shares sold | 1,181,240,207 | 1,267,173,146 | $1,181,240,207 | $1,267,173,146 |
| Reinvestment of distributions | 2,103,528 | 167,465 | 2,103,528 | 167,465 |
| Shares redeemed | (950,644,220) | (2,045,259,356) | (950,644,220) | (2,045,259,356) |
| Net increase (decrease) | 232,699,515 | (777,918,745) | $232,699,515 | $(777,918,745) |
| Service Class | ||||
| Shares sold | 902,470,332 | 1,374,883,334 | $902,470,334 | $1,374,883,335 |
| Reinvestment of distributions | 1,655,990 | 154,033 | 1,655,988 | 154,032 |
| Shares redeemed | (623,013,334) | (1,568,971,979) | (623,013,334) | (1,568,971,979) |
| Net increase (decrease) | 281,112,988 | (193,934,612) | $281,112,988 | $(193,934,612) |
| Service Class 2 | ||||
| Shares sold | 91,078,605 | 189,188,159 | $91,078,605 | $189,188,157 |
| Reinvestment of distributions | 175,661 | 21,334 | 175,661 | 21,336 |
| Shares redeemed | (60,831,825) | (207,603,643) | (60,831,825) | (207,603,643) |
| Net increase (decrease) | 30,422,441 | (18,394,150) | $30,422,441 | $(18,394,150) |
| Investor Class | ||||
| Shares sold | 835,063,358 | 545,811,804 | $835,063,358 | $545,811,804 |
| Reinvestment of distributions | 2,802,675 | 197,608 | 2,802,675 | 197,608 |
| Shares redeemed | (337,350,965) | (670,763,888) | (337,350,965) | (670,763,888) |
| Net increase (decrease) | 500,515,068 | (124,754,476) | $500,515,068 | $(124,754,476) |
7. Other.
A fund's organizational documents provide former and current trustees and officers with a limited indemnification against liabilities arising in connection with the performance of their duties to the fund. In the normal course of business, a fund may also enter into contracts that provide general indemnifications. A fund's maximum exposure under these arrangements is unknown as this would be dependent on future claims that may be made against a fund. The risk of material loss from such claims is considered remote.
At the end of the period, the investment adviser or its affiliates were owners of record of more than 10% and certain otherwise unaffiliated shareholders were owners of record of more than 10% of the outstanding shares as follows:
| Fund | Affiliated % | Number of Unaffiliated Shareholders | Unaffiliated Shareholders % |
| VIP Government Money Market Portfolio | 44% | 1 | 16% |
8. Coronavirus (COVID-19) Pandemic.
An outbreak of COVID-19 first detected in China during December 2019 has since spread globally and was declared a pandemic by the World Health Organization during March 2020. Developments that disrupt global economies and financial markets, such as the COVID-19 pandemic, may magnify factors that affect the Fund's performance.
Shareholder Expense Example
As a shareholder, you incur two types of costs: (1) transaction costs, which may include sales charges (loads) on purchase payments or redemption proceeds, as applicable and (2) ongoing costs, which generally include management fees, distribution and/or service (12b-1) fees and other Fund expenses. This Example is intended to help you understand your ongoing costs (in dollars) of investing in a fund and to compare these costs with the ongoing costs of investing in other mutual funds.
The Example is based on an investment of $1,000 invested at the beginning of the period and held for the entire period (January 1, 2022 to June 30, 2022).
Actual Expenses
The first line of the accompanying table provides information about actual account values and actual expenses. You may use the information in this line, together with the amount you invested, to estimate the expenses that you paid over the period. Simply divide your account value by $1,000.00 (for example, an $8,600 account value divided by $1,000.00 = 8.6), then multiply the result by the number in the first line for a class/Fund under the heading entitled "Expenses Paid During Period" to estimate the expenses you paid on your account during this period. If any fund is a shareholder of any underlying mutual funds or exchange-traded funds (ETFs) (the Underlying Funds), such fund indirectly bears its proportional share of the expenses of the Underlying Funds in addition to the direct expenses incurred presented in the table. These fees and expenses are not included in the annualized expense ratio used to calculate the expense estimate in the table below. The estimate of expenses does not include any fees or other expenses of any variable annuity or variable life insurance product. If they were, the estimate of expenses you paid during the period would be higher, and your ending account value would be lower.
Hypothetical Example for Comparison Purposes
The second line of the accompanying table provides information about hypothetical account values and hypothetical expenses based on the actual expense ratio and an assumed rate of return of 5% per year before expenses, which is not the actual return. The hypothetical account values and expenses may not be used to estimate the actual ending account balance or expenses you paid for the period. You may use this information to compare the ongoing costs of investing in the Fund and other funds. To do so, compare this 5% hypothetical example with the 5% hypothetical examples that appear in the shareholder reports of the other funds. If any fund is a shareholder of any Underlying Funds, such fund indirectly bears its proportional share of the expenses of the Underlying Funds in addition to the direct expenses as presented in the table. These fees and expenses are not included in the annualized expense ratio used to calculate the expense estimate in the table below. The estimate of expenses does not include any fees or other expenses of any variable annuity or variable life insurance product. If they were, the estimate of expenses you paid during the period would be higher, and your ending account value would be lower.
Please note that the expenses shown in the table are meant to highlight your ongoing costs only and do not reflect any transaction costs. Therefore, the second line of the table is useful in comparing ongoing costs only, and will not help you determine the relative total costs of owning different funds. In addition, if these transactional costs were included, your costs would have been higher.
| Annualized Expense Ratio-A | Beginning Account Value January 1, 2022 | Ending Account Value June 30, 2022 | Expenses Paid During Period-B January 1, 2022 to June 30, 2022 |
|
| VIP Government Money Market Portfolio | ||||
| Initial Class | .18% | |||
| Actual | $1,000.00 | $1,001.30 | $.89-C | |
| Hypothetical-D | $1,000.00 | $1,023.90 | $.90-C | |
| Service Class | .23% | |||
| Actual | $1,000.00 | $1,001.00 | $1.14-C | |
| Hypothetical-D | $1,000.00 | $1,023.65 | $1.15-C | |
| Service Class 2 | .29% | |||
| Actual | $1,000.00 | $1,000.80 | $1.44-C | |
| Hypothetical-D | $1,000.00 | $1,023.36 | $1.45-C | |
| Investor Class | .20% | |||
| Actual | $1,000.00 | $1,001.20 | $.99-C | |
| Hypothetical-D | $1,000.00 | $1,023.80 | $1.00-C |
A Annualized expense ratio reflects expenses net of applicable fee waivers.
B Expenses are equal to the annualized expense ratio, multiplied by the average account value over the period, multiplied by 181/ 365 (to reflect the one-half year period). The fees and expenses of any Underlying Funds are not included in each annualized expense ratio.
C If certain fees were not voluntarily waived by the investment adviser or its affiliates during the period, the annualized expense ratio and the expenses paid in the actual and hypothetical examples above would have been as shown in the table below.
D 5% return per year before expenses
| Annualized Expense Ratio-(a)
| Expenses Paid |
|
| VIP Government Money Market Portfolio | ||
| Initial Class | .24% | |
| Actual | $1.19 | |
| Hypothetical-(b) | $1.20 | |
| Service Class | .34% | |
| Actual | $1.69 | |
| Hypothetical-(b) | $1.71 | |
| Service Class 2 | .49% | |
| Actual | $2.43 | |
| Hypothetical-(b) | $2.46 | |
| Investor Class | .26% | |
| Actual | $1.29 | |
| Hypothetical-(b) | $1.30 |
(a) Annualized expense ratio reflects expenses net of applicable fee waivers.
(b) 5% return per year before expenses
![]()
VIPMM-SANN-0822
1.705628.124
Fidelity® Variable Insurance Products:
Strategic Income Portfolio
Semi-Annual Report
June 30, 2022
Contents
To view a fund's proxy voting guidelines and proxy voting record for the 12-month period ended June 30, visit http://www.fidelity.com/proxyvotingresults or visit the Securities and Exchange Commission's (SEC) web site at http://www.sec.gov.
You may also call 1-877-208-0098 to request a free copy of the proxy voting guidelines.
Fidelity® Variable Insurance Products are separate account options which are purchased through a variable insurance contract.
Standard & Poor's, S&P and S&P 500 are registered service marks of The McGraw-Hill Companies, Inc. and have been licensed for use by Fidelity Distributors Corporation.
Other third-party marks appearing herein are the property of their respective owners.
All other marks appearing herein are registered or unregistered trademarks or service marks of FMR LLC or an affiliated company. © 2022 FMR LLC. All rights reserved.
This report and the financial statements contained herein are submitted for the general information of the shareholders of the Fund. This report is not authorized for distribution to prospective investors in the Fund unless preceded or accompanied by an effective prospectus.
A fund files its complete schedule of portfolio holdings with the SEC for the first and third quarters of each fiscal year on Form N-PORT. Forms N-PORT are available on the SEC’s web site at http://www.sec.gov. A fund's Forms N-PORT may be reviewed and copied at the SEC’s Public Reference Room in Washington, DC. Information regarding the operation of the SEC's Public Reference Room may be obtained by calling 1-800-SEC-0330.
For a complete list of a fund's portfolio holdings, view the most recent holdings listing, semiannual report, or annual report on Fidelity's web site at http://www.fidelity.com, http://www.institutional.fidelity.com, or http://www.401k.com, as applicable.
NOT FDIC INSURED •MAY LOSE VALUE •NO BANK GUARANTEE
Neither the Fund nor Fidelity Distributors Corporation is a bank.
Note to Shareholders:
Early in 2020, the outbreak and spread of COVID-19 emerged as a public health emergency that had a major influence on financial markets, primarily based on its impact on the global economy and corporate earnings. On March 11, 2020, the World Health Organization declared the COVID-19 outbreak a pandemic, citing sustained risk of further global spread. The pandemic prompted a number of measures to limit the spread of COVID-19, including travel and border restrictions, quarantines, and restrictions on large gatherings. In turn, these resulted in lower consumer activity, diminished demand for a wide range of products and services, disruption in manufacturing and supply chains, and – given the wide variability in outcomes regarding the outbreak – significant market uncertainty and volatility. To help stem the turmoil, the U.S. government took unprecedented action – in concert with the U.S. Federal Reserve and central banks around the world – to help support consumers, businesses, and the broader economy, and to limit disruption to the financial system.
In general, the overall impact of the pandemic lessened in 2021, amid a resilient economy and widespread distribution of three COVID-19 vaccines granted emergency use authorization from the U.S. Food and Drug Administration (FDA) early in the year. Still, the situation remains dynamic, and the extent and duration of its influence on financial markets and the economy is highly uncertain, due in part to a recent spike in cases based on highly contagious variants of the coronavirus.
Extreme events such as the COVID-19 crisis are exogenous shocks that can have significant adverse effects on mutual funds and their investments. Although multiple asset classes may be affected by market disruption, the duration and impact may not be the same for all types of assets. Fidelity is committed to helping you stay informed amid news about COVID-19 and during increased market volatility, and we continue to take extra steps to be responsive to customer needs. We encourage you to visit us online, where we offer ongoing updates, commentary, and analysis on the markets and our funds.
Investment Summary (Unaudited)
The information in the following tables is based on the combined investments of the Fund and its pro-rata share of the investments of Fidelity's Fixed-Income Central Funds.Top Holdings as of June 30, 2022
| (by issuer, excluding cash equivalents) | % of fund's net assets |
| U.S. Treasury Obligations | 26.5 |
| German Federal Republic | 1.7 |
| CCO Holdings LLC/CCO Holdings Capital Corp. | 1.5 |
| JPMorgan Chase & Co. | 1.2 |
| TransDigm, Inc. | 1.1 |
| Fannie Mae | 0.8 |
| Freddie Mac | 0.8 |
| Citigroup, Inc. | 0.7 |
| United Kingdom, Great Britain and Northern Ireland | 0.7 |
| Bank of America Corp. | 0.7 |
| 35.7 |
Market Sectors as of June 30, 2022
| % of fund's net assets | |
| Financials | 8.2 |
| Energy | 7.9 |
| Consumer Discretionary | 7.3 |
| Communication Services | 7.3 |
| Industrials | 5.6 |
| Materials | 4.1 |
| Information Technology | 3.4 |
| Health Care | 3.1 |
| Utilities | 2.6 |
| Consumer Staples | 2.2 |
| Real Estate | 1.2 |
Quality Diversification (% of fund's net assets)
| As of June 30, 2022 | ||
| U.S. Government and U.S. Government Agency Obligations | 29.1% | |
| AAA,AA,A | 5.3% | |
| BBB | 7.5% | |
| BB | 17.1% | |
| B | 21.9% | |
| CCC,CC,C | 3.5% | |
| Not Rated | 4.9% | |
| Equities | 2.6% | |
| Short-Term Investments and Net Other Assets | 8.1% | |

We have used ratings from Moody's Investors Service, Inc. Where Moody's® ratings are not available, we have used S&P® ratings. All ratings are as of the date indicated and do not reflect subsequent changes.
Asset Allocation (% of fund's net assets)
| As of June 30, 2022*,**,*** | ||
| Preferred Securities | 4.5% | |
| Corporate Bonds | 36.4% | |
| U.S. Government and U.S. Government Agency Obligations | 29.1% | |
| Foreign Government & Government Agency Obligations | 9.3% | |
| Bank Loan Obligations | 9.4% | |
| Stocks | 2.6% | |
| Other Investments | 0.6% | |
| Short-Term Investments and Net Other Assets (Liabilities) | 8.1% | |
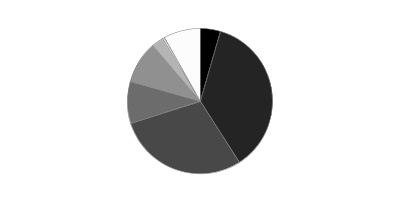
* Foreign investments - 22.7%
** Foreign Currency Contracts - (4.7)%
*** Futures and Swaps - 10.3%
An unaudited holdings listing for the Fund, which presents direct holdings as well as the pro-rata share of any securities and other investments held indirectly through its investment in underlying non-money market Fidelity Central Funds, is available at fidelity.com and/or institutional.fidelity.com, as applicable.
Geographic Diversification (% of fund's net assets)
| As of June 30, 2022 | ||
| United States of America* | 77.3% | |
| Germany | 2.3% | |
| Canada | 1.5% | |
| United Kingdom | 1.5% | |
| Netherlands | 1.4% | |
| Luxembourg | 1.3% | |
| Cayman Islands | 1.2% | |
| Mexico | 1.2% | |
| Israel | 0.6% | |
| Other | 11.7% | |

* Includes Short-Term investments and Net Other Assets (Liabilities).
Percentages in the above tables are adjusted for the effect of TBA Sale Commitments.
Schedule of Investments June 30, 2022 (Unaudited)
Showing Percentage of Net Assets
| Corporate Bonds - 36.1% | |||
| Principal Amount(a) | Value | ||
| Convertible Bonds - 0.1% | |||
| ENERGY - 0.1% | |||
| Oil, Gas & Consumable Fuels - 0.1% | |||
| Mesquite Energy, Inc. 15% 7/15/23 (b)(c) | $119,924 | $599,620 | |
| Mesquite Energy, Inc. 15% 7/15/23 (b)(c) | 208,674 | 949,467 | |
| 1,549,087 | |||
| FINANCIALS - 0.0% | |||
| Diversified Financial Services - 0.0% | |||
| New Cotai LLC 5% 2/24/27 (c) | 287,602 | 244,462 | |
| TOTAL CONVERTIBLE BONDS | 1,793,549 | ||
| Nonconvertible Bonds - 36.0% | |||
| COMMUNICATION SERVICES - 5.9% | |||
| Diversified Telecommunication Services - 2.1% | |||
| Altice France SA: | |||
| 5.125% 7/15/29 (d) | 3,835,000 | 2,895,425 | |
| 5.5% 1/15/28 (d) | 1,190,000 | 943,075 | |
| 5.5% 10/15/29 (d) | 2,810,000 | 2,146,278 | |
| 8.125% 2/1/27 (d) | 370,000 | 340,544 | |
| Axtel S.A.B. de CV 6.375% 11/14/24 (d) | 100,000 | 88,050 | |
| C&W Senior Financing Designated Activity Co. 6.875% 9/15/27 (d) | 2,630,000 | 2,360,425 | |
| Cablevision Lightpath LLC: | |||
| 3.875% 9/15/27 (d) | 325,000 | 268,938 | |
| 5.625% 9/15/28 (d) | 260,000 | 203,388 | |
| Cogent Communications Group, Inc. 7% 6/15/27 (d) | 280,000 | 268,240 | |
| Colombia Telecomunicaciones SA 4.95% 7/17/30 (d) | 210,000 | 161,936 | |
| Frontier Communications Holdings LLC: | |||
| 5% 5/1/28 (d) | 1,165,000 | 990,250 | |
| 5.875% 10/15/27 (d) | 620,000 | 557,444 | |
| 6% 1/15/30 (d) | 555,000 | 427,045 | |
| 6.75% 5/1/29 (d) | 745,000 | 612,763 | |
| 8.75% 5/15/30 (d) | 280,000 | 283,077 | |
| IHS Holding Ltd. 5.625% 11/29/26 (d) | 595,000 | 487,454 | |
| Level 3 Financing, Inc. 3.75% 7/15/29 (d) | 1,140,000 | 881,454 | |
| Liquid Telecommunications Financing PLC 5.5% 9/4/26 (d) | 605,000 | 529,375 | |
| Northwest Fiber LLC/Northwest Fiber Finance Sub, Inc.: | |||
| 4.75% 4/30/27 (d) | 280,000 | 230,595 | |
| 6% 2/15/28 (d) | 235,000 | 168,874 | |
| 10.75% 6/1/28 (d) | 365,000 | 324,773 | |
| Qtel International Finance Ltd.: | |||
| 2.625% 4/8/31 (d) | 460,000 | 397,900 | |
| 3.25% 2/21/23 (d) | 450,000 | 448,875 | |
| 5% 10/19/25 (d) | 230,000 | 235,649 | |
| Qwest Corp. 7.25% 9/15/25 | 35,000 | 35,999 | |
| Sable International Finance Ltd. 5.75% 9/7/27 (d) | 1,352,000 | 1,233,430 | |
| Sprint Capital Corp.: | |||
| 6.875% 11/15/28 | 5,882,000 | 6,185,041 | |
| 8.75% 3/15/32 | 1,346,000 | 1,619,884 | |
| Telefonica Celular del Paraguay SA 5.875% 4/15/27 (d) | 455,000 | 410,638 | |
| Telenet Finance Luxembourg Notes SARL 5.5% 3/1/28 (d) | 600,000 | 529,440 | |
| Virgin Media Finance PLC 5% 7/15/30 (d) | 1,385,000 | 1,097,613 | |
| Windstream Escrow LLC 7.75% 8/15/28 (d) | 2,470,000 | 1,988,350 | |
| Zayo Group Holdings, Inc. 4% 3/1/27 (d) | 900,000 | 746,631 | |
| 30,098,853 | |||
| Entertainment - 0.0% | |||
| Roblox Corp. 3.875% 5/1/30 (d) | 410,000 | 332,313 | |
| Interactive Media & Services - 0.1% | |||
| Baidu, Inc.: | |||
| 1.72% 4/9/26 | 460,000 | 420,217 | |
| 2.375% 10/9/30 | 270,000 | 227,462 | |
| Tencent Holdings Ltd.: | |||
| 1.81% 1/26/26 (d) | 240,000 | 221,670 | |
| 2.39% 6/3/30 (d) | 295,000 | 247,855 | |
| 2.88% 4/22/31 (d) | 200,000 | 172,078 | |
| 3.975% 4/11/29 (d) | 180,000 | 170,885 | |
| 1,460,167 | |||
| Media - 3.3% | |||
| Altice Financing SA: | |||
| 5% 1/15/28 (d) | 2,250,000 | 1,813,140 | |
| 5.75% 8/15/29 (d) | 1,125,000 | 902,813 | |
| Block Communications, Inc. 4.875% 3/1/28 (d) | 410,000 | 346,450 | |
| Cable Onda SA 4.5% 1/30/30 (d) | 740,000 | 610,500 | |
| CCO Holdings LLC/CCO Holdings Capital Corp.: | |||
| 4.25% 2/1/31 (d) | 1,005,000 | 819,075 | |
| 4.5% 8/15/30 (d) | 4,690,000 | 3,894,004 | |
| 4.5% 5/1/32 | 665,000 | 538,451 | |
| 4.75% 3/1/30 (d) | 4,810,000 | 4,113,753 | |
| 5% 2/1/28 (d) | 4,665,000 | 4,304,396 | |
| 5.125% 5/1/27 (d) | 1,840,000 | 1,736,500 | |
| 5.375% 6/1/29 (d) | 4,800,000 | 4,290,432 | |
| 5.5% 5/1/26 (d) | 1,225,000 | 1,195,245 | |
| Clear Channel International BV 6.625% 8/1/25 (d) | 965,000 | 897,450 | |
| Clear Channel Outdoor Holdings, Inc. 7.5% 6/1/29 (d) | 570,000 | 409,864 | |
| CSC Holdings LLC: | |||
| 3.375% 2/15/31 (d) | 860,000 | 635,807 | |
| 4.5% 11/15/31 (d) | 1,435,000 | 1,106,600 | |
| 5.375% 2/1/28 (d) | 1,190,000 | 1,029,350 | |
| 6.5% 2/1/29 (d) | 1,320,000 | 1,188,198 | |
| Diamond Sports Group LLC/Diamond Sports Finance Co. 5.375% 8/15/26 (d) | 2,455,000 | 613,750 | |
| DISH DBS Corp.: | |||
| 5.25% 12/1/26 (d) | 685,000 | 536,930 | |
| 5.75% 12/1/28 (d) | 685,000 | 507,181 | |
| Gannett Holdings LLC 6% 11/1/26 (d) | 400,000 | 335,000 | |
| Gray Escrow II, Inc. 5.375% 11/15/31 (d) | 850,000 | 681,046 | |
| LCPR Senior Secured Financing DAC: | |||
| 5.125% 7/15/29 (d) | 1,370,000 | 1,143,950 | |
| 6.75% 10/15/27 (d) | 544,000 | 507,460 | |
| Nexstar Broadcasting, Inc.: | |||
| 4.75% 11/1/28 (d) | 1,335,000 | 1,144,763 | |
| 5.625% 7/15/27 (d) | 1,275,000 | 1,163,438 | |
| Quebecor Media, Inc. 5.75% 1/15/23 | 790,000 | 790,988 | |
| Radiate Holdco LLC/Radiate Financial Service Ltd.: | |||
| 4.5% 9/15/26 (d) | 495,000 | 426,829 | |
| 6.5% 9/15/28 (d) | 1,325,000 | 1,024,059 | |
| Scripps Escrow II, Inc. 3.875% 1/15/29 (d) | 165,000 | 138,277 | |
| Sirius XM Radio, Inc.: | |||
| 3.125% 9/1/26 (d) | 425,000 | 379,198 | |
| 3.875% 9/1/31 (d) | 570,000 | 453,863 | |
| 4% 7/15/28 (d) | 1,125,000 | 973,125 | |
| 5% 8/1/27 (d) | 800,000 | 742,016 | |
| Townsquare Media, Inc. 6.875% 2/1/26 (d) | 325,000 | 289,491 | |
| TV Azteca SA de CV 8.25% 8/9/24 (Reg. S) (e) | 1,500,000 | 720,000 | |
| Univision Communications, Inc.: | |||
| 4.5% 5/1/29 (d) | 570,000 | 477,103 | |
| 7.375% 6/30/30 (d) | 385,000 | 376,338 | |
| Videotron Ltd. 5.125% 4/15/27 (d) | 615,000 | 572,356 | |
| VTR Finance BV 6.375% 7/15/28 (d) | 320,000 | 232,000 | |
| VZ Secured Financing BV 5% 1/15/32 (d) | 1,105,000 | 917,150 | |
| Ziggo Bond Co. BV: | |||
| 5.125% 2/28/30 (d) | 315,000 | 247,089 | |
| 6% 1/15/27 (d) | 635,000 | 561,975 | |
| Ziggo BV 4.875% 1/15/30 (d) | 430,000 | 364,723 | |
| 46,152,126 | |||
| Wireless Telecommunication Services - 0.4% | |||
| AXIAN Telecom 7.375% 2/16/27 (d) | 525,000 | 488,250 | |
| Bharti Airtel International BV 5.35% 5/20/24 (d) | 594,000 | 605,991 | |
| CT Trust 5.125% 2/3/32 (d) | 625,000 | 500,781 | |
| Digicel Group Ltd. 6.75% 3/1/23 (d) | 270,000 | 162,000 | |
| Intelsat Jackson Holdings SA 6.5% 3/15/30 (d) | 1,160,000 | 957,000 | |
| Millicom International Cellular SA 4.5% 4/27/31 (d) | 645,000 | 477,300 | |
| MTN (Mauritius) Investments Ltd.: | |||
| 4.755% 11/11/24 (d) | 170,000 | 164,985 | |
| 6.5% 10/13/26 (d) | 315,000 | 309,350 | |
| Sprint Corp. 7.625% 3/1/26 | 540,000 | 568,958 | |
| T-Mobile U.S.A., Inc. 3.5% 4/15/31 | 220,000 | 189,955 | |
| VimpelCom Holdings BV 7.25% 4/26/23 (d) | 445,000 | 375,747 | |
| VTR Comunicaciones SpA: | |||
| 4.375% 4/15/29 (d) | 210,000 | 142,275 | |
| 5.125% 1/15/28 (d) | 620,000 | 459,498 | |
| 5,402,090 | |||
| TOTAL COMMUNICATION SERVICES | 83,445,549 | ||
| CONSUMER DISCRETIONARY - 4.7% | |||
| Auto Components - 0.2% | |||
| Allison Transmission, Inc. 5.875% 6/1/29 (d) | 420,000 | 390,600 | |
| Dana, Inc. 4.5% 2/15/32 | 410,000 | 302,900 | |
| Exide Technologies: | |||
| 11% 10/31/24 pay-in-kind (c)(d)(e)(f) | 384,000 | 0 | |
| 11% 10/31/24 pay-in-kind (c)(d)(e)(f) | 185,848 | 83,632 | |
| Metalsa SA de CV 3.75% 5/4/31 (d) | 455,000 | 320,206 | |
| Nesco Holdings II, Inc. 5.5% 4/15/29 (d) | 715,000 | 598,813 | |
| PECF USS Intermediate Holding III Corp. 8% 11/15/29 (d) | 250,000 | 198,125 | |
| Tupy Overseas SA 4.5% 2/16/31 (d) | 445,000 | 341,204 | |
| 2,235,480 | |||
| Automobiles - 0.2% | |||
| Ford Motor Co. 3.25% 2/12/32 | 1,335,000 | 989,936 | |
| McLaren Finance PLC 7.5% 8/1/26 (d) | 390,000 | 288,171 | |
| Rivian Holdco & Rivian LLC & Rivian Automotive LLC 6 month U.S. LIBOR + 5.620% 7.1766% 10/15/26 (d)(f)(g) | 1,395,000 | 1,247,130 | |
| 2,525,237 | |||
| Diversified Consumer Services - 0.2% | |||
| Adtalem Global Education, Inc. 5.5% 3/1/28 (d) | 420,000 | 374,850 | |
| GEMS MENASA Cayman Ltd. 7.125% 7/31/26 (d) | 1,130,000 | 1,060,293 | |
| Service Corp. International 4% 5/15/31 | 570,000 | 486,638 | |
| Sotheby's 7.375% 10/15/27 (d) | 295,000 | 273,398 | |
| Sotheby's/Bidfair Holdings, Inc. 5.875% 6/1/29 (d) | 430,000 | 369,077 | |
| TKC Holdings, Inc. 6.875% 5/15/28 (d) | 635,000 | 543,897 | |
| WASH Multifamily Acquisition, Inc. 5.75% 4/15/26 (d) | 475,000 | 447,688 | |
| 3,555,841 | |||
| Hotels, Restaurants & Leisure - 2.2% | |||
| 1011778 BC Unlimited Liability Co./New Red Finance, Inc.: | |||
| 3.875% 1/15/28 (d) | 570,000 | 494,714 | |
| 4% 10/15/30 (d) | 2,320,000 | 1,861,800 | |
| 4.375% 1/15/28 (d) | 560,000 | 489,608 | |
| Affinity Gaming LLC 6.875% 12/15/27 (d) | 250,000 | 210,010 | |
| Bloomin Brands, Inc. / OSI Restaurant Partners LLC 5.125% 4/15/29 (d) | 270,000 | 229,080 | |
| Boyd Gaming Corp. 4.75% 6/15/31 (d) | 715,000 | 604,189 | |
| Caesars Entertainment, Inc.: | |||
| 4.625% 10/15/29 (d) | 835,000 | 649,213 | |
| 6.25% 7/1/25 (d) | 2,520,000 | 2,428,600 | |
| 8.125% 7/1/27 (d) | 3,360,000 | 3,246,600 | |
| Caesars Resort Collection LLC 5.75% 7/1/25 (d) | 840,000 | 803,300 | |
| Carnival Corp.: | |||
| 4% 8/1/28 (d) | 855,000 | 701,100 | |
| 7.625% 3/1/26 (d) | 500,000 | 386,250 | |
| 9.875% 8/1/27 (d) | 1,000,000 | 968,750 | |
| 10.5% 2/1/26 (d) | 730,000 | 728,577 | |
| CDI Escrow Issuer, Inc. 5.75% 4/1/30 (d) | 280,000 | 254,800 | |
| Choice Hotels International, Inc. 5.75% 7/1/22 | 145,000 | 145,000 | |
| Fertitta Entertainment LLC / Fertitta Entertainment Finance Co., Inc.: | |||
| 4.625% 1/15/29 (d) | 1,175,000 | 1,001,688 | |
| 6.75% 1/15/30 (d) | 1,100,000 | 844,250 | |
| GENM Capital Labuan Ltd. 3.882% 4/19/31 (d) | 595,000 | 475,368 | |
| Hilton Domestic Operating Co., Inc.: | |||
| 3.75% 5/1/29 (d) | 330,000 | 279,889 | |
| 4% 5/1/31 (d) | 500,000 | 415,500 | |
| 4.875% 1/15/30 | 975,000 | 881,156 | |
| Hilton Worldwide Finance LLC/Hilton Worldwide Finance Corp. 4.875% 4/1/27 | 435,000 | 409,829 | |
| Jacobs Entertainment, Inc. 6.75% 2/15/29 (d) | 395,000 | 334,025 | |
| Melco Resorts Finance Ltd.: | |||
| 5.25% 4/26/26 (d) | 620,000 | 437,100 | |
| 5.75% 7/21/28 (d) | 335,000 | 214,400 | |
| Merlin Entertainments PLC 5.75% 6/15/26 (d) | 395,000 | 360,439 | |
| MGM Resorts International: | |||
| 4.75% 10/15/28 | 665,000 | 559,232 | |
| 6.75% 5/1/25 | 1,485,000 | 1,457,156 | |
| NagaCorp Ltd. 7.95% 7/6/24 (Reg. S) | 1,000,000 | 896,750 | |
| NCL Corp. Ltd.: | |||
| 5.875% 3/15/26 (d) | 695,000 | 545,499 | |
| 5.875% 2/15/27 (d) | 550,000 | 470,250 | |
| NCL Finance Ltd. 6.125% 3/15/28 (d) | 270,000 | 196,425 | |
| Papa John's International, Inc. 3.875% 9/15/29 (d) | 255,000 | 210,350 | |
| Peninsula Pacific Entertainment LLC 8.5% 11/15/27 (d) | 665,000 | 698,250 | |
| Premier Entertainment Sub LLC: | |||
| 5.625% 9/1/29 (d) | 1,285,000 | 914,869 | |
| 5.875% 9/1/31 (d) | 1,095,000 | 759,944 | |
| Royal Caribbean Cruises Ltd.: | |||
| 5.375% 7/15/27 (d) | 415,000 | 301,651 | |
| 10.875% 6/1/23 (d) | 845,000 | 845,169 | |
| 11.5% 6/1/25 (d) | 734,000 | 754,185 | |
| SeaWorld Parks & Entertainment, Inc. 5.25% 8/15/29 (d) | 560,000 | 473,866 | |
| Station Casinos LLC 4.625% 12/1/31 (d) | 410,000 | 319,800 | |
| Studio City Finance Ltd. 5% 1/15/29 (d) | 320,000 | 159,560 | |
| Vail Resorts, Inc. 6.25% 5/15/25 (d) | 380,000 | 379,533 | |
| Viking Cruises Ltd. 13% 5/15/25 (d) | 570,000 | 584,144 | |
| Voc Escrow Ltd. 5% 2/15/28 (d) | 545,000 | 437,913 | |
| Yum! Brands, Inc. 4.625% 1/31/32 | 590,000 | 518,852 | |
| 31,338,633 | |||
| Household Durables - 0.3% | |||
| Ashton Woods U.S.A. LLC/Ashton Woods Finance Co. 4.625% 4/1/30 (d) | 410,000 | 301,083 | |
| Brookfield Residential Properties, Inc./Brookfield Residential U.S. Corp. 4.875% 2/15/30 (d) | 405,000 | 294,233 | |
| Century Communities, Inc. 3.875% 8/15/29 (d) | 420,000 | 328,524 | |
| Taylor Morrison Communities, Inc./Monarch Communities, Inc. 5.625% 3/1/24 (d) | 65,000 | 63,196 | |
| Tempur Sealy International, Inc.: | |||
| 3.875% 10/15/31 (d) | 735,000 | 551,250 | |
| 4% 4/15/29 (d) | 790,000 | 636,377 | |
| TopBuild Corp. 3.625% 3/15/29 (d) | 305,000 | 240,115 | |
| TRI Pointe Group, Inc./TRI Pointe Holdings, Inc. 5.875% 6/15/24 | 780,000 | 759,011 | |
| TRI Pointe Homes, Inc. 5.7% 6/15/28 | 865,000 | 746,482 | |
| 3,920,271 | |||
| Internet & Direct Marketing Retail - 1.0% | |||
| Alibaba Group Holding Ltd. 2.125% 2/9/31 | 300,000 | 247,707 | |
| Angi Group LLC 3.875% 8/15/28 (d) | 335,000 | 255,068 | |
| B2W Digital Lux SARL 4.375% 12/20/30 (d) | 895,000 | 677,851 | |
| JD.com, Inc. 3.375% 1/14/30 | 850,000 | 776,875 | |
| Meituan: | |||
| 2.125% 10/28/25 (d) | 510,000 | 459,281 | |
| 3.05% 10/28/30 (d) | 335,000 | 249,042 | |
| Millennium Escrow Corp. 6.625% 8/1/26 (d) | 570,000 | 460,023 | |
| Prosus NV: | |||
| 2.031% 8/3/32 (Reg. S) | EUR | 210,000 | 152,398 |
| 3.257% 1/19/27 (d) | 200,000 | 175,000 | |
| 3.68% 1/21/30 (d) | 370,000 | 295,376 | |
| 4.027% 8/3/50 (d) | 595,000 | 371,429 | |
| Terrier Media Buyer, Inc. 8.875% 12/15/27 (d) | 2,160,000 | 1,706,422 | |
| Uber Technologies, Inc.: | |||
| 4.5% 8/15/29 (d) | 1,260,000 | 1,036,350 | |
| 6.25% 1/15/28 (d) | 545,000 | 504,038 | |
| 7.5% 9/15/27 (d) | 2,950,000 | 2,857,901 | |
| 8% 11/1/26 (d) | 4,260,000 | 4,240,830 | |
| 14,465,591 | |||
| Multiline Retail - 0.1% | |||
| Macy's Retail Holdings LLC: | |||
| 5.875% 3/15/30 (d) | 290,000 | 243,323 | |
| 6.125% 3/15/32 (d) | 280,000 | 233,800 | |
| Nordstrom, Inc.: | |||
| 4.25% 8/1/31 | 1,160,000 | 879,083 | |
| 4.375% 4/1/30 | 175,000 | 136,063 | |
| 5% 1/15/44 | 80,000 | 57,000 | |
| 6.95% 3/15/28 | 25,000 | 23,656 | |
| 1,572,925 | |||
| Specialty Retail - 0.5% | |||
| Arko Corp. 5.125% 11/15/29 (d) | 415,000 | 314,374 | |
| Asbury Automotive Group, Inc.: | |||
| 4.5% 3/1/28 | 184,000 | 159,620 | |
| 4.625% 11/15/29 (d) | 450,000 | 371,813 | |
| 4.75% 3/1/30 | 184,000 | 151,294 | |
| 5% 2/15/32 (d) | 485,000 | 396,488 | |
| At Home Group, Inc. 4.875% 7/15/28 (d) | 285,000 | 206,625 | |
| Bath & Body Works, Inc.: | |||
| 6.625% 10/1/30 (d) | 330,000 | 285,034 | |
| 6.75% 7/1/36 | 1,575,000 | 1,259,843 | |
| 6.875% 11/1/35 | 430,000 | 349,375 | |
| 7.5% 6/15/29 | 500,000 | 455,028 | |
| Carvana Co.: | |||
| 4.875% 9/1/29 (d) | 980,000 | 557,233 | |
| 5.5% 4/15/27 (d) | 590,000 | 380,749 | |
| Foot Locker, Inc. 4% 10/1/29 (d) | 280,000 | 211,763 | |
| LCM Investments Holdings 4.875% 5/1/29 (d) | 310,000 | 235,941 | |
| Michaels Companies, Inc. 5.25% 5/1/28 (d) | 685,000 | 538,389 | |
| Victoria's Secret & Co. 4.625% 7/15/29 (d) | 1,065,000 | 802,488 | |
| 6,676,057 | |||
| Textiles, Apparel & Luxury Goods - 0.0% | |||
| Crocs, Inc.: | |||
| 4.125% 8/15/31 (d) | 280,000 | 198,172 | |
| 4.25% 3/15/29 (d) | 435,000 | 321,761 | |
| Kontoor Brands, Inc. 4.125% 11/15/29 (d) | 240,000 | 190,589 | |
| 710,522 | |||
| TOTAL CONSUMER DISCRETIONARY | 67,000,557 | ||
| CONSUMER STAPLES - 1.7% | |||
| Beverages - 0.0% | |||
| Central American Bottling Corp. 5.25% 4/27/29 (d) | 465,000 | 409,142 | |
| Triton Water Holdings, Inc. 6.25% 4/1/29 (d) | 315,000 | 223,650 | |
| 632,792 | |||
| Food & Staples Retailing - 0.8% | |||
| Albertsons Companies LLC/Safeway, Inc./New Albertson's, Inc./Albertson's LLC: | |||
| 3.5% 3/15/29 (d) | 525,000 | 424,890 | |
| 4.625% 1/15/27 (d) | 1,310,000 | 1,170,249 | |
| 4.875% 2/15/30 (d) | 5,365,000 | 4,602,312 | |
| C&S Group Enterprises LLC 5% 12/15/28 (d) | 510,000 | 378,866 | |
| KeHE Distributors LLC / KeHE Finance Corp. 8.625% 10/15/26 (d) | 420,000 | 419,737 | |
| NBM U.S. Holdings, Inc. 6.625% 8/6/29 (d) | 1,185,000 | 1,136,341 | |
| Nestle Finance International Ltd. 1.5% 3/29/35 (Reg. S) | EUR | 1,005,000 | 892,136 |
| Performance Food Group, Inc.: | |||
| 4.25% 8/1/29 (d) | 400,000 | 334,000 | |
| 5.5% 10/15/27 (d) | 475,000 | 439,729 | |
| SEG Holding LLC/SEG Finance Corp. 5.625% 10/15/28 (d) | 665,000 | 595,907 | |
| United Natural Foods, Inc. 6.75% 10/15/28 (d) | 465,000 | 434,562 | |
| 10,828,729 | |||
| Food Products - 0.8% | |||
| Adecoagro SA 6% 9/21/27 (d) | 785,000 | 716,950 | |
| Camposol SA 6% 2/3/27 (d) | 225,000 | 189,042 | |
| Chobani LLC/Finance Corp., Inc. 4.625% 11/15/28 (d) | 375,000 | 316,875 | |
| Darling Ingredients, Inc. 6% 6/15/30 (d) | 375,000 | 373,744 | |
| JBS Finance Luxembourg SARL 2.5% 1/15/27 (d) | 250,000 | 216,935 | |
| JBS U.S.A. Lux SA / JBS Food Co.: | |||
| 5.5% 1/15/30 (d) | 1,085,000 | 1,026,735 | |
| 6.5% 4/15/29 (d) | 293,000 | 294,758 | |
| Lamb Weston Holdings, Inc.: | |||
| 4.125% 1/31/30 (d) | 555,000 | 480,386 | |
| 4.375% 1/31/32 (d) | 275,000 | 239,250 | |
| Pilgrim's Pride Corp. 4.25% 4/15/31 (d) | 1,020,000 | 851,170 | |
| Post Holdings, Inc.: | |||
| 4.5% 9/15/31 (d) | 1,215,000 | 993,688 | |
| 4.625% 4/15/30 (d) | 3,850,000 | 3,248,515 | |
| 5.5% 12/15/29 (d) | 1,085,000 | 969,968 | |
| 5.75% 3/1/27 (d) | 143,000 | 138,531 | |
| Simmons Foods, Inc. 4.625% 3/1/29 (d) | 430,000 | 363,522 | |
| TreeHouse Foods, Inc. 4% 9/1/28 | 220,000 | 179,243 | |
| 10,599,312 | |||
| Household Products - 0.0% | |||
| Diamond BC BV 4.625% 10/1/29 (d) | 335,000 | 267,900 | |
| Spectrum Brands Holdings, Inc. 3.875% 3/15/31 (d) | 430,000 | 346,488 | |
| 614,388 | |||
| Personal Products - 0.1% | |||
| BellRing Brands, Inc. 7% 3/15/30 (d) | 685,000 | 645,613 | |
| GSK Consumer Healthcare Capital 2.125% 3/29/34 (Reg. S) | EUR | 593,000 | 542,071 |
| Natura Cosmeticos SA 4.125% 5/3/28 (d) | 670,000 | 552,817 | |
| 1,740,501 | |||
| TOTAL CONSUMER STAPLES | 24,415,722 | ||
| ENERGY - 6.3% | |||
| Energy Equipment & Services - 0.6% | |||
| CGG SA 8.75% 4/1/27 (d) | 590,000 | 501,500 | |
| Exterran Energy Solutions LP 8.125% 5/1/25 | 575,000 | 544,813 | |
| Guara Norte SARL 5.198% 6/15/34 (d) | 468,075 | 379,814 | |
| Nabors Industries Ltd.: | |||
| 7.25% 1/15/26 (d) | 595,000 | 527,676 | |
| 7.5% 1/15/28 (d) | 510,000 | 438,600 | |
| Nine Energy Service, Inc. 8.75% 11/1/23 (d) | 300,000 | 190,039 | |
| NuStar Logistics LP 6% 6/1/26 | 640,000 | 598,400 | |
| Oleoducto Central SA 4% 7/14/27 (d) | 900,000 | 744,670 | |
| Southern Gas Corridor CJSC 6.875% 3/24/26 (d) | 985,000 | 966,531 | |
| State Oil Co. of Azerbaijan Republic: | |||
| 4.75% 3/13/23 (Reg. S) | 200,000 | 199,163 | |
| 6.95% 3/18/30 (Reg. S) | 400,000 | 378,420 | |
| Summit Midstream Holdings LLC: | |||
| 5.75% 4/15/25 | 285,000 | 223,013 | |
| 8.5% (d)(h) | 415,000 | 372,595 | |
| The Oil and Gas Holding Co.: | |||
| 7.5% 10/25/27 (d) | 665,000 | 669,489 | |
| 7.625% 11/7/24 (d) | 855,000 | 879,474 | |
| 8.375% 11/7/28 (d) | 180,000 | 189,934 | |
| 7,804,131 | |||
| Oil, Gas & Consumable Fuels - 5.7% | |||
| Antero Midstream Partners LP/Antero Midstream Finance Corp.: | |||
| 5.375% 6/15/29 (d) | 430,000 | 385,091 | |
| 5.75% 1/15/28 (d) | 955,000 | 869,451 | |
| Callon Petroleum Co. 6.125% 10/1/24 | 225,000 | 228,465 | |
| Canacol Energy Ltd. 5.75% 11/24/28 (d) | 380,000 | 306,375 | |
| Cheniere Energy Partners LP: | |||
| 3.25% 1/31/32 (d) | 420,000 | 330,750 | |
| 4% 3/1/31 | 910,000 | 773,773 | |
| Cheniere Energy, Inc. 4.625% 10/15/28 | 1,325,000 | 1,193,255 | |
| Chesapeake Energy Corp.: | |||
| 5.875% 2/1/29 (d) | 310,000 | 292,330 | |
| 6.75% 4/15/29 (d) | 440,000 | 425,493 | |
| 7% 10/1/24 (c)(e) | 360,000 | 0 | |
| 8% 1/15/25 (c)(e) | 180,000 | 0 | |
| 8% 6/15/27 (c)(e) | 115,000 | 0 | |
| Citgo Holding, Inc. 9.25% 8/1/24 (d) | 2,195,000 | 2,123,663 | |
| Citgo Petroleum Corp.: | |||
| 6.375% 6/15/26 (d) | 470,000 | 433,890 | |
| 7% 6/15/25 (d) | 1,340,000 | 1,296,450 | |
| CNX Midstream Partners LP 4.75% 4/15/30 (d) | 295,000 | 247,800 | |
| CNX Resources Corp. 6% 1/15/29 (d) | 315,000 | 294,273 | |
| Colgate Energy Partners III LLC 5.875% 7/1/29 (d) | 405,000 | 354,881 | |
| Comstock Resources, Inc.: | |||
| 5.875% 1/15/30 (d) | 1,185,000 | 1,019,100 | |
| 6.75% 3/1/29 (d) | 1,030,000 | 922,293 | |
| CQP Holdco LP / BIP-V Chinook Holdco LLC 5.5% 6/15/31 (d) | 1,265,000 | 1,077,198 | |
| Crestwood Midstream Partners LP/Crestwood Midstream Finance Corp.: | |||
| 5.625% 5/1/27 (d) | 960,000 | 854,400 | |
| 5.75% 4/1/25 | 250,000 | 233,750 | |
| 6% 2/1/29 (d) | 1,685,000 | 1,470,297 | |
| CrownRock LP/CrownRock Finance, Inc. 5% 5/1/29 (d) | 245,000 | 219,724 | |
| CVR Energy, Inc.: | |||
| 5.25% 2/15/25 (d) | 895,000 | 822,872 | |
| 5.75% 2/15/28 (d) | 2,320,000 | 2,068,748 | |
| DCP Midstream Operating LP 5.85% 5/21/43 (d)(f) | 885,000 | 743,531 | |
| Delek Overriding Royalty Levia 7.494% 12/30/23 (Reg. S) (d) | 870,000 | 870,000 | |
| DT Midstream, Inc.: | |||
| 4.125% 6/15/29 (d) | 430,000 | 364,425 | |
| 4.375% 6/15/31 (d) | 430,000 | 360,125 | |
| EG Global Finance PLC 8.5% 10/30/25 (d) | 855,000 | 828,281 | |
| EIG Pearl Holdings SARL 3.545% 8/31/36 (d) | 1,090,000 | 934,675 | |
| Endeavor Energy Resources LP/EER Finance, Inc.: | |||
| 5.75% 1/30/28 (d) | 880,000 | 838,332 | |
| 6.625% 7/15/25 (d) | 335,000 | 336,642 | |
| Energean Israel Finance Ltd. 4.875% 3/30/26 (Reg. S) (d) | 570,000 | 503,082 | |
| Energean PLC 6.5% 4/30/27 (d) | 550,000 | 485,994 | |
| Energy Transfer LP 5.5% 6/1/27 | 860,000 | 880,135 | |
| FEL Energy VI SARL 5.75% 12/1/40 (d) | 268,438 | 195,087 | |
| Galaxy Pipeline Assets BidCo Ltd.: | |||
| 2.16% 3/31/34 (d) | 374,735 | 318,525 | |
| 2.625% 3/31/36 (d) | 1,080,000 | 872,978 | |
| GeoPark Ltd. 6.5% 9/21/24 (d) | 322,000 | 326,689 | |
| Hess Midstream Partners LP: | |||
| 4.25% 2/15/30 (d) | 460,000 | 385,234 | |
| 5.125% 6/15/28 (d) | 595,000 | 534,013 | |
| 5.5% 10/15/30 (d) | 275,000 | 246,813 | |
| 5.625% 2/15/26 (d) | 795,000 | 757,238 | |
| Hilcorp Energy I LP/Hilcorp Finance Co. 6.25% 11/1/28 (d) | 590,000 | 556,081 | |
| Holly Energy Partners LP/Holly Energy Finance Corp.: | |||
| 5% 2/1/28 (d) | 400,000 | 342,576 | |
| 6.375% 4/15/27 (d) | 280,000 | 263,553 | |
| Indika Energy Capital IV Pte Ltd. 8.25% 10/22/25 (d) | 345,000 | 333,788 | |
| KazMunaiGaz National Co.: | |||
| 3.5% 4/14/33 (d) | 335,000 | 239,860 | |
| 4.75% 4/24/25 (d) | 105,000 | 98,129 | |
| 5.75% 4/19/47 (d) | 170,000 | 129,200 | |
| Kosmos Energy Ltd. 7.125% 4/4/26 (d) | 1,610,000 | 1,355,218 | |
| Leviathan Bond Ltd.: | |||
| 5.75% 6/30/23 (Reg. S) (d) | 370,000 | 364,570 | |
| 6.125% 6/30/25 (Reg. S) (d) | 485,000 | 455,270 | |
| MC Brazil Downstream Trading SARL 7.25% 6/30/31 (d) | 625,000 | 500,000 | |
| Medco Laurel Tree Pte Ltd. 6.95% 11/12/28 (d) | 640,000 | 531,200 | |
| Medco Oak Tree Pte Ltd. 7.375% 5/14/26 (d) | 105,000 | 95,288 | |
| Medco Platinum Road Pte Ltd. 6.75% 1/30/25 (d) | 485,000 | 449,625 | |
| MEG Energy Corp. 7.125% 2/1/27 (d) | 595,000 | 599,213 | |
| Mesquite Energy, Inc. 7.25% 2/15/23 (c)(d)(e) | 1,063,000 | 0 | |
| Murphy Oil U.S.A., Inc.: | |||
| 4.75% 9/15/29 | 370,000 | 333,485 | |
| 5.625% 5/1/27 | 305,000 | 298,900 | |
| NAK Naftogaz Ukraine: | |||
| 7.375% 7/19/22 (Reg. S) | 655,000 | 494,525 | |
| 7.625% 11/8/26 (d) | 230,000 | 69,403 | |
| New Fortress Energy, Inc.: | |||
| 6.5% 9/30/26 (d) | 1,035,000 | 937,463 | |
| 6.75% 9/15/25 (d) | 950,000 | 897,750 | |
| NGL Energy Partners LP/NGL Energy Finance Corp. 7.5% 4/15/26 | 195,000 | 145,817 | |
| NGPL PipeCo LLC 4.875% 8/15/27 (d) | 150,000 | 148,401 | |
| Nostrum Oil & Gas Finance BV 8% 12/31/49 (d)(e) | 2,620,000 | 643,210 | |
| Occidental Petroleum Corp.: | |||
| 3.5% 8/15/29 | 370,000 | 330,514 | |
| 5.875% 9/1/25 | 670,000 | 667,086 | |
| 6.2% 3/15/40 | 350,000 | 344,750 | |
| 6.375% 9/1/28 | 670,000 | 678,375 | |
| 6.45% 9/15/36 | 1,171,000 | 1,200,275 | |
| 6.6% 3/15/46 | 705,000 | 748,710 | |
| 6.625% 9/1/30 | 1,340,000 | 1,380,200 | |
| 7.2% 3/15/29 | 240,000 | 247,200 | |
| 7.5% 5/1/31 | 65,000 | 69,875 | |
| Parkland Corp.: | |||
| 4.5% 10/1/29 (d) | 440,000 | 356,682 | |
| 4.625% 5/1/30 (d) | 550,000 | 446,178 | |
| PBF Holding Co. LLC/PBF Finance Corp.: | |||
| 6% 2/15/28 | 1,445,000 | 1,224,710 | |
| 7.25% 6/15/25 | 1,145,000 | 1,070,289 | |
| 9.25% 5/15/25 (d) | 2,755,000 | 2,885,863 | |
| PBF Logistics LP/PBF Logistics Finance, Inc. 6.875% 5/15/23 | 435,000 | 428,475 | |
| PDC Energy, Inc. 6.125% 9/15/24 | 100,000 | 99,320 | |
| Petrobras Global Finance BV: | |||
| 6.75% 6/3/50 | 430,000 | 371,950 | |
| 6.875% 1/20/40 | 309,000 | 291,387 | |
| Petroleos de Venezuela SA: | |||
| 5.375% 4/12/27 (e) | 480,000 | 26,400 | |
| 6% 5/16/24 (d)(e) | 585,000 | 32,175 | |
| 6% 11/15/26 (d)(e) | 930,000 | 51,150 | |
| 12.75% 12/31/49 (d)(e) | 110,000 | 6,050 | |
| Petroleos Mexicanos: | |||
| 3.5% 1/30/23 | 750,000 | 735,938 | |
| 4.875% 1/18/24 | 1,750,000 | 1,702,750 | |
| 6.5% 3/13/27 | 240,000 | 207,180 | |
| 6.5% 6/2/41 | 170,000 | 105,910 | |
| 6.625% 6/15/35 | 1,965,000 | 1,342,586 | |
| 6.7% 2/16/32 | 821,000 | 621,908 | |
| 6.75% 9/21/47 | 798,000 | 488,775 | |
| 6.875% 10/16/25 | 520,000 | 483,600 | |
| 6.95% 1/28/60 | 545,000 | 335,448 | |
| 7.69% 1/23/50 | 3,773,000 | 2,518,478 | |
| 8.625% 12/1/23 (f) | 250,000 | 247,656 | |
| Petronas Capital Ltd.: | |||
| 3.404% 4/28/61 (d) | 295,000 | 222,238 | |
| 3.5% 4/21/30 (d) | 230,000 | 217,327 | |
| PT Adaro Indonesia 4.25% 10/31/24 (d) | 790,000 | 746,451 | |
| Qatar Petroleum: | |||
| 1.375% 9/12/26 (d) | 1,260,000 | 1,137,465 | |
| 2.25% 7/12/31 (d) | 1,135,000 | 970,425 | |
| 3.125% 7/12/41 (d) | 630,000 | 495,259 | |
| 3.3% 7/12/51 (d) | 625,000 | 483,711 | |
| SA Global Sukuk Ltd. 1.602% 6/17/26 (d) | 1,365,000 | 1,246,245 | |
| Saudi Arabian Oil Co.: | |||
| 1.625% 11/24/25 (d) | 940,000 | 869,383 | |
| 3.5% 4/16/29 (d) | 2,130,000 | 2,031,488 | |
| 3.5% 11/24/70 (d) | 460,000 | 323,150 | |
| 4.25% 4/16/39 (d) | 1,260,000 | 1,163,610 | |
| 4.375% 4/16/49 (d) | 355,000 | 314,796 | |
| Sibur Securities DAC 2.95% 7/8/25 (d) | 225,000 | 67,500 | |
| Sinopec Group Overseas Development Ltd.: | |||
| 1.45% 1/8/26 (d) | 355,000 | 328,641 | |
| 2.7% 5/13/30 (d) | 220,000 | 200,629 | |
| SM Energy Co.: | |||
| 5.625% 6/1/25 | 330,000 | 311,850 | |
| 6.625% 1/15/27 | 1,125,000 | 1,051,875 | |
| 6.75% 9/15/26 | 250,000 | 235,841 | |
| Southwestern Energy Co.: | |||
| 5.375% 3/15/30 | 560,000 | 515,200 | |
| 5.95% 1/23/25 (f) | 14,000 | 13,830 | |
| 7.75% 10/1/27 | 680,000 | 693,600 | |
| SUEK Securities DAC 3.375% 9/15/26 (d)(e) | 890,000 | 44,500 | |
| Sunoco LP/Sunoco Finance Corp.: | |||
| 4.5% 5/15/29 | 605,000 | 498,692 | |
| 4.5% 4/30/30 (d) | 555,000 | 448,098 | |
| Tallgrass Energy Partners LP / Tallgrass Energy Finance Corp.: | |||
| 6% 9/1/31 (d) | 420,000 | 346,500 | |
| 7.5% 10/1/25 (d) | 495,000 | 479,048 | |
| Targa Resources Partners LP/Targa Resources Partners Finance Corp. 4.875% 2/1/31 | 625,000 | 569,752 | |
| Teine Energy Ltd. 6.875% 4/15/29 (d) | 445,000 | 413,850 | |
| Tengizchevroil Finance Co. International Ltd. 3.25% 8/15/30 (d) | 650,000 | 479,375 | |
| Tennessee Gas Pipeline Co. 7.625% 4/1/37 | 50,000 | 55,901 | |
| Tullow Oil PLC: | |||
| 7% 3/1/25 (d) | 180,000 | 148,500 | |
| 10.25% 5/15/26 (d) | 991,000 | 946,405 | |
| Uzbekneftegaz JSC 4.75% 11/16/28 (d) | 200,000 | 156,250 | |
| Venture Global Calcasieu Pass LLC: | |||
| 3.875% 8/15/29 (d) | 355,000 | 310,527 | |
| 4.125% 8/15/31 (d) | 355,000 | 303,355 | |
| YPF SA: | |||
| 8.5% 3/23/25 (d) | 469,500 | 363,070 | |
| 8.75% 4/4/24 (d) | 1,102,500 | 894,265 | |
| 81,155,091 | |||
| TOTAL ENERGY | 88,959,222 | ||
| FINANCIALS - 3.9% | |||
| Banks - 0.3% | |||
| Access Bank PLC 6.125% 9/21/26 (d) | 630,000 | 507,071 | |
| Banco de Reservas de La Republica Dominicana 7% 2/1/23 (d) | 90,000 | 89,888 | |
| BBVA Bancomer SA Texas Branch 6.75% 9/30/22 (d) | 305,000 | 304,909 | |
| Development Bank of Mongolia 7.25% 10/23/23 (d) | 105,000 | 101,378 | |
| Georgia Bank Joint Stock Co. 6% 7/26/23 (d) | 825,000 | 805,613 | |
| National Bank of Uzbekistan 4.85% 10/21/25 (Reg. S) | 225,000 | 205,777 | |
| Nordea Bank ABP 2.5% 5/23/29 (Reg. S) | EUR | 1,344,000 | 1,335,744 |
| Oschadbank Via SSB #1 PLC 9.375% 3/10/23 (d) | 80,000 | 44,000 | |
| Svenska Handelsbanken AB 3.25% 6/1/33 (Reg. S) (f) | EUR | 945,000 | 945,669 |
| 4,340,049 | |||
| Capital Markets - 0.6% | |||
| AssuredPartners, Inc.: | |||
| 5.625% 1/15/29 (d) | 390,000 | 312,207 | |
| 7% 8/15/25 (d) | 245,000 | 230,120 | |
| Blackstone Holdings Finance Co. LLC 3.5% 6/1/34 (Reg. S) | EUR | 1,204,000 | 1,176,275 |
| Broadstreet Partners, Inc. 5.875% 4/15/29 (d) | 725,000 | 567,247 | |
| Coinbase Global, Inc.: | |||
| 3.375% 10/1/28 (d) | 420,000 | 264,371 | |
| 3.625% 10/1/31 (d) | 420,000 | 235,874 | |
| Credit Suisse Group AG 2.875% 4/2/32 (Reg. S) (f) | EUR | 1,840,000 | 1,619,573 |
| Deutsche Bank AG 4% 6/24/32 (Reg. S) (f) | EUR | 1,200,000 | 1,150,020 |
| Deutsche Borse AG 1.5% 4/4/32 (Reg. S) | EUR | 700,000 | 657,296 |
| Hightower Holding LLC 6.75% 4/15/29 (d) | 285,000 | 214,289 | |
| Jane Street Group LLC/JSG Finance, Inc. 4.5% 11/15/29 (d) | 395,000 | 351,550 | |
| Lions Gate Capital Holdings LLC 5.5% 4/15/29 (d) | 445,000 | 347,100 | |
| MSCI, Inc.: | |||
| 3.25% 8/15/33 (d) | 420,000 | 334,778 | |
| 4% 11/15/29 (d) | 340,000 | 301,352 | |
| 7,762,052 | |||
| Consumer Finance - 1.3% | |||
| Ally Financial, Inc.: | |||
| 8% 11/1/31 | 823,000 | 900,515 | |
| 8% 11/1/31 | 5,273,000 | 5,861,808 | |
| Ford Motor Credit Co. LLC: | |||
| 3.375% 11/13/25 | 1,585,000 | 1,427,245 | |
| 3.625% 6/17/31 | 740,000 | 573,500 | |
| 4% 11/13/30 | 2,525,000 | 2,045,894 | |
| 5.113% 5/3/29 | 610,000 | 546,849 | |
| OneMain Finance Corp.: | |||
| 4% 9/15/30 | 330,000 | 244,613 | |
| 5.375% 11/15/29 | 500,000 | 405,180 | |
| 6.625% 1/15/28 | 385,000 | 344,098 | |
| 6.875% 3/15/25 | 2,580,000 | 2,445,221 | |
| 7.125% 3/15/26 | 3,405,000 | 3,159,208 | |
| Shriram Transport Finance Co. Ltd.: | |||
| 4.15% 7/18/25 (d) | 500,000 | 437,125 | |
| 5.1% 7/16/23 (d) | 120,000 | 115,200 | |
| 18,506,456 | |||
| Diversified Financial Services - 1.0% | |||
| 1MDB Global Investments Ltd. 4.4% 3/9/23 | 4,000,000 | 3,878,250 | |
| Altus Midstream LP 5.875% 6/15/30 (d) | 425,000 | 404,861 | |
| Compass Group Diversified Holdings LLC 5% 1/15/32 (d) | 275,000 | 212,322 | |
| Enviva Partners LP / Enviva Partners Finance Corp. 6.5% 1/15/26 (d) | 595,000 | 574,919 | |
| Icahn Enterprises LP/Icahn Enterprises Finance Corp.: | |||
| 4.375% 2/1/29 | 630,000 | 509,141 | |
| 5.25% 5/15/27 | 2,150,000 | 1,902,750 | |
| 6.25% 5/15/26 | 1,305,000 | 1,213,650 | |
| 6.375% 12/15/25 | 2,785,000 | 2,632,688 | |
| Intercement Financial Operatio 5.75% 7/17/24 (d) | 370,000 | 279,766 | |
| James Hardie International Finance Ltd. 5% 1/15/28 (d) | 455,000 | 404,950 | |
| MDGH GMTN RSC Ltd. 2.875% 11/7/29 (d) | 530,000 | 478,756 | |
| OEC Finance Ltd.: | |||
| 4.375% 10/25/29 pay-in-kind (d) | 367,028 | 10,827 | |
| 5.25% 12/27/33 pay-in-kind (d) | 336,672 | 10,437 | |
| PTT Treasury Center Co. Ltd. 3.7% 7/16/70 (d) | 230,000 | 160,885 | |
| Shift4 Payments LLC / Shift4 Payments Finance Sub, Inc. 4.625% 11/1/26 (d) | 225,000 | 199,123 | |
| Sparc Em Spc 0% 12/5/22 (d) | 24,805 | 24,399 | |
| VMED O2 UK Financing I PLC 4.75% 7/15/31 (d) | 995,000 | 803,811 | |
| 13,701,535 | |||
| Insurance - 0.7% | |||
| Acrisure LLC / Acrisure Finance, Inc.: | |||
| 6% 8/1/29 (d) | 425,000 | 332,686 | |
| 7% 11/15/25 (d) | 1,805,000 | 1,623,476 | |
| 10.125% 8/1/26 (d) | 605,000 | 587,576 | |
| Alliant Holdings Intermediate LLC: | |||
| 4.25% 10/15/27 (d) | 665,000 | 575,604 | |
| 5.875% 11/1/29 (d) | 415,000 | 344,371 | |
| 6.75% 10/15/27 (d) | 965,000 | 856,322 | |
| Allianz SE 4.252% 7/5/52 (Reg. S) (f) | EUR | 1,800,000 | 1,803,976 |
| AmWINS Group, Inc. 4.875% 6/30/29 (d) | 415,000 | 339,853 | |
| AXA SA 4.25% 3/10/43 (Reg. S) (f) | EUR | 1,492,000 | 1,474,726 |
| Berkshire Hathaway Finance Corp. 2% 3/18/34 | EUR | 1,172,000 | 1,050,993 |
| HUB International Ltd.: | |||
| 5.625% 12/1/29 (d) | 595,000 | 491,501 | |
| 7% 5/1/26 (d) | 595,000 | 559,538 | |
| MAPFRE SA 2.875% 4/13/30 (Reg. S) | EUR | 200,000 | 185,194 |
| Sagicor Financial Co. Ltd. 5.3% 5/13/28 (d) | 345,000 | 315,848 | |
| 10,541,664 | |||
| Thrifts & Mortgage Finance - 0.0% | |||
| MGIC Investment Corp. 5.25% 8/15/28 | 465,000 | 416,384 | |
| TOTAL FINANCIALS | 55,268,140 | ||
| HEALTH CARE - 2.1% | |||
| Biotechnology - 0.0% | |||
| Grifols Escrow Issuer SA 4.75% 10/15/28 (d) | 280,000 | 242,900 | |
| Health Care Equipment & Supplies - 0.1% | |||
| American Medical Systems Europe 1.875% 3/8/34 | EUR | 772,000 | 672,423 |
| Avantor Funding, Inc. 3.875% 11/1/29 (d) | 275,000 | 240,529 | |
| Hologic, Inc. 4.625% 2/1/28 (d) | 215,000 | 201,186 | |
| 1,114,138 | |||
| Health Care Providers & Services - 1.6% | |||
| 180 Medical, Inc. 3.875% 10/15/29(d) | 300,000 | 259,500 | |
| Cano Health, Inc. 6.25% 10/1/28 (d) | 185,000 | 151,292 | |
| Centene Corp.: | |||
| 4.25% 12/15/27 | 615,000 | 574,084 | |
| 4.625% 12/15/29 | 2,150,000 | 2,004,875 | |
| Community Health Systems, Inc.: | |||
| 4.75% 2/15/31 (d) | 1,150,000 | 841,971 | |
| 5.25% 5/15/30 (d) | 825,000 | 626,917 | |
| 5.625% 3/15/27 (d) | 400,000 | 338,548 | |
| 6% 1/15/29 (d) | 485,000 | 401,784 | |
| 6.125% 4/1/30 (d) | 1,145,000 | 698,450 | |
| 8% 3/15/26 (d) | 3,270,000 | 2,977,956 | |
| DaVita HealthCare Partners, Inc.: | |||
| 3.75% 2/15/31 (d) | 210,000 | 150,568 | |
| 4.625% 6/1/30 (d) | 1,590,000 | 1,239,981 | |
| HealthEquity, Inc. 4.5% 10/1/29 (d) | 295,000 | 258,125 | |
| Horizon Pharma U.S.A., Inc. 5.5% 8/1/27 (d) | 650,000 | 626,828 | |
| ModivCare Escrow Issuer, Inc. 5% 10/1/29 (d) | 325,000 | 262,516 | |
| Modivcare, Inc. 5.875% 11/15/25 (d) | 485,000 | 446,200 | |
| Molina Healthcare, Inc.: | |||
| 3.875% 11/15/30 (d) | 640,000 | 547,059 | |
| 3.875% 5/15/32 (d) | 550,000 | 461,222 | |
| 4.375% 6/15/28 (d) | 465,000 | 415,371 | |
| Option Care Health, Inc. 4.375% 10/31/29 (d) | 300,000 | 257,250 | |
| Radiology Partners, Inc. 9.25% 2/1/28 (d) | 2,690,000 | 2,020,244 | |
| RP Escrow Issuer LLC 5.25% 12/15/25 (d) | 615,000 | 531,562 | |
| Tenet Healthcare Corp.: | |||
| 4.625% 7/15/24 | 126,000 | 120,926 | |
| 4.625% 9/1/24 (d) | 650,000 | 624,000 | |
| 4.875% 1/1/26 (d) | 1,625,000 | 1,495,000 | |
| 5.125% 11/1/27 (d) | 975,000 | 877,500 | |
| 6.125% 10/1/28 (d) | 1,140,000 | 975,589 | |
| 6.125% 6/15/30 (d) | 845,000 | 779,580 | |
| 6.25% 2/1/27 (d) | 1,850,000 | 1,702,768 | |
| 22,667,666 | |||
| Health Care Technology - 0.1% | |||
| IQVIA, Inc. 5% 5/15/27 (d) | 640,000 | 605,504 | |
| Minerva Merger Sub, Inc. 6.5% 2/15/30 (d) | 555,000 | 461,532 | |
| 1,067,036 | |||
| Life Sciences Tools & Services - 0.1% | |||
| Charles River Laboratories International, Inc.: | |||
| 3.75% 3/15/29 (d) | 475,000 | 412,229 | |
| 4% 3/15/31 (d) | 605,000 | 515,731 | |
| 4.25% 5/1/28 (d) | 185,000 | 166,187 | |
| Syneos Health, Inc. 3.625% 1/15/29 (d) | 500,000 | 423,414 | |
| 1,517,561 | |||
| Pharmaceuticals - 0.2% | |||
| Bayer AG 5.375% 3/25/82 (Reg. S) (f) | EUR | 800,000 | 698,983 |
| Catalent Pharma Solutions: | |||
| 3.5% 4/1/30 (d) | 280,000 | 228,460 | |
| 5% 7/15/27 (d) | 205,000 | 192,973 | |
| Organon & Co. / Organon Foreign Debt Co-Issuer BV: | |||
| 4.125% 4/30/28 (d) | 1,015,000 | 898,275 | |
| 5.125% 4/30/31 (d) | 885,000 | 763,605 | |
| Teva Pharmaceutical Finance Co. BV 2.95% 12/18/22 | 250,000 | 246,250 | |
| Teva Pharmaceutical Finance Netherlands III BV: | |||
| 4.75% 5/9/27 | 555,000 | 474,151 | |
| 5.125% 5/9/29 | 275,000 | 226,531 | |
| 3,729,228 | |||
| TOTAL HEALTH CARE | 30,338,529 | ||
| INDUSTRIALS - 3.7% | |||
| Aerospace & Defense - 1.4% | |||
| Bombardier, Inc.: | |||
| 6% 2/15/28 (d) | 280,000 | 209,832 | |
| 7.125% 6/15/26 (d) | 570,000 | 464,550 | |
| 7.5% 3/15/25 (d) | 776,000 | 701,310 | |
| 7.875% 4/15/27 (d) | 2,685,000 | 2,212,325 | |
| BWX Technologies, Inc. 4.125% 6/30/28 (d) | 630,000 | 560,700 | |
| DAE Funding LLC 1.55% 8/1/24 (d) | 650,000 | 606,125 | |
| Embraer Netherlands Finance BV 5.05% 6/15/25 | 715,000 | 690,556 | |
| Moog, Inc. 4.25% 12/15/27 (d) | 185,000 | 160,301 | |
| Rolls-Royce PLC 5.75% 10/15/27 (d) | 650,000 | 585,845 | |
| Spirit Aerosystems, Inc. 7.5% 4/15/25 (d) | 905,000 | 840,519 | |
| TransDigm UK Holdings PLC 6.875% 5/15/26 | 1,805,000 | 1,683,163 | |
| TransDigm, Inc.: | |||
| 4.625% 1/15/29 | 930,000 | 748,669 | |
| 5.5% 11/15/27 | 7,825,000 | 6,651,250 | |
| 6.25% 3/15/26 (d) | 955,000 | 920,381 | |
| 6.375% 6/15/26 | 2,060,000 | 1,926,100 | |
| 7.5% 3/15/27 | 960,000 | 905,674 | |
| 19,867,300 | |||
| Air Freight & Logistics - 0.1% | |||
| Aeropuerto Internacional de Tocumen SA: | |||
| 4% 8/11/41 (d) | 280,000 | 227,465 | |
| 5.125% 8/11/61 (d) | 205,000 | 161,348 | |
| Cargo Aircraft Management, Inc. 4.75% 2/1/28 (d) | 365,000 | 332,150 | |
| 720,963 | |||
| Airlines - 0.6% | |||
| Air Canada 3.875% 8/15/26 (d) | 425,000 | 359,503 | |
| Azul Investments LLP: | |||
| 5.875% 10/26/24 (d) | 765,000 | 578,436 | |
| 7.25% 6/15/26 (d) | 265,000 | 184,059 | |
| Delta Air Lines, Inc. 7% 5/1/25 (d) | 164,000 | 165,999 | |
| Delta Air Lines, Inc. / SkyMiles IP Ltd. 4.75% 10/20/28 (d) | 2,365,000 | 2,231,110 | |
| Mileage Plus Holdings LLC 6.5% 6/20/27 (d) | 2,045,000 | 2,009,826 | |
| Spirit Loyalty Cayman Ltd. / Spirit IP Cayman Ltd. 8% 9/20/25 (d) | 462,000 | 474,137 | |
| United Airlines, Inc.: | |||
| 4.375% 4/15/26 (d) | 1,450,000 | 1,277,697 | |
| 4.625% 4/15/29 (d) | 870,000 | 737,995 | |
| 8,018,762 | |||
| Building Products - 0.1% | |||
| Advanced Drain Systems, Inc.: | |||
| 5% 9/30/27 (d) | 125,000 | 115,253 | |
| 6.375% 6/15/30 (d) | 280,000 | 273,440 | |
| CP Atlas Buyer, Inc. 7% 12/1/28 (d) | 325,000 | 234,709 | |
| MIWD Holdco II LLC / MIWD Finance Corp. 5.5% 2/1/30 (d) | 185,000 | 148,881 | |
| Oscar Acquisition Co. LLC / Oscar Finance, Inc. 9.5% 4/15/30 (d) | 420,000 | 332,907 | |
| Shea Homes Ltd. Partnership/Corp. 4.75% 4/1/29 (d) | 475,000 | 372,367 | |
| 1,477,557 | |||
| Commercial Services & Supplies - 0.7% | |||
| Allied Universal Holdco LLC / Allied Universal Finance Corp. 6% 6/1/29 (d) | 815,000 | 591,830 | |
| Atlas Luxco 4 SARL / Allied Universal Holdco LLC / Allied Universal Finance Corp.: | |||
| 4.625% 6/1/28 (d) | 1,032,000 | 851,093 | |
| 4.625% 6/1/28 (d) | 683,000 | 552,692 | |
| CoreCivic, Inc. 8.25% 4/15/26 | 1,495,000 | 1,457,879 | |
| Covanta Holding Corp.: | |||
| 4.875% 12/1/29 (d) | 425,000 | 345,831 | |
| 5% 9/1/30 | 670,000 | 546,921 | |
| GFL Environmental, Inc.: | |||
| 4% 8/1/28 (d) | 420,000 | 346,500 | |
| 4.75% 6/15/29 (d) | 575,000 | 475,813 | |
| IAA, Inc. 5.5% 6/15/27 (d) | 250,000 | 232,860 | |
| KAR Auction Services, Inc. 5.125% 6/1/25 (d) | 525,000 | 499,228 | |
| Madison IAQ LLC: | |||
| 4.125% 6/30/28 (d) | 535,000 | 441,880 | |
| 5.875% 6/30/29 (d) | 425,000 | 325,686 | |
| Nielsen Finance LLC/Nielsen Finance Co.: | |||
| 4.5% 7/15/29 (d) | 285,000 | 257,465 | |
| 4.75% 7/15/31 (d) | 285,000 | 256,380 | |
| Pitney Bowes, Inc.: | |||
| 6.875% 3/15/27 (d) | 295,000 | 234,293 | |
| 7.25% 3/15/29 (d) | 295,000 | 223,179 | |
| The Bidvest Group UK PLC 3.625% 9/23/26 (d) | 335,000 | 294,025 | |
| The Brink's Co. 4.625% 10/15/27 (d) | 620,000 | 550,929 | |
| The GEO Group, Inc.: | |||
| 5.125% 4/1/23 | 695,000 | 656,087 | |
| 5.875% 10/15/24 | 810,000 | 727,902 | |
| 6% 4/15/26 | 521,000 | 424,485 | |
| 10,292,958 | |||
| Construction & Engineering - 0.3% | |||
| AECOM 5.125% 3/15/27 | 625,000 | 590,625 | |
| Arcosa, Inc. 4.375% 4/15/29 (d) | 415,000 | 352,150 | |
| Bouygues SA 3.25% 6/30/37 | EUR | 400,000 | 383,411 |
| Indika Energy Capital III Pte. Ltd. 5.875% 11/9/24 (d) | 256,000 | 248,608 | |
| Pike Corp. 5.5% 9/1/28 (d) | 1,415,000 | 1,148,711 | |
| SRS Distribution, Inc.: | |||
| 4.625% 7/1/28 (d) | 550,000 | 481,250 | |
| 6% 12/1/29 (d) | 505,000 | 396,541 | |
| 6.125% 7/1/29 (d) | 300,000 | 236,693 | |
| 3,837,989 | |||
| Electrical Equipment - 0.0% | |||
| Sensata Technologies BV 4% 4/15/29 (d) | 590,000 | 500,367 | |
| Industrial Conglomerates - 0.0% | |||
| Turk Sise ve Cam Fabrikalari A/S 6.95% 3/14/26 (d) | 445,000 | 394,743 | |
| Machinery - 0.0% | |||
| ATS Automation Tooling System, Inc. 4.125% 12/15/28 (d) | 460,000 | 384,100 | |
| Stevens Holding Co., Inc. 6.125% 10/1/26 (d) | 155,000 | 149,188 | |
| 533,288 | |||
| Marine - 0.1% | |||
| MISC Capital Two (Labuan) Ltd.: | |||
| 3.625% 4/6/25 (d) | 360,000 | 349,682 | |
| 3.75% 4/6/27 (d) | 570,000 | 536,051 | |
| Navios South American Logistics, Inc./Navios Logistics Finance U.S., Inc. 10.75% 7/1/25 (d) | 215,000 | 200,084 | |
| Seaspan Corp. 5.5% 8/1/29 (d) | 425,000 | 339,202 | |
| 1,425,019 | |||
| Professional Services - 0.1% | |||
| ASGN, Inc. 4.625% 5/15/28 (d) | 510,000 | 441,813 | |
| Booz Allen Hamilton, Inc.: | |||
| 3.875% 9/1/28 (d) | 620,000 | 548,700 | |
| 4% 7/1/29 (d) | 280,000 | 244,140 | |
| TriNet Group, Inc. 3.5% 3/1/29 (d) | 455,000 | 374,770 | |
| 1,609,423 | |||
| Road & Rail - 0.1% | |||
| Hertz Corp.: | |||
| 4.625% 12/1/26 (d) | 230,000 | 192,298 | |
| 5% 12/1/29 (d) | 450,000 | 346,500 | |
| 5.5% 10/15/24 (c)(d)(e) | 650,000 | 813 | |
| 6% 1/15/28 (c)(d)(e) | 575,000 | 33,781 | |
| 6.25% 10/15/22 (c)(e) | 670,000 | 838 | |
| 7.125% 8/1/26 (c)(d)(e) | 620,000 | 35,650 | |
| Kazakhstan Temir Zholy Finance BV 6.95% 7/10/42 (d) | 120,000 | 107,610 | |
| XPO Logistics, Inc. 6.25% 5/1/25 (d) | 515,000 | 511,138 | |
| 1,228,628 | |||
| Trading Companies & Distributors - 0.1% | |||
| Foundation Building Materials, Inc. 6% 3/1/29 (d) | 310,000 | 227,075 | |
| H&E Equipment Services, Inc. 3.875% 12/15/28 (d) | 995,000 | 804,706 | |
| 1,031,781 | |||
| Transportation Infrastructure - 0.1% | |||
| DP World Crescent Ltd.: | |||
| 3.7495% 1/30/30 (d) | 765,000 | 702,031 | |
| 3.875% 7/18/29 (Reg. S) | 600,000 | 555,000 | |
| DP World Ltd. 5.625% 9/25/48 (d) | 400,000 | 373,450 | |
| First Student Bidco, Inc./First Transit Parent, Inc. 4% 7/31/29 (d) | 425,000 | 339,910 | |
| 1,970,391 | |||
| TOTAL INDUSTRIALS | 52,909,169 | ||
| INFORMATION TECHNOLOGY - 1.1% | |||
| Communications Equipment - 0.0% | |||
| HTA Group Ltd. 7% 12/18/25 (d) | 585,000 | 487,853 | |
| Electronic Equipment & Components - 0.1% | |||
| II-VI, Inc. 5% 12/15/29 (d) | 435,000 | 379,538 | |
| TTM Technologies, Inc. 4% 3/1/29 (d) | 455,000 | 382,633 | |
| 762,171 | |||
| IT Services - 0.3% | |||
| Acuris Finance U.S. 5% 5/1/28 (d) | 430,000 | 356,823 | |
| Block, Inc. 3.5% 6/1/31 (d) | 570,000 | 454,210 | |
| CA Magnum Holdings 5.375% (d)(h) | 955,000 | 826,075 | |
| Camelot Finance SA 4.5% 11/1/26 (d) | 570,000 | 520,005 | |
| Gartner, Inc.: | |||
| 3.625% 6/15/29 (d) | 405,000 | 350,880 | |
| 3.75% 10/1/30 (d) | 685,000 | 583,106 | |
| Go Daddy Operating Co. LLC / GD Finance Co., Inc.: | |||
| 3.5% 3/1/29 (d) | 610,000 | 514,285 | |
| 5.25% 12/1/27 (d) | 500,000 | 457,500 | |
| Rackspace Hosting, Inc. 5.375% 12/1/28 (d) | 380,000 | 248,319 | |
| Unisys Corp. 6.875% 11/1/27 (d) | 365,000 | 318,693 | |
| 4,629,896 | |||
| Semiconductors & Semiconductor Equipment - 0.1% | |||
| onsemi 3.875% 9/1/28 (d) | 690,000 | 607,570 | |
| Synaptics, Inc. 4% 6/15/29 (d) | 350,000 | 284,193 | |
| 891,763 | |||
| Software - 0.6% | |||
| Black Knight InfoServ LLC 3.625% 9/1/28 (d) | 690,000 | 596,850 | |
| Central Parent, Inc./Central Merger Sub, Inc. 7.25% 6/15/29 (d) | 425,000 | 409,063 | |
| Clarivate Science Holdings Corp.: | |||
| 3.875% 7/1/28 (d) | 500,000 | 417,754 | |
| 4.875% 7/1/29 (d) | 475,000 | 389,975 | |
| Elastic NV 4.125% 7/15/29 (d) | 810,000 | 676,172 | |
| Fair Isaac Corp. 4% 6/15/28 (d) | 580,000 | 513,787 | |
| ION Trading Technologies Ltd. 5.75% 5/15/28 (d) | 575,000 | 459,879 | |
| MicroStrategy, Inc. 6.125% 6/15/28 (d) | 995,000 | 792,348 | |
| NCR Corp.: | |||
| 5% 10/1/28 (d) | 335,000 | 284,045 | |
| 5.25% 10/1/30 (d) | 335,000 | 288,938 | |
| 5.75% 9/1/27 (d) | 485,000 | 430,452 | |
| 6.125% 9/1/29 (d) | 485,000 | 419,456 | |
| NortonLifeLock, Inc. 5% 4/15/25 (d) | 530,000 | 516,750 | |
| Open Text Corp.: | |||
| 3.875% 2/15/28 (d) | 300,000 | 266,829 | |
| 3.875% 12/1/29 (d) | 300,000 | 252,495 | |
| Open Text Holdings, Inc.: | |||
| 4.125% 2/15/30 (d) | 300,000 | 259,515 | |
| 4.125% 12/1/31 (d) | 245,000 | 202,852 | |
| PTC, Inc.: | |||
| 3.625% 2/15/25 (d) | 350,000 | 331,023 | |
| 4% 2/15/28 (d) | 345,000 | 311,765 | |
| Veritas U.S., Inc./Veritas Bermuda Ltd. 7.5% 9/1/25 (d) | 1,165,000 | 866,469 | |
| 8,686,417 | |||
| Technology Hardware, Storage & Peripherals - 0.0% | |||
| Lenovo Group Ltd.: | |||
| 3.421% 11/2/30 (d) | 485,000 | 413,553 | |
| 5.875% 4/24/25 (Reg. S) | 200,000 | 205,834 | |
| 619,387 | |||
| TOTAL INFORMATION TECHNOLOGY | 16,077,487 | ||
| MATERIALS - 3.2% | |||
| Chemicals - 1.3% | |||
| BASF AG: | |||
| 1.5% 3/17/31 (Reg. S) | EUR | 200,000 | 176,290 |
| 3.75% 6/29/32 (Reg. S) | EUR | 1,300,000 | 1,329,522 |
| Braskem Idesa SAPI 7.45% 11/15/29 (d) | 125,000 | 107,719 | |
| ENN Clean Energy International Investment Ltd. 3.375% 5/12/26 (d) | 620,000 | 562,191 | |
| Equate Petrochemical BV: | |||
| 2.625% 4/28/28 (d) | 275,000 | 242,688 | |
| 4.25% 11/3/26 (d) | 235,000 | 230,300 | |
| Gpd Companies, Inc. 10.125% 4/1/26 (d) | 790,000 | 752,775 | |
| Ingevity Corp. 3.875% 11/1/28 (d) | 665,000 | 556,938 | |
| Kronos Acquisition Holdings, Inc. / KIK Custom Products, Inc. 5% 12/31/26 (d) | 205,000 | 175,277 | |
| Lanxess AG 1.75% 3/22/28 (Reg. S) | EUR | 1,100,000 | 1,032,193 |
| Linde PLC: | |||
| 1.375% 3/31/31 (Reg. S) | EUR | 800,000 | 737,237 |
| 1.625% 3/31/35 (Reg. S) | EUR | 1,100,000 | 955,718 |
| LSB Industries, Inc. 6.25% 10/15/28 (d) | 960,000 | 847,200 | |
| MEGlobal Canada, Inc. 5% 5/18/25 (d) | 445,000 | 448,004 | |
| OCP SA: | |||
| 3.75% 6/23/31 (d) | 525,000 | 396,375 | |
| 4.5% 10/22/25 (d) | 115,000 | 113,009 | |
| 5.625% 4/25/24 (d) | 670,000 | 678,978 | |
| 6.875% 4/25/44 (d) | 95,000 | 78,868 | |
| Olympus Water U.S. Holding Corp. 4.25% 10/1/28 (d) | 560,000 | 438,620 | |
| Orbia Advance Corp. S.A.B. de CV: | |||
| 1.875% 5/11/26 (d) | 630,000 | 558,062 | |
| 2.875% 5/11/31 (d) | 340,000 | 271,851 | |
| Petkim Petrokimya Holding A/S 5.875% 1/26/23 (d) | 725,000 | 708,688 | |
| Sabic Capital I BV 2.15% 9/14/30 (Reg. S) | 400,000 | 338,000 | |
| SABIC Capital II BV 4% 10/10/23 (d) | 560,000 | 560,700 | |
| Sasol Financing U.S.A. LLC: | |||
| 4.375% 9/18/26 | 635,000 | 553,390 | |
| 5.875% 3/27/24 | 690,000 | 673,613 | |
| SCIH Salt Holdings, Inc. 4.875% 5/1/28 (d) | 375,000 | 311,295 | |
| SCIL IV LLC / SCIL U.S.A. Holdings LLC 5.375% 11/1/26 (d) | 640,000 | 512,000 | |
| The Chemours Co. LLC: | |||
| 5.375% 5/15/27 | 1,700,000 | 1,495,752 | |
| 5.75% 11/15/28 (d) | 995,000 | 847,969 | |
| The Scotts Miracle-Gro Co. 4% 4/1/31 | 595,000 | 444,763 | |
| Valvoline, Inc. 4.25% 2/15/30 (d) | 435,000 | 363,225 | |
| W.R. Grace Holding LLC 5.625% 8/15/29 (d) | 1,300,000 | 957,125 | |
| 18,456,335 | |||
| Construction Materials - 0.0% | |||
| CEMEX S.A.B. de CV 3.875% 7/11/31 (d) | 230,000 | 173,236 | |
| Summit Materials LLC/Summit Materials Finance Corp. 5.25% 1/15/29 (d) | 645,000 | 562,763 | |
| 735,999 | |||
| Containers & Packaging - 0.4% | |||
| Ardagh Metal Packaging Finance U.S.A. LLC/Ardagh Metal Packaging Finance PLC: | |||
| 3.25% 9/1/28 (d) | 300,000 | 256,068 | |
| 4% 9/1/29 (d) | 605,000 | 483,359 | |
| 6% 6/15/27 (d) | 280,000 | 276,500 | |
| Cascades, Inc.: | |||
| 5.125% 1/15/26 (d) | 300,000 | 273,945 | |
| 5.375% 1/15/28 (d) | 300,000 | 255,020 | |
| Clydesdale Acquisition Holdings, Inc.: | |||
| 6.625% 4/15/29 (d) | 330,000 | 310,078 | |
| 8.75% 4/15/30 (d) | 700,000 | 603,799 | |
| Crown Cork & Seal, Inc.: | |||
| 7.375% 12/15/26 | 1,210,000 | 1,236,027 | |
| 7.5% 12/15/96 | 160,000 | 160,642 | |
| Graham Packaging Co., Inc. 7.125% 8/15/28 (d) | 365,000 | 292,913 | |
| Graphic Packaging International, Inc. 3.75% 2/1/30 (d) | 355,000 | 300,881 | |
| Intelligent Packaging Ltd. Finco, Inc. 6% 9/15/28 (d) | 255,000 | 211,089 | |
| Trivium Packaging Finance BV 5.5% 8/15/26 (d) | 375,000 | 352,751 | |
| 5,013,072 | |||
| Metals & Mining - 1.4% | |||
| Alcoa Nederland Holding BV: | |||
| 4.125% 3/31/29 (d) | 775,000 | 692,959 | |
| 6.125% 5/15/28 (d) | 200,000 | 194,500 | |
| Algoma Steel SCA 0% 12/31/23 (c) | 102,200 | 0 | |
| Allegheny Technologies, Inc.: | |||
| 4.875% 10/1/29 | 280,000 | 223,297 | |
| 5.125% 10/1/31 | 245,000 | 187,680 | |
| Antofagasta PLC: | |||
| 2.375% 10/14/30 (d) | 685,000 | 531,731 | |
| 5.625% 5/13/32 (d) | 260,000 | 249,600 | |
| Arconic Corp.: | |||
| 6% 5/15/25 (d) | 400,000 | 390,122 | |
| 6.125% 2/15/28 (d) | 875,000 | 817,058 | |
| Celtic Resources Holdings DAC 4.125% 10/9/24 (d)(e) | 445,000 | 44,027 | |
| Cleveland-Cliffs, Inc.: | |||
| 4.625% 3/1/29 (d) | 465,000 | 410,363 | |
| 4.875% 3/1/31 (d) | 465,000 | 409,976 | |
| 5.875% 6/1/27 | 960,000 | 895,229 | |
| Compania de Minas Buenaventura SA 5.5% 7/23/26 (d) | 245,000 | 220,941 | |
| Compass Minerals International, Inc. 6.75% 12/1/27 (d) | 1,305,000 | 1,181,025 | |
| Corporacion Nacional del Cobre de Chile (Codelco): | |||
| 3% 9/30/29 (d) | 105,000 | 91,632 | |
| 3.15% 1/14/30 (d) | 280,000 | 244,615 | |
| 3.7% 1/30/50 (d) | 650,000 | 484,575 | |
| Eldorado Gold Corp. 6.25% 9/1/29 (d) | 420,000 | 338,494 | |
| Endeavour Mining PLC 5% 10/14/26 (d) | 350,000 | 280,656 | |
| ERO Copper Corp. 6.5% 2/15/30 (d) | 415,000 | 333,038 | |
| First Quantum Minerals Ltd.: | |||
| 6.5% 3/1/24 (d) | 610,000 | 588,078 | |
| 6.875% 3/1/26 (d) | 1,265,000 | 1,163,914 | |
| 7.5% 4/1/25 (d) | 1,330,000 | 1,261,006 | |
| FMG Resources Pty Ltd.: | |||
| 4.375% 4/1/31 (d) | 445,000 | 360,913 | |
| 4.5% 9/15/27 (d) | 485,000 | 432,863 | |
| 5.125% 5/15/24 (d) | 495,000 | 481,655 | |
| Fresnillo PLC 4.25% 10/2/50 (d) | 360,000 | 263,993 | |
| Gcm Mining Corp. 6.875% 8/9/26 (d) | 655,000 | 510,081 | |
| Gold Fields Orogen Holding BVI Ltd. 5.125% 5/15/24 (d) | 160,000 | 160,180 | |
| HudBay Minerals, Inc. 4.5% 4/1/26 (d) | 360,000 | 301,241 | |
| Infrabuild Australia Pty Ltd. 12% 10/1/24 (d) | 570,000 | 541,500 | |
| JSW Steel Ltd. 3.95% 4/5/27 (d) | 460,000 | 369,150 | |
| Kaiser Aluminum Corp. 4.625% 3/1/28 (d) | 595,000 | 495,350 | |
| Metinvest BV: | |||
| 7.75% 4/23/23 (d) | 669,000 | 391,365 | |
| 8.5% 4/23/26 (Reg. S) | 200,000 | 103,170 | |
| Mineral Resources Ltd.: | |||
| 8% 11/1/27 (d) | 280,000 | 273,000 | |
| 8.125% 5/1/27 (d) | 960,000 | 933,758 | |
| 8.5% 5/1/30 (d) | 210,000 | 206,850 | |
| Murray Energy Corp.: | |||
| 11.25% 12/31/49 (c)(d)(e) | 490,000 | 0 | |
| 12% 4/15/24 pay-in-kind (c)(d)(e)(f) | 548,100 | 0 | |
| PT Freeport Indonesia: | |||
| 4.763% 4/14/27 (d) | 225,000 | 215,438 | |
| 5.315% 4/14/32 (d) | 385,000 | 349,388 | |
| 6.2% 4/14/52 (d) | 265,000 | 227,900 | |
| PT Indonesia Asahan Aluminium Tbk: | |||
| 4.75% 5/15/25 (d) | 125,000 | 123,920 | |
| 5.45% 5/15/30 (d) | 460,000 | 429,611 | |
| Roller Bearing Co. of America, Inc. 4.375% 10/15/29 (d) | 200,000 | 170,183 | |
| Stillwater Mining Co. 4% 11/16/26 (d) | 820,000 | 680,600 | |
| TMK Capital SA 4.3% 2/12/27 (Reg. S) | 400,000 | 60,000 | |
| Usiminas International SARL 5.875% 7/18/26 (d) | 560,000 | 549,080 | |
| VM Holding SA 6.5% 1/18/28 (d) | 525,000 | 501,473 | |
| Volcan Compania Minera SAA 4.375% 2/11/26 (d) | 185,000 | 161,043 | |
| 20,528,221 | |||
| Paper & Forest Products - 0.1% | |||
| Glatfelter Corp. 4.75% 11/15/29 (d) | 415,000 | 290,500 | |
| LABL, Inc. 5.875% 11/1/28 (d) | 665,000 | 536,939 | |
| 827,439 | |||
| TOTAL MATERIALS | 45,561,066 | ||
| REAL ESTATE - 1.2% | |||
| Equity Real Estate Investment Trusts (REITs) - 0.9% | |||
| Iron Mountain Information Management Services, Inc. 5% 7/15/32 (d) | 415,000 | 334,952 | |
| Iron Mountain, Inc.: | |||
| 4.875% 9/15/29 (d) | 1,300,000 | 1,104,909 | |
| 5% 7/15/28 (d) | 630,000 | 557,983 | |
| 5.25% 7/15/30 (d) | 585,000 | 508,596 | |
| 5.625% 7/15/32 (d) | 585,000 | 494,662 | |
| MPT Operating Partnership LP/MPT Finance Corp.: | |||
| 3.5% 3/15/31 | 665,000 | 518,700 | |
| 4.625% 8/1/29 | 970,000 | 851,175 | |
| 5% 10/15/27 | 1,860,000 | 1,701,286 | |
| SBA Communications Corp. 3.875% 2/15/27 | 890,000 | 812,383 | |
| Uniti Group LP / Uniti Group Finance, Inc.: | |||
| 4.75% 4/15/28 (d) | 940,000 | 773,047 | |
| 6.5% 2/15/29 (d) | 1,965,000 | 1,439,363 | |
| Uniti Group, Inc.: | |||
| 6% 1/15/30 (d) | 695,000 | 480,801 | |
| 7.875% 2/15/25 (d) | 920,000 | 887,708 | |
| VICI Properties LP / VICI Note Co.: | |||
| 3.875% 2/15/29 (d) | 665,000 | 571,948 | |
| 4.25% 12/1/26 (d) | 1,140,000 | 1,041,173 | |
| 4.625% 12/1/29 (d) | 650,000 | 581,071 | |
| 12,659,757 | |||
| Real Estate Management & Development - 0.3% | |||
| DTZ U.S. Borrower LLC 6.75% 5/15/28 (d) | 650,000 | 603,688 | |
| Realogy Group LLC/Realogy Co-Issuer Corp. 5.75% 1/15/29 (d) | 850,000 | 649,188 | |
| Realogy Group LLC/Realogy Co.-Issuer Corp. 5.25% 4/15/30 (d) | 550,000 | 407,000 | |
| Segro Capital SARL 1.875% 3/23/30 (Reg. S) | EUR | 1,114,000 | 1,019,077 |
| Taylor Morrison Communities, Inc./Monarch Communities, Inc.: | |||
| 5.125% 8/1/30 (d) | 635,000 | 527,358 | |
| 5.875% 6/15/27 (d) | 495,000 | 456,246 | |
| Vonovia SE 2.375% 3/25/32 (Reg. S) | EUR | 400,000 | 344,126 |
| Weekley Homes LLC/Weekley Finance Corp. 4.875% 9/15/28 (d) | 300,000 | 236,575 | |
| 4,243,258 | |||
| TOTAL REAL ESTATE | 16,903,015 | ||
| UTILITIES - 2.2% | |||
| Electric Utilities - 1.7% | |||
| Adani Electricity Mumbai Ltd. 3.867% 7/22/31 (d) | 325,000 | 255,772 | |
| Clearway Energy Operating LLC: | |||
| 3.75% 1/15/32 (d) | 280,000 | 221,900 | |
| 4.75% 3/15/28 (d) | 365,000 | 328,384 | |
| Comision Federal de Electricid: | |||
| 3.348% 2/9/31 (d) | 130,000 | 99,515 | |
| 4.688% 5/15/29 (d) | 565,000 | 505,781 | |
| Eskom Holdings SOC Ltd.: | |||
| 6.35% 8/10/28 (d) | 355,000 | 317,281 | |
| 6.75% 8/6/23 (d) | 1,840,000 | 1,673,020 | |
| 7.125% 2/11/25 (d) | 75,000 | 63,014 | |
| Israel Electric Corp. Ltd. 3.75% 2/22/32 (Reg. S) (d) | 605,000 | 540,634 | |
| Lamar Funding Ltd. 3.958% 5/7/25 (d) | 600,000 | 569,738 | |
| Mong Duong Finance Holdings BV 5.125% 5/7/29 (d) | 655,000 | 526,988 | |
| NRG Energy, Inc.: | |||
| 3.375% 2/15/29 (d) | 305,000 | 245,955 | |
| 3.625% 2/15/31 (d) | 605,000 | 474,314 | |
| 3.875% 2/15/32 (d) | 700,000 | 555,998 | |
| 5.75% 1/15/28 | 1,740,000 | 1,581,538 | |
| 6.625% 1/15/27 | 410,000 | 401,544 | |
| ORSTED A/S 2.875% 6/14/33 (Reg. S) | EUR | 988,000 | 1,006,423 |
| Pacific Gas & Electric Co.: | |||
| 3.75% 8/15/42 | 555,000 | 375,121 | |
| 3.95% 12/1/47 | 2,880,000 | 1,994,906 | |
| 4% 12/1/46 | 1,315,000 | 922,346 | |
| 4.25% 3/15/46 | 125,000 | 91,291 | |
| 4.3% 3/15/45 | 315,000 | 229,010 | |
| 4.55% 7/1/30 | 3,929,000 | 3,491,038 | |
| PG&E Corp.: | |||
| 5% 7/1/28 | 1,345,000 | 1,135,019 | |
| 5.25% 7/1/30 | 510,000 | 419,567 | |
| TenneT Holding BV: | |||
| 2.375% 5/17/33 (Reg. S) | EUR | 1,240,000 | 1,212,581 |
| 2.75% 5/17/42 (Reg. S) | EUR | 1,135,000 | 1,061,884 |
| Vistra Operations Co. LLC: | |||
| 4.375% 5/1/29 (d) | 1,105,000 | 924,476 | |
| 5% 7/31/27 (d) | 1,220,000 | 1,109,114 | |
| 5.5% 9/1/26 (d) | 820,000 | 774,355 | |
| 5.625% 2/15/27 (d) | 1,495,000 | 1,405,689 | |
| 24,514,196 | |||
| Gas Utilities - 0.1% | |||
| ENN Energy Holdings Ltd. 4.625% 5/17/27 (d) | 640,000 | 643,968 | |
| Promigas SA ESP/Gases del Pacifico SAC 3.75% 10/16/29 (d) | 335,000 | 268,209 | |
| Southern Natural Gas Co. LLC: | |||
| 7.35% 2/15/31 | 175,000 | 195,628 | |
| 8% 3/1/32 | 335,000 | 391,528 | |
| Suburban Propane Partners LP/Suburban Energy Finance Corp. 5% 6/1/31 (d) | 570,000 | 484,714 | |
| 1,984,047 | |||
| Independent Power and Renewable Electricity Producers - 0.2% | |||
| Atlantica Sustainable Infrastructure PLC 4.125% 6/15/28 (d) | 370,000 | 322,189 | |
| Aydem Yenilenebilir Enerji A/S 7.75% 2/2/27 (d) | 245,000 | 174,073 | |
| Energo-Pro A/S 8.5% 2/4/27 (d) | 245,000 | 231,525 | |
| EnfraGen Energia Sur SA 5.375% 12/30/30 (d) | 1,020,000 | 688,500 | |
| Investment Energy Resources Ltd. 6.25% 4/26/29 (d) | 485,000 | 411,280 | |
| RWE AG 1% 11/26/33 (Reg. S) | EUR | 900,000 | 688,663 |
| Termocandelaria Power Ltd. 7.875% 1/30/29 (d) | 488,750 | 437,523 | |
| 2,953,753 | |||
| Multi-Utilities - 0.1% | |||
| Abu Dhabi National Energy Co. PJSC: | |||
| 4% 10/3/49 (d) | 593,000 | 531,032 | |
| 4.875% 4/23/30 (d) | 95,000 | 99,293 | |
| 630,325 | |||
| Water Utilities - 0.1% | |||
| Thames Water Utility Finance PLC 1.25% 1/31/32 (Reg. S) | EUR | 1,370,000 | 1,071,420 |
| TOTAL UTILITIES | 31,153,741 | ||
| TOTAL NONCONVERTIBLE BONDS | 512,032,197 | ||
| TOTAL CORPORATE BONDS | |||
| (Cost $591,293,670) | 513,825,746 | ||
| U.S. Government and Government Agency Obligations - 26.7% | |||
| U.S. Government Agency Obligations - 0.0% | |||
| Fannie Mae 0.625% 4/22/25 | 210,000 | 196,372 | |
| Tennessee Valley Authority: | |||
| 5.25% 9/15/39 | $126,000 | $144,130 | |
| 5.375% 4/1/56 | 302,000 | 376,190 | |
| TOTAL U.S. GOVERNMENT AGENCY OBLIGATIONS | 716,692 | ||
| U.S. Treasury Obligations - 26.6% | |||
| U.S. Treasury Bills, yield at date of purchase 0.66% to 1.59% 7/7/22 to 9/22/22 (i) | 1,950,000 | 1,948,590 | |
| U.S. Treasury Bonds: | |||
| 1.875% 11/15/51 | 6,237,000 | 4,679,699 | |
| 2% 11/15/41 | 5,645,000 | 4,483,365 | |
| 2% 8/15/51 | 19,356,000 | 14,959,315 | |
| 2.25% 2/15/52 (j) | 12,700,000 | 10,451,703 | |
| 2.5% 2/15/45 (i) | 17,524,000 | 14,862,543 | |
| 2.875% 5/15/52 | 960,000 | 906,750 | |
| 3% 5/15/45 | 1,800,000 | 1,669,641 | |
| 3% 2/15/49 | 15,491,000 | 14,761,834 | |
| 3.25% 5/15/42 | 600,000 | 585,563 | |
| 4.75% 2/15/37 (i) | 8,126,000 | 9,811,828 | |
| 6.25% 8/15/23 (i) | 2,249,000 | 2,333,952 | |
| U.S. Treasury Notes: | |||
| 0.125% 8/31/22 | 5,100,000 | 5,087,819 | |
| 0.125% 11/30/22 | 4,000,000 | 3,963,281 | |
| 0.125% 12/31/22 | 3,400,000 | 3,359,359 | |
| 0.125% 2/28/23 | 7,200,000 | 7,077,656 | |
| 0.125% 3/31/23 | 3,000,000 | 2,941,758 | |
| 0.125% 5/31/23 | 3,800,000 | 3,705,891 | |
| 0.125% 8/15/23 | 374,000 | 362,196 | |
| 0.125% 10/15/23 | 280,000 | 269,938 | |
| 0.25% 5/15/24 | 73,000 | 69,381 | |
| 0.25% 7/31/25 | 1,221,000 | 1,121,078 | |
| 0.25% 9/30/25 | 1,207,000 | 1,102,755 | |
| 0.25% 10/31/25 | 1,700,000 | 1,549,125 | |
| 0.375% 10/31/23 | 2,000,000 | 1,932,813 | |
| 0.375% 12/31/25 | 8,019,000 | 7,308,254 | |
| 0.375% 1/31/26 | 2,100,000 | 1,909,523 | |
| 0.5% 11/30/23 | 12,900,000 | 12,461,602 | |
| 0.625% 7/31/26 | 2,400,000 | 2,176,500 | |
| 0.75% 3/31/26 | 4,704,000 | 4,320,514 | |
| 0.75% 8/31/26 | 3,400,000 | 3,094,797 | |
| 0.875% 9/30/26 | 16,300,000 | 14,886,484 | |
| 1% 7/31/28 | 4,418,000 | 3,907,341 | |
| 1.125% 10/31/26 | 1,700,000 | 1,566,988 | |
| 1.125% 8/31/28 (i) | 54,982,000 | 48,931,757 | |
| 1.25% 12/31/26 | 2,667,000 | 2,465,100 | |
| 1.25% 9/30/28 | 2,930,000 | 2,624,296 | |
| 1.375% 8/31/23 | 500,000 | 490,762 | |
| 1.375% 10/31/28 | 3,514,000 | 3,168,228 | |
| 1.5% 2/29/24 | 29,600,000 | 28,902,781 | |
| 1.5% 9/30/24 | 1,995,000 | 1,929,851 | |
| 1.5% 10/31/24 | 280,000 | 270,517 | |
| 1.5% 1/31/27 | 4,595,000 | 4,290,222 | |
| 1.5% 11/30/28 | 860,000 | 780,920 | |
| 1.625% 11/15/22 | 3,584,000 | 3,574,760 | |
| 1.625% 5/31/23 | 760,000 | 751,331 | |
| 1.625% 9/30/26 | 4,153,000 | 3,917,609 | |
| 1.75% 1/31/29 | 2,583,000 | 2,381,506 | |
| 1.875% 2/28/27 | 27,200,000 | 25,818,750 | |
| 1.875% 2/15/32 | 12,060,000 | 10,911,473 | |
| 2.125% 7/31/24 | 9,671,000 | 9,501,758 | |
| 2.25% 4/30/24 | 9,144,000 | 9,024,699 | |
| 2.25% 3/31/26 | 3,329,000 | 3,234,592 | |
| 2.5% 1/31/24 | 630,000 | 625,275 | |
| 2.5% 2/28/26 | 7,215,000 | 7,076,337 | |
| 2.5% 3/31/27 | 900,000 | 878,098 | |
| 2.625% 5/31/27 | 2,000,000 | 1,962,188 | |
| 2.75% 2/15/24 | 25,768,000 | 25,677,410 | |
| 2.75% 5/31/29 | 1,155,000 | 1,132,261 | |
| 2.875% 11/30/25 | 3,162,000 | 3,143,102 | |
| 2.875% 4/30/29 | 3,300,000 | 3,261,328 | |
| 2.875% 5/15/32 | 4,580,000 | 4,528,475 | |
| 3.125% 11/15/28 | 1,580,000 | 1,583,271 | |
| TOTAL U.S. TREASURY OBLIGATIONS | 378,468,493 | ||
| Other Government Related - 0.1% | |||
| Private Export Funding Corp. Secured 1.75% 11/15/24 | 1,030,000 | 993,906 | |
| TOTAL U.S. GOVERNMENT AND GOVERNMENT AGENCY OBLIGATIONS | |||
| (Cost $408,679,904) | 380,179,091 | ||
| U.S. Government Agency - Mortgage Securities - 2.7% | |||
| Fannie Mae - 0.8% | |||
| 1.5% 11/1/40 to 11/1/41 | 4,323,438 | 3,721,809 | |
| 2.5% 9/1/51 to 12/1/51 | 2,405,141 | 2,171,549 | |
| 3% 11/1/34 to 2/1/52 | 1,346,208 | 1,303,753 | |
| 3.5% 11/1/51 to 3/1/52 | 4,744,145 | 4,577,221 | |
| TOTAL FANNIE MAE | 11,774,332 | ||
| Freddie Mac - 0.4% | |||
| 1.5% 12/1/40 to 4/1/41 | 1,212,431 | 1,045,402 | |
| 2.5% 5/1/41 to 12/1/51 | 2,068,544 | 1,898,272 | |
| 3% 9/1/34 | 424,673 | 417,405 | |
| 3.5% 3/1/50 to 3/1/52 | 3,017,787 | 2,918,292 | |
| TOTAL FREDDIE MAC | 6,279,371 | ||
| Ginnie Mae - 0.8% | |||
| 2% 7/1/52 (k) | 1,100,000 | 976,631 | |
| 2% 7/1/52 (k) | 300,000 | 266,354 | |
| 2% 7/1/52 (k) | 300,000 | 266,354 | |
| 2% 7/1/52 (k) | 300,000 | 266,354 | |
| 2% 7/1/52 (k) | 550,000 | 488,316 | |
| 2% 7/1/52 (k) | 300,000 | 266,354 | |
| 2% 7/1/52 (k) | 300,000 | 266,354 | |
| 2% 7/1/52 (k) | 1,000,000 | 887,847 | |
| 2% 7/1/52 (k) | 200,000 | 177,569 | |
| 2% 7/1/52 (k) | 1,900,000 | 1,686,908 | |
| 2% 7/1/52 (k) | 500,000 | 443,923 | |
| 2% 8/1/52 (k) | 1,600,000 | 1,419,117 | |
| 2% 8/1/52 (k) | 1,000,000 | 886,948 | |
| 2% 8/1/52 (k) | 1,050,000 | 931,295 | |
| 3.5% 7/1/52 (k) | 1,450,000 | 1,408,308 | |
| TOTAL GINNIE MAE | 10,638,632 | ||
| Uniform Mortgage Backed Securities - 0.7% | |||
| 2% 7/1/52 (k) | 1,900,000 | 1,648,666 | |
| 2% 7/1/52 (k) | 1,900,000 | 1,648,666 | |
| 3% 7/1/52 (k) | 3,500,000 | 3,257,459 | |
| 3% 8/1/52 (k) | 1,250,000 | 1,161,913 | |
| 3.5% 7/1/52 (k) | 200,000 | 192,273 | |
| 4% 7/1/52 (k) | 1,600,000 | 1,577,249 | |
| TOTAL UNIFORM MORTGAGE BACKED SECURITIES | 9,486,226 | ||
| TOTAL U.S. GOVERNMENT AGENCY - MORTGAGE SECURITIES | |||
| (Cost $39,410,226) | 38,178,561 | ||
| Commercial Mortgage Securities - 0.4% | |||
| Freddie Mac: (Cost $5,930,793) | $ | $ | |
| floater: | |||
| Series 2021-F114 Class A/S, 0.9392% 5/25/31 (f) | 587,666 | 582,417 | |
| Series 2021-F120 Class A/S, U.S. 30-Day Avg. Secured Overnight Fin. Rate (SOFR) Indx + 0.210% 0.9192% 8/25/31 (f)(g) | 3,388,000 | 3,337,330 | |
| sequential payer: | |||
| Series 2021-K135 Class A2, 2.154% 10/25/31 | 1,400,000 | 1,241,113 | |
| Series 2021-K136 Class A2, 2.127% 11/25/31 | 500,000 | 441,816 | |
| TOTAL COMMERCIAL MORTGAGE SECURITIES | |||
| (Cost $5,930,793) | 5,602,676 | ||
| Foreign Government and Government Agency Obligations - 9.3% | |||
| Angola Republic: | |||
| 8.25% 5/9/28 (d) | 610,000 | 506,300 | |
| 8.75% 4/14/32 (d) | 310,000 | 248,000 | |
| 9.375% 5/8/48 (d) | 85,000 | 62,050 | |
| 9.5% 11/12/25 (d) | 1,105,000 | 1,015,219 | |
| Arab Republic of Egypt: | |||
| 5.8% 9/30/27 (d) | 385,000 | 270,463 | |
| 7.0529% 1/15/32 (d) | 280,000 | 179,200 | |
| 7.5% 1/31/27 (d) | 2,485,000 | 1,932,088 | |
| 7.6003% 3/1/29 (d) | 500,000 | 363,750 | |
| 7.903% 2/21/48 (d) | 385,000 | 217,525 | |
| 8.5% 1/31/47 (d) | 580,000 | 340,750 | |
| 8.7002% 3/1/49 (d) | 340,000 | 200,600 | |
| Argentine Republic: | |||
| 0.5% 7/9/30 (l) | 7,000,308 | 1,529,567 | |
| 1% 7/9/29 | 738,798 | 172,509 | |
| 1.125% 7/9/35 (l) | 1,857,241 | 388,163 | |
| 2% 1/9/38 (l) | 897,304 | 260,218 | |
| Australian Commonwealth 1.75% 6/21/51 (Reg. S) | AUD | 1,375,000 | 602,660 |
| Barbados Government 6.5% 10/1/29 (d) | 859,000 | 823,996 | |
| Bermuda Government: | |||
| 2.375% 8/20/30 (d) | 55,000 | 45,935 | |
| 3.375% 8/20/50 (d) | 165,000 | 120,017 | |
| 3.717% 1/25/27 (d) | 645,000 | 622,143 | |
| 4.75% 2/15/29 (d) | 360,000 | 359,618 | |
| Brazilian Federative Republic: | |||
| 2.875% 6/6/25 | 1,165,000 | 1,098,595 | |
| 3.875% 6/12/30 | 830,000 | 695,540 | |
| 7.125% 1/20/37 | 565,000 | 561,928 | |
| 8.25% 1/20/34 | 1,045,000 | 1,132,715 | |
| Buenos Aires Province 3.9% 9/1/37 (d)(l) | 550,000 | 167,681 | |
| Cameroon Republic 5.95% 7/7/32 (d) | EUR | 585,000 | 452,815 |
| Canadian Government: | |||
| 1.25% 3/1/27 | CAD | 3,000,000 | 2,144,096 |
| 1.5% 6/1/31 | CAD | 1,925,000 | 1,297,296 |
| 2% 12/1/51 | CAD | 715,000 | 434,144 |
| Chilean Republic: | |||
| 2.45% 1/31/31 | 1,355,000 | 1,154,968 | |
| 2.75% 1/31/27 | 310,000 | 289,850 | |
| 3.5% 1/31/34 | 200,000 | 177,600 | |
| 4% 1/31/52 | 200,000 | 165,700 | |
| 4.34% 3/7/42 | 260,000 | 232,050 | |
| Colombian Republic: | |||
| 3% 1/30/30 | 1,025,000 | 781,114 | |
| 3.125% 4/15/31 | 535,000 | 396,836 | |
| 3.25% 4/22/32 | 290,000 | 210,395 | |
| 4.125% 5/15/51 | 220,000 | 132,110 | |
| 5% 6/15/45 | 855,000 | 572,209 | |
| 5.2% 5/15/49 | 650,000 | 441,716 | |
| 6.125% 1/18/41 | 40,000 | 31,345 | |
| 7.375% 9/18/37 | 140,000 | 129,308 | |
| Costa Rican Republic: | |||
| 5.625% 4/30/43 (d) | 200,000 | 150,538 | |
| 6.125% 2/19/31 (d) | 150,000 | 139,528 | |
| 7% 4/4/44 (d) | 60,000 | 51,518 | |
| Democratic Socialist Republic of Sri Lanka: | |||
| 6.2% 5/11/27 (d)(e) | 300,000 | 84,033 | |
| 7.55% 3/28/30 (d)(e) | 235,000 | 65,826 | |
| 7.85% 3/14/29 (d)(e) | 415,000 | 116,246 | |
| Dominican Republic: | |||
| 4.5% 1/30/30 (d) | 225,000 | 179,550 | |
| 4.875% 9/23/32 (d) | 860,000 | 661,018 | |
| 5.875% 1/30/60 (d) | 270,000 | 184,241 | |
| 5.95% 1/25/27 (d) | 445,000 | 424,919 | |
| 6% 7/19/28 (d) | 360,000 | 333,630 | |
| 6.4% 6/5/49 (d) | 160,000 | 118,980 | |
| 6.5% 2/15/48 (d) | 65,000 | 48,843 | |
| 6.5% 2/15/48 (Reg. S) | 150,000 | 112,716 | |
| 6.85% 1/27/45 (d) | 300,000 | 238,463 | |
| 6.875% 1/29/26 (d) | 780,000 | 794,528 | |
| 7.45% 4/30/44 (d) | 335,000 | 286,174 | |
| Ecuador Republic: | |||
| 1% 7/31/35 (d)(l) | 705,000 | 348,226 | |
| 5% 7/31/30 (d)(l) | 1,320,000 | 864,435 | |
| El Salvador Republic: | |||
| 6.375% 1/18/27 (d) | 75,000 | 25,139 | |
| 7.1246% 1/20/50 (d) | 290,000 | 88,051 | |
| 7.625% 2/1/41 (d) | 90,000 | 27,917 | |
| 7.75% 1/24/23 (d) | 730,000 | 513,190 | |
| Emirate of Abu Dhabi: | |||
| 1.7% 3/2/31 (d) | 570,000 | 478,194 | |
| 3% 9/15/51 (d) | 430,000 | 324,463 | |
| 3.125% 4/16/30 (d) | 715,000 | 679,384 | |
| 3.125% 9/30/49 (d) | 920,000 | 714,610 | |
| 3.875% 4/16/50 (d) | 620,000 | 551,529 | |
| Emirate of Dubai 3.9% 9/9/50 (Reg. S) | 720,000 | 515,160 | |
| Gabonese Republic 7% 11/24/31 (d) | 455,000 | 328,738 | |
| Georgia Republic 2.75% 4/22/26 (d) | 480,000 | 397,890 | |
| German Federal Republic: | |||
| 0% 3/10/23 (Reg. S) | EUR | 4,225,000 | 4,425,375 |
| 0% 8/15/31 | EUR | 2,516,126 | 2,341,561 |
| 0% 2/15/32 (Reg. S) | EUR | 18,090,000 | 16,655,417 |
| Ghana Republic: | |||
| 7.75% 4/7/29 (d) | 560,000 | 275,730 | |
| 8.125% 1/18/26 (d) | 70,000 | 50,216 | |
| 8.627% 6/16/49 (d) | 30,000 | 14,025 | |
| 10.75% 10/14/30 (d) | 360,000 | 306,000 | |
| Guatemalan Republic: | |||
| 4.9% 6/1/30 (d) | 230,000 | 209,703 | |
| 5.375% 4/24/32 (d) | 380,000 | 349,909 | |
| 6.125% 6/1/50 (d) | 225,000 | 188,691 | |
| Hungarian Republic: | |||
| 2.125% 9/22/31 (d) | 205,000 | 158,273 | |
| 5.25% 6/16/29 (d) | 295,000 | 293,925 | |
| 5.5% 6/16/34 (d) | 305,000 | 295,892 | |
| Indonesian Republic: | |||
| 3.85% 10/15/30 | 330,000 | 313,356 | |
| 4.1% 4/24/28 | 665,000 | 653,279 | |
| 4.35% 1/11/48 | 300,000 | 261,408 | |
| 4.4% 6/6/27 (d) | 345,000 | 342,413 | |
| 5.125% 1/15/45 (d) | 825,000 | 787,966 | |
| 5.25% 1/17/42 (d) | 305,000 | 296,765 | |
| 5.95% 1/8/46 (d) | 350,000 | 364,831 | |
| 6.625% 2/17/37 (d) | 220,000 | 240,048 | |
| 6.75% 1/15/44 (d) | 330,000 | 377,474 | |
| 7.75% 1/17/38 (d) | 730,000 | 869,521 | |
| 8.5% 10/12/35 (Reg. S) | 875,000 | 1,100,750 | |
| Islamic Republic of Pakistan: | |||
| 6% 4/8/26 (d) | 730,000 | 489,180 | |
| 6.875% 12/5/27 (d) | 130,000 | 87,409 | |
| 8.25% 4/15/24 (d) | 95,000 | 73,494 | |
| Israeli State: | |||
| (guaranteed by U.S. Government through Agency for International Development): | |||
| 5.5% 9/18/23 | 5,395,000 | 5,554,342 | |
| 5.5% 12/4/23 | 1,628,000 | 1,683,019 | |
| 3.375% 1/15/50 | 595,000 | 479,895 | |
| 3.8% 5/13/60 (Reg. S) | 340,000 | 282,710 | |
| Ivory Coast: | |||
| 5.875% 10/17/31 (d) | EUR | 500,000 | 409,454 |
| 6.125% 6/15/33 (d) | 400,000 | 311,575 | |
| 6.375% 3/3/28 (d) | 490,000 | 433,129 | |
| Jamaican Government: | |||
| 6.75% 4/28/28 | 255,000 | 262,698 | |
| 7.875% 7/28/45 | 160,000 | 169,120 | |
| Japan Government: | |||
| 0.1% 12/20/30 | JPY | 467,600,000 | 3,406,091 |
| 0.4% 3/20/56 | JPY | 230,150,000 | 1,305,755 |
| Jordanian Kingdom: | |||
| 4.95% 7/7/25 (d) | 575,000 | 518,147 | |
| 7.375% 10/10/47 (d) | 110,000 | 80,183 | |
| 7.75% 1/15/28 (d) | 320,000 | 299,160 | |
| Kingdom of Saudi Arabia: | |||
| 2.25% 2/2/33 (d) | 665,000 | 551,950 | |
| 3.625% 3/4/28 (d) | 315,000 | 310,275 | |
| 3.75% 1/21/55 (d) | 655,000 | 536,281 | |
| 4.5% 10/26/46 (d) | 640,000 | 583,200 | |
| 4.5% 4/22/60 (d) | 225,000 | 207,000 | |
| 4.625% 10/4/47 (d) | 330,000 | 305,250 | |
| Korean Republic 1% 9/16/30 | 590,000 | 492,314 | |
| Lebanese Republic: | |||
| 5.8% 12/31/49 (e) | 625,000 | 40,938 | |
| 6.375% 12/31/49 (e) | 810,000 | 53,055 | |
| Ministry of Finance of the Russian Federation: | |||
| 4.375% 3/21/29(Reg. S) (e) | 200,000 | 52,000 | |
| 5.1% 3/28/35(Reg. S) (e) | 600,000 | 150,000 | |
| Mongolia Government 5.125% 4/7/26 (d) | 480,000 | 427,253 | |
| Moroccan Kingdom: | |||
| 2.375% 12/15/27 (d) | 520,000 | 423,540 | |
| 4% 12/15/50 (d) | 200,000 | 121,000 | |
| 5.5% 12/11/42 (d) | 70,000 | 50,873 | |
| Panamanian Republic: | |||
| 2.252% 9/29/32 | 400,000 | 312,700 | |
| 3.16% 1/23/30 | 440,000 | 391,958 | |
| 3.298% 1/19/33 | 445,000 | 381,365 | |
| 3.87% 7/23/60 | 715,000 | 507,337 | |
| 3.875% 3/17/28 | 555,000 | 529,782 | |
| 4.5% 5/15/47 | 250,000 | 206,453 | |
| 4.5% 4/16/50 | 780,000 | 637,309 | |
| Peoples Republic of China 1.2% 10/21/30 (d) | 430,000 | 369,564 | |
| Peruvian Republic: | |||
| 2.783% 1/23/31 | 1,775,000 | 1,510,747 | |
| 3% 1/15/34 | 440,000 | 361,020 | |
| 3.3% 3/11/41 | 360,000 | 271,080 | |
| Province of Santa Fe 7% 3/23/23 (d) | 367,500 | 341,775 | |
| Provincia de Cordoba: | |||
| 6.875% 12/10/25 (d) | 1,051,837 | 801,566 | |
| 6.99% 6/1/27 (d) | 515,562 | 332,634 | |
| Republic of Armenia 7.15% 3/26/25 (d) | 245,000 | 241,065 | |
| Republic of Benin: | |||
| 4.875% 1/19/32 (d) | EUR | 510,000 | 380,732 |
| 5.75% 3/26/26 (d) | EUR | 245,000 | 251,260 |
| Republic of Iraq 5.8% 1/15/28 (Reg. S) | 225,000 | 202,050 | |
| Republic of Kenya: | |||
| 6.875% 6/24/24 (d) | 540,000 | 453,600 | |
| 7% 5/22/27 (d) | 475,000 | 349,125 | |
| Republic of Nigeria: | |||
| 6.125% 9/28/28 (d) | 545,000 | 385,008 | |
| 6.375% 7/12/23 (d) | 385,000 | 377,300 | |
| 6.5% 11/28/27 (d) | 225,000 | 170,438 | |
| 7.143% 2/23/30 (d) | 360,000 | 252,000 | |
| 7.625% 11/21/25 (d) | 1,575,000 | 1,386,000 | |
| Republic of Paraguay: | |||
| 2.739% 1/29/33 (d) | 225,000 | 167,316 | |
| 4.95% 4/28/31 (d) | 480,000 | 442,890 | |
| 5.4% 3/30/50 (d) | 445,000 | 344,124 | |
| Republic of Serbia 2.125% 12/1/30 (d) | 525,000 | 382,594 | |
| Republic of Uzbekistan: | |||
| 3.7% 11/25/30 (d) | 270,000 | 193,388 | |
| 3.9% 10/19/31 (d) | 395,000 | 279,463 | |
| 4.75% 2/20/24 (d) | 215,000 | 204,962 | |
| Republic of Zambia 8.97% 7/30/27 (d) | 335,000 | 194,677 | |
| Romanian Republic: | |||
| 3% 2/27/27 (d) | 470,000 | 414,423 | |
| 3% 2/14/31 (d) | 600,000 | 461,550 | |
| 3.375% 1/28/50 (Reg. S) | EUR | 170,000 | 105,310 |
| 3.625% 3/27/32 (d) | 470,000 | 366,982 | |
| 4.375% 8/22/23 (d) | 210,000 | 209,514 | |
| Rwanda Republic 5.5% 8/9/31 (d) | 595,000 | 467,187 | |
| South African Republic 4.85% 9/30/29 | 235,000 | 200,602 | |
| Spanish Kingdom 1.9% 10/31/52 (Reg. S) (d) | EUR | 370,000 | 291,920 |
| State of Qatar: | |||
| 3.75% 4/16/30 (d) | 1,875,000 | 1,856,250 | |
| 4% 3/14/29 (d) | 580,000 | 585,800 | |
| 4.4% 4/16/50 (d) | 520,000 | 498,550 | |
| 4.817% 3/14/49 (d) | 1,060,000 | 1,065,300 | |
| 5.103% 4/23/48 (d) | 370,000 | 387,113 | |
| 9.75% 6/15/30 (d) | 295,000 | 407,469 | |
| Sultanate of Oman: | |||
| 5.375% 3/8/27 (d) | 120,000 | 116,250 | |
| 5.625% 1/17/28 (d) | 1,465,000 | 1,406,400 | |
| 6% 8/1/29 (d) | 450,000 | 432,563 | |
| 6.25% 1/25/31 (d) | 425,000 | 410,656 | |
| 6.75% 1/17/48 (d) | 750,000 | 645,000 | |
| Turkish Republic: | |||
| 4.25% 3/13/25 | 590,000 | 505,667 | |
| 4.25% 4/14/26 | 215,000 | 172,779 | |
| 4.75% 1/26/26 | 980,000 | 808,500 | |
| 4.875% 10/9/26 | 650,000 | 519,716 | |
| 4.875% 4/16/43 | 715,000 | 421,761 | |
| 5.125% 2/17/28 | 520,000 | 395,948 | |
| 5.75% 3/22/24 | 260,000 | 240,793 | |
| 5.75% 5/11/47 | 375,000 | 230,461 | |
| 6% 1/14/41 | 165,000 | 104,497 | |
| 6.125% 10/24/28 | 365,000 | 286,479 | |
| 6.35% 8/10/24 | 270,000 | 249,210 | |
| 6.375% 10/14/25 | 720,000 | 635,760 | |
| 7.25% 12/23/23 | 560,000 | 545,055 | |
| Ukraine Government: | |||
| 1.258% 5/31/40 (d)(f) | 370,000 | 90,650 | |
| 6.876% 5/21/29 (d) | 170,000 | 40,800 | |
| 7.253% 3/15/33 (d) | 585,000 | 143,325 | |
| 7.375% 9/25/32 (d) | 285,000 | 69,825 | |
| 7.75% 9/1/22 (d) | 566,000 | 305,640 | |
| 7.75% 9/1/23 (d) | 1,345,000 | 416,950 | |
| 7.75% 9/1/24 (d) | 1,505,000 | 376,250 | |
| 7.75% 9/1/26 (d) | 200,000 | 50,500 | |
| 7.75% 9/1/27 (d) | 110,000 | 27,775 | |
| United Arab Emirates 4.05% 7/7/32 (d)(k) | 440,000 | 442,750 | |
| United Kingdom, Great Britain and Northern Ireland 0.375% 10/22/26 (Reg. S) | GBP | 8,580,000 | 9,764,501 |
| United Mexican States: | |||
| 2.659% 5/24/31 | 510,000 | 419,730 | |
| 3.25% 4/16/30 | 620,000 | 545,329 | |
| 3.5% 2/12/34 | 610,000 | 504,470 | |
| 3.75% 1/11/28 | 590,000 | 566,105 | |
| 3.75% 4/19/71 | 660,000 | 418,193 | |
| 4.5% 4/22/29 | 345,000 | 334,995 | |
| 5.75% 10/12/2110 | 840,000 | 703,133 | |
| 6.05% 1/11/40 | 670,000 | 657,982 | |
| Uruguay Republic 5.1% 6/18/50 | 675,000 | 677,025 | |
| Venezuelan Republic: | |||
| 9.25% 9/15/27 (e) | 2,395,000 | 203,575 | |
| 11.95% 8/5/31 (Reg. S) (e) | 1,090,000 | 92,650 | |
| 12.75% 8/23/22 (e) | 190,000 | 16,388 | |
| Vietnamese Socialist Republic 5.5% 3/12/28 | 1,763,000 | 1,746,802 | |
| TOTAL FOREIGN GOVERNMENT AND GOVERNMENT AGENCY OBLIGATIONS | |||
| (Cost $163,186,832) | 131,805,367 | ||
| Shares | Value | ||
| Common Stocks - 2.5% | |||
| COMMUNICATION SERVICES - 0.1% | |||
| Entertainment - 0.0% | |||
| New Cotai LLC/New Cotai Capital Corp. (b)(c)(m) | 247,076 | 2 | |
| Media - 0.1% | |||
| iHeartMedia, Inc. (m) | 5,655 | 44,618 | |
| Nexstar Broadcasting Group, Inc. Class A | 6,300 | 1,026,144 | |
| 1,070,762 | |||
| TOTAL COMMUNICATION SERVICES | 1,070,764 | ||
| CONSUMER DISCRETIONARY - 0.3% | |||
| Auto Components - 0.0% | |||
| Exide Technologies (c)(m) | 2,115 | 2,115 | |
| Exide Technologies (c)(m) | 124,905 | 1 | |
| Exide Technologies (c)(m) | 84 | 54,600 | |
| UC Holdings, Inc. (c)(m) | 33,750 | 168,075 | |
| 224,791 | |||
| Hotels, Restaurants & Leisure - 0.1% | |||
| Boyd Gaming Corp. | 12,300 | 611,925 | |
| Caesars Entertainment, Inc. (m) | 32,600 | 1,248,580 | |
| Studio City International Holdings Ltd.: | |||
| ADR (m) | 11,100 | 23,865 | |
| ADR (d) | 10,083 | 21,678 | |
| 1,906,048 | |||
| Household Durables - 0.1% | |||
| Tempur Sealy International, Inc. | 33,400 | 713,758 | |
| Specialty Retail - 0.1% | |||
| Lowe's Companies, Inc. | 2,900 | 506,543 | |
| RH (m) | 1,300 | 275,938 | |
| Williams-Sonoma, Inc. | 3,900 | 432,705 | |
| 1,215,186 | |||
| TOTAL CONSUMER DISCRETIONARY | 4,059,783 | ||
| CONSUMER STAPLES - 0.1% | |||
| Food & Staples Retailing - 0.0% | |||
| Southeastern Grocers, Inc. (b)(c)(m) | 40,826 | 996,154 | |
| Food Products - 0.1% | |||
| Darling Ingredients, Inc. (m) | 9,200 | 550,160 | |
| JBS SA | 109,400 | 660,357 | |
| Reddy Ice Holdings, Inc. (c)(m) | 2,286 | 126 | |
| 1,210,643 | |||
| TOTAL CONSUMER STAPLES | 2,206,797 | ||
| ENERGY - 0.7% | |||
| Energy Equipment & Services - 0.1% | |||
| Diamond Offshore Drilling, Inc. (j)(m) | 5,989 | 35,275 | |
| Forbes Energy Services Ltd. (c)(m) | 6,562 | 1 | |
| Jonah Energy Parent LLC (c)(m) | 15,708 | 714,714 | |
| Superior Energy Services, Inc. Class A (c)(m) | 5,560 | 142,340 | |
| 892,330 | |||
| Oil, Gas & Consumable Fuels - 0.6% | |||
| Antero Resources Corp. (m) | 12,900 | 395,385 | |
| California Resources Corp. | 105,452 | 4,059,902 | |
| California Resources Corp. warrants 10/27/24 (m) | 3,099 | 31,827 | |
| Chaparral Energy, Inc.: | |||
| Series A warrants 10/1/24 (c)(m) | 13 | 22 | |
| Series B warrants 10/1/25 (c)(m) | 13 | 22 | |
| Cheniere Energy, Inc. | 8,900 | 1,183,967 | |
| Chesapeake Energy Corp. | 13,074 | 1,060,301 | |
| Chesapeake Energy Corp. (b)(m) | 1,691 | 137,140 | |
| Civitas Resources, Inc. | 3,070 | 160,530 | |
| EP Energy Corp. (c)(m) | 52,316 | 489,155 | |
| Mesquite Energy, Inc. (c)(m) | 15,322 | 898,303 | |
| Unit Corp. (m) | 2,069 | 104,774 | |
| 8,521,328 | |||
| TOTAL ENERGY | 9,413,658 | ||
| FINANCIALS - 0.1% | |||
| Capital Markets - 0.0% | |||
| Penson Worldwide, Inc. Class A (c)(m) | 314,563 | 3 | |
| Consumer Finance - 0.1% | |||
| OneMain Holdings, Inc. | 29,400 | 1,098,972 | |
| Diversified Financial Services - 0.0% | |||
| Axis Energy Services, LLC Class A (c)(m) | 395 | 126 | |
| TOTAL FINANCIALS | 1,099,101 | ||
| HEALTH CARE - 0.1% | |||
| Health Care Providers & Services - 0.0% | |||
| UnitedHealth Group, Inc. | 1,400 | 719,082 | |
| Life Sciences Tools & Services - 0.1% | |||
| Charles River Laboratories International, Inc. (m) | 1,800 | 385,146 | |
| IQVIA Holdings, Inc. (m) | 4,300 | 933,057 | |
| 1,318,203 | |||
| TOTAL HEALTH CARE | 2,037,285 | ||
| INDUSTRIALS - 0.1% | |||
| Building Products - 0.0% | |||
| Carrier Global Corp. | 11,700 | 417,222 | |
| Electrical Equipment - 0.0% | |||
| Array Technologies, Inc. (m) | 300 | 3,303 | |
| Professional Services - 0.1% | |||
| ASGN, Inc. (m) | 10,500 | 947,625 | |
| Trading Companies & Distributors - 0.0% | |||
| Penhall Acquisition Co.: | |||
| Class A (c)(m) | 321 | 44,356 | |
| Class B (c)(m) | 107 | 14,785 | |
| 59,141 | |||
| Transportation Infrastructure - 0.0% | |||
| Tricer Holdco SCA: | |||
| Class A1 (b)(c)(m) | 16,755 | 19 | |
| Class A2 (b)(c)(m) | 16,755 | 19 | |
| Class A3 (b)(c)(m) | 16,755 | 19 | |
| Class A4 (b)(c)(m) | 16,755 | 19 | |
| Class A5 (b)(c)(m) | 16,755 | 19 | |
| Class A6 (b)(c)(m) | 16,755 | 19 | |
| Class A7 (b)(c)(m) | 16,755 | 19 | |
| Class A8 (b)(c)(m) | 16,755 | 19 | |
| Class A9 (b)(c)(m) | 16,755 | 19 | |
| 171 | |||
| TOTAL INDUSTRIALS | 1,427,462 | ||
| INFORMATION TECHNOLOGY - 0.5% | |||
| Electronic Equipment & Components - 0.0% | |||
| CDW Corp. | 5,000 | 787,800 | |
| IT Services - 0.2% | |||
| Global Payments, Inc. | 12,100 | 1,338,744 | |
| GTT Communications, Inc. rights (c)(m) | 27,222 | 27,222 | |
| SS&C Technologies Holdings, Inc. | 15,008 | 871,515 | |
| 2,237,481 | |||
| Semiconductors & Semiconductor Equipment - 0.3% | |||
| KLA Corp. | 900 | 287,172 | |
| Lam Research Corp. | 1,800 | 767,070 | |
| Marvell Technology, Inc. | 15,400 | 670,362 | |
| Microchip Technology, Inc. | 11,800 | 685,344 | |
| NXP Semiconductors NV | 3,000 | 444,090 | |
| onsemi (m) | 21,400 | 1,076,634 | |
| 3,930,672 | |||
| Software - 0.0% | |||
| Salesforce.com, Inc. (m) | 3,800 | 627,152 | |
| TOTAL INFORMATION TECHNOLOGY | 7,583,105 | ||
| MATERIALS - 0.4% | |||
| Chemicals - 0.2% | |||
| CF Industries Holdings, Inc. | 12,300 | 1,054,479 | |
| The Chemours Co. LLC | 42,600 | 1,364,052 | |
| 2,418,531 | |||
| Containers & Packaging - 0.1% | |||
| Berry Global Group, Inc. (m) | 21,000 | 1,147,440 | |
| WestRock Co. | 23,900 | 952,176 | |
| 2,099,616 | |||
| Metals & Mining - 0.1% | |||
| Algoma Steel Group, Inc. | 21,960 | 197,201 | |
| Algoma Steel SCA (c)(m) | 10,220 | 0 | |
| Elah Holdings, Inc. (m) | 14 | 966 | |
| First Quantum Minerals Ltd. | 54,800 | 1,039,633 | |
| 1,237,800 | |||
| TOTAL MATERIALS | 5,755,947 | ||
| UTILITIES - 0.1% | |||
| Electric Utilities - 0.1% | |||
| NRG Energy, Inc. | 18,400 | 702,328 | |
| PG&E Corp. (m) | 56,566 | 564,529 | |
| Portland General Electric Co. | 140 | 6,766 | |
| 1,273,623 | |||
| Independent Power and Renewable Electricity Producers - 0.0% | |||
| PureWest Energy (c) | 901 | 10,817 | |
| PureWest Energy rights (c)(m) | 543 | 0 | |
| 10,817 | |||
| TOTAL UTILITIES | 1,284,440 | ||
| TOTAL COMMON STOCKS | |||
| (Cost $28,273,617) | 35,938,342 | ||
| Nonconvertible Preferred Stocks - 0.0% | |||
| CONSUMER DISCRETIONARY - 0.0% | |||
| Auto Components - 0.0% | |||
| Exide Technologies (c)(m) | 187 | 174,050 | |
| INDUSTRIALS - 0.0% | |||
| Transportation Infrastructure - 0.0% | |||
| Tricer Holdco SCA (b)(c)(m) | 8,042,141 | 2,716 | |
| TOTAL NONCONVERTIBLE PREFERRED STOCKS | |||
| (Cost $460,804) | 176,766 | ||
| Principal Amount(n) | Value | ||
| Bank Loan Obligations - 1.4% | |||
| COMMUNICATION SERVICES - 0.2% | |||
| Diversified Telecommunication Services - 0.1% | |||
| Connect U.S. Finco LLC Tranche B 1LN, term loan 3 month U.S. LIBOR + 3.500% 5.17% 12/12/26 (f)(g)(o) | 474,088 | 434,975 | |
| Frontier Communications Holdings LLC Tranche B 1LN, term loan 3 month U.S. LIBOR + 3.750% 6.0625% 5/1/28 (f)(g)(o) | 262,211 | 244,774 | |
| Securus Technologies Holdings Tranche B, term loan 3 month U.S. LIBOR + 4.500% 6.7504% 11/1/24 (f)(g)(o) | 412,442 | 374,036 | |
| Zayo Group Holdings, Inc. 1LN, term loan 3 month U.S. LIBOR + 3.000% 4.6661% 3/9/27 (f)(g)(o) | 409,763 | 376,617 | |
| 1,430,402 | |||
| Media - 0.1% | |||
| Diamond Sports Group LLC 1LN, term loan U.S. Secured Overnight Fin. Rate (SOFR) Indx + 8.000% 9.1808% 5/25/26 (f)(g)(o) | 358,274 | 355,884 | |
| Nexstar Broadcasting, Inc. Tranche B, term loan 3 month U.S. LIBOR + 2.500% 4.1661% 9/19/26 (f)(g)(o) | 134,627 | 132,421 | |
| Univision Communications, Inc.: | |||
| 1LN, term loan CME TERM SOFR 1 MONTH INDEX + 4.250% 6.2543% 6/10/29 (f)(g)(o) | 35,000 | 33,279 | |
| Tranche B 1LN, term loan 1 month U.S. LIBOR + 3.250% 4.9161% 1/31/29 (f)(g)(o) | 354,113 | 330,210 | |
| 851,794 | |||
| TOTAL COMMUNICATION SERVICES | 2,282,196 | ||
| CONSUMER DISCRETIONARY - 0.2% | |||
| Auto Components - 0.0% | |||
| Midas Intermediate Holdco II LLC Tranche B 1LN, term loan 3 month U.S. LIBOR + 7.750% 11.5% 12/16/25 (f)(g)(o) | 50,896 | 46,528 | |
| PECF USS Intermediate Holding III Corp. Tranche B 1LN, term loan 1 month U.S. LIBOR + 4.250% 5.9161% 12/17/28 (f)(g)(o) | 104,475 | 94,028 | |
| 140,556 | |||
| Diversified Consumer Services - 0.1% | |||
| KUEHG Corp. Tranche B 2LN, term loan 3 month U.S. LIBOR + 8.250% 10.5004% 8/22/25 (f)(g)(o) | 305,000 | 291,784 | |
| Sotheby's Tranche B 1LN, term loan 1 month U.S. LIBOR + 4.500% 5.5443% 1/15/27 (f)(g)(o) | 591,233 | 564,628 | |
| Spin Holdco, Inc. Tranche B 1LN, term loan 3 month U.S. LIBOR + 4.000% 5.6107% 3/4/28 (f)(g)(o) | 838,737 | 770,380 | |
| 1,626,792 | |||
| Hotels, Restaurants & Leisure - 0.0% | |||
| Fertitta Entertainment LLC NV Tranche B 1LN, term loan U.S. Secured Overnight Fin. Rate (SOFR) Indx + 4.000% 5.5341% 1/27/29 (f)(g)(o) | 174,563 | 160,533 | |
| Light & Wonder, Inc. 1LN, term loan CME TERM SOFR 1 MONTH INDEX + 3.250% 4.3577% 4/7/29 (f)(g)(o) | 110,000 | 104,225 | |
| 264,758 | |||
| Specialty Retail - 0.1% | |||
| Michaels Companies, Inc. 1LN, term loan 3 month U.S. LIBOR + 4.250% 6.5004% 4/15/28 (f)(g)(o) | 267,300 | 219,483 | |
| Wand NewCo 3, Inc. Tranche B 1LN, term loan 3 month U.S. LIBOR + 3.000% 4.6661% 2/5/26 (f)(g)(o) | 955,719 | 885,235 | |
| 1,104,718 | |||
| TOTAL CONSUMER DISCRETIONARY | 3,136,824 | ||
| CONSUMER STAPLES - 0.0% | |||
| Beverages - 0.0% | |||
| Bengal Debt Merger Sub LLC 1LN, term loan U.S. Secured Overnight Fin. Rate (SOFR) Indx + 3.250% 5.4031% 1/24/29 (f)(g)(o) | 105,000 | 97,519 | |
| ENERGY - 0.0% | |||
| Energy Equipment & Services - 0.0% | |||
| Forbes Energy Services LLC Tranche B, term loan 0% 12/31/49 (c)(e)(f)(o) | 61,482 | 0 | |
| Oil, Gas & Consumable Fuels - 0.0% | |||
| Citgo Holding, Inc. Tranche B 1LN, term loan 3 month U.S. LIBOR + 7.000% 8.6661% 8/1/23 (f)(g)(o) | 72,399 | 71,328 | |
| Mesquite Energy, Inc.: | |||
| 1LN, term loan 3 month U.S. LIBOR + 8.000% 0% (c)(e)(g)(o) | 283,417 | 0 | |
| term loan 3 month U.S. LIBOR + 0.000% 0% (c)(e)(g)(o) | 122,000 | 0 | |
| 71,328 | |||
| TOTAL ENERGY | 71,328 | ||
| FINANCIALS - 0.1% | |||
| Capital Markets - 0.0% | |||
| Citadel Securities LP Tranche B 1LN, term loan 3 month U.S. LIBOR + 2.500% 4.1398% 2/27/28 (f)(g)(o) | 534,600 | 513,050 | |
| Insurance - 0.1% | |||
| Acrisure LLC Tranche B 1LN, term loan 1 month U.S. LIBOR + 4.250% 5.9161% 2/15/27 (f)(g)(o) | 64,675 | 60,903 | |
| Alliant Holdings Intermediate LLC Tranche B3 1LN, term loan 1 month U.S. LIBOR + 3.500% 5.0093% 11/12/27 (f)(g)(o) | 638,178 | 592,069 | |
| 652,972 | |||
| TOTAL FINANCIALS | 1,166,022 | ||
| HEALTH CARE - 0.2% | |||
| Health Care Providers & Services - 0.1% | |||
| Gainwell Acquisition Corp. Tranche B 1LN, term loan 3 month U.S. LIBOR + 4.000% 6.2504% 10/1/27 (f)(g)(o) | 971,743 | 917,083 | |
| Phoenix Newco, Inc. Tranche B 1LN, term loan 1 month U.S. LIBOR + 3.250% 4.9631% 11/15/28 (f)(g)(o) | 329,175 | 308,437 | |
| 1,225,520 | |||
| Health Care Technology - 0.1% | |||
| Athenahealth Group, Inc.: | |||
| Tranche B 1LN, term loan U.S. Secured Overnight Fin. Rate (SOFR) Indx + 3.500% 5.0091% 2/15/29 (f)(g)(o) | 1,308,261 | 1,201,154 | |
| Tranche DD 1LN, term loan U.S. Secured Overnight Fin. Rate (SOFR) Indx + 3.500% 2/15/29 (g)(o)(p) | 221,739 | 203,585 | |
| 1,404,739 | |||
| TOTAL HEALTH CARE | 2,630,259 | ||
| INDUSTRIALS - 0.3% | |||
| Air Freight & Logistics - 0.0% | |||
| Dynasty Acquisition Co., Inc.: | |||
| Tranche B 1LN, term loan 3 month U.S. LIBOR + 3.500% 5.1661% 4/8/26 (f)(g)(o) | 136,162 | 125,201 | |
| Tranche B2 1LN, term loan 3 month U.S. LIBOR + 3.500% 5.1661% 4/4/26 (f)(g)(o) | 73,206 | 67,312 | |
| 192,513 | |||
| Airlines - 0.1% | |||
| Air Canada Tranche B 1LN, term loan 1 month U.S. LIBOR + 3.500% 4.25% 8/11/28 (f)(g)(o) | 425,000 | 389,938 | |
| SkyMiles IP Ltd. Tranche B 1LN, term loan 3 month U.S. LIBOR + 3.750% 4.75% 10/20/27 (f)(g)(o) | 205,000 | 203,526 | |
| 593,464 | |||
| Building Products - 0.1% | |||
| Acproducts Holdings, Inc. Tranche B 1LN, term loan 1 month U.S. LIBOR + 4.250% 6.0622% 5/17/28 (f)(g)(o) | 1,128,600 | 869,022 | |
| Hunter Douglas, Inc. Tranche B 1LN, term loan U.S. Secured Overnight Fin. Rate (SOFR) Indx + 3.500% 4.8417% 2/25/29 (f)(g)(o) | 1,045,000 | 896,746 | |
| 1,765,768 | |||
| Commercial Services & Supplies - 0.1% | |||
| ABG Intermediate Holdings 2 LLC: | |||
| Tranche B 2LN, term loan 3 month U.S. LIBOR + 6.000% 7.6253% 12/20/29 (c)(f)(g)(o) | 50,000 | 46,000 | |
| Tranche B1 LN, term loan U.S. Secured Overnight Fin. Rate (SOFR) Indx + 3.500% 5.1253% 12/21/28 (f)(g)(o) | 250,000 | 233,125 | |
| Madison IAQ LLC Tranche B 1LN, term loan 1 month U.S. LIBOR + 3.250% 4.5244% 6/21/28 (f)(g)(o) | 138,600 | 125,895 | |
| Sabert Corp. Tranche B 1LN, term loan 3 month U.S. LIBOR + 4.500% 6.1875% 12/10/26 (c)(f)(g)(o) | 401,025 | 379,971 | |
| 784,991 | |||
| Construction & Engineering - 0.0% | |||
| SRS Distribution, Inc. Tranche B 1LN, term loan 1 month U.S. LIBOR + 3.500% 4.0187% 6/4/28 (f)(g)(o) | 302,713 | 278,647 | |
| TOTAL INDUSTRIALS | 3,615,383 | ||
| INFORMATION TECHNOLOGY - 0.3% | |||
| Electronic Equipment & Components - 0.0% | |||
| DG Investment Intermediate Holdings, Inc. Tranche B 1LN, term loan 3 month U.S. LIBOR + 3.750% 5.4161% 3/31/28 (f)(g)(o) | 99,003 | 92,290 | |
| IT Services - 0.1% | |||
| Acuris Finance U.S., Inc. 1LN, term loan 3 month U.S. LIBOR + 4.000% 6.2044% 2/16/28 (f)(g)(o) | 60,938 | 57,281 | |
| Camelot Finance SA Tranche B, term loan 3 month U.S. LIBOR + 3.000% 4.6661% 10/31/26 (f)(g)(o) | 58,500 | 55,234 | |
| GTT Communications, Inc. Tranche B, term loan 3 month U.S. LIBOR + 4.750% 8.5% 5/31/25 (f)(g)(o) | 745,026 | 581,843 | |
| Hunter U.S. Bidco, Inc. Tranche B 1LN, term loan 1 month U.S. LIBOR + 4.250% 6.5004% 8/19/28 (f)(g)(o) | 530,775 | 502,909 | |
| 1,197,267 | |||
| Software - 0.2% | |||
| Boxer Parent Co., Inc. Tranche B 1LN, term loan 3 month U.S. LIBOR + 3.750% 5.4161% 10/2/25 (f)(g)(o) | 1,614,806 | 1,500,429 | |
| Polaris Newco LLC Tranche B 1LN, term loan 1 month U.S. LIBOR + 4.000% 5.6661% 6/2/28 (f)(g)(o) | 317,600 | 292,646 | |
| Proofpoint, Inc. Tranche B 1LN, term loan 1 month U.S. LIBOR + 3.250% 4.8249% 8/31/28 (f)(g)(o) | 308,450 | 285,976 | |
| RealPage, Inc. Tranche B 1LN, term loan 3 month U.S. LIBOR + 3.250% 4.6661% 4/22/28 (f)(g)(o) | 308,450 | 284,416 | |
| Ultimate Software Group, Inc. 1LN, term loan 1 month U.S. LIBOR + 3.250% 4.2116% 5/3/26 (f)(g)(o) | 659,996 | 616,687 | |
| VS Buyer LLC Tranche B 1LN, term loan 3 month U.S. LIBOR + 3.000% 4.6661% 2/28/27 (f)(g)(o) | 122,188 | 114,704 | |
| 3,094,858 | |||
| TOTAL INFORMATION TECHNOLOGY | 4,384,415 | ||
| MATERIALS - 0.0% | |||
| Chemicals - 0.0% | |||
| Olympus Water U.S. Holding Corp. Tranche B 1LN, term loan 1 month U.S. LIBOR + 3.750% 6.0625% 11/9/28 (f)(g)(o) | 169,150 | 157,151 | |
| W.R. Grace Holding LLC Tranche B 1LN, term loan 1 month U.S. LIBOR + 3.750% 6.0625% 9/22/28 (f)(g)(o) | 129,350 | 122,430 | |
| 279,581 | |||
| Containers & Packaging - 0.0% | |||
| Clydesdale Acquisition Holdings, Inc. 1LN, term loan CME TERM SOFR 1 MONTH INDEX + 4.250% 5.8753% 3/30/29 (f)(g)(o) | 420,000 | 391,847 | |
| Kloeckner Pentaplast of America, Inc. Tranche B 1LN, term loan 3 month U.S. LIBOR + 4.750% 5.5544% 2/9/26 (f)(g)(o) | 79,000 | 66,558 | |
| 458,405 | |||
| TOTAL MATERIALS | 737,986 | ||
| UTILITIES - 0.1% | |||
| Electric Utilities - 0.1% | |||
| PG&E Corp. Tranche B 1LN, term loan 3 month U.S. LIBOR + 3.000% 4.6875% 6/23/25 (f)(g)(o) | 1,646,400 | 1,548,439 | |
| TOTAL BANK LOAN OBLIGATIONS | |||
| (Cost $21,541,153) | 19,670,371 | ||
| Shares | Value | ||
| Fixed-Income Funds - 8.8% | |||
| Fidelity Floating Rate Central Fund (q) | |||
| (Cost $136,126,336) | 1,335,206 | 125,389,199 | |
| Principal Amount(a) | Value | ||
| Preferred Securities - 4.5% | |||
| COMMUNICATION SERVICES - 0.1% | |||
| Diversified Telecommunication Services - 0.1% | |||
| CAS Capital No 1 Ltd. 4% (Reg. S) (f)(h) | 800,000 | 692,692 | |
| CONSUMER DISCRETIONARY - 0.1% | |||
| Automobiles - 0.1% | |||
| Volkswagen International Finance NV 4.375% (Reg. S) (f)(h) | EUR | 1,800,000 | 1,534,963 |
| CONSUMER STAPLES - 0.1% | |||
| Food Products - 0.1% | |||
| Cosan Overseas Ltd. 8.25% (h) | 1,685,000 | 1,698,423 | |
| ENERGY - 0.5% | |||
| Oil, Gas & Consumable Fuels - 0.5% | |||
| DCP Midstream Partners LP 7.375% (f)(h) | 775,000 | 683,347 | |
| Energy Transfer LP: | |||
| 6.25% (f)(h) | 4,050,000 | 3,130,951 | |
| 6.625% (f)(h) | 1,515,000 | 1,153,341 | |
| 7.125% (f)(h) | 410,000 | 355,493 | |
| Gazprom PJSC Via Gaz Finance PLC 4.5985% (Reg. S) (f)(h) | 550,000 | 93,399 | |
| MPLX LP 6.875% (f)(h) | 1,550,000 | 1,512,039 | |
| Summit Midstream Partners LP 9.5% (f)(h) | 148,000 | 106,737 | |
| 7,035,307 | |||
| FINANCIALS - 3.5% | |||
| Banks - 3.3% | |||
| Banco Do Brasil SA 6.25% (d)(f)(h) | 560,000 | 501,276 | |
| Banco Mercantil del Norte SA: | |||
| 6.75% (d)(f)(h) | 350,000 | 328,819 | |
| 6.875% (d)(f)(h) | 960,000 | 968,573 | |
| 7.625% (d)(f)(h) | 210,000 | 198,794 | |
| Bank of America Corp.: | |||
| 5.2% (f)(h) | 3,717,000 | 3,463,360 | |
| 5.875% (f)(h) | 5,125,000 | 4,588,275 | |
| 6.25% (f)(h) | 1,410,000 | 1,398,295 | |
| BBVA Bancomer SA Texas Branch: | |||
| 5.125% 1/18/33 (d)(f) | 340,000 | 296,262 | |
| 5.35% 11/12/29 (d)(f) | 180,000 | 170,058 | |
| Citigroup, Inc.: | |||
| 4.7% (f)(h) | 3,805,000 | 3,166,162 | |
| 5% (f)(h) | 3,245,000 | 2,903,646 | |
| 5.9% (f)(h) | 1,455,000 | 1,457,813 | |
| 5.95% (f)(h) | 2,675,000 | 2,687,358 | |
| 6.3% (f)(h) | 270,000 | 254,109 | |
| Emirates NBD Bank PJSC 6.125% (Reg. S) (f)(h) | 625,000 | 635,609 | |
| Georgia Bank Joint Stock Co. 11.125% (Reg. S) (f)(h) | 200,000 | 199,682 | |
| Huntington Bancshares, Inc. 5.7% (f)(h) | 650,000 | 564,602 | |
| Itau Unibanco Holding SA 6.125% (d)(f)(h) | 785,000 | 754,787 | |
| JPMorgan Chase & Co.: | |||
| 3 month U.S. LIBOR + 3.320% 4.2869% (f)(g)(h) | 2,145,000 | 2,028,819 | |
| 4% (f)(h) | 4,805,000 | 4,005,915 | |
| 4.6% (f)(h) | 1,225,000 | 1,058,096 | |
| 5% (f)(h) | 1,660,000 | 1,499,115 | |
| 6% (f)(h) | 6,524,000 | 6,278,253 | |
| 6.125% (f)(h) | 850,000 | 814,254 | |
| 6.75% (f)(h) | 400,000 | 413,858 | |
| NBK Tier 1 Financing 2 Ltd. 4.5% (d)(f)(h) | 455,000 | 425,098 | |
| NBK Tier 1 Ltd. 3.625% (d)(f)(h) | 230,000 | 209,249 | |
| Tinkoff Credit Systems 6% (d)(f)(h) | 275,000 | 63,743 | |
| Wells Fargo & Co.: | |||
| 5.875% (f)(h) | 2,600,000 | 2,541,418 | |
| 5.9% (f)(h) | 3,065,000 | 2,779,278 | |
| 46,654,576 | |||
| Capital Markets - 0.2% | |||
| Goldman Sachs Group, Inc.: | |||
| 4.4% (f)(h) | 420,000 | 362,727 | |
| 4.95% (f)(h) | 710,000 | 652,924 | |
| 5% (f)(h) | 2,951,000 | 2,529,199 | |
| 3,544,850 | |||
| Diversified Financial Services - 0.0% | |||
| OEC Finance Ltd. 7.5% pay-in-kind (d)(h) | 1,822 | 33 | |
| TOTAL FINANCIALS | 50,199,459 | ||
| INDUSTRIALS - 0.1% | |||
| Marine - 0.1% | |||
| DP World Salaam 6% (Reg. S) (f)(h) | 600,000 | 619,488 | |
| INFORMATION TECHNOLOGY - 0.1% | |||
| IT Services - 0.1% | |||
| Network i2i Ltd.: | |||
| 3.975% (d)(f)(h) | 315,000 | 265,716 | |
| 5.65% (d)(f)(h) | 570,000 | 534,046 | |
| 799,762 | |||
| MATERIALS - 0.0% | |||
| Construction Materials - 0.0% | |||
| CEMEX S.A.B. de CV 5.125% (d)(f)(h) | 595,000 | 514,536 | |
| REAL ESTATE - 0.0% | |||
| Real Estate Management & Development - 0.0% | |||
| MAF Global Securities Ltd. 5.5% (Reg. S) (f)(h) | 600,000 | 608,827 | |
| TOTAL PREFERRED SECURITIES | |||
| (Cost $71,430,913) | 63,703,457 | ||
| Shares | Value | ||
| Money Market Funds - 8.8% | |||
| Fidelity Cash Central Fund 1.58% (r) | 115,481,375 | 115,504,471 | |
| Fidelity Securities Lending Cash Central Fund 1.58%(r)(s) | 10,165,243 | 10,166,260 | |
| TOTAL MONEY MARKET FUNDS | |||
| (Cost $125,662,177) | 125,670,731 | ||
| TOTAL INVESTMENT IN SECURITIES - 101.2% | |||
| (Cost $1,591,996,425) | 1,440,140,307 | ||
| NET OTHER ASSETS (LIABILITIES) - (1.2)% | (16,593,757) | ||
| NET ASSETS - 100% | $1,423,546,550 |
| TBA Sale Commitments | ||
| Principal Amount | Value | |
| Ginnie Mae | ||
| 2% 7/1/52 | $(1,600,000) | $(1,420,555) |
| 2% 7/1/52 | (1,050,000) | (932,239) |
| 2% 7/1/52 | (500,000) | (443,923) |
| TOTAL GINNIE MAE | (2,796,717) | |
| Uniform Mortgage Backed Securities | ||
| 2% 7/1/52 | (1,900,000) | (1,648,666) |
| 2% 7/1/52 | (1,900,000) | (1,648,666) |
| 3% 7/1/52 | (1,250,000) | (1,163,378) |
| 3.5% 7/1/52 | (200,000) | (192,273) |
| 4% 7/1/52 | (1,600,000) | (1,577,249) |
| TOTAL UNIFORM MORTGAGE BACKED SECURITIES | (6,230,232) | |
| TOTAL TBA SALE COMMITMENTS | ||
| (Proceeds $8,941,515) | $(9,026,949) |
| Futures Contracts | |||||
| Number of contracts | Expiration Date | Notional Amount | Value | Unrealized Appreciation/(Depreciation) | |
| Purchased | |||||
| Treasury Contracts | |||||
| CBOT 10-Year U.S. Treasury Note Contracts (United States) | 510 | Sept. 2022 | $60,450,938 | $(678,596) | $(678,596) |
| CBOT 2-Year U.S. Treasury Note Contracts (United States) | 260 | Sept. 2022 | 54,604,063 | (276,622) | (276,622) |
| CBOT 5-Year U.S. Treasury Note Contracts (United States) | 8 | Sept. 2022 | 898,000 | (7,453) | (7,453) |
| CBOT Ultra Long Term U.S. Treasury Bond Contracts (United States) | 195 | Sept. 2022 | 30,097,031 | (721,783) | (721,783) |
| TOTAL FUTURES CONTRACTS | $(1,684,454) |
The notional amount of futures purchased as a percentage of Net Assets is 10.3%
For the period, the average monthly notional amount at value for futures contracts in the aggregate was $174,910,446.
| Forward Foreign Currency Contracts | ||||||
| Currency Purchased | Currency Sold | Counterparty | Settlement Date | Unrealized Appreciation/(Depreciation) | ||
| EUR | 232,501 | USD | 242,103 | HSBC Bank | 7/1/22 | $1,546 |
| EUR | 281,973 | USD | 295,276 | Morgan Stanley Cap. Group, Inc | 7/1/22 | 217 |
| EUR | 1,323,552 | USD | 1,386,059 | National Australia Bank | 7/1/22 | 958 |
| AUD | 269,000 | USD | 186,599 | HSBC Bank | 7/14/22 | (909) |
| EUR | 326,000 | USD | 345,160 | BNP Paribas S.A. | 7/14/22 | (3,320) |
| EUR | 344,000 | USD | 362,046 | BNP Paribas S.A. | 7/14/22 | (1,331) |
| EUR | 1,723,000 | USD | 1,793,667 | Bank of America, N.A. | 7/14/22 | 13,055 |
| EUR | 475,000 | USD | 503,410 | Barclays Bank PLC | 7/14/22 | (5,329) |
| EUR | 884,000 | USD | 928,881 | Brown Brothers Harriman & Co | 7/14/22 | (1,926) |
| EUR | 2,096,000 | USD | 2,210,106 | Brown Brothers Harriman & Co | 7/14/22 | (12,260) |
| EUR | 779,000 | USD | 815,476 | HSBC Bank | 7/14/22 | 1,376 |
| EUR | 402,000 | USD | 426,734 | Morgan Stanley Cap. Group, Inc | 7/14/22 | (5,200) |
| EUR | 465,000 | USD | 487,548 | National Australia Bank | 7/14/22 | 47 |
| EUR | 358,000 | USD | 376,684 | State Street Bank and Trust Co | 7/14/22 | (1,289) |
| GBP | 159,000 | USD | 192,975 | Brown Brothers Harriman & Co | 7/14/22 | 607 |
| JPY | 23,937,000 | USD | 179,901 | Brown Brothers Harriman & Co | 7/14/22 | (3,380) |
| USD | 784,632 | AUD | 1,100,000 | Brown Brothers Harriman & Co | 7/14/22 | 25,305 |
| USD | 3,971,911 | CAD | 5,055,000 | Royal Bank of Canada | 7/14/22 | 44,833 |
| USD | 2,107,984 | EUR | 2,026,000 | Bank of America, N.A. | 7/14/22 | (16,461) |
| USD | 52,330,535 | EUR | 49,312,000 | Barclays Bank PLC | 7/14/22 | 622,426 |
| USD | 792,273 | EUR | 752,000 | Citibank, N. A. | 7/14/22 | 3,733 |
| USD | 524,197 | EUR | 503,000 | HSBC Bank | 7/14/22 | (3,244) |
| USD | 546,139 | EUR | 524,000 | HSBC Bank | 7/14/22 | (3,322) |
| USD | 642,697 | EUR | 611,000 | HSBC Bank | 7/14/22 | 2,008 |
| USD | 303,928 | EUR | 290,000 | Morgan Stanley Cap. Group, Inc | 7/14/22 | (164) |
| USD | 1,371,919 | EUR | 1,309,000 | National Australia Bank | 7/14/22 | (686) |
| USD | 188,534 | EUR | 179,000 | National Australia Bank | 7/14/22 | 836 |
| USD | 231,815 | EUR | 220,000 | Royal Bank of Canada | 7/14/22 | 1,125 |
| USD | 10,092,389 | GBP | 8,084,000 | Brown Brothers Harriman & Co | 7/14/22 | 250,142 |
| USD | 4,942,680 | JPY | 661,166,000 | Royal Bank of Canada | 7/14/22 | 66,995 |
| TOTAL FORWARD FOREIGN CURRENCY CONTRACTS | $976,388 | |||||
| Unrealized Appreciation | 1,035,209 | |||||
| Unrealized Depreciation | (58,821) | |||||
For the period, the average contract value for forward foreign currency contracts was $174,910,446. Contract value represents contract amount in United States dollars plus or minus unrealized appreciation or depreciation, respectively
Currency Abbreviations
AUD – Australian dollar
CAD – Canadian dollar
EUR – European Monetary Unit
GBP – British pound
JPY – Japanese yen
USD – U.S. dollar
Legend
(a) Amount is stated in United States dollars unless otherwise noted.
(b) Restricted securities (including private placements) - Investment in securities not registered under the Securities Act of 1933 (excluding 144A issues). At the end of the period, the value of restricted securities (excluding 144A issues) amounted to $2,685,270 or 0.2% of net assets.
(c) Level 3 security
(d) Security exempt from registration under Rule 144A of the Securities Act of 1933. These securities may be resold in transactions exempt from registration, normally to qualified institutional buyers. At the end of the period, the value of these securities amounted to $416,804,304 or 29.3% of net assets.
(e) Non-income producing - Security is in default.
(f) Coupon rates for floating and adjustable rate securities reflect the rates in effect at period end.
(g) Coupon is indexed to a floating interest rate which may be multiplied by a specified factor and/or subject to caps or floors.
(h) Security is perpetual in nature with no stated maturity date.
(i) Security or a portion of the security was pledged to cover margin requirements for futures contracts. At period end, the value of securities pledged amounted to $2,520,980.
(j) Security or a portion of the security is on loan at period end.
(k) Security or a portion of the security purchased on a delayed delivery or when-issued basis.
(l) Security initially issued at one coupon which converts to a higher coupon at a specified date. The rate shown is the rate at period end.
(m) Non-income producing
(n) Amount is stated in United States dollars unless otherwise noted.
(o) Remaining maturities of bank loan obligations may be less than the stated maturities shown as a result of contractual or optional prepayments by the borrower. Such prepayments cannot be predicted with certainty.
(p) Position or a portion of the position represents an unfunded loan commitment. At period end, the total principal amount and market value of unfunded commitments totaled $221,739 and $205,663, respectively.
(q) Affiliated fund that is generally available only to investment companies and other accounts managed by Fidelity Investments. A complete unaudited schedule of portfolio holdings for each Fidelity Central Fund is filed with the SEC for the first and third quarters of each fiscal year on Form N-PORT and is available upon request or at the SEC's website at www.sec.gov. An unaudited holdings listing for the Fund, which presents direct holdings as well as the pro-rata share of securities and other investments held indirectly through its investment in underlying non-money market Fidelity Central Funds, is available at fidelity.com and/or institutional.fidelity.com, as applicable. In addition, each Fidelity Central Fund's financial statements are available on the SEC's website or upon request.
(r) Affiliated fund that is generally available only to investment companies and other accounts managed by Fidelity Investments. The rate quoted is the annualized seven-day yield of the fund at period end. A complete unaudited listing of the fund's holdings as of its most recent quarter end is available upon request. In addition, each Fidelity Central Fund's financial statements are available on the SEC's website or upon request.
(s) Investment made with cash collateral received from securities on loan.
Additional information on each restricted holding is as follows:
| Security | Acquisition Date | Acquisition Cost |
| Chesapeake Energy Corp. | 2/10/21 | $16,014 |
| Mesquite Energy, Inc. 15% 7/15/23 | 7/10/20 - 1/18/22 | $119,924 |
| Mesquite Energy, Inc. 15% 7/15/23 | 11/5/20 - 1/18/22 | $208,674 |
| New Cotai LLC/New Cotai Capital Corp. | 9/11/20 | $1,223,948 |
| Southeastern Grocers, Inc. | 6/1/18 | $287,174 |
| Tricer Holdco SCA | 10/16/09 - 12/30/17 | $286,754 |
| Tricer Holdco SCA Class A1 | 10/16/09 - 10/29/09 | $45,666 |
| Tricer Holdco SCA Class A2 | 10/16/09 - 10/29/09 | $45,666 |
| Tricer Holdco SCA Class A3 | 10/16/09 - 10/29/09 | $45,666 |
| Tricer Holdco SCA Class A4 | 10/16/09 - 10/29/09 | $45,666 |
| Tricer Holdco SCA Class A5 | 10/16/09 - 10/29/09 | $45,666 |
| Tricer Holdco SCA Class A6 | 10/16/09 - 10/29/09 | $45,666 |
| Tricer Holdco SCA Class A7 | 10/16/09 - 10/29/09 | $45,666 |
| Tricer Holdco SCA Class A8 | 10/16/09 - 10/29/09 | $45,666 |
| Tricer Holdco SCA Class A9 | 10/16/09 - 10/29/09 | $45,706 |
Affiliated Central Funds
Fiscal year to date information regarding the Fund's investments in Fidelity Central Funds, including the ownership percentage, is presented below.
| Fund | Value, beginning of period | Purchases | Sales Proceeds | Dividend Income | Realized Gain/Loss | Change in Unrealized appreciation (depreciation) | Value, end of period | % ownership, end of period |
| Fidelity Cash Central Fund 1.58% | $122,864,292 | $260,726,462 | $268,086,283 | $247,399 | $-- | $-- | $115,504,471 | 0.2% |
| Fidelity Floating Rate Central Fund | 148,227,047 | 5,004,205 | 18,738,406 | 3,004,735 | (826,770) | (8,276,877) | 125,389,199 | 4.3% |
| Fidelity Mortgage Backed Securities Central Fund | 1,965 | 3 | 1,936 | 4 | (53) | 21 | -- | 0.0% |
| Fidelity Securities Lending Cash Central Fund 1.58% | -- | 32,220,014 | 22,053,754 | 23,474 | -- | -- | 10,166,260 | 0.0% |
| Total | $271,093,304 | $297,950,684 | $308,880,379 | $3,275,612 | $(826,823) | $(8,276,856) | $251,059,930 |
Amounts in the income column in the above table include any capital gain distributions from underlying funds, which are presented in the corresponding line-item in the Statement of Operations, if applicable. Amount for Fidelity Securities Lending Cash Central Fund represents the income earned on investing cash collateral, less rebates paid to borrowers and any lending agent fees associated with the loan, plus any premium payments received for lending certain types of securities.
Investment Valuation
The following is a summary of the inputs used, as of June 30, 2022, involving the Fund's assets and liabilities carried at fair value. The inputs or methodology used for valuing securities may not be an indication of the risk associated with investing in those securities. For more information on valuation inputs, and their aggregation into the levels used below, please refer to the Investment Valuation section in the accompanying Notes to Financial Statements.
| Valuation Inputs at Reporting Date: | ||||
| Description | Total | Level 1 | Level 2 | Level 3 |
| Investments in Securities: | ||||
| Equities: | ||||
| Communication Services | $1,070,764 | $1,070,762 | $-- | $2 |
| Consumer Discretionary | 4,233,833 | 3,834,992 | -- | 398,841 |
| Consumer Staples | 2,206,797 | 1,210,517 | -- | 996,280 |
| Energy | 9,413,658 | 7,169,101 | -- | 2,244,557 |
| Financials | 1,099,101 | 1,098,972 | -- | 129 |
| Health Care | 2,037,285 | 2,037,285 | -- | -- |
| Industrials | 1,430,178 | 1,368,150 | -- | 62,028 |
| Information Technology | 7,583,105 | 7,555,883 | -- | 27,222 |
| Materials | 5,755,947 | 5,755,947 | -- | -- |
| Utilities | 1,284,440 | 1,273,623 | -- | 10,817 |
| Corporate Bonds | 513,825,746 | -- | 511,877,483 | 1,948,263 |
| U.S. Government and Government Agency Obligations | 380,179,091 | -- | 380,179,091 | -- |
| U.S. Government Agency - Mortgage Securities | 38,178,561 | -- | 38,178,561 | -- |
| Commercial Mortgage Securities | 5,602,676 | -- | 5,602,676 | -- |
| Foreign Government and Government Agency Obligations | 131,805,367 | -- | 131,805,367 | -- |
| Bank Loan Obligations | 19,670,371 | -- | 19,244,400 | 425,971 |
| Fixed-Income Funds | 125,389,199 | 125,389,199 | -- | -- |
| Preferred Securities | 63,703,457 | -- | 63,703,457 | -- |
| Money Market Funds | 125,670,731 | 125,670,731 | -- | -- |
| Total Investments in Securities: | $1,440,140,307 | $283,435,162 | $1,150,591,035 | $6,114,110 |
| Derivative Instruments: | ||||
| Assets | ||||
| Forward Foreign Currency Contracts | $1,035,209 | $-- | $1,035,209 | $-- |
| Total Assets | $1,035,209 | $-- | $1,035,209 | $-- |
| Liabilities | ||||
| Futures Contracts | $(1,684,454) | $(1,684,454) | $-- | $-- |
| Forward Foreign Currency Contracts | (58,821) | -- | (58,821) | -- |
| Total Liabilities | $(1,743,275) | $(1,684,454) | $(58,821) | $-- |
| Total Derivative Instruments: | $(708,066) | $(1,684,454) | $976,388 | $-- |
| Other Financial Instruments: | ||||
| TBA Sale Commitments | $(9,026,949) | $-- | $(9,026,949) | $-- |
| Total Other Financial Instruments: | $(9,026,949) | $-- | $(9,026,949) | $-- |
Value of Derivative Instruments
The following table is a summary of the Fund's value of derivative instruments by primary risk exposure as of June 30, 2022. For additional information on derivative instruments, please refer to the Derivative Instruments section in the accompanying Notes to Financial Statements.
| Primary Risk Exposure / Derivative Type | Value | |
| Asset | Liability | |
| Foreign Exchange Risk | ||
| Forward Foreign Currency Contracts(a) | $1,035,209 | $(58,821) |
| Total Foreign Exchange Risk | 1,035,209 | (58,821) |
| Interest Rate Risk | ||
| Futures Contracts(b) | 0 | (1,684,454) |
| Total Interest Rate Risk | 0 | (1,684,454) |
| Total Value of Derivatives | $1,035,209 | $(1,743,275) |
(a) Gross value is presented in the Statement of Assets and Liabilities in the unrealized appreciation/depreciation on forward foreign currency contracts line-items.
(b) Reflects gross cumulative appreciation (depreciation) on futures contracts as presented in the Schedule of Investments. In the Statement of Assets and Liabilities, the period end daily variation margin is included in receivable or payable for daily variation margin on futures contracts, and the net cumulative appreciation (depreciation) is included in Total accumulated earnings (loss).
See accompanying notes which are an integral part of the financial statements.
Financial Statements
Statement of Assets and Liabilities
| June 30, 2022 (Unaudited) | ||
| Assets | ||
| Investment in securities, at value (including securities loaned of $10,042,570) — See accompanying schedule: Unaffiliated issuers (cost $1,330,207,912) | $1,189,080,377 | |
| Fidelity Central Funds (cost $261,788,513) | 251,059,930 | |
| Total Investment in Securities (cost $1,591,996,425) | $1,440,140,307 | |
| Cash | 3,364,582 | |
| Foreign currency held at value (cost $52,400) | 52,279 | |
| Receivable for investments sold | 2,856,996 | |
| Receivable for TBA sale commitments | 8,941,515 | |
| Unrealized appreciation on forward foreign currency contracts | 1,035,209 | |
| Receivable for fund shares sold | 93,960 | |
| Dividends receivable | 15,015 | |
| Interest receivable | 12,629,169 | |
| Distributions receivable from Fidelity Central Funds | 111,898 | |
| Receivable for daily variation margin on futures contracts | 1,100,901 | |
| Total assets | 1,470,341,831 | |
| Liabilities | ||
| Payable for investments purchased | ||
| Regular delivery | $5,580,408 | |
| Delayed delivery | 20,455,883 | |
| TBA sale commitments, at value | 9,026,949 | |
| Unrealized depreciation on forward foreign currency contracts | 58,821 | |
| Payable for fund shares redeemed | 527,267 | |
| Accrued management fee | 663,151 | |
| Distribution and service plan fees payable | 112,233 | |
| Other affiliated payables | 147,218 | |
| Other payables and accrued expenses | 57,091 | |
| Collateral on securities loaned | 10,166,260 | |
| Total liabilities | 46,795,281 | |
| Net Assets | $1,423,546,550 | |
| Net Assets consist of: | ||
| Paid in capital | $1,550,858,543 | |
| Total accumulated earnings (loss) | (127,311,993) | |
| Net Assets | $1,423,546,550 | |
| Net Asset Value and Maximum Offering Price | ||
| Initial Class: | ||
| Net Asset Value, offering price and redemption price per share ($72,369,608 ÷ 6,999,631 shares) | $10.34 | |
| Service Class: | ||
| Net Asset Value, offering price and redemption price per share ($462,490 ÷ 44,793 shares) | $10.33 | |
| Service Class 2: | ||
| Net Asset Value, offering price and redemption price per share ($527,299,088 ÷ 51,654,687 shares) | $10.21 | |
| Investor Class: | ||
| Net Asset Value, offering price and redemption price per share ($823,415,364 ÷ 79,968,633 shares) | $10.30 |
See accompanying notes which are an integral part of the financial statements.
Statement of Operations
| Six months ended June 30, 2022 (Unaudited) | ||
| Investment Income | ||
| Dividends | $2,413,227 | |
| Interest | 23,033,807 | |
| Income from Fidelity Central Funds (including $23,474 from security lending) | 3,275,612 | |
| Total income | 28,722,646 | |
| Expenses | ||
| Management fee | $4,267,488 | |
| Transfer agent fees | 683,916 | |
| Distribution and service plan fees | 720,533 | |
| Accounting fees | 263,182 | |
| Custodian fees and expenses | 20,218 | |
| Independent trustees' fees and expenses | 2,413 | |
| Registration fees | 65 | |
| Audit | 51,505 | |
| Legal | 34,958 | |
| Miscellaneous | 2,979 | |
| Total expenses before reductions | 6,047,257 | |
| Expense reductions | (17,702) | |
| Total expenses after reductions | 6,029,555 | |
| Net investment income (loss) | 22,693,091 | |
| Realized and Unrealized Gain (Loss) | ||
| Net realized gain (loss) on: | ||
| Investment securities: | ||
| Unaffiliated issuers | 2,259,029 | |
| Fidelity Central Funds | (826,823) | |
| Forward foreign currency contracts | 8,972,363 | |
| Foreign currency transactions | (490,406) | |
| Futures contracts | (12,556,599) | |
| Total net realized gain (loss) | (2,642,436) | |
| Change in net unrealized appreciation (depreciation) on: | ||
| Investment securities: | ||
| Unaffiliated issuers | (206,630,166) | |
| Fidelity Central Funds | (8,276,856) | |
| Forward foreign currency contracts | (911,891) | |
| Assets and liabilities in foreign currencies | (7,602) | |
| Futures contracts | (1,914,743) | |
| TBA sale commitments | (84,675) | |
| Total change in net unrealized appreciation (depreciation) | (217,825,933) | |
| Net gain (loss) | (220,468,369) | |
| Net increase (decrease) in net assets resulting from operations | $(197,775,278) |
See accompanying notes which are an integral part of the financial statements.
Statement of Changes in Net Assets
| Six months ended June 30, 2022 (Unaudited) | Year ended December 31, 2021 | |
| Increase (Decrease) in Net Assets | ||
| Operations | ||
| Net investment income (loss) | $22,693,091 | $42,613,129 |
| Net realized gain (loss) | (2,642,436) | 27,637,272 |
| Change in net unrealized appreciation (depreciation) | (217,825,933) | (12,779,803) |
| Net increase (decrease) in net assets resulting from operations | (197,775,278) | 57,470,598 |
| Distributions to shareholders | (1,586,514) | (68,953,706) |
| Share transactions - net increase (decrease) | (68,105,847) | 144,097,619 |
| Total increase (decrease) in net assets | (267,467,639) | 132,614,511 |
| Net Assets | ||
| Beginning of period | 1,691,014,189 | 1,558,399,678 |
| End of period | $1,423,546,550 | $1,691,014,189 |
See accompanying notes which are an integral part of the financial statements.
Financial Highlights
VIP Strategic Income Portfolio Initial Class
| Six months ended (Unaudited) June 30, | Years endedDecember 31, | |||||
| 2022 | 2021 | 2020 | 2019 | 2018 | 2017 | |
| Selected Per–Share Data | ||||||
| Net asset value, beginning of period | $11.74 | $11.81 | $11.45 | $10.75 | $11.50 | $11.07 |
| Income from Investment Operations | ||||||
| Net investment income (loss)A,B | .167 | .327 | .380 | .421 | .418C | .399 |
| Net realized and unrealized gain (loss) | (1.556) | .113 | .477 | .749 | (.716)C | .462 |
| Total from investment operations | (1.389) | .440 | .857 | 1.170 | (.298) | .861 |
| Distributions from net investment income | – | (.320) | (.385) | (.385) | (.444) | (.371) |
| Distributions from net realized gain | (.011) | (.190) | (.112) | (.085) | (.008) | (.060) |
| Total distributions | (.011) | (.510) | (.497) | (.470) | (.452) | (.431) |
| Net asset value, end of period | $10.34 | $11.74 | $11.81 | $11.45 | $10.75 | $11.50 |
| Total ReturnD,E,F | (11.84)% | 3.74% | 7.52% | 10.89% | (2.57)% | 7.79% |
| Ratios to Average Net AssetsB,G,H | ||||||
| Expenses before reductions | .67%I | .66% | .67% | .67% | .66% | .67% |
| Expenses net of fee waivers, if any | .67%I | .66% | .67% | .67% | .66% | .67% |
| Expenses net of all reductions | .67%I | .66% | .66% | .66% | .66% | .67% |
| Net investment income (loss) | 3.05%I | 2.72% | 3.32% | 3.67% | 3.66% | 3.45% |
| Supplemental Data | ||||||
| Net assets, end of period (000 omitted) | $72,370 | $84,605 | $79,320 | $83,769 | $82,529 | $96,952 |
| Portfolio turnover rateJ | 89%I | 103% | 116% | 144% | 118% | 124% |
A Calculated based on average shares outstanding during the period.
B Net investment income (loss) is affected by the timing of the declaration of dividends by any underlying mutual funds or exchange-traded funds (ETFs). Net investment income (loss) of any such underlying funds is not included in the Fund's net investment income (loss) ratio.
C The amount shown reflects reclassifications related to book to tax differences that were made in the year shown.
D Total returns for periods of less than one year are not annualized.
E Total returns do not reflect charges attributable to your insurance company's separate account. Inclusion of these charges would reduce the total returns shown.
F Total returns would have been lower if certain expenses had not been reduced during the applicable periods shown.
G Fees and expenses of any underlying mutual funds or exchange-traded funds (ETFs) are not included in the Fund's expense ratio. The Fund indirectly bears its proportionate share of these expenses. For additional expense information related to investments in Fidelity Central Funds, please refer to the "Investments in Fidelity Central Funds" note found in the Notes to Financial Statements section of the most recent Annual or Semi-Annual report.
H Expense ratios reflect operating expenses of the class. Expenses before reductions do not reflect amounts reimbursed, waived, or reduced through arrangements with the investment adviser, brokerage services, or other offset arrangements, if applicable, and do not represent the amount paid by the class during periods when reimbursements, waivers or reductions occur.
I Annualized
J Amount does not include the portfolio activity of any underlying mutual funds or exchange-traded funds (ETFs).
See accompanying notes which are an integral part of the financial statements.
VIP Strategic Income Portfolio Service Class
| Six months ended (Unaudited) June 30, | Years endedDecember 31, | |||||
| 2022 | 2021 | 2020 | 2019 | 2018 | 2017 | |
| Selected Per–Share Data | ||||||
| Net asset value, beginning of period | $11.73 | $11.81 | $11.42 | $10.72 | $11.47 | $11.05 |
| Income from Investment Operations | ||||||
| Net investment income (loss)A,B | .161 | .315 | .371 | .409 | .406C | .389 |
| Net realized and unrealized gain (loss) | (1.550) | .105 | .489 | .750 | (.715)C | .461 |
| Total from investment operations | (1.389) | .420 | .860 | 1.159 | (.309) | .850 |
| Distributions from net investment income | – | (.310) | (.358) | (.374) | (.433) | (.370) |
| Distributions from net realized gain | (.011) | (.190) | (.112) | (.085) | (.008) | (.060) |
| Total distributions | (.011) | (.500) | (.470) | (.459) | (.441) | (.430) |
| Net asset value, end of period | $10.33 | $11.73 | $11.81 | $11.42 | $10.72 | $11.47 |
| Total ReturnD,E,F | (11.85)% | 3.57% | 7.56% | 10.82% | (2.68)% | 7.71% |
| Ratios to Average Net AssetsB,G,H | ||||||
| Expenses before reductions | .77%I | .76% | .77% | .77% | .76% | .77% |
| Expenses net of fee waivers, if any | .77%I | .76% | .77% | .77% | .76% | .77% |
| Expenses net of all reductions | .77%I | .76% | .77% | .76% | .76% | .77% |
| Net investment income (loss) | 2.95%I | 2.62% | 3.21% | 3.57% | 3.56% | 3.35% |
| Supplemental Data | ||||||
| Net assets, end of period (000 omitted) | $462 | $502 | $426 | $1,945 | $1,745 | $1,899 |
| Portfolio turnover rateJ | 89%I | 103% | 116% | 144% | 118% | 124% |
A Calculated based on average shares outstanding during the period.
B Net investment income (loss) is affected by the timing of the declaration of dividends by any underlying mutual funds or exchange-traded funds (ETFs). Net investment income (loss) of any such underlying funds is not included in the Fund's net investment income (loss) ratio.
C The amount shown reflects reclassifications related to book to tax differences that were made in the year shown.
D Total returns for periods of less than one year are not annualized.
E Total returns do not reflect charges attributable to your insurance company's separate account. Inclusion of these charges would reduce the total returns shown.
F Total returns would have been lower if certain expenses had not been reduced during the applicable periods shown.
G Fees and expenses of any underlying mutual funds or exchange-traded funds (ETFs) are not included in the Fund's expense ratio. The Fund indirectly bears its proportionate share of these expenses. For additional expense information related to investments in Fidelity Central Funds, please refer to the "Investments in Fidelity Central Funds" note found in the Notes to Financial Statements section of the most recent Annual or Semi-Annual report.
H Expense ratios reflect operating expenses of the class. Expenses before reductions do not reflect amounts reimbursed, waived, or reduced through arrangements with the investment adviser, brokerage services, or other offset arrangements, if applicable, and do not represent the amount paid by the class during periods when reimbursements, waivers or reductions occur.
I Annualized
J Amount does not include the portfolio activity of any underlying mutual funds or exchange-traded funds (ETFs).
See accompanying notes which are an integral part of the financial statements.
VIP Strategic Income Portfolio Service Class 2
| Six months ended (Unaudited) June 30, | Years endedDecember 31, | |||||
| 2022 | 2021 | 2020 | 2019 | 2018 | 2017 | |
| Selected Per–Share Data | ||||||
| Net asset value, beginning of period | $11.61 | $11.69 | $11.34 | $10.65 | $11.40 | $10.98 |
| Income from Investment Operations | ||||||
| Net investment income (loss)A,B | .151 | .293 | .348 | .389 | .385C | .368 |
| Net realized and unrealized gain (loss) | (1.540) | .108 | .471 | .745 | (.709)C | .459 |
| Total from investment operations | (1.389) | .401 | .819 | 1.134 | (.324) | .827 |
| Distributions from net investment income | – | (.292) | (.357) | (.359) | (.418) | (.347) |
| Distributions from net realized gain | (.011) | (.189) | (.112) | (.085) | (.008) | (.060) |
| Total distributions | (.011) | (.481) | (.469) | (.444) | (.426) | (.407) |
| Net asset value, end of period | $10.21 | $11.61 | $11.69 | $11.34 | $10.65 | $11.40 |
| Total ReturnD,E,F | (11.97)% | 3.44% | 7.25% | 10.66% | (2.82)% | 7.54% |
| Ratios to Average Net AssetsB,G,H | ||||||
| Expenses before reductions | .92%I | .91% | .92% | .92% | .91% | .92% |
| Expenses net of fee waivers, if any | .92%I | .91% | .92% | .92% | .91% | .92% |
| Expenses net of all reductions | .92%I | .91% | .91% | .91% | .91% | .92% |
| Net investment income (loss) | 2.80%I | 2.47% | 3.07% | 3.42% | 3.41% | 3.20% |
| Supplemental Data | ||||||
| Net assets, end of period (000 omitted) | $527,299 | $619,208 | $534,029 | $502,859 | $397,785 | $374,227 |
| Portfolio turnover rateJ | 89%I | 103% | 116% | 144% | 118% | 124% |
A Calculated based on average shares outstanding during the period.
B Net investment income (loss) is affected by the timing of the declaration of dividends by any underlying mutual funds or exchange-traded funds (ETFs). Net investment income (loss) of any such underlying funds is not included in the Fund's net investment income (loss) ratio.
C The amount shown reflects reclassifications related to book to tax differences that were made in the year shown.
D Total returns for periods of less than one year are not annualized.
E Total returns do not reflect charges attributable to your insurance company's separate account. Inclusion of these charges would reduce the total returns shown.
F Total returns would have been lower if certain expenses had not been reduced during the applicable periods shown.
G Fees and expenses of any underlying mutual funds or exchange-traded funds (ETFs) are not included in the Fund's expense ratio. The Fund indirectly bears its proportionate share of these expenses. For additional expense information related to investments in Fidelity Central Funds, please refer to the "Investments in Fidelity Central Funds" note found in the Notes to Financial Statements section of the most recent Annual or Semi-Annual report.
H Expense ratios reflect operating expenses of the class. Expenses before reductions do not reflect amounts reimbursed, waived, or reduced through arrangements with the investment adviser, brokerage services, or other offset arrangements, if applicable, and do not represent the amount paid by the class during periods when reimbursements, waivers or reductions occur.
I Annualized
J Amount does not include the portfolio activity of any underlying mutual funds or exchange-traded funds (ETFs).
See accompanying notes which are an integral part of the financial statements.
VIP Strategic Income Portfolio Investor Class
| Six months ended (Unaudited) June 30, | Years endedDecember 31, | |||||
| 2022 | 2021 | 2020 | 2019 | 2018 | 2017 | |
| Selected Per–Share Data | ||||||
| Net asset value, beginning of period | $11.70 | $11.77 | $11.41 | $10.71 | $11.46 | $11.03 |
| Income from Investment Operations | ||||||
| Net investment income (loss)A,B | .165 | .322 | .375 | .416 | .413C | .394 |
| Net realized and unrealized gain (loss) | (1.554) | .114 | .478 | .750 | (.715)C | .463 |
| Total from investment operations | (1.389) | .436 | .853 | 1.166 | (.302) | .857 |
| Distributions from net investment income | – | (.316) | (.381) | (.381) | (.440) | (.367) |
| Distributions from net realized gain | (.011) | (.190) | (.112) | (.085) | (.008) | (.060) |
| Total distributions | (.011) | (.506) | (.493) | (.466) | (.448) | (.427) |
| Net asset value, end of period | $10.30 | $11.70 | $11.77 | $11.41 | $10.71 | $11.46 |
| Total ReturnD,E,F | (11.88)% | 3.72% | 7.51% | 10.89% | (2.62)% | 7.78% |
| Ratios to Average Net AssetsB,G,H | ||||||
| Expenses before reductions | .70%I | .69% | .70% | .70% | .70% | .71% |
| Expenses net of fee waivers, if any | .70%I | .69% | .70% | .70% | .70% | .71% |
| Expenses net of all reductions | .70%I | .69% | .70% | .70% | .70% | .71% |
| Net investment income (loss) | 3.02%I | 2.69% | 3.28% | 3.63% | 3.63% | 3.41% |
| Supplemental Data | ||||||
| Net assets, end of period (000 omitted) | $823,415 | $986,699 | $944,625 | $969,943 | $907,456 | $1,072,701 |
| Portfolio turnover rateJ | 89%I | 103% | 116% | 144% | 118% | 124% |
A Calculated based on average shares outstanding during the period.
B Net investment income (loss) is affected by the timing of the declaration of dividends by any underlying mutual funds or exchange-traded funds (ETFs). Net investment income (loss) of any such underlying funds is not included in the Fund's net investment income (loss) ratio.
C The amount shown reflects reclassifications related to book to tax differences that were made in the year shown.
D Total returns for periods of less than one year are not annualized.
E Total returns do not reflect charges attributable to your insurance company's separate account. Inclusion of these charges would reduce the total returns shown.
F Total returns would have been lower if certain expenses had not been reduced during the applicable periods shown.
G Fees and expenses of any underlying mutual funds or exchange-traded funds (ETFs) are not included in the Fund's expense ratio. The Fund indirectly bears its proportionate share of these expenses. For additional expense information related to investments in Fidelity Central Funds, please refer to the "Investments in Fidelity Central Funds" note found in the Notes to Financial Statements section of the most recent Annual or Semi-Annual report.
H Expense ratios reflect operating expenses of the class. Expenses before reductions do not reflect amounts reimbursed, waived, or reduced through arrangements with the investment adviser, brokerage services, or other offset arrangements, if applicable, and do not represent the amount paid by the class during periods when reimbursements, waivers or reductions occur.
I Annualized
J Amount does not include the portfolio activity of any underlying mutual funds or exchange-traded funds (ETFs).
See accompanying notes which are an integral part of the financial statements.
Notes to Financial Statements (Unaudited)
For the period ended June 30, 2022
1. Organization.
VIP Strategic Income Portfolio (the Fund) is a fund of Variable Insurance Products Fund V (the Trust) and is authorized to issue an unlimited number of shares. The Trust is registered under the Investment Company Act of 1940, as amended (the 1940 Act), as an open-end management investment company organized as a Massachusetts business trust. Shares of the Fund may only be purchased by insurance companies for the purpose of funding variable annuity or variable life insurance contracts. The Fund offers the following classes of shares: Initial Class shares, Service Class shares, Service Class 2 shares and Investor Class shares. All classes have equal rights and voting privileges, except for matters affecting a single class.
2. Investments in Fidelity Central Funds.
Funds may invest in Fidelity Central Funds, which are open-end investment companies generally available only to other investment companies and accounts managed by the investment adviser and its affiliates. The Schedule of Investments lists any Fidelity Central Funds held as an investment as of period end, but does not include the underlying holdings of each Fidelity Central Fund. An investing fund indirectly bears its proportionate share of the expenses of the underlying Fidelity Central Funds.
Based on its investment objective, each Fidelity Central Fund may invest or participate in various investment vehicles or strategies that are similar to those of the investing fund. These strategies are consistent with the investment objectives of the investing fund and may involve certain economic risks which may cause a decline in value of each of the Fidelity Central Funds and thus a decline in the value of the investing fund.
| Fidelity Central Fund | Investment Manager | Investment Objective | Investment Practices | Expense Ratio(a) |
| Fidelity Floating Rate Central Fund | Fidelity Management & Research Company LLC (FMR) | Seeks a high level of income by normally investing in floating rate loans and other floating rate securities. | Foreign Securities Loans & Direct Debt Instruments Restricted Securities | Less than .005% |
| Fidelity Money Market Central Funds | Fidelity Management & Research Company LLC (FMR) | Each fund seeks to obtain a high level of current income consistent with the preservation of capital and liquidity. | Short-term Investments | Less than .005% |
(a) Expenses expressed as a percentage of average net assets and are as of each underlying Central Fund's most recent annual or semi-annual shareholder report.
An unaudited holdings listing for the investing fund, which presents direct holdings as well as the pro-rata share of any securities and other investments held indirectly through its investment in underlying non-money market Fidelity Central Funds, is available at fidelity.com and/or institutional.fidelity.com, as applicable. A complete unaudited list of holdings for each Fidelity Central Fund is available upon request or at the Securities and Exchange Commission website at www.sec.gov. In addition, the financial statements of the Fidelity Central Funds which contain the significant accounting policies (including investment valuation policies) of those funds, and are not covered by the Report of Independent Registered Public Accounting Firm, are available on the Securities and Exchange Commission website or upon request.
3. Significant Accounting Policies.
The Fund is an investment company and applies the accounting and reporting guidance of the Financial Accounting Standards Board (FASB) Accounting Standards Codification Topic 946 Financial Services - Investment Companies. The financial statements have been prepared in conformity with accounting principles generally accepted in the United States of America (GAAP), which require management to make certain estimates and assumptions at the date of the financial statements. Actual results could differ from those estimates. Subsequent events, if any, through the date that the financial statements were issued have been evaluated in the preparation of the financial statements. The Fund's Schedule of Investments lists any underlying mutual funds or exchange-traded funds (ETFs) but does not include the underlying holdings of these funds. The following summarizes the significant accounting policies of the Fund:
Investment Valuation. Investments are valued as of 4:00 p.m. Eastern time on the last calendar day of the period. The Board of Trustees (the Board) has delegated the day to day responsibility for the valuation of the Fund's investments to the Fair Value Committee (the Committee) established by the Fund's investment adviser. In accordance with valuation policies and procedures approved by the Board, the Fund attempts to obtain prices from one or more third party pricing vendors or brokers to value its investments. When current market prices, quotations or currency exchange rates are not readily available or reliable, investments will be fair valued in good faith by the Committee, in accordance with procedures adopted by the Board. Factors used in determining fair value vary by investment type and may include market or investment specific events, changes in interest rates and credit quality. The frequency with which these procedures are used cannot be predicted and they may be utilized to a significant extent. The Committee oversees the Fund's valuation policies and procedures and reports to the Board on the Committee's activities and fair value determinations. The Board monitors the appropriateness of the procedures used in valuing the Fund's investments and ratifies the fair value determinations of the Committee.
The Fund categorizes the inputs to valuation techniques used to value its investments into a disclosure hierarchy consisting of three levels as shown below:
- Level 1 – unadjusted quoted prices in active markets for identical investments
- Level 2 – other significant observable inputs (including quoted prices for similar investments, interest rates, prepayment speeds, etc.)
- Level 3 – unobservable inputs (including the Fund's own assumptions based on the best information available)
Valuation techniques used to value the Fund's investments by major category are as follows:
Debt securities, including restricted securities, are valued based on evaluated prices received from third party pricing vendors or from brokers who make markets in such securities. Corporate bonds, bank loan obligations, foreign government and government agency obligations, preferred securities and U.S. government and government agency obligations are valued by pricing vendors who utilize matrix pricing which considers yield or price of bonds of comparable quality, coupon, maturity and type or by broker-supplied prices. Commercial mortgage securities and U.S. government agency mortgage securities are valued by pricing vendors who utilize matrix pricing which considers prepayment speed assumptions, attributes of the collateral, yield or price of bonds of comparable quality, coupon, maturity and type or by broker-supplied prices. When independent prices are unavailable or unreliable, debt securities may be valued utilizing pricing methodologies which consider similar factors that would be used by third party pricing vendors. For foreign debt securities, when significant market or security specific events arise, valuations may be determined in good faith in accordance with procedures adopted by the Board. Debt securities are generally categorized as Level 2 in the hierarchy but may be Level 3 depending on the circumstances. The Fund invests a significant portion of its assets in below investment grade securities. The value of these securities can be more volatile due to changes in the credit quality of the issuer and is sensitive to changes in economic, market and regulatory conditions.
Equity securities, including restricted securities, for which market quotations are readily available, are valued at the last reported sale price or official closing price as reported by a third party pricing vendor on the primary market or exchange on which they are traded and are categorized as Level 1 in the hierarchy. In the event there were no sales during the day or closing prices are not available, securities are valued at the last quoted bid price or may be valued using the last available price and are generally categorized as Level 2 in the hierarchy. For foreign equity securities, when market or security specific events arise, comparisons to the valuation of American Depositary Receipts (ADRs), futures contracts, Exchange-Traded Funds (ETFs) and certain indexes as well as quoted prices for similar securities may be used and would be categorized as Level 2 in the hierarchy. For equity securities, including restricted securities, where observable inputs are limited, assumptions about market activity and risk are used and these securities may be categorized as Level 3 in the hierarchy.
The U.S. dollar value of foreign currency contracts is determined using currency exchange rates supplied by a pricing service and are categorized as Level 2 in the hierarchy. Futures contracts are valued at the settlement price established each day by the board of trade or exchange on which they are traded and are categorized as Level 1 in the hierarchy. Investments in open-end mutual funds, including the Fidelity Central Funds, are valued at their closing net asset value (NAV) each business day and are categorized as Level 1 in the hierarchy.
Changes in valuation techniques may result in transfers in or out of an assigned level within the disclosure hierarchy. The aggregate value of investments by input level as of June 30, 2022 is included at the end of the Fund's Schedule of Investments.
Foreign Currency. Foreign-denominated assets, including investment securities, and liabilities are translated into U.S. dollars at the exchange rates at period end. Purchases and sales of investment securities, income and dividends received, and expenses denominated in foreign currencies are translated into U.S. dollars at the exchange rate in effect on the transaction date.
The effects of exchange rate fluctuations on investments are included with the net realized and unrealized gain (loss) on investment securities. Other foreign currency transactions resulting in realized and unrealized gain (loss) are disclosed separately.
Realized gains and losses on foreign currency transactions arise from the disposition of foreign currency, realized changes in the value of foreign currency between the trade and settlement dates on security transactions, and the difference between the amounts of dividends, interest and foreign withholding taxes recorded on transaction date and the U.S. dollar equivalent of the amounts actually received or paid. Unrealized gains and losses on assets and liabilities in foreign currencies arise from changes in the value of foreign currency, and from assets and liabilities denominated in foreign currencies, other than investments, which are held at period end.
Investment Transactions and Income. For financial reporting purposes, the Fund's investment holdings and NAV include trades executed through the end of the last business day of the period. The NAV per share for processing shareholder transactions is calculated as of the close of business of the New York Stock Exchange (NYSE), normally 4:00 p.m. Eastern time and includes trades executed through the end of the prior business day. Gains and losses on securities sold are determined on the basis of identified cost and include proceeds received from litigation. Commissions paid to certain brokers with whom the investment adviser, or its affiliates, places trades on behalf of a fund include an amount in addition to trade execution, which may be rebated back to a fund. Any such rebates are included in net realized gain (loss) on investments in the Statement of Operations. Dividend income is recorded on the ex-dividend date, except for certain dividends from foreign securities where the ex-dividend date may have passed, which are recorded as soon as the Fund is informed of the ex-dividend date. Non-cash dividends included in dividend income, if any, are recorded at the fair market value of the securities received. Income and capital gain distributions from Fidelity Central Funds, if any, are recorded on the ex-dividend date. Certain distributions received by the Fund represent a return of capital or capital gain. The Fund determines the components of these distributions subsequent to the ex-dividend date, based upon receipt of tax filings or other correspondence relating to the underlying investment. These distributions are recorded as a reduction of cost of investments and/or as a realized gain. Interest income is accrued as earned and includes coupon interest and amortization of premium and accretion of discount on debt securities as applicable. Paid in Kind (PIK) income is recorded at the fair market value of the securities received. Investment income is recorded net of foreign taxes withheld where recovery of such taxes is uncertain. Debt obligations may be placed on non-accrual status and related interest income may be reduced by ceasing current accruals and writing off interest receivables when the collection of all or a portion of interest has become doubtful based on consistently applied procedures. A debt obligation is removed from non-accrual status when the issuer resumes interest payments or when collectability of interest is reasonably assured. Funds may file withholding tax reclaims in certain jurisdictions to recover a portion of amounts previously withheld. Any withholding tax reclaims income is included in the Statement of Operations in interest. Any receivables for withholding tax reclaims are included in the Statement of Assets and Liabilities in interest receivable.
Class Allocations and Expenses. Investment income, realized and unrealized capital gains and losses, common expenses of a fund, and certain fund-level expense reductions, if any, are allocated daily on a pro-rata basis to each class based on the relative net assets of each class to the total net assets of a fund. Each class differs with respect to transfer agent and distribution and service plan fees incurred, as applicable. Certain expense reductions may also differ by class, if applicable. For the reporting period, the allocated portion of income and expenses to each class as a percent of its average net assets may vary due to the timing of recording these transactions in relation to fluctuating net assets of the classes. Expenses directly attributable to a fund are charged to that fund. Expenses attributable to more than one fund are allocated among the respective funds on the basis of relative net assets or other appropriate methods. Expenses included in the accompanying financial statements reflect the expenses of that fund and do not include any expenses associated with any underlying mutual funds or exchange-traded funds. Although not included in a fund's expenses, a fund indirectly bears its proportionate share of these expenses through the net asset value of each underlying mutual fund or exchange-traded fund. Expense estimates are accrued in the period to which they relate and adjustments are made when actual amounts are known.
Income Tax Information and Distributions to Shareholders. Each year, the Fund intends to qualify as a regulated investment company under Subchapter M of the Internal Revenue Code, including distributing substantially all of its taxable income and realized gains. As a result, no provision for U.S. Federal income taxes is required. The Fund files a U.S. federal tax return, in addition to state and local tax returns as required. The Fund's federal income tax returns are subject to examination by the Internal Revenue Service (IRS) for a period of three fiscal years after they are filed. State and local tax returns may be subject to examination for an additional fiscal year depending on the jurisdiction. Foreign taxes are provided for based on the Fund's understanding of the tax rules and rates that exist in the foreign markets in which it invests.
Distributions are declared and recorded on the ex-dividend date. Income and capital gain distributions are declared separately for each class. Income and capital gain distributions are determined in accordance with income tax regulations, which may differ from GAAP.
Capital accounts within the financial statements are adjusted for permanent book-tax differences. These adjustments have no impact on net assets or the results of operations. Capital accounts are not adjusted for temporary book-tax differences which will reverse in a subsequent period.
Book-tax differences are primarily due to the short-term gain distributions from the Fidelity Central Funds, futures contracts, swaps, foreign currency transactions, defaulted bonds, market discount, partnerships and losses deferred due to wash sales and futures contracts.
As of period end, the cost and unrealized appreciation (depreciation) in securities, and derivatives if applicable, for federal income tax purposes were as follows:
| Gross unrealized appreciation | $26,711,651 |
| Gross unrealized depreciation | (176,338,529) |
| Net unrealized appreciation (depreciation) | $(149,626,878) |
| Tax cost | $1,588,973,685 |
Delayed Delivery Transactions and When-Issued Securities. During the period, certain Funds transacted in securities on a delayed delivery or when-issued basis. Payment and delivery may take place after the customary settlement period for that security. The price of the underlying securities and the date when the securities will be delivered and paid for are fixed at the time the transaction is negotiated. Securities purchased on a delayed delivery or when-issued basis are identified as such in the Schedule of Investments. Compensation for interest forgone in the purchase of a delayed delivery or when-issued debt security may be received. With respect to purchase commitments, each applicable Fund identifies securities as segregated in its records with a value at least equal to the amount of the commitment. Payables and receivables associated with the purchases and sales of delayed delivery securities having the same coupon, settlement date and broker are offset. Delayed delivery or when-issued securities that have been purchased from and sold to different brokers are reflected as both payables and receivables in the Statement of Assets and Liabilities under the caption "Delayed delivery", as applicable. Losses may arise due to changes in the value of the underlying securities or if the counterparty does not perform under the contract's terms, or if the issuer does not issue the securities due to political, economic, or other factors.
To-Be-Announced (TBA) Securities and Mortgage Dollar Rolls. TBA securities involve buying or selling mortgage-backed securities (MBS) on a forward commitment basis. A TBA transaction typically does not designate the actual security to be delivered and only includes an approximate principal amount; however delivered securities must meet specified terms defined by industry guidelines, including issuer, rate and current principal amount outstanding on underlying mortgage pools. Funds may enter into a TBA transaction with the intent to take possession of or deliver the underlying MBS, or a fund may elect to extend the settlement by entering into either a mortgage or reverse mortgage dollar roll. Mortgage dollar rolls are transactions where a fund sells TBA securities and simultaneously agrees to repurchase MBS on a later date at a lower price and with the same counterparty. Reverse mortgage dollar rolls involve the purchase and simultaneous agreement to sell TBA securities on a later date at a lower price. Transactions in mortgage dollar rolls and reverse mortgage dollar rolls are accounted for as purchases and sales and may result in an increase to a fund's portfolio turnover rate.
Purchases and sales of TBA securities involve risks similar to those discussed above for delayed delivery and when-issued securities. Also, if the counterparty in a mortgage dollar roll or a reverse mortgage dollar roll transaction files for bankruptcy or becomes insolvent, a fund's right to repurchase or sell securities may be limited. Additionally, when a fund sells TBA securities without already owning or having the right to obtain the deliverable securities (an uncovered forward commitment to sell), it incurs a risk of loss because it could have to purchase the securities at a price that is higher than the price at which it sold them. A fund may be unable to purchase the deliverable securities if the corresponding market is illiquid.
TBA securities subject to a forward commitment to sell at period end are included at the end of the Schedule of Investments under the caption "TBA Sale Commitments." The proceeds and value of these commitments are reflected in the Statement of Assets and Liabilities as "Receivable for TBA sale commitments" and "TBA sale commitments, at value," respectively.
Restricted Securities (including Private Placements). Funds may invest in securities that are subject to legal or contractual restrictions on resale. These securities generally may be resold in transactions exempt from registration or to the public if the securities are registered. Disposal of these securities may involve time-consuming negotiations and expense, and prompt sale at an acceptable price may be difficult. Information regarding restricted securities held at period end is included at the end of the Schedule of Investments, if applicable.
Loans and Other Direct Debt Instruments. Direct debt instruments are interests in amounts owed to lenders by corporate or other borrowers. These instruments may be in the form of loans, trade claims or other receivables and may include standby financing commitments such as revolving credit facilities that obligate a fund to supply additional cash to the borrower on demand. Loans may be acquired through assignment, participation, or may be made directly to a borrower. Such instruments are presented in the Bank Loan Obligations section in the Schedule of Investments. Certain funds may also invest in unfunded loan commitments, which are contractual obligations for future funding. Information regarding unfunded commitments is included at the end of the Schedule of Investments, if applicable.
4. Derivative Instruments.
Risk Exposures and the Use of Derivative Instruments. Investment objectives allow a fund to enter into various types of derivative contracts, including futures contracts and forward foreign currency contracts. Derivatives are investments whose value is primarily derived from underlying assets, indices or reference rates and may be transacted on an exchange or over-the-counter (OTC). Derivatives may involve a future commitment to buy or sell a specified asset based on specified terms, to exchange future cash flows at periodic intervals based on a notional principal amount, or for one party to make one or more payments upon the occurrence of specified events in exchange for periodic payments from the other party.
Derivatives were used to increase returns, to facilitate transactions in foreign-denominated securities and to manage exposure to certain risks as defined below. The success of any strategy involving derivatives depends on analysis of numerous economic factors, and if the strategies for investment do not work as intended, the objectives may not be achieved.
Derivatives were used to increase or decrease exposure to the following risk(s):
| Foreign Exchange Risk | Foreign exchange rate risk relates to fluctuations in the value of an asset or liability due to changes in currency exchange rates. |
| Interest Rate Risk | Interest rate risk relates to the fluctuations in the value of interest-bearing securities due to changes in the prevailing levels of market interest rates. |
Funds are also exposed to additional risks from investing in derivatives, such as liquidity risk and counterparty credit risk. Liquidity risk is the risk that a fund will be unable to close out the derivative in the open market in a timely manner. Counterparty credit risk is the risk that the counterparty will not be able to fulfill its obligation to a fund. Derivative counterparty credit risk is managed through formal evaluation of the creditworthiness of all potential counterparties. On certain OTC derivatives such as forward foreign currency contracts, a fund attempts to reduce its exposure to counterparty credit risk by entering into an International Swaps and Derivatives Association, Inc. (ISDA) Master Agreement with each of its counterparties. The ISDA Master Agreement gives a fund the right to terminate all transactions traded under such agreement upon the deterioration in the credit quality of the counterparty beyond specified levels. The ISDA Master Agreement gives each party the right, upon an event of default by the other party or a termination of the agreement, to close out all transactions traded under such agreement and to net amounts owed under each transaction to one net payable by one party to the other. To mitigate counterparty credit risk on bi-lateral OTC derivatives, a fund receives collateral in the form of cash or securities once net unrealized appreciation on outstanding derivative contracts under an ISDA Master Agreement exceeds certain applicable thresholds, subject to certain minimum transfer provisions. The collateral received is held in segregated accounts with the custodian bank in accordance with the collateral agreements entered into between a fund, the counterparty and the custodian bank. A fund could experience delays and costs in gaining access to the collateral even though it is held by the custodian bank. The maximum risk of loss to a fund from counterparty credit risk related to bi-lateral OTC derivatives is generally the aggregate unrealized appreciation and unpaid counterparty payments in excess of any collateral pledged by the counterparty to a fund. A fund may be required to pledge collateral for the benefit of the counterparties on bi-lateral OTC derivatives in an amount not less than each counterparty's unrealized appreciation on outstanding derivative contracts, subject to certain minimum transfer provisions, and any such pledged collateral is identified in the Schedule of Investments. Exchange-traded contracts are not covered by the ISDA Master Agreement; however counterparty credit risk related to these contracts may be mitigated by the protection provided by the exchange on which they trade.
Investing in derivatives may involve greater risks than investing in the underlying assets directly and, to varying degrees, may involve risk of loss in excess of any initial investment and collateral received and amounts recognized in the Statement of Assets and Liabilities. In addition, there may be the risk that the change in value of the derivative contract does not correspond to the change in value of the underlying instrument.
Net Realized Gain (Loss) and Change in Net Unrealized Appreciation (Depreciation) on Derivatives. The table below, which reflects the impacts of derivatives on the financial performance, summarizes the net realized gain (loss) and change in net unrealized appreciation (depreciation) for derivatives during the period as presented in the Statement of Operations.
| Primary Risk Exposure / Derivative Type | Net Realized Gain (Loss) | Change in Net Unrealized Appreciation (Depreciation) |
| VIP Strategic Income Portfolio | ||
| Foreign Exchange Risk | ||
| Forward Foreign Currency Contracts | $8,972,363 | $(911,891) |
| Total Foreign Exchange Risk | 8,972,363 | (911,891) |
| Interest Rate Risk | ||
| Futures Contracts | (12,556,599) | (1,914,743) |
| Total Interest Rate Risk | (12,556,599) | (1,914,743) |
| Totals | $(3,584,236) | $(2,826,634) |
If there are any open positions at period end, a summary of the value of derivatives by primary risk exposure is included at the end of the Schedule of Investments.
Forward Foreign Currency Contracts. Forward foreign currency contracts represent obligations to purchase or sell foreign currency on a specified future date at a price fixed at the time the contracts are entered into. Forward foreign currency contracts were used to facilitate transactions in foreign-denominated securities and to manage exposure to certain foreign currencies.
Forward foreign currency contracts are valued daily and fluctuations in exchange rates on open contracts are recorded as unrealized appreciation or (depreciation) and reflected in the Statement of Assets and Liabilities. When the contract is closed, a gain or loss is realized equal to the difference between the closing value and the value at the time it was opened. Non-deliverable forward foreign currency exchange contracts are settled with the counterparty in cash without the delivery of foreign currency. The net realized gain (loss) and change in net unrealized appreciation (depreciation) on forward foreign currency contracts during the period is presented in the Statement of Operations.
Any open forward foreign currency contracts at period end are presented in the Schedule of Investments under the caption "Forward Foreign Currency Contracts." The contract amount and unrealized appreciation (depreciation) reflects each contract's exposure to the underlying currency at period end, and is representative of volume of activity during the period unless an average contract value is presented.
Futures Contracts. A futures contract is an agreement between two parties to buy or sell a specified underlying instrument for a fixed price at a specified future date. Futures contracts were used to manage exposure to the bond market and fluctuations in interest rates.
Upon entering into a futures contract, a fund is required to deposit either cash or securities (initial margin) with a clearing broker in an amount equal to a certain percentage of the face value of the contract. Futures contracts are marked-to-market daily and subsequent daily payments are made or received by a fund depending on the daily fluctuations in the value of the futures contracts and are recorded as unrealized appreciation or (depreciation). This receivable and/or payable, if any, is included in daily variation margin on futures contracts in the Statement of Assets and Liabilities. Realized gain or (loss) is recorded upon the expiration or closing of a futures contract. The net realized gain (loss) and change in net unrealized appreciation (depreciation) on futures contracts during the period is presented in the Statement of Operations.
Any open futures contracts at period end are presented in the Schedule of Investments under the caption "Futures Contracts". The notional amount at value reflects each contract's exposure to the underlying instrument or index at period end, and is representative of volume of activity during the period unless an average notional amount is presented. Any securities deposited to meet initial margin requirements are identified in the Schedule of Investments. Any cash deposited to meet initial margin requirements is presented as segregated cash with brokers for derivative instruments in the Statement of Assets and Liabilities.
5. Purchases and Sales of Investments.
Purchases and sales of securities, other than short-term securities, U.S. government securities and in-kind transactions, as applicable, are noted in the table below.
| Purchases ($) | Sales ($) | |
| VIP Strategic Income Portfolio | 302,083,071 | 405,681,511 |
6. Fees and Other Transactions with Affiliates.
Management Fee. Fidelity Management & Research Company LLC (the investment adviser) and its affiliates provide the Fund with investment management related services for which the Fund pays a monthly management fee. The management fee is the sum of an individual fund fee rate that is based on an annual rate of .45% of the Fund's average net assets and an annualized group fee rate that averaged .10% during the period. The group fee rate is based upon the monthly average net assets of a group of registered investment companies with which the investment adviser has management contracts. The group fee rate decreases as assets under management increase and increases as assets under management decrease. For the reporting period, the total annualized management fee rate was .55% of the Fund's average net assets.
Distribution and Service Plan Fees. In accordance with Rule 12b-1 of the 1940 Act, the Fund has adopted separate 12b-1 Plans for each Service Class of shares. Each Service Class pays Fidelity Distributors Company LLC (FDC), an affiliate of the investment adviser, a service fee. For the period, the service fee is based on an annual rate of .10% of Service Class' average net assets and .25% of Service Class 2's average net assets.
For the period, total fees, all of which were re-allowed to insurance companies for the distribution of shares and providing shareholder support services, were as follows:
| Service Class | $239 |
| Service Class 2 | 720,294 |
| $720,533 |
Transfer Agent Fees. Fidelity Investments Institutional Operations Company LLC (FIIOC), an affiliate of the investment adviser, is the Fund's transfer, dividend disbursing, and shareholder servicing agent. FIIOC receives an asset-based fee with respect to each class. Each class pays a fee for transfer agent services, typesetting and printing and mailing of shareholder reports, excluding mailing of proxy statements. For the period, transfer agent fees for each class were as follows:
| Amount | % of Class-Level Average Net Assets(a) | |
| Initial Class | $26,622 | .07 |
| Service Class | 162 | .07 |
| Service Class 2 | 195,920 | .07 |
| Investor Class | 461,212 | .10 |
| $683,916 |
(a) Annualized
Accounting Fees. Fidelity Service Company, Inc. (FSC), an affiliate of the investment adviser, maintains the Fund's accounting records. The accounting fee is based on the level of average net assets for each month. For the period, the fees were equivalent to the following annualized rates:
| % of Average Net Assets | |
| VIP Strategic Income Portfolio | .03 |
Brokerage Commissions. A portion of portfolio transactions were placed with brokerage firms which are affiliates of the investment adviser. Brokerage commissions are included in net realized gain (loss) and change in net unrealized appreciation (depreciation) in the Statement of Operations. The commissions paid to these affiliated firms were as follows:
| Amount | |
| VIP Strategic Income Portfolio | $171 |
Interfund Trades. Funds may purchase from or sell securities to other Fidelity Funds under procedures adopted by the Board. The procedures have been designed to ensure these interfund trades are executed in accordance with Rule 17a-7 of the 1940 Act. Any interfund trades are included within the respective purchases and sales amounts shown in the Purchases and Sales of Investments note. Interfund trades during the period are noted in the table below.
| Purchases ($) | Sales ($) | Realized Gain (Loss) ($) | |
| VIP Strategic Income Portfolio | 490,314 | 1,051,602 | 385,641 |
7. Committed Line of Credit.
Certain Funds participate with other funds managed by the investment adviser or an affiliate in a $4.25 billion credit facility (the "line of credit") to be utilized for temporary or emergency purposes to fund shareholder redemptions or for other short-term liquidity purposes. The participating funds have agreed to pay commitment fees on their pro-rata portion of the line of credit, which are reflected in Miscellaneous expenses on the Statement of Operations, and are listed below. During the period, there were no borrowings on this line of credit.
| Amount | |
| VIP Strategic Income Portfolio | $1,363 |
8. Security Lending.
Funds lend portfolio securities from time to time in order to earn additional income. Lending agents are used, including National Financial Services (NFS), an affiliate of the investment adviser. Pursuant to a securities lending agreement, NFS will receive a fee, which is capped at 9.9% of a fund's daily lending revenue, for its services as lending agent. A fund may lend securities to certain qualified borrowers, including NFS. On the settlement date of the loan, a fund receives collateral (in the form of U.S. Treasury obligations, letters of credit and/or cash) against the loaned securities and maintains collateral in an amount not less than 100% of the market value of the loaned securities during the period of the loan. The market value of the loaned securities is determined at the close of business of a fund and any additional required collateral is delivered to a fund on the next business day. A fund or borrower may terminate the loan at any time, and if the borrower defaults on its obligation to return the securities loaned because of insolvency or other reasons, a fund may apply collateral received from the borrower against the obligation. A fund may experience delays and costs in recovering the securities loaned. Any cash collateral received is invested in the Fidelity Securities Lending Cash Central Fund. Any loaned securities are identified as such in the Schedule of Investments, and the value of loaned securities and cash collateral at period end, as applicable, are presented in the Statement of Assets and Liabilities. Security lending income represents the income earned on investing cash collateral, less rebates paid to borrowers and any lending agent fees associated with the loan, plus any premium payments received for lending certain types of securities. Security lending income is presented in the Statement of Operations as a component of income from Fidelity Central Funds. Affiliated security lending activity, if any, was as follows:
| Total Security Lending Fees Paid to NFS | Security Lending Income From Securities Loaned to NFS | Value of Securities Loaned to NFS at Period End | |
| VIP Strategic Income Portfolio | $2,542 | $– | $– |
9. Expense Reductions.
Through arrangements with the Fund's custodian, credits realized as a result of certain uninvested cash balances were used to reduce the Fund's expenses. During the period, custodian credits reduced the Fund's expenses by $4,595.
In addition, during the period the investment adviser or an affiliate reimbursed and/or waived a portion of fund-level operating expenses in the amount of $13,107.
10. Distributions to Shareholders.
Distributions to shareholders of each class were as follows:
| Six months ended June 30, 2022 | Year ended December 31, 2021 |
|
| VIP Strategic Income Portfolio | ||
| Distributions to shareholders | ||
| Initial Class | $78,764 | $3,507,252 |
| Service Class | 469 | 20,980 |
| Service Class 2 | 585,167 | 24,471,364 |
| Investor Class | 922,114 | 40,954,110 |
| Total | $1,586,514 | $68,953,706 |
11. Share Transactions.
Transactions for each class of shares were as follows and may contain in-kind transactions:
| Shares | Shares | Dollars | Dollars | |
| Six months ended June 30, 2022 | Year ended December 31, 2021 | Six months ended June 30, 2022 | Year ended December 31, 2021 | |
| VIP Strategic Income Portfolio | ||||
| Initial Class | ||||
| Shares sold | 510,690 | 886,557 | $5,653,062 | $10,638,576 |
| Reinvestment of distributions | 6,891 | 299,350 | 78,764 | 3,507,252 |
| Shares redeemed | (722,856) | (695,312) | (8,013,495) | (8,347,425) |
| Net increase (decrease) | (205,275) | 490,595 | $(2,281,669) | $5,798,403 |
| Service Class | ||||
| Shares sold | 5,968 | 6,908 | $63,646 | $83,589 |
| Reinvestment of distributions | 15 | 628 | 169 | 7,345 |
| Shares redeemed | (4,019) | (815) | (42,852) | (9,769) |
| Net increase (decrease) | 1,964 | 6,721 | $20,963 | $81,165 |
| Service Class 2 | ||||
| Shares sold | 4,164,530 | 9,835,013 | $45,386,480 | $116,858,955 |
| Reinvestment of distributions | 51,785 | 2,112,196 | 585,167 | 24,471,364 |
| Shares redeemed | (5,902,042) | (4,306,582) | (63,883,105) | (51,228,532) |
| Net increase (decrease) | (1,685,727) | 7,640,627 | $(17,911,458) | $90,101,787 |
| Investor Class | ||||
| Shares sold | 2,012,714 | 4,444,658 | $22,047,340 | $53,219,559 |
| Reinvestment of distributions | 80,958 | 3,510,351 | 922,114 | 40,954,110 |
| Shares redeemed | (6,482,677) | (3,858,381) | (70,903,137) | (46,057,405) |
| Net increase (decrease) | (4,389,005) | 4,096,628 | $(47,933,683) | $48,116,264 |
12. Other.
A fund's organizational documents provide former and current trustees and officers with a limited indemnification against liabilities arising in connection with the performance of their duties to the fund. In the normal course of business, a fund may also enter into contracts that provide general indemnifications. A fund's maximum exposure under these arrangements is unknown as this would be dependent on future claims that may be made against a fund. The risk of material loss from such claims is considered remote.
At the end of the period, the investment adviser or its affiliates and certain otherwise unaffiliated shareholders were owners of record of more than 10% of the outstanding shares as follows:
| Fund | Affiliated % | Number of Unaffiliated Shareholders | Unaffiliated Shareholders % |
| VIP: Strategic Income Portfolio | 61% | 2 | 22% |
13. Credit Risk.
The Fund's relatively large investment in countries with limited or developing capital markets may involve greater risks than investments in more developed markets and the prices of such investments may be volatile. The yields of emerging market debt obligations reflect, among other things, perceived credit risk. The consequences of political, social or economic changes in these markets may have disruptive effects on the market prices of the Fund's investments and the income they generate, as well as the Fund's ability to repatriate such amounts.
14. Coronavirus (COVID-19) Pandemic.
An outbreak of COVID-19 first detected in China during December 2019 has since spread globally and was declared a pandemic by the World Health Organization during March 2020. Developments that disrupt global economies and financial markets, such as the COVID-19 pandemic, may magnify factors that affect the Fund's performance.
Shareholder Expense Example
As a shareholder, you incur two types of costs: (1) transaction costs, which may include sales charges (loads) on purchase payments or redemption proceeds, as applicable and (2) ongoing costs, which generally include management fees, distribution and/or service (12b-1) fees and other Fund expenses. This Example is intended to help you understand your ongoing costs (in dollars) of investing in a fund and to compare these costs with the ongoing costs of investing in other mutual funds.
The Example is based on an investment of $1,000 invested at the beginning of the period and held for the entire period (January 1, 2022 to June 30, 2022).
Actual Expenses
The first line of the accompanying table provides information about actual account values and actual expenses. You may use the information in this line, together with the amount you invested, to estimate the expenses that you paid over the period. Simply divide your account value by $1,000.00 (for example, an $8,600 account value divided by $1,000.00 = 8.6), then multiply the result by the number in the first line for a class/Fund under the heading entitled "Expenses Paid During Period" to estimate the expenses you paid on your account during this period. If any fund is a shareholder of any underlying mutual funds or exchange-traded funds (ETFs) (the Underlying Funds), such fund indirectly bears its proportional share of the expenses of the Underlying Funds in addition to the direct expenses incurred presented in the table. These fees and expenses are not included in the annualized expense ratio used to calculate the expense estimate in the table below. The estimate of expenses does not include any fees or other expenses of any variable annuity or variable life insurance product. If they were, the estimate of expenses you paid during the period would be higher, and your ending account value would be lower.
Hypothetical Example for Comparison Purposes
The second line of the accompanying table provides information about hypothetical account values and hypothetical expenses based on the actual expense ratio and an assumed rate of return of 5% per year before expenses, which is not the actual return. The hypothetical account values and expenses may not be used to estimate the actual ending account balance or expenses you paid for the period. You may use this information to compare the ongoing costs of investing in the Fund and other funds. To do so, compare this 5% hypothetical example with the 5% hypothetical examples that appear in the shareholder reports of the other funds. If any fund is a shareholder of any Underlying Funds, such fund indirectly bears its proportional share of the expenses of the Underlying Funds in addition to the direct expenses as presented in the table. These fees and expenses are not included in the annualized expense ratio used to calculate the expense estimate in the table below. The estimate of expenses does not include any fees or other expenses of any variable annuity or variable life insurance product. If they were, the estimate of expenses you paid during the period would be higher, and your ending account value would be lower.
Please note that the expenses shown in the table are meant to highlight your ongoing costs only and do not reflect any transaction costs. Therefore, the second line of the table is useful in comparing ongoing costs only, and will not help you determine the relative total costs of owning different funds. In addition, if these transactional costs were included, your costs would have been higher.
| Annualized Expense Ratio-A | Beginning Account Value January 1, 2022 | Ending Account Value June 30, 2022 | Expenses Paid During Period-B January 1, 2022 to June 30, 2022 |
|
| VIP Strategic Income Portfolio | ||||
| Initial Class | .67% | |||
| Actual | $1,000.00 | $881.60 | $3.13 | |
| Hypothetical-C | $1,000.00 | $1,021.47 | $3.36 | |
| Service Class | .77% | |||
| Actual | $1,000.00 | $881.50 | $3.59 | |
| Hypothetical-C | $1,000.00 | $1,020.98 | $3.86 | |
| Service Class 2 | .92% | |||
| Actual | $1,000.00 | $880.30 | $4.29 | |
| Hypothetical-C | $1,000.00 | $1,020.23 | $4.61 | |
| Investor Class | .70% | |||
| Actual | $1,000.00 | $881.20 | $3.27 | |
| Hypothetical-C | $1,000.00 | $1,021.32 | $3.51 |
A Annualized expense ratio reflects expenses net of applicable fee waivers.
B Expenses are equal to the annualized expense ratio, multiplied by the average account value over the period, multiplied by 181/ 365 (to reflect the one-half year period). The fees and expenses of any Underlying Funds are not included in each annualized expense ratio.
C 5% return per year before expenses
Liquidity Risk Management Program
The Securities and Exchange Commission adopted Rule 22e-4 under the Investment Company Act of 1940 (the Liquidity Rule) to promote effective liquidity risk management throughout the open-end investment company industry, thereby reducing the risk that funds will be unable to meet their redemption obligations and mitigating dilution of the interests of fund shareholders.
The Fund has adopted and implemented a liquidity risk management program pursuant to the Liquidity Rule (the Program) effective December 1, 2018. The Program is reasonably designed to assess and manage the Fund’s liquidity risk and to comply with the requirements of the Liquidity Rule. The Fund’s Board of Trustees (the Board) has designated the Fund’s investment adviser as administrator of the Program. The Fidelity advisers have established a Liquidity Risk Management Committee (the LRM Committee) to manage the Program for each of the Fidelity Funds. The LRM Committee monitors the adequacy and effectiveness of implementation of the Program and on a periodic basis assesses each Fund’s liquidity risk based on a variety of factors including (1) the Fund’s investment strategy, (2) portfolio liquidity and cash flow projections during normal and reasonably foreseeable stressed conditions, (3) shareholder redemptions, (4) borrowings and other funding sources and (5) in the case of exchange-traded funds, certain additional factors including the effect of the Fund’s prices and spreads, market participants, and basket compositions on the overall liquidity of the Fund’s portfolio, as applicable.
In accordance with the Program, each of the Fund’s portfolio investments is classified into one of four liquidity categories described below based on a determination of a reasonable expectation for how long it would take to convert the investment to cash (or sell or dispose of the investment) without significantly changing its market value.
- Highly liquid investments – cash or convertible to cash within three business days or less
- Moderately liquid investments – convertible to cash in three to seven calendar days
- Less liquid investments – can be sold or disposed of, but not settled, within seven calendar days
- Illiquid investments – cannot be sold or disposed of within seven calendar days
Liquidity classification determinations take into account a variety of factors including various market, trading and investment-specific considerations, as well as market depth, and generally utilize analysis from a third-party liquidity metrics service.
The Liquidity Rule places a 15% limit on a fund’s illiquid investments and requires funds that do not primarily hold assets that are highly liquid investments to determine and maintain a minimum percentage of the fund’s net assets to be invested in highly liquid investments (highly liquid investment minimum or HLIM). The Program includes provisions reasonably designed to comply with the 15% limit on illiquid investments and for determining, periodically reviewing and complying with the HLIM requirement as applicable.
At a recent meeting of the Fund’s Board of Trustees, the LRM Committee provided a written report to the Board pertaining to the operation, adequacy, and effectiveness of implementation of the Program for the annual period from December 1, 2020 through November 30, 2021. The report concluded that the Program has been implemented and is operating effectively and is reasonably designed to assess and manage the Fund’s liquidity risk.
![]()
VIPSI-SANN-0822
1.803539.118
Fidelity® Variable Insurance Products:
Target Volatility Portfolio
Semi-Annual Report
June 30, 2022
Contents
|
Board Approval of Investment Advisory Contracts and Management Fees | |
To view a fund's proxy voting guidelines and proxy voting record for the 12-month period ended June 30, visit http://www.fidelity.com/proxyvotingresults or visit the Securities and Exchange Commission's (SEC) web site at http://www.sec.gov.
You may also call 1-877-208-0098 to request a free copy of the proxy voting guidelines.
Fidelity® Variable Insurance Products are separate account options which are purchased through a variable insurance contract.
Standard & Poor's, S&P and S&P 500 are registered service marks of The McGraw-Hill Companies, Inc. and have been licensed for use by Fidelity Distributors Corporation.
Other third-party marks appearing herein are the property of their respective owners.
All other marks appearing herein are registered or unregistered trademarks or service marks of FMR LLC or an affiliated company. © 2022 FMR LLC. All rights reserved.
This report and the financial statements contained herein are submitted for the general information of the shareholders of the Fund. This report is not authorized for distribution to prospective investors in the Fund unless preceded or accompanied by an effective prospectus.
A fund files its complete schedule of portfolio holdings with the SEC for the first and third quarters of each fiscal year on Form N-PORT. Forms N-PORT are available on the SEC’s web site at http://www.sec.gov. A fund's Forms N-PORT may be reviewed and copied at the SEC’s Public Reference Room in Washington, DC. Information regarding the operation of the SEC's Public Reference Room may be obtained by calling 1-800-SEC-0330.
For a complete list of a fund's portfolio holdings, view the most recent holdings listing, semiannual report, or annual report on Fidelity's web site at http://www.fidelity.com, http://www.institutional.fidelity.com, or http://www.401k.com, as applicable.
NOT FDIC INSURED •MAY LOSE VALUE •NO BANK GUARANTEE
Neither the Fund nor Fidelity Distributors Corporation is a bank.
Note to Shareholders:
Early in 2020, the outbreak and spread of COVID-19 emerged as a public health emergency that had a major influence on financial markets, primarily based on its impact on the global economy and corporate earnings. On March 11, 2020, the World Health Organization declared the COVID-19 outbreak a pandemic, citing sustained risk of further global spread. The pandemic prompted a number of measures to limit the spread of COVID-19, including travel and border restrictions, quarantines, and restrictions on large gatherings. In turn, these resulted in lower consumer activity, diminished demand for a wide range of products and services, disruption in manufacturing and supply chains, and – given the wide variability in outcomes regarding the outbreak – significant market uncertainty and volatility. To help stem the turmoil, the U.S. government took unprecedented action – in concert with the U.S. Federal Reserve and central banks around the world – to help support consumers, businesses, and the broader economy, and to limit disruption to the financial system.
In general, the overall impact of the pandemic lessened in 2021, amid a resilient economy and widespread distribution of three COVID-19 vaccines granted emergency use authorization from the U.S. Food and Drug Administration (FDA) early in the year. Still, the situation remains dynamic, and the extent and duration of its influence on financial markets and the economy is highly uncertain, due in part to a recent spike in cases based on highly contagious variants of the coronavirus.
Extreme events such as the COVID-19 crisis are exogenous shocks that can have significant adverse effects on mutual funds and their investments. Although multiple asset classes may be affected by market disruption, the duration and impact may not be the same for all types of assets. Fidelity is committed to helping you stay informed amid news about COVID-19 and during increased market volatility, and we continue to take extra steps to be responsive to customer needs. We encourage you to visit us online, where we offer ongoing updates, commentary, and analysis on the markets and our funds.
Investment Summary (Unaudited)
The information in the following tables is based on the direct investments of the Fund.Portfolio Composition
| % of fund's investments | ||
| Domestic Equity Funds | 31.4% | |
| International Equity Funds | 8.4% | |
| Fixed-Income Funds | 34.8% | |
| U.S. Government and U.S. Government Agency Obligations | 0.4% | |
| Money Market Funds | 25.0% | |
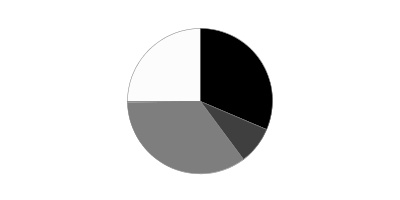
Asset Allocation (% of fund's investments)
| As of June 30, 2022 | ||
| Equities | 39.8% | |
| Bonds | 34.8% | |
| Short-Term and Other | 25.4% | |
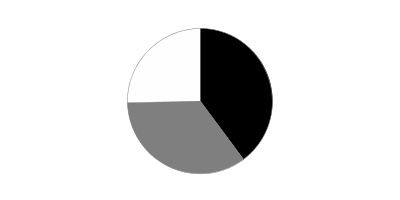
Schedule of Investments June 30, 2022 (Unaudited)
Showing Percentage of Net Assets
| Equity Funds - 39.8% | |||
| Shares | Value | ||
| Domestic Equity Funds - 31.4% | |||
| Fidelity Contrafund (a) | 253,300 | $3,368,892 | |
| Fidelity Equity-Income Fund (a) | 36,471 | 2,281,603 | |
| Fidelity Large Cap Value Enhanced Index Fund (a) | 347,897 | 4,933,182 | |
| Fidelity Low-Priced Stock Fund (a) | 78,999 | 3,675,011 | |
| Fidelity U.S. Low Volatility Equity Fund (a) | 376,521 | 3,772,745 | |
| Fidelity Value Discovery Fund (a) | 52,291 | 1,810,321 | |
| VIP Stock Selector All Cap Portfolio Investor Class (a) | 6,100,837 | 48,318,626 | |
| TOTAL DOMESTIC EQUITY FUNDS | 68,160,380 | ||
| International Equity Funds - 8.4% | |||
| Fidelity Canada Fund (a) | 9,414 | 563,639 | |
| Fidelity Emerging Markets Fund (a) | 144,519 | 4,740,230 | |
| Fidelity International Enhanced Index Fund (a) | 243,084 | 2,207,207 | |
| Fidelity International Value Fund (a) | 334,351 | 2,661,434 | |
| Fidelity Japan Smaller Companies Fund (a) | 109,390 | 1,382,695 | |
| Fidelity Overseas Fund (a) | 140,142 | 6,781,476 | |
| TOTAL INTERNATIONAL EQUITY FUNDS | 18,336,681 | ||
| TOTAL EQUITY FUNDS | |||
| (Cost $95,990,070) | 86,497,061 | ||
| Fixed-Income Funds - 34.8% | |||
| Fixed-Income Funds - 34.8% | |||
| Fidelity Inflation-Protected Bond Index Fund (a) | 508,087 | 5,157,088 | |
| Fidelity Long-Term Treasury Bond Index Fund (a) | 836,808 | 9,648,398 | |
| Fidelity Total Bond Fund (a) | 4,077,822 | 39,514,092 | |
| Fidelity U.S. Bond Index Fund (a) | 2,003,023 | 21,312,170 | |
| TOTAL FIXED-INCOME FUNDS | |||
| (Cost $81,383,400) | 75,631,748 | ||
| U.S. Treasury Obligations - 0.4% | |||
| U.S. Treasury Bills, yield at date of purchase 0.85% to 1.59% 8/4/22 to 9/15/22 (b) | |||
| (Cost $798,828) | 800,000 | 798,448 | |
| Money Market Funds - 25.0% | |||
| Cash Equivalents - 8.6% | |||
| Fidelity Cash Central Fund 1.58% (c) | 18,640,187 | 18,643,915 | |
| Money Market Funds - 16.4% | |||
| Fidelity Investments Money Market Government Portfolio Institutional Class 1.25% (a)(d) | 35,692,332 | 35,692,332 | |
| TOTAL MONEY MARKET FUNDS | |||
| (Cost $54,336,247) | 54,336,247 | ||
| TOTAL INVESTMENT IN SECURITIES - 100.0% | |||
| (Cost $232,508,545) | 217,263,504 | ||
| NET OTHER ASSETS (LIABILITIES) - 0.0% | 84,139 | ||
| NET ASSETS - 100% | $217,347,643 |
| Futures Contracts | |||||
| Number of contracts | Expiration Date | Notional Amount | Value | Unrealized Appreciation/(Depreciation) | |
| Sold | |||||
| Equity Index Contracts | |||||
| CME E-mini S&P 500 Index Contracts (United States) | 62 | Sept. 2022 | $11,747,450 | $(110,265) | $(110,265) |
| ICE E-mini MSCI EAFE Index Contracts (United States) | 33 | Sept. 2022 | 3,063,390 | (19,016) | (19,016) |
| TOTAL FUTURES CONTRACTS | $(129,281) |
The notional amount of futures sold as a percentage of Net Assets is 6.8%
For the period, the average monthly notional amount at value for futures contracts in the aggregate was $13,225,677.
Legend
(a) Affiliated Fund
(b) Security or a portion of the security was pledged to cover margin requirements for futures contracts. At period end, the value of securities pledged amounted to $798,448.
(c) Affiliated fund that is generally available only to investment companies and other accounts managed by Fidelity Investments. The rate quoted is the annualized seven-day yield of the fund at period end. A complete unaudited listing of the fund's holdings as of its most recent quarter end is available upon request. In addition, each Fidelity Central Fund's financial statements are available on the SEC's website or upon request.
(d) The rate quoted is the annualized seven-day yield of the fund at period end.
Affiliated Central Funds
Fiscal year to date information regarding the Fund's investments in Fidelity Central Funds, including the ownership percentage, is presented below.
| Fund | Value, beginning of period | Purchases | Sales Proceeds | Dividend Income | Realized Gain/Loss | Change in Unrealized appreciation (depreciation) | Value, end of period | % ownership, end of period |
| Fidelity Cash Central Fund 1.58% | $16,269,995 | $52,031,711 | $49,657,791 | $39,061 | $-- | $-- | $18,643,915 | 0.0% |
| Fidelity Securities Lending Cash Central Fund 1.58% | 2,097,325 | 20,177,715 | 22,275,040 | 163 | -- | -- | -- | 0.0% |
| Total | $18,367,320 | $72,209,426 | $71,932,831 | $39,224 | $-- | $-- | $18,643,915 |
Amounts in the income column in the above table include any capital gain distributions from underlying funds, which are presented in the corresponding line-item in the Statement of Operations, if applicable. Amount for Fidelity Securities Lending Cash Central Fund represents the income earned on investing cash collateral, less rebates paid to borrowers and any lending agent fees associated with the loan, plus any premium payments received for lending certain types of securities.
Affiliated Underlying Funds
Fiscal year to date information regarding the Fund's investments in affiliated Underlying Funds is presented below. Exchanges between classes of the same affiliated Underlying Funds may occur, and are excluded from purchases and sales below if applicable. If an underlying Fund changes its name, the name presented below is the name in effect at period end.
| Affiliate | Value, beginning of period | Purchases | Sales Proceeds | Dividend Income | Realized Gain (loss) | Change in Unrealized appreciation (depreciation) | Value, end of period |
| Fidelity Canada Fund | $-- | $595,355 | $3,499 | $-- | $(157) | $(28,060) | $563,639 |
| Fidelity Contrafund | 5,935,286 | 111,988 | 1,007,175 | 67,634 | (125,929) | (1,545,278) | 3,368,892 |
| Fidelity Emerging Markets Fund | -- | 5,111,573 | 67,070 | -- | (2,336) | (301,937) | 4,740,230 |
| Fidelity Equity-Income Fund | 3,216,212 | 38,165 | 648,222 | 11,852 | 37,409 | (361,961) | 2,281,603 |
| Fidelity Inflation-Protected Bond Index Fund | 5,946,117 | 49,779 | 312,796 | -- | (10,988) | (515,024) | 5,157,088 |
| Fidelity International Enhanced Index Fund | 7,396,024 | 45,630 | 4,181,991 | -- | 173,856 | (1,226,312) | 2,207,207 |
| Fidelity International Value Fund | 6,215,449 | 50,205 | 2,852,146 | -- | 170,255 | (922,329) | 2,661,434 |
| Fidelity Investments Money Market Government Portfolio Institutional Class 1.25% | -- | 36,713,653 | 1,021,321 | 49,496 | -- | -- | 35,692,332 |
| Fidelity Japan Smaller Companies Fund | 2,096,904 | -- | 312,100 | -- | (92,112) | (309,997) | 1,382,695 |
| Fidelity Large Cap Value Enhanced Index Fund | 7,027,634 | 56,554 | 1,421,481 | -- | 82,525 | (812,050) | 4,933,182 |
| Fidelity Long-Term Treasury Bond Index Fund | 7,249,063 | 5,072,317 | 490,702 | 106,802 | (66,413) | (2,115,867) | 9,648,398 |
| Fidelity Low-Priced Stock Fund | 5,349,057 | 42,079 | 1,068,235 | -- | (55,679) | (592,211) | 3,675,011 |
| Fidelity Overseas Fund | 26,507,575 | 179,056 | 13,631,395 | -- | 2,381,157 | (8,654,917) | 6,781,476 |
| Fidelity Total Bond Fund | 43,263,312 | 3,705,237 | 2,188,184 | 494,666 | (34,537) | (5,231,736) | 39,514,092 |
| Fidelity U.S. Bond Index Fund | 12,546,081 | 11,503,347 | 912,254 | 176,128 | (22,387) | (1,802,617) | 21,312,170 |
| Fidelity U.S. Low Volatility Equity Fund | 5,483,153 | 207,432 | 1,069,340 | 160,504 | 30,049 | (878,549) | 3,772,745 |
| Fidelity Value Discovery Fund | 2,521,999 | 20,333 | 510,536 | -- | 104,000 | (325,475) | 1,810,321 |
| VIP Stock Selector All Cap Portfolio Investor Class | 83,129,938 | 594,751 | 18,592,874 | -- | (2,841,022) | (13,972,167) | 48,318,626 |
| Total | $223,883,804 | $64,097,454 | $50,291,321 | $1,067,082 | $(272,309) | $(39,596,487) | $197,821,141 |
Amounts in the income column in the above table include any capital gain distributions from underlying funds, which are presented in the corresponding line-item in the Statement of Operations, if applicable.
Investment Valuation
The following is a summary of the inputs used, as of June 30, 2022, involving the Fund's assets and liabilities carried at fair value. The inputs or methodology used for valuing securities may not be an indication of the risk associated with investing in those securities. For more information on valuation inputs, and their aggregation into the levels used below, please refer to the Investment Valuation section in the accompanying Notes to Financial Statements.
| Valuation Inputs at Reporting Date: | ||||
| Description | Total | Level 1 | Level 2 | Level 3 |
| Investments in Securities: | ||||
| Equity Funds | $86,497,061 | $86,497,061 | $-- | $-- |
| Fixed-Income Funds | 75,631,748 | 75,631,748 | -- | -- |
| Other Short-Term Investments | 798,448 | -- | 798,448 | -- |
| Money Market Funds | 54,336,247 | 54,336,247 | -- | -- |
| Total Investments in Securities: | $217,263,504 | $216,465,056 | $798,448 | $-- |
| Derivative Instruments: | ||||
| Liabilities | ||||
| Futures Contracts | $(129,281) | $(129,281) | $-- | $-- |
| Total Liabilities | $(129,281) | $(129,281) | $-- | $-- |
| Total Derivative Instruments: | $(129,281) | $(129,281) | $-- | $-- |
Value of Derivative Instruments
The following table is a summary of the Fund's value of derivative instruments by primary risk exposure as of June 30, 2022. For additional information on derivative instruments, please refer to the Derivative Instruments section in the accompanying Notes to Financial Statements.
| Primary Risk Exposure / Derivative Type | Value | |
| Asset | Liability | |
| Equity Risk | ||
| Futures Contracts(a) | $0 | $(129,281) |
| Total Equity Risk | 0 | (129,281) |
| Total Value of Derivatives | $0 | $(129,281) |
(a) Reflects gross cumulative appreciation (depreciation) on futures contracts as presented in the Schedule of Investments. In the Statement of Assets and Liabilities, the period end daily variation margin is included in receivable or payable for daily variation margin on futures contracts, and the net cumulative appreciation (depreciation) is included in Total accumulated earnings (loss).
See accompanying notes which are an integral part of the financial statements.
Financial Statements
Statement of Assets and Liabilities
| June 30, 2022 (Unaudited) | ||
| Assets | ||
| Investment in securities, at value — See accompanying schedule: Unaffiliated issuers (cost $798,828) | $798,448 | |
| Fidelity Central Funds (cost $18,643,915) | 18,643,915 | |
| Other affiliated issuers (cost $213,065,802) | 197,821,141 | |
| Total Investment in Securities (cost $232,508,545) | $217,263,504 | |
| Cash | 21,951 | |
| Receivable for investments sold | 362,468 | |
| Receivable for fund shares sold | 7,214 | |
| Dividends receivable | 177,285 | |
| Distributions receivable from Fidelity Central Funds | 16,844 | |
| Receivable for daily variation margin on futures contracts | 113,770 | |
| Total assets | 217,963,036 | |
| Liabilities | ||
| Payable for investments purchased | $469,915 | |
| Payable for fund shares redeemed | 90,099 | |
| Accrued management fee | 27,706 | |
| Distribution and service plan fees payable | 27,547 | |
| Other affiliated payables | 126 | |
| Total liabilities | 615,393 | |
| Net Assets | $217,347,643 | |
| Net Assets consist of: | ||
| Paid in capital | $228,976,906 | |
| Total accumulated earnings (loss) | (11,629,263) | |
| Net Assets | $217,347,643 | |
| Net Asset Value and Maximum Offering Price | ||
| Service Class: | ||
| Net Asset Value, offering price and redemption price per share ($1,243,899 ÷ 116,422 shares) | $10.68 | |
| Service Class 2: | ||
| Net Asset Value, offering price and redemption price per share ($216,103,744 ÷ 20,331,432 shares) | $10.63 |
See accompanying notes which are an integral part of the financial statements.
Statement of Operations
| Six months ended June 30, 2022 (Unaudited) | ||
| Investment Income | ||
| Dividends: | ||
| Affiliated issuers | $848,409 | |
| Interest | 1,480 | |
| Income from Fidelity Central Funds (including $163 from security lending) | 39,224 | |
| Total income | 889,113 | |
| Expenses | ||
| Management fee | $341,358 | |
| Transfer agent fees | 1,859 | |
| Distribution and service plan fees | 298,851 | |
| Independent trustees' fees and expenses | 373 | |
| Total expenses before reductions | 642,441 | |
| Expense reductions | (179,915) | |
| Total expenses after reductions | 462,526 | |
| Net investment income (loss) | 426,587 | |
| Realized and Unrealized Gain (Loss) | ||
| Net realized gain (loss) on: | ||
| Investment securities: | ||
| Unaffiliated issuers | 1,337,726 | |
| Affiliated issuers | (272,309) | |
| Futures contracts | 2,458,006 | |
| Capital gain distributions from underlying funds: | ||
| Affiliated issuers | 218,673 | |
| Total net realized gain (loss) | 3,742,096 | |
| Change in net unrealized appreciation (depreciation) on: | ||
| Investment securities: | ||
| Unaffiliated issuers | (3,062,969) | |
| Affiliated issuers | (39,596,487) | |
| Futures contracts | (129,281) | |
| Total change in net unrealized appreciation (depreciation) | (42,788,737) | |
| Net gain (loss) | (39,046,641) | |
| Net increase (decrease) in net assets resulting from operations | $(38,620,054) |
See accompanying notes which are an integral part of the financial statements.
Statement of Changes in Net Assets
| Six months ended June 30, 2022 (Unaudited) | Year ended December 31, 2021 | |
| Increase (Decrease) in Net Assets | ||
| Operations | ||
| Net investment income (loss) | $426,587 | $2,117,331 |
| Net realized gain (loss) | 3,742,096 | 41,170,293 |
| Change in net unrealized appreciation (depreciation) | (42,788,737) | (12,732,939) |
| Net increase (decrease) in net assets resulting from operations | (38,620,054) | 30,554,685 |
| Distributions to shareholders | (4,856,493) | (34,340,907) |
| Share transactions - net increase (decrease) | (5,858,564) | (190,497) |
| Total increase (decrease) in net assets | (49,335,111) | (3,976,719) |
| Net Assets | ||
| Beginning of period | 266,682,754 | 270,659,473 |
| End of period | $217,347,643 | $266,682,754 |
See accompanying notes which are an integral part of the financial statements.
Financial Highlights
VIP Target Volatility Portfolio Service Class
| Six months ended (Unaudited) June 30, | Years endedDecember 31, | |||||
| 2022 | 2021 | 2020 | 2019 | 2018 | 2017 | |
| Selected Per–Share Data | ||||||
| Net asset value, beginning of period | $12.76 | $13.05 | $12.40 | $10.86 | $12.14 | $11.22 |
| Income from Investment Operations | ||||||
| Net investment income (loss)A,B | .03 | .13 | .14 | .20 | .19 | .17 |
| Net realized and unrealized gain (loss) | (1.88) | 1.46 | .97 | 1.81 | (.90) | 1.67 |
| Total from investment operations | (1.85) | 1.59 | 1.11 | 2.01 | (.71) | 1.84 |
| Distributions from net investment income | (.10) | –C | (.18) | (.19) | (.20)D | (.16) |
| Distributions from net realized gain | (.13) | (1.88) | (.29) | (.28) | (.37)D | (.76) |
| Total distributions | (.23) | (1.88) | (.46)E | (.47) | (.57) | (.92) |
| Net asset value, end of period | $10.68 | $12.76 | $13.05 | $12.40 | $10.86 | $12.14 |
| Total ReturnF,G,H | (14.65)% | 12.16% | 9.13% | 18.81% | (5.81)% | 16.39% |
| Ratios to Average Net AssetsB,I,J | ||||||
| Expenses before reductions | .39%K | .41% | .40% | .42% | .42% | .42% |
| Expenses net of fee waivers, if any | .24%K | .26% | .25% | .27% | .27% | .27% |
| Expenses net of all reductions | .24%K | .26% | .25% | .27% | .27% | .27% |
| Net investment income (loss) | .51%K | .93% | 1.12% | 1.72% | 1.60% | 1.43% |
| Supplemental Data | ||||||
| Net assets, end of period (000 omitted) | $1,244 | $1,486 | $1,519 | $1,434 | $1,256 | $1,444 |
| Portfolio turnover rateL | 59%K | 64% | 57% | 65% | 85% | 91% |
A Calculated based on average shares outstanding during the period.
B Net investment income (loss) is affected by the timing of the declaration of dividends by any underlying mutual funds or exchange-traded funds (ETFs). Net investment income (loss) of any such underlying funds is not included in the Fund's net investment income (loss) ratio.
C Amount represents less than $.005 per share.
D The amount shown reflects reclassifications related to book to tax differences that were made in the year shown.
E Total distributions per share do not sum due to rounding.
F Total returns for periods of less than one year are not annualized.
G Total returns do not reflect charges attributable to your insurance company's separate account. Inclusion of these charges would reduce the total returns shown.
H Total returns would have been lower if certain expenses had not been reduced during the applicable periods shown.
I Fees and expenses of any underlying mutual funds or exchange-traded funds (ETFs) are not included in the Fund's expense ratio. The Fund indirectly bears its proportionate share of these expenses. For additional expense information related to investments in Fidelity Central Funds, please refer to the "Investments in Fidelity Central Funds" note found in the Notes to Financial Statements section of the most recent Annual or Semi-Annual report.
J Expense ratios reflect operating expenses of the class. Expenses before reductions do not reflect amounts reimbursed, waived, or reduced through arrangements with the investment adviser, brokerage services, or other offset arrangements, if applicable, and do not represent the amount paid by the class during periods when reimbursements, waivers or reductions occur.
K Annualized
L Amount does not include the portfolio activity of any underlying mutual funds or exchange-traded funds (ETFs).
See accompanying notes which are an integral part of the financial statements.
VIP Target Volatility Portfolio Service Class 2
| Six months ended (Unaudited) June 30, | Years endedDecember 31, | |||||
| 2022 | 2021 | 2020 | 2019 | 2018 | 2017 | |
| Selected Per–Share Data | ||||||
| Net asset value, beginning of period | $12.71 | $13.02 | $12.37 | $10.83 | $12.11 | $11.19 |
| Income from Investment Operations | ||||||
| Net investment income (loss)A,B | .02 | .11 | .12 | .18 | .17 | .16 |
| Net realized and unrealized gain (loss) | (1.87) | 1.46 | .97 | 1.81 | (.90) | 1.66 |
| Total from investment operations | (1.85) | 1.57 | 1.09 | 1.99 | (.73) | 1.82 |
| Distributions from net investment income | (.10) | –C | (.16) | (.16) | (.18)D | (.14) |
| Distributions from net realized gain | (.13) | (1.88) | (.29) | (.28) | (.37)D | (.76) |
| Total distributions | (.23) | (1.88) | (.44)E | (.45)E | (.55) | (.90) |
| Net asset value, end of period | $10.63 | $12.71 | $13.02 | $12.37 | $10.83 | $12.11 |
| Total ReturnF,G,H | (14.71)% | 12.03% | 8.99% | 18.65% | (5.99)% | 16.29% |
| Ratios to Average Net AssetsB,I,J | ||||||
| Expenses before reductions | .54%K | .56% | .56% | .57% | .57% | .57% |
| Expenses net of fee waivers, if any | .39%K | .41% | .40% | .42% | .42% | .42% |
| Expenses net of all reductions | .39%K | .41% | .40% | .42% | .42% | .42% |
| Net investment income (loss) | .36%K | .78% | .97% | 1.57% | 1.45% | 1.28% |
| Supplemental Data | ||||||
| Net assets, end of period (000 omitted) | $216,104 | $265,197 | $269,141 | $290,145 | $277,696 | $295,856 |
| Portfolio turnover rateL | 59%K | 64% | 57% | 65% | 85% | 91% |
A Calculated based on average shares outstanding during the period.
B Net investment income (loss) is affected by the timing of the declaration of dividends by any underlying mutual funds or exchange-traded funds (ETFs). Net investment income (loss) of any such underlying funds is not included in the Fund's net investment income (loss) ratio.
C Amount represents less than $.005 per share.
D The amount shown reflects reclassifications related to book to tax differences that were made in the year shown.
E Total distributions per share do not sum due to rounding.
F Total returns for periods of less than one year are not annualized.
G Total returns do not reflect charges attributable to your insurance company's separate account. Inclusion of these charges would reduce the total returns shown.
H Total returns would have been lower if certain expenses had not been reduced during the applicable periods shown.
I Fees and expenses of any underlying mutual funds or exchange-traded funds (ETFs) are not included in the Fund's expense ratio. The Fund indirectly bears its proportionate share of these expenses. For additional expense information related to investments in Fidelity Central Funds, please refer to the "Investments in Fidelity Central Funds" note found in the Notes to Financial Statements section of the most recent Annual or Semi-Annual report.
J Expense ratios reflect operating expenses of the class. Expenses before reductions do not reflect amounts reimbursed, waived, or reduced through arrangements with the investment adviser, brokerage services, or other offset arrangements, if applicable, and do not represent the amount paid by the class during periods when reimbursements, waivers or reductions occur.
K Annualized
L Amount does not include the portfolio activity of any underlying mutual funds or exchange-traded funds (ETFs).
See accompanying notes which are an integral part of the financial statements.
Notes to Financial Statements (Unaudited)
For the period ended June 30, 2022
1. Organization.
VIP Target Volatility Portfolio (the Fund) is a fund of Variable Insurance Products Fund V (the Trust) and is authorized to issue an unlimited number of shares. The Trust is registered under the Investment Company Act of 1940, as amended (the 1940 Act), as an open-end management investment company organized as a Massachusetts business trust. Shares of the Fund may only be purchased by insurance companies for the purpose of funding variable annuity or variable life insurance contracts. The Fund offers the following classes of shares: Service Class shares and Service Class 2 shares. All classes have equal rights and voting privileges, except for matters affecting a single class.
2. Investments in Fidelity Central Funds.
Funds may invest in Fidelity Central Funds, which are open-end investment companies generally available only to other investment companies and accounts managed by the investment adviser and its affiliates. The Schedule of Investments lists any Fidelity Central Funds held as an investment as of period end, but does not include the underlying holdings of each Fidelity Central Fund. An investing fund indirectly bears its proportionate share of the expenses of the underlying Fidelity Central Funds.
Based on its investment objective, each Fidelity Central Fund may invest or participate in various investment vehicles or strategies that are similar to those of the investing fund. These strategies are consistent with the investment objectives of the investing fund and may involve certain economic risks which may cause a decline in value of each of the Fidelity Central Funds and thus a decline in the value of the investing fund.
| Fidelity Central Fund | Investment Manager | Investment Objective | Investment Practices | Expense Ratio(a) |
| Fidelity Money Market Central Funds | Fidelity Management & Research Company LLC (FMR) | Each fund seeks to obtain a high level of current income consistent with the preservation of capital and liquidity. | Short-term Investments | Less than .005% |
(a) Expenses expressed as a percentage of average net assets and are as of each underlying Central Fund's most recent annual or semi-annual shareholder report.
A complete unaudited list of holdings for each Fidelity Central Fund is available upon request or at the Securities and Exchange Commission website at www.sec.gov. In addition, the financial statements of the Fidelity Central Funds which contain the significant accounting policies (including investment valuation policies) of those funds, and are not covered by the Report of Independent Registered Public Accounting Firm, are available on the Securities and Exchange Commission website or upon request.
3. Significant Accounting Policies.
The Fund is an investment company and applies the accounting and reporting guidance of the Financial Accounting Standards Board (FASB) Accounting Standards Codification Topic 946 Financial Services - Investment Companies. The financial statements have been prepared in conformity with accounting principles generally accepted in the United States of America (GAAP), which require management to make certain estimates and assumptions at the date of the financial statements. Actual results could differ from those estimates. Subsequent events, if any, through the date that the financial statements were issued have been evaluated in the preparation of the financial statements. The Fund's Schedule of Investments lists any underlying mutual funds or exchange-traded funds (ETFs) but does not include the underlying holdings of these funds. The following summarizes the significant accounting policies of the Fund:
Investment Valuation. Investments are valued as of 4:00 p.m. Eastern time on the last calendar day of the period. The Board of Trustees (the Board) has delegated the day to day responsibility for the valuation of the Fund's investments to the Fair Value Committee (the Committee) established by the the Fund's investment adviser. In accordance with valuation policies and procedures approved by the Board, the Fund attempts to obtain prices from one or more third party pricing vendors or brokers to value its investments. When current market prices, quotations or currency exchange rates are not readily available or reliable, investments will be fair valued in good faith by the Committee, in accordance with procedures adopted by the Board. Factors used in determining fair value vary by investment type and may include market or investment specific events, changes in interest rates and credit quality. The frequency with which these procedures are used cannot be predicted and they may be utilized to a significant extent. The Committee oversees the Fund's valuation policies and procedures and reports to the Board on the Committee's activities and fair value determinations. The Board monitors the appropriateness of the procedures used in valuing the Fund's investments and ratifies the fair value determinations of the Committee. The Fund categorizes the inputs to valuation techniques used to value its investments into a disclosure hierarchy consisting of three levels as shown below:
- Level 1 – unadjusted quoted prices in active markets for identical investments
- Level 2 – other significant observable inputs (including quoted prices for similar investments, interest rates, prepayment speeds, etc.)
- Level 3 – unobservable inputs (including the Fund's own assumptions based on the best information available)
Valuation techniques used to value the Fund's investments by major category are as follows. Investments in open-end mutual funds are valued at their closing net asset value (NAV) each business day and are categorized as Level 1 in the hierarchy. Debt securities, including restricted securities, are valued based on evaluated prices received from third party pricing vendors or from brokers who make markets in such securities. U.S. government and government agency obligations are valued by pricing vendors who utilize matrix pricing which considers yield or price of bonds of comparable quality, coupon, maturity and type or by broker-supplied prices. When independent prices are unavailable or unreliable, debt securities may be valued utilizing pricing methodologies which consider similar factors that would be used by third party pricing vendors. Debt securities are generally categorized as Level 2 in the hierarchy but may be Level 3 depending on the circumstances. The aggregate value of investments by input level as of June 30, 2022 is included at the end of the Fund's Schedule of Investments.
Futures contracts are valued at the settlement price established each day by the board of trade or exchange on which they are traded and are categorized as Level 1 in the hierarchy.
Investment Transactions and Income. For financial reporting purposes, the Fund's investment holdings and NAV include trades executed through the end of the last business day of the period. The NAV per share for processing shareholder transactions is calculated as of the close of business of the New York Stock Exchange (NYSE), normally 4:00 p.m. Eastern time and includes trades executed through the end of the prior business day. Gains and losses on securities sold are determined on the basis of identified cost. Income and capital gain distributions from any underlying mutual funds or exchange-traded funds (ETFs) are recorded on the ex-dividend date. Interest income is accrued as earned. Interest income includes coupon interest and amortization of premium and accretion of discount on debt securities as applicable.
Class Allocations and Expenses. Investment income, realized and unrealized capital gains and losses, common expenses of a fund, and certain fund-level expense reductions, if any, are allocated daily on a pro-rata basis to each class based on the relative net assets of each class to the total net assets of a fund. Each class differs with respect to transfer agent and distribution and service plan fees incurred, as applicable. Certain expense reductions may also differ by class, if applicable. For the reporting period, the allocated portion of income and expenses to each class as a percent of its average net assets may vary due to the timing of recording these transactions in relation to fluctuating net assets of the classes. Expenses directly attributable to a fund are charged to that fund. Expenses attributable to more than one fund are allocated among the respective funds on the basis of relative net assets or other appropriate methods. Expenses included in the accompanying financial statements reflect the expenses of that fund and do not include any expenses associated with any underlying mutual funds or exchange-traded funds. Although not included in a fund's expenses, a fund indirectly bears its proportionate share of these expenses through the net asset value of each underlying mutual fund or exchange-traded fund. Expense estimates are accrued in the period to which they relate and adjustments are made when actual amounts are known.
Income Tax Information and Distributions to Shareholders. Each year, the Fund intends to qualify as a regulated investment company under Subchapter M of the Internal Revenue Code, including distributing substantially all of its taxable income and realized gains. As a result, no provision for U.S. Federal income taxes is required. The Fund files a U.S. federal tax return, in addition to state and local tax returns as required. The Fund's federal income tax returns are subject to examination by the Internal Revenue Service (IRS) for a period of three fiscal years after they are filed. State and local tax returns may be subject to examination for an additional fiscal year depending on the jurisdiction.
Distributions are declared and recorded on the ex-dividend date. Income and capital gain distributions are declared separately for each class. Income and capital gain distributions are determined in accordance with income tax regulations, which may differ from GAAP.
Capital accounts within the financial statements are adjusted for permanent book-tax differences. These adjustments have no impact on net assets or the results of operations. Capital accounts are not adjusted for temporary book-tax differences which will reverse in a subsequent period.
Book-tax differences are primarily due to the short-term gain distributions from the Underlying Funds, capital loss carryforwards and losses deferred due to wash sales.
As of period end, the cost and unrealized appreciation (depreciation) in securities, and derivatives if applicable, for federal income tax purposes were as follows:
| Gross unrealized appreciation | $3,970,578 |
| Gross unrealized depreciation | (19,566,717) |
| Net unrealized appreciation (depreciation) | $(15,596,139) |
| Tax cost | $232,730,362 |
4. Derivative Instruments.
Risk Exposures and the Use of Derivative Instruments. Investment objectives allow a fund to enter into various types of derivative contracts, including futures contracts. Derivatives are investments whose value is primarily derived from underlying assets, indices or reference rates and may be transacted on an exchange or over-the-counter (OTC). Derivatives may involve a future commitment to buy or sell a specified asset based on specified terms, to exchange future cash flows at periodic intervals based on a notional principal amount, or for one party to make one or more payments upon the occurrence of specified events in exchange for periodic payments from the other party.
Derivatives were used to increase returns and to manage exposure to certain risks as defined below. The success of any strategy involving derivatives depends on analysis of numerous economic factors, and if the strategies for investment do not work as intended, the objectives may not be achieved.
Derivatives were used to increase or decrease exposure to the following risk(s):
| Equity Risk | Equity risk relates to the fluctuations in the value of financial instruments as a result of changes in market prices (other than those arising from interest rate risk or foreign exchange risk), whether caused by factors specific to an individual investment, its issuer, or all factors affecting all instruments traded in a market or market segment. |
Funds are also exposed to additional risks from investing in derivatives, such as liquidity risk and counterparty credit risk. Liquidity risk is the risk that a fund will be unable to close out the derivative in the open market in a timely manner. Counterparty credit risk is the risk that the counterparty will not be able to fulfill its obligation to a fund. Exchange-traded contracts are not covered by the ISDA Master Agreement; however counterparty credit risk related to these contracts may be mitigated by the protection provided by the exchange on which they trade.
Investing in derivatives may involve greater risks than investing in the underlying assets directly and, to varying degrees, may involve risk of loss in excess of any initial investment and collateral received and amounts recognized in the Statement of Assets and Liabilities. In addition, there may be the risk that the change in value of the derivative contract does not correspond to the change in value of the underlying instrument.
Futures Contracts. A futures contract is an agreement between two parties to buy or sell a specified underlying instrument for a fixed price at a specified future date. Futures contracts were used to manage exposure to the stock market.
Upon entering into a futures contract, a fund is required to deposit either cash or securities (initial margin) with a clearing broker in an amount equal to a certain percentage of the face value of the contract. Futures contracts are marked-to-market daily and subsequent daily payments are made or received by a fund depending on the daily fluctuations in the value of the futures contracts and are recorded as unrealized appreciation or (depreciation). This receivable and/or payable, if any, is included in daily variation margin on futures contracts in the Statement of Assets and Liabilities. Realized gain or (loss) is recorded upon the expiration or closing of a futures contract. The net realized gain (loss) and change in net unrealized appreciation (depreciation) on futures contracts during the period is presented in the Statement of Operations.
Any open futures contracts at period end are presented in the Schedule of Investments under the caption "Futures Contracts". The notional amount at value reflects each contract's exposure to the underlying instrument or index at period end, and is representative of volume of activity during the period unless an average notional amount is presented. Any securities deposited to meet initial margin requirements are identified in the Schedule of Investments. Any cash deposited to meet initial margin requirements is presented as segregated cash with brokers for derivative instruments in the Statement of Assets and Liabilities.
5. Purchases and Sales of Investments.
Purchases and sales of securities, other than short-term securities and in-kind transactions, as applicable, are noted in the table below.
| Purchases ($) | Sales ($) | |
| VIP Target Volatility Portfolio | 64,097,454 | 75,155,606 |
6. Fees and Other Transactions with Affiliates.
Management Fee. Fidelity Management & Research Company LLC (the investment adviser) provides the Fund with investment management related services. For these services the Fund pays a monthly management fee to the investment adviser. The management fee is computed at an annual rate of .20% of the Fund's average net assets. During January 2022 the Board approved a change in the management fee rate from .30% to .20% effective June 1, 2022. For the reporting period, the annualized management fee rate was .28% of the Fund's average net assets. Under the management contract, the investadviser pays all other fund-level operating expenses, except the compensation of the independent Trustees and certain other expenses such as interest expense.
During the period, the investment adviser waived a portion of its management fee as described in the Expense Reductions note.
Distribution and Service Plan Fees. In accordance with Rule 12b-1 of the 1940 Act, the Fund has adopted separate 12b-1 Plans for each Service Class of shares. Each Service Class pays Fidelity Distributors Company LLC (FDC), an affiliate of the investment adviser, a service fee. For the period, the service fee is based on an annual rate of .10% of Service Class' average net assets and .25% of Service Class 2's average net assets.
For the period, total fees, all of which were re-allowed to insurance companies for the distribution of shares and providing shareholder support services, were as follows:
| Service Class | $670 |
| Service Class 2 | 298,181 |
| $298,851 |
Transfer Agent Fees. Fidelity Investments Institutional Operations Company LLC (FIIOC), an affiliate of the investment adviser, is the Fund's transfer, dividend disbursing, and shareholder servicing agent. FIIOC receives an asset-based fee with respect to each class. Each class pays a fee for transfer agent services, typesetting and printing and mailing of shareholder reports, excluding mailing of proxy statements, equal to an annual rate of .14% of class-level average net assets invested in underlying mutual funds or exchange-traded funds (ETFs) that are not managed by the investment adviser or its affiliates. For the period, transfer agent fees for each class were as follows:
| Amount | % of Class-Level Average Net Assets(a) | |
| Service Class | $11 | –(b) |
| Service Class 2 | 1,848 | –(b) |
| $1,859 |
(a) Annualized
(b) Amount represents less than .005%.
Interfund Trades. Funds may purchase from or sell securities to other Fidelity Funds under procedures adopted by the Board. The procedures have been designed to ensure these interfund trades are executed in accordance with Rule 17a-7 of the 1940 Act. Any interfund trades are included within the respective purchases and sales amounts shown in the Purchases and Sales of Investments note. During the period, there were no interfund trades.
Prior Fiscal Year Reallocation of Underlying Fund Investments. During the prior period, the investment adviser reallocated investments of the Fund. This involved taxable redemptions of each Fund's interest in Fidelity Stock Selector All Cap Fund for investments, as shown in the table below.
| Value of investments redeemed from Fidelity Stock Selector All Cap Fund | Shares of Fidelity Stock Selector All Cap Fund sold | Net realized gain on redemptions of Fidelity Stock Selector All Cap Fund | |
| VIP Target Volatility Portfolio | $83,635,576 | 1,215,280 | $31,576,922 |
In addition, the Fund exchanged investments for shares of VIP Stock Selector All Cap Fund, as shown in the table below. The fund did not recognize any gains or losses for book, or federal income tax, purposes.
| Value of investments delivered to VIP Stock Selector All Cap Fund | Shares of VIP Stock Selector All Cap received | |
| VIP Target Volatility Portfolio | $83,635,576 | 8,363,558 |
7. Committed Line of Credit.
Certain Funds participate with other funds managed by the investment adviser or an affiliate in a $4.25 billion credit facility (the "line of credit") to be utilized for temporary or emergency purposes to fund shareholder redemptions or for other short-term liquidity purposes. The commitment fees on the pro-rata portion of the line of credit are borne by the investment adviser. During the period, there were no borrowings on this line of credit.
8. Security Lending.
Funds lend portfolio securities from time to time in order to earn additional income. Lending agents are used, including National Financial Services (NFS), an affiliate of the investment adviser. Pursuant to a securities lending agreement, NFS will receive a fee, which is capped at 9.9% of a fund's daily lending revenue, for its services as lending agent. A fund may lend securities to certain qualified borrowers, including NFS. On the settlement date of the loan, a fund receives collateral (in the form of U.S. Treasury obligations, letters of credit and/or cash) against the loaned securities and maintains collateral in an amount not less than 100% of the market value of the loaned securities during the period of the loan. The market value of the loaned securities is determined at the close of business of a fund and any additional required collateral is delivered to a fund on the next business day. A fund or borrower may terminate the loan at any time, and if the borrower defaults on its obligation to return the securities loaned because of insolvency or other reasons, a fund may apply collateral received from the borrower against the obligation. A fund may experience delays and costs in recovering the securities loaned. Any cash collateral received is invested in the Fidelity Securities Lending Cash Central Fund. Any loaned securities are identified as such in the Schedule of Investments, and the value of loaned securities and cash collateral at period end, as applicable, are presented in the Statement of Assets and Liabilities. Security lending income represents the income earned on investing cash collateral, less rebates paid to borrowers and any lending agent fees associated with the loan, plus any premium payments received for lending certain types of securities. Security lending income is presented in the Statement of Operations as a component of income from Fidelity Central Funds. Affiliated security lending activity, if any, was as follows:
| Total Security Lending Fees Paid to NFS | Security Lending Income From Securities Loaned to NFS | Value of Securities Loaned to NFS at Period End | |
| VIP Target Volatility Portfolio | $17 | $– | $– |
9. Expense Reductions.
The investment adviser contractually agreed to waive the Fund's management fee in an amount equal to .05% of the Fund's average net assets until April 30, 2024. During the period, the Fund's management fee was reduced by $59,972.
In addition, FMR has contractually agreed to reimburse .10% of class-level expenses for Service Class and Service Class 2. During the period, this reimbursement reduced the Fund's Service Class and Service Class 2's expenses by the following amounts:
| Reimbursement | |
| Service Class | $670 |
| Service Class 2 | 119,272 |
Through arrangements with the Fund's custodian, credits realized as a result of certain uninvested cash balances were used to reduce the Fund's expenses. During the period, custodian credits reduced the Fund's expenses by $1.
10. Distributions to Shareholders.
Distributions to shareholders of each class were as follows:
| Six months ended June 30, 2022 | Year ended December 31, 2021 |
|
| VIP Target Volatility Portfolio | ||
| Distributions to shareholders | ||
| Service Class | $27,124 | $218,441 |
| Service Class 2 | 4,829,369 | 34,122,466 |
| Total | $4,856,493 | $34,340,907 |
11. Share Transactions.
Transactions for each class of shares were as follows and may contain in-kind transactions:
| Shares | Shares | Dollars | Dollars | |
| Six months ended June 30, 2022 | Year ended December 31, 2021 | Six months ended June 30, 2022 | Year ended December 31, 2021 | |
| VIP Target Volatility Portfolio | ||||
| Service Class | ||||
| Reinvestment of distributions | 15 | 97 | $175 | $1,233 |
| Shares redeemed | (5) | (9) | (55) | (123) |
| Net increase (decrease) | 10 | 88 | $120 | $1,110 |
| Service Class 2 | ||||
| Shares sold | 629,789 | 764,537 | $7,354,273 | $10,603,809 |
| Reinvestment of distributions | 409,963 | 2,682,335 | 4,829,369 | 34,122,466 |
| Shares redeemed | (1,577,138) | (3,241,950) | (18,042,326) | (44,917,882) |
| Net increase (decrease) | (537,386) | 204,922 | $(5,858,684) | $(191,607) |
12. Other.
A fund's organizational documents provide former and current trustees and officers with a limited indemnification against liabilities arising in connection with the performance of their duties to the fund. In the normal course of business, a fund may also enter into contracts that provide general indemnifications. A fund's maximum exposure under these arrangements is unknown as this would be dependent on future claims that may be made against a fund. The risk of material loss from such claims is considered remote.
At the end of the period, the investment adviser or its affiliates were owners of record of more than 10% of the outstanding shares as follows:
| Fund | Number of Unaffiliated Shareholders | Unaffiliated Shareholders % |
| VIP: Target Volatility Portfolio | 1 | 94% |
13. Coronavirus (COVID-19) Pandemic.
An outbreak of COVID-19 first detected in China during December 2019 has since spread globally and was declared a pandemic by the World Health Organization during March 2020. Developments that disrupt global economies and financial markets, such as the COVID-19 pandemic, may magnify factors that affect the Fund's performance.
Shareholder Expense Example
As a shareholder, you incur two types of costs: (1) transaction costs, which may include sales charges (loads) on purchase payments or redemption proceeds, as applicable and (2) ongoing costs, which generally include management fees, distribution and/or service (12b-1) fees and other Fund expenses. This Example is intended to help you understand your ongoing costs (in dollars) of investing in a fund and to compare these costs with the ongoing costs of investing in other mutual funds.
The Example is based on an investment of $1,000 invested at the beginning of the period and held for the entire period (January 1, 2022 to June 30, 2022).
Actual Expenses
The first line of the accompanying table provides information about actual account values and actual expenses. You may use the information in this line, together with the amount you invested, to estimate the expenses that you paid over the period. Simply divide your account value by $1,000.00 (for example, an $8,600 account value divided by $1,000.00 = 8.6), then multiply the result by the number in the first line for a class/Fund under the heading entitled "Expenses Paid During Period" to estimate the expenses you paid on your account during this period. If any fund is a shareholder of any underlying mutual funds or exchange-traded funds (ETFs) (the Underlying Funds), such fund indirectly bears its proportional share of the expenses of the Underlying Funds in addition to the direct expenses incurred presented in the table. These fees and expenses are not included in the annualized expense ratio used to calculate the expense estimate in the table below. The estimate of expenses does not include any fees or other expenses of any variable annuity or variable life insurance product. If they were, the estimate of expenses you paid during the period would be higher, and your ending account value would be lower.
Hypothetical Example for Comparison Purposes
The second line of the accompanying table provides information about hypothetical account values and hypothetical expenses based on the actual expense ratio and an assumed rate of return of 5% per year before expenses, which is not the actual return. The hypothetical account values and expenses may not be used to estimate the actual ending account balance or expenses you paid for the period. You may use this information to compare the ongoing costs of investing in the Fund and other funds. To do so, compare this 5% hypothetical example with the 5% hypothetical examples that appear in the shareholder reports of the other funds. If any fund is a shareholder of any Underlying Funds, such fund indirectly bears its proportional share of the expenses of the Underlying Funds in addition to the direct expenses as presented in the table. These fees and expenses are not included in the annualized expense ratio used to calculate the expense estimate in the table below. The estimate of expenses does not include any fees or other expenses of any variable annuity or variable life insurance product. If they were, the estimate of expenses you paid during the period would be higher, and your ending account value would be lower.
Please note that the expenses shown in the table are meant to highlight your ongoing costs only and do not reflect any transaction costs. Therefore, the second line of the table is useful in comparing ongoing costs only, and will not help you determine the relative total costs of owning different funds. In addition, if these transactional costs were included, your costs would have been higher.
| Annualized Expense Ratio-A | Beginning Account Value January 1, 2022 | Ending Account Value June 30, 2022 | Expenses Paid During Period-B January 1, 2022 to June 30, 2022 |
|
| VIP Target Volatility Portfolio | ||||
| Service Class | .24% | |||
| Actual | $1,000.00 | $853.50 | $1.10** | |
| Hypothetical-C | $1,000.00 | $1,023.60 | $1.20** | |
| Service Class 2 | .39% | |||
| Actual | $1,000.00 | $852.90 | $1.79** | |
| Hypothetical-C | $1,000.00 | $1,022.86 | $1.96** |
A Annualized expense ratio reflects expenses net of applicable fee waivers.
B Expenses are equal to the annualized expense ratio, multiplied by the average account value over the period, multiplied by 181/ 365 (to reflect the one-half year period). The fees and expenses of any Underlying Funds are not included in each annualized expense ratio.
C 5% return per year before expenses
** If fees and changes to the expense contract and/ or expense cap, effective June 1, 2022, had been in effect during the entire current period, the restated annualized expense ratio and the expenses paid in the actual and hypothetical examples above would be as shown in table below:
| Annualized Expense Ratio-(a)
| Expenses Paid |
|
| VIP Target Volatility Portfolio | ||
| Service Class | .16% | |
| Actual | $.74 | |
| Hypothetical-(b) | $.80 | |
| Service Class 2 | .31% | |
| Actual | $1.42 | |
| Hypothetical-(b) | $1.56 |
(a) Annualized expense ratio reflects expenses net of applicable fee waivers.
(b) 5% return per year before expenses
Board Approval of Investment Advisory Contracts and Management Fees
VIP Target Volatility Portfolio
At its May 2022 meeting the Board of Trustees, including the Independent Trustees (together, the Board), voted to approve an amended and restated management contract (the Amended Contract) for the fund to decrease the management fees paid to Fidelity Management & Research Company LLC (FMR), the fund's investment adviser, by 10 basis points, effective June 1, 2022. The Board, assisted by the advice of fund counsel and Independent Trustees' counsel, considered a broad range of information. Nature, Extent, and Quality of Services Provided. The Board previously received and considered materials relating to the nature, extent and quality of services provided by FMR to the funds, including the resources dedicated to investment management and support services, shareholder and administrative services, the benefits to shareholders of investment in a large fund family, and the investment performance of the funds in connection with the annual renewal of the funds' current management contracts. At its September 2021 meeting, the Board concluded that the nature, extent and quality of the services provided to the funds under the existing management contract should continue to benefit each fund's shareholders. In connection with its approval of the Amended Contract at its May 2022 meeting, the Board noted that such approval would not change the fund's portfolio managers, the investment processes, the level or nature of services provided, the resources and personnel allocated or trading and compliance operations. The Board concluded that the nature, extent, and quality of services to be provided to the fund under the Amended Contract will continue to benefit the fund shareholders. Competitiveness of Management Fee and Total Expense Ratio. The Board considered that it received and reviewed information regarding the fund's management fee rate and total expense ratio compared to "mapped groups" of competitive funds and classes at the current management fee and expense levels in connection with the annual renewal of the management contract. Based on its review, the Board concluded at its September 2021 meeting that the fund's current management fee and total expenses are fair and reasonable in light of the services that the fund receives and the other factors considered. In its review of the proposed management fee rate under the Amended Contract, the Board considered that the proposed fee rate is lower by 10 basis points than the current management fee rate. The Board also considered that FMR will retain its obligation to pay fund-level operating expenses, with certain limited exceptions, under the management contract and that FMR also will continue to waive 0.05% of its management fee until April 30, 2024. Based on its review, the Board concluded that the management fee and the total expense ratio of each class of the fund continue to be fair and reasonable in light of the services that each fund receives and the other factors considered. Costs of the Services and Profitability. The Board considered that it previously reviewed information regarding the revenues earned, the expenses incurred by FMR in providing services to the fund and the level of FMR's profitability. At its September 2021 meeting, the Board concluded that it was satisfied that the profitability of FMR in connection with the operation of the fund was not excessive. Because the Board was approving an arrangement under which the management fees were being reduced, the Board did not consider FMR's costs of services, revenues, or profitability to be significant factors in its decision to approve the Amended Contract. Economies of Scale. The Board considered that it previously received and reviewed information regarding whether there have been economies of scale in respect of the management of the Fidelity funds, whether the Fidelity funds (including the fund) have appropriately benefited from any such economies of scale, and whether there is a potential realization of any further economies of scale and that it concluded, at its September 2021 meeting, that economies of scale, if any, are being appropriately shared between fund shareholders and Fidelity. In connection with the approval of the fund's Amended Contract, the Board did not consider economies of scale because the proposed fee arrangement lowers the fund's management fee and FMR will continue to contractually limit expenses. The Board will continue to review economies of scale in connection with future renewals of the Amended Contract.Based on its evaluation of all of the conclusions noted above, and after considering all factors it believed relevant, the Board ultimately concluded that the advisory fee structures are fair and reasonable, and that the fund's Amended Contract should be ratified and approved.Liquidity Risk Management Program
The Securities and Exchange Commission adopted Rule 22e-4 under the Investment Company Act of 1940 (the Liquidity Rule) to promote effective liquidity risk management throughout the open-end investment company industry, thereby reducing the risk that funds will be unable to meet their redemption obligations and mitigating dilution of the interests of fund shareholders.
The Fund has adopted and implemented a liquidity risk management program pursuant to the Liquidity Rule (the Program) effective December 1, 2018. The Program is reasonably designed to assess and manage the Fund’s liquidity risk and to comply with the requirements of the Liquidity Rule. The Fund’s Board of Trustees (the Board) has designated the Fund’s investment adviser as administrator of the Program. The Fidelity advisers have established a Liquidity Risk Management Committee (the LRM Committee) to manage the Program for each of the Fidelity Funds. The LRM Committee monitors the adequacy and effectiveness of implementation of the Program and on a periodic basis assesses each Fund’s liquidity risk based on a variety of factors including (1) the Fund’s investment strategy, (2) portfolio liquidity and cash flow projections during normal and reasonably foreseeable stressed conditions, (3) shareholder redemptions, (4) borrowings and other funding sources and (5) in the case of exchange-traded funds, certain additional factors including the effect of the Fund’s prices and spreads, market participants, and basket compositions on the overall liquidity of the Fund’s portfolio, as applicable.
In accordance with the Program, each of the Fund’s portfolio investments is classified into one of four liquidity categories described below based on a determination of a reasonable expectation for how long it would take to convert the investment to cash (or sell or dispose of the investment) without significantly changing its market value.
- Highly liquid investments – cash or convertible to cash within three business days or less
- Moderately liquid investments – convertible to cash in three to seven calendar days
- Less liquid investments – can be sold or disposed of, but not settled, within seven calendar days
- Illiquid investments – cannot be sold or disposed of within seven calendar days
Liquidity classification determinations take into account a variety of factors including various market, trading and investment-specific considerations, as well as market depth, and generally utilize analysis from a third-party liquidity metrics service.
The Liquidity Rule places a 15% limit on a fund’s illiquid investments and requires funds that do not primarily hold assets that are highly liquid investments to determine and maintain a minimum percentage of the fund’s net assets to be invested in highly liquid investments (highly liquid investment minimum or HLIM). The Program includes provisions reasonably designed to comply with the 15% limit on illiquid investments and for determining, periodically reviewing and complying with the HLIM requirement as applicable.
At a recent meeting of the Fund’s Board of Trustees, the LRM Committee provided a written report to the Board pertaining to the operation, adequacy, and effectiveness of implementation of the Program for the annual period from December 1, 2020 through November 30, 2021. The report concluded that the Program has been implemented and is operating effectively and is reasonably designed to assess and manage the Fund’s liquidity risk.
![]()
VIPTV-SANN-0822
1.955018.109
Item 2.
Code of Ethics
Not applicable.
Item 3.
Audit Committee Financial Expert
Not applicable.
Item 4.
Principal Accountant Fees and Services
Not applicable.
Item 5.
Audit Committee of Listed Registrants
Not applicable.
Item 6.
Investments
(a)
Not applicable.
(b)
Not applicable
Item 7.
Disclosure of Proxy Voting Policies and Procedures for Closed-End Management Investment Companies
Not applicable.
Item 8.
Portfolio Managers of Closed-End Management Investment Companies
Not applicable.
Item 9.
Purchase of Equity Securities by Closed-End Management Investment Company and Affiliated Purchasers
Not applicable.
Item 10.
Submission of Matters to a Vote of Security Holders
There were no material changes to the procedures by which shareholders may recommend nominees to the Variable Insurance Products Fund V’s Board of Trustees.
Item 11.
Controls and Procedures
(a)(i) The President and Treasurer and the Chief Financial Officer have concluded that the Variable Insurance Products Fund V’s (the “Trust”) disclosure controls and procedures (as defined in Rule 30a-3(c) under the Investment Company Act) provide
reasonable assurances that material information relating to the Trust is made known to them by the appropriate persons, based on their evaluation of these controls and procedures as of a date within 90 days of the filing date of this report.
(a)(ii) There was no change in the Trust’s internal control over financial reporting (as defined in Rule 30a-3(d) under the Investment Company Act) that occurred during the period covered by this report that has materially affected, or is reasonably likely to materially affect, the Trust’s internal control over financial reporting.
Item 12.
Disclosure of Securities Lending Activities for Closed-End Management
Investment Companies
Not applicable.
Item 13.
Exhibits
| (a) | (1) | Not applicable. |
| (a) | (2) | |
| (a) | (3) | Not applicable. |
| (b) | |
SIGNATURES
Pursuant to the requirements of the Securities Exchange Act of 1934 and the Investment Company Act of 1940, the registrant has duly caused this report to be signed on its behalf by the undersigned, thereunto duly authorized.
Variable Insurance Products Fund V
| By: | /s/Laura M. Del Prato |
| | Laura M. Del Prato |
| | President and Treasurer |
| | |
| Date: | August 19, 2022 |
Pursuant to the requirements of the Securities Exchange Act of 1934 and the Investment Company Act of 1940, this report has been signed below by the following persons on behalf of the registrant and in the capacities and on the dates indicated.
| By: | /s/Laura M. Del Prato |
| | Laura M. Del Prato |
| | President and Treasurer |
| | |
| Date: | August 19, 2022 |
| By: | /s/John J. Burke III |
| | John J. Burke III |
| | Chief Financial Officer |
| | |
| Date: | August 19, 2022 |