UNITED STATES | ||
SECURITIES AND EXCHANGE COMMISSION | ||
WASHINGTON, D.C. 20549 | ||
FORM 10-K | ||
(Mark One) | |
ý | ANNUAL REPORT PURSUANT TO SECTION 13 OR 15(d) OF THE SECURITIES EXCHANGE ACT OF 1934 |
FOR THE FISCAL YEAR ENDED DECEMBER 31, 2016. | |
OR | |
o | TRANSITION REPORT PURSUANT TO SECTION 13 OR 15(d) OF THE SECURITIES EXCHANGE ACT OF 1934 |
FOR THE TRANSITION PERIOD FROM TO | |
COMMISSION FILE NUMBER 1-9750 | |
___________________________________________________________________

(Exact name of registrant as specified in its charter)
__________________________________________________________________
Delaware | 38-2478409 | ||||||
(State or other jurisdiction of incorporation or organization) | (I.R.S. Employer Identification No.) | ||||||
1334 York Avenue | 10021 | ||||||
New York, New York | (Zip Code) | ||||||
(Address of principal executive offices) | |||||||
(212) 606-7000 | |||||||
(Registrant’s telephone number, including area code) | |||||||
Securities registered pursuant to Section 12(b) of the Act: | |||||||
Title of each class | Name of each exchange on which registered | ||||||
Common Stock, | New York Stock Exchange | ||||||
$0.01 Par Value | |||||||
Securities registered pursuant to Section 12(g) of the Act: None | |||||||
Indicate by check mark if the registrant is a well-known seasoned issuer, as defined in Rule 405 of the Securities Act. Yes þ No o
Indicate by check mark if the registrant is not required to file reports pursuant to Section 13 or Section 15(d) of the Act. Yes o No þ
Indicate by check mark whether the registrant (1) has filed all reports required to be filed by Section 13 or 15(d) of the Securities Exchange Act of 1934 during the preceding 12 months (or for such shorter periods that the registrant was required to file such reports), and (2) has been subject to such filing requirements for the past 90 days. Yes þ No o
Indicate by check mark whether the registrant has submitted electronically and posted on its corporate Web site, if any, every Interactive Data File required to be submitted and posted pursuant to Rule 405 of Regulation S-T (§232.405 of this chapter) during the preceding 12 months (or for such shorter period that the registrant was required to submit and post such files). Yes þ No o
Indicate by check mark if disclosure of delinquent filers pursuant to Item 405 of Regulation S-K (§232.405 of this chapter) is not contained herein, and will not be contained, to the best of registrant’s knowledge, in definitive proxy or information statements incorporated by reference in Part III of this Form 10-K or any amendment to this Form 10-K. o
Indicate by check mark whether the registrant is a large accelerated filer, an accelerated filer, a non-accelerated filer, or a smaller reporting company. See the definitions of "large accelerated filer," "accelerated filer," and "smaller reporting company" in Rule 12b-2 of the Exchange Act. Large accelerated filer þ Accelerated filer o Non-accelerated filer o (Do not check if a smaller reporting company) Smaller reporting company o
Indicate by check mark whether the registrant is a shell company (as defined in Rule 12b-2 of the Act) Yes o No þ
As of June 30, 2016, the aggregate market value of the 47,997,224 shares of Common Stock held by non-affiliates of the registrant was $1,315,123,938 based upon the closing price ($27.40) on the New York Stock Exchange composite tape on such date for the Common Stock.
As of February 23, 2017, there were outstanding 52,976,046 shares of Common Stock.
DOCUMENTS INCORPORATED BY REFERENCE
Portions of the registrant’s proxy statement for the 2017 annual meeting of shareholders are incorporated by reference into Part III of this Form 10-K.
TABLE OF CONTENTS
Page | |||
2
PART I
ITEM 1: DESCRIPTION OF BUSINESS
Company Overview
Sotheby's is a global art business, offering our clients opportunities to connect with and transact in the world's most extraordinary objects. Auctioneers since 1744, today we offer a variety of innovative art-related services, including the brokerage of private art sales, private jewelry sales through Sotheby's Diamonds, exclusive private selling exhibitions at our S|2 galleries, art-related financing, and art advisory services, as well as retail wine locations in New York and Hong Kong.
As successor to a business that began in 1744, Sotheby's is the oldest company listed on the New York Stock Exchange ("NYSE") (symbol: BID) and is the only publicly traded investment opportunity in the art market. Sotheby's is incorporated in Delaware.
Business Organization
Our operations are organized under two segments: the Agency segment and the Finance segment, which does business as and is referred to in this report as Sotheby’s Financial Services (“SFS”). The Agency segment earns commissions by matching buyers and sellers of authenticated fine art, decorative art, jewelry, wine and collectibles (collectively, "art" or "works of art" or "artwork" or "property") through the auction or private sale process. To a much lesser extent, Agency segment activities also include the sale of artworks that are principally acquired as a consequence of the auction process, as well as the activities of RM Sotheby's, an equity investee that operates as an auction house for investment-quality automobiles (see Note 5 of Notes to Consolidated Financial Statements). SFS earns interest income through art-related financing activities by making loans that are secured by works of art. Art Agency, Partners (“AAP”), through which we offer art advisory services, provides clients strategic guidance on collection identity and development, acquisitions, and short and long-term planning. Our advisory services are classified within All Other for segment reporting purposes, along with our retail wine business and brand licensing activities. See Note 2 of Notes to Consolidated Financial Statements for information regarding our segment reporting.
Agency Segment
Through our Agency segment, we accept property on consignment, stimulate buyer interest through professional marketing techniques, and match sellers (also known as consignors) to buyers through the auction or private sale process. Prior to offering a work of art for sale, we perform due diligence activities to authenticate and determine the ownership history of the property being sold. See “Converting Consignment Opportunities” below for further information regarding the consignment process.
Following an auction or private sale, we invoice the buyer for the purchase price of the property (including any commission owed by the buyer), collect payment from the buyer, and remit to the consignor the net sale proceeds after deducting our commissions, expenses and applicable taxes and royalties. As compensation for our auction services, we earn a commission from both the buyer ("buyer's premium") and, to a lesser extent, the seller ("seller's commission") (collectively, "auction commission revenue"), both of which are calculated as a percentage of the hammer price of the property sold at auction. In 2016, 2015, and 2014, auction commission revenues accounted for approximately 75%, 75%, and 81%, respectively, of our consolidated revenues. Private sale commission revenues are earned through the direct brokering of purchases and sales of art. Private sales are initiated either by a client wishing to sell property with Sotheby's acting as its exclusive agent in the transaction, or by a prospective buyer who is interested in purchasing a certain work of art privately. In 2016, 2015, and 2014, private sale commission revenues accounted for approximately 7%, 6%, and 6%, respectively, of our consolidated revenues.
Under the standard terms and conditions of our auction and private sales, we are not obligated to pay the consignor for property that has not been paid for by the buyer. If a buyer defaults on payment, the sale may be cancelled, and the property will be returned to the consignor. Alternatively, the consignor may reoffer the property at one of our future auctions or negotiate a private sale with us acting as their agent. In certain instances and subject to management approval under our internal corporate governance policy, we may pay the net sale proceeds to the consignor before payment is collected from the buyer and/or we may allow the buyer to take possession of the property before making payment. In situations when the buyer takes possession of the property before making payment, we are liable to the seller for the net sale proceeds whether or not the buyer makes payment.
3
From time-to-time in the ordinary course of our business, we will guarantee to a consignor a minimum sale price in connection with the sale of property at auction (an "auction guarantee"). If the property offered under the auction guarantee sells above the minimum guaranteed price, we are generally entitled to a share of the excess proceeds (the "overage"). In the event that the property sells for less than the minimum guaranteed price, we must perform under the auction guarantee by funding the difference between the sale price at auction and the amount of the auction guarantee (the "shortfall"). If any item of property offered under the auction guarantee does not sell, the amount of the auction guarantee must be paid, but we take ownership of the unsold property and may recover the amount paid through its future sale.
We may reduce our financial exposure under auction guarantees through contractual risk and reward sharing arrangements. Such auction guarantee risk and reward sharing arrangements include irrevocable bids and partner sharing arrangements. In exchange for accepting a share of the financial exposure under the auction guarantee, our counterparties to these arrangements are generally entitled to receive a share of our auction commission if the property sells and/or a share of the overage, if any.
Auction guarantees are an important financial incentive which may significantly influence an art collector's decision on whether and how to sell their property. As such, auction guarantees provide us the opportunity to secure highly sought-after consignments, often well in advance of a specific selling season. When we evaluate the performance of our portfolio of auction guarantees, we take into consideration the overall revenues earned on the transaction, which includes our auction commission revenues, as well as any overage or shortfall.
See "Auction Commission Margin" under Part II, Item 7, "Management's Discussion and Analysis of Financial Condition and Results of Operations," for a complete discussion of the factors impacting auction commission margin, as well as a discussion of the overall financial performance of the Agency segment for the years ended December 31, 2016, 2015 and 2014. See Note 4 of Notes to Consolidated Financial Statements for additional information about auction and private sale receivables. See Note 19 of Notes to Consolidated Financial Statements for additional information about auction guarantees.
Sotheby's Financial Services
SFS is an art financing company that is uniquely positioned as a niche lender with the ability to tailor attractive financing packages for clients who wish to obtain immediate access to liquidity from their art assets. SFS deploys a combination of art expertise, skill in international law and finance, and access to capital to provide art collectors and dealers with financing secured by their works of art, allowing them to unlock the value in their collections. A considerable number of traditional lending sources offer conventional loans at a lower cost to borrowers than the average cost of loans offered by SFS and many traditional lenders offer borrowers a variety of integrated financial services such as wealth management. Few lenders, however, are willing to accept works of art as sole collateral for loans, as they do not have access to market information allowing them to effectively appraise collateral during the life of a loan, nor do they have the wherewithal to efficiently monetize loan collateral. Through a combination of our art expertise and skills in international law and finance, we have the ability to tailor attractive financing packages for clients who wish to obtain immediate access to liquidity from their art assets.
SFS makes term loans secured by artworks that are not presently intended for sale, allowing us to establish or enhance mutually beneficial relationships with art collectors. Term loans may also generate future auction or private sale consignments and/or purchases. In certain situations, term loans are made to refinance receivables generated by the auction and private sale purchases of our clients. Term loans normally have initial maturities of up to two years and typically carry a variable market rate of interest. To a much lesser extent, SFS also makes consignor advances secured by artworks that are contractually committed, in the near term, to be offered for sale through our Agency segment. Consignor advances allow sellers to receive funds upon consignment for an auction or private sale that will occur up to one year in the future and normally have short-term maturities.
Prior to 2014, the lending activities of SFS were funded primarily by the operating cash flows of our Agency segment, with the ability to supplement those cash flows with revolving credit facility borrowings. In January 2014, in order to reduce our cost of capital and enhance returns, we established a separate capital structure for SFS through which client loans are predominantly funded with borrowings drawn from a dedicated revolving credit facility. To a lesser extent, cash balances are also used to fund a portion of the loans made by SFS, as appropriate. The establishment of a dedicated revolving credit facility for SFS has allowed us to finance approximately 84% of the loan portfolio with debt as of December 31, 2016 and has contributed to a 42% increase in the client loan portfolio when compared to December 31, 2013 and a higher level of profitability for the segment.
4
The repayment of secured loans can be adversely impacted by a decline in the art market in general or in the value of the collateral, which is concentrated within certain collecting categories. In addition, in situations when there are competing claims on the collateral and/or when a borrower becomes subject to bankruptcy or insolvency laws, our ability to realize on our collateral may be limited or delayed.
We aim to mitigate the risk associated with potential devaluation in our collateral by targeting a 50% loan-to-value ("LTV") ratio (i.e., the principal loan amount divided by the low auction estimate of the collateral). However, loans may also be made with LTV ratios between 51% and 60%, and in rare circumstances, loans may be made at an initial LTV ratio higher than 60%. The dedicated revolving credit facility for SFS permits borrowings on the portion of any loan that does not exceed a 60% LTV ratio.
The LTV ratio of certain loans may increase above our 50% target due to a decrease in the low auction estimate of the collateral. The revaluation of term loan collateral is performed by our specialists on an annual basis or more frequently if there is a material change in the circumstances related to the loan, the value of the collateral, the disposal plans for the collateral, or if an event of default occurs.
See "Sotheby's Financial Services" under Part II, Item 7, "Management's Discussion and Analysis of Financial Condition and Results of Operations," for information on the financial performance of SFS for the years ended December 31, 2016, 2015 and 2014. See Note 4 of Notes to Consolidated Financial Statements for information about the SFS loan portfolio. See Note 9 of Notes to Consolidated Financial Statements for information about the SFS revolving credit facility.
The Art Market
The global art market is influenced over time by the overall strength and stability of the global economy, the financial markets of various countries, geopolitical conditions, and world events, all of which may impact the willingness of potential buyers and sellers to purchase and sell art. In addition, the amount and quality of art consigned for sale is influenced by other factors not within our control, and many consignments become available only as a result of the death or financial or marital difficulties of the owner (see "Converting Consignment Opportunities" below). These factors cause the supply and demand for works of art to be unpredictable and may lead to significant variability in our revenues from period to period.
Seasonality
The global art auction market has two principal selling seasons, which generally occur in the second and fourth quarters of the year. In the aggregate, second and fourth quarter Net Auction Sales1 represented 82%, 78%, and 79% of our total annual Net Auction Sales in 2016, 2015, and 2014, respectively, with auction commission revenues comprising approximately 75%, 75%, and 81% of our total revenues in each of these years. Accordingly, our financial results are seasonal, with peak revenues and operating income generally occurring in the second and fourth quarters. Consequently, first and third quarter results have historically reflected lower revenues when compared to the second and fourth quarters and, typically, a net loss due to the fixed nature of many of our operating expenses.
In quarterly reporting periods, the comparison of our results between reporting periods can be significantly influenced by a number of factors, such as changes in the timing of when certain auctions occur, the level of non-recurring single-owner auction sale events, the level and timing of individually negotiated private sale transactions, and changes in certain accounting estimates that rely upon forecasted results such as variable incentive and share-based compensation expense and our estimated annual effective income tax rate. Accordingly, when evaluating our performance, we believe that investors should also consider results for six and twelve month periods, which better reflect the business cycle of the global art auction market. See Note 29 of Notes to Consolidated Financial Statements for our quarterly results for the years ended December 31, 2016 and 2015.
__________
1 Represents the total hammer (sale) price of property sold at auction.
5
Competition
Artworks are sold primarily through the major auction houses, numerous art dealers, smaller auction houses, and also directly between private collectors. In recent years, a growing number of art dealers and private collectors now buy and sell artworks at art fairs such as the The European Fine Art Fair ("TEFAF"), Art Basel, and the Frieze art fairs.
Competition in the global art market is intense. A fundamental challenge facing any auctioneer or art dealer is the sourcing of high quality and valuable property for sale either as agent or as principal. Our primary competitor in the global art market is Christie's, a privately owned auction house. To a lesser extent, we also face competition from a variety of art dealers across all collecting categories, as well as smaller auction houses such as Bonhams and Phillips and certain regional auction houses. In the Chinese art market, we compete with Beijing Poly International Auction Co. Ltd., China Guardian Auctions Co. Ltd. and Beijing Hanhai Auction Co. Ltd.
In 2016, 2015, and 2014, Sotheby's and Christie's together totaled approximately $8.7 billion, $12.3 billion, and $12.9 billion, respectively, of Aggregate Auction Sales2, of which we accounted for $4.2 billion (49%), $5.9 billion (48%), and $6.1 billion (47%), respectively.
It is not possible to measure with any particular accuracy the entire global art market or to reach definitive conclusions regarding overall competition because privately owned art dealers and auction houses frequently do not publicly report annual totals for art sales, revenues, or profits, and the amounts reported may not be verifiable. However, the most recent TEFAF Art Market Report estimates that global art sales totaled approximately $64 billion in 2015 with private sales by dealers and other agents accounting for 53% of the market and public auctions accounting for 47%.
Converting Consignment Opportunities
The ability to source high quality and valuable property for consignment is highly dependent on the meaningful institutional and personal relationships we have with our clients, which sometimes span generations. As these relationships develop over time, we provide our clients with strategic guidance on collection identity, development and acquisition, and then help them navigate the financial, logistical and personal considerations involved with deciding to sell their valued artworks. A client's decision to sell their art may be part of their long-term financial planning process or could occur suddenly as a result of a sudden change in circumstances. Over time, the principal reasons that art collectors sell have become known as the "four D's": (i) Death; (ii) Debt; (iii) Divorce; and (iv) Discretion (e.g., change in collecting preferences, redecorating a residence, and market strength). These reasons each represent a potential opportunity for consignment, but the timing of when they may arise is unpredictable and not within our control. As a result, it is difficult to predict with any certainty the supply of high quality and valuable property available for consignment in advance of peak selling seasons.
The more valuable the property, the more likely it is that an owner looking to sell their artwork will consider more than one option and will solicit proposals from more than one potential purchaser or agent. Traditionally, the primary options available to a seller of art have been:
•Sale or consignment to an art dealer;
•Sale or consignment to an auction house;
•Private sale to a collector or museum; or
•Consignment to an internet based service for certain categories of property (in particular, collectibles).
____________
2 Represents the total hammer (sale) price of property sold at auction, plus buyer's premium.
6
A complex array of factors may influence a seller's decision to favor one of these options over the others, and may include any or all of the following considerations:
•The level and breadth of expertise of the art dealer or auction house with respect to the property;
•The extent of the prior relationship, if any, between the art dealer or auction house and its staff and the seller;
• | The reputation and historic level of achievement by the art dealer or auction house in attaining high sale prices in the property's specialized category; |
• | Recommendations by third parties consulted by the seller; |
• | The client's desire for privacy; |
• | The level of pre-sale estimates; |
• | The desirability of a public auction in order to achieve the maximum possible price; |
• | The amount of cash offered by an art dealer, auction house or other purchaser to purchase the property outright, which is greatly influenced by the amount and cost of capital resources available to such parties; |
• | The availability and terms of financial incentives offered by auction houses, including auction guarantees, short-term financing, and auction commission sharing arrangements; |
• | The commission charged by art dealers or auction houses to sell a work on consignment; |
• | The cost, style, and extent of pre-sale marketing and promotion to be undertaken by an art dealer or auction house; and |
• | The availability and extent of related services, such as tax or insurance appraisals. |
Regulation of the Art Market
Regulation of the art market varies from jurisdiction to jurisdiction. In many jurisdictions, we are subject to laws and regulations, including, but not limited to, import and export regulations, cultural property regulations, data protection and privacy laws, anti-money laundering laws, antitrust laws, copyright and resale royalty laws, laws and regulations involving sales, use, value-added and other indirect taxes, and regulations related to the use of real estate. In addition, we are subject to local auction regulations, such as New York City Auction Regulations Subchapter M of Title 6 §§ 2-121-2-125, et. seq. Such regulations currently do not impose a material impediment to our business, but do affect the art market generally. A material adverse change in such regulations, such as the American Royalties Too Act of 2014 introduced in the U.S. Congress, which would impose a 5% resale royalty (with a cap of $35,000) on sales of art through large auction houses, could affect our business. Additionally, export and import laws and cultural property ownership laws could affect the availability of certain kinds of property for sale at our principal auction locations, increase the cost of moving property to such locations, or expose us to legal claims or government inquiries. We have a Compliance Department which, amongst other activities, develops and updates compliance policies, and audits, monitors, and provides training to our employees on compliance with many of these laws and regulations.
Our Strategic Priorities
We are focused on four key strategic priorities: (i) the development and implementation of a compelling growth strategy; (ii) embracing technology more effectively, both internally and through client-facing products; (iii) the efficient allocation of capital; and (iv) the attraction, development, and retention of talent. Throughout 2016, we have made significant progress against each of these priorities.
In January 2016, we acquired AAP, a firm that provides a range of art-related services, in exchange for initial cash consideration of $50 million and earn-out consideration of $35 million. The purpose of this acquisition is to grow auction and private sale revenues by enhancing our relationships with art collectors and by improving our position in the fine art market, particularly in Impressionist, Modern and Contemporary Art. Also, as a result of this acquisition, we have added a new revenue stream by integrating AAP's existing art advisory business, providing a new avenue for growth. See Note 3 of Notes to Consolidated Financial Statements for additional information regarding the acquisition of AAP.
7
In July 2016, we acquired The Mei Moses Art Indices, which is now known as Sotheby's Mei Moses. Widely recognized as the preeminent measure of the state of the art market, the indices use repeat sales (i.e., the sale of the same object at different points in time) to track changes in value. Through this acquisition, we have unique access to an analytic tool and data that provide objective and verifiable information to complement the world-class expertise of our art specialists.
In November 2016, we acquired Orion Analytical, a materials analysis and consulting firm that utilizes state-of-the-art technical and scientific methods in the examination of art, cultural property, wine and other objects. With this acquisition, we have established a scientific research department led by Orion Analytical's founder, Jamie Martin, the leading scientist in the field of materials analysis, enhancing our world-class expertise and provenance research capabilities. Bringing scientific expertise in-house mirrors a trend seen in the world’s great museums and distinguishes us in the marketplace as we help make the art market a safer place to transact.
In addition to these acquisitions, we have also appointed several new executives and client service professionals, enhancing our business development and private sale capabilities, as well as our advisory business.
In the world of technology, in 2016, we launched and refined a new generation of mobile applications across several major platforms including iPhone, iPad, Apple TV, Android, Amazon Fire TV, and Samsung Smart TV. These applications enable our clients to live-stream our auctions, review auction results and experience audio tours of our exhibitions. Additionally, throughout the year, digital participation in our auctions continued to grow. For the year ended December 31, 2016, online sales, which includes sales to on-line bidders during our live auctions, as well as on-line only auctions, totaled $155 million, a 20% increase when compared to the prior year.
Lastly, we have continued to refine our capital allocation framework to facilitate the efficient use of capital for our shareholders. This framework takes a comprehensive look at the totality of our capital needs, including the liquidity required to support our recurring business and working capital needs, capital required for the pursuit of growth opportunities, and an appropriate level of capital reserved to mitigate the risk of a cyclical downturn in the global art market. Importantly, this framework also considers the risks associated with our use of auction guarantees and their potential impact on our liquidity. Additionally, in conjunction with our capital allocation framework, we have stress tested our business model under the different market conditions of the last decade in order to determine cash-basis break-even levels at significantly lower levels of Net Auction Sales.
Guided by this framework, in 2016, we have returned approximately $360 million to shareholders through our common stock repurchase program. To date, over a three-year period, we have repurchased 17.4 million shares of our common stock, returning $510 million to our shareholders and reducing our outstanding share count by 23%. See Note 14 of Notes to Consolidated Financial Statements for additional information on our share repurchase program.
Brand Licensing Activities
Prior to 2004, we were engaged in the marketing and brokerage of luxury residential real estate sales through Sotheby's International Realty ("SIR"). In 2004, we sold SIR to a subsidiary of Realogy Corporation ("Realogy"), formerly Cendant Corporation. In conjunction with the sale, we entered into an agreement with Realogy to license the SIR trademark and certain related trademarks for an initial 50-year term with a 50-year renewal option (the "Realogy License Agreement"). The Realogy License Agreement is applicable worldwide.
The Realogy License Agreement provides for an ongoing license fee during its term based on the volume of commerce transacted under the licensed trademarks. In 2016, 2015, and 2014, we earned $9.1 million, $8.1 million, and $7.2 million, respectively, in license fee revenue related to the Realogy License Agreement.
We also license the Sotheby's name for use in connection with the art auction business in Australia, and art education services in the U.S. and the U.K. We will consider additional opportunities to license the Sotheby's brand in businesses where appropriate.
Financial and Geographical Information about Segments
See Note 2 of Notes to Consolidated Financial Statements for financial and geographical information about Sotheby's segments.
8
Employees
As of December 31, 2016, we have 1,617 employees, with 652 located in the Americas, 524 in the U.K., 231 in Continental Europe, and 210 in Asia. We regard our relations with our employees as good. The table below provides a breakdown of Sotheby's employees by segment as of December 31, 2016 and 2015.
December 31, | 2016 | 2015 | ||||
Agency | 1,373 | 1,368 | ||||
Finance | 11 | 11 | ||||
All Other | 233 | 217 | ||||
Total | 1,617 | 1,596 | ||||
Employees classified within "All Other" principally relate to our central corporate and information technology departments.
Website Address
Our annual reports on Form 10-K, quarterly reports on Form 10-Q, and current reports on Form 8-K, are available free of charge on the Investor Relations page of our website, www.sothebys.com. These reports are made available on the same day that they are electronically filed with or furnished to the Securities and Exchange Commission (the "SEC"). Information available on the website is not incorporated by reference and is not deemed to be part of this Form 10-K.
ITEM 1A: RISK FACTORS
Before you make an investment decision with respect to our common stock, you should carefully consider all of the information included in this Form 10-K and our subsequent periodic filings with the SEC. In particular, you should carefully consider the risk factors described below and the risks and uncertainties related to "Forward Looking Statements," any of which could have a material adverse effect on our business, results of operations, financial condition and the actual outcome of matters as to which forward looking statements are made in this annual report. The following risk factors, which are not ranked in any particular order, should be read in conjunction with the balance of this annual report, including the Consolidated Financial Statements and related notes.
The global economy, the financial markets and political conditions of various countries may negatively affect our business and clients, as well as the supply of and demand for works of art.
The global art market is influenced over time by the overall strength and stability of the global economy and the financial markets of various countries, although this correlation may not be immediately evident. In addition, global political conditions and world events may affect our business through their effect on the economies of various countries, as well as on the willingness of potential buyers and sellers to purchase and sell art in the wake of economic uncertainty. Our business can be particularly influenced by the economies, financial markets and political conditions of the U.S., the U.K., China, and the other major countries or territories of Europe and Asia (including the Middle East). Accordingly, weakness in those economies and financial markets can adversely affect the supply of and demand for works of art and our business. Furthermore, global political conditions may also influence the enactment of legislation that could adversely impact our business.
Competition in the global art market is intense and may adversely impact our business, results of operations, and financial condition.
We compete with other auctioneers and art dealers to obtain valuable consignments to offer for sale either at auction or through private sale. The level of competition is intense and can adversely impact our ability to obtain valuable consignments for sale, as well as the commission margins achieved on such consignments.
We cannot be assured of the amount and quality of property consigned for sale, which may cause significant variability in our results of operations.
The amount and quality of property consigned for sale is influenced by a number of factors not within our control. Many major consignments, and specifically single-owner sale consignments, become available only as a result of the death or financial or marital difficulties of the owner, all of which are unpredictable and may cause significant variability in our results of operations from period to period.
9
The demand for art is unpredictable, which may cause significant variability in our results of operations.
The demand for art is influenced not only by overall economic conditions, but also by changing trends in the art market as to which collecting categories and artists are most sought after and by the collecting preferences of individual collectors. These conditions and trends are difficult to predict and may adversely impact our ability to obtain and sell consigned property, potentially causing significant variability in our results of operations from period to period.
We rely on a select group of clients who make a significant contribution to our revenues, profitability, and operating cash flows.
Sotheby's is a global art business that caters to a select group of the world's most discerning art collectors. Accordingly, our revenues, profitability, and operating cash flows are highly dependent upon our ability to develop and maintain relationships with these clients, as well as their financial strength.
Tax matters may cause significant variability in our results of operations.
We operate in many tax jurisdictions throughout the world, and the provision for income taxes involves a significant amount of judgment regarding the interpretation of relevant facts and laws in these jurisdictions. Our effective income tax rate and recorded tax balances can significantly change between periods due to a number of complex factors including, but not limited to: (i) our projected levels of taxable income; (ii) changes in the jurisdictional mix of our forecasted and/or actual pre-tax income; (iii) increases or decreases to valuation allowances recorded against deferred tax assets; (iv) tax audits conducted by various tax authorities; (v) adjustments to income taxes upon the finalization of income tax returns; (vi) the ability to claim foreign tax credits; (vii) estimates of cash held in the U.S. and in foreign jurisdictions; (viii) our working capital and investment needs; (ix) the repatriation of foreign earnings for which we have not previously provided income taxes; and (x) tax planning strategies. Additionally, our effective income tax rate could be impacted by future changes in applicable laws, including the European Commission’s investigations on illegal state aid and the Organisation for Economic Co-operation and Development project on Base Erosion and Profit Shifting, which may result in changes to long-standing tax principles, as well as the uncertainty of the timing and nature of any comprehensive tax reform in the U.S., which could involve, among other things, reductions in the corporate income tax rate, the reduction or elimination of the deferral of U.S. income tax on our unrepatriated foreign earnings, and the reduction or elimination of certain tax credits or deductions.
Our clients reside in various tax jurisdictions throughout the world. To the extent that there are changes to tax laws or tax reporting obligations in any of these jurisdictions, such changes could adversely impact the ability and/or willingness of our clients to purchase or sell works of art. Additionally, we are subject to laws and regulations in many countries involving sales, use, value-added and other indirect taxes which are assessed by various governmental authorities and imposed on certain revenue-producing transactions between us and our clients. The application of these laws and regulations to our unique business and global client base, and the estimation of any related liabilities is complex and requires a significant amount of judgment. We are generally not responsible for these indirect tax liabilities unless we fail to collect the correct amount of sales, use, value-added, or other indirect taxes. Failure to collect the correct amount of indirect tax on a transaction may expose us to claims from tax authorities.
The loss of key personnel could adversely impact our ability to compete.
We are largely a service business in which the ability of our employees to develop and maintain relationships with potential sellers and buyers of works of art is essential to our success. Moreover, our business is unique, making it important to retain key specialists and members of management. Accordingly, our business is highly dependent upon our success in attracting and retaining qualified personnel.
Our business plans and strategic initiatives may not succeed.
Our future operating results are dependent, in part, on our ability to successfully implement our business plans and strategic initiatives. The inability to successfully implement our business plans and strategic initiatives could result in, among other things, the loss of clients and the impairment of assets. Also, our short-term operating results and liquidity could be unfavorably impacted by the implementation of our business plans and strategic initiatives. See "Our Strategic Priorities" under Part I, Item 1, "Description of Business."
10
Government laws and regulations may restrict or limit our business or impact the value of our real estate assets.
Many of our activities are subject to laws and regulations including, but not limited to, import and export regulations, cultural property regulations, data protection and privacy laws, anti-money laundering laws, antitrust laws, copyright and resale royalty laws, laws and regulations involving sales, use, value-added and other indirect taxes, and regulations related to the use of real estate. In addition, we are subject to local auction regulations, such as New York City Auction Regulations Subchapter M of Title 6 § 2-121-2-125, et. seq. Such regulations currently do not impose a material impediment to our business, but do affect the art market generally. A material adverse change in such regulations, such as the American Royalties Too Act of 2014 introduced in the U.S. Congress, which would impose a 5% resale royalty (with a cap of $35,000) on sales of art through large auction houses, could affect our business. Additionally, export and import laws and cultural property ownership laws could affect the availability of certain kinds of property for sale at our principal auction locations, increase the cost of moving property to such locations, or expose us to legal claims or government inquiries.
Our ability to collect auction receivables may be adversely impacted by buyers from emerging markets, as well as by the banking and foreign currency laws and regulations and judicial systems of the countries in which we operate and in which our clients reside.
We operate in 40 countries and have a worldwide client base that has grown in recent years due in part to an increase in the activity of buyers from emerging markets, in particular, China. The collection of auction receivables related to buyers from emerging markets may be adversely impacted by the buyer's lack of familiarity with the auction process and the buyer's financial condition. Our ability to collect auction receivables may also be adversely impacted by the banking and foreign currency laws and regulations regarding the movement of funds out of certain countries, as well as by our ability to enforce our rights as a creditor in jurisdictions where the applicable laws and regulations may be less defined, particularly in emerging markets.
Our capital allocation and financial policies may impact our liquidity, financial condition, market capitalization and business, and our ongoing ability to return capital to shareholders (and the size and timing of such return) is subject to ongoing business variables.
The actions taken in reference to our capital allocation and financial policies may impact our current and future liquidity, financial condition, market capitalization, and business. In addition, the amount and timing of any potential return of capital to shareholders depends on various factors, including the amount of excess cash generated by our business in the future, the ability to continue to finance the SFS loan portfolio with debt, the business initiatives contemplated and implemented by management, and the amount of capital that may be required to support our future liquidity needs, among other factors.
Foreign currency exchange rate movements can significantly impact our results of operations and financial condition.
We have operations throughout the world. Approximately 55% of our total revenues were earned outside of the U.S. in 2016, including 24% of our total revenues earned in the U.K. Additionally, we have significant assets and liabilities denominated in the Pound Sterling, the Euro, and the Swiss Franc. Revenues, expenses, gains, and losses recorded in foreign currencies are translated using the monthly average exchange rates prevailing during the period in which they are recognized. Assets and liabilities recorded in foreign currencies are translated at the exchange rate on the balance sheet date. Accordingly, fluctuations in foreign currency exchange rates, particularly for the Pound Sterling, the Euro, and the Swiss Franc, can significantly impact our results of operations and financial condition.
11
Subject to management approval under our internal corporate governance policy, we may pay the net sale proceeds to the consignor before payment is collected from the buyer and/or we may allow the buyer to take possession of purchased property before making payment. In these situations, we are exposed to losses in the event the buyer does not make payment.
Under the standard terms and conditions of our auction and private sales, we are not obligated to pay the consignor for property that has not been paid for by the buyer. However, in certain instances and subject to management approval under our internal corporate governance policy, we may pay the net sale proceeds to the consignor before payment is collected from the buyer while we retain possession of the property. In these situations, if the buyer does not make payment, we take title to the property, but could be exposed to losses if the value of the property subsequently declines. In certain other situations and subject to management approval under our internal corporate governance policy, we may allow the buyer to take possession of the purchased property before making payment. In these situations, we are liable to the seller for the net sale proceeds whether or not the buyer makes payment and would incur a loss in the event of buyer default. See Note 4 of Notes to Consolidated Financial Statements for information about auction and private sale receivables.
We could be exposed to losses in the event of title or authenticity claims.
The assessment of property offered for auction or private sale can involve potential claims regarding title and authenticity. The items we sell may be subject to statutory warranties as to title and to a limited guarantee as to authenticity under the Conditions of Sale and Terms of Guarantee that are published in our auction sale catalogues and the terms stated in, and the laws applicable to, agreements governing private sale transactions. Our authentication of the items we offer is based on scholarship and research, but necessarily requires a degree of judgment from our specialists. In the event of a title or authenticity claim against us, we may have recourse against the seller of the property and may have the benefit of insurance, but a claim could nevertheless expose us to losses and to reputational risk.
Auction guarantees create the risk of loss resulting from the potential inaccurate valuation of art.
The market for fine art, decorative art, and jewelry is not a highly liquid trading market and, as a result, the valuation of these items is inherently subjective. Accordingly, we are at risk with respect to our ability to estimate the likely selling prices of property offered with auction guarantees. If our judgments about the likely selling prices of property offered with auction guarantees prove to be inaccurate, there could be a significant adverse impact on our results, financial condition, and liquidity. See Note 19 of Notes to Consolidated Financial Statements for information related to auction guarantees.
We could be exposed to losses in the event of nonperformance by our counterparties in auction guarantee risk and reward sharing arrangements.
In certain situations, we reduce our financial exposure under auction guarantees through risk and reward sharing arrangements. Our counterparties to these risk and reward sharing arrangements are typically major international art dealers or major art collectors. We could be exposed to losses in the event any of these counterparties do not perform according to the terms of these contractual arrangements. See Note 19 of Notes to Consolidated Financial Statements for information related to auction guarantees.
Demand for art-related financing is unpredictable, which may cause variability in the operating results of SFS.
Our business is, in part, dependent on the demand for art-related financing, which can be significantly influenced by overall economic conditions and by the often unpredictable financial requirements of owners of major art collections. Accordingly, the operating results of SFS are subject to variability from period to period.
Our ability to realize proceeds from the sale of collateral for SFS loans may be delayed or limited.
In situations when there are competing claims on the collateral for SFS loans and/or when a borrower becomes subject to bankruptcy or insolvency laws, our ability to realize proceeds from the sale of its collateral may be limited or delayed.
12
The value of art held in inventory and art pledged as collateral for SFS loans is subjective and often fluctuates, exposing us to losses and significant variability in our results of operations.
The art market is not a highly liquid trading market. As a result, the valuation of art is inherently subjective and its realizable value often fluctuates over time. Accordingly, we are at risk both as to the realizable value of the property held in inventory and as to the realizable value of the property pledged as collateral for SFS loans. If there is evidence that the estimated realizable value of a specific item held in inventory is less than its carrying value, a loss is recorded to reflect our revised estimate of realizable value. In addition, if the estimated realizable value of the property pledged as collateral for an SFS loan is less than the corresponding loan balance, we assess whether it is necessary to record a loss to reduce the carrying value of the loan, after taking into account the ability of the borrower to repay any shortfall between the value of the collateral and the amount of the loan. In estimating the realizable value of art held in inventory and art pledged as collateral for SFS loans, we consider the following complex array of factors: (i) whether the property is expected to be offered at auction or sold privately, and the timing of any such sale; (ii) the supply and demand for the property, taking into account current art market conditions, as well as changing trends as to which collecting categories and artists are most sought after; (iii) recent sale prices achieved for comparable items within a particular collecting category and/or by a particular artist, (iv) the state of the global economy and financial markets; and (v) our intent and ability to hold the property in order to maximize its realizable value. Due to the inherent subjectivity involved in estimating the realizable value of art held in inventory and art pledged as collateral for SFS loans, our estimates of realizable value may prove, with the benefit of hindsight, to be different than the amount ultimately realized upon sale. Accordingly, changes in the valuation of art held in inventory and art pledged as collateral for SFS loans expose us to significant variability in our results of operations from period to period.
The low rate of historic losses on the SFS loan portfolio may not be indicative of future loan loss experience.
We have historically incurred minimal losses on the SFS loan portfolio. However, despite our stringent loan underwriting standards, our previous loan loss experience may not be indicative of the future performance of the loan portfolio.
The collateral supporting the SFS loan portfolio is concentrated within certain collecting categories. A material decline in these markets could impair our ability to collect the principal and interest owed on certain loans and could require repayments of borrowings on such affected loans under our revolving credit facility.
The collateral supporting the SFS loan portfolio is concentrated within certain collecting categories. Although we believe the SFS loan portfolio is sufficiently collateralized due to its current aggregate loan-to-value ratio of 48%, a material decline in these markets could impair our ability to collect the principal and interest owed on certain loans. Additionally, the eligibility of individual SFS loans included in the borrowing base of our revolving credit facility requires a minimum loan-to-value ratio of 60%. A material decline in the value of SFS loan collateral could result in an increase in the loan-to-value ratio above 60% for individual loans and could require repayment of a portion of the borrowings associated with such loans.
We could be exposed to losses and/or reputational harm as a result of various claims and lawsuits incidental to the ordinary course of our business.
We become involved in various legal proceedings, lawsuits, and other claims incidental to the ordinary course of our business. We are required to assess the likelihood of any adverse judgments or outcomes in these matters, as well as potential ranges of probable or reasonably possible losses. A determination of the amount of losses, if any, to be recorded or disclosed as a result of these contingencies is based on a careful analysis of each individual exposure with, in some cases, the assistance of outside legal counsel. The amount of losses recorded or disclosed for such contingencies may change in the future due to new developments in each matter or a change in settlement strategy.
We could be exposed to reputational harm as a result of wrongful actions by certain third parties.
We are involved in various business arrangements and ventures with unaffiliated third parties. Wrongful actions by such parties could harm our brand and reputation.
13
A breach of the security measures protecting our global network of information systems and those of certain third-party service providers utilized by Sotheby's could adversely impact our operations, reputation and brand.
The protection of client, employee and company data is extremely important to us. The regulatory environment surrounding information security and privacy is becoming increasingly demanding and frequently changing in the jurisdictions in which we do business. Clients and employees have expectations that we will protect their information from cyber-attacks and other security breaches. We have implemented systems and processes that are designed to protect personal and company information and to prevent data losses, however, these measures cannot provide absolute security, and our systems may be vulnerable to cyber-security breaches such as viruses, hacking, and similar disruptions from unauthorized intrusions. In addition, we are dependent on a global network of information systems to conduct our business and are committed to maintaining a strong infrastructure to secure these systems. As part of our information systems infrastructure, we rely increasingly upon third-party service providers to perform services related to our live auction bidding platform, retail wine and other e-commerce, video broadcasting, website content distribution, marketing, and to store, process and transmit information including client, employee and company information. Any failure on our part or by these third-party service providers to maintain the security of our confidential data and our client and employee personal information could result in business disruption, damage to reputation, financial obligations, lawsuits, sizable fines and costs, and loss of employee and client confidence in Sotheby's, and thus could have a material adverse impact on our business and financial condition, and adversely affect our results of operations. A significant security breach could require future expenditures to implement additional security measures to protect against new privacy threats or to comply with state, federal and international laws aimed at addressing those threats.
Due to the nature of our business, valuable works of art are exhibited and stored at our facilities around the world. Such works of art could be subject to damage or theft, which could have a material adverse effect on our operations, reputation and brand.
Valuable works of art are exhibited and stored at our facilities around the world. Although we maintain state of the art security measures at our premises, valuable artworks may be subject to damage or theft. The damage or theft of valuable property despite these security measures could have a material adverse impact on our business and reputation.
Insurance coverage for artwork may become more difficult to obtain or the terms of such coverage may become less favorable, exposing us to losses resulting from the damage or loss of artwork in our possession.
We maintain insurance coverage for the works of art we own, works of art consigned by clients, and all other property that may be in our custody, which are exhibited and stored at our facilities around the world. An inability to adequately insure such works of art due to limited capacity of the global art insurance market, or the inability to secure coverage on acceptable terms, could, in the future, have a material adverse impact on our business, results of operations, and financial condition.
Our business continuity plans may not be effective in addressing the impact of unexpected events that could impact our business.
Our inability to successfully implement our business continuity plans in the wake of an unexpected event, such as an act of God or a terrorist attack occurring in or near one of our major selling and/or sourcing offices and/or any other unexpected event, could disrupt our ability to operate and adversely impact our operations.
Future costs and obligations related to our U.K. Pension Plan are dependent on unpredictable factors, which may cause significant variability in our employee benefit costs.
Future costs and obligations related to our defined benefit pension plan in the U.K. are heavily influenced by changes in interest rates, investment performance in the debt and equity markets, changes in statutory requirements in the U.K., and actuarial assumptions, each of which is unpredictable and may cause significant variability in our employee benefit costs. See Note 8 of Notes to Consolidated Financial Statements for information related to our defined benefit pension plan in the U.K.
ITEM 1B: UNRESOLVED STAFF COMMENTS
None.
14
ITEM 2: PROPERTIES
We are headquartered at 1334 York Avenue in New York (the "York Property"). The York Property includes land and approximately 489,000 square feet of building area. The York Property is home to our sole North American auction salesroom and principal North American exhibition space, including S|2, our private sale exhibition gallery. The York Property is also home to the U.S. operations of SFS, as well as our corporate offices. The York Property is subject to a seven-year, $325 million mortgage that matures on July 1, 2022 (the "York Property Mortgage"). See Note 9 of Notes to Consolidated Financial Statements for additional information on the York Property Mortgage.
Our U.K. operations are based in London on New Bond Street, where the main salesrooms, exhibition spaces, and administrative offices are located. As part of a multi-year refurbishment initiative, we have invested approximately $14 million in New Bond Street over the past 5 years to enhance exhibition space, construct an S|2 private sales gallery, and establish a Sotheby's Diamonds salon. Almost the entire New Bond Street complex is either owned or held under various long-term lease, freehold, and virtual freehold arrangements. (Freeholds are occupancy arrangements in which we own the property outright. Virtual freeholds are occupancy arrangements in which there is a 2,000-year lease with nominal yearly rent payments that cannot be escalated during the term of the lease.) We also lease 52,000 square feet for a warehouse facility in Greenford, West London under a lease that expires in 2030.
We also lease space primarily for Agency segment operations in various locations throughout North America, South America, Continental Europe and Asia, including sales centers in Geneva and Zurich, Switzerland; Milan, Italy; Paris, France; and Hong Kong, China.
We believe our worldwide premises are adequate for the current conduct of our business. We have recently completed a review of our New York real estate holdings and concluded that we will continue to occupy the York Property for the foreseeable future. We are also continuing to evaluate our real estate holdings in London, taking into account the strategic and operating requirements for this location. See statement on Forward Looking Statements.
ITEM 3: LEGAL PROCEEDINGS
See Note 18 of Notes to Consolidated Financial Statements for information related to legal proceedings.
ITEM 4: MINE SAFETY DISCLOSURES
Not applicable.
15
PART II
ITEM 5: MARKET FOR THE REGISTRANT'S COMMON EQUITY, RELATED STOCKHOLDER MATTERS, AND ISSUER PURCHASES OF EQUITY SECURITIES
Market and Stockholders
Our common stock is traded on the NYSE under the symbol BID. As of February 13, 2017, there were 838 registered holders of record of our common stock. The quarterly price ranges for our common stock for the years ended December 31, 2016 and 2015 were as follows:
2016 | 2015 | |||||||||||||||
High | Low | High | Low | |||||||||||||
Quarter Ended | ||||||||||||||||
March 31 | $ | 27.49 | $ | 18.86 | $ | 45.41 | $ | 39.70 | ||||||||
June 30 | $ | 32.25 | $ | 24.96 | $ | 47.28 | $ | 40.47 | ||||||||
September 30 | $ | 41.23 | $ | 26.20 | $ | 45.74 | $ | 31.46 | ||||||||
December 31 | $ | 42.66 | $ | 33.85 | $ | 35.40 | $ | 25.49 | ||||||||
Dividends and Common Stock Repurchases
See Note 14 of Notes to Consolidated Financial Statements for detailed information regarding dividends and common stock repurchases. The following table provides information regarding our monthly common stock repurchases during the quarter ended December 31, 2016:
Period | Total number of shares purchased | Average price paid per share | Total number of shares purchased as part of publicly announced plans or programs | Approximate dollar value of shares that may yet be purchased under publicly announced plans or programs (a) | |||||||||||
October 2016 | 2,050,000 | $ | 36.00 | 2,050,000 | $ | 40,226,234 | |||||||||
November 2016 | — | $ | — | — | $ | 40,226,234 | |||||||||
December 2016 | — | $ | — | — | $ | 40,226,234 | |||||||||
Total | 2,050,000 | $ | 36.00 | 2,050,000 | |||||||||||
(a) Represents the dollar value of shares that were available to be repurchased under our publicly announced share repurchase program at the end of each respective monthly period.
16
Equity Compensation Plans
The following table provides information as of December 31, 2016 related to shares of common stock that may be issued under our existing equity compensation plans, including the Stock Option Plan, Restricted Stock Unit Plan, and Directors Stock Plan, each of which are described in Note 21 of Notes to Consolidated Financial Statements (in thousands, except per share data):
(A) | (B) | (C) | ||||||||
Plan Category | Number of Securities to be Issued Upon Exercise of Outstanding Options, Warrants and Rights (1) | Weighted Average Exercise Price of Outstanding Options, Warrants and Rights (2) | Number of Securities Remaining Available for Future Issuance Under Equity Compensation Plans (3) | |||||||
Equity compensation plans approved by shareholders | 2,158 | $ | 22.11 | 2,877 | ||||||
Equity compensation plans not approved by shareholders | 127 | $ | — | — | ||||||
Total | 2,285 | $ | 22.11 | 2,877 | ||||||
_____________________________________________________________
(1) | The number of securities that may be issued under equity compensation plans approved by shareholders includes 2,108,208 shares awarded under our Restricted Stock Unit Plan for which vesting is contingent upon future employee service and/or the achievement of certain profitability targets, as well as 50,000 vested and outstanding stock options. The number of securities that may be issued under equity compensation plans not approved by shareholders consists solely of inducement awards granted to Thomas S. Smith, Jr., our President and Chief Executive Officer ("CEO"), upon the commencement of his employment on March 31, 2015. As of December 31, 2016, these awards consist of 79,804 unvested shares of restricted stock and 47,070 fully-vested restricted stock units. The inducement awards granted to Mr. Smith were not issued pursuant to our Restricted Stock Unit Plan and have not been registered with the SEC. See Note 21 of Notes to Consolidated Financial Statements for a description of these inducement awards. |
(2) | The weighted-average exercise price includes the exercise price of outstanding stock options, but does not take into account 2,108,208 shares awarded under our Restricted Stock Unit Plan or the 79,804 unvested restricted stock shares and 47,070 fully-vested restricted stock units granted to Mr. Smith upon the commencement of his employment as our President and CEO on March 31, 2015. |
(3) | Includes 2,635,874 shares available for future issuance under our Restricted Stock Unit Plan, 104,100 shares available for issuance under our Stock Option Plan, and 136,645 shares available for issuance under our Directors Stock Plan. |
17
Performance Graph
The following graph compares the cumulative total shareholder return on our common stock for the five-year period from December 31, 2011 to December 31, 2016 with the cumulative return of the Standard & Poor's Global Luxury Index (the "S&P Global Luxury Index"), which is a line-of-business index largely composed of companies whose products and services appeal to a segment of the population consistent with our clients, and the Standard & Poor's MidCap 400 Stock Index (the"S&P MidCap 400").
The graph reflects an investment of $100 in our common stock, the S&P Global Luxury Index, and the S&P MidCap 400 on December 31, 2011, and a reinvestment of dividends at the average of the closing stock prices at the beginning and end of each quarter. 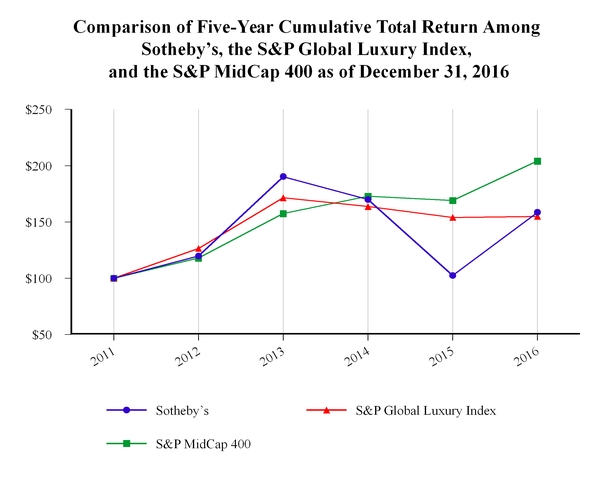
12/31/11 | 12/31/12 | 12/31/13 | 12/31/14 | 12/31/15 | 12/31/16 | |||||||||||||||||||
Sotheby's | $ | 100.00 | $ | 119.69 | $ | 190.20 | $ | 169.81 | $ | 102.39 | $ | 158.43 | ||||||||||||
S&P Global Luxury Index | $ | 100.00 | $ | 126.42 | $ | 171.42 | $ | 163.60 | $ | 153.91 | $ | 154.89 | ||||||||||||
S&P MidCap 400 | $ | 100.00 | $ | 117.87 | $ | 157.38 | $ | 172.74 | $ | 169.01 | $ | 204.02 | ||||||||||||
18
ITEM 6: SELECTED FINANCIAL DATA
Year ended December 31, | 2016 | 2015 | 2014 | 2013 | 2012 | |||||||||||||||
(Thousands of dollars, except per share data) | ||||||||||||||||||||
Income Statement Data: | ||||||||||||||||||||
Revenues: | ||||||||||||||||||||
Agency commissions and fees | $ | 671,833 | $ | 791,920 | $ | 825,126 | $ | 793,639 | $ | 717,231 | ||||||||||
Inventory sales | 62,863 | 108,699 | 69,958 | 30,638 | 26,180 | |||||||||||||||
Finance | 52,716 | 50,489 | 33,013 | 21,277 | 17,707 | |||||||||||||||
Other | 17,965 | 10,386 | 9,956 | 8,124 | 7,374 | |||||||||||||||
Total revenues | $ | 805,377 | $ | 961,494 | $ | 938,053 | $ | 853,678 | $ | 768,492 | ||||||||||
Net interest expense (a) | $ | (29,016 | ) | $ | (30,969 | ) | $ | (33,306 | ) | $ | (39,911 | ) | $ | (42,879 | ) | |||||
Net income attributable to Sotheby's | $ | 74,112 | $ | 43,727 | $ | 117,795 | $ | 130,006 | $ | 108,292 | ||||||||||
Basic earnings per share | $ | 1.28 | $ | 0.64 | $ | 1.69 | $ | 1.90 | $ | 1.59 | ||||||||||
Diluted earnings per share | $ | 1.27 | $ | 0.63 | $ | 1.68 | $ | 1.88 | $ | 1.57 | ||||||||||
Cash dividends declared per common share | $ | — | $ | 0.40 | $ | 4.74 | $ | 0.20 | $ | 0.52 | ||||||||||
Statistical Metrics: | ||||||||||||||||||||
Net Auction Sales (b) | $ | 3,556,090 | $ | 5,016,738 | $ | 5,151,419 | $ | 4,338,948 | $ | 3,809,656 | ||||||||||
Auction Commission Margin (c) | 17.1 | % | 14.3 | % | 14.7 | % | 15.9 | % | 16.3 | % | ||||||||||
Private Sales (d) | $ | 583,410 | $ | 673,119 | $ | 624,511 | $ | 1,179,038 | $ | 906,510 | ||||||||||
Non-GAAP Financial Measures: | ||||||||||||||||||||
Adjusted Net Income (e) | $ | 99,616 | $ | 143,131 | $ | 142,398 | $ | 139,461 | $ | 116,553 | ||||||||||
Adjusted Diluted Earnings Per Share (e) | $ | 1.71 | $ | 2.07 | $ | 2.03 | $ | 2.02 | $ | 1.69 | ||||||||||
EBITDA (e) | $ | 168,640 | $ | 241,102 | $ | 256,776 | $ | 245,066 | $ | 220,640 | ||||||||||
Adjusted EBITDA (e) | $ | 210,384 | $ | 294,551 | $ | 298,613 | $ | 246,438 | $ | 235,658 | ||||||||||
Balance Sheet Data: | ||||||||||||||||||||
Working capital (f) | $ | 525,878 | $ | 913,166 | $ | 610,315 | $ | 829,784 | $ | 706,244 | ||||||||||
Total assets (f) | $ | 2,504,426 | $ | 3,263,313 | $ | 3,129,796 | $ | 2,887,480 | $ | 2,567,360 | ||||||||||
Average Loan Portfolio (g) | $ | 646,135 | $ | 732,814 | $ | 583,304 | $ | 433,619 | $ | 335,898 | ||||||||||
Average Credit Facility Borrowings (h) | $ | 534,433 | $ | 541,004 | $ | 306,448 | $ | — | $ | — | ||||||||||
Long-term debt, net (f) | $ | 598,941 | $ | 604,961 | $ | 295,163 | $ | 509,480 | $ | 508,337 | ||||||||||
Total equity | $ | 505,602 | $ | 806,704 | $ | 878,238 | $ | 1,139,665 | $ | 992,826 | ||||||||||
Legend: | |
(a) | Represents interest expense less interest income. |
(b) | Represents the total hammer (sale) price of property sold at auction. |
(c) | Represents total auction commission revenues as a percentage of Net Auction Sales. |
(d) | Represents the total purchase price of property sold in private sales that we have brokered, including our commissions. |
(e) | See "Non-GAAP Financial Measures" under Part II, Item 7, "Management's Discussion and Analysis of Financial Condition and Results of Operations," for a description of this non-GAAP financial measure and a reconciliation to the most comparable GAAP amount. |
(f) | See Note 1 of Notes to Consolidated Financial Statements for information regarding the retrospective adoption of an accounting standard in 2016 that requires unamortized debt issuance costs to be included as a direct deduction from the related debt liability on the balance sheet. Prior period balances in this table have been adjusted to conform to this new presentation. |
(g) | Represents the average SFS loan portfolio outstanding during the period. |
(h) | Represents average borrowings outstanding during the period under the revolving credit facility for SFS. |
19
ITEM 7: | MANAGEMENT'S DISCUSSION AND ANALYSIS OF FINANCIAL CONDITION AND RESULTS OF |
OPERATIONS
Management's Discussion and Analysis of Financial Condition and Results of Operations (or, "MD&A") should be read in conjunction with Note 2 ("Segment Reporting") of Notes to Consolidated Financial Statements.
Critical Accounting Estimates
The preparation of financial statements and related disclosures in accordance with GAAP requires management to make judgments, assumptions, and estimates that affect the amounts reported in our Consolidated Financial Statements and accompanying notes. Actual results may ultimately differ from our original estimates, as future events and circumstances sometimes do not develop as expected. Note 1 of Notes to Consolidated Financial Statements describes the significant accounting policies and methods used in the preparation of our Consolidated Financial Statements. In addition, we believe that the following are our most critical accounting estimates, which are not ranked in any particular order, that may affect our reported financial condition and/or results of operations.
(1) | Valuation of Inventory and Loan Collateral—The art market is not a highly liquid trading market. As a result, the valuation of art is inherently subjective and the realizable value of art often fluctuates over time. If there is evidence that the estimated realizable value of a specific item held in inventory is less than its carrying value, we record a loss to reflect our revised estimate of realizable value. If the estimated realizable value of the property pledged as collateral for an SFS loan is less than the corresponding loan balance, we assess whether it is necessary to record a loss to reduce the carrying value of the loan, after taking into account the ability of the borrower to repay any shortfall between the value of the collateral and the amount of the loan. |
In estimating the realizable value of art held in inventory and art pledged as collateral for SFS loans, we consider the following complex array of factors: (i) whether the property is expected to be offered at auction or sold privately, and the timing of any such sale; (ii) the supply and demand for the property, taking into account current art market conditions, as well as changing trends as to which collecting categories and artists are most sought after; (iii) recent sale prices achieved for comparable items within a particular collecting category and/or by a particular artist; (iv) the state of the global economy and financial markets; and (v) our intent and ability to hold the property in order to maximize its realizable value.
Due to the inherent subjectivity involved in estimating the realizable value of art held in inventory and art pledged as collateral for SFS loans, our estimates of realizable value may prove, with the benefit of hindsight, to be different than the amount ultimately realized upon sale.
See Note 1 of Notes to Consolidated Financial Statements for information related to inventory. See Note 4 of Notes to Consolidated Financial Statements for information related to SFS loans.
(2) Accounts Receivable—Accounts receivable principally includes amounts due from buyers as a result of auction and private sale transactions. The recorded amount reflects the purchase price of the property, including our commission. Under the standard terms and conditions of our auction and private sales, we are not obligated to pay the consignor for property that has not been paid for by the buyer. If a buyer defaults on payment, the sale may be cancelled and the property will be returned to the consignor. We continually evaluate the collectability of amounts due from individual buyers and, if we determine that it is probable that a buyer will default, a cancelled sale is recorded in the period in which that determination is made and the associated accounts receivable balance, including our auction commission, is reversed. Historically, cancelled sales have not been material in relation to the aggregate hammer price of property sold at auction.
In certain instances and subject to management approval under our internal corporate governance policy, we may pay the consignor the net sale proceeds before payment is collected from the buyer while we retain possession of the property. In these situations, if the buyer does not make payment, Sotheby's takes title to the property, but could be exposed to losses if the value of the property subsequently declines. In certain other situations and subject to management approval under our internal corporate governance policy, we allow the buyer to take possession of purchased property before making payment. In these situations, we are liable to the seller for the net sale proceeds whether or not the buyer makes payment and would incur a loss in the event of buyer default.
Our judgments regarding the collectability of accounts receivable are based on an assessment of the buyer's payment history, discussions with the buyer, and the value of any property held as security against the buyer's payment obligation. Our judgments with respect to the collectability of amounts due from buyers for auction and private sale purchases may prove, with the benefit of hindsight, to be incorrect. See Note 4 of Notes to Consolidated Financial Statements for information related to accounts receivable.
20
(3) Pension Obligations—The benefit obligation related to our defined benefit pension plan in the U.K. (the "U.K. Pension Plan") is based on an actuarial valuation. Inherent in this valuation are key assumptions and estimates, including those related to the discount rate, the expected long-term rate of return on plan assets, future inflation, and mortality, which are reviewed and updated, as appropriate, on at least an annual basis. In developing these assumptions and estimates, we consider current market conditions, market indices, and other relevant data.
The discount rate represents the approximate weighted average rate at which the obligations of the U.K. Pension Plan could be effectively settled and is based on a yield curve for a selection of high-quality corporate bonds with maturity dates approximating the length of time remaining until individual benefit payment dates. The discount rates as of December 31, 2015 used to calculate the service and interest cost elements included in the calculation of the $6.9 million net pension credit recorded in 2016 were 3.8% and 3.4%, respectively. A hypothetical increase or decrease of 0.1% in this assumption would result in a decrease or increase in net annual pension cost of approximately $0.4 million. As of December 31, 2016, the discount rate used to calculate the $327.6 million benefit obligation was 2.7%. A hypothetical increase or decrease of 0.1% in this assumption would result in a decrease or increase in the benefit obligation of approximately $6.5 million.
The expected long-term rate of return is weighted according to the composition of invested assets and is based on expected future appreciation, as well as dividend and interest yields currently available in the equity and bond markets. In particular, the expected rate of return for growth assets represents our best estimate of annualized long-term returns by asset class. The expected rate of return on debt securities is based on interest yields currently available on long-dated U.K. government bonds and highly-rated corporate bonds. The expected long-term rate of return on plan assets used to calculate the $6.9 million net pension cost recorded in 2016 was 5.2%. A hypothetical increase or decrease of 0.25% in this assumption would result in a decrease or increase in net annual pension cost of approximately $0.9 million.
Assumed mortality rates are based upon standardized data tables used by actuaries in the U.K., taking into account the demographics of U.K. Pension Plan members and allowances for longer future life expectancies. A hypothetical 5% increase or decrease in life expectancies would result in an increase or decrease in 2016 net pension cost of approximately $0.4 million. Additionally, a hypothetical 5% increase or decrease in life expectancies would result in an increase or decrease in the December 31, 2016 benefit obligation of approximately $4.3 million.
As of December 31, 2016, the accumulated after-tax net loss related to the U.K. Pension Plan that has not yet been recognized in our Consolidated Income Statements was ($14.2) million and is reflected in the Shareholders' Equity section of our Consolidated Balance Sheets. Unrecognized pension losses are generally the result of: (i) actual results being different from previous actuarial assumptions (for example, the expected return on plan assets); (ii) changes in actuarial assumptions between balance sheet dates (for example, the discount rate); and/or (iii) curtailment gains.
In periods when the unrecognized pre-tax loss reflected in Shareholders' Equity exceeds 10% of the greater of: (i) the market-related value of plan assets or (ii) the benefit obligation, the excess amount is amortized as a component of future net pension cost or benefit over the average expected future life of plan participants, which is approximately 30.8 years. It is expected that approximately $0.9 million ($1.1 million, pre-tax) of the ($14.2) million after-tax net loss related to the U.K. Pension Plan will be recognized as a reduction of the net pension benefit anticipated for the year ended December 31, 2017. (See statement on Forward Looking Statements.)
On April 30, 2016, after the completion of a statutory consultation process, the U.K. Pension Plan was closed to accrual of future service costs for active participants. See Note 8 of Notes to Consolidated Financial Statements for additional information related to the U.K. Pension Plan.
(4) | Income Taxes—The provision for income taxes involves a significant amount of judgment regarding the interpretation of the relevant facts and laws in the many jurisdictions in which we operate. Our effective income tax rate and recorded tax balances can change significantly between periods due to a number of complex factors including, but not limited to: (i) our projected levels of taxable income; (ii) changes in the jurisdictional mix of our forecasted and/or actual pre-tax income; (iii) increases or decreases to valuation allowances recorded against deferred tax assets; (iv) tax audits conducted by various tax authorities; (v) adjustments to income taxes upon the finalization of income tax returns; (vi) the ability to claim foreign tax credits; (vii) estimates of cash held in the U.S. and in foreign jurisdictions; (viii) our working capital and investment needs; (ix) the repatriation of foreign earnings for which we have not previously provided income taxes; and (x) tax planning strategies. |
21
As of December 31, 2016, we had a net deferred tax liability of $2.5 million, which includes gross deferred tax assets of $83.2 million, primarily resulting from deductible temporary differences which will reduce taxable income in future periods. To a lesser extent, we also have deferred tax assets relating to net operating loss carryforwards, which are partially offset by a valuation allowance of $2.8 million to reduce the deferred tax assets to the amount that we have determined is more likely than not to be realized. In assessing the need for a valuation allowance, we consider, among other things, projections of future taxable income and ongoing prudent and feasible tax planning strategies. If we determine that sufficient negative evidence exists (for example, if we experience cumulative three-year losses in a certain jurisdiction), then we will consider recording a valuation allowance against a portion or all of the deferred tax assets in that jurisdiction. If, after recording a valuation allowance, our projections of future taxable income and other positive evidence considered in evaluating the need for a valuation allowance prove, with the benefit of hindsight, to be inaccurate, it could prove more difficult to support the realization of these deferred tax assets. As a result, an additional valuation allowance could be required, which would have an adverse impact on our effective income tax rate and results. Conversely, if, after recording a valuation allowance, we determine that sufficient positive evidence exists in the jurisdiction in which a valuation allowance is recorded (for example, if we are no longer in a three-year cumulative loss position in the jurisdiction, and we expect to have future taxable income in that jurisdiction based upon our forecasts and the expected timing of deferred tax asset reversals), we may reverse a portion or all of the valuation allowance in that jurisdiction. In such situations, the adjustment made to the deferred tax asset would have a favorable impact on our effective income tax rate and results in the period such determination was made.
Due to the global complexity of tax regulation, we record liabilities to address potential exposures involving uncertain tax positions that we have taken, or expect to take, on income tax returns that could be challenged by taxing authorities. These potential exposures result from the varying applications and interpretations of income tax related statutes, rules, and regulations. As of December 31, 2016, our liability for unrecognized tax benefits, excluding interest and penalties, was $19.5 million. We believe that our recorded tax liabilities are adequate to cover all open years based on an assessment of the relevant facts and circumstances. This assessment involves assumptions and significant judgments about future events and potential actions by taxing authorities, as well as an evaluation of past experiences. The cost of the ultimate resolution of these matters may be greater or less than the liability that we have recorded. To the extent that our opinion as to the outcome of these matters changes, income tax expense will be adjusted accordingly in the period in which such a determination is made.
See "Income Tax Expense" below, as well as Note 16 and Note 17 of Notes to Consolidated Financial Statements.
(5) | Share-Based Payments—We grant share-based payment awards as compensation to certain employees. The amount of compensation expense recognized for share-based payments is based, in part, on our estimate of the number of shares ultimately expected to vest as a result of employee service. A substantial portion of the share-based payment awards vest only if we achieve established profitability targets (for awards granted prior to 2016) or certain return on invested capital ("ROIC") targets (for awards granted beginning in 2016). The amount of compensation expense recognized for such performance-based awards is dependent upon our quarterly assessment of the likelihood of achieving these future profitability or ROIC targets. Accordingly, if our projections of future performance against these targets prove, with the benefit of hindsight, to be inaccurate, the amount of life-to-date and future compensation expense related to share-based payments could significantly increase or decrease. |
In 2015, we granted a share-based payment award to Thomas S. Smith, Jr., our President and CEO, with a single vesting opportunity after a five-year service period contingent upon the achievement of pre-determined levels of price appreciation in our stock. The compensation expense recognized for this share-based payment is based on our estimate of the grant date fair value of the award. In developing this estimate, we considered then-current market conditions, historical data, and other relevant data. See Note 21 of Notes to Consolidated Financial Statements for additional information related to our share-based payment programs.
(6) | Legal Contingencies—We become involved in various claims and lawsuits incidental to the ordinary course of our business. We are required to assess the likelihood of any adverse judgments or outcomes related to these legal contingencies, as well as potential ranges of probable or reasonably possible losses. The determination of the amount of any losses to be recorded or disclosed as a result of these contingencies is based on a careful analysis of each individual exposure with, in some cases, the assistance of outside legal counsel. The amount of losses recorded or disclosed for such contingencies may change in the future due to new developments in each matter or a change in settlement strategy. See Note 18 of Notes to Consolidated Financial Statements for additional information related to legal contingencies. |
22
Seasonality
The global art auction market has two principal selling seasons, which generally occur in the second and fourth quarters of the year. In the aggregate, second and fourth quarter Net Auction Sales represented 82% and 78% of our total annual Net Auction Sales in 2016 and 2015, respectively, with auction commission revenues comprising approximately 75% of our total revenues in each of these years. Accordingly, our financial results are seasonal, with peak revenues and operating income generally occurring in the second and fourth quarters. Consequently, first and third quarter results have historically reflected lower revenues when compared to the second and fourth quarters and, typically, a net loss due to the fixed nature of many of our operating expenses.
In quarterly reporting periods, the comparison of our results between reporting periods can be significantly influenced by a number of factors, such as changes in the timing of when certain auctions occur, the level of non-recurring single-owner auction sale events, the level and timing of individually negotiated private sale transactions, and changes in certain accounting estimates that rely upon forecasted results such as variable incentive and share-based compensation expense and our estimated annual effective income tax rate. Accordingly, when evaluating our performance, we believe that investors should also consider results for six and twelve month periods, which better reflect the business cycle of the global art auction market. See Note 29 of Notes to Consolidated Financial Statements for our quarterly results for the years ended December 31, 2016 and 2015.
Business and Industry Trends
Agency Segment—In late-2009, the global art market began a period of expansion that resulted in some of the most profitable years in our history. A significant driver of the expansion of the global art market and our profitability during this period was the growth of the Contemporary Art and Asian Art markets, as well as increased demand for art from clients in China and other emerging markets across several collecting categories.
Auction sale results in the fourth quarter of 2015 and throughout 2016 indicate that the global art market has entered a period of lower sales. With the art market declining from its most recent peak, consignors have exercised greater discretion in offering their works of art for sale, which has resulted in lower consignment levels, particularly in the Impressionist, Modern and Contemporary Art collecting categories. However, collectors continue to purchase top quality works of art for strong prices in these smaller and more selective sales, which have also recently experienced encouraging sell-through rates, and a greater proportion of sales exceeding their pre-sale low estimates. The lower level of sales has also been partially mitigated by an increase in Auction Commission Margin in each of the last four quarterly reporting periods beginning in the first quarter of 2016, relative to the same periods in the prior year.
Sotheby's Financial Services—In recent years, there has been an increase in the demand for art-related financing. In response, and in an effort to reduce our cost of capital and enhance returns, in January 2014, we established a separate capital structure for SFS through which client loans are predominantly funded with borrowings drawn from a dedicated revolving credit facility. The establishment of a dedicated revolving credit facility for SFS has allowed us to finance approximately 84% of the loan portfolio with debt as of December 31, 2016, and has contributed to a 42% increase in the client loan portfolio when compared to December 31, 2013 and a higher level of profitability for the segment.
23
RESULTS OF OPERATIONS FOR THE YEARS ENDED DECEMBER 31, 2016 AND 2015
This discussion should be read in conjunction with Note 2 of Notes to Consolidated Financial Statements, which provides financial information about our segments.
Overview
In 2016, we reported net income of $74.1 million (or $1.27 per diluted share), representing an increase of $30.4 million when compared to 2015 when we reported net income of $43.7 million (or $0.63 per diluted share). The comparison to the prior year is most significantly influenced by a $65.7 million income tax charge recorded in 2015 related to the repatriation of foreign earnings. Excluding this and other charges in both years, Adjusted Net Income* is $99.6 million (or Adjusted Diluted Earnings Per Share* of $1.71), which is $43.5 million (30%) lower than Adjusted Net Income* of $143.1 million (or Adjusted Diluted Earnings Per Share* of $2.07) in 2015.
The lower level of Adjusted Net Income* is principally due to the recent decline in the global art market, which resulted in a $1.5 billion (29%) decrease in Net Auction Sales and an associated $112.9 million (17%) decrease in Agency segment gross profit. Notably, the impact of the decline in Net Auction Sales¹ was somewhat mitigated by an increase in Auction Commission Margin from 14.3% to 17.1%, as well as a lower level of incentive and share-based compensation and a lower effective tax rate, excluding discrete items.
Outlook
Based on the activity in the fourth quarter of 2016 and to date in 2017, we are encouraged with the direction of the art market and our prospects for the upcoming year. With respect to expenses, we expect a modest increase in spending over 2016 as we accelerate our investments in digital marketing and other technology initiatives. We also anticipate that our effective tax rate will increase slightly in 2016 as the jurisdictional mix of our earnings shifts back to the U.S.
With respect to the balance sheet, we plan to continue our efficient allocation of capital. Accordingly, in 2017, we will continue the process of converting inventory to cash through an aggressive sale plan. Any excess capital will be evaluated for its optimal use, including potential investments in the business, potential share repurchases and/or potential debt reduction.
(See statement on Forward Looking Statements.)
______________________
* | See "Non-GAAP Financial Measures" below for a description of this non-GAAP financial measure and a reconciliation to the most comparable GAAP amount. |
24
Results of Operations for the Years Ended December 31, 2016 and 2015
The table below presents a summary of our consolidated results of operations and related statistical metrics for the years ended December 31, 2016 and 2015, as well as a comparison between the current and prior year periods (in thousands of dollars, except per share data):
Variance | ||||||||||||||
2016 | 2015 | $ / % | % | |||||||||||
Revenues: | ||||||||||||||
Agency commissions and fees | $ | 671,833 | $ | 791,920 | $ | (120,087 | ) | (15 | %) | |||||
Inventory sales | 62,863 | 108,699 | (45,836 | ) | (42 | %) | ||||||||
Finance | 52,716 | 50,489 | 2,227 | 4 | % | |||||||||
Other | 17,965 | 10,386 | 7,579 | 73 | % | |||||||||
Total revenues | 805,377 | 961,494 | (156,117 | ) | (16 | %) | ||||||||
Expenses: | ||||||||||||||
Agency direct costs | 73,324 | 91,919 | (18,595 | ) | (20 | %) | ||||||||
Cost of inventory sales | 81,782 | 111,090 | (29,308 | ) | (26 | %) | ||||||||
Cost of finance revenues | 17,738 | 15,780 | 1,958 | 12 | % | |||||||||
Marketing | 19,695 | 19,332 | 363 | 2 | % | |||||||||
Salaries and related | 307,659 | 302,825 | 4,834 | 2 | % | |||||||||
General and administrative | 161,356 | 159,148 | 2,208 | 1 | % | |||||||||
Depreciation and amortization | 21,817 | 19,481 | 2,336 | 12 | % | |||||||||
Voluntary separation incentive programs (net) (a) | (610 | ) | 36,938 | (37,548 | ) | N/A | ||||||||
CEO separation and transition costs (b) | — | 4,232 | (4,232 | ) | (100 | %) | ||||||||
Restructuring charges (net) (c) | — | (972 | ) | 972 | (100 | %) | ||||||||
Total expenses | 682,761 | 759,773 | (77,012 | ) | (10 | %) | ||||||||
Operating income | 122,616 | 201,721 | (79,105 | ) | (39 | %) | ||||||||
Net interest expense (d) | (29,016 | ) | (30,969 | ) | 1,953 | 6 | % | |||||||
Other income (expense) | 3,134 | (1,453 | ) | 4,587 | N/A | |||||||||
Income before taxes | 96,734 | 169,299 | (72,565 | ) | (43 | %) | ||||||||
Income tax expense | 25,957 | 131,145 | (105,188 | ) | (80 | %) | ||||||||
Equity in earnings of investees | 3,262 | 5,327 | (2,065 | ) | (39 | %) | ||||||||
Net income | 74,039 | 43,481 | 30,558 | 70 | % | |||||||||
Less: Net loss attributable to noncontrolling interest | (73 | ) | (246 | ) | 173 | 70 | % | |||||||
Net income attributable to Sotheby's | $ | 74,112 | $ | 43,727 | $ | 30,385 | 69 | % | ||||||
Diluted earnings per share - Sotheby's common shareholders | $ | 1.27 | $ | 0.63 | $ | 0.64 | * | |||||||
Statistical Metrics: | ||||||||||||||
Aggregate Auction Sales (e) | $ | 4,247,873 | $ | 5,949,030 | $ | (1,701,157 | ) | (29 | %) | |||||
Net Auction Sales (f) | $ | 3,556,090 | $ | 5,016,738 | $ | (1,460,648 | ) | (29 | %) | |||||
Private Sales (g) | $ | 583,410 | $ | 673,119 | $ | (89,709 | ) | (13 | %) | |||||
Consolidated Sales (h) | $ | 4,894,146 | $ | 6,720,384 | $ | (1,826,238 | ) | (27 | %) | |||||
Effective income tax rate (i) | 26.8 | % | 77.5 | % | (50.7 | %) | N/A | |||||||
Non-GAAP Financial Measures: | ||||||||||||||
Adjusted Expenses (j) | $ | 541,497 | $ | 579,454 | $ | (37,957 | ) | (7 | %) | |||||
Adjusted Operating Income (j) | $ | 164,360 | $ | 255,170 | $ | (90,810 | ) | (36 | %) | |||||
Adjusted Net Income (j) | $ | 99,616 | $ | 143,131 | $ | (43,515 | ) | (30 | %) | |||||
Adjusted Diluted Earnings Per Share (j) | $ | 1.71 | $ | 2.07 | $ | (0.36 | ) | (17 | %) | |||||
EBITDA (j) | $ | 168,640 | $ | 241,102 | $ | (72,462 | ) | (30 | %) | |||||
EBITDA Margin (j) | 20.9 | % | 25.1 | % | (4.2 | %) | N/A | |||||||
Adjusted EBITDA (j) | $ | 210,384 | $ | 294,551 | $ | (84,167 | ) | (29 | %) | |||||
Adjusted EBITDA Margin (j) | 26.1 | % | 30.6 | % | (4.5 | %) | N/A | |||||||
25
Legend: | |
* | Represents a variance in excess of 100%. |
(a) | Consists of the net (credit) charge associated with the voluntary separation incentive programs that we implemented in the fourth quarter of 2015. See "Voluntary Separation Incentive Programs (Net)" below for additional information. |
(b) | Consists of compensation-related charges and other costs associated with the hiring of Thomas S. Smith, Jr. as our President and CEO in the first quarter of 2015. See "CEO Separation and Transition Costs" below for additional information. |
(c) | Consists of a net credit recorded in 2015 to adjust the liability associated with the 2014 Restructuring Plan. See "Restructuring Charges (Net)" below for additional information. |
(d) | Represents interest expense less interest income. |
(e) | Represents the total hammer (sale) price of property sold at auction plus buyer's premium. |
(f) | Represents the total hammer (sale) price of property sold at auction. |
(g) | Represents the total purchase price of property sold in private sales that we have brokered, including our commissions. |
(h) | Represents the sum of Aggregate Auction Sales, Private Sales, and inventory sales. For the purposes of this calculation, when applicable, amounts that are associated with the sale of our inventory at auction and included in Aggregate Auction Sales are eliminated. |
(i) | The effective income tax rate in 2015 is significantly impacted by non-cash income tax expense of $65.7 million related to the repatriation of foreign earnings. See "Income Tax Expense" and "Liquidity and Capital Resources" below for additional information. |
(j) | See "Non-GAAP Financial Measures" below for a description of this non-GAAP financial measure and a reconciliation to the most comparable GAAP amount. |
Agency Segment
Our Agency segment earns commissions by matching buyers and sellers (also known as consignors) of authenticated works of art through the auction or private sale process. To a much lesser extent, Agency segment activities also include the sale of artworks acquired principally as a consequence of the auction process.
Agency segment gross profit decreased by $112.9 million (17%) in 2016 as a result of the decline in the global art market, most notably in the Impressionist, Modern and Contemporary Art collecting categories, which resulted in a significantly lower level of Net Auction Sales (29%) and auction commission revenues (15%). Also contributing to the decrease in Agency segment gross profit is a higher level of inventory losses. Somewhat mitigating the unfavorable comparison to the prior year is an increase in Auction Commission Margin from 14.3% to 17.1% and a lower level of auction direct costs. See below for a detailed discussion of the significant factors impacting the comparison of Agency segment gross profit between the current and prior year periods.
26
The table below presents a summary of Agency segment gross profit and related statistical metrics for the years ended December 31, 2016 and 2015, as well as a comparison between the current and prior year periods (in thousands of dollars):
Variance | |||||||||||||||
2016 | 2015 | $ / % | % | ||||||||||||
Agency commissions and fees: | |||||||||||||||
Auction commissions | $ | 607,770 | $ | 719,152 | $ | (111,382 | ) | (15 | %) | ||||||
Private sale commissions | 52,463 | 61,256 | (8,793 | ) | (14 | %) | |||||||||
Other Agency commissions and fees (net) | 11,600 | 11,512 | 88 | 1 | % | ||||||||||
Total Agency commissions and fees | 671,833 | 791,920 | (120,087 | ) | (15 | %) | |||||||||
Inventory sales | 54,829 | 100,110 | (45,281 | ) | (45 | %) | |||||||||
Total Agency segment revenues | 726,662 | 892,030 | (165,368 | ) | (19 | %) | |||||||||
Agency direct costs: | |||||||||||||||
Auction direct costs | 69,179 | 85,182 | (16,003 | ) | (19 | %) | |||||||||
Private sale expenses | 4,145 | 6,737 | (2,592 | ) | (38 | %) | |||||||||
Total Agency direct costs | 73,324 | 91,919 | (18,595 | ) | (20 | %) | |||||||||
Cost of inventory sales | 75,574 | 103,256 | (27,682 | ) | (27 | %) | |||||||||
Total Agency direct costs and cost of inventory sales | 148,898 | 195,175 | (46,277 | ) | (24 | %) | |||||||||
Intersegment costs: | |||||||||||||||
Interest (a) | 1,386 | 4,856 | (3,470 | ) | (71 | %) | |||||||||
Facility fees (b) | 1,817 | 2,065 | (248 | ) | (12 | %) | |||||||||
Consignment fees (c) | 5,315 | 7,838 | (2,523 | ) | (32 | %) | |||||||||
Total intersegment costs | 8,518 | 14,759 | (6,241 | ) | (42 | %) | |||||||||
Agency segment gross profit (d) | $ | 569,246 | $ | 682,096 | $ | (112,850 | ) | (17 | %) | ||||||
Statistical Metrics: | |||||||||||||||
Aggregate Auction Sales (e) | $ | 4,247,873 | $ | 5,949,030 | $ | (1,701,157 | ) | (29 | %) | ||||||
Net Auction Sales (f) | $ | 3,556,090 | $ | 5,016,738 | $ | (1,460,648 | ) | (29 | %) | ||||||
Items sold at auction with a hammer (sale) price greater than $1 million | 528 | 727 | (199) | (27 | %) | ||||||||||
Total hammer (sale) price of items sold at auction with a hammer price greater than $1 million | $ | 1,963,512 | $ | 3,273,638 | $ | (1,310,126 | ) | (40 | %) | ||||||
Items sold at auction with a hammer (sale) price greater than $3 million | 163 | 250 | (87) | (35 | %) | ||||||||||
Total hammer (sale) price of items sold at auction with a hammer (sale) price greater than $3 million | $ | 1,369,147 | $ | 2,499,581 | $ | (1,130,434 | ) | (45 | %) | ||||||
Auction Commission Margin (g) | 17.1 | % | 14.3 | % | 2.8 | % | N/A | ||||||||
Auction direct costs as a percentage of Net Auction Sales | 1.95 | % | 1.70 | % | 0.25 | % | N/A | ||||||||
Private Sales (h) | $ | 583,410 | $ | 673,119 | $ | (89,709 | ) | (13 | %) | ||||||
27
Legend: | |||||||
(a) | Represents interest charged by SFS for secured loans issued with an interest rate below its target rate. Such loans are issued by SFS as an accommodation to the Agency segment in order to secure a consignment or enhance a client relationship. See the discussion of SFS results below for an explanation of a credit recorded to intersegment interest expense in the first quarter of 2016. | ||||||
(b) | Represents fees charged by SFS for secured loans where the facility fee owed by the borrower is either reduced or waived as an accommodation to the Agency segment in order to secure a consignment or enhance a client relationship. | ||||||
(c) | Represents fees charged by SFS for term loan collateral sold at auction or privately through the Agency segment. Such fees, which represent a portion of the commission revenue earned by the Agency segment on the sale of the loan collateral, are paid to compensate SFS for generating auction and private sale consignments. | ||||||
(d) | The calculation of gross profit does not include the impact of salaries and related costs, general and administrative expenses, and depreciation and amortization expense. However, these items are deducted in the determination of segment income before taxes as reported in Note 2 of Notes to Consolidated Financial Statements. | ||||||
(e) | Represents the total hammer (sale) price of property sold at auction plus buyer's premium. | ||||||
(f) | Represents the total hammer (sale) price of property sold at auction. | ||||||
(g) | Represents total auction commission revenues as a percentage of Net Auction Sales. | ||||||
(h) | Represents the total purchase price of property sold in private sales that we have brokered, including our commissions. | ||||||
Auction Commission Revenues—In our role as auctioneer, we accept property on consignment and match sellers to buyers through the auction process. As compensation for our auction services, we earn a commission from both the buyer ("buyer's premium") and, to a lesser extent, the seller ("seller's commission") (collectively, "auction commission revenue"), both of which are calculated as a percentage of Net Auction Sales. Auction commission revenues are recorded net of commissions owed to third parties, which are principally the result of situations when the buyer's premium is shared with a consignor or with the counterparty in an auction guarantee risk and reward sharing arrangement. Additionally, in certain situations, auction commissions are shared with third parties who introduce us to consignors who sell property at auction or otherwise facilitate the sale of property at auction.
Auction commission revenues decreased $111.4 million (15%) in 2016 primarily due to a lower level of Net Auction Sales, partially offset by an improvement in Auction Commission Margin. Also contributing to the lower level of auction commission revenues are unfavorable changes in foreign currency exchange rates, which contributed $22.4 million to the overall decrease. See below for a more detailed discussion of Net Auction Sales and Auction Commission Margin.
Net Auction Sales—The table below presents a summary of Net Auction Sales for the years ended December 31, 2016 and 2015, as well as a comparison between the current and prior year periods (in millions of dollars):
Variance | |||||||||||||||
2016 | 2015 | $ | % | ||||||||||||
Contemporary Art | $ | 1,002.2 | $ | 1,467.5 | $ | (465.3 | ) | (32 | %) | ||||||
Impressionist and Modern Art | 708.8 | 1,517.5 | (808.7 | ) | (53 | %) | |||||||||
Asian Art | 665.8 | 607.8 | 58.0 | 10 | % | ||||||||||
Jewelry, Wine and Watches | 548.9 | 603.3 | (54.4 | ) | (9 | %) | |||||||||
Old Master and British Paintings and Drawings | 173.7 | 211.6 | (37.9 | ) | (18 | %) | |||||||||
Other fine art, decorative art and collectibles | 581.3 | 609.0 | (27.7 | ) | (5 | %) | |||||||||
Sub-total | 3,680.7 | 5,016.7 | (1,336.0 | ) | (27 | %) | |||||||||
Impact of foreign currency exchange rate changes | (124.6 | ) | N/A | (124.6 | ) | N/A | |||||||||
Total | $ | 3,556.1 | $ | 5,016.7 | $ | (1,460.6 | ) | (29 | %) | ||||||
The decrease in Net Auction Sales during the year is predominantly due to the decline in the global art market that began in the fourth quarter of 2015, most notably in the Impressionist, Modern and Contemporary Art collecting categories. The comparison of Net Auction Sales to the prior year is significantly influenced by sales of property from the Taubman Collection during the fourth quarter of 2015, which totaled $383 million across various collecting categories, but most prominently in Impressionist and Modern Art ($237 million) and Contemporary Art ($121 million).
28
Auction Commission Margin—Auction Commission Margin represents total auction commission revenues as a percentage of Net Auction Sales. Typically, Auction Commission Margin is higher for lower value works of art or collections, while higher valued property earns a lower Auction Commission Margin. Accordingly, Auction Commission Margin may be impacted by the mix of property sold in a period. Auction Commission Margin may also be adversely impacted by arrangements whereby we share our buyer's premium with a consignor in order to secure a high-value consignment, as well as by our use of auction guarantees. For example, when issuing an auction guarantee, we may enter into a risk and reward sharing arrangement with a counterparty whereby our financial exposure under the auction guarantee is reduced in exchange for sharing our buyer's premium. Also, in situations when guaranteed property sells for less than the guaranteed price, our buyer's premium from that sale is used to reduce the loss on the transaction. See Note 19 of Notes to Consolidated Financial Statements for information related to our use of auction guarantees.
Auction Commission Margin increased from 14.3% to 17.1% in 2016 largely due to changes in sales mix, as fewer objects were sold in the higher price bands of our buyer's premium rate structure. The comparison of Auction Commission Margin to the prior year is also significantly impacted by sales of property from the Taubman Collection in the fourth quarter of 2015. The Taubman Collection was subject to an auction guarantee and although it totaled $383 million of Net Auction Sales, sale results fell short of the guaranteed amount, and we did not recognize any net auction commission revenue from this consignment.
On November 13, 2016, we implemented a new buyer's premium rate structure. The new rate structure is 25% on the first $250,000 of hammer (sale) price; 20% on the portion of hammer (sale) price above $250,000 up to and including $3 million; and 12.5% on any remaining amount above $3 million. The hammer (sale) price thresholds in other currencies have been adjusted in a commensurate manner. The previous buyer’s premium rate structure, which had been in effect since February 1, 2015, was 25% on the first $200,000 of hammer (sale) price; 20% on the portion of hammer (sale) price above $200,000 up to and including $3 million; and 12% on the remaining amount above $3 million.
Private Sale Commission Revenues—Private sale commission revenues are earned through the direct brokering of purchases and sales of art. Private sales are initiated either by a client wishing to sell property with us acting as their exclusive agent in the transaction, or by a prospective buyer who is interested in purchasing a certain work of art privately. Because private sales are individually negotiated, non-recurring transactions, the volume and value of transactions completed can vary from period to period, with associated variability in revenues.
Private sale commissions decreased $8.8 million (14%) in 2016 due to a lower level of transaction volume during the year. Changes in foreign currency exchange rates also impacted private sales commissions, contributing $2.6 million to the overall decrease.
Agency Direct Costs—The table below presents a summary of Agency direct costs for the years ended December 31, 2016 and 2015, as well as a comparison between the current and prior year periods (in thousands of dollars):
Variance | |||||||||||||||
2016 | 2015 | $ / % | % | ||||||||||||
Auction direct costs: | |||||||||||||||
Sale marketing | $ | 26,885 | $ | 38,120 | $ | (11,235 | ) | (29 | %) | ||||||
Shipping | 11,157 | 12,971 | (1,814 | ) | (14 | %) | |||||||||
Sale venue | 13,344 | 15,402 | (2,058 | ) | (13 | %) | |||||||||
Other | 17,793 | 18,689 | (896 | ) | (5 | %) | |||||||||
Total auction direct costs | 69,179 | 85,182 | (16,003 | ) | (19 | %) | |||||||||
Private sale expenses | 4,145 | 6,737 | (2,592 | ) | (38 | %) | |||||||||
Total Agency direct costs | $ | 73,324 | $ | 91,919 | $ | (18,595 | ) | (20 | %) | ||||||
Statistical Metric: | |||||||||||||||
Auction direct costs as a % of Net Auction Sales | 1.95 | % | 1.70 | % | 0.25 | % | N/A | ||||||||
Auction Direct Costs—A large portion of auction direct costs relate to sale marketing expenses such as catalogue production and distribution, advertising and promotion costs, and traveling exhibition costs. Auction direct costs also include the cost of shipping property, sale venue costs, and other direct costs such as debit and credit card processing fees. The level of auction direct costs incurred in a period is generally dependent upon the volume and composition of our auction sale offerings. For example, direct costs attributable to auctions of single-owner or other high-value collections are typically higher than those associated with standard various-owner auctions, mainly due to higher promotional costs for catalogues, special events, and traveling exhibitions, as well as higher shipping expenses.
29
The decrease in auction direct costs during 2016 is largely a result of the lower value of our auction offerings during the year, as well as management's cost control initiatives. The comparison to the prior year is also favorably influenced by $6 million of costs incurred in the fourth quarter of 2015 to promote and conduct the Taubman Collection sale, as well as changes in foreign currency exchange rates, which reduced auction direct costs by $2.2 million.
Inventory Sales and Cost of Inventory Sales—Agency segment inventory sales include proceeds earned from the sale of (i) artworks that have been obtained as a result of the failure of guaranteed property to sell at auction, (ii) artworks that have been purchased opportunistically, including property acquired for sale at auction, and (iii) other objects obtained incidental to the auction process (e.g., as a result of buyer default). Agency segment cost of inventory sales includes the net book value of inventory sold and writedowns associated with our periodic assessment of inventory valuation.
The table below presents a summary of Agency segment inventory activities for the years ended December 31, 2016 and 2015, as well as a comparison between the current and prior year periods (in thousands of dollars):
Variance | ||||||||||||||
2016 | 2015 | $ | % | |||||||||||
Inventory sales | $ | 54,829 | $ | 100,110 | $ | (45,281 | ) | (45 | %) | |||||
Cost of inventory sales | (75,574 | ) | (103,256 | ) | 27,682 | 27 | % | |||||||
Gross loss | $ | (20,745 | ) | $ | (3,146 | ) | $ | (17,599 | ) | * | ||||
Legend:
* Represents a variance in excess of 100%.
Agency segment inventory results for 2016 include a higher level of writedowns and losses resulting from our decision in the fourth quarter of 2016 to sell certain artworks on an accelerated basis in order to deploy the sales proceeds to more productive uses, when received. Also impacting the year-over-year comparison is the completion of a number of profitable inventory sales in 2015, which were not repeated in the current year.
Sotheby's Financial Services
SFS makes term loans secured by artworks that are not presently intended for sale, allowing us to establish or enhance mutually beneficial relationships with art collectors. To a much lesser extent, SFS also makes consignor advances secured by artworks that are contractually committed, in the near term, to be offered for sale through our Agency segment. See Note 4 of Notes to Consolidated Financial Statements for additional information about the SFS loan portfolio.
The lending activities of SFS are predominantly funded with borrowings drawn from a dedicated revolving credit facility (the "SFS Credit Facility"). To a lesser extent, cash balances are also used to fund a portion of the SFS loan portfolio, as appropriate. See Note 9 of Notes to Consolidated Financial Statements for information related to the SFS Credit Facility.
Gross profit for SFS decreased $6 million (12%) in 2016 almost entirely due to a lower level of intersegment interest and consignment fees, as detailed in the table below. Excluding intersegment revenues, gross profit for SFS is essentially flat when compared to the prior year as a higher level of collateral release fees and higher interest rates earned on the loan portfolio mitigated the impact of a lower Average Loan Portfolio balance and increased borrowing costs. The decrease in the Average Loan Portfolio balance in 2016 is principally the result of proceeds collected from term loan collateral sales during the first half of the year. The increase in borrowing costs is the result of funding a greater portion of the loan portfolio with debt, as well as higher commitment fees following the expansion of the SFS credit facility in June 2015.
30
The table below presents a summary of SFS gross profit and related loan portfolio metrics as of and for the years ended December 31, 2016 and 2015 (in thousands of dollars):
Variance | |||||||||||||||
2016 | 2015 | $ / % | % | ||||||||||||
Finance revenues: | |||||||||||||||
Client paid revenues: | |||||||||||||||
Interest | $ | 43,083 | $ | 42,771 | $ | 312 | 1 | % | |||||||
Facility and other fees | 9,633 | 7,718 | 1,915 | 25 | % | ||||||||||
Total client paid revenues | 52,716 | 50,489 | 2,227 | 4 | % | ||||||||||
Intersegment revenues: | |||||||||||||||
Interest (a) | 1,386 | 4,856 | (3,470 | ) | (71 | %) | |||||||||
Facility fees (b) | 1,817 | 2,065 | (248 | ) | (12 | %) | |||||||||
Consignment fees (c) | 5,315 | 7,838 | (2,523 | ) | (32 | %) | |||||||||
Total intersegment revenues | 8,518 | 14,759 | (6,241 | ) | (42 | %) | |||||||||
Total finance revenues | 61,234 | 65,248 | (4,014 | ) | (6 | %) | |||||||||
Cost of finance revenues (d) | 17,738 | 15,780 | 1,958 | 12 | % | ||||||||||
SFS gross profit (e) | $ | 43,496 | $ | 49,468 | $ | (5,972 | ) | (12 | %) | ||||||
Loan Portfolio Metrics: | |||||||||||||||
Loan Portfolio Balance (f) | $ | 675,109 | $ | 682,258 | $ | (7,149 | ) | (1 | %) | ||||||
Average Loan Portfolio (g) | $ | 646,135 | $ | 732,814 | $ | (86,679 | ) | (12 | %) | ||||||
Credit Facility Borrowings (h) | $ | 565,000 | $ | 541,500 | $ | 23,500 | 4 | % | |||||||
Average Credit Facility Borrowings (i) | $ | 534,433 | $ | 541,004 | $ | (6,571 | ) | (1 | %) | ||||||
Average Equity in Loan Portfolio (j) | $ | 111,702 | $ | 191,810 | $ | (80,108 | ) | (42 | %) | ||||||
SFS Leverage Ratio (k) | 83.7 | % | 79.4 | % | 4.3 | % | N/A | ||||||||
Finance Revenue Percentage (l) | 9.5 | % | 8.9 | % | 0.6 | % | N/A | ||||||||
Weighted Average Cost of Borrowings (m) | 3.3 | % | 2.9 | % | 0.4 | % | N/A | ||||||||
SFS LTM Return on Equity (n) | 22.2 | % | 14.7 | % | 7.5 | % | N/A | ||||||||
31
Legend: | ||||
(a) | Represents interest earned from the Agency segment for secured loans issued with an interest rate below the SFS target rate. Such loans are issued by SFS as an accommodation to the Agency segment in order to secure a consignment or enhance a client relationship. In the first quarter of 2016, SFS earned client paid interest of $2.5 million resulting from a retroactive interest rate increase triggered during the period. SFS was compensated for this amount by the Agency segment through credits recorded to intersegment revenues in prior periods. These intersegment revenue credits were reversed in the first quarter of 2016 upon receipt of the client paid interest. | |||
(b) | Represents fees earned from the Agency segment for secured loans where the facility fee owed by the borrower is either reduced or waived as an accommodation to the Agency segment in order to secure a consignment or enhance a client relationship. | |||
(c) | Represents fees earned from the Agency segment for SFS term loan collateral sold at auction or privately through the Agency segment. Such fees, which represent a portion of the commission revenue earned by the Agency segment on the sale of the loan collateral, are paid to compensate SFS for generating auction and private sale consignments. | |||
(d) | Includes borrowing costs related to the SFS Credit Facility, including interest expense, commitment fees, and the amortization of amendment and arrangement fees. | |||
(e) | The calculation of gross profit does not include the impact of salaries and related costs, general and administrative expenses, and depreciation and amortization expense. However, these items are deducted in the determination of segment income before taxes as reported in Note 2 of Notes to Consolidated Financial Statements. | |||
(f) | Represents the period end net loan portfolio balance. | |||
(g) | Represents the average loan portfolio outstanding during the period. | |||
(h) | Represents the period end balance of borrowings outstanding under the SFS Credit Facility. | |||
(i) | Represents average borrowings outstanding during the period under the SFS Credit Facility. | |||
(j) | Calculated as the Average Loan Portfolio less Average Credit Facility Borrowings. | |||
(k) | Calculated as Credit Facility Borrowings divided by the Loan Portfolio Balance. | |||
(l) | Represents the annualized percentage of total client paid and intersegment finance revenues in relation to the Average Loan Portfolio. | |||
(m) | Represents the annualized cost of Credit Facility Borrowings. | |||
(n) | Represents the return on net income attributable to SFS, excluding allocated corporate overhead costs, over the last twelve months ("LTM") in relation to the Average Equity in Loan Portfolio during that period. For the purposes of this calculation, income taxes are provided using the effective income tax rate of SFS for the years December 31, 2016 and 2015 (38.3% and 38.5%, respectively). | |||
Other Revenues
Other revenues includes fees earned from art advisory services, license fee revenues, and other ancillary revenues. Other revenues increased $7.6 million (73%) in 2016 due to advisory fees earned by AAP, which was acquired in January 2016. See Note 3 of Notes to Consolidated Financial Statements.
32
Salaries and Related Costs
For the years ended December 31, 2016 and 2015, salaries and related costs consisted of the following (in thousands of dollars):
Variance | ||||||||||||||
2016 | 2015 | $ / % | % | |||||||||||
Full-time salaries | $ | 143,577 | $ | 146,130 | $ | (2,553 | ) | (2 | %) | |||||
Incentive compensation expense | 41,035 | 44,456 | (3,421 | ) | (8 | %) | ||||||||
Share-based payment expense | 15,935 | 28,632 | (12,697 | ) | (44 | %) | ||||||||
Acquisition earn-out compensation | 35,000 | — | 35,000 | N/A | ||||||||||
Payroll taxes | 19,519 | 20,472 | (953 | ) | (5 | %) | ||||||||
Employee benefits | 22,925 | 30,331 | (7,406 | ) | (24 | %) | ||||||||
Contractual severance agreements (net) | 7,354 | — | 7,354 | N/A | ||||||||||
Leadership transition severance costs | — | 13,251 | (13,251 | ) | (100 | %) | ||||||||
Other compensation expense | 22,314 | 19,553 | 2,761 | 14 | % | |||||||||
Total salaries and related costs | $ | 307,659 | $ | 302,825 | $ | 4,834 | 2 | % | ||||||
In 2016, changes in foreign currency exchange rates reduced salaries and related costs by $8.9 million when compared to the prior year. Excluding the impact of foreign currency exchange rate changes, salaries and related costs increased $13.7 million (5%) in 2016. See below for a detailed discussion of the significant factors impacting the comparison of the various elements of salaries and related costs between the current and prior year periods.
Full-Time Salaries—Full-time salaries decreased $2.6 million (2%) in 2016 principally due to changes in foreign currency exchange rates, which reduced the reported expense by $5 million, as well as savings resulting from the voluntary separation incentive programs enacted in December 2015 (see "Voluntary Separation Incentive Programs (net)" below). These factors are partially offset by base salary increases and headcount reinvestments in the current year.
Incentive Compensation—Incentive compensation consists principally of the accrual of annual cash incentive payments, which are paid to employees in the first quarter of every year. For 2016, we adopted a new cash incentive program that is intended to align payouts with performance against our annual financial plan. Prior to 2016, the annual cash incentive bonus pool was determined utilizing a formula that was based, in large part, on the absolute level of Adjusted EBITDA* earned during the year. Incentive compensation also includes amounts awarded to employees for brokering certain eligible private sale and other transactions.
Incentive compensation expense decreased $3.4 million (8%) in 2016 due, in part, to changes in foreign currency exchange rates, which contributed $1.6 million to the reduction versus the prior year. Excluding the impact of changes in foreign currency exchange rates, incentive compensation expense decreased $1.8 million (4%). The comparison to the prior year is also significantly influenced by $4.7 million of incentive compensation paid to participants in the voluntary separation incentive programs, which was classified as part of the charge associated with those programs in our Consolidated Income Statement for the year ended December 31, 2015 (see "Voluntary Separation Incentive Programs (net)" below). Excluding the impact of changes in foreign currency exchange rates and if such voluntary separation incentive program charges had been classified as incentive compensation, the decrease in incentive compensation would have been $6.5 million (13%).
______________________
* See "Non-GAAP Financial Measures" below for a description of this non-GAAP financial measure.
33
Share-Based Payment Expense—Share-based payment expense relates to the amortization of equity compensation awards such as performance share units, market-based share units, restricted stock units, and restricted stock. The amount of compensation expense recognized for share-based payments is based, in part, on our estimate of the number of units or shares ultimately expected to vest as a result of employee service. In addition, performance share units vest only if we achieve established profitability targets (for awards granted prior to 2016) or certain ROIC targets (for awards granted beginning in 2016). The amount of compensation expense recognized for such performance-based awards is dependent upon our quarterly assessment of the likelihood of achieving these future profitability or ROIC targets. See Note 21 of Notes to Consolidated Financial Statements for more detailed information related to our share-based compensation programs.
Share-based payment expense decreased by $12.7 million (44%) in 2016 primarily as a result of our quarterly assessment of the profitability and ROIC targets related to performance share unit awards. The comparison of share-based payment expense to the prior year is also favorably impacted by the accelerated recognition of $2.9 million in share-based compensation in 2015 pursuant to the terms of the severance agreements with our former Chief Financial Officer and former Chief Operating Officer.
Acquisition Earn-Out Compensation—On January 11, 2016, we acquired AAP, a firm that provides a range of art-related services, in exchange for initial cash consideration of $50 million. In connection with this acquisition, we also agreed to make future earn-out payments to the former principals of AAP not to exceed $35 million in the aggregate, contingent on the achievement of a level of cumulative financial performance within the Impressionist, Modern and Contemporary Art collecting categories, as well as from AAP's art advisory business. Progress against the cumulative financial target (the "Target") is measured at the end of each calendar year during the four-year performance period following the acquisition, after adjusting the Target to reflect the annual growth or contraction of the auction market for Impressionist, Modern and Contemporary Art, when compared to the year ended December 31, 2015. Payments made pursuant to the earn-out arrangement are deemed to be compensation for accounting purposes and are expensed to salaries and related costs in our Consolidated Income Statements on a pro-rata basis over the periods during which the Target is met.
The purchase agreement governing the acquisition of AAP includes non-competition and non-solicitation covenants that continue in effect until January 2021. In connection with this acquisition, each of the former principals of AAP also entered into a five-year employment agreement that extends through January 2021. Each employment agreement also includes non-competition and non-solicitation covenants that continue in effect for 12 months following the end of employment.
For the year ended December 31, 2016, we recognized $35 million of compensation expense associated with the AAP earn-out arrangement based on our assessment of performance against the Target during the initial annual period. This amount includes charges of $17.2 million and $13.4 million recorded in the third and fourth quarters of 2016, respectively, following our reassessments of progress against the Target based on forecasted and actual results for the autumn sales season. The achievement of the entire $35 million earn-out reflects our improved market share in the Contemporary Art collecting category, as well as an improvement in Auction Commission Margin. The $35 million owed under the earn-out arrangement will be paid in four annual increments of $8.75 million in the first quarter of each year beginning in 2017 and through 2020.
See Note 3 of Notes to Consolidated Financial Statements for additional information regarding the acquisition of AAP.
Employee Benefits—Employee benefits include the cost of our retirement plans and health and welfare programs, as well as certain employee severance costs. Our material retirement plans include defined contribution pension plans for our employees in the U.S. and the U.K., as well as a deferred compensation plan for certain U.S. employees (the "DCP") and the U.K. Pension Plan, a defined benefit pension plan. On April 30, 2016, after the completion of a statutory consultation process, the U.K. Pension Plan was closed to accrual of future service costs for all active participants, all of whom have become participants in the defined contribution plan for U.K. employees.
Generally, the amount of employee benefit costs recognized in a period is dependent upon headcount and overall compensation levels, as well as our financial performance. Additionally, the level of expense related to the U.K. Pension Plan is significantly influenced by service costs, interest rates, investment performance in the debt and equity markets, and actuarial assumptions. Also, the amount of expense recorded in a period for the DCP is dependent upon changes in the fair value of the associated liability resulting from gains and losses in deemed participant investments. Gains in deemed participant investments increase the DCP liability and, therefore, increase employee benefit costs. Losses in deemed participant investments decrease the DCP liability and therefore, decrease employee benefit costs. On a consolidated basis, cost increases (decreases) related to the DCP liability are largely offset by market gains (losses) in the trust assets related to the DCP liability, which are reflected in our Consolidated Income Statements within other income (expense).
34
Employee benefit costs decreased $7.4 million (24%) in 2016 principally due to the closure of the U.K. Pension Plan (see Note 8 of Notes to Consolidated Financial Statements) and, to a lesser extent, lower employee severance costs. The overall decrease in employee benefit costs is partially offset by higher DCP costs as a result of an improvement in the performance of deemed participant investments, as well as an increase in health care costs.
We expect the net credit associated with the U.K. Pension Plan to decrease by $2.1 million in 2017, from $6.9 million to $4.8 million, primarily due to a lower expected rate of return on plan assets and an anticipated increase in the required amortization of prior year actuarial losses. The lower expected rate of return is the result of a change in asset allocation strategy in the first quarter of 2017 which will reduce risk by investing a higher proportion of plan assets in debt securities. The increase in the amortization of prior year actuarial losses is due in large part to a decrease in the discount rate assumption used to value the projected benefit obligation as of December 31, 2016. See Note 8 of Notes to Consolidated Financial Statements for additional information on the U.K. Pension Plan. (See statement on Forward Looking Statements.)
Contractual Severance Agreements—In the first and third quarters of 2016, we entered into contractual severance agreements with certain former senior employees that provide cash severance benefits and the ability to continue to vest in share-based payment awards after termination of employment. These agreements resulted in net charges of $7.4 million recorded within salaries and related costs in 2016.
Leadership Transition Severance Costs—In 2015, in conjunction with our leadership transition, we incurred severance costs of $13.3 million associated with the termination of the employment of certain executive officers, including our former Chief Financial Officer and former Chief Operating Officer.
Other Compensation Expense —Other compensation expense typically includes the cost of temporary labor and overtime, as well as the amortization of expense related to certain retention-based, new-hire and other employment arrangements. Other compensation expense increased $2.8 million (14%) in 2016 primarily as a result of a higher level of expense associated with such employment arrangements.
35
General and Administrative Expenses
For the years ended December 31, 2016 and 2015, general and administrative expenses consisted of the following (in thousands of dollars):
Variance | |||||||||||||||
2016 | 2015 | $ | % | ||||||||||||
Professional fees: | |||||||||||||||
Operations (a) | $ | 22,512 | $ | 25,137 | $ | (2,625 | ) | (10 | %) | ||||||
Legal and compliance (b) | 18,317 | 13,700 | 4,617 | 34 | % | ||||||||||
Other (c) | 11,980 | 14,402 | (2,422 | ) | (17 | %) | |||||||||
Total professional fees | 52,809 | 53,239 | (430 | ) | (1 | %) | |||||||||
Facilities-related expenses | 44,537 | 42,666 | 1,871 | 4 | % | ||||||||||
Travel and entertainment | 24,287 | 27,566 | (3,279 | ) | (12 | %) | |||||||||
Telecommunication and technology | 12,928 | 9,487 | 3,441 | 36 | % | ||||||||||
Insurance | 6,049 | 6,270 | (221 | ) | (4 | %) | |||||||||
Other indirect expenses | 20,746 | 19,920 | 826 | 4 | % | ||||||||||
Total general and administrative expenses | $ | 161,356 | $ | 159,148 | $ | 2,208 | 1 | % | |||||||
(a) Includes professional fees incurred to outsource certain business functions such as catalogue production and our client contact management center, as well as for assistance with personnel recruiting, website maintenance and development, and other activities.
(b) Includes fees related to legal, audit, tax, and other compliance-related activities.
(c) Includes costs related to various administrative areas, Board of Director fees, and business consulting costs incurred to assist management in the analysis and development of business and operational strategies.
In 2016, changes in foreign currency exchange rates reduced general and administrative expenses by $5.6 million. Excluding foreign currency exchange rate changes, general and administrative expenses increased $7.8 million (5%) in 2016. See below for a detailed discussion of the significant factors impacting the comparison of the various elements of general and administrative expenses between the current and prior year periods.
Professional fees—Professional fees decreased $0.4 million (1%) in 2016. However, excluding foreign currency exchange rate changes, professional fees increased $1.1 million (2%), primarily due to higher legal fees almost entirely offset by lower operational outsourcing and business consulting costs.
Facilities-related expenses—Facilities-related expenses principally include rent expense, real estate taxes and other costs related to the operation, security and maintenance of our worldwide premises. In 2016, facilities-related expenses increased $1.9 million (4%), largely due to real estate tax rebates received in the prior year in respect of our London premises that were not repeated and increased rental costs related to our other European locations, partially offset by the impact of favorable changes in foreign currency exchange rates.
Travel and entertainment—Travel and entertainment includes costs for business travel and client entertainment. In 2016, travel and entertainment expenses decreased $3.3 million (12%) as a result of management's cost savings initiatives.
Telecommunication and technology—Telecommunication and technology includes costs related to digital media and our technology infrastructure. In 2016, telecommunication and technology costs increased $3.4 million (36%) largely due to improvements to our digital and mobile technology intended to enhance the experiences of our clients.
Other indirect expenses—Other indirect expenses includes costs related to client goodwill gestures and claims, uncollectible accounts, and other miscellaneous indirect costs. In 2016, other indirect expenses increased $0.8 million (4%) primarily as a result of a higher costs associated with client goodwill gestures and claims, partially offset by a lower level of bad debt expense.
Depreciation and Amortization Expense
Depreciation and amortization expense increased $2.3 million (12%) in 2016 primarily due to amortization expense related to intangible assets acquired in the acquisition of AAP in January 2016. See Note 7 of Notes to Consolidated Financial Statements for information regarding our intangible assets.
36
Voluntary Separation Incentive Programs (Net)
On November 13, 2015, we announced a series of regional voluntary separation incentive programs (the "Programs") aimed at reducing headcount and associated compensation costs. The Programs were offered to our employees in jurisdictions where it was practical to do so. Employees who elected to participate in the Programs were accepted only upon approval by management.
In the fourth quarter of 2015, we recognized a charge of $36.9 million as a result of the Programs, consisting of $33.8 million in cash severance benefits and $3.1 million in accelerated equity compensation expense related to awards that will continue to vest after termination of employment, subject to our achievement of the underlying profitability targets, when applicable. The liability related to the $33.8 million in cash severance benefits was recorded on our Consolidated Balance Sheets within accounts payable and accrued liabilities and included $4.7 million related to 2015 incentive compensation that would have been paid to participants had they not participated in the Programs.
In 2016, we recognized a net credit of $0.6 million to the originally recorded charge primarily as a result of our quarterly assessment of the likelihood that the performance-based stock units held by participants in the Programs will vest. Employee transitions and cash severance payments under the Programs are substantially complete.
CEO Separation and Transition Costs
In the first quarter of 2015, we recognized $4.2 million in costs associated with the hiring of Thomas S. Smith, Jr. as our President and CEO. These costs principally relate to compensation of $3.1 million owed to Mr. Smith to replace incentive compensation that he expected to receive from his previous employer, consisting of a fully-vested restricted stock unit award with a fair value of $2 million granted on March 31, 2015 and a $1.1 million cash payment that was made in September 2015. There was no required service period associated with this compensation. The CEO separation and transition costs recognized in the first quarter of 2015 also include approximately $1.1 million in recruitment and other professional fees associated with the CEO hiring process.
Restructuring Charges (Net)
On July 16, 2014, our Board of Directors approved a restructuring plan (the "2014 Restructuring Plan") principally impacting our operations in the U.S. and the U.K. In 2015, we recognized a credit of approximately $1 million in Restructuring Charges (net) as a result of adjustments to the initial $13.9 million accrual for employee termination benefits. The headcount reductions resulting from the 2014 Restructuring Plan were completed in the third quarter of 2015, and the associated liability has been fully settled.
Net Interest Expense
Net interest expense decreased $2 million (6%) in 2016 almost entirely due to the July 2015 refinancing of our previous mortgage on the York Property. See Note 9 of Notes to Consolidated Financial Statements.
Other Income (Expense)
The $4.6 million improvement in other income (expense) in 2016 is principally due to the improved market performance of DCP trust assets (+$3.1 million) and a net gain associated with foreign currency denominated transactions. This overall improvement is partially offset by a non-recurring $1.6 million death benefit recognized in 2015 under a corporate-owned life insurance policy related to the DCP.
37
Income Tax Expense
Our effective income tax rate is 26.8% for the year ended December 31, 2016, compared to 77.5% in the prior year. The decrease in our effective income tax rate is primarily due to income tax expense of $65.7 million recorded in the fourth quarter of 2015 to recognize a deferred tax liability for incremental taxes associated with accumulated foreign earnings related to years prior to 2014 that were no longer deemed to be indefinitely reinvested outside of the U.S. The decrease in our effective tax rate is also due to a change in our assertion regarding earnings from our foreign subsidiaries. In the first quarter of 2016, we determined that our foreign earnings related to 2016 (except those in the U.K.) would be indefinitely reinvested outside of the U.S. Conversely, in 2015, we recorded incremental deferred income taxes on substantially all of our foreign earnings for that year on the basis that such earnings would not be indefinitely reinvested overseas. As a result, the mix of pre-tax income among our various jurisdictions did not have a material effect on our annual effective income tax rate in 2015. However, the effective income tax rate for 2016 is influenced by changes in the mix of pre-tax income among the various jurisdictions where we operate, resulting in a decrease in our effective income tax rate. (See “Repatriation of Foreign Earnings” below and Note 16 of Notes to Consolidated Financial Statements.)
The comparison of our effective income tax rate between the two periods is also influenced by a $4 million charge recorded in 2015 to write-down certain deferred tax assets. This writedown was a result of New York City tax legislation enacted in that year which resulted in a reduction of income apportioned to New York City in 2016 and accordingly resulted in a decrease to our state and local effective income tax rate in the current year.
Our effective income tax rate may fluctuate in the future due to changes in the jurisdictional mix of our pre-tax income. The impact of such changes could be meaningful in countries with statutory tax rates that are significantly lower than the U.S. statutory tax rate of 35%, if we are not already recording incremental deferred income taxes on the earnings of those countries. This is particularly true in countries where we have significant auction operations such as Hong Kong and Switzerland, where the current statutory tax rates are approximately 17% and 23%, respectively. Furthermore, the effective income tax rate may also fluctuate due to permanent book to tax differences (e.g., nondeductible expenses), changes to the valuation allowance for net deferred tax assets, the impact of future tax settlements with federal, state or foreign tax authorities, or the impact of tax law changes.
Repatriation of Foreign Earnings—Prior to the fourth quarter of 2015, based on our projections and planned uses of U.S. and foreign earnings, we had intended that approximately $400 million of accumulated foreign earnings relating to years prior to 2014 would be indefinitely reinvested outside of the U.S. As a result, we did not initially record deferred income taxes on these earnings in our Consolidated Financial Statements. In the fourth quarter of 2015, however, in consideration of the expansion of our common stock repurchase program (see Note 14 of Notes to Consolidated Financial Statements), as well as the need for cash in the U.S. to fund other corporate strategic initiatives, we reassessed our U.S. and foreign cash needs and concluded that these foreign earnings would, instead, be repatriated to the U.S. in the foreseeable future. Consequently, in the fourth quarter of 2015, we recognized a liability for the deferred income taxes on these foreign earnings. In addition, we had accrued incremental taxes during 2014 and 2015 on approximately $200 million of foreign earnings for those years.
As of December 31, 2016, approximately $330 million of the foreign earnings discussed above had been repatriated and used, in part, to fund common stock repurchases during 2016. We expect that additional repatriations will be made, though the specific timing of any further repatriation of foreign earnings and the cash payment of the associated taxes is currently uncertain and is being evaluated. See statement on Forward Looking Statements.
Based on our current projections and planned uses of U.S. and foreign cash, we believe that our cash balances and earnings in the U.S., as well as the amount of unremitted foreign earnings for which a deferred tax liability has been recorded, will be sufficient to satisfy our current cash needs in the U.S. Accordingly, we plan to indefinitely reinvest the prospective earnings of our foreign subsidiaries, except those in the U.K., outside of the U.S. See statement on Forward Looking Statements.
Equity in Earnings of Investees
The $2.1 million decrease in earnings from equity method investments in 2016 is attributable to decreases related to Acquavella Modern Art ($1.5 million) and RM Sotheby's ($0.6 million). See Note 5 of Notes to Consolidated Financial Statements for additional information regarding our equity method investments.
38
Impact of Changes in Foreign Currency Exchange Rates
For the year ended December 31, 2016, foreign currency exchange rate changes had a net unfavorable impact of approximately $7.7 million on our operating income, with revenues unfavorably impacted by $27.4 million and expenses favorably impacted by $19.7 million.
RESULTS OF OPERATIONS FOR THE YEARS ENDED DECEMBER 31, 2015 AND 2014
This discussion should be read in conjunction with Note 2 of Notes to Consolidated Financial Statements, which provides financial information about our segments.
Overview
In 2015, we reported net income of $43.7 million (or $0.63 per diluted share), representing a decrease of $74.1 million (63%) when compared to 2014 when we reported net income of $117.8 million (or $1.68 per diluted share). The lower level of net income was due to a number of charges recorded in 2015, including a $65.7 million non-cash income tax charge related to the repatriation of foreign earnings and an after-tax charge of $23.6 million related to a series of regional voluntary separation incentive programs. Excluding these and other charges in both years, Adjusted Net Income* of $143.1 million (or Adjusted Diluted Earnings Per Share* of $2.07) in 2015 was comparable to Adjusted Net Income* of $142.4 million (or Adjusted Diluted Earnings Per Share* of $2.03) in 2014.
The comparison of net income and Adjusted Net Income* between 2015 and 2014 was also significantly influenced by sales of property from the Taubman Collection, which was subject to an auction guarantee. Auction sale results for the Taubman Collection fell short of the guaranteed amount and, accordingly, we did not recognize any net auction commission revenue from this consignment, which contributed to a decline in Auction Commission Margin when compared to 2014. The comparison between the two years was also impacted by an overall lower level of auction commission revenues, as well as a higher level of auction direct costs (including $6 million attributable to the Taubman Collection) and an increase in inventory writedowns. These factors were largely offset by a lower level of incentive compensation costs, improved results from SFS, and a higher level of equity earnings in part attributable to our 25% interest in RM Sotheby's, which was acquired in February 2015.
Although Adjusted Net Income* for 2015 was comparable to 2014, Adjusted Diluted Earnings Per Share* of $2.07 reflected an improvement versus Adjusted Diluted Earnings Per Share* of $2.03 in 2014 due to 3,705,658 shares of common stock repurchased during the year. See Note 14 of Notes to Consolidated Financial Statements for information on our common stock repurchase program.
_______________________
* See "Non-GAAP Financial Measures" below for a description of this non-GAAP financial measure and a reconciliation to the most comparable GAAP amount.
39
Results of Operations for the Years Ended December 31, 2015 and 2014
The table below presents a summary of our consolidated results of operations and related statistical metrics for the years ended December 31, 2015 and 2014, as well as a comparison between the two years (in thousands of dollars, except per share data):
Variance | ||||||||||||||
2015 | 2014 | $ / % | % | |||||||||||
Revenues: | ||||||||||||||
Agency commissions and fees | $ | 791,920 | $ | 825,126 | $ | (33,206 | ) | (4 | %) | |||||
Inventory sales | 108,699 | 69,958 | 38,741 | 55 | % | |||||||||
Finance | 50,489 | 33,013 | 17,476 | 53 | % | |||||||||
Other | 10,386 | 9,956 | 430 | 4 | % | |||||||||
Total revenues | 961,494 | 938,053 | 23,441 | 2 | % | |||||||||
Expenses: | ||||||||||||||
Agency direct costs | 91,919 | 86,524 | 5,395 | 6 | % | |||||||||
Cost of inventory sales | 111,090 | 68,037 | 43,053 | 63 | % | |||||||||
Cost of finance revenues | 15,780 | 8,740 | 7,040 | 81 | % | |||||||||
Marketing | 19,332 | 16,566 | 2,766 | 17 | % | |||||||||
Salaries and related | 302,825 | 310,934 | (8,109 | ) | (3 | %) | ||||||||
General and administrative | 159,148 | 158,796 | 352 | — | % | |||||||||
Depreciation and amortization | 19,481 | 20,575 | (1,094 | ) | (5 | %) | ||||||||
Voluntary separation incentive programs (net) (a) | 36,938 | — | 36,938 | N/A | ||||||||||
CEO separation and transition costs (b) | 4,232 | 7,591 | (3,359 | ) | (44 | %) | ||||||||
Restructuring charges (net) (c) | (972 | ) | 14,238 | (15,210 | ) | N/A | ||||||||
Special charges (net) (d) | — | 20,008 | (20,008 | ) | (100 | %) | ||||||||
Total expenses | 759,773 | 712,009 | 47,764 | 7 | % | |||||||||
Operating income | 201,721 | 226,044 | (24,323 | ) | (11 | %) | ||||||||
Net interest expense (e) | (30,969 | ) | (33,306 | ) | 2,337 | 7 | % | |||||||
Other (expense) income | (1,453 | ) | 283 | (1,736 | ) | N/A | ||||||||
Income before taxes | 169,299 | 193,021 | (23,722 | ) | (12 | %) | ||||||||
Income tax expense | 131,145 | 75,761 | 55,384 | 73 | % | |||||||||
Equity in earnings of investees | 5,327 | 732 | 4,595 | * | ||||||||||
Net income | 43,481 | 117,992 | (74,511 | ) | (63 | %) | ||||||||
Less: Net (loss) income attributable to noncontrolling interest | (246 | ) | 197 | (443 | ) | N/A | ||||||||
Net income attributable to Sotheby's | $ | 43,727 | $ | 117,795 | $ | (74,068 | ) | (63 | %) | |||||
Diluted earnings per share - Sotheby's common shareholders | $ | 0.63 | $ | 1.68 | $ | (1.05 | ) | (63 | %) | |||||
Statistical Metrics: | ||||||||||||||
Aggregate Auction Sales (f) | $ | 5,949,030 | $ | 6,075,345 | $ | (126,315 | ) | (2 | %) | |||||
Net Auction Sales (g) | $ | 5,016,738 | $ | 5,151,419 | $ | (134,681 | ) | (3 | %) | |||||
Private Sales (h) | $ | 673,119 | $ | 624,511 | $ | 48,608 | 8 | % | ||||||
Consolidated Sales (i) | $ | 6,720,384 | $ | 6,740,114 | $ | (19,730 | ) | — | % | |||||
Effective income tax rate (j) | 77.5 | % | 39.2 | % | 38.3 | % | N/A | |||||||
Non-GAAP Financial Measures: | ||||||||||||||
Adjusted Expenses (k) | $ | 579,454 | $ | 593,395 | $ | (13,941 | ) | (2 | %) | |||||
Adjusted Operating Income (k) | $ | 255,170 | $ | 267,881 | $ | (12,711 | ) | (5 | %) | |||||
Adjusted Net Income (k) | $ | 143,131 | $ | 142,398 | $ | 733 | 1 | % | ||||||
Adjusted Diluted Earnings Per Share (k) | $ | 2.07 | $ | 2.03 | $ | 0.04 | 2 | % | ||||||
EBITDA (k) | $ | 241,102 | $ | 256,776 | $ | (15,674 | ) | (6 | %) | |||||
EBITDA Margin (k) | 25.1 | % | 27.4 | % | (2.3 | %) | N/A | |||||||
Adjusted EBITDA (k) | $ | 294,551 | $ | 298,613 | $ | (4,062 | ) | (1 | %) | |||||
Adjusted EBITDA Margin (k) | 30.6 | % | 31.8 | % | (1.2 | %) | N/A | |||||||
40
Legend: | |
* | Represents a variance in excess of 100%. |
(a) | Consists of charges associated with the voluntary separation incentive programs that we implemented in the fourth quarter of 2015. See "Voluntary Separation Incentive Programs" below for additional information. |
(b) | In 2015, these charges consist of compensation-related charges and other costs associated with the hiring of Thomas S. Smith, Jr. as our President and CEO. In 2014, these charges consist of compensation-related charges associated with the resignation of William F. Ruprecht as our President and CEO. See "CEO Separation and Transition Costs" below for additional information. |
(c) | Consists of a net credit recorded in 2015 and charges recorded in 2014 for employee termination benefits and lease termination costs associated with the 2014 Restructuring Plan. See "Restructuring Charges (Net)" below for additional information. |
(d) | Consists of expenses directly associated with issues related to shareholder activism and the resulting proxy contest with Third Point. See "Special Charges (Net)" below for additional information. |
(e) | Represents interest expense less interest income. |
(f) | Represents the total hammer (sale) price of property sold at auction plus buyer's premium. |
(g) | Represents the total hammer (sale) price of property sold at auction. |
(h) | Represents the total purchase price of property sold in private sales that we have brokered, including our commissions. |
(i) | Represents the sum of Aggregate Auction Sales, Private Sales, and inventory sales. For the purposes of this calculation, when applicable, amounts that are associated with the sale of our inventory at auction and included in Aggregate Auction Sales are eliminated. |
(j) | The effective income tax rate in 2015 is significantly impacted by non-cash income tax expense of $65.7 million related to the repatriation of foreign earnings. See "Income Tax Expense" and "Liquidity and Capital Resources" below for additional information. |
(k) | See "Non-GAAP Financial Measures" below for a description of this non-GAAP financial measure and a reconciliation to the most comparable GAAP amount. |
Agency Segment
Agency segment gross profit decreased by $43.1 million (6%) in 2015 largely due to changes in foreign currency exchange rates, which contributed $28.4 million to the overall decrease. Excluding the impact of foreign currency exchange rate changes, Agency segment gross profit decreased by $14.7 million (2%). The comparison of Agency segment gross profit between the two years was significantly influenced by sales of property from the Taubman Collection. The Taubman Collection was subject to an auction guarantee and although it totaled $383 million of Net Auction Sales, sale results fell short of the guaranteed amount and we did not recognize any net auction commission revenue from this consignment, causing a decline in Auction Commission Margin from 14.7% to 14.3%. Also contributing to the decrease in Agency segment gross profit in 2015 was a lower level of recurring various-owner Net Auction Sales, as well as a higher level of auction direct costs (including $6 million attributable to the Taubman Collection) and an increase in inventory writedowns. See below for a detailed discussion of the significant factors impacting the comparison of Agency segment gross profit between the current and prior year periods.
41
The table below presents a summary of Agency segment gross profit and related statistical metrics for the years ended December 31, 2015 and 2014, as well as a comparison between the two years (in thousands of dollars).
Variance | |||||||||||||||
2015 | 2014 | $ / % | % | ||||||||||||
Agency commissions and fees: | |||||||||||||||
Auction commissions | $ | 719,152 | $ | 758,213 | $ | (39,061 | ) | (5 | %) | ||||||
Private sale commissions | 61,256 | 60,183 | 1,073 | 2 | % | ||||||||||
Other Agency commissions and fees (net) | 11,512 | 6,730 | 4,782 | 71 | % | ||||||||||
Total Agency commissions and fees | 791,920 | 825,126 | (33,206 | ) | (4 | %) | |||||||||
Inventory sales | 100,110 | 60,167 | 39,943 | 66 | % | ||||||||||
Total Agency segment revenues | 892,030 | 885,293 | 6,737 | 1 | % | ||||||||||
Agency direct costs: | |||||||||||||||
Auction direct costs | 85,182 | 79,677 | 5,505 | 7 | % | ||||||||||
Private sale expenses | 6,737 | 6,847 | (110 | ) | (2 | %) | |||||||||
Total Agency direct costs | 91,919 | 86,524 | 5,395 | 6 | % | ||||||||||
Cost of inventory sales | 103,256 | 59,313 | 43,943 | 74 | % | ||||||||||
Total Agency direct costs and cost of inventory sales | 195,175 | 145,837 | 49,338 | 34 | % | ||||||||||
Intersegment costs: | |||||||||||||||
Interest (a) | 4,856 | 6,796 | (1,940 | ) | (29 | %) | |||||||||
Facility fees (b) | 2,065 | 2,209 | (144 | ) | (7 | %) | |||||||||
Consignment fees (c) | 7,838 | 5,272 | 2,566 | 49 | % | ||||||||||
Total Intersegment costs | 14,759 | 14,277 | 482 | 3 | % | ||||||||||
Agency segment gross profit (d) | $ | 682,096 | $ | 725,179 | $ | (43,083 | ) | (6 | %) | ||||||
Statistical Metrics: | |||||||||||||||
Aggregate Auction Sales (e) | $ | 5,949,030 | $ | 6,075,345 | $ | (126,315 | ) | (2 | %) | ||||||
Net Auction Sales (f) | $ | 5,016,738 | $ | 5,151,419 | $ | (134,681 | ) | (3 | %) | ||||||
Items sold at auction with a hammer (sale) price greater than $1 million | 727 | 743 | (16 | ) | (2 | %) | |||||||||
Total hammer (sale) price of items sold at auction with a hammer price greater than $1 million | $ | 3,273,638 | $ | 3,188,811 | $ | 84,827 | 3 | % | |||||||
Items sold at auction with a hammer (sale) price greater than $2 million | 385 | 408 | (23 | ) | (6 | %) | |||||||||
Total hammer (sale) price of items sold at auction with a hammer price greater than $2 million | $ | 2,828,520 | $ | 2,720,525 | $ | 107,995 | 4 | % | |||||||
Items sold at auction with a hammer (sale) price greater than $3 million | 250 | 276 | (26 | ) | (9 | %) | |||||||||
Total hammer (sale) price of items sold at auction with a hammer price greater than $3 million | $ | 2,499,581 | $ | 2,396,255 | $ | 103,326 | 4 | % | |||||||
Auction Commission Margin (g) | 14.3 | % | 14.7 | % | (0.4 | %) | N/A | ||||||||
Auction direct costs as a percentage of Net Auction Sales | 1.70 | % | 1.55 | % | 0.15 | % | N/A | ||||||||
Private Sales (h) | $ | 673,119 | $ | 624,511 | $ | 48,608 | 8 | % | |||||||
42
Legend: | |||||||
(a) | Represents interest charged by SFS for secured loans issued with an interest rate below its target rate. Such loans are issued by SFS as an accommodation to the Agency segment in order to secure a consignment or enhance a client relationship. | ||||||
(b) | Represents fees charged by SFS for secured loans where the facility fee owed by the borrower is either reduced or waived as an accommodation to the Agency segment in order to secure a consignment or enhance a client relationship. | ||||||
(c) | Represents fees charged by SFS for term loan collateral sold at auction or privately through the Agency segment. Such fees, which represent a portion of the commission revenue earned by the Agency segment on the sale of the loan collateral, are paid to compensate SFS for generating auction and private sale consignments. | ||||||
(d) | The calculation of gross profit does not include the impact of salaries and related costs, general and administrative expenses, and depreciation and amortization expense. However, these items are deducted in the determination of segment income before taxes as reported in Note 2 of Notes to Consolidated Financial Statements. | ||||||
(e) | Represents the total hammer (sale) price of property sold at auction plus buyer's premium. | ||||||
(f) | Represents the total hammer (sale) price of property sold at auction. | ||||||
(g) | Represents total auction commission revenues as a percentage of Net Auction Sales. | ||||||
(h) | Represents the total purchase price of property sold in private sales that we have brokered, including our commissions. | ||||||
Auction Commission Revenues—Auction commission revenues decreased $39.1 million (5%) in 2015 largely due to changes in foreign currency exchange rates, which contributed $28.4 million to the overall decrease. Excluding the impact of foreign currency exchange rate changes, auction commission revenues decreased $10.7 million (1%) due to a decrease in Auction Commission Margin from 14.7% to 14.3% and a lower level of recurring various-owner Net Auction Sales. See below for a more detailed discussion of Net Auction Sales and Auction Commission Margin.
Net Auction Sales—In 2015, Net Auction Sales decreased $134.7 million (3%) as a result of the performance of the following collecting categories (in millions of dollars):
Variance | |||||||||||||||
2015 | 2014 | $ | % | ||||||||||||
Impressionist and Modern Art | $ | 1,569.3 | $ | 1,245.8 | $ | 323.5 | 26 | % | |||||||
Contemporary Art | 1,525.8 | 1,430.5 | 95.3 | 7 | % | ||||||||||
Asian Art | 630.2 | 675.2 | (45.0 | ) | (7 | %) | |||||||||
Jewelry | 504.1 | 500.7 | 3.4 | 1 | % | ||||||||||
Old Master and British Paintings and Drawings | 223.5 | 307.7 | (84.2 | ) | (27 | %) | |||||||||
Other fine art, decorative art and collectibles | 737.4 | 991.6 | (254.2 | ) | (26 | %) | |||||||||
Sub-total | 5,190.3 | 5,151.5 | 38.8 | 1 | % | ||||||||||
Impact of foreign currency exchange rate changes | (173.5 | ) | N/A | (173.5 | ) | N/A | |||||||||
Total | $ | 5,016.8 | $ | 5,151.5 | $ | (134.7 | ) | (3 | %) | ||||||
Net Auction Sales decreased $134.7 million (3%) in 2015 due to changes in foreign currency exchange rates, which contributed $173.5 million to the overall decrease. Excluding the impact of foreign currency exchange rate changes, Net Auction Sales increased $38.8 million (1%). The comparison of Net Auction Sales between the two years was significantly influenced by sales of property from the Taubman Collection at various auctions in the fourth quarter of 2015, which totaled $383 million across various collecting categories, most prominently in Impressionist and Modern Art ($237 million) and Contemporary Art ($121 million). Excluding sales of property from the Taubman Collection, the comparison of Net Auction Sales between the two periods was unfavorably impacted by a lower level of auction sales across the majority of our collecting categories, most notably in the fourth quarter of 2015.
Auction Commission Margin—Auction Commission Margin decreased from 14.7% to 14.3% in 2015 and was significantly influenced by sales of property from the Taubman Collection. The Taubman Collection was subject to an auction guarantee and although it totaled $383 million of Net Auction Sales in the fourth quarter of 2015, sale results fell short of the guaranteed amount and we did not recognize any net auction commission revenue from this consignment. The comparison of Auction Commission Margin between the two years was also influenced by an unfavorable change in sales mix, as a higher value of property was sold in the upper price bands of our buyer's premium rate structure in 2015. These factors were partially offset by a change in our buyer's premium rate structure that was enacted on February 1, 2015, which added $44 million in incremental buyer's premium revenues.
43
Private Sale Commission Revenues—Private sale commissions increased $1.1 million (2%) in 2015 due to an increased number of high-value transactions completed during the year, partially offset by foreign currency exchange rate changes. Excluding the unfavorable impact of foreign currency exchange rate changes ($2.5 million), private sale commission revenues increased $3.6 million (6%) when compared to 2014.
Agency Direct Costs—The table below presents a summary of Agency direct costs for the years ended December 31, 2015 and 2014, as well as a comparison between the two years (in thousands of dollars):
Variance | |||||||||||||||
2015 | 2014 | $ / % | % | ||||||||||||
Auction direct costs: | |||||||||||||||
Sale marketing | $ | 38,120 | $ | 34,979 | $ | 3,141 | 9 | % | |||||||
Shipping | 12,971 | 13,208 | (237 | ) | (2 | %) | |||||||||
Sale venue | 15,402 | 14,522 | 880 | 6 | % | ||||||||||
Other | 18,689 | 16,968 | 1,721 | 10 | % | ||||||||||
Total auction direct costs | 85,182 | 79,677 | 5,505 | 7 | % | ||||||||||
Private sale expenses | 6,737 | 6,847 | (110 | ) | (2 | %) | |||||||||
Total Agency direct costs | $ | 91,919 | $ | 86,524 | $ | 5,395 | 6 | % | |||||||
Statistical Metric: | |||||||||||||||
Auction direct costs as a % of Net Auction Sales | 1.70 | % | 1.55 | % | 0.15 | % | N/A | ||||||||
Auction Direct Costs—In 2015, changes in foreign currency exchange rates reduced auction direct costs by $2.7 million. Excluding foreign currency exchange rate changes, auction direct costs increased $8.2 million (10%), primarily due to approximately $6 million of costs incurred to promote and conduct the Taubman Collection sales, and, to a lesser extent, the higher cost of promoting and conducting our recurring various-owner Impressionist and Modern Art and Contemporary Art sales.
Inventory Sales and Cost of Inventory Sales—The table below presents a summary of Agency segment inventory activities for the years ended December 31, 2015 and 2014, as well as a comparison between the two years (in thousands of dollars):
Variance | ||||||||||||||
2015 | 2014 | $ | % | |||||||||||
Inventory sales | $ | 100,110 | $ | 60,167 | $ | 39,943 | 66 | % | ||||||
Cost of inventory sales | (103,256 | ) | (59,313 | ) | (43,943 | ) | 74 | % | ||||||
Gross (loss) profit | $ | (3,146 | ) | $ | 854 | $ | (4,000 | ) | N/A | |||||
The increase in Agency segment inventory sales and cost of inventory sales in 2015 was primarily due to two paintings acquired and sold at auction in 2015, which together yielded approximately $55 million in inventory sales and cost of inventory sales. The unfavorable variance in Agency segment inventory gross (loss) profit was due to a higher level of inventory writedowns in 2015 when compared to 2014.
Sotheby's Financial Services
The improvement in SFS gross profit in 2015 was a reflection of the higher Average Loan Portfolio, which was attributed to our increased ability to fund loans through revolving credit facility borrowings, the relatively low nominal interest rate environment in that period, and the improved global reach of our art-financing business, all of which allowed us to fund a number of significant new term loans during the first half of 2015. The overall improvement in SFS gross profit was partially offset by a higher cost of revolving credit facility borrowings due to an increase in the Average Loan Portfolio and a higher SFS Leverage Ratio as the process of financing loans with debt began in February 2014.
44
The table below presents a summary of SFS gross profit and related loan portfolio metrics as of and for the years ended December 31, 2015 and 2014, as well as a comparison between the two years (in thousands of dollars):
Variance | |||||||||||||||
2015 | 2014 | $ / % | % | ||||||||||||
Finance revenues: | |||||||||||||||
Client paid revenues: | |||||||||||||||
Interest | $ | 42,771 | $ | 29,477 | $ | 13,294 | 45 | % | |||||||
Facility and other fees | 7,718 | 3,536 | 4,182 | * | |||||||||||
Total client paid revenues | 50,489 | 33,013 | 17,476 | 53 | % | ||||||||||
Intersegment revenues: | |||||||||||||||
Interest (a) | 4,856 | 6,796 | (1,940 | ) | (29 | %) | |||||||||
Facility fees (b) | 2,065 | 2,209 | (144 | ) | (7 | %) | |||||||||
Consignment fees (c) | 7,838 | 5,272 | 2,566 | 49 | % | ||||||||||
Total intersegment revenues | 14,759 | 14,277 | 482 | 3 | % | ||||||||||
Total finance revenues | 65,248 | 47,290 | 17,958 | 38 | % | ||||||||||
Cost of finance revenues (d) | 15,780 | 8,740 | 7,040 | 81 | % | ||||||||||
SFS gross profit (e) | $ | 49,468 | $ | 38,550 | $ | 10,918 | 28 | % | |||||||
Loan Portfolio Metrics: | |||||||||||||||
Loan Portfolio Balance (f) | $ | 682,258 | $ | 644,441 | $ | 37,817 | 6 | % | |||||||
Average Loan Portfolio (g) | $ | 732,814 | $ | 583,304 | $ | 149,510 | 26 | % | |||||||
Credit Facility Borrowings (h) | $ | 541,500 | $ | 445,000 | $ | 96,500 | 22 | % | |||||||
Average Credit Facility Borrowings (i) | $ | 541,004 | $ | 306,448 | $ | 234,556 | 77 | % | |||||||
Average Equity in Loan Portfolio (j) | $ | 191,810 | $ | 276,856 | $ | (85,046 | ) | (31 | %) | ||||||
SFS Leverage Ratio (k) | 79.4 | % | 69.1 | % | 10.3 | % | N/A | ||||||||
Finance Revenue Percentage (l) | 8.9 | % | 8.1 | % | 0.8 | % | N/A | ||||||||
Weighted Average Cost of Borrowings (m) | 2.9 | % | 2.9 | % | — | % | N/A | ||||||||
SFS LTM Return on Equity (n) | 14.7 | % | NA | N/A | N/A | ||||||||||
45
Legend: | ||||
* | Represents a variance in excess of 100%. | |||
(a) | Represents interest earned from the Agency segment for secured loans issued with an interest rate below the SFS target rate. Such loans are issued by SFS as an accommodation to the Agency segment in order to secure a consignment or enhance a client relationship. | |||
(b) | Represents fees earned from the Agency segment for secured loans where the facility fee owed by the borrower is either reduced or waived as an accommodation to the Agency segment in order to secure a consignment or enhance a client relationship. | |||
(c) | Represents fees earned from the Agency segment for SFS term loan collateral sold at auction or privately through the Agency segment. Such fees, which represent a portion of the commission revenue earned by the Agency segment on the sale of the loan collateral, are paid to compensate SFS for generating auction and private sale consignments. | |||
(d) | Includes borrowing costs related to the SFS Credit Facility, including interest expense, commitment fees, and the amortization of amendment and arrangement fees. | |||
(e) | The calculation of gross profit does not include the impact of salaries and related costs, general and administrative expenses, depreciation and amortization expense, and intercompany charges from our global treasury function. However, these items are deducted in the determination of segment income before taxes as reported in Note 2 of Notes to Consolidated Financial Statements. | |||
(f) | Represents the period end net loan portfolio balance. | |||
(g) | Represents the average loan portfolio outstanding during the period. | |||
(h) | Represents the period end balance of borrowings outstanding under the SFS Credit Facility. | |||
(i) | Represents average borrowings outstanding during the period under the SFS Credit Facility. | |||
(j) | Calculated as Average Loan Portfolio less Average Credit Facility Borrowings. | |||
(k) | Calculated as Credit Facility Borrowings divided by Loan Portfolio Balance. | |||
(l) | Represents the annualized percentage of total client paid and intersegment finance revenues in relation to the Average Loan Portfolio. | |||
(m) | Represents the annualized cost of Credit Facility Borrowings. | |||
(n) | Represents the return on net income attributable to SFS, excluding allocated corporate overhead costs, over the last twelve months ("LTM") in relation to the Average Equity in Loan Portfolio during that period. For the purposes of this calculation, income taxes are provided using the effective income tax rate of SFS for the year ended December 31, 2015. This metric was not applicable for the LTM period ended December 31, 2014, as the financing of the SFS loan portfolio with debt did not begin until February 2014. | |||
Marketing Expenses
Marketing expenses increased $2.8 million (17%) in 2015 as a result of costs incurred to enhance our brand preeminence and accessibility.
46
Salaries and Related Costs
For the years ended December 31, 2015 and 2014, salaries and related costs consisted of the following (in thousands of dollars):
Variance | ||||||||||||||
2015 | 2014 | $ / % | % | |||||||||||
Full-time salaries | $ | 146,130 | $ | 150,110 | $ | (3,980 | ) | (3 | %) | |||||
Incentive compensation expense | 44,456 | 63,672 | (19,216 | ) | (30 | %) | ||||||||
Share-based payment expense | 28,632 | 23,470 | 5,162 | 22 | % | |||||||||
Payroll taxes | 20,472 | 23,631 | (3,159 | ) | (13 | %) | ||||||||
Employee benefits | 30,331 | 29,651 | 680 | 2 | % | |||||||||
Leadership transition severance costs | 13,251 | — | 13,251 | N/A | ||||||||||
Other compensation expense | 19,553 | 20,400 | (847 | ) | (4 | %) | ||||||||
Total salaries and related costs | $ | 302,825 | $ | 310,934 | $ | (8,109 | ) | (3 | %) | |||||
In 2015, changes in foreign currency exchange rates reduced salaries and related costs by $13.7 million when compared to 2014. Excluding the impact of foreign currency exchange rate changes, salaries and related costs increased $5.6 million (2%) in 2015. See below for a detailed discussion of the significant factors impacting the comparison of the various elements of salaries and related costs between 2015 and 2014.
Full-Time Salaries—Full-time salaries decreased $4 million (3%) in 2015 due to changes in foreign currency exchange rates ($6.6 million) and savings achieved as a result of the restructuring plan enacted in July 2014 (see "Restructuring Charges (Net)" below), partially offset by base salary increases and headcount reinvestments in 2015. Excluding the impact of foreign currency exchange rates, full-time salaries increased $2.7 million (2%) in 2015.
Incentive Compensation—The decrease in incentive compensation expense in 2015 was principally due to management's recommendation to reduce the pool of available incentive compensation relative to Adjusted EBITDA*.
Leadership Transition Severance Costs—In 2015, in conjunction with our leadership transition, we incurred severance costs of $13.3 million associated with the termination of certain executive officers, including our former Chief Financial Officer and former Chief Operating Officer.
Share-Based Payment Expense—Share-based payment expense increased by $5.2 million (22%) in 2015 largely due to the accelerated recognition of $2.9 million of compensation expense pursuant to the terms of severance agreements with our former Chief Financial Officer and former Chief Operating Officer, as well as higher amortization of share-based payment awards related to our CEO. See Note 21 of Notes to Consolidated Financial Statements for more detailed information related to our share-based compensation programs.
Payroll Taxes—The decrease of $3.2 million (13%) in payroll taxes in 2015 was primarily due to changes in foreign currency exchange rates ($1.8 million) and the lower level of incentive compensation expense.
Employee Benefits—Employee benefit costs increased $0.7 million (2%) in 2015 primarily due to higher pension costs in the U.K., including an increase of $2.3 million related to the U.K. Pension Plan and $0.7 million related to defined contribution plan profit share accruals, which commenced in the U.K. in 2015. Also unfavorably impacting the comparison to 2014 were higher non-restructuring related severance costs. These factors were almost entirely offset by a decrease of $2.3 million in DCP expense as a result of a decline in the performance of deemed participant investments, as well as lower health and welfare costs in the U.S., the lower level of incentive compensation, and changes in foreign currency exchange rates.
________________________
* See "Non-GAAP Financial Measures" below for a description of this non-GAAP financial measure.
47
General and Administrative Expenses
For the years ended December 31, 2015 and 2014, general and administrative costs consisted of the following (in thousands of dollars):
Variance | |||||||||||||||
2015 | 2014 | $ | % | ||||||||||||
Professional fees: | |||||||||||||||
Operations (a) | $ | 25,137 | $ | 25,321 | $ | (184 | ) | (1 | %) | ||||||
Legal and compliance (b) | 13,700 | 14,261 | (561 | ) | (4 | %) | |||||||||
Other (c) | 14,402 | 14,703 | (301 | ) | (2 | %) | |||||||||
Total professional fees | 53,239 | 54,285 | (1,046 | ) | (2 | %) | |||||||||
Facilities-related expenses | 42,666 | 44,590 | (1,924 | ) | (4 | %) | |||||||||
Travel and entertainment | 27,566 | 27,633 | (67 | ) | — | % | |||||||||
Telecommunication and technology | 9,487 | 9,077 | 410 | 5 | % | ||||||||||
Insurance | 6,270 | 6,190 | 80 | 1 | % | ||||||||||
Other indirect expenses | 19,920 | 17,021 | 2,899 | 17 | % | ||||||||||
Total general and administrative expenses | $ | 159,148 | $ | 158,796 | $ | 352 | — | % | |||||||
(a) Includes professional fees incurred by us to outsource certain business functions such as catalogue production and our client contact management center, as well as for assistance with personnel recruiting, website maintenance and development, and other activities.
(b) Includes fees related to legal, audit, and tax services, and other compliance-related activities.
(c) Includes costs related to various administrative areas, Board of Director fees, and business consulting costs incurred to assist management in the analysis and development of business and operational strategies.
In 2015, changes in foreign currency exchange rates reduced general and administrative expenses by $6.5 million. Excluding foreign currency exchange rate changes, general and administrative expenses increased $6.9 million (4%) in 2015. See below for a detailed discussion of the significant factors impacting the comparison of the various elements of general and administrative expenses between 2015 and 2014.
Professional fees (Operations)—This category of professional fees was relatively unchanged in 2015 when compared to 2014, as savings from negotiated rate reductions related to certain outsourced functions were offset by higher website consulting costs and personnel recruiting costs.
Professional fees (Legal and Compliance)—This category of professional fees decreased $0.6 million (4%) in 2015 primarily due to recoveries of legal fees mainly resulting from a favorable court ruling.
Facilities-related expenses—Facilities-related expenses decreased $1.9 million (4%) in 2015 due to changes in foreign currency exchange rates, which contributed $2.4 million to the overall decrease.
Travel and entertainment—Travel and entertainment expenses were unchanged in 2015 when compared to 2014 due to changes in foreign currency exchange rates, which reduced the level of reported expense by $1.2 million. Excluding foreign currency exchange rate changes, travel and entertainment expenses increased $1.1 million (4%) in 2015.
Other indirect expenses—Includes costs related to client goodwill gestures and claims, uncollectible accounts, and other miscellaneous indirect costs. Other indirect expenses increased $2.9 million (17%) in 2015 primarily due to a charge recognized in the second quarter of 2015 for an authenticity claim related to property sold through Sotheby's several years ago. This charge was recorded net of a related insurance recovery recognized in the fourth quarter of 2015.
48
Voluntary Separation Incentive Programs
On November 13, 2015, we announced a series of regional voluntary separation incentive programs aimed at reducing headcount and associated compensation costs. The Programs were offered to our employees in jurisdictions where it was practical to do so. Employees who elected to participate in the Programs were accepted only upon approval by our management.
In the fourth quarter of 2015, we recognized a charge of $36.9 million as a result of the Programs, consisting of $33.8 million in cash severance benefits and $3.1 million in accelerated equity compensation expense related to awards that will continue to vest after termination of employment, subject to our achievement of the underlying profitability targets, when applicable. The liability related to the $33.8 million in cash severance benefits was recorded on our Consolidated Balance Sheets within accounts payable and accrued liabilities and included $4.7 million related to 2015 incentive compensation that would have been paid to participants had they not participated in the Programs. Employee transitions and cash severance payments under the Programs are substantially complete.
CEO Separation and Transition Costs
In 2014, CEO Separation and Transition Costs consisted of compensation-related charges of $7.6 million recognized in the fourth quarter of 2014, related to the resignation of William F. Ruprecht as our President and CEO, and charges of $4.2 million recognized in the first quarter of 2015, associated with the subsequent hiring of Thomas S. Smith, Jr. as his replacement.
The charges recognized in the fourth quarter of 2014 consisted of the accrual of a $4 million cash severance benefit and $3.6 million in accelerated equity compensation expense triggered by the terms of Mr. Ruprecht's employment agreement.
In the first quarter of 2015, we recognized $4.2 million in costs associated with the hiring of Thomas S. Smith, Jr. as our President and CEO. These costs principally relate to compensation of $3.1 million owed to Mr. Smith to replace incentive compensation that he expected to receive from his previous employer, consisting of a fully-vested restricted stock unit award with a fair value of $2 million granted on March 31, 2015 and a $1.1 million cash payment that was made in September 2015. There was no required service period associated with this compensation. The CEO Separation and Transition Costs recognized in the first quarter of 2015 also include approximately $1.1 million in recruitment and other professional fees associated with the CEO hiring process.
Restructuring Charges (Net)
On July 16, 2014, our Board of Directors approved the 2014 Restructuring Plan, which principally impacted our operations in the U. S. and the U.K. The 2014 Restructuring Plan resulted in net Restructuring Charges of $14.2 million recognized in 2014, consisting of $13.9 million in employee termination benefits and approximately $0.3 million in lease exit costs. In 2015, we recognized a benefit of $1 million in Restructuring Charges (net) as a result of adjustments to the initial accrual for employee termination benefits. The headcount reductions resulting from the 2014 Restructuring Plan were completed in the third quarter of 2015, and the associated liability has been fully settled.
Special Charges (Net)
In 2014, we recognized Special Charges (net) of $20 million related to third party advisory, legal, and other professional service fees directly associated with issues related to shareholder activism, the resulting proxy contest with Third Point LLC ("Third Point"), and the litigation concerning our former shareholder rights plan and the change in control provision in our credit agreement. This amount is net of a $4.6 million insurance recovery pertaining to certain professional services fees incurred in defense of the litigation concerning the former shareholder rights plan and the change in control provision in our credit agreement.
Included in Special Charges (net) in 2014 is a $10 million charge related to our reimbursement of Third Point's documented, out-of-pocket expenses incurred in connection with the proxy contest and the litigation concerning our former shareholder rights plan. This reimbursement is part of a support agreement that we entered into with Third Point, Daniel S. Loeb, Olivier Reza, Harry J. Wilson and other entities affiliated with Third Point (together with Third Point, the "Third Point Entities") on May 4, 2014 pursuant to which we settled the previously pending proxy contest for the election of directors (the "Support Agreement"). Pursuant to the Support Agreement, on May 4, 2014, Mr. Loeb, Mr. Reza, and Mr. Wilson (the "Third Point Nominees") were appointed to our Board of Directors. The Support Agreement also contains various other terms and provisions, including with respect to standstill and voting commitments entered into by Third Point, Third Point's withdrawal of the litigation concerning our former shareholder rights plan, and the accelerated expiration of our former shareholder rights plan.
49
Net Interest Expense
Net interest expense decreased $2.3 million (7%) in 2015 almost entirely due to the July 2015 refinancing of our previous mortgage on the York Property. See Note 9 of Notes to Consolidated Financial Statements.
Other (Expense) Income
In 2015, other expense of approximately $1 million consisted primarily of a $2.7 million DCP market loss associated with the underlying trust assets, partially offset by a $1.6 million death benefit recognized in the fourth quarter of 2015 under a corporate-owned life insurance policy related to the DCP.
Other income of approximately $0.3 million in 2014 consisted of net gains realized on certain foreign currency denominated transactions and a $0.3 million market gain on DCP trust assets, almost entirely offset by a $2.1 million loss related to the cumulative translation adjustment that was recognized upon the liquidation of a foreign subsidiary.
Income Tax Expense
Our effective income tax rate was 77.5% in 2015, compared to 39.2% in 2014. The increase in the effective income tax rate was primarily due to income tax expense of $65.7 million recorded in the fourth quarter of 2015 to recognize a deferred tax liability for incremental taxes associated with accumulated foreign earnings relating to years prior to 2014 that were no longer deemed to be indefinitely reinvested outside of the U.S. (see “Repatriation of Foreign Earnings” below). In 2015 and 2014, income tax expense of approximately $14.2 million and $18.6 million, respectively, was recorded to recognize deferred tax liabilities for incremental taxes associated with our foreign earnings in those years that were not deemed to be indefinitely reinvested outside of the U.S.
The effective income tax rate for 2015 also included income tax expense of approximately $4 million to write-down certain deferred tax assets as a result of New York City tax legislation enacted in April 2015. The legislation reduced the amount of our taxable income apportioned to New York City, thereby reducing our state and local effective income tax rate. This income tax expense was recorded discretely in the second quarter of 2015 and reduced the value of certain deferred tax assets to the amount that will be recognized in the future as a result of the reduction of the New York City effective income tax rate. The effective income tax rate for 2014 included income tax expense of approximately $3.9 million related to the writedown of certain deferred tax assets as a result of the New York State 2014-2015 Budget Act that was enacted in 2014.
Repatriation of Foreign Earnings—Prior to the fourth quarter of 2015, based on our projections and planned uses of U.S. and foreign earnings, we had intended that approximately $400 million of accumulated foreign earnings relating to years prior to 2014 would be indefinitely reinvested outside of the U.S. As a result, we did not initially record deferred income taxes on these earnings in our Consolidated Financial Statements. Due to the resignation of William F. Ruprecht as our President and CEO in November 2014 and the subsequent hiring of Thomas S. Smith, Jr. as his replacement in March 2015, and the resulting reevaluation of our strategic priorities, we reassessed our U.S. and foreign cash needs in the fourth quarter of 2015. As a result of this reassessment and in consideration of the expansion of our common stock repurchase program (see Note 14 of Notes to Consolidated Financial Statements), as well as the need for cash in the U.S. to fund other corporate strategic initiatives, in the fourth quarter of 2015, it was apparent that these foreign earnings would instead be repatriated to the U.S. in the foreseeable future. Consequently, in the fourth quarter of 2015, we recognized a non-cash income tax charge of $65.7 million (net of foreign tax credits) for the deferred income taxes on these foreign earnings.
Equity in Earnings of Investees
Our equity method investments include a 25% ownership interest in RM Sotheby's, which was acquired on February 18, 2015, and a 50% ownership interest in Acquavella Modern Art ("AMA"). In 2015, equity in earnings of investees increased by $4.6 million when compared to 2014 due to the earnings contributed by RM Sotheby's ($2.5 million) and an increase in earnings from AMA ($2.1 million). See Note 5 of Notes to Consolidated Financial Statements for additional information on our equity method investees.
Impact of Changes in Foreign Currency Exchange Rates
For the year ended December 31, 2015, foreign currency exchange rate changes had a net unfavorable impact of approximately $6.7 million on our operating income when compared to 2014, with revenues unfavorably impacted by $32.5 million and expenses favorably impacted by $25.8 million.
50
NON-GAAP FINANCIAL MEASURES
GAAP refers to generally accepted accounting principles in the United States of America. Included in this Form 10-K are financial measures presented in accordance with GAAP and also on a non-GAAP basis. The non-GAAP financial measures presented in this Form 10-K are:
(i) | Adjusted Expenses | (v) | EBITDA |
(ii) | Adjusted Operating Income | (vi) | Adjusted EBITDA |
(iii) | Adjusted Net Income | (vii) | EBITDA Margin |
(iv) | Adjusted Diluted Earnings Per Share | (viii) | Adjusted EBITDA Margin |
We caution users of our financial statements that amounts presented in accordance with our definitions of these non-GAAP financial measures as provided below may not be comparable to similar measures disclosed by other companies because not all companies and analysts calculate such measures in the same manner. Our definitions of the non-GAAP financial measures presented in this Form 10-K are as follows:
(i) | Adjusted Expenses is defined as total expenses excluding the cost of inventory sales, the cost of finance revenues, earn-out compensation expense related to the acquisition of AAP, charges related to certain contractual severance agreements (net, recorded within salaries and related costs), leadership transition severance costs (recorded within salaries and related costs), charges related to our voluntary separation incentive programs (net), CEO separation and transition costs, restructuring charges (net), and special charges (net). |
(ii) | Adjusted Operating Income is defined as operating income excluding earn-out compensation expense related to the acquisition of AAP, charges related to certain contractual severance agreements (net, recorded within salaries and related costs), leadership transition severance costs (recorded within salaries and related costs), charges related to our voluntary separation incentive programs (net), CEO separation and transition costs, restructuring charges (net), and special charges (net). |
(iii) | Adjusted Net Income is defined as net income attributable to Sotheby's excluding the after-tax impact of earn-out compensation expense related to the acquisition of AAP, charges related to certain contractual severance agreements (net, recorded within salaries and related costs), leadership transition severance costs (recorded within salaries and related costs), charges related to our voluntary separation incentive programs (net), CEO separation and transition costs, restructuring charges (net), special charges (net), and losses associated with the extinguishment of debt, as well as income tax charges associated with the repatriation of pre-2014 foreign earnings. |
(iv) | Adjusted Diluted Earnings Per Share is defined as diluted earnings per share excluding the after-tax per share impact of earn-out compensation expense related to the acquisition of AAP, charges related to certain contractual severance agreements (net, recorded within salaries and related costs), leadership transition severance costs (recorded within salaries and related costs), charges related to our voluntary separation incentive programs (net), CEO separation and transition costs, restructuring charges (net), special charges (net), and losses associated with the extinguishment of debt, as well as income tax charges associated with the repatriation of pre-2014 foreign earnings. |
(v) | EBITDA is defined as net income attributable to Sotheby's excluding income tax expense, interest expense, interest income, the cost of finance revenues, and depreciation and amortization. |
(vi) | Adjusted EBITDA is defined as EBITDA excluding earn-out compensation expense related to the acquisition of AAP, charges related to certain contractual severance agreements (net, recorded within salaries and related costs), leadership transition severance costs (recorded within salaries and related costs), charges related to our voluntary separation incentive programs (net), CEO separation and transition costs, restructuring charges (net), special charges (net), and losses associated with the extinguishment of debt. |
(vii) | EBITDA Margin is defined as EBITDA as a percentage of total revenues. |
(viii) | Adjusted EBITDA Margin is defined as Adjusted EBITDA as a percentage of total revenues. |
We use Adjusted Expenses to assess our cost structure when compared to prior periods and on a forward-looking basis, particularly in evaluating performance against our cost control initiatives. Adjusted Expenses provides insight into our ongoing cost structure, absent the interest costs associated with funding the SFS loan portfolio and the cost of inventory sales, which are unpredictable and can vary significantly from one period to the next, and costs associated with unusual items.
51
Adjusted Operating Income, Adjusted Net Income, Adjusted Diluted Earnings Per Share, EBITDA, Adjusted EBITDA, EBITDA Margin, and Adjusted EBITDA Margin are important supplemental measures used in our financial and operational decision making processes, for internal reporting, and as part of our forecasting and budgeting processes, as they provide helpful measures of our core operations. These measures allow us to view operating trends, perform analytical comparisons, and benchmark performance between periods. We also believe that these measures may be used by securities analysts, investors, financial institutions, and other interested parties in their evaluation of our performance.
The following is a reconciliation of total expenses to Adjusted Expenses for the years ended December 31, 2016, 2015, and 2014 (in thousands of dollars):
2016 | 2015 | 2014 | ||||||||||
Total expenses | $ | 682,761 | $ | 759,773 | $ | 712,009 | ||||||
Subtract: Cost of inventory sales | 81,782 | 111,090 | 68,037 | |||||||||
Subtract: Cost of finance revenues | 17,738 | 15,780 | 8,740 | |||||||||
Subtract: Acquisition earn-out compensation expense | 35,000 | — | — | |||||||||
Subtract: Contractual severance agreement charges (net) | 7,354 | — | — | |||||||||
Subtract: Leadership transition severance costs | — | 13,251 | — | |||||||||
Subtract: Voluntary separation incentive program charges (net) | (610 | ) | 36,938 | — | ||||||||
Subtract: CEO separation and transition costs | — | 4,232 | 7,591 | |||||||||
Subtract: Restructuring charges (net) | — | (972 | ) | 14,238 | ||||||||
Subtract: Special charges (net) | — | — | 20,008 | |||||||||
Adjusted Expenses | $ | 541,497 | $ | 579,454 | $ | 593,395 | ||||||
The following is a reconciliation of operating income to Adjusted Operating Income for the years ended December 31, 2016, 2015, and 2014 (in thousands of dollars):
2016 | 2015 | 2014 | ||||||||||
Operating income | $ | 122,616 | $ | 201,721 | $ | 226,044 | ||||||
Add: Acquisition earn-out compensation expense | 35,000 | — | — | |||||||||
Add: Contractual severance agreement charges (net) | 7,354 | — | — | |||||||||
Add: Leadership transition severance costs | — | 13,251 | — | |||||||||
Add: Voluntary separation incentive program charges (net) | (610 | ) | 36,938 | — | ||||||||
Add: CEO separation and transition costs | — | 4,232 | 7,591 | |||||||||
Add: Restructuring charges (net) | — | (972 | ) | 14,238 | ||||||||
Add: Special charges (net) | — | — | 20,008 | |||||||||
Adjusted Operating Income | $ | 164,360 | $ | 255,170 | $ | 267,881 | ||||||
52
The following is a reconciliation of net income attributable to Sotheby's to Adjusted Net Income for the years ended December 31, 2016, 2015, 2014, 2013, and 2012 (in thousands of dollars):
2016 | 2015 | 2014 | 2013 | 2012 | ||||||||||||||||
Net income attributable to Sotheby's | $ | 74,112 | $ | 43,727 | $ | 117,795 | $ | 130,006 | $ | 108,292 | ||||||||||
Add: Acquisition earn-out compensation expense, net of tax of ($13,615), $0, $0, $0, and $0 | 21,385 | — | — | — | — | |||||||||||||||
Add: Contractual severance agreement charges (net), net of tax of ($2,852), $0, $0, $0, and $0 | 4,502 | — | — | — | — | |||||||||||||||
Add: Leadership transition severance costs, net of tax of $0, ($5,167), $0, $0, and $0 | — | 8,084 | — | — | — | |||||||||||||||
Add: Voluntary separation incentive program charges (net), net of tax of $227, ($13,298), $0, $0, and $0 | (383 | ) | 23,640 | — | — | — | ||||||||||||||
Add: CEO separation and transition costs, net of tax of $0, ($1,651), ($3,138), $0, and $0 | — | 2,581 | 4,453 | — | — | |||||||||||||||
Add: Restructuring charges (net), net of tax of $0, $339, ($5,221), $0, and $0 | — | (633 | ) | 9,017 | — | — | ||||||||||||||
Add: Special charges (net), net of tax of $0, $0, ($8,875), ($617), and $0 | — | — | 11,133 | 755 | — | |||||||||||||||
Add: Extinguishment of debt, net of tax of $0, $0, $0, $0, and ($6,759) | — | — | — | — | 8,261 | |||||||||||||||
Add: Income tax expense related to repatriation of pre-2014 foreign earnings | — | 65,732 | — | 8,700 | — | |||||||||||||||
Adjusted Net Income | $ | 99,616 | $ | 143,131 | $ | 142,398 | $ | 139,461 | $ | 116,553 | ||||||||||
The income tax effect of each line item in the reconciliation above of net income attributable to Sotheby's to Adjusted Net Income is computed using the relevant jurisdictional tax rate for each item.
The following is a reconciliation of diluted earnings per share to Adjusted Diluted Earnings Per Share for the years ended December 31, 2016, 2015, 2014, 2013, and 2012:
2016 | 2015 | 2014 | 2013 | 2012 | ||||||||||||||||
Diluted earnings per share | $ | 1.27 | $ | 0.63 | $ | 1.68 | $ | 1.88 | $ | 1.57 | ||||||||||
Add: Acquisition earn-out compensation expense, per share | 0.37 | — | — | — | — | |||||||||||||||
Add: Contractual severance agreement charges (net), per share | 0.08 | — | — | — | — | |||||||||||||||
Add: Leadership transition severance costs, per share | — | 0.11 | — | — | — | |||||||||||||||
Add: Voluntary separation incentive program charges (net), per share | (0.01 | ) | 0.34 | — | — | — | ||||||||||||||
Add: CEO separation and transition costs, per share | — | 0.04 | 0.06 | — | — | |||||||||||||||
Add: Restructuring charges (net), per share | — | (0.01 | ) | 0.13 | — | — | ||||||||||||||
Add: Special charges (net), per share | — | — | 0.16 | 0.01 | — | |||||||||||||||
Add: Extinguishment of debt, per share | — | — | — | — | 0.12 | |||||||||||||||
Add: Income tax expense related to repatriation of pre-2014 foreign earnings, per share | — | 0.96 | — | 0.13 | — | |||||||||||||||
Adjusted Diluted Earnings Per Share | $ | 1.71 | $ | 2.07 | $ | 2.03 | $ | 2.02 | $ | 1.69 | ||||||||||
53
The following is a reconciliation of net income attributable to Sotheby's to EBITDA and Adjusted EBITDA for the years ended December 31, 2016, 2015, 2014, 2013, and 2012 (in thousands of dollars):
2016 | 2015 | 2014 | 2013 | 2012 | |||||||||||||||
Net income attributable to Sotheby's | $ | 74,112 | $ | 43,727 | $ | 117,795 | $ | 130,006 | $ | 108,292 | |||||||||
Add: Income tax expense | 25,957 | 131,145 | 75,761 | 55,702 | 51,395 | ||||||||||||||
Add: Income tax expense related to equity investees | — | — | 599 | 12 | 132 | ||||||||||||||
Subtract: Interest income | 1,294 | 1,776 | 1,883 | 2,801 | 1,550 | ||||||||||||||
Add: Interest expense | 30,310 | 32,745 | 35,189 | 42,712 | 44,429 | ||||||||||||||
Add: Cost of finance revenues | 17,738 | 15,780 | 8,740 | — | — | ||||||||||||||
Add: Depreciation and amortization | 21,817 | 19,481 | 20,575 | 19,435 | 17,942 | ||||||||||||||
EBITDA | 168,640 | 241,102 | 256,776 | 245,066 | 220,640 | ||||||||||||||
Add: Acquisition earn-out compensation expense | 35,000 | — | — | — | — | ||||||||||||||
Add: Contractual severance agreement charges (net) | 7,354 | — | — | — | — | ||||||||||||||
Add: Leadership transition severance costs | — | 13,251 | — | — | — | ||||||||||||||
Add: Voluntary separation incentive program charges (net) | (610 | ) | 36,938 | — | — | — | |||||||||||||
Add: CEO separation and transition costs | — | 4,232 | 7,591 | — | — | ||||||||||||||
Add: Restructuring charges (net) | — | (972 | ) | 14,238 | — | (2 | ) | ||||||||||||
Add: Special charges (net) | — | — | 20,008 | 1,372 | — | ||||||||||||||
Add: Extinguishment of debt | — | — | — | — | 15,020 | ||||||||||||||
Adjusted EBITDA | $ | 210,384 | $ | 294,551 | $ | 298,613 | $ | 246,438 | $ | 235,658 | |||||||||
CASH FLOWS FOR THE YEARS ENDED DECEMBER 31, 2016, 2015, and 2014
This discussion should be read in conjunction with our Consolidated Statements of Cash Flows for the years ended December 31, 2016, 2015, and 2014.
Net Cash Provided by Operating Activities—We are predominantly an agency business that collects and remits cash on behalf of our clients. Accordingly, the net amount of cash provided or used in a period by our operating activities is significantly influenced by the timing of auction and private sale settlements. As discussed in Note 4 of Notes to Consolidated Financial Statements, under our standard auction payment terms, the purchase price is due from the buyer no more than 30 days after the sale date, with the net proceeds due to the consignor 35 days after the sale date. Accordingly, it is not unusual for us to hold significant balances of consignor net sale proceeds at the end of a quarterly reporting period that are disbursed soon thereafter. Additionally, we sometimes provide extended payment terms to an auction or private sale buyer. For auctions, the extent to which extended payment terms are provided can vary considerably from selling season to selling season. In certain instances, and subject to management approval under our internal corporate governance policy, we may pay the net sale proceeds to the consignor before payment is collected from the buyer, with the collection from the buyer sometimes occurring after the current balance sheet date. The amount of net cash provided or used by our operating activities in a reporting period is also a function of our net income or loss, the timing of payments made to vendors, the timing of compensation-related payments, the timing and extent of cash flows related to inventory activities, and the timing of the collection and/or payment of tax-related receivables and payables.
For the year ended December 31, 2016, net cash provided by operating activities of approximately $158.4 million is principally attributable to net income of $74.1 million for the period and net proceeds received from the sale of inventory, including $34.2 million received upon the sale of an undivided 50% ownership interest in a Fancy Vivid Pink Diamond (see Note 11 of Notes to Consolidated Financial Statements).
For the year ended December 31, 2015, net cash provided by operating activities of $155.1 million was principally a function of our net income for the period, partially offset by the funding of inventory acquisitions. Notably, net income in 2015 included the impact of several significant non-cash charges, including a $65.7 million charge recorded in the fourth quarter of 2015 associated with the repatriation of accumulated foreign earnings. See "Income Tax Expense" above within Results of Operations for the Years Ended December 31, 2015 and 2014" and "Liquidity and Capital Resources" below.
54
For the year ended December 31, 2014, net cash provided by operating activities of $44.3 million was principally attributable to our net income of $117.8 million, partially offset by a net cash outflow of $99.2 million associated with the settlement of auction and private sale transactions during the period. This net cash outflow was influenced, in part, by sales proceeds from certain high-value sales that were collected from buyers late in 2013 for which payment to the consignor was not made until early in 2014. Cash flows from operating activities in 2014 were also impacted by the funding of inventory acquisitions as a result of guaranteed property that failed to sell at auction and other opportunistic investments.
Net Cash Used by Investing Activities—For the year ended December 31, 2016, the net cash used by investing activities of $120.4 million is primarily attributable to the cash used to acquire AAP ($50.7 million, net of cash acquired), $21.4 million in capital expenditures related to various office renovations and digital technology initiatives, and the net funding of client loans ($15.4 million). Cash outflows from investing activities also include a $26.1 million increase in restricted cash, due in part to $15 million in consignor funds held in escrow pending the final settlement of a sale. See Note 3 of Notes to Consolidated Financial Statements for information related to the acquisition of AAP.
For the year ended December 31, 2015, the net cash used by investing activities of $16.7 million was primarily attributable to our acquisition of a 25% ownership interest in RM Auctions for $30.7 million and capital expenditures of $11.3 million. These investing cash outflows were partially offset by the collection of auction guarantee advances during the year and $4.5 million of distributions received from AMA, an equity method investee. See Note 5 of Notes to Consolidated Financial Statements for information on our investments in RM Auctions and AMA.
For the year ended December 31, 2014, the net cash used by investing activities of $128.6 million was due to the growth of the SFS loan portfolio and also included capital expenditures of $10.9 million.
Net Cash (Used) Provided by Financing Activities—For the year ended December 31, 2016, net cash used by financing activities of $356.3 million is predominantly due to common stock repurchases of $359.9 million. See Note 14 of Notes to Consolidated Financial Statements.
For the year ended December 31, 2015, net cash provided by financing activities of $25.7 million was largely due to $96.5 million in net borrowings under the SFS Credit Facility and net proceeds of approximately $98 million from the refinancing of our previous mortgage on the York Property in July 2015. These cash inflows were partially offset by common stock repurchases of $125 million, dividend and dividend equivalent payments of $29.8 million, and the funding of employee tax obligations related to share-based payments of $9 million.
For the year ended December 31, 2014, net cash provided by financing activities of $72.2 million was largely due to $445 million in net borrowings under the SFS Credit Facility. This cash inflow was largely offset by the payment of a $300 million special dividend, common stock repurchases of $25 million, quarterly dividend payments of $27.6 million, and the funding of employee tax obligations related to share-based payments of $11.8 million.
55
CONTRACTUAL OBLIGATIONS AND COMMITMENTS
The following table summarizes our material contractual obligations and commitments as of December 31, 2016 (in thousands of dollars):
Payments Due by Year | |||||||||||||||||||
Total | 2017 | 2018 to 2019 | 2020 to 2021 | Thereafter | |||||||||||||||
Debt (a): | |||||||||||||||||||
York Property Mortgage: | |||||||||||||||||||
Principal payments | $ | 315,406 | $ | 7,639 | $ | 16,313 | $ | 17,759 | $ | 273,695 | |||||||||
Interest payments | 67,262 | 11,261 | 25,370 | 23,968 | 6,663 | ||||||||||||||
Sub-total | 382,668 | 18,900 | 41,683 | 41,727 | 280,358 | ||||||||||||||
2022 Senior Notes: | |||||||||||||||||||
Principal payments | 300,000 | — | — | — | 300,000 | ||||||||||||||
Interest payments | 94,500 | 15,750 | 31,500 | 31,500 | 15,750 | ||||||||||||||
Sub-total | 394,500 | 15,750 | 31,500 | 31,500 | 315,750 | ||||||||||||||
Revolving credit facility borrowings | 565,000 | — | — | 565,000 | — | ||||||||||||||
Total debt and interest payments | 1,342,168 | 34,650 | 73,183 | 638,227 | 596,108 | ||||||||||||||
Other commitments: | |||||||||||||||||||
Operating lease obligations (b) | 68,071 | 15,036 | 13,787 | 11,072 | 28,176 | ||||||||||||||
Compensation arrangements (c) | 10,331 | 4,681 | 5,300 | 350 | — | ||||||||||||||
Acquisition earn-out consideration (d) | 35,000 | 8,750 | 17,500 | 8,750 | — | ||||||||||||||
Auction guarantees (e) | 17,312 | 17,312 | — | — | — | ||||||||||||||
Unfunded loan commitments (f) | 14,665 | 14,665 | — | — | — | ||||||||||||||
Uncertain tax positions (g) | 370 | 370 | — | — | — | ||||||||||||||
Total other commitments | 145,749 | 60,814 | 19,087 | 11,422 | 28,176 | ||||||||||||||
Total | $ | 1,487,917 | $ | 95,464 | $ | 92,270 | $ | 649,649 | $ | 624,284 | |||||||||
(a) | See Note 9 of Notes to Consolidated Financial Statements for information related to the York Property Mortgage, the 2022 Senior Notes, and our revolving credit facility. The York Property Mortgage bears interest based on the one-month LIBOR rate (the "LIBOR rate") plus a spread of 2.25%. Due to the variable interest rate associated with the York Property Mortgage, we entered into interest rate protection agreements consisting of a two-year interest rate swap and a five-year interest rate collar. These interest rate protection agreements effectively hedge the LIBOR rate on the entire outstanding principal balance of the York Property Mortgage at an annual rate equal to 0.877% for the first two years, and then at an annual rate of no less than 1.917%, but no more than 3.75% for the remainder of the seven-year term. In consideration of the interest rate protection agreements, the table above assumes that the annual interest rate for the first two years of the York Property Mortgage will be approximately 3.127%, and then will be at the interest rate collar's floor rate of 4.167% for the remainder of the seven-year term. See Note 10 of Notes to Consolidated Financial Statements for additional information related to the interest rate protection agreements. |
(b) | These amounts represent undiscounted future minimum rental commitments under non-cancellable operating leases. |
(c) | These amounts represent the remaining commitment for future salaries and other cash compensation related to compensation arrangements with certain senior employees, excluding any participation in our incentive compensation and share-based payment programs. |
(d) | In conjunction with the acquisition of AAP on January 11, 2016, we agreed to make future earn-out payments to the former principals of AAP not to exceed $35 million in the aggregate, contingent on the achievement of a level of cumulative financial performance within the Impressionist, Modern and Contemporary Art collecting categories, as well as from AAP's art advisory business. The cumulative financial performance target associated with this earn-out arrangement was met in the fourth quarter of 2016. The $35 million owed under the earn-out arrangement will be paid in four annual increments of $8.75 million over the period between February 2017 and January 2020. See Note 3 of Notes to Consolidated Financial Statements. |
(e) | This amount represents the minimum guaranteed price associated with auction guarantees outstanding as of December 31, 2016, net of amounts advanced. See Note 19 of Notes to Consolidated Financial Statements. |
(f) Represents unfunded commitments to extend additional credit through SFS. See Note 4 of Notes to Consolidated Financial Statements.
56
(g) | Excludes the $21.1 million liability recorded for uncertain tax positions that would be settled by cash payments to the respective taxing authorities, which are classified as long-term liabilities on our Consolidated Balance Sheets as of December 31, 2016. This liability is excluded from the table above because we are unable to make reliable estimates of the period of settlement with the various taxing authorities. See Note 17 of Notes to Consolidated Financial Statements. |
OFF-BALANCE SHEET ARRANGEMENTS
For information related to off-balance sheet arrangements: (i) see Note 4 of Notes to Consolidated Financial Statements, which discusses unfunded SFS loan commitments; (ii) see Note 5 of Notes to Consolidated Financial Statements, which discusses a contingent obligation related to our interest in an equity method investment; (iii) see Note 18 of Notes to Consolidated Financial Statements, which discusses guarantees of collection; (iv) see Note 19 of Notes to Consolidated Financial Statements, which discusses auction guarantees; and (v) see Note 20 of Notes to Consolidated Financial Statements, which discusses operating lease obligations.
DERIVATIVE FINANCIAL INSTRUMENTS
For information related to derivative financial instruments, see Note 10 of Notes to Consolidated Financial Statements.
CONTINGENCIES
For information related to contingencies: (i) see Note 5 of Notes to Consolidated Financial Statements, which discusses a contingent obligation related to our interest in an equity method investment; (ii) see Note 17 of Notes to Consolidated Financial Statements, which discusses income tax contingencies; (iii) see Note 18 of Notes to Consolidated Financial Statements, which discusses legal and other tax contingencies; and (iv) see Note 19 of Notes to Consolidated Financial Statements, which discusses auction guarantees.
UNCERTAIN TAX POSITIONS
For information related to uncertain tax positions, see Note 17 of Notes to Consolidated Financial Statements.
LIQUIDITY AND CAPITAL RESOURCES
Overview—As of December 31, 2016, we held cash and cash equivalents of $496 million, with $162.9 million held in the U.S. and $333.1 million held by our foreign subsidiaries (see “Repatriation of Foreign Earnings” below). After taking into account funds held that are owed to consignors, we estimate available cash balances to be approximately $355 million as of December 31, 2016.
In addition to our available cash balances, we also have access to a revolving credit facility to support the separate capital structures of our Agency segment and SFS. As of December 31, 2016, our revolving credit facility had available borrowing capacity of $169.5 million. (See Note 9 of Notes to Consolidated Financial Statements for detailed information regarding the terms and conditions of our revolving credit facility.)
These cash balances and revolving credit facility borrowings are available to support our various capital needs, including the liquidity required to support our recurring business needs, capital required for the pursuit of growth opportunities, and capital to mitigate the risk of a cyclical downturn in the global art market. Importantly, the assessment of our capital needs also takes into consideration the risks associated with our use of auction guarantees and their potential impact on our liquidity. We believe our cash balances and available revolving credit facility borrowings provide an appropriate level of capital to mitigate the risk of a cyclical downturn in the global art market .
Repatriation of Foreign Earnings—Prior to the fourth quarter of 2015, based on our projections and planned uses of U.S. and foreign earnings, we had intended that approximately $400 million of accumulated foreign earnings relating to years prior to 2014 would be indefinitely reinvested outside of the U.S. As a result, we did not initially record deferred income taxes on these earnings in our Consolidated Financial Statements. In the fourth quarter of 2015, however, in consideration of the expansion of our common stock repurchase program (see Note 14 of Notes to Consolidated Financial Statements), as well as the need for cash in the U.S. to fund other corporate strategic initiatives, we reassessed our U.S. and foreign cash needs and concluded that these foreign earnings would instead be repatriated to the U.S. in the foreseeable future. Consequently, in the fourth quarter of 2015, we recognized a liability for the deferred income taxes on these foreign earnings. In addition, we had accrued incremental taxes during 2014 and 2015 on approximately $200 million of foreign earnings for those years.
As of December 31, 2016, approximately $330 million of the foreign earnings discussed above had been repatriated and used, in part, to fund common stock repurchases during 2016. We expect that additional repatriations will be made, though the specific timing of any further repatriation of foreign earnings and the cash payment of the associated taxes is currently uncertain and is being evaluated. See statement on Forward Looking Statements.
57
Based on our current projections and planned uses of U.S. and foreign cash, we believe that our cash balances and earnings in the U.S., as well as the amount of unremitted foreign earnings for which a deferred tax liability has been recorded, will be sufficient to satisfy our current cash needs in the U.S. Accordingly, we plan to indefinitely reinvest the prospective earnings of our foreign subsidiaries, except those in the U.K., outside of the U.S. See statement on Forward Looking Statements and "Income Tax Expense" above.
Assessment of Liquidity and Capital Requirements—We have separate capital structures and financial policies for our Agency segment and SFS. The Agency segment generally relies on existing cash balances (including amounts collected on behalf of and owed to consignors), operating cash flows, and revolving credit facility borrowings, if needed, to meet its liquidity and capital requirements. The timing and extent of any revolving credit facility borrowings by the Agency segment is dependent upon a number of factors including, but not limited to, the cyclical nature of the global art market, the seasonality of the art auction market, the timing of auction and private sale settlements, the potential funding of auction guarantees, the pursuit of business opportunities and growth initiatives, and the timing of the repatriation of foreign earnings.
SFS predominantly relies on revolving credit facility borrowings to fund client loans. To a lesser extent, cash balances are also used to fund a portion of the SFS loan portfolio, as appropriate. The timing and extent of revolving credit facility borrowings by SFS is dependent upon a number of factors including, but not limited to, the demand for art-related financing, which can be significantly influenced by overall economic conditions and by the often unpredictable financial requirements of owners of major art collections, the timing of the funding of new client loans, and the timing of the settlement of existing client loans.
Our short-term and long-term operating needs and capital requirements include: (i) the funding of net sales proceeds to consignors when unmatched extended payment terms are granted to auction or private sale buyers (see Note 4 of Notes to Consolidated Financial Statements); (ii) the potential funding of auction guarantees (see Note 19 of Notes to Consolidated Financial Statements); (iii) the funding of potential client loans; (iv) the potential repayment of revolving credit facility borrowings; (v) the funding of capital expenditures; (vi) the funding of other possible business initiatives and/or investments; (vii) the funding of potential common stock repurchases (see Note 14 of Notes to Consolidated Financial Statements); and (viii) the funding of the other short-term and long-term commitments summarized in the table of contractual obligations and commitments above. See statement on Forward Looking Statements.
We believe that operating cash flows, existing cash balances, and revolving credit facility borrowings will be adequate to support our anticipated short and long-term commitments, operating needs and capital requirements, as well as provide sufficient capital to mitigate the risk of cyclical downturns in the global art market through the August 22, 2020 expiration of our revolving credit facility. See statement on Forward Looking Statements.
ACQUISITION OF ART AGENCY, PARTNERS
See Note 3 of Notes to Consolidated Financial Statements for information related to our acquisition of Art Agency, Partners.
RECENT ACCOUNTING STANDARDS NOT YET ADOPTED
See Note 28 of Notes to Consolidated Financial Statements for a discussion of recent accounting standards that have not yet been adopted.
58
FORWARD LOOKING STATEMENTS
This Form 10-K contains certain forward looking statements, as such term is defined in Section 21E of the Securities Exchange Act of 1934, as amended, relating to future events and Sotheby's financial performance. Such statements are only predictions and involve risks and uncertainties, resulting in the possibility that the actual events or performance will differ materially from such predictions. Major factors, which we believe could cause the actual results to differ materially from the predicted results in the “forward looking statements” include, but are not limited to:
• | Changes in the global economy, the financial markets, and political conditions of various countries; |
• | A change in the level of competition in the global art market; |
• | Uncertainty regarding the amount and quality of property available for consignment; |
• | Changes in trends in the art market as to which collecting categories and artists are most sought after and in the collecting preferences of individual collectors; |
• | The unpredictable demand for art-related financing; |
• | Our ability to maintain strong relationships with art collectors; |
• | An adverse change in the financial health and/or creditworthiness of our clients; |
• | Our ability to retain key personnel; |
• | Our ability to successfully execute business plans and strategic initiatives; |
• | Our ability to accurately estimate the value of works of art held in inventory or as collateral for SFS loans, as well as those offered under an auction guarantee; |
• | An adverse change in the financial health and/or creditworthiness of the counterparties to our auction guarantee risk and reward sharing arrangements; |
• | Changes in laws and regulations, including those related to income taxes and sales, use, value-added, and other indirect taxes; |
• | Changes in foreign currency exchange rates; |
• | Volatility in the share price of Sotheby's common stock; and |
• | The ability of Sotheby's and its third party service providers to adequately protect their information systems and the client, employee, and company data maintained in those systems. |
See Part I, Item 1A, "Risk Factors."
ITEM 7A: QUANTITATIVE AND QUALITATIVE DISCLOSURES ABOUT MARKET RISK
We continually evaluate the market risk associated with our financial instruments in the normal course of our business. As of December 31, 2016, our material financial instruments include: (i) cash and cash equivalents; (ii) restricted cash; (iii) notes receivable; (iv) credit facility borrowings; (v) the York Property Mortgage; (vi) various derivative financial instruments, including interest rate swaps, an interest rate collar, and outstanding forward exchange contracts, as discussed in more detail below; and (vii) long-term debt. See Note 4 of Notes to Consolidated Financial Statements for information related to notes receivable. See Note 9 of Notes to Consolidated Financial Statements for information related to credit facility borrowings, the York Property Mortgage, and long-term debt. See Note 10 of Notes to Consolidated Financial Statements for information regarding our derivative financial instruments.
59
Interest Rate Risk—On July 1, 2015, we entered into a seven-year, $325 million mortgage loan to refinance our previous mortgage loan on the York Property. The York Property Mortgage bears interest based on the one-month LIBOR rate plus a spread of 2.25% and is being amortized based on a twenty-five-year mortgage-style amortization schedule over its seven-year term. In connection with the York Property Mortgage, we entered into interest rate protection agreements secured by the York Property, consisting of a two-year interest rate swap (the "Mortgage Swap"), effective as of July 1, 2015, and a five-year interest rate collar (the "Mortgage Collar"), effective as of July 1, 2017. The Mortgage Swap and the Mortgage Collar each have a notional amount equal to the applicable principal balance of the York Property Mortgage and have an identical amortization schedule to that of the mortgage. These interest rate protection agreements effectively hedge the LIBOR rate on the entire outstanding principal balance of the York Property Mortgage at an annual rate equal to 0.877% for the first two years, and then at an annual rate of no less than 1.917%, but no more than 3.75%, for the remainder of the seven-year term. After taking into account the interest rate protection agreements, the annual interest rate for the first two years of the York Property Mortgage will be approximately 3.127% and then will be between a floor of 4.167% and a cap of 6% for the remainder of the seven-year term. As of December 31, 2016, the notional value of the Mortgage Swap was $314.8 million and the notional value of the Mortgage Collar was $310.3 million.
On November 21, 2016, we entered into a two-year interest rate swap agreement (the “SFS Swap”) to eliminate the variability in expected cash outflows associated with the one-month LIBOR indexed interest payments owed on $63 million of SFS Credit Facility borrowings. As of December 31, 2016, the notional value of the SFS Swap was $63 million.
We believe that the interest rate risk associated with our other financial instruments is minimal as a hypothetical 10% increase or decrease in interest rates is immaterial to our cash flow, earnings, and the fair value of our financial instruments.
We are exposed to credit-related risks in the event of nonperformance by the counterparties to the Mortgage Swap, the SFS Swap, and the Mortgage Collar. We do not expect any of these counterparties to fail to meet their obligations, given their high short-term (A1/P1) credit ratings.
Foreign Currency Exchange Rate Risk—We utilize forward contracts to hedge cash flow exposures related to foreign currency exchange rate movements, which primarily arise from short-term foreign currency denominated intercompany balances and, to a much lesser extent, foreign currency denominated client payable balances, as well as foreign currency denominated auction guarantee obligations. Such forward exchange contracts are typically short-term with settlement dates less than six months from their inception. All derivative financial instruments are entered into by our global treasury function, which is responsible for monitoring and managing our exposure to foreign currency exchange rate movements. As of December 31, 2016, the notional value of outstanding forward exchange contracts used to hedge such cash flow exposures was $472.6 million.
As of December 31, 2016, our foreign subsidiaries held approximately $341.6 million in foreign currency denominated cash balances. A hypothetical 10% strengthening or weakening of the U.S. dollar relative to all other currencies would result in a decrease or increase in our cash flow of approximately $34.2 million related to such foreign currency balances.
As discussed in "Liquidity and Capital Resources" above, we expect to repatriate certain accumulated foreign earnings at some point in the future. These accumulated foreign earnings represented, at that time, almost the entire value of our net investments in the subsidiaries from which the earnings are being repatriated. As a result, we are exposed to variability in the U.S. Dollar equivalent of these net investments and, by extension, the U.S. Dollar equivalent of any foreign earnings repatriated to the U.S. due to potential changes in foreign currency exchange rates. To mitigate this risk, we have entered into corresponding foreign currency forward exchange contracts, which have an aggregate notional value of $213.8 million as of December 31, 2016.
We are exposed to credit-related risks in the event of nonperformance by the three counterparties to our outstanding forward exchange contracts. We do not expect any of these counterparties to fail to meet their obligations, given their high short-term (A1/P1) credit ratings.
60
ITEM 8: FINANCIAL STATEMENTS AND SUPPLEMENTARY DATA
REPORT OF INDEPENDENT REGISTERED PUBLIC ACCOUNTING FIRM
To the Board of Directors and Stockholders of
Sotheby’s
New York, New York
We have audited the accompanying consolidated balance sheets of Sotheby’s and subsidiaries (the "Company") as of December 31, 2016 and 2015, and the related consolidated statements of income, comprehensive income, cash flows, and changes in shareholders' equity, for each of the three years in the period ended December 31, 2016. Our audits also included the financial statement schedule listed in the Index at Item 15. These consolidated financial statements and financial statement schedule are the responsibility of the Company's management. Our responsibility is to express an opinion on the consolidated financial statements and financial statement schedule based on our audits.
We conducted our audits in accordance with the standards of the Public Company Accounting Oversight Board (United States). Those standards require that we plan and perform the audit to obtain reasonable assurance about whether the financial statements are free of material misstatement. An audit includes examining, on a test basis, evidence supporting the amounts and disclosures in the financial statements. An audit also includes assessing the accounting principles used and significant estimates made by management, as well as evaluating the overall financial statement presentation. We believe that our audits provide a reasonable basis for our opinion.
In our opinion, such consolidated financial statements present fairly, in all material respects, the financial position of Sotheby’s and subsidiaries as of December 31, 2016 and 2015, and the results of their operations and their cash flows for each of the three years in the period ended December 31, 2016, in conformity with accounting principles generally accepted in the United States of America. Also, in our opinion, such financial statement schedule, when considered in relation to the basic consolidated financial statements taken as a whole, present fairly, in all material respects, the information set forth therein.
We have also audited, in accordance with the standards of the Public Company Accounting Oversight Board (United States), the Company's internal control over financial reporting as of December 31, 2016, based on the criteria established in Internal Control - Integrated Framework (2013) issued by the Committee of Sponsoring Organizations of the Treadway Commission and our report dated February 27, 2017 expressed an unqualified opinion on the Company's internal control over financial reporting.
/S/ DELOITTE & TOUCHE LLP
New York, New York
February 27, 2017
61
SOTHEBY'S
CONSOLIDATED INCOME STATEMENTS
(Thousands of dollars, except per share data)
Year Ended December 31, | 2016 | 2015 | 2014 | |||||||||
Revenues: | ||||||||||||
Agency commissions and fees | $ | 671,833 | $ | 791,920 | $ | 825,126 | ||||||
Inventory sales | 62,863 | 108,699 | 69,958 | |||||||||
Finance | 52,716 | 50,489 | 33,013 | |||||||||
Other | 17,965 | 10,386 | 9,956 | |||||||||
Total revenues | 805,377 | 961,494 | 938,053 | |||||||||
Expenses: | ||||||||||||
Agency direct costs | 73,324 | 91,919 | 86,524 | |||||||||
Cost of inventory sales | 81,782 | 111,090 | 68,037 | |||||||||
Cost of finance revenues | 17,738 | 15,780 | 8,740 | |||||||||
Marketing | 19,695 | 19,332 | 16,566 | |||||||||
Salaries and related | 307,659 | 302,825 | 310,934 | |||||||||
General and administrative | 161,356 | 159,148 | 158,796 | |||||||||
Depreciation and amortization | 21,817 | 19,481 | 20,575 | |||||||||
Voluntary separation incentive programs (net) (see Note 22) | (610 | ) | 36,938 | — | ||||||||
CEO separation and transition costs (see Note 23) | — | 4,232 | 7,591 | |||||||||
Restructuring charges (net) (see Note 24) | — | (972 | ) | 14,238 | ||||||||
Special charges (net) (see Note 25) | — | — | 20,008 | |||||||||
Total expenses | 682,761 | 759,773 | 712,009 | |||||||||
Operating income | 122,616 | 201,721 | 226,044 | |||||||||
Interest income | 1,294 | 1,776 | 1,883 | |||||||||
Interest expense | (30,310 | ) | (32,745 | ) | (35,189 | ) | ||||||
Other income (expense) | 3,134 | (1,453 | ) | 283 | ||||||||
Income before taxes | 96,734 | 169,299 | 193,021 | |||||||||
Income tax expense | 25,957 | 131,145 | 75,761 | |||||||||
Equity in earnings of investees | 3,262 | 5,327 | 732 | |||||||||
Net income | 74,039 | 43,481 | 117,992 | |||||||||
Less: Net (loss) income attributable to noncontrolling interest | (73 | ) | (246 | ) | 197 | |||||||
Net income attributable to Sotheby's | $ | 74,112 | $ | 43,727 | $ | 117,795 | ||||||
Basic earnings per share - Sotheby's common shareholders | $ | 1.28 | $ | 0.64 | $ | 1.69 | ||||||
Diluted earnings per share - Sotheby's common shareholders | $ | 1.27 | $ | 0.63 | $ | 1.68 | ||||||
Cash dividends declared per common share | $ | — | $ | 0.40 | $ | 4.74 | ||||||
See accompanying Notes to Consolidated Financial Statements
62
SOTHEBY'S
CONSOLIDATED STATEMENTS OF COMPREHENSIVE INCOME
(Thousands of dollars)
Year Ended December 31, | 2016 | 2015 | 2014 | |||||||||
Net income | $ | 74,039 | $ | 43,481 | $ | 117,992 | ||||||
Other comprehensive (loss) income: | ||||||||||||
Currency translation adjustments | (34,899 | ) | (17,959 | ) | (29,403 | ) | ||||||
Cash flow hedges | 642 | (4,306 | ) | — | ||||||||
Net investment hedges | 16,618 | — | — | |||||||||
Defined benefit pension plan | (6,515 | ) | 32,827 | (7,910 | ) | |||||||
Total other comprehensive (loss) income | (24,154 | ) | 10,562 | (37,313 | ) | |||||||
Comprehensive income | 49,885 | 54,043 | 80,679 | |||||||||
Less: Comprehensive (loss) income attributable to noncontrolling interests | (73 | ) | (246 | ) | 197 | |||||||
Comprehensive income attributable to Sotheby's | $ | 49,958 | $ | 54,289 | $ | 80,482 | ||||||
See accompanying Notes to Consolidated Financial Statements
63
SOTHEBY'S CONSOLIDATED BALANCE SHEETS (Thousands of dollars) | ||||||||
December 31, | 2016 | 2015 | ||||||
Assets | ||||||||
Current assets: | ||||||||
Cash and cash equivalents | $ | 496,031 | $ | 848,697 | ||||
Restricted cash | 59,106 | 29,568 | ||||||
Accounts receivable (net) | 433,614 | 875,265 | ||||||
Notes receivable (net) | 37,977 | 101,441 | ||||||
Inventory | 159,043 | 215,020 | ||||||
Income tax receivables | 6,475 | 5,819 | ||||||
Prepaid expenses and other current assets (see Note 12) | 76,607 | 33,929 | ||||||
Total current assets | 1,268,853 | 2,109,739 | ||||||
Notes receivable | 651,159 | 611,899 | ||||||
Fixed assets (net) | 347,182 | 354,494 | ||||||
Goodwill | 50,029 | 13,621 | ||||||
Intangible assets (net) | 13,393 | 324 | ||||||
Trust assets related to deferred compensation liability | 26,713 | 37,843 | ||||||
Income tax receivables | 686 | 3,178 | ||||||
Deferred income taxes (see Note 1) | 7,700 | 7,916 | ||||||
Other long-term assets (see Notes 1 and 12) | 138,711 | 124,299 | ||||||
Total assets | $ | 2,504,426 | $ | 3,263,313 | ||||
Liabilities and Shareholders' Equity | ||||||||
Current liabilities: | ||||||||
Client payables | $ | 511,876 | $ | 692,606 | ||||
Related party client payable (see Note 27) | — | 285,418 | ||||||
Accounts payable and accrued liabilities | 85,995 | 88,894 | ||||||
Accrued salaries and related costs | 68,387 | 103,155 | ||||||
Current portion of York Property Mortgage (see Note 1) | 6,629 | 6,292 | ||||||
Accrued income taxes | 26,912 | 11,095 | ||||||
Other current liabilities | 43,176 | 9,113 | ||||||
Total current liabilities | 742,975 | 1,196,573 | ||||||
Credit facility borrowings | 565,000 | 541,500 | ||||||
Long-term debt (net) (see Note 1) | 598,941 | 604,961 | ||||||
Deferred compensation liability | 25,914 | 39,013 | ||||||
Accrued income taxes | 16,600 | 18,529 | ||||||
Deferred income taxes (see Note 1) | 10,228 | 40,424 | ||||||
Other long-term liabilities (see Note 12) | 39,166 | 15,609 | ||||||
Total liabilities | 1,998,824 | 2,456,609 | ||||||
Commitments and contingencies (see Note 18) | ||||||||
Shareholders’ equity: | ||||||||
Common Stock, $0.01 par value | 703 | 700 | ||||||
Authorized shares—200,000,000 | ||||||||
Issued shares—70,378,873 and 70,054,948 | ||||||||
Outstanding shares—52,971,232 and 65,791,119 | ||||||||
Additional paid-in capital | 444,611 | 435,696 | ||||||
Treasury stock shares, at cost: 17,407,641 and 4,263,829 | (509,885 | ) | (150,000 | ) | ||||
Retained earnings | 660,347 | 586,235 | ||||||
Accumulated other comprehensive loss | (90,358 | ) | (66,204 | ) | ||||
Total shareholders’ equity | 505,418 | 806,427 | ||||||
Noncontrolling interest | 184 | 277 | ||||||
Total equity | 505,602 | 806,704 | ||||||
Total liabilities and shareholders' equity | $ | 2,504,426 | $ | 3,263,313 | ||||
See accompanying Notes to Consolidated Financial Statements
64
SOTHEBY'S CONSOLIDATED STATEMENTS OF CASH FLOWS (Thousands of dollars) | ||||||||||||
Year Ended December 31, | 2016 | 2015 | 2014 | |||||||||
Operating Activities: | ||||||||||||
Net income attributable to Sotheby's | $ | 74,112 | $ | 43,727 | $ | 117,795 | ||||||
Adjustments to reconcile net income attributable to Sotheby's to net cash provided by operating activities: | ||||||||||||
Depreciation and amortization | 21,817 | 19,481 | 20,575 | |||||||||
(Gain) loss from recognition of cumulative translation adjustment upon liquidation of foreign subsidiary | — | (105 | ) | 2,058 | ||||||||
Deferred income tax (benefit) expense | (24,156 | ) | 81,689 | 8,833 | ||||||||
Share-based payments | 15,216 | 33,700 | 27,061 | |||||||||
Net pension (benefit) cost | (6,895 | ) | 1,577 | (688 | ) | |||||||
Inventory writedowns and bad debt provisions | 23,441 | 21,729 | 10,383 | |||||||||
Amortization of debt discount and issuance costs (see Note 1) | 1,619 | 3,072 | 4,606 | |||||||||
Excess tax benefits from share-based payments | — | (1,064 | ) | (3,625 | ) | |||||||
Equity in earnings of investees | (3,262 | ) | (5,327 | ) | (732 | ) | ||||||
Other | 794 | 45 | 3,223 | |||||||||
Changes in assets and liabilities: | ||||||||||||
Accounts receivable | 437,398 | (14,190 | ) | (178,335 | ) | |||||||
Client payables | (136,097 | ) | (268,234 | ) | 79,180 | |||||||
Related party client payables (see Note 27) | (285,418 | ) | 285,418 | — | ||||||||
Inventory | 29,746 | (18,828 | ) | (59,475 | ) | |||||||
Changes in other operating assets and liabilities (see Note 13) | 10,055 | (27,632 | ) | 13,406 | ||||||||
Net cash provided by operating activities | 158,370 | 155,058 | 44,265 | |||||||||
Investing Activities: | ||||||||||||
Funding of notes receivable | (321,127 | ) | (334,989 | ) | (592,022 | ) | ||||||
Collections of notes receivable | 305,770 | 355,103 | 476,522 | |||||||||
Capital expenditures | (21,363 | ) | (11,338 | ) | (10,868 | ) | ||||||
Acquisitions, net of cash acquired (see Notes 3 and 7) | (54,343 | ) | — | — | ||||||||
Funding of investments | (2,200 | ) | (30,725 | ) | — | |||||||
Distributions from investees | 1,925 | 4,515 | 2,160 | |||||||||
Proceeds from the sale of equity method investment | 325 | 275 | 300 | |||||||||
Settlement of net investment hedges (see Note 10) | (3,308 | ) | — | — | ||||||||
(Increase) decrease in restricted cash | (26,097 | ) | 457 | (4,655 | ) | |||||||
Net cash used by investing activities | (120,418 | ) | (16,702 | ) | (128,563 | ) | ||||||
Financing Activities: | ||||||||||||
Debt issuance and other borrowing costs | (320 | ) | (9,642 | ) | (5,394 | ) | ||||||
Proceeds from credit facility borrowings | 164,500 | 186,500 | 507,500 | |||||||||
Repayments of credit facility borrowings | (141,000 | ) | (90,000 | ) | (62,500 | ) | ||||||
Proceeds from refinancing of York Property Mortgage | — | 325,000 | — | |||||||||
Repayments of York Property Mortgage | (7,302 | ) | (223,440 | ) | (3,614 | ) | ||||||
Restricted cash related to York Property Mortgage (see Note 9) | (4,635 | ) | — | — | ||||||||
Repurchases of common stock | (359,885 | ) | (125,000 | ) | (25,000 | ) | ||||||
Dividends paid | (1,743 | ) | (29,784 | ) | (331,535 | ) | ||||||
Proceeds from exercise of employee stock options | — | — | 967 | |||||||||
Excess tax benefits from share-based payments | — | 1,064 | 3,625 | |||||||||
Funding of employee tax obligations upon the vesting of share-based payments | (5,890 | ) | (8,978 | ) | (11,848 | ) | ||||||
Net cash (used) provided by financing activities | (356,275 | ) | 25,720 | 72,201 | ||||||||
Effect of exchange rate changes on cash and cash equivalents | (34,343 | ) | (9,208 | ) | (15,389 | ) | ||||||
(Decrease) increase in cash and cash equivalents | (352,666 | ) | 154,868 | (27,486 | ) | |||||||
Cash and cash equivalents at beginning of period | 848,697 | 693,829 | 721,315 | |||||||||
Cash and cash equivalents at end of period | $ | 496,031 | $ | 848,697 | $ | 693,829 | ||||||
Supplemental information on non-cash investing and financing activities:
See Note 4 for information regarding non-cash transfers between Accounts Receivable (net) and Notes Receivable (net).
See accompanying Notes to Consolidated Financial Statements
65
SOTHEBY'S
CONSOLIDATED STATEMENTS OF CHANGES IN SHAREHOLDERS' EQUITY
YEARS ENDED DECEMBER 31, 2016, 2015, AND 2014
(Thousands of dollars, except per share data)
Common Stock | Additional Paid-In Capital | Treasury Stock | Retained Earnings | Accumulated Other Comprehensive Loss | Total | ||||||||||||||||||
Balance at January 1, 2014 | $ | 691 | $ | 387,477 | $ | — | $ | 790,603 | $ | (39,453 | ) | $ | 1,139,318 | ||||||||||
Net income attributable to Sotheby's | 117,795 | 117,795 | |||||||||||||||||||||
Other comprehensive loss | (37,313 | ) | (37,313 | ) | |||||||||||||||||||
Stock options exercised | 967 | 967 | |||||||||||||||||||||
Common stock shares withheld to satisfy employee tax obligations | (11,848 | ) | (11,848 | ) | |||||||||||||||||||
Restricted stock units vested, net | 4 | (4 | ) | — | |||||||||||||||||||
Amortization of share-based payment expense | 27,061 | 27,061 | |||||||||||||||||||||
Tax benefit from share-based payments | 3,625 | 3,625 | |||||||||||||||||||||
Shares and deferred stock units issued to directors | 1,596 | 1,596 | |||||||||||||||||||||
Repurchase of common stock | (25,000 | ) | (25,000 | ) | |||||||||||||||||||
Cash dividends, $4.74 per common share | (327,754 | ) | (327,754 | ) | |||||||||||||||||||
Cash dividend equivalents paid on share-based payments | (3,781 | ) | (3,781 | ) | |||||||||||||||||||
Cash dividend equivalents accrued on share-based payments | (6,969 | ) | (6,969 | ) | |||||||||||||||||||
Balance at December 31, 2014 | 695 | 408,874 | (25,000 | ) | 569,894 | (76,766 | ) | 877,697 | |||||||||||||||
Net income attributable to Sotheby's | 43,727 | 43,727 | |||||||||||||||||||||
Other comprehensive income | 10,562 | 10,562 | |||||||||||||||||||||
Common stock shares withheld to satisfy employee tax obligations | (8,978 | ) | (8,978 | ) | |||||||||||||||||||
Restricted stock units vested, net | 5 | (5 | ) | — | |||||||||||||||||||
Amortization of share-based payment expense | 33,700 | 33,700 | |||||||||||||||||||||
Tax benefit from share-based payments | 1,064 | 1,064 | |||||||||||||||||||||
Shares and deferred stock units issued to directors | 1,041 | 1,041 | |||||||||||||||||||||
Repurchase of common stock | (125,000 | ) | (125,000 | ) | |||||||||||||||||||
Cash dividends, $0.40 per common share | (27,107 | ) | (27,107 | ) | |||||||||||||||||||
Cash dividend equivalents related to share-based payments | (279 | ) | (279 | ) | |||||||||||||||||||
Balance at December 31, 2015 | 700 | 435,696 | (150,000 | ) | 586,235 | (66,204 | ) | 806,427 | |||||||||||||||
Net income attributable to Sotheby's | 74,112 | 74,112 | |||||||||||||||||||||
Other comprehensive loss | (24,154 | ) | (24,154 | ) | |||||||||||||||||||
Common stock shares withheld to satisfy employee tax obligations | (5,890 | ) | (5,890 | ) | |||||||||||||||||||
Restricted stock units vested, net | 3 | (3 | ) | — | |||||||||||||||||||
Amortization of share-based payment expense | 15,216 | 15,216 | |||||||||||||||||||||
Tax deficiency from share-based payments | (1,342 | ) | (1,342 | ) | |||||||||||||||||||
Shares and deferred stock units issued to directors | 934 | 934 | |||||||||||||||||||||
Repurchases of common stock | (359,885 | ) | (359,885 | ) | |||||||||||||||||||
Balance at December 31, 2016 | $ | 703 | $ | 444,611 | $ | (509,885 | ) | $ | 660,347 | $ | (90,358 | ) | $ | 505,418 | |||||||||
See accompanying Notes to Consolidated Financial Statements
66
SOTHEBY'S
NOTES TO CONSOLIDATED FINANCIAL STATEMENTS
Note 1—Summary of Significant Accounting Policies
Basis of Presentation—The Consolidated Financial Statements included herein have been prepared in accordance with accounting principles generally accepted in the United States of America ("U.S. GAAP") and pursuant to the rules and regulations of the Securities and Exchange Commission (the "SEC"). In the Consolidated Financial Statements, unless otherwise stated, the terms "art" or "works of art" or "artwork" or "property" refer to authenticated fine art, decorative art, jewelry, wine, and collectibles.
Principles of Consolidation—The Consolidated Financial Statements include the accounts of our wholly-owned subsidiaries and Sotheby's (Beijing) Auction Co., Ltd. ("Sotheby's Beijing"), a joint venture formed in September 2012 in which we have a controlling 80% ownership interest. The net income attributable to the minority owner of Sotheby's Beijing is reported as "Net (Loss) Income Attributable to Noncontrolling Interest" in our Consolidated Income Statements and the non-controlling 20% ownership interest is reported as "Noncontrolling Interest" within the Equity section of our Consolidated Balance Sheets. Intercompany transactions and balances among our subsidiaries are eliminated in consolidation.
Equity investments through which we exercise significant influence over the investee, but do not control, are accounted for using the equity method. Under the equity method, our share of investee earnings or losses is recorded within Equity in Earnings of Investees in our Consolidated Income Statements. Our interest in the net assets of these investees is recorded within Equity Method Investments on our Consolidated Balance Sheets. Our equity method investees include Acquavella Modern Art, a partnership through which a collection of fine art is being sold, and RM Sotheby's (formerly RM Auctions), an auction house for investment-quality automobiles. See Note 5 for information related to our equity method investments.
Foreign Currency Translation—Assets and liabilities recorded in foreign currencies are translated at the exchange rate on the balance sheet date. Revenues, expenses, gains, and losses recorded in foreign currencies are translated using the monthly average exchange rates prevailing during the period in which they are recognized. Translation adjustments resulting from this process are recorded to Other Comprehensive (Loss) Income and reported on our Consolidated Balance Sheets within Accumulated Other Comprehensive Loss until the subsidiary is sold or liquidated.
Adjustments to Prior Period Presentation—In April 2015, the Financial Accounting Standards Board (the "FASB") issued Accounting Standards Update ("ASU") 2015-03, Simplifying the Presentation of Debt Issuance Costs, and in August 2015, issued ASU 2015-15, Presentation and Subsequent Measurement of Debt Issuance Costs Associated with Line-of-Credit Arrangements. These standards require unamortized debt issuance costs to be included as a direct deduction from the related debt liability on the balance sheet, but permit companies to continue to record unamortized debt issuance costs related to revolving credit facility arrangements as assets. Under previous guidance, all unamortized debt issuance costs were reported as assets on the balance sheet. We adopted and applied ASU 2015-03 on a retrospective basis on its January 1, 2016 effective date. As permitted by ASU 2015-15, we are continuing to present debt issuance costs related to revolving credit facility arrangements as an asset on our balance sheet, regardless of whether there are any outstanding borrowings under the arrangement. The following tables summarize the effect of adopting ASU 2015-03 on our previously issued financial statements (in thousands of dollars):
As of December 31, 2015 | ||||||||||||
Consolidated Balance Sheets: | As Previously Reported | ASU 2015-03 Adjustments | As Adjusted | |||||||||
Other long-term assets (see Note 12) | $ | 135,115 | $ | (10,816 | ) | $ | 124,299 | |||||
York Property Mortgage, current | $ | 7,302 | $ | (1,010 | ) | $ | 6,292 | |||||
Long-term debt, net | $ | 614,767 | $ | (9,806 | ) | $ | 604,961 | |||||
67
Year Ended December 31, 2015 | ||||||||||||
Consolidated Statements of Cash Flows: | As Previously Reported | ASU 2015-03 Adjustments | As Adjusted | |||||||||
Operating Activities: | ||||||||||||
Adjustments to reconcile net income attributable to Sotheby's to net cash provided by operating activities: | ||||||||||||
Amortization of debt discount and issuance costs | $ | 1,782 | $ | 1,290 | $ | 3,072 | ||||||
Changes in assets and liabilities: | ||||||||||||
Other operating assets and liabilities (see Note 13) | $ | (26,342 | ) | $ | (1,290 | ) | $ | (27,632 | ) | |||
Net cash provided by operating activities | $ | 155,058 | $ | — | $ | 155,058 | ||||||
Year Ended December 31, 2014 | ||||||||||||
Consolidated Statements of Cash Flows: | As Previously Reported | ASU 2015-03 Adjustments | As Adjusted | |||||||||
Operating Activities: | ||||||||||||
Adjustments to reconcile net income attributable to Sotheby's to net cash provided by operating activities: | ||||||||||||
Amortization of debt discount and issuance costs | $ | 3,564 | $ | 1,042 | $ | 4,606 | ||||||
Changes in assets and liabilities: | ||||||||||||
Other operating assets and liabilities (see Note 13) | $ | 14,448 | $ | (1,042 | ) | $ | 13,406 | |||||
Net cash provided by operating activities | $ | 44,265 | $ | — | $ | 44,265 | ||||||
Restricted Cash—As of December 31, 2016 and 2015, Restricted Cash primarily includes amounts held in certain foreign jurisdictions where there is a legal requirement for auction houses to maintain consignor funds in segregated accounts ($38.5 million and $28.9 million, respectively). As of December 31, 2016, Restricted Cash also includes funds held in escrow pending the final settlement of a sale ($15.3 million), as well as funds held in a cash management account established under the control of the lender for potential monthly debt service, insurance, and tax payments related to the mortgage on our headquarters building in New York ($4.6 million). See Note 9 for information related to the mortgage on our headquarters building in New York.
Valuation of Inventory and Loan Collateral—The art market is not a highly liquid trading market. As a result, the valuation of art is inherently subjective and the realizable value of art often fluctuates over time. In estimating the realizable value of art held in inventory and art pledged as collateral for SFS loans, we consider the following complex array of factors: (i) whether the property is expected to be offered at auction or sold privately, and the timing of any such sale; (ii) the supply and demand for the property, taking into account current art market conditions, as well as changing trends as to which collecting categories and artists are most sought after; (iii) recent sale prices achieved for comparable items within a particular collecting category and/or by a particular artist; (iv) the state of the global economy and financial markets; and (v) our intent and ability to hold the property in order to maximize its realizable value. Due to the inherent subjectivity involved in estimating the realizable value of art held in inventory and art pledged as collateral for SFS loans, our estimates of realizable value may prove, with the benefit of hindsight, to be different than the amount ultimately realized upon sale. See below for a detailed discussion of our accounting policies with respect to Notes Receivable and Inventory.
Accounts Receivable and Allowance for Doubtful Accounts—Accounts Receivable principally includes amounts due from buyers as a result of auction and private sale transactions. The recorded amount reflects the purchase price of the property, including our commission. The Allowance for Doubtful Accounts principally includes estimated losses associated with situations when we have paid the net sale proceeds to the seller and it is probable that payment will not be collected from the buyer. The Allowance for Doubtful Accounts also includes an estimate of probable losses inherent in the remainder of the Accounts Receivable balance. The amount of the required allowance is based on the facts available to management, including the value of any property held as collateral, and is reevaluated and adjusted as additional facts become known. Based on all available information, we believe that the Allowance for Doubtful Accounts is adequate as of December 31, 2016; however, actual losses may ultimately exceed the recorded allowance. As of December 31, 2016 and 2015, the Allowance for Doubtful Accounts was $7.7 million and $8.6 million, respectively. See Note 4 for information related to Accounts Receivable.
68
Notes Receivable and Allowance for Credit Losses—Notes Receivable includes loans made to clients that are secured by artworks. The classification of a loan as current or non-current on our Consolidated Balance Sheets takes into account the contractual maturity date of the loan, as well as the likelihood of renewing the loan on or before its contractual maturity. The determination of whether a specific loan is impaired and the amount of any required allowance is based on the facts available to management and is reevaluated and adjusted as additional facts become known. A loan is considered to be impaired when we determine that it is probable that a portion of the principal and interest owed by the borrower will not be recovered after taking into account the estimated realizable value of the collateral securing the loan, as well as the ability of the borrower to repay any shortfall between the value of the collateral and the amount of the loan. An allowance is also established for probable losses inherent in the remainder of the loan portfolio based on historical data related to loan losses. See Note 4 for information related to Notes Receivable.
Inventory—Inventory consists of artworks that we own and includes the following general categories: (i) items that have been obtained as a result of the failure of guaranteed property to sell at auction (see Note 19), (ii) items that have been purchased opportunistically, including property acquired for sale at auction, and (iii) other objects obtained incidental to the auction process (e.g., as a result of buyer default).
Inventory is valued on a specific identification basis at the lower of cost or our estimate of realizable value (i.e., the expected sale price upon disposition). If there is evidence that the estimated realizable value of a specific item held in Inventory is less than its carrying value, a writedown is recorded to reflect our revised estimate of realizable value. For the years ended December 31, 2016, 2015, and 2014, inventory writedowns totaled $22.3 million, $20.1 million, and $10 million, respectively.
Although all of the items held in Inventory are available for immediate sale, the timing of eventual sale is difficult to predict due to the high value and unique nature of each item, as well as the cyclical nature of the global art market. We expect that the items held in Inventory will be sold in the ordinary course of our business during the normal operating cycle for such items.
Fixed Assets—Fixed Assets are stated at cost less accumulated depreciation and amortization. Depreciation is calculated using the straight-line method over the estimated useful life of the asset. Buildings are depreciated over a useful life of up to 50 years. Building improvements are depreciated over a useful life of up to 20 years. Furniture and fixtures are depreciated over a useful life of up to seven years. Leasehold improvements are amortized using the straight-line method over the lesser of the term of the related lease or the estimated useful life of the improvement. Computer software purchased or developed for internal use consists of the cost of purchased software, as well as direct external and internal software development costs. These costs are amortized on a straight-line basis over the estimated useful life of the software, which is typically between seven to ten years for enterprise systems and three years for other types of software. See Note 6 for information related to Fixed Assets.
Goodwill —Goodwill represents the excess of the purchase price paid over the fair value of net assets acquired in a business combination. Goodwill is not amortized, but is tested annually for impairment at the reporting unit level as of October 31 and between annual tests if indicators of potential impairment exist. These indicators could include a decline in our stock price and market capitalization, a significant change in the outlook for the reporting unit's business, lower than expected operating results, increased competition, legal factors, or the sale or disposition of a significant portion of a reporting unit. An impairment loss is recognized for any amount by which the carrying value of a reporting unit's goodwill exceeds its fair value. The fair value of the reporting units in our Agency segment is determined in reference to a blend of the income and market approaches and the fair value of our art advisory reporting unit is determined using a discounted cash flow methodology. See Note 7 for information related to Goodwill.
The significant assumptions used in the income approach and discounted cash flow approach include (i) forecasted growth rates and (ii) forecasted profitability, both of which are estimated based on consideration of our historical performance and projections of our future performance, and (iii) discount rates that are used to calculate the value of future projected cash flows, which rates are derived based on our estimated weighted average cost of capital. The significant assumptions used in the market approach include the selected multiples applied to certain operating metrics. Considerable judgment is necessary to evaluate the impact of operating changes and business initiatives in order to estimate future growth rates and profitability in order to estimate future cash flows and multiples. This is particularly true in a cyclical business, like ours. Future business results could significantly impact the evaluation of our goodwill which could have a material impact on the determination of whether a potential impairment exists and the size of any such impairment.
Intangible Assets —Intangible assets are amortized over their estimated useful lives unless the useful life of a particular intangible asset is deemed to be indefinite. If indicators of potential impairment exist, intangible assets with defined useful lives are tested for impairment based on our estimates of undiscounted cash flows and, if impaired, written down to fair value based on either discounted cash flows or appraised values. See Note 7 for information related to Intangible Assets.
69
Impairment of Long-Lived Assets—Long-lived assets are reviewed for impairment whenever events or changes in circumstances indicate that the carrying amount of the asset may not be recoverable. In such situations, long-lived assets are considered impaired when estimated future cash flows (undiscounted and without interest charges) resulting from the use of the asset and its eventual disposition are less than the asset's carrying amount. In such situations, the asset is written down to the present value of the estimated future cash flows. Factors that are considered when evaluating long-lived assets for impairment include a current expectation that it is more likely than not that the long-lived asset will be sold significantly before the end of its useful life, a significant decrease in the market price of the long-lived asset, and a significant change in the extent or manner in which the long-lived asset is being used.
Valuation of Deferred Tax Assets—A valuation allowance is recorded to reduce our deferred tax assets to the amount that is more likely than not to be realized. In assessing the need for the valuation allowance, management considers, among other things, projections of future taxable income and ongoing prudent and feasible tax planning strategies. If we determine that sufficient negative evidence exists (for example, if we experience cumulative three-year losses in a certain jurisdiction), then we will consider recording a valuation allowance against a portion or all of the deferred tax assets in that jurisdiction. If, after recording a valuation allowance, our projections of future taxable income and other positive evidence considered in evaluating the need for a valuation allowance prove, with the benefit of hindsight, to be inaccurate, it could prove to be more difficult to support the realization of our deferred tax assets. As a result, an additional valuation allowance could be required, which would have an adverse impact on our effective income tax rate and results. Conversely, if, after recording a valuation allowance, we determine that sufficient positive evidence exists in the jurisdiction in which the valuation allowance was recorded (for example, if we are no longer in a three-year cumulative loss position in the jurisdiction, and we expect to have future taxable income in that jurisdiction based upon our forecasts and the expected timing of deferred tax asset reversals), we may reverse a portion or all of the valuation allowance in that jurisdiction. In such situations, the adjustment made to the deferred tax asset would have a favorable impact on our effective income tax rate and results in the period such determination was made. See Note 16 for information related to income taxes, including the recorded balances of our valuation allowance related to deferred tax assets.
Auction Guarantees—From time-to-time in the ordinary course of our business, we will guarantee to a consignor a minimum sale price in connection with the sale of property at auction. If the property offered under the auction guarantee sells above the minimum guaranteed price, we are generally entitled to a share of the excess proceeds. In the event that the property sells for less than the minimum guaranteed price, we must perform under the auction guarantee by funding the difference between the sale price at auction and the amount of the auction guarantee. If any item of property offered under the auction guarantee does not sell, the amount of the auction guarantee must be paid, but we take ownership of the unsold property and may recover the amount paid through its future sale. In situations when an item of guaranteed property does not sell and we take ownership of the property, it is recorded as Inventory on our Consolidated Balance Sheets at the lower of its cost (i.e., the amount paid under the auction guarantee) or our estimate of the property's net realizable value (i.e., the expected sale price upon its eventual disposition).
The estimated fair value of our obligation to perform under our auction guarantees is recorded on our Consolidated Balance Sheets within Accounts Payable and Accrued Liabilities. This estimated fair value is based on an analysis of historical loss experience related to auction guarantees and does not include the impact of risk-sharing arrangements that may have mitigated all or a portion of any historical losses.
See Note 19 for information related to auction guarantees and any associated risk-sharing arrangements.
Financial Instruments—Our material financial instruments include: (i) Cash and Cash Equivalents; (ii) Restricted Cash; (iii) Notes Receivable; (iv) credit facility borrowings; (v) long-term debt, including the mortgage on our headquarters building in New York; and (vi) various derivative financial instruments. The carrying amounts of Cash and Cash Equivalents, Restricted Cash, Notes Receivable, the mortgage on our headquarters building in New York, and credit facility borrowings do not materially differ from their estimated fair values due to their nature and the variable interest rates associated with each of these financial instruments. See Notes 9 for fair value information related to other long-term debt and Note 10 for fair value information related to derivative financial instruments.
70
Revenue Recognition (Agency Commissions and Fees)—Through our Agency segment, we accept property on consignment, stimulate buyer interest through professional marketing techniques, and match sellers (also known as consignors) to buyers through the auction or private sale process. Prior to offering a work of art for sale, we perform due diligence activities to authenticate and determine the ownership history of the property being sold. The revenue recognition policy for each of the principal components of Agency Commissions and Fees is described below.
(1) Auction Commission Revenues—In our role as auctioneer, we accept property on consignment and match sellers to buyers through the auction process. As compensation for our auction services, we earn a commission from both the buyer ("buyer's premium") and, to a lesser extent, the seller ("seller's commission") (collectively, "auction commission revenue"), both of which are calculated as a percentage of the hammer price of the property sold at auction.
On the fall of the auctioneer's hammer, the highest bidder becomes legally obligated to pay the full purchase price, which includes the hammer price of the property purchased plus the buyer's premium, and the seller is legally obligated to relinquish the property in exchange for the hammer price less any seller's commissions. Auction commission revenue is recognized on the date of the auction sale upon the fall of the auctioneer's hammer, which is the point in time when we have substantially accomplished what we must do to be entitled to the benefits represented by the auction commission revenue. Subsequent to the date of the auction sale, our remaining obligations for our auction services relate only to the collection of the purchase price from the buyer and the remittance of the net sale proceeds to the seller. These remaining service obligations are not an essential part of our auction services.
Under the standard terms and conditions of our auction sales, we are not obligated to pay the consignor for property that has not been paid for by the buyer. If a buyer defaults on payment, the sale may be cancelled, and the property will be returned to the consignor. We continually evaluate the collectability of amounts due from individual buyers and only recognize auction commission revenue when the collection of the amount due from the buyer is reasonably assured. If we determine that it is probable that the buyer will default, a cancelled sale is recorded in the period in which that determination is made and the associated Accounts Receivable balance, including our auction commission, is reversed. Our judgments regarding the collectability of Accounts Receivable are based on an assessment of the buyer's payment history, discussions with the buyer, and the value of any property held as security against the buyer's payment obligation. Our judgments with respect to the collectability of amounts due from buyers for auction purchases may prove, with the benefit of hindsight, to be incorrect. Historically, cancelled sales have not been material in relation to the aggregate hammer price of property sold at auction.
Auction commission revenues are recorded net of commissions owed to third parties, which are principally the result of situations when the buyer's premium is shared with the consignor or with the counterparty in an auction guarantee risk and reward sharing arrangement (see Note 19). Additionally, in certain situations, auction commissions are shared with third parties who introduce us to auction consignors or otherwise facilitate the sale of property at auction.
(2) Private Sale Commission Revenues—Private sale commission revenues are earned through the direct brokering of purchases and sales of art. Similar to auction sales, the primary service that we provide in a private sale transaction is the matching of the seller to a buyer in a legally binding transaction. Private sales are initiated either by a client wishing to sell property with Sotheby's acting as its exclusive agent in the transaction or a prospective buyer who is interested in purchasing a certain work of art privately. Such arrangements are evidenced by a legally binding agreement between Sotheby's and the seller (a "Seller Agreement"), which outlines the terms of the arrangement, including the desired sale price and the amount or rate of commission to be earned. In certain situations, we may also execute a legally binding agreement with the buyer stipulating the terms of the transaction (a "Buyer Agreement").
The timing of revenue recognition for private sale commissions is evaluated on a case-by-case basis, and in large part, is dependent upon whether a Buyer Agreement has been executed. Additionally, a careful analysis of the individual facts and circumstances is performed for each transaction to fully understand our obligations and performance requirements related to the transaction.
In transactions with a Buyer Agreement, our services are performed on the date that the Buyer Agreement is executed. At this point, any remaining service obligations are considered to be inconsequential and perfunctory. Such remaining service obligations normally relate only to the collection of the purchase price from the buyer and the remittance of the net sale proceeds to the seller. These remaining service obligations are not an essential part of the services that we provide in a private sale transaction. In the absence of an executed Buyer Agreement, revenue recognition is deferred until we have performed our substantive service obligations in the transaction and the buyer has paid the full purchase price thereby evidencing the terms of the arrangement.
71
Private sale commission revenues are recorded net of commissions owed to third parties. In certain situations, commissions are shared with third parties who introduce us to consignors who sell property through a private sale transaction.
(3) Other Agency Commissions and Fees (Net)—Included in Other Agency Commissions and Fees is our share of overage or shortfall related to guaranteed property offered or sold at auction. The overage or shortfall related to guaranteed property is generally recognized in the period in which the property is offered at auction. However, a shortfall is recognized prior to the date of the auction if we determine that a loss related to an auction guarantee is probable. In such situations, we estimate the amount of the loss based on the difference between the amount of the auction guarantee and the expected selling price of the property, including buyer's premium.
Also included in Other Agency Commissions and Fees (Net) are commissions and fees earned on sales of art brokered by third parties, fees charged to consignors for property withdrawn prior to auction, and catalogue subscription and advertising revenues. These revenues are recognized in our Consolidated Income Statements when the underlying event occurs or over the period during which we provide the service to our customer.
Revenue Recognition (Inventory Sales)—Inventory sales are recognized in the period in which the sale is completed, title to the property passes to the purchaser, and we have fulfilled any other obligations that may be relevant to the transaction, including, but not limited to, delivery of the property. In instances when Inventory is sold at auction, the associated buyer's premium is recorded within Inventory Sales. The carrying value of Inventory sold during a period is recorded within Cost of Inventory Sales.
Revenue Recognition (Finance Revenues)—Finance revenues consist principally of interest income earned on Notes Receivable. Such interest income is recognized when earned, based on the amount of the outstanding loan, the applicable interest rate on the loan, and the length of time the loan is outstanding during the period. A non-accrual loan is a loan for which future Finance revenue is not recorded due to our determination that it is probable that future interest on the loan is not collectible. Any cash receipts subsequently received on non-accrual loans are first applied to reduce the recorded principal balance of the loan, with any proceeds in excess of the principal balance then applied to interest owed by the borrower. The recognition of Finance revenue may resume on a non-accrual loan if sufficient additional collateral is provided by the borrower or if we become aware of other circumstances that indicate that it is probable that the borrower will make future interest payments on the loan. See Note 4 for information related to Notes Receivable.
Revenue Recognition (Advisory Revenues)—Advisory revenues consist of fees earned from providing art-related advice to certain clients, including strategic guidance on collection identity and development, acquisitions, and short and long-term planning. These arrangements are typically evidenced by a legally binding written agreement between us and the client, which outlines the nature of the services to be provided and the amount of fees to be earned. Our advisory services are also sometimes provided on the basis of a verbal agreement with the client. For arrangements with written agreements, advisory revenues are recognized ratably on a straight-line basis over the term of the agreement, provided collectability is reasonably assured. Advisory service arrangements are typically one year in duration. In the absence of a written advisory agreement, revenue recognition is deferred until we have performed our substantive service obligations and the client has made payment for those services thereby evidencing the terms of the arrangement. Advisory revenues are reflected within Other Revenues in our Consolidated Income Statements.
Sales, Use and Value-Added Taxes—Sales, use and value-added taxes assessed by governmental authorities that are both imposed on and concurrent with revenue-producing transactions between us and our clients are reported on a net basis within revenues.
Agency Direct Costs—A large portion of Agency Direct Costs relate to sale marketing expenses such as catalogue production and distribution, advertising and promotion costs, and traveling exhibition costs. Such costs are deferred and recorded on our Consolidated Balance Sheets within Prepaid Expenses and Other Current Assets until the date of the sale when they are recognized in our Consolidated Income Statements.
Cost of Finance Revenues—The Cost of Finance Revenues includes costs related to revolving credit facility borrowings that are used to fund client loans, including interest expense, commitment fees, and the amortization of amendment and arrangement fees. See Note 9 for information related to our revolving credit facility.
72
Share-Based Payments—We grant share-based payment awards as compensation to certain employees. The amount of compensation expense recognized for share-based payments is based, in part, on our estimate of the number of shares ultimately expected to vest as a result of employee service. For share-based payment awards that vest annually over a multi-year period of service, compensation expense is amortized over the requisite service period according to a graded vesting schedule. For share-based payment awards that vest at the end of a service period, compensation expense is amortized on a straight-line basis over the requisite service period.
A substantial portion of the share-based payment awards vest only if we achieve established profitability targets (for awards granted prior to 2016) or certain return on invested capital targets (for awards granted beginning in 2016). The amount of compensation expense recognized for such performance-based awards is dependent upon our quarterly assessment of the likelihood of achieving these targets. Accordingly, if our projections of future performance against these targets prove, with the benefit of hindsight, to be inaccurate, the amount of life-to-date and future compensation expense related to share-based payments could significantly increase or decrease.
In 2015, we granted a share-based payment award to Thomas S. Smith, Jr., our President and CEO, with a single vesting opportunity after a five-year service period contingent upon the achievement of pre-determined levels of appreciation related to our common stock. The compensation expense recognized for this share-based payment is based on our estimate of the grant date fair value of the award. In developing this estimate, we considered then-current market conditions, historical data, and any other relevant data.
Dividend equivalents related to share-based payments to employees are charged to Retained Earnings.
See Note 21 for information related to share-based payments.
Use of Estimates—The preparation of financial statements in conformity with U.S. GAAP requires management to make estimates and assumptions that affect the reported amounts of assets and liabilities and disclosure of contingent assets and liabilities at the date of the financial statements and the reported amounts of revenues and expenses during the reporting period. Actual results could differ from those estimates.
Note 2—Segment Reporting
Sotheby's is a global art business, offering our clients opportunities to connect with and transact in the world's most extraordinary objects. Auctioneers since 1744, today we offer a variety of innovative art-related services, including the brokerage of private art sales, private jewelry sales through Sotheby's Diamonds, exclusive private selling exhibitions at our S|2 galleries, art-related financing, and art advisory services, as well as retail wine locations in New York and Hong Kong.
Our operations are organized under two segments—the Agency segment and the Finance segment, which does business as and is referred to in this report as Sotheby's Financial Services (or "SFS").
Through our Agency segment, we accept property on consignment, stimulate buyer interest through professional marketing techniques, and match sellers (also known as consignors) to buyers through the auction or private sale process. Prior to offering a work of art for sale, we perform due diligence activities to authenticate and determine the ownership history of the property being sold. To a much lesser extent, Agency segment activities also include the sale of artworks that are principally acquired as a consequence of the auction process, as well as the activities of RM Sotheby's, an equity investee that operates as an auction house for investment-quality automobiles (see Note 5). The Agency segment is an aggregation of the auction, private sale, and other related activities conducted by our operating segments in the Americas, Europe, and Asia, which have similar economic characteristics and are similar in their services, customers, and the manner in which their services are provided.
SFS is an art financing company that is uniquely positioned as a niche lender with the ability to tailor attractive financing packages for clients who wish to obtain immediate access to liquidity from their art assets. SFS deploys a unique combination of art expertise, skill in international law and finance, and access to capital to provide art collectors and dealers with financing secured by their works of art, allowing them to unlock the value in their collections. (See Note 4).
Art Agency Partners (“AAP”), through which we offer art advisory services, provides clients strategic guidance on collection identity and development, acquisitions, and short and long-term planning. AAP was acquired on January 11, 2016 (see Note 3). Our advisory services are classified within All Other for segment reporting purposes, along with our retail wine business, brand licensing activities, the activities of Acquavella Modern Art ("AMA"), an equity investee (see Note 5), and sales of the remaining inventory of Noortman Master Paintings, an art dealer that was owned and operated by us from its acquisition in 2006 until its closure in December 2013.
73
The accounting policies of our segments are the same as those described in Note 1. For auction commissions, revenues are attributed to geographic areas based on the location of the auction. For private sale commissions, revenues are attributed to geographic areas based on the location of the entities which significantly contributed to the completion of the sale. For inventory activities, revenues are attributed to geographic areas based on the location of the entity that holds legal title to the property sold. SFS revenues are attributed to geographic areas based on the location of the entity that originated the loan. Revenues attributable to our advisory business are earned entirely in the U.S.
The following table presents our segment information for the years ended December 31, 2016, 2015, and 2014 (in thousands of dollars):
Year ended December 31, 2016 | Agency | SFS | All Other | Reconciling items | Total | |||||||||||||||
Revenues | $ | 726,662 | $ | 61,234 | $ | 25,999 | $ | (8,518 | ) | (a) | $ | 805,377 | ||||||||
Interest income | $ | 1,294 | $ | — | $ | — | $ | — | $ | 1,294 | ||||||||||
Interest expense | $ | 30,310 | $ | — | $ | — | $ | — | $ | 30,310 | ||||||||||
Depreciation and amortization | $ | 21,081 | $ | 119 | $ | 617 | $ | — | $ | 21,817 | ||||||||||
Segment income (loss) before taxes | $ | 64,571 | (c) | $ | 35,907 | $ | (482 | ) | (c) | $ | (3,262 | ) | (b) | $ | 96,734 | |||||
Year ended December 31, 2015 | ||||||||||||||||||||
Revenues | $ | 892,030 | $ | 65,248 | $ | 18,975 | $ | (14,759 | ) | (a) | $ | 961,494 | ||||||||
Interest income | $ | 1,773 | $ | 3 | $ | — | $ | — | $ | 1,776 | ||||||||||
Interest expense | $ | 32,745 | $ | — | $ | — | $ | — | $ | 32,745 | ||||||||||
Depreciation and amortization | $ | 19,233 | $ | 124 | $ | 124 | $ | — | $ | 19,481 | ||||||||||
Segment income before taxes | $ | 139,942 | $ | 41,303 | $ | 10,864 | $ | (22,810 | ) | (b) | $ | 169,299 | ||||||||
Year ended December 31, 2014 | ||||||||||||||||||||
Revenues | $ | 885,293 | $ | 47,290 | $ | 19,747 | $ | (14,277 | ) | (a) | $ | 938,053 | ||||||||
Interest income | $ | 1,857 | $ | 18 | $ | 8 | $ | — | $ | 1,883 | ||||||||||
Interest expense | $ | 35,189 | $ | — | $ | — | $ | — | $ | 35,189 | ||||||||||
Depreciation and amortization | $ | 20,110 | $ | 130 | $ | 335 | $ | — | $ | 20,575 | ||||||||||
Segment income before taxes | $ | 182,763 | $ | 31,763 | (b) | $ | 7,424 | $ | (28,929 | ) | (b) | $ | 193,021 | |||||||
(a) The reconciling items related to Revenues consist principally of amounts charged by SFS to the Agency segment, including interest and facility fees related to certain loans made to Agency segment clients, as well as fees charged for term loan collateral sold at auction or privately through the Agency segment.
(b) | The reconciling items related to segment income before taxes are detailed in the table below. |
(c) | Agency segment income before taxes for the year ended December 31, 2016 includes $23.9 million of compensation expense related to an earn-out arrangement with the former principals of AAP. All Other (loss) income before taxes for the year ended December 31, 2016 includes $11.1 million of compensation expense related to this earn-out arrangement. See Note 3. |
74
The table below details the unallocated amounts and reconciling items related to segment income (loss) before taxes and provides a reconciliation of segment income (loss) before taxes to consolidated income before taxes for the years ended December 31, 2016, 2015, and 2014 (in thousands of dollars):
2016 | 2015 | 2014 | |||||||||
Agency | $ | 64,571 | $ | 139,942 | $ | 182,763 | |||||
SFS | 35,907 | 41,303 | 31,763 | ||||||||
All Other | (482 | ) | 10,864 | 7,424 | |||||||
Segment income before taxes | 99,996 | 192,109 | 221,950 | ||||||||
Unallocated amounts and reconciling items: | |||||||||||
Leadership transition severance costs (a) | — | (13,251 | ) | — | |||||||
CEO separation and transition costs (see Note 23) | — | (4,232 | ) | (7,591 | ) | ||||||
Special charges (net) (see Note 25) | — | — | (20,008 | ) | |||||||
Equity in earnings of investees (b): | |||||||||||
RM Sotheby's | (1,967 | ) | (2,519 | ) | — | ||||||
Acquavella Modern Art | (1,295 | ) | (2,808 | ) | (1,330 | ) | |||||
Total equity in earnings of investees | (3,262 | ) | (5,327 | ) | (1,330 | ) | |||||
Income before taxes | $ | 96,734 | $ | 169,299 | $ | 193,021 | |||||
(a) In 2015, in conjunction with our leadership transition, we incurred severance costs of $13.3 million associated with the termination of certain executive officers, including our former Chief Financial Officer and former Chief Operating Officer.
(b) For segment reporting purposes, our share of earnings related to equity investees is included as part of income before taxes. However, such earnings are reported separately below income before taxes in our Consolidated Income Statements. For the periods presented, Agency segment results include equity earnings related to RM Sotheby's and All Other includes equity earnings related to Acquavella Modern Art. See Note 5 for information related to our equity method investments.
The table below presents geographic information about our revenues for the years ended December 31, 2016, 2015, and 2014 for all countries which exceeded 5% of total revenues (in thousands of dollars):
2016 | 2015 | 2014 | |||||||||
United States | $ | 367,200 | $ | 463,129 | $ | 402,385 | |||||
United Kingdom | 193,721 | 257,336 | 271,505 | ||||||||
Hong Kong and China | 145,885 | 146,262 | 165,066 | ||||||||
Switzerland | 50,003 | 50,134 | 46,226 | ||||||||
France | 42,980 | 41,803 | 48,032 | ||||||||
Other countries | 14,106 | 17,589 | 19,116 | ||||||||
Reconciling item: | |||||||||||
Intercompany revenue | (8,518 | ) | (14,759 | ) | (14,277 | ) | |||||
Total | $ | 805,377 | $ | 961,494 | $ | 938,053 | |||||
75
The table below presents segment assets, as well as a reconciliation of segment assets to consolidated assets as of December 31, 2016, 2015, and 2014 (in thousands of dollars):
December 31, | 2016 | 2015 | 2014 | |||||||||
Agency | $ | 1,759,670 | $ | 2,499,441 | $ | 2,386,739 | ||||||
SFS | 687,649 | 721,781 | 658,710 | |||||||||
All Other | 42,246 | 25,178 | 29,067 | |||||||||
Total segment assets | 2,489,565 | 3,246,400 | 3,074,516 | |||||||||
Unallocated amounts: | ||||||||||||
Deferred tax assets and income tax receivable | 14,861 | 16,913 | 55,280 | |||||||||
Consolidated assets | $ | 2,504,426 | $ | 3,263,313 | $ | 3,129,796 | ||||||
Substantially all of our capital expenditures for the years ended December 31, 2016, 2015, and 2014 were attributable to the Agency segment. See Note 1 for information regarding the retrospective adoption of an accounting standard in 2016 that requires unamortized debt issuance costs to be included as a direct deduction from the related debt liability on the balance sheet. Prior period balances in this table have been adjusted to conform to this new presentation.
Note 3—Acquisition of Art Agency, Partners
On January 11, 2016, we acquired Art Agency, Partners, a firm that provides a range of art-related services, in exchange for initial cash consideration of $50 million and potential future earn-out payments of up to $35 million, as discussed in more detail below. The purpose of this acquisition is to grow auction and private sale revenues by enhancing our relationships with art collectors and by improving our position in the fine art market, particularly in Impressionist, Modern and Contemporary Art. Also, as a result of this acquisition, we have added a new revenue stream by integrating AAP's existing art advisory business, providing a new avenue for growth.
The purchase agreement governing the acquisition of AAP includes non-competition and non-solicitation covenants that continue in effect until January 2021. In connection with this acquisition, each of the former principals of AAP also entered into a five-year employment agreement that extends through January 2021. Each employment agreement also includes non-competition and non-solicitation covenants that continue in effect for 12 months following the end of employment.
As indicated above, in connection with the acquisition of AAP, we agreed to make future earn-out payments to the former principals of AAP not to exceed $35 million in the aggregate, contingent on the achievement of a level of cumulative financial performance within the Impressionist, Modern and Contemporary Art collecting categories, as well as from AAP's art advisory business. Progress against the cumulative financial target (the "Target") is measured at the end of each calendar year during the four-year performance period following the acquisition, after adjusting the Target to reflect the annual growth or contraction of the auction market for Impressionist, Modern and Contemporary Art, when compared to the year ended December 31, 2015. Payments made pursuant to the earn-out arrangement are deemed to be compensation for accounting purposes and are expensed to Salaries and Related Costs in our Consolidated Income Statements on a pro-rata basis over the periods during which the Target is met.
For the year ended December 31, 2016, we recognized $35 million of compensation expense associated with the AAP earn-out arrangement based on our assessment of performance against the Target during the initial annual period. This amount includes charges of $17.2 million and $13.4 million recorded in the third and fourth quarters of 2016, respectively, following our reassessments of progress against the Target based on forecasted and actual results for the autumn sales season. The achievement of the entire $35 million earn-out reflects our improved market share in the Contemporary Art collecting category, as well as an improvement in auction commission margins. The $35 million owed under the earn-out arrangement will be paid in four annual increments of $8.75 million in the first quarter of each year beginning in 2017 and through 2020. The portion of the accrued liability due in the first quarter of 2017 ($8.75 million) is recorded within Accrued Salaries and Related Costs on our Consolidated Balance Sheets. The remaining liability ($26.25 million) is recorded within Other Long-Term Liabilities. See Note 12.
76
The table below summarizes the allocation of the total purchase price paid for AAP to the assets acquired and liabilities assumed (in thousands of dollars):
Purchase price: | ||||
Initial cash consideration | $ | 50,000 | ||
Working capital adjustment | 1,189 | |||
Total purchase price | $ | 51,189 | ||
Allocation of purchase price: | ||||
Net working capital acquired | $ | 1,572 | ||
Fixed assets and other long-term assets | 173 | |||
Goodwill | 34,490 | |||
Intangible assets - customer relationships (see Note 7) | 10,800 | |||
Intangible assets - non-compete agreements (see Note 7) | 3,060 | |||
Deferred tax assets | 1,094 | |||
Total purchase price | $ | 51,189 | ||
Upon completion of the purchase price allocation, $28.3 million of the resulting goodwill was allocated to the Agency segment and $6.2 million was allocated to the acquired art advisory business, which is reported within All Other for segment reporting purposes. The goodwill is tax deductible over a period of 15 years. See Note 7 for additional information related to goodwill and intangible assets.
We incurred $0.8 million of transaction costs in connection with the acquisition of AAP, which were recognized within General and Administrative Expenses in our Consolidated Income Statements in the fourth quarter of 2015 ($0.6 million) and the first quarter of 2016 ($0.2 million).
It is impracticable to compute the amount of revenues and earnings contributed to the Agency segment as a result of the acquisition because the related activities have been integrated into the segment. Disclosure of pro-forma revenues and earnings attributable to the acquisition is also excluded because it is impracticable to determine since AAP was a closely-held private entity and its historical financial records are not available in U.S. GAAP.
Note 4—Receivables
Accounts Receivable (Net)—Through our Agency segment, we accept property on consignment and match sellers, also known as consignors, to buyers through the auction or private sale process. Following an auction or private sale, we invoice the buyer for the purchase price of the property (including any commissions owed by the buyer), collect payment from the buyer, and remit to the consignor the net sale proceeds after deducting our commissions, expenses and applicable taxes and royalties.
Under our standard auction payment terms, the purchase price is due from the buyer no more than 30 days after the sale date, with the net proceeds due to the consignor 35 days after the sale date. For private sales, payment from the buyer is typically due on the sale date, with the net sale proceeds due to the consignor shortly thereafter. We also sometimes provide extended payment terms to an auction or private sale buyer. For auctions, the extent to which extended payment terms are provided can vary considerably from selling season to selling season. Extended payment terms typically extend the payment due date to a date that is no longer than one year from the sale date. In limited circumstances, the payment due date may be extended to a date that is beyond one year from the sale date. When providing extended payment terms, we attempt to match the timing of cash receipt from the buyer with the timing of our payment to the consignor, but are not always successful in doing so. All extended payment term arrangements are approved by management under our internal corporate governance policy.
In the limited circumstances when the buyer's payment due date is extended to a date that is beyond one year from the sale date, if the consignor does not provide matched payment terms (i.e., we pay the consignor before receiving payment from the buyer), the receivable balance is reclassified from Accounts Receivable to Notes Receivable on our Consolidated Balance Sheets. As of December 31, 2016 and 2015, Notes Receivable within the Agency segment included $7.5 million and $24.3 million, respectively, of such balances that have been reclassified from Accounts Receivable. See discussion of Agency segment Notes Receivable below.
77
Under the standard terms and conditions of our auction and private sales, we are not obligated to pay the consignor for property that has not been paid for by the buyer. If a buyer defaults on payment, the sale may be cancelled, and the property will be returned to the consignor. Alternatively, the consignor may reoffer the property at one of our future auctions or negotiate a private sale with us acting as their agent. In certain instances, and subject to management approval under our internal corporate governance policy, we may pay the net sale proceeds to the consignor before payment is collected from the buyer and/or we may allow the buyer to take possession of the property before making payment. In situations when the buyer takes possession of the property before making payment, we are liable to the seller for the net sales proceeds whether or not the buyer makes payment. As of December 31, 2016 and 2015, Accounts Receivable (net) included $90.1 million and $165.2 million, respectively, related to situations when we paid the consignor all or a portion of the net sales proceeds before payment was collected from the buyer. As of December 31, 2016 and 2015, Accounts Receivable (net) also included $76.3 million and $93.1 million, respectively, related to situations when we allowed the buyer to take possession of the property before making payment.
Notes Receivable (Sotheby's Financial Services)—SFS makes term loans secured by artworks that are not presently intended for sale, allowing us to establish or enhance mutually beneficial relationships with art collectors. Term loans may also generate future auction or private sale consignments and/or purchases. In certain situations, term loans are made to refinance receivables generated by the auction and private sale purchases of our clients. Term loans normally have initial maturities of up to two years and typically carry a variable market rate of interest. To a much lesser extent, SFS also makes consignor advances secured by artworks that are contractually committed, in the near term, to be offered for sale through our Agency segment. Consignor advances allow sellers to receive funds upon consignment for an auction or private sale that will occur up to one year in the future and normally have short-term maturities.
The lending activities of SFS are predominantly funded with borrowings drawn from a dedicated revolving credit facility. To a lesser extent, cash balances are also used to fund a portion of the loans made by SFS, as appropriate. See Note 9 for information related to the dedicated revolving credit facility for SFS.
As of December 31, 2016 and 2015, the net Notes Receivable balance of SFS includes $88.7 million and $108.8 million, respectively, of term loans issued by SFS to refinance client auction and private sale purchases. For the years ended December 31, 2016 and 2015, SFS issued $13.3 million and $50.2 million, respectively, of such loans. These loans are accounted for as non-cash transfers between Accounts Receivable (net) and Notes Receivable (net) and are, therefore, not reflected as the funding of Notes Receivable within Investing Activities in our Consolidated Statements of Cash Flows. Upon repayment, the cash received in settlement of such Notes Receivable is classified within Operating Activities in our Consolidated Statements of Cash Flows. For the years ended December 31, 2016 and 2015, such repayments totaled $33.4 million and $31.8 million, respectively.
The repayment of secured loans can be adversely impacted by a decline in the art market in general or in the value of the collateral, which is concentrated within certain collecting categories. In addition, in situations when there are competing claims on the collateral and/or when a borrower becomes subject to bankruptcy or insolvency laws, our ability to realize on our collateral may be limited or delayed.
We aim to mitigate the risk associated with a potential devaluation in our collateral by targeting a 50% loan-to-value ("LTV") ratio (i.e., the principal loan amount divided by the low auction estimate of the collateral). However, loans may also be made with LTV ratios between 51% and 60%, and in rare circumstances, loans may be made at an initial LTV ratio higher than 60%. The SFS Credit Facility permits borrowings up to 85% of the portion of any loan that does not exceed a 60% LTV ratio.
The LTV ratio of certain loans may increase above our 50% target due to a decrease in the low auction estimate of the collateral. The revaluation of term loan collateral is performed by our specialists on an annual basis or more frequently if there is a material change in the circumstances related to the loan, the value of the collateral, the disposal plans for the collateral, or if an event of default occurs. We believe that the LTV ratio is the critical credit quality indicator for the secured loans made by SFS.
The table below provides the aggregate LTV ratio for the SFS loan portfolio as of December 31, 2016 and 2015 (in thousands of dollars):
December 31, | 2016 | 2015 | ||||||
Secured loans | $ | 675,109 | $ | 682,258 | ||||
Low auction estimate of collateral | $ | 1,405,856 | $ | 1,380,022 | ||||
Aggregate LTV ratio | 48 | % | 49 | % | ||||
78
The table below provides the aggregate LTV ratio for secured loans made by SFS with an LTV above 50% as of December 31, 2016 and 2015 (in thousands of dollars):
December 31, | 2016 | 2015 | ||||||
Secured loans with an LTV ratio above 50% | $ | 270,111 | $ | 354,049 | ||||
Low auction estimate of collateral related to secured loans with an LTV above 50% | $ | 486,973 | $ | 626,829 | ||||
Aggregate LTV ratio of secured loans with an LTV above 50% | 55 | % | 56 | % | ||||
The table below provides other credit quality information regarding secured loans made by SFS as of December 31, 2016 and 2015 (in thousands of dollars):
December 31, | 2016 | 2015 | ||||||
Total secured loans | $ | 675,109 | $ | 682,258 | ||||
Loans past due | $ | 90,508 | $ | 11,819 | ||||
Loans more than 90 days past due | $ | 158 | $ | 7,828 | ||||
Non-accrual loans | $ | 158 | $ | — | ||||
Impaired loans | $ | — | $ | — | ||||
Allowance for credit losses: | ||||||||
Allowance for credit losses for impaired loans | $ | — | $ | — | ||||
Allowance for credit losses based on historical data | 1,270 | 1,458 | ||||||
Total allowance for credit losses - secured loans | $ | 1,270 | $ | 1,458 | ||||
We consider a loan to be past due when principal payments are not paid in accordance with the stated terms of the loan. As of December 31, 2016, $90.5 million of the Notes Receivable (net) balance was past due, of which $0.2 million was more than 90 days past due. The collateral securing these loans has a low auction estimate of approximately $161 million resulting in an LTV ratio of approximately 56%. We are continuing to accrue interest on virtually all past due loans. In consideration of payments received to-date in the first quarter of 2017, the collateral value related to these loans, and current collateral disposal plans, we believe that the principal and interest amounts due for these loans will be collected.
A non-accrual loan is a loan for which future Finance revenue is not recorded due to our determination that it is probable that future interest on the loan is not collectible. Any cash receipts subsequently received on non-accrual loans are first applied to reduce the recorded principal balance of the loan, with any proceeds in excess of the principal balance then applied to interest owed by the borrower. The recognition of Finance revenue may resume on a non-accrual loan if sufficient additional collateral is provided by the borrower or if we become aware of other circumstances that indicate that it is probable that the borrower will make future interest payments on the loan. As of December 31, 2016 there were $0.2 million of non-accrual loans outstanding. As of December 31, 2015, there were no non-accrual loans outstanding.
A loan is considered to be impaired when we determine that it is probable that a portion of the principal and interest owed by the borrower will not be recovered after taking into account the estimated realizable value of the collateral securing the loan, as well as the ability of the borrower to repay any shortfall between the value of the collateral and the amount of the loan. If a loan is considered to be impaired, Finance Revenue is no longer recognized and bad debt expense is recorded for any principal or accrued interest that is deemed uncollectible. As of December 31, 2016 and 2015, there were no impaired loans outstanding.
For the years ended December 31, 2016 and 2015, activity related to the Allowance for Credit Losses was as follows (in thousands of dollars):
Balance as of January 1, 2015 | $ | 1,166 | |
Change in loan loss provision | 292 | ||
Balance as of December 31, 2015 | 1,458 | ||
Change in loan loss provision | (188 | ) | |
Balance as of December 31, 2016 | $ | 1,270 | |
As of December 31, 2016, unfunded commitments to extend additional credit through SFS were approximately $14.7 million.
79
Notes Receivable (Agency Segment)—We are obligated under the terms of certain auction guarantees to advance a portion of the guaranteed amount prior to the auction. Such auction guarantee advances are recorded on our Consolidated Balance Sheets within Notes Receivable (net). As of December 31, 2016, there were $1 million in auction guarantee advances outstanding. As of December 31, 2015, there were no auction guarantee advances outstanding. See Note 19 for information related to auction guarantees.
As discussed above, in the limited circumstances when the payment due date for an auction or private sale receivable is extended to a date that is beyond one year from the sale date, if the consignor does not provide matched payment terms, the receivable balance is reclassified from Accounts Receivable (net) to Notes Receivable (net) on our Consolidated Balance Sheets. As of December 31, 2016, Notes Receivable (net) within the Agency segment included $7.5 million of such amounts reclassified from Accounts Receivable (net), against which we hold $3.1 million of collateral. As of December 31, 2015, Notes Receivable within the Agency segment included $24.3 million of such loans, against which we held $7.2 million of collateral. These Notes Receivable are accounted for as non-cash transfers between Accounts Receivable (net) and Notes Receivable (net) and are, therefore, not reflected as the funding of Notes Receivable within Investing Activities in our Consolidated Statements of Cash Flows. Upon repayment, the cash received in settlement of such Notes Receivable is classified within Operating Activities in our Consolidated Statements of Cash Flows. For the year ended December 31, 2016, such repayments totaled $16.3 million.
Under certain circumstances, we provide loans to certain art dealers to finance the purchase of works of art. In these situations, we acquire a partial ownership interest or a security interest in the purchased property in addition to providing the loan. Upon the eventual sale of the property acquired, the loan is repaid. As of December 31, 2016 and 2015, such unsecured loans totaled $3.8 million and $4.2 million, respectively. We are no longer accruing interest with respect to one of these loans with a balance of $2.1 million, but management believes that this balance is collectible.
Notes Receivable (Other)—In the second quarter of 2013, we sold our interest in an equity method investee for $4.3 million. The sale price was funded by an upfront cash payment of $0.8 million and the issuance of a $3.5 million unsecured loan. This loan matures in December 2018, has a variable market rate of interest, and requires monthly payments during the loan term. As of December 31, 2016 and 2015, the carrying value of this loan was $2.1 million and $2.4 million, respectively.
Note 5—Equity Method Investments
Acquavella Modern Art—On May 23, 1990, we purchased the common stock of the Pierre Matisse Gallery Corporation ("Matisse") for approximately $153 million. The assets of Matisse consisted of a collection of fine art (the "Matisse Inventory"). Upon consummation of the purchase, we entered into an agreement with Acquavella Contemporary Art, Inc. ("ACA") to form AMA, a partnership through which the Matisse Inventory would be sold. We contributed the Matisse Inventory to AMA in exchange for a 50% interest in the partnership. Although the original term of the AMA partnership agreement was for ten years and was due to expire in 2000, it has been renewed on an annual basis since then.
Pursuant to the AMA partnership agreement, upon the death of the majority shareholder of ACA, the successors-in-interest to ACA have the right, but not the obligation, to require us to purchase their interest in AMA at a price equal to the fair market value of such interest. The fair market value shall be determined pursuant to a process and a formula set forth in the partnership agreement that includes an appraisal of the works of art held by AMA at such time. Upon dissolution of AMA, if we and ACA elect not to liquidate the property and assets of AMA, any assets remaining after the payment of expenses and any other liabilities of AMA will be distributed to us and AMA as tenants-in-common or in some other reasonable manner. The net assets of AMA consist almost entirely of the Matisse Inventory. As of December 31, 2016 and 2015, the carrying value of the Matisse Inventory was $39 million and $41.4 million, respectively. As of December 31, 2016 and 2015, the carrying value of our investment in AMA was $7.9 million and $8.5 million, respectively. For the years ended December 31, 2016, 2015, and 2014, our results include $1.3 million, $2.8 million, and $0.7 million, respectively, of equity earnings related to AMA. From time-to-time, we transact with the principal shareholder of ACA in the normal course of our business.
RM Sotheby's—On February 18, 2015, we acquired a 25% ownership interest in RM Auctions, an auction house for investment-quality automobiles, for $30.7 million. Following our investment, RM Auctions is now known as RM Sotheby's. In addition to the initial 25% ownership interest, we have governance participation and a comprehensive partnership agreement to work together to drive growth in the business. Over time, we will have opportunities to increase our ownership stake as the partnership evolves and grows. As of December 31, 2016 and 2015, the carrying value of our investment in RM Sotheby's was $35.3 million and $33.2 million, respectively. For the years ended December 31, 2016 and 2015, our results include $2 million and $2.5 million, respectively, of equity earnings related to RM Sotheby's.
80
Note 6—Fixed Assets
As of December 31, 2016 and 2015, Fixed Assets consisted of the following (in thousands of dollars):
December 31, | 2016 | 2015 | ||||||
Land | $ | 92,155 | $ | 93,078 | ||||
Buildings and building improvements | 230,803 | 226,530 | ||||||
Leasehold improvements | 72,969 | 82,011 | ||||||
Computer hardware and software | 74,744 | 73,728 | ||||||
Furniture, fixtures and equipment | 76,829 | 78,529 | ||||||
Construction in progress | 3,621 | 2,090 | ||||||
Other | 5,257 | 2,015 | ||||||
Sub-total | 556,378 | 557,981 | ||||||
Less: Accumulated depreciation and amortization | (209,196 | ) | (203,487 | ) | ||||
Total Fixed Assets, net | $ | 347,182 | $ | 354,494 | ||||
For the years ended December 31, 2016, 2015, and 2014, Depreciation and Amortization related to Fixed Assets was $19.9 million, $19.5 million, and $20.6 million, respectively.
Note 7—Goodwill and Intangible Assets
Goodwill—As of January 1, 2015, all goodwill was attributable to the Agency segment. As discussed in Note 3, on January 11, 2016, we acquired AAP, a firm that provides a range of art-related services. Upon completion of the related purchase price allocation, $28.3 million of the resulting goodwill was allocated to the Agency segment and $6.2 million was allocated to the acquired art advisory business, which is reported within All Other for segment reporting purposes.
For the years ended December 31, 2016 and 2015, changes in the carrying value of Goodwill were as follows (in thousands of dollars):
Year ended December 31, 2016 | Year ended December 31, 2015 | |||||||||||||||||||||||
Agency | All Other | Total | Agency | All Other | Total | |||||||||||||||||||
Beginning balance | $ | 13,621 | $ | — | $ | 13,621 | $ | 14,017 | $ | — | $ | 14,017 | ||||||||||||
Goodwill acquired: | ||||||||||||||||||||||||
AAP (see Note 3) | 28,339 | 6,151 | 34,490 | — | — | — | ||||||||||||||||||
Orion Analytical (a) | 2,445 | — | 2,445 | — | — | — | ||||||||||||||||||
Foreign currency exchange rate changes | (527 | ) | — | (527 | ) | (396 | ) | — | (396 | ) | ||||||||||||||
Ending balance | $ | 43,878 | $ | 6,151 | $ | 50,029 | $ | 13,621 | $ | — | $ | 13,621 | ||||||||||||
(a) | On November 30, 2016, we acquired Orion Analytical, a materials analysis and consulting firm that utilizes state-of-the-art technical and scientific methods in the examination of art, cultural property, wine and other objects. With this acquisition, we have established a scientific research department that complements our existing world-class expertise and provenance research capabilities. |
81
Intangible Assets—As of December 31, 2016 and 2015, intangible assets consisted of the following (in thousands of dollars):
Amortization Period | December 31, 2016 | December 31, 2015 | ||||||||
Indefinite lived intangible assets: | ||||||||||
License (a) | N/A | $ | 324 | $ | 324 | |||||
Intangible assets subject to amortization: | ||||||||||
Customer relationships - AAP (see Note 3) | 8 years | 10,800 | — | |||||||
Non-compete agreements - AAP (see Note 3) | 6 years | 3,060 | — | |||||||
Artworks database (b) | 10 years | 1,125 | — | |||||||
Total intangible assets subject to amortization | 14,985 | — | ||||||||
Accumulated amortization | (1,916 | ) | — | |||||||
Total amortizable intangible assets (net) | 13,069 | — | ||||||||
Total intangible assets (net) | $ | 13,393 | $ | 324 | ||||||
(a) Relates to a license obtained in conjunction with the purchase of a retail wine business in 2008.
(b) Relates to a database containing historic information concerning repeat sales of works of art. This database was acquired in the third quarter of 2016.
For the year ended December 31, 2016, amortization expense related to intangible assets was approximately $1.9 million. No such amortization expense was recorded in 2015 and 2014.
The estimated aggregate amortization expense for the remaining useful lives of intangible assets subject to amortization during the five-year period succeeding the December 31, 2016 balance sheet date are as follows (in thousands of dollars):
Period | Amount | |||
2017 | $ | 1,972 | ||
2018 | $ | 1,972 | ||
2019 | $ | 1,972 | ||
2020 | $ | 1,972 | ||
2021 | $ | 1,972 | ||
Note 8—Pension Arrangements
Retirement Savings Plan—We sponsor a qualified defined contribution plan for our employees in the U.S. (the "Retirement Savings Plan"). Participants in the Retirement Savings Plan may elect to contribute between 2% and 50% of their eligible compensation, on a pre-tax or after-tax Roth basis. We may match participant savings with a contribution of up to 3% of eligible compensation. We may also contribute an annual discretionary amount to the Retirement Savings Plan, which varies as a percentage of each participant's eligible compensation depending on our profitability. For the years ended December 31, 2016, 2015, and 2014, we accrued discretionary contributions of $1.2 million, $1.3 million, and $1.3 million, respectively, related to the Retirement Savings Plan, which is equal to 2% of eligible compensation paid during those years. For the years ended December 31, 2016, 2015, and 2014, total pension expense related to matching and discretionary contributions to the Retirement Savings Plan, net of forfeitures, was $2.5 million, $2.4 million, and $2.4 million, respectively. Both participant and Company contributions to the Retirement Savings Plan are subject to limitations under Internal Revenue Service ("IRS") regulations.
Deferred Compensation Plan—We sponsor a non-qualified Deferred Compensation Plan (the "DCP"), which is available to certain U.S. officers for whom contributions to the Retirement Savings Plan are limited by IRS regulations. The DCP provides participants with a menu of investment crediting options that track a portfolio of various deemed investment funds. We credit participant accounts on the same basis as matching and discretionary contributions to the Retirement Savings Plan, as discussed above. For the years ended December 31, 2016, 2015, and 2014, we recorded discretionary accruals of $0.3 million, $0.3 million, and $0.4 million, respectively, related to the DCP, which is equal to 2% of eligible compensation paid during those years. For the years ended December 31, 2016, 2015, and 2014, total pension expense related to our matching and discretionary DCP accruals was $0.6 million, $0.8 million, and $0.9 million, respectively.
82
Employee deferrals and our accrued contributions to the DCP are informally funded into a rabbi trust which provides benefit security by sheltering assets in the event of a change-in-control of Sotheby's and certain other situations. DCP liabilities are financed through the trust almost entirely by using company-owned variable life insurance ("COLI"), and, to a much lesser extent, investments in money market mutual funds. As of December 31, 2016 and 2015, the DCP liability was $25.9 million and $39 million, respectively, and the assets held in the rabbi trust consisted of the following (in thousands of dollars):
December 31, | 2016 | 2015 | ||||||
Company-owned variable life insurance | $ | 25,114 | $ | 37,155 | ||||
Money market mutual fund investments | 1,599 | 688 | ||||||
Total | $ | 26,713 | $ | 37,843 | ||||
The decrease in the DCP assets and liabilities between the two year-end reporting periods is largely due to distributions made to employees who separated from service.
The COLI and money market mutual fund investments are aggregated and recorded on our Consolidated Balance Sheets within Trust Assets Related to Deferred Compensation Liability. The COLI is reflected at its cash surrender value. The money market mutual fund investments are classified as trading securities and reflected at their fair value.
Changes in the fair value of the DCP liability, which result from gains and losses in deemed participant investments, are recognized in our Consolidated Income Statements within Salaries and Related Costs in the period in which they occur. Gains in deemed participant investments increase the DCP liability, as well as Salaries and Related Costs. Losses in deemed participant investments decrease the DCP liability, as well as Salaries and Related Costs. For the years ended December 31, 2016, 2015, and 2014, net gains (losses) in deemed participant investments totaled $1.6 million, ($0.5) million, and $1.9 million, respectively.
Gains and losses resulting from changes in the cash surrender value of the COLI and the fair value of the money market mutual fund investments, as well as related COLI expenses (primarily for insurance), are recognized in our Consolidated Income Statements below Operating Income within Other Income (Expense) in the period in which they occur. For the years ended December 31, 2016, 2015, and 2014, net gains (losses) related to the COLI and the money market mutual fund investments were $0.4 million, ($2.7) million, and $0.3 million, respectively. In 2015, Other Income (Expense) also includes a $1.6 million death benefit recognized in the fourth quarter of 2015 under the COLI policy.
U.K. Defined Contribution Plan—Beginning on April 1, 2004, a defined contribution plan was made available to employees in the U.K. (the "U.K. Defined Contribution Plan"). Beginning in 2015, we may also contribute an annual discretionary amount to the U.K. Defined Contribution Plan, which varies as a percentage of each participant's eligible compensation depending on our profitability. For the years ended December 31, 2016 and 2015, we accrued discretionary contributions of $0.8 million and $0.7 million, respectively, related to the U.K. Defined Contribution Plan, both of which are equal to 2% of eligible compensation paid during those years. For the years ended December 31, 2016, 2015, and 2014, pension expense related to the U.K. Defined Contribution Plan was $4.3 million, $3.1 million, and $2.2 million, respectively. The increase in pension expense in 2016 is primarily attributable to additional contributions made on behalf of previously active participants in our U.K. defined benefit pension plan, who transferred into the U.K. Defined Contribution Plan after the defined benefit pension plan was closed to accrual of future service costs on April 30, 2016. See "U.K Defined Benefit Pension Plan" below.
83
U.K. Defined Benefit Pension Plan—We sponsor a defined benefit pension plan in the U.K. (the "U.K. Pension Plan"). Effective April 1, 2004, participation in the U.K. Pension Plan was closed to new employees. On April 30, 2016, after the completion of a statutory consultation process, the U.K. Pension Plan was closed to accrual of future service costs for active participants, who became participants in the U.K. Defined Contribution Plan. The tables below present detailed information related to the U.K. Pension Plan, including the recognition of a $17.9 million curtailment gain in 2015 that resulted from this plan closure.
Benefit Obligation, Plan Assets, and Funded Status
The table below details the changes in the projected benefit obligation, plan assets, and funded status of the U.K. Pension Plan, as well as the net pension asset recognized on our Consolidated Balance Sheets, as of December 31, 2016 and 2015 (in thousands of dollars):
December 31, | 2016 | 2015 | ||||||
Reconciliation of benefit obligation | ||||||||
Projected benefit obligation at beginning of year | $ | 326,243 | $ | 381,935 | ||||
Service cost | 1,086 | 4,497 | ||||||
Interest cost | 9,817 | 12,923 | ||||||
Contributions by plan participants | 232 | 877 | ||||||
Actuarial loss (gain) | 64,104 | (27,885 | ) | |||||
Curtailment gain | — | (17,895 | ) | |||||
Benefits paid | (12,176 | ) | (10,745 | ) | ||||
Foreign currency exchange rate changes | (61,687 | ) | (17,464 | ) | ||||
Projected benefit obligation at end of year | 327,619 | 326,243 | ||||||
Reconciliation of plan assets | ||||||||
Fair value of plan assets at beginning of year | 393,102 | 410,928 | ||||||
Actual return on plan assets | 73,806 | 9,996 | ||||||
Employer contributions | 24,748 | 2,163 | ||||||
Contributions by plan participants | 232 | 877 | ||||||
Benefits paid | (12,176 | ) | (10,745 | ) | ||||
Foreign currency exchange rate changes | (73,517 | ) | (20,117 | ) | ||||
Fair value of plan assets at end of year | 406,195 | 393,102 | ||||||
Funded Status | ||||||||
Net pension asset | $ | 78,576 | $ | 66,859 | ||||
As of December 31, 2016 and 2015, the net pension asset of $78.6 million and $66.9 million, respectively, was recorded within Other Long-Term Assets on our Consolidated Balance Sheets (see Note 12). For the year ended December 31, 2016, we contributed $24.7 million to the U.K. Pension Plan, including $24.2 million contributed in December 2016 in respect of the recently completed statutory triennial funding valuation of the plan. This contribution satisfied the resulting statutory funding deficit in-full. As discussed above, the U.K. Pension Plan is now closed to accrual of future service costs. Accordingly, we do not expect to pay regular contributions to the U.K. Pension Plan in 2017.
As of December 31, 2016 and 2015, the accumulated benefit obligation for the U.K. Pension Plan was $327.6 million and $325.8 million, respectively.
Components of Net Pension (Benefit) Cost
For the years ended December 31, 2016, 2015, and 2014, the components of the net pension (benefit) cost related to the U.K. Pension Plan are as follows (in thousands of dollars):
2016 | 2015 | 2014 | ||||||||||
Service cost | $ | 1,086 | $ | 4,497 | $ | 4,499 | ||||||
Interest cost | 9,817 | 12,923 | 15,633 | |||||||||
Expected return on plan assets | (17,798 | ) | (20,174 | ) | (23,166 | ) | ||||||
Amortization of actuarial loss | — | 3,967 | 2,346 | |||||||||
Amortization of prior service cost | — | 364 | — | |||||||||
Net pension (benefit) cost | $ | (6,895 | ) | $ | 1,577 | $ | (688 | ) | ||||
84
Net (Loss) Gain Recognized in Other Comprehensive (Loss) Income
The net (loss) gain related to the U.K. Pension Plan, which is recognized net of tax in Other Comprehensive (Loss) Income, is generally the result of: (i) actual results differing from previous actuarial assumptions (for example, the expected return on plan assets), (ii) changes in actuarial assumptions between balance sheet dates (for example, the discount rate), and/or (iii) curtailment gains. For the years ended December 31, 2016, 2015, and 2014, the net (loss) gain related to the U.K. Pension Plan was ($6.5) million, $29.4 million, and ($9.8) million, respectively.
Net Loss Included in Accumulated Other Comprehensive Loss
Net gains and (losses) related to the U.K. Pension Plan recognized in Other Comprehensive (Loss) Income are recorded net of tax in the Shareholders' Equity section of our Consolidated Balance Sheets within Accumulated Other Comprehensive Loss. As of December 31, 2016 and 2015, the net loss related to the U.K. Pension Plan recorded in Accumulated Other Comprehensive Loss was ($14.2) million and ($10) million, respectively.
If the amount recorded in Accumulated Other Comprehensive Loss exceeds 10% of the greater of (i) the market-related value of plan assets or (ii) the benefit obligation, that excess amount is amortized as a component of future net pension cost or benefit over the average expected future life of plan participants, which is approximately 30.8 years. The market-related value of plan assets adjusts the market value of plan assets by recognizing changes in fair value over a period of five years. It is expected that approximately $0.9 million ($1.1 million, pre-tax) of the ($14.2) million after-tax net loss related to the U.K. Pension Plan will be recognized as a reduction of the net pension benefit anticipated for the year ended December 31, 2017.
Assumptions
As of and for the years ended December 31, 2016, 2015, and 2014, the following assumptions were used in determining the benefit obligation and net pension (benefit) cost related to the U.K. Pension Plan:
Benefit Obligation | 2016 | 2015 | ||
Weighted average discount rate | 2.7% | 3.7% | ||
Weighted average rate of compensation increase | —% | —% | ||
Net Pension (Benefit) Cost | 2016 | 2015 | 2014 | |||
Weighted average discount rate | N/A | 3.5% | 4.4% | |||
Weighted average discount rate - service cost | 3.8% | 3.5% | 4.4% | |||
Weighted average discount rate - interest cost | 3.4% | 3.5% | 4.4% | |||
Weighted average rate of compensation increase | 4.1% | 4.1% | 4.6% | |||
Weighted average expected long-term rate of return on plan assets | 5.2% | 5.4% | 6.1% | |||
The discount rate represents the approximate weighted average rate at which the obligations of the U.K. Pension Plan could be effectively settled and is based on a yield curve for a selection of high-quality corporate bonds with maturity dates approximating the length of time remaining until individual benefit payment dates. Prior to 2016, the same discount rate was used for the service and interest cost components of the net pension (benefit) cost. In 2016, we elected to use separate discount rates for each of these components. The discount rate used for each component in 2016 contemplates a full yield curve in respect to the expected timing of the cash flows related to these components.
The measurement of the benefit obligation as of December 31, 2016 and 2015 does not include an assumption for future annual compensation increases due to the closure of the U.K. Pension Plan to the accrual of future service costs, as discussed above.
The expected long-term rate of return is weighted according to the composition of invested assets and is based on expected future appreciation, as well as dividend and interest yields currently available in the equity and bond markets. In particular, the expected rate of return for growth assets represents our estimate of median annualized returns by asset class. The expected rate of return on debt securities is based on interest yields currently available on long-dated U.K. government bonds and highly-rated corporate bonds. No allowance is made in the expected rate of return for potential market out-performance by fund managers.
85
Plan Assets
The investment policy for the U.K. Pension Plan is established by its Trustees in consultation with our management. The Trustees' investment objective is to maximize the return on assets while controlling the level of risk so as to ensure that sufficient assets are available to pay participants' benefits as and when they arise. In order to avoid an undue concentration of risk, a diverse spread of assets is held within the portfolio. The diversification is both within and across asset categories. Professional investment managers are provided target allocation percentages for different categories within each asset class; actual allocation percentages are permitted to fall within a reasonable range of these targets. In setting specific asset allocation targets, the Trustees take advice as required from professional investment advisors and require that the majority of the assets be realizable at short notice.
In 2014, the Trustees altered the asset allocation so that approximately 60% was allocated to growth assets and approximately 40% was allocated to debt securities and cash. As a result of the closure of the U.K. Pension Plan to the accrual of future service costs in April 2016 and our $24.2 million contribution to the plan in December 2016 (both as discussed above), there has been an improvement in the funded status of the plan. Accordingly, a further change in asset allocation was implemented in February 2017, which is intended to reduce investment risk and which has resulted in an approximate allocation of 40% to growth assets and 60% to debt securities and cash. A small holding in real estate is retained and is not subject to this allocation methodology.
The investment managers for the U.K. Pension Plan have full discretion in making investment decisions, subject to broad guidelines established by the Trustees. It is the Trustees' policy not to invest in the common stock of Sotheby's or any of its subsidiaries. The performance of the investment managers is benchmarked against suitable indices.
The table below presents the fair value of U.K. Pension Plan assets, by investment category, as of December 31, 2016 and 2015 (in thousands of dollars):
December 31, | 2016 | % of Total | 2015 | % of Total | ||||||||||
Growth assets | $ | 217,730 | 53.6 | % | $ | 240,214 | 61.1 | % | ||||||
Debt securities: | ||||||||||||||
Corporate | 35,973 | 8.9 | % | 36,772 | 9.4 | % | ||||||||
Index-linked | 134,972 | 33.2 | % | 112,049 | 28.5 | % | ||||||||
Total debt securities | 170,945 | 42.1 | % | 148,821 | 37.9 | % | ||||||||
Real estate mutual funds | 2,667 | 0.6 | % | 3,148 | 0.8 | % | ||||||||
Cash and cash equivalents | 14,853 | 3.7 | % | 919 | 0.2 | % | ||||||||
Total fair value of plan assets | $ | 406,195 | $ | 393,102 | ||||||||||
The assets of the U.K. Pension Plan, which are measured at fair value, are classified and disclosed according to one of the following categories:
• | Level 1—Quoted prices are available in active markets for identical assets or liabilities as of the reporting date. Level 1 inputs generally provide the most reliable evidence of fair value. |
• | Level 2—Pricing inputs are other than quoted prices in active markets, which are either directly or indirectly observable as of the reporting date, and fair value may be determined through the use of models or other valuation methodologies. |
• | Level 3—Pricing inputs are unobservable for the asset or liability and include situations where there is little, if any, market activity for the investment. The inputs into the determination of fair value require significant management judgment or estimation. |
86
The table below provides fair value measurement information for the U.K. Pension Plan assets as of December 31, 2016 (in thousands of dollars):
Fair Value Measurements Using: | |||||||||||||||
Total Fair Value | Quoted Prices in Active Markets (Level 1) | Significant Other Observable Inputs (Level 2) | Significant Unobservable Inputs (Level 3) | ||||||||||||
Growth assets | $ | 217,730 | $ | 171,286 | $ | 46,444 | $ | — | |||||||
Debt securities: | |||||||||||||||
Corporate | 35,973 | — | 35,973 | — | |||||||||||
Index-linked | 134,972 | 134,972 | — | ||||||||||||
Total debt securities | 170,945 | 134,972 | 35,973 | — | |||||||||||
Real estate mutual funds | 2,667 | — | 2,667 | — | |||||||||||
Cash and cash equivalents | 14,853 | 14,853 | — | — | |||||||||||
Total fair value of plan assets | $ | 406,195 | $ | 321,111 | $ | 85,084 | $ | — | |||||||
As of December 31, 2016, the following U.K. Pension Plan assets are classified as Level 1 fair value measurements:
Growth Assets—Includes investments in publicly-traded mutual funds and other publicly-traded stocks, the fair values of which are based on exchange quoted prices in active markets.
Debt Securities—Includes investments in publicly-traded bond mutual funds and other publicly-traded bonds, the fair values of which are based on exchange quoted prices in active markets.
Cash and Cash Equivalents—Includes investments in cash and money market instruments that are highly liquid and for which book value approximates fair value.
As of December 31, 2016, the following U.K. Pension Plan assets are classified as Level 2 fair value measurements:
Growth Assets—Includes investments in pooled funds which do not have directly observable quoted market prices, but for which the underlying value is determined by publicly-traded stocks that have directly observable exchange quoted prices in active markets.
Debt Securities—Includes investments in pooled funds which do not have directly observable quoted market prices, but for which the underlying value is determined by publicly-traded bonds that have directly observable exchange quoted prices in active markets.
Real Estate Mutual Funds—Includes investments in real estate mutual funds, the fair value of which are based on directly and indirectly observable real estate prices, including comparable prices.
Estimated Future Benefit Payments
Estimated future benefit payments related to the U.K. Pension Plan are as follows (in thousands of dollars):
Year | Benefit Payments | |||
2017 | $ | 8,149 | ||
2018 | $ | 8,494 | ||
2019 | $ | 8,015 | ||
2020 | $ | 8,863 | ||
2021 | $ | 10,945 | ||
2022 to 2026 | $ | 57,567 | ||
87
Note 9—Debt
Revolving Credit Facility—We are party to a credit agreement with an international syndicate of lenders, which provides for separate dedicated revolving credit facilities for the Agency segment (the "Agency Credit Facility") and SFS (the "SFS Credit Facility") (the "Credit Agreement"). On June 15, 2015, the Credit Agreement was amended to increase the commitments under the SFS Credit Facility in order to support the lending activities of the SFS business and to extend the maturity date of the Credit Agreement by one year to August 22, 2020.
The Agency Credit Facility and the SFS Credit Facility are asset-based revolving credit facilities which may be used primarily for the working capital and other general corporate needs of each segment, including for the funding of SFS loans. The Credit Agreement allows the proceeds from borrowings under each of the revolving credit facilities to be transferred between the Agency segment and SFS.
The maximum aggregate borrowing capacity of the Credit Agreement, which is subject to a borrowing base, is approximately $1.335 billion, with $300 million committed to the Agency segment and $1.035 billion committed to SFS, including a $485 million increase that was secured for SFS in conjunction with the June 2015 amendment. The borrowing capacity of the Agency Credit Facility includes a $50 million incremental revolving credit facility with higher advance rates against certain assets and higher commitment and borrowing costs (the "Incremental Facility"). In July 2016, the Credit Agreement was amended to extend the maturity date of the Incremental Facility by one year to August 22, 2017. This maturity date may be extended for an additional 365 days on an annual basis with the consent of the lenders who agree to extend their commitments under the Incremental Facility.
The Credit Agreement has a sub-limit of $400 million for foreign currency borrowings, with up to $50 million available for foreign currency borrowings under the Agency Credit Facility and up to $350 million available for foreign currency borrowings under the SFS Credit Facility. The Credit Agreement also includes an accordion feature, which allows us to seek an increase to the borrowing capacity of the Credit Agreement until February 23, 2020 by an amount not to exceed $150 million in the aggregate. Though new commitments would need to be obtained, the uncommitted accordion feature permits us to seek an increase to the aggregate commitments of the Credit Agreement under an expedited arrangement process.
The borrowing base under the Agency Credit Facility is determined by a calculation that is primarily based upon a percentage of the carrying values of certain auction guarantee advances (see Note 4), a percentage of the carrying value of certain inventory, a percentage of the carrying value of certain extended payment term receivables arising from auction or private sale transactions (see Note 4), and the fair value of certain of our trademarks. The borrowing base under the Incremental Facility is determined by a calculation that is based on a percentage of the carrying values of certain inventory and the fair value of certain of our trademarks. The borrowing base under the SFS Credit Facility is determined by a calculation that is primarily based on a percentage of the carrying value of certain SFS loans and the fair value of certain our trademarks.
The obligations under the Credit Agreements are cross-guaranteed and cross-collateralized. Domestic borrowers are jointly and severally liable for all obligations under the Credit Agreement and, subject to certain limitations, borrowers in the U.K. and Sotheby's Hong Kong Limited are jointly and severally liable for all obligations of the foreign borrowers under the Credit Agreement. In addition, the obligations of the borrowers under the Credit Agreement are guaranteed by certain of their subsidiaries. Our obligations under the Credit Agreement are secured by liens on all or substantially all of the personal property of the entities that are borrowers and guarantors under the Credit Agreement.
The Credit Agreement contains certain customary affirmative and negative covenants including, but not limited to, limitations on capital expenditures, a $600 million limitation on net outstanding auction guarantees (i.e., auction guarantees less the impact of related risk and reward sharing arrangements), and limitations on the use of proceeds from borrowings under the Credit Agreement.
The Credit Agreement does not limit dividend payments and common stock repurchases provided that, both before and after giving effect thereto: (i) there are no events of default, (ii) the aggregate available borrowing capacity equals or exceeds $100 million, and (iii) the Liquidity Amount, as defined in the Credit Agreement, equals or exceeds $200 million. The Credit Agreement also contains certain financial covenants, which are only applicable during certain defined compliance periods. These financial covenants were not applicable for the twelve month period ended December 31, 2016.
Since August 2009, we have incurred aggregate fees of approximately $21.7 million in conjunction with the establishment of and subsequent amendments to the Credit Agreement. These fees are being amortized on a straight-line basis through the August 22, 2020 maturity date of the Credit Agreement. As of December 31, 2016, $7.7 million of such unamortized fees are included within Other Long-Term Assets on our Consolidated Balance Sheets.
88
The following tables summarize information related to the Credit Agreement as of and for the years ended December 31, 2016, 2015, and 2014 (in thousands of dollars):
As of and for the year ended December 31, 2016 | Agency Credit Facility | SFS Credit Facility | Total | |||||||||
Maximum borrowing capacity | $ | 300,000 | $ | 1,035,000 | $ | 1,335,000 | ||||||
Borrowing base | $ | 165,443 | $ | 569,021 | $ | 734,464 | ||||||
Borrowings outstanding | $ | — | $ | 565,000 | $ | 565,000 | ||||||
Available borrowing capacity (a) | $ | 165,443 | $ | 4,021 | $ | 169,464 | ||||||
Average borrowings outstanding | $ | — | $ | 534,433 | $ | 534,433 | ||||||
Borrowing Costs: | ||||||||||||
Interest | $ | — | (b) | $ | 14,819 | (c) | $ | 14,819 | ||||
Fees | 2,712 | (b) | 2,919 | (c) | 5,631 | |||||||
Total | $ | 2,712 | $ | 17,738 | $ | 20,450 | ||||||
As of and for the year ended December 31, 2015 | Agency Credit Facility | SFS Credit Facility | Total | |||||||||
Maximum borrowing capacity | $ | 300,000 | $ | 1,035,000 | $ | 1,335,000 | ||||||
Borrowing base | $ | 225,642 | $ | 547,586 | $ | 773,228 | ||||||
Borrowings outstanding | $ | — | $ | 541,500 | $ | 541,500 | ||||||
Available borrowing capacity (a) | $ | 225,642 | $ | 6,086 | $ | 231,728 | ||||||
Average borrowings outstanding | $ | — | $ | 541,004 | $ | 541,004 | ||||||
Borrowing Costs: | ||||||||||||
Interest | $ | — | (b) | $ | 14,060 | (c) | $ | 14,060 | ||||
Fees | 2,752 | (b) | 1,720 | (c) | 4,472 | |||||||
Total | $ | 2,752 | $ | 15,780 | $ | 18,532 | ||||||
As of and for the year ended December 31, 2014 | Agency Credit Facility | SFS Credit Facility | Total | |||||||||
Maximum borrowing capacity | $ | 300,000 | $ | 550,000 | $ | 850,000 | ||||||
Borrowing base | $ | 237,830 | $ | 519,255 | $ | 757,085 | ||||||
Borrowings outstanding | $ | — | $ | 445,000 | $ | 445,000 | ||||||
Available borrowing capacity (a) | $ | 237,830 | $ | 74,255 | $ | 312,085 | ||||||
Average borrowings outstanding | $ | — | $ | 306,448 | $ | 306,448 | ||||||
Borrowing Costs: | ||||||||||||
Interest | $ | — | (b) | $ | 7,751 | (c) | $ | 7,751 | ||||
Fees | 2,240 | (b) | 989 | (c) | 3,229 | |||||||
Total | $ | 2,240 | $ | 8,740 | $ | 10,980 | ||||||
Legend:
(a) The available borrowing capacity is calculated as the borrowing base less borrowings outstanding.
(b) Borrowing costs related to the Agency Credit Facility, which include interest and fees, are reflected in our Consolidated Income Statements as Interest Expense. See the table below for additional information related to Interest Expense associated with the Agency Credit Facility.
(c) Borrowing costs related to the SFS Credit Facility are reflected in our Consolidated Income Statements within Cost of Finance Revenues. For the years ended December 31, 2016, 2015, and 2014, the weighted average cost of borrowings related to the SFS Credit Facility was approximately 3.3%, 2.9%, and 2.9%, respectively.
89
Long-Term Debt—As of December 31, 2016 and 2015, Long-Term Debt consisted of the following (in thousands of dollars):
December 31, | 2016 | 2015 | ||||||
York Property Mortgage, net of unamortized debt issuance costs of $5,555 and $6,565 | $ | 309,212 | $ | 315,504 | ||||
2022 Senior Notes, net of unamortized debt issuance costs of $3,642 and $4,251 | 296,358 | 295,749 | ||||||
Less current portion: | ||||||||
York Property Mortgage, net of unamortized debt issuance costs of $1,010 and $1,010 | (6,629 | ) | (6,292 | ) | ||||
Total Long-Term Debt, net | $ | 598,941 | $ | 604,961 | ||||
On January 1, 2016, we retrospectively adopted ASU 2015-03, which requires unamortized debt issuance costs to be included as a direct deduction from the related debt liability on the balance sheet. Under previous guidance, all unamortized debt issuance costs were reported as assets on the balance sheet. See Note 1 for information on the impact of the retrospective adoption of ASU 2015-03.
See the captioned sections below for information related to the York Property Mortgage and the 2022 Senior Notes.
York Property Mortgage—On February 6, 2009, we purchased the land and building located at 1334 York Avenue, New York, New York (the "York Property") from RFR Holding Corp. ("RFR") for a purchase price of $370 million. The York Property is home to our sole North American auction salesroom and principal North American exhibition space, including S|2, our private sale exhibition gallery. The York Property is also home to the U.S. operations of SFS, as well as our corporate offices.
We financed the $370 million purchase price through an initial $50 million cash payment made in conjunction with the signing of the related purchase and sale agreement on January 11, 2008, an $85 million cash payment made when the purchase was consummated on February 6, 2009, and the assumption of a $235 million mortgage that carried an initial annual rate of interest of approximately 5.6% (the "Original York Property Mortgage"). The Original York Property Mortgage was due to mature on July 1, 2035, but had an optional pre-payment date of July 1, 2015, after which the annual rate of interest was scheduled to increase to 10.6%.
On July 1, 2015, we entered into a seven-year, $325 million mortgage loan (the "York Property Mortgage") to refinance the Original York Property Mortgage. After the repayment of the Original York Property Mortgage and the funding of all closing costs, reserves, and expenses, we received net cash proceeds of approximately $98 million. The York Property Mortgage bears interest based on the one-month LIBOR rate (the "LIBOR rate") plus a spread of 2.25% and is being amortized based on a 25-year mortgage-style amortization schedule over its seven-year term, with the then-remaining principal balance of $268.2 million due to be paid on the July 1, 2022 maturity date.
In connection with the York Property Mortgage, we entered into interest rate protection agreements secured by the York Property, consisting of a two-year interest rate swap effective as of July 1, 2015 and a five-year interest rate collar effective as of July 1, 2017. See Note 10 for additional information related to the interest rate protection agreements.
The York Property, the York Property Mortgage, and the related interest rate protection agreements are held by 1334 York, LLC (the "LLC"), a separate legal entity of Sotheby's that maintains its own books and records and whose results are ultimately consolidated into our Consolidated Financial Statements. The LLC is the sole owner and lessor of the York Property. The LLC presently leases the York Property to Sotheby's, Inc., which is also controlled by Sotheby's. The assets of the LLC are not available to satisfy the obligations of our other affiliates or any other entity.
90
The loan agreement governing the York Property Mortgage contains the following financial covenants, which are subject to additional terms and conditions as provided in the underlying loan agreement:
• | As of July 1, 2020, the LTV ratio (i.e., the principal balance of the York Property Mortgage divided by the appraised value of the York Property) may not exceed 65% (the "Maximum LTV") based on the then-outstanding principal balance of the York Property Mortgage. If the LTV ratio exceeds the Maximum LTV, the LLC may, at its option, post cash or a letter of credit or pay down the York Property Mortgage without any prepayment penalty or premium, in an amount that will cause the LTV ratio not to exceed the Maximum LTV. |
• | At all times during the term of the York Property Mortgage, the Debt Yield will not be less than 8.5% (the "Minimum Debt Yield"). The Debt Yield is calculated by dividing the annual net operating income of the LLC, which primarily consists of lease income from Sotheby's, Inc. (calculated on a cash basis), by the outstanding principal balance of the York Property Mortgage. If the Debt Yield falls below the Minimum Debt Yield, the LLC has the option to post cash or a letter of credit or prepay the York Property Mortgage without any prepayment penalty or premium, in an amount that will cause the Debt Yield to exceed the Minimum Debt Yield. |
• | If our corporate credit rating from Standard & Poor's Rating Services ("S&P") is downgraded to "BB-", the lender may require that the LLC establish cash management accounts (the "Cash Management Accounts") under the lender's control for potential monthly debt service, insurance, and tax payments. If the rating is downgraded to "B+" or "B", the lender may require the LLC to deposit a certain amount of debt service into the Cash Management Accounts (approximately 6 and 12 months of debt service, respectively). If the rating is downgraded to lower than "B", the LLC must make principal payments on the mortgage such that the LTV ratio does not exceed 65%. On February 9, 2016, our corporate credit rating from S&P was downgraded to "BB-" from "BB". As a result, a Cash Management Account was established under the control of the lender for monthly debt service, insurance, and tax payments. The lender will retain any excess cash after debt service, insurance, and taxes as security (estimated to be $6 million annually). As of December 31, 2016, the Cash Management Account had a balance of $4.6 million, which is reflected within Restricted Cash on our Consolidated Balance Sheets. |
• | At all times during the term of the York Property Mortgage, we are required to maintain a net worth of at least $425 million, subject to a cure period. |
As of December 31, 2016, the fair value of the York Property Mortgage approximates its book value due to the variable interest rate associated with the mortgage. This fair value measurement is considered to be a Level 2 fair value measurement in the fair value hierarchy as per Accounting Standards Codification 820, Fair Value Measurements ("ASC 820").
2022 Senior Notes—On September 27, 2012, we issued $300 million aggregate principal amount of 5.25% Senior Notes, due October 1, 2022 (the "2022 Senior Notes"). The 2022 Senior Notes were offered only to qualified institutional buyers in accordance with Rule 144A and to non-U.S. Persons under Regulation S under the Securities Act of 1933, as amended (the "Securities Act"). Holders of the 2022 Senior Notes do not have registration rights, and the 2022 Senior Notes have not been and will not be registered under the Securities Act.
The net proceeds from the issuance of the 2022 Senior Notes were approximately $294.6 million, after deducting fees paid to the initial purchasers, and were principally used to retire $80 million of unsecured debt that was due in June 2015 and $182 million of convertible debt that was due in June 2013.
The 2022 Senior Notes are guaranteed, jointly and severally, on a senior unsecured basis by certain of our existing and future domestic subsidiaries to the extent and on the same basis that such subsidiaries guarantee borrowings under the Credit Agreement. Interest on the 2022 Senior Notes is payable semi-annually in cash on April 1 and October 1 of each year.
We may redeem the 2022 Senior Notes, in whole or in part, on or after October 1, 2017, at specified redemption prices set forth in the underlying indenture, plus accrued and unpaid interest to, but excluding, the redemption date. Prior to October 1, 2017, we may redeem the 2022 Senior Notes, in whole or in part, at a redemption price equal to 100% of the principal amount to be redeemed, plus accrued and unpaid interest to, but excluding, the redemption date, plus a premium equal to the greater of 1% of the principal amount of the 2022 Senior Notes and a make-whole premium (as defined in the underlying indenture). The 2022 Senior Notes are not callable by holders unless we are in default under the terms of the underlying indenture.
As of December 31, 2016, the $300 million principal amount of 2022 Senior Notes had a fair value of approximately $297.8 million based on a broker quoted price derived via a pricing model using observable and unobservable inputs. As such, this fair value measurement is considered to be a Level 3 fair value measurement in the fair value hierarchy as per ASC 820.
91
Future Principal and Interest Payments—The aggregate future principal and interest payments due under the Credit Agreement, the York Property Mortgage, and the 2022 Senior Notes during the five year period after December 31, 2016 are as follows (in thousands of dollars):
Year | Amount | |||
2017 | $ | 34,650 | ||
2018 | $ | 36,586 | ||
2019 | $ | 36,597 | ||
2020 | $ | 601,607 | ||
2021 | $ | 36,620 | ||
In consideration of the interest rate protection agreements relating to the York Property Mortgage, the table above assumes that the annual interest rate for the first two years of the mortgage will be approximately 3.127%, and then will be at the interest rate collar's floor rate of 4.167% for the remainder of the seven-year term.
Interest Expense—For the years ended December 31, 2016, 2015, and 2014, Interest Expense consisted of the following (in thousands of dollars):
December 31, | 2016 | 2015 | 2014 | |||||||||
Agency Credit Facility: | ||||||||||||
Amendment and arrangement fees | $ | 1,123 | $ | 1,167 | $ | 1,096 | ||||||
Commitment fees | 1,589 | 1,585 | 1,144 | |||||||||
Sub-total | 2,712 | 2,752 | 2,240 | |||||||||
York Property Mortgage | 11,121 | 13,537 | 16,335 | |||||||||
2022 Senior Notes | 16,402 | 16,394 | 16,394 | |||||||||
Other interest expense | 75 | 62 | 220 | |||||||||
Total Interest Expense | $ | 30,310 | $ | 32,745 | $ | 35,189 | ||||||
In the table above, Interest Expense related to the York Property Mortgage and the 2022 Senior Notes includes the amortization of debt issuance costs and, when applicable, the amortization of discount. Borrowing costs related to the SFS Credit Facility are reflected within Cost of Finance Revenues in our Consolidated Income Statements.
Interest Paid—In 2016, 2015, and 2014, interest paid totaled $44.5 million, $53.5 million, and $42.4 million, respectively. Interest paid in 2016, 2015, and 2014 includes $27.8 million, $36 million, and $31.2 million respectively, attributable to the Agency segment, which primarily relates to the York Property Mortgage (including $7.1 million of amounts paid to refinance the previous mortgage in July 2015), our long-term debt securities, and revolving credit facility fees. Interest paid in 2016, 2015, and 2014 includes $16.7 million, $17.5 million and $11.2 million, respectively, attributable to the SFS Credit Facility, which relates to revolving credit facility borrowings and fees.
Note 10—Derivative Financial Instruments
Derivative Financial Instruments Designated as Hedging Instruments—The following tables summarize fair value information related to the derivative financial instruments designated as hedging instruments and recorded on our Consolidated Balance Sheets as of December 31, 2016 and 2015 (in thousands of dollars):
Assets | Liabilities | ||||||||||||
December 31, 2016 | Balance Sheet Classification | Fair Value | Balance Sheet Classification | Fair Value | |||||||||
Cash Flow Hedges: | |||||||||||||
Interest rate swaps | Other Current Assets | $ | 82 | Other Current Liabilities | $ | 163 | |||||||
Interest rate collar | N/A | — | Other Long-Term Liabilities | 5,952 | |||||||||
Total cash flow hedges | 82 | — | 6,115 | ||||||||||
Net Investment Hedges: | |||||||||||||
Foreign exchange contracts | Other Current Assets | 30,258 | N/A | — | |||||||||
Total | $ | 30,340 | $ | 6,115 | |||||||||
92
Assets | Liabilities | |||||||||||
December 31, 2015 | Balance Sheet Classification | Fair Value | Balance Sheet Classification | Fair Value | ||||||||
Cash Flow Hedges: | ||||||||||||
Interest rate swaps | N/A | $ | — | Other Current Liabilities | $ | 360 | ||||||
Interest rate collar | N/A | — | Other Long-Term Liabilities | 6,816 | ||||||||
Total cash flow hedges | — | 7,176 | ||||||||||
Net Investment Hedges: | ||||||||||||
Foreign exchange contracts | N/A | — | N/A | — | ||||||||
Total | $ | — | $ | 7,176 | ||||||||
The following tables summarize the effect of the derivative financial instruments designated as hedging instruments on our Consolidated Income Statements and Consolidated Statements of Comprehensive Income for the years ended December 31, 2016 and 2015 (in thousands of dollars):
Gain (Loss) Recognized in Other Comprehensive (Loss) Income - Effective Portion | Classification of Gain (Loss) Reclassified from Accumulated Other Comprehensive Loss into Net Income | Amount Reclassified from Accumulated Other Comprehensive Loss into Net Income - Effective Portion | ||||||||||||||||
Year Ended December 31, | 2016 | 2015 | 2016 | 2015 | ||||||||||||||
Cash Flow Hedges: | ||||||||||||||||||
Interest rate swaps | $ | (704 | ) | $ | (802 | ) | Interest Expense | $ | 813 | $ | 688 | |||||||
Interest rate collar | 533 | (4,192 | ) | Interest Expense | — | — | ||||||||||||
Total cash flow hedges | (171 | ) | (4,994 | ) | 813 | 688 | ||||||||||||
Net Investment Hedges: | ||||||||||||||||||
Foreign exchange contracts | 16,618 | — | Other Income/(Expense) | — | — | |||||||||||||
Total | $ | 16,447 | $ | (4,994 | ) | $ | 813 | $ | 688 | |||||||||
See the captioned sections below for information related to derivative financial instruments designated as cash flow hedges and derivative financial instruments designated as net investment hedges.
Derivative Financial Instruments Designated as Cash Flow Hedges—On July 1, 2015, we entered into a seven-year, $325 million mortgage loan to refinance the previous mortgage on the York Property. The York Property Mortgage bears interest based on the one-month LIBOR rate plus a spread of 2.25% and is being amortized based on a 25-year mortgage-style amortization schedule over its seven-year term. In connection with the York Property Mortgage, we entered into interest rate protection agreements secured by the York Property, consisting of a two-year interest rate swap (the "Mortgage Swap"), effective as of July 1, 2015, and a five-year interest rate collar (the "Mortgage Collar"), effective as of July 1, 2017. The Mortgage Swap and the Mortgage Collar each have a notional amount equal to the applicable principal balance of the York Property Mortgage and have an identical amortization schedule to that of the mortgage. These interest rate protection agreements effectively hedge the LIBOR rate on the entire outstanding principal balance of the York Property Mortgage at an annual rate equal to 0.877% for the first two years, and then at an annual rate of no less than 1.917%, but no more than 3.75%, for the remainder of the seven-year term. After taking into account the interest rate protection agreements, the annual interest rate for the first two years of the York Property Mortgage will be approximately 3.127% and then will be between a floor of 4.167% and a cap of 6% for the remainder of the seven-year term. As of December 31, 2016, the notional value of the Mortgage Swap was $314.8 million and the notional value of the Collar was $310.3 million. The York Property, the York Property Mortgage, and the related interest rate protection agreements are held by 1334 York, LLC, a separate legal entity of Sotheby's that maintains its own books and records and whose results are ultimately consolidated into our financial statements. See Note 9 for additional information related to the York Property Mortgage.
On November 21, 2016, we entered into a two-year interest rate swap agreement (the “SFS Swap”) to eliminate the variability in expected cash outflows associated with the one-month LIBOR indexed interest payments owed on $63 million of SFS Credit Facility borrowings. As of December 31, 2016, the notional value of the SFS Swap was $63 million. See Note 9 for additional information related to the SFS Credit Facility.
93
At their inception, the Mortgage Swap, the Mortgage Collar, and the SFS Swap (collectively, the "Cash Flow Hedges")were each individually designated as cash flow hedges of the risk associated with the variability in expected cash outflows related to the one-month LIBOR-indexed interest payments owed on their respective debt instruments. Accordingly, to the extent that each of the Cash Flow Hedges are effective, any unrealized gains and losses related to changes in their fair value are recorded to Accumulated Other Comprehensive Loss on our Consolidated Balance Sheets and then reclassified to Interest Expense in our Consolidated Income Statements as interest expense related to the underlying debt instruments is recorded. Any hedge ineffectiveness is immediately recognized in Interest Expense. There was no hedge ineffectiveness related to the Cash Flow Hedges during the years ended December 31, 2016 and 2015. Management performs a quarterly assessment to determine whether each of the Cash Flow Hedges continues to be highly effective in hedging the risk associated with the variability in expected cash outflows related to the one-month LIBOR-indexed interest payments owed on their respective debt instruments.
The assets and liabilities associated with the Cash Flow Hedges have been designated as Level 2 fair value measurements within the fair value hierarchy provided by ASC 820. Level 2 fair value measurements have pricing inputs other than quoted prices in active markets, which are either directly or indirectly observable as of the reporting date. Level 2 fair value measurements may be determined through the use of models or other valuation methodologies. The fair value of the Mortgage Swap is based on a discounted cash flow methodology using the contractual terms of the instrument and observable LIBOR-curve rates that are consistent with the timing of the interest payments related to the York Property Mortgage. The fair value of the Mortgage Collar is based on an option pricing model using observable LIBOR-curve rates for each forecasted monthly settlement, with the projected cash flows discounted using the contractual terms of the instrument. The fair value of the SFS Swap is based on a discounted cash flow methodology using the contractual terms of the instrument and observable LIBOR-curve rates that are consistent with the timing of the interest payments related to the SFS Credit Facility.
Derivative Financial Instruments Designated as Net Investment Hedges—In the fourth quarter of 2015, in consideration of the expansion of our common stock repurchase program, as well as the need for cash in the U.S. to fund other corporate strategic initiatives, management assessed its U.S. and foreign cash needs and concluded that approximately $600 million of accumulated foreign earnings would be repatriated to the U.S. in the foreseeable future. As of December 31, 2016, approximately $330 million of these foreign earnings had been repatriated and used, in part, to fund common stock repurchases. We expect that additional repatriations will be made, though the specific timing of any further repatriation of foreign earnings is currently uncertain and is being evaluated. These accumulated foreign earnings represented, at that time, almost the entire value of our net investments in the subsidiaries from which the earnings are being repatriated. As a result, we are exposed to variability in the U.S. Dollar equivalent of these net investments and, by extension, the U.S. Dollar equivalent of any foreign earnings repatriated to the U.S. due to potential changes in foreign currency exchange rates. In 2016, we entered into foreign currency forward exchange contracts with a aggregate notional value $309.1 million, which hedge the net investment in certain of our foreign subsidiaries. As of December 31, 2016, the aggregate notional value of the net investment hedge contracts that remained outstanding was $213.8 million.
We use the forward rate method to assess the effectiveness of our net investment hedges. Under the forward rate method, if both the notional amount of the derivative designated as a hedge of a net investment in a foreign subsidiary equals the portion of the net investment designated as being hedged and the derivative relates solely to the foreign exchange rate between the functional currency of the hedged net investment and the investor’s functional currency, then all changes in fair value of the derivative are reported in the cumulative translation adjustment accounts within Accumulated Other Comprehensive Loss on our Consolidated Balance Sheets.
The foreign currency forward exchange contracts designated as net investment hedges are considered Level 2 fair value measurements within the fair value hierarchy provided by ASC 820. Level 2 fair value measurements have pricing inputs other than quoted prices in active markets, which are either directly or indirectly observable as of the reporting date, and fair value may be determined through the use of models or other valuation methodologies. The fair value of these foreign currency forward exchange contracts is based on the estimated amount to settle the contracts using applicable market exchange rates as of the balance sheet date.
Derivative Financial Instruments Not Designated as Hedging Instruments—We also utilize forward contracts to hedge cash flow exposures related to foreign currency exchange rate movements arising from short-term foreign currency denominated intercompany balances and, to a much lesser extent, foreign currency denominated client payable balances, as well as foreign currency denominated auction guarantee obligations. Such forward exchange contracts are typically short-term with settlement dates less than six months from their inception. All instruments used to offset cash flow exposures related to foreign currency exchange rate movements are not designated as hedging instruments for accounting purposes. Accordingly, changes in the fair value of these instruments are recognized in our Consolidated Income Statements in Other Income (Expense).
94
As of December 31, 2016, the notional value of outstanding forward exchange contracts not designated as hedging instruments was $258.8 million. Notional values do not quantify risk or represent our assets or liabilities, but are used to calculate cash settlements under outstanding forward exchange contracts. We are exposed to credit-related risks in the event of nonperformance by the two counterparties to our outstanding forward exchange contracts. We do not expect any of these counterparties to fail to meet their obligations, given their high short-term (A1/P1) credit ratings. As of December 31, 2016, the aggregate fair value of these contracts represented a liability of $3.6 million, which was recorded on our Consolidated Balance Sheets within Accounts Payable and Accrued Liabilities. As of December 31, 2015 the aggregate fair value of these contracts was not material to our Consolidated Financial Statements.
Note 11—Other Current Liabilities
In the second quarter of 2016, we sold an undivided legal and beneficial 50% ownership interest in a Fancy Vivid Pink Diamond (the "Pink Diamond"), weighing 59.60 carats, for $34.2 million in cash. The entire value of the Pink Diamond will continue to be reported within Inventory on our Consolidated Balance Sheets pending the future sale of a 100% interest in the property. Until such time, the $34.2 million we received will be recorded within Other Current Liabilities on our Consolidated Balance Sheets. Upon completion of the future sale of a 100% interest in the Pink Diamond, the revenue associated with the final sale will include the $34.2 million already collected and will be recorded within Inventory Sales on our Consolidated Income Statements with the corresponding acquisition cost recorded as Cost of Inventory Sales.
Note 12—Supplemental Consolidated Balance Sheet Information
As of December 31, 2016 and 2015, Prepaid Expenses and Other Current Assets consisted of the following (in thousands of dollars):
December 31, | 2016 | 2015 | ||||||
Prepaid expenses | $ | 20,436 | $ | 19,422 | ||||
Derivative financial instruments (see Note 10) | 30,340 | — | ||||||
Other (a) | 25,831 | 14,507 | ||||||
Total Prepaid and Other Current Assets | $ | 76,607 | $ | 33,929 | ||||
(a) Other includes insurance recoveries and other miscellaneous short-term assets.
As of December 31, 2016 and 2015, Other Long-Term Assets consisted of the following (in thousands of dollars):
December 31, | 2016 | 2015 | ||||||
Defined benefit pension plan asset (see Note 8) | $ | 78,576 | $ | 66,859 | ||||
Equity method investments (see Note 5) | 43,143 | 41,744 | ||||||
Other | 16,992 | 15,696 | ||||||
Total Other Long-Term Assets | $ | 138,711 | $ | 124,299 | ||||
As of December 31, 2016 and 2015, Other Long-Term Liabilities consisted of the following (in thousands of dollars):
December 31, | 2016 | 2015 | ||||||
Acquisition earn-out consideration (see Note 3) | $ | 26,250 | $ | — | ||||
Interest rate collar liability (see Note 10) | 5,952 | 6,816 | ||||||
Other | 6,964 | 8,793 | ||||||
Total Other Long-Term Liabilities | $ | 39,166 | $ | 15,609 | ||||
95
Note 13—Supplemental Consolidated Cash Flow Information
For the years ended December 31, 2016, 2015 and 2014, changes in other operating assets and liabilities as reported in the Consolidated Statements of Cash Flows included the following (in thousands of dollars):
December 31, | 2016 | 2015 | 2014 | |||||||||
Decrease (increase) in: | ||||||||||||
Prepaid expenses and other current assets | $ | (14,510 | ) | $ | (6,562 | ) | $ | (9,559 | ) | |||
Other long-term assets | (10,006 | ) | 13,641 | 4,330 | ||||||||
Income tax receivables and deferred income tax assets | 2,395 | 22,144 | 7,168 | |||||||||
Increase (decrease) in: | ||||||||||||
Accrued income taxes and deferred income tax liabilities | 14,879 | (27,325 | ) | (9,309 | ) | |||||||
Accounts payable and accrued liabilities and other liabilities | 17,297 | (29,530 | ) | 20,776 | ||||||||
Total changes in other operating assets and liabilities | $ | 10,055 | $ | (27,632 | ) | $ | 13,406 | |||||
Note 14—Shareholders' Equity and Dividends
Common Stock—Our common stock is traded on the New York Stock Exchange (the "NYSE") under the symbol BID. Each share of our common stock has a par value of $0.01 per share and is entitled to one vote. As of December 31, 2016 and 2015, there were 52,971,232 and 65,791,119 shares of common stock outstanding, respectively.
Preferred Stock—We have the authority to issue 50 million shares of no par value preferred stock. No shares of preferred stock were outstanding as of December 31, 2016 and 2015.
Common Stock Repurchase Program—The following table provides information regarding our common stock repurchase program as of and for the years ended December 31, 2016, 2015, and 2014 (in thousands, except for per share data):
2016 | 2015 | 2014 | Three-Year Total | ||||||||||||
Shares repurchased | 13,144 | 3,706 | 558 | 17,408 | |||||||||||
Aggregate purchase price | $ | 359,885 | $ | 125,000 | $ | 25,000 | $ | 509,885 | |||||||
Average price per share | $ | 27.38 | $ | 33.73 | $ | 44.79 | $ | 29.29 | |||||||
Repurchase authorization outstanding | $ | 40,226 | $ | 125,000 | $ | 125,000 | $ | 40,226 | |||||||
On January 29, 2014, our Board of Directors authorized a five-year, $150 million common stock repurchase program. In March 2014, we repurchased 558,171 shares of common stock under this authorization for an aggregate purchase price of $25 million ($44.79 per share) pursuant to an accelerated stock repurchase ("ASR") agreement.
On August 6, 2015, our Board of Directors approved an increase of $125 million to the share repurchase authorization, which resulted in an updated authorization of $250 million as of that date. On August 13, 2015, we entered into an ASR agreement (the "August 2015 ASR Agreement") pursuant to which we received an initial delivery of 2,667,378 shares of our common stock for an initial purchase price of $125 million. The initial shares received on August 13, 2015 had a value of $100 million, or $37.49 per share. In November 2015, the counterparty to the August 2015 ASR Agreement elected to conclude the agreement, and we received an additional 1,038,280 shares of our common stock. Accordingly, the August 2015 ASR Agreement resulted in the total repurchase of 3,705,658 shares of our common stock for an average price of $33.73 per share.
On January 21, 2016, our Board of Directors approved a $200 million increase to the share repurchase authorization, which resulted in an updated authorization of $325 million as of that date, and on September 30, 2016, approved an additional share repurchase authorization of $75 million. The share repurchases made in 2016 include open market purchases, purchases made pursuant to a Rule 10b5-1 plan, and purchases made pursuant to an agreement with funds managed by Marcato Capital Management LP ("Marcato") in which we agreed to acquire 2,050,000 shares of our common stock from Marcato for an aggregate purchase price of $73.8 million, or $36.00 per share. At the time of this agreement, Marcato owned 8.5% of our outstanding common stock.
The timing of further share repurchases and the actual amount purchased will depend on a variety of factors including the market price of our common stock, general market and economic conditions, securities law requirements, and other corporate considerations. Repurchases may continue to be made pursuant to plans intended to comply with Rule 10b5-1 under the Exchange Act, which allows us to purchase our shares during periods when we otherwise might be prevented from doing so under insider trading laws or because of self-imposed trading blackout periods. The repurchase authorization does not require the purchase of a specific number of shares and is subject to suspension or termination by our Board of Directors at any time.
96
Quarterly Cash Dividends—The following table summarizes cash dividends declared and paid in each of the quarterly periods in the years ended December 31, 2016, 2015, and 2014 (in thousands of dollars, except per share amounts):
2016 | 2015 | 2014 | |||||||||||||||||||||||
Per Share | Amount | Per Share | Amount | Per Share | Amount | ||||||||||||||||||||
Quarter Ended | |||||||||||||||||||||||||
March 31 | $ | — | $ | — | $ | 0.10 | $ | 6,944 | $ | 0.10 | $ | 6,944 | |||||||||||||
June 30 | — | — | 0.10 | 6,933 | 0.10 | 6,894 | |||||||||||||||||||
September 30 | — | — | 0.10 | 6,667 | 0.10 | 6,899 | |||||||||||||||||||
December 31 | — | — | 0.10 | 6,563 | 0.10 | 6,899 | |||||||||||||||||||
Total | $ | — | $ | — | $ | 0.40 | $ | 27,107 | $ | 0.40 | $ | 27,636 | |||||||||||||
On January 21, 2016, our Board of Directors decided to eliminate the $0.10 per share quarterly cash dividend and, instead, allocate the capital to repurchase shares of common stock.
Special Dividend—On January 29, 2014, our Board of Directors declared a special dividend of $300 million ($4.34 per share) that was paid on March 17, 2014. The special dividend was funded principally by the repatriation of $250 million of cash from our foreign subsidiaries, with the remaining $50 million funded by then existing domestic cash balances. In conjunction with this special dividend, we accrued approximately $11 million for dividend equivalents related to unvested share-based payments to employees. These accrued dividend equivalents were charged to Retained Earnings. Through December 31, 2016, approximately $7.2 million of such dividends have been paid to employees upon the vesting of the share-based payments, including $1.4 million, $2 million, and $3.8 million paid in each of March 2016, 2015, and 2014, respectively.
97
Note 15—Accumulated Other Comprehensive Loss
The following is a summary of the changes in Accumulated Other Comprehensive Loss and the details regarding any reclassification adjustments made during the period January 1, 2014 to December 31, 2016 (in thousands of dollars):
2016 | 2015 | 2014 | ||||||||||
Currency Translation Adjustments | ||||||||||||
Balance at January 1 | $ | (52,279 | ) | $ | (33,223 | ) | $ | (1,352 | ) | |||
Other comprehensive loss before reclassifications, net of tax of ($13,113), ($6,345), and ($2,376) | (37,199 | ) | (18,951 | ) | (33,929 | ) | ||||||
Reclassifications from other comprehensive (loss) income | — | (105 | ) | 2,058 | ||||||||
Other comprehensive loss | (37,199 | ) | (19,056 | ) | (31,871 | ) | ||||||
Balance at December 31 | (89,478 | ) | (52,279 | ) | (33,223 | ) | ||||||
Cash Flow Hedges | ||||||||||||
Balance at January 1 | (4,306 | ) | — | — | ||||||||
Other comprehensive loss before reclassifications, net of tax of ($106), ($3,126), and $0 | (171 | ) | (4,994 | ) | — | |||||||
Reclassifications from other comprehensive (loss) income, net of tax of $502, $430, and $0 | 813 | 688 | — | |||||||||
Other comprehensive income (loss) | 642 | (4,306 | ) | — | ||||||||
Balance at December 31 | (3,664 | ) | (4,306 | ) | — | |||||||
Net Investment Hedges | ||||||||||||
Balance at January 1 | — | — | — | |||||||||
Other comprehensive income before reclassifications, net of tax of $10,354, $0, and $0 | 16,618 | — | — | |||||||||
Other comprehensive income | 16,618 | — | — | |||||||||
Balance at December 31 | 16,618 | — | — | |||||||||
Defined Benefit Pension Plan | ||||||||||||
Balance at January 1 | (9,619 | ) | (43,543 | ) | (38,101 | ) | ||||||
Currency translation adjustments | 2,300 | 1,097 | 2,468 | |||||||||
Net actuarial (loss) gain, net of tax of ($1,427), $6,445, and ($2,447) | (6,515 | ) | 29,363 | (9,787 | ) | |||||||
Prior service cost amortization, net of tax of $0, $73, and $0 | — | 291 | — | |||||||||
Actuarial loss amortization, net of tax of $0, $794, and $469 | — | 3,173 | 1,877 | |||||||||
Other comprehensive (loss) income | (4,215 | ) | 33,924 | (5,442 | ) | |||||||
Balance at December 31 | (13,834 | ) | (9,619 | ) | (43,543 | ) | ||||||
Total other comprehensive (loss) income attributable to Sotheby's | (24,154 | ) | 10,562 | (37,313 | ) | |||||||
Accumulated comprehensive loss as of December 31 | $ | (90,358 | ) | $ | (66,204 | ) | $ | (76,766 | ) | |||
98
Year Ended December 31, | 2016 | 2015 | 2014 | |||||||||
Cumulative Translation Adjustments | ||||||||||||
(Gain) loss upon liquidation of foreign subsidiary | $ | — | $ | (105 | ) | $ | 2,058 | |||||
Tax effect | — | — | — | |||||||||
Reclassification adjustment, net of tax | — | (105 | ) | 2,058 | ||||||||
Cash Flow Hedges | ||||||||||||
Settlement of interest rate swaps | 1,315 | 1,118 | — | |||||||||
Tax effect | (502 | ) | (430 | ) | — | |||||||
Reclassification adjustment, net of tax | 813 | 688 | — | |||||||||
Defined Benefit Pension Plan | ||||||||||||
Prior service cost amortization | — | 364 | — | |||||||||
Actuarial loss amortization | — | 3,967 | 2,346 | |||||||||
Pre-tax total | — | 4,331 | 2,346 | |||||||||
Tax effect | — | (867 | ) | (469 | ) | |||||||
Reclassification adjustments, net of tax | — | 3,464 | 1,877 | |||||||||
Total reclassification adjustments, net of tax | $ | 813 | $ | 4,047 | $ | 3,935 | ||||||
Note 16—Income Taxes
For the years ended December 31, 2016, 2015, and 2014, the significant components of income tax expense consisted of the following (in thousands of dollars):
2016 | 2015 | 2014 | |||||||||
Income before taxes: | |||||||||||
Domestic | $ | (38,567 | ) | $ | 11,414 | $ | 21,976 | ||||
Foreign | 135,301 | 157,885 | 171,045 | ||||||||
Total | $ | 96,734 | $ | 169,299 | $ | 193,021 | |||||
Income tax expense—current: | |||||||||||
Domestic | $ | 18,443 | $ | 10,455 | $ | 22,220 | |||||
State and local | 1,766 | 5,958 | 6,946 | ||||||||
Foreign | 29,904 | 33,043 | 37,762 | ||||||||
Sub-total | 50,113 | 49,456 | 66,928 | ||||||||
Income tax (benefit) expense—deferred: | |||||||||||
Domestic | (19,114 | ) | 69,835 | 5,406 | |||||||
State and local | (1,034 | ) | 6,378 | 6,314 | |||||||
Foreign | (4,008 | ) | 5,476 | (2,887 | ) | ||||||
Sub-total | (24,156 | ) | 81,689 | 8,833 | |||||||
Total | $ | 25,957 | $ | 131,145 | $ | 75,761 | |||||
99
As of December 31, 2016 and 2015, the components of Deferred Tax Assets and Deferred Tax Liabilities consisted of the following (in thousands of dollars):
December 31, | 2016 | 2015 | ||||||
Deferred tax assets: | ||||||||
Asset provisions and liabilities | $ | 11,512 | $ | 13,720 | ||||
Inventory writedowns | 10,874 | 10,621 | ||||||
Tax loss and credit carryforwards | 3,708 | 2,887 | ||||||
Difference between book and tax basis of depreciable and amortizable assets | 30,855 | 17,857 | ||||||
Share-based payments and deferred compensation | 26,267 | 34,165 | ||||||
Sub-total | 83,216 | 79,250 | ||||||
Valuation allowance | (2,819 | ) | (2,437 | ) | ||||
Total deferred tax assets | 80,397 | 76,813 | ||||||
Deferred tax liabilities: | ||||||||
Difference between book and tax basis of other assets and liabilities | 1,612 | 2,361 | ||||||
Pension obligations | 9,689 | 11,231 | ||||||
Basis differences in equity method investments | 3,423 | 3,805 | ||||||
Undistributed earnings of foreign subsidiaries | 68,201 | 91,924 | ||||||
Total deferred tax liabilities | 82,925 | 109,321 | ||||||
Total net deferred tax liabilities | $ | (2,528 | ) | $ | (32,508 | ) | ||
As of December 31, 2016, we had deferred tax assets related to various foreign and state loss and tax credit carryforwards totaling $3.7 million that begin to expire in 2020.
As of December 31, 2016 and 2015, we provided valuation allowances of $2.8 million and $2.4 million, respectively, relating to net operating loss carryforwards. The increase in the valuation allowance in 2016 is due to an increase in the net operating loss related to certain jurisdictions.
For the years ended December 31, 2016, 2015, and 2014, our effective income tax rate varied from the statutory tax rate as follows:
2016 | 2015 | 2014 | ||||||
Statutory federal income tax rate | 35.0 | % | 35.0 | % | 35.0 | % | ||
State and local taxes, net of federal tax benefit | 0.5 | % | 2.3 | % | 2.5 | % | ||
Foreign taxes at rates different from U.S. rates | (25.0 | %) | (14.9 | %) | (13.5 | %) | ||
U.S. taxes on foreign earnings | 9.9 | % | 50.5 | % | 12.6 | % | ||
Valuation allowance | 0.5 | % | 0.3 | % | (0.2 | %) | ||
Effect of enacted tax legislation | (0.1 | %) | 2.5 | % | 2.0 | % | ||
Changes in tax reserves | 1.6 | % | 0.0 | % | 0.4 | % | ||
Other | 4.4 | % | 1.8 | % | 0.4 | % | ||
Effective income tax rate | 26.8 | % | 77.5 | % | 39.2 | % | ||
The presentation of certain prior year amounts in the table above has been updated to conform to the current year presentation.
100
The comparison of our effective income tax rate between periods is significantly influenced by the level and mix of earnings and losses by taxing jurisdiction, foreign tax rate differentials, the relative impact of permanent book to tax differences (e.g., non-deductible expenses) on pre-tax results by taxing jurisdiction, new tax legislation, and changes in valuation allowances and tax reserves.
Our effective income tax rate is 26.8% for the year ended December 31, 2016, compared to 77.5% in the prior year. The decrease in our effective income tax rate is primarily due to income tax expense of $65.7 million recorded in the fourth quarter of 2015 to recognize a deferred tax liability for incremental taxes associated with accumulated foreign earnings related to years prior to 2014 that were no longer deemed to be indefinitely reinvested outside of the U.S. The decrease in our effective tax rate is also due to a change in assertion regarding earnings from our foreign subsidiaries. In the first quarter of 2016, we determined that our foreign earnings related to 2016 (except those in the U.K.) would be indefinitely reinvested outside of the U.S. Conversely, in 2015, we recorded incremental deferred income taxes on substantially all of our foreign earnings for that year on the basis that such earnings would not be indefinitely reinvested overseas. As a result, the mix of pre-tax income among our various jurisdictions did not have a material effect on our effective income tax rate in 2015. However, the effective income tax rate for 2016 is influenced by changes in the mix of pre-tax income among the various jurisdictions where we operate, resulting in a decrease in our effective income tax rate. (See “Repatriation of Foreign Earnings” below.)
The comparison of our effective income tax rate between the two periods is also influenced by a $4 million charge recorded in 2015 to write-down certain deferred tax assets. This writedown was a result of New York City tax legislation enacted in that year, which resulted in a reduction of income apportioned to New York City in 2016 and accordingly resulted in a decrease to our state and local effective income tax rate in the current year.
For the year ended December 31, 2015, our effective income tax rate increased when compared to 2014 primarily due to the $65.7 million charge recorded in the fourth quarter of 2015, as discussed above.
The comparison of our effective income tax rate between 2015 and 2014 was also influenced by the $4 million charge recorded in 2015 to write-down certain deferred tax assets as a result of New York City tax legislation, as discussed above, and income tax expense of approximately $3.9 million recorded in 2014 related to the writedown of certain deferred tax assets as a result of New York State legislation that was enacted in 2014.
Repatriation of Foreign Earnings—Prior to the fourth quarter of 2015, based on our projections and planned uses of U.S. and foreign earnings, we had intended that approximately $400 million of accumulated foreign earnings relating to years prior to 2014 would be indefinitely reinvested outside of the U.S. As a result, we did not initially record deferred income taxes on these earnings in our Consolidated Financial Statements. In the fourth quarter of 2015, however, in consideration of the expansion of our common stock repurchase program (see Note 14), as well as the need for cash in the U.S. to fund other corporate strategic initiatives, we reassessed our U.S. and foreign cash needs and concluded that these foreign earnings would, instead, be repatriated to the U.S. in the foreseeable future. Consequently, in the fourth quarter of 2015, we recognized a liability for the deferred income taxes on these foreign earnings. In addition, we had accrued incremental taxes during 2014 and 2015 on approximately $200 million of foreign earnings for those years. As of December 31, 2015, we had recognized total net deferred tax liabilities of approximately $92 million for foreign earnings deemed not to be indefinitely reinvested outside of the U.S.
As of December 31, 2016, approximately $330 million of the foreign earnings discussed above have been repatriated and used, in part, to fund common stock repurchases. We expect that additional repatriations will be made, though the specific timing of any further repatriation of foreign earnings and the cash payment of the associated taxes is currently uncertain and is being evaluated.
Based on our current projections and planned uses of U.S. and foreign cash, we believe that our cash balances and earnings in the U.S., as well as the amount of unremitted foreign earnings for which a deferred tax liability has been recorded, will be sufficient to satisfy our current cash needs in the U.S. Accordingly, we plan to indefinitely reinvest the prospective earnings of our foreign subsidiaries, except those in the U.K., outside of the U.S. As a result, income tax expense related to the deferred tax liabilities for incremental taxes associated with our foreign earnings decreased from approximately $14.2 million in 2015 and $18.6 million in 2014 to approximately $8.5 million in 2016.
101
As of December 31, 2016, income taxes have not been provided on approximately $108 million of our foreign earnings which are intended to be indefinitely reinvested outside of the U.S. A determination of the amount of unrecognized deferred income tax liabilities on these earnings is subject to many variables, such as the amount of foreign tax credits, if any, that may be available and is dependent on circumstances existing if and when remittance occurs. The unrecognized deferred income tax liability related to these earnings is impracticable to compute. If these earnings were not indefinitely reinvested outside of the U.S., and assuming that the distribution would be fully taxable in the U.S. with no use of foreign tax credits, a deferred tax liability of approximately $38 million would be recognized for U.S. federal income taxes.
Total net income tax payments during 2016, 2015, and 2014 were $32.4 million, $53.9 million, and $60.3 million, respectively.
Note 17—Uncertain Tax Positions
As of December 31, 2016, 2015, and 2014, the liability for unrecognized tax benefits, excluding interest and penalties, was $19.5 million, $22 million, and $22.8 million, respectively, and is recorded within long-term Accrued Income Taxes on our Consolidated Balance Sheets.
As of December 31, 2016 and 2015, the total amount of unrecognized tax benefits that, if recognized, would favorably affect our effective income tax rate was $9.3 million and $12.8 million, respectively.
The table below presents a reconciliation of the beginning and ending balances of the liability for unrecognized tax benefits, excluding interest and penalties, for the years ended December 31, 2016, 2015, and 2014 (in thousands of dollars):
2016 | 2015 | 2014 | |||||||||
Balance at January 1 | $ | 22,042 | $ | 22,798 | $ | 25,423 | |||||
Increases in unrecognized tax benefits related to the current year | 1,700 | 2,917 | 2,229 | ||||||||
Increases in unrecognized tax benefits related to prior years | 29 | 2,276 | 167 | ||||||||
Decreases in unrecognized tax benefits related to prior years | — | (1,973 | ) | (134 | ) | ||||||
Decreases in unrecognized tax benefits related to settlements | — | (437 | ) | (590 | ) | ||||||
Decreases in unrecognized tax benefits due to the lapse of the applicable statute of limitations | (4,293 | ) | (3,539 | ) | (4,297 | ) | |||||
Balance at December 31 | $ | 19,478 | $ | 22,042 | $ | 22,798 | |||||
The net decrease to the liability for unrecognized tax benefits in 2016 is primarily due to the expiration of the statute of limitations for certain tax years, partially offset by the accrual of tax reserves related to transfer pricing and other U.S. federal and state and non-U.S. matters.
In 2015 and 2014, the net decreases to the liability for unrecognized tax benefits were primarily attributable to the expiration of the statutes of limitations for certain tax years, the closing of tax audits in 2015 and the settlement of an audit in 2014, partially offset by the accrual of tax reserves related to transfer pricing and other U.S. federal and state and non-U.S. matters.
We recognize interest expense and penalties related to unrecognized tax benefits as a component of Income Tax Expense in our Consolidated Income Statements. During 2016, 2015, and 2014, we recognized a net expense of $0.3 million, a net benefit of $0.04 million, and a net expense of $0.2 million, respectively, for interest expense and penalties related to unrecognized tax benefits. As of December 31, 2016, 2015, and 2014, the liability for tax-related interest and penalties included in our Consolidated Balance Sheets was $2.1 million, $1.8 million, and $1.8 million, respectively. The net increase in 2016 is due to the accrual of additional interest, partially offset by the reversal of interest accrued on unrecognized tax benefits that were recognized during the year. The net decrease in 2015 is primarily attributable to the closing of certain tax audits, partially offset by the accrual of tax reserves related to transfer pricing.
We are subject to taxation in the U.S. and various state and foreign jurisdictions and, as a result, may be subject to tax audits in these jurisdictions. We are currently under examination by various U.S. state and foreign taxing authorities. The earliest open tax year for the major jurisdictions in which we do business, which includes the U.S. (including various state and local jurisdictions), the U.K., and Hong Kong, is 2009.
We believe it is reasonably possible that a decrease of $9.3 million in the balance of unrecognized tax benefits can occur within 12 months of the December 31, 2016 balance sheet date primarily as a result of the expiration of statutes of limitation and the expected settlements of ongoing tax audits.
102
Note 18—Commitments and Contingencies
Compensation Arrangements—As of December 31, 2016, we had compensation arrangements with certain senior employees, which expire at various points between February 28, 2017 and March 31, 2020. Such arrangements may provide, among other benefits, for minimum salary levels and for compensation under our incentive compensation programs that is payable only if specified Company and individual goals are attained. Additionally, under certain circumstances, certain of these arrangements provide annual share-based payments, severance payments, and other cash compensation. The aggregate remaining commitment for salaries and other cash compensation related to these compensation arrangements, excluding any participation in our incentive compensation programs, was approximately $10.3 million as of December 31, 2016.
Guarantees of Collection—A guarantee of collection is a guarantee to a consignor that, under certain conditions, we will pay the consignor for property that has sold at auction, but has not yet been paid for by the purchaser. It is not a guarantee that the property will be sold at a certain minimum price.
As of December 31, 2016, we had outstanding guarantees of collection totaling $4 million related to property sold at auctions in the fourth quarter of 2016. In the event that any purchaser does not pay for purchased property by the settlement date, we will be required to pay the consignor the net sale proceeds, but would then take title to the property and have the right to pursue the defaulting buyer and/or reoffer the property at a future sale. As of February 15, 2017, all amounts due to us for property sold under this guarantee of collection have been remitted by the purchasers.
Tax Contingencies—We are subject to laws and regulations in many countries involving sales, use, value-added and other indirect taxes which are assessed by various governmental authorities and imposed on certain revenue-producing transactions between us and our clients. The application of these laws and regulations to our unique business and global client base, and the estimation of any related liabilities, is complex and requires a significant amount of judgment. We are generally not responsible for these indirect tax liabilities unless we fail to collect the correct amount of sales, use, value-added, or other indirect taxes. Failure to collect the correct amount of indirect tax on a transaction may expose us to claims from tax authorities and could require us to record a liability and corresponding charge to General and Administrative Expenses.
Legal Contingencies—We become involved in various claims and lawsuits incidental to the ordinary course of our business. We are required to assess the likelihood of any adverse judgments or outcomes related to these legal contingencies, as well as potential ranges of probable or reasonably possible losses. The determination of the amount of any losses to be recorded or disclosed as a result of these contingencies is based on a careful analysis of each individual exposure with, in some cases, the assistance of outside legal counsel. The amount of losses recorded or disclosed for such contingencies may change in the future due to new developments in each matter or a change in settlement strategy. While the impact of any one or more legal claims or proceedings could be material to our operating results in any period, we do not believe that the outcome of any of these pending claims or proceedings, individually and in the aggregate, will have a material adverse effect on our consolidated financial condition.
See Note 3 for information related to our commitment to make earn-out payments to the former principals of AAP. See Note 4 for information related to unfunded commitments to extend additional credit through SFS. See Note 9 for information related to debt commitments. See Note 17 for information related to income tax contingencies. See Note 19 for information related to auction guarantees. See Note 20 for information related to lease commitments.
103
Note 19—Auction Guarantees
From time-to-time in the ordinary course of our business, we will guarantee to a consignor a minimum sale price in connection with the sale of property at auction (an "auction guarantee"). If the property offered under the auction guarantee sells above the minimum guaranteed price, we are generally entitled to a share of the excess proceeds (the "overage"). In the event that the property sells for less than the minimum guaranteed price, we must perform under the auction guarantee by funding the difference between the sale price at auction and the amount of the auction guarantee (the "shortfall"). The amount of any shortfall recorded in our Consolidated Income Statements is reduced by any auction commissions earned on property sold under the auction guarantee. If any item of property offered under the auction guarantee does not sell, the amount of the auction guarantee must be paid, but we take ownership of the unsold property and may recover the amount paid through its future sale. Depending on the mix of items subject to an auction guarantee, in advance of peak selling seasons, a small number of guaranteed items may represent a substantial portion of the aggregate amount of outstanding auction guarantees.
In situations when an item of guaranteed property does not sell and we take ownership of the property, it is recorded as Inventory on our Consolidated Balance Sheets at the lower of its cost (i.e., the amount paid under the auction guarantee) or our estimate of the property's net realizable value (i.e., the expected sale price upon its eventual disposition). The market for fine art, decorative art, and jewelry is not a highly liquid trading market. As a result, the valuation of property acquired as a result of failed auction guarantees is inherently subjective and its realizable value often fluctuates over time. Accordingly, the proceeds ultimately realized on the sale of previously guaranteed property may equal, exceed, or be less than the estimated net realizable value recorded as Inventory on our Consolidated Balance Sheets.
We may reduce our financial exposure under auction guarantees through contractual risk and reward sharing arrangements. Such auction guarantee risk and reward sharing arrangements include irrevocable bids and partner sharing arrangements. An irrevocable bid is an arrangement under which a counterparty commits to bid a predetermined price on the guaranteed property. If the irrevocable bid is not the winning bid, the counterparty is generally entitled to receive a share of the auction commission earned on the sale and/or a share of any overage. If the irrevocable bid is the winning bid, the counterparty may receive a fixed fee as compensation for providing the irrevocable bid. This fee may be netted against the counterparty's obligation to pay the full purchase price (i.e., the hammer price plus the applicable buyer's premium). In a partner sharing arrangement, a counterparty commits to fund: (i) a share of the difference between the sale price at auction and the amount of the auction guarantee if the property sells for less than the minimum guaranteed price or (ii) a share of the minimum guaranteed price if the property does not sell while taking ownership of a proportionate share of the unsold property. In exchange for accepting a share of the financial exposure under the auction guarantee, the counterparty in a partner sharing arrangement is generally entitled to receive a share of the auction commission earned if the property sells and/or a share of any overage.
The counterparties to our auction guarantee risk and reward sharing arrangements are typically major international art dealers or major art collectors. We could be exposed to losses in the event any of these counterparties do not perform according to the terms of these contractual arrangements.
Although irrevocable bid and partner sharing arrangements may be used to reduce the risk associated with auction guarantees, we may also enter into auction guarantees without securing such arrangements. In these circumstances, we could be exposed to deterioration in auction commission margins and/or auction guarantee losses if one or more of the guaranteed items fails to sell at its minimum guaranteed price. Furthermore, in such situations, our liquidity could be reduced.
Our credit agreement has a covenant that imposes a $600 million limitation on net outstanding auction guarantees (i.e., the aggregate financial exposure under outstanding auction guarantees less the impact of related risk and reward sharing arrangements). In addition to compliance with this covenant, significant auction guarantees and related risk and reward sharing arrangements are subject to approval by our Board of Directors.
As of December 31, 2016, we had outstanding auction guarantees totaling $18.3 million. Our financial exposure under these auction guarantees is reduced by irrevocable bids totaling $12.8 million. Each of the outstanding auction guarantees has a minimum guaranteed price that is within or below the range of the pre-sale auction estimates for the underlying property. The property related to these auction guarantees is being offered at auctions during the first and second quarters of 2017.
We are obligated under the terms of certain auction guarantees to advance all or a portion of the guaranteed amount prior to auction. As of December 31, 2016, there were $1 million in auction guarantee advances outstanding. As of December 31, 2016 and 2015, the estimated fair value of our obligation to perform under our outstanding auction guarantees totaled $0.6 million and $1 million, respectively, and is recorded within Accounts Payable and Accrued Liabilities on our Consolidated Balance Sheets.
104
As of February 23, 2017, we had outstanding auction guarantees totaling $147.7 million and, as of that date, our financial exposure was reduced by irrevocable bids totaling $89.4 million. Each of the auction guarantees outstanding as of February 23, 2017, had a minimum guaranteed price that was within or below the range of the pre-sale auction estimates for the underlying property. The property related to these auction guarantees is being offered at auctions in the first and second quarters of 2017. As of February 23, 2017, we have advanced $11.5 million of the total guaranteed amount.
Note 20—Lease Commitments
We conduct business on premises leased in various locations under long-term operating leases expiring at various dates through 2060. For the years ended December 31, 2016, 2015, and 2014, net rental expense under our operating leases was $18.4 million, $17.5 million, and $18.2 million, respectively, which was recorded in General and Administrative Expenses in our Consolidated Income Statements. Future minimum lease payments due under non-cancellable operating leases in effect at December 31, 2016 were as follows (in thousands of dollars):
2017 | $ | 15,036 | |
2018 | 7,339 | ||
2019 | 6,448 | ||
2020 | 5,781 | ||
2021 | 5,291 | ||
Thereafter | 28,176 | ||
Total future minimum lease payments | $ | 68,071 | |
The future minimum lease payments in the table above exclude future minimum sublease rental receipts of $1 million owed to us under noncancellable subleases. In addition to the operating lease payments in the table above, under the terms of certain leases, we are required to pay real estate taxes and utility costs and may be subject to escalations in the amount of future minimum lease payments based on certain contractual provisions.
Note 21—Share-Based Payments
Share-Based Payments—Share-based payments made to employees include performance-based stock unit awards, market-based stock unit awards, restricted stock units, restricted stock shares, and stock options. Share-based payments are also made to members of our Board of Directors through the issuance of deferred stock units. A description of each of these share-based payments is provided below.
For the years ended December 31, 2016, 2015, and 2014, compensation expense for share-based payments made to employees was reflected in the following accounts in our Consolidated Income Statements (in thousands of dollars):
2016 | 2015 | 2014 | |||||||||
Salaries and related costs | $ | 15,935 | $ | 28,632 | $ | 23,470 | |||||
Voluntary separation incentive programs (see Note 22) | (719 | ) | 3,068 | — | |||||||
CEO separation and transition costs (see Note 23) | — | 2,000 | 3,591 | ||||||||
Total share-based payment expense (pre-tax) | $ | 15,216 | $ | 33,700 | $ | 27,061 | |||||
Total share-based payment expense (after-tax) | $ | 10,810 | $ | 22,992 | $ | 17,683 | |||||
For the year ended December 31, 2016, our Consolidated Income Statements include a credit of $0.7 million related to share-based payments associated with the voluntary separation programs enacted in the fourth quarter of 2015. This credit is the result of changes in our estimate of the number of performance-based stock units held by program participants that are expected to vest.
In 2016, we recognized a $1.3 million tax shortfall related to share-based payment arrangements. This tax shortfall represents the amount by which the tax deduction resulting from the vesting of share-based payments in the period was less than the tax benefit initially recognized in our Consolidated Financial Statements. Such tax shortfalls are accounted for on our Consolidated Balance Sheets as a reduction to amounts recorded in Additional Paid-in Capital for previously recognized excess tax benefits related to share-based payments.
105
In 2015 and 2014, we recognized $1.1 million and $3.6 million, respectively, of excess tax benefits related to share-based payment arrangements. These tax benefits represent the amount by which the tax deduction resulting from the vesting of share-based payments in the period exceeded the tax benefit initially recognized in our Consolidated Financial Statements. Such excess tax benefits are recognized on our Consolidated Balance Sheets as an increase to Additional Paid-in Capital and are classified within Financing Activities in our Consolidated Statements of Cash Flows.
As of December 31, 2016, unrecognized compensation expense related to the unvested portion of share-based payments to employees was $17.5 million. This compensation expense is expected to be amortized over a weighted-average period of approximately 2.2 years. We do not capitalize compensation expense related to share-based payments to employees.
Restricted Stock Unit Plan—The Sotheby's Restricted Stock Unit Plan (as amended and restated, the "Restricted Stock Unit Plan") provides for the issuance of restricted stock units ("RSU's") and restricted stock shares to employees. Awards made under the Restricted Stock Unit Plan are subject to the approval of the Compensation Committee of our Board of Directors (the "Compensation Committee"). In making awards under the Restricted Stock Unit Plan, the Compensation Committee takes into account the nature of the services rendered by employees, their present and potential future contributions to our success, and such other factors as the Compensation Committee in its discretion deems relevant.
RSU's and restricted stock shares issued under the Restricted Stock Unit Plan generally vest evenly over a three-year service period. Prior to vesting, holders of RSU's and restricted stock shares are entitled to receive non-forfeitable dividend equivalents and dividends, respectively, at the same rate as dividends are paid on our common stock (if and when such dividends are paid). Prior to vesting, holders of RSU's do not have voting rights, while holders of restricted stock shares have voting rights. RSU's and restricted stock shares may not be sold, assigned, transferred, pledged or otherwise encumbered until they vest.
Performance Share Units (or "PSU's") are RSU's that generally vest over three or four year service periods, subject to the achievement of certain profitability targets (for awards granted prior to 2016) or certain return on invested capital ("ROIC") targets (for awards granted beginning in 2016). Prior to vesting, holders of PSU's do not have voting rights and are not entitled to receive dividends or dividend equivalents. Dividend equivalents are generally credited to holders of PSU's at the same rate as dividends are paid on our common stock (if and when such dividends are paid), but are only paid for PSU's that vest and become shares of our common stock. PSU's may not be sold, assigned, transferred, pledged, or otherwise encumbered until they vest.
In 2016, the Compensation Committee approved share-based payment awards with a total grant date fair value of $23.7 million, as follows:
• | 607,606 PSU's with a grant date fair value of $14.4 million and a single vesting opportunity after a three-year service period. These PSU's provide the recipient with an opportunity to vest in incremental PSU's of up to 100% of the initial award subject to the achievement of certain ROIC targets, for a total maximum vesting opportunity of 200% of the initial award. The maximum number of shares of common stock that may be payable with respect to these awards is 1,215,212. |
• | 394,371 RSU's with a grant date fair value of $9.3 million and annual vesting opportunities over a three-year service period. |
CEO Share-Based Payment Awards—In the first quarter of 2015, share-based payment awards with a grant date fair value of $16.5 million were granted to Thomas S. Smith, Jr. upon the commencement of his employment as our President and CEO on March 31, 2015. These awards consist of the following:
• | An inducement award of 158,638 shares of restricted stock with a grant date fair value of $6.5 million, with periodic vesting opportunities between March 4, 2016 and September 1, 2017, which substantially correspond to the times when forfeited opportunities at Mr. Smith's previous employer would otherwise have become eligible to vest. These restricted stock shares were not issued pursuant to the Restricted Stock Unit Plan and have not been registered with the SEC. These shares have voting rights and a non-forfeitable right to dividends. |
• | An inducement award of 47,070 fully-vested RSU's with a grant date fair value of $2 million awarded to Mr. Smith to compensate him for a portion of the annual bonus that he would have received from his previous employer. The common stock shares associated with this award will be distributed in three approximately equal installments on the third, fourth, and fifth anniversaries of the grant date. These RSU's were not issued pursuant to the Restricted Stock Unit Plan and have not been registered with the SEC. These RSU's will be credited with dividend equivalents in the form of additional RSU's if, when, and at the same rate as dividends are paid on our common stock. |
106
• | An award of 94,140 PSU's under the Restricted Stock Unit Plan with a grant date fair value of $8 million and with a single vesting opportunity after a five-year service period contingent upon the achievement of pre-determined levels of price appreciation in our stock. This award provides opportunities to vest in incremental PSU's up to 350% of the initial award, such that the maximum number of shares that may be payable with respect to this award is 329,490 shares. These PSU's do not have a right to earn dividend equivalents. |
Subsequent Event: 2017 Share-Based Payment Awards—In 2017, prior to the date of this filing, the Compensation Committee approved share-based payment awards with a total grant date fair value of $28.9 million as follows:
• | 367,745 PSU's with a grant date fair value of $14.5 million and a single vesting opportunity after a three-year service period. These PSU's provide the recipient with an opportunity to vest in incremental PSU's of up to 100% of the initial awards subject to the achievement of certain ROIC targets, for a total maximum vesting opportunity of 200% of the initial award. The maximum number of shares of common stock that may be payable with respect to these awards is 735,490. |
• | 363,664 RSU's with a grant date fair value of $14.4 million and annual vesting opportunities over a three-year service period. |
Summary of Outstanding Share-Based Payment Awards to Employees—For the year ended December 31, 2016, changes to the number of outstanding RSU's, PSU's, and Restricted Stock shares were as follows (shares in thousands):
RSU's, PSU's, and Restricted Stock Shares | Weighted Average Grant Date Fair Value | |||||
Outstanding at January 1, 2016 | 2,019 | $ | 43.61 | |||
Granted | 1,002 | $ | 23.66 | |||
Vested | (569 | ) | $ | 39.60 | ||
Canceled | (217 | ) | $ | 36.28 | ||
Outstanding at December 31, 2016 | 2,235 | $ | 36.40 | |||
As of December 31, 2016, 2.6 million shares were available for future awards pursuant to the Restricted Stock Unit Plan. The aggregate fair value of RSU's and PSU's that vested during 2016, 2015, and 2014 was $15.2 million, $22.9 million, and $28.1 million, respectively, based on the closing stock price on the dates the shares vested.
Stock Options—Stock options issued pursuant to the 1997 Stock Option Plan are exercisable into authorized, but unissued shares of our common stock. Stock options vest evenly over four years and expire 10 years after the date of grant. As of December 31, 2016, 104,100 shares of common stock were available for the issuance of stock options under the Stock Option Plan. As of December 31, 2016, 50,000 stock options were outstanding and exercisable with a weighted average exercise price of $22.11 per share, a weighted average remaining contractual term of 3.1 years, and an aggregate intrinsic value of $0.9 million. No stock options were granted or exercised in 2016 and 2015. The aggregate intrinsic value of options exercised during 2014 was $1.2 million. Cash received from stock options that were exercised during 2014 totaled $1 million. In 2014, the related excess tax benefit realized from the exercise of stock options was $0.3 million.
Directors Stock Plan—Common stock is issued quarterly under the Sotheby’s Stock Compensation Plan for Non-Employee Directors (as amended and restated, the “Directors Stock Plan”). Directors may elect to receive this compensation in the form of deferred stock units, which are credited in an amount that is equal to the number of shares of common stock the director otherwise would have received. The number of shares of common stock awarded is calculated using the closing price of the common stock on the NYSE on the business day immediately prior to the quarterly grant date. Deferred stock units are held until a director’s termination of service, at which time the units are settled on a one-for one basis in shares of our common stock on the first day of the calendar month following the date of termination. As of December 31, 2016, 149,004 deferred stock units were outstanding under the Directors Stock Plan and 136,645 units were available for future issuance.
107
Note 22—Voluntary Separation Incentive Programs
On November 13, 2015, we announced a series of regional voluntary separation incentive programs (the "Programs") aimed at reducing headcount and associated compensation costs. The Programs were offered to our employees in jurisdictions where it was practical to do so. Employees who elected to participate in the Programs were accepted only upon approval by management.
In the fourth quarter of 2015, we recognized a charge of $36.9 million as a result of the Programs, consisting of $33.8 million in cash severance benefits and $3.1 million in accelerated equity compensation expense related to awards that will continue to vest after termination of employment, subject to our achievement of the underlying profitability targets, when applicable. The liability related to the $33.8 million in cash severance benefits was recorded on our Consolidated Balance Sheets within Accounts Payable and Accrued Liabilities and included $4.7 million related to 2015 incentive compensation that would have been paid to participants had they not participated in the Programs.
In 2016, we recognized a net credit of $0.6 million to the originally recorded charge primarily as a result of our quarterly assessment of the likelihood that the performance-based stock units held by participants in the Programs will vest. Employee transitions and cash severance payments under the Programs are substantially complete.
Note 23—CEO Separation and Transition Costs
In 2014, CEO Separation and Transition Costs consisted of compensation-related charges of $7.6 million recognized in the fourth quarter of 2014, related to the resignation of William F. Ruprecht as our President and CEO, and charges of $4.2 million recognized in the first quarter of 2015, associated with the subsequent hiring of Thomas S. Smith, Jr. as his replacement. The charges recognized in the fourth quarter of 2014 consisted of the accrual of a $4 million cash severance benefit and $3.6 million in accelerated equity compensation expense triggered by the terms of Mr. Ruprecht's employment agreement. The charges recognized in the first quarter of 2015 principally relate to compensation of $3.1 million owed to Mr. Smith to replace incentive compensation that he expected to receive from his previous employer, consisting of a fully-vested restricted stock unit award with a fair value of $2 million granted on March 31, 2015 and a $1.1 million cash payment that was made in September 2015. There was no required service period associated with this compensation. The CEO Separation and Transition Costs recognized in the first quarter of 2015 also include approximately $1.1 million in recruitment and other professional fees associated with the CEO hiring process.
Note 24—Restructuring Charges (Net)
On July 16, 2014, our Board of Directors approved a restructuring plan (the "2014 Restructuring Plan") principally impacting our operations in the U.S. and the U.K. The 2014 Restructuring Plan resulted in Restructuring Charges (net) of $14.2 million recognized in 2014, consisting of $13.9 million in employee termination benefits and approximately $0.3 million in lease exit costs. In 2015, we recognized a credit of approximately $1 million in Restructuring Charges (net) as a result of adjustments to the initial accrual for employee termination benefits. The headcount reductions resulting from the 2014 Restructuring Plan were completed in the third quarter of 2015, and the associated liability has been fully settled.
Note 25—Special Charges (Net)
In 2014, we recognized Special Charges (net) of $20 million related to third party advisory, legal, and other professional service fees directly associated with issues related to shareholder activism, the resulting proxy contest with Third Point LLC ("Third Point"), and the litigation concerning our former shareholder rights plan and the change in control provision in our credit agreement. This amount is net of a $4.6 million insurance recovery pertaining to certain professional services fees incurred in defense of the litigation concerning our former shareholder rights plan and the change in control provision in our credit agreement.
Included in Special Charges (net) in 2014 is a $10 million charge related to our reimbursement of Third Point's documented, out-of-pocket expenses incurred in connection with the proxy contest and the litigation concerning our former shareholder rights plan. This reimbursement is part of a support agreement that we entered into with Third Point, Daniel S. Loeb, Olivier Reza, Harry J. Wilson and other entities affiliated with Third Point (together with Third Point, the "Third Point Entities") on May 4, 2014 pursuant to which we settled the previously pending proxy contest for the election of directors (the "Support Agreement"). Pursuant to the Support Agreement, on May 4, 2014, Mr. Loeb, Mr. Reza, and Mr. Wilson (the "Third Point Nominees") were appointed to our Board of Directors. The Support Agreement also contains various other terms and provisions, including with respect to standstill and voting commitments entered into by Third Point, Third Point's withdrawal of the litigation concerning our former shareholder rights plan, and the accelerated expiration of our former shareholder rights plan.
108
Note 26—Earnings Per Share
Basic earnings per share—Basic earnings per share attributable to Sotheby's common shareholders is computed under the two-class method using the weighted average number of common shares outstanding during the period. The two-class method requires that the amount of net income attributable to participating securities be deducted from consolidated net income in the computation of basic earnings per share. In periods with a net loss, the net loss attributable to participating securities is not deducted from consolidated net loss in the computation of basic loss per share as the impact would be anti-dilutive. Our participating securities include unvested restricted stock units and unvested restricted stock shares held by employees, both of which have non-forfeitable rights to dividends. See Note 21 for information on our share-based payment programs.
Diluted earnings per share—Diluted earnings per share attributable to Sotheby's common shareholders is computed in a similar manner to basic earnings per share under the two-class method, using the weighted average number of common shares outstanding during the period and, if dilutive, the weighted average number of potential common shares outstanding during the period. Our potential common shares include unvested performance share units held by employees, incremental common shares issuable upon the exercise of employee stock options, and deferred stock units held by members of our Board of Directors. See Note 21 for information on our share-based payment programs.
109
For the years ended December 31, 2016, 2015, and 2014, 1 million, 0.9 million, and 1.1 million potential common shares, respectively, related to share-based payment awards were excluded from the computation of diluted earnings per share because the financial performance or stock price targets inherent in such awards were not achieved as of the respective balance sheet dates.
The table below summarizes the computation of basic and diluted earnings per share for the years ended December 31, 2016, 2015, and 2014 (in thousands of dollars, except per share amounts):
2016 | 2015 | 2014 | |||||||||
Basic: | |||||||||||
Numerator: | |||||||||||
Net income attributable to Sotheby's | $ | 74,112 | $ | 43,727 | $ | 117,795 | |||||
Less: Net income attributable to participating securities | 1,001 | 354 | 1,047 | ||||||||
Net income attributable to Sotheby's common shareholders | $ | 73,111 | $ | 43,373 | $ | 116,748 | |||||
Denominator: | |||||||||||
Weighted average common shares outstanding | 57,024 | 68,121 | 69,016 | ||||||||
Basic earnings per share - Sotheby's common shareholders | $ | 1.28 | $ | 0.64 | $ | 1.69 | |||||
Diluted: | |||||||||||
Numerator: | |||||||||||
Net income attributable to Sotheby's | $ | 74,112 | $ | 43,727 | $ | 117,795 | |||||
Less: Net income attributable to participating securities | 1,001 | 354 | 1,047 | ||||||||
Net income attributable to Sotheby's common shareholders | $ | 73,111 | $ | 43,373 | $ | 116,748 | |||||
Denominator: | |||||||||||
Weighted average common shares outstanding | 57,024 | 68,121 | 69,016 | ||||||||
Weighted average effect of dilutive potential common shares: | |||||||||||
Performance share units | 465 | 438 | 407 | ||||||||
Deferred stock units | 149 | 167 | 162 | ||||||||
Stock options | 15 | 18 | 21 | ||||||||
Weighted average dilutive potential common shares outstanding | 629 | 623 | 590 | ||||||||
Weighted average diluted shares outstanding | 57,653 | 68,744 | 69,606 | ||||||||
Diluted earnings per share - Sotheby's common shareholders | $ | 1.27 | $ | 0.63 | $ | 1.68 | |||||
The decrease in weighted average basic and diluted shares outstanding over the three reporting periods is due to common stock repurchases. See Note 14 for additional information on our share repurchase program.
Note 27—Related Party Transactions
From time-to-time, in the ordinary course of business, related parties, such as members of our Board of Directors and employees, buy and sell property at our auctions or through private sales brokered by Sotheby's. For the years ended December 31, 2016, 2015, and 2014, we recognized Agency Commissions and Fees of $4.1 million, $2.7 million, and $3.1 million, respectively, related to property sold or purchased by related parties. As of December 31, 2016, Accounts Receivable (net) included $1.8 million associated with an auction purchase made by a related party and Client Payables included $3.6 million owed to related party consignors.
On September 2, 2015, we entered into an arrangement with the Estate of A. Alfred Taubman under which we offered works of art from the Taubman Collection. Robert S. Taubman, a trustee and beneficiary of the Estate, was a member of our Board of Directors at the time the arrangement was consummated. In connection with this arrangement, we provided an auction guarantee of $509 million, after taking into account items withdrawn by the Estate prior to sale. Total aggregate proceeds (i.e., the hammer price plus buyer's premium) from sales of Taubman Collection property were $473.5 million. The results of these sales, combined with the initially estimated value of items which were taken into inventory after failing to sell at auction ($33 million), resulted in a loss on the auction guarantee of approximately $3 million, which was recognized in the fourth quarter of 2015. As of December 31, 2015, we owed $285.4 million to the Estate in connection with this auction guarantee. This liability was settled by cash payments made to the Estate throughout 2016.
110
On October 3, 2016, we entered into an agreement with funds managed by Marcato Capital Management LP, pursuant to which we purchased 2,050,000 shares of our common stock from Marcato for an aggregate purchase price of $73.8 million, or $36.00 per share. At the time of this agreement, Marcato owned 8.5% of our outstanding common stock. (See Note 14.)
Note 28—Recently Issued Accounting Standards
In May 2014, the FASB issued ASU 2014-09, Revenue from Contracts with Customers, which introduces a new five-step framework for revenue recognition. The core principal of the standard is that entities should recognize revenue to depict the transfer of promised goods or services to customers in an amount that reflects the consideration for which the entity expects to be entitled in exchange for those goods or services. This ASU also requires enhanced disclosures regarding the nature, amount, timing, and uncertainty of revenue and cash flows arising from an entity's contracts with customers. This standard can be applied either retrospectively to each period presented or as a cumulative-effect adjustment as of the date of adoption. On August 12, 2015, the FASB issued ASU 2015-14, Revenue from Contracts with Customers - Deferral of Effective Date, which defers the effective date of ASU 2014-09 to January 1, 2018 with early adoption beginning January 1, 2017. We are continuing to assess the impact of ASU 2014-09 on our Consolidated Financial Statements. Based on our progress to date, we do not expect the adoption of ASU 2014-09 to have a material impact on the timing of our revenue recognition.
In January 2016, the FASB issued ASU 2016-01, Financial Instruments-Overall: Recognition and Measurement of Financial Assets and Financial Liabilities. ASU 2016-01 addresses certain aspects of recognition, measurement, presentation, and disclosure of financial instruments, including requirements to measure most equity investments at fair value with changes in fair value recognized in net income, to perform a qualitative assessment of equity investments without readily determinable fair values, and to separately present financial assets and liabilities by measurement category and by type of financial asset on the balance sheet or in the accompanying notes to the financial statements. ASU 2016-01 will be effective for us beginning on January 1, 2018, and will be applied by means of a cumulative effect adjustment to the balance sheet, except for effects related to equity securities without readily determinable values, which will be applied prospectively. We are currently assessing the potential impact of adopting this new accounting standard on our Consolidated Financial Statements.
In February 2016, the FASB issued ASU 2016-02, Leases, which requires an entity to recognize long-term lease arrangements as assets and liabilities on the balance sheet of the lessee. Under ASU 2016-02, a right-of-use asset and lease obligation will be recorded for all long-term leases, whether operating or financing, while the income statement will reflect lease expense for operating leases and interest expense for financing leases. The amendments also require certain new quantitative and qualitative disclosures regarding leasing arrangements. ASU 2016-02 will be effective for us beginning on January 1, 2019. Lessees must apply a modified retrospective transition approach for leases existing at, or entered into after, the beginning of the earliest comparative period presented in the financial statements. Early adoption is permitted. We are currently assessing the potential impact of adopting this new accounting standard on our Consolidated Financial Statements.
In March 2016, the FASB issued ASU 2016-05, Derivatives and Hedging: Effect of Derivative Contract Novations on Existing Hedge Accounting Relationships, which clarifies that a change in the counterparty to a derivative instrument that has been designated as a hedging instrument would not, in and of itself, be considered a termination of the derivative instrument, provided that all other hedge accounting criteria continue to be met. We will adopt ASU 2016-05 on its effective date of January 1, 2017. The adoption of ASU 2016-05 will not have a material effect on our Consolidated Financial Statements.
In March 2016, the FASB issued ASU 2016-06, Derivatives and Hedging - Contingent Put and Call Options in Debt Instruments, which aims to reduce the diversity of practice in identifying embedded derivatives in debt instruments. ASU 2016-06 clarifies that the nature of an exercise contingency is not subject to the “clearly and closely” criteria for purposes of assessing whether the call or put option must be separated from the debt instrument and accounted for separately as a derivative. We will adopt ASU 2016-06 on its effective date of January 1, 2017. The adoption of ASU 2016-06 will not have a material effect on our Consolidated Financial Statements.
In March 2016, the FASB issued ASU 2016-09, Compensation - Stock Compensation: Improvements to Employee Share-Based Payment Accounting. ASU 2016-09 simplifies several aspects of the accounting and presentation of share-based payment transactions, including the accounting for related income tax consequences and certain classifications within the statement of cash flows. This standard requires companies to record all excess tax benefits and deficiencies resulting from the vesting of share-based payments to the income statement, whereas current guidance generally permits such items to be recorded to the equity section of the balance sheet provided that an adequate level of previously recorded excess tax benefits exists. We will adopt ASU 2016-09 on its effective date of January 1, 2017. We expect that the adoption of ASU 2016-09 could potentially result in increased variability in our effective income tax rate as a result of the requirement to record all excess tax benefits and deficiencies resulting from the vesting of share-based payments to our Consolidated Income Statements. We do not expect that the other provisions of ASU 2016-09 will have a material effect on our Consolidated Financial Statements.
In June 2016, the FASB issued ASU 2016-13, Measurement of Credit Losses on Financial Instruments, which amends previously issued guidance regarding the impairment of financial instruments by creating an impairment model that is based on
111
expected losses rather than incurred losses. ASU 2016-13 is effective for us beginning on January 1, 2020. Early adoption is permitted. We are currently assessing the potential impact of adopting this new accounting standard on our Consolidated Financial Statements.
In August 2016, the FASB issued ASU 2016-15, Statement of Cash Flows, which updates guidance as to how certain cash receipts and cash payments should be presented and classified within the statement of cash flows. ASU 2016-15 is intended to reduce the existing diversity in practice and is effective for us beginning on January 1, 2018. Early adoption is permitted. We are currently assessing the potential impact of adopting this new accounting standard on our Consolidated Financial Statements.
In November 2016, the FASB issued ASU 2016-18, Statement of Cash Flows, which amends ASC 230 to add or clarify guidance on the classification and presentation of restricted cash and restricted cash equivalents in the statement of cash flows. ASU 2016-18 is effective for us beginning on January 1, 2018. Early adoption is permitted. We are currently assessing the potential impact of adopting this new accounting standard on our Consolidated Financial Statements.
112
Note 29—Quarterly Results (Unaudited)
The global art auction market has two principal selling seasons, which generally occur in the second and fourth quarters of the year. In the aggregate, second and fourth quarter Net Auction Sales1 represented 82% and 78% of our total annual Net Auction Sales in 2016 and 2015, respectively, with auction commission revenues comprising approximately 75% of our total revenues in each of these years. Accordingly, our financial results are seasonal, with peak revenues and operating income generally occurring in the second and fourth quarters. Consequently, first and third quarter results have historically reflected lower revenues when compared to the second and fourth quarters and, typically, a net loss due to the fixed nature of many of our operating expenses.
First Quarter | Second Quarter | Third Quarter | Fourth Quarter | ||||||||||||
(In thousands, except per share data) | |||||||||||||||
Year Ended December 31, 2016 | |||||||||||||||
Net Auction Sales | $ | 491,176 | $ | 1,567,495 | $ | 160,208 | $ | 1,337,211 | |||||||
Income Statement Data: | |||||||||||||||
Revenues: | |||||||||||||||
Agency commissions and fees | $ | 81,065 | $ | 273,764 | $ | 51,285 | $ | 265,719 | |||||||
Inventory sales | 6,794 | 5,281 | 24,359 | 26,429 | |||||||||||
Finance | 14,755 | 14,750 | 11,138 | 12,073 | |||||||||||
Other | 3,917 | 4,870 | 4,710 | 4,468 | |||||||||||
Total revenues | $ | 106,531 | $ | 298,665 | $ | 91,492 | $ | 308,689 | |||||||
Operating (loss) income | $ | (31,989 | ) | $ | 130,083 | $ | (66,874 | ) | $ | 91,396 | |||||
Net (loss) income attributable to Sotheby's | $ | (25,884 | ) | $ | 88,964 | $ | (54,470 | ) | $ | 65,502 | |||||
Per Share Amounts: | |||||||||||||||
Basic (loss) earnings per share - Sotheby's common shareholders | $ | (0.41 | ) | $ | 1.54 | $ | (0.99 | ) | $ | 1.22 | |||||
Diluted (loss) earnings per share - Sotheby's common shareholders | $ | (0.41 | ) | $ | 1.52 | $ | (0.99 | ) | $ | 1.20 | |||||
Shares Outstanding: | |||||||||||||||
Basic | 63,022 | 57,104 | 55,013 | 52,956 | |||||||||||
Diluted | 63,022 | 57,712 | 55,013 | 53,685 | |||||||||||
Year Ended December 31, 2015 | |||||||||||||||
Net Auction Sales | $ | 755,817 | $ | 1,856,643 | $ | 370,928 | $ | 2,033,350 | |||||||
Income Statement Data: | |||||||||||||||
Revenues: | |||||||||||||||
Agency commissions and fees | $ | 127,882 | $ | 310,377 | $ | 69,222 | $ | 284,439 | |||||||
Inventory sales | 12,983 | 7,005 | 53,226 | 35,485 | |||||||||||
Finance | 12,687 | 11,970 | 12,933 | 12,899 | |||||||||||
Other | 2,123 | 2,654 | 2,611 | 2,998 | |||||||||||
Total revenues | $ | 155,675 | $ | 332,006 | $ | 137,992 | $ | 335,821 | |||||||
Operating income (loss) | $ | 18,404 | $ | 116,458 | $ | (21,707 | ) | $ | 88,566 | ||||||
Net income (loss) attributable to Sotheby's | $ | 5,202 | $ | 67,572 | $ | (17,894 | ) | $ | (11,153 | ) | |||||
Per Share Amounts: | |||||||||||||||
Basic earnings (loss) per share - Sotheby's common shareholders | $ | 0.07 | $ | 0.97 | $ | (0.26 | ) | $ | (0.17 | ) | |||||
Diluted earnings (loss) per share - Sotheby's common shareholders | $ | 0.07 | $ | 0.96 | $ | (0.26 | ) | $ | (0.17 | ) | |||||
Shares Outstanding: | |||||||||||||||
Basic | 69,090 | 69,332 | 67,946 | 66,118 | |||||||||||
Diluted | 69,705 | 69,884 | 67,946 | 66,118 | |||||||||||
__________________________________________________________________
1 Net Auction Sales represents the hammer or sale price of property sold at auction.
113
ITEM 9: CHANGES IN AND DISAGREEMENTS WITH ACCOUNTANTS ON ACCOUNTING AND FINANCIAL
DISCLOSURE
Not applicable.
ITEM 9A: | CONTROLS AND PROCEDURES |
Disclosure Controls and Procedures
As of December 31, 2016, the Company has carried out an evaluation, under the supervision and with the participation of the Company's management, including the Company's Chief Executive Officer and Chief Financial Officer, of the effectiveness of the Company's disclosure controls and procedures. Based upon that evaluation, the Company's Chief Executive Officer and Chief Financial Officer have concluded that the Company's disclosure controls and procedures (as defined in Exchange Act Rule 13a-15(e)) were effective as of December 31, 2016.
Management's Report on Internal Control over Financial Reporting
The Company's management is responsible for establishing and maintaining adequate internal control over financial reporting, as such term is defined in Exchange Act Rule 13a-15(f). Management evaluates the effectiveness of the Company's internal control over financial reporting using the criteria set forth by the Committee of Sponsoring Organizations of the Treadway Commission (COSO) in Internal Control - Integrated Framework (2013). Management, under the supervision and with the participation of the Company's Chief Executive Officer and Chief Financial Officer, assessed the effectiveness of the Company's internal control over financial reporting as of December 31, 2016 and concluded that it is effective.
The Company's independent registered public accounting firm, Deloitte & Touche LLP, has audited the effectiveness of the Company's internal control over financial reporting as of December 31, 2016 and has expressed an unqualified opinion in their report which is included herein.
Changes in Internal Control over Financial Reporting
There was no change in the Company's internal control over financial reporting that occurred during the Company's most recent fiscal quarter that has materially affected, or is reasonably likely to materially affect, the Company's internal control over financial reporting.
114
REPORT OF INDEPENDENT REGISTERED PUBLIC ACCOUNTING FIRM
To the Board of Directors and Stockholders of
Sotheby’s
New York, New York
We have audited the internal control over financial reporting of Sotheby’s and subsidiaries (the "Company") as of December 31, 2016, based on criteria established in Internal Control - Integrated Framework (2013) issued by the Committee of Sponsoring Organizations of the Treadway Commission. The Company's management is responsible for maintaining effective internal control over financial reporting and for its assessment of the effectiveness of internal control over financial reporting, included in the accompanying Management’s Report on Internal Control over Financial Reporting. Our responsibility is to express an opinion on the Company's internal control over financial reporting based on our audit.
We conducted our audit in accordance with the standards of the Public Company Accounting Oversight Board (United States). Those standards require that we plan and perform the audit to obtain reasonable assurance about whether effective internal control over financial reporting was maintained in all material respects. Our audit included obtaining an understanding of internal control over financial reporting, assessing the risk that a material weakness exists, testing and evaluating the design and operating effectiveness of internal control based on the assessed risk, and performing such other procedures as we considered necessary in the circumstances. We believe that our audit provides a reasonable basis for our opinion.
A company's internal control over financial reporting is a process designed by, or under the supervision of, the company's principal executive and principal financial officers, or persons performing similar functions, and effected by the company's board of directors, management, and other personnel to provide reasonable assurance regarding the reliability of financial reporting and the preparation of financial statements for external purposes in accordance with generally accepted accounting principles. A company's internal control over financial reporting includes those policies and procedures that (1) pertain to the maintenance of records that, in reasonable detail, accurately and fairly reflect the transactions and dispositions of the assets of the company; (2) provide reasonable assurance that transactions are recorded as necessary to permit preparation of financial statements in accordance with generally accepted accounting principles, and that receipts and expenditures of the company are being made only in accordance with authorizations of management and directors of the company; and (3) provide reasonable assurance regarding prevention or timely detection of unauthorized acquisition, use, or disposition of the company's assets that could have a material effect on the financial statements.
Because of the inherent limitations of internal control over financial reporting, including the possibility of collusion or improper management override of controls, material misstatements due to error or fraud may not be prevented or detected on a timely basis. Also, projections of any evaluation of the effectiveness of the internal control over financial reporting to future periods are subject to the risk that the controls may become inadequate because of changes in conditions, or that the degree of compliance with the policies or procedures may deteriorate.
In our opinion, the Company maintained, in all material respects, effective internal control over financial reporting as of December 31, 2016, based on the criteria established in Internal Control - Integrated Framework (2013) issued by the Committee of Sponsoring Organizations of the Treadway Commission.
We have also audited, in accordance with the standards of the Public Company Accounting Oversight Board (United States), the consolidated financial statements and financial statement schedules as of and for the year ended December 31, 2016 of the Company and our report dated February 27, 2017, expressed an unqualified opinion on those financial statements and financial statement schedules.
/S/ DELOITTE & TOUCHE LLP
New York, New York
February 27, 2017
115
PART III
ITEM 10: | DIRECTORS, EXECUTIVE OFFICERS AND CORPORATE GOVERNANCE |
Certain of the information required by this Item is incorporated by reference from our definitive proxy statement for the 2017 Annual Meeting of Stockholders to be filed with the SEC pursuant to Regulation 14A within 120 days after December 31, 2016.
Executive Officers of the Registrant
Our Executive Officers as of February 27, 2017 were:
7 | ||
Name | Age | Current Position and Officer |
Adam Chinn | 55 | Executive Vice President and Chief Operating Officer |
Kevin M. Delaney | 44 | Senior Vice President, Controller and Chief Accounting Officer |
David Goodman | 56 | Executive Vice President, Digital Development and Marketing |
Michael Goss | 57 | Executive Vice President and Chief Financial Officer |
Jane A. Levine | 57 | Executive Vice President, Chief Global Compliance Counsel and Head of Government and Regulatory Affairs |
Lisa Nadler | 53 | Executive Vice President and Chief Human Resources Officer |
Jonathan A. Olsoff | 57 | Executive Vice President and General Counsel |
Thomas S. Smith, Jr | 51 | President and Chief Executive Officer and a Director |
There is no family relationship between the directors or executive officers. The term of office of each of our foregoing officers will continue until the next annual meeting of the Board of Directors and until a successor has been elected and qualified.
Adam Chinn has served as Executive Vice President and Chief Operating Officer of the Company since February 2017. He joined the Company as Executive Vice President, Worldwide Head of Transaction Support in January 2016 as part of its acquisition of Art Agency, Partners. Mr. Chinn was a partner and Chief Operating Officer with Art Agency, Partners from October 2014 to January 2016. Prior to that, Mr. Chinn was a co-founder of the boutique investment bank Centerview Partners LLC from March 2007 to September 2014, and a partner at Wachtell, Lipton, Rosen & Katz until February 2007.
Kevin M. Delaney has served as Senior Vice President (and previously Vice President) and Chief Accounting Officer of the Company since March 2007. He joined Sotheby’s as Assistant Vice President (and later Vice President) and Assistant Corporate Controller in June 2000. From July 1998 to June 2000, Mr. Delaney served in several accounting management positions with Sony Music. From July 1994 to June 1998, Mr. Delaney was a staff accountant (and then senior accountant) with Deloitte & Touche. Mr. Delaney is a Certified Public Accountant.
David Goodman joined the Company in June 2015 as Executive Vice President of Digital Development and Marketing. From September 2014 until May 2015, he served as President, Productions and Live Entertainment, of The Madison Square Garden Company. Mr. Goodman had previously spent 12 years at CBS, leading various divisions of the company, including as president of CBS Live Experiences.
Michael Goss joined the Company in March 2016 as Executive Vice President and Chief Financial Officer. He was a partner and managing director at Bain Capital from 2001 to 2013, served as Bain’s Chief Financial Officer from 2001 to 2011, as Chief Operating Officer from 2004 to 2011 and Head of Global Investor Relations from 2012 to 2013. Prior thereto, he was Executive Vice President and Chief Financial Officer at Digitas in 2000 and Executive Vice President and Chief Financial Officer and a director at Playtex Products from 1994 to 1999. Mr. Goss is a director of Platform Specialty Products Corporation (NYSE: PAH).
Jane A. Levine has been Executive Vice President, Chief Global Compliance Counsel and Head of Government and Regulatory Affairs since May 2016. She joined the Company in September 2006 as Senior Vice President, Worldwide Director of Compliance. From August 1996 to August 2006, Ms. Levine served as an Assistant United States Attorney with the Southern District of New York, where she worked with the FBI’s Art Crime team.
116
Lisa Nadler joined the Company in September 2015 as Senior Vice President and Chief Human Resources Officer and became Executive Vice President and Chief Human Resources Officer in May 2016. From March 2014 to August 2015, she served as Senior Vice President, Human Resources, of The Madison Square Garden Company and from December 2011 to February 2014, she served as Senior Vice President, Human Resources Operations, of Cablevision. From March 2010 to December 2011, Ms. Nadler was the Senior Vice President, Compensation and Benefits, of XL Capital. Before joining XL Capital, Ms. Nadler was Senior Vice President and Treasurer for IMG Worldwide, Senior Vice President, Treasurer and Director of Investor Relations at Gartner, Inc., Vice President, Corporate Compensation and Benefits at Citibank, and an actuary at Woodrow Milliman.
Jonathan A. Olsoff has been with the Company since 1997. He has been Executive Vice President, Worldwide General Counsel of the Company since May 2016 and Senior Vice President, Worldwide General Counsel from May 2015 until May 2016. Mr. Olsoff also held the title of Corporate Secretary from May 2015 until September 2015. Prior to that, he held various positions, including Senior Vice President, General Counsel, Americas, Worldwide Head of Litigation and Assistant Secretary. Prior to joining the Company, Mr. Olsoff was employed with the law firm Berger & Steingut, where he served as one of Sotheby’s lead outside litigators, from 1994 to 1997.
Thomas S. (“Tad”) Smith, Jr. has served as President and Chief Executive Officer of the Company and a Director since March 2015. From February 2014 to March 2015, he served as President and Chief Executive Officer of The Madison Square Garden Company, a diversified media, entertainment and sports company. From 2009 to February 2014, Mr. Smith was President, Local Media, of Cablevision, responsible for Cablevision Media Sales. From 2000 to 2009, he worked for Reed Elsevier Group PLC, a worldwide media company, where he last served as chief executive officer of the company’s U.S. business-to-business division, Reed Business Information (RBI). He currently serves as an Adjunct Professor at NYU Stern School of Business.
ITEM 11: EXECUTIVE COMPENSATION
The information required by this item is incorporated herein by reference to the material appearing in the Proxy Statement under the captions "Compensation of Executive Officers" and "Compensation of Directors." Notwithstanding anything to the contrary herein, the Report of the Audit Committee and the Report of the Compensation Committee in the Proxy Statement are not incorporated by reference herein.
ITEM 12: SECURITY OWNERSHIP OF CERTAIN BENEFICIAL OWNERS AND MANAGEMENT AND
RELATED STOCKHOLDER MATTERS
The information required by this item is incorporated herein by reference to the tables and related text and footnotes appearing in the Proxy Statement under the captions "Security Ownership of Certain Beneficial Owners and Management" and "Equity Compensation Plans."
ITEM 13: | CERTAIN RELATIONSHIPS AND RELATED TRANSACTIONS AND DIRECTOR INDEPENDENCE |
The information required by this item is incorporated herein by reference to the material appearing in the Proxy Statement under the captions "Corporate Governance" and "Certain Relationships and Related Party Transactions."
ITEM 14: | PRINCIPAL ACCOUNTANT FEES AND SERVICES |
The information required by this item is incorporated herein by reference to the material appearing in the Proxy Statement under the caption "Proposal 2—Ratification of the Appointment of Independent Registered Public Accounting Firm."
117
PART IV
ITEM 15: EXHIBITS, FINANCIAL STATEMENT SCHEDULES, AND REPORTS ON FORM 8-K
15(a)(1) | — | The following consolidated financial statements and the related notes thereto of Sotheby's and subsidiaries are contained in Item 8, "Financial Statements and Supplementary Data": Consolidated Income Statements—Years ended December 31, 2016, 2015, and 2014; Consolidated Statements of Comprehensive Income—Years ended December 31, 2016, 2015, and 2014; Consolidated Balance Sheets—December 31, 2016 and 2015; Consolidated Statements of Cash Flows—Years ended December 31, 2016, 2015, and 2014; Consolidated Statements of Changes in Shareholders' Equity—Years ended December 31, 2016, 2015, and 2014. |
15(a)(2) | — | The following is the consolidated financial statement schedule of Sotheby's and subsidiaries required by Item 15(d): Schedule II—Valuation and Qualifying Accounts for the years ended December 31, 2016, 2015, and 2014. |
15(a)(3) | ||
2.1 | — | Agreement and Plan of Merger between Sotheby's Holdings, Inc., a Michigan corporation and Sotheby's Delaware, Inc., a Delaware corporation, dated March 31, 2006, incorporated by reference to Exhibit 2.1 to the Company's First Quarter Form 10-Q for 2006. |
3.1 | — | Certificate of Incorporation of Sotheby's, as amended as of June 30, 2006, incorporated by reference to Exhibit 3.1 to the Company's current report on Form 8-K, filed on July 7, 2006. |
3.2 | — | Amended and Restated By-Laws of Sotheby's, amended through November 4, 2010, incorporated by reference to Exhibit 3.2 to the Company's Third Quarter Form 10-Q for 2010. |
3.3 | — | Amendment to the Amended and Restated By-Laws of Sotheby's, effective as of February 25, 2016, incorporated by reference to Exhibit 3.1 to the Company's current report on Form 8-K, filed on March 1, 2016. |
3.4 | — | Form of Indemnity Agreement, as amended and restated as of August 4, 2009, incorporated by reference to Exhibit 10.1 to the Company's Second Quarter Form 10-Q for 2009. |
4.1 | — | See Exhibits 3.1, 3.2, 3.3, and 3.4 |
4.2 | — | Specimen Common Stock Certificate of Sotheby's, incorporated by reference to Exhibit 4.1 to Post-Effective Amendment No. 1 to the Company's Registration Statement on Form 8-A filed on November 21, 2006. |
4.3 | — | Indenture, dated as of September 27, 2012, for the 5.25% Senior Notes due 2022 among Sotheby's, as Issuer, and Initial Subsidiary Guarantors Party thereto and U.S. Bank National Association, as Trustee, incorporated by reference to Exhibit 4.1 to the Company's current report on Form 8-K filed on September 27, 2012. |
10.1* | — | Sotheby's Deferred Compensation Plan, dated December 21, 2006 and effective January 1, 2007, incorporated by reference to Exhibit 10.2 to the Company's Annual Report on Form 10-K for the year ended December 31, 2006. |
10.2* | — | Sotheby's Holdings, Inc. 1997 Stock Option Plan Composite Plan Document, effective January 1, 2000, incorporated by reference to Exhibit 10(k) to the Company's Annual Report on Form 10-K for the year ended December 31, 2000. |
10.3* | — | Seventh Amendment to the Sotheby's Holdings, Inc. 1997 Stock Option Plan dated November 7, 2005, effective September 8, 2005, incorporated by reference to Exhibit 10.4 to the Company's Annual Report on Form 10-K for the year ended December 31, 2005. |
10.4* | — | Eighth Amendment to the Sotheby's 1997 Stock Option Plan, dated and effective May 8, 2006, incorporated by reference to Exhibit 10.2 to the Company's current report on Form 8-K dated May 12, 2006. |
10.5 | — | Agreement of Partnership of Acquavella Modern Art, dated May 29, 1990, between Sotheby's Nevada, Inc. and Acquavella Contemporary Art, Inc., incorporated by reference to Exhibit 10(b) to the Company's current report on Form 8-K, filed on June 7, 1990, SEC File No. 1-9750, on file at the Washington, D.C. office of the Securities and Exchange Commission. |
10.6 | — | Sixteenth Amendment to the Agreement of Partnership dated March 30, 2016, between Sotheby's Nevada Inc. and Acquavella Contemporary Art, incorporated by reference to the Exhibit 10.1 to the Company's First Quarter Form 10-Q for 2016. |
118
10.7* | — | Sotheby's 1998 Stock Compensation Plan for Non-Employee Directors, as amended and restated on April 9, 2007, effective May 7, 2007 (the "Directors Plan"), incorporated by reference to Exhibit 10.2 to the Company's current report on Form 8-K, filed on May 11, 2007. |
10.8* | — | First Amendment to the Directors Plan, dated November 6, 2007, incorporated by reference to Exhibit 10.14 to the Company's Annual Report on Form 10-K for the year ended December 31, 2007 (the "2007 Form 10-K"). |
10.9* | — | Second Amendment to the Directors Plan, adopted by the Board of Directors of the Company on March 18, 2010, effective as of May 6, 2010, and incorporated by reference to Exhibit 10.1 to the Company's current report on Form 8-K, filed on May 11, 2010. |
10.10 | — | Amended and Restated Auction Credit Agreement, dated as of August 22, 2014, among Sotheby's, a Delaware corporation, Sotheby's Inc., Sotheby's Financial Services, Inc., Sotheby's Financial Services, Inc., Sotheby's Financial Services California, Inc., Oberon, Inc., Sotheby's Ventures, LLC, Oatshare Limited, Sotheby's, a company registered in England, Sotheby's Financial Services Limited, and Sotheby's Hong Kong Limited as Borrowers, the Other Credit Parties Signatory Hereto, as Credit Parties, the Lenders Signatory Hereto from time to time, as Lenders, Wells Fargo (formerly known as General Electric Capital Corporation), as Administrative Agent, Collateral Agent and a Lender, and Wells Fargo (formerly known as GE Capital Markets, Inc.), J.P. Morgan Securities LLC and HSBC Bank USA, N.A., as Joint Lead Arrangers and Joint Bookrunners, incorporated by reference to Exhibit 10.1 to the Company's current report on Form 8-K filed on August 25, 2014. |
10.11 | — | Amended and Restated SFS Credit Agreement, dated as of August 22, 2014, among Sotheby's Inc., Sotheby's Financial Services, Inc., Sotheby's Financial Services, Inc., Sotheby's Financial Services California, Inc., Oberon, Inc., Sotheby's Ventures, LLC, Sotheby's, a company registered in England, Sotheby's Financial Services Limited, and Sotheby's Hong Kong Limited as Borrowers, the Other Credit Parties Signatory Hereto, as Credit Parties, the Lenders Signatory Hereto from time to time, as Lenders, Wells Fargo (formerly known as General Electric Capital Corporation), as Administrative Agent, Collateral Agent and a Lender, and Wells Fargo (formerly known as GE Capital Markets, Inc.), J.P. Morgan Securities LLC and HSBC Bank USA, N.A., as Joint Lead Arrangers and Joint Bookrunners, incorporated by reference to Exhibit 10.2 to the Company's current report on Form 8-K filed on August 25, 2014. |
10.12 | — | Amendment No. 1 to the Amended and Restated Auction Credit Agreement and Amended and Restated SFS Credit Agreement, dated June 15, 2015, by and among Sotheby’s, a Delaware corporation, Sotheby’s, Inc., Sotheby’s Financial Services, Inc., Sotheby’s Financial Services California, Inc., Oberon, Inc., Sotheby’s Ventures, LLC, Sotheby’s Financial Services Limited, Oatshare Limited, Sotheby’s, a company registered in England, and Sotheby’s Hong Kong Limited as Borrowers, the Other Credit Parties signatory hereto, Wells Fargo (formerly known as General Electric Capital Corporation), as Administrative Agent and Collateral Agent, and the Lenders signatory hereto, incorporated by reference to Exhibit 10.2 to the Company's Second Quarter Form 10-Q for 2015. |
10.13 | — | Amendment No. 1 to Amended and Restated Credit Agreement (the Auction Revolving Credit Facility), dated June 15, 2015, among Sotheby’s, a Delaware corporation, Sotheby’s, Inc., Sotheby’s Financial Services, Inc., Sotheby’s Financial Services California, Inc., Oberon, Inc., Sotheby’s Ventures, LLC, Sotheby’s Financial Services Limited, Oatshare Limited, Sotheby’s, a company registered in England, and Sotheby’s Hong Kong Limited as Borrowers, the Other Credit Parties signatory hereto, as Credit Parties, the Lenders Signatory Hereto from time to time, as Lenders, Wells Fargo (formerly known as General Electric Capital Corporation), as Administrative Agent, Collateral Agent, and a Lender, and Wells Fargo (formerly known as GE Capital Markets, Inc.), J.P. Morgan Securities LLC, and HSBC Bank USA, N.A., as Joint Lead Arrangers and Joint Bookrunners, incorporated by reference to Exhibit 10.3 to the Company's Second Quarter Form 10-Q for 2015. |
10.14 | — | Amendment No. 1 to Amended and Restated Credit Agreement (the SFS Revolving Credit Facility), dated June 15, 2015, among Sotheby’s, Inc., Sotheby’s Financial Services, Inc., Sotheby’s Financial Services California, Inc., Oberon, Inc., Sotheby’s Ventures, LLC, Sotheby’s Financial Services Limited, Sotheby’s, a company registered in England, and Sotheby’s Hong Kong Limited as Borrowers, the Other Credit Parties signatory hereto, as Credit Parties, the Lenders Signatory Hereto from time to time, as Lenders, Wells Fargo (formerly known as General Electric Capital Corporation), as Administrative Agent, Collateral Agent, and a Lender, and Wells Fargo (formerly known as GE Capital Markets, Inc.), J.P. Morgan Securities LLC, and HSBC Bank USA, N.A., as Joint Lead Arrangers and Joint Bookrunners, incorporated by reference to Exhibit 10.4 to the Company's Second Quarter Form 10-Q for 2015. |
119
10.15 | — | Amendment No.1 to the Amended and Restated Auction Guaranty Side Letter to the Amended and Restated Credit Agreement, dated September 16, 2015, by and among Sotheby’s, a Delaware corporation (“Parent”), Sotheby’s, Inc., a New York corporation (“Sotheby’s, Inc.”), Sotheby’s Financial Services, Inc., a Nevada corporation (“SFS Inc.”), Sotheby’s Financial Services California, Inc., a Nevada corporation (“SFS California”), Oberon, Inc., a Delaware corporation (“Oberon”), Sotheby’s Ventures, LLC, a New York limited liability company (“Ventures”), Sotheby’s Financial Services Limited, a company registered in England (“SFS Ltd.”), Oatshare Limited, a company registered in England (“Oatshare”), Sotheby’s, a company registered in England (“Sotheby’s U.K.”), and Sotheby’s Hong Kong Limited, a company incorporated in Hong Kong (“Sotheby’s H.K.” and, collectively with Sotheby’s Inc., SFS Inc., SFS California, Oberon, Ventures, Sotheby’s U.K. and SFS Ltd., the “SFS Borrowers”; the SFS Borrowers, collectively with the Parent and Oatshare, the “Auction Borrowers” and the Auction Borrowers together with the SFS Borrowers, the “Borrowers”), the other Credit Parties signatory hereto, Wells Fargo (formerly known as General Electric Capital Corporation), as Administrative Agent under the SFS Credit Agreement and as Administrative Agent under the Auction Credit Agreement (collectively referred to herein as the “Administrative Agents”), and the Lenders signatory hereto, incorporated by reference to Exhibit 10.1 to the Company's Third Quarter Form 10-Q for 2015. |
10.16 | — | Purchase and Sale Agreement, dated January 11, 2008 between 1334 York Avenue L.P., Seller and Sotheby's, purchaser for 1334 York Avenue, New York, New York 10021, incorporated by reference to Exhibit 10.1 to the Company's First Quarter Form 10-Q for 2009. |
10.17 | — | Consent and Assumption Agreement with Release, dated as of February 6, 2009 between 1334 York, LLC as New Borrower, Sotheby's as New Guarantor, 1334 York Avenue L.P., as Original Borrower, Aby Rosen and Michael Fuchs as Original Guarantor and Bank of America, N.A. as Agent and certain other parties, incorporated by reference to Exhibit 10.2 to the Company's First Quarter Form 10-Q for 2009. |
10.18 | — | Loan Agreement, dated as of June 22, 2005 between 1334 York Avenue L.P., as Borrower and Bank of America, N.A., as Lender, incorporated by reference to Exhibit 10.3 to the Company's First Quarter Form 10-Q for 2009. |
10.19 | — | First Amendment to Loan Agreement and Other Loan Documents, dated as of September 20, 2005 between 1334 York Avenue L.P., as Borrower, and Bank of America, N.A., as Lender, incorporated by reference to Exhibit 10.4 to the Company's First Quarter Form 10-Q for 2009. |
10.20 | — | Loan Agreement, dated as of July 1, 2015, among 1334 York, LLC, as Borrower, HSBC Bank USA, National Association, as Agent, HSBC Bank USA, National Association and Industrial and Commercial Bank of China, Limited, New York Branch, as Lenders and collectively, as Lead Arranger, and the other Lenders from time to time a party thereto, incorporated by reference to Exhibit 10.1 to the Company's current report on Form 8-K filed on July 6, 2015. |
10.21 | — | Guaranty of Recourse Carveouts, dated as of July 1, 2015, by Sotheby’s, as Guarantor, for the benefit of HSBC Bank USA, National Association, as Agent, incorporated by reference to Exhibit 10.2 to the Company's current report on Form 8-K filed on July 6, 2015. |
10.22 | — | Environmental Indemnity Agreement, dated as of July 1, 2015, between 1334 York, LLC and Sotheby’s, in favor of HSBC Bank USA, National Association, as Agent, incorporated by reference to Exhibit 10.3 to the Company's current report on Form 8-K filed on July 6, 2015. |
10.23 | — | Lease between 1334 York Avenue L.P., "Landlord," and Sotheby's, Inc., "Tenant," February 7, 2003; Premises: 1334 York Avenue, New York, New York, incorporated by reference to Exhibit 10(b) to the Company's First Quarter Form 10-Q for 2003. |
10.24 | — | Guaranty of Lease, made by Sotheby's in favor of 1334 York Avenue L.P., dated as of June 30, 2006 incorporated by reference to Exhibit 10.29 to the Company's current report on Form 8-K, filed on July 7, 2006. |
10.25 | — | Joint Venture Contract between GeHua Art Company and Sotheby's Hong Kong Limited; For The Establishment of Sotheby's (Beijing) Auction Co., LTD, dated as of September 3, 2012, incorporated by reference to Exhibit 10.3 to the Company's Third Quarter Form 10-Q for 2012. |
10.26 | — | Joint Venture Contract between GeHua Art Company and Sotheby's Hong Kong Limited; For The Establishment of Sotheby's (Beijing) Auction Co., LTD, amended as of September 26, 2012, incorporated by reference to Exhibit 10.4 to the Company's Third Quarter Form 10-Q for 2012. |
10.27* | — | Employment Agreement dated September 1, 2010 between the Company and William F. Ruprecht, incorporated by reference to Exhibit 10.1 to the Company's current report on Form 8-K filed on September 3, 2010. |
10.28*^ | — | Confidentiality Agreement dated September 2, 2010 between the Company and William F. Ruprecht, incorporated by reference to Exhibit 10.2 to the Company's current report on Form 8-K filed on September 3, 2010. |
120
10.29* | — | Letter Agreement, dated December 19, 2013, but effective as of January 1, 2014, between the Company and William F. Ruprecht, incorporated by reference to Exhibit 10.1 to the Company's current report on Form 8-K filed on December 24, 2013. |
10.30* | — | Letter Agreement, dated November 20, 2014, between the Company and William F. Ruprecht. |
10.31*^ | — | Performance Share Unit Agreement effective as of February 26, 2015 between the Company and William F. Ruprecht, incorporated by reference to Exhibit 10.37 to the Company's Annual Report on Form 10-K for the year ended December 31, 2014. |
10.32* | — | Severance Agreement, dated September 22, 2013, between the Company and Patrick S. McClymont, incorporated by reference to Exhibit 10.2 to the Company's Third Quarter Form 10-Q for 2013. |
10.33* | — | Offer Letter (with related Confidentiality Agreement), dated September 22, 2013, between the Company and Patrick S. McClymont, incorporated by reference to Exhibit 10.3 to the Company's Third Quarter Form 10-Q for 2013. |
10.34* | — | Severance Agreement Amendment, dated December 19, 2013 but effective as of January 1, 2014, between the Company and Patrick S. McClymont, incorporated by reference to Exhibit 10.3 to the Company's current report on Form 8-K filed on December 24, 2013. |
10.35* | — | Transition Agreement, dated December 15, 2015, between the Company and Patrick S. McClymont, incorporated by reference to Exhibit 10.35 to the Company's Annual Report on Form 10-K for the year ended December 31, 2015. |
10.36* | — | Severance Agreement, dated December 31, 2014 but effective as of January 1, 2015, between the Company and Bruno Vinciguerra, incorporated by reference to Exhibit 10.1 to the Company's current report on Form -K, filed on January 6, 2015. |
10.37*^ | — | Performance Share Unit Agreement effective as of February 26, 2015 between the Company and Bruno Vinciguerra, incorporated by reference to Exhibit 10.43 to the Company's Annual Report on Form 10-K for the year ended December 31, 2014. |
10.38* | — | Restricted Stock Unit Agreement effective as of February 26, 2015 between the Company and Bruno Vinciguerra, incorporated by reference to Exhibit 10.44 to the Company's Annual Report on Form 10-K for the year ended December 31, 2014. |
10.39* | — | Severance Agreement between Sotheby's and Kevin Ching, dated as of January 1, 2010, incorporated by reference to Exhibit 10.3 to the Company's First Quarter Form 10-Q for 2010. |
10.40* | — | Letter Agreement, dated December 20, 2013, between Sotheby's Hong Kong, Ltd., a Company subsidiary, and Kevin Ching, incorporated by reference to Exhibit 10.4 to the Company's current report on Form 8-K filed on December 24, 2013. |
10.41* | — | Severance Agreement between Sotheby's and Alfredo Gangotena, dated December 4, 2013, incorporated by reference to Exhibit 10.5 to the Company's First Quarter Form 10-Q for 2015. |
10.42* | — | Severance Agreement, dated June 1, 2015, between Sotheby's and David Goodman, incorporated by reference to Exhibit 10.1 to the Company's Second Quarter Form 10-Q for 2015. |
10.43* | — | Employment Agreement, dated March 13, 2015, effective as of March 31, 2015, between the Company and Thomas S. Smith, Jr., incorporated by reference to Exhibit 10.1 to the Company's current report on Form 8-K filed on March 18, 2015. |
10.44* | — | Restricted Stock Unit Agreement between Sotheby's and Thomas S. Smith, dated March 31, 2015, incorporated by reference to Exhibit 10.2 to the Company's First Quarter Form 10-Q for 2015. |
10.45* | — | Restricted Stock Agreement between Sotheby's and Thomas S. Smith, dated March 31, 2015, incorporated by reference to Exhibit 10.3 to the Company's First Quarter Form 10-Q for 2015. |
10.46* | — | Performance Stock Unit Agreement between Sotheby's and Thomas S. Smith, dated March 31, 2015, incorporated by reference to Exhibit 10.4 to the Company's First Quarter Form 10-Q for 2015. |
10.47* | — | Severance Agreement, dated December 31, 2014 but effective as of January 1, 2015, between the Company and Mitchell Zuckerman, incorporated by reference to Exhibit 10.2 to the Company's current report on Form 8-K, filed on January 6, 2015. |
10.48* | — | Letter Agreement, between the Company and Jane Levine, dated May 8, 2015, incorporated by reference to Exhibit 10.3 to the Company's First Quarter Form 10-Q for 2016. |
10.49* | — | Letter Agreement, between the Company and Lisa Nadler, dated August 13, 2015, incorporated by reference to Exhibit 10.4 to the Company's First Quarter Form 10-Q for 2016. |
121
10.50* | — | Letter Agreement, between the Company and Michael Goss, amended through February 24, 2017. |
10.51* | — | Fourth Amended and Restated Sotheby's Restricted Stock Unit Plan, reflecting amendments effective as of February 7, 2017. |
10.52* | — | Form of Performance Share Unit Agreement, adopted by the Board of Directors of the Company on February 9, 2016, incorporated by reference to Exhibit 10.51 in the Company's Annual Report on Form 10-K for the year ended December 31, 2015. |
10.53 | — | Stock Purchase Agreement, dated as of February 17, 2004, by and among NRT Incorporated as the Purchaser, Sotheby's Holdings, Inc., as the Seller, and Cendant Corporation as the Purchaser Guarantor, incorporated by reference to Exhibit 99.2 to the Company's current report on Form 8-K, filed on March 2, 2004. |
10.54 | — | Trademark License Agreement, dated as of February 17, 2004, among SPTC, Inc., as Licensor, Sotheby's Holdings, Inc. as Guarantor, Monticello Licensee Corporation, as Licensee, and Cendant Corporation, as Guarantor, incorporated by reference to Exhibit 99.3 to the Company's current report on Form 8-K, filed on March 2, 2004. |
10.55 | — | Amendment No. 1 to Trademark License Agreement, dated as of May 2, 2005, among SPTC Delaware, LLC (as an assignee of SPTC, Inc) and Sotheby's Holdings, Inc. and Cendant Corporation and Sotheby's International Realty Licensee Corporation (formerly known as Monticello Licensee Corporation), incorporated by reference to Exhibit 10.1 to the Company's Second Quarter Form 10-Q for 2005. |
10.56* | — | Amendment No. 2 to Trademark License Agreement, dated as of May 2, 2005, among SPTC Delaware, LLC (as an assignee of SPTC, Inc) and Sotheby's Holdings, Inc. and Cendant Corporation and Sotheby's International Realty Licensee Corporation (formerly known as Monticello Licensee Corporation), incorporated by reference to Exhibit 10.2 to the Company's Second Quarter Form 10-Q for 2005. |
10.57* | — | Sotheby's Executive Bonus Plan (amended as of January 1, 2012), incorporated by reference to Appendix B to the Company's Proxy Statement on Schedule 14A filed March 28, 2012. |
10.58* | — | Sotheby's First Amended Executive Severance Benefits Plan, effective February 7, 2017. |
10.59* | — | Sotheby's 2016 Annual Bonus Plan, as adopted on May 6, 2016, incorporated by reference to Appendix A to the Company's Proxy Statement on Schedule 14A filed on March 24, 2016. |
10.60* | — | Sotheby's Compensation Recoupment Policy, effective January 1, 2015, incorporated by reference to Exhibit 10.1 to the Company's Second Quarter Form 10-Q for 2016. |
10.61 | — | Support Agreement, dated May 4, 2014 by and among the Company, Third Point LLC and the other persons set forth on the signature pages thereto, incorporated by reference to Exhibit 99.1 to the Company's current report on Form 8-K filed on May 7, 2014. |
10.62 | — | Master Confirmation - Uncollared Accelerated Share Repurchase, dated August 13, 2015, between J.P. Morgan Securities LLC, as agent for JPMorgan Chase Bank, National Association, London Branch, and Sotheby’s, incorporated by reference to Exhibit 10.1 to the Company's Third Quarter Form 10-Q for 2015. |
10.63 | — | Purchase Agreement, dated as of January 11, 2016, by and among Amy Cappellazzo, Allan Schwartzman, Adam Chinn and Sotheby’s, Inc., incorporated by reference to Exhibit 99.1 to the Company's current report on Form 8-K filed on January 11, 2016. |
10.64 | — | Support Agreement, dated September 8, 2016, by and between Sotheby's and Taikang Insurance Group, incorporated by reference to Exhibit 99.1 to the Company's current report on Form 8-K filed on September 9, 2016. |
10.65 | — | Share Repurchase Agreement, dated October 3, 2016, by and between Marcato, L.P., Marcato II, L.P., and Sotheby's, incorporated by reference to Exhibit 10.1 to the Company's current report on Form 8-K filed on October 4, 2016. |
10.66 | — | Confidentiality Agreement, dated October 3, 2016, by and between Richard T. McGuire III, Marcato Capital Management LP, Marcato, L.P., Marcato II, L.P., Marcato International Master Fund, Ltd. and Sotheby's, incorporated by reference to Exhibit 10.2 to the Company's current report on Form 8-K filed on October 4, 2016. |
10.67* | — | Letter Agreement, between the Company and Dennis Weibling dated December 16, 2015. |
21 | — | Subsidiaries of the Registrant |
23 | — | Consent of Deloitte & Touche LLP |
31.1 | — | Certification of Chief Executive Officer pursuant to Section 302 of the Sarbanes-Oxley Act of 2002. |
122
31.2 | — | Certification of Chief Financial Officer pursuant to Section 302 of the Sarbanes-Oxley Act of 2002. |
32.1 | — | Certification of Chief Executive Officer pursuant to Section 906 of the Sarbanes-Oxley Act of 2002. |
32.2 | — | Certification of Chief Financial Officer pursuant to Section 906 of the Sarbanes-Oxley Act of 2002. |
101INS | — | XBRL Instance Document. |
101.SCH | — | XBRL Taxonomy Extension Schema Document. |
101.CAL | — | XBRL Taxonomy Extension Calculation Linkbase Document. |
101.DEF | — | XBRL Taxonomy Extension Definition Linkbase Document. |
101.LAB | — | XBRL Taxonomy Extension Label Linkbase Document. |
101.PRE | — | XBRL Taxonomy Extension Presentation Linkbase Document. |
— | The list of exhibits filed with this report is set forth in response to Item 15(a)(3). The required exhibit index has been filed with the exhibits. | |
— | The financial statement schedule of the Company listed in response to Item 15(a)(2) is filed pursuant to this Item 15(d). | |
* | A compensatory agreement or plan required to be filed pursuant to Item 15(c) of Form 10-K. | |
^ | Confidential treatment has been requested with respect to portions of this exhibit, and the redacted information has been filed separately with the Securities and Exchange Commission. | |
FORM 8-K FILINGS IN THE FOURTH QUARTER OF 2016 | ||
— | On October 4, 2016, the Company filed a current report on Form 8-K under Item 1.01, "Entry into a Material Definitive Agreement," Item 2.01, "Completion of Acquisition or Disposition of Assets," Item 8.01, "Other Events," and Item 9.01, "Financial Statements and Exhibits." | |
— | On November 7, 2016, the Company filed a current report on Form 8-K under Item 2.02, "Results of Operations and Financial Conditions," Item 5.02, "Departure of Directors or Certain Officers; Election of Directors; Appointment of Certain Officers; Compensatory Arrangements of Certain Officers," Item 8.01, Other Events," and Item 9.01, "Financial Statements and Exhibits." | |
123
SCHEDULE II
SOTHEBY'S
VALUATION AND QUALIFYING ACCOUNTS
YEARS ENDED DECEMBER 31, 2016, 2015, AND 2014
Column A | Column B | Column C | Column D | Column E | ||||||||||||||||
Description | Balance at Beginning of Period | Charged to Costs and Expenses | Charged to Other Accounts | Deductions | Balance at End of Period | |||||||||||||||
(Thousands of dollars) | ||||||||||||||||||||
Valuation reserve deducted in the balance sheet from the asset to which it applies: | ||||||||||||||||||||
Receivables: | ||||||||||||||||||||
2016 Allowance for doubtful accounts and credit losses | $ | 10,099 | $ | 928 | $ | — | $ | 2,087 | $ | 8,940 | ||||||||||
2015 Allowance for doubtful accounts and credit losses | $ | 8,484 | $ | 2,607 | $ | — | $ | 992 | $ | 10,099 | ||||||||||
2014 Allowance for doubtful accounts and credit losses | $ | 8,685 | $ | 1,893 | $ | — | $ | 2,094 | $ | 8,484 | ||||||||||
Deferred tax assets: | ||||||||||||||||||||
2016 Valuation allowance | $ | 2,437 | $ | 526 | $ | — | $ | 144 | $ | 2,819 | ||||||||||
2015 Valuation allowance | $ | 2,224 | $ | 461 | $ | — | $ | 248 | $ | 2,437 | ||||||||||
2014 Valuation allowance | $ | 3,227 | $ | 29 | $ | — | $ | 1,032 | $ | 2,224 | ||||||||||
124
SIGNATURES
Pursuant to the requirements of Section 13 or 15(d) of the Securities Exchange Act of 1934, the registrant has duly caused this report to be signed on its behalf by the undersigned, thereunto duly authorized.
SOTHEBY'S | ||
By: | /s/ THOMAS S. SMITH | |
Thomas S. Smith | ||
President and Chief Executive Officer | ||
Pursuant to the requirements of the Securities Exchange Act of 1934, this report has been signed below by the following persons on behalf of the registrant and in the capacities indicated on the 27th day of February 2017.
Signature | Title | |
/s/ THOMAS S. SMITH | President and Chief Executive Officer | |
Thomas S. Smith | ||
/s/ DOMENICO DE SOLE | Chairman of the Board | |
Domenico De Sole | ||
/s/ DEVONSHIRE | Deputy Chairman of the Board | |
The Duke of Devonshire | ||
/s/ JESSICA BIBLIOWICZ | Director | |
Jessica Bibliowicz | ||
/s/ LINUS W. L. CHEUNG | Director | |
Linus W. L. Cheung | ||
/s/ KEVIN CONROY | Director | |
Kevin Conroy | ||
/s/ DANIEL S. LOEB | Director | |
Daniel S. Loeb | ||
/s/ OLIVIER REZA | Director | |
Olivier Reza | ||
/s/ MARSHA E. SIMMS | Director | |
Marsha E. Simms | ||
/s/ DIANA L. TAYLOR | Director | |
Diana L. Taylor | ||
/s/ DENNIS M. WEIBLING | Director | |
Dennis M. Weibling | ||
/s/ HARRY J. WILSON | Director | |
Harry J. Wilson | ||
/s/ MICHAEL GOSS | Executive Vice President and Chief Financial Officer | |
Michael Goss | ||
/s/ KEVIN M. DELANEY | Senior Vice President, Controller and Chief Accounting Officer | |
Kevin M. Delaney | ||
125
EXHIBIT INDEX
Exhibit No. | Description | |
2.1 | — | Agreement and Plan of Merger between Sotheby's Holdings, Inc., a Michigan corporation and Sotheby's Delaware, Inc., a Delaware corporation, dated March 31, 2006, incorporated by reference to Exhibit 2.1 to the Company's First Quarter Form 10-Q for 2006. |
3.1 | — | Certificate of Incorporation of Sotheby's, as amended as of June 30, 2006, incorporated by reference to Exhibit 3.1 to the Company's current report on Form 8-K, filed on July 7, 2006. |
3.2 | — | Amended and Restated By-Laws of Sotheby's, amended through November 4, 2010, incorporated by reference to Exhibit 3.2 to the Company's Third Quarter Form 10-Q for 2010. |
3.3 | — | Amendment to the Amended and Restated By-Laws of Sotheby's, effective as of February 25, 2016, incorporated by reference to Exhibit 3.1 to the Company's current report on Form 8-K, filed on March 1, 2016. |
3.4 | — | Form of Indemnity Agreement, as amended and restated as of August 4, 2009, incorporated by reference to Exhibit 10.1 to the Company's Second Quarter Form 10-Q for 2009. |
4.1 | — | See Exhibits 3.1, 3.2, 3.3, and 3.4 |
4.2 | — | Specimen Common Stock Certificate of Sotheby's, incorporated by reference to Exhibit 4.1 to Post-Effective Amendment No. 1 to the Company's Registration Statement on Form 8-A filed on November 21, 2006. |
4.3 | — | Indenture, dated as of September 27, 2012, for the 5.25% Senior Notes due 2022 among Sotheby's, as Issuer, and Initial Subsidiary Guarantors Party thereto and U.S. Bank National Association, as Trustee, incorporated by reference to Exhibit 4.1 to the Company's current report on Form 8-K filed on September 27, 2012. |
10.1* | — | Sotheby's Deferred Compensation Plan, dated December 21, 2006 and effective January 1, 2007, incorporated by reference to Exhibit 10.2 to the Company's Annual Report on Form 10-K for the year ended December 31, 2006. |
10.2* | — | Sotheby's Holdings, Inc. 1997 Stock Option Plan Composite Plan Document, effective January 1, 2000, incorporated by reference to Exhibit 10(k) to the Company's Annual Report on Form 10-K for the year ended December 31, 2000. |
10.3* | — | Seventh Amendment to the Sotheby's Holdings, Inc. 1997 Stock Option Plan dated November 7, 2005, effective September 8, 2005, incorporated by reference to Exhibit 10.4 to the Company's Annual Report on Form 10-K for the year ended December 31, 2005. |
10.4* | — | Eighth Amendment to the Sotheby's 1997 Stock Option Plan, dated and effective May 8, 2006, incorporated by reference to Exhibit 10.2 to the Company's current report on Form 8-K dated May 12, 2006. |
10.5 | — | Agreement of Partnership of Acquavella Modern Art, dated May 29, 1990, between Sotheby's Nevada, Inc. and Acquavella Contemporary Art, Inc., incorporated by reference to Exhibit 10(b) to the Company's current report on Form 8-K, filed on June 7, 1990, SEC File No. 1-9750, on file at the Washington, D.C. office of the Securities and Exchange Commission. |
10.6 | — | Sixteenth Amendment to the Agreement of Partnership dated March 30, 2016, between Sotheby's Nevada Inc. and Acquavella Contemporary Art, incorporated by reference to the Exhibit 10.1 to the Company's First Quarter Form 10-Q for 2016. |
10.7* | — | Sotheby's 1998 Stock Compensation Plan for Non-Employee Directors, as amended and restated on April 9, 2007, effective May 7, 2007 (the "Directors Plan"), incorporated by reference to Exhibit 10.2 to the Company's current report on Form 8-K, filed on May 11, 2007. |
10.8* | — | First Amendment to the Directors Plan, dated November 6, 2007, incorporated by reference to Exhibit 10.14 to the Company's Annual Report on Form 10-K for the year ended December 31, 2007 (the "2007 Form 10-K"). |
10.9* | — | Second Amendment to the Directors Plan, adopted by the Board of Directors of the Company on March 18, 2010, effective as of May 6, 2010, and incorporated by reference to Exhibit 10.1 to the Company's current report on Form 8-K, filed on May 11, 2010. |
126
10.10 | — | Amended and Restated Auction Credit Agreement, dated as of August 22, 2014, among Sotheby's, a Delaware corporation, Sotheby's Inc., Sotheby's Financial Services, Inc., Sotheby's Financial Services, Inc., Sotheby's Financial Services California, Inc., Oberon, Inc., Sotheby's Ventures, LLC, Oatshare Limited, Sotheby's, a company registered in England, Sotheby's Financial Services Limited, and Sotheby's Hong Kong Limited as Borrowers, the Other Credit Parties Signatory Hereto, as Credit Parties, the Lenders Signatory Hereto from time to time, as Lenders, Wells Fargo (formerly known as General Electric Capital Corporation), as Administrative Agent, Collateral Agent and a Lender, and Wells Fargo (formerly known as GE Capital Markets, Inc.), J.P. Morgan Securities LLC and HSBC Bank USA, N.A., as Joint Lead Arrangers and Joint Bookrunners, incorporated by reference to Exhibit 10.1 to the Company's current report on Form 8-K filed on August 25, 2014. |
10.11 | — | Amended and Restated SFS Credit Agreement, dated as of August 22, 2014, among Sotheby's Inc., Sotheby's Financial Services, Inc., Sotheby's Financial Services, Inc., Sotheby's Financial Services California, Inc., Oberon, Inc., Sotheby's Ventures, LLC, Sotheby's, a company registered in England, Sotheby's Financial Services Limited, and Sotheby's Hong Kong Limited as Borrowers, the Other Credit Parties Signatory Hereto, as Credit Parties, the Lenders Signatory Hereto from time to time, as Lenders, Wells Fargo (formerly known as General Electric Capital Corporation), as Administrative Agent, Collateral Agent and a Lender, and Wells Fargo (formerly known as GE Capital Markets, Inc.), J.P. Morgan Securities LLC and HSBC Bank USA, N.A., as Joint Lead Arrangers and Joint Bookrunners, incorporated by reference to Exhibit 10.2 to the Company's current report on Form 8-K filed on August 25, 2014. |
10.12 | — | Amendment No. 1 to the Amended and Restated Auction Credit Agreement and Amended and Restated SFS Credit Agreement, dated June 15, 2015, by and among Sotheby’s, a Delaware corporation, Sotheby’s, Inc., Sotheby’s Financial Services, Inc., Sotheby’s Financial Services California, Inc., Oberon, Inc., Sotheby’s Ventures, LLC, Sotheby’s Financial Services Limited, Oatshare Limited, Sotheby’s, a company registered in England, and Sotheby’s Hong Kong Limited as Borrowers, the Other Credit Parties signatory hereto, Wells Fargo (formerly known as General Electric Capital Corporation), as Administrative Agent and Collateral Agent, and the Lenders signatory hereto, incorporated by reference to Exhibit 10.2 to the Company's Second Quarter Form 10-Q for 2015. |
10.13 | — | Amendment No. 1 to Amended and Restated Credit Agreement (the Auction Revolving Credit Facility), dated June 15, 2015, among Sotheby’s, a Delaware corporation, Sotheby’s, Inc., Sotheby’s Financial Services, Inc., Sotheby’s Financial Services California, Inc., Oberon, Inc., Sotheby’s Ventures, LLC, Sotheby’s Financial Services Limited, Oatshare Limited, Sotheby’s, a company registered in England, and Sotheby’s Hong Kong Limited as Borrowers, the Other Credit Parties signatory hereto, as Credit Parties, the Lenders Signatory Hereto from time to time, as Lenders, Wells Fargo (formerly known as General Electric Capital Corporation), as Administrative Agent, Collateral Agent, and a Lender, and Wells Fargo (formerly known as GE Capital Markets, Inc.), J.P. Morgan Securities LLC, and HSBC Bank USA, N.A., as Joint Lead Arrangers and Joint Bookrunners, incorporated by reference to Exhibit 10.3 to the Company's Second Quarter Form 10-Q for 2015. |
10.14 | — | Amendment No. 1 to Amended and Restated Credit Agreement (the SFS Revolving Credit Facility), dated June 15, 2015, among Sotheby’s, Inc., Sotheby’s Financial Services, Inc., Sotheby’s Financial Services California, Inc., Oberon, Inc., Sotheby’s Ventures, LLC, Sotheby’s Financial Services Limited, Sotheby’s, a company registered in England, and Sotheby’s Hong Kong Limited as Borrowers, the Other Credit Parties signatory hereto, as Credit Parties, the Lenders Signatory Hereto from time to time, as Lenders, Wells Fargo (formerly known as General Electric Capital Corporation), as Administrative Agent, Collateral Agent, and a Lender, and Wells Fargo (formerly known as GE Capital Markets, Inc.), J.P. Morgan Securities LLC, and HSBC Bank USA, N.A., as Joint Lead Arrangers and Joint Bookrunners, incorporated by reference to Exhibit 10.4 to the Company's Second Quarter Form 10-Q for 2015. |
10.15 | — | Amendment No.1 to the Amended and Restated Auction Guaranty Side Letter to the Amended and Restated Credit Agreement, dated September 16, 2015, by and among Sotheby’s, a Delaware corporation (“Parent”), Sotheby’s, Inc., a New York corporation (“Sotheby’s, Inc.”), Sotheby’s Financial Services, Inc., a Nevada corporation (“SFS Inc.”), Sotheby’s Financial Services California, Inc., a Nevada corporation (“SFS California”), Oberon, Inc., a Delaware corporation (“Oberon”), Sotheby’s Ventures, LLC, a New York limited liability company (“Ventures”), Sotheby’s Financial Services Limited, a company registered in England (“SFS Ltd.”), Oatshare Limited, a company registered in England (“Oatshare”), Sotheby’s, a company registered in England (“Sotheby’s U.K.”), and Sotheby’s Hong Kong Limited, a company incorporated in Hong Kong (“Sotheby’s H.K.” and, collectively with Sotheby’s Inc., SFS Inc., SFS California, Oberon, Ventures, Sotheby’s U.K. and SFS Ltd., the “SFS Borrowers”; the SFS Borrowers, collectively with the Parent and Oatshare, the “Auction Borrowers” and the Auction Borrowers together with the SFS Borrowers, the “Borrowers”), the other Credit Parties signatory hereto, Wells Fargo (formerly known as General Electric Capital Corporation), as Administrative Agent under the SFS Credit Agreement and as Administrative Agent under the Auction Credit Agreement (collectively referred to herein as the “Administrative Agents”), and the Lenders signatory hereto, incorporated by reference to Exhibit 10.1 to the Company's Third Quarter Form 10-Q for 2015. |
10.16 | — | Purchase and Sale Agreement, dated January 11, 2008 between 1334 York Avenue L.P., Seller and Sotheby's, purchaser for 1334 York Avenue, New York, New York 10021, incorporated by reference to Exhibit 10.1 to the Company's First Quarter Form 10-Q for 2009. |
127
10.17 | — | Consent and Assumption Agreement with Release, dated as of February 6, 2009 between 1334 York, LLC as New Borrower, Sotheby's as New Guarantor, 1334 York Avenue L.P., as Original Borrower, Aby Rosen and Michael Fuchs as Original Guarantor and Bank of America, N.A. as Agent and certain other parties, incorporated by reference to Exhibit 10.2 to the Company's First Quarter Form 10-Q for 2009. |
10.18 | — | Loan Agreement, dated as of June 22, 2005 between 1334 York Avenue L.P., as Borrower and Bank of America, N.A., as Lender, incorporated by reference to Exhibit 10.3 to the Company's First Quarter Form 10-Q for 2009. |
10.19 | — | First Amendment to Loan Agreement and Other Loan Documents, dated as of September 20, 2005 between 1334 York Avenue L.P., as Borrower, and Bank of America, N.A., as Lender, incorporated by reference to Exhibit 10.4 to the Company's First Quarter Form 10-Q for 2009. |
10.20 | — | Loan Agreement, dated as of July 1, 2015, among 1334 York, LLC, as Borrower, HSBC Bank USA, National Association, as Agent, HSBC Bank USA, National Association and Industrial and Commercial Bank of China, Limited, New York Branch, as Lenders and collectively, as Lead Arranger, and the other Lenders from time to time a party thereto, incorporated by reference to Exhibit 10.1 to the Company's current report on Form 8-K filed on July 6, 2015. |
10.21 | — | Guaranty of Recourse Carveouts, dated as of July 1, 2015, by Sotheby’s, as Guarantor, for the benefit of HSBC Bank USA, National Association, as Agent, incorporated by reference to Exhibit 10.2 to the Company's current report on Form 8-K filed on July 6, 2015. |
10.22 | — | Environmental Indemnity Agreement, dated as of July 1, 2015, between 1334 York, LLC and Sotheby’s, in favor of HSBC Bank USA, National Association, as Agent, incorporated by reference to Exhibit 10.3 to the Company's current report on Form 8-K filed on July 6, 2015. |
10.23 | — | Lease between 1334 York Avenue L.P., "Landlord," and Sotheby's, Inc., "Tenant," February 7, 2003; Premises: 1334 York Avenue, New York, New York, incorporated by reference to Exhibit 10(b) to the Company's First Quarter Form 10-Q for 2003. |
10.24 | — | Guaranty of Lease, made by Sotheby's in favor of 1334 York Avenue L.P., dated as of June 30, 2006 incorporated by reference to Exhibit 10.29 to the Company's current report on Form 8-K, filed on July 7, 2006. |
10.25 | — | Joint Venture Contract between GeHua Art Company and Sotheby's Hong Kong Limited; For The Establishment of Sotheby's (Beijing) Auction Co., LTD, dated as of September 3, 2012, incorporated by reference to Exhibit 10.3 to the Company's Third Quarter Form 10-Q for 2012. |
10.26 | — | Joint Venture Contract between GeHua Art Company and Sotheby's Hong Kong Limited; For The Establishment of Sotheby's (Beijing) Auction Co., LTD, amended as of September 26, 2012, incorporated by reference to Exhibit 10.4 to the Company's Third Quarter Form 10-Q for 2012. |
10.27* | — | Employment Agreement dated September 1, 2010 between the Company and William F. Ruprecht, incorporated by reference to Exhibit 10.1 to the Company's current report on Form 8-K filed on September 3, 2010. |
10.28*^ | — | Confidentiality Agreement dated September 2, 2010 between the Company and William F. Ruprecht, incorporated by reference to Exhibit 10.2 to the Company's current report on Form 8-K filed on September 3, 2010. |
10.29* | — | Letter Agreement, dated December 19, 2013, but effective as of January 1, 2014, between the Company and William F. Ruprecht, incorporated by reference to Exhibit 10.1 to the Company's current report on Form 8-K filed on December 24, 2013. |
10.30* | — | Letter Agreement, dated November 20, 2014, between the Company and William F. Ruprecht. |
10.31*^ | — | Performance Share Unit Agreement effective as of February 26, 2015 between the Company and William F. Ruprecht, incorporated by reference to Exhibit 10.37 to the Company's Annual Report on Form 10-K for the year ended December 31, 2014. |
10.32* | — | Severance Agreement, dated September 22, 2013, between the Company and Patrick S. McClymont, incorporated by reference to Exhibit 10.2 to the Company's Third Quarter Form 10-Q for 2013. |
10.33* | — | Offer Letter (with related Confidentiality Agreement), dated September 22, 2013, between the Company and Patrick S. McClymont, incorporated by reference to Exhibit 10.3 to the Company's Third Quarter Form 10-Q for 2013. |
10.34* | — | Severance Agreement Amendment, dated December 19, 2013 but effective as of January 1, 2014, between the Company and Patrick S. McClymont, incorporated by reference to Exhibit 10.3 to the Company's current report on Form 8-K filed on December 24, 2013. |
128
10.35* | — | Transition Agreement, dated December 15, 2015, between the Company and Patrick S. McClymont, incorporated by reference to Exhibit 10.35 to the Company's Annual Report on Form 10-K for the year ended December 31, 2015. |
10.36* | — | Severance Agreement, dated December 31, 2014 but effective as of January 1, 2015, between the Company and Bruno Vinciguerra, incorporated by reference to Exhibit 10.1 to the Company's current report on Form -K, filed on January 6, 2015. |
10.37*^ | — | Performance Share Unit Agreement effective as of February 26, 2015 between the Company and Bruno Vinciguerra, incorporated by reference to Exhibit 10.43 to the Company's Annual Report on Form 10-K for the year ended December 31, 2014. |
10.38* | — | Restricted Stock Unit Agreement effective as of February 26, 2015 between the Company and Bruno Vinciguerra, incorporated by reference to Exhibit 10.44 to the Company's Annual Report on Form 10-K for the year ended December 31, 2014. |
10.39* | — | Severance Agreement between Sotheby's and Kevin Ching, dated as of January 1, 2010, incorporated by reference to Exhibit 10.3 to the Company's First Quarter Form 10-Q for 2010. |
10.40* | — | Letter Agreement, dated December 20, 2013, between Sotheby's Hong Kong, Ltd., a Company subsidiary, and Kevin Ching, incorporated by reference to Exhibit 10.4 to the Company's current report on Form 8-K filed on December 24, 2013. |
10.41* | — | Severance Agreement between Sotheby's and Alfredo Gangotena, dated December 4, 2013, incorporated by reference to Exhibit 10.5 to the Company's First Quarter Form 10-Q for 2015. |
10.42* | — | Severance Agreement, dated June 1, 2015, between Sotheby's and David Goodman, incorporated by reference to Exhibit 10.1 to the Company's Second Quarter Form 10-Q for 2015. |
10.43* | — | Employment Agreement, dated March 13, 2015, effective as of March 31, 2015, between the Company and Thomas S. Smith, Jr., incorporated by reference to Exhibit 10.1 to the Company's current report on Form 8-K filed on March 18, 2015. |
10.44* | — | Restricted Stock Unit Agreement between Sotheby's and Thomas S. Smith, dated March 31, 2015, incorporated by reference to Exhibit 10.2 to the Company's First Quarter Form 10-Q for 2015. |
10.45* | — | Restricted Stock Agreement between Sotheby's and Thomas S. Smith, dated March 31, 2015, incorporated by reference to Exhibit 10.3 to the Company's First Quarter Form 10-Q for 2015. |
10.46* | — | Performance Stock Unit Agreement between Sotheby's and Thomas S. Smith, dated March 31, 2015, incorporated by reference to Exhibit 10.4 to the Company's First Quarter Form 10-Q for 2015. |
10.47* | — | Severance Agreement, dated December 31, 2014 but effective as of January 1, 2015, between the Company and Mitchell Zuckerman, incorporated by reference to Exhibit 10.2 to the Company's current report on Form 8-K, filed on January 6, 2015. |
10.48* | — | Letter Agreement, between the Company and Jane Levine, dated May 8, 2015, incorporated by reference to Exhibit 10.3 to the Company's First Quarter Form 10-Q for 2016. |
10.49* | — | Letter Agreement, between the Company and Lisa Nadler, dated August 13, 2015, incorporated by reference to Exhibit 10.4 to the Company's First Quarter Form 10-Q for 2016. |
10.50* | — | Letter Agreement, between the Company and Michael Goss, amended through February 24, 2017. |
10.51* | — | Fourth Amended and Restated Sotheby's Restricted Stock Unit Plan, reflecting amendments effective as of February 7, 2017. |
10.52* | — | Form of Performance Share Unit Agreement, adopted by the Board of Directors of the Company on February 9, 2016, incorporated by reference to Exhibit 10.51 in the Company's Annual Report on Form 10-K for the year ended December 31, 2015. |
10.53 | — | Stock Purchase Agreement, dated as of February 17, 2004, by and among NRT Incorporated as the Purchaser, Sotheby's Holdings, Inc., as the Seller, and Cendant Corporation as the Purchaser Guarantor, incorporated by reference to Exhibit 99.2 to the Company's current report on Form 8-K, filed on March 2, 2004. |
10.54 | — | Trademark License Agreement, dated as of February 17, 2004, among SPTC, Inc., as Licensor, Sotheby's Holdings, Inc. as Guarantor, Monticello Licensee Corporation, as Licensee, and Cendant Corporation, as Guarantor, incorporated by reference to Exhibit 99.3 to the Company's current report on Form 8-K, filed on March 2, 2004. |
129
10.55 | — | Amendment No. 1 to Trademark License Agreement, dated as of May 2, 2005, among SPTC Delaware, LLC (as an assignee of SPTC, Inc) and Sotheby's Holdings, Inc. and Cendant Corporation and Sotheby's International Realty Licensee Corporation (formerly known as Monticello Licensee Corporation), incorporated by reference to Exhibit 10.1 to the Company's Second Quarter Form 10-Q for 2005. |
10.56* | — | Amendment No. 2 to Trademark License Agreement, dated as of May 2, 2005, among SPTC Delaware, LLC (as an assignee of SPTC, Inc) and Sotheby's Holdings, Inc. and Cendant Corporation and Sotheby's International Realty Licensee Corporation (formerly known as Monticello Licensee Corporation), incorporated by reference to Exhibit 10.2 to the Company's Second Quarter Form 10-Q for 2005. |
10.57* | — | Sotheby's Executive Bonus Plan (amended as of January 1, 2012), incorporated by reference to Appendix B to the Company's Proxy Statement on Schedule 14A filed March 28, 2012. |
10.58* | — | Sotheby's First Amended Executive Severance Benefits Plan, effective February 7, 2017. |
10.59* | — | Sotheby's 2016 Annual Bonus Plan, as adopted on May 6, 2016, incorporated by reference to Appendix A to the Company's Proxy Statement on Schedule 14A filed on March 24, 2016. |
10.60* | — | Sotheby's Compensation Recoupment Policy, effective January 1, 2015, incorporated by reference to Exhibit 10.1 to the Company's Second Quarter Form 10-Q for 2016. |
10.61 | — | Support Agreement, dated May 4, 2014 by and among the Company, Third Point LLC and the other persons set forth on the signature pages thereto, incorporated by reference to Exhibit 99.1 to the Company's current report on Form 8-K filed on May 7, 2014. |
10.62 | — | Master Confirmation - Uncollared Accelerated Share Repurchase, dated August 13, 2015, between J.P. Morgan Securities LLC, as agent for JPMorgan Chase Bank, National Association, London Branch, and Sotheby’s, incorporated by reference to Exhibit 10.1 to the Company's Third Quarter Form 10-Q for 2015. |
10.63 | — | Purchase Agreement, dated as of January 11, 2016, by and among Amy Cappellazzo, Allan Schwartzman, Adam Chinn and Sotheby’s, Inc., incorporated by reference to Exhibit 99.1 to the Company's current report on Form 8-K filed on January 11, 2016. |
10.64 | — | Support Agreement, dated September 8, 2016, by and between Sotheby's and Taikang Insurance Group, incorporated by reference to Exhibit 99.1 to the Company's current report on Form 8-K filed on September 9, 2016. |
10.65 | — | Share Repurchase Agreement, dated October 3, 2016, by and between Marcato, L.P., Marcato II, L.P., and Sotheby's, incorporated by reference to Exhibit 10.1 to the Company's current report on Form 8-K filed on October 4, 2016. |
10.66 | — | Confidentiality Agreement, dated October 3, 2016, by and between Richard T. McGuire III, Marcato Capital Management LP, Marcato, L.P., Marcato II, L.P., Marcato International Master Fund, Ltd. and Sotheby's, incorporated by reference to Exhibit 10.2 to the Company's current report on Form 8-K filed on October 4, 2016. |
10.67* | — | Letter Agreement, between the Company and Dennis Weibling dated December 16, 2015. |
21 | — | Subsidiaries of the Registrant |
23 | — | Consent of Deloitte & Touche LLP |
31.1 | — | Certification of Chief Executive Officer pursuant to Section 302 of the Sarbanes-Oxley Act of 2002. |
31.2 | — | Certification of Chief Financial Officer pursuant to Section 302 of the Sarbanes-Oxley Act of 2002. |
32.1 | — | Certification of Chief Executive Officer pursuant to Section 906 of the Sarbanes-Oxley Act of 2002. |
32.2 | — | Certification of Chief Financial Officer pursuant to Section 906 of the Sarbanes-Oxley Act of 2002. |
101INS | — | XBRL Instance Document. |
101.SCH | — | XBRL Taxonomy Extension Schema Document. |
101.CAL | — | XBRL Taxonomy Extension Calculation Linkbase Document. |
101.DEF | — | XBRL Taxonomy Extension Definition Linkbase Document. |
101.LAB | — | XBRL Taxonomy Extension Label Linkbase Document. |
101.PRE | — | XBRL Taxonomy Extension Presentation Linkbase Document. |
* | A compensatory agreement or plan required to be filed pursuant to Item 15(c) of Form 10-K. | |
^ | Confidential treatment has been requested with respect to portions of this exhibit, and the redacted information has been filed separately with the Securities and Exchange Commission. | |
130
131