Summary
Prospectus
Prospectus

April 28, 2023
Goldman Sachs Absolute Return Tracker Fund
Class A:
GARTX Class C: GCRTX Institutional: GJRTX Investor: GSRTX Class R: GRRTX Class R6: GARUX
Before you invest, you may want to review the Goldman Sachs Absolute Return Tracker Fund (the “Fund”) Prospectus, which contains more information about the Fund and its risks. You can find the Fund’s Prospectus, reports to shareholders and other information about the Fund online at www.gsamfunds.com/mutualfunds. You can also get this information at no cost by calling 800-621-2550 for Institutional, Service and Class R6 shareholders, 800-526-7384 for all other shareholders or by sending an e-mail request to gs-funds-document-requests@gs.com. The Fund’s Prospectus and Statement of Additional Information (“SAI”), both dated April 28, 2023, are incorporated by reference into this Summary Prospectus.
| Investment Objective |
The Goldman Sachs Absolute Return Tracker Fund (the "Fund") seeks to deliver long-term total return consistent with investment results that approximate the return and risk
patterns of a diversified universe of hedge funds.
| Fees and Expenses of the Fund |
This table describes the fees and expenses that you may pay if you buy, hold and sell shares of the Fund.
You may pay other fees, such as brokerage commissions and other fees to financial intermediaries,
which are not reflected in
the table and Example below. You may qualify for sales charge discounts on purchases of Class
A Shares if you invest at least $50,000 in Goldman Sachs Funds. More information about these and other discounts is available from your financial
professional and in “Shareholder Guide—Common Questions Applicable to the
Purchase of Class A Shares” beginning on page 53 and in Appendix C—Additional Information About Sales Charge Variations, Waivers and Discounts on page 104 of the Prospectus and “Other Information Regarding Maximum Sales Charge, Purchases, Redemptions, Exchanges and Dividends” beginning on page B-171 of the Fund’s Statement of
Additional Information (“SAI”).
Shareholder Fees
(fees paid
directly from your investment)
| |
Class A |
Class C |
Institutional |
Investor |
Class R |
Class R6 |
| Maximum Sales Charge (Load) Imposed on Purchases (as a percentage of offering price) |
5.50% |
None |
None |
None |
None |
None |
| Maximum Deferred Sales Charge (Load) (as a percentage of the lower of original purchase price or sale proceeds)1
|
None |
1.00% |
None |
None |
None |
None |
Annual
Fund Operating Expenses
(expenses that you pay each year as a percentage of the
value of your investment)
| |
Class A |
Class C |
Institutional |
Investor |
Class R |
Class R6 |
| Management Fees |
0.63% |
0.63% |
0.63% |
0.63% |
0.63% |
0.63% |
| Distribution and/or Service (12b-1) Fees |
0.25% |
0.75% |
0.00% |
0.00% |
0.50% |
0.00% |
| Other Expenses |
0.20% |
0.45% |
0.08% |
0.20% |
0.20% |
0.07% |
| Service Fees |
0.00% |
0.25% |
0.00% |
0.00% |
0.00% |
0.00% |
| All Other Expenses |
0.20% |
0.20% |
0.08% |
0.20% |
0.20% |
0.07% |
| Acquired Fund Fees and Expenses |
0.11% |
0.11% |
0.11% |
0.11% |
0.11% |
0.11% |
| Total Annual Fund Operating Expenses2 |
1.19% |
1.94% |
0.82% |
0.94% |
1.44% |
0.81% |
| Fee Waiver and Expense Limitation3
|
(0.10%) |
(0.10%) |
(0.10%) |
(0.10%) |
(0.10%) |
(0.10%) |
| Total Annual Fund Operating Expenses After Fee Waiver and Expense Limitation |
1.09% |
1.84% |
0.72% |
0.84% |
1.34% |
0.71% |
1
A contingent deferred sales charge (“CDSC”) of 1% is
imposed on Class C Shares redeemed within 12 months of purchase.
2
The “Total Annual Fund Operating Expenses” do not
correlate to the ratios of net and total expenses to average net assets provided in the Financial Highlights, which reflect the operating expenses of
the Fund and do not include “Acquired Fund Fees and Expenses.”
3
The Investment Adviser has agreed to: (i) waive a portion of its
management fee payable by the Fund in an amount equal to any management fees it earns as an investment adviser to the affiliated funds in which the
Fund invests, except those management fees it earns from the Fund’s investments of cash collateral received in connection with securities lending
transactions in affiliated funds; (ii) waive a portion of its management fee in an amount equal to the management fee paid to the Investment Adviser by the ART Subsidiary (as defined below) at an annual rate of 0.42% of the ART Subsidiary’s average daily net assets; and (iii) reduce or limit “Other
Expenses” (excluding acquired fund fees and expenses, transfer agency fees and expenses, service fees, taxes, dividend and interest expenses on
short sales, interest, brokerage fees, expenses of shareholder
2 Summary
Prospectus — Goldman Sachs Absolute Return Tracker Fund
meetings, litigation and indemnification, and extraordinary expenses) to
0.014% of the Fund’s average daily net assets. The management fee waiver arrangement with respect to the ART Subsidiary may not be discontinued
by the Investment Adviser as long as its contract with the ART Subsidiary is in place. The other management fee waiver and expense limitation
arrangements will remain in effect through at least April 28, 2024, and prior to such date the Investment Adviser may not terminate the arrangements without the approval of the Board of Trustees.
| Expense Example |
This Example is intended to help you compare the cost of investing in the Fund with the cost of investing
in other mutual funds.
The Example assumes that you invest $10,000 in Class A, Class C, Institutional, Investor, Class R and/or Class R6 Shares of the Fund for the time periods indicated and
then redeem all of your Class A, Class C, Institutional, Investor, Class R and/or Class R6 Shares at the end of those periods. The Example also assumes that your investment has a 5% return each year and that the
Fund’s operating expenses remain the same (except that the Example incorporates the fee waiver and expense limitation arrangements for only the first year). Although your actual costs may be higher or lower, based
on these assumptions your costs would be:
| |
1 Year |
3 Years |
5 Years |
10 Years |
| Class A Shares |
$655 |
$898 |
$1,159 |
$1,905 |
| Class C Shares |
$287 |
$600 |
$1,038 |
$2,256 |
| Institutional Shares |
$74 |
$252 |
$445 |
$1,004 |
| Investor Shares |
$86 |
$290 |
$510 |
$1,146 |
| Class R Shares |
$136 |
$446 |
$777 |
$1,716 |
| Class R6 Shares |
$73 |
$249 |
$440 |
$992 |
| Class C Shares – Assuming no redemption |
$187 |
$600 |
$1,038 |
$2,256 |
| Portfolio Turnover |
The Fund pays transaction costs when it buys and sells securities or instruments (i.e., “turns over” its portfolio). A high rate of portfolio turnover may result in increased transaction costs, including brokerage commissions, which must be borne
by the Fund and its shareholders, and is also likely to result in higher short-term capital gains for taxable shareholders. These costs are not reflected in the annual fund operating expenses or in the expense
example above, but are reflected in the Fund’s performance. The Fund’s portfolio turnover rate for the fiscal year ended December 31, 2022 was 184% of the average value of its portfolio.
| Principal Strategy |
The Fund’s Investment Adviser believes that hedge funds derive a large portion of their returns from
exposure to sources of market risk (“Market Exposures”) and “Trading Strategies” involving long and/or short positions in Market Exposures and/or individual securities or baskets of securities. In seeking to
meet its investment objective, the Fund uses a dynamic investment process to seek to identify the appropriate weights to Market Exposures and Trading Strategies that approximate the return and risk
patterns of specific hedge fund sub-strategies. The hedge fund sub-strategies whose returns the Fund seeks to approximate include, but are not limited to, Equity Long Short, Event Driven, Relative Value and
Macro sub-strategies (each a “Hedge Fund Sub-Strategy”). To establish the Market Exposures and Trading Strategies that drive the returns of the Hedge Fund Sub-Strategies, the Investment Adviser uses industry
analysis of hedge funds, including hedge fund return databases, prime brokerage reports, industry participants and regulatory filings and other public sources. The Investment Adviser then applies a
quantitative methodology, in
combination with a qualitative overlay, to assess the appropriate weight to each Market Exposure and
Trading Strategy. The Fund may seek to establish long and/or short positions in a multitude of Market Exposures, including but not limited to:
◼
U.S. and non-U.S. (including emerging market) equity indices;
◼
U.S. and non-U.S. (including emerging market) fixed income indices;
◼
Credit indices;
◼
Interest rates;
◼
Commodity indices;
◼
Master limited partnership (“MLP”) indices;
◼
Foreign currency exchange rates;
◼
Baskets of top positions held by hedge funds;
◼
Single stocks and single commodities;
◼
Volatility; and
◼
Market momentum/trends.
The Fund invests in instruments that the Investment
Adviser believes will assist the Fund in gaining exposure to the Market Exposures. The
instruments in which the Fund may invest include, but are not limited to:
◼
Equity securities (including securities that may convert into equity securities);
◼
U.S. corporate bonds and other fixed income securities (including non-investment grade fixed income securities (commonly known as “junk bonds”));
◼
Futures (including equity index futures, interest rate futures, bond futures and volatility futures);
◼
Swaps (including total return swaps and credit default swaps on indices);
◼
Options (including listed equity index put and call options, listed government bond future put and call options, options on volatility, and swaptions);
◼
Structured notes (including commodity-linked notes);
◼
Exchange-traded funds (“ETFs”);
◼
Forward contracts (including currency forward contracts on developed and emerging markets currencies);
◼
Wholly-owned subsidiary (to gain exposure to the commodities markets);
◼
Asset and mortgage-backed securities and real estate investment trusts (“REITs”);
◼
U.S. government securities, including agency debentures, and other high quality debt securities; and
◼
Cash equivalents.
Investment in the Subsidiary. The Fund seeks to gain exposure to the commodities markets by investing in a wholly-owned subsidiary of the Fund organized as a limited liability
company under the laws of the Cayman Islands, Cayman Commodity – ART, LLC (the “ART
Subsidiary”). The ART Subsidiary is advised by the Investment Adviser and seeks to gain
commodities exposure. The Fund may invest up to 25% of its total assets in the ART Subsidiary. The ART Subsidiary primarily obtains its commodity exposure by investing in commodity-linked derivative instruments (which
may include total return swaps on commodity indexes, sub-indexes and single commodities, as
well as commodity (U.S. or foreign) futures, commodity options and commodity-linked notes). Commodity-linked swaps are derivative instruments whereby the cash flows agreed upon
3 Summary
Prospectus — Goldman Sachs Absolute Return Tracker Fund
between counterparties are dependent upon the price of the underlying commodity or commodity index over the life of the swap. Commodity futures contracts are standardized,
exchange-traded contracts that provide for the sale or purchase of, or economic exposure to the price of, a commodity or a specified basket of commodities at a future time. An option on commodities gives the
purchaser the right (and the writer of the option the obligation) to assume a position in a commodity or a specified basket of commodities at a specified exercise price within a specified period of time. The value
of these commodity-linked derivatives will rise and fall in response to changes in the underlying commodity or commodity index. Commodity-linked derivatives expose the ART Subsidiary and the Fund
economically to movements in commodity prices. Such instruments may be leveraged so that small
changes in the underlying commodity prices would result in disproportionate changes in the
value of the instrument. Neither the Fund nor the ART Subsidiary invests directly in physical commodities. The ART Subsidiary may also invest in other instruments, including fixed income securities, either as
investments or to serve as margin or collateral for its swap positions, as well as volatility index derivatives and foreign currency transactions (including forward contracts).
The Fund may from time to time hold foreign currencies. Additionally, as a result of the Fund’s use of derivatives, the Fund may also hold as collateral significant
amounts of U.S. Treasury or short-term investments, including money market funds, repurchase agreements, cash and time deposits. In managing the collateral portion of the Fund’s investment strategy, the
Investment Adviser generally seeks capital preservation.
The weighting of a Market Exposure or Trading Strategy within the Fund may be positive or negative. A
negative weighting will result from establishing a short position with respect to a Market Exposure or Trading Strategy. As a result of the Fund’s negative weightings in various Market Exposures or
Trading Strategies from time to time, the Fund’s net asset value (“NAV”) per share may decline during certain periods, even if the value of any or all of the Market Exposures or Trading Strategies increases during
that time. Additionally, the sum of the Fund’s target weightings to each Market Exposure or Trading Strategy may not equal 100%.
The
Fund may make investment decisions that deviate from those generated by the Investment Adviser’s proprietary investment model, at the discretion of the Investment Adviser. In addition, the Investment Adviser may, in its discretion, make
changes to the quantitative methodology used by the Fund, and the Fund may use other proprietary methodologies based on the Investment Adviser’s proprietary research.
The Fund does not invest in hedge
funds.
The Fund’s benchmark index is the ICE Bank of America Merrill Lynch Three-Month U.S. Treasury Bill Index.
| Principal Risks of the Fund |
Loss of money is a risk of investing in the Fund. The investment program of the Fund is speculative, entails substantial
risks and includes alternative investment techniques not employed by traditional mutual funds. The Fund should not be relied upon as a
complete investment program. The Fund’s investment techniques (if they do not perform as designed) may increase the volatility of
performance and the risk of investment loss, including the loss of the entire amount that is invested, and there can be no assurance that
the investment objective of the Fund will be achieved. Moreover, certain investment techniques which the Fund may employ in its investment program can substantially increase the adverse
impact to which the Fund’s investments may be subject.
There is no assurance that the investment processes of the Fund will be
successful, that the techniques utilized therein will be implemented successfully or that they are adequate for their intended uses, or that the discretionary element of the investment
processes of the Fund will be exercised in a manner that is
successful or that is not adverse to the Fund. An
investment in the Fund is not a bank deposit and is not insured or guaranteed by the Federal Deposit Insurance Corporation (“FDIC”) or any
government agency. Investors should carefully consider these risks before
investing.
In addition, the Fund’s NAV may fluctuate substantially over
time. Because the Fund attempts to approximate the return and risk patterns of a diversified universe of hedge funds, the Fund’s
performance may potentially be lower than the returns of the
broader stock market. Accordingly, the Fund should be considered a speculative investment entailing a high degree of risk and is not
suitable for all investors. The Fund’s principal risks are presented below in alphabetical order, and not in the order of importance or
potential exposure.
Absence of Regulation Risk. The Fund engages in over-the-counter (“OTC”) transactions, which trade in a dealer network,
rather than on an exchange. In general, there is less governmental regulation and supervision
of transactions in the OTC markets than of transactions entered into on organized
exchanges.
Commodity Sector Risk. Exposure to the commodities markets may subject the Fund to greater volatility than investments in more traditional securities. The value of
commodity-linked investments may be affected by changes in overall market movements, commodity index volatility, changes in interest rates, or factors affecting a particular industry or commodity, such as
drought, floods, weather, livestock disease, embargoes, tariffs and international economic,
business, political and regulatory developments. The prices of energy, industrial
metals, precious metals, agriculture and livestock sector commodities may fluctuate widely due to factors such as changes in value, supply and demand and governmental regulatory policies. The commodity-linked investments in which
the ART Subsidiary enters into may involve counterparties in the financial services sector, and events affecting the financial services sector may cause the ART Subsidiary's, and therefore the
Fund’s, share value to fluctuate.
Counterparty Risk. Many of the protections afforded to cleared transactions, such as the security afforded by transacting
through a clearing house, might not be available in connection with OTC transactions.
Therefore, in those instances in which the Fund enters into uncleared OTC transactions, the Fund will be subject to the risk that its direct counterparty will not perform its obligations under the transactions and that the Fund will sustain losses.
Credit/Default Risk. An issuer or guarantor of fixed income securities or instruments held by the Fund (which may have low credit ratings) may default on its obligation to pay
interest and repay principal or default on any other obligation. The credit quality of the Fund’s portfolio securities or instruments may meet the Fund’s credit quality requirements at the time of
purchase but then deteriorate thereafter, and such a deterioration can occur rapidly. In certain instances, the downgrading or default of a single holding or guarantor of the Fund’s holding may impair the
Fund’s liquidity and have the potential to cause significant deterioration in net asset value (“NAV”). These risks are heightened in market environments where interest rates are rising as well as in connection with the
Fund’s investments in non-investment grade fixed income securities.
4 Summary Prospectus — Goldman Sachs Absolute
Return Tracker Fund
Derivatives Risk. The Fund’s use of options, futures, forwards,
swaps, options on swaps, structured securities and other derivative instruments may result in
losses. These instruments, which may pose risks in addition to and greater than those associated with investing directly in securities, currencies or other instruments, may be illiquid or less liquid, volatile, difficult to price
and leveraged so that small changes in the value of underlying instruments may produce disproportionate losses to the Fund. Certain derivatives are also subject to counterparty risk, which is the risk that the other
party in the transaction will not fulfill its contractual obligations. The use of derivatives is a highly specialized activity that involves investment techniques and risks different from those associated with investments in
more traditional securities and instruments.
Expenses Risk. By investing in pooled investment vehicles (including investment companies and exchange-traded funds
(“ETFs”)), partnerships, and real estate investment trusts (“REITs”) (“Underlying Funds”) indirectly through the Fund, the investor will incur not only a proportionate share of the
expenses of those Underlying Funds held by the Fund (including operating costs and investment management fees), but also the expenses of the Fund.
Foreign and Emerging Countries Risk. Foreign securities may be subject to risk of loss because of more or less foreign government regulation; less public information;
less stringent investor protections; less stringent accounting, corporate governance, financial reporting and disclosure standards; and less economic, political and social stability in the countries in which the Fund
invests. The imposition of sanctions, exchange controls (including repatriation restrictions), confiscations, trade restrictions (including tariffs) and other government restrictions by the United States and other
governments, or from problems in share registration, settlement or custody, may also result in losses. The type and severity of sanctions and other similar measures, including counter sanctions and other retaliatory
actions, that may be imposed could vary broadly in scope, and their impact is impossible to predict. For example, the imposition of sanctions and other similar measures could, among other things, cause a decline in the
value and/or liquidity of securities issued by the sanctioned country or companies located in or economically tied to the sanctioned country and increase market volatility and disruption in the
sanctioned country and throughout the world. Sanctions and other similar measures could limit or prevent the Fund from buying and selling securities (in the sanctioned country and other markets), significantly delay
or prevent the settlement of securities transactions, and significantly impact the Fund’s liquidity and performance. Foreign risk also involves the risk of negative foreign currency exchange rate fluctuations,
which may cause the value of securities denominated in such foreign currency (or other instruments through which the Fund has exposure to foreign currencies) to decline in value. Currency exchange rates
may fluctuate significantly over short periods of time. These risks are more pronounced in connection with the Fund’s investments in securities of issuers located in, or otherwise economically tied to, emerging
countries.
Interest Rate Risk. When interest rates increase, fixed income securities or instruments held by the Fund will generally
decline in value. Long-term fixed income securities or instruments will normally have more
price volatility because of this risk than short-term fixed income securities or instruments. Changing interest rates may have unpredictable effects on the markets, may result in heightened market volatility and may detract from Fund
performance. In addition, changes in monetary policy may exacerbate the risks associated with changing interest rates. Funds with longer average portfolio durations will
generally be more sensitive to changes in interest rates than funds with a shorter average portfolio duration. Fluctuations in interest rates may also affect the liquidity of fixed
income securities and instruments held by the Fund.
Investing in the Underlying Funds. The investments of the Fund may be concentrated in one or more Underlying Funds (including ETFs and other registered investment companies)
subject to limitations and/or conditions prescribed by the Investment Company Act of 1940, as
amended (the “Investment Company Act”), or rules, regulations or exemptive relief
thereunder. The Fund’s investment performance is directly related to the investment performance of the Underlying Funds it holds. The Fund is subject to the risk factors associated with the investments of the Underlying Funds
in direct proportion to the amount of assets allocated to each. If the Fund has a relative concentration of its portfolio in a single Underlying Fund, it may be more susceptible to adverse developments affecting that
Underlying Fund and may be more susceptible to losses because of these
developments.
Investment Style Risk. Different investment styles (e.g., “growth”, “value” or “quantitative”) tend to shift in and out of favor depending upon market
and economic conditions and investor sentiment. The Fund employs a “quantitative” style, and may outperform or underperform other funds that invest in similar asset classes but employ different investment styles.
Large Shareholder Transactions Risk. The Fund may experience adverse effects when certain large shareholders purchase or redeem large amounts of shares of the Fund. Such large shareholder redemptions, which may occur rapidly or
unexpectedly, may cause the Fund to sell portfolio securities at times when it would not otherwise do so, which may negatively impact the Fund's NAV and liquidity. Similarly, large Fund share
purchases may adversely affect the Fund's performance to the extent that the Fund is delayed in investing new cash or otherwise maintains a larger cash position than it ordinarily would. These transactions may also
accelerate the realization of taxable income to shareholders if such sales of investments resulted in gains, and may also increase transaction costs. In addition, a large redemption could result in the Fund's
current expenses being allocated over a smaller asset base, leading to an increase in the Fund's expense ratio.
Leverage Risk. Borrowing and the use of derivatives may result in leverage and may make the Fund more volatile. The use
of leverage may cause the Fund to liquidate portfolio positions to satisfy its obligations
when it may not be advantageous to do so. The use of leverage by the Fund can substantially
increase the adverse impact to which the Fund’s investment portfolio may be
subject.
Liquidity Risk. The Fund may make investments that are illiquid or that may become less liquid in response to market developments or adverse investor perceptions. Illiquid
investments may be more difficult to value. Liquidity risk may also refer to the risk that the Fund will not be able to pay redemption proceeds within the allowable time period because of unusual market conditions,
declining prices of the securities sold, an unusually high volume of redemption requests or other reasons. To meet redemption requests, the Fund may be forced to sell investments at an unfavorable time
and/or under unfavorable conditions. Liquidity risk may be the result of, among other things, the reduced number and capacity of traditional market participants to make a market in fixed income
securities or the lack of an active market. The potential for liquidity risk may be magnified by a rising interest rate environment or other circumstances where investor redemptions from fixed income funds may be higher
than normal, potentially causing increased supply in the market due to selling activity. These risks may
5 Summary Prospectus — Goldman Sachs Absolute
Return Tracker Fund
be more pronounced in connection with the Fund’s investments in securities of issuers located in
emerging market countries. Redemptions by large shareholders may have a negative impact on the Fund’s liquidity.
Management Risk. A strategy used by the Investment Adviser may fail
to produce the intended results. The Investment Adviser attempts to execute a complex
strategy for the Fund using proprietary quantitative models. Investments selected using these models may perform differently than expected as a result of the factors used in the models, the weight placed on each factor,
changes from the factors’ historical trends, and technical issues in the construction and implementation of the models (including, for example, data problems and/or software issues). There is no guarantee that the
Investment Adviser’s use of these quantitative models will result in effective investment decisions for the Fund. Additionally, commonality of holdings across quantitative money managers may amplify losses.
Market Risk. The value of the securities in which the Fund invests may go up or down in response to the
prospects of individual companies, particular sectors or governments and/or general economic conditions throughout the world due to increasingly interconnected global economies and financial markets. Events
such as war, military conflict, acts of terrorism, social unrest, natural disasters, recessions, inflation, rapid interest rate changes, supply chain disruptions, sanctions, the spread of infectious illness or
other public health threats could also significantly impact the Fund and its
investments.
Master Limited Partnership Risk. Investments in securities of an MLP involve risks that differ from investments in common stock, including risks related to limited control and
limited rights to vote on matters affecting the MLP. Certain MLP securities may trade in lower volumes due to their smaller capitalizations, and may be subject to more abrupt or erratic price movements and
lower market liquidity. MLPs are generally considered interest-rate sensitive investments. During periods of interest rate volatility, these investments may not provide attractive returns.
Investments in securities of an MLP also include tax-related risks. For example, to the extent a distribution received by the Fund from an MLP is treated as a return of capital,
the Fund’s adjusted tax basis in the interests of the MLP may be reduced, which will result in an increase in an amount of income or gain (or decrease in the amount of loss) that will be recognized by the Fund for
tax purposes upon the sale of any such interests or upon subsequent distributions in respect of
such interests.
Mid-Cap and Small-Cap Risk. Investments in mid-capitalization and small-capitalization companies involve greater risks than those
associated with larger, more established companies. These securities may be subject to more
abrupt or erratic price movements and may lack sufficient market liquidity, and these issuers often face greater business risks.
Non-Hedging Foreign Currency Trading Risk. The Fund may engage in forward foreign currency transactions for hedging and non-hedging purposes. The Investment Adviser may
purchase or sell foreign currencies through the use of forward contracts based on the Investment Adviser's judgment regarding the direction of the market for a particular foreign currency or currencies.
In pursuing this strategy, the Investment Adviser seeks to profit from anticipated movements in
currency rates by establishing “long” and/or “short” positions in
forward contracts on various foreign currencies. Foreign exchange rates can be extremely
volatile and a variance in the degree of volatility of the market or in the direction of the market from the Investment Adviser's expectations may produce significant losses to the Fund. Some of these transactions may also be subject to
interest rate risk.
Other Investment Companies Risk. By investing in other investment companies (including ETFs) indirectly through the Fund, investors will incur a proportionate share of the
expenses of the other investment companies held by the Fund (including operating costs and investment management fees) in addition to the fees regularly borne by the Fund. In addition, the Fund will be
affected by the investment policies, practices and performance of such investment companies in direct proportion to the amount of assets the Fund invests therein.
Portfolio Turnover Rate Risk. A high rate of portfolio turnover (100% or more) involves correspondingly greater expenses which must be
borne by the Fund and its shareholders, and is also likely to result in short-term capital
gains taxable to shareholders.
Short Position Risk. The Fund may enter into a short position through a futures contract, an option or swap agreement or
through short sales of any instrument that the Fund may purchase for investment. Taking short
positions involves leverage of the Fund’s assets and presents various risks. If the
value of the underlying instrument or market in which the Fund has taken a short position increases, then the Fund will incur a loss equal to the increase in value from the time that the short position was entered into plus any
related interest payments or other fees. Taking short positions involves the risk that losses may be disproportionate, may exceed the amount invested and may be unlimited.
Stock Risk. Stock prices have historically risen and fallen in periodic cycles. U.S. and foreign stock markets have experienced periods of substantial price volatility in
the past and may do so again in the future.
Subsidiary Risk. The ART Subsidiary is not registered under the Investment Company Act of 1940, as amended
(“Investment Company Act”) and is not subject to all the investor protections of the Investment Company Act. Changes in the laws of the United States and/or the Cayman Islands could result in the
inability of the Fund and/or the ART Subsidiary to operate as described in the Prospectus and the SAI and could adversely affect the Fund.
Swaps Risk. In a standard “swap” transaction, two parties agree to exchange the returns, differentials in rates of return or some other amount earned or realized on the
“notional amount” of predetermined investments or instruments, which may be adjusted for an interest factor. Swaps can involve greater risks than direct investment in securities, because swaps may be leveraged and
subject to counterparty risk (e.g., the risk of a counterparty’s defaulting on the obligation or bankruptcy), credit risk and pricing risk (i.e., swaps may be difficult to value). Swaps may also be considered
illiquid. It may not be possible for the Fund or the ART Subsidiary to liquidate a swap position at an advantageous time or price, which may result in significant losses.
Tax Risk. Based on a private letter ruling from the Internal Revenue Service (“IRS”), the Fund seeks to gain exposure to the commodity markets through investments
in the ART Subsidiary.
The tax treatment of the Fund’s investments in the ART Subsidiary could affect whether income derived from such investments is “qualifying income” under
Subchapter M of the Internal Revenue Code of 1986, as amended (the “Code”), or otherwise affect the character, timing and/or amount of the Fund’s taxable income or any gains and distributions made by the Fund.
If the IRS were to successfully assert that a Fund’s income from such investments was not “qualifying income,” the Fund may fail to qualify as a regulated investment company (“RIC”) under
Subchapter M of the Code if over 10% of its gross income was derived from these investments. If the Fund failed to qualify as a RIC, it would be subject to federal and state income tax on
6 Summary
Prospectus — Goldman Sachs Absolute Return Tracker Fund
all of its taxable income at regular corporate tax rates with no deduction for any distributions paid to shareholders, which would significantly adversely affect the returns to, and
could cause substantial losses for, Fund shareholders.
Shareholders should review “Other Information” under “Taxation” on page 73 of the
Prospectus for more information.
U.S. Government Securities Risk. The U.S. government may not provide financial support to U.S. government agencies, instrumentalities or sponsored enterprises if it is
not obligated to do so by law. U.S. government securities issued by those agencies, instrumentalities and sponsored enterprises, including those issued by the Federal National Mortgage Association (“Fannie
Mae”), Federal Home Loan Mortgage Corporation (“Freddie Mac”) and the Federal Home Loan Banks, are neither issued nor guaranteed by the U.S. Treasury and, therefore, are not backed by the full faith and
credit of the United States. The maximum potential liability of the issuers of some U.S. government securities held by the Fund may greatly exceed their current resources, including any legal right to
support from the U.S. Treasury. It is possible that issuers of U.S. government securities will not have the funds to meet their payment obligations in the future.
| Performance |
The bar chart and table below provide an indication of the risks of investing in the Fund by showing: (a)
changes in the performance of the Fund’s Institutional Shares from year to year; and (b) how the average annual total returns of the Fund’s Class A, Class C, Institutional,
Investor, Class R and Class R6 Shares compare to those of a broad-based securities market index.The Fund’s past performance, before and after taxes, is not necessarily an indication of how the Fund will perform in the
future. Updated performance information is available at no cost at www.gsamfunds.com/performance or by calling the appropriate phone number on the back cover of the Prospectus.
Performance reflects applicable fee waivers and/or expense limitations in effect during the periods shown.
CALENDAR YEAR (INSTITUTIONAL)
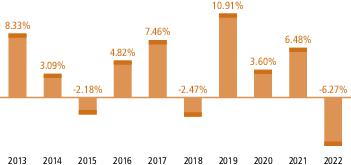
| During the periods shown in the chart above:
|
Returns |
Quarter ended |
| Best Quarter Return |
6.57% |
December 31, 2020 |
| Worst Quarter Return |
-9.75% |
March 31, 2020 |
| AVERAGE ANNUAL TOTAL RETURN For the period ended
December 31, 2022 |
|
|
|
|
| 1 Year |
5 Years |
10 Years |
Inception
Date | |
| Class A Shares |
|
|
|
5/30/2008 |
| Returns Before Taxes |
-11.78% |
0.74% |
2.27% |
|
| Returns After Taxes on Distributions |
-13.43% |
-0.71% |
1.03% |
|
| Returns After Taxes on Distributions and Sale of Fund Shares |
-6.89% |
0.07% |
1.33% |
|
| Class C Shares |
|
|
|
5/30/2008 |
| Returns Before Taxes |
-8.21% |
1.14% |
2.08%*
|
|
| Institutional Shares |
|
|
|
5/30/2008 |
| Returns Before Taxes |
-6.27% |
2.26% |
3.25% |
|
| Investor Shares |
|
|
|
5/30/2008 |
| Returns Before Taxes |
-6.37% |
2.14% |
3.11% |
|
| Class R Shares |
|
|
|
5/30/2008 |
| Returns |
-6.79% |
1.61% |
2.58% |
|
| Class R6 Shares |
|
|
|
7/31/2015 |
| Returns Before Taxes |
-6.17% |
2.28% |
3.25%**
|
|
| ICE BofAML Three-Month U.S. Treasury Bill Index |
1.47% |
1.26% |
0.76% |
|
*
Class C Shares automatically convert into Class A Shares eight
years after the purchase date. The 10-Year performance for Class C Shares does not reflect the conversion to Class A Shares after the first eight years
of performance.
**
Class R6 Shares commenced operations on July 31, 2015. Prior to
that date, the performance of Class R6 Shares shown in the table above is that of Institutional Shares. Performance has not been adjusted to reflect
the lower expenses of Class R6 Shares. Class R6 Shares would have had higher returns because: (i) Institutional Shares and Class R6 Shares represent
interests in the same portfolio of securities; and (ii) Class R6 Shares have lower expenses.
The after-tax returns are for Class A Shares only. The after-tax returns for Class C, Institutional, Investor and Class R6 Shares, and returns for Class R Shares (which are offered exclusively to employee benefit plans), will vary. After-tax returns are calculated using the historical highest individual federal marginal income tax
rates and do not reflect the impact of state and local taxes. Actual
after-tax returns depend on an investor’s tax situation and may differ from those shown. In addition, the after-tax returns shown are not relevant to investors who
hold Fund Shares through tax-deferred arrangements such as 401(k) plans or individual retirement accounts.
7 Summary Prospectus — Goldman Sachs Absolute
Return Tracker Fund
| Portfolio Management |
Goldman Sachs Asset Management, L.P. is the investment adviser for the Fund (the “Investment
Adviser” or “GSAM”).
Portfolio Manager: Oliver Bunn, Vice President, has managed the Fund since 2017.
| Buying and Selling Fund Shares |
The minimum initial investment for Class A and Class C Shares is, generally, $1,000. The minimum initial
investment for Institutional Shares is, generally, $1,000,000 for individual or certain institutional investors, alone or in combination with other assets under the management of the Investment Adviser and
its affiliates. There is no minimum for initial purchases of Investor, Class R and Class R6 Shares, except for certain institutional investors who purchase Class R6 Shares directly with the Fund’s
transfer agent for which the minimum initial investment is $5,000,000. Those share classes with a minimum initial investment requirement do not impose it on certain employee benefit plans, and Institutional Shares do not
impose it on certain investment advisers investing on behalf of other accounts.
The minimum subsequent investment for Class A and Class C shareholders is $50, except for certain employee benefit plans, for which there is no minimum. There is no
minimum subsequent investment for Institutional, Investor, Class R or Class R6 shareholders.
You may purchase and redeem (sell) shares
of the Fund on any business day through certain intermediaries that have a relationship with
Goldman Sachs & Co. LLC (“Goldman Sachs”), including banks, trust companies,
brokers, registered investment advisers and other financial institutions (“Intermediaries”).
| Tax Information |
The Fund’s distributions are taxable, and will be taxed as ordinary income or capital gains, unless
you are investing through a tax-deferred arrangement, such as a 401(k) plan or an individual retirement account. Investments made through tax-deferred arrangements may become taxable upon withdrawal from such arrangements.
| Payments to Broker-Dealers and Other Financial Intermediaries |
If you purchase the Fund through an Intermediary, the Fund and/or its related companies may pay the
Intermediary for the sale of Fund shares and related services. These payments may create a conflict of interest by influencing the Intermediary and your salesperson to recommend the Fund over another investment. Ask your
salesperson or visit your Intermediary’s website for more information.