UNITED STATES
SECURITIES AND EXCHANGE COMMISSION
Washington, D.C. 20549
FORM N-CSR
CERTIFIED SHAREHOLDER REPORT OF REGISTERED
MANAGEMENT INVESTMENT COMPANIES
Investment Company Act file number 811-05349
Goldman Sachs Trust
(Exact name of registrant as specified in charter)
71 South Wacker Drive, Chicago, Illinois 60606
(Address of principal executive offices) (Zip code)
Copies to:
| Caroline Kraus, Esq. | Stephen H. Bier, Esq. |
|||||||
| Goldman Sachs & Co. LLC | Dechert LLP |
|||||||
| 200 West Street | 1095 Avenue of the Americas |
|||||||
| New York, New York 10282 | New York, NY 10036 |
(Name and address of agents for service)
Registrant’s telephone number, including area code: (312) 655-4400
Date of fiscal year end: August 31
Date of reporting period: August 31, 2022
| ITEM 1. | REPORTS TO STOCKHOLDERS. |
| The Annual Report to Shareholders is filed herewith. |
Goldman Sachs Funds
| Annual Report | August 31, 2022 | |||
| Fundamental Equity Growth Funds | ||||
| Concentrated Growth | ||||
| Flexible Cap | ||||
| Large Cap Core* | ||||
| Mid Cap Growth** | ||||
| Small Cap Growth | ||||
| Small/Mid Cap Growth | ||||
| Strategic Growth | ||||
| Technology Opportunities | ||||
| U.S. Equity ESG | ||||
| * | Effective after the close of business on April 13, 2022, the Goldman Sachs Capital Growth Fund was renamed the Goldman Sachs Large Cap Core Fund. |
| ** | Effective after the close of business on April 13, 2022, the Goldman Sachs Growth Opportunities Fund was renamed the Goldman Sachs Mid Cap Growth Fund. |

Goldman Sachs Fundamental Equity Growth Funds
| ∎ | CONCENTRATED GROWTH |
| ∎ | FLEXIBLE CAP |
| ∎ | LARGE CAP CORE |
| ∎ | MID CAP GROWTH |
| ∎ | SMALL CAP GROWTH |
| ∎ | SMALL/MID CAP GROWTH |
| ∎ | STRATEGIC GROWTH |
| ∎ | TECHNOLOGY OPPORTUNITIES |
| ∎ | U.S. EQUITY ESG |
|
| ||||
| 1 | ||||
| 3 | ||||
| 50 | ||||
| 71 | ||||
| 82 | ||||
| 82 | ||||
| 89 | ||||
| 96 | ||||
| 104 | ||||
| 112 | ||||
| 119 | ||||
| 127 | ||||
| 135 | ||||
| 142 | ||||
| 149 | ||||
| 174 | ||||
| 175 | ||||
| NOT FDIC-INSURED | May Lose Value | No Bank Guarantee | ||
MARKET REVIEW
Goldman Sachs Fundamental Equity Growth Funds
Overall, U.S. equities struggled during the 12 months ended August 31, 2022 (the “Reporting Period”). The Standard & Poor’s® 500 Index (the “S&P 500 Index”) ended the Reporting Period with a return of -11.23%. The Russell 3000® Index generated a return of -13.28%. Persistent supply-chain disruptions, shifting U.S. Federal Reserve (“Fed”) policy, heightened inflation levels, COVID-19 pandemic overhangs and ongoing war between Russia and Ukraine were the primary concerns pressuring the U.S. equity markets during the Reporting Period.
As the Reporting Period began in September 2021, the S&P 500 Index saw its first decline since January 2021 and its worst month since September 2020. Focus centered around Fed tapering, complex legislative negotiations, persistent supply-chain disruptions, spread of the COVID-19 Delta variant, global risk events, rising energy costs and the rapid uptick in U.S. Treasury yields.
During the fourth quarter of 2021, the S&P 500 Index increased in October, fell in November and increased in December. The third quarter corporate earnings season propelled a U.S. equity market rally in October, with retail earnings upside surprises and hints of easing supply-chain constraints supporting the market’s upward trajectory into early November. Later in November, a $1 trillion infrastructure bill was signed into law, and Fed Chair Powell was appointed for a second term, bringing clarity to the Fed’s leadership. However, renewed concerns around COVID-19 developments pressured U.S. equities, with the emergence of the more contagious Omicron variant triggering a sell-off. Persistently high inflation also weighed on market sentiment. In December, the S&P 500 Index rebounded despite record COVID-19 case counts in many population centers in the U.S., as studies showed the variant was generally accompanied by milder symptoms than previous variants. Positive seasonality and the so-called “Santa Rally” also lifted the S&P 500 Index towards the end of the month. The Fed walked back its use of “transitory” in describing the inflationary environment and announced it would double its pace of asset purchase tapering and indicated potential interest rate hikes in 2022.
During the first quarter of 2022, the S&P 500 Index fell, marking its first quarterly decline since the first quarter of 2020. Among the major economic and geopolitical developments were the dramatic repricing of the Fed interest rate hike path and accelerated expectations for a more aggressive balance sheet runoff phase due to concerns about elevated and persistent inflation pressures. The hawkish Fed policy shift drove a large increase in bond yields, and U.S. Treasuries suffered one of their worst quarters on record. (Hawkish suggest higher interest rates; opposite of dovish.) COVID-19, and more specifically, the Omicron variant, was still an overhang, with resurgent cases bringing back supply-chain issues and worker shortages. Amid this backdrop, dampened corporate earnings momentum played into the bearish narrative for the U.S. equities markets. (Bearish refers to an expected downward movement in the prices of securities.) Growth equities meaningfully lagged value equities as a potential by-product of anticipated higher interest rates in the near term.
The S&P 500 Index fell more dramatically in the second quarter of 2022, as inflation, the Fed’s policy response and recession worries were at the core of investors’ narratives, resulting in a broad risk-off, or heightened risk aversion, atmosphere. Geopolitical overhang also remained a concern, as it affected energy prices, leading to low consumer sentiment and potentially changing consumer spending trends. On the other hand, equity inflows, buyback strength, insider buying, resilient consumer spending and some hints of cooling in the labor market were seen by the consensus as tailwinds. In late May/early June 2022, it remained unclear whether a rebound seen in the U.S. equity markets from the May 20, 2022 year-to-date low represented the start of a recovery or a bear-market rally. This question was quickly answered later in the month after the release of a higher than consensus expected May Consumer Price Index report, which sent the S&P 500 Index to a new year-to-date low. Moreover, following a 25 basis point hike in March 2022 and a 50 basis point increase in May 2022, the Fed agreed to a 75 basis point interest rate hike during its June 2022 meeting, wherein Fed Chair Powell asserted the Fed’s unconditional commitment to price stability with a policy response evolving based on incoming data. (A basis point is 1/100th of a percentage point.) At the end of the quarter, investors were looking ahead to the second quarter corporate earnings reporting season with some caution, as input price pressures and consumption trends factored into analyst arguments for downward revisions to earnings estimates.
In July 2022, U.S. equities rallied strongly, posting its largest monthly gain since November 2020 even as the Fed delivered another 75 basis point interest rate hike and Fed Chair Powell reiterated the central bank’s commitment to bringing inflation back to its target around 2%. Despite fears about aggressive monetary policy tightening and indications the U.S. economy had contracted for a second consecutive quarter, stocks advanced amid mostly better than consensus expected corporate earnings and a
1
MARKET REVIEW
decline in mid- to longer-term inflation expectations. U.S. equities continued to rally through mid-August 2022 driven by softer U.S. inflation readings and strong labor market data. However, the S&P 500 Index gave up its gains in the second half of the month on the back of hawkish Fed commentary. Business and consumer confidence remained depressed, pointing toward persistent weakness in economic activity. However, the U.S. labor market added 315,000 jobs in August. While the U.S. unemployment rate inched up from 3.5% to 3.7%, it was largely driven by a higher participation rate, i.e. increased labor supply rather than weaker labor demand. Nonetheless, given the moderating but elevated inflation, the Fed continued to signal further monetary tightening, which hurt the U.S. equity market in the latter half of August. In his speech at Jackson Hole, Fed Chair Powell reiterated that restoring price stability would likely require maintaining a restrictive policy stance for some time.
For the Reporting Period overall, only three of the 11 sectors of the S&P 500 Index posted absolute gains, led by the energy sector. Following at some distance were utilities and consumer staples, which also generated positive returns during the Reporting Period. On a relative basis, the weakest performing sectors in the S&P 500 Index were communication services, consumer discretionary and information technology.
Within the U.S. equity market, all capitalization segments generated negative absolute returns during the Reporting Period, but small-cap stocks, as measured by the Russell 2000® Index, were weakest, followed by mid-cap stocks, as measured by the Russell Midcap® Index, and then large-cap stocks, as measured by the Russell 1000® Index. From a style perspective, for the second consecutive 12-month period, value stocks meaningfully outperformed growth stocks on a relative basis across the capitalization spectrum during the Reporting Period. (All as measured by the FTSE Russell indices.)
Looking Ahead
At the end of the Reporting Period, we remained optimistic about the overall strength of the U.S. economy yet vigilant as we navigate anticipated U.S. equity market volatility ahead as the Fed’s hawkish stance, elevated inflation, high commodities prices, China’s economic growth slowdown, the U.S.’ resilient labor market and COVID-19 overhangs remain key factors to watch. While fears of a deep recession have waned, there remains the risk the Fed could overtighten monetary policy, and we do expect economic growth to slow in the U.S. through the end of 2022 and into 2023. Further, given higher oil and gas prices, strength in shelter inflation (inclusive of rent and lodging away from home) and potential COVID-19-related supply disruptions from China, we expect inflation to remain elevated in the near term but then to moderate gradually toward the end of the year. We expect the Fed’s monetary policy to continue to tighten to anchor inflation expectations. Finally, geopolitical uncertainties remain elevated. While uncertainty dominates, we believe some of this had already been priced into the U.S. equity market, as valuations, in our view, were more reasonable at the end of the Reporting Period than at the start of 2022. Amid this backdrop, we intend to stay true, as always, to our quality-first investment approach as we continue to seek to invest in businesses with healthy balance sheets, relatively stable cash flow generation and differentiated business models aligned to secular advantages. We continue to test our strategies and re-evaluate our assumptions with increasing information, staying focused on the long-term investment horizon.
Regardless of market direction, our fundamental, bottom-up stock selection continues to drive our process, rather than headlines or sentiment. We maintain high conviction in the companies the Fundamental Equity Growth Funds own and believe they have the potential to outperform relative to the broader market regardless of economic growth conditions. As always, we maintain our focus on seeking companies that we believe will generate long-term growth in today’s ever-changing market conditions.
2
Goldman Sachs Concentrated Growth Fund
Portfolio Composition
The Fund seeks to achieve its investment objective of seeking long-term growth of capital by investing, under normal circumstances, in U.S. equity investments selected for their potential to achieve capital appreciation over the long term. The Fund typically holds 30-40 companies that are considered by the Investment Adviser to be positioned for long-term growth. The Fund may invest in securities of companies of any capitalization. Although the Fund invests primarily in publicly traded U.S. securities, it may invest up to 25% of its total assets in foreign securities, including securities of issuers in countries with emerging markets or economies (“emerging countries”) and securities quoted in foreign currencies. The Fund may also invest up to 10% of its total assets in fixed income securities, such as government, corporate and bank debt obligations.
Portfolio Management Discussion and Analysis
Below, the Goldman Sachs Fundamental Equity U.S. Equity Team discusses the Goldman Sachs Concentrated Growth Fund’s (the “Fund”) performance and positioning for the 12-month period ended August 31, 2022 (the “Reporting Period”).
| Q | How did the Fund perform during the Reporting Period? |
| A | During the Reporting Period, the Fund’s Class A, Class C, Institutional, Investor, Class R6, Class R and Class P Shares generated average annual total returns, without sales charges, of -26.54%, -27.13%, -26.32%, -26.35%, -26.31%, -26.72% and -26.32%, respectively. These returns compare to the -19.06% average annual total return of the Fund’s benchmark, the Russell 1000® Growth Index (with dividends reinvested) (the “Russell Index”), during the same period. |
| Q | What key factors were responsible for the Fund’s performance during the Reporting Period? |
| A | The Fund underperformed the Russell Index on a relative basis during the Reporting Period due primarily to stock selection overall. Sector allocation as a whole also detracted, albeit more modestly, from relative performance during the Reporting Period. |
| Q | Which equity market sectors most significantly affected Fund performance? |
| A | The sectors that detracted most from the Fund’s relative performance during the Reporting Period were communication services, consumer discretionary and information technology, wherein stock selection in each proved challenging. Sector allocation positioning in communication services also hurt. Only partially offsetting these detractors was effective stock selection in health care and real estate — the only two sectors to contribute positively to the Fund’s relative results during the Reporting Period. |
| Q | Which stocks detracted significantly from the Fund’s performance during the Reporting Period? |
| A | Those stocks detracting most from the Fund’s results relative to the Russell Index were Snap, PayPal Holdings and Affirm Holdings. |
| Snap is a social media and camera company that develops and provides applications and products for communication. A broader impact of supply-chain shortages and Apple’s IDFA erosion weighed on advertiser demand, ultimately driving Snap’s quarterly earnings results lower. (The Identifier for Advertisers (“IDFA”) is a random device identifier assigned by Apple to a user’s device. Advertisers use this to track data so they can deliver customized advertising. The IDFA is used for tracking and identifying a user without revealing personal information.) Then, after issuing guidance that contradicted previous revenue and profit targets in May 2022, the company’s stock suffered a substantial pullback, as investors were uneasy about macroeconomic pressures facing the company. The company announced a disappointing quarter, as it saw increased competition for advertising dollars and macroeconomic headwinds. The company illustrated a slowdown in the advertising market and did not provide a guide for the third calendar quarter. However, the company had strong engagement trends and daily active user growth, and the longer-term goal of artificial reality and maps monetization remained intact. At the end of the Reporting Period, we continued to believe user growth and engagement were still positive, and we expected new products to drive higher revenue. Longer term, we believed Snap remained well situated to take incremental share of digital ad dollars, as it |
3
PORTFOLIO RESULTS
| continued to drive user engagement with innovative features and has a strong management team, in our view, committed to execution. Furthermore, its shares depreciated due to no company-specific news but rather due to a broad and abrupt market reversal from high growth names to value due to concerns around rising interest rates, which, in turn, drove losses across the technology industry. |
| Shares of digital payment technology company PayPal Holdings initially declined during the Reporting Period amid rumors the company was looking to acquire Pinterest, though PayPal Holdings ultimately decided the move would be too difficult to accomplish. Further, the company’s earnings report in November 2021 exceeded consensus expectations on earnings per share, but revenue fell below consensus expectations. The lesser volumes were caused by lower than consensus expected back-to-school spending along with a travel slowdown due to the COVID-19 variants. Its shares then depreciated following the company’s fourth quarter 2021 earnings announcement, wherein they issued disappointing forward guidance amid supply-chain issues, inflation, labor shortages and weaker consumer sentiment. The company’s stock depreciated further in the second quarter of 2022, as there were longer-term market share concerns with lowered revenue growth and operating margins adjusted downward, and the concerns of the prior quarter remained overhangs. At the end of the Reporting Period, we maintained our conviction in the company, as, in our view, it has the resources and capability to continue to grow its core customer base as it focuses on user engagement. As a scaled player in the payment industry, we believed PayPal Holdings was well positioned to leverage its existing customer base to implement any new payment technology. Also, we believed its strong balance sheet should allow it to either develop new technology, such as “buy now, pay later,” in house or to acquire an existing player within the industry. |
| Financial technology company Affirm Holdings originally suffered during the Reporting Period from the widespread reversal away from high growth companies as interest rate hikes waned on valuations. Then, its shares declined following its fourth quarter 2021 earnings release in February 2022, which featured better than consensus revenue and gross merchandise value (“GMV”) results, but its forward guidance concerned investors with its management pointing out a potential step down in GMV results and elevated transaction costs. Regarding transaction costs, the company’s long-term target on revenue excluding these costs as a percentage of GMV had not changed, which we viewed as a favorable sign. However, the company struggled amid macroeconomic headwinds, such as record level inflation, rising interest rates and decreased consumer spending, which together raised concerns about subprime credit lending and profitability. We had established a Fund position in Affirm Holdings earlier in the Reporting Period and despite the firm’s strong earnings and exclusive partnership to grow its GMV, we ultimately sold the position in favor a what we saw as a better risk/reward opportunity. |
| Q | What were some of the Fund’s best-performing individual stocks? |
| A | The Fund benefited most relative to the Russell Index from positions in Eli Lilly and Company, McDonald’s and Sarepta Therapeutics. |
| Eli Lilly and Company develops and manufactures pharmaceutical products. Its earnings results in the first quarter of 2022 beat consensus estimates by three cents with adjusted quarterly earnings of $2.49 per share, while its revenue beat consensus forecasts as well. These results were boosted by a jump in sales of the company’s Trulicity diabetes drug and COVID-19 therapies. Eli Lilly and Company was able to achieve 10% growth outside of its COVID-19 work and saw more than 60% of its revenues in the fourth quarter of 2021 coming from its “growth brand” of pharmaceutical products. Also, five new medicines were on deck to launch during the next two years. In August 2022, its earnings report featured a slight miss compared to consensus expectations, but the company maintained its full-year guidance and announced that all of its drug launches remained on track. At the end of the Reporting Period, we continued to view Eli Lilly and Company as one of the fastest growing pharmaceuticals companies with no major patent concerns until 2030 and a robust new product pipeline with multi-billion dollar opportunities ahead. |
| Fast-food restaurant giant McDonald’s successfully navigated a difficult operating environment amidst being forced to close its 850 locations in Russia and being faced with rising costs during the Reporting Period. Its Russian segment was a lower margin business, so this was not viewed by investors as a material negative. Consumers trading down in a higher cost environment also benefitted its sales. At the end of the Reporting Period, we continued to believe McDonald’s was well positioned to gain share and perform well in the near term given what we see as its leadership in value, strong operations and ongoing digital efforts. |
4
PORTFOLIO RESULTS
| Shares of commercial stage biopharmaceutical company Sarepta Therapeutics depreciated in January 2022 after trading was halted before the announcement of preliminary earnings results that were not well received. Poor results also came from drug trials, though we did not view the announcements to be as material as the market did. However, good news came in July 2022 as accelerated approval was filed for its Duchenne muscular dystrophy gene therapy drug, SRP-9001, and the company’s stock ended up generating robust double-digit gains for the Reporting Period overall. At the end of the Reporting Period, gene therapy remained the main driver of our investment thesis for Sarepta Therapeutics, and our conviction in the company’s operating capabilities as well as in the prospects of its drug pipeline coming to market remained intact. |
| Q | How did the Fund use derivatives and similar instruments during the Reporting Period? |
| A | During the Reporting Period, we did not use derivatives as part of an active management strategy. |
| Q | Did the Fund make any significant purchases or sales during the Reporting Period? |
| A | We initiated a Fund position in multinational information technology services and consulting company Accenture during the Reporting Period. We believe Accenture is a market leader and a well-managed company that should benefit in a robust demand environment. Further, we believe its stock was trading, at the time of purchase, at an attractive valuation given that the company had lagged comparable peers in the months prior and believe the market was underappreciating Accenture’s growth prospects. |
| We established a Fund position in paint and coatings manufacturer Sherwin-Williams in July 2022. Despite supply-chain headwinds from China, the company has taken on a series of price initiatives. Its management also stated it feels good about its margin expansion story for early 2023 should cost pressures ease as it anticipates given that it does not anticipate rolling back its prices, so profitability should resume in the near term. |
| Conversely, we exited the Fund’s position in media content provider Netflix during the Reporting Period. While we continued to like the company, we saw some near-term headwinds facing the business, such as increased competition and macroeconomic pressures. We sold the position in favor what we considered to be better risk/reward profiles elsewhere, but we intend to keep monitoring the company for a longer-term opportunity. |
| We sold the Fund’s position in financial technology services provider Fidelity National Information Services in November 2021. We believed its near-term growth could be inhibited by implied risks in its merchant solution business. We eliminated the position for this reason and due to concerns about its long-term growth based on what we saw as the disruptive competitive landscape for the firm. |
| Q | Were there any changes to the Fund’s portfolio management team during the Reporting Period? |
| A | There were no changes to the Fund’s portfolio management team during the Reporting Period. |
| Q | Were there any notable changes in the Fund’s weightings during the Reporting Period? |
| A | In constructing the Fund’s portfolio, we focus on picking stocks rather than on making industry or sector bets. We seek to outpace the benchmark index by overweighting stocks that we expect to outperform and underweighting those that we think may lag. Consequently, changes in its sector weights are generally the direct result of individual stock selection or of stock appreciation or depreciation. That said, during the Reporting Period, the Fund’s exposure to consumer discretionary and information technology increased and its allocations to communication services and consumer staples decreased relative to the Russell Index. |
| Q | How was the Fund positioned relative to its benchmark index at the end of August 2022? |
| A | At the end of August 2022, the Fund had overweighted positions relative to the Russell Index in the health care and materials sectors. On the same date, the Fund had underweighted positions compared to the Russell Index in industrials and consumer staples. The Fund was rather neutrally weighted relative to the Russell Index in communication services, consumer discretionary, information technology and real estate and had no positions at all in the utilities, energy and financials sectors at the end of the Reporting Period. |
5
FUND BASICS
Concentrated Growth Fund
as of August 31, 2022
| TOP TEN HOLDINGS AS OF 8/31/221 | ||||||||
| Holding | % of Net Assets | Line of Business | ||||||
| Apple, Inc. | 11.1 | % | Technology Hardware, Storage & Peripherals | |||||
| Microsoft Corp. | 10.6 | Software | ||||||
| Amazon.com, Inc. | 4.6 | Internet & Direct Marketing Retail | ||||||
| Eli Lilly & Co. | 3.2 | Pharmaceuticals | ||||||
| Mastercard, Inc., Class A | 3.2 | IT Services | ||||||
| Alphabet, Inc., Class A | 3.1 | Interactive Media & Services | ||||||
| Alphabet, Inc., Class C | 2.7 | Interactive Media & Services | ||||||
| American Tower Corp. REIT | 2.6 | Equity Real Estate Investment Trusts (REITs) | ||||||
| Boston Scientific Corp. | 2.6 | Health Care Equipment & Supplies | ||||||
| McDonald’s Corp. | 2.6 | Hotels, Restaurants & Leisure | ||||||
| 1 | The top 10 holdings may not be representative of the Fund’s future investments. |
| FUND VS. BENCHMARK SECTOR ALLOCATION2 |
| As of August 31, 2022 |

| 2 | The Fund is actively managed and, as such, its composition may differ over time. Consequently, the Fund’s overall sector allocations may differ from the percentages contained in the graph above. Figures in the above graph may not sum to 100% due to the exclusion of other assets and liabilities. The graph categorizes investments using the Global Industry Classification Standard (“GICS”), however, the sector classifications used by the portfolio management team may differ from GICS. The percentage shown for each investment category reflects the value of investments in that category as a percentage of market value. The graph depicts the Fund’s investments but may not represent the Fund’s market exposure due to the exclusion of certain derivatives, if any, as listed in the Additional Investment Information section of the Schedule of Investments. |
For more information about the Fund, please refer to www.GSAMFUNDS.com. There, you can learn more about the Fund’s investment strategies, holdings, and performance.
6
GOLDMAN SACHS CONCENTRATED GROWTH FUND
Performance Summary
August 31, 2022
The following graph shows the value, as of August 31, 2022, of a $1,000,000 investment made on September 1, 2012 in Institutional Shares at NAV. For comparative purposes, the performance of the Fund’s benchmark, the Russell 1000® Growth Index (with dividends reinvested), is shown. Performance reflects applicable fee waivers and/or expense limitations in effect during the periods shown and in their absence, performance would be reduced. Returns do not reflect the deduction of taxes that a shareholder would pay on Fund distributions or the redemption of Fund shares. The returns set forth below represent past performance. Past performance does not guarantee future results. The Fund’s investment return and principal value will fluctuate so that an investor’s shares, when redeemed, may be worth more or less than their original cost. Current performance may be lower or higher than the performance quoted below. Please visit our web site at www.GSAMFUNDS.com to obtain the most recent month-end returns.
| Concentrated Growth Fund’s 10 Year Performance |
Performance of a $1,000,000 Investment, including any applicable sales charges, with distributions reinvested, from September 1, 2012 through August 31, 2022.

| Average Annual Total Return through August 31, 2022* | One Year | Five Years | Ten Years | Since Inception | ||||||||
| Class A |
||||||||||||
| Excluding sales charges |
-26.54% | 11.30% | 11.78% | — | ||||||||
| Including sales charges |
-30.57% | 10.05% | 11.15% | — | ||||||||
|
| ||||||||||||
| Class C |
||||||||||||
| Excluding contingent deferred sales charges |
-27.13% | 10.46% | 10.95% | — | ||||||||
| Including contingent deferred sales charges |
-27.85% | 10.46% | 10.95% | — | ||||||||
|
| ||||||||||||
| Institutional |
-26.32% | 11.68% | 12.19% | — | ||||||||
|
| ||||||||||||
| Investor |
-26.35% | 11.57% | 12.06% | — | ||||||||
|
| ||||||||||||
| Class R6 (Commenced July 31, 2015) |
-26.31% | 11.69% | N/A | 10.49% | ||||||||
|
| ||||||||||||
| Class R |
-26.72% | 11.02% | 11.51% | — | ||||||||
|
| ||||||||||||
| Class P (Commenced April 17, 2018) |
-26.32% | N/A | N/A | 10.63% | ||||||||
|
| ||||||||||||
| * | These returns assume reinvestment of all distributions at NAV and reflect a maximum initial sales charge of 5.50% for Class A Shares and the assumed contingent deferred sales charge for Class C Shares (1% if redeemed within 12 months of purchase). Because Institutional, Investor, Class P, Class R and Class R6 Shares do not involve a sales charge, such a charge is not applied to their Average Annual Total Return. |
7
PORTFOLIO RESULTS
Goldman Sachs Flexible Cap Fund
Portfolio Composition
The Fund invests, under normal circumstances, at least 80% of its net assets plus any borrowings for investment purposes (measured at time of purchase) (“Net Assets”) in equity investments in small-, mid- and large-cap issuers. The Fund seeks to achieve its investment objective by investing, under normal circumstances, in companies that are considered by the Investment Adviser to be positioned for long-term growth of capital. This strategy is combined with a quantitative risk allocation process that is used to assist portfolio construction and trading decisions.
Portfolio Management Discussion and Analysis
Below, the Goldman Sachs Fundamental Equity U.S. Equity Team discusses the Goldman Sachs Flexible Cap Fund’s (the “Fund”) performance and positioning for the 12-month period ended August 31, 2022 (the “Reporting Period”).
| Q | How did the Fund perform during the Reporting Period? |
| A | During the Reporting Period, the Fund’s Class A, Class C, Institutional, Investor, Class R6, Class R and Class P Shares generated average annual total returns, without sales charges, of -11.46%, -12.07%, -11.10%, -11.21%, -11.12%, -11.68% and -11.07%, respectively. These returns compare to the -11.23% average annual total return of the Fund’s benchmark, the S&P 500 Index (with dividends reinvested), during the same period. |
| Q | What key factors were responsible for the Fund’s performance during the Reporting Period? |
| A | While absolute returns disappointed, several share classes of the Fund outperformed the S&P 500 Index on a relative basis during the Reporting Period due both to stock selection and sector allocation overall. |
| Q | Which equity market sectors most significantly affected Fund performance? |
| A | The sectors that contributed most positively to the Fund’s relative performance during the Reporting Period were health care, financials and energy. Effective stock selection drove results in each of these sectors. The sectors that detracted most from the Fund’s relative results during the Reporting Period were information technology, consumer staples and materials, wherein stock selection proved challenging. |
| Q | What were some of the Fund’s best-performing individual stocks? |
| A | Those stocks the Fund benefited most from relative to the S&P 500 Index were positions in Devon Energy, Meta Platforms and Pioneer Natural Resources. |
| Devon Energy, an exploration and production oil and gas company, posted fourth quarter 2021 earnings that featured strong results, with both earnings and dividend amounts higher than market expectations. Investor focus remained on 2022 production and a variable dividend wherein Devon Energy leads the industry. Each subsequent earnings report during the Reporting Period similarly featured results above market expectations, largely due to strong production and execution metrics. At the end of the Reporting Period, our investment thesis continued to revolve around a better than consensus expected variable dividend, increased buybacks and what we saw as a line of sight to significant capital returns. |
| Meta Platforms engages in the development of social media applications. The company, formerly known as Facebook, was a top contributor to relative results because the Fund held an underweighted position in this weakly-performing stock during the Reporting Period. In February 2022, the company announced materially lowered forward guidance. Issues of concerns included social media competition/engagement, introduction of Reels to compete with TikTok with limited traction, and IDFA concerns as it related to pending regulations being imposed. (The Identifier for Advertisers (“IDFA”) is a random device identifier assigned by Apple to a user’s device. Advertisers use this to track data so they can deliver customized advertising. The IDFA is used for tracking and identifying a user without revealing personal information.) At the end of the Reporting Period, the Fund maintained a position in Meta Platforms because we believed the company has an attractive valuation and is focusing its efforts on different new devices to diversify and enter new markets. We were also optimistic the company will continue what we view as its attractive operating margins and that the |
8
PORTFOLIO RESULTS
| broader industry has positive tailwinds. However, a fair amount of uncertainty remained around the future prospects of Meta Platforms. |
| The strong performance of oil and gas exploration and production company Pioneer Natural Resources was supported by subdued oil production, high and improving demand, and new geopolitical tensions fueled by the war in Ukraine. Another point of optimism supporting its stock was that the company is committed to return 75% of its free cash flow in the form of distributions. We believed the company’s healthy balance sheet and efficient production would likely continue to drive performance and keep its earnings in line with market expectations. In our view, the company’s cash yield of approximately 15% also remained attractive. However, given a more scrutinized operating environment for exploration and production companies along with potential political intervention, in the context of the entirety of the Fund’s portfolio, we opted to sell the position, taking profits. |
| Q | Which stocks detracted significantly from the Fund’s performance during the Reporting Period? |
| A | Detracting most from the Fund’s results relative to the S&P 500 Index were positions in Exxon Mobil, EPAM Systems and Adobe. |
| Oil and gas integrated energy company Exxon Mobil, a new purchase for the Fund during the Reporting Period, was a top detractor from relative results because the Fund held an underweight position in its strongly performing stock. Its shares benefited primarily from an increase in crude oil prices and favorable supply/demand dynamics. Also, in February 2022, it was announced that sweeping restructuring would be taking place across its global operations. Examples of changes included cost cutting and a new headquarters location in Houston. Further, earnings releases in the summer of 2022 featured significant outperformance of market expectations on both net income and earnings per share. Results from its liquid natural gas segment also proved favorable. At the end of the Reporting Period, we continued to see what we viewed as attractive trends in the operations of its business, and we looked to see further capital distributions put in place. |
| We initiated a Fund position in software product development and digital platform services company EPAM Systems in September 2021 but ultimately exited the position in March 2022. It performed poorly, as the company had significant business operations in Ukraine, and its management cited concerns around revenue and costs being adversely affected by the ongoing war there. We had viewed the company as one of our favorites within the mid-cap information technology services industry, but the geopolitical conflict concerns invalidated our investment thesis, and we sold the position. |
| Shares of digital marketing and media solutions company Adobe fell in December 2021 after poor earnings and forward guidance was given by its management. Then, in March 2022, price hikes were announced for enterprise-level customers. Fortunately, the products offered by Adobe are highly integrated into most clients’ business operations, so we believe most will accept the higher prices. At the end of the Reporting Period, we continued to believe Adobe had industry-leading operating margins, and if the macroenvironment weakens, that its management would be able to adjust expenses accordingly. |
| Q | How did the Fund use derivatives and similar instruments during the Reporting Period? |
| A | During the Reporting Period, we did not use derivatives as part of an active management strategy. |
| Q | Did the Fund make any significant purchases or sales during the Reporting Period? |
| A | In addition to the purchase of Exxon Mobil, already mentioned, we initiated a Fund position in multinational information technology services and consulting company Accenture during the Reporting Period. We believe Accenture is a market leader and a well-managed company that should benefit in a robust demand environment. Further, we believe its stock was trading, at the time of purchase, at an attractive valuation given that the company had lagged comparable peers in the months prior and believe the market was underappreciating Accenture’s growth prospects. |
| Conversely, in addition to those sales mentioned earlier, we exited the Fund’s position in Intuit, which offers financial management and compliance products and services, in September 2021. Despite what we see as the strength of the business and clear levers of growth, on a relative basis, Intuit looked less attractive to us than other large-cap technology companies. We ultimately decided to sell the position in favor of what we considered to be more attractive investment opportunities elsewhere. |
| We eliminated the Fund’s position in semiconductor company Texas Instruments during the Reporting Period. Concerns were observed regarding peak gross margins and compressing cash flows as a result of capital expenditure investments planned by the company for the next few years. |
9
PORTFOLIO RESULTS
| Our preference at the end of the Reporting Period was for other names in the industry, so we decided to sell in favor of other positions. |
| Q | Were there any changes to the Fund’s portfolio management team during the Reporting Period? |
| A | There were no changes to the Fund’s portfolio management team during the Reporting Period. |
| Q | Were there any notable changes in the Fund’s weightings during the Reporting Period? |
| A | In constructing the Fund’s portfolio, we focus on picking stocks rather than on making industry or sector bets. We seek to outpace the benchmark index by overweighting stocks that we expect to outperform and underweighting those that we think may lag. Consequently, changes in its sector weights are generally the direct result of individual stock selection or of stock appreciation or depreciation. That said, during the Reporting Period, the Fund’s exposure to industrials increased and its allocation to health care decreased relative to the S&P 500 Index. |
| Q | How was the Fund positioned relative to its benchmark index at the end of August 2022? |
| A | At the end of August 2022, the Fund had underweighted positions compared to the S&P 500 Index in consumer staples, and health care and an overweighted position relative to the S&P 500 Index in industrials. The Fund was rather neutrally weighted relative to the Russell Index in the remaining eight sectors of the S&P 500 Index at the end of the Reporting Period. |
10
FUND BASICS
Flexible Cap Fund
as of August 31, 2022
| TOP TEN HOLDINGS AS OF 8/31/221 | ||||||||
| Holding | % of Net Assets | Line of Business | ||||||
| Apple, Inc. | 6.8 | % | Technology Hardware, Storage & Peripherals | |||||
| Microsoft Corp. | 5.9 | Software | ||||||
| Amazon.com, Inc. | 2.8 | Internet & Direct Marketing Retail | ||||||
| Alphabet, Inc., Class C | 1.8 | Interactive Media & Services | ||||||
| Exxon Mobil Corp. | 1.7 | Oil, Gas & Consumable Fuels | ||||||
| Meta Platforms, Inc., Class A | 1.6 | Interactive Media & Services | ||||||
| JPMorgan Chase & Co. | 1.5 | Banks | ||||||
| Alphabet, Inc., Class A | 1.4 | Interactive Media & Services | ||||||
| Tesla, Inc. | 1.4 | Automobiles | ||||||
| Bank of America Corp. | 1.2 | Banks | ||||||
| 1 | The top 10 holdings may not be representative of the Fund’s future investments. |
| FUND VS. BENCHMARK SECTOR ALLOCATION2 |
| As of August 31, 2022 |

| 2 | The Fund is actively managed and, as such, its composition may differ over time. Consequently, the Fund’s overall sector allocations may differ from the percentages contained in the graph above. Figures in the above graph may not sum to 100% due to the exclusion of other assets and liabilities. The graph categorizes investments using the Global Industry Classification Standard (“GICS”), however, the sector classifications used by the portfolio management team may differ from GICS. The percentage shown for each investment category reflects the value of investments in that category as a percentage of market value. The graph depicts the Fund’s investments but may not represent the Fund’s market exposure due to the exclusion of certain derivatives, if any, as listed in the Additional Investment Information section of the Schedule of Investments. |
For more information about the Fund, please refer to www.GSAMFUNDS.com. There, you can learn more about the Fund’s investment strategies, holdings, and performance.
11
GOLDMAN SACHS FLEXIBLE CAP FUND
Performance Summary
August 31, 2022
The following graph shows the value, as of August 31, 2022, of a $10,000 investment made on September 1, 2012 in Class A Shares at NAV (with the maximum sales charge of 5.50%). For comparative purposes, the performance of the Fund’s benchmark, the S&P 500® Index (with dividends reinvested), is shown. Performance reflects applicable fee waivers and/or expense limitations in effect during the periods shown and in their absence, performance would be reduced. Returns do not reflect the deduction of taxes that a shareholder would pay on Fund distributions or the redemption of Fund shares. The returns set forth below represent past performance. Past performance does not guarantee future results. The Fund’s investment return and principal value will fluctuate so that an investor’s shares, when redeemed, may be worth more or less than their original cost. Current performance may be lower or higher than the performance quoted below. Please visit our web site at www.GSAMFUNDS.com to obtain the most recent month-end returns.
| Flexible Cap Fund’s 10 Year Performance |
Performance of a $10,000 Investment, including any applicable sales charges, with distributions reinvested, from September 1, 2012 through August 31, 2022.
![]()
| Average Annual Total Return through August 31, 2022* | One Year | Five Years | Ten Years | Since Inception | ||||||||
| Class A |
||||||||||||
| Excluding sales charges |
-11.46% | 11.51% | 12.89% | — | ||||||||
| Including sales charges |
-16.35% | 10.26% | 12.25% | — | ||||||||
|
| ||||||||||||
| Class C |
||||||||||||
| Excluding contingent deferred sales charges |
-12.07% | 10.69% | 12.05% | — | ||||||||
| Including contingent deferred sales charges |
-12.95% | 10.69% | 12.05% | — | ||||||||
|
| ||||||||||||
| Institutional |
-11.10% | 11.93% | 13.32% | — | ||||||||
|
| ||||||||||||
| Investor |
-11.21% | 11.79% | 13.18% | — | ||||||||
|
| ||||||||||||
| Class R6 (Commenced July 31, 2015) |
-11.12% | 11.93% | N/A | 10.84% | ||||||||
|
| ||||||||||||
| Class R |
-11.68% | 11.23% | 12.61% | — | ||||||||
|
| ||||||||||||
| Class P (Commenced April 17, 2018) |
-11.07% | N/A | N/A | 10.92% | ||||||||
|
| ||||||||||||
| * | These returns assume reinvestment of all distributions at NAV and reflect a maximum initial sales charge of 5.50% for Class A Shares and the assumed contingent deferred sales charge for Class C Shares (1% if redeemed within 12 months of purchase). Because Institutional, Investor, Class P, Class R and Class R6 Shares do not involve a sales charge, such a charge is not applied to their Average Annual Total Return. |
12
PORTFOLIO RESULTS
Goldman Sachs Large Cap Core Fund
Portfolio Composition
At the start of the Reporting Period, the Fund sought to achieve its investment objective of seeking long-term growth of capital by investing, under normal circumstances, in companies that were considered by the Investment Advisor to be positioned for long-term growth.
Effective after the close of business on April 13, 2022, the Fund seeks to achieve its investment objective of long-term growth of capital by investing, under normal circumstances, at least 80% of its net assets plus any borrowings for investment purposes (measured at the time of purchase) (“Net Assets”) in a diversified portfolio of equity investments in large-cap issuers. Large-cap issuers are issuers with public stock market capitalizations (based upon shares available for trading on an unrestricted basis) within the range of the market capitalizations of companies constituting the Russell 1000® Index at the time of investment. The Fund seeks to achieve its investment objective by investing, under normal circumstances, in companies that are considered by the Investment Adviser to be positioned for long-term growth. Although the Fund invests primarily in publicly traded U.S. securities, it may invest up to 25% of its total assets in foreign securities, including securities of issuers in countries with emerging markets or economies (“emerging countries”) and securities quoted in foreign currencies.
Portfolio Management Discussion and Analysis
Effective after the close of business on April 13, 2022, Goldman Sachs Capital Growth Fund was re-named Goldman Sachs Large Cap Core Fund and changes were made to its principal investment strategy. Below, the Goldman Sachs Fundamental Equity U.S. Equity Team discusses the Goldman Sachs Large Cap Core Fund’s (the “Fund”) performance and positioning for the 12-month period ended August 31, 2022 (the “Reporting Period”).
| Q | How did the Fund perform during the Reporting Period? |
| A | During the Reporting Period, the Fund’s Class A, Class C, Institutional, Service, Investor, Class R6, Class R and Class P Shares generated average annual total returns, without sales charges, of -15.37%, -16.04%, -15.08%, -15.50%, -15.16%, -15.07%, -15.58% and -15.08%, respectively. These returns compare to the -12.96% average annual total return of the Fund’s benchmark, the Russell 1000® Index (with dividends reinvested) (the “Russell Index”), during the same period. |
| Q | What key factors were responsible for the Fund’s performance during the Reporting Period? |
| A | The Fund underperformed the Russell Index on a relative basis during the Reporting Period due primarily to stock selection overall. Sector allocation as a whole had a rather neutral effect on relative performance during the Reporting Period. |
| Q | Which equity market sectors most significantly affected Fund performance? |
| A | The sectors that detracted most from the Fund’s relative performance during the Reporting Period were communication services, industrials and health care, wherein stock selection in each dampened results. The sectors that contributed most positively to the Fund’s relative performance during the Reporting Period were energy, financials and real estate, wherein stock selection in each proved effective. Having a modest overweight to energy, which was the strongest sector in the Russell Index during the Reporting Period, also boosted relative results. |
| Q | Which stocks detracted significantly from the Fund’s performance during the Reporting Period? |
| A | Those stocks detracting most from the Fund’s results relative to the Russell Index were positions in Snap, Exxon Mobil and PayPal Holdings. |
| Snap is a social media and camera company that develops and provides applications and products for communication. A broader impact of supply-chain shortages and Apple’s IDFA erosion weighed on advertiser demand, ultimately driving Snap’s quarterly earnings results lower. (The Identifier for Advertisers (“IDFA”) is a random device identifier assigned by Apple to a user’s device. Advertisers use this to track data so they can deliver customized advertising. The IDFA is used for tracking and identifying a user without revealing personal information.) Then, after |
13
PORTFOLIO RESULTS
| issuing guidance that contradicted previous revenue and profit targets in May 2022, the company’s stock suffered a substantial pullback, as investors were uneasy about macroeconomic pressures facing the company. The company announced a disappointing quarter, as it saw increased competition for advertising dollars and macroeconomic headwinds. The company illustrated a slowdown in the advertising market and did not provide a guide for the third calendar quarter. However, the company had strong engagement trends and daily active user growth, and the longer-term goal of artificial reality and maps monetization remained intact. At the end of the Reporting Period, we continued to believe user growth and engagement were still positive, and we expected new products to drive higher revenue. Longer term, we believed Snap remained well situated to take incremental share of digital ad dollars, as it continued to drive user engagement with innovative features and had a strong management team, in our view, committed to execution. Furthermore, its shares depreciated due to no company-specific news but rather due to a broad and abrupt market reversal from high growth names to value due to concerns around rising interest rates, which, in turn, drove losses across the technology industry. |
| Oil and gas integrated energy company Exxon Mobil, a new purchase for the Fund during the Reporting Period, was a top detractor from relative results because the Fund held an underweight position in its strongly performing stock. Its shares benefited primarily from an increase in crude oil prices and favorable supply/demand dynamics. Also, in February 2022, it was announced that sweeping restructuring would be taking place across its global operations. Examples of changes included cost cutting and a new headquarters location in Houston. Further, earnings releases in the summer of 2022 featured significant outperformance of market expectations on both net income and earnings per share. Results from its liquid natural gas segment also proved favorable. At the end of the Reporting Period, we continued to see what we viewed as attractive trends in the operations of its business, and we looked to see further capital distributions put in place. |
| Shares of digital payment technology company PayPal Holdings initially declined during the Reporting Period amid rumors the company was looking to acquire Pinterest, though PayPal Holdings ultimately decided the move would be too difficult to accomplish. Further, the company’s earnings report in November 2021 exceeded consensus expectations on earnings per share, but revenue fell below consensus expectations. The lesser volumes were caused by lower than consensus expected back-to-school spending along with a travel slowdown due to the COVID-19 variants. Its shares then depreciated following the company’s fourth quarter 2021 earnings announcement, wherein the company issued disappointing forward guidance amid supply-chain issues, inflation, labor shortages and weaker consumer sentiment. The company’s stock depreciated further in the second quarter of 2022, as there were longer-term market share concerns with lowered revenue growth and operating margins adjusted downward, and the concerns of the prior quarter remained overhangs. At the end of the Reporting Period, we maintained our conviction in the company, as, in our view, it has the resources and capability to continue to grow its core customer base as it focuses on user engagement. As a scaled player in the payment industry, we believed PayPal Holdings was well positioned to leverage its existing customer base to implement any new payment technology. Also, we believed its strong balance sheet should allow it to either develop new technology, such as “buy now, pay later,” in house or to acquire an existing player within the industry. |
| Q | What were some of the Fund’s best-performing individual stocks? |
| A | Those stocks the Fund benefited most from relative to the Russell Index were positions in Chevron, Pioneer Natural Resources and CVS Health. |
| Chevron is a global integrated energy, chemical and petroleum company. Its stock price, similar to the energy sector more broadly, benefited from an increase in crude oil prices in the first quarter of 2022, driven by slow oil supply growth as the Organization of the Petroleum Exporting Countries (“OPEC”) struggled to produce oil in line with its production goals, while demand proved to be resilient and on track to reach pre-pandemic levels. Furthermore, fuel prices appreciated as tensions between Ukraine and Russia heightened, causing countries to threaten sanctions on Russia, which supplies more than a third of the European Union’s natural gas. At the end of the Reporting Period, we continued to believe Chevron’s management had solid capital allocation discipline with a shareholder friendly team. We were optimistic at the end of the Reporting Period given our view that the company has a strong balance sheet, a Permian Basin portfolio that enables balanced growth and free cash flow, and an ability to generate free cash flow from its core asset base. |
| Similarly, the strong performance of oil and gas exploration and production company Pioneer Natural Resources was |
14
PORTFOLIO RESULTS
| supported by subdued oil production, high and improving demand, and new geopolitical tensions fueled by the war in Ukraine. Another point of optimism supporting its stock was that the company is committed to return 75% of its free cash flow in the form of distributions. We believed the company’s healthy balance sheet and efficient production would likely continue to drive performance and keep its earnings in line with market expectations. In our view, the company’s cash yield of approximately 15% also remained attractive. However, given a more scrutinized operating environment for exploration and production companies along with potential political intervention, in the context of the entirety of the Fund’s portfolio, we opted to sell the position, taking profits. |
| Healthcare services provider CVS Health provided updated earnings guidance in January 2022 that was meaningfully higher than its prior guidance and consensus expectations. The raised guidance came before its fourth quarter 2021 earnings announcement and followed the strong momentum of its third quarter 2021 results. Its earnings in the spring of 2022 reflected strength in the health care insurance business, though cost pressures and operating margins became a potential concern. It reaffirmed our investment thesis on the company, wherein we believe CVS Health will likely benefit from its transition to a healthcare enterprise, potentially driving faster growth. Despite the challenging operating environment and the roll-off of some COVID-19-driven business, success, in our view, can been seen in the company’s foundational business, accelerated by the strategy of its management. |
| Q | How did the Fund use derivatives and similar instruments during the Reporting Period? |
| A | During the Reporting Period, we did not use derivatives as part of an active management strategy. |
| Q | Did the Fund make any significant purchases or sales during the Reporting Period? |
| A | In addition to the purchase of Exxon Mobil, mentioned earlier, we initiated a Fund position in multinational information technology services and consulting company Accenture during the Reporting Period. We believe Accenture is a market leader and a well-managed company that should benefit in a robust demand environment. Further, we believe its stock was trading, at the time of purchase, at an attractive valuation given that the company had lagged comparable peers in the months prior and believe the market was underappreciating Accenture’s growth prospects. |
| Conversely, we trimmed the Fund’s position in media content provider Netflix during the Reporting Period. While we continued to like this company, we saw some near-term headwinds facing the business, such as increased competition and macroeconomic pressures. We also trimmed the Fund’s position in e-commerce behemoth Amazon.com during the Reporting Period. We remained constructive on its long-term growth prospects and its top-line revenue growth, but we also saw valuation concerns. In our view, there may be a trough in Amazon.com’s profitability in the remaining months of 2022, including the holiday season. |
| Q | Were there any changes to the Fund’s portfolio management team during the Reporting Period? |
| A | There were no changes to the Fund’s portfolio management team during the Reporting Period. |
| Q | Were there any notable changes in the Fund’s weightings during the Reporting Period? |
| A | In constructing the Fund’s portfolio, we focus on picking stocks rather than on making industry or sector bets. We seek to outpace the benchmark index by overweighting stocks that we expect to outperform and underweighting those that we think may lag. Consequently, changes in its sector weights are generally the direct result of individual stock selection or of stock appreciation or depreciation. That said, during the Reporting Period, relative to the Russell Index, the Fund’s allocation to financials increased, and its allocation to information technology decreased. |
| Q | How was the Fund positioned relative to its benchmark index at the end of August 2022? |
| A | At the end of August 2022, the Fund was overweight relative to the Russell Index in materials, was underweight relative to the Russell Index in consumer staples and financials, and was rather neutrally weighted to the remaining eight sectors in the Russell Index. |
15
FUND BASICS
Large Cap Core Fund
as of August 31, 2022
| TOP TEN HOLDINGS AS OF 8/31/221 | ||||||||
| Holding | % of Net Assets | Line of Business | ||||||
| Apple, Inc. | 6.2 | % | Technology Hardware, Storage & Peripherals | |||||
| Microsoft Corp. | 5.6 | Software | ||||||
| Amazon.com, Inc. | 2.8 | Internet & Direct Marketing Retail | ||||||
| Alphabet, Inc., Class A | 1.7 | Interactive Media & Services | ||||||
| Alphabet, Inc., Class C | 1.6 | Interactive Media & Services | ||||||
| UnitedHealth Group, Inc. | 1.5 | Health Care Providers & Services | ||||||
| JPMorgan Chase & Co. | 1.5 | Banks | ||||||
| CVS Health Corp. | 1.5 | Health Care Providers & Services | ||||||
| Bank of America Corp. | 1.4 | Banks | ||||||
| Exxon Mobil Corp. | 1.4 | Oil, Gas & Consumable Fuels | ||||||
| 1 | The top 10 holdings may not be representative of the Fund’s future investments. |
| FUND VS. BENCHMARK SECTOR ALLOCATION2 |
| As of August 31, 2022 |

| 2 | The Fund is actively managed and, as such, its composition may differ over time. Consequently, the Fund’s overall sector allocations may differ from the percentages contained in the graph above. Figures in the above graph may not sum to 100% due to the exclusion of other assets and liabilities. The graph categorizes investments using the Global Industry Classification Standard (“GICS”), however, the sector classifications used by the portfolio management team may differ from GICS. The percentage shown for each investment category reflects the value of investments in that category as a percentage of market value. The graph depicts the Fund’s investments but may not represent the Fund’s market exposure due to the exclusion of certain derivatives, if any, as listed in the Additional Investment Information section of the Schedule of Investments. |
For more information about the Fund, please refer to www.GSAMFUNDS.com. There, you can learn more about the Fund’s investment strategies, holdings, and performance.
16
LARGE CAP CORE FUND
Performance Summary
August 31, 2022
The following graph shows the value, as of August 31, 2022, of a $10,000 investment made on September 1, 2012 in Class A Shares at NAV (with the maximum sales charge of 5.50%). For comparative purposes, the performance of the Fund’s benchmark, the Russell 1000 Index (with dividends reinvested), is shown. Performance reflects applicable fee waivers and/or expense limitations in effect during the periods shown and in their absence, performance would be reduced. Returns do not reflect the deduction of taxes that a shareholder would pay on Fund distributions or the redemption of Fund shares. The returns set forth below represent past performance. Past performance does not guarantee future results. The Fund’s investment return and principal value will fluctuate so that an investor’s shares, when redeemed, may be worth more or less than their original cost. Current performance may be lower or higher than the performance quoted below. Please visit our web site at www.GSAMFUNDS.com to obtain the most recent month-end returns.
| Large Cap Core Fund’s 10 Year Performance |
Performance of a $10,000 Investment, including any applicable sales charges, with distributions reinvested, from September 1, 2012 through August 31, 2022.

| Average Annual Total Return through August 31, 2022* | One Year | Five Years | Ten Years | Since Inception | ||||||||
| Class A |
||||||||||||
| Excluding sales charges |
-15.37% | 11.63% | 12.80% | — | ||||||||
| Including sales charges |
-20.03% | 10.38% | 12.16% | — | ||||||||
|
| ||||||||||||
| Class C |
||||||||||||
| Excluding contingent deferred sales charges |
-16.04% | 10.81% | 11.96% | — | ||||||||
| Including contingent deferred sales charges |
-16.88% | 10.81% | 11.96% | — | ||||||||
|
| ||||||||||||
| Institutional |
-15.08% | 12.05% | 13.24% | — | ||||||||
|
| ||||||||||||
| Service |
-15.50% | 11.50% | 12.67% | — | ||||||||
|
| ||||||||||||
| Investor |
-15.16% | 11.91% | 13.08% | — | ||||||||
|
| ||||||||||||
| Class R6 (Commenced July 31, 2015) |
-15.07% | 12.07% | N/A | 11.24% | ||||||||
|
| ||||||||||||
| Class R |
-15.58% | 11.36% | 12.52% | — | ||||||||
|
| ||||||||||||
| Class P (Commenced April 17, 2018) |
-15.08% | N/A | N/A | 10.44% | ||||||||
|
| ||||||||||||
| * | These returns assume reinvestment of all distributions at NAV and reflect a maximum initial sales charge of 5.50% for Class A Shares and the assumed contingent deferred sales charge for Class C Shares (1% if redeemed within 12 months of purchase). Because Institutional, Service, Investor, Class P, Class R and Class R6 Shares do not involve a sales charge, such a charge is not applied to their Average Annual Total Return. |
17
PORTFOLIO RESULTS
Goldman Sachs Mid Cap Growth Fund
Portfolio Composition
At the start of the Reporting Period, the Fund sought to achieve its investment objective of seeking long-term growth of capital by investing, under normal circumstances, in companies that were considered by the Investment Advisor to be positioned for long-term growth, investing primarily in medium-sized growth companies. Effective after the close of business on April 13, 2022, the Fund seeks to achieve its investment objective of seeking long-term growth of capital by investing, under normal circumstances, at least 80% of its net assets plus any borrowings for investment purposes (measured at the time of purchase) (“Net Assets”) in a diversified portfolio of equity investments in mid-cap issuers. Mid-cap issuers are issuers with public stock market capitalizations (based upon shares available for trading on an unrestricted basis) within the range of the market capitalizations of companies constituting the Russell Midcap® Growth Index at the time of investment. Although the Fund invests primarily in publicly traded U.S. securities, it may invest up to 25% of its total assets in foreign securities, including securities of issuers in countries with emerging markets or economies (“emerging countries”) and securities quoted in foreign currencies. The Fund may also invest in privately held companies and companies that only recently began to trade publicly.
Portfolio Management Discussion and Analysis
Effective after the close of business on April 13, 2022, Goldman Sachs Growth Opportunities Fund was re-named Goldman Sachs Mid Cap Growth Fund and changes were made to its principal investment strategy. Below, the Goldman Sachs Fundamental Equity U.S. Equity Team discusses the Goldman Sachs Mid Cap Growth Fund’s (the “Fund”) performance and positioning for the 12-month period ended August 31, 2022 (the “Reporting Period”).
| Q | How did the Fund perform during the Reporting Period? |
| A | During the Reporting Period, the Fund’s Class A, Class C, Institutional, Service, Investor, Class R6, Class R and Class P Shares generated average annual total returns, without sales charges, of -25.93%, -26.40%, -25.69%, -26.06%, -25.79%, -25.69%, -26.10% and -25.68%, respectively. These returns compare to the -26.69% average annual total return of the Fund’s benchmark, the Russell Midcap® Growth Index (with dividends reinvested) (the “Russell Index”), during the same period. |
| Q | What key factors were responsible for the Fund’s performance during the Reporting Period? |
| A | While absolute returns disappointed, the Fund outperformed the Russell Index on a relative basis during the Reporting Period due primarily to stock selection overall. Sector allocation as a whole detracted modestly from relative performance. |
| Q | Which equity market sectors most significantly affected Fund performance? |
| A | The sectors that contributed most positively to the Fund’s relative performance during the Reporting Period were consumer staples, consumer discretionary and health care, wherein effective stock selection drove results. Having an overweight to consumer staples, which outperformed the Russell Index during the Reporting Period, and having an underweight to consumer discretionary, which underperformed the Russell Index during the Reporting Period, also boosted the Fund’s relative results. The sectors that detracted most from the Fund’s relative performance during the Reporting Period were materials, energy and financials. Stock selection proved especially challenging in the materials sector. Sector allocation positioning in energy and financials hurt most. |
| Q | What were some of the Fund’s best-performing individual stocks? |
| A | The Fund benefited most relative to the Russell Index from positions in ON Semiconductor, Palo Alto Networks and Pioneer Natural Resources. |
| ON Semiconductor engages in the design, manufacture and marketing of a portfolio of semiconductor components. The year 2021 was an impressive one for many semiconductor firms, and ON Semiconductor was a beneficiary. Its performance in the fourth quarter of 2021 was driven by a strong beat of consensus expectations and raised guidance on |
18
PORTFOLIO RESULTS
| earnings as well as by margins and top-line revenue growing organically amid ongoing supply-chain constraints. In June 2022, it was announced the company would be joining the S&P 500 Index, which drove its returns higher still. Strength in its results was also supported by strong performance in the auto and industrial end-markets. At the end of the Reporting Period, we continued to view the company as one of our favorite semiconductor names in the mid-cap universe. |
| A largely positive earnings report drove the stock of network security solutions provider Palo Alto Networks higher in late August 2021, just before the start of the Reporting Period. Accelerated billings growth and total revenue both saw better than consensus expected results unfold. Then, another largely positive earnings report drove the stock higher in late February 2022. Billing growth continued to accelerate on the back of its next generation security business, while its other business segments and customer expansion surprised on the upside as well. Further, in August 2022, the company posted its fiscal fourth quarter 2022 earnings, reporting billings growth ahead of guidance and consensus estimates. The strong results were driven by continued strength of its next generation security business. It had become evident to us that companies are increasing their demand for firewalls, as they scramble to protect their businesses and data from digital threats. At the end of the Reporting Period, we continued to believe Palo Alto Network’s strong pipeline will feed the business, and its recent management changes reflected the company’s focus on securing larger customers going forward while adding accretive incremental operating margin. |
| The strong performance of oil and gas exploration and production company Pioneer Natural Resources was supported by subdued oil production, high and improving demand, and new geopolitical tensions fueled by the war in Ukraine. Another point of optimism supporting its stock was that the company is committed to return 75% of its free cash flow in the form of distributions. We believed the company’s healthy balance sheet and efficient production would likely continue to drive performance and keep its earnings in line with market expectations. In our view, the company’s cash yield of approximately 15% also remained attractive. However, given a more scrutinized operating environment for exploration and production companies along with potential political intervention, in the context of the entirety of the Fund’s portfolio, we opted to sell the position, taking profits. |
| Q | Which stocks detracted significantly from the Fund’s performance during the Reporting Period? |
| A | Detracting most from the Fund’s results relative to the Russell Index were positions in DocuSign, Affirm Holdings and Guardant Health. |
| Cloud-based electronic signature solutions provider DocuSign reported strong third quarter 2021 earnings in November 2021, yet they were not as exceptional as investors had expected. Even though its billings had increased 28% year over year, the company missed its own estimates while also issuing fourth quarter 2021 guidance that was lower than consensus estimates. Further, the company reported earnings in line with estimates for the fourth quarter of 2021 but provided guidance that missed consensus estimates. It seemed DocuSign’s exceptional COVID-19 pandemic-fueled earnings may be slowing, so, ultimately, we exited the Fund’s position for what we saw as better risk/reward opportunities. |
| Financial technology company Affirm Holdings, a new purchase for the Fund during the Reporting Period, originally suffered during the Reporting Period from the widespread reversal away from high growth companies as interest rate hikes waned on valuations. Then, its shares declined following its fourth quarter 2021 earnings release in February 2022, which featured better than consensus revenue and gross merchandise value (“GMV”) results, but its forward guidance concerned investors with its management pointing out a potential step down in GMV results and elevated transaction costs. Regarding transaction costs, the company’s long-term target on revenue excluding these costs as a percentage of GMV had not changed, which we viewed as a favorable sign. However, the company struggled amid macroeconomic headwinds, such as record level inflation, rising interest rates and decreased consumer spending, which together raised concerns about subprime credit lending and profitability. We had established a Fund position in Affirm Holdings earlier in the Reporting Period and despite the firm’s strong earnings and exclusive partnership to grow its GMV, we ultimately sold the position in favor a what we saw as a better risk/reward opportunity. |
| Shares of Guardant Health, a precision oncology treatment company, depreciated during the fourth quarter of 2021 due to no particular fundamental driver. We continued to like the company, as it reported a solid quarterly result and provided positive updates on its research and development progress. However, in May 2022, a poor earnings report caused the stock to face significant pressures. Our investment thesis |
19
PORTFOLIO RESULTS
| became invalidated, and we ultimately decided to sell the name at that time to pursue what we viewed as more attractive investment opportunities. |
| Q | How did the Fund use derivatives and similar instruments during the Reporting Period? |
| A | During the Reporting Period, we did not use derivatives as part of an active management strategy. |
| Q | Did the Fund make any significant purchases or sales during the Reporting Period? |
| A | We initiated a Fund position in medical device manufacturing company DexCom during the Reporting Period. The company’s glucose monitoring systems are potentially considered best-in-class among comparable products, and its newest product, G7, was recently approved for use in Europe, with U.S. approval likely to come within the next year or so. |
| We re-established a Fund position in analytical laboratory instrument manufacturing company Mettler-Toledo International during the Reporting Period. The company had targeted toward increasing its growth in China for 2022, as it had a very limited COVID-19 revenue benefit, leading to no overhang of a revenue cliff. (A revenue, or patent, cliff is a colloquialism to denote the potential sharp decline in revenues upon patent expiration of one or more leading products of a firm. A patent cliff is when a firm’s revenues could “fall off a cliff” when one or more established products go off-patent, since these products can be replicated and sold at much cheaper prices by competitors.) We re-initiated the Fund’s position in the company on the pullback and intend to continue to look for opportunities to further rebuild the position. |
| Conversely, in addition to those sales mentioned earlier, we exited the Fund’s position in software solutions provider Splunk during the Reporting Period. While we still liked the company, we decided to allocate resources to what we considered to be more attractive risk/reward opportunities elsewhere. |
| Q | Were there any changes to the Fund’s portfolio management team during the Reporting Period? |
| A | There were no changes to the Fund’s portfolio management team during the Reporting Period. |
| Q | Were there any notable changes in the Fund’s weightings during the Reporting Period? |
| A | In constructing the Fund’s portfolio, we focus on picking stocks rather than on making industry or sector bets. We seek to outpace the benchmark index by overweighting stocks that we expect to outperform and underweighting those that we think may lag. Consequently, changes in its sector weights are generally the direct result of individual stock selection or of stock appreciation or depreciation. That said, during the Reporting Period, the Fund’s exposure to consumer discretionary, health care, industrials and real estate increased and its allocations to communication services, consumer staples, information technology and materials decreased relative to the Russell Index. |
| Q | How was the Fund positioned relative to its benchmark index at the end of August 2022? |
| A | At the end of August 2022, the Fund had overweighted positions relative to the Russell Index in the health care and industrials sectors. On the same date, the Fund had underweighted positions compared to the Russell Index in information technology, consumer discretionary, financials and communication services. The Fund was rather neutrally weighted to the Index in consumer staples, energy, materials and real estate and had no position at all in utilities at the end of the Reporting Period. |
20
FUND BASICS
Mid Cap Growth Fund
as of August 31, 2022
| TOP TEN HOLDINGS AS OF 8/31/221 | ||||||||
| Holding | % of Net Assets | Line of Business | ||||||
| Cadence Design Systems, Inc. | 3.4 | % | Software | |||||
| Rockwell Automation, Inc. | 2.5 | Electrical Equipment | ||||||
| Insulet Corp. | 2.4 | Health Care Equipment & Supplies | ||||||
| Dexcom, Inc. | 2.3 | Health Care Equipment & Supplies | ||||||
| Keysight Technologies, Inc. | 2.2 | Electronic Equipment, Instruments & Components | ||||||
| Lululemon Athletica, Inc. | 2.2 | Textiles, Apparel & Luxury Goods | ||||||
| Veeva Systems, Inc., Class A | 2.1 | Health Care Technology | ||||||
| West Pharmaceutical Services, Inc. | 2.0 | Life Sciences Tools & Services | ||||||
| Etsy, Inc. | 2.0 | Internet & Direct Marketing Retail | ||||||
| Verisk Analytics, Inc. | 1.9 | Professional Services | ||||||
| 1 | The top 10 holdings may not be representative of the Fund’s future investments. |
| FUND VS. BENCHMARK SECTOR ALLOCATION2 |
| As of August 31, 2022 |
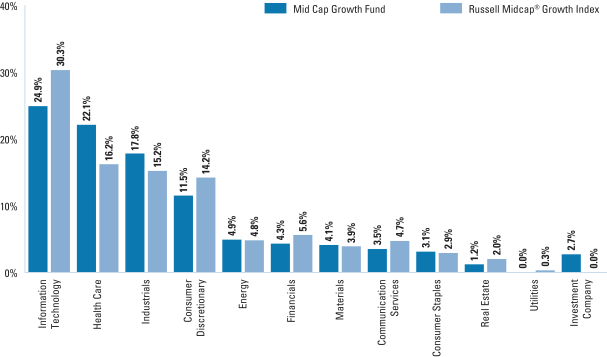
| 2 | The Fund is actively managed and, as such, its composition may differ over time. Consequently, the Fund’s overall sector allocations may differ from the percentages contained in the graph above. Figures in the above graph may not sum to 100% due to the exclusion of other assets and liabilities. The graph categorizes investments using the Global Industry Classification Standard (“GICS”), however, the sector classifications used by the portfolio management team may differ from GICS. The percentage shown for each investment category reflects the value of investments in that category as a percentage of market value. The graph depicts the Fund’s investments but may not represent the Fund’s market exposure due to the exclusion of certain derivatives, if any, as listed in the Additional Investment Information section of the Schedule of Investments. |
For more information about the Fund, please refer to www.GSAMFUNDS.com. There, you can learn more about the Fund’s investment strategies, holdings, and performance.
21
GOLDMAN SACHS MID CAP GROWTH FUND
Performance Summary
August 31, 2022
The following graph shows the value, as of August 31, 2022, of a $1,000,000 investment made on September 1, 2012 in Institutional Shares at NAV. For comparative purposes, the performance of the Fund’s benchmark the Russell Midcap® Growth Index (with dividends reinvested), is shown. Performance reflects applicable fee waivers and/or expense limitations in effect during the periods shown and in their absence, performance would be reduced. Returns do not reflect the deduction of taxes that a shareholder would pay on Fund distributions or the redemption of Fund shares. The returns set forth below represent past performance. Past performance does not guarantee future results. The Fund’s investment return and principal value will fluctuate so that an investor’s shares, when redeemed, may be worth more or less than their original cost. Current performance may be lower or higher than the performance quoted below. Please visit our web site at www.GSAMFUNDS.com to obtain the most recent month-end returns.
| Mid Cap Growth Fund’s 10 Year Performance |
Performance of a $1,000,000 Investment, including any applicable sales charges, with distributions reinvested, from September 1, 2012 through August 31, 2022.
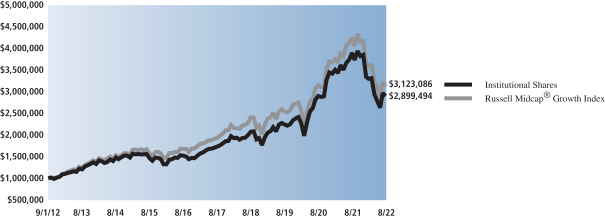
| Average Annual Total Return through August 31, 2022* | One Year | Five Years | Ten Years | Since Inception | ||||||||
| Class A |
||||||||||||
| Excluding sales charges |
-25.93% | 10.50% | 10.82% | — | ||||||||
| Including sales charges |
-30.00% | 9.25% | 10.20% | — | ||||||||
|
| ||||||||||||
| Class C |
||||||||||||
| Excluding contingent deferred sales charges |
-26.40% | 9.72% | 10.02% | — | ||||||||
| Including contingent deferred sales charges |
-26.58% | 9.72% | 10.02% | — | ||||||||
|
| ||||||||||||
| Institutional |
-25.69% | 10.87% | 11.23% | — | ||||||||
|
| ||||||||||||
| Service |
-26.06% | 10.32% | 10.67% | — | ||||||||
|
| ||||||||||||
| Investor |
-25.79% | 10.77% | 11.10% | — | ||||||||
|
| ||||||||||||
| Class R6 (Commenced July 31, 2015) |
-25.69% | 10.88% | N/A | 9.12% | ||||||||
|
| ||||||||||||
| Class R |
-26.10% | 10.23% | 10.55% | — | ||||||||
|
| ||||||||||||
| Class P (Commenced April 17, 2018) |
-25.68% | N/A | N/A | 9.31% | ||||||||
|
| ||||||||||||
| * | These returns assume reinvestment of all distributions at NAV and reflect a maximum initial sales charge of 5.50% for Class A Shares and the assumed contingent deferred sales charge for Class C Shares (1% if redeemed within 12 months of purchase). Because Institutional, Service, Investor, Class P, Class R and Class R6 Shares do not involve a sales charge, such a charge is not applied to their Average Annual Total Return. |
22
PORTFOLIO RESULTS
Goldman Sachs Small Cap Growth Fund
Portfolio Composition
The Fund invests, under normal circumstances, at least 80% of its net assets plus any borrowings for investment purposes (measured at the time of purchase) (“Net Assets”) in a diversified portfolio of equity investments in small-cap issuers. Small-cap issuers are issuers with public stock market capitalizations (based upon shares available for trading on an unrestricted basis) within the range of the market capitalizations of companies constituting the Russell 2000® Growth Index at the time of investment. As of August 31, 2022, the capitalization range of the companies in the Russell 2000® Growth Index was between $17 million and $10.659 billion. The Fund seeks to achieve its investment objective of seeking long-term growth of capital by investing, under normal circumstances, in companies that are considered by the Investment Adviser to be positioned for long-term growth. Although the Fund invests primarily in publicly traded U.S. securities, it may invest up to 25% of its Net Assets in foreign securities, including securities of issuers in countries with emerging markets or economies (“emerging countries”) and securities quoted in foreign currencies. The Fund may also invest in privately held companies and companies that only recently began to trade publicly.
Portfolio Management Discussion and Analysis
Below, the Goldman Sachs Fundamental Equity U.S. Equity Team discusses the Goldman Sachs Small Cap Growth Fund’s (the “Fund”) performance and positioning for the 12-month period ended August 31, 2022 (the “Reporting Period”).
| Q | How did the Fund perform during the Reporting Period? |
| A | During the Reporting Period, the Fund’s Class A, Class C, Institutional, Investor, Class R6, Class R and Class P Shares generated average annual total returns, without sales charges, of -26.55%, -27.08%, -26.21%, -26.37%, -26.25%, -26.76% and -26.27%, respectively. These returns compare to the -25.26% average annual total return of the Fund’s benchmark, the Russell 2000® Growth Index (with dividends reinvested) (the “Russell Index”), during the same period. |
| Q | What key factors were responsible for the Fund’s performance during the Reporting Period? |
| A | The Fund underperformed the Russell Index on a relative basis during the Reporting Period due to sector allocation overall. Stock selection as a whole contributed positively to the Fund’s relative performance. |
| Q | Which equity market sectors most significantly affected Fund performance? |
| A | Having no exposure to energy, which was the strongest performing sector in the Russell Index during the Reporting Period, detracted most from the Fund’s relative results. Additionally, weak stock selection in the consumer discretionary and financials sectors detracted as did having an underweight to the financials sector, which outpaced the Russell Index during the Reporting Period. Largely offsetting these detractors was effective stock selection in the health care sector, which contributed positively. Having an overweight to industrials, which outperformed the Russell Index during the Reporting Period, and having an underweight to communication services, which was the weakest sector in the Russell Index during the Reporting Period, further boosted the Fund’s relative results. |
| Q | Which stocks detracted significantly from the Fund’s performance during the Reporting Period? |
| A | Those stocks detracting most from the Fund’s results relative to the Russell Index were positions in Domo, Quanterix and Pacific Biosciences of California. |
| Domo operates a cloud-based business intelligence platform in the U.S., Japan and internationally. Its platform digitally connects from the chief executive officer to the frontline employee with the people, data and systems in an organization, giving them access to real-time data and insights and allowing them to manage business from smartphones. Domo reported third quarter 2021 earnings that included higher than consensus expected revenues and year over year billing growth, but the company guided revenue and earnings lower than consensus expected for the quarter and for the full year ahead. The company’s second quarter 2022 results also drove its stock lower. For the second time in about three years, the company had a major sales hiccup, with the issue this time being its inability to get traction in |
23
PORTFOLIO RESULTS
| the enterprise side of its business. That led to a spike in representative (“rep”) turnover and a deficit in ramped reps, which led them to guide to significantly lower billings growth for the third quarter of 2022 and somewhat lower billings guidance as well. On the positive side, the corporate side of Domo’s business grew materially. At the end of the Reporting Period, Domo intended to begin the process of shifting more focus and reps to corporate from enterprise. |
| Quanterix is a biotechnology company that develops ultrasensitive biomarker detection for health care. The market reacted negatively to the company’s lower margins in the first quarter of 2022. Also, its second quarter 2022 earnings disappointed. The company announced it had assay quality issues in its consumables and consequently lower shipments to a large customer. Its consumables declined significantly due to manufacturing quality issues, which, in turn, hit gross margins dramatically. We exited the Fund’s position in Quanterix by the end of the Reporting Period. |
| Despite largely in-line with consensus estimates earnings announcements and having been a top performer for the Fund in the prior annual period, shares of Pacific Biosciences of California, a company developing a platform for genetic analysis, traded down during the Reporting Period due primarily to what appeared to be a competitive threat from Illumina. Investors were concerned Illumina might start impeding on what is known as the “long-read sequencing” portion of business even though, in fact, Illumina’s offering is not directly competitive to Pacific Biosciences of California. |
| Q | What were some of the Fund’s best-performing individual stocks? |
| A | Among those stocks the Fund benefited most from relative to the Russell Index were positions in Dutch Bros., Axcelis Technologies and iRhythm Technologies. |
| Dutch Bros., an operator and franchisor of drive-through coffee and beverage shops, had its Initial Public Offering in October 2021. Initially performing well, its stock was hurt in May 2022, as its management guided same-store sales lower due to macroeconomic headwinds affecting discretionary income and, notably for the drive-through chain, higher gas prices. However, its stock rebounded through the end of August 2022, when the company released strong second quarter 2022 earnings, including a higher than consensus expected top line and raised guidance. We sold the Fund’s position in Dutch Bros. by the end of the Reporting Period, taking profits. |
| Axcelis Technologies designs, manufactures and services ion implantation and other processing equipment used in the fabrication of semiconductor chips. Its shares rose in November 2021 after reporting its third quarter 2021 earnings, showing revenue that beat consensus expectations and guidance higher on revenues and margins. Following some subsequent volatility in the months that followed, its stock rallied again on the announcement toward the end of the Reporting Period on second quarter 2022 earnings in which revenues beat consensus expectations and margins expanded. |
| iRhythm Technologies, a new purchase for the Fund during the Reporting Period, is a digital healthcare company that develops biosensing technology built on cloud-based data analytics and machine learning. Early in the Reporting Period, its shares rose upon the announcement of third quarter 2021 results, including better than consensus expected revenue and earnings before interest, taxes, depreciation and amortization. Then, in April 2022, the market reacted positively to the results of three clinical research studies iRhythm presented at the American College of Cardiology’s Scientific Session & Expo. These studies further validated its Zio service as a viable solution for the early detection of atrial fibrillation, helping undiagnosed populations effectively seek treatment before more serious problems arise. |
| Q | How did the Fund use derivatives and similar instruments during the Reporting Period? |
| A | During the Reporting Period, we did not use derivatives as part of an active management strategy. |
| Q | Did the Fund make any significant purchases or sales during the Reporting Period? |
| A | In addition to the purchase of iRhythm Technologies, already mentioned, we initiated a Fund position in ExlService Holdings, an operations and business management company within the information technology services industry, during the Reporting Period. We added the name in anticipation of the broadening of its business out to digital transformation and security from its focus on financials and insurance. |
| We established a Fund position during the Reporting Period in Shoals Technologies Group, which provides electrical balance of system solutions for solar energy projects. We like the company given its exposure to the secularly growing area of solar power as well as for what we see as its strong revenue growth and durable margins. We added the position |
24
PORTFOLIO RESULTS
| to the Fund’s portfolio upon its addition to the Russell Index at the annual reconstitution of the Russell Index in June 2022. |
| Conversely, in addition to those sales mentioned earlier, we exited the Fund’s position in FIGS, a direct to consumer health care apparel and lifestyle brand, during the Reporting Period. We sold the position given our concerns related to the demand outlook amid macroeconomic headwinds and a potential trade down from its customer base. |
| We sold the Fund’s position in Nautilus Biotechnology, which operates as a life sciences company. The firm develops proteomics platforms for analyzing and quantifying the human proteome. We eliminated the position and reallocated the capital to what we considered better risk/reward opportunities elsewhere. |
| Q | Were there any changes to the Fund’s portfolio management team during the Reporting Period? |
| A | There were no changes to the Fund’s portfolio management team during the Reporting Period. |
| Q | Were there any notable changes in the Fund’s weightings during the Reporting Period? |
| A | In constructing the Fund’s portfolio, we focus on picking stocks rather than on making industry or sector bets. We seek to outpace the benchmark index by overweighting stocks that we expect to outperform and underweighting those that we think may lag. Consequently, changes in its sector weights are generally the direct result of individual stock selection or of stock appreciation or depreciation. That said, during the Reporting Period, the Fund’s exposure to health care, consumer staples, real estate and energy increased and its allocations to information technology and industrials decreased relative to the Russell Index. |
| Q | How was the Fund positioned relative to its benchmark index at the end of August 2022? |
| A | At the end of August 2022, the Fund had overweighted positions relative to the Russell Index in the industrials, information technology, consumer discretionary and consumer staples sectors. On the same date, the Fund had underweighted positions compared to the Russell Index in energy, communication services, real estate and materials. The Fund was rather neutrally weighted to the Russell Index in health care and financials and had no position at all in utilities at the end of the Reporting Period. |
25
FUND BASICS
Small Cap Growth Fund
as of August 31, 2022
| TOP TEN HOLDINGS AS OF 8/31 /221 | ||||||||||
| Holding | % of Net Assets | Line of Business | Country | |||||||
| AAON, Inc. | 2.3 | % | Building Products | United States | ||||||
| Badger Meter, Inc. | 2.1 | Electronic Equipment, Instruments & Components | United States | |||||||
| RBC Bearings, Inc. | 2.1 | Machinery | United States | |||||||
| Watts Water Technologies, Inc., Class A | 1.9 | Machinery | United States | |||||||
| Balchem Corp. | 1.8 | Chemicals | United States | |||||||
| Axonics, Inc. | 1.7 | Health Care Equipment & Supplies | United States | |||||||
| Chart Industries, Inc. | 1.7 | Machinery | United States | |||||||
| Ashland, Inc. | 1.7 | Chemicals | United States | |||||||
| ExlService Holdings, Inc. | 1.7 | IT Services | United States | |||||||
| Ameresco, Inc., Class A | 1.6 | Construction & Engineering | United States | |||||||
| 1 | The top 10 holdings may not be representative of the Fund’s future investments. |
| FUND VS. BENCHMARK SECTOR ALLOCATION2 |
| As of August 31, 2022 |

| 2 | The Fund is actively managed and, as such, its composition may differ over time. Consequently, the Fund’s overall sector allocations may differ from the percentages contained in the graph above. Figures in the above graph may not sum to 100% due to the exclusion of other assets and liabilities. The graph categorizes investments using the Global Industry Classification Standard (“GICS”), however, the sector classifications used by the portfolio management team may differ from GICS. The percentage shown for each investment category reflects the value of investments in that category as a percentage of market value. The graph depicts the Fund’s investments but may not represent the Fund’s market exposure due to the exclusion of certain derivatives, if any, as listed in the Additional Investment Information section of the Schedule of Investments. |
For more information about the Fund, please refer to www.GSAMFUNDS.com. There, you can learn more about the Fund’s investment strategies, holdings, and performance.
26
GOLDMAN SACHS SMALL CAP GROWTH FUND
Performance Summary
August 31, 2022
The following graph shows the value, as of August 31, 2022, of a $1,000,000 investment made on October 31, 2019 (commencement of operations) in Institutional Shares at NAV. For comparative purposes, the performance of the Fund’s benchmark, the Russell 2000® Growth Index (with dividends reinvested), is shown. Performance reflects applicable fee waivers and/or expense limitations in effect during the periods shown and in their absence, performance would be reduced. Returns do not reflect the deduction of taxes that a shareholder would pay on Fund distributions or the redemption of Fund shares. The returns set forth below represent past performance. Past performance does not guarantee future results. The Fund’s investment return and principal value will fluctuate so that an investor’s shares, when redeemed, may be worth more or less than their original cost. Current performance may be lower or higher than the performance quoted below. Please visit our web site at www.GSAMFUNDS.com to obtain the most recent month-end returns.
| Small Cap Growth Fund’s Lifetime Performance |
Performance of a $1,000,000 Investment, including any applicable sales charges, with distributions reinvested, from October 31, 2019 through August 31, 2022.

| Average Annual Total Return through August 31, 2022* | One Year | Since Inception | ||||||
| Class A (Commenced October 31, 2019) |
||||||||
| Excluding sales charges |
-26.55% | 10.79% | ||||||
| Including sales charges |
-30.57% | 8.60% | ||||||
|
|
||||||||
| Class C (Commenced October 31, 2019) |
||||||||
| Excluding contingent deferred sales charges |
-27.08% | 9.96% | ||||||
| Including contingent deferred sales charges |
-27.81% | 9.95% | ||||||
|
|
||||||||
| Institutional (Commenced October 31, 2019) |
-26.21% | 11.22% | ||||||
|
|
||||||||
| Investor (Commenced October 31, 2019) |
-26.37% | 11.05% | ||||||
|
|
||||||||
| Class R6 (Commenced October 31, 2019) |
-26.25% | 11.22% | ||||||
|
|
||||||||
| Class R (Commenced October 31, 2019) |
-26.76% | 10.50% | ||||||
|
|
||||||||
| Class P (Commenced October 31, 2019) |
-26.27% | 11.19% | ||||||
|
|
||||||||
| * | These returns assume reinvestment of all distributions at NAV and reflect a maximum initial sales charge of 5.50% for Class A Shares and the assumed contingent deferred sales charge for Class C Shares (1% if redeemed within 12 months of purchase). Because Institutional, Investor, Class P, Class R and Class R6 Shares do not involve a sales charge, such a charge is not applied to their Average Annual Total Return. |
27
PORTFOLIO RESULTS
Goldman Sachs Small/Mid Cap Growth Fund
Portfolio Composition
The Fund seeks to achieve its investment objective of seeking long-term growth of capital by investing, under normal circumstances, at least 80% of its net assets plus any borrowings for investment purposes (“Net Assets”) in a diversified portfolio of equity investments in small- and mid-cap issuers. Small- or mid-cap issuers are issuers with public stock capitalizations within the outside range of the market capitalizations of companies constituting the Russell 2000 Growth Index and the Russell Midcap Growth Index. As of August 31, 2022, the outside capitalization range of the companies in these indexes was between $17 million and $52.942 billion. Although the Fund invests primarily in publicly traded U.S. securities, it may invest up to 25% of its Net Assets in foreign securities, including securities of issuers in countries with emerging markets or economies and securities quoted in foreign currencies.
Portfolio Management Discussion and Analysis
Below, the Goldman Sachs Fundamental Equity U.S. Equity Team discusses the Goldman Sachs Small/Mid Cap Growth Fund’s (the “Fund”) performance and positioning for the 12-month period ended August 31, 2022 (the “Reporting Period”).
| Q | How did the Fund perform during the Reporting Period? |
| A | During the Reporting Period, the Fund’s Class A, Class C, Institutional, Service, Investor, Class R6, Class R and Class P Shares generated average annual total returns, without sales charges, of -29.64%, -30.18%, -29.42%, -29.78%, -29.47%, -29.41%, -29.82% and -29.41%, respectively. These returns compare to the -25.68% average annual total return of the Fund’s benchmark, the Russell 2500® Growth Index (with dividends reinvested) (the “Russell Index”), during the same period. |
| Q | What key factors were responsible for the Fund’s performance during the Reporting Period? |
| A | The Fund underperformed the Russell Index on a relative basis during the Reporting Period due to a combination of stock selection and sector allocation positioning overall. |
| Q | Which equity market sectors most significantly affected Fund performance? |
| A | Challenging stock selection in the information technology and consumer discretionary sectors detracted from the Fund’s relative results most during the Reporting Period. Having an underweighted allocation to energy, which was the best performing sector in the Russell Index during the Reporting Period, also hurt. Only partially offsetting these detractors was effective stock selection in the health care and materials sectors, which contributed positively. Having an overweight to materials, which outpaced the Russell Index during the Reporting Period, and having an underweight to communication services, which was the weakest sector in the Russell Index during the Reporting Period, also buoyed the Fund’s relative results. |
| Q | Which stocks detracted significantly from the Fund’s performance during the Reporting Period? |
| A | Those stocks detracting most from the Fund’s results relative to the Russell Index were positions in Guardant Health, AZEK and Enphase Energy. |
| Shares of Guardant Health, a precision oncology treatment company, depreciated during the fourth quarter of 2021 due to no particular fundamental driver. Its fourth quarter 2021 earnings, reported in the first quarter of 2022, were largely in line with consensus estimates, but its stock traded down in late February/early March on more conservative guidance and uncertainty surrounding testing volumes in the year ahead. The stock remained under pressure through the remainder of the Reporting Period, including May 2022 when a poor earnings report caused the stock to face significant pressures. Inconsistent test orders by biopharmaceutical customers exacerbated its weakness. |
| AZEK engages in designing, manufacturing and selling building products for residential, commercial and industrial markets in the U.S. Despite relatively solid earnings data amid inflationary and margin pressures, AZEK came under pressure and traded down along with broad weakness in homebuilders and construction-related companies, resulting from economic headwinds and pressure on consumer wallets. |
28
PORTFOLIO RESULTS
| Enphase Energy is a global energy management technology company that provides residential and commercial solar plus storage solutions. We had sold the Fund’s position in Enphase Energy in January 2022 and in so doing missed out on the stock’s positive returns in the remaining months of the Reporting Period. The stock performed well on the back of positive news for residential solar names related to a U.S. Department of Commerce anti-circumvention investigation in April 2022 and a solid second quarter 2022 earnings release in July. |
| Q | What were some of the Fund’s best-performing individual stocks? |
| A | Among those stocks the Fund benefited most from relative to the Russell Index were positions in Molina Healthcare, Ashland and RBC Bearings. |
| Molina Healthcare engages in the provision of health care services. It operates through the health plans and “other” segments of the sector. The health plans segment consists of health plans in 11 states and in Puerto Rico and includes direct delivery business. The “other” segment includes the historical results of the Medicaid management information systems (“MMIS”) and behavioral health subsidiaries. Molina Healthcare reported modestly better third quarter 2021 revenues as well as earnings per share in line with consensus expectations. Also, membership was modestly ahead of consensus expectations, and the company raised its fiscal year 2021 guidance. The company then released a solid second quarter 2022 earnings report in July 2022 showing continued strength in Medicaid volumes and premiums. Higher premium revenue also reflected the impact of acquisitions. Guidance was increased, and membership grew, driven by Medicaid programs. |
| Ashland is a global specialty chemicals company that engages in the manufacture and distribution of adhesives, architectural coatings and more. In the face of rising prices and inflation, Ashland was able to effectively raise prices, preserving its margins. |
| RBC Bearings manufactures and markets engineered precision bearings and components. Its stock rose strongly in August 2022 as the market reacted positively to the company’s earnings release, which showed solid organic growth and strong sales, despite margin contraction and reduced guidance. |
| Q | How did the Fund use derivatives and similar instruments during the Reporting Period? |
| A | During the Reporting Period, we did not use derivatives as part of an active management strategy. |
| Q | Did the Fund make any significant purchases or sales during the Reporting Period? |
| A | We initiated a Fund position in BJ’s Wholesale Club Holdings during the Reporting Period in light of anticipated increased pressure on consumer wallets as a result of macroeconomic headwinds. We believe this wholesale retailer is poised to benefit from market conditions given its value proposition. We further believe it may be shielded from the negative effects of a weaker economy given its customer base’s higher household income relative to some of its peers. |
| We established a Fund position in Paylocity Holding in February 2022. Paylocity Holding provides cloud-based payroll and human capital management software solutions for medium-sized organizations. We favored the company based on what we viewed as its strong top-line growth in the payroll/human capital management space with solid free cash flow and earnings before interest, taxes, depreciation and amortization margins. We also felt the company has a best-in-class product suite along with strong up-sell and cross-sell potential. We further believe payroll/human capital management options will become front of mind again as firms seek to attract and retain talent. |
| Conversely, in addition to the sale of Enphase Energy mentioned earlier, we exited the Fund’s position in FIGS, a direct-to-consumer health care apparel and lifestyle brand, during the Reporting Period. We sold the position given our concerns related to the demand outlook amid macroeconomic headwinds and a potential trade down from its customer base. |
| We sold the Fund’s hedging position in aerospace and space company Virgin Galactic Holdings in October 2021. The company had a significant position in the Russell Index — which was the impetus for the hedge, but as its weight decreased in the Russell Index, the need for the hedge was eliminated. |
| Q | Were there any changes to the Fund’s portfolio management team during the Reporting Period? |
| A | There were no changes to the Fund’s portfolio management team during the Reporting Period. |
29
PORTFOLIO RESULTS
| Q | Were there any notable changes in the Fund’s weightings during the Reporting Period? |
| A | In constructing the Fund’s portfolio, we focus on picking stocks rather than on making industry or sector bets. We seek to outpace the benchmark index by overweighting stocks that we expect to outperform and underweighting those that we think may lag. Consequently, changes in its sector weights are generally the direct result of individual stock selection or of stock appreciation or depreciation. That said, during the Reporting Period, the Fund’s exposure to industrials, financials, consumer staples, communication services, energy and real estate increased and its allocations to information technology and consumer discretionary decreased relative to the Russell Index. |
| Q | How was the Fund positioned relative to its benchmark index at the end of August 2022? |
| A | At the end of August 2022, the Fund had overweighted position relative to the Russell Index in the industrials and information technology sectors. On the same date, the Fund had underweighted positions compared to the Russell Index in financials, consumer discretionary, energy and real estate. The Fund was rather neutrally weighted to the Russell Index in health care, materials, consumer staples and communication services and had no position at all in utilities at the end of the Reporting Period. |
30
FUND BASICS
Small/Mid Cap Growth Fund
as of August 31, 2022
| TOP TEN HOLDINGS AS OF 8/31/221 | ||||||||
| Holding | % of Net Assets | Line of Business | ||||||
| RBC Bearings, Inc. | 2.0 | % | Machinery | |||||
| Ashland, Inc. | 2.0 | Chemicals | ||||||
| BJ’s Wholesale Club Holdings, Inc. | 1.9 | Food & Staples Retailing | ||||||
| Paylocity Holding Corp. | 1.8 | Software | ||||||
| Nordson Corp. | 1.8 | Machinery | ||||||
| Lattice Semiconductor Corp. | 1.7 | Semiconductors & Semiconductor Equipment | ||||||
| Tetra Tech, Inc. | 1.7 | Commercial Services & Supplies | ||||||
| Neurocrine Biosciences, Inc. | 1.7 | Biotechnology | ||||||
| Jacobs Solutions, Inc. | 1.7 | Professional Services | ||||||
| RPM International, Inc. | 1.7 | Chemicals | ||||||
| 1 | The top 10 holdings may not be representative of the Fund’s future investments. |
| FUND VS. BENCHMARK SECTOR ALLOCATION2 |
| As of August 31, 2022 |

| 2 | The Fund is actively managed and, as such, its composition may differ over time. Consequently, the Fund’s overall sector allocations may differ from the percentages contained in the graph above. Figures in the above graph may not sum to 100% due to the exclusion of other assets and liabilities. The graph categorizes investments using the Global Industry Classification Standard (“GICS”), however, the sector classifications used by the portfolio management team may differ from GICS. The percentage shown for each investment category reflects the value of investments in that category as a percentage of market value. The graph depicts the Fund’s investments but may not represent the Fund’s market exposure due to the exclusion of certain derivatives, if any, as listed in the Additional Investment Information section of the Schedule of Investments. |
For more information about the Fund, please refer to www.GSAMFUNDS.com. There, you can learn more about the Fund’s investment strategies, holdings, and performance.
31
GOLDMAN SACHS SMALL/MID CAP GROWTH FUND
Performance Summary
August 31, 2022
The following graph shows the value, as of August 31, 2022, of a $1,000,000 investment made on September 1, 2012 in Institutional Shares at NAV. For comparative purposes, the performance of the Fund’s benchmark, the Russell 2500® Growth Index (with dividends reinvested), is shown. Performance reflects applicable fee waivers and/or expense limitations in effect during the periods shown and in their absence, performance would be reduced. Returns do not reflect the deduction of taxes that a shareholder would pay on Fund distributions or the redemption of Fund shares. The returns set forth below represent past performance. Past performance does not guarantee future results. The Fund’s investment return and principal value will fluctuate so that an investor’s shares, when redeemed, may be worth more or less than their original cost. Current performance may be lower or higher than the performance quoted below. Please visit our web site at www.GSAMFUNDS.com to obtain the most recent month-end returns.
| Small/Mid Cap Growth Fund’s 10 Year Performance |
Performance of a $1,000,000 Investment, including any applicable sales charges, with distributions reinvested, from September 1, 2012 through August 31, 2022.

| Average Annual Total Return through August 31, 2022* | One Year | Five Years | Ten Years | Since Inception | ||||||||
| Class A |
||||||||||||
| Excluding sales charges |
-29.64% | 11.22% | 11.92% | — | ||||||||
| Including sales charges |
-33.52% | 9.97% | 11.30% | — | ||||||||
|
| ||||||||||||
| Class C |
||||||||||||
| Excluding contingent deferred sales charges |
-30.18% | 10.39% | 11.09% | — | ||||||||
| Including contingent deferred sales charges |
-30.88% | 10.39% | 11.09% | — | ||||||||
|
| ||||||||||||
| Institutional |
-29.42% | 11.59% | 12.33% | — | ||||||||
|
| ||||||||||||
| Service |
-29.78% | 11.04% | 11.76% | — | ||||||||
|
| ||||||||||||
| Investor |
-29.47% | 11.50% | 12.20% | — | ||||||||
|
| ||||||||||||
| Class R6 (Commenced July 31, 2015) |
-29.41% | 11.60% | N/A | 8.85% | ||||||||
|
| ||||||||||||
| Class R |
-29.82% | 10.95% | 11.64% | — | ||||||||
|
| ||||||||||||
| Class P (Commenced April 17, 2018) |
-29.41% | N/A | N/A | 9.64% | ||||||||
|
| ||||||||||||
| * | These returns assume reinvestment of all distributions at NAV and reflect a maximum initial sales charge of 5.50% for Class A Shares and the assumed contingent deferred sales charge for Class C Shares (1% if redeemed within 12 months of purchase). Because Institutional, Service, Investor, Class P, Class R and Class R6 Shares do not involve a sales charge, such a charge is not applied to their Average Annual Total Return. |
32
PORTFOLIO RESULTS
Goldman Sachs Strategic Growth Fund
Portfolio Composition
The Fund invests primarily in U.S. equity investments. The Fund seeks to achieve its investment objective of seeking long-term growth of capital by investing, under normal circumstances, in companies that are considered by the Investment Adviser to be positioned for long-term growth. The Fund’s fundamental equity growth investment process involves evaluating potential investments based on specific characteristics believed to indicate a high quality business with sustainable growth including strong business franchises, favorable long-term prospects and excellent management.
Portfolio Management Discussion and Analysis
Below, the Goldman Sachs Fundamental Equity U.S. Equity Team discusses the Goldman Sachs Strategic Growth Fund’s (the “Fund”) performance and positioning for the 12-month period ended August 31, 2022 (the “Reporting Period”).
| Q | How did the Fund perform during the Reporting Period? |
| A | During the Reporting Period, the Fund’s Class A, Class C, Institutional, Service, Investor, Class R6, Class R and Class P Shares generated average annual total returns, without sales charges, of -25.42%, -25.97%, -25.16%, -25.59%, -25.18%, -25.09%, -25.57% and -25.12%, respectively. These returns compare to the -19.06% average annual total return of the Fund’s benchmark, the Russell 1000® Growth Index (with dividends reinvested) (the “Russell Index”), during the same period. |
| Q | What key factors were responsible for the Fund’s performance during the Reporting Period? |
| A | The Fund underperformed the Russell Index on a relative basis during the Reporting Period, attributable primarily to stock selection overall. Sector allocation as a whole also detracted from relative performance, albeit more modestly. |
| Q | Which equity market sectors most significantly affected Fund performance? |
| A | Challenging stock selection in information technology, consumer discretionary and communication services detracted from the Fund’s relative performance most during the Reporting Period. Allocation positioning in communication services also hurt. Only partially offsetting these detractors was effective stock selection in industrials and financials, the only two sectors to contribute positively to the Fund’s relative results during the Reporting Period. |
| Q | Which stocks detracted significantly from the Fund’s performance during the Reporting Period? |
| A | The stocks detracting most from the Fund’s results relative to the Russell Index were PayPal Holdings, Snap and Netflix. |
| Shares of digital payment technology company PayPal Holdings initially declined during the Reporting Period amid rumors the company was looking to acquire Pinterest, though PayPal Holdings ultimately decided the move would be too difficult to accomplish. Further, the company’s earnings report in November 2021 exceeded consensus expectations on earnings per share, but revenue fell below consensus expectations. The lesser volumes were caused by lower than consensus expected back-to-school spending along with a travel slowdown due to the COVID-19 variants. Its shares then depreciated following the company’s fourth quarter 2021 earnings announcement, wherein they issued disappointing forward guidance amid supply-chain issues, inflation, labor shortages and weaker consumer sentiment. The company’s stock depreciated further in the second quarter of 2022, as there were longer-term market share concerns with lowered revenue growth and operating margins adjusted downward, and the concerns of the prior quarter remained overhangs. At the end of the Reporting Period, we maintained our conviction in the company, as, in our view, it has the resources and capability to continue to grow its core customer base as it focuses on user engagement. As a scaled player in the payment industry, we believed PayPal Holdings was well positioned to leverage its existing customer base to implement any new payment technology. Also, we believed its strong balance sheet should allow it to either develop new technology, such as “buy now, pay later,” in house or to acquire an existing player within the industry. |
| Snap is a social media and camera company that develops and provides applications and products for communication. A broader impact of supply-chain shortages and Apple’s IDFA erosion weighed on advertiser demand, ultimately |
33
PORTFOLIO RESULTS
| driving Snap’s quarterly earnings results lower. (The Identifier for Advertisers (“IDFA”) is a random device identifier assigned by Apple to a user’s device. Advertisers use this to track data so they can deliver customized advertising. The IDFA is used for tracking and identifying a user without revealing personal information.) Then, after issuing guidance that contradicted previous revenue and profit targets in May 2022, the company’s stock suffered a substantial pullback, as investors were uneasy about macroeconomic pressures facing the company. The company announced a disappointing quarter, as it saw increased competition for advertising dollars and macroeconomic headwinds. The company illustrated a slowdown in the advertising market and did not provide a guide for the third calendar quarter. However, the company had strong engagement trends and daily active user growth, and the longer-term goal of artificial reality and maps monetization remained intact. At the end of the Reporting Period, we continued to believe user growth and engagement were still positive, and we expected new products to drive higher revenue. Longer term, we believed Snap remained well situated to take incremental share of digital ad dollars, as it continued to drive user engagement with innovative features and has a strong management team, in our view, committed to execution. Furthermore, its shares depreciated due to no company-specific news but rather due to a broad and abrupt market reversal from high growth names to value due to concerns around rising interest rates, which, in turn, drove losses across the technology industry. |
| Shares of media content provider Netflix depreciated in November 2021 after announcing its free suite of mobile games for existing Netflix users. The stock dropped further at the end of the month after European telecommunications Chief Executive Officers released a joint statement saying that major U.S. technology companies need to help fund network costs being caused by their platforms’ traffic. Its stock price declined again in January 2022 on a disappointing miss of consensus estimates on subscriber numbers in the fourth quarter of 2021, and the company cut its first quarter 2022 guidance for new customers as streaming competition mounted challenges. Then, in April 2022, its stock price declined further after the company reported earnings, revealing it had lost 200,000 subscribers in that first quarter of 2022 and expected to lose more in the second calendar quarter. While we continued to like the company, we saw some near-term headwinds facing the business, such as increased competition and macroeconomic pressures. We sold the position in favor what we considered to be better risk/reward profiles elsewhere, but we intend to keep monitoring the company for a longer-term opportunity. |
| Q | What were some of the Fund’s best-performing individual stocks? |
| A | Those stocks the Fund benefited most from relative to the Russell Index were positions in Union Pacific, Eli Lilly and Company and Argenx. |
| Shares of railroad and freight transportation services provider Union Pacific appreciated in October 2021, highlighted by a largely positive earnings release against a challenging operating backdrop. Its management did lower its guidance as a result of ongoing weakness in auto carloads due to chip shortages and pressure on network fluidity. In late January 2022, the company reported operating results slightly above consensus expectations, driven by better yields. Increasing fuel prices were a slight headwind to the business, though it also served as a tailwind for the broader rail industry as it offered a cheaper shipping alternative compared to trucking. Strength in the coal business also was a byproduct of these conditions. In March 2022, Union Pacific’s shares rallied along with the broader industry. At the end of the Reporting Period, we remained optimistic about Union Pacific’s long-term opportunity to gain intermodal market share for rails relative to trucking. We were also constructive about intermodal pricing gains as well as margin improvement opportunities when near-term supply-chain challenges begin to subside and system fluidity improves. |
| Eli Lilly and Company develops and manufactures pharmaceutical products. Its earnings results in the first quarter of 2022 beat consensus estimates by three cents with adjusted quarterly earnings of $2.49 per share, while its revenue beat consensus forecasts as well. These results were boosted by a jump in sales of the company’s Trulicity diabetes drug and COVID-19 therapies. Eli Lilly and Company was able to achieve 10% growth outside of its COVID-19 work and saw more than 60% of its revenues in the fourth quarter of 2021 coming from its “growth brand” of pharmaceutical products. Also, five new medicines were on deck to launch during the next two years. In August 2022, its earnings report featured a slight miss compared to consensus expectations, but the company maintained its full-year guidance and announced that all its drug launches remained on track. At the end of the Reporting Period, we continued to view Eli Lilly and Company as one of the fastest growing pharmaceuticals companies with no major patent concerns until 2030 and a robust new product pipeline with multi-billion dollar opportunities ahead. |
34
PORTFOLIO RESULTS
| Global immunology company Argenx was a new purchase for the Fund during the Reporting Period. Its stock gained strength, as the Committee for Medicinal Products for Human Use (“CHMP”) gave a positive opinion and then authorized the use of Argenx’s Vyvgart, used to treat a disease called myasthenia gravis. (The CHMP is the committee for the European Medicines Agency that is responsible for preparing opinions on questions concerning human medicines.) Argenx subsequently reported a strong first quarter of 2022 based on the Vyvgart launch, with sales of $21 million, well above consensus estimates of $6 million. At the end of the Reporting Period, we remained constructive on the company, as patient starts were robust for the ongoing launch of Vyvgart, and the company, in our view, seemed well positioned to continue to support the growth trajectory of its business. |
| Q | How did the Fund use derivatives and similar instruments during the Reporting Period? |
| A | During the Reporting Period, we did not use derivatives as part of an active management strategy. |
| Q | Did the Fund make any significant purchases or sales during the Reporting Period? |
| A | In addition to the purchase of Argenx mentioned earlier, we established a Fund position in health care and insurance company UnitedHealth Group during the Reporting Period. We believe the company should benefit from its recent acquisition of health care provider EMIS, as it should provide synergy opportunities and increase product exposure in the U.K. We also believe in Optum’s robust growth strategy, as it generated strong double-digit sales during the Reporting Period and provides geographical diversification. (Optum, the fastest growing part of UnitedHealth Group, is a leading information and technology-enabled health services business.) Overall, we are constructive on the managed care organization portion of the health care sector and believe the company is well positioned to execute ahead of consensus expectations. |
| We initiated a Fund position in multinational information technology services and consulting company Accenture during the Reporting Period. We believe Accenture is a market leader and a well-managed company that should benefit in a robust demand environment. Further, we believe its stock was trading, at the time of purchase, at an attractive valuation given that the company had lagged comparable peers in the months prior and believe the market was underappreciating Accenture’s growth prospects. |
| Conversely, in addition to the sale of Netflix, already mentioned, we exited the Fund’s position in social media company Meta Platforms during the Reporting Period. The company, formerly known as Facebook, has struggled with macroeconomic headwinds as rising interest rates and inflation have impacted the company’s profitability. In response, the firm strategically froze hiring and cut expenses for the near term to preserve operating profits. Despite the company’s capital intensive investments within the metaverse space, we ultimately decided to sell the position in favor of what we saw as better risk/reward opportunities. |
| Q | Were there any changes to the Fund’s portfolio management team during the Reporting Period? |
| A | There were no changes to the Fund’s portfolio management team during the Reporting Period. |
| Q | Were there any notable changes in the Fund’s weightings during the Reporting Period? |
| A | In constructing the Fund’s portfolio, we focus on picking stocks rather than on making industry or sector bets. We seek to outpace the benchmark index by overweighting stocks that we expect to outperform and underweighting those that we think may lag. Consequently, changes in its sector weights are generally the direct result of individual stock selection or of stock appreciation or depreciation. That said, during the Reporting Period, the Fund’s exposure to consumer discretionary and information technology increased and its allocation to communication services decreased relative to the Russell Index. |
| Q | How was the Fund positioned relative to its benchmark index at the end of August 2022? |
| A | At the end of August 2022, the Fund had overweighted allocations relative to the Russell Index in health care and materials and underweighted positions compared to the Russell Index in financials, industrials and communication services. The Fund was rather neutrally weighted in the consumer discretionary, consumer staples, information technology and real estate sectors of the Russell Index and had no positions at all in utilities and energy at the end of the Reporting Period. |
35
FUND BASICS
Strategic Growth Fund
as of August 31, 2022
| TOP TEN HOLDINGS AS OF 8/31/221 | ||||||||
| Holding | % of Net Assets | Line of Business | ||||||
| Apple, Inc. | 13.3 | % | Technology Hardware, Storage & Peripherals | |||||
| Microsoft Corp. | 10.6 | Software | ||||||
| Amazon.com, Inc. | 6.5 | Internet & Direct Marketing Retail | ||||||
| Tesla, Inc. | 3.4 | Automobiles | ||||||
| Alphabet, Inc., Class A | 2.9 | Interactive Media & Services | ||||||
| Alphabet, Inc., Class C | 2.7 | Interactive Media & Services | ||||||
| Mastercard, Inc., Class A | 2.7 | IT Services | ||||||
| NVIDIA Corp. | 2.4 | Semiconductors & Semiconductor Equipment | ||||||
| UnitedHealth Group, Inc. | 2.4 | Health Care Providers & Services | ||||||
| Eli Lilly & Co. | 2.1 | Pharmaceuticals | ||||||
| 1 | The top 10 holdings may not be representative of the Fund’s future investments. |
| FUND VS. BENCHMARK SECTOR ALLOCATION2 |
| As of August 31, 2022 |
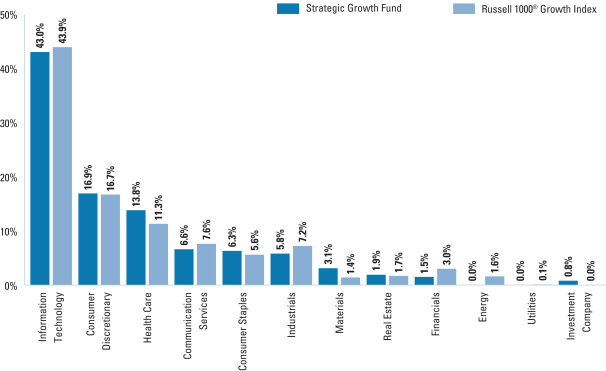
| 2 | The Fund is actively managed and, as such, its composition may differ over time. Consequently, the Fund’s overall sector allocations may differ from the percentages contained in the graph above. Figures in the above graph may not sum to 100% due to the exclusion of other assets and liabilities. The graph categorizes investments using the Global Industry Classification Standard (“GICS”), however, the sector classifications used by the portfolio management team may differ from GICS. The percentage shown for each investment category reflects the value of investments in that category as a percentage of market value. The graph depicts the Fund’s investments but may not represent the Fund’s market exposure due to the exclusion of certain derivatives, if any, as listed in the Additional Investment Information section of the Schedule of Investments. |
For more information about the Fund, please refer to www.GSAMFUNDS.com. There, you can learn more about the Fund’s investment strategies, holdings, and performance.
36
GOLDMAN SACHS STRATEGIC GROWTH FUND
Performance Summary
August 31, 2022
The following graph shows the value, as of August 31, 2022, of a $1,000,000 investment made on September 1, 2012 in Institutional Shares at NAV. For comparative purposes, the performance of the Fund’s benchmark, the Russell 1000® Growth Index (with dividends reinvested), is shown. Performance reflects applicable fee waivers and/or expense limitations in effect during the periods shown and in their absence, performance would be reduced. Returns do not reflect the deduction of taxes that a shareholder would pay on Fund distributions or the redemption of Fund shares. The returns set forth below represent past performance. Past performance does not guarantee future results. The Fund’s investment return and principal value will fluctuate so that an investor’s shares, when redeemed, may be worth more or less than their original cost. Current performance may be lower or higher than the performance quoted below. Please visit our web site at www.GSAMFUNDS.com to obtain the most recent month-end returns.
| Strategic Growth Fund’s 10 Year Performance |
Performance of a $1,000,000 Investment, including any applicable sales charges, with distributions reinvested, from September 1, 2012 through August 31, 2022.
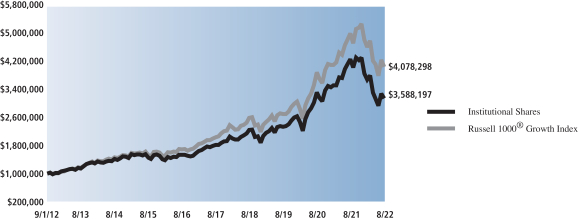
| Average Annual Total Return through August 31, 2022* | One Year | Five Years | Ten Years | Since Inception | ||||||||
| Class A |
||||||||||||
| Excluding sales charges |
-25.42% | 12.38% | 13.18% | — | ||||||||
| Including sales charges |
-29.54% | 11.12% | 12.55% | — | ||||||||
|
| ||||||||||||
| Class C |
||||||||||||
| Excluding contingent deferred sales charges |
-25.97% | 11.54% | 12.33% | — | ||||||||
| Including contingent deferred sales charges |
-26.41% | 11.54% | 12.33% | — | ||||||||
|
| ||||||||||||
| Institutional |
-25.16% | 12.80% | 13.62% | — | ||||||||
|
| ||||||||||||
| Service |
-25.59% | 12.24% | 13.05% | — | ||||||||
|
| ||||||||||||
| Investor |
-25.18% | 12.67% | 13.46% | — | ||||||||
|
| ||||||||||||
| Class R6 (Commenced July 31, 2015) |
-25.09% | 12.84% | N/A | 11.81% | ||||||||
|
| ||||||||||||
| Class R |
-25.57% | 12.10% | 12.92% | — | ||||||||
|
| ||||||||||||
| Class P (Commenced April 17, 2018) |
-25.12% | N/A | N/A | 11.28% | ||||||||
|
| ||||||||||||
| * | These returns assume reinvestment of all distributions at NAV and reflect a maximum initial sales charge of 5.50% for Class A Shares and the assumed contingent deferred sales charge for Class C Shares (1% if redeemed within 12 months of purchase). Because Institutional, Service, Investor, Class P, Class R and Class R6 Shares do not involve a sales charge, such a charge is not applied to their Average Annual Total Return. |
37
PORTFOLIO RESULTS
Goldman Sachs Technology Opportunities Fund
Portfolio Composition
The Fund invests, under normal circumstances, at least 80% of its net assets plus any borrowing for investment purposes (measured at time of purchase) in equity investments in technology companies. The Fund seeks to achieve its investment objective of long-term growth of capital by investing, under normal circumstances, in companies that are considered by the Investment Adviser to benefit from the proliferation of technology. Although the Fund invests primarily in publicly traded U.S. securities, it may invest up to 25% of its total assets measured at the time of purchase in foreign securities, including securities of issuers in countries with emerging markets or economies and securities quoted in foreign currencies. The Fund may also invest in privately held companies and companies that only recently began to trade publicly.
Portfolio Management Discussion and Analysis
Below, the Goldman Sachs Fundamental Equity U.S. Equity Team discusses the Goldman Sachs Technology Opportunities Fund’s (the “Fund”) performance and positioning for the 12-month period ended August 31, 2022 (the “Reporting Period”).
| Q | How did the Fund perform during the Reporting Period? |
| A | During the Reporting Period, the Fund’s Class A, Class C, Institutional, Service, Investor, Class R6 and Class P Shares generated average annual total returns, without sales charges, of -29.60%, -30.13%, -29.38%, -29.76%, -29.42%, -29.38% and -29.38%, respectively. These returns compare to the -21.99% average annual total return of the Fund’s benchmark, the NASDAQ Composite Total Return Index (the “NASDAQ Composite”), during the same period. |
| Q | What key factors were responsible for the Fund’s performance during the Reporting Period? |
| A | The Fund underperformed the NASDAQ Composite on a relative basis during the Reporting Period due primarily to stock selection overall. Sector allocation positioning as a whole contributed positively to relative performance. |
| Q | Which equity market sectors most significantly affected Fund performance? |
| A | As both the Fund and the NASDAQ Composite have the majority of their respective assets allocated to the information technology sector, broad equity market sector performance generally does not have a meaningful impact on relative performance. That said, weak stock selection within the information technology and consumer discretionary sectors detracted most from the Fund’s relative results during the Reporting Period. Having no exposure to consumer staples, which outperformed the NASDAQ Composite Index during the Reporting Period, further dampened relative results. These detractors were partially offset by effective stock selection in the real estate sector, which contributed positively. Having no exposure to the health care sector, which underperformed the NASDAQ Composite Index during the Reporting Period, also helped. |
| Q | Which stocks detracted significantly from the Fund’s performance during the Reporting Period? |
| A | Detracting most from the Fund’s results relative to the NASDAQ Composite were positions in Apple, Snap and PayPal Holdings. |
| Information technology behemoth Apple was a top detractor from relative returns during the Reporting Period because of the Fund’s underweighted position in this strongly performing stock. In January 2022, its stock rallied after Apple reported a strong quarter due to iPhone sales and service revenues coming in better than it expected. The Fund was underweight Apple, as we believed the upcoming iPhone cycle would be more muted than the market was expecting and because we had concerns about the prospects ahead for its services businesses given the possibility of app store regulation and friction around the search relationship. |
| Snap is a social media and camera company that develops and provides applications and products for communication. A broader impact of supply-chain shortages and Apple’s IDFA erosion weighed on advertiser demand, ultimately driving Snap’s quarterly earnings results lower. (The Identifier for Advertisers (“IDFA”) is a random device identifier assigned by Apple to a user’s device. Advertisers |
38
PORTFOLIO RESULTS
| use this to track data so they can deliver customized advertising. The IDFA is used for tracking and identifying a user without revealing personal information.) Then, after issuing guidance that contradicted previous revenue and profit targets in May 2022, the company’s stock suffered a substantial pullback, as investors were uneasy about macroeconomic pressures facing the company. The company announced a disappointing quarter, as it saw increased competition for advertising dollars and macroeconomic headwinds. The company illustrated a slowdown in the advertising market and did not provide a guide for the third calendar quarter. However, the company had strong engagement trends and daily active user growth, and the longer-term goal of artificial reality and maps monetization remained intact. At the end of the Reporting Period, we continued to believe user growth and engagement were still positive, and we expected new products to drive higher revenue. Longer term, we believed Snap remained well situated to take incremental share of digital ad dollars, as it continued to drive user engagement with innovative features and has a strong management team, in our view, committed to execution. Furthermore, its shares depreciated due to no company-specific news but rather due to a broad and abrupt market reversal from high growth names to value due to concerns around rising interest rates, which, in turn, drove losses across the technology industry. |
| Shares of digital payment technology company PayPal Holdings initially declined during the Reporting Period amid rumors the company was looking to acquire Pinterest, though PayPal Holdings ultimately decided the move would be too difficult to accomplish. Further, the company’s earnings report in November 2021 exceeded consensus expectations on earnings per share, but revenue fell below consensus expectations. The lesser volumes were caused by lower than consensus expected back-to-school spending along with a travel slowdown due to the COVID-19 variants. Its shares then depreciated following the company’s fourth quarter 2021 earnings announcement, wherein they issued disappointing forward guidance amid supply-chain issues, inflation, labor shortages and weaker consumer sentiment. The company’s stock depreciated further in the second quarter of 2022, as there were longer-term market share concerns with lowered revenue growth and operating margins adjusted downward, and the concerns of the prior quarter remained overhangs. At the end of the Reporting Period, we maintained our conviction in the company, as, in our view, it has the resources and capability to continue to grow its core customer base as it focuses on user engagement. As a scaled player in the payment industry, we believed PayPal Holdings was well positioned to leverage its existing customer base to implement any new payment technology. Also, we believed its strong balance sheet should allow it to either develop new technology, such as “buy now, pay later,” in house or to acquire an existing player within the industry. |
| Q | What were some of the Fund’s best-performing individual stocks? |
| A | Those stocks the Fund benefited most from relative to the NASDAQ Composite were positions in Palo Alto Networks, Meta Platforms and KLA. |
| A largely positive earnings report drove the stock of network security solutions provider Palo Alto Networks higher in late August 2021, just before the start of the Reporting Period. Accelerated billings growth and total revenue both saw better than consensus expected results unfold. Then, another largely positive earnings report drove its stock higher in late February 2022. Billing growth continued to accelerate on the back of its next generation security business, while its other business segments and customer expansion surprised on the upside as well. Further, in August 2022, the company posted its fiscal fourth quarter 2022 earnings, reporting billings growth ahead of guidance and consensus estimates. The strong results were driven by continued strength of its next generation security business. It has become evident to us that companies are increasing their demand for firewalls, as they scramble to protect their businesses and data from digital threats. At the end of the Reporting Period, we continued to believe Palo Alto Network’s strong pipeline will feed the business, and its recent management changes reflected the company’s focus on securing larger customers going forward while adding accretive incremental operating margin. |
| Meta Platforms engages in the development of social media applications. The company, formerly known as Facebook, was a top contributor to relative results because the Fund held an underweighted position in this weakly-performing stock during the Reporting Period. In February 2022, the company announced materially lowered forward guidance. Issues of concerns included social media competition/engagement, introduction of Reels to compete with TikTok with limited traction, and IDFA concerns as it related to pending regulations being imposed. (The Identifier for Advertisers (“IDFA”) is a random device identifier assigned by Apple to a user’s device. Advertisers use this to track data so they can deliver customized advertising. The IDFA is used for tracking and identifying a user without revealing personal |
39
PORTFOLIO RESULTS
| information.) At the end of the Reporting Period, the Fund maintained a position in Meta Platforms because we believed the company has an attractive valuation and is focusing its efforts on different new devices to diversify and enter new markets. We were also optimistic the company will continue what we view as its attractive operating margins and that the broader industry has positive tailwinds. However, a fair amount of uncertainty remained surround the future prospects of Meta Platforms. As such, we trimmed the Fund’s position in Meta Platforms during the Reporting Period. We had exited the position completely earlier in the Reporting Period but then reinitiated the position in August 2022, encouraged by some Reels traction and cost saving efforts by the company and based on our view it was trading at an attractive valuation. |
| KLA, a semiconductor equipment company, reported a solid beat of consensus expectations and raised its forward guidance in May 2022. This came at a time when its semiconductor equipment peers were guiding their revenues lower due to supply-chain concerns. Even though supply-chain challenges persisted, KLA benefitted from both strong execution and a rather simplistic supply chain given that its business is focused on process control equipment, which scans wafers and semiconductors for imperfections — as compared to its peers who are more diversified. At the end of the Reporting Period, we viewed KLA as the market leader in its space, as it controls approximately 60% of its market and has, in our opinion, a world-class, efficient process to detect wafer defects. |
| Q | How did the Fund use derivatives and similar instruments during the Reporting Period? |
| A | During the Reporting Period, we did not use derivatives as part of an active management strategy. |
| Q | Did the Fund make any significant purchases or sales during the Reporting Period? |
| A | During the Reporting Period, we initiated a Fund position in Salesforce, a leading cloud-based software solutions provider for customer relationship management (“CRM”). We are positive on Salesforce because companies are increasing their information technology budgets to include CRM software, and, in our view, the company’s growth reflects this strong demand. We are also optimistic about the company’s integration of Slack, a workplace communication platform, and the synergies it may create going forward. Additionally, we believe Salesforce is likely to be a key beneficiary of growth in cloud software globally. |
| We established a Fund position in multinational semiconductor company Analog Devices during the Reporting Period. We believe the company’s leadership position in analog semiconductors could benefit from the acceleration of 5G (fifth generation) buildout. In our view, strong end-market demand may continue to drive growth organically as the company expands its production capacity. Also, we believe the company’s use of capital favors equity holders given its history of returning free cash flow through stock buybacks and dividends. However, in June 2022, we exited the Fund’s position in Analog Devices after its stock reached our price target. Adhering to our strong valuation discipline, we decided to exit the Fund’s position and redeploy the capital into other semiconductor companies with what we saw as more compelling risk/reward profiles. |
| We exited the Fund’s position in financial services company Mastercard during the Reporting Period. The company has struggled from cross-border and geopolitical headwinds, even as it continued to see the number of transactions rising back to pre-pandemic levels. Further, the company had priced in a slowdown in Ukraine and had monitored COVID-19 infection rates and inflation as travel-related spending tends to skew toward credit. Despite promising recovery in cross-border transactions, we decided to sell the position in favor of another company within the payments industry. |
| Q | Were there any changes to the Fund’s portfolio management team during the Reporting Period? |
| A | There were no changes to the Fund’s portfolio management team during the Reporting Period. |
| Q | Were there any notable changes in the Fund’s weightings during the Reporting Period? |
| A | In constructing the Fund’s portfolio, we focus on picking stocks rather than on making industry or sector bets. We seek to outpace the benchmark index by overweighting stocks that we expect to outperform and underweighting those that we think may lag. Consequently, changes in its sector weights are generally the direct result of individual stock selection or of stock appreciation or depreciation. That said, during the Reporting Period, the Fund’s exposure to information technology and real estate increased relative to the NASDAQ Composite and its relative exposure to communication services decreased. |
40
PORTFOLIO RESULTS
| Q | How was the Fund positioned relative to its benchmark index at the end of August 2022? |
| A | At the end of August 2022, the Fund was overweighted relative to the NASDAQ Composite in the information technology and real estate sectors. On the same date, the Fund had underweighted exposure compared to the NASDAQ Composite in consumer discretionary, communication services and industrials. The Fund had no exposure to the utilities, materials, energy, health care, consumer staples or financials sectors at the end of the Reporting Period. |
41
FUND BASICS
Technology Opportunities Fund
as of August 31, 2022
| TOP TEN HOLDINGS AS OF 8/31/221 | ||||||||
| Holding | % of Net Assets | Line of Business | ||||||
| Microsoft Corp. | 12.0 | % | Software | |||||
| Amazon.com, Inc. | 8.6 | Internet & Direct Marketing Retail | ||||||
| Apple, Inc. | 5.4 | Technology Hardware, Storage & Peripherals | ||||||
| Alphabet, Inc., Class C | 4.7 | Interactive Media & Services | ||||||
| Adobe, Inc. | 4.0 | Software | ||||||
| American Tower Corp. REIT | 3.4 | Equity Real Estate Investment Trusts (REITs) | ||||||
| Accenture PLC, Class A | 3.3 | IT Services | ||||||
| Palo Alto Networks, Inc. | 3.1 | Software | ||||||
| KLA Corp. | 3.1 | Semiconductors & Semiconductor Equipment | ||||||
| Equinix, Inc. REIT | 2.8 | Equity Real Estate Investment Trusts (REITs) | ||||||
| 1 | The top 10 holdings may not be representative of the Fund’s future investments. |
| FUND VS. BENCHMARK SECTOR ALLOCATION2 |
| As of August 31, 2022 |
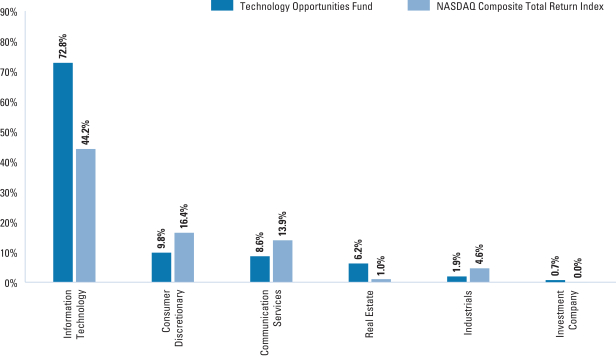
| 2 | The Fund is actively managed and, as such, its composition may differ over time. Consequently, the Fund’s overall sector allocations may differ from the percentages contained in the graph above. Figures in the above graph may not sum to 100% due to the exclusion of other assets and liabilities. The graph categorizes investments using the Global Industry Classification Standard (“GICS”), however, the sector classifications used by the portfolio management team may differ from GICS. The percentage shown for each investment category reflects the value of investments in that category as a percentage of market value. The graph depicts the Fund’s investments but may not represent the Fund’s market exposure due to the exclusion of certain derivatives, if any, as listed in the Additional Investment Information section of the Schedule of Investments. |
For more information about the Fund, please refer to www.GSAMFUNDS.com. There, you can learn more about the Fund’s investment strategies, holdings, and performance.
42
GOLDMAN SACHS TECHNOLOGY OPPORTUNITIES FUND
Performance Summary
August 31, 2022
The following graph shows the value as of August 31, 2022, of a $10,000 investment made on September 1, 2012 in Class A Shares at NAV (with the maximum sales charge of 5.50%). For comparative purposes, the performance of the Fund’s benchmark, the NASDAQ Composite Total Return Index, is shown. Performance reflects applicable fee waivers and/or expense limitations in effect during the periods shown and in their absence, performance would be reduced. Returns do not reflect the deduction of taxes that a shareholder would pay on Fund distributions or the redemption of Fund shares. The returns set forth below represent past performance. Past performance does not guarantee future results. The Fund’s investment return and principal value will fluctuate so that an investor’s shares, when redeemed, may be worth more or less than their original cost. Current performance may be lower or higher than the performance quoted below. Please visit our web site at www.GSAMFUNDS.com to obtain the most recent month-end returns.
| Technology Opportunities Fund’s 10 Year Performance |
Performance of a $10,000 Investment, including any applicable sales charges, with distributions reinvested, from September 1, 2012 through August 31, 2022.

| Average Annual Total Return through August 31, 2022* | One Year | Five Years | Ten Years | Since Inception | ||||||||
| Class A |
||||||||||||
| Excluding sales charges |
-29.60% | 13.41% | 14.82% | — | ||||||||
| Including sales charges |
-33.47% | 12.14% | 14.17% | — | ||||||||
|
| ||||||||||||
| Class C |
||||||||||||
| Excluding contingent deferred sales charges |
-30.13% | 12.58% | 13.97% | — | ||||||||
| Including contingent deferred sales charges |
-30.83% | 12.58% | 13.97% | — | ||||||||
|
| ||||||||||||
| Institutional |
-29.38% | 13.79% | 15.24% | — | ||||||||
|
| ||||||||||||
| Service |
-29.76% | 13.21% | 14.66% | — | ||||||||
|
| ||||||||||||
| Investor (Commenced September 30, 2010) |
-29.42% | 13.70% | 15.11% | — | ||||||||
|
| ||||||||||||
| Class R6 (Commenced December 29, 2017) |
-29.38% | N/A | N/A | 13.25% | ||||||||
|
| ||||||||||||
| Class P (Commenced April 17, 2018) |
-29.38% | N/A | N/A | 11.53% | ||||||||
|
| ||||||||||||
| * | These returns assume reinvestment of all distributions at NAV and reflect a maximum initial sales charge of 5.50% for Class A Shares and the assumed contingent deferred sales charge for Class C Shares (1% if redeemed within 12 months of purchase). Because Institutional, Service, Investor, Class R6 and Class P Shares do not involve a sales charge, such a charge is not applied to their Average Annual Total Return. |
43
PORTFOLIO RESULTS
Goldman Sachs U.S. Equity ESG Fund
Portfolio Composition
The Fund invests, under normal circumstances, at least 80% of its net assets plus any borrowings for investment purposes (measured at the time of purchase) (“Net Assets”) in a diversified portfolio of equity investments of U.S. issuers that Goldman Sachs Asset Management, L.P. (the “Investment Adviser”) believes adhere to the Fund’s environmental, social and governance (“ESG”) criteria. Such equity investments may include exchange-traded funds (“ETFs”), futures and other instruments with similar economic exposures. The Fund seeks to achieve its investment objective of long-term growth of capital by investing, under normal circumstances, in U.S. companies that are considered by the Investment Adviser to be positioned for long-term growth of capital. The Fund may also invest up to 20% of its Net Assets in equity investments that may not adhere to the Fund’s ESG criteria, in non-U.S. issuers, and in fixed income securities, such as government, corporate and bank debt obligations.
Portfolio Management Discussion and Analysis
Below, the Goldman Sachs Fundamental Equity U.S. Equity Team discusses the Goldman Sachs U.S. Equity ESG Fund’s (the “Fund”) performance and positioning for the 12-month period ended August 31. 2022 (the “Reporting Period”).
| Q | How did the Fund perform during the Reporting Period? |
| A | During the Reporting Period, the Fund’s Class A, Class C, Institutional, Investor, Class R6, Class R and Class P Shares generated average annual total returns, without sales charges, of -18.42%, -19.04%, -18.13%, -18.22%, -18.13%, -18.62% and -18.14%, respectively. These returns compare to the -11.23% average annual total return of the Fund’s benchmark, the Standard & Poor’s 500® Index (the “S&P 500 Index”), during the same period. |
| Q | What are the Fund’s investment criteria? |
| A | The Fund’s ESG criteria are generally designed to exclude companies that are involved in, and/or derive significant revenue from certain industries or product lines, including gambling, alcohol, tobacco, adult entertainment, for-profit prisons, oil and gas exploration and production, coal and weapons. Once the Investment Adviser determines that an issuer meets the Fund’s ESG criteria, the Investment Adviser conducts a supplemental analysis of individual companies’ corporate governance factors and a range of environmental and social factors that may vary by sector. This supplemental analysis is conducted alongside traditional fundamental, bottom-up financial analysis of individual companies, using traditional fundamental metrics. The Investment Adviser may engage in active dialogues with company management teams to further inform investment decision-making and to foster best corporate governance practices using its fundamental and ESG analysis. |
| The Investment Adviser may sell holdings for several reasons, including, among others, changes in a company’s fundamentals or earnings, a company no longer meeting the Fund’s ESG criteria, or a company otherwise failing to conform to the Investment Adviser’s investment philosophy. |
| The Fund seeks to provide broad U.S. equity market exposure by investing in securities of U.S. issuers of any investment style. |
| The Fund’s performance benchmark index is the S&P 500 Index. |
| Q | What key factors were responsible for the Fund’s performance during the Reporting Period? |
| A | The Fund underperformed the S&P 500 Index on a relative basis during the Reporting Period due primarily to stock selection overall. Sector allocation as a whole also detracted from relative performance. |
| Q | Which equity market sectors most significantly affected Fund performance? |
| A | The sector that detracted most from the Fund’s relative performance was energy, as the Fund held no exposure to this most strongly performing sector in the S&P 500 Index during the Reporting Period. Also, weak stock selection in the consumer discretionary and materials sectors dampened the Fund’s relative results. Only partially offsetting these detractors was stock selection in the health care, communication services and real estate sectors, which contributed positively. |
44
PORTFOLIO RESULTS
| Q | Which stocks detracted significantly from the Fund’s performance during the Reporting Period? |
| A | Those stocks detracting most from the Fund’s results relative to the S&P 500 Index were positions in Affirm Holdings, Etsy and Ball. |
| Financial technology company Affirm Holdings originally suffered during the Reporting Period from the widespread reversal away from high growth companies as interest rate hikes waned on valuations. Then, its shares declined following its fourth quarter 2021 earnings release in February 2022, which featured better than consensus revenue and gross merchandise value (“GMV”) results, but its forward guidance concerned investors with its management pointing out a potential step down in GMV results and elevated transaction costs. Regarding transaction costs, the company’s long-term target on revenue excluding these costs as a percentage of GMV had not changed, which we viewed as a favorable sign. However, the company struggled amid macroeconomic headwinds, such as record level inflation, rising interest rates and decreased consumer spending, which together raised concerns about subprime credit lending and profitability. We had established a Fund position in Affirm Holdings earlier in the Reporting Period and despite the firm’s strong earnings and exclusive partnership to grow its GMV, we ultimately sold the position in favor a what we saw as a better risk/reward opportunity. |
| Sales of global online marketplace operator Etsy declined during the Reporting Period, as more customers elected to defer purchases on the platform given the weakening macroenvironment and rising inflation. Still, we believed Etsy’s platform was better positioned than the broader retail industry and its stock was overpunished by the market. As other retailers continued to build inventory levels to protect from supply-chain issues, they then faced an abundance of supply, which benefits Etsy’s off-price model, in our opinion. We believe this model also tends to do well in recessionary periods. At the end of the Reporting Period, we believed the company continued to have a compelling cash flow profile and had reached a point where its valuation was compelling. |
| Shares of metal packaging provider Ball performed well in the late part of 2021 based on strong performance reports, but its first quarter 2022 earnings report missed consensus expectations. The miss was mostly driven by an approximately 21% volume decline in its Latin American business due to flooding in the region. Also, its earnings report released in early August 2022 featured surprisingly weak results due to a sizeable slowdown in its Americas business, as consumers came under cost pressures. At the end of the Reporting Period, our longer-term investment thesis for Ball remained intact, as we continued to see a multi-year growth story for aluminum products, for which Ball should be a primary beneficiary. |
| Q | What were some of the Fund’s best-performing individual stocks? |
| A | The Fund benefited most relative to the S&P 500 Index from positions in Wolfspeed, Humana and CVS Health. |
| Shares of semiconductor company Wolfspeed fluctuated similarly to the broader semiconductor industry, with strong performance at the end of 2021 and then supply-chain concerns driving the stock down early in 2022. Its most positive results came in August 2022 with revenues, gross margins and forward guidance all surpassing consensus expectations. With auto electrification continuing to happen at an earlier and steeper pace than many had anticipated, we believed at the end of the Reporting Period that Wolfspeed was well positioned to capitalize on the opportunity. |
| Shares of health insurance services provider Humana fell by approximately 10% in early January 2022 when its net membership growth estimates for Medicare Advantage products were reduced significantly. However, its shares rebounded relatively quickly after this announcement, as its earnings results continued to surpass market expectations throughout the first eight months of 2022. At the end of the Reporting Period, we continued to view Humana as one of our preferred names within the health insurance industry. |
| Healthcare services provider CVS Health provided updated earnings guidance in January 2022 that was meaningfully higher than its prior guidance and consensus expectations. The raised guidance came before its fourth quarter 2021 earnings announcement and followed the strong momentum of its third quarter 2021 results. Its earnings in the spring of 2022 reflected strength in the health care insurance business, though cost pressures and operating margins became a potential concern. It reaffirmed our investment thesis on the company, wherein we believe CVS Health will likely benefit from its transition to a healthcare enterprise, potentially driving faster growth. Despite the challenging operating environment and the roll-off of some COVID-19-driven business, success, in our view, can been seen in the company’s foundational business, accelerated by the strategy of its management. |
45
PORTFOLIO RESULTS
| Q | How did the Fund use derivatives and similar instruments during the Reporting Period? |
| A | During the Reporting Period, we did not use derivatives as part of an active management strategy. |
| Q | Did the Fund make any significant purchases or sales during the Reporting Period? |
| A | We initiated a Fund position in Xylem, which designs and manufactures engineered technologies for the water industry, in July 2022. We believe the company aligns with our current view of the market cycle and that Xylem may be positioned for outsized margin improvement and top-line performance in comparison to its peers. |
| We established a Fund position in off-price retailer Ross Stores in July 2022. The optimism we held for off-price retailers in the last months of the Reporting Period was high, and we felt Ross Stores’ 100% domestic business was attractive relative to its peers. In addition, Ross Stores may be positioned, in our opinion, to take advantage of healthy deals in the marketplace and may also be able to ride market tailwinds to an improved revenue and margin outlook. |
| Conversely, we exited the Fund’s position in financial services company Visa in January 2022. We sold the company’s stock, as we believed alternative payment methods could drive long-term market share uncertainty. However, we intend to continue to monitor adoption trends in the “buy now, pay later” category and take that into account going forward. |
| We sold the Fund’s position in railroad and freight transportation services provider Union Pacific in April 2022. Our concerns heightened regarding network fluidity, as the risk for West Coast port disruptions increased. After our analysis, we decided to exit the position in favor of a competitor with what we considered to be a more attractive risk/reward opportunity. |
| Q | Were there any changes to the Fund’s portfolio management team during the Reporting Period? |
| A | There were no changes to the Fund’s portfolio management team during the Reporting Period. |
| Q | Were there any notable changes in the Fund’s weightings during the Reporting Period? |
| A | In constructing the Fund’s portfolio, we focus on picking stocks rather than on making industry or sector bets. We seek to outpace the benchmark index by overweighting stocks that we expect to outperform and underweighting those that we think may lag. Consequently, changes in its sector weights are generally the direct result of individual stock selection or of stock appreciation or depreciation. That said, during the Reporting Period, the Fund’s exposure to consumer discretionary, health care and industrials increased and its allocations to financials, information technology and materials decreased compared to the S&P 500 Index. |
| Q | How was the Fund positioned relative to its benchmark index at the end of August 2022? |
| A | At the end of August 2022, the Fund had overweighted positions relative to the S&P 500 Index in industrials, utilities, health care and materials. On the same date, the Fund had underweighted positions compared to the S&P 500 Index in information technology, consumer staples and financials and was rather neutrally weighted to the S&P 500 Index in consumer discretionary, communication services and real estate. The Fund had no position at all in energy at the end of the Reporting Period. |
46
FUND BASICS
U.S. Equity ESG Fund
as of August 31, 2022
| TOP TEN HOLDINGS AS OF 8/31/221 | ||||||||
| Holding | % of Net Assets | Line of Business | ||||||
| Microsoft Corp. | 7.0 | % | Software | |||||
| Apple, Inc. | 6.3 | Technology Hardware, Storage & Peripherals | ||||||
| Alphabet, Inc., Class A | 3.8 | Interactive Media & Services | ||||||
| NextEra Energy, Inc. | 3.3 | Electric Utilities | ||||||
| Procter & Gamble Co. (The) | 3.2 | Household Products | ||||||
| Eli Lilly & Co. | 3.1 | Pharmaceuticals | ||||||
| JPMorgan Chase & Co. | 3.1 | Banks | ||||||
| Danaher Corp. | 2.9 | Life Sciences Tools & Services | ||||||
| CVS Health Corp. | 2.7 | Health Care Providers & Services | ||||||
| American Tower Corp. REIT | 2.6 | Equity Real Estate Investment Trusts (REITs) | ||||||
| 1 | The top 10 holdings may not be representative of the Portfolio’s future investments. The top 10 holdings exclude investments in money market funds. |
| FUND VS. BENCHMARK SECTOR ALLOCATION2 |
| As of August 31, 2022 |

| 2 | The Fund is actively managed and, as such, its composition may differ over time. Consequently, the Fund’s overall sector allocations may differ from the percentages contained in the graph above. Figures in the above graph may not sum to 100% due to the exclusion of other assets and liabilities. The graph categorizes investments using the Global Industry Classification Standard (“GICS”), however, the sector classifications used by the portfolio management team may differ from GICS. The percentage shown for each investment category reflects the value of investments in that category as a percentage of market value. The graph depicts the Fund’s investments but may not represent the Fund’s market exposure due to the exclusion of certain derivatives, if any, as listed in the Additional Investment Information section of the Schedule of Investments. |
For more information about the Fund, please refer to www.GSAMFUNDS.com. There, you can learn more about the Fund’s investment strategies, holdings, and performance.
47
GOLDMAN SACHS U.S. EQUITY ESG FUND
Performance Summary
August 31, 2022
The following graph shows the value, as of August 31, 2022, of a $1,000,000 investment made on September 1, 2012 in Institutional Shares at NAV. For comparative purposes, the performance of the Fund’s benchmark, the S&P 500® Index (with dividends reinvested), is shown. Performance reflects applicable fee waivers and/or expense limitations in effect during the periods shown and in their absence, performance would be reduced. Returns do not reflect the deduction of taxes that a shareholder would pay on Fund distributions or the redemption of Fund shares. The returns set forth below represent past performance. Past performance does not guarantee future results. The Fund’s investment return and principal value will fluctuate so that an investor’s shares, when redeemed, may be worth more or less than their original cost. Current performance may be lower or higher than the performance quoted below. Please visit our web site at www.GSAMFUNDS.com to obtain the most recent month-end returns.
| U.S. Equity ESG Fund’s 10 Year Performance |
Performance of a $1,000,000 Investment, including any applicable sales charges, with distributions reinvested, from September 1, 2012 through August 31, 2022.
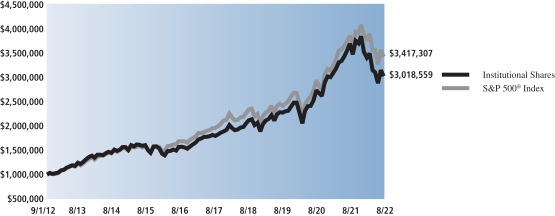
| Average Annual Total Return through August 31, 2022* | One Year | Five Years | Ten Years | Since Inception | ||||||||
| Class A |
||||||||||||
| Excluding sales charges |
-18.42% | 10.58% | 11.25% | — | ||||||||
| Including sales charges |
-22.91% | 9.35% | 10.62% | — | ||||||||
|
| ||||||||||||
| Class C |
||||||||||||
| Excluding contingent deferred sales charges |
-19.04% | 9.76% | 10.42% | — | ||||||||
| Including contingent deferred sales charges |
-19.85% | 9.76% | 10.42% | — | ||||||||
|
| ||||||||||||
| Institutional |
-18.13% | 10.98% | 11.67% | — | ||||||||
|
| ||||||||||||
| Investor |
-18.22% | 10.87% | 11.53% | — | ||||||||
|
| ||||||||||||
| Class R6 (Commenced July 31, 2015) |
-18.13% | 10.98% | N/A | 9.34% | ||||||||
|
| ||||||||||||
| Class R |
-18.62% | 10.31% | 10.99% | — | ||||||||
|
| ||||||||||||
| Class P (Commenced April 17, 2018) |
-18.14% | N/A | N/A | 10.40% | ||||||||
|
| ||||||||||||
| * | These returns assume reinvestment of all distributions at NAV and reflect a maximum initial sales charge of 5.50% for Class A Shares and the assumed contingent deferred sales charge for Class C Shares (1% if redeemed within 12 months of purchase). Because Institutional, Investor, Class P, Class R and Class R6 Shares do not involve a sales charge, such a charge is not applied to their Average Annual Total Return. |
48
FUND BASICS
Index Definitions
The S&P 500® Index is the Standard & Poor’s® 500 Composite Index of 500 stocks, an unmanaged index of common stock prices. The S&P 500® Index figures do not reflect any deduction for fees, expenses or taxes. It is not possible to invest directly in an index.
The Russell 3000® Index is a market capitalization weighted equity index maintained by the FTSE Russell that provides exposure to the entire U.S. stock market. The index tracks the performance of the 3,000 largest U.S.-traded stocks which represent about 98% of all U.S incorporated equity securities. It is not possible to invest directly in an index.
The Russell 1000® Index measures the performance of the large-cap segment of the U.S. equity universe. It includes those Russell 1000 Index companies with lower price-to-book ratios and lower expected growth values. The Russell 1000 Index is constructed to provide a comprehensive and unbiased barometer for the large-cap value segment. The Russell 1000 Index is completely reconstituted annually to ensure new and growing equities are included and that the represented companies continue to reflect value characteristics. It is not possible to invest directly in an index.
The Russell 1000® Growth Index is an unmanaged index that measures the performance of those Russell 1000® companies with higher price-to-book ratios and higher forecasted growth values. The Russell 1000® Growth Index figures do not reflect any deduction for fees, expenses or taxes. It is not possible to invest directly in an index.
The Russell Midcap® Growth Index is an unmanaged market capitalization weighted index that measures the performance of those Russell Midcap companies with higher price-to-book ratios and higher forecasted growth values. The Russell Midcap® Growth Index figures do not reflect any deduction for fees, expenses or taxes. It is not possible to invest directly in an index.
The Russell 2000® Growth Index is an unmanaged index of common stock prices that measures the performance of those Russell 2000 companies with higher price-to-book ratios and higher forecasted growth values. The Russell 2000® Growth Index figures do not reflect any deduction for fees, expenses or taxes. It is not possible to invest directly in an index.
The Russell 2500® Growth Index is an unmanaged index that measures the performance of the small to mid-cap growth segment of the US equity universe. The Russell 2500® Growth Index is constructed to provide a comprehensive and unbiased barometer of the small- to mid-cap growth market. Based on ongoing empirical research of investment manager behavior, the methodology used to determine growth probability approximates the aggregate small- to mid-cap growth manager’s opportunity set. The Russell 2500® Growth Index figures do not reflect any deduction for fees, expenses or taxes. It is not possible to invest directly in an index.
The NASDAQ Composite Index includes all domestic and international based common type stocks listed on The NASDAQ Stock Market. The NASDAQ Composite Index is a broad based Index. It is not possible to invest directly in an index.
49
GOLDMAN SACHS CONCENTRATED GROWTH FUND
August 31, 2022
| Shares |
Description | Value | ||||||
| Common Stocks – 99.4% | ||||||||
| Aerospace & Defense – 1.4% | ||||||||
| 12,438 | Boeing Co. (The)* | $ | 1,993,189 | |||||
|
|
|
|||||||
| Auto Components – 1.8% | ||||||||
| 28,516 | Aptiv PLC* | 2,664,250 | ||||||
|
|
|
|||||||
| Biotechnology – 4.8% | ||||||||
| 5,779 | Argenx SE ADR (Netherlands) * | 2,183,711 | ||||||
| 16,612 | BioMarin Pharmaceutical, Inc.* | 1,481,790 | ||||||
| 15,645 | Sarepta Therapeutics, Inc.* | 1,711,250 | ||||||
| 10,966 | Seagen, Inc.* | 1,691,944 | ||||||
|
|
|
|||||||
| 7,068,695 | ||||||||
|
|
|
|||||||
| Chemicals – 2.4% | ||||||||
| 14,928 | Sherwin-Williams Co. (The) | 3,464,789 | ||||||
|
|
|
|||||||
| Equity Real Estate Investment Trusts (REITs) – 2.6% | ||||||||
| 14,955 | American Tower Corp. REIT | 3,799,318 | ||||||
|
|
|
|||||||
| Food Products – 2.3% | ||||||||
| 39,155 | McCormick & Co., Inc. | 3,291,761 | ||||||
|
|
|
|||||||
| Health Care Equipment & Supplies – 5.2% | ||||||||
| 92,896 | Boston Scientific Corp.* | 3,744,638 | ||||||
| 7,555 | Insulet Corp.* | 1,930,076 | ||||||
| 9,351 | Intuitive Surgical, Inc.* | 1,923,874 | ||||||
|
|
|
|||||||
| 7,598,588 | ||||||||
|
|
|
|||||||
| Health Care Providers & Services – 1.7% | ||||||||
| 5,297 | Humana, Inc. | 2,551,989 | ||||||
|
|
|
|||||||
| Health Care Technology – 1.2% | ||||||||
| 9,133 | Veeva Systems, Inc., Class A* | 1,820,389 | ||||||
|
|
|
|||||||
| Hotels, Restaurants & Leisure – 2.6% | ||||||||
| 14,836 | McDonald’s Corp. | 3,742,826 | ||||||
|
|
|
|||||||
| Household Products – 1.9% | ||||||||
| 20,190 | Procter & Gamble Co. (The) | 2,785,009 | ||||||
|
|
|
|||||||
| Interactive Media & Services – 6.8% | ||||||||
| 41,391 | Alphabet, Inc., Class A* | 4,479,334 | ||||||
| 35,580 | Alphabet, Inc., Class C* | 3,883,557 | ||||||
| 151,322 | Snap, Inc., Class A* | 1,646,383 | ||||||
|
|
|
|||||||
| 10,009,274 | ||||||||
|
|
|
|||||||
| Internet & Direct Marketing Retail – 5.6% | ||||||||
| 52,640 | Amazon.com, Inc.* | 6,673,173 | ||||||
| 13,962 | Etsy, Inc.* | 1,474,527 | ||||||
|
|
|
|||||||
| 8,147,700 | ||||||||
|
|
|
|||||||
| IT Services – 8.9% | ||||||||
| 12,617 | Accenture PLC, Class A | 3,639,500 | ||||||
| 14,189 | Mastercard, Inc., Class A | 4,602,486 | ||||||
| 22,835 | PayPal Holdings, Inc.* | 2,133,702 | ||||||
| 14,684 | Snowflake, Inc., Class A* | 2,657,070 | ||||||
|
|
|
|||||||
| 13,032,758 | ||||||||
|
|
|
|||||||
| Life Sciences Tools & Services – 1.9% | ||||||||
| 10,546 | Danaher Corp. | 2,846,471 | ||||||
|
|
|
|||||||
| Common Stocks – (continued) | ||||||||
| Pharmaceuticals – 3.2% | ||||||||
| 15,720 | Eli Lilly & Co. | 4,735,335 | ||||||
|
|
|
|||||||
| Professional Services – 2.1% | ||||||||
| 16,623 | Verisk Analytics, Inc. | 3,111,161 | ||||||
|
|
|
|||||||
| Road & Rail – 1.4% | ||||||||
| 7,710 | Old Dominion Freight Line, Inc. | 2,092,571 | ||||||
|
|
|
|||||||
| Semiconductors & Semiconductor Equipment – 6.4% | ||||||||
| 6,984 | KLA Corp. | 2,403,404 | ||||||
| 68,774 | Marvell Technology, Inc. | 3,219,999 | ||||||
| 24,549 | NVIDIA Corp. | 3,705,426 | ||||||
|
|
|
|||||||
| 9,328,829 | ||||||||
|
|
|
|||||||
| Software – 17.0% | ||||||||
| 7,871 | Adobe, Inc.* | 2,939,346 | ||||||
| 8,029 | Atlassian Corp. PLC, Class A* | 1,988,462 | ||||||
| 16,079 | Bill.com Holdings, Inc.* | 2,602,869 | ||||||
| 59,305 | Microsoft Corp. | 15,506,478 | ||||||
| 11,260 | Workday, Inc., Class A* | 1,852,946 | ||||||
|
|
|
|||||||
| 24,890,101 | ||||||||
|
|
|
|||||||
| Specialty Retail – 3.3% | ||||||||
| 7,297 | RH* | 1,867,375 | ||||||
| 33,428 | Ross Stores, Inc. | 2,883,834 | ||||||
|
|
|
|||||||
| 4,751,209 | ||||||||
|
|
|
|||||||
| Technology Hardware, Storage & Peripherals – 11.1% | ||||||||
| 102,895 | Apple, Inc. | 16,177,152 | ||||||
|
|
|
|||||||
| Textiles, Apparel & Luxury Goods – 3.8% | ||||||||
| 7,411 | Lululemon Athletica, Inc.* | 2,223,003 | ||||||
| 31,368 | NIKE, Inc., Class B | 3,339,124 | ||||||
|
|
|
|||||||
| 5,562,127 | ||||||||
|
|
|
|||||||
| TOTAL COMMON STOCKS | ||||||||
| (Cost $95,004,005) | $ | 145,465,491 | ||||||
|
|
|
|||||||
| Shares | Dividend Rate |
Value | ||||||
| Investment Company – 0.4%(a) | ||||||||
| |
Goldman Sachs Financial Square Government Fund – |
| ||||||
| 601,795 | 2.154% | $ | 601,795 | |||||
| (Cost $601,795) | ||||||||
|
|
|
|||||||
| TOTAL INVESTMENTS – 99.8% | ||||||||
| (Cost $95,605,800) | $ | 146,067,286 | ||||||
|
|
|
|||||||
| |
OTHER ASSETS IN EXCESS OF LIABILITIES – 0.2% |
233,197 | ||||||
|
|
|
|||||||
| NET ASSETS – 100.0% | $ | 146,300,483 | ||||||
|
|
|
|||||||
| 50 | The accompanying notes are an integral part of these financial statements. |
GOLDMAN SACHS CONCENTRATED GROWTH FUND
| The percentage shown for each investment category reflects the value of investments in that category as a percentage of net assets. | ||
| * |
Non-income producing security. | |
| (a) |
Represents an affiliated issuer. | |
|
| ||||
| Investment Abbreviations: | ||||
| ADR |
—American Depositary Receipt | |||
| PLC |
—Public Limited Company | |||
| REIT |
—Real Estate Investment Trust | |||
|
| ||||
| The accompanying notes are an integral part of these financial statements. | 51 |
GOLDMAN SACHS FLEXIBLE CAP FUND
Schedule of Investments
August 31, 2022
| Shares |
Description | Value | ||||||
| Common Stocks – 99.3% | ||||||||
| Aerospace & Defense – 1.3% | ||||||||
| 2,085 | Boeing Co. (The)* | $ | 334,122 | |||||
| 2,132 | Woodward, Inc. | 198,425 | ||||||
|
|
|
|||||||
| 532,547 | ||||||||
|
|
|
|||||||
| Air Freight & Logistics – 0.3% | ||||||||
| 682 | United Parcel Service, Inc., Class B | 132,656 | ||||||
|
|
|
|||||||
| Auto Components – 0.6% | ||||||||
| 2,493 | Aptiv PLC* | 232,921 | ||||||
|
|
|
|||||||
| Automobiles – 1.4% | ||||||||
| 2,062 | Tesla, Inc.* | 568,308 | ||||||
|
|
|
|||||||
| Banks – 3.4% | ||||||||
| 14,693 | Bank of America Corp. | 493,832 | ||||||
| 5,192 | Citizens Financial Group, Inc. | 190,443 | ||||||
| 1,125 | East West Bancorp, Inc. | 81,191 | ||||||
| 5,492 | JPMorgan Chase & Co. | 624,605 | ||||||
|
|
|
|||||||
| 1,390,071 | ||||||||
|
|
|
|||||||
| Beverages – 1.3% | ||||||||
| 1,447 | Coca-Cola Co. (The) | 89,295 | ||||||
| 3,790 | Coca-Cola Europacific Partners PLC (United Kingdom) | 186,354 | ||||||
| 961 | Constellation Brands, Inc., Class A | 236,454 | ||||||
| 227 | PepsiCo, Inc. | 39,105 | ||||||
|
|
|
|||||||
| 551,208 | ||||||||
|
|
|
|||||||
| Biotechnology – 2.6% | ||||||||
| 624 | AbbVie, Inc. | 83,903 | ||||||
| 1,108 | Biogen, Inc.* | 216,481 | ||||||
| 2,386 | BioMarin Pharmaceutical, Inc.* | 212,831 | ||||||
| 4,924 | Gilead Sciences, Inc. | 312,526 | ||||||
| 2,139 | Neurocrine Biosciences, Inc.* | 223,804 | ||||||
|
|
|
|||||||
| 1,049,545 | ||||||||
|
|
|
|||||||
| Building Products – 1.1% | ||||||||
| 1,942 | Allegion PLC | 184,684 | ||||||
| 1,612 | Trane Technologies PLC | 248,361 | ||||||
|
|
|
|||||||
| 433,045 | ||||||||
|
|
|
|||||||
| Capital Markets – 3.7% | ||||||||
| 942 | Ameriprise Financial, Inc. | 252,465 | ||||||
| 5,040 | Charles Schwab Corp. (The) | 357,588 | ||||||
| 4,257 | Morgan Stanley | 362,782 | ||||||
| 2,379 | Raymond James Financial, Inc. | 248,296 | ||||||
| 838 | S&P Global, Inc. | 295,127 | ||||||
|
|
|
|||||||
| 1,516,258 | ||||||||
|
|
|
|||||||
| Chemicals – 2.1% | ||||||||
| 1,428 | Ecolab, Inc. | 233,949 | ||||||
| 1,323 | Linde PLC (United Kingdom) | 374,224 | ||||||
| 1,072 | Sherwin-Williams Co. (The) | 248,811 | ||||||
|
|
|
|||||||
| 856,984 | ||||||||
|
|
|
|||||||
| Communications Equipment – 1.0% | ||||||||
| 9,624 | Cisco Systems, Inc. | 430,385 | ||||||
|
|
|
|||||||
| Common Stocks – (continued) | ||||||||
| Consumer Finance – 0.8% | ||||||||
| 2,120 | American Express Co. | 322,240 | ||||||
|
|
|
|||||||
| Diversified Financial Services – 0.9% | ||||||||
| 1,381 | Berkshire Hathaway, Inc., Class B* | 387,785 | ||||||
|
|
|
|||||||
| Diversified Telecommunication Services – 0.7% | ||||||||
| 16,137 | AT&T, Inc. | 283,043 | ||||||
|
|
|
|||||||
| Electric Utilities – 1.3% | ||||||||
| 3,070 | NextEra Energy, Inc. | 261,134 | ||||||
| 3,483 | Xcel Energy, Inc. | 258,613 | ||||||
|
|
|
|||||||
| 519,747 | ||||||||
|
|
|
|||||||
| Electrical Equipment – 0.6% | ||||||||
| 1,019 | Rockwell Automation, Inc. | 241,442 | ||||||
|
|
|
|||||||
| Electronic Equipment, Instruments & Components – 0.4% | ||||||||
| 7,345 | Vontier Corp. | 161,002 | ||||||
|
|
|
|||||||
| Entertainment – 1.8% | ||||||||
| 2,035 | Electronic Arts, Inc. | 258,180 | ||||||
| 2,345 | Live Nation Entertainment, Inc.* | 211,894 | ||||||
| 447 | Walt Disney Co. (The)* | 50,100 | ||||||
| 16,125 | Warner Bros Discovery, Inc.* | 213,495 | ||||||
|
|
|
|||||||
| 733,669 | ||||||||
|
|
|
|||||||
| Equity Real Estate Investment Trusts (REITs) – 3.8% | ||||||||
| 1,082 | AvalonBay Communities, Inc. REIT | 217,385 | ||||||
| 3,759 | CubeSmart REIT | 173,102 | ||||||
| 1,751 | Equity LifeStyle Properties, Inc. REIT | 122,745 | ||||||
| 782 | Essex Property Trust, Inc. REIT | 207,277 | ||||||
| 8,331 | Healthpeak Properties, Inc. REIT | 218,689 | ||||||
| 576 | Public Storage REIT | 190,558 | ||||||
| 3,123 | Regency Centers Corp. REIT | 190,003 | ||||||
| 4,953 | Ventas, Inc. REIT | 237,050 | ||||||
|
|
|
|||||||
| 1,556,809 | ||||||||
|
|
|
|||||||
| Food & Staples Retailing – 1.1% | ||||||||
| 3,342 | Walmart, Inc. | 442,982 | ||||||
|
|
|
|||||||
| Food Products – 1.5% | ||||||||
| 3,377 | Archer-Daniels-Midland Co. | 296,805 | ||||||
| 4,956 | Mondelez International, Inc., Class A | 306,578 | ||||||
|
|
|
|||||||
| 603,383 | ||||||||
|
|
|
|||||||
| Health Care Equipment & Supplies – 0.5% | ||||||||
| 2,026 | Zimmer Biomet Holdings, Inc. | 215,404 | ||||||
|
|
|
|||||||
| Health Care Providers & Services – 4.3% | ||||||||
| 1,485 | AmerisourceBergen Corp. | 217,642 | ||||||
| 2,883 | Centene Corp.* | 258,721 | ||||||
| 3,622 | CVS Health Corp. | 355,499 | ||||||
| 595 | Humana, Inc. | 286,659 | ||||||
| 1,782 | Quest Diagnostics, Inc. | 223,302 | ||||||
| 777 | UnitedHealth Group, Inc. | 403,519 | ||||||
|
|
|
|||||||
| 1,745,342 | ||||||||
|
|
|
|||||||
| Health Care Technology – 0.5% | ||||||||
| 1,005 | Veeva Systems, Inc., Class A* | 200,317 | ||||||
|
|
|
|||||||
| 52 | The accompanying notes are an integral part of these financial statements. |
GOLDMAN SACHS FLEXIBLE CAP FUND
| Shares |
Description | Value | ||||||
| Common Stocks – (continued) | ||||||||
| Hotels, Restaurants & Leisure – 2.4% | ||||||||
| 1,775 | Expedia Group, Inc.* | $ | 182,204 | |||||
| 1,740 | McDonald’s Corp. | 438,967 | ||||||
| 2,812 | Wyndham Hotels & Resorts, Inc. | 183,736 | ||||||
| 1,614 | Yum! Brands, Inc. | 179,541 | ||||||
|
|
|
|||||||
| 984,448 | ||||||||
|
|
|
|||||||
| Household Durables – 0.4% | ||||||||
| 1,938 | Lennar Corp., Class A | 150,098 | ||||||
|
|
|
|||||||
| Household Products – 1.7% | ||||||||
| 3,725 | Colgate-Palmolive Co. | 291,332 | ||||||
| 3,012 | Procter & Gamble Co. (The) | 415,476 | ||||||
|
|
|
|||||||
| 706,808 | ||||||||
|
|
|
|||||||
| Independent Power and Renewable Electricity Producers – 0.6% | ||||||||
| 9,161 | AES Corp. (The) | 233,147 | ||||||
|
|
|
|||||||
| Industrial Conglomerates – 0.7% | ||||||||
| 4,169 | General Electric Co. | 306,171 | ||||||
|
|
|
|||||||
| Insurance – 2.1% | ||||||||
| 4,507 | Arch Capital Group Ltd.* | 206,060 | ||||||
| 1,322 | Chubb Ltd. | 249,924 | ||||||
| 2,047 | Globe Life, Inc. | 198,948 | ||||||
| 3,025 | Principal Financial Group, Inc. | 226,149 | ||||||
|
|
|
|||||||
| 881,081 | ||||||||
|
|
|
|||||||
| Interactive Media & Services – 4.8% | ||||||||
| 5,361 | Alphabet, Inc., Class A* | 580,168 | ||||||
| 6,602 | Alphabet, Inc., Class C* | 720,608 | ||||||
| 4,060 | Meta Platforms, Inc., Class A* | 661,496 | ||||||
|
|
|
|||||||
| 1,962,272 | ||||||||
|
|
|
|||||||
| Internet & Direct Marketing Retail – 3.0% | ||||||||
| 8,866 | Amazon.com, Inc.* | 1,123,943 | ||||||
| 1,080 | Etsy, Inc.* | 114,059 | ||||||
|
|
|
|||||||
| 1,238,002 | ||||||||
|
|
|
|||||||
| IT Services – 4.0% | ||||||||
| 1,400 | Accenture PLC, Class A | 403,844 | ||||||
| 3,445 | Cognizant Technology Solutions Corp., Class A | 217,621 | ||||||
| 2,973 | Fidelity National Information Services, Inc. | 271,643 | ||||||
| 2,411 | International Business Machines Corp. | 309,693 | ||||||
| 427 | Mastercard, Inc., Class A | 138,506 | ||||||
| 1,100 | PayPal Holdings, Inc.* | 102,784 | ||||||
| 966 | Visa, Inc., Class A | 191,954 | ||||||
|
|
|
|||||||
| 1,636,045 | ||||||||
|
|
|
|||||||
| Life Sciences Tools & Services – 1.6% | ||||||||
| 3,660 | Avantor, Inc.* | 91,171 | ||||||
| 1,283 | Danaher Corp. | 346,294 | ||||||
| 193 | Mettler-Toledo International, Inc.* | 234,005 | ||||||
|
|
|
|||||||
| 671,470 | ||||||||
|
|
|
|||||||
| Common Stocks – (continued) | ||||||||
| Machinery – 1.3% | ||||||||
| 1,091 | Cummins, Inc. | 234,969 | ||||||
| 1,575 | Fortive Corp. | 99,745 | ||||||
| 2,691 | ITT, Inc. | 195,178 | ||||||
|
|
|
|||||||
| 529,892 | ||||||||
|
|
|
|||||||
| Media – 0.5% | ||||||||
| 2,138 | Comcast Corp., Class A | 77,374 | ||||||
| 4,322 | New York Times Co. (The), Class A | 131,778 | ||||||
|
|
|
|||||||
| 209,152 | ||||||||
|
|
|
|||||||
| Metals & Mining – 1.2% | ||||||||
| 9,077 | Freeport-McMoRan, Inc. | 268,679 | ||||||
| 2,925 | Steel Dynamics, Inc. | 236,106 | ||||||
|
|
|
|||||||
| 504,785 | ||||||||
|
|
|
|||||||
| Multiline Retail – 0.7% | ||||||||
| 1,846 | Target Corp. | 295,988 | ||||||
|
|
|
|||||||
| Multi-Utilities – 1.1% | ||||||||
| 3,249 | CMS Energy Corp. | 219,438 | ||||||
| 2,251 | WEC Energy Group, Inc. | 232,168 | ||||||
|
|
|
|||||||
| 451,606 | ||||||||
|
|
|
|||||||
| Oil, Gas & Consumable Fuels – 5.0% | ||||||||
| 2,176 | Chesapeake Energy Corp. | 218,666 | ||||||
| 1,040 | Chevron Corp. | 164,383 | ||||||
| 3,463 | ConocoPhillips | 379,025 | ||||||
| 4,222 | Devon Energy Corp. | 298,158 | ||||||
| 7,326 | Exxon Mobil Corp. | 700,292 | ||||||
| 10,523 | Marathon Oil Corp. | 269,284 | ||||||
|
|
|
|||||||
| 2,029,808 | ||||||||
|
|
|
|||||||
| Pharmaceuticals – 3.5% | ||||||||
| 2,741 | AstraZeneca PLC ADR (United Kingdom) | 170,984 | ||||||
| 5,262 | Bristol-Myers Squibb Co. | 354,711 | ||||||
| 1,613 | Eli Lilly & Co. | 485,884 | ||||||
| 1,653 | Johnson & Johnson | 266,695 | ||||||
| 414 | Merck & Co., Inc. | 35,339 | ||||||
| 2,266 | Pfizer, Inc. | 102,491 | ||||||
|
|
|
|||||||
| 1,416,104 | ||||||||
|
|
|
|||||||
| Professional Services – 1.4% | ||||||||
| 2,334 | Booz Allen Hamilton Holding Corp. | 223,364 | ||||||
| 1,574 | CoStar Group, Inc.* | 109,613 | ||||||
| 1,288 | Verisk Analytics, Inc. | 241,062 | ||||||
|
|
|
|||||||
| 574,039 | ||||||||
|
|
|
|||||||
| Road & Rail – 2.1% | ||||||||
| 3,903 | Knight-Swift Transportation Holdings, Inc. | 197,140 | ||||||
| 1,099 | Norfolk Southern Corp. | 267,200 | ||||||
| 814 | Old Dominion Freight Line, Inc. | 220,928 | ||||||
| 940 | Saia, Inc.* | 194,420 | ||||||
|
|
|
|||||||
| 879,688 | ||||||||
|
|
|
|||||||
| The accompanying notes are an integral part of these financial statements. | 53 |
GOLDMAN SACHS FLEXIBLE CAP FUND
Schedule of Investments (continued)
August 31, 2022
| Shares |
Description | Value | ||||||
| Common Stocks – (continued) | ||||||||
| Semiconductors & Semiconductor Equipment – 3.8% | ||||||||
| 831 | KLA Corp. | $ | 285,972 | |||||
| 4,199 | Marvell Technology, Inc. | 196,597 | ||||||
| 3,419 | Microchip Technology, Inc. | 223,090 | ||||||
| 1,508 | MKS Instruments, Inc. | 150,212 | ||||||
| 1,636 | NVIDIA Corp. | 246,938 | ||||||
| 1,002 | NXP Semiconductors NV (China) | 164,909 | ||||||
| 4,124 | ON Semiconductor Corp.* | 283,607 | ||||||
|
|
|
|||||||
| 1,551,325 | ||||||||
|
|
|
|||||||
| Software – 10.0% | ||||||||
| 1,092 | Adobe, Inc.* | 407,797 | ||||||
| 254 | Aspen Technology, Inc.* | 53,492 | ||||||
| 1,622 | Cadence Design Systems, Inc.* | 281,855 | ||||||
| 9,227 | Microsoft Corp. | 2,412,584 | ||||||
| 394 | Palo Alto Networks, Inc.* | 219,383 | ||||||
| 565 | Paycom Software, Inc.* | 198,428 | ||||||
| 1,874 | Salesforce, Inc.* | 292,569 | ||||||
| 1,322 | Workday, Inc., Class A* | 217,548 | ||||||
|
|
|
|||||||
| 4,083,656 | ||||||||
|
|
|
|||||||
| Specialty Retail – 1.3% | ||||||||
| 514 | Home Depot, Inc. (The) | 148,248 | ||||||
| 1,697 | Ross Stores, Inc. | 146,400 | ||||||
| 551 | Ulta Beauty, Inc.* | 231,348 | ||||||
|
|
|
|||||||
| 525,996 | ||||||||
|
|
|
|||||||
| Technology Hardware, Storage & Peripherals – 7.7% | ||||||||
| 17,678 | Apple, Inc. | 2,779,335 | ||||||
| 4,665 | Dell Technologies, Inc., Class C | 178,623 | ||||||
| 2,846 | NetApp, Inc. | 205,282 | ||||||
|
|
|
|||||||
| 3,163,240 | ||||||||
|
|
|
|||||||
| Textiles, Apparel & Luxury Goods – 1.4% | ||||||||
| 4,820 | Capri Holdings Ltd.* | 227,408 | ||||||
| 3,074 | NIKE, Inc., Class B | 327,227 | ||||||
|
|
|
|||||||
| 554,635 | ||||||||
|
|
|
|||||||
| TOTAL INVESTMENTS – 99.3% | ||||||||
| (Cost $34,353,959) | $ | 40,646,549 | ||||||
|
|
|
|||||||
| |
OTHER ASSETS IN EXCESS OF LIABILITIES – 0.7% |
273,689 | ||||||
|
|
|
|||||||
| NET ASSETS – 100.0% | $ | 40,920,238 | ||||||
|
|
|
|||||||
| The percentage shown for each investment category reflects the value of investments in that category as a percentage of net assets. | ||
| * |
Non-income producing security. | |
|
| ||||
| Investment Abbreviations: | ||||
| ADR |
—American Depositary Receipt | |||
| PLC |
—Public Limited Company | |||
| REIT |
—Real Estate Investment Trust | |||
|
| ||||
| 54 | The accompanying notes are an integral part of these financial statements. |
GOLDMAN SACHS LARGE CAP CORE FUND
Schedule of Investments
August 31, 2022
| Shares |
Description | Value | ||||||
| Common Stocks – 98.6% | ||||||||
| Aerospace & Defense – 1.4% | ||||||||
| 56,459 | Boeing Co. (The)* | $ | 9,047,555 | |||||
| 16,672 | L3Harris Technologies, Inc. | 3,804,384 | ||||||
| 4,524 | TransDigm Group, Inc. | 2,716,164 | ||||||
|
|
|
|||||||
| 15,568,103 | ||||||||
|
|
|
|||||||
| Air Freight & Logistics – 0.5% | ||||||||
| 27,161 | United Parcel Service, Inc., Class B | 5,283,086 | ||||||
|
|
|
|||||||
| Airlines – 0.1% | ||||||||
| 37,932 | United Airlines Holdings, Inc.* | 1,327,999 | ||||||
|
|
|
|||||||
| Auto Components – 0.6% | ||||||||
| 76,446 | Aptiv PLC* | 7,142,350 | ||||||
|
|
|
|||||||
| Automobiles – 1.8% | ||||||||
| 302,062 | General Motors Co. | 11,541,789 | ||||||
| 28,368 | Tesla, Inc.* | 7,818,504 | ||||||
|
|
|
|||||||
| 19,360,293 | ||||||||
|
|
|
|||||||
| Banks – 4.3% | ||||||||
| 443,362 | Bank of America Corp. | 14,901,397 | ||||||
| 63,073 | First Republic Bank | 9,576,374 | ||||||
| 145,684 | JPMorgan Chase & Co. | 16,568,641 | ||||||
| 18,130 | M&T Bank Corp. | 3,295,671 | ||||||
| 18,495 | PNC Financial Services Group, Inc. (The) | 2,922,210 | ||||||
|
|
|
|||||||
| 47,264,293 | ||||||||
|
|
|
|||||||
| Beverages – 1.4% | ||||||||
| 77,481 | Coca-Cola Europacific Partners PLC (United Kingdom) | 3,809,741 | ||||||
| 27,704 | Constellation Brands, Inc., Class A | 6,816,569 | ||||||
| 54,601 | Monster Beverage Corp.* | 4,850,207 | ||||||
|
|
|
|||||||
| 15,476,517 | ||||||||
|
|
|
|||||||
| Biotechnology – 1.6% | ||||||||
| 11,322 | Alnylam Pharmaceuticals, Inc.* | 2,339,918 | ||||||
| 8,443 | Argenx SE ADR (Netherlands)* | 3,190,356 | ||||||
| 19,014 | Biogen, Inc.* | 3,714,955 | ||||||
| 49,884 | Gilead Sciences, Inc. | 3,166,138 | ||||||
| 23,255 | Neurocrine Biosciences, Inc.* | 2,433,171 | ||||||
| 14,860 | Seagen, Inc.* | 2,292,749 | ||||||
|
|
|
|||||||
| 17,137,287 | ||||||||
|
|
|
|||||||
| Building Products – 0.7% | ||||||||
| 61,503 | AZEK Co., Inc. (The)* | 1,122,430 | ||||||
| 40,260 | Trane Technologies PLC | 6,202,858 | ||||||
|
|
|
|||||||
| 7,325,288 | ||||||||
|
|
|
|||||||
| Capital Markets – 2.7% | ||||||||
| 5,683 | BlackRock, Inc. | 3,787,094 | ||||||
| 42,778 | Carlyle Group, Inc. (The) | 1,391,568 | ||||||
| 97,190 | Charles Schwab Corp. (The) | 6,895,631 | ||||||
| 109,609 | Morgan Stanley | 9,340,879 | ||||||
| 3,221 | MSCI, Inc. | 1,447,002 | ||||||
| 19,021 | Raymond James Financial, Inc. | 1,985,222 | ||||||
| 10,527 | S&P Global, Inc. | 3,707,399 | ||||||
| 20,913 | Tradeweb Markets, Inc., Class A | 1,455,336 | ||||||
|
|
|
|||||||
| 30,010,131 | ||||||||
|
|
|
|||||||
| Common Stocks – (continued) | ||||||||
| Chemicals – 1.9% | ||||||||
| 6,580 | Air Products and Chemicals, Inc. | 1,661,121 | ||||||
| 45,814 | Ecolab, Inc. | 7,505,708 | ||||||
| 18,157 | Linde PLC (United Kingdom) | 5,135,889 | ||||||
| 28,826 | Sherwin-Williams Co. (The) | 6,690,514 | ||||||
|
|
|
|||||||
| 20,993,232 | ||||||||
|
|
|
|||||||
| Commercial Services & Supplies – 0.3% | ||||||||
| 27,490 | Waste Connections, Inc. | 3,826,058 | ||||||
|
|
|
|||||||
| Communications Equipment – 1.1% | ||||||||
| 259,812 | Cisco Systems, Inc. | 11,618,793 | ||||||
|
|
|
|||||||
| Construction Materials – 0.6% | ||||||||
| 18,545 | Martin Marietta Materials, Inc. | 6,448,282 | ||||||
|
|
|
|||||||
| Consumer Finance – 0.7% | ||||||||
| 52,309 | American Express Co. | 7,950,968 | ||||||
|
|
|
|||||||
| Containers & Packaging – 0.3% | ||||||||
| 67,182 | Ball Corp. | 3,749,427 | ||||||
|
|
|
|||||||
| Diversified Financial Services – 0.9% | ||||||||
| 34,475 | Apollo Global Management, Inc. | 1,916,121 | ||||||
| 27,388 | Berkshire Hathaway, Inc., Class B* | 7,690,550 | ||||||
|
|
|
|||||||
| 9,606,671 | ||||||||
|
|
|
|||||||
| Diversified Telecommunication Services – 1.1% | ||||||||
| 713,372 | AT&T, Inc. | 12,512,545 | ||||||
|
|
|
|||||||
| Electric Utilities – 1.3% | ||||||||
| 107,130 | NextEra Energy, Inc. | 9,112,478 | ||||||
| 63,444 | Xcel Energy, Inc. | 4,710,717 | ||||||
|
|
|
|||||||
| 13,823,195 | ||||||||
|
|
|
|||||||
| Electrical Equipment – 2.0% | ||||||||
| 53,563 | Eaton Corp. PLC | 7,318,848 | ||||||
| 57,200 | Rockwell Automation, Inc. | 13,552,968 | ||||||
| 36,559 | Shoals Technologies Group, Inc., Class A* | 964,061 | ||||||
|
|
|
|||||||
| 21,835,877 | ||||||||
|
|
|
|||||||
| Electronic Equipment, Instruments & Components – 0.8% | ||||||||
| 33,922 | CDW Corp. | 5,790,485 | ||||||
| 17,032 | Keysight Technologies, Inc.* | 2,791,375 | ||||||
|
|
|
|||||||
| 8,581,860 | ||||||||
|
|
|
|||||||
| Energy Equipment & Services – 0.4% | ||||||||
| 146,319 | Halliburton Co. | 4,408,591 | ||||||
|
|
|
|||||||
| Entertainment – 2.0% | ||||||||
| 25,988 | Electronic Arts, Inc. | 3,297,097 | ||||||
| 58,579 | Live Nation Entertainment, Inc.* | 5,293,198 | ||||||
| 5,259 | Netflix, Inc.* | 1,175,702 | ||||||
| 19,695 | Walt Disney Co. (The)* | 2,207,416 | ||||||
| 767,761 | Warner Bros Discovery, Inc.* | 10,165,156 | ||||||
|
|
|
|||||||
| 22,138,569 | ||||||||
|
|
|
|||||||
| The accompanying notes are an integral part of these financial statements. | 55 |
GOLDMAN SACHS LARGE CAP CORE FUND
Schedule of Investments (continued)
August 31, 2022
| Shares |
Description | Value | ||||||
| Common Stocks – (continued) | ||||||||
| Equity Real Estate Investment Trusts (REITs) – 2.4% | ||||||||
| 28,538 | Alexandria Real Estate Equities, Inc. REIT | $ | 4,377,729 | |||||
| 17,986 | American Tower Corp. REIT | 4,569,343 | ||||||
| 44,804 | Americold Realty Trust, Inc. REIT | 1,318,134 | ||||||
| 11,859 | AvalonBay Communities, Inc. REIT | 2,382,592 | ||||||
| 19,881 | Digital Realty Trust, Inc. REIT | 2,457,888 | ||||||
| 36,257 | Duke Realty Corp. REIT | 2,133,725 | ||||||
| 2,955 | Equinix, Inc. REIT | 1,942,528 | ||||||
| 33,879 | Equity LifeStyle Properties, Inc. REIT | 2,374,918 | ||||||
| 8,269 | Public Storage REIT | 2,735,633 | ||||||
| 22,220 | Ryman Hospitality Properties, Inc. REIT* | 1,826,928 | ||||||
|
|
|
|||||||
| 26,119,418 | ||||||||
|
|
|
|||||||
| Food Products – 1.7% | ||||||||
| 140,196 | McCormick & Co., Inc. | 11,786,278 | ||||||
| 117,063 | Mondelez International, Inc., Class A | 7,241,517 | ||||||
|
|
|
|||||||
| 19,027,795 | ||||||||
|
|
|
|||||||
| Health Care Equipment & Supplies – 2.6% | ||||||||
| 132,785 | Boston Scientific Corp.* | 5,352,563 | ||||||
| 33,884 | Dexcom, Inc.* | 2,785,604 | ||||||
| 33,345 | Edwards Lifesciences Corp.* | 3,004,385 | ||||||
| 7,166 | IDEXX Laboratories, Inc.* | 2,491,045 | ||||||
| 12,213 | Insulet Corp.* | 3,120,055 | ||||||
| 51,331 | Intuitive Surgical, Inc.* | 10,560,840 | ||||||
| 16,119 | Zimmer Biomet Holdings, Inc. | 1,713,772 | ||||||
|
|
|
|||||||
| 29,028,264 | ||||||||
|
|
|
|||||||
| Health Care Providers & Services – 5.0% | ||||||||
| 29,327 | AmerisourceBergen Corp. | 4,298,165 | ||||||
| 37,324 | Centene Corp.* | 3,349,456 | ||||||
| 165,599 | CVS Health Corp. | 16,253,542 | ||||||
| 25,793 | Guardant Health, Inc.* | 1,291,197 | ||||||
| 27,451 | Humana, Inc. | 13,225,343 | ||||||
| 32,093 | UnitedHealth Group, Inc. | 16,666,858 | ||||||
|
|
|
|||||||
| 55,084,561 | ||||||||
|
|
|
|||||||
| Health Care Technology – 0.5% | ||||||||
| 25,672 | Veeva Systems, Inc., Class A* | 5,116,943 | ||||||
|
|
|
|||||||
| Hotels, Restaurants & Leisure – 2.0% | ||||||||
| 25,957 | Airbnb, Inc., Class A* | 2,936,256 | ||||||
| 2,174 | Chipotle Mexican Grill, Inc.* | 3,471,443 | ||||||
| 49,326 | McDonald’s Corp. | 12,443,963 | ||||||
| 40,397 | Wyndham Hotels & Resorts, Inc. | 2,639,540 | ||||||
|
|
|
|||||||
| 21,491,202 | ||||||||
|
|
|
|||||||
| Household Products – 1.5% | ||||||||
| 37,961 | Colgate-Palmolive Co. | 2,968,930 | ||||||
| 97,513 | Procter & Gamble Co. (The) | 13,450,943 | ||||||
|
|
|
|||||||
| 16,419,873 | ||||||||
|
|
|
|||||||
| Industrial Conglomerates – 0.8% | ||||||||
| 121,896 | General Electric Co. | 8,952,042 | ||||||
|
|
|
|||||||
| Common Stocks – (continued) | ||||||||
| Insurance – 1.5% | ||||||||
| 10,122 | Allstate Corp. (The) | 1,219,701 | ||||||
| 45,890 | Arch Capital Group Ltd.* | 2,098,091 | ||||||
| 16,816 | Chubb Ltd. | 3,179,065 | ||||||
| 36,479 | Globe Life, Inc. | 3,545,394 | ||||||
| 953 | Markel Corp.* | 1,137,987 | ||||||
| 19,605 | Marsh & McLennan Cos., Inc. | 3,163,659 | ||||||
| 16,885 | Progressive Corp. (The) | 2,070,945 | ||||||
|
|
|
|||||||
| 16,414,842 | ||||||||
|
|
|
|||||||
| Interactive Media & Services – 4.7% | ||||||||
| 168,012 | Alphabet, Inc., Class A* | 18,182,259 | ||||||
| 162,920 | Alphabet, Inc., Class C* | 17,782,718 | ||||||
| 74,419 | Meta Platforms, Inc., Class A* | 12,125,088 | ||||||
| 354,423 | Snap, Inc., Class A* | 3,856,122 | ||||||
|
|
|
|||||||
| 51,946,187 | ||||||||
|
|
|
|||||||
| Internet & Direct Marketing Retail – 3.4% | ||||||||
| 241,922 | Amazon.com, Inc.* | 30,668,452 | ||||||
| 62,159 | Etsy, Inc.* | 6,564,612 | ||||||
|
|
|
|||||||
| 37,233,064 | ||||||||
|
|
|
|||||||
| IT Services – 4.8% | ||||||||
| 44,356 | Accenture PLC, Class A | 12,794,932 | ||||||
| 20,658 | Cognizant Technology Solutions Corp., Class A | 1,304,966 | ||||||
| 68,899 | Fidelity National Information Services, Inc. | 6,295,301 | ||||||
| 107,958 | International Business Machines Corp. | 13,867,205 | ||||||
| 59,006 | PayPal Holdings, Inc.* | 5,513,521 | ||||||
| 17,362 | Snowflake, Inc., Class A* | 3,141,654 | ||||||
| 49,895 | Visa, Inc., Class A | 9,914,635 | ||||||
|
|
|
|||||||
| 52,832,214 | ||||||||
|
|
|
|||||||
| Life Sciences Tools & Services – 1.8% | ||||||||
| 208,549 | Avantor, Inc.* | 5,194,956 | ||||||
| 35,421 | Danaher Corp. | 9,560,482 | ||||||
| 12,236 | Illumina, Inc.* | 2,467,267 | ||||||
| 9,379 | West Pharmaceutical Services, Inc. | 2,782,655 | ||||||
|
|
|
|||||||
| 20,005,360 | ||||||||
|
|
|
|||||||
| Machinery – 1.9% | ||||||||
| 40,314 | Caterpillar, Inc. | 7,446,399 | ||||||
| 2,141 | Deere & Co. | 782,000 | ||||||
| 54,145 | Illinois Tool Works, Inc. | 10,549,071 | ||||||
| 20,610 | Stanley Black & Decker, Inc. | 1,815,741 | ||||||
|
|
|
|||||||
| 20,593,211 | ||||||||
|
|
|
|||||||
| Media – 0.2% | ||||||||
| 32,217 | Comcast Corp., Class A | 1,165,933 | ||||||
| 42,768 | New York Times Co. (The), Class A | 1,303,997 | ||||||
|
|
|
|||||||
| 2,469,930 | ||||||||
|
|
|
|||||||
| Metals & Mining – 1.1% | ||||||||
| 296,222 | Freeport-McMoRan, Inc. | 8,768,171 | ||||||
| 44,195 | Steel Dynamics, Inc. | 3,567,421 | ||||||
|
|
|
|||||||
| 12,335,592 | ||||||||
|
|
|
|||||||
| 56 | The accompanying notes are an integral part of these financial statements. |
GOLDMAN SACHS LARGE CAP CORE FUND
| Shares |
Description | Value | ||||||
| Common Stocks – (continued) | ||||||||
| Multiline Retail – 1.3% | ||||||||
| 12,815 | Dollar General Corp. | $ | 3,042,537 | |||||
| 68,169 | Target Corp. | 10,930,218 | ||||||
|
|
|
|||||||
| 13,972,755 | ||||||||
|
|
|
|||||||
| Multi-Utilities – 1.0% | ||||||||
| 56,610 | Ameren Corp. | 5,243,218 | ||||||
| 80,262 | CMS Energy Corp. | 5,420,896 | ||||||
|
|
|
|||||||
| 10,664,114 | ||||||||
|
|
|
|||||||
| Oil, Gas & Consumable Fuels – 4.8% | ||||||||
| 25,061 | Cheniere Energy, Inc. | 4,014,271 | ||||||
| 10,015 | Chesapeake Energy Corp. | 1,006,407 | ||||||
| 25,496 | Chevron Corp. | 4,029,898 | ||||||
| 27,194 | ConocoPhillips | 2,976,383 | ||||||
| 49,729 | Diamondback Energy, Inc. | 6,627,881 | ||||||
| 13,639 | DT Midstream, Inc. | 753,009 | ||||||
| 7,093 | EOG Resources, Inc. | 860,381 | ||||||
| 155,686 | Exxon Mobil Corp. | 14,882,025 | ||||||
| 49,670 | Hess Corp. | 5,999,143 | ||||||
| 175,242 | Marathon Oil Corp. | 4,484,443 | ||||||
| 32,835 | Ovintiv, Inc. | 1,744,852 | ||||||
| 13,087 | Range Resources Corp.* | 430,039 | ||||||
| 48,782 | Southwestern Energy Co.* | 365,377 | ||||||
| 74,870 | Targa Resources Corp. | 5,108,380 | ||||||
|
|
|
|||||||
| 53,282,489 | ||||||||
|
|
|
|||||||
| Personal Products – 0.3% | ||||||||
| 12,321 | Estee Lauder Cos., Inc. (The), Class A | 3,134,216 | ||||||
|
|
|
|||||||
| Pharmaceuticals – 3.0% | ||||||||
| 56,481 | AstraZeneca PLC ADR (United Kingdom) | 3,523,285 | ||||||
| 212,690 | Bristol-Myers Squibb Co. | 14,337,433 | ||||||
| 49,355 | Eli Lilly & Co. | 14,867,206 | ||||||
|
|
|
|||||||
| 32,727,924 | ||||||||
|
|
|
|||||||
| Professional Services – 0.4% | ||||||||
| 26,428 | Verisk Analytics, Inc. | 4,946,264 | ||||||
|
|
|
|||||||
| Road & Rail – 1.2% | ||||||||
| 27,266 | Norfolk Southern Corp. | 6,629,182 | ||||||
| 11,304 | Old Dominion Freight Line, Inc. | 3,068,019 | ||||||
| 93,984 | Uber Technologies, Inc.* | 2,702,980 | ||||||
| 2,840 | Union Pacific Corp. | 637,608 | ||||||
|
|
|
|||||||
| 13,037,789 | ||||||||
|
|
|
|||||||
| Semiconductors & Semiconductor Equipment – 4.3% | ||||||||
| 28,561 | Advanced Micro Devices, Inc.* | 2,423,972 | ||||||
| 8,779 | Enphase Energy, Inc.* | 2,514,657 | ||||||
| 31,596 | KLA Corp. | 10,873,131 | ||||||
| 4,628 | Lam Research Corp. | 2,026,647 | ||||||
| 78,805 | Marvell Technology, Inc. | 3,689,650 | ||||||
| 42,954 | Microchip Technology, Inc. | 2,802,749 | ||||||
| 62,202 | NVIDIA Corp. | 9,388,770 | ||||||
| 9,879 | NXP Semiconductors NV (China) | 1,625,886 | ||||||
| 104,451 | ON Semiconductor Corp.* | 7,183,095 | ||||||
| 12,129 | Texas Instruments, Inc. | 2,003,832 | ||||||
| 23,351 | Wolfspeed, Inc.* | 2,649,638 | ||||||
|
|
|
|||||||
| 47,182,027 | ||||||||
|
|
|
|||||||
| Common Stocks – (continued) | ||||||||
| Software – 8.6% | ||||||||
| 24,537 | Adobe, Inc.* | 9,163,097 | ||||||
| 13,186 | Atlassian Corp. PLC, Class A* | 3,265,645 | ||||||
| 14,597 | Bill.com Holdings, Inc.* | 2,362,962 | ||||||
| 20,973 | Cadence Design Systems, Inc.* | 3,644,478 | ||||||
| 42,676 | Dynatrace, Inc.* | 1,629,370 | ||||||
| 5,070 | HubSpot, Inc.* | 1,708,793 | ||||||
| 236,618 | Microsoft Corp. | 61,868,508 | ||||||
| 6,965 | Palo Alto Networks, Inc.* | 3,878,182 | ||||||
| 22,995 | Salesforce, Inc.* | 3,589,979 | ||||||
| 9,771 | Workday, Inc., Class A* | 1,607,916 | ||||||
| 13,295 | Zscaler, Inc.* | 2,117,096 | ||||||
|
|
|
|||||||
| 94,836,026 | ||||||||
|
|
|
|||||||
| Specialty Retail – 2.0% | ||||||||
| 2,132 | O’Reilly Automotive, Inc.* | 1,486,260 | ||||||
| 33,593 | RH* | 8,596,784 | ||||||
| 85,601 | Ross Stores, Inc. | 7,384,798 | ||||||
| 12,180 | Tractor Supply Co. | 2,255,127 | ||||||
| 6,733 | Ulta Beauty, Inc.* | 2,826,985 | ||||||
|
|
|
|||||||
| 22,549,954 | ||||||||
|
|
|
|||||||
| Technology Hardware, Storage & Peripherals – 6.5% | ||||||||
| 430,565 | Apple, Inc. | 67,693,429 | ||||||
| 86,984 | Dell Technologies, Inc., Class C | 3,330,618 | ||||||
|
|
|
|||||||
| 71,024,047 | ||||||||
|
|
|
|||||||
| Textiles, Apparel & Luxury Goods – 0.8% | ||||||||
| 30,195 | Capri Holdings Ltd.* | 1,424,600 | ||||||
| 8,505 | Lululemon Athletica, Inc.* | 2,551,160 | ||||||
| 46,925 | NIKE, Inc., Class B | 4,995,166 | ||||||
|
|
|
|||||||
| 8,970,926 | ||||||||
|
|
|
|||||||
| TOTAL COMMON STOCKS | ||||||||
| (Cost $812,589,530) | $ | 1,084,788,444 | ||||||
|
|
|
|||||||
| Shares | Dividend Rate |
Value | ||||||
| Investment Company – 0.2%(a) | ||||||||
| |
Goldman Sachs Financial Square Government Fund – |
| ||||||
| 2,302,429 | 2.154% | $ | 2,302,429 | |||||
| (Cost $2,302,429) | ||||||||
|
|
|
|||||||
| TOTAL INVESTMENTS – 98.8% | ||||||||
| (Cost $814,891,959) | $ | 1,087,090,873 | ||||||
|
|
|
|||||||
| |
OTHER ASSETS IN EXCESS OF LIABILITIES – 1.2% |
13,233,330 | ||||||
|
|
|
|||||||
| NET ASSETS – 100.0% | $ | 1,100,324,203 | ||||||
|
|
|
|||||||
| The percentage shown for each investment category reflects the value of investments in that category as a percentage of net assets. | ||
| * |
Non-income producing security. | |
| (a) |
Represents an affiliated issuer. | |
|
| ||||
| Investment Abbreviations: | ||||
| ADR |
—American Depositary Receipt | |||
| PLC |
—Public Limited Company | |||
| REIT |
—Real Estate Investment Trust | |||
|
| ||||
| The accompanying notes are an integral part of these financial statements. | 57 |
GOLDMAN SACHS MID CAP GROWTH FUND
Schedule of Investments
August 31, 2022
| Shares |
Description | Value | ||||||
| Common Stocks – 97.4% | ||||||||
| Aerospace & Defense – 0.9% | ||||||||
| 97,000 | Woodward, Inc. | $ | 9,027,790 | |||||
|
|
|
|||||||
| Auto Components – 1.7% | ||||||||
| 170,753 | Aptiv PLC* | 15,953,453 | ||||||
|
|
|
|||||||
| Banks – 1.2% | ||||||||
| 78,152 | First Republic Bank | 11,865,818 | ||||||
|
|
|
|||||||
| Biotechnology – 6.4% | ||||||||
| 49,756 | Alnylam Pharmaceuticals, Inc.* | 10,283,073 | ||||||
| 24,197 | Argenx SE ADR (Netherlands)* | 9,143,320 | ||||||
| 25,859 | Biogen, Inc.* | 5,052,331 | ||||||
| 127,498 | Neurocrine Biosciences, Inc.* | 13,340,116 | ||||||
| 99,682 | Sarepta Therapeutics, Inc.* | 10,903,217 | ||||||
| 86,651 | Seagen, Inc.* | 13,369,383 | ||||||
|
|
|
|||||||
| 62,091,440 | ||||||||
|
|
|
|||||||
| Building Products – 1.7% | ||||||||
| 109,108 | Trane Technologies PLC | 16,810,270 | ||||||
|
|
|
|||||||
| Capital Markets – 3.0% | ||||||||
| 130,514 | Ares Management Corp., Class A | 9,676,308 | ||||||
| 21,856 | MSCI, Inc. | 9,818,589 | ||||||
| 155,822 | TPG, Inc. | 4,574,934 | ||||||
| 72,113 | Tradeweb Markets, Inc., Class A | 5,018,344 | ||||||
|
|
|
|||||||
| 29,088,175 | ||||||||
|
|
|
|||||||
| Chemicals – 1.0% | ||||||||
| 96,926 | Ashland, Inc. | 9,863,190 | ||||||
|
|
|
|||||||
| Construction Materials – 1.0% | ||||||||
| 27,692 | Martin Marietta Materials, Inc. | 9,628,785 | ||||||
|
|
|
|||||||
| Containers & Packaging – 1.5% | ||||||||
| 260,145 | Ball Corp. | 14,518,692 | ||||||
|
|
|
|||||||
| Electrical Equipment – 3.9% | ||||||||
| 106,773 | AMETEK, Inc. | 12,829,844 | ||||||
| 102,680 | Rockwell Automation, Inc. | 24,328,999 | ||||||
|
|
|
|||||||
| 37,158,843 | ||||||||
|
|
|
|||||||
| Electronic Equipment, Instruments & Components – 4.0% | ||||||||
| 233,215 | Amphenol Corp., Class A | 17,148,299 | ||||||
| 129,659 | Keysight Technologies, Inc.* | 21,249,813 | ||||||
|
|
|
|||||||
| 38,398,112 | ||||||||
|
|
|
|||||||
| Entertainment – 2.7% | ||||||||
| 166,103 | Live Nation Entertainment, Inc.* | 15,009,067 | ||||||
| 818,534 | Warner Bros Discovery, Inc.* | 10,837,390 | ||||||
|
|
|
|||||||
| 25,846,457 | ||||||||
|
|
|
|||||||
| Equity Real Estate Investment Trusts (REITs) – 1.2% | ||||||||
| 89,418 | Ryman Hospitality Properties, Inc. REIT* | 7,351,948 | ||||||
| 13,932 | SBA Communications Corp. REIT | 4,531,383 | ||||||
|
|
|
|||||||
| 11,883,331 | ||||||||
|
|
|
|||||||
| Common Stocks – (continued) | ||||||||
| Food Products – 3.1% | ||||||||
| 170,501 | McCormick & Co., Inc. | 14,334,019 | ||||||
| 944,557 | Utz Brands, Inc. | 15,736,320 | ||||||
|
|
|
|||||||
| 30,070,339 | ||||||||
|
|
|
|||||||
| Health Care Equipment & Supplies – 6.4% | ||||||||
| 18,275 | Align Technology, Inc.* | 4,453,618 | ||||||
| 269,116 | Dexcom, Inc.* | 22,124,026 | ||||||
| 34,161 | IDEXX Laboratories, Inc.* | 11,875,047 | ||||||
| 90,239 | Insulet Corp.* | 23,053,357 | ||||||
|
|
|
|||||||
| 61,506,048 | ||||||||
|
|
|
|||||||
| Health Care Providers & Services – 1.4% | ||||||||
| 94,883 | AmerisourceBergen Corp. | 13,906,052 | ||||||
|
|
|
|||||||
| Health Care Technology – 2.1% | ||||||||
| 101,757 | Veeva Systems, Inc., Class A* | 20,282,205 | ||||||
|
|
|
|||||||
| Hotels, Restaurants & Leisure – 2.9% | ||||||||
| 26,454 | Domino’s Pizza, Inc. | 9,837,185 | ||||||
| 171,948 | Expedia Group, Inc.* | 17,650,462 | ||||||
|
|
|
|||||||
| 27,487,647 | ||||||||
|
|
|
|||||||
| Interactive Media & Services – 0.8% | ||||||||
| 702,272 | Snap, Inc., Class A* | 7,640,719 | ||||||
|
|
|
|||||||
| Internet & Direct Marketing Retail – 1.9% | ||||||||
| 178,078 | Etsy, Inc.* | 18,806,818 | ||||||
|
|
|
|||||||
| Life Sciences Tools & Services – 4.6% | ||||||||
| 291,074 | Avantor, Inc.* | 7,250,653 | ||||||
| 14,604 | Mettler-Toledo International, Inc.* | 17,706,766 | ||||||
| 64,905 | West Pharmaceutical Services, Inc. | 19,256,665 | ||||||
|
|
|
|||||||
| 44,214,084 | ||||||||
|
|
|
|||||||
| Machinery – 4.4% | ||||||||
| 54,159 | Chart Industries, Inc.* | 10,499,264 | ||||||
| 61,354 | Cummins, Inc. | 13,213,811 | ||||||
| 146,893 | Fortive Corp. | 9,302,734 | ||||||
| 127,703 | ITT, Inc. | 9,262,298 | ||||||
|
|
|
|||||||
| 42,278,107 | ||||||||
|
|
|
|||||||
| Metals & Mining – 0.6% | ||||||||
| 201,743 | Freeport-McMoRan, Inc. | 5,971,593 | ||||||
|
|
|
|||||||
| Oil, Gas & Consumable Fuels – 4.9% | ||||||||
| 102,589 | Cheniere Energy, Inc. | 16,432,706 | ||||||
| 124,518 | Devon Energy Corp. | 8,793,461 | ||||||
| 48,549 | Diamondback Energy, Inc. | 6,470,611 | ||||||
| 74,577 | Hess Corp. | 9,007,410 | ||||||
| 102,272 | Targa Resources Corp. | 6,978,019 | ||||||
|
|
|
|||||||
| 47,682,207 | ||||||||
|
|
|
|||||||
| Pharmaceuticals – 1.2% | ||||||||
| 127,638 | Catalent, Inc.* | 11,232,144 | ||||||
|
|
|
|||||||
| Professional Services – 4.9% | ||||||||
| 197,344 | CoStar Group, Inc.* | 13,743,036 | ||||||
| 206,045 | TransUnion | 15,220,544 | ||||||
| 97,930 | Verisk Analytics, Inc. | 18,328,579 | ||||||
|
|
|
|||||||
| 47,292,159 | ||||||||
|
|
|
|||||||
| 58 | The accompanying notes are an integral part of these financial statements. |
GOLDMAN SACHS MID CAP GROWTH FUND
| Shares |
Description | Value | ||||||
| Common Stocks – (continued) | ||||||||
| Road & Rail – 2.0% | ||||||||
| 46,000 | Old Dominion Freight Line, Inc. | $ | 12,484,860 | |||||
| 30,673 | Saia, Inc.* | 6,344,097 | ||||||
|
|
|
|||||||
| 18,828,957 | ||||||||
|
|
|
|||||||
| Semiconductors & Semiconductor Equipment – 6.3% | ||||||||
| 54,455 | Enphase Energy, Inc.* | 15,598,090 | ||||||
| 135,709 | Entegris, Inc. | 12,876,070 | ||||||
| 86,323 | MKS Instruments, Inc. | 8,598,634 | ||||||
| 223,054 | ON Semiconductor Corp.* | 15,339,423 | ||||||
| 75,191 | Wolfspeed, Inc.* | 8,531,923 | ||||||
|
|
|
|||||||
| 60,944,140 | ||||||||
|
|
|
|||||||
| Software – 14.6% | ||||||||
| 193,931 | AppLovin Corp., Class A* | 4,776,520 | ||||||
| 33,077 | Atlassian Corp. PLC, Class A* | 8,191,850 | ||||||
| 71,902 | Bill.com Holdings, Inc.* | 11,639,496 | ||||||
| 191,025 | Cadence Design Systems, Inc.* | 33,194,414 | ||||||
| 69,861 | Datadog, Inc., Class A* | 7,331,912 | ||||||
| 300,100 | Dynatrace, Inc.* | 11,457,818 | ||||||
| 42,751 | HubSpot, Inc.* | 14,408,797 | ||||||
| 22,012 | Palo Alto Networks, Inc.* | 12,256,502 | ||||||
| 41,411 | Paycom Software, Inc.* | 14,543,543 | ||||||
| 130,075 | Qualtrics International, Inc., Class A* | 1,593,419 | ||||||
| 101,403 | Trade Desk, Inc. (The), Class A* | 6,357,968 | ||||||
| 93,766 | Zscaler, Inc.* | 14,931,298 | ||||||
|
|
|
|||||||
| 140,683,537 | ||||||||
|
|
|
|||||||
| Specialty Retail – 2.9% | ||||||||
| 79,405 | Burlington Stores, Inc.* | 11,131,787 | ||||||
| 23,973 | RH* | 6,134,930 | ||||||
| 24,701 | Ulta Beauty, Inc.* | 10,371,209 | ||||||
|
|
|
|||||||
| 27,637,926 | ||||||||
|
|
|
|||||||
| Textiles, Apparel & Luxury Goods – 2.2% | ||||||||
| 69,426 | Lululemon Athletica, Inc.* | 20,825,023 | ||||||
|
|
|
|||||||
| TOTAL COMMON STOCKS | ||||||||
| (Cost $829,821,318) | $ | 939,424,061 | ||||||
|
|
|
|||||||
| Shares | Dividend Rate |
Value | ||||||
| Investment Company – 2.7%(a) | ||||||||
| |
Goldman Sachs Financial Square Government Fund – |
| ||||||
| 25,770,714 | 2.154% | $ | 25,770,714 | |||||
| (Cost $25,770,714) | ||||||||
|
|
|
|||||||
| TOTAL INVESTMENTS – 100.1% | ||||||||
| (Cost $855,592,032) | $ | 965,194,775 | ||||||
|
|
|
|||||||
| |
LIABILITIES IN EXCESS OF OTHER ASSETS – (0.1)% |
(725,733 | ) | |||||
|
|
|
|||||||
| NET ASSETS – 100.0% | $ | 964,469,042 | ||||||
|
|
|
|||||||
| The percentage shown for each investment category reflects the value of investments in that category as a percentage of net assets. | ||
| * |
Non-income producing security. | |
| (a) |
Represents an affiliated issuer. | |
|
| ||||
| Investment Abbreviations: | ||||
| ADR |
—American Depositary Receipt | |||
| PLC |
—Public Limited Company | |||
| REIT |
—Real Estate Investment Trust | |||
|
| ||||
| The accompanying notes are an integral part of these financial statements. | 59 |
GOLDMAN SACHS SMALL CAP GROWTH FUND
Schedule of Investments
August 31, 2022
| Shares |
Description | Value | ||||||
| Common Stocks – 98.2% | ||||||||
| Aerospace & Defense – 2.2% | ||||||||
| 10,044 | Kratos Defense & Security Solutions, Inc.* | $ | 125,952 | |||||
| 3,869 | Maxar Technologies, Inc. | 92,198 | ||||||
| 6,358 | Moog, Inc., Class A | 476,723 | ||||||
|
|
|
|||||||
| 694,873 | ||||||||
|
|
|
|||||||
| Biotechnology – 10.0% | ||||||||
| 5,843 | 2seventy bio, Inc.* | 86,067 | ||||||
| 7,182 | 4D Molecular Therapeutics, Inc.* | 56,451 | ||||||
| 10,835 | Agios Pharmaceuticals, Inc.* | 276,292 | ||||||
| 7,013 | Alkermes PLC* | 165,998 | ||||||
| 15,932 | Allogene Therapeutics, Inc.* | 218,428 | ||||||
| 24,556 | Annexon, Inc.* | 144,389 | ||||||
| 3,867 | Apellis Pharmaceuticals, Inc.* | 233,992 | ||||||
| 11,776 | Avidity Biosciences, Inc.* | 231,045 | ||||||
| 4,897 | Beam Therapeutics, Inc.* | 267,376 | ||||||
| 3,861 | Cytokinetics, Inc.* | 204,479 | ||||||
| 5,496 | Design Therapeutics, Inc.*(a) | 111,349 | ||||||
| 8,180 | Halozyme Therapeutics, Inc.* | 333,171 | ||||||
| 3,838 | Sage Therapeutics, Inc.* | 144,539 | ||||||
| 3,346 | Sarepta Therapeutics, Inc.* | 365,985 | ||||||
| 11,021 | Sutro Biopharma, Inc.* | 62,379 | ||||||
| 2,058 | Ultragenyx Pharmaceutical, Inc.* | 98,146 | ||||||
| 3,513 | Zentalis Pharmaceuticals, Inc.* | 94,184 | ||||||
|
|
|
|||||||
| 3,094,270 | ||||||||
|
|
|
|||||||
| Building Products – 2.8% | ||||||||
| 12,461 | AAON, Inc. | 716,259 | ||||||
| 9,105 | AZEK Co., Inc. (The)* | 166,166 | ||||||
|
|
|
|||||||
| 882,425 | ||||||||
|
|
|
|||||||
| Capital Markets – 4.1% | ||||||||
| 4,439 | Hamilton Lane, Inc., Class A | 308,865 | ||||||
| 3,314 | Houlihan Lokey, Inc. | 260,149 | ||||||
| 10,354 | Moelis & Co., Class A | 431,348 | ||||||
| 3,687 | PJT Partners, Inc., Class A | 255,214 | ||||||
|
|
|
|||||||
| 1,255,576 | ||||||||
|
|
|
|||||||
| Chemicals – 3.4% | ||||||||
| 5,064 | Ashland, Inc. | 515,313 | ||||||
| 4,120 | Balchem Corp. | 543,098 | ||||||
|
|
|
|||||||
| 1,058,411 | ||||||||
|
|
|
|||||||
| Construction & Engineering – 1.6% | ||||||||
| 7,102 | Ameresco, Inc., Class A* | 488,973 | ||||||
|
|
|
|||||||
| Diversified Consumer Services – 1.0% | ||||||||
| 20,041 | Udemy, Inc.* | 297,809 | ||||||
|
|
|
|||||||
| Electrical Equipment – 1.4% | ||||||||
| 16,632 | Shoals Technologies Group, Inc., Class A* | 438,586 | ||||||
|
|
|
|||||||
| Electronic Equipment, Instruments & Components – 3.3% | ||||||||
| 3,860 | 908 Devices, Inc.* | 77,779 | ||||||
| 6,745 | Badger Meter, Inc. | 638,684 | ||||||
| 2,318 | Novanta, Inc.* | 309,893 | ||||||
|
|
|
|||||||
| 1,026,356 | ||||||||
|
|
|
|||||||
| Common Stocks – (continued) | ||||||||
| Energy Equipment & Services – 0.6% | ||||||||
| 4,584 | Cactus, Inc., Class A | 183,131 | ||||||
|
|
|
|||||||
| Equity Real Estate Investment Trusts (REITs) – 0.9% | ||||||||
| 15,300 | Pebblebrook Hotel Trust REIT | 269,586 | ||||||
|
|
|
|||||||
| Food & Staples Retailing – 1.1% | ||||||||
| 4,594 | BJ’s Wholesale Club Holdings, Inc.* | 342,207 | ||||||
|
|
|
|||||||
| Food Products – 2.8% | ||||||||
| 3,800 | Freshpet, Inc.* | 165,414 | ||||||
| 15,727 | Hostess Brands, Inc.* | 364,552 | ||||||
| 22,692 | Sovos Brands, Inc.* | 346,507 | ||||||
|
|
|
|||||||
| 876,473 | ||||||||
|
|
|
|||||||
| Health Care Equipment & Supplies – 8.0% | ||||||||
| 7,297 | Axonics, Inc.* | 527,208 | ||||||
| 4,862 | Inari Medical, Inc.* | 337,180 | ||||||
| 2,876 | iRhythm Technologies, Inc.* | 424,066 | ||||||
| 4,253 | Omnicell, Inc.* | 435,039 | ||||||
| 9,730 | Outset Medical, Inc.* | 177,962 | ||||||
| 1,436 | Shockwave Medical, Inc.* | 426,291 | ||||||
| 3,107 | Tandem Diabetes Care, Inc.* | 142,114 | ||||||
|
|
|
|||||||
| 2,469,860 | ||||||||
|
|
|
|||||||
| Health Care Providers & Services – 1.4% | ||||||||
| 21,509 | Alignment Healthcare, Inc.* | 327,152 | ||||||
| 2,743 | National Research Corp. | 93,564 | ||||||
|
|
|
|||||||
| 420,716 | ||||||||
|
|
|
|||||||
| Health Care Technology – 2.7% | ||||||||
| 11,138 | Evolent Health, Inc., Class A* | 409,321 | ||||||
| 6,973 | Simulations Plus, Inc. | 418,729 | ||||||
|
|
|
|||||||
| 828,050 | ||||||||
|
|
|
|||||||
| Hotels, Restaurants & Leisure – 5.1% | ||||||||
| 16,054 | First Watch Restaurant Group, Inc.* | 269,226 | ||||||
| 2,364 | Papa John’s International, Inc. | 191,082 | ||||||
| 18,743 | Playa Hotels & Resorts NV* | 122,954 | ||||||
| 9,734 | Sweetgreen, Inc., Class A*(a) | 164,602 | ||||||
| 3,559 | Texas Roadhouse, Inc. | 315,897 | ||||||
| 2,512 | Wingstop, Inc. | 286,016 | ||||||
| 3,329 | Wyndham Hotels & Resorts, Inc. | 217,517 | ||||||
|
|
|
|||||||
| 1,567,294 | ||||||||
|
|
|
|||||||
| Household Durables – 1.5% | ||||||||
| 11,244 | Sonos, Inc.* | 169,110 | ||||||
| 1,607 | TopBuild Corp.* | 295,302 | ||||||
|
|
|
|||||||
| 464,412 | ||||||||
|
|
|
|||||||
| Insurance – 1.1% | ||||||||
| 4,454 | Palomar Holdings, Inc.* | 353,158 | ||||||
|
|
|
|||||||
| Internet & Direct Marketing Retail – 1.1% | ||||||||
| 6,812 | Xometry, Inc., Class A*(a) | 333,856 | ||||||
|
|
|
|||||||
| IT Services – 2.9% | ||||||||
| 3,056 | ExlService Holdings, Inc.* | 512,522 | ||||||
| 15,614 | Flywire Corp.* | 388,164 | ||||||
|
|
|
|||||||
| 900,686 | ||||||||
|
|
|
|||||||
| 60 | The accompanying notes are an integral part of these financial statements. |
GOLDMAN SACHS SMALL CAP GROWTH FUND
| Shares |
Description | Value | ||||||
| Common Stocks – (continued) | ||||||||
| Leisure Products – 0.3% | ||||||||
| 14,184 | Latham Group, Inc.* | $ | 80,991 | |||||
|
|
|
|||||||
| Life Sciences Tools & Services – 0.9% | ||||||||
| 13,840 | MaxCyte, Inc.* | 71,968 | ||||||
| 4,477 | Olink Holding AB ADR (Sweden)*(a) | 67,782 | ||||||
| 17,190 | Pacific Biosciences of California, Inc.* | 100,733 | ||||||
| 12,835 | Rapid Micro Biosystems, Inc., Class A*(a) | 42,741 | ||||||
|
|
|
|||||||
| 283,224 | ||||||||
|
|
|
|||||||
| Machinery – 10.3% | ||||||||
| 2,684 | Chart Industries, Inc.* | 520,320 | ||||||
| 8,922 | Evoqua Water Technologies Corp.* | 312,984 | ||||||
| 11,537 | Federal Signal Corp. | 459,980 | ||||||
| 4,803 | Franklin Electric Co., Inc. | 417,140 | ||||||
| 2,648 | RBC Bearings, Inc.* | 637,321 | ||||||
| 11,186 | Shyft Group, Inc. (The) | 267,905 | ||||||
| 4,164 | Watts Water Technologies, Inc., Class A | 576,797 | ||||||
|
|
|
|||||||
| 3,192,447 | ||||||||
|
|
|
|||||||
| Oil, Gas & Consumable Fuels – 3.3% | ||||||||
| 4,181 | Callon Petroleum Co.* | 177,943 | ||||||
| 3,536 | Denbury, Inc.* | 314,457 | ||||||
| 28,491 | Kosmos Energy Ltd. (Ghana)* | 201,431 | ||||||
| 2,695 | Matador Resources Co. | 160,622 | ||||||
| 21,335 | Permian Resources Corp., Class A* | 175,587 | ||||||
|
|
|
|||||||
| 1,030,040 | ||||||||
|
|
|
|||||||
| Personal Products – 1.6% | ||||||||
| 12,810 | elf Beauty, Inc.* | 488,445 | ||||||
|
|
|
|||||||
| Pharmaceuticals – 0.2% | ||||||||
| 2,631 | Atea Pharmaceuticals, Inc.* | 19,733 | ||||||
| 6,423 | Pharvaris NV (Netherlands)* | 58,385 | ||||||
|
|
|
|||||||
| 78,118 | ||||||||
|
|
|
|||||||
| Road & Rail – 1.4% | ||||||||
| 2,099 | Saia, Inc.* | 434,136 | ||||||
|
|
|
|||||||
| Semiconductors & Semiconductor Equipment – 5.5% | ||||||||
| 5,893 | Axcelis Technologies, Inc.* | 394,477 | ||||||
| 5,048 | Cohu, Inc.* | 135,438 | ||||||
| 15,507 | Credo Technology Group Holding Ltd.* | 213,842 | ||||||
| 6,052 | FormFactor, Inc.* | 177,203 | ||||||
| 6,982 | MaxLinear, Inc.* | 250,863 | ||||||
| 3,472 | Onto Innovation, Inc.* | 246,477 | ||||||
| 4,074 | Power Integrations, Inc. | 291,413 | ||||||
|
|
|
|||||||
| 1,709,713 | ||||||||
|
|
|
|||||||
| Software – 9.8% | ||||||||
| 8,367 | Domo, Inc., Class B* | 161,148 | ||||||
| 21,719 | EverCommerce, Inc.*(a) | 252,809 | ||||||
| 10,763 | Expensify, Inc., Class A* | 195,133 | ||||||
| 15,216 | ForgeRock, Inc., Class A* | 259,585 | ||||||
| 18,622 | Instructure Holdings, Inc.* | 423,278 | ||||||
| 9,906 | JFrog Ltd. (Israel)* | 209,512 | ||||||
| 16,445 | KnowBe4, Inc., Class A* | 316,073 | ||||||
| 4,874 | New Relic, Inc.* | 295,901 | ||||||
|
|
|
|||||||
| Common Stocks – (continued) | ||||||||
| Software – (continued) | ||||||||
| 12,624 | PagerDuty, Inc.* | $ | 328,729 | |||||
| 4,317 | Sprout Social, Inc., Class A* | 259,193 | ||||||
| 8,025 | Tenable Holdings, Inc.* | 317,870 | ||||||
|
|
|
|||||||
| 3,019,231 | ||||||||
|
|
|
|||||||
| Specialty Retail – 2.8% | ||||||||
| 19,813 | Arhaus, Inc.* | 169,599 | ||||||
| 2,279 | Asbury Automotive Group, Inc.* | 397,640 | ||||||
| 2,446 | Boot Barn Holdings, Inc.* | 162,953 | ||||||
| 9,236 | Leslie’s, Inc.* | 130,966 | ||||||
|
|
|
|||||||
| 861,158 | ||||||||
|
|
|
|||||||
| Textiles, Apparel & Luxury Goods – 1.0% | ||||||||
| 4,049 | Crocs, Inc.* | 298,411 | ||||||
|
|
|
|||||||
| Trading Companies & Distributors – 1.5% | ||||||||
| 20,388 | Core & Main, Inc., Class A* | 480,545 | ||||||
|
|
|
|||||||
| Wireless Telecommunication Services – 0.6% | ||||||||
| 11,896 | Gogo, Inc.* | 176,775 | ||||||
|
|
|
|||||||
| TOTAL COMMON STOCKS | ||||||||
| (Cost $29,650,091) | $ | 30,379,942 | ||||||
|
|
|
|||||||
| Shares | Dividend Rate |
Value | ||||
| Investment Company – 1.3%(b) | ||||||
| Goldman Sachs Financial Square Government Fund – Institutional Shares |
| |||||
| 404,748 | 2.154% | $ | 404,748 | |||
| (Cost $404,748) |
| |||||
|
|
||||||
| TOTAL INVESTMENTS BEFORE SECURITIES LENDING REINVESTMENT VEHICLE |
| |||||
| (Cost $30,054,839) | $ | 30,784,690 | ||||
|
|
||||||
| Securities Lending Reinvestment Vehicle – 2.2%(b) | ||||||
| Goldman Sachs Financial Square Government Fund – Institutional Shares |
| |||||
| 678,997 | 2.154% | $ | 678,997 | |||
| (Cost $678,997) |
| |||||
|
|
||||||
| TOTAL INVESTMENTS – 101.7% |
| |||||
| (Cost $30,733,836) | $ | 31,463,687 | ||||
|
|
||||||
| LIABILITIES IN EXCESS OF OTHER ASSETS – (1.7)% | (537,480 | ) | ||||
|
|
||||||
| NET ASSETS – 100.0% | $ | 30,926,207 | ||||
|
|
||||||
| The accompanying notes are an integral part of these financial statements. | 61 |
GOLDMAN SACHS SMALL CAP GROWTH FUND
Schedule of Investments (continued)
August 31, 2022
| The percentage shown for each investment category reflects the value of investments in that category as a percentage of net assets. | ||
| * |
Non-income producing security. | |
| (a) |
All or a portion of security is on loan. | |
| (b) |
Represents an affiliated issuer. | |
|
| ||
| Investment Abbreviations: | ||
| ADR |
—American Depositary Receipt | |
| PLC |
—Public Limited Company | |
| REIT |
—Real Estate Investment Trust | |
|
| ||
| 62 | The accompanying notes are an integral part of these financial statements. |
GOLDMAN SACHS SMALL/MID CAP GROWTH FUND
Schedule of Investments
August 31, 2022
| Shares |
Description | Value | ||||||
| Common Stocks – 99.0% | ||||||||
| Aerospace & Defense – 0.9% | ||||||||
| 126,524 | HEICO Corp. | $ | 19,269,605 | |||||
|
|
|
|||||||
| Biotechnology – 7.0% | ||||||||
| 525,520 | Agios Pharmaceuticals, Inc.* | 13,400,760 | ||||||
| 300,782 | Allogene Therapeutics, Inc.* | 4,123,721 | ||||||
| 48,728 | Alnylam Pharmaceuticals, Inc.* | 10,070,616 | ||||||
| 295,883 | Beam Therapeutics, Inc.* | 16,155,212 | ||||||
| 1,199,123 | Exelixis, Inc.* | 21,272,442 | ||||||
| 759,294 | Halozyme Therapeutics, Inc.* | 30,926,045 | ||||||
| 336,983 | Neurocrine Biosciences, Inc.* | 35,258,531 | ||||||
| 344,860 | Ultragenyx Pharmaceutical, Inc.* | 16,446,373 | ||||||
|
|
|
|||||||
| 147,653,700 | ||||||||
|
|
|
|||||||
| Building Products – 3.4% | ||||||||
| 568,358 | AAON, Inc. | 32,669,218 | ||||||
| 308,094 | Allegion PLC | 29,299,739 | ||||||
| 543,444 | AZEK Co., Inc. (The)* | 9,917,853 | ||||||
|
|
|
|||||||
| 71,886,810 | ||||||||
|
|
|
|||||||
| Capital Markets – 4.7% | ||||||||
| 68,360 | FactSet Research Systems, Inc. | 29,623,122 | ||||||
| 148,249 | Houlihan Lokey, Inc. | 11,637,547 | ||||||
| 146,323 | LPL Financial Holdings, Inc. | 32,385,670 | ||||||
| 274,740 | Stifel Financial Corp. | 16,294,829 | ||||||
| 359,806 | TPG, Inc.(a) | 10,563,904 | ||||||
|
|
|
|||||||
| 100,505,072 | ||||||||
|
|
|
|||||||
| Chemicals – 3.6% | ||||||||
| 407,678 | Ashland, Inc. | 41,485,313 | ||||||
| 375,790 | RPM International, Inc. | 35,008,597 | ||||||
|
|
|
|||||||
| 76,493,910 | ||||||||
|
|
|
|||||||
| Commercial Services & Supplies – 1.7% | ||||||||
| 267,458 | Tetra Tech, Inc. | 36,323,471 | ||||||
|
|
|
|||||||
| Communications Equipment – 0.8% | ||||||||
| 329,751 | Ciena Corp.* | 16,731,566 | ||||||
|
|
|
|||||||
| Construction & Engineering – 1.8% | ||||||||
| 361,681 | Ameresco, Inc., Class A* | 24,901,737 | ||||||
| 91,393 | Quanta Services, Inc. | 12,913,831 | ||||||
|
|
|
|||||||
| 37,815,568 | ||||||||
|
|
|
|||||||
| Containers & Packaging – 1.9% | ||||||||
| 145,322 | Avery Dennison Corp. | 26,684,025 | ||||||
| 246,527 | Ball Corp. | 13,758,672 | ||||||
|
|
|
|||||||
| 40,442,697 | ||||||||
|
|
|
|||||||
| Diversified Consumer Services – 0.7% | ||||||||
| 206,608 | Bright Horizons Family Solutions, Inc.* | 14,090,666 | ||||||
|
|
|
|||||||
| Electrical Equipment – 0.9% | ||||||||
| 755,936 | Shoals Technologies Group, Inc., Class A* | 19,934,032 | ||||||
|
|
|
|||||||
| Common Stocks – (continued) | ||||||||
| Electronic Equipment, Instruments & Components – 2.0% | ||||||||
| 165,581 | Novanta, Inc.* | 22,136,524 | ||||||
| 53,335 | Teledyne Technologies, Inc.* | 19,646,480 | ||||||
|
|
|
|||||||
| 41,783,004 | ||||||||
|
|
|
|||||||
| Entertainment – 0.5% | ||||||||
| 168,770 | Liberty Media Corp.-Liberty Formula One, Class C* | 10,747,274 | ||||||
|
|
|
|||||||
| Equity Real Estate Investment Trusts (REITs) – 0.7% | ||||||||
| 189,307 | Ryman Hospitality Properties, Inc. REIT* | 15,564,822 | ||||||
|
|
|
|||||||
| Food & Staples Retailing – 2.9% | ||||||||
| 528,297 | BJ’s Wholesale Club Holdings, Inc.* | 39,352,844 | ||||||
| 101,360 | Casey’s General Stores, Inc. | 21,667,727 | ||||||
|
|
|
|||||||
| 61,020,571 | ||||||||
|
|
|
|||||||
| Food Products – 1.3% | ||||||||
| 234,766 | Freshpet, Inc.* | 10,219,364 | ||||||
| 726,280 | Hostess Brands, Inc.* | 16,835,170 | ||||||
|
|
|
|||||||
| 27,054,534 | ||||||||
|
|
|
|||||||
| Health Care Equipment & Supplies – 5.3% | ||||||||
| 302,668 | Axonics, Inc.* | 21,867,763 | ||||||
| 207,041 | Inari Medical, Inc.* | 14,358,293 | ||||||
| 83,008 | Insulet Corp.* | 21,206,054 | ||||||
| 113,835 | iRhythm Technologies, Inc.* | 16,784,971 | ||||||
| 168,134 | Omnicell, Inc.* | 17,198,427 | ||||||
| 67,500 | Shockwave Medical, Inc.* | 20,038,050 | ||||||
|
|
|
|||||||
| 111,453,558 | ||||||||
|
|
|
|||||||
| Health Care Providers & Services – 3.6% | ||||||||
| 1,305,443 | Alignment Healthcare, Inc.* | 19,855,788 | ||||||
| 424,630 | Guardant Health, Inc.* | 21,256,978 | ||||||
| 102,343 | Molina Healthcare, Inc.* | 34,527,458 | ||||||
|
|
|
|||||||
| 75,640,224 | ||||||||
|
|
|
|||||||
| Health Care Technology – 0.5% | ||||||||
| 655,577 | Certara, Inc.* | 10,272,892 | ||||||
|
|
|
|||||||
| Hotels, Restaurants & Leisure – 4.3% | ||||||||
| 417,654 | Planet Fitness, Inc., Class A* | 28,296,059 | ||||||
| 319,216 | Texas Roadhouse, Inc. | 28,333,612 | ||||||
| 96,147 | Vail Resorts, Inc. | 21,602,308 | ||||||
| 208,988 | Wyndham Hotels & Resorts, Inc. | 13,655,276 | ||||||
|
|
|
|||||||
| 91,887,255 | ||||||||
|
|
|
|||||||
| Insurance – 0.5% | ||||||||
| 42,077 | Kinsale Capital Group, Inc. | 10,669,886 | ||||||
|
|
|
|||||||
| Interactive Media & Services – 1.2% | ||||||||
| 323,204 | Bumble, Inc., Class A* | 8,096,260 | ||||||
| 365,481 | ZoomInfo Technologies, Inc.* | 16,600,147 | ||||||
|
|
|
|||||||
| 24,696,407 | ||||||||
|
|
|
|||||||
| IT Services – 1.8% | ||||||||
| 279,110 | DigitalOcean Holdings, Inc.*(a) | 11,747,740 | ||||||
| 80,601 | Jack Henry & Associates, Inc. | 15,491,512 | ||||||
|
|
|
|||||||
| The accompanying notes are an integral part of these financial statements. | 63 |
GOLDMAN SACHS SMALL/MID CAP GROWTH FUND
Schedule of Investments (continued)
August 31, 2022
| Shares |
Description | Value | ||||||
| Common Stocks – (continued) | ||||||||
| IT Services – (continued) | ||||||||
| 598,439 | Toast, Inc., Class A* | $ | 11,328,450 | |||||
|
|
|
|||||||
| 38,567,702 | ||||||||
|
|
|
|||||||
| Life Sciences Tools & Services – 3.9% | ||||||||
| 653,263 | Pacific Biosciences of California, Inc.* | 3,828,121 | ||||||
| 723,319 | QIAGEN NV* | 32,860,382 | ||||||
| 123,828 | Repligen Corp.* | 27,164,149 | ||||||
| 1,083,157 | Stevanato Group SPA (Italy)(a) | 17,980,406 | ||||||
|
|
|
|||||||
| 81,833,058 | ||||||||
|
|
|
|||||||
| Machinery – 8.7% | ||||||||
| 131,916 | Chart Industries, Inc.* | 25,573,236 | ||||||
| 158,815 | IDEX Corp. | 31,955,166 | ||||||
| 166,284 | Nordson Corp. | 37,774,736 | ||||||
| 179,482 | RBC Bearings, Inc.* | 43,197,728 | ||||||
| 249,778 | Toro Co. (The) | 20,714,090 | ||||||
| 112,333 | Watts Water Technologies, Inc., Class A | 15,560,367 | ||||||
| 99,106 | Xylem, Inc. | 9,028,556 | ||||||
|
|
|
|||||||
| 183,803,879 | ||||||||
|
|
|
|||||||
| Oil, Gas & Consumable Fuels – 2.8% | ||||||||
| 374,766 | Antero Resources Corp.* | 15,020,621 | ||||||
| 123,237 | Chesapeake Energy Corp. | 12,384,086 | ||||||
| 204,034 | Denbury, Inc.* | 18,144,744 | ||||||
| 243,315 | Matador Resources Co. | 14,501,574 | ||||||
|
|
|
|||||||
| 60,051,025 | ||||||||
|
|
|
|||||||
| Personal Products – 0.4% | ||||||||
| 685,921 | Olaplex Holdings, Inc.* | 9,136,468 | ||||||
|
|
|
|||||||
| Professional Services – 2.7% | ||||||||
| 226,697 | Booz Allen Hamilton Holding Corp. | 21,694,903 | ||||||
| 282,262 | Jacobs Solutions, Inc. | 35,164,200 | ||||||
|
|
|
|||||||
| 56,859,103 | ||||||||
|
|
|
|||||||
| Semiconductors & Semiconductor Equipment – 6.3% | ||||||||
| 1,109,411 | Allegro MicroSystems, Inc. (Japan)* | 25,871,465 | ||||||
| 280,075 | Entegris, Inc. | 26,573,516 | ||||||
| 684,096 | Lattice Semiconductor Corp.* | 36,872,774 | ||||||
| 410,809 | MACOM Technology Solutions Holdings, Inc.* | 22,656,116 | ||||||
| 219,933 | MKS Instruments, Inc. | 21,907,526 | ||||||
|
|
|
|||||||
| 133,881,397 | ||||||||
|
|
|
|||||||
| Software – 12.2% | ||||||||
| 81,465 | Bill.com Holdings, Inc.* | 13,187,554 | ||||||
| 167,540 | CyberArk Software Ltd.* | 24,172,671 | ||||||
| 768,756 | Dynatrace, Inc.* | 29,351,104 | ||||||
| 201,681 | Elastic NV* | 16,923,053 | ||||||
| 1,104,732 | EverCommerce, Inc.* | 12,859,080 | ||||||
| 177,709 | Manhattan Associates, Inc.* | 25,103,173 | ||||||
| 317,898 | nCino, Inc.* | 10,026,503 | ||||||
| 157,111 | Paylocity Holding Corp.* | 37,863,751 | ||||||
| 282,095 | Procore Technologies, Inc.* | 15,402,387 | ||||||
|
|
|
|||||||
| Common Stocks – (continued) | ||||||||
| Software – (continued) | ||||||||
| 1,191,617 | Qualtrics International, Inc., Class A* | 14,597,308 | ||||||
| 339,259 | Rapid7, Inc.* | 19,507,392 | ||||||
| 940,842 | Samsara, Inc., Class A* | 13,990,321 | ||||||
| 459,932 | Smartsheet, Inc., Class A* | 15,301,938 | ||||||
| 147,894 | Workiva, Inc.* | 10,040,524 | ||||||
|
|
|
|||||||
| 258,326,759 | ||||||||
|
|
|
|||||||
| Specialty Retail – 2.7% | ||||||||
| 198,357 | Five Below, Inc.* | 25,365,893 | ||||||
| 218,229 | Floor & Decor Holdings, Inc., Class A* | 17,755,112 | ||||||
| 50,000 | Lithia Motors, Inc. | 13,272,000 | ||||||
|
|
|
|||||||
| 56,393,005 | ||||||||
|
|
|
|||||||
| Technology Hardware, Storage & Peripherals – 1.3% | ||||||||
| 982,794 | Pure Storage, Inc., Class A* | 28,471,542 | ||||||
|
|
|
|||||||
| Textiles, Apparel & Luxury Goods – 3.3% | ||||||||
| 260,207 | Crocs, Inc.* | 19,177,256 | ||||||
| 104,854 | Deckers Outdoor Corp.* | 33,717,901 | ||||||
| 562,046 | Levi Strauss & Co., Class A | 9,492,957 | ||||||
| 403,846 | On Holding AG, Class A (Switzerland)* | 8,072,881 | ||||||
|
|
|
|||||||
| 70,460,995 | ||||||||
|
|
|
|||||||
| Trading Companies & Distributors – 2.7% | ||||||||
| 1,346,761 | Core & Main, Inc., Class A* | 31,743,157 | ||||||
| 194,333 | SiteOne Landscape Supply, Inc.* | 24,322,718 | ||||||
|
|
|
|||||||
| 56,065,875 | ||||||||
|
|
|
|||||||
| TOTAL COMMON STOCKS | ||||||||
| (Cost $2,061,767,602) | $ | 2,095,788,332 | ||||||
|
|
|
|||||||
| Shares | Dividend Rate |
Value | ||||
| Investment Company – 0.2%(b) | ||||||
| Goldman Sachs Financial Square Government Fund – Institutional Shares |
| |||||
| 4,992,100 | 2.154% | $ | 4,992,100 | |||
| (Cost $4,992,100) |
| |||||
|
|
||||||
| TOTAL INVESTMENTS BEFORE SECURITIES LENDING REINVESTMENT VEHICLE |
| |||||
| (Cost $2,066,759,702) | $ | 2,100,780,432 | ||||
|
|
||||||
| 64 | The accompanying notes are an integral part of these financial statements. |
GOLDMAN SACHS SMALL/MID CAP GROWTH FUND
| Shares | Dividend Rate |
Value | ||||
| Securities Lending Reinvestment Vehicle – 0.3%(b) | ||||||
| Goldman Sachs Financial Square Government Fund – Institutional Shares |
| |||||
| 7,120,875 | 2.154% | $ | 7,120,875 | |||
| (Cost $7,120,875) |
| |||||
|
|
||||||
| TOTAL INVESTMENTS – 99.5% |
| |||||
| (Cost $2,073,880,577) | $ | 2,107,901,307 | ||||
|
|
||||||
| OTHER ASSETS IN EXCESS OF LIABILITIES – 0.5% | 10,124,220 | |||||
|
|
||||||
| NET ASSETS – 100.0% | $ | 2,118,025,527 | ||||
|
|
||||||
| The percentage shown for each investment category reflects the value of investments in that category as a percentage of net assets. | ||
| * |
Non-income producing security. | |
| (a) |
All or a portion of security is on loan. | |
| (b) |
Represents an affiliated issuer. | |
|
| ||
| Investment Abbreviations: | ||
| PLC |
—Public Limited Company | |
| REIT |
—Real Estate Investment Trust | |
|
| ||
| The accompanying notes are an integral part of these financial statements. | 65 |
GOLDMAN SACHS STRATEGIC GROWTH FUND
Schedule of Investments
August 31, 2022
| Shares |
Description | Value | ||||||
| Common Stocks – 98.9% | ||||||||
| Aerospace & Defense – 0.7% | ||||||||
| 6,509 | Boeing Co. (The)* | $ | 1,043,067 | |||||
|
|
|
|||||||
| Air Freight & Logistics – 1.1% | ||||||||
| 7,802 | United Parcel Service, Inc., Class B | 1,517,567 | ||||||
|
|
|
|||||||
| Auto Components – 0.5% | ||||||||
| 8,288 | Aptiv PLC* | 774,348 | ||||||
|
|
|
|||||||
| Automobiles – 3.4% | ||||||||
| 17,481 | Tesla, Inc.* | 4,817,938 | ||||||
|
|
|
|||||||
| Beverages – 2.2% | ||||||||
| 32,418 | Coca-Cola Co. (The) | 2,000,515 | ||||||
| 12,671 | Monster Beverage Corp.* | 1,125,565 | ||||||
|
|
|
|||||||
| 3,126,080 | ||||||||
|
|
|
|||||||
| Biotechnology – 2.7% | ||||||||
| 2,776 | Alnylam Pharmaceuticals, Inc.* | 573,716 | ||||||
| 3,361 | Argenx SE ADR (Netherlands)* | 1,270,021 | ||||||
| 4,868 | BioMarin Pharmaceutical, Inc.* | 434,226 | ||||||
| 4,393 | Sarepta Therapeutics, Inc.* | 480,506 | ||||||
| 7,261 | Seagen, Inc.* | 1,120,300 | ||||||
|
|
|
|||||||
| 3,878,769 | ||||||||
|
|
|
|||||||
| Capital Markets – 1.5% | ||||||||
| 24,676 | Charles Schwab Corp. (The) | 1,750,762 | ||||||
| 4,547 | Intercontinental Exchange, Inc. | 458,565 | ||||||
|
|
|
|||||||
| 2,209,327 | ||||||||
|
|
|
|||||||
| Chemicals – 2.5% | ||||||||
| 4,432 | Ecolab, Inc. | 726,094 | ||||||
| 3,536 | Linde PLC (United Kingdom) | 1,000,193 | ||||||
| 8,239 | Sherwin-Williams Co. (The) | 1,912,272 | ||||||
|
|
|
|||||||
| 3,638,559 | ||||||||
|
|
|
|||||||
| Construction Materials – 0.5% | ||||||||
| 2,203 | Martin Marietta Materials, Inc. | 766,005 | ||||||
|
|
|
|||||||
| Electronic Equipment, Instruments & Components – 1.0% | ||||||||
| 18,683 | Amphenol Corp., Class A | 1,373,761 | ||||||
|
|
|
|||||||
| Entertainment – 0.6% | ||||||||
| 10,102 | Live Nation Entertainment, Inc.* | 912,817 | ||||||
|
|
|
|||||||
| Equity Real Estate Investment Trusts (REITs) – 1.9% | ||||||||
| 6,133 | American Tower Corp. REIT | 1,558,089 | ||||||
| 1,715 | Equinix, Inc. REIT | 1,127,389 | ||||||
|
|
|
|||||||
| 2,685,478 | ||||||||
|
|
|
|||||||
| Food Products – 1.8% | ||||||||
| 19,307 | McCormick & Co., Inc. | 1,623,139 | ||||||
| 15,075 | Mondelez International, Inc., Class A | 932,540 | ||||||
|
|
|
|||||||
| 2,555,679 | ||||||||
|
|
|
|||||||
| Health Care Equipment & Supplies – 2.9% | ||||||||
| 40,074 | Boston Scientific Corp.* | 1,615,383 | ||||||
| 4,050 | Insulet Corp.* | 1,034,653 | ||||||
| 7,673 | Intuitive Surgical, Inc.* | 1,578,643 | ||||||
|
|
|
|||||||
| 4,228,679 | ||||||||
|
|
|
|||||||
| Common Stocks – (continued) | ||||||||
| Health Care Providers & Services – 3.6% | ||||||||
| 3,568 | Humana, Inc. | 1,718,991 | ||||||
| 6,547 | UnitedHealth Group, Inc. | 3,400,053 | ||||||
|
|
|
|||||||
| 5,119,044 | ||||||||
|
|
|
|||||||
| Health Care Technology – 0.7% | ||||||||
| 5,055 | Veeva Systems, Inc., Class A* | 1,007,563 | ||||||
|
|
|
|||||||
| Hotels, Restaurants & Leisure – 2.2% | ||||||||
| 865 | Chipotle Mexican Grill, Inc.* | 1,381,232 | ||||||
| 7,336 | McDonald’s Corp. | 1,850,726 | ||||||
|
|
|
|||||||
| 3,231,958 | ||||||||
|
|
|
|||||||
| Household Products – 1.6% | ||||||||
| 16,773 | Procter & Gamble Co. (The) | 2,313,668 | ||||||
|
|
|
|||||||
| Interactive Media & Services – 5.9% | ||||||||
| 38,951 | Alphabet, Inc., Class A* | 4,215,277 | ||||||
| 36,080 | Alphabet, Inc., Class C* | 3,938,132 | ||||||
| 33,478 | Snap, Inc., Class A* | 364,241 | ||||||
|
|
|
|||||||
| 8,517,650 | ||||||||
|
|
|
|||||||
| Internet & Direct Marketing Retail – 7.0% | ||||||||
| 73,206 | Amazon.com, Inc.* | 9,280,325 | ||||||
| 7,022 | Etsy, Inc.* | 741,593 | ||||||
|
|
|
|||||||
| 10,021,918 | ||||||||
|
|
|
|||||||
| IT Services – 7.5% | ||||||||
| 8,138 | Accenture PLC, Class A | 2,347,488 | ||||||
| 11,980 | Mastercard, Inc., Class A | 3,885,953 | ||||||
| 14,869 | PayPal Holdings, Inc.* | 1,389,359 | ||||||
| 8,037 | Snowflake, Inc., Class A* | 1,454,295 | ||||||
| 8,372 | Visa, Inc., Class A | 1,663,600 | ||||||
|
|
|
|||||||
| 10,740,695 | ||||||||
|
|
|
|||||||
| Life Sciences Tools & Services – 1.9% | ||||||||
| 5,528 | Danaher Corp. | 1,492,063 | ||||||
| 3,960 | West Pharmaceutical Services, Inc. | 1,174,892 | ||||||
|
|
|
|||||||
| 2,666,955 | ||||||||
|
|
|
|||||||
| Machinery – 1.1% | ||||||||
| 4,303 | Deere & Co. | 1,571,671 | ||||||
|
|
|
|||||||
| Personal Products – 0.8% | ||||||||
| 4,360 | Estee Lauder Cos., Inc. (The), Class A | 1,109,097 | ||||||
|
|
|
|||||||
| Pharmaceuticals – 2.1% | ||||||||
| 9,969 | Eli Lilly & Co. | 3,002,962 | ||||||
|
|
|
|||||||
| Professional Services – 1.2% | ||||||||
| 9,228 | Verisk Analytics, Inc. | 1,727,112 | ||||||
|
|
|
|||||||
| Road & Rail – 1.7% | ||||||||
| 4,922 | Old Dominion Freight Line, Inc. | 1,335,880 | ||||||
| 5,031 | Union Pacific Corp. | 1,129,510 | ||||||
|
|
|
|||||||
| 2,465,390 | ||||||||
|
|
|
|||||||
| Semiconductors & Semiconductor Equipment – 4.9% | ||||||||
| 5,624 | KLA Corp. | 1,935,387 | ||||||
|
|
|
|||||||
| 66 | The accompanying notes are an integral part of these financial statements. |
GOLDMAN SACHS STRATEGIC GROWTH FUND
| Shares |
Description | Value | ||||||
| Common Stocks – (continued) | ||||||||
| Semiconductors & Semiconductor Equipment – (continued) | ||||||||
| 36,880 | Marvell Technology, Inc. | $ | 1,726,722 | |||||
| 22,813 | NVIDIA Corp. | 3,443,394 | ||||||
|
|
|
|||||||
| 7,105,503 | ||||||||
|
|
|
|||||||
| Software – 16.4% | ||||||||
| 6,196 | Adobe, Inc.* | 2,313,834 | ||||||
| 4,284 | Atlassian Corp. PLC, Class A* | 1,060,975 | ||||||
| 6,156 | Bill.com Holdings, Inc.* | 996,533 | ||||||
| 2,192 | HubSpot, Inc.* | 738,792 | ||||||
| 58,297 | Microsoft Corp. | 15,242,917 | ||||||
| 3,943 | ServiceNow, Inc.* | 1,713,707 | ||||||
| 6,486 | Workday, Inc., Class A* | 1,067,336 | ||||||
| 3,195 | Zscaler, Inc.* | 508,772 | ||||||
|
|
|
|||||||
| 23,642,866 | ||||||||
|
|
|
|||||||
| Specialty Retail – 1.6% | ||||||||
| 3,074 | RH* | 786,668 | ||||||
| 18,264 | Ross Stores, Inc. | 1,575,635 | ||||||
|
|
|
|||||||
| 2,362,303 | ||||||||
|
|
|
|||||||
| Technology Hardware, Storage & Peripherals – 13.3% | ||||||||
| 121,542 | Apple, Inc. | 19,108,833 | ||||||
|
|
|
|||||||
| Textiles, Apparel & Luxury Goods – 2.1% | ||||||||
| 3,397 | Lululemon Athletica, Inc.* | 1,018,964 | ||||||
| 19,054 | NIKE, Inc., Class B | 2,028,298 | ||||||
|
|
|
|||||||
| 3,047,262 | ||||||||
|
|
|
|||||||
| TOTAL COMMON STOCKS | ||||||||
| (Cost $74,811,434) | $ | 142,290,524 | ||||||
|
|
|
|||||||
| Shares | Dividend Rate |
Value | ||||
| Investment Company – 0.8%(a) | ||||||
| Goldman Sachs Financial Square Government Fund – Institutional Shares |
| |||||
| 1,183,975 | 2.154% | $ | 1,183,975 | |||
| (Cost $1,183,975) |
| |||||
|
|
||||||
| TOTAL INVESTMENTS – 99.7% |
| |||||
| (Cost $75,995,409) | $ | 143,474,499 | ||||
|
|
||||||
| OTHER ASSETS IN EXCESS OF LIABILITIES – 0.3% | 434,073 | |||||
|
|
||||||
| NET ASSETS – 100.0% | $ | 143,908,572 | ||||
|
|
||||||
| The percentage shown for each investment category reflects the value of investments in that category as a percentage of net assets. | ||
| * |
Non-income producing security. | |
| (a) |
Represents an affiliated issuer. | |
|
| ||
| Investment Abbreviations: | ||
| ADR |
—American Depositary Receipt | |
| PLC |
—Public Limited Company | |
| REIT |
—Real Estate Investment Trust | |
|
| ||
| The accompanying notes are an integral part of these financial statements. | 67 |
GOLDMAN SACHS TECHNOLOGY OPPORTUNITIES FUND
Schedule of Investments
August 31, 2022
| Shares |
Description | Value | ||||||
| Common Stocks – 99.3% | ||||||||
| Communications Equipment – 2.6% | ||||||||
| 358,557 | Cisco Systems, Inc. | $ | 16,034,669 | |||||
|
|
|
|||||||
| Equity Real Estate Investment Trusts (REITs) – 6.2% | ||||||||
| 83,110 | American Tower Corp. REIT | 21,114,095 | ||||||
| 26,420 | Equinix, Inc. REIT | 17,367,716 | ||||||
|
|
|
|||||||
| 38,481,811 | ||||||||
|
|
|
|||||||
| Interactive Media & Services – 8.6% | ||||||||
| 268,680 | Alphabet, Inc., Class C* | 29,326,422 | ||||||
| 99,371 | Meta Platforms, Inc., Class A* | 16,190,517 | ||||||
| 713,044 | Snap, Inc., Class A* | 7,757,919 | ||||||
|
|
|
|||||||
| 53,274,858 | ||||||||
|
|
|
|||||||
| Internet & Direct Marketing Retail – 9.8% | ||||||||
| 417,578 | Amazon.com, Inc.* | 52,936,363 | ||||||
| 8,875 | MercadoLibre, Inc. (Brazil) * | 7,591,320 | ||||||
|
|
|
|||||||
| 60,527,683 | ||||||||
|
|
|
|||||||
| IT Services – 12.2% | ||||||||
| 71,165 | Accenture PLC, Class A | 20,528,256 | ||||||
| 77,753 | Cognizant Technology Solutions Corp., Class A | 4,911,657 | ||||||
| 149,572 | Fidelity National Information Services, Inc. | 13,666,393 | ||||||
| 134,892 | PayPal Holdings, Inc.* | 12,604,308 | ||||||
| 67,725 | Snowflake, Inc., Class A* | 12,254,839 | ||||||
| 57,601 | Visa, Inc., Class A | 11,445,895 | ||||||
|
|
|
|||||||
| 75,411,348 | ||||||||
|
|
|
|||||||
| Road & Rail – 1.8% | ||||||||
| 396,872 | Uber Technologies, Inc.* | 11,414,039 | ||||||
|
|
|
|||||||
| Semiconductors & Semiconductor Equipment – 16.6% | ||||||||
| 55,522 | KLA Corp. | 19,106,786 | ||||||
| 24,019 | Lam Research Corp. | 10,518,160 | ||||||
| 345,458 | Marvell Technology, Inc. | 16,174,344 | ||||||
| 132,630 | Microchip Technology, Inc. | 8,654,107 | ||||||
| 105,722 | NVIDIA Corp. | 15,957,679 | ||||||
| 56,591 | NXP Semiconductors NV (China) | 9,313,747 | ||||||
| 192,572 | ON Semiconductor Corp.* | 13,243,176 | ||||||
| 58,027 | Texas Instruments, Inc. | 9,586,641 | ||||||
|
|
|
|||||||
| 102,554,640 | ||||||||
|
|
|
|||||||
| Software – 36.1% | ||||||||
| 66,526 | Adobe, Inc.* | 24,843,469 | ||||||
| 59,285 | Atlassian Corp. PLC, Class A* | 14,682,523 | ||||||
| 24,843 | HubSpot, Inc.* | 8,373,085 | ||||||
| 284,218 | Microsoft Corp. | 74,314,480 | ||||||
| 34,758 | Palo Alto Networks, Inc.* | 19,353,602 | ||||||
| 32,085 | Paycom Software, Inc.* | 11,268,252 | ||||||
| 102,875 | Salesforce, Inc.* | 16,060,845 | ||||||
| 38,970 | ServiceNow, Inc.* | 16,937,141 | ||||||
| 120,929 | Splunk, Inc.* | 10,887,238 | ||||||
| 437,580 | UiPath, Inc., Class A* | 7,198,191 | ||||||
| 72,998 | Workday, Inc., Class A* | 12,012,551 | ||||||
| 46,582 | Zscaler, Inc.* | 7,417,718 | ||||||
|
|
|
|||||||
| 223,349,095 | ||||||||
|
|
|
|||||||
| Common Stocks – (continued) | ||||||||
| Technology Hardware, Storage & Peripherals – 5.4% | ||||||||
| 211,942 | Apple, Inc. | 33,321,521 | ||||||
|
|
|
|||||||
| TOTAL COMMON STOCKS | ||||||||
| (Cost $465,923,394) | $ | 614,369,664 | ||||||
|
|
|
|||||||
| Shares | Dividend Rate |
Value | ||||||
| Investment Company – 0.7%(a) | ||||||||
| |
Goldman Sachs Financial Square Government Fund – |
| ||||||
| 4,488,694 | 2.154% | $ | 4,488,694 | |||||
| (Cost $4,488,694) | ||||||||
|
|
|
|||||||
| TOTAL INVESTMENTS – 100.0% | ||||||||
| (Cost $470,412,088) | $ | 618,858,358 | ||||||
|
|
|
|||||||
| |
LIABILITIES IN EXCESS OF OTHER ASSETS – (0.0)% |
(411,001 | ) | |||||
|
|
|
|||||||
| NET ASSETS – 100.0% | $ | 618,447,357 | ||||||
|
|
|
|||||||
| The percentage shown for each investment category reflects the value of investments in that category as a percentage of net assets. | ||
| * |
Non-income producing security. | |
| (a) |
Represents an affiliated issuer. | |
|
| ||
| Investment Abbreviations: | ||
| PLC |
—Public Limited Company | |
| REIT |
—Real Estate Investment Trust | |
|
| ||
| 68 | The accompanying notes are an integral part of these financial statements. |
GOLDMAN SACHS U.S. EQUITY ESG FUND
Schedule of Investments
August 31, 2022
| Shares |
Description | Value | ||||||
| Common Stocks – 98.2% | ||||||||
| Auto Components – 1.9% | ||||||||
| 3,712 | Aptiv PLC* | $ | 346,812 | |||||
|
|
|
|||||||
| Automobiles – 1.6% | ||||||||
| 7,753 | General Motors Co. | 296,242 | ||||||
|
|
|
|||||||
| Banks – 3.1% | ||||||||
| 4,984 | JPMorgan Chase & Co. | 566,830 | ||||||
|
|
|
|||||||
| Capital Markets – 4.3% | ||||||||
| 524 | BlackRock, Inc. | 349,189 | ||||||
| 5,156 | Morgan Stanley | 439,394 | ||||||
|
|
|
|||||||
| 788,583 | ||||||||
|
|
|
|||||||
| Chemicals – 2.1% | ||||||||
| 1,380 | Linde PLC (United Kingdom) | 390,347 | ||||||
|
|
|
|||||||
| Communications Equipment – 2.5% | ||||||||
| 10,249 | Cisco Systems, Inc. | 458,335 | ||||||
|
|
|
|||||||
| Consumer Finance – 1.8% | ||||||||
| 2,150 | American Express Co. | 326,800 | ||||||
|
|
|
|||||||
| Containers & Packaging – 1.9% | ||||||||
| 6,244 | Ball Corp. | 348,478 | ||||||
|
|
|
|||||||
| Diversified Telecommunication Services – 2.6% | ||||||||
| 27,240 | AT&T, Inc. | 477,790 | ||||||
|
|
|
|||||||
| Electric Utilities – 3.2% | ||||||||
| 7,016 | NextEra Energy, Inc. | 596,781 | ||||||
|
|
|
|||||||
| Electrical Equipment – 4.4% | ||||||||
| 2,813 | Eaton Corp. PLC | 384,368 | ||||||
| 1,776 | Rockwell Automation, Inc. | 420,806 | ||||||
|
|
|
|||||||
| 805,174 | ||||||||
|
|
|
|||||||
| Entertainment – 1.7% | ||||||||
| 2,823 | Walt Disney Co. (The)* | 316,402 | ||||||
|
|
|
|||||||
| Equity Real Estate Investment Trusts (REITs) – 2.6% | ||||||||
| 1,891 | American Tower Corp. REIT | 480,408 | ||||||
|
|
|
|||||||
| Food Products – 1.9% | ||||||||
| 4,147 | McCormick & Co., Inc. | 348,638 | ||||||
|
|
|
|||||||
| Health Care Equipment & Supplies – 2.1% | ||||||||
| 945 | Cooper Cos., Inc. (The) | 271,631 | ||||||
| 1,349 | Dexcom, Inc.* | 110,901 | ||||||
|
|
|
|||||||
| 382,532 | ||||||||
|
|
|
|||||||
| Health Care Providers & Services – 5.2% | ||||||||
| 5,093 | CVS Health Corp. | 499,878 | ||||||
| 941 | Humana, Inc. | 453,355 | ||||||
|
|
|
|||||||
| 953,233 | ||||||||
|
|
|
|||||||
| Hotels, Restaurants & Leisure – 2.4% | ||||||||
| 1,713 | McDonald’s Corp. | 432,156 | ||||||
|
|
|
|||||||
| Household Products – 3.2% | ||||||||
| 4,199 | Procter & Gamble Co. (The) | 579,210 | ||||||
|
|
|
|||||||
| Common Stocks – (continued) | ||||||||
| Industrial Conglomerates – 2.1% | ||||||||
| 5,245 | General Electric Co. | 385,193 | ||||||
|
|
|
|||||||
| Interactive Media & Services – 3.8% | ||||||||
| 6,367 | Alphabet, Inc., Class A* | 689,037 | ||||||
|
|
|
|||||||
| Internet & Direct Marketing Retail – 1.2% | ||||||||
| 2,169 | Etsy, Inc.* | 229,068 | ||||||
|
|
|
|||||||
| Life Sciences Tools & Services – 2.9% | ||||||||
| 1,943 | Danaher Corp. | 524,435 | ||||||
|
|
|
|||||||
| Machinery – 3.4% | ||||||||
| 727 | Deere & Co. | 265,536 | ||||||
| 3,848 | Xylem, Inc. | 350,553 | ||||||
|
|
|
|||||||
| 616,089 | ||||||||
|
|
|
|||||||
| Media – 1.1% | ||||||||
| 6,918 | New York Times Co. (The), Class A | 210,930 | ||||||
|
|
|
|||||||
| Pharmaceuticals – 5.6% | ||||||||
| 6,748 | Bristol-Myers Squibb Co. | 454,883 | ||||||
| 1,915 | Eli Lilly & Co. | 576,855 | ||||||
|
|
|
|||||||
| 1,031,738 | ||||||||
|
|
|
|||||||
| Road & Rail – 1.3% | ||||||||
| 882 | Old Dominion Freight Line, Inc. | 239,384 | ||||||
|
|
|
|||||||
| Semiconductors & Semiconductor Equipment – 6.2% | ||||||||
| 425 | Enphase Energy, Inc.* | 121,737 | ||||||
| 2,493 | Marvell Technology, Inc. | 116,722 | ||||||
| 1,803 | NVIDIA Corp. | 272,145 | ||||||
| 2,124 | Texas Instruments, Inc. | 350,906 | ||||||
| 2,368 | Wolfspeed, Inc.* | 268,697 | ||||||
|
|
|
|||||||
| 1,130,207 | ||||||||
|
|
|
|||||||
| Software – 10.1% | ||||||||
| 837 | Adobe, Inc.* | 312,569 | ||||||
| 4,906 | Microsoft Corp. | 1,282,772 | ||||||
| 1,551 | Workday, Inc., Class A* | 255,233 | ||||||
|
|
|
|||||||
| 1,850,574 | ||||||||
|
|
|
|||||||
| Specialty Retail – 1.7% | ||||||||
| 3,536 | Ross Stores, Inc. | 305,051 | ||||||
|
|
|
|||||||
| Technology Hardware, Storage & Peripherals – 6.3% | ||||||||
| 7,327 | Apple, Inc. | 1,151,951 | ||||||
|
|
|
|||||||
| Textiles, Apparel & Luxury Goods – 1.9% | ||||||||
| 3,221 | NIKE, Inc., Class B | 342,875 | ||||||
|
|
|
|||||||
| Water Utilities – 2.1% | ||||||||
| 2,658 | American Water Works Co., Inc. | 394,580 | ||||||
|
|
|
|||||||
| TOTAL COMMON STOCKS | ||||||||
| (Cost $15,885,360) | $ | 17,995,863 | ||||||
|
|
|
|||||||
| The accompanying notes are an integral part of these financial statements. | 69 |
GOLDMAN SACHS U.S. EQUITY ESG FUND
Schedule of Investments (continued)
August 31, 2022
| Shares | Dividend Rate |
Value | ||||
| Investment Company – 1.6%(a) | ||||||
| Goldman Sachs Financial Square Government Fund – Institutional Shares |
| |||||
| 292,205 | 2.154% | $ | 292,205 | |||
| (Cost $292,205) |
| |||||
|
|
||||||
| TOTAL INVESTMENTS – 99.8% |
| |||||
| (Cost $16,177,565) | $ | 18,288,068 | ||||
|
|
||||||
| OTHER ASSETS IN EXCESS OF LIABILITIES – 0.2% |
33,637 | |||||
|
|
||||||
| NET ASSETS – 100.0% | $ | 18,321,705 | ||||
|
|
||||||
| The percentage shown for each investment category reflects the value of investments in that category as a percentage of net assets. | ||
| * |
Non-income producing security. | |
| (a) |
Represents an affiliated issuer. | |
|
| ||
| Investment Abbreviations: | ||
| PLC |
—Public Limited Company | |
| REIT |
—Real Estate Investment Trust | |
|
| ||
| 70 | The accompanying notes are an integral part of these financial statements. |
GOLDMAN SACHS FUNDAMENTAL EQUITY GROWTH FUNDS
Statements of Assets and Liabilities
August 31, 2022
| Concentrated Growth Fund |
Flexible Cap Fund |
Large Cap Core Fund |
||||||||||||
| Assets: |
| |||||||||||||
| Investments in unaffiliated issuers, at value (cost $95,004,005, $34,353,959 and $812,589,530, respectively) |
$ | 145,465,491 | $ | 40,646,549 | $ | 1,084,788,444 | ||||||||
| Investments in affiliated issuers, at value (cost $601,795, $— and $2,302,429, respectively) |
601,795 | — | 2,302,429 | |||||||||||
| Cash |
477,290 | — | 8,197,968 | |||||||||||
| Receivables: |
||||||||||||||
| Dividends |
90,684 | 53,648 | 1,245,041 | |||||||||||
| Reimbursement from investment adviser |
52,953 | 30,013 | 112,952 | |||||||||||
| Fund shares sold |
183 | 4,373 | 285,114 | |||||||||||
| Investments sold |
— | 1,619,099 | 5,590,230 | |||||||||||
| Securities lending income |
— | 15 | 153 | |||||||||||
| Other assets |
46,775 | 32,393 | 62,413 | |||||||||||
| Total assets | 146,735,171 | 42,386,090 | 1,102,584,744 | |||||||||||
| Liabilities: | ||||||||||||||
| Payables: |
||||||||||||||
| Fund shares redeemed |
206,364 | 121,018 | 831,311 | |||||||||||
| Management fees |
100,817 | 20,605 | 689,516 | |||||||||||
| Distribution and Service fees and Transfer Agency fees |
8,971 | 6,797 | 467,418 | |||||||||||
| Investments purchased |
— | 317,640 | — | |||||||||||
| Due to custodian |
— | 887,541 | — | |||||||||||
| Accrued expenses |
118,536 | 112,251 | 272,296 | |||||||||||
| Total liabilities | 434,688 | 1,465,852 | 2,260,541 | |||||||||||
| Net Assets: | ||||||||||||||
| Paid-in capital |
91,513,674 | 33,142,908 | 774,463,479 | |||||||||||
| Total distributable earnings |
54,786,809 | 7,777,330 | 325,860,724 | |||||||||||
| NET ASSETS | $ | 146,300,483 | $ | 40,920,238 | $ | 1,100,324,203 | ||||||||
| Net Assets: |
||||||||||||||
| Class A |
$ | 7,777,942 | $ | 6,820,346 | $ | 756,801,359 | ||||||||
| Class C |
570,022 | 889,925 | 16,518,329 | |||||||||||
| Institutional |
9,676,152 | 8,832,439 | 93,741,226 | |||||||||||
| Service |
— | — | 486,010 | |||||||||||
| Investor |
163,225 | 66,492 | 36,346,492 | |||||||||||
| Class R6 |
780,116 | 2,060,509 | 78,897,355 | |||||||||||
| Class R |
30,725 | 10,314 | 8,185,999 | |||||||||||
| Class P |
127,302,301 | 22,240,213 | 109,347,433 | |||||||||||
| Total Net Assets |
$ | 146,300,483 | $ | 40,920,238 | $ | 1,100,324,203 | ||||||||
| Shares outstanding $0.001 par value (unlimited number of shares authorized): |
||||||||||||||
| Class A |
465,225 | 484,213 | 28,903,731 | |||||||||||
| Class C |
49,678 | 76,896 | 1,196,303 | |||||||||||
| Institutional |
516,279 | 568,673 | 3,015,601 | |||||||||||
| Service |
— | — | 19,830 | |||||||||||
| Investor |
9,415 | 4,398 | 1,348,396 | |||||||||||
| Class R6 |
41,746 | 132,967 | 2,541,735 | |||||||||||
| Class R |
1,967 | 774 | 337,002 | |||||||||||
| Class P |
6,814,884 | 1,434,382 | 3,524,021 | |||||||||||
| Net asset value, offering and redemption price per share:(a) |
||||||||||||||
| Class A |
$16.72 | $14.09 | $26.18 | |||||||||||
| Class C |
11.47 | 11.57 | 13.81 | |||||||||||
| Institutional |
18.74 | 15.53 | 31.09 | |||||||||||
| Service |
— | — | 24.51 | |||||||||||
| Investor |
17.34 | 15.12 | 26.96 | |||||||||||
| Class R6 |
18.69 | 15.50 | 31.04 | |||||||||||
| Class R |
15.62 | 13.32 | 24.29 | |||||||||||
| Class P |
18.68 | 15.51 | 31.03 | |||||||||||
| (a) | Maximum public offering price per share for Class A Shares of the Concentrated Growth, Flexible Cap and Large Cap Core Funds is $17.69, $14.91 and $27.70. At redemption, Class C Shares may be subject to a contingent deferred sales charge, assessed on the amount equal to the lesser of the current net asset value (“NAV”) or the original purchase price of the shares. |
| The accompanying notes are an integral part of these financial statements. | 71 |
GOLDMAN SACHS FUNDAMENTAL EQUITY GROWTH FUNDS
Statements of Assets and Liabilities (continued)
August 31, 2022
| Mid Cap Growth Fund |
Small Cap Growth Fund |
Small/Mid Cap Growth Fund |
||||||||||||
| Assets: |
| |||||||||||||
| Investments in unaffiliated issuers, at value (cost $829,821,318, $29,650,091 and $2,061,767,602, respectively)(a) |
$ | 939,424,061 | $ | 30,379,942 | $ | 2,095,788,332 | ||||||||
| Investments in affiliated issuers, at value (cost $25,770,714, $404,748 and $4,992,100, respectively) |
25,770,714 | 404,748 | 4,992,100 | |||||||||||
| Investments in affiliated securities lending reinvestment vehicle, at value which equals cost |
— | 678,997 | 7,120,875 | |||||||||||
| Cash |
639,578 | 80,035 | 2,161,750 | |||||||||||
| Receivables: |
||||||||||||||
| Dividends |
458,580 | 7,873 | 1,019,838 | |||||||||||
| Fund shares sold |
332,741 | 2,000 | 749,105 | |||||||||||
| Reimbursement from investment adviser |
96,559 | 21,342 | — | |||||||||||
| Securities lending income |
233 | 690 | 3,503 | |||||||||||
| Investments sold |
— | 559,782 | 28,926,709 | |||||||||||
| Other assets |
57,120 | 249 | 120,871 | |||||||||||
| Total assets | 966,779,586 | 32,135,658 | 2,140,883,083 | |||||||||||
| Liabilities: | ||||||||||||||
| Payables: |
||||||||||||||
| Fund shares redeemed |
964,778 | 118,528 | 2,508,515 | |||||||||||
| Management fees |
792,609 | 22,544 | 1,602,974 | |||||||||||
| Distribution and Service fees and Transfer Agency fees |
233,954 | 1,403 | 385,568 | |||||||||||
| Investments purchased |
— | 201,557 | 10,725,027 | |||||||||||
| Payable upon return of securities loaned |
— | 678,997 | 7,120,875 | |||||||||||
| Reimbursement to investment adviser |
— | 77,992 | — | |||||||||||
| Other liabilities |
— | 515 | — | |||||||||||
| Accrued expenses |
319,203 | 107,915 | 514,597 | |||||||||||
| Total liabilities | 2,310,544 | 1,209,451 | 22,857,556 | |||||||||||
| Net Assets: | ||||||||||||||
| Paid-in capital |
844,602,610 | 32,393,137 | 2,141,027,118 | |||||||||||
| Total distributable earnings (loss) |
119,866,432 | (1,466,930 | ) | (23,001,591 | ) | |||||||||
| NET ASSETS | $ | 964,469,042 | $ | 30,926,207 | $ | 2,118,025,527 | ||||||||
| Net Assets: |
||||||||||||||
| Class A |
$ | 262,403,843 | $ | 451,244 | $ | 276,713,704 | ||||||||
| Class C |
13,260,753 | 72,482 | 76,088,859 | |||||||||||
| Institutional |
313,137,378 | 18,661,069 | 824,358,853 | |||||||||||
| Service |
21,106,722 | — | 1,266,660 | |||||||||||
| Investor |
70,758,895 | 67,332 | 428,148,715 | |||||||||||
| Class R6 |
199,472,451 | 67,585 | 156,598,653 | |||||||||||
| Class R |
33,397,456 | 66,385 | 9,301,349 | |||||||||||
| Class P |
50,931,544 | 11,540,110 | 345,548,734 | |||||||||||
| Total Net Assets |
$ | 964,469,042 | $ | 30,926,207 | $ | 2,118,025,527 | ||||||||
| Shares outstanding $0.001 par value (unlimited number of shares authorized): |
||||||||||||||
| Class A |
23,796,885 | 40,424 | 16,218,252 | |||||||||||
| Class C |
773,028 | 6,632 | 6,349,971 | |||||||||||
| Institutional |
18,030,433 | 1,654,875 | 41,884,325 | |||||||||||
| Service |
2,254,633 | — | 78,898 | |||||||||||
| Investor |
5,509,717 | 5,988 | 23,102,239 | |||||||||||
| Class R6 |
11,464,063 | 5,992 | 7,945,591 | |||||||||||
| Class R |
3,565,150 | 5,984 | 593,160 | |||||||||||
| Class P |
2,925,436 | 1,023,579 | 17,529,045 | |||||||||||
| Net asset value, offering and redemption price per share:(b) |
||||||||||||||
| Class A |
$11.03 | $11.16 | $17.06 | |||||||||||
| Class C |
17.15 | 10.93 | 11.98 | |||||||||||
| Institutional |
17.37 | 11.28 | 19.68 | |||||||||||
| Service |
9.36 | — | 16.05 | |||||||||||
| Investor |
12.84 | 11.24 | 18.53 | |||||||||||
| Class R6 |
17.40 | 11.28 | 19.71 | |||||||||||
| Class R |
9.37 | 11.09 | 15.68 | |||||||||||
| Class P |
17.41 | 11.27 | 19.71 | |||||||||||
| (a) | Includes loaned securities having a market value of $–, $648,631 and $6,968,695 for the Mid Cap Growth, Small Cap Growth and Small/Mid Cap Growth Funds, respectively. |
| (b) | Maximum public offering price per share for Class A Shares of the Mid Cap Growth, Small Cap Growth and Small/Mid Cap Growth Funds is $11.67, $11.81 and $18.05. At redemption, Class C Shares may be subject to a contingent deferred sales charge, assessed on the amount equal to the lesser of the current net asset value (“NAV”) or the original purchase price of the shares. |
| 72 | The accompanying notes are an integral part of these financial statements. |
GOLDMAN SACHS FUNDAMENTAL EQUITY GROWTH FUNDS
Statements of Assets and Liabilities (continued)
August 31, 2022
| Strategic Growth Fund |
Technology Opportunities Fund |
U.S. Equity ESG Fund |
||||||||||||
| Assets: |
| |||||||||||||
| Investments in unaffiliated issuers, at value (cost $74,811,434, $465,923,394 and $15,885,360, respectively) |
$ | 142,290,524 | $ | 614,369,664 | $ | 17,995,863 | ||||||||
| Investments in affiliated issuers, at value (cost $1,183,975, $4,488,694 and $292,205, respectively) |
1,183,975 | 4,488,694 | 292,205 | |||||||||||
| Cash |
542,773 | 608,175 | 73,833 | |||||||||||
| Receivables: |
||||||||||||||
| Dividends |
99,217 | 391,818 | 16,837 | |||||||||||
| Fund shares sold |
36,547 | 121,818 | 16,009 | |||||||||||
| Reimbursement from investment adviser |
19,595 | 23,963 | 21,976 | |||||||||||
| Other assets |
51,456 | 87,259 | 25,397 | |||||||||||
| Total assets | 144,224,087 | 620,091,391 | 18,442,120 | |||||||||||
| Liabilities: | ||||||||||||||
| Payables: |
||||||||||||||
| Management fees |
92,336 | 532,818 | 8,858 | |||||||||||
| Fund shares redeemed |
63,556 | 603,401 | 442 | |||||||||||
| Distribution and Service fees and Transfer Agency fees |
27,336 | 208,019 | 7,462 | |||||||||||
| Accrued expenses |
132,287 | 299,796 | 103,653 | |||||||||||
| Total liabilities | 315,515 | 1,644,034 | 120,415 | |||||||||||
| Net Assets: | ||||||||||||||
| Paid-in capital |
68,627,934 | 405,598,780 | 17,916,638 | |||||||||||
| Total distributable earnings |
75,280,638 | 212,848,577 | 405,067 | |||||||||||
| NET ASSETS | $ | 143,908,572 | $ | 618,447,357 | $ | 18,321,705 | ||||||||
| Net Assets: |
||||||||||||||
| Class A |
$ | 33,995,852 | $ | 324,627,553 | $ | 6,596,920 | ||||||||
| Class C |
2,152,667 | 16,950,253 | 1,401,889 | |||||||||||
| Institutional |
39,300,403 | 97,095,330 | 1,425,295 | |||||||||||
| Service |
536,492 | 8,258,683 | — | |||||||||||
| Investor |
3,304,089 | 26,044,365 | 1,174,872 | |||||||||||
| Class R6 |
3,845,683 | 50,264,357 | 1,172,821 | |||||||||||
| Class R |
170,173 | — | 408,487 | |||||||||||
| Class P |
60,603,213 | 95,206,816 | 6,141,421 | |||||||||||
| Total Net Assets |
$ | 143,908,572 | $ | 618,447,357 | $ | 18,321,705 | ||||||||
| Shares outstanding $0.001 par value (unlimited number of shares authorized): |
||||||||||||||
| Class A |
4,215,681 | 15,574,797 | 436,024 | |||||||||||
| Class C |
201,691 | 1,278,113 | 99,697 | |||||||||||
| Institutional |
4,041,584 | 3,826,362 | 92,856 | |||||||||||
| Service |
68,919 | 416,206 | — | |||||||||||
| Investor |
342,472 | 1,056,644 | 76,545 | |||||||||||
| Class R6 |
396,492 | 1,978,975 | 76,345 | |||||||||||
| Class R |
22,779 | — | 26,891 | |||||||||||
| Class P |
6,261,895 | 3,748,624 | 399,981 | |||||||||||
| Net asset value, offering and redemption price per share:(a) |
||||||||||||||
| Class A |
$8.06 | $20.84 | $15.13 | |||||||||||
| Class C |
10.67 | 13.26 | 14.06 | |||||||||||
| Institutional |
9.72 | 25.38 | 15.35 | |||||||||||
| Service |
7.78 | 19.84 | — | |||||||||||
| Investor |
9.65 | 24.65 | 15.35 | |||||||||||
| Class R6 |
9.70 | 25.40 | 15.36 | |||||||||||
| Class R |
7.47 | — | 15.19 | |||||||||||
| Class P |
9.68 | 25.40 | 15.35 | |||||||||||
| (a) | Maximum public offering price per share for Class A Shares of the Strategic Growth, Technology Opportunities and U.S. Equity ESG Funds is $8.53, $22.05 and $16.01. At redemption, Class C Shares may be subject to a contingent deferred sales charge, assessed on the amount equal to the lesser of the current net asset value (“NAV”) or the original purchase price of the shares. |
| The accompanying notes are an integral part of these financial statements. | 73 |
GOLDMAN SACHS FUNDAMENTAL EQUITY GROWTH FUNDS
Statements of Operations
For the Fiscal Year Ended August 31, 2022
| Concentrated Growth Fund |
Flexible Cap Fund |
Large Cap Core Fund |
||||||||||||
| Investment income: |
| |||||||||||||
| Dividends — unaffiliated issuers (net of foreign withholding taxes of $—, $448 and $15,179, respectively) |
$ | 805,287 | $ | 540,681 | $ | 14,750,654 | ||||||||
| Dividends — affiliated issuers |
3,394 | 1,888 | 16,038 | |||||||||||
| Securities lending income — unaffiliated issuer |
282 | 31 | 2,366 | |||||||||||
| Total investment income | 808,963 | 542,600 | 14,769,058 | |||||||||||
| Expenses: |
| |||||||||||||
| Management fees |
1,392,730 | 222,321 | 8,525,933 | |||||||||||
| Registration fees |
92,052 | 85,043 | 120,369 | |||||||||||
| Professional fees |
73,881 | 81,292 | 85,369 | |||||||||||
| Transfer Agency fees(a) |
70,298 | 24,106 | 1,583,920 | |||||||||||
| Printing and mailing costs |
40,430 | 36,779 | 130,939 | |||||||||||
| Distribution and Service (12b-1) fees(a) |
30,320 | 26,792 | 2,369,552 | |||||||||||
| Trustee fees |
23,840 | 23,600 | 25,648 | |||||||||||
| Custody, accounting and administrative services |
19,214 | 24,266 | 113,713 | |||||||||||
| Service fees — Class C |
1,921 | 2,826 | 48,905 | |||||||||||
| Shareholder Administration fees — Service Shares |
— | — | 2,839 | |||||||||||
| Other |
2,542 | 8,626 | 25,555 | |||||||||||
| Total expenses | 1,747,228 | 535,651 | 13,032,742 | |||||||||||
| Less — expense reductions |
(253,081 | ) | (258,547 | ) | (950,594 | ) | ||||||||
| Net expenses | 1,494,147 | 277,104 | 12,082,148 | |||||||||||
| NET INVESTMENT INCOME (LOSS) | (685,184 | ) | 265,496 | 2,686,910 | ||||||||||
| Realized and unrealized gain (loss): |
| |||||||||||||
| Net realized gain (loss) from: |
||||||||||||||
| Investments — unaffiliated issuers |
7,307,548 | 1,821,470 | 90,087,058 | |||||||||||
| Foreign currency transactions |
— | — | 33 | |||||||||||
| Net change in unrealized gain (loss) on: |
||||||||||||||
| Investments — unaffiliated issuers |
(61,510,282 | ) | (6,760,402 | ) | (299,531,130 | ) | ||||||||
| Foreign currency translations |
— | — | (97 | ) | ||||||||||
| Net realized and unrealized loss | (54,202,734 | ) | (4,938,932 | ) | |
(209,444,136 |
) | |||||||
| NET DECREASE IN NET ASSETS RESULTING FROM OPERATIONS | $ | (54,887,918 | ) | $ | (4,673,436 | ) | $ | (206,757,226 | ) | |||||
| (a) | Class specific Distribution and/or Service and Transfer Agency fees were as follows: |
| Distribution and/or Service (12b-1) Fees | Transfer Agency Fees | |||||||||||||||||||||||||||||||||||||||||||||||
| Fund |
Class A |
Class C |
Service |
Class R |
Class A |
Class C |
Institutional |
Service |
Investor |
Class R6 |
Class R |
Class P |
||||||||||||||||||||||||||||||||||||
| Concentrated Growth |
$ | 24,377 | $ | 5,762 | $ | — | $ | 181 | $ | 15,602 | $ | 1,229 | $ | 5,296 | $ | — | $ | 340 | $ | 299 | $ | 58 | $ | 47,474 | ||||||||||||||||||||||||
| Flexible Cap |
18,231 | 8,477 | — | 84 | 11,668 | 1,809 | 2,659 | — | 422 | 265 | 27 | 7,256 | ||||||||||||||||||||||||||||||||||||
| Large Cap Core |
2,170,117 | 146,715 | 2,839 | 49,881 | 1,388,890 | 31,300 | 42,973 | 454 | 48,429 | 19,185 | 15,962 | 36,727 | ||||||||||||||||||||||||||||||||||||
| 74 | The accompanying notes are an integral part of these financial statements. |
GOLDMAN SACHS FUNDAMENTAL EQUITY GROWTH FUNDS
Statements of Operations (continued)
For the Fiscal Year Ended August 31, 2022
| Mid Cap Growth Fund |
Small Cap Growth Fund |
Small/Mid Cap Growth Fund |
||||||||||||
| Investment income: |
| |||||||||||||
| Dividends — unaffiliated issuers (net of foreign withholding taxes of $—, $— and $15,682, respectively) |
$ | 5,823,810 | $ | 90,663 | $ | 9,858,949 | ||||||||
| Dividends — affiliated issuers |
118,943 | 2,497 | 136,190 | |||||||||||
| Securities lending income — unaffiliated issuer |
51,013 | 48,668 | 1,938,847 | |||||||||||
| Total investment income | 5,993,766 | 141,828 | 11,933,986 | |||||||||||
| Expenses: |
| |||||||||||||
| Management fees |
10,895,136 | 213,048 | 23,093,359 | |||||||||||
| Distribution and Service (12b-1) fees(a) |
1,212,993 | 2,354 | 1,774,923 | |||||||||||
| Transfer Agency fees(a) |
1,005,010 | 10,208 | 2,368,170 | |||||||||||
| Registration fees |
131,924 | 86,279 | 257,943 | |||||||||||
| Custody, accounting and administrative services |
107,535 | 16,349 | 246,476 | |||||||||||
| Printing and mailing costs |
99,477 | 26,848 | 209,643 | |||||||||||
| Professional fees |
88,052 | 59,598 | 81,969 | |||||||||||
| Shareholder Administration fees — Service Shares |
65,771 | — | 12,202 | |||||||||||
| Service fees — Class C |
43,029 | 234 | 262,771 | |||||||||||
| Trustee fees |
25,541 | 23,577 | 28,300 | |||||||||||
| Other |
28,782 | 4,179 | 81,309 | |||||||||||
| Total expenses | 13,703,250 | 442,674 | 28,417,065 | |||||||||||
| Less — expense reductions |
(1,334,511 | ) | (211,533 | ) | (587,600 | ) | ||||||||
| Net expenses | 12,368,739 | 231,141 | 27,829,465 | |||||||||||
| NET INVESTMENT LOSS | (6,374,973 | ) | (89,313 | ) | (15,895,479 | ) | ||||||||
| Realized and unrealized gain (loss): |
| |||||||||||||
| Net realized gain (loss) from: |
||||||||||||||
| Investments — unaffiliated issuers |
|
38,510,258 |
|
|
(1,836,676 |
) |
56,322,415 | |||||||
| Net change in unrealized gain (loss) on: |
||||||||||||||
| Investments — unaffiliated issuers |
|
(392,512,705 |
) |
(5,366,673 | ) | (1,071,662,762 | ) | |||||||
| Net realized and unrealized loss | (354,002,447 | ) | (7,203,349 | ) | (1,015,340,347 | ) | ||||||||
| NET DECREASE IN NET ASSETS RESULTING FROM OPERATIONS | $ | (360,377,420 | ) | $ | (7,292,662 | ) | $ | (1,031,235,826 | ) | |||||
| (a) | Class specific Distribution and/or Service and Transfer Agency fees were as follows: |
| Distribution and/or Service (12b-1) Fees | Transfer Agency Fees | |||||||||||||||||||||||||||||||||||||||||||||||
| Fund |
Class A |
Class C |
Service |
Class R |
Class A |
Class C |
Institutional |
Service |
Investor |
Class R6 |
Class R |
Class P |
||||||||||||||||||||||||||||||||||||
| Mid Cap Growth |
$ | 806,875 | $ | 129,086 | $ | 65,771 | $ | 211,261 | $ | 516,406 | $ | 27,539 | $ | 153,665 | $ | 10,523 | $ | 137,604 | $ | 69,955 | $ | 67,604 | $ | 21,714 | ||||||||||||||||||||||||
| Small Cap Growth |
1,271 | 702 | — | 381 | 813 | 150 | 6,826 | — | 124 | 23 | 122 | 2,150 | ||||||||||||||||||||||||||||||||||||
| Small/Mid Cap Growth |
916,500 | 788,314 | 12,202 | 57,907 | 586,567 | 168,175 | 423,503 | 1,952 | 979,716 | 45,635 | 18,530 | 144,092 | ||||||||||||||||||||||||||||||||||||
| The accompanying notes are an integral part of these financial statements. | 75 |
GOLDMAN SACHS FUNDAMENTAL EQUITY GROWTH FUNDS
Statements of Operations (continued)
For the Fiscal Year Ended August 31, 2022
| Strategic Growth Fund |
Technology Opportunities Fund |
U.S. Equity ESG Fund |
||||||||||||
| Investment income: |
| |||||||||||||
| Dividends — unaffiliated issuers (net of foreign withholding taxes of $—, $66,194 and $—, respectively) |
$ | 911,737 | $ | 4,297,983 | $ | 289,415 | ||||||||
| Dividends — affiliated issuers |
4,276 | 48,762 | 1,165 | |||||||||||
| Securities lending income — unaffiliated issuer |
2,461 | 5,452 | 196 | |||||||||||
| Total investment income | 918,474 | 4,352,197 | 290,776 | |||||||||||
| Expenses: |
| |||||||||||||
| Management fees |
1,314,248 | 7,066,122 | 117,439 | |||||||||||
| Distribution and Service (12b-1) fees(a) |
147,465 | 1,213,118 | 34,958 | |||||||||||
| Transfer Agency fees(a) |
132,927 | 840,774 | 20,918 | |||||||||||
| Registration fees |
122,855 | 101,083 | 89,338 | |||||||||||
| Professional fees |
85,718 | 83,361 | 98,260 | |||||||||||
| Printing and mailing costs |
52,628 | 159,465 | 30,272 | |||||||||||
| Trustee fees |
23,828 | 24,791 | 23,556 | |||||||||||
| Custody, accounting and administrative services |
22,433 | 76,359 | 9,272 | |||||||||||
| Service fees — Class C |
7,425 | 54,400 | 4,919 | |||||||||||
| Shareholder Administration fees — Service Shares |
1,513 | 36,646 | — | |||||||||||
| Other |
7,504 | 7,340 | 8,102 | |||||||||||
| Total expenses | 1,918,544 | 9,663,459 | 437,034 | |||||||||||
| Less — expense reductions |
(315,834 | ) | (940,202 | ) | (242,436 | ) | ||||||||
| Net expenses | 1,602,710 | 8,723,257 | 194,598 | |||||||||||
| NET INVESTMENT INCOME (LOSS) | (684,236 | ) | (4,371,060 | ) | 96,178 | |||||||||
| Realized and unrealized gain (loss): |
| |||||||||||||
| Net realized gain (loss) from: |
||||||||||||||
| Investments — unaffiliated issuers |
11,142,187 | 103,356,490 | (1,751,929 | ) | ||||||||||
| Investments — affiliated issuers |
— | 4 | — | |||||||||||
| Foreign currency transactions |
— | 1,360 | — | |||||||||||
| Net change in unrealized gain (loss) on: |
||||||||||||||
| Investments — unaffiliated issuers |
(64,450,982 | ) | (351,713,397 | ) | (3,493,632 | ) | ||||||||
| Net realized and unrealized loss | (53,308,795 | ) | (248,355,543 | ) | (5,245,561 | ) | ||||||||
| NET DECREASE IN NET ASSETS RESULTING FROM OPERATIONS | $ | (53,993,031 | ) | $ | (252,726,603 | ) | $ | (5,149,383 | ) | |||||
| (a) | Class specific Distribution and/or Service and Transfer Agency fees were as follows: |
| Distribution and/or Service (12b-1) Fees | Transfer Agency Fees | |||||||||||||||||||||||||||||||||||||||||||||||
| Fund |
Class A |
Class C |
Service |
Class R |
Class A |
Class C |
Institutional |
Service |
Investor |
Class R6 |
Class R |
Class P |
||||||||||||||||||||||||||||||||||||
| Strategic Growth |
$ | 122,711 | $ | 22,274 | $ | 1,513 | $ | 967 | $ | 78,535 | $ | 4,752 | $ | 20,004 | $ | 242 | $ | 5,430 | $ | 874 | $ | 309 | $ | 22,781 | ||||||||||||||||||||||||
| Technology Opportunities |
1,013,273 | 163,199 | 36,646 | — | 648,502 | 34,816 | 55,464 | 5,863 | 55,054 | 4,164 | — | 36,911 | ||||||||||||||||||||||||||||||||||||
| U.S. Equity ESG |
17,951 | 14,756 | — | 2,251 | 11,489 | 3,148 | 1,298 | — | 2,105 | 368 | 720 | 1,790 | ||||||||||||||||||||||||||||||||||||
| 76 | The accompanying notes are an integral part of these financial statements. |
GOLDMAN SACHS FUNDAMENTAL EQUITY GROWTH FUNDS
Statements of Changes in Net Assets
| Concentrated Growth Fund | Flexible Cap Fund | |||||||||||||||||||||
| For the Fiscal Year Ended August 31, 2022 |
For the Fiscal Year Ended August 31, 2021 |
For the Fiscal Year Ended August 31, 2022 |
For the Fiscal Year Ended August 31, 2021 |
|||||||||||||||||||
| From operations: |
|
|||||||||||||||||||||
| Net investment income (loss) |
$ | (685,184 | ) | $ | (649,848 | ) | $ | 265,496 | $ | 130,911 | ||||||||||||
| Net realized gain |
7,307,548 | 34,008,869 | 1,821,470 | 1,824,645 | ||||||||||||||||||
| Net change in unrealized gain (loss) |
(61,510,282 | ) | 16,761,188 | (6,760,402 | ) | 6,011,617 | ||||||||||||||||
| Net increase (decrease) in net assets resulting from operations | (54,887,918 | ) | 50,120,209 | (4,673,436 | ) | 7,967,173 | ||||||||||||||||
| Distributions to shareholders: |
|
|||||||||||||||||||||
| From distributable earnings: |
||||||||||||||||||||||
| Class A Shares |
(1,982,323 | ) | (589,089 | ) | (475,431 | ) | (348,337 | ) | ||||||||||||||
| Class C Shares |
(205,024 | ) | (92,741 | ) | (92,555 | ) | (76,792 | ) | ||||||||||||||
| Institutional Shares |
(2,410,152 | ) | (802,543 | ) | (302,451 | ) | (30,388 | ) | ||||||||||||||
| Investor Shares |
(37,303 | ) | (12,344 | ) | (3,157 | ) | (2,137 | ) | ||||||||||||||
| Class R6 Shares |
(179,377 | ) | (45,645 | ) | (21,620 | ) | (13,001 | ) | ||||||||||||||
| Class R Shares |
(7,600 | ) | (2,170 | ) | (700 | ) | (2,962 | ) | ||||||||||||||
| Class P Shares |
(29,595,626 | ) | (9,334,561 | ) | (1,510,289 | ) | (868,917 | ) | ||||||||||||||
| Total distributions to shareholders | (34,417,405 | ) | (10,879,093 | ) | (2,406,203 | ) | (1,342,534 | ) | ||||||||||||||
| From share transactions: |
|
|||||||||||||||||||||
| Proceeds from sales of shares |
8,712,665 | 15,178,558 | 18,075,359 | 9,481,676 | ||||||||||||||||||
| Reinvestment of distributions |
34,050,958 | 10,783,130 | 2,406,145 | 1,342,533 | ||||||||||||||||||
| Cost of shares redeemed |
(28,577,444 | ) | (29,601,069 | ) | (10,854,027 | ) | (2,605,305 | ) | ||||||||||||||
| Net increase (decrease) in net assets resulting from share transactions | 14,186,179 | (3,639,381 | ) | 9,627,477 | 8,218,904 | |||||||||||||||||
| TOTAL INCREASE (DECREASE) | (75,119,144 | ) | 35,601,735 | 2,547,838 | 14,843,543 | |||||||||||||||||
| Net assets: |
|
|||||||||||||||||||||
| Beginning of year |
221,419,627 | 185,817,892 | 38,372,400 | 23,528,857 | ||||||||||||||||||
| End of year |
$ | 146,300,483 | $ | 221,419,627 | $ | 40,920,238 | $ | 38,372,400 | ||||||||||||||
| The accompanying notes are an integral part of these financial statements. | 77 |
GOLDMAN SACHS FUNDAMENTAL EQUITY GROWTH FUNDS
Statements of Changes in Net Assets (continued)
| Large Cap Core Fund | Mid Cap Growth Fund | |||||||||||||||||||||
| For the Fiscal Year Ended August 31, 2022 |
For the Fiscal Year Ended August 31, 2021 |
For the Fiscal Year Ended August 31, 2022 |
For the Fiscal Year Ended August 31, 2021 |
|||||||||||||||||||
| From operations: |
|
|||||||||||||||||||||
| Net investment income (loss) |
$ | 2,686,910 | $ | (1,202,689 | ) | $ | (6,374,973 | ) | $ | (9,475,497 | ) | |||||||||||
| Net realized gain |
90,087,091 | 112,670,809 | 38,510,258 | 257,986,575 | ||||||||||||||||||
| Net change in unrealized gain (loss) |
(299,531,227 | ) | 201,303,226 | (392,512,705 | ) | 154,463,280 | ||||||||||||||||
| Net increase (decrease) in net assets resulting from operations | (206,757,226 | ) | 312,771,346 | (360,377,420 | ) | 402,974,358 | ||||||||||||||||
| Distributions to shareholders: |
|
|||||||||||||||||||||
| From distributable earnings: |
||||||||||||||||||||||
| Class A Shares |
(94,467,095 | ) | (29,785,751 | ) | (67,635,332 | ) | (80,419,726 | ) | ||||||||||||||
| Class C Shares |
(3,764,198 | ) | (947,434 | ) | (15,805,073 | ) | (15,392,994 | ) | ||||||||||||||
| Institutional Shares |
(10,320,799 | ) | (2,366,718 | ) | (54,055,820 | ) | (73,299,105 | ) | ||||||||||||||
| Service Shares |
(241,187 | ) | (56,146 | ) | (6,473,043 | ) | (7,330,638 | ) | ||||||||||||||
| Investor Shares |
(2,350,236 | ) | (371,777 | ) | (15,664,510 | ) | (17,952,306 | ) | ||||||||||||||
| Class R6 Shares |
(8,164,475 | ) | (92,242 | ) | (32,255,834 | ) | (36,107,697 | ) | ||||||||||||||
| Class R Shares |
(1,189,253 | ) | (385,346 | ) | (10,238,647 | ) | (12,453,846 | ) | ||||||||||||||
| Class P Shares |
(11,394,754 | ) | (3,547,586 | ) | (10,730,774 | ) | (13,547,235 | ) | ||||||||||||||
| Total distributions to shareholders | (131,891,997 | ) | (37,553,000 | ) | (212,859,033 | ) | (256,503,547 | ) | ||||||||||||||
| From share transactions: |
|
|||||||||||||||||||||
| Proceeds from sales of shares |
190,798,465 | 110,074,487 | 177,404,726 | 260,135,416 | ||||||||||||||||||
| Reinvestment of distributions |
125,788,279 | 35,803,881 | 199,802,806 | 239,672,958 | ||||||||||||||||||
| Cost of shares redeemed |
(157,421,316 | ) | (117,761,664 | ) | (313,748,065 | ) | (431,164,146 | ) | ||||||||||||||
| Net increase in net assets resulting from share transactions | 159,165,428 | 28,116,704 | 63,459,467 | 68,644,228 | ||||||||||||||||||
| TOTAL INCREASE (DECREASE) | (179,483,795 | ) | 303,335,050 | (509,776,986 | ) | 215,115,039 | ||||||||||||||||
| Net assets: |
|
|||||||||||||||||||||
| Beginning of year |
1,279,807,998 | 976,472,948 | 1,474,246,028 | 1,259,130,989 | ||||||||||||||||||
| End of year |
$ | 1,100,324,203 | $ | 1,279,807,998 | $ | 964,469,042 | $ | 1,474,246,028 | ||||||||||||||
| 78 | The accompanying notes are an integral part of these financial statements. |
GOLDMAN SACHS FUNDAMENTAL EQUITY GROWTH FUNDS
Statements of Changes in Net Assets (continued)
| Small Cap Growth Fund | Small/Mid Cap Growth Fund | |||||||||||||||||||||
| For the Fiscal Year Ended August 31, 2022 |
For the Fiscal Year Ended August 31, 2021 |
For the Fiscal Year Ended August 31, 2022 |
For the Fiscal Year Ended August 31, 2021 |
|||||||||||||||||||
| From operations: |
|
|||||||||||||||||||||
| Net investment loss |
$ | (89,313 | ) | $ | (135,457 | ) | $ | (15,895,479 | ) | $ | (22,146,644 | ) | ||||||||||
| Net realized gain (loss) |
(1,836,676 | ) | 2,863,972 | 56,322,415 | 477,942,099 | |||||||||||||||||
| Net change in unrealized gain (loss) |
(5,366,673 | ) | 2,800,407 | (1,071,662,762 | ) | 476,822,391 | ||||||||||||||||
| Net increase (decrease) in net assets resulting from operations | (7,292,662 | ) | 5,528,922 | (1,031,235,826 | ) | 932,617,846 | ||||||||||||||||
| Distributions to shareholders: |
|
|||||||||||||||||||||
| From distributable earnings: |
||||||||||||||||||||||
| Class A Shares |
(56,194 | ) | (22,970 | ) | (62,416,584 | ) | (49,888,744 | ) | ||||||||||||||
| Class C Shares |
(11,684 | ) | (8,216 | ) | (24,413,751 | ) | (30,046,612 | ) | ||||||||||||||
| Institutional Shares |
(1,688,009 | ) | (953,009 | ) | (153,957,378 | ) | (138,905,563 | ) | ||||||||||||||
| Service Shares |
— | — | (263,322 | ) | (6,207,186 | ) | ||||||||||||||||
| Investor Shares |
(8,566 | ) | (5,612 | ) | (103,538,120 | ) | (77,471,106 | ) | ||||||||||||||
| Class R6 Shares |
(8,574 | ) | (5,676 | ) | (17,155,030 | ) | (12,136,651 | ) | ||||||||||||||
| Class R Shares |
(8,551 | ) | (5,508 | ) | (2,048,239 | ) | (2,365,428 | ) | ||||||||||||||
| Class P Shares |
(635,615 | ) | (250,100 | ) | (73,222,947 | ) | (46,974,296 | ) | ||||||||||||||
| From return of capital: |
||||||||||||||||||||||
| Class A Shares |
— | — | (526,146 | ) | — | |||||||||||||||||
| Class C Shares |
— | — | (205,798 | ) | — | |||||||||||||||||
| Institutional Shares |
— | — | (1,297,796 | ) | — | |||||||||||||||||
| Service Shares |
— | — | (2,220 | ) | — | |||||||||||||||||
| Investor Shares |
— | — | (872,783 | ) | — | |||||||||||||||||
| Class R6 Shares |
— | — | (144,610 | ) | — | |||||||||||||||||
| Class R Shares |
— | — | (17,266 | ) | — | |||||||||||||||||
| Class P Shares |
— | — | (617,239 | ) | — | |||||||||||||||||
| Total distributions to shareholders | (2,417,193 | ) | (1,251,091 | ) | (440,699,229 | ) | (363,995,586 | ) | ||||||||||||||
| From share transactions: |
|
|||||||||||||||||||||
| Proceeds from sales of shares |
25,068,068 | 8,222,531 | 911,040,668 | 1,149,686,953 | ||||||||||||||||||
| Reinvestment of distributions |
2,417,193 | 1,251,091 | 413,186,636 | 339,495,791 | ||||||||||||||||||
| Cost of shares redeemed |
(7,573,145 | ) | (6,834,486 | ) | (1,248,105,485 | ) | (829,149,871 | ) | ||||||||||||||
| Net increase in net assets resulting from share transactions | 19,912,116 | 2,639,136 | 76,121,819 | 660,032,873 | ||||||||||||||||||
| TOTAL INCREASE (DECREASE) | 10,202,261 | 6,916,967 | (1,395,813,236 | ) | 1,228,655,133 | |||||||||||||||||
| Net assets: |
|
|||||||||||||||||||||
| Beginning of year |
20,723,946 | 13,806,979 | 3,513,838,763 | 2,285,183,630 | ||||||||||||||||||
| End of year |
$ | 30,926,207 | $ | 20,723,946 | $ | 2,118,025,527 | $ | 3,513,838,763 | ||||||||||||||
| The accompanying notes are an integral part of these financial statements. | 79 |
GOLDMAN SACHS FUNDAMENTAL EQUITY GROWTH FUNDS
Statements of Changes in Net Assets (continued)
| Strategic Growth Fund | Technology Opportunities Fund | |||||||||||||||||||||
| For the Fiscal Year Ended August 31, 2022 |
For the Fiscal Year Ended August 31, 2021 |
For the Fiscal Year Ended August 31, 2022 |
For the Fiscal Year Ended August 31, 2021 |
|||||||||||||||||||
| From operations: |
|
|||||||||||||||||||||
| Net investment loss |
$ | (684,236 | ) | $ | (661,246 | ) | $ | (4,371,060 | ) | $ | (5,328,409 | ) | ||||||||||
| Net realized gain |
11,142,187 | 27,166,411 | 103,357,854 | 120,819,118 | ||||||||||||||||||
| Net change in unrealized gain (loss) |
(64,450,982 | ) | 25,948,742 | (351,713,397 | ) | 102,237,201 | ||||||||||||||||
| Net increase (decrease) in net assets resulting from operations | (53,993,031 | ) | 52,453,907 | (252,726,603 | ) | 217,727,910 | ||||||||||||||||
| Distributions to shareholders: |
|
|||||||||||||||||||||
| From distributable earnings: |
||||||||||||||||||||||
| Class A Shares |
(7,953,403 | ) | (5,753,617 | ) | (74,869,236 | ) | (37,649,057 | ) | ||||||||||||||
| Class C Shares |
(870,837 | ) | (1,246,700 | ) | (5,848,371 | ) | (3,403,030 | ) | ||||||||||||||
| Institutional Shares |
(6,118,062 | ) | (7,620,404 | ) | (23,454,408 | ) | (11,618,167 | ) | ||||||||||||||
| Service Shares |
(85,719 | ) | (79,067 | ) | (1,999,587 | ) | (3,325,261 | ) | ||||||||||||||
| Investor Shares |
(363,863 | ) | (382,724 | ) | (5,464,239 | ) | (3,999,623 | ) | ||||||||||||||
| Class R6 Shares |
(71,703 | ) | (84,347 | ) | (461,688 | ) | (113,026 | ) | ||||||||||||||
| Class R Shares |
(28,431 | ) | (6,717 | ) | — | — | ||||||||||||||||
| Class P Shares |
(9,425,707 | ) | (10,678,494 | ) | (19,319,680 | ) | (5,859,003 | ) | ||||||||||||||
| Total distributions to shareholders | (24,917,725 | ) | (25,852,070 | ) | (131,417,209 | ) | (65,967,167 | ) | ||||||||||||||
| From share transactions: |
|
|||||||||||||||||||||
| Proceeds from sales of shares |
27,677,941 | 36,302,264 | 192,213,977 | 171,089,507 | ||||||||||||||||||
| Reinvestment of distributions |
24,520,241 | 25,398,921 | 124,715,438 | 62,828,022 | ||||||||||||||||||
| Cost of shares redeemed |
(55,444,746 | ) | (46,298,529 | ) | (264,763,196 | ) | (206,094,335 | ) | ||||||||||||||
| Net increase (decrease) in net assets resulting from share transactions | (3,246,564 | ) | 15,402,656 | 52,166,219 | 27,823,194 | |||||||||||||||||
| TOTAL INCREASE (DECREASE) | (82,157,320 | ) | 42,004,493 | (331,977,593 | ) | 179,583,937 | ||||||||||||||||
| Net assets: |
|
|||||||||||||||||||||
| Beginning of year |
226,065,892 | 184,061,399 | 950,424,950 | 770,841,013 | ||||||||||||||||||
| End of year |
$ | 143,908,572 | $ | 226,065,892 | $ | 618,447,357 | $ | 950,424,950 | ||||||||||||||
| 80 | The accompanying notes are an integral part of these financial statements. |
GOLDMAN SACHS FUNDAMENTAL EQUITY GROWTH FUNDS
Statements of Changes in Net Assets (continued)
| U.S. Equity ESG Fund | ||||||||||
| For the Fiscal Year Ended August 31, 2022 |
For the Fiscal Year Ended August 31, 2021 |
|||||||||
| From operations: |
| |||||||||
| Net investment income |
$ | 96,178 | $ | 32,916 | ||||||
| Net realized gain (loss) |
(1,751,929 | ) | 657,932 | |||||||
| Net change in unrealized gain (loss) |
(3,493,632 | ) | 3,301,444 | |||||||
| Net increase (decrease) in net assets resulting from operations | (5,149,383 | ) | 3,992,292 | |||||||
| Distributions to shareholders: | ||||||||||
| From distributable earnings: |
||||||||||
| Class A Shares |
(142,692 | ) | (600,873 | ) | ||||||
| Class C Shares |
(44,937 | ) | (212,062 | ) | ||||||
| Institutional Shares |
(290,021 | ) | (138,080 | ) | ||||||
| Investor Shares |
(31,256 | ) | (38,039 | ) | ||||||
| Class R6 Shares |
(26,498 | ) | (127,443 | ) | ||||||
| Class R Shares |
(8,964 | ) | (2,431 | ) | ||||||
| Class P Shares |
(72,352 | ) | (91,452 | ) | ||||||
| Total distributions to shareholders | (616,720 | ) | (1,210,380 | ) | ||||||
| From share transactions: | ||||||||||
| Proceeds from sales of shares |
27,832,323 | 3,995,264 | ||||||||
| Reinvestment of distributions |
613,618 | 1,123,800 | ||||||||
| Cost of shares redeemed |
(21,584,853 | ) | (1,637,812 | ) | ||||||
| Net increase in net assets resulting from share transactions | 6,861,088 | 3,481,252 | ||||||||
| TOTAL INCREASE | 1,094,985 | 6,263,164 | ||||||||
| Net assets: | ||||||||||
| Beginning of year |
17,226,720 | 10,963,556 | ||||||||
| End of year |
$ | 18,321,705 | $ | 17,226,720 | ||||||
| The accompanying notes are an integral part of these financial statements. | 81 |
GOLDMAN SACHS CONCENTRATED GROWTH FUND
Selected Data for a Share Outstanding Throughout Each Year
| (a) | Calculated based on the average shares outstanding methodology. |
| (b) | Amount is less than $0.005 per share. |
| (c) | Assumes investment at the NAV at the beginning of the year, reinvestment of all dividends and distributions, a complete redemption of the investment at the NAV at the end of the year and no sales or redemption charges (if any). Total returns would be reduced if a sales or redemption charge was taken into account. Returns do not reflect the impact of taxes to shareholders relating to Fund distributions or the redemption of Fund shares. |
| (d) | The Fund’s portfolio turnover rate is calculated in accordance with regulatory requirements, without regard to transactions involving short term investments. If such transactions were included, the Fund’s portfolio turnover rate may be higher. |
| 82 | The accompanying notes are an integral part of these financial statements. |
GOLDMAN SACHS CONCENTRATED GROWTH FUND
Financial Highlights (continued)
Selected Data for a Share Outstanding Throughout Each Year
| Goldman Sachs Concentrated Growth Fund | ||||||||||||||||||||||
| Class C Shares | ||||||||||||||||||||||
| Year Ended August 31, | ||||||||||||||||||||||
| 2022 | 2021 | 2020 | 2019 | 2018 | ||||||||||||||||||
| Per Share Data | ||||||||||||||||||||||
| Net asset value, beginning of year |
$ | 20.54 | $ | 17.56 | $ | 13.87 | $ | 15.88 | $ | 14.93 | ||||||||||||
| Net investment loss(a) |
(0.21 | ) | (0.24 | ) | (0.17 | ) | (0.13 | ) | (0.12 | ) | ||||||||||||
| Net realized and unrealized gain (loss) |
(4.13 | ) | 4.67 | 5.34 | 0.22 | 3.17 | ||||||||||||||||
| Total from investment operations |
(4.34 | ) | 4.43 | 5.17 | 0.09 | 3.05 | ||||||||||||||||
| Distributions to shareholders from net realized gains |
(4.73 | ) | (1.45 | ) | (1.48 | ) | (2.10 | ) | (2.10 | ) | ||||||||||||
| Net asset value, end of year |
$ | 11.47 | $ | 20.54 | $ | 17.56 | $ | 13.87 | $ | 15.88 | ||||||||||||
| Total Return(b) | (27.13 | )% | 27.24 | % | 40.47 | % | 2.81 | % | 22.74 | % | ||||||||||||
| Net assets, end of year (in 000’s) |
$ | 570 | $ | 1,008 | $ | 1,162 | $ | 823 | $ | 2,137 | ||||||||||||
| Ratio of net expenses to average net assets |
1.85 | % | 1.86 | % | 1.91 | % | 1.91 | % | 1.92 | % | ||||||||||||
| Ratio of total expenses to average net assets |
2.06 | % | 2.07 | % | 2.10 | % | 2.21 | % | 2.26 | % | ||||||||||||
| Ratio of net investment loss to average net assets |
(1.42 | )% | (1.38 | )% | (1.23 | )% | (0.98 | )% | (0.80 | )% | ||||||||||||
| Portfolio turnover rate(c) |
29 | % | 37 | % | 36 | % | 40 | % | 44 | % | ||||||||||||
| (a) | Calculated based on the average shares outstanding methodology. |
| (b) | Assumes investment at the NAV at the beginning of the year, reinvestment of all dividends and distributions, a complete redemption of the investment at the NAV at the end of the year and no sales or redemption charges (if any). Total returns would be reduced if a sales or redemption charge was taken into account. Returns do not reflect the impact of taxes to shareholders relating to Fund distributions or the redemption of Fund shares. |
| (c) | The Fund’s portfolio turnover rate is calculated in accordance with regulatory requirements, without regard to transactions involving short term investments. If such transactions were included, the Fund’s portfolio turnover rate may be higher. |
| The accompanying notes are an integral part of these financial statements. | 83 |
GOLDMAN SACHS CONCENTRATED GROWTH FUND
Financial Highlights (continued)
Selected Data for a Share Outstanding Throughout Each Year
| Goldman Sachs Concentrated Growth Fund | ||||||||||||||||||||||
| Institutional Shares | ||||||||||||||||||||||
| Year Ended August 31, | ||||||||||||||||||||||
| 2022 | 2021 | 2020 | 2019 | 2018 | ||||||||||||||||||
| Per Share Data |
| |||||||||||||||||||||
| Net asset value, beginning of year |
$ | 30.22 | $ | 24.92 | $ | 18.93 | $ | 20.61 | $ | 18.65 | ||||||||||||
| Net investment income (loss)(a) |
(0.09 | ) | (0.08 | ) | (0.01 | ) | 0.03 | 0.06 | ||||||||||||||
| Net realized and unrealized gain (loss) |
(6.66 | ) | 6.83 | 7.50 | 0.41 | 4.07 | ||||||||||||||||
| Total from investment operations |
(6.75 | ) | 6.75 | 7.49 | 0.44 | 4.13 | ||||||||||||||||
| Distributions to shareholders from net investment income |
— | — | (0.02 | ) | (0.02 | ) | (0.07 | ) | ||||||||||||||
| Distributions to shareholders from net realized gains |
(4.73 | ) | (1.45 | ) | (1.48 | ) | (2.10 | ) | (2.10 | ) | ||||||||||||
| Total distributions |
(4.73 | ) | (1.45 | ) | (1.50 | ) | (2.12 | ) | (2.17 | ) | ||||||||||||
| Net asset value, end of year |
$ | 18.74 | $ | 30.22 | $ | 24.92 | $ | 18.93 | $ | 20.61 | ||||||||||||
| Total Return(b) | (26.32 | )% | 28.56 | % | 41.98 | % | 3.98 | % | 24.13 | % | ||||||||||||
| Net assets, end of year (in 000’s) |
$ | 9,676 | $ | 16,789 | $ | 13,744 | $ | 12,497 | $ | 15,286 | ||||||||||||
| Ratio of net expenses to average net assets |
0.80 | % | 0.80 | % | 0.81 | % | 0.80 | % | 0.81 | % | ||||||||||||
| Ratio of total expenses to average net assets |
0.94 | % | 0.95 | % | 1.01 | % | 1.07 | % | 1.20 | % | ||||||||||||
| Ratio of net investment income (loss) to average net assets |
(0.37 | )% | (0.32 | )% | (0.07 | )% | 0.17 | % | 0.31 | % | ||||||||||||
| Portfolio turnover rate(c) |
29 | % | 37 | % | 36 | % | 40 | % | 44 | % | ||||||||||||
| (a) | Calculated based on the average shares outstanding methodology. |
| (b) | Assumes investment at the NAV at the beginning of the year, reinvestment of all dividends and distributions, a complete redemption of the investment at the NAV at the end of the year and no sales or redemption charges (if any). Total returns would be reduced if a sales or redemption charge was taken into account. Returns do not reflect the impact of taxes to shareholders relating to Fund distributions or the redemption of Fund shares. |
| (c) | The Fund’s portfolio turnover rate is calculated in accordance with regulatory requirements, without regard to transactions involving short term investments. If such transactions were included, the Fund’s portfolio turnover rate may be higher. |
| 84 | The accompanying notes are an integral part of these financial statements. |
GOLDMAN SACHS CONCENTRATED GROWTH FUND
Financial Highlights (continued)
Selected Data for a Share Outstanding Throughout Each Year
| Goldman Sachs Concentrated Growth Fund | ||||||||||||||||||||||
| Investor Shares | ||||||||||||||||||||||
| Year Ended August 31, | ||||||||||||||||||||||
| 2022 | 2021 | 2020 | 2019 | 2018 | ||||||||||||||||||
| Per Share Data | ||||||||||||||||||||||
| Net asset value, beginning of year |
$ | 28.33 | $ | 23.46 | $ | 17.90 | $ | 19.66 | $ | 17.88 | ||||||||||||
| Net investment income (loss)(a) |
(0.09 | ) | (0.09 | ) | (0.03 | ) | 0.01 | 0.03 | ||||||||||||||
| Net realized and unrealized gain (loss) |
(6.17 | ) | 6.41 | 7.07 | 0.36 | 3.88 | ||||||||||||||||
| Total from investment operations |
(6.26 | ) | 6.32 | 7.04 | 0.37 | 3.91 | ||||||||||||||||
| Distributions to shareholders from net investment income |
— | — | — | (b) | (0.03 | ) | (0.03 | ) | ||||||||||||||
| Distributions to shareholders from net realized gains |
(4.73 | ) | (1.45 | ) | (1.48 | ) | (2.10 | ) | (2.10 | ) | ||||||||||||
| Total distributions |
(4.73 | ) | (1.45 | ) | (1.48 | ) | (2.13 | ) | (2.13 | ) | ||||||||||||
| Net asset value, end of year |
$ | 17.34 | $ | 28.33 | $ | 23.46 | $ | 17.90 | $ | 19.66 | ||||||||||||
| Total Return(c) | (26.35 | )% | 28.50 | % | 41.87 | % | 3.83 | % | 23.94 | % | ||||||||||||
| Net assets, end of year (in 000’s) |
$ | 163 | $ | 296 | $ | 189 | $ | 133 | $ | 463 | ||||||||||||
| Ratio of net expenses to average net assets |
0.85 | % | 0.86 | % | 0.91 | % | 0.91 | % | 0.92 | % | ||||||||||||
| Ratio of total expenses to average net assets |
1.06 | % | 1.07 | % | 1.11 | % | 1.22 | % | 1.26 | % | ||||||||||||
| Ratio of net investment income (loss) to average net assets |
(0.42 | )% | (0.39 | )% | (0.18 | )% | 0.03 | % | 0.17 | % | ||||||||||||
| Portfolio turnover rate(d) |
29 | % | 37 | % | 36 | % | 40 | % | 44 | % | ||||||||||||
| (a) | Calculated based on the average shares outstanding methodology. |
| (b) | Amount is less than $0.005 per share. |
| (c) | Assumes investment at the NAV at the beginning of the year, reinvestment of all dividends and distributions, a complete redemption of the investment at the NAV at the end of the year and no sales or redemption charges (if any). Total returns would be reduced if a sales or redemption charge was taken into account. Returns do not reflect the impact of taxes to shareholders relating to Fund distributions or the redemption of Fund shares. |
| (d) | The Fund’s portfolio turnover rate is calculated in accordance with regulatory requirements, without regard to transactions involving short term investments. If such transactions were included, the Fund’s portfolio turnover rate may be higher. |
| The accompanying notes are an integral part of these financial statements. | 85 |
GOLDMAN SACHS CONCENTRATED GROWTH FUND
Financial Highlights (continued)
Selected Data for a Share Outstanding Throughout Each Year
| Goldman Sachs Concentrated Growth Fund | ||||||||||||||||||||||
| Class R6 Shares | ||||||||||||||||||||||
| Year Ended August 31, | ||||||||||||||||||||||
| 2022 | 2021 | 2020 | 2019 | 2018 | ||||||||||||||||||
| Per Share Data |
| |||||||||||||||||||||
| Net asset value, beginning of year |
$ | 30.15 | $ | 24.86 | $ | 18.88 | $ | 20.60 | $ | 18.65 | ||||||||||||
| Net investment income (loss)(a) |
(0.09 | ) | (0.08 | ) | (0.01 | ) | 0.04 | 0.06 | ||||||||||||||
| Net realized and unrealized gain (loss) |
(6.64 | ) | 6.82 | 7.49 | 0.39 | 4.06 | ||||||||||||||||
| Total from investment operations |
(6.73 | ) | 6.74 | 7.48 | 0.43 | 4.12 | ||||||||||||||||
| Distributions to shareholders from net investment income |
— | — | (0.02 | ) | (0.05 | ) | (0.07 | ) | ||||||||||||||
| Distributions to shareholders from net realized gains |
(4.73 | ) | (1.45 | ) | (1.48 | ) | (2.10 | ) | (2.10 | ) | ||||||||||||
| Total distributions |
(4.73 | ) | (1.45 | ) | (1.50 | ) | (2.15 | ) | (2.17 | ) | ||||||||||||
| Net asset value, end of year |
$ | 18.69 | $ | 30.15 | $ | 24.86 | $ | 18.88 | $ | 20.60 | ||||||||||||
| Total Return(b) | (26.31 | )% | 28.59 | % | 42.05 | % | 4.00 | % | 24.09 | % | ||||||||||||
| Net assets, end of year (in 000’s) |
$ | 780 | $ | 1,497 | $ | 806 | $ | 538 | $ | 99 | ||||||||||||
| Ratio of net expenses to average net assets |
0.79 | % | 0.79 | % | 0.80 | % | 0.79 | % | 0.80 | % | ||||||||||||
| Ratio of total expenses to average net assets |
0.93 | % | 0.94 | % | 0.98 | % | 1.04 | % | 1.09 | % | ||||||||||||
| Ratio of net investment income (loss) to average net assets |
(0.36 | )% | (0.30 | )% | (0.07 | )% | 0.22 | % | 0.34 | % | ||||||||||||
| Portfolio turnover rate(c) |
29 | % | 37 | % | 36 | % | 40 | % | 44 | % | ||||||||||||
| (a) | Calculated based on the average shares outstanding methodology. |
| (b) | Assumes investment at the NAV at the beginning of the year, reinvestment of all dividends and distributions, a complete redemption of the investment at the NAV at the end of the year and no sales or redemption charges (if any). Total returns would be reduced if a sales or redemption charge was taken into account. Returns do not reflect the impact of taxes to shareholders relating to Fund distributions or the redemption of Fund shares. |
| (c) | The Fund’s portfolio turnover rate is calculated in accordance with regulatory requirements, without regard to transactions involving short term investments. If such transactions were included, the Fund’s portfolio turnover rate may be higher. |
| 86 | The accompanying notes are an integral part of these financial statements. |
GOLDMAN SACHS CONCENTRATED GROWTH FUND
Financial Highlights (continued)
Selected Data for a Share Outstanding Throughout Each Year
| Goldman Sachs Concentrated Growth Fund | ||||||||||||||||||||||
| Class R Shares | ||||||||||||||||||||||
| Year Ended August 31, | ||||||||||||||||||||||
| 2022 | 2021 | 2020 | 2019 | 2018 | ||||||||||||||||||
| Per Share Data |
| |||||||||||||||||||||
| Net asset value, beginning of year |
$ | 26.11 | $ | 21.84 | $ | 16.84 | $ | 18.68 | $ | 17.13 | ||||||||||||
| Net investment loss(a) |
(0.18 | ) | (0.20 | ) | (0.12 | ) | (0.07 | ) | (0.05 | ) | ||||||||||||
| Net realized and unrealized gain (loss) |
(5.58 | ) | 5.92 | 6.60 | 0.33 | 3.70 | ||||||||||||||||
| Total from investment operations |
(5.76 | ) | 5.72 | 6.48 | 0.26 | 3.65 | ||||||||||||||||
| Distributions to shareholders from net realized gains |
(4.73 | ) | (1.45 | ) | (1.48 | ) | (2.10 | ) | (2.10 | ) | ||||||||||||
| Net asset value, end of year |
$ | 15.62 | $ | 26.11 | $ | 21.84 | $ | 16.84 | $ | 18.68 | ||||||||||||
| Total Return(b) | (26.72 | )% | 27.84 | % | 41.12 | % | 3.36 | % | 23.37 | % | ||||||||||||
| Net assets, end of year (in 000’s) |
$ | 31 | $ | 42 | $ | 33 | $ | 36 | $ | 34 | ||||||||||||
| Ratio of net expenses to average net assets |
1.35 | % | 1.36 | % | 1.41 | % | 1.41 | % | 1.42 | % | ||||||||||||
| Ratio of total expenses to average net assets |
1.56 | % | 1.57 | % | 1.66 | % | 1.70 | % | 1.75 | % | ||||||||||||
| Ratio of net investment loss to average net assets |
(0.91 | )% | (0.88 | )% | (0.69 | )% | (0.43 | )% | (0.29 | )% | ||||||||||||
| Portfolio turnover rate(c) |
29 | % | 37 | % | 36 | % | 40 | % | 44 | % | ||||||||||||
| (a) | Calculated based on the average shares outstanding methodology. |
| (b) | Assumes investment at the NAV at the beginning of the year, reinvestment of all dividends and distributions, a complete redemption of the investment at the NAV at the end of the year and no sales or redemption charges (if any). Total returns would be reduced if a sales or redemption charge was taken into account. Returns do not reflect the impact of taxes to shareholders relating to Fund distributions or the redemption of Fund shares. |
| (c) | The Fund’s portfolio turnover rate is calculated in accordance with regulatory requirements, without regard to transactions involving short term investments. If such transactions were included, the Fund’s portfolio turnover rate may be higher. |
| The accompanying notes are an integral part of these financial statements. | 87 |
GOLDMAN SACHS CONCENTRATED GROWTH FUND
Financial Highlights (continued)
Selected Data for a Share Outstanding Throughout Each Period
| Goldman Sachs Concentrated Growth Fund | ||||||||||||||||||||||
| Class P Shares | ||||||||||||||||||||||
| Year Ended August 31, | Period Ended August 31, 2018(a) |
|||||||||||||||||||||
| 2022 | 2021 | 2020 | 2019 | |||||||||||||||||||
| Per Share Data | ||||||||||||||||||||||
| Net asset value, beginning of period |
$ | 30.14 | $ | 24.85 | $ | 18.88 | $ | 20.60 | $ | 18.54 | ||||||||||||
| Net investment income (loss)(b) |
(0.08 | ) | (0.08 | ) | (0.01 | ) | 0.03 | 0.02 | ||||||||||||||
| Net realized and unrealized gain (loss) |
(6.65 | ) | 6.82 | 7.48 | 0.40 | 2.04 | ||||||||||||||||
| Total from investment operations |
(6.73 | ) | 6.74 | 7.47 | 0.43 | 2.06 | ||||||||||||||||
| Distributions to shareholders from net investment income |
— | — | (0.02 | ) | (0.05 | ) | — | |||||||||||||||
| Distributions to shareholders from net realized gains |
(4.73 | ) | (1.45 | ) | (1.48 | ) | (2.10 | ) | — | |||||||||||||
| Total distributions |
(4.73 | ) | (1.45 | ) | (1.50 | ) | (2.15 | ) | — | |||||||||||||
| Net asset value, end of period |
$ | 18.68 | $ | 30.14 | $ | 24.85 | $ | 18.88 | $ | 20.60 | ||||||||||||
| Total Return(c) | (26.32 | )% | 28.60 | % | 42.00 | % | 4.01 | % | 11.11 | % | ||||||||||||
| Net assets, end of period (in 000’s) |
$ | 127,302 | $ | 190,213 | $ | 160,582 | $ | 128,289 | $ | 143,078 | ||||||||||||
| Ratio of net expenses to average net assets |
0.79 | % | 0.79 | % | 0.80 | % | 0.79 | % | 0.79 | %(d) | ||||||||||||
| Ratio of total expenses to average net assets |
0.93 | % | 0.94 | % | 0.99 | % | 1.06 | % | 0.72 | %(d) | ||||||||||||
| Ratio of net investment income (loss) to average net assets |
(0.35 | )% | (0.31 | )% | (0.06 | )% | 0.18 | % | 0.32 | %(d) | ||||||||||||
| Portfolio turnover rate(e) |
29 | % | 37 | % | 36 | % | 40 | % | 44 | % | ||||||||||||
| (a) | Commenced operations on April 17, 2018. |
| (b) | Calculated based on the average shares outstanding methodology. |
| (c) | Assumes investment at the NAV at the beginning of the period, reinvestment of all dividends and distributions, a complete redemption of the investment at the NAV at the end of the period and no sales or redemption charges (if any). Total returns would be reduced if a sales or redemption charge was taken into account. Returns do not reflect the impact of taxes to shareholders relating to Fund distributions or the redemption of Fund shares. Total returns for periods less than one full year are not annualized. |
| (d) | Annualized. |
| (e) | The Fund’s portfolio turnover rate is calculated in accordance with regulatory requirements, without regard to transactions involving short term investments. If such transactions were included, the Fund’s portfolio turnover rate may be higher. |
| 88 | The accompanying notes are an integral part of these financial statements. |
GOLDMAN SACHS FLEXIBLE CAP FUND
Financial Highlights (continued)
Selected Data for a Share Outstanding Throughout Each Year
| (a) | Calculated based on the average shares outstanding methodology. |
| (b) | Assumes investment at the NAV at the beginning of the year, reinvestment of all dividends and distributions, a complete redemption of the investment at the NAV at the end of the year and no sales or redemption charges (if any). Total returns would be reduced if a sales or redemption charge was taken into account. Returns do not reflect the impact of taxes to shareholders relating to Fund distributions or the redemption of Fund shares. |
| (c) | The Fund’s portfolio turnover rate is calculated in accordance with regulatory requirements, without regard to transactions involving short term investments. If such transactions were included, the Fund’s portfolio turnover rate may be higher. |
| The accompanying notes are an integral part of these financial statements. | 89 |
GOLDMAN SACHS FLEXIBLE CAP FUND
Financial Highlights (continued)
Selected Data for a Share Outstanding Throughout Each Year
| Goldman Sachs Flexible Cap Fund | ||||||||||||||||||||||
| Class C Shares | ||||||||||||||||||||||
| Year Ended August 31, | ||||||||||||||||||||||
| 2022 | 2021 | 2020 | 2019 | 2018 | ||||||||||||||||||
| Per Share Data |
| |||||||||||||||||||||
| Net asset value, beginning of year |
$ | 14.17 | $ | 11.67 | $ | 10.23 | $ | 11.00 | $ | 12.75 | ||||||||||||
| Net investment loss(a) |
(0.05 | ) | (0.07 | ) | (0.02 | ) | — | (b) | — | (b) | ||||||||||||
| Net realized and unrealized gain (loss) |
(1.52 | ) | 3.31 | 2.10 | 0.13 | 1.93 | ||||||||||||||||
| Total from investment operations |
(1.57 | ) | 3.24 | 2.08 | 0.13 | 1.93 | ||||||||||||||||
| Distributions to shareholders from net investment income |
— | — | (0.02 | ) | (0.03 | ) | — | |||||||||||||||
| Distributions to shareholders from net realized gains |
(1.03 | ) | (0.74 | ) | (0.62 | ) | (0.87 | ) | (3.68 | ) | ||||||||||||
| Total distributions |
(1.03 | ) | (0.74 | ) | (0.64 | ) | (0.90 | ) | (3.68 | ) | ||||||||||||
| Net asset value, end of year |
$ | 11.57 | $ | 14.17 | $ | 11.67 | $ | 10.23 | $ | 11.00 | ||||||||||||
| Total Return(c) | (12.07 | )% | 29.19 | % | 21.16 | % | 2.30 | % | 18.00 | % | ||||||||||||
| Net assets, end of year (in 000’s) |
$ | 890 | $ | 1,354 | $ | 1,516 | $ | 1,288 | $ | 1,304 | ||||||||||||
| Ratio of net expenses to average net assets |
1.71 | % | 1.71 | % | 1.75 | % | 1.72 | % | 1.70 | % | ||||||||||||
| Ratio of total expenses to average net assets |
2.35 | % | 2.76 | % | 3.19 | % | 3.63 | % | 3.20 | % | ||||||||||||
| Ratio of net investment loss to average net assets |
(0.39 | )% | (0.54 | )% | (0.16 | )% | 0.00 | %(d) | (0.02 | )% | ||||||||||||
| Portfolio turnover rate(e) |
49 | % | 43 | % | 69 | % | 50 | % | 157 | % | ||||||||||||
| (a) | Calculated based on the average shares outstanding methodology. |
| (b) | Amount is less than $0.005 per share. |
| (c) | Assumes investment at the NAV at the beginning of the year, reinvestment of all dividends and distributions, a complete redemption of the investment at the NAV at the end of the year and no sales or redemption charges (if any). Total returns would be reduced if a sales or redemption charge was taken into account. Returns do not reflect the impact of taxes to shareholders relating to Fund distributions or the redemption of Fund shares. |
| (d) | Amount is less than 0.005% per share. |
| (e) | The Fund’s portfolio turnover rate is calculated in accordance with regulatory requirements, without regard to transactions involving short term investments. If such transactions were included, the Fund’s portfolio turnover rate may be higher. |
| 90 | The accompanying notes are an integral part of these financial statements. |
GOLDMAN SACHS FLEXIBLE CAP FUND
Financial Highlights (continued)
Selected Data for a Share Outstanding Throughout Each Year
| Goldman Sachs Flexible Cap Fund | ||||||||||||||||||||||
| Institutional Shares | ||||||||||||||||||||||
| Year Ended August 31, | ||||||||||||||||||||||
| 2022 | 2021 | 2020 | 2019 | 2018 | ||||||||||||||||||
| Per Share Data |
| |||||||||||||||||||||
| Net asset value, beginning of year |
$ | 18.56 | $ | 15.01 | $ | 12.94 | $ | 13.61 | $ | 14.88 | ||||||||||||
| Net investment income(a) |
0.13 | 0.09 | 0.12 | 0.13 | 0.14 | |||||||||||||||||
| Net realized and unrealized gain (loss) |
(2.04 | ) | 4.31 | 2.70 | 0.19 | 2.33 | ||||||||||||||||
| Total from investment operations |
(1.91 | ) | 4.40 | 2.82 | 0.32 | 2.47 | ||||||||||||||||
| Distributions to shareholders from net investment income |
(0.09 | ) | (0.11 | ) | (0.13 | ) | (0.12 | ) | (0.06 | ) | ||||||||||||
| Distributions to shareholders from net realized gains |
(1.03 | ) | (0.74 | ) | (0.62 | ) | (0.87 | ) | (3.68 | ) | ||||||||||||
| Total distributions |
(1.12 | ) | (0.85 | ) | (0.75 | ) | (0.99 | ) | (3.74 | ) | ||||||||||||
| Net asset value, end of year |
$ | 15.53 | $ | 18.56 | $ | 15.01 | $ | 12.94 | $ | 13.61 | ||||||||||||
| Total Return(b) | (11.10 | )% | 30.62 | % | 22.53 | % | 3.47 | % | 19.29 | % | ||||||||||||
| Net assets, end of year (in 000’s) |
$ | 8,832 | $ | 4,514 | $ | 594 | $ | 587 | $ | 1,633 | ||||||||||||
| Ratio of net expenses to average net assets |
0.59 | % | 0.59 | % | 0.62 | % | 0.59 | % | 0.59 | % | ||||||||||||
| Ratio of total expenses to average net assets |
1.24 | % | 1.46 | % | 2.11 | % | 2.41 | % | 2.01 | % | ||||||||||||
| Ratio of net investment income to average net assets |
0.78 | % | 0.54 | % | 0.95 | % | 1.08 | % | 1.04 | % | ||||||||||||
| Portfolio turnover rate(c) |
49 | % | 43 | % | 69 | % | 50 | % | 157 | % | ||||||||||||
| (a) | Calculated based on the average shares outstanding methodology. |
| (b) | Assumes investment at the NAV at the beginning of the year, reinvestment of all dividends and distributions, a complete redemption of the investment at the NAV at the end of the year and no sales or redemption charges (if any). Total returns would be reduced if a sales or redemption charge was taken into account. Returns do not reflect the impact of taxes to shareholders relating to Fund distributions or the redemption of Fund shares. |
| (c) | The Fund’s portfolio turnover rate is calculated in accordance with regulatory requirements, without regard to transactions involving short term investments. If such transactions were included, the Fund’s portfolio turnover rate may be higher. |
| The accompanying notes are an integral part of these financial statements. | 91 |
GOLDMAN SACHS FLEXIBLE CAP FUND
Financial Highlights (continued)
Selected Data for a Share Outstanding Throughout Each Year
| Goldman Sachs Flexible Cap Fund | ||||||||||||||||||||||
| Investor Shares | ||||||||||||||||||||||
| Year Ended August 31, | ||||||||||||||||||||||
| 2022 | 2021 | 2020 | 2019 | 2018 | ||||||||||||||||||
| Per Share Data |
| |||||||||||||||||||||
| Net asset value, beginning of year |
$ | 18.09 | $ | 14.66 | $ | 12.65 | $ | 13.35 | $ | 14.63 | ||||||||||||
| Net investment income(a) |
0.14 | 0.07 | 0.10 | 0.12 | 0.12 | |||||||||||||||||
| Net realized and unrealized gain (loss) |
(2.01 | ) | 4.19 | 2.64 | 0.18 | 2.28 | ||||||||||||||||
| Total from investment operations |
(1.87 | ) | 4.26 | 2.74 | 0.30 | 2.40 | ||||||||||||||||
| Distributions to shareholders from net investment income |
(0.07 | ) | (0.09 | ) | (0.11 | ) | (0.13 | ) | — | |||||||||||||
| Distributions to shareholders from net realized gains |
(1.03 | ) | (0.74 | ) | (0.62 | ) | (0.87 | ) | (3.68 | ) | ||||||||||||
| Total distributions |
(1.10 | ) | (0.83 | ) | (0.73 | ) | (1.00 | ) | (3.68 | ) | ||||||||||||
| Net asset value, end of year |
$ | 15.12 | $ | 18.09 | $ | 14.66 | $ | 12.65 | $ | 13.35 | ||||||||||||
| Total Return(b) | (11.21 | )% | 30.39 | % | 22.43 | % | 3.40 | % | 19.08 | % | ||||||||||||
| Net assets, end of year (in 000’s) |
$ | 66 | $ | 52 | $ | 38 | $ | 70 | $ | 68 | ||||||||||||
| Ratio of net expenses to average net assets |
0.71 | % | 0.71 | % | 0.76 | % | 0.72 | % | 0.70 | % | ||||||||||||
| Ratio of total expenses to average net assets |
1.42 | % | 1.74 | % | 2.66 | % | 2.63 | % | 2.08 | % | ||||||||||||
| Ratio of net investment income to average net assets |
0.91 | % | 0.46 | % | 0.78 | % | 0.99 | % | 0.88 | % | ||||||||||||
| Portfolio turnover rate(c) |
49 | % | 43 | % | 69 | % | 50 | % | 157 | % | ||||||||||||
| (a) | Calculated based on the average shares outstanding methodology. |
| (b) | Assumes investment at the NAV at the beginning of the year, reinvestment of all dividends and distributions, a complete redemption of the investment at the NAV at the end of the year and no sales or redemption charges (if any). Total returns would be reduced if a sales or redemption charge was taken into account. Returns do not reflect the impact of taxes to shareholders relating to Fund distributions or the redemption of Fund shares. |
| (c) | The Fund’s portfolio turnover rate is calculated in accordance with regulatory requirements, without regard to transactions involving short term investments. If such transactions were included, the Fund’s portfolio turnover rate may be higher. |
| 92 | The accompanying notes are an integral part of these financial statements. |
GOLDMAN SACHS FLEXIBLE CAP FUND
Financial Highlights (continued)
Selected Data for a Share Outstanding Throughout Each Year
| Goldman Sachs Flexible Cap Fund | ||||||||||||||||||||||
| Class R6 Shares | ||||||||||||||||||||||
| Year Ended August 31, | ||||||||||||||||||||||
| 2022 | 2021 | 2020 | 2019 | 2018 | ||||||||||||||||||
| Per Share Data |
| |||||||||||||||||||||
| Net asset value, beginning of year |
$ | 18.52 | $ | 14.98 | $ | 12.91 | $ | 13.61 | $ | 14.88 | ||||||||||||
| Net investment income(a) |
0.15 | 0.10 | 0.13 | 0.14 | 0.15 | |||||||||||||||||
| Net realized and unrealized gain (loss) |
(2.05 | ) | 4.29 | 2.69 | 0.18 | 2.32 | ||||||||||||||||
| Total from investment operations |
(1.90 | ) | 4.39 | 2.82 | 0.32 | 2.47 | ||||||||||||||||
| Distributions to shareholders from net investment income |
(0.09 | ) | (0.11 | ) | (0.13 | ) | (0.15 | ) | (0.06 | ) | ||||||||||||
| Distributions to shareholders from net realized gains |
(1.03 | ) | (0.74 | ) | (0.62 | ) | (0.87 | ) | (3.68 | ) | ||||||||||||
| Total distributions |
(1.12 | ) | (0.85 | ) | (0.75 | ) | (1.02 | ) | (3.74 | ) | ||||||||||||
| Net asset value, end of year |
$ | 15.50 | $ | 18.52 | $ | 14.98 | $ | 12.91 | $ | 13.61 | ||||||||||||
| Total Return(b) | (11.12 | )% | 30.64 | % | 22.60 | % | 3.47 | % | 19.27 | % | ||||||||||||
| Net assets, end of year (in 000’s) |
$ | 2,061 | $ | 334 | $ | 226 | $ | 202 | $ | 14 | ||||||||||||
| Ratio of net expenses to average net assets |
0.58 | % | 0.58 | % | 0.61 | % | 0.59 | % | 0.58 | % | ||||||||||||
| Ratio of total expenses to average net assets |
1.26 | % | 1.61 | % | 2.10 | % | 2.59 | % | 2.09 | % | ||||||||||||
| Ratio of net investment income to average net assets |
0.92 | % | 0.59 | % | 0.96 | % | 1.17 | % | 1.11 | % | ||||||||||||
| Portfolio turnover rate(c) |
49 | % | 43 | % | 69 | % | 50 | % | 157 | % | ||||||||||||
| (a) | Calculated based on the average shares outstanding methodology. |
| (b) | Assumes investment at the NAV at the beginning of the year, reinvestment of all dividends and distributions, a complete redemption of the investment at the NAV at the end of the year and no sales or redemption charges (if any). Total returns would be reduced if a sales or redemption charge was taken into account. Returns do not reflect the impact of taxes to shareholders relating to Fund distributions or the redemption of Fund shares. |
| (c) | The Fund’s portfolio turnover rate is calculated in accordance with regulatory requirements, without regard to transactions involving short term investments. If such transactions were included, the Fund’s portfolio turnover rate may be higher. |
| The accompanying notes are an integral part of these financial statements. | 93 |
GOLDMAN SACHS FLEXIBLE CAP FUND
Financial Highlights (continued)
Selected Data for a Share Outstanding Throughout Each Year
| Goldman Sachs Flexible Cap Fund | ||||||||||||||||||||||
| Class R Shares | ||||||||||||||||||||||
| Year Ended August 31, | ||||||||||||||||||||||
| 2022 | 2021 | 2020 | 2019 | 2018 | ||||||||||||||||||
| Per Share Data |
| |||||||||||||||||||||
| Net asset value, beginning of year |
$ | 16.08 | $ | 13.13 | $ | 11.40 | $ | 12.14 | $ | 13.67 | ||||||||||||
| Net investment income (loss)(a) |
— | (b) | (0.01 | ) | 0.04 | 0.05 | 0.06 | |||||||||||||||
| Net realized and unrealized gain (loss) |
(1.73 | ) | 3.74 | 2.36 | 0.16 | 2.09 | ||||||||||||||||
| Total from investment operations |
(1.73 | ) | 3.73 | 2.40 | 0.21 | 2.15 | ||||||||||||||||
| Distributions to shareholders from net investment income |
— | (0.04 | ) | (0.05 | ) | (0.08 | ) | — | ||||||||||||||
| Distributions to shareholders from net realized gains |
(1.03 | ) | (0.74 | ) | (0.62 | ) | (0.87 | ) | (3.68 | ) | ||||||||||||
| Total distributions |
(1.03 | ) | (0.78 | ) | (0.67 | ) | (0.95 | ) | (3.68 | ) | ||||||||||||
| Net asset value, end of year |
$ | 13.32 | $ | 16.08 | $ | 13.13 | $ | 11.40 | $ | 12.14 | ||||||||||||
| Total Return(c) | (11.68 | )% | 29.78 | % | 21.78 | % | 2.89 | % | 18.50 | % | ||||||||||||
| Net assets, end of year (in 000’s) |
$ | 10 | $ | 46 | $ | 49 | $ | 39 | $ | 49 | ||||||||||||
| Ratio of net expenses to average net assets |
1.21 | % | 1.21 | % | 1.25 | % | 1.22 | % | 1.20 | % | ||||||||||||
| Ratio of total expenses to average net assets |
1.89 | % | 2.23 | % | 2.63 | % | 3.13 | % | 2.74 | % | ||||||||||||
| Ratio of net investment income (loss) to average net assets |
0.01 | % | (0.04 | )% | 0.33 | % | 0.49 | % | 0.48 | % | ||||||||||||
| Portfolio turnover rate(d) |
49 | % | 43 | % | 69 | % | 50 | % | 157 | % | ||||||||||||
| (a) | Calculated based on the average shares outstanding methodology. |
| (b) | Amount is less than $0.005 per share. |
| (c) | Assumes investment at the NAV at the beginning of the year, reinvestment of all dividends and distributions, a complete redemption of the investment at the NAV at the end of the year and no sales or redemption charges (if any). Total returns would be reduced if a sales or redemption charge was taken into account. Returns do not reflect the impact of taxes to shareholders relating to Fund distributions or the redemption of Fund shares. |
| (d) | The Fund’s portfolio turnover rate is calculated in accordance with regulatory requirements, without regard to transactions involving short term investments. If such transactions were included, the Fund’s portfolio turnover rate may be higher. |
| 94 | The accompanying notes are an integral part of these financial statements. |
GOLDMAN SACHS FLEXIBLE CAP FUND
Financial Highlights (continued)
Selected Data for a Share Outstanding Throughout Each Period
| Goldman Sachs Flexible Cap Fund | ||||||||||||||||||||||
| Class P Shares | ||||||||||||||||||||||
| Year Ended August 31, | Period Ended August 31, 2018(a) |
|||||||||||||||||||||
| 2022 | 2021 | 2020 | 2019 | |||||||||||||||||||
| Per Share Data |
| |||||||||||||||||||||
| Net asset value, beginning of period |
$ | 18.52 | $ | 14.99 | $ | 12.92 | $ | 13.61 | $ | 12.75 | ||||||||||||
| Net investment income(b) |
0.13 | 0.10 | 0.13 | 0.14 | 0.09 | |||||||||||||||||
| Net realized and unrealized gain (loss) |
(2.02 | ) | 4.28 | 2.69 | 0.19 | 0.77 | ||||||||||||||||
| Total from investment operations |
(1.89 | ) | 4.38 | 2.82 | 0.33 | 0.86 | ||||||||||||||||
| Distributions to shareholders from net investment income |
(0.09 | ) | (0.11 | ) | (0.13 | ) | (0.15 | ) | — | |||||||||||||
| Distributions to shareholders from net realized gains |
(1.03 | ) | (0.74 | ) | (0.62 | ) | (0.87 | ) | — | |||||||||||||
| Total distributions |
(1.12 | ) | (0.85 | ) | (0.75 | ) | (1.02 | ) | — | |||||||||||||
| Net asset value, end of period |
$ | 15.51 | $ | 18.52 | $ | 14.99 | $ | 12.92 | $ | 13.61 | ||||||||||||
| Total Return(c) | (11.07 | )% | 30.55 | % | 22.58 | % | 3.56 | % | 6.75 | % | ||||||||||||
| Net assets, end of period (in 000’s) |
$ | 22,240 | $ | 24,713 | $ | 15,263 | $ | 11,110 | $ | 12,616 | ||||||||||||
| Ratio of net expenses to average net assets |
0.58 | % | 0.58 | % | 0.61 | % | 0.58 | % | 0.58 | %(d) | ||||||||||||
| Ratio of total expenses to average net assets |
1.22 | % | 1.59 | % | 1.94 | % | 2.47 | % | 3.14 | %(d) | ||||||||||||
| Ratio of net investment income to average net assets |
0.75 | % | 0.59 | % | 0.96 | % | 1.13 | % | 1.79 | %(d) | ||||||||||||
| Portfolio turnover rate(e) |
49 | % | 43 | % | 69 | % | 50 | % | 157 | % | ||||||||||||
| (a) | Commenced operations on April 17, 2018. |
| (b) | Calculated based on the average shares outstanding methodology. |
| (c) | Assumes investment at the NAV at the beginning of the period, reinvestment of all dividends and distributions, a complete redemption of the investment at the NAV at the end of the period and no sales or redemption charges (if any). Total returns would be reduced if a sales or redemption charge was taken into account. Returns do not reflect the impact of taxes to shareholders relating to Fund distributions or the redemption of Fund shares. Total returns for periods less than one full year are not annualized. |
| (d) | Annualized. |
| (e) | The Fund’s portfolio turnover rate is calculated in accordance with regulatory requirements, without regard to transactions involving short term investments. If such transactions were included, the Fund’s portfolio turnover rate may be higher. |
| The accompanying notes are an integral part of these financial statements. | 95 |
GOLDMAN SACHS LARGE CAP CORE FUND
Financial Highlights (continued)
Selected Data for a Share Outstanding Throughout Each Year
| (a) | Calculated based on the average shares outstanding methodology. |
| (b) | Amount is less than $0.005 per share. |
| (c) | Assumes investment at the NAV at the beginning of the year, reinvestment of all dividends and distributions, a complete redemption of the investment at the NAV at the end of the year and no sales or redemption charges (if any). Total returns would be reduced if a sales or redemption charge was taken into account. Returns do not reflect the impact of taxes to shareholders relating to Fund distributions or the redemption of Fund shares. |
| (d) | The Fund’s portfolio turnover rate is calculated in accordance with regulatory requirements, without regard to transactions involving short term investments. If such transactions were included, the Fund’s portfolio turnover rate may be higher. |
| 96 | The accompanying notes are an integral part of these financial statements. |
GOLDMAN SACHS LARGE CAP CORE FUND
Financial Highlights (continued)
Selected Data for a Share Outstanding Throughout Each Year
| Goldman Sachs Large Cap Core Fund | ||||||||||||||||||||||
| Class C Shares | ||||||||||||||||||||||
| Year Ended August 31, | ||||||||||||||||||||||
| 2022 | 2021 | 2020 | 2019 | 2018 | ||||||||||||||||||
| Per Share Data |
| |||||||||||||||||||||
| Net asset value, beginning of year |
$ | 19.86 | $ | 16.05 | $ | 14.05 | $ | 24.01 | $ | 22.13 | ||||||||||||
| Net investment loss(a) |
(0.10 | ) | (0.16 | ) | (0.06 | ) | (0.07 | ) | (0.16 | ) | ||||||||||||
| Net realized and unrealized gain (loss) |
(2.53 | ) | 4.97 | 2.95 | (0.56 | ) | 4.51 | |||||||||||||||
| Total from investment operations |
(2.63 | ) | 4.81 | 2.89 | (0.63 | ) | 4.35 | |||||||||||||||
| Distributions to shareholders from net realized gains |
(3.42 | ) | (1.00 | ) | (0.89 | ) | (9.33 | ) | (2.47 | ) | ||||||||||||
| Net asset value, end of year |
$ | 13.81 | $ | 19.86 | $ | 16.05 | $ | 14.05 | $ | 24.01 | ||||||||||||
| Total Return(b) | (16.04 | )% | 31.41 | % | 21.37 | % | 3.01 | % | 21.11 | % | ||||||||||||
| Net assets, end of year (in 000’s) |
$ | 16,518 | $ | 21,144 | $ | 16,596 | $ | 18,674 | $ | 65,983 | ||||||||||||
| Ratio of net expenses to average net assets |
1.82 | % | 1.86 | % | 1.89 | % | 1.89 | % | 1.89 | % | ||||||||||||
| Ratio of total expenses to average net assets |
1.90 | % | 1.92 | % | 1.97 | % | 1.97 | % | 2.06 | % | ||||||||||||
| Ratio of net investment loss to average net assets |
(0.61 | )% | (0.92 | )% | (0.45 | )% | (0.41 | )% | (0.70 | )% | ||||||||||||
| Portfolio turnover rate(c) |
63 | % | 46 | % | 47 | % | 55 | % | 93 | % | ||||||||||||
| (a) | Calculated based on the average shares outstanding methodology. |
| (b) | Assumes investment at the NAV at the beginning of the year, reinvestment of all dividends and distributions, a complete redemption of the investment at the NAV at the end of the year and no sales or redemption charges (if any). Total returns would be reduced if a sales or redemption charge was taken into account. Returns do not reflect the impact of taxes to shareholders relating to Fund distributions or the redemption of Fund shares. |
| (c) | The Fund’s portfolio turnover rate is calculated in accordance with regulatory requirements, without regard to transactions involving short term investments. If such transactions were included, the Fund’s portfolio turnover rate may be higher. |
| The accompanying notes are an integral part of these financial statements. | 97 |
GOLDMAN SACHS LARGE CAP CORE FUND
Financial Highlights (continued)
Selected Data for a Share Outstanding Throughout Each Year
| Goldman Sachs Large Cap Core Fund | ||||||||||||||||||||||
| Institutional Shares | ||||||||||||||||||||||
| Year Ended August 31, | ||||||||||||||||||||||
| 2022 | 2021 | 2020 | 2019 | 2018 | ||||||||||||||||||
| Per Share Data |
| |||||||||||||||||||||
| Net asset value, beginning of year |
$ | 40.01 | $ | 31.19 | $ | 26.39 | $ | 35.76 | $ | 31.60 | ||||||||||||
| Net investment income(a) |
0.17 | 0.07 | 0.16 | 0.20 | 0.13 | |||||||||||||||||
| Net realized and unrealized gain (loss) |
(5.67 | ) | 9.90 | 5.70 | (0.17 | ) | 6.62 | |||||||||||||||
| Total from investment operations |
(5.50 | ) | 9.97 | 5.86 | 0.03 | 6.75 | ||||||||||||||||
| Distributions to shareholders from net investment income |
— | (0.15 | ) | (0.17 | ) | (0.07 | ) | (0.12 | ) | |||||||||||||
| Distributions to shareholders from net realized gains |
(3.42 | ) | (1.00 | ) | (0.89 | ) | (9.33 | ) | (2.47 | ) | ||||||||||||
| Total distributions |
(3.42 | ) | (1.15 | ) | (1.06 | ) | (9.40 | ) | (2.59 | ) | ||||||||||||
| Net asset value, end of year |
$ | 31.09 | $ | 40.01 | $ | 31.19 | $ | 26.39 | $ | 35.76 | ||||||||||||
| Total Return(b) | (15.08 | )% | 32.86 | % | 22.71 | % | 4.14 | % | 22.50 | % | ||||||||||||
| Net assets, end of year (in 000’s) |
$ | 93,741 | $ | 118,823 | $ | 64,708 | $ | 60,169 | $ | 77,293 | ||||||||||||
| Ratio of net expenses to average net assets |
0.72 | % | 0.74 | % | 0.76 | % | 0.75 | % | 0.75 | % | ||||||||||||
| Ratio of total expenses to average net assets |
0.78 | % | 0.80 | % | 0.84 | % | 0.83 | % | 0.93 | % | ||||||||||||
| Ratio of net investment income to average net assets |
0.49 | % | 0.20 | % | 0.58 | % | 0.74 | % | 0.40 | % | ||||||||||||
| Portfolio turnover rate(c) |
63 | % | 46 | % | 47 | % | 55 | % | 93 | % | ||||||||||||
| (a) | Calculated based on the average shares outstanding methodology. |
| (b) | Assumes investment at the NAV at the beginning of the year, reinvestment of all dividends and distributions, a complete redemption of the investment at the NAV at the end of the year and no sales or redemption charges (if any). Total returns would be reduced if a sales or redemption charge was taken into account. Returns do not reflect the impact of taxes to shareholders relating to Fund distributions or the redemption of Fund shares. |
| (c) | The Fund’s portfolio turnover rate is calculated in accordance with regulatory requirements, without regard to transactions involving short term investments. If such transactions were included, the Fund’s portfolio turnover rate may be higher. |
| 98 | The accompanying notes are an integral part of these financial statements. |
GOLDMAN SACHS LARGE CAP CORE FUND
Financial Highlights (continued)
Selected Data for a Share Outstanding Throughout Each Year
| Goldman Sachs Large Cap Core Fund | ||||||||||||||||||||||
| Service Shares | ||||||||||||||||||||||
| Year Ended August 31, | ||||||||||||||||||||||
| 2022 | 2021 | 2020 | 2019 | 2018 | ||||||||||||||||||
| Per Share Data |
| |||||||||||||||||||||
| Net asset value, beginning of year |
$ | 32.41 | $ | 25.46 | $ | 21.73 | $ | 31.33 | $ | 28.00 | ||||||||||||
| Net investment income (loss)(a) |
(0.03 | ) | (0.08 | ) | 0.03 | 0.06 | (0.01 | ) | ||||||||||||||
| Net realized and unrealized gain (loss) |
(4.45 | ) | 8.04 | 4.66 | (0.33 | ) | 5.81 | |||||||||||||||
| Total from investment operations |
(4.48 | ) | 7.96 | 4.69 | (0.27 | ) | 5.80 | |||||||||||||||
| Distributions to shareholders from net investment income |
— | (0.01 | ) | (0.07 | ) | — | — | |||||||||||||||
| Distributions to shareholders from net realized gains |
(3.42 | ) | (1.00 | ) | (0.89 | ) | (9.33 | ) | (2.47 | ) | ||||||||||||
| Total distributions |
(3.42 | ) | (1.01 | ) | (0.96 | ) | (9.33 | ) | (2.47 | ) | ||||||||||||
| Net asset value, end of year |
$ | 24.51 | $ | 32.41 | $ | 25.46 | $ | 21.73 | $ | 31.33 | ||||||||||||
| Total Return(b) | (15.50 | )% | 32.21 | % | 22.12 | % | 3.57 | % | 21.91 | % | ||||||||||||
| Net assets, end of year (in 000’s) |
$ | 486 | $ | 2,151 | $ | 1,814 | $ | 1,546 | $ | 1,802 | ||||||||||||
| Ratio of net expenses to average net assets |
1.23 | % | 1.24 | % | 1.26 | % | 1.25 | % | 1.25 | % | ||||||||||||
| Ratio of total expenses to average net assets |
1.28 | % | 1.30 | % | 1.34 | % | 1.33 | % | 1.41 | % | ||||||||||||
| Ratio of net investment income (loss) to average net assets |
(0.11 | )% | (0.30 | )% | 0.13 | % | 0.25 | % | (0.04 | )% | ||||||||||||
| Portfolio turnover rate(c) |
63 | % | 46 | % | 47 | % | 55 | % | 93 | % | ||||||||||||
| (a) | Calculated based on the average shares outstanding methodology. |
| (b) | Assumes investment at the NAV at the beginning of the year, reinvestment of all dividends and distributions, a complete redemption of the investment at the NAV at the end of the year and no sales or redemption charges (if any). Total returns would be reduced if a sales or redemption charge was taken into account. Returns do not reflect the impact of taxes to shareholders relating to Fund distributions or the redemption of Fund shares. |
| (c) | The Fund’s portfolio turnover rate is calculated in accordance with regulatory requirements, without regard to transactions involving short term investments. If such transactions were included, the Fund’s portfolio turnover rate may be higher. |
| The accompanying notes are an integral part of these financial statements. | 99 |
GOLDMAN SACHS LARGE CAP CORE FUND
Financial Highlights (continued)
Selected Data for a Share Outstanding Throughout Each Year
| Goldman Sachs Large Cap Core Fund | ||||||||||||||||||||||
| Investor Shares | ||||||||||||||||||||||
| Year Ended August 31, | ||||||||||||||||||||||
| 2022 | 2021 | 2020 | 2019 | 2018 | ||||||||||||||||||
| Per Share Data |
| |||||||||||||||||||||
| Net asset value, beginning of year |
$ | 35.18 | $ | 27.56 | $ | 23.43 | $ | 32.94 | $ | 29.31 | ||||||||||||
| Net investment income(a) |
0.13 | 0.02 | 0.11 | 0.15 | 0.09 | |||||||||||||||||
| Net realized and unrealized gain (loss) |
(4.93 | ) | 8.73 | 5.05 | (0.28 | ) | 6.11 | |||||||||||||||
| Total from investment operations |
(4.80 | ) | 8.75 | 5.16 | (0.13 | ) | 6.20 | |||||||||||||||
| Distributions to shareholders from net investment income |
— | (0.13 | ) | (0.14 | ) | (0.05 | ) | (0.10 | ) | |||||||||||||
| Distributions to shareholders from net realized gains |
(3.42 | ) | (1.00 | ) | (0.89 | ) | (9.33 | ) | (2.47 | ) | ||||||||||||
| Total distributions |
(3.42 | ) | (1.13 | ) | (1.03 | ) | (9.38 | ) | (2.57 | ) | ||||||||||||
| Net asset value, end of year |
$ | 26.96 | $ | 35.18 | $ | 27.56 | $ | 23.43 | $ | 32.94 | ||||||||||||
| Total Return(b) | (15.16 | )% | 32.71 | % | 22.56 | % | 3.96 | % | 22.35 | % | ||||||||||||
| Net assets, end of year (in 000’s) |
$ | 36,346 | $ | 21,889 | $ | 8,703 | $ | 6,649 | $ | 9,259 | ||||||||||||
| Ratio of net expenses to average net assets |
0.81 | % | 0.86 | % | 0.89 | % | 0.89 | % | 0.89 | % | ||||||||||||
| Ratio of total expenses to average net assets |
0.90 | % | 0.92 | % | 0.96 | % | 0.97 | % | 1.06 | % | ||||||||||||
| Ratio of net investment income to average net assets |
0.44 | % | 0.08 | % | 0.46 | % | 0.60 | % | 0.31 | % | ||||||||||||
| Portfolio turnover rate(c) |
63 | % | 46 | % | 47 | % | 55 | % | 93 | % | ||||||||||||
| (a) | Calculated based on the average shares outstanding methodology. |
| (b) | Assumes investment at the NAV at the beginning of the year, reinvestment of all dividends and distributions, a complete redemption of the investment at the NAV at the end of the year and no sales or redemption charges (if any). Total returns would be reduced if a sales or redemption charge was taken into account. Returns do not reflect the impact of taxes to shareholders relating to Fund distributions or the redemption of Fund shares. |
| (c) | The Fund’s portfolio turnover rate is calculated in accordance with regulatory requirements, without regard to transactions involving short term investments. If such transactions were included, the Fund’s portfolio turnover rate may be higher. |
| 100 | The accompanying notes are an integral part of these financial statements. |
GOLDMAN SACHS LARGE CAP CORE FUND
Financial Highlights (continued)
Selected Data for a Share Outstanding Throughout Each Year
| Goldman Sachs Large Cap Core Fund | ||||||||||||||||||||||
| Class R6 Shares | ||||||||||||||||||||||
| Year Ended August 31, | ||||||||||||||||||||||
| 2022 | 2021 | 2020 | 2019 | 2018 | ||||||||||||||||||
| Per Share Data |
| |||||||||||||||||||||
| Net asset value, beginning of year |
$ | 39.96 | $ | 31.14 | $ | 26.35 | $ | 35.75 | $ | 31.60 | ||||||||||||
| Net investment income(a) |
0.19 | 0.07 | 0.16 | 0.19 | 0.20 | |||||||||||||||||
| Net realized and unrealized gain (loss) |
(5.69 | ) | 9.90 | 5.69 | (0.17 | ) | 6.55 | |||||||||||||||
| Total from investment operations |
(5.50 | ) | 9.97 | 5.85 | 0.02 | 6.75 | ||||||||||||||||
| Distributions to shareholders from net investment income |
— | (0.15 | ) | (0.17 | ) | (0.09 | ) | (0.13 | ) | |||||||||||||
| Distributions to shareholders from net realized gains |
(3.42 | ) | (1.00 | ) | (0.89 | ) | (9.33 | ) | (2.47 | ) | ||||||||||||
| Total distributions |
(3.42 | ) | (1.15 | ) | (1.06 | ) | (9.42 | ) | (2.60 | ) | ||||||||||||
| Net asset value, end of year |
$ | 31.04 | $ | 39.96 | $ | 31.14 | $ | 26.35 | $ | 35.75 | ||||||||||||
| Total Return(b) | (15.07 | )% | 32.92 | % | 22.71 | % | 4.12 | % | 22.53 | % | ||||||||||||
| Net assets, end of year (in 000’s) |
$ | 78,897 | $ | 8,707 | $ | 2,454 | $ | 2,313 | $ | 60 | ||||||||||||
| Ratio of net expenses to average net assets |
0.70 | % | 0.73 | % | 0.75 | % | 0.74 | % | 0.74 | % | ||||||||||||
| Ratio of total expenses to average net assets |
0.77 | % | 0.78 | % | 0.83 | % | 0.83 | % | 0.90 | % | ||||||||||||
| Ratio of net investment income to average net assets |
0.56 | % | 0.21 | % | 0.59 | % | 0.75 | % | 0.60 | % | ||||||||||||
| Portfolio turnover rate(c) |
63 | % | 46 | % | 47 | % | 55 | % | 93 | % | ||||||||||||
| (a) | Calculated based on the average shares outstanding methodology. |
| (b) | Assumes investment at the NAV at the beginning of the year, reinvestment of all dividends and distributions, a complete redemption of the investment at the NAV at the end of the year and no sales or redemption charges (if any). Total returns would be reduced if a sales or redemption charge was taken into account. Returns do not reflect the impact of taxes to shareholders relating to Fund distributions or the redemption of Fund shares. |
| (c) | The Fund’s portfolio turnover rate is calculated in accordance with regulatory requirements, without regard to transactions involving short term investments. If such transactions were included, the Fund’s portfolio turnover rate may be higher. |
| The accompanying notes are an integral part of these financial statements. | 101 |
GOLDMAN SACHS LARGE CAP CORE FUND
Financial Highlights (continued)
Selected Data for a Share Outstanding Throughout Each Year
| Goldman Sachs Large Cap Core Fund | ||||||||||||||||||||||
| Class R Shares | ||||||||||||||||||||||
| Year Ended August 31, | ||||||||||||||||||||||
| 2022 | 2021 | 2020 | 2019 | 2018 | ||||||||||||||||||
| Per Share Data |
| |||||||||||||||||||||
| Net asset value, beginning of year |
$ | 32.19 | $ | 25.32 | $ | 21.63 | $ | 31.26 | $ | 28.01 | ||||||||||||
| Net investment income (loss)(a) |
(0.03 | ) | (0.12 | ) | — | (b) | 0.02 | (0.06 | ) | |||||||||||||
| Net realized and unrealized gain (loss) |
(4.45 | ) | 8.01 | 4.62 | (0.32 | ) | 5.81 | |||||||||||||||
| Total from investment operations |
(4.48 | ) | 7.89 | 4.62 | (0.30 | ) | 5.75 | |||||||||||||||
| Distributions to shareholders from net investment income |
— | (0.02 | ) | (0.04 | ) | — | (0.03 | ) | ||||||||||||||
| Distributions to shareholders from net realized gains |
(3.42 | ) | (1.00 | ) | (0.89 | ) | (9.33 | ) | (2.47 | ) | ||||||||||||
| Total distributions |
(3.42 | ) | (1.02 | ) | (0.93 | ) | (9.33 | ) | (2.50 | ) | ||||||||||||
| Net asset value, end of year |
$ | 24.29 | $ | 32.19 | $ | 25.32 | $ | 21.63 | $ | 31.26 | ||||||||||||
| Total Return(c) | (15.58 | )% | 32.09 | % | 21.90 | % | 3.47 | % | 21.73 | % | ||||||||||||
| Net assets, end of year (in 000’s) |
$ | 8,186 | $ | 12,608 | $ | 10,097 | $ | 8,559 | $ | 8,887 | ||||||||||||
| Ratio of net expenses to average net assets |
1.32 | % | 1.36 | % | 1.39 | % | 1.39 | % | 1.39 | % | ||||||||||||
| Ratio of total expenses to average net assets |
1.40 | % | 1.42 | % | 1.47 | % | 1.47 | % | 1.56 | % | ||||||||||||
| Ratio of net investment income (loss) to average net assets |
(0.12 | )% | (0.42 | )% | 0.01 | % | 0.11 | % | (0.20 | )% | ||||||||||||
| Portfolio turnover rate(d) |
63 | % | 46 | % | 47 | % | 55 | % | 93 | % | ||||||||||||
| (a) | Calculated based on the average shares outstanding methodology. |
| (b) | Amount is less than $0.005 per share. |
| (c) | Assumes investment at the NAV at the beginning of the year, reinvestment of all dividends and distributions, a complete redemption of the investment at the NAV at the end of the year and no sales or redemption charges (if any). Total returns would be reduced if a sales or redemption charge was taken into account. Returns do not reflect the impact of taxes to shareholders relating to Fund distributions or the redemption of Fund shares. |
| (d) | The Fund’s portfolio turnover rate is calculated in accordance with regulatory requirements, without regard to transactions involving short term investments. If such transactions were included, the Fund’s portfolio turnover rate may be higher. |
| 102 | The accompanying notes are an integral part of these financial statements. |
GOLDMAN SACHS LARGE CAP CORE FUND
Financial Highlights (continued)
Selected Data for a Share Outstanding Throughout Each Period
| Goldman Sachs Large Cap Core Fund | ||||||||||||||||||||||
| Class P Shares | ||||||||||||||||||||||
| Year Ended August 31, | Period Ended August 31, 2018(a) |
|||||||||||||||||||||
| 2022 | 2021 | 2020 | 2019 | |||||||||||||||||||
| Per Share Data |
| |||||||||||||||||||||
| Net asset value, beginning of period |
$ | 39.94 | $ | 31.13 | $ | 26.34 | $ | 35.74 | $ | 33.39 | ||||||||||||
| Net investment income(b) |
0.18 | 0.07 | 0.16 | 0.20 | 0.09 | |||||||||||||||||
| Net realized and unrealized gain (loss) |
(5.67 | ) | 9.89 | 5.69 | (0.18 | ) | 2.26 | |||||||||||||||
| Total from investment operations |
(5.49 | ) | 9.96 | 5.85 | 0.02 | 2.35 | ||||||||||||||||
| Distributions to shareholders from net investment income |
— | (0.15 | ) | (0.17 | ) | (0.09 | ) | — | ||||||||||||||
| Distributions to shareholders from net realized gains |
(3.42 | ) | (1.00 | ) | (0.89 | ) | (9.33 | ) | — | |||||||||||||
| Total distributions |
(3.42 | ) | (1.15 | ) | (1.06 | ) | (9.42 | ) | — | |||||||||||||
| Net asset value, end of period |
$ | 31.03 | $ | 39.94 | $ | 31.13 | $ | 26.34 | $ | 35.74 | ||||||||||||
| Total Return(c) | (15.08 | )% | 32.90 | % | 22.73 | % | 4.13 | % | 7.04 | % | ||||||||||||
| Net assets, end of period (in 000’s) |
$ | 109,347 | $ | 132,700 | $ | 95,182 | $ | 85,422 | $ | 104,131 | ||||||||||||
| Ratio of net expenses to average net assets |
0.71 | % | 0.73 | % | 0.75 | % | 0.74 | % | 0.74 | %(d) | ||||||||||||
| Ratio of total expenses to average net assets |
0.77 | % | 0.79 | % | 0.83 | % | 0.82 | % | 0.85 | %(d) | ||||||||||||
| Ratio of net investment income to average net assets |
0.50 | % | 0.21 | % | 0.59 | % | 0.75 | % | 0.72 | %(d) | ||||||||||||
| Portfolio turnover rate(e) |
63 | % | 46 | % | 47 | % | 55 | % | 93 | % | ||||||||||||
| (a) | Commenced operations on April 17, 2018. |
| (b) | Calculated based on the average shares outstanding methodology. |
| (c) | Assumes investment at the NAV at the beginning of the period, reinvestment of all dividends and distributions, a complete redemption of the investment at the NAV at the end of the period and no sales or redemption charges (if any). Total returns would be reduced if a sales or redemption charge was taken into account. Returns do not reflect the impact of taxes to shareholders relating to Fund distributions or the redemption of Fund shares. Total returns for periods less than one full year are not annualized. |
| (d) | Annualized. |
| (e) | The Fund’s portfolio turnover rate is calculated in accordance with regulatory requirements, without regard to transactions involving short term investments. If such transactions were included, the Fund’s portfolio turnover rate may be higher. |
| The accompanying notes are an integral part of these financial statements. | 103 |
GOLDMAN SACHS MID CAP GROWTH FUND
Financial Highlights (continued)
Selected Data for a Share Outstanding Throughout Each Year
| (a) | Calculated based on the average shares outstanding methodology. |
| (b) | Assumes investment at the NAV at the beginning of the year, reinvestment of all dividends and distributions, a complete redemption of the investment at the NAV at the end of the year and no sales or redemption charges (if any). Total returns would be reduced if a sales or redemption charge was taken into account. Returns do not reflect the impact of taxes to shareholders relating to Fund distributions or the redemption of Fund shares. |
| (c) | The Fund’s portfolio turnover rate is calculated in accordance with regulatory requirements, without regard to transactions involving short term investments. If such transactions were included, the Fund’s portfolio turnover rate may be higher. |
| 104 | The accompanying notes are an integral part of these financial statements. |
GOLDMAN SACHS MID CAP GROWTH FUND
Financial Highlights (continued)
Selected Data for a Share Outstanding Throughout Each Year
| Goldman Sachs Mid Cap Growth Fund | ||||||||||||||||||||||
| Class C Shares | ||||||||||||||||||||||
| Year Ended August 31, | ||||||||||||||||||||||
| 2022 | 2021 | 2020 | 2019 | 2018 | ||||||||||||||||||
| Per Share Data* |
| |||||||||||||||||||||
| Net asset value, beginning of year |
$ | 102.96 | $ | 162.72 | $ | 243.84 | $ | 386.64 | $ | 430.80 | ||||||||||||
| Net investment loss(a) |
(0.48 | ) | (1.68 | ) | (2.16 | ) | (3.12 | ) | (5.28 | ) | ||||||||||||
| Net realized and unrealized gain (loss) |
(9.97 | ) | 39.12 | 41.76 | 1.44 | 71.76 | ||||||||||||||||
| Total from investment operations |
(10.45 | ) | 37.44 | 39.60 | (1.68 | ) | 66.48 | |||||||||||||||
| Distributions to shareholders from net realized gains |
(75.36 | ) | (97.20 | ) | (120.72 | ) | (141.12 | ) | (110.64 | ) | ||||||||||||
| Net asset value, end of year |
$ | 17.15 | $ | 102.96 | $ | 162.72 | $ | 243.84 | $ | 386.64 | ||||||||||||
| Total Return(b) | (26.40 | )% | 32.89 | % | 27.86 | % | 7.24 | % | 18.52 | % | ||||||||||||
| Net assets, end of year (in 000’s) |
$ | 13,261 | $ | 23,337 | $ | 28,894 | $ | 40,072 | $ | 77,990 | ||||||||||||
| Ratio of net expenses to average net assets |
1.99 | % | 1.99 | % | 2.00 | % | 2.02 | % | 2.05 | % | ||||||||||||
| Ratio of total expenses to average net assets |
2.12 | % | 2.12 | % | 2.16 | % | 2.14 | % | 2.15 | % | ||||||||||||
| Ratio of net investment loss to average net assets |
(1.48 | )% | (1.62 | )% | (1.38 | )% | (1.25 | )% | (1.35 | )% | ||||||||||||
| Portfolio turnover rate(c) |
50 | % | 57 | % | 65 | % | 69 | % | 60 | % | ||||||||||||
| * | On June 10, 2022, the Fund’s Class C Shares affected a 24-for-1 reverse share split. All per share data prior to June 10, 2022 has been adjusted to reflect the reverse share split. |
| (a) | Calculated based on the average shares outstanding methodology. |
| (b) | Assumes investment at the NAV at the beginning of the year, reinvestment of all dividends and distributions, a complete redemption of the investment at the NAV at the end of the year and no sales or redemption charges (if any). Total returns would be reduced if a sales or redemption charge was taken into account. Returns do not reflect the impact of taxes to shareholders relating to Fund distributions or the redemption of Fund shares. |
| (c) | The Fund’s portfolio turnover rate is calculated in accordance with regulatory requirements, without regard to transactions involving short term investments. If such transactions were included, the Fund’s portfolio turnover rate may be higher. |
| The accompanying notes are an integral part of these financial statements. | 105 |
GOLDMAN SACHS MID CAP GROWTH FUND
Financial Highlights (continued)
Selected Data for a Share Outstanding Throughout Each Year
| Goldman Sachs Mid Cap Growth Fund | ||||||||||||||||||||||
| Institutional Shares | ||||||||||||||||||||||
| Year Ended August 31, | ||||||||||||||||||||||
| 2022 | 2021 | 2020 | 2019 | 2018 | ||||||||||||||||||
| Per Share Data |
| |||||||||||||||||||||
| Net asset value, beginning of year |
$ | 26.68 | $ | 23.41 | $ | 22.93 | $ | 27.78 | $ | 27.54 | ||||||||||||
| Net investment loss(a) |
(0.08 | ) | (0.13 | ) | (0.06 | ) | (0.04 | ) | (0.07 | ) | ||||||||||||
| Net realized and unrealized gain (loss) |
(6.09 | ) | 7.45 | 5.57 | 1.07 | 4.92 | ||||||||||||||||
| Total from investment operations |
(6.17 | ) | 7.32 | 5.51 | 1.03 | 4.85 | ||||||||||||||||
| Distributions to shareholders from net realized gains |
(3.14 | ) | (4.05 | ) | (5.03 | ) | (5.88 | ) | (4.61 | ) | ||||||||||||
| Net asset value, end of year |
$ | 17.37 | $ | 26.68 | $ | 23.41 | $ | 22.93 | $ | 27.78 | ||||||||||||
| Total Return(b) | (25.69 | )% | 34.27 | % | 29.33 | % | 8.34 | % | 19.78 | % | ||||||||||||
| Net assets, end of year (in 000’s) |
$ | 313,137 | $ | 478,127 | $ | 442,693 | $ | 491,659 | $ | 1,178,239 | ||||||||||||
| Ratio of net expenses to average net assets |
0.90 | % | 0.90 | % | 0.91 | % | 0.93 | % | 0.96 | % | ||||||||||||
| Ratio of total expenses to average net assets |
1.00 | % | 1.00 | % | 1.03 | % | 1.00 | % | 1.01 | % | ||||||||||||
| Ratio of net investment loss to average net assets |
(0.39 | )% | (0.53 | )% | (0.29 | )% | (0.17 | )% | (0.26 | )% | ||||||||||||
| Portfolio turnover rate(c) |
50 | % | 57 | % | 65 | % | 69 | % | 60 | % | ||||||||||||
| (a) | Calculated based on the average shares outstanding methodology. |
| (b) | Assumes investment at the NAV at the beginning of the year, reinvestment of all dividends and distributions, a complete redemption of the investment at the NAV at the end of the year and no sales or redemption charges (if any). Total returns would be reduced if a sales or redemption charge was taken into account. Returns do not reflect the impact of taxes to shareholders relating to Fund distributions or the redemption of Fund shares. |
| (c) | The Fund’s portfolio turnover rate is calculated in accordance with regulatory requirements, without regard to transactions involving short term investments. If such transactions were included, the Fund’s portfolio turnover rate may be higher. |
| 106 | The accompanying notes are an integral part of these financial statements. |
GOLDMAN SACHS MID CAP GROWTH FUND
Financial Highlights (continued)
Selected Data for a Share Outstanding Throughout Each Year
| Goldman Sachs Mid Cap Growth Fund | ||||||||||||||||||||||
| Service Shares | ||||||||||||||||||||||
| Year Ended August 31, | ||||||||||||||||||||||
| 2022 | 2021 | 2020 | 2019 | 2018 | ||||||||||||||||||
| Per Share Data |
| |||||||||||||||||||||
| Net asset value, beginning of year |
$ | 15.97 | $ | 15.50 | $ | 16.89 | $ | 22.29 | $ | 23.05 | ||||||||||||
| Net investment loss(a) |
(0.10 | ) | (0.16 | ) | (0.11 | ) | (0.11 | ) | (0.17 | ) | ||||||||||||
| Net realized and unrealized gain (loss) |
(3.37 | ) | 4.68 | 3.75 | 0.59 | 4.02 | ||||||||||||||||
| Total from investment operations |
(3.47 | ) | 4.52 | 3.64 | 0.48 | 3.85 | ||||||||||||||||
| Distributions to shareholders from net realized gains |
(3.14 | ) | (4.05 | ) | (5.03 | ) | (5.88 | ) | (4.61 | ) | ||||||||||||
| Net asset value, end of year |
$ | 9.36 | $ | 15.97 | $ | 15.50 | $ | 16.89 | $ | 22.29 | ||||||||||||
| Total Return(b) | (26.06 | )% | 33.59 | % | 28.64 | % | 7.82 | % | 19.21 | % | ||||||||||||
| Net assets, end of year (in 000’s) |
$ | 21,107 | $ | 33,114 | $ | 27,723 | $ | 27,094 | $ | 34,211 | ||||||||||||
| Ratio of net expenses to average net assets |
1.40 | % | 1.40 | % | 1.41 | % | 1.43 | % | 1.46 | % | ||||||||||||
| Ratio of total expenses to average net assets |
1.50 | % | 1.50 | % | 1.53 | % | 1.51 | % | 1.51 | % | ||||||||||||
| Ratio of net investment loss to average net assets |
(0.90 | )% | (1.03 | )% | (0.79 | )% | (0.67 | )% | (0.76 | )% | ||||||||||||
| Portfolio turnover rate(c) |
50 | % | 57 | % | 65 | % | 69 | % | 60 | % | ||||||||||||
| (a) | Calculated based on the average shares outstanding methodology. |
| (b) | Assumes investment at the NAV at the beginning of the year, reinvestment of all dividends and distributions, a complete redemption of the investment at the NAV at the end of the year and no sales or redemption charges (if any). Total returns would be reduced if a sales or redemption charge was taken into account. Returns do not reflect the impact of taxes to shareholders relating to Fund distributions or the redemption of Fund shares. |
| (c) | The Fund’s portfolio turnover rate is calculated in accordance with regulatory requirements, without regard to transactions involving short term investments. If such transactions were included, the Fund’s portfolio turnover rate may be higher. |
| The accompanying notes are an integral part of these financial statements. | 107 |
GOLDMAN SACHS MID CAP GROWTH FUND
Financial Highlights (continued)
Selected Data for a Share Outstanding Throughout Each Year
| Goldman Sachs Mid Cap Growth Fund | ||||||||||||||||||||||
| Investor Shares | ||||||||||||||||||||||
| Year Ended August 31, | ||||||||||||||||||||||
| 2022 | 2021 | 2020 | 2019 | 2018 | ||||||||||||||||||
| Per Share Data |
| |||||||||||||||||||||
| Net asset value, beginning of year |
$ | 20.61 | $ | 18.90 | $ | 19.47 | $ | 24.59 | $ | 24.90 | ||||||||||||
| Net investment loss(a) |
(0.07 | ) | (0.12 | ) | (0.07 | ) | (0.05 | ) | (0.08 | ) | ||||||||||||
| Net realized and unrealized gain (loss) |
(4.56 | ) | 5.88 | 4.53 | 0.81 | 4.38 | ||||||||||||||||
| Total from investment operations |
(4.63 | ) | 5.76 | 4.46 | 0.76 | 4.30 | ||||||||||||||||
| Distributions to shareholders from net realized gains |
(3.14 | ) | (4.05 | ) | (5.03 | ) | (5.88 | ) | (4.61 | ) | ||||||||||||
| Net asset value, end of year |
$ | 12.84 | $ | 20.61 | $ | 18.90 | $ | 19.47 | $ | 24.59 | ||||||||||||
| Total Return(b) | (25.79 | )% | 34.19 | % | 29.15 | % | 8.33 | % | 19.64 | % | ||||||||||||
| Net assets, end of year (in 000’s) |
$ | 70,759 | $ | 105,878 | $ | 81,928 | $ | 77,012 | $ | 93,889 | ||||||||||||
| Ratio of net expenses to average net assets |
0.99 | % | 0.99 | % | 1.00 | % | 1.01 | % | 1.05 | % | ||||||||||||
| Ratio of total expenses to average net assets |
1.12 | % | 1.12 | % | 1.16 | % | 1.15 | % | 1.15 | % | ||||||||||||
| Ratio of net investment loss to average net assets |
(0.48 | )% | (0.62 | )% | (0.39 | )% | (0.25 | )% | (0.35 | )% | ||||||||||||
| Portfolio turnover rate(c) |
50 | % | 57 | % | 65 | % | 69 | % | 60 | % | ||||||||||||
| (a) | Calculated based on the average shares outstanding methodology. |
| (b) | Assumes investment at the NAV at the beginning of the year, reinvestment of all dividends and distributions, a complete redemption of the investment at the NAV at the end of the year and no sales or redemption charges (if any). Total returns would be reduced if a sales or redemption charge was taken into account. Returns do not reflect the impact of taxes to shareholders relating to Fund distributions or the redemption of Fund shares. |
| (c) | The Fund’s portfolio turnover rate is calculated in accordance with regulatory requirements, without regard to transactions involving short term investments. If such transactions were included, the Fund’s portfolio turnover rate may be higher. |
| 108 | The accompanying notes are an integral part of these financial statements. |
GOLDMAN SACHS MID CAP GROWTH FUND
Financial Highlights (continued)
Selected Data for a Share Outstanding Throughout Each Year
| Goldman Sachs Mid Cap Growth Fund | ||||||||||||||||||||||
| Class R6 Shares | ||||||||||||||||||||||
| Year Ended August 31, | ||||||||||||||||||||||
| 2022 | 2021 | 2020 | 2019 | 2018 | ||||||||||||||||||
| Per Share Data |
| |||||||||||||||||||||
| Net asset value, beginning of year |
$ | 26.72 | $ | 23.44 | $ | 22.95 | $ | 27.80 | $ | 27.55 | ||||||||||||
| Net investment loss(a) |
(0.08 | ) | (0.13 | ) | (0.06 | ) | (0.04 | ) | (0.07 | ) | ||||||||||||
| Net realized and unrealized gain (loss) |
(6.10 | ) | 7.46 | 5.58 | 1.07 | 4.93 | ||||||||||||||||
| Total from investment operations |
(6.18 | ) | 7.33 | 5.52 | 1.03 | 4.86 | ||||||||||||||||
| Distributions to shareholders from net realized gains |
(3.14 | ) | (4.05 | ) | (5.03 | ) | (5.88 | ) | (4.61 | ) | ||||||||||||
| Net asset value, end of year |
$ | 17.40 | $ | 26.72 | $ | 23.44 | $ | 22.95 | $ | 27.80 | ||||||||||||
| Total Return(b) | (25.69 | )% | 34.27 | % | 29.35 | % | 8.35 | % | 19.80 | % | ||||||||||||
| Net assets, end of year (in 000’s) |
$ | 199,472 | $ | 283,233 | $ | 211,480 | $ | 181,988 | $ | 231,077 | ||||||||||||
| Ratio of net expenses to average net assets |
0.89 | % | 0.89 | % | 0.90 | % | 0.92 | % | 0.95 | % | ||||||||||||
| Ratio of total expenses to average net assets |
0.99 | % | 0.99 | % | 1.02 | % | 1.00 | % | 0.99 | % | ||||||||||||
| Ratio of net investment loss to average net assets |
(0.38 | )% | (0.53 | )% | (0.28 | )% | (0.16 | )% | (0.25 | )% | ||||||||||||
| Portfolio turnover rate(c) |
50 | % | 57 | % | 65 | % | 69 | % | 60 | % | ||||||||||||
| (a) | Calculated based on the average shares outstanding methodology. |
| (b) | Assumes investment at the NAV at the beginning of the year, reinvestment of all dividends and distributions, a complete redemption of the investment at the NAV at the end of the year and no sales or redemption charges (if any). Total returns would be reduced if a sales or redemption charge was taken into account. Returns do not reflect the impact of taxes to shareholders relating to Fund distributions or the redemption of Fund shares. |
| (c) | The Fund’s portfolio turnover rate is calculated in accordance with regulatory requirements, without regard to transactions involving short term investments. If such transactions were included, the Fund’s portfolio turnover rate may be higher. |
| The accompanying notes are an integral part of these financial statements. | 109 |
GOLDMAN SACHS MID CAP GROWTH FUND
Financial Highlights (continued)
Selected Data for a Share Outstanding Throughout Each Year
| Goldman Sachs Mid Cap Growth Fund | ||||||||||||||||||||||
| Class R Shares | ||||||||||||||||||||||
| Year Ended August 31, | ||||||||||||||||||||||
| 2022 | 2021 | 2020 | 2019 | 2018 | ||||||||||||||||||
| Per Share Data |
| |||||||||||||||||||||
| Net asset value, beginning of year |
$ | 15.99 | $ | 15.53 | $ | 16.92 | $ | 22.33 | $ | 23.11 | ||||||||||||
| Net investment loss(a) |
(0.11 | ) | (0.17 | ) | (0.12 | ) | (0.13 | ) | (0.19 | ) | ||||||||||||
| Net realized and unrealized gain (loss) |
(3.37 | ) | 4.68 | 3.76 | 0.60 | 4.02 | ||||||||||||||||
| Total from investment operations |
(3.48 | ) | 4.51 | 3.64 | 0.47 | 3.83 | ||||||||||||||||
| Distributions to shareholders from net realized gains |
(3.14 | ) | (4.05 | ) | (5.03 | ) | (5.88 | ) | (4.61 | ) | ||||||||||||
| Net asset value, end of year |
$ | 9.37 | $ | 15.99 | $ | 15.53 | $ | 16.92 | $ | 22.33 | ||||||||||||
| Total Return(b) | (26.10 | )% | 33.44 | % | 28.58 | % | 7.75 | % | 19.06 | % | ||||||||||||
| Net assets, end of year (in 000’s) |
$ | 33,397 | $ | 54,987 | $ | 48,780 | $ | 45,005 | $ | 54,359 | ||||||||||||
| Ratio of net expenses to average net assets |
1.49 | % | 1.49 | % | 1.50 | % | 1.51 | % | 1.55 | % | ||||||||||||
| Ratio of total expenses to average net assets |
1.62 | % | 1.62 | % | 1.66 | % | 1.64 | % | 1.65 | % | ||||||||||||
| Ratio of net investment loss to average net assets |
(0.98 | )% | (1.12 | )% | (0.89 | )% | (0.76 | )% | (0.85 | )% | ||||||||||||
| Portfolio turnover rate(c) |
50 | % | 57 | % | 65 | % | 69 | % | 60 | % | ||||||||||||
| (a) | Calculated based on the average shares outstanding methodology. |
| (b) | Assumes investment at the NAV at the beginning of the year, reinvestment of all dividends and distributions, a complete redemption of the investment at the NAV at the end of the year and no sales or redemption charges (if any). Total returns would be reduced if a sales or redemption charge was taken into account. Returns do not reflect the impact of taxes to shareholders relating to Fund distributions or the redemption of Fund shares. |
| (c) | The Fund’s portfolio turnover rate is calculated in accordance with regulatory requirements, without regard to transactions involving short term investments. If such transactions were included, the Fund’s portfolio turnover rate may be higher. |
| 110 | The accompanying notes are an integral part of these financial statements. |
GOLDMAN SACHS MID CAP GROWTH FUND
Financial Highlights (continued)
Selected Data for a Share Outstanding Throughout Each Period
| Goldman Sachs Mid Cap Growth Fund | ||||||||||||||||||||||
| Class P Shares | ||||||||||||||||||||||
| Year Ended August 31, | Period Ended August 31, 2018(a) |
|||||||||||||||||||||
| 2022 | 2021 | 2020 | 2019 | |||||||||||||||||||
| Per Share Data |
| |||||||||||||||||||||
| Net asset value, beginning of period |
$ | 26.74 | $ | 23.45 | $ | 22.96 | $ | 27.80 | $ | 26.35 | ||||||||||||
| Net investment loss(b) |
(0.08 | ) | (0.13 | ) | (0.06 | ) | (0.04 | ) | (0.04 | ) | ||||||||||||
| Net realized and unrealized gain (loss) |
(6.11 | ) | 7.47 | 5.58 | 1.08 | 1.49 | ||||||||||||||||
| Total from investment operations |
(6.19 | ) | 7.34 | 5.52 | 1.04 | 1.45 | ||||||||||||||||
| Distributions to shareholders from net realized gains |
(3.14 | ) | (4.05 | ) | (5.03 | ) | (5.88 | ) | — | |||||||||||||
| Net asset value, end of period |
$ | 17.41 | $ | 26.74 | $ | 23.45 | $ | 22.96 | $ | 27.80 | ||||||||||||
| Total Return(c) | (25.68 | )% | 34.26 | % | 29.34 | % | 8.38 | % | 5.50 | % | ||||||||||||
| Net assets, end of period (in 000’s) |
$ | 50,932 | $ | 90,649 | $ | 69,989 | $ | 69,893 | $ | 94,794 | ||||||||||||
| Ratio of net expenses to average net assets |
0.89 | % | 0.89 | % | 0.90 | % | 0.92 | % | 0.95 | %(d) | ||||||||||||
| Ratio of total expenses to average net assets |
0.99 | % | 0.99 | % | 1.02 | % | 1.00 | % | 1.00 | %(d) | ||||||||||||
| Ratio of net investment loss to average net assets |
(0.40 | )% | (0.53 | )% | (0.28 | )% | (0.16 | )% | (0.36 | )%(d) | ||||||||||||
| Portfolio turnover rate(e) |
50 | % | 57 | % | 65 | % | 69 | % | 60 | % | ||||||||||||
| (a) | Commenced operations on April 17, 2018. |
| (b) | Calculated based on the average shares outstanding methodology. |
| (c) | Assumes investment at the NAV at the beginning of the period, reinvestment of all dividends and distributions, a complete redemption of the investment at the NAV at the end of the period and no sales or redemption charges (if any). Total returns would be reduced if a sales or redemption charge was taken into account. Returns do not reflect the impact of taxes to shareholders relating to Fund distributions or the redemption of Fund shares. Total returns for periods less than one full year are not annualized. |
| (d) | Annualized. |
| (e) | The Fund’s portfolio turnover rate is calculated in accordance with regulatory requirements, without regard to transactions involving short term investments. If such transactions were included, the Fund’s portfolio turnover rate may be higher. |
| The accompanying notes are an integral part of these financial statements. | 111 |
GOLDMAN SACHS SMALL CAP GROWTH FUND
Financial Highlights (continued)
Selected Data for a Share Outstanding Throughout Each Period
| (a) | Commenced operations on October 31, 2019. |
| (b) | Calculated based on the average shares outstanding methodology. |
| (c) | Reflects income recognized from special dividends which amounted to $0.01 per share and 0.10% of average net assets. |
| (d) | Reflects income recognized from special dividends which amounted to $0.01 per share and 0.08% of average net assets. |
| (e) | Assumes investment at the NAV at the beginning of the period, reinvestment of all dividends and distributions, a complete redemption of the investment at the NAV at the end of the period and no sales or redemption charges (if any). Total returns would be reduced if a sales or redemption charge was taken into account. Returns do not reflect the impact of taxes to shareholders relating to Fund distributions or the redemption of Fund shares. Total returns for periods less than one full year are not annualized. |
| (f) | Annualized. |
| (g) | The Fund’s portfolio turnover rate is calculated in accordance with regulatory requirements, without regard to transactions involving short term investments. If such transactions were included, the Fund’s portfolio turnover rate may be higher. |
| 112 | The accompanying notes are an integral part of these financial statements. |
GOLDMAN SACHS SMALL CAP GROWTH FUND
Financial Highlights (continued)
Selected Data for a Share Outstanding Throughout Each Period
| Goldman Sachs Small Cap Growth Fund | ||||||||||||||
| Class C Shares | ||||||||||||||
| Year Ended August 31, | Period Ended August 31, 2020(a) |
|||||||||||||
| 2022 | 2021 | |||||||||||||
| Per Share Data |
| |||||||||||||
| Net asset value, beginning of period |
$ | 16.69 | $ | 12.74 | $ | 10.00 | ||||||||
| Net investment loss(b) |
(0.20 | )(c) | (0.27 | )(d) | (0.15 | ) | ||||||||
| Net realized and unrealized gain (loss) |
(3.97 | ) | 5.32 | 2.89 | ||||||||||
| Total from investment operations |
(4.17 | ) | 5.05 | 2.74 | ||||||||||
| Distributions to shareholders from net investment income |
— | — | — | (e) | ||||||||||
| Distributions to shareholders from net realized gains |
(1.59 | ) | (1.10 | ) | — | |||||||||
| Total distributions |
(1.59 | ) | (1.10 | ) | — | (e) | ||||||||
| Net asset value, end of period |
$ | 10.93 | $ | 16.69 | $ | 12.74 | ||||||||
| Total Return(f) | (27.08 | )% | 40.86 | % | 27.44 | % | ||||||||
| Net assets, end of period (in 000’s) |
$ | 72 | $ | 119 | $ | 91 | ||||||||
| Ratio of net expenses to average net assets |
2.03 | % | 2.03 | % | 2.06 | %(g) | ||||||||
| Ratio of total expenses to average net assets |
2.92 | % | 4.09 | % | 9.80 | %(g) | ||||||||
| Ratio of net investment loss to average net assets |
(1.48 | )%(c) | (1.78 | )% | (1.70 | )%(g) | ||||||||
| Portfolio turnover rate(h) |
81 | % | 101 | % | 70 | % | ||||||||
| (a) | Commenced operations on October 31, 2019. |
| (b) | Calculated based on the average shares outstanding methodology. |
| (c) | Reflects income recognized from special dividends which amounted to $0.01 per share and 0.10% of average net assets. |
| (d) | Reflects income recognized from special dividends which amounted to $0.01 per share and 0.08% of average net assets. |
| (e) | Amount is less than $0.005 per share. |
| (f) | Assumes investment at the NAV at the beginning of the period, reinvestment of all dividends and distributions, a complete redemption of the investment at the NAV at the end of the period and no sales or redemption charges (if any). Total returns would be reduced if a sales or redemption charge was taken into account. Returns do not reflect the impact of taxes to shareholders relating to Fund distributions or the redemption of Fund shares. Total returns for periods less than one full year are not annualized. |
| (g) | Annualized. |
| (h) | The Fund’s portfolio turnover rate is calculated in accordance with regulatory requirements, without regard to transactions involving short term investments. If such transactions were included, the Fund’s portfolio turnover rate may be higher. |
| The accompanying notes are an integral part of these financial statements. | 113 |
GOLDMAN SACHS SMALL CAP GROWTH FUND
Financial Highlights (continued)
Selected Data for a Share Outstanding Throughout Each Period
| Goldman Sachs Small Cap Growth Fund | ||||||||||||||
| Institutional Shares | ||||||||||||||
| Year Ended August 31, | Period Ended August 31, 2020(a) |
|||||||||||||
| 2022 | 2021 | |||||||||||||
| Per Share Data |
| |||||||||||||
| Net asset value, beginning of period |
$ | 16.98 | $ | 12.84 | $ | 10.00 | ||||||||
| Net investment loss(b) |
(0.04 | )(c) | (0.10 | )(d) | (0.05 | ) | ||||||||
| Net realized and unrealized gain (loss) |
(4.07 | ) | 5.37 | 2.91 | ||||||||||
| Total from investment operations |
(4.11 | ) | 5.27 | 2.86 | ||||||||||
| Distributions to shareholders from net investment income |
— | (0.03 | ) | (0.02 | ) | |||||||||
| Distributions to shareholders from net realized gains |
(1.59 | ) | (1.10 | ) | — | |||||||||
| Total distributions |
(1.59 | ) | (1.13 | ) | (0.02 | ) | ||||||||
| Net asset value, end of period |
$ | 11.28 | $ | 16.98 | $ | 12.84 | ||||||||
| Total Return(e) | (26.21 | )% | 42.36 | % | 28.68 | % | ||||||||
| Net assets, end of period (in 000’s) |
$ | 18,661 | $ | 14,313 | $ | 10,516 | ||||||||
| Ratio of net expenses to average net assets |
0.91 | % | 0.91 | % | 0.93 | %(f) | ||||||||
| Ratio of total expenses to average net assets |
1.75 | % | 2.93 | % | 8.24 | %(f) | ||||||||
| Ratio of net investment loss to average net assets |
(0.34 | )%(c) | (0.66 | )% | (0.58 | )%(f) | ||||||||
| Portfolio turnover rate(g) |
81 | % | 101 | % | 70 | % | ||||||||
| (a) | Commenced operations on October 31, 2019. |
| (b) | Calculated based on the average shares outstanding methodology. |
| (c) | Reflects income recognized from special dividends which amounted to $0.01 per share and 0.10% of average net assets. |
| (d) | Reflects income recognized from special dividends which amounted to $0.01 per share and 0.08% of average net assets. |
| (e) | Assumes investment at the NAV at the beginning of the period, reinvestment of all dividends and distributions, a complete redemption of the investment at the NAV at the end of the period and no sales or redemption charges (if any). Total returns would be reduced if a sales or redemption charge was taken into account. Returns do not reflect the impact of taxes to shareholders relating to Fund distributions or the redemption of Fund shares. Total returns for periods less than one full year are not annualized. |
| (f) | Annualized. |
| (g) | The Fund’s portfolio turnover rate is calculated in accordance with regulatory requirements, without regard to transactions involving short term investments. If such transactions were included, the Fund’s portfolio turnover rate may be higher. |
| 114 | The accompanying notes are an integral part of these financial statements. |
GOLDMAN SACHS SMALL CAP GROWTH FUND
Financial Highlights (continued)
Selected Data for a Share Outstanding Throughout Each Period
| Goldman Sachs Small Cap Growth Fund | ||||||||||||||
| Investor Shares | ||||||||||||||
| Year Ended August 31, | Period Ended August 31, 2020(a) |
|||||||||||||
| 2022 | 2021 | |||||||||||||
| Per Share Data |
| |||||||||||||
| Net asset value, beginning of period |
$ | 16.96 | $ | 12.83 | $ | 10.00 | ||||||||
| Net investment loss(b) |
(0.06 | )(c) | (0.12 | )(d) | (0.06 | ) | ||||||||
| Net realized and unrealized gain (loss) |
(4.07 | ) | 5.37 | 2.91 | ||||||||||
| Total from investment operations |
(4.13 | ) | 5.25 | 2.85 | ||||||||||
| Distributions to shareholders from net investment income |
— | (0.02 | ) | (0.02 | ) | |||||||||
| Distributions to shareholders from net realized gains |
(1.59 | ) | (1.10 | ) | — | |||||||||
| Total distributions |
(1.59 | ) | (1.12 | ) | (0.02 | ) | ||||||||
| Net asset value, end of period |
$ | 11.24 | $ | 16.96 | $ | 12.83 | ||||||||
| Total Return(e) | (26.37 | )% | 42.21 | % | 28.55 | % | ||||||||
| Net assets, end of period (in 000’s) |
$ | 67 | $ | 91 | $ | 64 | ||||||||
| Ratio of net expenses to average net assets |
1.03 | % | 1.03 | % | 1.06 | %(f) | ||||||||
| Ratio of total expenses to average net assets |
1.90 | % | 3.13 | % | 9.22 | %(f) | ||||||||
| Ratio of net investment loss to average net assets |
(0.48 | )%(c) | (0.78 | )% | (0.69 | )%(f) | ||||||||
| Portfolio turnover rate(g) |
81 | % | 101 | % | 70 | % | ||||||||
| (a) | Commenced operations on October 31, 2019. |
| (b) | Calculated based on the average shares outstanding methodology. |
| (c) | Reflects income recognized from special dividends which amounted to $0.01 per share and 0.10% of average net assets. |
| (d) | Reflects income recognized from special dividends which amounted to $0.01 per share and 0.08% of average net assets. |
| (e) | Assumes investment at the NAV at the beginning of the period, reinvestment of all dividends and distributions, a complete redemption of the investment at the NAV at the end of the period and no sales or redemption charges (if any). Total returns would be reduced if a sales or redemption charge was taken into account. Returns do not reflect the impact of taxes to shareholders relating to Fund distributions or the redemption of Fund shares. Total returns for periods less than one full year are not annualized. |
| (f) | Annualized. |
| (g) | The Fund’s portfolio turnover rate is calculated in accordance with regulatory requirements, without regard to transactions involving short term investments. If such transactions were included, the Fund’s portfolio turnover rate may be higher. |
| The accompanying notes are an integral part of these financial statements. | 115 |
GOLDMAN SACHS SMALL CAP GROWTH FUND
Financial Highlights (continued)
Selected Data for a Share Outstanding Throughout Each Period
| Goldman Sachs Small Cap Growth Fund | ||||||||||||||
| Class R6 Shares | ||||||||||||||
| Year Ended August 31, | Period Ended August 31, 2020(a) |
|||||||||||||
| 2022 | 2021 | |||||||||||||
| Per Share Data |
| |||||||||||||
| Net asset value, beginning of period |
$ | 16.99 | $ | 12.84 | $ | 10.00 | ||||||||
| Net investment loss(b) |
(0.05 | )(c) | (0.10 | )(d) | (0.05 | ) | ||||||||
| Net realized and unrealized gain (loss) |
(4.07 | ) | 5.38 | 2.91 | ||||||||||
| Total from investment operations |
(4.12 | ) | 5.28 | 2.86 | ||||||||||
| Distributions to shareholders from net investment income |
— | (0.03 | ) | (0.02 | ) | |||||||||
| Distributions to shareholders from net realized gains |
(1.59 | ) | (1.10 | ) | — | |||||||||
| Total distributions |
(1.59 | ) | (1.13 | ) | (0.02 | ) | ||||||||
| Net asset value, end of period |
$ | 11.28 | $ | 16.99 | $ | 12.84 | ||||||||
| Total Return(e) | (26.25 | )% | 42.44 | % | 28.68 | % | ||||||||
| Net assets, end of period (in 000’s) |
$ | 68 | $ | 92 | $ | 64 | ||||||||
| Ratio of net expenses to average net assets |
0.90 | % | 0.90 | % | 0.93 | %(f) | ||||||||
| Ratio of total expenses to average net assets |
1.77 | % | 3.00 | % | 9.08 | %(f) | ||||||||
| Ratio of net investment loss to average net assets |
(0.35 | )%(c) | (0.65 | )% | (0.55 | )%(f) | ||||||||
| Portfolio turnover rate(g) |
81 | % | 101 | % | 70 | % | ||||||||
| (a) | Commenced operations on October 31, 2019. |
| (b) | Calculated based on the average shares outstanding methodology. |
| (c) | Reflects income recognized from special dividends which amounted to $0.01 per share and 0.10% of average net assets. |
| (d) | Reflects income recognized from special dividends which amounted to $0.01 per share and 0.08% of average net assets. |
| (e) | Assumes investment at the NAV at the beginning of the period, reinvestment of all dividends and distributions, a complete redemption of the investment at the NAV at the end of the period and no sales or redemption charges (if any). Total returns would be reduced if a sales or redemption charge was taken into account. Returns do not reflect the impact of taxes to shareholders relating to Fund distributions or the redemption of Fund shares. Total returns for periods less than one full year are not annualized. |
| (f) | Annualized. |
| (g) | The Fund’s portfolio turnover rate is calculated in accordance with regulatory requirements, without regard to transactions involving short term investments. If such transactions were included, the Fund’s portfolio turnover rate may be higher. |
| 116 | The accompanying notes are an integral part of these financial statements. |
GOLDMAN SACHS SMALL CAP GROWTH FUND
Financial Highlights (continued)
Selected Data for a Share Outstanding Throughout Each Period
| Goldman Sachs Small Cap Growth Fund | ||||||||||||||
| Class R Shares | ||||||||||||||
| Year Ended August 31, | Period Ended August 31, 2020(a) |
|||||||||||||
| 2022 | 2021 | |||||||||||||
| Per Share Data |
| |||||||||||||
| Net asset value, beginning of period |
$ | 16.84 | $ | 12.79 | $ | 10.00 | ||||||||
| Net investment loss(b) |
(0.13 | )(c) | (0.20 | )(d) | (0.11 | ) | ||||||||
| Net realized and unrealized gain (loss) |
(4.03 | ) | 5.35 | 2.91 | ||||||||||
| Total from investment operations |
(4.16 | ) | 5.15 | 2.80 | ||||||||||
| Distributions to shareholders from net investment income |
— | — | (0.01 | ) | ||||||||||
| Distributions to shareholders from net realized gains |
(1.59 | ) | (1.10 | ) | — | |||||||||
| Total distributions |
(1.59 | ) | (1.10 | ) | (0.01 | ) | ||||||||
| Net asset value, end of period |
$ | 11.09 | $ | 16.84 | $ | 12.79 | ||||||||
| Total Return(e) | (26.76 | )% | 41.51 | % | 28.05 | % | ||||||||
| Net assets, end of period (in 000’s) |
$ | 66 | $ | 91 | $ | 64 | ||||||||
| Ratio of net expenses to average net assets |
1.53 | % | 1.53 | % | 1.56 | %(f) | ||||||||
| Ratio of total expenses to average net assets |
2.41 | % | 3.62 | % | 9.73 | %(f) | ||||||||
| Ratio of net investment loss to average net assets |
(0.98 | )%(c) | (1.28 | )% | (1.19 | )%(f) | ||||||||
| Portfolio turnover rate(g) |
81 | % | 101 | % | 70 | % | ||||||||
| (a) | Commenced operations on October 31, 2019. |
| (b) | Calculated based on the average shares outstanding methodology. |
| (c) | Reflects income recognized from special dividends which amounted to $0.01 per share and 0.10% of average net assets. |
| (d) | Reflects income recognized from special dividends which amounted to $0.01 per share and 0.08% of average net assets. |
| (e) | Assumes investment at the NAV at the beginning of the period, reinvestment of all dividends and distributions, a complete redemption of the investment at the NAV at the end of the period and no sales or redemption charges (if any). Total returns would be reduced if a sales or redemption charge was taken into account. Returns do not reflect the impact of taxes to shareholders relating to Fund distributions or the redemption of Fund shares. Total returns for periods less than one full year are not annualized. |
| (f) | Annualized. |
| (g) | The Fund’s portfolio turnover rate is calculated in accordance with regulatory requirements, without regard to transactions involving short term investments. If such transactions were included, the Fund’s portfolio turnover rate may be higher. |
| The accompanying notes are an integral part of these financial statements. | 117 |
GOLDMAN SACHS SMALL CAP GROWTH FUND
Financial Highlights (continued)
Selected Data for a Share Outstanding Throughout Each Period
| Goldman Sachs Small Cap Growth Fund | ||||||||||||||
| Class P Shares | ||||||||||||||
| Year Ended August 31, | Period Ended August 31, 2020(a) |
|||||||||||||
| 2022 | 2021 | |||||||||||||
| Per Share Data |
| |||||||||||||
| Net asset value, beginning of period |
$ | 16.98 | $ | 12.84 | $ | 10.00 | ||||||||
| Net investment loss(b) |
(0.04 | )(c) | (0.10 | )(d) | (0.05 | ) | ||||||||
| Net realized and unrealized gain (loss) |
(4.08 | ) | 5.37 | 2.91 | ||||||||||
| Total from investment operations |
(4.12 | ) | 5.27 | 2.86 | ||||||||||
| Distributions to shareholders from net investment income |
— | (0.03 | ) | (0.02 | ) | |||||||||
| Distributions to shareholders from net realized gains |
(1.59 | ) | (1.10 | ) | — | |||||||||
| Total distributions |
(1.59 | ) | (1.13 | ) | (0.02 | ) | ||||||||
| Net asset value, end of period |
$ | 11.27 | $ | 16.98 | $ | 12.84 | ||||||||
| Total Return(e) | (26.27 | )% | 42.38 | % | 28.68 | % | ||||||||
| Net assets, end of period (in 000’s) |
$ | 11,540 | $ | 5,349 | $ | 2,831 | ||||||||
| Ratio of net expenses to average net assets |
0.90 | % | 0.90 | % | 0.90 | %(f) | ||||||||
| Ratio of total expenses to average net assets |
1.75 | % | 3.00 | % | 6.73 | %(f) | ||||||||
| Ratio of net investment loss to average net assets |
(0.35 | )%(c) | (0.64 | )% | (0.55 | )%(f) | ||||||||
| Portfolio turnover rate(g) |
81 | % | 101 | % | 70 | % | ||||||||
| (a) | Commenced operations on October 31, 2019. |
| (b) | Calculated based on the average shares outstanding methodology. |
| (c) | Reflects income recognized from special dividends which amounted to $0.01 per share and 0.10% of average net assets. |
| (d) | Reflects income recognized from special dividends which amounted to $0.01 per share and 0.08% of average net assets. |
| (e) | Assumes investment at the NAV at the beginning of the period, reinvestment of all dividends and distributions, a complete redemption of the investment at the NAV at the end of the period and no sales or redemption charges (if any). Total returns would be reduced if a sales or redemption charge was taken into account. Returns do not reflect the impact of taxes to shareholders relating to Fund distributions or the redemption of Fund shares. Total returns for periods less than one full year are not annualized. |
| (f) | Annualized. |
| (g) | The Fund’s portfolio turnover rate is calculated in accordance with regulatory requirements, without regard to transactions involving short term investments. If such transactions were included, the Fund’s portfolio turnover rate may be higher. |
| 118 | The accompanying notes are an integral part of these financial statements. |
GOLDMAN SACHS SMALL/MID CAP GROWTH FUND
Financial Highlights (continued)
Selected Data for a Share Outstanding Throughout Each Year
| (a) | Calculated based on the average shares outstanding methodology. |
| (b) | Reflects income recognized from special dividends which amounted to $0.02 per share and 0.08% of average net assets. |
| (c) | Reflects income recognized from special dividends which amounted to $0.03 per share and 0.11% of average net assets. |
| (d) | Assumes investment at the NAV at the beginning of the year, reinvestment of all dividends and distributions, a complete redemption of the investment at the NAV at the end of the year and no sales or redemption charges (if any). Total returns would be reduced if a sales or redemption charge was taken into account. Returns do not reflect the impact of taxes to shareholders relating to Fund distributions or the redemption of Fund shares. |
| (e) | The Fund’s portfolio turnover rate is calculated in accordance with regulatory requirements, without regard to transactions involving short term investments. If such transactions were included, the Fund’s portfolio turnover rate may be higher. |
| The accompanying notes are an integral part of these financial statements. | 119 |
GOLDMAN SACHS SMALL/MID CAP GROWTH FUND
Financial Highlights (continued)
Selected Data for a Share Outstanding Throughout Each Year
| Goldman Sachs Small/Mid Cap Growth Fund | ||||||||||||||||||||||
| Class C Shares | ||||||||||||||||||||||
| Year Ended August 31, | ||||||||||||||||||||||
| 2022 | 2021 | 2020 | 2019 | 2018 | ||||||||||||||||||
| Per Share Data |
| |||||||||||||||||||||
| Net asset value, beginning of year |
$ | 21.23 | $ | 18.59 | $ | 16.90 | $ | 20.60 | $ | 19.27 | ||||||||||||
| Net investment loss(a) |
(0.24 | ) | (0.34 | ) | (0.25 | ) | (0.22 | )(b) | (0.27 | )(c) | ||||||||||||
| Net realized and unrealized gain (loss) |
(5.24 | ) | 6.82 | 4.96 | 0.17 | 4.48 | ||||||||||||||||
| Total from investment operations |
(5.48 | ) | 6.48 | 4.71 | (0.05 | ) | 4.21 | |||||||||||||||
| Distributions to shareholders from net realized gains |
(3.74 | ) | (3.84 | ) | (3.02 | ) | (3.65 | ) | (2.88 | ) | ||||||||||||
| Distributions to shareholders from return of capital |
(0.03 | ) | — | — | — | — | ||||||||||||||||
| Total distributions |
(3.77 | ) | (3.84 | ) | (3.02 | ) | (3.65 | ) | (2.88 | ) | ||||||||||||
| Net asset value, end of year |
$ | 11.98 | $ | 21.23 | $ | 18.59 | $ | 16.90 | $ | 20.60 | ||||||||||||
| Total Return(d) | (30.18 | )% | 38.00 | % | 32.18 | % | 3.50 | % | 24.30 | % | ||||||||||||
| Net assets, end of year (in 000’s) |
$ | 76,089 | $ | 145,721 | $ | 153,835 | $ | 166,172 | $ | 232,881 | ||||||||||||
| Ratio of net expenses to average net assets |
1.97 | % | 1.96 | % | 2.02 | % | 2.01 | % | 2.03 | % | ||||||||||||
| Ratio of total expenses to average net assets |
2.02 | % | 2.01 | % | 2.08 | % | 2.07 | % | 2.10 | % | ||||||||||||
| Ratio of net investment loss to average net assets |
(1.54 | )% | (1.69 | )% | (1.55 | )% | (1.35 | )%(b) | (1.38 | )%(c) | ||||||||||||
| Portfolio turnover rate(e) |
65 | % | 60 | % | 76 | % | 76 | % | 59 | % | ||||||||||||
| (a) | Calculated based on the average shares outstanding methodology. |
| (b) | Reflects income recognized from special dividends which amounted to $0.02 per share and 0.08% of average net assets. |
| (c) | Reflects income recognized from special dividends which amounted to $0.03 per share and 0.11% of average net assets. |
| (d) | Assumes investment at the NAV at the beginning of the year, reinvestment of all dividends and distributions, a complete redemption of the investment at the NAV at the end of the year and no sales or redemption charges (if any). Total returns would be reduced if a sales or redemption charge was taken into account. Returns do not reflect the impact of taxes to shareholders relating to Fund distributions or the redemption of Fund shares. |
| (e) | The Fund’s portfolio turnover rate is calculated in accordance with regulatory requirements, without regard to transactions involving short term investments. If such transactions were included, the Fund’s portfolio turnover rate may be higher. |
| 120 | The accompanying notes are an integral part of these financial statements. |
GOLDMAN SACHS SMALL/MID CAP GROWTH FUND
Financial Highlights (continued)
Selected Data for a Share Outstanding Throughout Each Year
| Goldman Sachs Small/Mid Cap Growth Fund | ||||||||||||||||||||||
| Institutional Shares | ||||||||||||||||||||||
| Year Ended August 31, | ||||||||||||||||||||||
| 2022 | 2021 | 2020 | 2019 | 2018 | ||||||||||||||||||
| Per Share Data |
| |||||||||||||||||||||
| Net asset value, beginning of year |
$ | 31.94 | $ | 26.09 | $ | 22.36 | $ | 25.63 | $ | 23.08 | ||||||||||||
| Net investment loss(a) |
(0.11 | ) | (0.18 | ) | (0.09 | ) | (0.06 | )(b) | (0.07 | )(c) | ||||||||||||
| Net realized and unrealized gain (loss) |
(8.38 | ) | 9.87 | 6.84 | 0.44 | 5.50 | ||||||||||||||||
| Total from investment operations |
(8.49 | ) | 9.69 | 6.75 | 0.38 | 5.43 | ||||||||||||||||
| Distributions to shareholders from net realized gains |
(3.74 | ) | (3.84 | ) | (3.02 | ) | (3.65 | ) | (2.88 | ) | ||||||||||||
| Distributions to shareholders from return of capital |
(0.03 | ) | — | — | — | — | ||||||||||||||||
| Total distributions |
(3.77 | ) | (3.84 | ) | (3.02 | ) | (3.65 | ) | (2.88 | ) | ||||||||||||
| Net asset value, end of year |
$ | 19.68 | $ | 31.94 | $ | 26.09 | $ | 22.36 | $ | 25.63 | ||||||||||||
| Total Return(d) | (29.42 | )% | 39.51 | % | 33.55 | % | 4.62 | % | 25.69 | % | ||||||||||||
| Net assets, end of year (in 000’s) |
$ | 824,359 | $ | 1,303,226 | $ | 921,412 | $ | 853,375 | $ | 1,067,540 | ||||||||||||
| Ratio of net expenses to average net assets |
0.90 | % | 0.89 | % | 0.94 | % | 0.93 | % | 0.92 | % | ||||||||||||
| Ratio of total expenses to average net assets |
0.90 | % | 0.89 | % | 0.95 | % | 0.93 | % | 0.96 | % | ||||||||||||
| Ratio of net investment loss to average net assets |
(0.47 | )% | (0.63 | )% | (0.39 | )% | (0.26 | )%(b) | (0.27 | )%(c) | ||||||||||||
| Portfolio turnover rate(e) |
65 | % | 60 | % | 76 | % | 76 | % | 59 | % | ||||||||||||
| (a) | Calculated based on the average shares outstanding methodology. |
| (b) | Reflects income recognized from special dividends which amounted to $0.02 per share and 0.08% of average net assets. |
| (c) | Reflects income recognized from special dividends which amounted to $0.03 per share and 0.11% of average net assets. |
| (d) | Assumes investment at the NAV at the beginning of the year, reinvestment of all dividends and distributions, a complete redemption of the investment at the NAV at the end of the year and no sales or redemption charges (if any). Total returns would be reduced if a sales or redemption charge was taken into account. Returns do not reflect the impact of taxes to shareholders relating to Fund distributions or the redemption of Fund shares. |
| (e) | The Fund’s portfolio turnover rate is calculated in accordance with regulatory requirements, without regard to transactions involving short term investments. If such transactions were included, the Fund’s portfolio turnover rate may be higher. |
| The accompanying notes are an integral part of these financial statements. | 121 |
GOLDMAN SACHS SMALL/MID CAP GROWTH FUND
Financial Highlights (continued)
Selected Data for a Share Outstanding Throughout Each Year
| Goldman Sachs Small/Mid Cap Growth Fund | ||||||||||||||||||||||
| Service Shares | ||||||||||||||||||||||
| Year Ended August 31, | ||||||||||||||||||||||
| 2022 | 2021 | 2020 | 2019 | 2018 | ||||||||||||||||||
| Per Share Data |
| |||||||||||||||||||||
| Net asset value, beginning of year |
$ | 26.92 | $ | 22.60 | $ | 19.84 | $ | 23.32 | $ | 21.33 | ||||||||||||
| Net investment loss(a) |
(0.27 | ) | (0.27 | ) | (0.18 | ) | (0.15 | )(b) | (0.17 | )(c) | ||||||||||||
| Net realized and unrealized gain (loss) |
(6.83 | ) | 8.43 | 5.96 | 0.32 | 5.04 | ||||||||||||||||
| Total from investment operations |
(7.10 | ) | 8.16 | 5.78 | 0.17 | 4.87 | ||||||||||||||||
| Distributions to shareholders from net realized gains |
(3.74 | ) | (3.84 | ) | (3.02 | ) | (3.65 | ) | (2.88 | ) | ||||||||||||
| Distributions to shareholders from return of capital |
(0.03 | ) | — | — | — | — | ||||||||||||||||
| Total distributions |
(3.77 | ) | (3.84 | ) | (3.02 | ) | (3.65 | ) | (2.88 | ) | ||||||||||||
| Net asset value, end of year |
$ | 16.05 | $ | 26.92 | $ | 22.60 | $ | 19.84 | $ | 23.32 | ||||||||||||
| Total Return(d) | (29.78 | )% | 38.78 | % | 32.87 | % | 4.13 | % | 25.12 | % | ||||||||||||
| Net assets, end of year (in 000’s) |
$ | 1,267 | $ | 22,781 | $ | 32,215 | $ | 18,395 | $ | 18,210 | ||||||||||||
| Ratio of net expenses to average net assets |
1.39 | % | 1.39 | % | 1.44 | % | 1.43 | % | 1.42 | % | ||||||||||||
| Ratio of total expenses to average net assets |
1.39 | % | 1.40 | % | 1.45 | % | 1.44 | % | 1.46 | % | ||||||||||||
| Ratio of net investment loss to average net assets |
(1.10 | )% | (1.12 | )% | (0.92 | )% | (0.75 | )%(b) | (0.77 | )%(c) | ||||||||||||
| Portfolio turnover rate(e) |
65 | % | 60 | % | 76 | % | 76 | % | 59 | % | ||||||||||||
| (a) | Calculated based on the average shares outstanding methodology. |
| (b) | Reflects income recognized from special dividends which amounted to $0.02 per share and 0.08% of average net assets. |
| (c) | Reflects income recognized from special dividends which amounted to $0.03 per share and 0.11% of average net assets. |
| (d) | Assumes investment at the NAV at the beginning of the year, reinvestment of all dividends and distributions, a complete redemption of the investment at the NAV at the end of the year and no sales or redemption charges (if any). Total returns would be reduced if a sales or redemption charge was taken into account. Returns do not reflect the impact of taxes to shareholders relating to Fund distributions or the redemption of Fund shares. |
| (e) | The Fund’s portfolio turnover rate is calculated in accordance with regulatory requirements, without regard to transactions involving short term investments. If such transactions were included, the Fund’s portfolio turnover rate may be higher. |
| 122 | The accompanying notes are an integral part of these financial statements. |
GOLDMAN SACHS SMALL/MID CAP GROWTH FUND
Financial Highlights (continued)
Selected Data for a Share Outstanding Throughout Each Year
| Goldman Sachs Small/Mid Cap Growth Fund | ||||||||||||||||||||||
| Investor Shares | ||||||||||||||||||||||
| Year Ended August 31, | ||||||||||||||||||||||
| 2022 | 2021 | 2020 | 2019 | 2018 | ||||||||||||||||||
| Per Share Data |
| |||||||||||||||||||||
| Net asset value, beginning of year |
$ | 30.33 | $ | 24.96 | $ | 21.53 | $ | 24.85 | $ | 22.48 | ||||||||||||
| Net investment loss(a) |
(0.13 | ) | (0.19 | ) | (0.10 | ) | (0.07 | )(b) | (0.09 | )(c) | ||||||||||||
| Net realized and unrealized gain (loss) |
(7.90 | ) | 9.40 | 6.55 | 0.40 | 5.34 | ||||||||||||||||
| Total from investment operations |
(8.03 | ) | 9.21 | 6.45 | 0.33 | 5.25 | ||||||||||||||||
| Distributions to shareholders from net realized gains |
(3.74 | ) | (3.84 | ) | (3.02 | ) | (3.65 | ) | (2.88 | ) | ||||||||||||
| Distributions to shareholders from return of capital |
(0.03 | ) | — | — | — | — | ||||||||||||||||
| Total distributions |
(3.77 | ) | (3.84 | ) | (3.02 | ) | (3.65 | ) | (2.88 | ) | ||||||||||||
| Net asset value, end of year |
$ | 18.53 | $ | 30.33 | $ | 24.96 | $ | 21.53 | $ | 24.85 | ||||||||||||
| Total Return(d) | (29.47 | )% | 39.37 | % | 33.44 | % | 4.57 | % | 25.57 | % | ||||||||||||
| Net assets, end of year (in 000’s) |
$ | 428,149 | $ | 815,104 | $ | 495,629 | $ | 409,019 | $ | 529,670 | ||||||||||||
| Ratio of net expenses to average net assets |
0.97 | % | 0.96 | % | 1.02 | % | 1.01 | % | 1.03 | % | ||||||||||||
| Ratio of total expenses to average net assets |
1.02 | % | 1.01 | % | 1.07 | % | 1.07 | % | 1.10 | % | ||||||||||||
| Ratio of net investment loss to average net assets |
(0.55 | )% | (0.69 | )% | (0.47 | )% | (0.34 | )%(b) | (0.38 | )%(c) | ||||||||||||
| Portfolio turnover rate(e) |
65 | % | 60 | % | 76 | % | 76 | % | 59 | % | ||||||||||||
| (a) | Calculated based on the average shares outstanding methodology. |
| (b) | Reflects income recognized from special dividends which amounted to $0.02 per share and 0.08% of average net assets. |
| (c) | Reflects income recognized from special dividends which amounted to $0.03 per share and 0.11% of average net assets. |
| (d) | Assumes investment at the NAV at the beginning of the year, reinvestment of all dividends and distributions, a complete redemption of the investment at the NAV at the end of the year and no sales or redemption charges (if any). Total returns would be reduced if a sales or redemption charge was taken into account. Returns do not reflect the impact of taxes to shareholders relating to Fund distributions or the redemption of Fund shares. |
| (e) | The Fund’s portfolio turnover rate is calculated in accordance with regulatory requirements, without regard to transactions involving short term investments. If such transactions were included, the Fund’s portfolio turnover rate may be higher. |
| The accompanying notes are an integral part of these financial statements. | 123 |
GOLDMAN SACHS SMALL/MID CAP GROWTH FUND
Financial Highlights (continued)
Selected Data for a Share Outstanding Throughout Each Year
| Goldman Sachs Small/Mid Cap Growth Fund | ||||||||||||||||||||||
| Class R6 Shares | ||||||||||||||||||||||
| Year Ended August 31, | ||||||||||||||||||||||
| 2022 | 2021 | 2020 | 2019 | 2018 | ||||||||||||||||||
| Per Share Data |
| |||||||||||||||||||||
| Net asset value, beginning of year |
$ | 31.98 | $ | 26.12 | $ | 22.38 | $ | 25.64 | $ | 23.09 | ||||||||||||
| Net investment loss(a) |
(0.10 | ) | (0.18 | ) | (0.08 | ) | (0.05 | )(b) | (0.06 | )(c) | ||||||||||||
| Net realized and unrealized gain (loss) |
(8.40 | ) | 9.88 | 6.84 | 0.44 | 5.49 | ||||||||||||||||
| Total from investment operations |
(8.50 | ) | 9.70 | 6.76 | 0.39 | 5.43 | ||||||||||||||||
| Distributions to shareholders from net realized gains |
(3.74 | ) | (3.84 | ) | (3.02 | ) | (3.65 | ) | (2.88 | ) | ||||||||||||
| Distributions to shareholders from return of capital |
(0.03 | ) | — | — | — | — | ||||||||||||||||
| Total distributions |
(3.77 | ) | (3.84 | ) | (3.02 | ) | (3.65 | ) | (2.88 | ) | ||||||||||||
| Total Return(d) | (29.41 | )% | 39.51 | % | 33.56 | % | 4.67 | % | 25.68 | % | ||||||||||||
| Net assets, end of year (in 000’s) |
$ | 156,599 | $ | 139,453 | $ | 73,863 | $ | 54,916 | $ | 39,263 | ||||||||||||
| Ratio of net expenses to average net assets |
0.89 | % | 0.88 | % | 0.93 | % | 0.92 | % | 0.91 | % | ||||||||||||
| Ratio of total expenses to average net assets |
0.89 | % | 0.88 | % | 0.94 | % | 0.93 | % | 0.95 | % | ||||||||||||
| Ratio of net investment loss to average net assets |
(0.43 | )% | (0.61 | )% | (0.38 | )% | (0.23 | )%(b) | (0.25 | )%(c) | ||||||||||||
| Portfolio turnover rate(e) |
65 | % | 60 | % | 76 | % | 76 | % | 59 | % | ||||||||||||
| (a) | Calculated based on the average shares outstanding methodology. |
| (b) | Reflects income recognized from special dividends which amounted to $0.02 per share and 0.08% of average net assets. |
| (c) | Reflects income recognized from special dividends which amounted to $0.03 per share and 0.11% of average net assets. |
| (d) | Assumes investment at the NAV at the beginning of the year, reinvestment of all dividends and distributions, a complete redemption of the investment at the NAV at the end of the year and no sales or redemption charges (if any). Total returns would be reduced if a sales or redemption charge was taken into account. Returns do not reflect the impact of taxes to shareholders relating to Fund distributions or the redemption of Fund shares. |
| (e) | The Fund’s portfolio turnover rate is calculated in accordance with regulatory requirements, without regard to transactions involving short term investments. If such transactions were included, the Fund’s portfolio turnover rate may be higher. |
| 124 | The accompanying notes are an integral part of these financial statements. |
GOLDMAN SACHS SMALL/MID CAP GROWTH FUND
Financial Highlights (continued)
Selected Data for a Share Outstanding Throughout Each Year
| Goldman Sachs Small/Mid Cap Growth Fund | ||||||||||||||||||||||
| Class R Shares | ||||||||||||||||||||||
| Year Ended August 31, | ||||||||||||||||||||||
| 2022 | 2021 | 2020 | 2019 | 2018 | ||||||||||||||||||
| Per Share Data |
| |||||||||||||||||||||
| Net asset value, beginning of year |
$ | 26.41 | $ | 22.24 | $ | 19.58 | $ | 23.08 | $ | 21.17 | ||||||||||||
| Net investment loss(a) |
(0.20 | ) | (0.29 | ) | (0.19 | ) | (0.16 | )(b) | (0.19 | )(c) | ||||||||||||
| Net realized and unrealized gain (loss) |
(6.76 | ) | 8.30 | 5.87 | 0.31 | 4.98 | ||||||||||||||||
| Total from investment operations |
(6.96 | ) | 8.01 | 5.68 | 0.15 | 4.79 | ||||||||||||||||
| Distributions to shareholders from net realized gains |
(3.74 | ) | (3.84 | ) | (3.02 | ) | (3.65 | ) | (2.88 | ) | ||||||||||||
| Distributions to shareholders from return of capital |
(0.03 | ) | — | — | — | — | ||||||||||||||||
| Total distributions |
(3.77 | ) | (3.84 | ) | (3.02 | ) | (3.65 | ) | (2.88 | ) | ||||||||||||
| Total Return(d) | (29.82 | )% | 38.72 | % | 32.78 | % | 4.07 | % | 24.92 | % | ||||||||||||
| Net assets, end of year (in 000’s) |
$ | 9,301 | $ | 14,818 | $ | 13,209 | $ | 15,856 | $ | 24,215 | ||||||||||||
| Ratio of net expenses to average net assets |
1.47 | % | 1.46 | % | 1.52 | % | 1.51 | % | 1.53 | % | ||||||||||||
| Ratio of total expenses to average net assets |
1.52 | % | 1.51 | % | 1.57 | % | 1.57 | % | 1.61 | % | ||||||||||||
| Ratio of net investment loss to average net assets |
(1.04 | )% | (1.20 | )% | (1.00 | )% | (0.85 | )%(b) | (0.90 | )%(c) | ||||||||||||
| Portfolio turnover rate(e) |
65 | % | 60 | % | 76 | % | 76 | % | 59 | % | ||||||||||||
| (a) | Calculated based on the average shares outstanding methodology. |
| (b) | Reflects income recognized from special dividends which amounted to $0.02 per share and 0.08% of average net assets. |
| (c) | Reflects income recognized from special dividends which amounted to $0.03 per share and 0.11% of average net assets. |
| (d) | Assumes investment at the NAV at the beginning of the year, reinvestment of all dividends and distributions, a complete redemption of the investment at the NAV at the end of the year and no sales or redemption charges (if any). Total returns would be reduced if a sales or redemption charge was taken into account. Returns do not reflect the impact of taxes to shareholders relating to Fund distributions or the redemption of Fund shares. |
| (e) | The Fund’s portfolio turnover rate is calculated in accordance with regulatory requirements, without regard to transactions involving short term investments. If such transactions were included, the Fund’s portfolio turnover rate may be higher. |
| The accompanying notes are an integral part of these financial statements. | 125 |
GOLDMAN SACHS SMALL/MID CAP GROWTH FUND
Financial Highlights (continued)
Selected Data for a Share Outstanding Throughout Each Period
| Goldman Sachs Small/Mid Cap Growth Fund | ||||||||||||||||||||||
| Class P Shares | ||||||||||||||||||||||
| Year Ended August 31, | Period Ended August 31, 2018(a) |
|||||||||||||||||||||
| 2022 | 2021 | 2020 | 2019 | |||||||||||||||||||
| Per Share Data |
| |||||||||||||||||||||
| Net asset value, beginning of period |
$ | 31.98 | $ | 26.12 | $ | 22.38 | $ | 25.64 | $ | 23.61 | ||||||||||||
| Net investment loss(b) |
(0.11 | ) | (0.18 | ) | (0.08 | ) | (0.05 | )(c) | (0.03 | )(d) | ||||||||||||
| Net realized and unrealized gain (loss) |
(8.39 | ) | 9.88 | 6.84 | 0.44 | 2.06 | ||||||||||||||||
| Total from investment operations |
(8.50 | ) | 9.70 | 6.76 | 0.39 | 2.03 | ||||||||||||||||
| Distributions to shareholders from net realized gains |
(3.74 | ) | (3.84 | ) | (3.02 | ) | (3.65 | ) | — | |||||||||||||
| Distributions to shareholders from return of capital |
(0.03 | ) | — | — | — | — | ||||||||||||||||
| Total distributions |
(3.77 | ) | (3.84 | ) | (3.02 | ) | (3.65 | ) | — | |||||||||||||
| Total Return(e) | (29.41 | )% | 39.51 | % | 33.56 | % | 4.67 | % | 8.60 | % | ||||||||||||
| Net assets, end of period (in 000’s) |
$ | 345,549 | $ | 601,794 | $ | 285,307 | $ | 188,657 | $ | 245,612 | ||||||||||||
| Ratio of net expenses to average net assets |
0.89 | % | 0.88 | % | 0.93 | % | 0.92 | % | 0.90 | %(f) | ||||||||||||
| Ratio of total expenses to average net assets |
0.89 | % | 0.88 | % | 0.94 | % | 0.92 | % | 0.91 | %(f) | ||||||||||||
| Ratio of net investment loss to average net assets |
(0.46 | )% | (0.61 | )% | (0.38 | )% | (0.25 | )%(c) | (0.36 | )%(d)(f) | ||||||||||||
| Portfolio turnover rate(g) |
65 | % | 60 | % | 76 | % | 76 | % | 59 | % | ||||||||||||
| (a) | Commenced operations on April 17, 2018. |
| (b) | Calculated based on the average shares outstanding methodology. |
| (c) | Reflects income recognized from special dividends which amounted to $0.02 per share and 0.08% of average net assets. |
| (d) | Reflects income recognized from special dividends which amounted to $0.03 per share and 0.11% of average net assets. |
| (e) | Assumes investment at the NAV at the beginning of the period, reinvestment of all dividends and distributions, a complete redemption of the investment at the NAV at the end of the period and no sales or redemption charges (if any). Total returns would be reduced if a sales or redemption charge was taken into account. Returns do not reflect the impact of taxes to shareholders relating to Fund distributions or the redemption of Fund shares. Total returns for periods less than one full year are not annualized. |
| (f) | Annualized. |
| (g) | The Fund’s portfolio turnover rate is calculated in accordance with regulatory requirements, without regard to transactions involving short term investments. If such transactions were included, the Fund’s portfolio turnover rate may be higher. |
| 126 | The accompanying notes are an integral part of these financial statements. |
GOLDMAN SACHS STRATEGIC GROWTH FUND
Financial Highlights (continued)
Selected Data for a Share Outstanding Throughout Each Year
| (a) | Calculated based on the average shares outstanding methodology. |
| (b) | Assumes investment at the NAV at the beginning of the year, reinvestment of all dividends and distributions, a complete redemption of the investment at the NAV at the end of the year and no sales or redemption charges (if any). Total returns would be reduced if a sales or redemption charge was taken into account. Returns do not reflect the impact of taxes to shareholders relating to Fund distributions or the redemption of Fund shares. |
| (c) | The Fund’s portfolio turnover rate is calculated in accordance with regulatory requirements, without regard to transactions involving short term investments. If such transactions were included, the Fund’s portfolio turnover rate may be higher. |
| The accompanying notes are an integral part of these financial statements. | 127 |
GOLDMAN SACHS STRATEGIC GROWTH FUND
Financial Highlights (continued)
Selected Data for a Share Outstanding Throughout Each Year
| Goldman Sachs Strategic Growth Fund | ||||||||||||||||||||||
| Class C Shares | ||||||||||||||||||||||
| Year Ended August 31, | ||||||||||||||||||||||
| 2022 | 2021 | 2020 | 2019 | 2018 | ||||||||||||||||||
| Per Share Data* | ||||||||||||||||||||||
| Net asset value, beginning of year |
$ | 18.96 | $ | 19.89 | $ | 18.27 | $ | 32.43 | $ | 34.38 | ||||||||||||
| Net investment loss(a) |
(0.21 | ) | (0.24 | ) | (0.21 | ) | (0.18 | ) | (0.27 | ) | ||||||||||||
| Net realized and unrealized gain (loss) |
(3.55 | ) | 4.62 | 6.51 | (1.17 | ) | 7.23 | |||||||||||||||
| Total from investment operations |
(3.76 | ) | 4.38 | 6.30 | (1.35 | ) | 6.96 | |||||||||||||||
| Distributions to shareholders from net realized gains |
(4.53 | ) | (5.31 | ) | (4.68 | ) | (12.81 | ) | (8.91 | ) | ||||||||||||
| Net asset value, end of year |
$ | 10.67 | $ | 18.96 | $ | 19.89 | $ | 18.27 | $ | 32.43 | ||||||||||||
| Total Return(b) | (25.97 | )% | 28.22 | % | 42.88 | % | 2.07 | % | 24.61 | % | ||||||||||||
| Net assets, end of year (in 000’s) |
$ | 2,153 | $ | 3,901 | $ | 4,522 | $ | 4,142 | $ | 9,081 | ||||||||||||
| Ratio of net expenses to average net assets |
1.86 | % | 1.87 | % | 1.89 | % | 1.89 | % | 1.89 | % | ||||||||||||
| Ratio of total expenses to average net assets |
2.04 | % | 2.05 | % | 2.11 | % | 2.14 | % | 2.13 | % | ||||||||||||
| Ratio of net investment loss to average net assets |
(1.37 | )% | (1.34 | )% | (1.25 | )% | (0.83 | )% | (0.85 | )% | ||||||||||||
| Portfolio turnover rate(c) |
24 | % | 31 | % | 39 | % | 28 | % | 40 | % | ||||||||||||
| * | On June 10, 2022, the Fund’s Class C Shares affected a 3-for-1 reverse share split. All per share data prior to June 10, 2022 has been adjusted to reflect the reverse share split. |
| (a) | Calculated based on the average shares outstanding methodology. |
| (b) | Assumes investment at the NAV at the beginning of the year, reinvestment of all dividends and distributions, a complete redemption of the investment at the NAV at the end of the year and no sales or redemption charges (if any). Total returns would be reduced if a sales or redemption charge was taken into account. Returns do not reflect the impact of taxes to shareholders relating to Fund distributions or the redemption of Fund shares. |
| (c) | The Fund’s portfolio turnover rate is calculated in accordance with regulatory requirements, without regard to transactions involving short term investments. If such transactions were included, the Fund’s portfolio turnover rate may be higher. |
| 128 | The accompanying notes are an integral part of these financial statements. |
GOLDMAN SACHS STRATEGIC GROWTH FUND
Financial Highlights (continued)
Selected Data for a Share Outstanding Throughout Each Year
| Goldman Sachs Strategic Growth Fund | ||||||||||||||||||||||
| Institutional Shares | ||||||||||||||||||||||
| Year Ended August 31, | ||||||||||||||||||||||
| 2022 | 2021 | 2020 | 2019 | 2018 | ||||||||||||||||||
| Per Share Data | ||||||||||||||||||||||
| Net asset value, beginning of year |
$ | 14.50 | $ | 12.88 | $ | 10.39 | $ | 14.92 | $ | 14.67 | ||||||||||||
| Net investment income (loss)(a) |
(0.03 | ) | (0.03 | ) | 0.01 | 0.03 | 0.04 | |||||||||||||||
| Net realized and unrealized gain (loss) |
(3.24 | ) | 3.42 | 4.07 | (0.26 | ) | 3.25 | |||||||||||||||
| Total from investment operations |
(3.27 | ) | 3.39 | 4.08 | (0.23 | ) | 3.29 | |||||||||||||||
| Distributions to shareholders from net investment income |
— | — | (b) | (0.03 | ) | (0.03 | ) | (0.07 | ) | |||||||||||||
| Distributions to shareholders from net realized gains |
(1.51 | ) | (1.77 | ) | (1.56 | ) | (4.27 | ) | (2.97 | ) | ||||||||||||
| Total distributions |
(1.51 | ) | (1.77 | ) | (1.59 | ) | (4.30 | ) | (3.04 | ) | ||||||||||||
| Net asset value, end of year |
$ | 9.72 | $ | 14.50 | $ | 12.88 | $ | 10.39 | $ | 14.92 | ||||||||||||
| Total Return(c) | (25.16 | )% | 29.65 | % | 44.36 | % | 3.31 | % | 26.11 | % | ||||||||||||
| Net assets, end of year (in 000’s) |
$ | 39,300 | $ | 62,894 | $ | 60,474 | $ | 52,461 | $ | 75,470 | ||||||||||||
| Ratio of net expenses to average net assets |
0.75 | % | 0.75 | % | 0.76 | % | 0.75 | % | 0.75 | % | ||||||||||||
| Ratio of total expenses to average net assets |
0.92 | % | 0.93 | % | 0.98 | % | 1.00 | % | 0.99 | % | ||||||||||||
| Ratio of net investment income (loss) to average net assets |
(0.25 | )% | (0.23 | )% | 0.10 | % | 0.32 | % | 0.31 | % | ||||||||||||
| Portfolio turnover rate(d) |
24 | % | 31 | % | 39 | % | 28 | % | 40 | % | ||||||||||||
| (a) | Calculated based on the average shares outstanding methodology. |
| (b) | Amount is less than $0.005 per share. |
| (c) | Assumes investment at the NAV at the beginning of the year, reinvestment of all dividends and distributions, a complete redemption of the investment at the NAV at the end of the year and no sales or redemption charges (if any). Total returns would be reduced if a sales or redemption charge was taken into account. Returns do not reflect the impact of taxes to shareholders relating to Fund distributions or the redemption of Fund shares. |
| (d) | The Fund’s portfolio turnover rate is calculated in accordance with regulatory requirements, without regard to transactions involving short term investments. If such transactions were included, the Fund’s portfolio turnover rate may be higher. |
| The accompanying notes are an integral part of these financial statements. | 129 |
GOLDMAN SACHS STRATEGIC GROWTH FUND
Financial Highlights (continued)
Selected Data for a Share Outstanding Throughout Each Year
| Goldman Sachs Strategic Growth Fund | ||||||||||||||||||||||
| Service Shares | ||||||||||||||||||||||
| Year Ended August 31, | ||||||||||||||||||||||
| 2022 | 2021 | 2020 | 2019 | 2018 | ||||||||||||||||||
| Per Share Data | ||||||||||||||||||||||
| Net asset value, beginning of year |
$ | 11.97 | $ | 10.97 | $ | 9.08 | $ | 13.67 | $ | 13.70 | ||||||||||||
| Net investment loss(a) |
(0.07 | ) | (0.08 | ) | (0.04 | ) | (0.01 | ) | (0.03 | ) | ||||||||||||
| Net realized and unrealized gain (loss) |
(2.61 | ) | 2.85 | 3.49 | (0.31 | ) | 3.00 | |||||||||||||||
| Total from investment operations |
(2.68 | ) | 2.77 | 3.45 | (0.32 | ) | 2.97 | |||||||||||||||
| Distributions to shareholders from net investment income |
— | — | — | — | (0.03 | ) | ||||||||||||||||
| Distributions to shareholders from net realized gains |
(1.51 | ) | (1.77 | ) | (1.56 | ) | (4.27 | ) | (2.97 | ) | ||||||||||||
| Total distributions |
(1.51 | ) | (1.77 | ) | (1.56 | ) | (4.27 | ) | (3.00 | ) | ||||||||||||
| Net asset value, end of year |
$ | 7.78 | $ | 11.97 | $ | 10.97 | $ | 9.08 | $ | 13.67 | ||||||||||||
| Total Return(b) | (25.59 | )% | 29.09 | % | 43.67 | % | 2.79 | % | 25.48 | % | ||||||||||||
| Net assets, end of year (in 000’s) |
$ | 536 | $ | 623 | $ | 505 | $ | 622 | $ | 597 | ||||||||||||
| Ratio of net expenses to average net assets |
1.25 | % | 1.25 | % | 1.26 | % | 1.25 | % | 1.25 | % | ||||||||||||
| Ratio of total expenses to average net assets |
1.42 | % | 1.43 | % | 1.53 | % | 1.53 | % | 1.48 | % | ||||||||||||
| Ratio of net investment loss to average net assets |
(0.75 | )% | (0.72 | )% | (0.47 | )% | (0.14 | )% | (0.21 | )% | ||||||||||||
| Portfolio turnover rate(c) |
24 | % | 31 | % | 39 | % | 28 | % | 40 | % | ||||||||||||
| (a) | Calculated based on the average shares outstanding methodology. |
| (b) | Assumes investment at the NAV at the beginning of the year, reinvestment of all dividends and distributions, a complete redemption of the investment at the NAV at the end of the year and no sales or redemption charges (if any). Total returns would be reduced if a sales or redemption charge was taken into account. Returns do not reflect the impact of taxes to shareholders relating to Fund distributions or the redemption of Fund shares. |
| (c) | The Fund’s portfolio turnover rate is calculated in accordance with regulatory requirements, without regard to transactions involving short term investments. If such transactions were included, the Fund’s portfolio turnover rate may be higher. |
| 130 | The accompanying notes are an integral part of these financial statements. |
GOLDMAN SACHS STRATEGIC GROWTH FUND
Financial Highlights (continued)
Selected Data for a Share Outstanding Throughout Each Year
| Goldman Sachs Strategic Growth Fund | ||||||||||||||||||||||
| Investor Shares | ||||||||||||||||||||||
| Year Ended August 31, | ||||||||||||||||||||||
| 2022 | 2021 | 2020 | 2019 | 2018 | ||||||||||||||||||
| Per Share Data | ||||||||||||||||||||||
| Net asset value, beginning of year |
$ | 14.41 | $ | 12.83 | $ | 10.34 | $ | 14.89 | $ | 14.66 | ||||||||||||
| Net investment income (loss)(a) |
(0.04 | ) | (0.04 | ) | (0.01 | ) | 0.02 | 0.02 | ||||||||||||||
| Net realized and unrealized gain (loss) |
(3.21 | ) | 3.39 | 4.07 | (0.27 | ) | 3.24 | |||||||||||||||
| Total from investment operations |
(3.25 | ) | 3.35 | 4.06 | (0.25 | ) | 3.26 | |||||||||||||||
| Distributions to shareholders from net investment income |
— | — | (0.01 | ) | (0.03 | ) | (0.06 | ) | ||||||||||||||
| Distributions to shareholders from net realized gains |
(1.51 | ) | (1.77 | ) | (1.56 | ) | (4.27 | ) | (2.97 | ) | ||||||||||||
| Total distributions |
(1.51 | ) | (1.77 | ) | (1.57 | ) | (4.30 | ) | (3.03 | ) | ||||||||||||
| Net asset value, end of year |
$ | 9.65 | $ | 14.41 | $ | 12.83 | $ | 10.34 | $ | 14.89 | ||||||||||||
| Total Return(b) | (25.18 | )% | 29.42 | % | 44.28 | % | 3.14 | % | 25.90 | % | ||||||||||||
| Net assets, end of year (in 000’s) |
$ | 3,304 | $ | 3,232 | $ | 2,758 | $ | 1,533 | $ | 2,578 | ||||||||||||
| Ratio of net expenses to average net assets |
0.86 | % | 0.87 | % | 0.89 | % | 0.89 | % | 0.89 | % | ||||||||||||
| Ratio of total expenses to average net assets |
1.04 | % | 1.05 | % | 1.06 | % | 1.14 | % | 1.12 | % | ||||||||||||
| Ratio of net investment income (loss) to average net assets |
(0.34 | )% | (0.35 | )% | (0.09 | )% | 0.16 | % | 0.15 | % | ||||||||||||
| Portfolio turnover rate(c) |
24 | % | 31 | % | 39 | % | 28 | % | 40 | % | ||||||||||||
| (a) | Calculated based on the average shares outstanding methodology. |
| (b) | Assumes investment at the NAV at the beginning of the year, reinvestment of all dividends and distributions, a complete redemption of the investment at the NAV at the end of the year and no sales or redemption charges (if any). Total returns would be reduced if a sales or redemption charge was taken into account. Returns do not reflect the impact of taxes to shareholders relating to Fund distributions or the redemption of Fund shares. |
| (c) | The Fund’s portfolio turnover rate is calculated in accordance with regulatory requirements, without regard to transactions involving short term investments. If such transactions were included, the Fund’s portfolio turnover rate may be higher. |
| The accompanying notes are an integral part of these financial statements. | 131 |
GOLDMAN SACHS STRATEGIC GROWTH FUND
Financial Highlights (continued)
Selected Data for a Share Outstanding Throughout Each Year
| Goldman Sachs Strategic Growth Fund | ||||||||||||||||||||||
| Class R6 Shares | ||||||||||||||||||||||
| Year Ended August 31, | ||||||||||||||||||||||
| 2022 | 2021 | 2020 | 2019 | 2018 | ||||||||||||||||||
| Per Share Data | ||||||||||||||||||||||
| Net asset value, beginning of year |
$ | 14.46 | $ | 12.86 | $ | 10.37 | $ | 14.91 | $ | 14.66 | ||||||||||||
| Net investment income (loss)(a) |
(0.02 | ) | (0.03 | ) | 0.01 | 0.04 | 0.04 | |||||||||||||||
| Net realized and unrealized gain (loss) |
(3.23 | ) | 3.40 | 4.07 | (0.27 | ) | 3.25 | |||||||||||||||
| Total from investment operations |
(3.25 | ) | 3.37 | 4.08 | (0.23 | ) | 3.29 | |||||||||||||||
| Distributions to shareholders from net investment income |
— | — | (b) | (0.03 | ) | (0.04 | ) | (0.07 | ) | |||||||||||||
| Distributions to shareholders from net realized gains |
(1.51 | ) | (1.77 | ) | (1.56 | ) | (4.27 | ) | (2.97 | ) | ||||||||||||
| Total distributions |
(1.51 | ) | (1.77 | ) | (1.59 | ) | (4.31 | ) | (3.04 | ) | ||||||||||||
| Net asset value, end of year |
$ | 9.70 | $ | 14.46 | $ | 12.86 | $ | 10.37 | $ | 14.91 | ||||||||||||
| Total Return(c) | (25.09 | )% | 29.57 | % | 44.49 | % | 3.33 | % | 26.15 | % | ||||||||||||
| Net assets, end of year (in 000’s) |
$ | 3,846 | $ | 789 | $ | 509 | $ | 477 | $ | 15 | ||||||||||||
| Ratio of net expenses to average net assets |
0.74 | % | 0.74 | % | 0.75 | % | 0.74 | % | 0.74 | % | ||||||||||||
| Ratio of total expenses to average net assets |
0.92 | % | 0.92 | % | 0.99 | % | 1.03 | % | 0.97 | % | ||||||||||||
| Ratio of net investment income (loss) to average net assets |
(0.18 | )% | (0.22 | )% | 0.10 | % | 0.40 | % | 0.30 | % | ||||||||||||
| Portfolio turnover rate(d) |
24 | % | 31 | % | 39 | % | 28 | % | 40 | % | ||||||||||||
| (a) | Calculated based on the average shares outstanding methodology. |
| (b) | Amount is less than $0.005 per share. |
| (c) | Assumes investment at the NAV at the beginning of the year, reinvestment of all dividends and distributions, a complete redemption of the investment at the NAV at the end of the year and no sales or redemption charges (if any). Total returns would be reduced if a sales or redemption charge was taken into account. Returns do not reflect the impact of taxes to shareholders relating to Fund distributions or the redemption of Fund shares. |
| (d) | The Fund’s portfolio turnover rate is calculated in accordance with regulatory requirements, without regard to transactions involving short term investments. If such transactions were included, the Fund’s portfolio turnover rate may be higher. |
| 132 | The accompanying notes are an integral part of these financial statements. |
GOLDMAN SACHS STRATEGIC GROWTH FUND
Financial Highlights (continued)
Selected Data for a Share Outstanding Throughout Each Year
| Goldman Sachs Strategic Growth Fund | ||||||||||||||||||||||
| Class R Shares | ||||||||||||||||||||||
| Year Ended August 31, | ||||||||||||||||||||||
| 2022 | 2021 | 2020 | 2019 | 2018 | ||||||||||||||||||
| Per Share Data | ||||||||||||||||||||||
| Net asset value, beginning of year |
$ | 11.55 | $ | 10.67 | $ | 8.88 | $ | 13.49 | $ | 13.56 | ||||||||||||
| Net investment loss(a) |
(0.08 | ) | (0.09 | ) | (0.06 | ) | (0.03 | ) | (0.04 | ) | ||||||||||||
| Net realized and unrealized gain (loss) |
(2.49 | ) | 2.74 | 3.41 | (0.31 | ) | 2.96 | |||||||||||||||
| Total from investment operations |
(2.57 | ) | 2.65 | 3.35 | (0.34 | ) | 2.92 | |||||||||||||||
| Distributions to shareholders from net investment income |
— | — | — | — | (0.02 | ) | ||||||||||||||||
| Distributions to shareholders from net realized gains |
(1.51 | ) | (1.77 | ) | (1.56 | ) | (4.27 | ) | (2.97 | ) | ||||||||||||
| Total distributions |
(1.51 | ) | (1.77 | ) | (1.56 | ) | (4.27 | ) | (2.99 | ) | ||||||||||||
| Net asset value, end of year |
$ | 7.47 | $ | 11.55 | $ | 10.67 | $ | 8.88 | $ | 13.49 | ||||||||||||
| Total Return(b) | (25.57 | )% | 28.74 | % | 43.52 | % | 2.67 | % | 25.29 | % | ||||||||||||
| Net assets, end of year (in 000’s) |
$ | 170 | $ | 213 | $ | 66 | $ | 292 | $ | 255 | ||||||||||||
| Ratio of net expenses to average net assets |
1.36 | % | 1.37 | % | 1.40 | % | 1.39 | % | 1.39 | % | ||||||||||||
| Ratio of total expenses to average net assets |
1.54 | % | 1.55 | % | 1.75 | % | 1.65 | % | 1.62 | % | ||||||||||||
| Ratio of net investment loss to average net assets |
(0.85 | )% | (0.85 | )% | (0.66 | )% | (0.31 | )% | (0.34 | )% | ||||||||||||
| Portfolio turnover rate(c) |
24 | % | 31 | % | 39 | % | 28 | % | 40 | % | ||||||||||||
| (a) | Calculated based on the average shares outstanding methodology. |
| (b) | Assumes investment at the NAV at the beginning of the year, reinvestment of all dividends and distributions, a complete redemption of the investment at the NAV at the end of the year and no sales or redemption charges (if any). Total returns would be reduced if a sales or redemption charge was taken into account. Returns do not reflect the impact of taxes to shareholders relating to Fund distributions or the redemption of Fund shares. |
| (c) | The Fund’s portfolio turnover rate is calculated in accordance with regulatory requirements, without regard to transactions involving short term investments. If such transactions were included, the Fund’s portfolio turnover rate may be higher. |
| The accompanying notes are an integral part of these financial statements. | 133 |
GOLDMAN SACHS STRATEGIC GROWTH FUND
Financial Highlights (continued)
Selected Data for a Share Outstanding Throughout Each Period
| Goldman Sachs Strategic Growth Fund | ||||||||||||||||||||||
| Class P Shares | ||||||||||||||||||||||
| Year Ended August 31, | Period Ended August 31, 2018(a) |
|||||||||||||||||||||
| 2022 | 2021 | 2020 | 2019 | |||||||||||||||||||
| Per Share Data | ||||||||||||||||||||||
| Net asset value, beginning of period |
$ | 14.44 | $ | 12.84 | $ | 10.35 | $ | 14.90 | $ | 13.53 | ||||||||||||
| Net investment income (loss)(b) |
(0.03 | ) | (0.03 | ) | 0.01 | 0.04 | 0.01 | |||||||||||||||
| Net realized and unrealized gain (loss) |
(3.22 | ) | 3.40 | 4.07 | (0.28 | ) | 1.36 | |||||||||||||||
| Total from investment operations |
(3.25 | ) | 3.37 | 4.08 | (0.24 | ) | 1.37 | |||||||||||||||
| Distributions to shareholders from net investment income |
— | — | (c) | (0.03 | ) | (0.04 | ) | — | ||||||||||||||
| Distributions to shareholders from net realized gains |
(1.51 | ) | (1.77 | ) | (1.56 | ) | (4.27 | ) | — | |||||||||||||
| Total distributions |
(1.51 | ) | (1.77 | ) | (1.59 | ) | (4.31 | ) | — | |||||||||||||
| Net asset value, end of period |
$ | 9.68 | $ | 14.44 | $ | 12.84 | $ | 10.35 | $ | 14.90 | ||||||||||||
| Total Return(d) | (25.12 | )% | 29.61 | % | 44.56 | % | 3.26 | % | 10.13 | % | ||||||||||||
| Net assets, end of period (in 000’s) |
$ | 60,603 | $ | 90,823 | $ | 78,539 | $ | 73,132 | $ | 104,590 | ||||||||||||
| Ratio of net expenses to average net assets |
0.74 | % | 0.74 | % | 0.75 | % | 0.74 | % | 0.74 | %(e) | ||||||||||||
| Ratio of total expenses to average net assets |
0.91 | % | 0.92 | % | 0.98 | % | 0.99 | % | 0.96 | %(e) | ||||||||||||
| Ratio of net investment income (loss) to average net assets |
(0.24 | )% | (0.22 | )% | 0.12 | % | 0.32 | % | 0.22 | %(e) | ||||||||||||
| Portfolio turnover rate(f) |
24 | % | 31 | % | 39 | % | 28 | % | 40 | % | ||||||||||||
| (a) | Commenced operations on April 17, 2018. |
| (b) | Calculated based on the average shares outstanding methodology. |
| (c) | Amount is less than $0.005 per share. |
| (d) | Assumes investment at the NAV at the beginning of the period, reinvestment of all dividends and distributions, a complete redemption of the investment at the NAV at the end of the period and no sales or redemption charges (if any). Total returns would be reduced if a sales or redemption charge was taken into account. Returns do not reflect the impact of taxes to shareholders relating to Fund distributions or the redemption of Fund shares. Total returns for periods less than one full year are not annualized. |
| (e) | Annualized. |
| (f) | The Fund’s portfolio turnover rate is calculated in accordance with regulatory requirements, without regard to transactions involving short term investments. If such transactions were included, the Fund’s portfolio turnover rate may be higher. |
| 134 | The accompanying notes are an integral part of these financial statements. |
GOLDMAN SACHS TECHNOLOGY OPPORTUNITIES FUND
Financial Highlights (continued)
Selected Data for a Share Outstanding Throughout Each Year
| (a) | Calculated based on the average shares outstanding methodology. |
| (b) | Assumes investment at the NAV at the beginning of the year, reinvestment of all dividends and distributions, a complete redemption of the investment at the NAV at the end of the year and no sales or redemption charges (if any). Total returns would be reduced if a sales or redemption charge was taken into account. Returns do not reflect the impact of taxes to shareholders relating to Fund distributions or the redemption of Fund shares. |
| (c) | The Fund’s portfolio turnover rate is calculated in accordance with regulatory requirements, without regard to transactions involving short term investments. If such transactions were included, the Fund’s portfolio turnover rate may be higher. |
| The accompanying notes are an integral part of these financial statements. | 135 |
GOLDMAN SACHS TECHNOLOGY OPPORTUNITIES FUND
Financial Highlights (continued)
Selected Data for a Share Outstanding Throughout Each Year
| Goldman Sachs Technology Opportunities Fund | ||||||||||||||||||||||
| Class C Shares | ||||||||||||||||||||||
| Year Ended August 31, | ||||||||||||||||||||||
| 2022 | 2021 | 2020 | 2019 | 2018 | ||||||||||||||||||
| Per Share Data |
| |||||||||||||||||||||
| Net asset value, beginning of year |
$ | 24.46 | $ | 21.68 | $ | 17.94 | $ | 23.05 | $ | 19.45 | ||||||||||||
| Net investment loss(a) |
(0.25 | ) | (0.31 | ) | (0.23 | ) | (0.24 | ) | (0.29 | ) | ||||||||||||
| Net realized and unrealized gain (loss) |
(5.65 | ) | 5.74 | 7.68 | 0.19 | 5.65 | ||||||||||||||||
| Total from investment operations |
(5.90 | ) | 5.43 | 7.45 | (0.05 | ) | 5.36 | |||||||||||||||
| Distributions to shareholders from net realized gains |
(5.30 | ) | (2.65 | ) | (3.71 | ) | (5.06 | ) | (1.76 | ) | ||||||||||||
| Net asset value, end of year |
$ | 13.26 | $ | 24.46 | $ | 21.68 | $ | 17.94 | $ | 23.05 | ||||||||||||
| Total Return(b) | (30.13 | )% | 28.13 | % | 49.93 | % | 3.97 | % | 29.49 | % | ||||||||||||
| Net assets, end of year (in 000’s) |
$ | 16,950 | $ | 27,866 | $ | 30,011 | $ | 24,948 | $ | 57,207 | ||||||||||||
| Ratio of net expenses to average net assets |
2.00 | % | 2.01 | % | 2.03 | % | 2.10 | % | 2.13 | % | ||||||||||||
| Ratio of total expenses to average net assets |
2.16 | % | 2.16 | % | 2.21 | % | 2.23 | % | 2.23 | % | ||||||||||||
| Ratio of net investment loss to average net assets |
(1.43 | )% | (1.47 | )% | (1.31 | )% | (1.31 | )% | (1.40 | )% | ||||||||||||
| Portfolio turnover rate(c) |
51 | % | 41 | % | 41 | % | 27 | % | 46 | % | ||||||||||||
| (a) | Calculated based on the average shares outstanding methodology. |
| (b) | Assumes investment at the NAV at the beginning of the year, reinvestment of all dividends and distributions, a complete redemption of the investment at the NAV at the end of the year and no sales or redemption charges (if any). Total returns would be reduced if a sales or redemption charge was taken into account. Returns do not reflect the impact of taxes to shareholders relating to Fund distributions or the redemption of Fund shares. |
| (c) | The Fund’s portfolio turnover rate is calculated in accordance with regulatory requirements, without regard to transactions involving short term investments. If such transactions were included, the Fund’s portfolio turnover rate may be higher. |
| 136 | The accompanying notes are an integral part of these financial statements. |
GOLDMAN SACHS TECHNOLOGY OPPORTUNITIES FUND
Financial Highlights (continued)
Selected Data for a Share Outstanding Throughout Each Year
| Goldman Sachs Technology Opportunities Fund | ||||||||||||||||||||||
| Institutional Shares | ||||||||||||||||||||||
| Year Ended August 31, | ||||||||||||||||||||||
| 2022 | 2021 | 2020 | 2019 | 2018 | ||||||||||||||||||
| Per Share Data | ||||||||||||||||||||||
| Net asset value, beginning of year |
$ | 41.40 | $ | 34.57 | $ | 26.28 | $ | 30.78 | $ | 25.15 | ||||||||||||
| Net investment loss(a) |
(0.13 | ) | (0.16 | ) | (0.07 | ) | (0.04 | ) | (0.07 | ) | ||||||||||||
| Net realized and unrealized gain (loss) |
(10.59 | ) | 9.64 | 12.07 | 0.60 | 7.46 | ||||||||||||||||
| Total from investment operations |
(10.72 | ) | 9.48 | 12.00 | 0.56 | 7.39 | ||||||||||||||||
| Distributions to shareholders from net realized gains |
(5.30 | ) | (2.65 | ) | (3.71 | ) | (5.06 | ) | (1.76 | ) | ||||||||||||
| Net asset value, end of year |
$ | 25.38 | $ | 41.40 | $ | 34.57 | $ | 26.28 | $ | 30.78 | ||||||||||||
| Total Return(b) | (29.38 | )% | 29.42 | % | 51.49 | % | 5.12 | % | 30.95 | % | ||||||||||||
| Net assets, end of year (in 000’s) |
$ | 97,095 | $ | 190,705 | $ | 157,267 | $ | 74,728 | $ | 87,522 | ||||||||||||
| Ratio of net expenses to average net assets |
0.97 | % | 0.98 | % | 0.99 | % | 0.98 | % | 0.99 | % | ||||||||||||
| Ratio of total expenses to average net assets |
1.04 | % | 1.04 | % | 1.08 | % | 1.09 | % | 1.09 | % | ||||||||||||
| Ratio of net investment loss to average net assets |
(0.40 | )% | (0.44 | )% | (0.27 | )% | (0.17 | )% | (0.26 | )% | ||||||||||||
| Portfolio turnover rate(c) |
51 | % | 41 | % | 41 | % | 27 | % | 46 | % | ||||||||||||
| (a) | Calculated based on the average shares outstanding methodology. |
| (b) | Assumes investment at the NAV at the beginning of the year, reinvestment of all dividends and distributions, a complete redemption of the investment at the NAV at the end of the year and no sales or redemption charges (if any). Total returns would be reduced if a sales or redemption charge was taken into account. Returns do not reflect the impact of taxes to shareholders relating to Fund distributions or the redemption of Fund shares. |
| (c) | The Fund’s portfolio turnover rate is calculated in accordance with regulatory requirements, without regard to transactions involving short term investments. If such transactions were included, the Fund’s portfolio turnover rate may be higher. |
| The accompanying notes are an integral part of these financial statements. | 137 |
GOLDMAN SACHS TECHNOLOGY OPPORTUNITIES FUND
Financial Highlights (continued)
Selected Data for a Share Outstanding Throughout Each Year
| Goldman Sachs Technology Opportunities Fund | ||||||||||||||||||||||
| Service Shares | ||||||||||||||||||||||
| Year Ended August 31, | ||||||||||||||||||||||
| 2022 | 2021 | 2020 | 2019 | 2018 | ||||||||||||||||||
| Per Share Data | ||||||||||||||||||||||
| Net asset value, beginning of year |
$ | 33.72 | $ | 28.77 | $ | 22.56 | $ | 27.35 | $ | 22.64 | ||||||||||||
| Net investment loss(a) |
(0.25 | ) | (0.27 | ) | (0.17 | ) | (0.15 | ) | (0.18 | ) | ||||||||||||
| Net realized and unrealized gain (loss) |
(8.33 | ) | 7.87 | 10.09 | 0.42 | 6.65 | ||||||||||||||||
| Total from investment operations |
(8.58 | ) | 7.60 | 9.92 | 0.27 | 6.47 | ||||||||||||||||
| Distributions to shareholders from net realized gains |
(5.30 | ) | (2.65 | ) | (3.71 | ) | (5.06 | ) | (1.76 | ) | ||||||||||||
| Net asset value, end of year |
$ | 19.84 | $ | 33.72 | $ | 28.77 | $ | 22.56 | $ | 27.35 | ||||||||||||
| Total Return(b) | (29.76 | )% | 28.78 | % | 50.71 | % | 4.62 | % | 30.28 | % | ||||||||||||
| Net assets, end of year (in 000’s) |
$ | 8,259 | $ | 38,670 | $ | 41,024 | $ | 29,084 | $ | 33,109 | ||||||||||||
| Ratio of net expenses to average net assets |
1.47 | % | 1.48 | % | 1.49 | % | 1.48 | % | 1.49 | % | ||||||||||||
| Ratio of total expenses to average net assets |
1.54 | % | 1.54 | % | 1.58 | % | 1.59 | % | 1.59 | % | ||||||||||||
| Ratio of net investment loss to average net assets |
(0.93 | )% | (0.94 | )% | (0.77 | )% | (0.67 | )% | (0.75 | )% | ||||||||||||
| Portfolio turnover rate(c) |
51 | % | 41 | % | 41 | % | 27 | % | 46 | % | ||||||||||||
| (a) | Calculated based on the average shares outstanding methodology. |
| (b) | Assumes investment at the NAV at the beginning of the year, reinvestment of all dividends and distributions, a complete redemption of the investment at the NAV at the end of the year and no sales or redemption charges (if any). Total returns would be reduced if a sales or redemption charge was taken into account. Returns do not reflect the impact of taxes to shareholders relating to Fund distributions or the redemption of Fund shares. |
| (c) | The Fund’s portfolio turnover rate is calculated in accordance with regulatory requirements, without regard to transactions involving short term investments. If such transactions were included, the Fund’s portfolio turnover rate may be higher. |
| 138 | The accompanying notes are an integral part of these financial statements. |
GOLDMAN SACHS TECHNOLOGY OPPORTUNITIES FUND
Financial Highlights (continued)
Selected Data for a Share Outstanding Throughout Each Year
| Goldman Sachs Technology Opportunities Fund | ||||||||||||||||||||||
| Investor Shares | ||||||||||||||||||||||
| Year Ended August 31, | ||||||||||||||||||||||
| 2022 | 2021 | 2020 | 2019 | 2018 | ||||||||||||||||||
| Per Share Data | ||||||||||||||||||||||
| Net asset value, beginning of year |
$ | 40.39 | $ | 33.79 | $ | 25.78 | $ | 30.33 | $ | 24.84 | ||||||||||||
| Net investment loss(a) |
(0.13 | ) | (0.16 | ) | (0.08 | ) | (0.07 | ) | (0.11 | ) | ||||||||||||
| Net realized and unrealized gain (loss) |
(10.31 | ) | 9.41 | 11.80 | 0.58 | 7.36 | ||||||||||||||||
| Total from investment operations |
(10.44 | ) | 9.25 | 11.72 | 0.51 | 7.25 | ||||||||||||||||
| Distributions to shareholders from net realized gains |
(5.30 | ) | (2.65 | ) | (3.71 | ) | (5.06 | ) | (1.76 | ) | ||||||||||||
| Net asset value, end of year |
$ | 24.65 | $ | 40.39 | $ | 33.79 | $ | 25.78 | $ | 30.33 | ||||||||||||
| Total Return(b) | (29.42 | )% | 29.42 | % | 51.40 | % | 5.01 | % | 30.76 | % | ||||||||||||
| Net assets, end of year (in 000’s) |
$ | 26,044 | $ | 41,403 | $ | 48,387 | $ | 19,207 | $ | 22,520 | ||||||||||||
| Ratio of net expenses to average net assets |
1.00 | % | 1.01 | % | 1.02 | % | 1.09 | % | 1.13 | % | ||||||||||||
| Ratio of total expenses to average net assets |
1.16 | % | 1.16 | % | 1.21 | % | 1.23 | % | 1.23 | % | ||||||||||||
| Ratio of net investment loss to average net assets |
(0.42 | )% | (0.47 | )% | (0.31 | )% | (0.29 | )% | (0.40 | )% | ||||||||||||
| Portfolio turnover rate(c) |
51 | % | 41 | % | 41 | % | 27 | % | 46 | % | ||||||||||||
| (a) | Calculated based on the average shares outstanding methodology. |
| (b) | Assumes investment at the NAV at the beginning of the year, reinvestment of all dividends and distributions, a complete redemption of the investment at the NAV at the end of the year and no sales or redemption charges (if any). Total returns would be reduced if a sales or redemption charge was taken into account. Returns do not reflect the impact of taxes to shareholders relating to Fund distributions or the redemption of Fund shares. |
| (c) | The Fund’s portfolio turnover rate is calculated in accordance with regulatory requirements, without regard to transactions involving short term investments. If such transactions were included, the Fund’s portfolio turnover rate may be higher. |
| The accompanying notes are an integral part of these financial statements. | 139 |
GOLDMAN SACHS TECHNOLOGY OPPORTUNITIES FUND
Financial Highlights (continued)
Selected Data for a Share Outstanding Throughout Each Period
| Goldman Sachs Technology Opportunities Fund | ||||||||||||||||||||||
| Class R6 Shares | ||||||||||||||||||||||
| Year Ended August 31, | Period Ended August 31, 2018(a) |
|||||||||||||||||||||
| 2022 | 2021 | 2020 | 2019 | |||||||||||||||||||
| Per Share Data | ||||||||||||||||||||||
| Net asset value, beginning of period |
$ | 41.43 | $ | 34.59 | $ | 26.29 | $ | 30.78 | $ | 25.08 | ||||||||||||
| Net investment loss(b) |
(0.06 | ) | (0.15 | ) | (0.08 | ) | (0.02 | ) | (0.04 | ) | ||||||||||||
| Net realized and unrealized gain (loss) |
(10.67 | ) | 9.64 | 12.09 | 0.59 | 5.74 | ||||||||||||||||
| Total from investment operations |
(10.73 | ) | 9.49 | 12.01 | 0.57 | 5.70 | ||||||||||||||||
| Distributions to shareholders from net realized gains |
(5.30 | ) | (2.65 | ) | (3.71 | ) | (5.06 | ) | — | |||||||||||||
| Net asset value, end of period |
$ | 25.40 | $ | 41.43 | $ | 34.59 | $ | 26.29 | $ | 30.78 | ||||||||||||
| Total Return(c) | (29.38 | )% | 29.44 | % | 51.51 | % | 5.15 | % | 22.73 | % | ||||||||||||
| Net assets, end of period (in 000’s) |
$ | 50,264 | $ | 3,134 | $ | 1,330 | $ | 138 | $ | 12 | ||||||||||||
| Ratio of net expenses to average net assets |
0.94 | % | 0.97 | % | 0.97 | % | 0.97 | % | 0.98 | %(d) | ||||||||||||
| Ratio of total expenses to average net assets |
1.04 | % | 1.03 | % | 1.06 | % | 1.09 | % | 1.08 | %(d) | ||||||||||||
| Ratio of net investment loss to average net assets |
(0.23 | )% | (0.43 | )% | (0.28 | )% | (0.07 | )% | (0.20 | )%(d) | ||||||||||||
| Portfolio turnover rate(e) |
51 | % | 41 | % | 41 | % | 27 | % | 46 | % | ||||||||||||
| (a) | Commenced operations on December 29, 2017. |
| (b) | Calculated based on the average shares outstanding methodology. |
| (c) | Assumes investment at the NAV at the beginning of the period, reinvestment of all dividends and distributions, a complete redemption of the investment at the NAV at the end of the period and no sales or redemption charges (if any). Total returns would be reduced if a sales or redemption charge was taken into account. Returns do not reflect the impact of taxes to shareholders relating to Fund distributions or the redemption of Fund shares. Total returns for periods less than one full year are not annualized. |
| (d) | Annualized. |
| (e) | The Fund’s portfolio turnover rate is calculated in accordance with regulatory requirements, without regard to transactions involving short term investments. If such transactions were included, the Fund’s portfolio turnover rate may be higher. |
| 140 | The accompanying notes are an integral part of these financial statements. |
GOLDMAN SACHS TECHNOLOGY OPPORTUNITIES FUND
Financial Highlights (continued)
Selected Data for a Share Outstanding Throughout Each Period
| Goldman Sachs Technology Opportunities Fund | ||||||||||||||||||||||
| Class P Shares | ||||||||||||||||||||||
| Year Ended August 31, | Period Ended August 31, 2018(a) |
|||||||||||||||||||||
| 2022 | 2021 | 2020 | 2019 | |||||||||||||||||||
| Per Share Data |
| |||||||||||||||||||||
| Net asset value, beginning of period |
$ | 41.43 | $ | 34.59 | $ | 26.29 | $ | 30.79 | $ | 27.83 | ||||||||||||
| Net investment income (loss)(b) |
(0.12 | ) | (0.15 | ) | (0.07 | ) | (0.04 | ) | 0.01 | |||||||||||||
| Net realized and unrealized gain (loss) |
(10.61 | ) | 9.64 | 12.08 | 0.60 | 2.95 | ||||||||||||||||
| Total from investment operations |
(10.73 | ) | 9.49 | 12.01 | 0.56 | 2.96 | ||||||||||||||||
| Distributions to shareholders from net realized gains |
(5.30 | ) | (2.65 | ) | (3.71 | ) | (5.06 | ) | — | |||||||||||||
| Net asset value, end of period |
$ | 25.40 | $ | 41.43 | $ | 34.59 | $ | 26.29 | $ | 30.79 | ||||||||||||
| Total Return(c) | (29.38 | )% | 29.44 | % | 51.51 | % | 5.11 | % | 10.64 | % | ||||||||||||
| Net assets, end of period (in 000’s) |
$ | 95,207 | $ | 145,094 | $ | 63,555 | $ | 24,396 | $ | 24,951 | ||||||||||||
| Ratio of net expenses to average net assets |
0.95 | % | 0.97 | % | 0.98 | % | 0.97 | % | 0.97 | %(d) | ||||||||||||
| Ratio of total expenses to average net assets |
1.03 | % | 1.03 | % | 1.07 | % | 1.08 | % | 1.14 | %(d) | ||||||||||||
| Ratio of net investment income (loss) to average net assets |
(0.38 | )% | (0.43 | )% | (0.25 | )% | (0.16 | )% | 0.08 | %(d) | ||||||||||||
| Portfolio turnover rate(e) |
51 | % | 41 | % | 41 | % | 27 | % | 46 | % | ||||||||||||
| (a) | Commenced operations on April 17, 2018. |
| (b) | Calculated based on the average shares outstanding methodology. |
| (c) | Assumes investment at the NAV at the beginning of the period, reinvestment of all dividends and distributions, a complete redemption of the investment at the NAV at the end of the period and no sales or redemption charges (if any). Total returns would be reduced if a sales or redemption charge was taken into account. Returns do not reflect the impact of taxes to shareholders relating to Fund distributions or the redemption of Fund shares. Total returns for periods less than one full year are not annualized. |
| (d) | Annualized. |
| (e) | The Fund’s portfolio turnover rate is calculated in accordance with regulatory requirements, without regard to transactions involving short term investments. If such transactions were included, the Fund’s portfolio turnover rate may be higher. |
| The accompanying notes are an integral part of these financial statements. | 141 |
GOLDMAN SACHS U.S. EQUITY ESG FUND
Financial Highlights (continued)
Selected Data for a Share Outstanding Throughout Each Year
| (a) | Calculated based on the average shares outstanding methodology. |
| (b) | Assumes investment at the NAV at the beginning of the year, reinvestment of all dividends and distributions, a complete redemption of the investment at the NAV at the end of the year and no sales or redemption charges (if any). Total returns would be reduced if a sales or redemption charge was taken into account. Returns do not reflect the impact of taxes to shareholders relating to Fund distributions or the redemption of Fund shares. |
| (c) | The Fund’s portfolio turnover rate is calculated in accordance with regulatory requirements, without regard to transactions involving short term investments. If such transactions were included, the Fund’s portfolio turnover rate may be higher. |
| 142 | The accompanying notes are an integral part of these financial statements. |
GOLDMAN SACHS U.S. EQUITY ESG FUND
Financial Highlights (continued)
Selected Data for a Share Outstanding Throughout Each Year
| Goldman Sachs U.S. Equity ESG Fund | ||||||||||||||||||||||
| Class C Shares | ||||||||||||||||||||||
| Year Ended August 31, | ||||||||||||||||||||||
| 2022 | 2021 | 2020 | 2019 | 2018 | ||||||||||||||||||
| Per Share Data | ||||||||||||||||||||||
| Net asset value, beginning of year |
$ | 17.71 | $ | 14.79 | $ | 12.91 | $ | 13.40 | $ | 14.36 | ||||||||||||
| Net investment income (loss)(a) |
(0.08 | ) | (0.08 | ) | (0.01 | ) | 0.02 | 0.01 | ||||||||||||||
| Net realized and unrealized gain (loss) |
(3.22 | ) | 4.62 | 2.41 | 0.62 | 2.07 | ||||||||||||||||
| Total from investment operations |
(3.30 | ) | 4.54 | 2.40 | 0.64 | 2.08 | ||||||||||||||||
| Distributions to shareholders from net investment income |
— | — | (0.06 | ) | (0.04 | ) | (0.03 | ) | ||||||||||||||
| Distributions to shareholders from net realized gains |
(0.35 | ) | (1.62 | ) | (0.46 | ) | (1.09 | ) | (3.01 | ) | ||||||||||||
| Total distributions |
(0.35 | ) | (1.62 | ) | (0.52 | ) | (1.13 | ) | (3.04 | ) | ||||||||||||
| Net asset value, end of year |
$ | 14.06 | $ | 17.71 | $ | 14.79 | $ | 12.91 | $ | 13.40 | ||||||||||||
| Total Return(b) | (19.04 | )% | 33.65 | % | 18.97 | % | 6.04 | % | 16.66 | % | ||||||||||||
| Net assets, end of year (in 000’s) |
$ | 1,402 | $ | 2,430 | $ | 1,985 | $ | 1,487 | $ | 172 | ||||||||||||
| Ratio of net expenses to average net assets |
1.78 | % | 1.76 | % | 1.80 | % | 1.78 | % | 1.80 | % | ||||||||||||
| Ratio of total expenses to average net assets |
2.94 | % | 4.46 | % | 4.07 | % | 4.97 | % | 5.86 | % | ||||||||||||
| Ratio of net investment income (loss) to average net assets |
(0.47 | )% | (0.49 | )% | (0.11 | )% | 0.18 | % | 0.05 | % | ||||||||||||
| Portfolio turnover rate(c) |
114 | % | 31 | % | 65 | % | 47 | % | 71 | % | ||||||||||||
| (a) | Calculated based on the average shares outstanding methodology. |
| (b) | Assumes investment at the NAV at the beginning of the year, reinvestment of all dividends and distributions, a complete redemption of the investment at the NAV at the end of the year and no sales or redemption charges (if any). Total returns would be reduced if a sales or redemption charge was taken into account. Returns do not reflect the impact of taxes to shareholders relating to Fund distributions or the redemption of Fund shares. |
| (c) | The Fund’s portfolio turnover rate is calculated in accordance with regulatory requirements, without regard to transactions involving short term investments. If such transactions were included, the Fund’s portfolio turnover rate may be higher. |
| The accompanying notes are an integral part of these financial statements. | 143 |
GOLDMAN SACHS U.S. EQUITY ESG FUND
Financial Highlights (continued)
Selected Data for a Share Outstanding Throughout Each Year
| Goldman Sachs U.S. Equity ESG Fund | ||||||||||||||||||||||
| Institutional Shares | ||||||||||||||||||||||
| Year Ended August 31, | ||||||||||||||||||||||
| 2022 | 2021 | 2020 | 2019 | 2018 | ||||||||||||||||||
| Per Share Data |
| |||||||||||||||||||||
| Net asset value, beginning of year |
$ | 19.13 | $ | 15.80 | $ | 13.73 | $ | 14.10 | $ | 14.92 | ||||||||||||
| Net investment income(a) |
0.14 | 0.10 | 0.14 | 0.16 | 0.16 | |||||||||||||||||
| Net realized and unrealized gain (loss) |
(3.53 | ) | 4.97 | 2.58 | 0.67 | 2.17 | ||||||||||||||||
| Total from investment operations |
(3.39 | ) | 5.07 | 2.72 | 0.83 | 2.33 | ||||||||||||||||
| Distributions to shareholders from net investment income |
(0.04 | ) | (0.12 | ) | (0.19 | ) | (0.11 | ) | (0.14 | ) | ||||||||||||
| Distributions to shareholders from net realized gains |
(0.35 | ) | (1.62 | ) | (0.46 | ) | (1.09 | ) | (3.01 | ) | ||||||||||||
| Total distributions |
(0.39 | ) | (1.74 | ) | (0.65 | ) | (1.20 | ) | (3.15 | ) | ||||||||||||
| Net asset value, end of year |
$ | 15.35 | $ | 19.13 | $ | 15.80 | $ | 13.73 | $ | 14.10 | ||||||||||||
| Total Return(b) | (18.13 | )% | 35.11 | % | 20.29 | % | 7.27 | % | 17.92 | % | ||||||||||||
| Net assets, end of year (in 000’s) |
$ | 1,425 | $ | 1,921 | $ | 1,009 | $ | 791 | $ | 4,969 | ||||||||||||
| Ratio of net expenses to average net assets |
0.67 | % | 0.67 | % | 0.70 | % | 0.67 | % | 0.68 | % | ||||||||||||
| Ratio of total expenses to average net assets |
1.51 | % | 3.39 | % | 2.99 | % | 3.97 | % | 4.65 | % | ||||||||||||
| Ratio of net investment income to average net assets |
0.74 | % | 0.60 | % | 0.99 | % | 1.22 | % | 1.20 | % | ||||||||||||
| Portfolio turnover rate(c) |
114 | % | 31 | % | 65 | % | 47 | % | 71 | % | ||||||||||||
| (a) | Calculated based on the average shares outstanding methodology. |
| (b) | Assumes investment at the NAV at the beginning of the year, reinvestment of all dividends and distributions, a complete redemption of the investment at the NAV at the end of the year and no sales or redemption charges (if any). Total returns would be reduced if a sales or redemption charge was taken into account. Returns do not reflect the impact of taxes to shareholders relating to Fund distributions or the redemption of Fund shares. |
| (c) | The Fund’s portfolio turnover rate is calculated in accordance with regulatory requirements, without regard to transactions involving short term investments. If such transactions were included, the Fund’s portfolio turnover rate may be higher. |
| 144 | The accompanying notes are an integral part of these financial statements. |
GOLDMAN SACHS U.S. EQUITY ESG FUND
Financial Highlights (continued)
Selected Data for a Share Outstanding Throughout Each Year
| Goldman Sachs U.S. Equity ESG Fund | ||||||||||||||||||||||
| Investor Shares | ||||||||||||||||||||||
| Year Ended August 31, | ||||||||||||||||||||||
| 2022 | 2021 | 2020 | 2019 | 2018 | ||||||||||||||||||
| Per Share Data | ||||||||||||||||||||||
| Net asset value, beginning of year |
$ | 19.14 | $ | 15.81 | $ | 13.72 | $ | 14.11 | $ | 14.92 | ||||||||||||
| Net investment income(a) |
0.10 | 0.09 | 0.11 | 0.15 | 0.14 | |||||||||||||||||
| Net realized and unrealized gain (loss) |
(3.51 | ) | 4.96 | 2.60 | 0.65 | 2.18 | ||||||||||||||||
| Total from investment operations |
(3.41 | ) | 5.05 | 2.71 | 0.80 | 2.32 | ||||||||||||||||
| Distributions to shareholders from net investment income |
(0.03 | ) | (0.10 | ) | (0.16 | ) | (0.10 | ) | (0.12 | ) | ||||||||||||
| Distributions to shareholders from net realized gains |
(0.35 | ) | (1.62 | ) | (0.46 | ) | (1.09 | ) | (3.01 | ) | ||||||||||||
| Total distributions |
(0.38 | ) | (1.72 | ) | (0.62 | ) | (1.19 | ) | (3.13 | ) | ||||||||||||
| Net asset value, end of year |
$ | 15.35 | $ | 19.14 | $ | 15.81 | $ | 13.72 | $ | 14.11 | ||||||||||||
| Total Return(b) | (18.22 | )% | 34.99 | % | 20.23 | % | 7.05 | % | 17.86 | % | ||||||||||||
| Net assets, end of year (in 000’s) |
$ | 1,175 | $ | 878 | $ | 344 | $ | 1,064 | $ | 235 | ||||||||||||
| Ratio of net expenses to average net assets |
0.78 | % | 0.76 | % | 0.85 | % | 0.78 | % | 0.79 | % | ||||||||||||
| Ratio of total expenses to average net assets |
1.96 | % | 3.79 | % | 3.75 | % | 4.06 | % | 4.87 | % | ||||||||||||
| Ratio of net investment income to average net assets |
0.57 | % | 0.52 | % | 0.76 | % | 1.16 | % | 1.06 | % | ||||||||||||
| Portfolio turnover rate(c) |
114 | % | 31 | % | 65 | % | 47 | % | 71 | % | ||||||||||||
| (a) | Calculated based on the average shares outstanding methodology. |
| (b) | Assumes investment at the NAV at the beginning of the year, reinvestment of all dividends and distributions, a complete redemption of the investment at the NAV at the end of the year and no sales or redemption charges (if any). Total returns would be reduced if a sales or redemption charge was taken into account. Returns do not reflect the impact of taxes to shareholders relating to Fund distributions or the redemption of Fund shares. |
| (c) | The Fund’s portfolio turnover rate is calculated in accordance with regulatory requirements, without regard to transactions involving short term investments. If such transactions were included, the Fund’s portfolio turnover rate may be higher. |
| The accompanying notes are an integral part of these financial statements. | 145 |
GOLDMAN SACHS U.S. EQUITY ESG FUND
Financial Highlights (continued)
Selected Data for a Share Outstanding Throughout Each Year
| Goldman Sachs U.S. Equity ESG Fund | ||||||||||||||||||||||
| Class R6 Shares | ||||||||||||||||||||||
| Year Ended August 31, | ||||||||||||||||||||||
| 2022 | 2021 | 2020 | 2019 | 2018 | ||||||||||||||||||
| Per Share Data |
| |||||||||||||||||||||
| Net asset value, beginning of year |
$ | 19.14 | $ | 15.81 | $ | 13.73 | $ | 14.11 | $ | 14.93 | ||||||||||||
| Net investment income(a) |
0.12 | 0.10 | 0.13 | 0.17 | 0.16 | |||||||||||||||||
| Net realized and unrealized gain (loss) |
(3.51 | ) | 4.96 | 2.60 | 0.65 | 2.17 | ||||||||||||||||
| Total from investment operations |
(3.39 | ) | 5.06 | 2.73 | 0.82 | 2.33 | ||||||||||||||||
| Distributions to shareholders from net investment income |
(0.04 | ) | (0.11 | ) | (0.19 | ) | (0.11 | ) | (0.14 | ) | ||||||||||||
| Distributions to shareholders from net realized gains |
(0.35 | ) | (1.62 | ) | (0.46 | ) | (1.09 | ) | (3.01 | ) | ||||||||||||
| Total distributions |
(0.39 | ) | (1.73 | ) | (0.65 | ) | (1.20 | ) | (3.15 | ) | ||||||||||||
| Net asset value, end of year |
$ | 15.36 | $ | 19.14 | $ | 15.81 | $ | 13.73 | $ | 14.11 | ||||||||||||
| Total Return(b) | (18.13 | )% | 35.09 | % | 20.37 | % | 7.20 | % | 17.94 | % | ||||||||||||
| Net assets, end of year (in 000’s) |
$ | 1,173 | $ | 1,199 | $ | 1,325 | $ | 3,229 | $ | 11 | ||||||||||||
| Ratio of net expenses to average net assets |
0.66 | % | 0.66 | % | 0.71 | % | 0.66 | % | 0.68 | % | ||||||||||||
| Ratio of total expenses to average net assets |
1.85 | % | 3.30 | % | 3.84 | % | 3.76 | % | 4.73 | % | ||||||||||||
| Ratio of net investment income to average net assets |
0.68 | % | 0.60 | % | 0.96 | % | 1.31 | % | 1.16 | % | ||||||||||||
| Portfolio turnover rate(c) |
114 | % | 31 | % | 65 | % | 47 | % | 71 | % | ||||||||||||
| (a) | Calculated based on the average shares outstanding methodology. |
| (b) | Assumes investment at the NAV at the beginning of the year, reinvestment of all dividends and distributions, a complete redemption of the investment at the NAV at the end of the year and no sales or redemption charges (if any). Total returns would be reduced if a sales or redemption charge was taken into account. Returns do not reflect the impact of taxes to shareholders relating to Fund distributions or the redemption of Fund shares. |
| (c) | The Fund’s portfolio turnover rate is calculated in accordance with regulatory requirements, without regard to transactions involving short term investments. If such transactions were included, the Fund’s portfolio turnover rate may be higher. |
| 146 | The accompanying notes are an integral part of these financial statements. |
GOLDMAN SACHS U.S. EQUITY ESG FUND
Financial Highlights (continued)
Selected Data for a Share Outstanding Throughout Each Year
| Goldman Sachs U.S. Equity ESG Fund | ||||||||||||||||||||||
| Class R Shares | ||||||||||||||||||||||
| Year Ended August 31, | ||||||||||||||||||||||
| 2022 | 2021 | 2020 | 2019 | 2018 | ||||||||||||||||||
| Per Share Data | ||||||||||||||||||||||
| Net asset value, beginning of year |
$ | 19.01 | $ | 15.72 | $ | 13.67 | $ | 14.07 | $ | 14.89 | ||||||||||||
| Net investment income(a) |
0.01 | 0.03 | 0.05 | 0.08 | 0.08 | |||||||||||||||||
| Net realized and unrealized gain (loss) |
(3.48 | ) | 4.92 | 2.57 | 0.67 | 2.16 | ||||||||||||||||
| Total from investment operations |
(3.47 | ) | 4.95 | 2.62 | 0.75 | 2.24 | ||||||||||||||||
| Distributions to shareholders from net investment income |
— | (0.04 | ) | (0.11 | ) | (0.06 | ) | (0.05 | ) | |||||||||||||
| Distributions to shareholders from net realized gains |
(0.35 | ) | (1.62 | ) | (0.46 | ) | (1.09 | ) | (3.01 | ) | ||||||||||||
| Total distributions |
(0.35 | ) | (1.66 | ) | (0.57 | ) | (1.15 | ) | (3.06 | ) | ||||||||||||
| Net asset value, end of year |
$ | 15.19 | $ | 19.01 | $ | 15.72 | $ | 13.67 | $ | 14.07 | ||||||||||||
| Total Return(b) | (18.62 | )% | 34.35 | % | 19.56 | % | 6.58 | % | 17.21 | % | ||||||||||||
| Net assets, end of year (in 000’s) |
$ | 408 | $ | 482 | $ | 23 | $ | 20 | $ | 20 | ||||||||||||
| Ratio of net expenses to average net assets |
1.28 | % | 1.26 | % | 1.30 | % | 1.27 | % | 1.29 | % | ||||||||||||
| Ratio of total expenses to average net assets |
2.48 | % | 5.23 | % | 3.68 | % | 4.53 | % | 5.36 | % | ||||||||||||
| Ratio of net investment income to average net assets |
0.06 | % | 0.15 | % | 0.39 | % | 0.64 | % | 0.55 | % | ||||||||||||
| Portfolio turnover rate(c) |
114 | % | 31 | % | 65 | % | 47 | % | 71 | % | ||||||||||||
| (a) | Calculated based on the average shares outstanding methodology. |
| (b) | Assumes investment at the NAV at the beginning of the year, reinvestment of all dividends and distributions, a complete redemption of the investment at the NAV at the end of the year and no sales or redemption charges (if any). Total returns would be reduced if a sales or redemption charge was taken into account. Returns do not reflect the impact of taxes to shareholders relating to Fund distributions or the redemption of Fund shares. |
| (c) | The Fund’s portfolio turnover rate is calculated in accordance with regulatory requirements, without regard to transactions involving short term investments. If such transactions were included, the Fund’s portfolio turnover rate may be higher. |
| The accompanying notes are an integral part of these financial statements. | 147 |
GOLDMAN SACHS U.S. EQUITY ESG FUND
Financial Highlights (continued)
Selected Data for a Share Outstanding Throughout Each Period
| Goldman Sachs U.S. Equity ESG Fund | ||||||||||||||||||||||
| Class P Shares | ||||||||||||||||||||||
| Year Ended August 31, | Period Ended August 31, 2018(a) |
|||||||||||||||||||||
| 2022 | 2021 | 2020 | 2019 | |||||||||||||||||||
| Per Share Data | ||||||||||||||||||||||
| Net asset value, beginning of period |
$ | 19.13 | $ | 15.80 | $ | 13.73 | $ | 14.11 | $ | 13.06 | ||||||||||||
| Net investment income(b) |
0.12 | 0.11 | 0.14 | 0.17 | 0.06 | |||||||||||||||||
| Net realized and unrealized gain (loss) |
(3.51 | ) | 4.95 | 2.58 | 0.65 | 0.99 | ||||||||||||||||
| Total from investment operations |
(3.39 | ) | 5.06 | 2.72 | 0.82 | 1.05 | ||||||||||||||||
| Distributions to shareholders from net investment income |
(0.04 | ) | (0.11 | ) | (0.19 | ) | (0.11 | ) | — | |||||||||||||
| Distributions to shareholders from net realized gains |
(0.35 | ) | (1.62 | ) | (0.46 | ) | (1.09 | ) | — | |||||||||||||
| Total distributions |
(0.39 | ) | (1.73 | ) | (0.65 | ) | (1.20 | ) | — | |||||||||||||
| Net asset value, end of period |
$ | 15.35 | $ | 19.13 | $ | 15.80 | $ | 13.73 | $ | 14.11 | ||||||||||||
| Total Return(c) | (18.14 | )% | 35.11 | % | 20.30 | % | 7.22 | % | 8.04 | % | ||||||||||||
| Net assets, end of period (in 000’s) |
$ | 6,141 | $ | 2,963 | $ | 830 | $ | 2,135 | $ | 2,026 | ||||||||||||
| Ratio of net expenses to average net assets |
0.66 | % | 0.66 | % | 0.71 | % | 0.66 | % | 0.66 | %(d) | ||||||||||||
| Ratio of total expenses to average net assets |
1.85 | % | 3.70 | % | 3.98 | % | 3.88 | % | 5.72 | %(d) | ||||||||||||
| Ratio of net investment income to average net assets |
0.72 | % | 0.63 | % | 0.98 | % | 1.26 | % | 1.23 | %(d) | ||||||||||||
| Portfolio turnover rate(e) |
114 | % | 31 | % | 65 | % | 47 | % | 71 | % | ||||||||||||
| (a) | Commenced operations on April 17, 2018. |
| (b) | Calculated based on the average shares outstanding methodology. |
| (c) | Assumes investment at the NAV at the beginning of the period, reinvestment of all dividends and distributions, a complete redemption of the investment at the NAV at the end of the period and no sales or redemption charges (if any). Total returns would be reduced if a sales or redemption charge was taken into account. Returns do not reflect the impact of taxes to shareholders relating to Fund distributions or the redemption of Fund shares. Total returns for periods less than one full year are not annualized. |
| (d) | Annualized. |
| (e) | The Fund’s portfolio turnover rate is calculated in accordance with regulatory requirements, without regard to transactions involving short term investments. If such transactions were included, the Fund’s portfolio turnover rate may be higher. |
| 148 | The accompanying notes are an integral part of these financial statements. |
GOLDMAN SACHS FUNDAMENTAL EQUITY GROWTH FUNDS
August 31, 2022
| 1. ORGANIZATION |
Goldman Sachs Trust (the “Trust”) is a Delaware statutory trust registered under the Investment Company Act of 1940, as amended (the “Act”), as an open-end management investment company. The following table lists those series of the Trust that are included in this report (collectively, the “Funds” or individually a “Fund”), along with their corresponding share classes and respective diversification status under the Act:
| Fund | Share Classes Offered | Diversified/ Non-Diversified | ||
| Large Cap Core, Mid Cap Growth and Small/Mid Cap Growth |
A, C, Institutional, Service, Investor, R6, R and P |
Diversified | ||
| Strategic Growth |
A, C, Institutional, Service, Investor, R6, R and P |
Non-Diversified | ||
| Concentrated Growth, Flexible Cap, Small Cap Growth and U.S. Equity ESG Fund |
A, C, Institutional, Investor, R6, R and P |
Diversified | ||
| Technology Opportunities |
A, C, Institutional, Service, Investor, R6 and P |
Diversified |
Class A Shares are sold with a front-end sales charge of up to 5.50%. Class C Shares are sold with a contingent deferred sales charge (“CDSC”) of 1.00%, which is imposed on redemptions made within 12 months of purchase. Institutional, Service, Investor, Class R6, Class R and Class P Shares are not subject to a sales charge.
Goldman Sachs Asset Management, L.P. (“GSAM”), an affiliate of Goldman Sachs & Co. LLC (“Goldman Sachs”), serves as investment adviser to the Funds pursuant to a management agreement (the “Agreement”) with the Trust.
| 2. SIGNIFICANT ACCOUNTING POLICIES |
The financial statements have been prepared in accordance with accounting principles generally accepted in the United States of America (“GAAP”) and require management to make estimates and assumptions that may affect the reported amounts and disclosures. Actual results may differ from those estimates and assumptions. Each Fund is an investment company under GAAP and follows the accounting and reporting guidance applicable to investment companies.
A. Investment Valuation — The Funds’ valuation policy is to value investments at fair value.
B. Investment Income and Investments — Investment income includes interest income, dividend income and securities lending income, if any. Interest income is accrued daily and adjusted for amortization of premiums and accretion of discounts. Dividend income is recognized on ex-dividend date or, for certain foreign securities, as soon as such information is obtained subsequent to the ex-dividend date. Non-cash dividends, if any, are recorded at the fair market value of the securities received. Investment transactions are reflected on trade date. Realized gains and losses are calculated using identified cost. Investment transactions are recorded on the following business day for daily net asset value (“NAV”) calculations. Investment income is recorded net of any foreign withholding taxes, less any amounts reclaimable. The Funds may file withholding tax reclaims in certain jurisdictions to recover a portion of amounts previously withheld. These reclaims, if any, are recorded when the amount is known and there are no significant uncertainties on collectability. Such amounts recovered, if any, are reflected as other income in the Statements of Operations. Any foreign capital gains tax is accrued daily based upon net unrealized gains, and is payable upon sale of such investments. Distributions received from the Funds’ investments in U.S. real estate investment trusts (“REITs”) may be characterized as ordinary income, net capital gain and/or a return of capital. A return of capital is recorded by the Funds as a reduction to the cost basis of the REIT.
C. Class Allocations and Expenses — Investment income, realized and unrealized gain (loss), if any, and non-class specific expenses of each Fund are allocated daily based upon the proportion of net assets of each class. Non-class specific expenses directly incurred by a Fund are charged to that Fund, while such expenses incurred by the Trust are allocated across the applicable
149
GOLDMAN SACHS FUNDAMENTAL EQUITY GROWTH FUNDS
Notes to Financial Statements (continued)
August 31, 2022
| 2. SIGNIFICANT ACCOUNTING POLICIES (continued) |
Funds on a straight-line and/or pro-rata basis depending upon the nature of the expenses. Class specific expenses, where applicable, are borne by the respective share classes and include Distribution and Service, Transfer Agency and Service and Shareholder Administration fees.
D. Federal Taxes and Distributions to Shareholders — It is each Fund’s policy to comply with the requirements of the Internal Revenue Code of 1986, as amended (the “Code”), applicable to regulated investment companies and to distribute each year substantially all of its investment company taxable income and capital gains to its shareholders. Accordingly, each Fund is not required to make any provisions for the payment of federal income tax. Distributions to shareholders are recorded on the ex-dividend date. Income and capital gains distributions, if any, are declared and paid at least annually.
Net capital losses, if any, are carried forward to future fiscal years and may be used to the extent allowed by the Code to offset any future capital gains. Losses that are carried forward will retain their character as either short-term or long-term capital losses. Utilization of capital loss carryforwards will reduce the requirement of future capital gains distributions.
The characterization of distributions to shareholders for financial reporting purposes is determined in accordance with federal income tax rules, which may differ from GAAP. The source of each Fund’s distributions may be shown in the accompanying financial statements as either from distributable earnings or capital. Certain components of the Funds’ net assets on the Statements of Assets and Liabilities reflect permanent GAAP/tax differences based on the appropriate tax character.
E. Foreign Currency Translation — The accounting records and reporting currency of the Funds are maintained in U.S. dollars. Assets and liabilities denominated in foreign currencies are translated into U.S. dollars using the current exchange rates at the close of each business day. The effect of changes in foreign currency exchange rates on investments is included within net realized and unrealized gain (loss) on investments. Changes in the value of other assets and liabilities as a result of fluctuations in foreign exchange rates are included in the Statements of Operations within net change in unrealized gain (loss) on foreign currency translation. Transactions denominated in foreign currencies are translated into U.S. dollars on the date the transaction occurred, the effects of which are included within net realized gain (loss) on foreign currency transactions.
| 3. INVESTMENTS AND FAIR VALUE MEASUREMENTS |
U.S. GAAP defines the fair value of a financial instrument as the amount that would be received to sell an asset or paid to transfer a liability in an orderly transaction between market participants at the measurement date (i.e., the exit price); the Funds’ policy is to use the market approach. GAAP establishes a fair value hierarchy that prioritizes the inputs to valuation techniques used to measure fair value. The hierarchy gives the highest priority to unadjusted quoted prices in active markets for identical assets or liabilities (Level 1 measurements) and the lowest priority to unobservable inputs (Level 3 measurements). The level in the fair value hierarchy within which the fair value measurement in its entirety falls shall be determined based on the lowest level input that is significant to the fair value measurement in its entirety. The levels used for classifying investments are not necessarily an indication of the risk associated with investing in these investments. The three levels of the fair value hierarchy are described below:
Level 1 — Unadjusted quoted prices in active markets that are accessible at the measurement date for identical, unrestricted assets or liabilities;
Level 2 — Quoted prices in markets that are not active or financial instruments for which significant inputs are observable (including, but not limited to, quoted prices for similar investments, interest rates, foreign exchange rates, volatility and credit spreads), either directly or indirectly;
Level 3 — Prices or valuations that require significant unobservable inputs (including GSAM’s assumptions in determining fair value measurement).
The Board of Trustees (“Trustees”) has approved Valuation Procedures that govern the valuation of the portfolio investments held by the Funds, including investments for which market quotations are not readily available. With respect to the Funds’ investments that do not have readily available market quotations, the Trustees have designated the Adviser as the valuation designee to perform fair valuations pursuant to Rule 2a-5 under the Investment Company Act of 1940 (the “Valuation Designee”). GSAM has day-to-
150
GOLDMAN SACHS FUNDAMENTAL EQUITY GROWTH FUNDS
| 3. INVESTMENTS AND FAIR VALUE MEASUREMENTS (continued) |
day responsibility for implementing and maintaining internal controls and procedures related to the valuation of the Funds’ investments. To assess the continuing appropriateness of pricing sources and methodologies, GSAM regularly performs price verification procedures and issues challenges as necessary to third party pricing vendors or brokers, and any differences are reviewed in accordance with the Valuation Procedures.
A. Level 1 and Level 2 Fair Value Investments — The valuation techniques and significant inputs used in determining the fair values for investments classified as Level 1 and Level 2 are as follows:
Equity Securities — Equity securities traded on a United States (“U.S.”) securities exchange or the NASDAQ system, or those located on certain foreign exchanges, including but not limited to the Americas, are valued daily at their last sale price or official closing price on the principal exchange or system on which they are traded. If there is no sale or official closing price or such price is believed by GSAM to not represent fair value, equity securities will be valued at the valid closing bid price for long positions and at the valid closing ask price for short positions (i.e. where there is sufficient volume, during normal exchange trading hours). If no valid bid/ask price is available, the equity security will be valued pursuant to the Valuation Procedures and consistent with applicable regulatory guidance. To the extent these investments are actively traded, they are classified as Level 1 of the fair value hierarchy, otherwise they are generally classified as Level 2. Certain equity securities containing unique attributes may be classified as Level 2.
Unlisted equity securities for which market quotations are available are valued at the last sale price on the valuation date, or if no sale occurs, at the last bid price for long positions or the last ask price for short positions, and are generally classified as Level 2. Securities traded on certain foreign securities exchanges are valued daily at fair value determined by an independent fair value service (if available) under the Valuation Procedures and consistent with applicable regulatory guidance. The independent fair value service takes into account multiple factors including, but not limited to, movements in the securities markets, certain depositary receipts, futures contracts and foreign currency exchange rates that have occurred subsequent to the close of the foreign securities exchange. These investments are generally classified as Level 2 of the fair value hierarchy.
Money Market Funds — Investments in the Goldman Sachs Financial Square Government Fund (“Underlying Money Market Fund”) are valued at the NAV per share of the Institutional Share class on the day of valuation. These investments are generally classified as Level 1 of the fair value hierarchy. For information regarding the Underlying Money Market Fund’s accounting policies and investment holdings, please see the Underlying Money Market Fund’s shareholder report.
B. Level 3 Fair Value Investments — To the extent that significant inputs to valuation models and other alternative pricing sources are unobservable, or if quotations are not readily available, or if GSAM believes that such quotations do not accurately reflect fair value, the fair value of a Fund’s investments may be determined under Valuation Procedures. GSAM, consistent with its procedures and applicable regulatory guidance, may make an adjustment to the most recent valuation prices of either domestic or foreign securities in light of significant events to reflect what it believes to be the fair value of the securities at the time of determining a Fund’s NAV. To the extent investments are valued using single source broker quotations obtained directly from the broker or passed through from third party pricing vendors, such investments are classified as Level 3 investments.
151
GOLDMAN SACHS FUNDAMENTAL EQUITY GROWTH FUNDS
Notes to Financial Statements (continued)
August 31, 2022
| 3. INVESTMENTS AND FAIR VALUE MEASUREMENTS (continued) |
C. Fair Value Hierarchy — The following is a summary of the Funds’ investments classified in the fair value hierarchy as of August 31, 2022:
| CONCENTRATED GROWTH FUND | ||||||||||||
| Investment Type | Level 1 | Level 2 | Level 3 | |||||||||
| Assets | ||||||||||||
| Common Stock and/or Other Equity Investments(a) |
||||||||||||
| Europe |
$ | 2,183,711 | $ | — | $ | — | ||||||
| North America |
143,281,780 | — | — | |||||||||
| Investment Company |
601,795 | — | — | |||||||||
| Total | $ | 146,067,286 | $ | — | $ | — | ||||||
| FLEXIBLE CAP FUND | ||||||||||||
| Investment Type | Level 1 | Level 2 | Level 3 | |||||||||
| Assets | ||||||||||||
| Common Stock and/or Other Equity Investments(a) |
||||||||||||
| Asia |
$ | 164,909 | $ | — | $ | — | ||||||
| Europe |
731,562 | — | — | |||||||||
| North America |
39,750,078 | — | — | |||||||||
| Total | $ | 40,646,549 | $ | — | $ | — | ||||||
| LARGE CAP CORE FUND | ||||||||||||
| Investment Type | Level 1 | Level 2 | Level 3 | |||||||||
| Assets | ||||||||||||
| Common Stock and/or Other Equity Investments(a) |
||||||||||||
| Asia |
$ | 1,625,886 | $ | — | $ | — | ||||||
| Europe |
15,659,271 | — | — | |||||||||
| North America |
1,067,503,287 | — | — | |||||||||
| Investment Company |
2,302,429 | — | — | |||||||||
| Total | $ | 1,087,090,873 | $ | — | $ | — | ||||||
| MID CAP GROWTH FUND | ||||||||||||
| Investment Type | Level 1 | Level 2 | Level 3 | |||||||||
| Assets | ||||||||||||
| Common Stock and/or Other Equity Investments(a) |
||||||||||||
| Europe |
$ | 9,143,320 | $ | — | $ | — | ||||||
| North America |
930,280,741 | — | — | |||||||||
| Investment Company |
25,770,714 | — | — | |||||||||
| Total | $ | 965,194,775 | $ | — | $ | — | ||||||
| (a) | Amounts are disclosed by continent to highlight the impact of time zone differences between local market close and the calculation of NAV. Security valuations are based on the principal exchange or system on which they are traded, which may differ from country of domicile noted in table. |
152
GOLDMAN SACHS FUNDAMENTAL EQUITY GROWTH FUNDS
| 3. INVESTMENTS AND FAIR VALUE MEASUREMENTS (continued) |
| SMALL CAP GROWTH FUND |
| |||||||||||
| Investment Type | Level 1 | Level 2 | Level 3 | |||||||||
| Assets | ||||||||||||
| Common Stock and/or Other Equity Investments(a) |
||||||||||||
| Africa |
$ | 201,431 | $ | — | $ | — | ||||||
| Asia |
209,512 | — | — | |||||||||
| Europe |
126,167 | — | — | |||||||||
| North America |
29,842,832 | — | — | |||||||||
| Investment Company |
404,748 | — | — | |||||||||
| Securities Lending Reinvestment Vehicle |
678,997 | — | — | |||||||||
| Total | $ | 31,463,687 | $ | — | $ | — | ||||||
| SMALL/MID CAP GROWTH FUND | ||||||||||||
| Investment Type | Level 1 | Level 2 | Level 3 | |||||||||
| Assets | ||||||||||||
| Common Stock and/or Other Equity Investments(a) |
||||||||||||
| Asia |
$ | 25,871,465 | $ | — | $ | — | ||||||
| Europe |
26,053,287 | — | — | |||||||||
| North America |
2,043,863,580 | — | — | |||||||||
| Investment Company |
4,992,100 | — | — | |||||||||
| Securities Lending Reinvestment Vehicle |
7,120,875 | — | — | |||||||||
| Total | $ | 2,107,901,307 | $ | — | $ | — | ||||||
| STRATEGIC GROWTH FUND | ||||||||||||
| Investment Type | Level 1 | Level 2 | Level 3 | |||||||||
| Assets | ||||||||||||
| Common Stock and/or Other Equity Investments(a) |
||||||||||||
| Europe |
$ | 2,270,214 | $ | — | $ | — | ||||||
| North America |
140,020,310 | — | — | |||||||||
| Investment Company |
1,183,975 | — | — | |||||||||
| Total | $ | 143,474,499 | $ | — | $ | — | ||||||
| TECHNOLOGY OPPORTUNITIES FUND | ||||||||||||
| Investment Type | Level 1 | Level 2 | Level 3 | |||||||||
| Assets | ||||||||||||
| Common Stock and/or Other Equity Investments(a) |
||||||||||||
| Asia |
$ | 9,313,747 | $ | — | $ | — | ||||||
| North America |
597,464,597 | — | — | |||||||||
| South America |
7,591,320 | — | — | |||||||||
| Investment Company |
4,488,694 | — | — | |||||||||
| Total | $ | 618,858,358 | $ | — | $ | — | ||||||
| (a) | Amounts are disclosed by continent to highlight the impact of time zone differences between local market close and the calculation of NAV. Security valuations are based on the principal exchange or system on which they are traded, which may differ from country of domicile noted in table. |
153
GOLDMAN SACHS FUNDAMENTAL EQUITY GROWTH FUNDS
Notes to Financial Statements (continued)
August 31, 2022
| 3. INVESTMENTS AND FAIR VALUE MEASUREMENTS (continued) |
| U.S. EQUITY ESG FUND |
| |||||||||||
| Investment Type | Level 1 | Level 2 | Level 3 | |||||||||
| Assets | ||||||||||||
| Common Stock and/or Other Equity Investments(a) |
||||||||||||
| Europe |
$ | 390,347 | $ | — | $ | — | ||||||
| North America |
17,605,516 | — | — | |||||||||
| Investment Company |
292,205 | — | — | |||||||||
| Total | $ | 18,288,068 | $ | — | $ | — | ||||||
| (a) | Amounts are disclosed by continent to highlight the impact of time zone differences between local market close and the calculation of NAV. Security valuations are based on the principal exchange or system on which they are traded, which may differ from country of domicile noted in table. |
For further information regarding security characteristics, see the Schedules of Investments.
| 4. AGREEMENTS AND AFFILIATED TRANSACTIONS |
A. Management Agreement — Under the Agreement, GSAM manages the Funds, subject to the general supervision of the Trustees.
As compensation for the services rendered pursuant to the Agreement, the assumption of the expenses related thereto and administration of the Funds’ business affairs, including providing facilities, GSAM is entitled to a management fee, accrued daily and paid monthly, equal to an annual percentage rate of each Fund’s average daily net assets.
As of August 31, 2022, contractual and effective net management fees with GSAM were at the following rates:
| Contractual Management Rate | Effective Contractual Management Rate |
Effective Net Management Rate# |
||||||||||||||||||||||||||||||
| Fund | First $1 billion |
Next $1 billion |
Next $3 billion |
Next $3 billion |
Over $8 billion |
|||||||||||||||||||||||||||
| Concentrated Growth |
0.76 | % | 0.68 | % | 0.65 | % | 0.64 | % | 0.62 | % | 0.76 | % | 0.76 | % | ||||||||||||||||||
| Flexible Cap |
0.55 | 0.50 | 0.47 | 0.46 | 0.45 | 0.55 | 0.55 | |||||||||||||||||||||||||
| Large Cap Core |
0.71 | 0.64 | 0.61 | 0.61 | 0.61 | 0.70 | 0.67 | * | ||||||||||||||||||||||||
| Mid Cap Growth |
0.92 | 0.92 | 0.83 | 0.79 | 0.77 | 0.92 | 0.86 | * | ||||||||||||||||||||||||
| Small Cap Growth |
0.85 | 0.85 | 0.77 | 0.73 | 0.71 | 0.85 | 0.85 | |||||||||||||||||||||||||
| Small/Mid Cap Growth |
0.85 | 0.85 | 0.77 | 0.73 | 0.71 | 0.83 | 0.83 | |||||||||||||||||||||||||
| Strategic Growth |
0.71 | 0.64 | 0.61 | 0.59 | 0.58 | 0.71 | 0.71 | |||||||||||||||||||||||||
| Technology Opportunities |
0.94 | 0.85 | 0.80 | 0.79 | 0.77 | 0.94 | 0.92 | * | ||||||||||||||||||||||||
| U.S. Equity ESG Fund |
0.55 | 0.50 | 0.47 | 0.46 | 0.45 | 0.55 | 0.55 | |||||||||||||||||||||||||
| # | The Effective Net Management Rate includes the impact of management fee waivers of affiliated underlying funds, if any. The Effective Net Management Rate may not correlate to the Contractual Management Rate as a result of management fee waivers that may be in effect from time to time. |
| * | The Investment Adviser agreed to waive a portion of its management fee in order to achieve an effective net management fee rate of 0.66% as an annual percentage rate of the Large Cap Core Growth, 0.86% as an annual percentage rate of the Mid Cap Growth and 0.91% as an annual percentage rate of the Technology Opportunities Fund’s average daily net assets. This arrangement will remain in effect through at least December 29, 2022. Prior to December 29, 2021, the effective net management fee rate for the Large Cap Core Fund was 0.86% and the Mid Cap Growth and Technology Opportunities Funds did not have management fee waivers. |
The Funds invest in Institutional Shares of the Underlying Money Market Fund, which is an affiliated Underlying Fund. GSAM has agreed to waive a portion of its management fee payable by the Funds in an amount equal to the management fee it
154
GOLDMAN SACHS FUNDAMENTAL EQUITY GROWTH FUNDS
| 4. AGREEMENTS AND AFFILIATED TRANSACTIONS (continued) |
earns as an investment adviser to the affiliated Underlying Fund in which the Funds invest, except those management fees it earns from the Funds’ investments of cash collateral received in connection with securities lending transactions in the Underlying Money Market Fund. For the fiscal year ended August 31, 2022, the management fee waived by GSAM for each Fund was as follows:
| Fund | Management Fee Waived |
|||||
| Concentrated Growth |
$ | 912 | ||||
| Flexible Cap |
558 | |||||
| Large Cap Core |
7,331 | |||||
| Mid Cap Growth |
21,510 | |||||
| Small Cap Growth |
718 | |||||
| Small/Mid Cap Growth |
39,781 | |||||
| Strategic Growth |
1,817 | |||||
| Technology Opportunities |
12,354 | |||||
| U.S. Equity ESG Fund |
417 | |||||
B. Distribution and/or Service (12b-1) Plans — The Trust, on behalf of Class A and Class R Shares of each applicable Fund, has adopted Distribution and Service Plans subject to Rule 12b-1 under the Act. Under the Distribution and Service Plans, Goldman Sachs, which serves as distributor (the “Distributor”), is entitled to a fee accrued daily and paid monthly for distribution services and personal and account maintenance services, which may then be paid by Goldman Sachs to authorized dealers. These fees are equal to an annual percentage rate of the average daily net assets attributable to Class A or Class R Shares of the Funds, as applicable, as set forth below.
The Trust, on behalf of Class C Shares of each applicable Fund, has adopted a Distribution Plan subject to Rule 12b-1 under the Act. Under the Distribution Plan, Goldman Sachs as Distributor is entitled to a fee accrued daily and paid monthly for distribution services, which may then be paid by Goldman Sachs to authorized dealers. These fees are equal to an annual percentage rate of the average daily net assets attributable to Class C Shares of the Funds, as set forth below.
The Trust, on behalf of Service Shares of each applicable Fund, has adopted a Service Plan subject to Rule 12b-1 under the Act to allow Service Shares to compensate service organizations (including Goldman Sachs) for providing personal and account maintenance services to their customers who are beneficial owners of such shares. The Service Plan provides for compensation to the service organizations equal to an annual percentage rate of the average daily net assets attributable to Service Shares of the Funds, as set forth below.
| Distribution and/or Service Plan Rates | ||||||||||||||||
| Class A* | Class C | Class R* | Service | |||||||||||||
| Distribution and/or Service Plan |
0.25 | % | 0.75 | % | 0.50 | % | 0.25 | % | ||||||||
| * | With respect to Class A and Class R Shares, the Distributor at its discretion may use compensation for distribution services paid under the Distribution and/or Service Plans to compensate service organizations for personal and account maintenance services and expenses as long as such total compensation does not exceed the maximum cap on “service fees” imposed by the Financial Industry Regulatory Authority. |
155
GOLDMAN SACHS FUNDAMENTAL EQUITY GROWTH FUNDS
Notes to Financial Statements (continued)
August 31, 2022
| 4. AGREEMENTS AND AFFILIATED TRANSACTIONS (continued) |
C. Distribution Agreement — Goldman Sachs, as Distributor of the shares of the Funds pursuant to a Distribution Agreement, may retain a portion of the Class A Shares’ front end sales charge and Class C Shares’ CDSC. During the fiscal year ended August 31, 2022, Goldman Sachs retained the following amounts:
| Front End Sales Charge |
Contingent Deferred Sales Charge |
|||||||||
| Fund | Class A | Class C | ||||||||
| Concentrated Growth |
$ | 3,374 | $ | — | ||||||
| Flexible Cap |
2,631 | — | ||||||||
| Large Cap Core |
29,512 | 796 | ||||||||
| Mid Cap Growth |
8,467 | 1,533 | ||||||||
| Small Cap Growth |
328 | — | ||||||||
| Small/Mid Cap Growth |
26,812 | — | ||||||||
| Strategic Growth |
4,941 | — | ||||||||
| Technology Opportunities |
13,099 | 970 | ||||||||
| U.S. Equity ESG Fund |
1,299 | — | ||||||||
D. Service and Shareholder Administration Plans — The Trust, on behalf of each applicable Fund, has adopted Service Plans to allow Class C Shares and Shareholder Administration Plans to allow Service Shares, respectively, to compensate service organizations (including Goldman Sachs) for providing varying levels of personal and account maintenance or shareholder administration services to their customers who are beneficial owners of such shares. The Service and Shareholder Administration Plans each provide for compensation to the service organizations equal to an annual percentage rate of 0.25% of the average daily net assets attributable to Class C and Service Shares of the Funds, respectively.
E. Transfer Agency Agreement — Goldman Sachs also serves as the transfer agent of the Funds for a fee pursuant to the Transfer Agency Agreement. The fees charged for such transfer agency services are accrued daily and paid monthly at annual rates as follows: 0.16% of the average daily net assets of Class A, Class C, Investor and Class R Shares; 0.03% of the average daily net assets of Class R6 and Class P Shares; and 0.04% of the average daily net assets of Institutional and Service Shares.
For the fiscal year ended August 31, 2022, the transfer agency fee waivers were as follows:
| Transfer Agency Waivers (Class A, Class C, Investor, and Class R Shares) | ||||||||||
| Fund | Before December 29, 2021 | As of December 29, 2021* | ||||||||
| Concentrated Growth |
0.07 | % | 0.07 | % | ||||||
| Mid Cap Growth |
0.02 | % | 0.04 | % | ||||||
| Large Cap Core |
— | % | 0.03 | % | ||||||
| Small/Mid Cap Growth |
0.04 | % | 0.04 | % | ||||||
| Strategic Growth |
— | % | 0.02 | % | ||||||
| Technology Opportunities |
0.08 | % | 0.08 | % | ||||||
| U.S. Equity ESG Fund |
0.02 | % | — | % | ||||||
| * | These arrangements will remain in effect through at least December 29, 2022, and prior to such date, Goldman Sachs may not terminate the arrangement without the approval of the Board of Trustees. |
156
GOLDMAN SACHS FUNDAMENTAL EQUITY GROWTH FUNDS
| 4. AGREEMENTS AND AFFILIATED TRANSACTIONS (continued) |
F. Other Expense Agreements and Affiliated Transactions — GSAM has agreed to reduce or limit certain “Other Expenses” of the Funds (excluding acquired fund fees and expenses, transfer agency fees and expenses, service fees and shareholder administration fees (as applicable), taxes, interest, brokerage fees, expenses of shareholder meetings, litigation and indemnification, and extraordinary expenses) to the extent such expenses exceed, on an annual basis, a percentage rate of the average daily net assets of each Fund. Such Other Expense reimbursements, if any, are accrued daily and paid monthly. In addition, the Funds are not obligated to reimburse GSAM for prior fiscal year expense reimbursements, if any. The Other Expense limitations as an annual percentage rate of average daily net assets for Concentrated Growth, Flexible Cap, Large Cap Core, Mid Cap Growth, Small Cap Growth, Small/Mid Cap Growth, Strategic Growth, Technology Opportunities, and U.S. Equity ESG Funds are 0.004%, 0.004%, 0.004%, 0.004%, 0.024%, 0.044%, 0.004%, 0.004%, and 0.084%, respectively. These Other Expense limitations will remain in place through at least December 29, 2022, and prior to such date GSAM may not terminate the arrangements without the approval of the Trustees. In addition, the Funds have entered into certain offset arrangements with the transfer agent, which may result in a reduction of the Funds’ expenses and are received irrespective of the application of the “Other Expense” limitations described above.
For the fiscal year ended August 31, 2022, these expense reductions, including any fee waivers and Other Expense reimbursements, were as follows:
| Fund | Management Fee Waiver |
Transfer Agency Fee Waiver/Credits |
Other Expense Reimbursements |
Total Expense Reductions |
||||||||||||||
| Concentrated Growth |
$ | 912 | $ | 7,538 | $ | 244,631 | $ | 253,081 | ||||||||||
| Flexible Cap |
558 | — | 257,989 | 258,547 | ||||||||||||||
| Large Cap Core |
318,604 | 179,310 | 452,680 | 950,594 | ||||||||||||||
| Mid Cap Growth |
731,994 | 168,575 | 433,942 | 1,334,511 | ||||||||||||||
| Small Cap Growth |
718 | — | 210,815 | 211,533 | ||||||||||||||
| Small/Mid Cap Growth |
39,781 | 547,819 | — | 587,600 | ||||||||||||||
| Strategic Growth |
1,817 | 6,456 | 307,561 | 315,834 | ||||||||||||||
| Technology Opportunities |
148,686 | 369,186 | 422,330 | 940,202 | ||||||||||||||
| U.S. Equity ESG Fund |
417 | 1,155 | 240,864 | 242,436 | ||||||||||||||
G. Line of Credit Facility — As of August 31, 2022, the Funds participated in a $1,250,000,000 committed, unsecured revolving line of credit facility (the “facility”) together with other funds of the Trust and certain registered investment companies having management agreements with GSAM or its affiliates. This facility is to be used for temporary emergency purposes, or to allow for an orderly liquidation of securities to meet redemption requests. The interest rate on borrowings is based on the federal funds rate. The facility also requires a fee to be paid by the Funds based on the amount of the commitment that has not been utilized. For the fiscal year ended August 31, 2022, the Funds did not have any borrowings under the facility. Prior to April 22, 2022, the facility was $1,000,000,000.
157
GOLDMAN SACHS FUNDAMENTAL EQUITY GROWTH FUNDS
Notes to Financial Statements (continued)
August 31, 2022
| 4. AGREEMENTS AND AFFILIATED TRANSACTIONS (continued) |
H. Other Transactions with Affiliates — For the fiscal year ended August 31, 2022, Goldman Sachs earned the following amounts in brokerage commissions from portfolio transactions, on behalf of the Funds:
| Concentrated Growth |
Flexible Cap Growth |
Large Cap Core |
Mid Cap Growth |
Small Cap Growth |
Small/Mid Cap Growth |
Strategic Growth |
Technology Opportunities |
U.S. Equity ESG Fund |
||||||||||||||||||||||||||||
| Brokerage commissions paid |
$ | — | $ | 9 | $ | 14,045 | $ | 13,928 | $ | — | $ | 32,991 | $ | — | $ | 8,883 | $ | 58 | ||||||||||||||||||
The table below shows the transactions in and earnings from investments in the Government Money Market Fund — Institutional Shares for the fiscal year ended August 31, 2022:
| Fund | Beginning Value as of August 31, 2021 |
Purchases at Cost |
Proceeds from Sales |
Market Value as of August 31, 2022 |
Shares as of August 31, 2022 |
Dividend Income |
||||||||||||||||||
| Concentrated Growth |
$ | 164,062 | $ | 22,513,339 | $ | (22,075,606 | ) | $ | 601,795 | 601,795 | $ | 3,394 | ||||||||||||
| Flexible Cap |
544,338 | 13,995,808 | (14,540,146 | ) | — | — | 1,888 | |||||||||||||||||
| Large Cap Core |
4,496,378 | 155,098,045 | (157,291,994 | ) | 2,302,429 | 2,302,429 | 16,038 | |||||||||||||||||
| Mid Cap Growth |
13,911,294 | 272,570,124 | (260,710,704 | ) | 25,770,714 | 25,770,714 | 118,943 | |||||||||||||||||
| Small Cap Growth |
249,984 | 25,185,050 | (25,030,286 | ) | 404,748 | 404,748 | 2,497 | |||||||||||||||||
| Small/Mid Cap Growth |
31,272,380 | 789,079,598 | (815,359,878 | ) | 4,992,100 | 4,992,100 | 136,190 | |||||||||||||||||
| Strategic Growth |
1,330,594 | 25,193,187 | (25,339,806 | ) | 1,183,975 | 1,183,975 | 4,276 | |||||||||||||||||
| Technology Opportunities |
19,184,235 | 238,246,846 | (252,942,387 | ) | 4,488,694 | 4,488,694 | 48,762 | |||||||||||||||||
| U.S. Equity ESG Fund |
273,779 | 10,221,579 | (10,203,153 | ) | 292,205 | 292,205 | 1,165 | |||||||||||||||||
As of August 31, 2022, The Goldman Sachs Group, Inc. was the beneficial owner of 5% or more of outstanding shares of the following Funds:
| Fund | Class C | Institutional | Investor | Class R6 | Class R | |||||||||||||||
| Concentrated Growth |
— | % | — | % | — | % | — | % | 100 | % | ||||||||||
| Flexible Cap |
— | — | 66 | — | 88 | |||||||||||||||
| Small Cap Growth |
90 | 21 | 100 | 100 | 100 | |||||||||||||||
| Strategic Growth |
— | — | — | — | 8 | |||||||||||||||
| U.S. Equity ESG |
— | 8 | — | — | 6 | |||||||||||||||
158
GOLDMAN SACHS FUNDAMENTAL EQUITY GROWTH FUNDS
| 5. PORTFOLIO SECURITIES TRANSACTIONS |
The cost of purchases and proceeds from sales and maturities of long-term securities for the fiscal year ended August 31, 2022, were as follows:
| Fund | Purchases | Sales | ||||||||
| Concentrated Growth |
$ | 52,087,485 | $ | 73,970,006 | ||||||
| Flexible Cap |
27,140,206 | 19,358,372 | ||||||||
| Large Cap Core |
788,836,063 | 757,924,558 | ||||||||
| Mid Cap Growth |
592,795,496 | 754,293,439 | ||||||||
| Small Cap Growth |
36,879,215 | 19,714,183 | ||||||||
| Small/Mid Cap Growth |
1,809,468,499 | 2,169,369,599 | ||||||||
| Strategic Growth |
44,337,133 | 73,192,670 | ||||||||
| Technology Opportunities |
381,031,089 | 453,442,453 | ||||||||
| U.S. Equity ESG Fund |
29,457,591 | 23,138,593 | ||||||||
| 6. SECURITIES LENDING |
The Funds may lend their securities through a securities lending agent, the Bank of New York Mellon (“BNYM”), to certain qualified borrowers. In accordance with the Funds’ securities lending procedures, the Funds receive cash collateral at least equal to the market value of the securities on loan. The market value of the loaned securities is determined at the close of business of the Funds, at their last sale price or official closing price on the principal exchange or system on which they are traded, and any additional required collateral is delivered to the Funds on the next business day. As with other extensions of credit, the Funds may experience delay in the recovery of their securities or incur a loss should the borrower of the securities breach its agreement with the Funds or become insolvent at a time when the collateral is insufficient to cover the cost of repurchasing securities on loan.
Dividend income received from securities on loan may not be subject to withholding taxes and therefore withholding taxes paid may differ from the amounts listed in the Statements of Operations. Loans of securities are terminable at any time and as such
1) the remaining contractual maturities of the outstanding securities lending transactions are considered to be overnight and continuous and 2) the borrower, after notice, is required to return borrowed securities within the standard time period for settlement of securities transactions.
The Funds invest the cash collateral received in connection with securities lending transactions in the Government Money Market Fund, an affiliated series of the Goldman Sachs Trust. The Government Money Market Fund is registered under the Act as an open end investment company, is subject to Rule 2a-7 under the Act, and is managed by GSAM, for which GSAM may receive a management fee of up to 0.16% on an annualized basis of the average daily net assets of the Government Money Market Fund.
In the event of a default by a borrower with respect to any loan, BNYM may exercise any and all remedies provided under the applicable borrower agreement to make the Funds whole. These remedies include purchasing replacement securities by applying the collateral held from the defaulting broker against the purchase cost of the replacement securities. If BNYM is unable to purchase replacement securities, BNYM will indemnify the Funds by paying the Funds an amount equal to the market value of the securities loaned minus the value of cash collateral received from the borrower for the loan, subject to an exclusion for any shortfalls resulting from a loss of value in such cash collateral due to reinvestment risk. The Funds’ master netting agreements with certain borrowers provide the right, in the event of a default (including bankruptcy or insolvency), for the non-defaulting party to liquidate the collateral and calculate net exposure to the defaulting party or request additional collateral. However, in the event of a default by a borrower, a resolution authority could determine that such rights are not enforceable due to the restrictions or
159
GOLDMAN SACHS FUNDAMENTAL EQUITY GROWTH FUNDS
Notes to Financial Statements (continued)
August 31, 2022
| 6. SECURITIES LENDING (continued) |
prohibitions against the right of set-off that may be imposed in accordance with a particular jurisdiction’s bankruptcy or insolvency laws. The Funds’ loaned securities were all subject to enforceable Securities Lending Agreements and the value of the collateral was at least equal to the value of the cash received. The amounts of the Funds’ overnight and continuous agreements, which represent the gross amounts of recognized liabilities for securities lending transactions outstanding as of August 31, 2022, are disclosed as “Payable upon return of securities loaned” on the Statements of Assets and Liabilities, where applicable.
Each of the Funds and BNYM received compensation relating to the lending of the Funds’ securities. The amounts earned, if any, by the Funds for the fiscal year ended August 31, 2022, are reported under Investment Income on the Statements of Operations.
The following table provides information about the Funds’ investments in the Government Money Market Fund for the fiscal year ended August 31, 2022:
| Fund | Beginning Value as of August 31, 2021 |
Purchases at Cost |
Proceeds from Sales |
Ending Value as of August 31, 2022 |
||||||||||||||
| Concentrated Growth |
$ | — | $ | 6,314,588 | $ | (6,314,588 | ) | $ | — | |||||||||
| Flexible Cap |
— | 634,192 | (634,192 | ) | — | |||||||||||||
| Large Cap Core |
3,856,622 | 21,180,956 | (25,037,578 | ) | — | |||||||||||||
| Mid Cap Growth |
7,447,030 | 102,226,378 | (109,673,408 | ) | — | |||||||||||||
| Small Cap Growth |
141,504 | 13,202,664 | (12,665,171 | ) | 678,997 | |||||||||||||
| Small/Mid Cap Growth |
18,738,133 | 559,075,901 | (570,693,159 | ) | 7,120,875 | |||||||||||||
| Strategic Growth |
1,015,902 | 8,221,555 | (9,237,457 | ) | — | |||||||||||||
| Technology Opportunities |
— | 32,670,469 | (32,670,469 | ) | — | |||||||||||||
| U.S. Equity ESG |
— | 997,046 | (997,046 | ) | — | |||||||||||||
| 7. TAX INFORMATION |
The tax character of distributions paid during the fiscal year ended August 31, 2022 was as follows:
| Concentrated Growth |
Flexible Cap Growth |
Large Cap Core |
Mid Cap Growth |
Small Cap Growth |
Small/Mid Cap Growth |
Strategic Growth |
Technology Opportunities |
U.S. Equity ESG Fund |
||||||||||||||||||||||||||||
| Distributions paid from: |
||||||||||||||||||||||||||||||||||||
| Ordinary Income |
$ | 6,748,756 | $ | 1,039,734 | $ | 41,150,272 | $ | 64,922,993 | $ | 1,158,258 | $ | 85,487,683 | $ | 5,130,133 | $ | 22,089,157 | $ | 395,223 | ||||||||||||||||||
| Net long-term capital gains |
27,668,649 | 1,366,469 | 90,741,725 | 147,936,040 | 1,258,935 | 351,527,688 | 19,787,592 | 109,328,052 | 221,497 | |||||||||||||||||||||||||||
| Total taxable distributions |
$ | 34,417,405 | $ | 2,406,203 | $ | 131,891,997 | $ | 212,859,033 | $ | 2,417,193 | $ | 437,015,371 | $ | 24,917,725 | $ | 131,417,209 | $ | 616,720 | ||||||||||||||||||
| Return of Capital |
$ | — | $ | — | $ | — | $ | — | $ | — | $ | 3,683,858 | $ | — | $ | — | $ | — | ||||||||||||||||||
160
GOLDMAN SACHS FUNDAMENTAL EQUITY GROWTH FUNDS
| 7. TAX INFORMATION (continued) |
The tax character of distributions paid during the fiscal year ended August 31, 2021 was as follows:
| Concentrated Growth |
Flexible Cap Growth |
Large Cap Core |
Mid Cap Growth |
Small Cap Growth |
Small/Mid Cap Growth |
Strategic Growth |
Technology Opportunities |
U.S. Equity ESG Fund |
||||||||||||||||||||||||||||
| Distributions paid from: |
||||||||||||||||||||||||||||||||||||
| Ordinary Income |
$ | 709,768 | $ | 530,052 | $ | 2,653,571 | $ | 42,355,710 | $ | 1,250,968 | $ | 96,550,926 | $ | 2,114,975 | $ | 10,001,353 | $ | 61,198 | ||||||||||||||||||
| Net long-term capital gains |
10,169,325 | 812,482 | 34,899,429 | 214,147,837 | 123 | 267,444,660 | 23,737,095 | 55,965,814 | 1,149,182 | |||||||||||||||||||||||||||
| Total taxable distributions |
$ | 10,879,093 | $ | 1,342,534 | $ | 37,553,000 | $ | 256,503,547 | $ | 1,251,091 | $ | 363,995,586 | $ | 25,852,070 | $ | 65,967,167 | $ | 1,210,380 | ||||||||||||||||||
As of August 31, 2022, the components of accumulated earnings (losses) on a tax basis were as follows:
| Concentrated Growth |
Flexible Cap Growth |
Large Cap Core | Mid Cap Growth |
Small Cap Growth |
Small/Mid Cap Growth |
Strategic Growth |
Technology Opportunities |
U.S. Equity ESG Fund |
||||||||||||||||||||||||||||
| Undistributed ordinary income — net |
$ | — | $ | 282,888 | $ | 3,094,792 | $ | — | $ | — | $ | — | $ | — | $ | — | $ | 83,088 | ||||||||||||||||||
| Undistributed long-term capital gains |
13,026,687 | 1,430,443 | 79,788,891 | 64,995,010 | — | — | 13,242,023 | 100,628,686 | — | |||||||||||||||||||||||||||
| Total undistributed earnings |
$ | 13,026,687 | $ | 1,713,331 | $ | 82,883,683 | $ | 64,995,010 | $ | — | $ | — | $ | 13,242,023 | $ | 100,628,686 | $ | 83,088 | ||||||||||||||||||
| Timing differences (Qualified Late Year Loss Deferral and Post October Losses) |
$ | (7,943,641 | ) | $ | — | $ | (19,382,667 | ) | $ | (51,311,557 | ) | $ | (1,704,716 | ) | $ | (52,598,941 | ) | $ | (5,008,376 | ) | $ | (33,260,798 | ) | $ | (1,441,478 | ) | ||||||||||
| Unrealized gains (losses) — net |
49,703,763 | 6,063,999 | 262,359,708 | 106,182,979 | 237,786 | 29,597,350 | 67,046,991 | 145,480,689 | 1,763,457 | |||||||||||||||||||||||||||
| Total accumulated earnings (losses) net |
$ | 54,786,809 | $ | 7,777,330 | $ | 325,860,724 | $ | 119,866,432 | $ | (1,466,930 | ) | $ | (23,001,591 | ) | $ | 75,280,638 | $ | 212,848,577 | $ | 405,067 | ||||||||||||||||
As of August 31, 2022, the Funds’ aggregate security unrealized gains and losses based on cost for U.S. federal income tax purposes were as follows:
| Concentrated Growth |
Flexible Cap Growth |
Large Cap Core |
Mid Cap Growth |
Small Cap Growth |
Small/Mid Cap Growth |
Strategic Growth |
Technology Opportunities |
U.S. Equity ESG Fund |
||||||||||||||||||||||||||||
| Tax Cost |
$ | 96,363,523 | $ | 34,582,550 | $ | 824,731,072 | $ | 859,011,796 | $ | 31,225,901 | $ | 2,078,303,957 | $ | 76,427,507 | $ | 473,377,669 | $ | 16,524,611 | ||||||||||||||||||
| Gross unrealized gain |
61,206,942 | 8,629,522 | 331,535,904 | 186,390,656 | 3,994,999 | 312,280,685 | 72,086,275 | 221,157,510 | 3,275,609 | |||||||||||||||||||||||||||
| Gross unrealized loss |
(11,503,179 | ) | (2,565,523 | ) | (69,176,196 | ) | (80,207,677 | ) | (3,757,213 | ) | (282,683,335 | ) | (5,039,284 | ) | (75,676,821 | ) | (1,512,152 | ) | ||||||||||||||||||
| Net unrealized gains (losses) |
$ | 49,703,763 | $ | 6,063,999 | $ | 262,359,708 | $ | 106,182,979 | $ | 237,786 | $ | 29,597,350 | $ | 67,046,991 | $ | 145,480,689 | $ | 1,763,457 | ||||||||||||||||||
The difference between GAAP-basis and tax basis unrealized gains (losses) is attributable primarily to wash sales.
The Small Cap Growth and Strategic Growth Funds reclassed $34,334 and $346,931, respectively, from paid-in capital to distributable earnings. In order to present certain components of the Funds’ capital accounts on a tax-basis, certain reclassifications have been recorded to the Funds’ accounts. These reclassifications have no impact on the net asset value of the Funds’ and result primarily from taxable overdistributions and net operating losses.
GSAM has reviewed the Funds’ tax positions for all open tax years (the current and prior three years, as applicable) and has concluded that no provision for income tax is required in the Funds’ financial statements. Such open tax years remain subject to examination and adjustment by tax authorities.
161
GOLDMAN SACHS FUNDAMENTAL EQUITY GROWTH FUNDS
Notes to Financial Statements (continued)
August 31, 2022
| 8. OTHER RISKS |
The Funds’ risks include, but are not limited to, the following:
Foreign and Emerging Countries Risk — Investing in foreign markets may involve special risks and considerations not typically associated with investing in the U.S. Foreign securities may be subject to risk of loss because of more or less foreign government regulation; less public information; less stringent investor protections; less stringent accounting, corporate governance, financial reporting and disclosure standards; and less economic, political and social stability in the countries in which a Fund invests. The imposition of sanctions, exchange controls (including repatriation restrictions), confiscation of assets and property, trade restrictions (including tariffs) and other government restrictions by the U.S. or other governments, or from problems in registration, settlement or custody, may also result in losses. The type and severity of sanctions and other similar measures, including counter sanctions and other retaliatory actions, that may be imposed could vary broadly in scope, and their impact is impossible to predict. For example, the imposition of sanctions and other similar measures could, among other things, cause a decline in the value and/or liquidity of securities issued by the sanctioned country or companies located in or economically tied to the sanctioned country and increase market volatility and disruption in the sanctioned country and throughout the world. Sanctions and other similar measures could limit or prevent a Fund from buying and selling securities (in the sanctioned country and other markets), significantly delay or prevent the settlement of securities transactions, and significantly impact a Fund’s liquidity and performance. Foreign risk also involves the risk of negative foreign currency exchange rate fluctuations, which may cause the value of securities denominated in such foreign currency (or other instruments through which a Fund has exposure to foreign currencies) to decline in value. Currency exchange rates may fluctuate significantly over short periods of time.
Foreign Custody Risk — The Funds invest in foreign securities, and as such the Funds may hold such securities and cash with foreign banks, agents, and securities depositories appointed by the Fund’s custodian (each a “Foreign Custodian”). Some foreign custodians may be recently organized or new to the foreign custody business. In some countries, Foreign Custodians may be subject to little or no regulatory oversight over, or independent evaluation of, their operations. Further, the laws of certain countries may place limitations on a Fund’s ability to recover its assets if a Foreign Custodian enters bankruptcy. Investments in emerging markets may be subject to even greater custody risks than investments in more developed markets. Custody services in emerging market countries are very often undeveloped and may be considerably less well regulated than in more developed countries, and thus may not afford the same level of investor protection as would apply in developed countries.
Industry Concentration Risk — The Technology Opportunities Fund invests primarily in equity investments in high-quality technology, media, or service companies that adopt or use technology to improve their cost structure, revenue opportunities or competitive advantage. Because of its focus on technology, media and service companies, the Technology Opportunities Fund is subject to greater risk of loss as a result of adverse economic, business or other developments than if its investments were diversified across different industry sectors. The Technology Opportunities Fund may also invest in a relatively few number of issuers. Thus, the Technology Opportunities Fund may be more susceptible to adverse developments affecting any single issuer held in its portfolio and may be more susceptible to greater losses because of these developments.
Issuer Concentration Risk — Under normal circumstances, the Concentrated Growth Fund and the U.S. Equity ESG Fund intend to invest in up to approximately 40 and 50 companies, respectively. As a result of the relatively small number of issuers in which a Fund generally invests, it may be subject to greater risks than a fund that invests in a greater number of issuers. A change in the value of any single investment held by a Fund may affect the overall value of the Fund more than it would affect a mutual fund that holds more investments. In particular, a Fund may be more susceptible to adverse developments affecting any single issuer in the Fund and may be susceptible to greater losses because of these developments.
Investments in Other Investment Companies Risk — As a shareholder of another investment company, a Fund will indirectly bear its proportionate share of any net management fees and other expenses paid by such other investment companies, in addition to the fees and expenses regularly borne by the Fund.
Large Shareholder Transactions Risk — A Fund may experience adverse effects when certain large shareholders, such as other funds, institutional investors (including those trading by use of non-discretionary mathematical formulas), financial intermediaries (who may make investment decisions on behalf of underlying clients and/or include a Fund in their investment
162
GOLDMAN SACHS FUNDAMENTAL EQUITY GROWTH FUNDS
| 8. OTHER RISKS (continued) |
model), individuals, accounts and Goldman Sachs affiliates, purchase or redeem large amounts of shares of a Fund. Such large shareholder redemptions, which may occur rapidly or unexpectedly, may cause a Fund to sell portfolio securities at times when it would not otherwise do so, which may negatively impact a Fund’s NAV and liquidity. These transactions may also accelerate the realization of taxable income to shareholders if such sales of investments resulted in gains, and may also increase transaction costs. In addition, a large redemption could result in a Fund’s current expenses being allocated over a smaller asset base, leading to an increase in the Fund’s expense ratio. Similarly, large Fund share purchases may adversely affect a Fund’s performance to the extent that the Fund is delayed in investing new cash or otherwise maintains a larger cash position than it ordinarily would.
Liquidity Risk — A Fund may make investments that are illiquid or that may become less liquid in response to market developments or adverse investor perceptions. Illiquid investments may be more difficult to value. Liquidity risk may also refer to the risk that a Fund will not be able to pay redemption proceeds within the allowable time period or without significant dilution to remaining investors’ interests because of unusual market conditions, an unusually high volume of redemption requests, or other reasons. To meet redemption requests, a Fund may be forced to sell investments at an unfavorable time and/or under unfavorable conditions. If a Fund is forced to sell securities at an unfavorable time and/or under unfavorable conditions, such sales may adversely affect the Fund’s NAV and dilute remaining investors’ interests. These risks may be more pronounced in connection with the Funds’ investments in securities of issuers located in emerging market countries. Redemptions by large shareholders may have a negative impact on a Fund’s liquidity.
Market and Credit Risks — In the normal course of business, a Fund trades financial instruments and enters into financial transactions where risk of potential loss exists due to changes in the market (market risk). The value of the securities in which a Fund invests may go up or down in response to the prospects of individual companies, particular sectors or governments and/or general economic conditions throughout the world due to increasingly interconnected global economies and financial markets. Events such as war, acts of terrorism, social unrest, natural disasters, the spread of infectious illness or other public health threats could also significantly impact a Fund and its investments. Additionally, a Fund may also be exposed to credit risk in the event that an issuer or guarantor fails to perform or that an institution or entity with which the Fund has unsettled or open transactions defaults.
Non-Diversification Risk — The Strategic Growth Fund is non-diversified, meaning that it is permitted to invest a larger percentage of its assets in one or more issuers or in fewer issuers than diversified mutual funds. Thus, the Fund may be more susceptible to adverse developments affecting any single issuer held in its portfolio, and may be more susceptible to greater losses because of these developments.
| 9. INDEMNIFICATIONS |
Under the Trust’s organizational documents, its Trustees, officers, employees and agents are indemnified, to the extent permitted by the Act and state law, against certain liabilities that may arise out of performance of their duties to the Funds. Additionally, in the course of business, the Funds enter into contracts that contain a variety of indemnification clauses. The Funds’ maximum exposure under these arrangements is unknown, as this would involve future claims that may be made against the Funds that have not yet occurred. However, GSAM believes the risk of loss under these arrangements to be remote.
| 10. OTHER MATTERS |
Effective after the close of business on April 13, 2022, the Goldman Sachs Capital Growth Fund’s name changed to “Goldman Sachs Large Cap Core Fund” and the Goldman Sachs Growth Opportunities Fund’s name changed to the “Goldman Sachs Mid Cap Growth Fund.”
Effective after the close of business on June 10, 2022, the Goldman Sachs Mid Cap Growth Fund completed a 24-for-1 reverse share split in which shareholders of record for Class C Shares received 1 share for every 24 shares outstanding and the Goldman Sachs Strategic Growth Fund completed a 3-for-1 reverse share split in which shareholders of record for Class C Shares received 1 share for every 3 shares outstanding.
163
GOLDMAN SACHS FUNDAMENTAL EQUITY GROWTH FUNDS
Notes to Financial Statements (continued)
August 31, 2022
| 11. SUBSEQUENT EVENTS |
Subsequent events after the Statements of Assets and Liabilities date have been evaluated, and GSAM has concluded that there is no impact requiring adjustment or disclosure in the financial statements.
164
GOLDMAN SACHS FUNDAMENTAL EQUITY GROWTH FUNDS
| 12. SUMMARY OF SHARE TRANSACTIONS |
Share activity is as follows:
| Concentrated Growth Fund | ||||||||||||||||
|
|
|
|||||||||||||||
| For the Fiscal Year Ended August 31, 2022 |
For the Fiscal Year Ended August 31, 2021 |
|||||||||||||||
|
|
|
|||||||||||||||
| Shares | Dollars | Shares | Dollars | |||||||||||||
|
|
|
|||||||||||||||
| Class A Shares |
| |||||||||||||||
| Shares sold |
53,567 | $ | 1,088,740 | 59,704 | $ | 1,382,411 | ||||||||||
| Reinvestment of distributions |
76,592 | 1,722,556 | 23,289 | 511,420 | ||||||||||||
| Shares redeemed |
(85,090 | ) | (1,649,644 | ) | (68,834 | ) | (1,616,717 | ) | ||||||||
| 45,069 | 1,161,652 | 14,159 | 277,114 | |||||||||||||
| Class C Shares | ||||||||||||||||
| Shares sold |
2,658 | 48,448 | 15,276 | 268,005 | ||||||||||||
| Reinvestment of distributions |
13,210 | 205,023 | 5,634 | 92,741 | ||||||||||||
| Shares redeemed |
(15,263 | ) | (253,854 | ) | (37,977 | ) | (660,721 | ) | ||||||||
| 605 | (383 | ) | (17,067 | ) | (299,975 | ) | ||||||||||
| Institutional Shares | ||||||||||||||||
| Shares sold |
28,933 | 755,020 | 44,169 | 1,074,773 | ||||||||||||
| Reinvestment of distributions |
91,553 | 2,303,473 | 32,623 | 784,250 | ||||||||||||
| Shares redeemed |
(159,711 | ) | (3,830,270 | ) | (72,734 | ) | (1,848,235 | ) | ||||||||
| (39,225 | ) | (771,777 | ) | 4,058 | 10,788 | |||||||||||
| Investor Shares | ||||||||||||||||
| Shares sold |
1,877 | 43,726 | 2,523 | 63,003 | ||||||||||||
| Reinvestment of distributions |
1,602 | 37,303 | 548 | 12,344 | ||||||||||||
| Shares redeemed |
(4,525 | ) | (112,181 | ) | (682 | ) | (16,167 | ) | ||||||||
| (1,046 | ) | (31,152 | ) | 2,389 | 59,180 | |||||||||||
| Class R6 Shares | ||||||||||||||||
| Shares sold |
11,408 | 255,940 | 23,259 | 671,356 | ||||||||||||
| Reinvestment of distributions |
7,152 | 179,377 | 1,903 | 45,645 | ||||||||||||
| Shares redeemed |
(26,454 | ) | (679,512 | ) | (7,929 | ) | (206,454 | ) | ||||||||
| (7,894 | ) | (244,195 | ) | 17,233 | 510,547 | |||||||||||
| Class R Shares | ||||||||||||||||
| Reinvestment of distributions |
361 | 7,600 | 104 | 2,170 | ||||||||||||
| 361 | 7,600 | 104 | 2,170 | |||||||||||||
| Class P Shares | ||||||||||||||||
| Shares sold |
289,419 | 6,520,791 | 445,789 | 11,719,010 | ||||||||||||
| Reinvestment of distributions |
1,180,520 | 29,595,626 | 389,427 | 9,334,560 | ||||||||||||
| Shares redeemed |
(966,546 | ) | (22,051,983 | ) | (984,468 | ) | (25,252,775 | ) | ||||||||
| 503,393 | 14,064,434 | (149,252 | ) | (4,199,205 | ) | |||||||||||
| NET INCREASE (DECREASE) |
501,263 | $ | 14,186,179 | (128,376 | ) | $ | (3,639,381 | ) | ||||||||
165
GOLDMAN SACHS FUNDAMENTAL EQUITY GROWTH FUNDS
Notes to Financial Statements (continued)
August 31, 2022
| 12. SUMMARY OF SHARE TRANSACTIONS (continued) |
| Flexible Cap Fund | ||||||||||||||||
|
|
|
|||||||||||||||
| For the Fiscal Year Ended August 31, 2022 |
For the Fiscal Year Ended August 31, 2021 |
|||||||||||||||
|
|
|
|||||||||||||||
| Shares | Dollars | Shares | Dollars | |||||||||||||
|
|
|
|||||||||||||||
| Class A Shares | ||||||||||||||||
| Shares sold |
86,701 | $ | 1,308,177 | 77,961 | $ | 1,153,418 | ||||||||||
| Reinvestment of distributions |
29,159 | 475,373 | 25,327 | 348,337 | ||||||||||||
| Shares redeemed |
(66,180 | ) | (999,821 | ) | (92,841 | ) | (1,391,459 | ) | ||||||||
| 49,680 | 783,729 | 10,447 | 110,296 | |||||||||||||
| Class C Shares | ||||||||||||||||
| Shares sold |
6,202 | 77,699 | 4,591 | 55,263 | ||||||||||||
| Reinvestment of distributions |
6,887 | 92,555 | 6,672 | 76,792 | ||||||||||||
| Shares redeemed |
(31,760 | ) | (387,807 | ) | (45,543 | ) | (537,786 | ) | ||||||||
| (18,671 | ) | (217,553 | ) | (34,280 | ) | (405,731 | ) | |||||||||
| Institutional Shares | ||||||||||||||||
| Shares sold |
607,045 | 9,859,567 | 216,397 | 3,614,754 | ||||||||||||
| Reinvestment of distributions |
16,818 | 302,451 | 2,015 | 30,388 | ||||||||||||
| Shares redeemed |
(298,420 | ) | (4,678,195 | ) | (14,758 | ) | (245,782 | ) | ||||||||
| 325,443 | 5,483,823 | 203,654 | 3,399,360 | |||||||||||||
| Investor Shares | ||||||||||||||||
| Shares sold |
82,952 | 1,225,235 | 347 | 5,740 | ||||||||||||
| Reinvestment of distributions |
180 | 3,157 | 146 | 2,137 | ||||||||||||
| Shares redeemed |
(81,599 | ) | (1,243,386 | ) | (195 | ) | (3,241 | ) | ||||||||
| 1,533 | (14,994 | ) | 298 | 4,636 | ||||||||||||
| Class R6 Shares | ||||||||||||||||
| Shares sold |
143,395 | 2,292,856 | 3,364 | 58,461 | ||||||||||||
| Reinvestment of distributions |
1,205 | 21,620 | 864 | 13,001 | ||||||||||||
| Shares redeemed |
(29,685 | ) | (482,788 | ) | (1,270 | ) | (20,316 | ) | ||||||||
| 114,915 | 1,831,688 | 2,958 | 51,146 | |||||||||||||
| Class R Shares | ||||||||||||||||
| Shares sold |
71 | 1,003 | 140 | 1,940 | ||||||||||||
| Reinvestment of distributions |
45 | 700 | 226 | 2,962 | ||||||||||||
| Shares redeemed |
(2,226 | ) | (36,968 | ) | (1,243 | ) | (19,919 | ) | ||||||||
| (2,110 | ) | (35,265 | ) | (877 | ) | (15,017 | ) | |||||||||
| Class P Shares | ||||||||||||||||
| Shares sold |
196,463 | 3,310,822 | 282,586 | 4,592,100 | ||||||||||||
| Reinvestment of distributions |
84,124 | 1,510,289 | 57,745 | 868,916 | ||||||||||||
| Shares redeemed |
(180,247 | ) | (3,025,062 | ) | (24,712 | ) | (386,802 | ) | ||||||||
| 100,340 | 1,796,049 | 315,619 | 5,074,214 | |||||||||||||
| NET INCREASE |
571,130 | $ | 9,627,477 | 497,819 | $ | 8,218,904 | ||||||||||
166
GOLDMAN SACHS FUNDAMENTAL EQUITY GROWTH FUNDS
| 12. SUMMARY OF SHARE TRANSACTIONS (continued) |
| Large Cap Core Fund | ||||||||||||||||
|
|
|
|||||||||||||||
| For the Fiscal Year Ended August 31, 2022 |
For the Fiscal Year Ended August 31, 2021 |
|||||||||||||||
|
|
|
|||||||||||||||
| Shares | Dollars | Shares | Dollars | |||||||||||||
|
|
|
|||||||||||||||
| Class A Shares |
| |||||||||||||||
| Shares sold |
667,747 | $ | 20,190,513 | 886,562 | $ | 26,514,670 | ||||||||||
| Reinvestment of distributions |
2,895,207 | 90,127,566 | 1,027,840 | 28,452,549 | ||||||||||||
| Shares redeemed |
(2,656,235 | ) | (78,546,761 | ) | (2,757,413 | ) | (81,210,223 | ) | ||||||||
| 906,719 | 31,771,318 | (843,011 | ) | (26,243,004 | ) | |||||||||||
| Class C Shares | ||||||||||||||||
| Shares sold |
229,724 | 3,836,698 | 393,978 | 6,814,811 | ||||||||||||
| Reinvestment of distributions |
226,391 | 3,735,452 | 58,241 | 934,178 | ||||||||||||
| Shares redeemed |
(324,671 | ) | (5,084,104 | ) | (421,568 | ) | (7,092,696 | ) | ||||||||
| 131,444 | 2,488,046 | 30,651 | 656,293 | |||||||||||||
| Institutional Shares | ||||||||||||||||
| Shares sold |
898,942 | 32,040,143 | 1,341,028 | 46,329,321 | ||||||||||||
| Reinvestment of distributions |
234,186 | 8,634,427 | 61,338 | 1,978,574 | ||||||||||||
| Shares redeemed |
(1,086,991 | ) | (37,991,615 | ) | (507,792 | ) | (17,806,383 | ) | ||||||||
| 46,137 | 2,682,955 | 894,574 | 30,501,512 | |||||||||||||
| Service Shares | ||||||||||||||||
| Shares sold |
5,517 | 171,167 | 10,248 | 297,051 | ||||||||||||
| Reinvestment of distributions |
8,063 | 235,186 | 2,075 | 54,101 | ||||||||||||
| Shares redeemed |
(60,112 | ) | (1,791,062 | ) | (17,229 | ) | (426,311 | ) | ||||||||
| (46,532 | ) | (1,384,709 | ) | (4,906 | ) | (75,159 | ) | |||||||||
| Investor Shares | ||||||||||||||||
| Shares sold |
878,949 | 26,913,189 | 356,199 | 11,219,002 | ||||||||||||
| Reinvestment of distributions |
73,468 | 2,350,236 | 13,102 | 371,777 | ||||||||||||
| Shares redeemed |
(226,172 | ) | (6,689,283 | ) | (62,949 | ) | (1,957,912 | ) | ||||||||
| 726,245 | 22,574,142 | 306,352 | 9,632,867 | |||||||||||||
| Class R6 Shares | ||||||||||||||||
| Shares sold |
2,428,309 | 97,648,617 | 160,137 | 5,589,483 | ||||||||||||
| Reinvestment of distributions |
221,102 | 8,138,748 | 2,625 | 84,554 | ||||||||||||
| Shares redeemed |
(325,582 | ) | (11,025,490 | ) | (23,660 | ) | (826,105 | ) | ||||||||
| 2,323,829 | 94,761,875 | 139,102 | 4,847,932 | |||||||||||||
| Class R Shares | ||||||||||||||||
| Shares sold |
61,134 | 1,698,179 | 66,611 | 1,874,883 | ||||||||||||
| Reinvestment of distributions |
40,508 | 1,171,910 | 14,679 | 380,562 | ||||||||||||
| Shares redeemed |
(156,317 | ) | (4,410,724 | ) | (88,336 | ) | (2,396,082 | ) | ||||||||
| (54,675 | ) | (1,540,635 | ) | (7,046 | ) | (140,637 | ) | |||||||||
| Class P Shares | ||||||||||||||||
| Shares sold |
238,990 | 8,299,959 | 330,332 | 11,435,266 | ||||||||||||
| Reinvestment of distributions |
309,640 | 11,394,754 | 110,152 | 3,547,586 | ||||||||||||
| Shares redeemed |
(346,687 | ) | (11,882,277 | ) | (175,655 | ) | (6,045,952 | ) | ||||||||
| 201,943 | 7,812,436 | 264,829 | 8,936,900 | |||||||||||||
| NET INCREASE |
4,235,110 | $ | 159,165,428 | 780,545 | $ | 28,116,704 | ||||||||||
167
GOLDMAN SACHS FUNDAMENTAL EQUITY GROWTH FUNDS
Notes to Financial Statements (continued)
August 31, 2022
| 12. SUMMARY OF SHARE TRANSACTIONS (continued) |
| Mid Cap Growth Fund | ||||||||||||||||
|
|
|
|||||||||||||||
| For the Fiscal Year Ended August 31, 2022 |
For the Fiscal Year Ended August 31, 2021 |
|||||||||||||||
|
|
|
|||||||||||||||
| Shares | Dollars | Shares | Dollars | |||||||||||||
|
|
|
|||||||||||||||
| Class A Shares |
| |||||||||||||||
| Shares sold |
2,865,919 | $ | 38,744,563 | 4,411,800 | $ | 73,944,026 | ||||||||||
| Reinvestment of distributions |
4,501,447 | 63,515,418 | 4,768,671 | 74,105,140 | ||||||||||||
| Shares redeemed |
(5,818,501 | ) | (78,844,257 | ) | (7,210,263 | ) | (120,846,872 | ) | ||||||||
| 1,548,865 | 23,415,724 | 1,970,208 | 27,202,294 | |||||||||||||
| Class C Shares | ||||||||||||||||
| Shares sold |
1,773,844 | 2,984,355 | 731,025 | 3,090,651 | ||||||||||||
| Reinvestment of distributions |
16,943,845 | 15,588,337 | 4,148,159 | 15,265,226 | ||||||||||||
| Shares redeemed |
(4,897,665 | ) | (7,458,721 | ) | (3,696,232 | ) | (15,936,397 | ) | ||||||||
| Shares reduced by reverse share split |
(18,491,042 | ) | — | — | — | |||||||||||
| (4,671,018 | ) | 11,113,971 | 1,182,952 | 2,419,480 | ||||||||||||
| Institutional Shares | ||||||||||||||||
| Shares sold |
4,002,806 | 78,454,077 | 3,347,250 | 81,088,034 | ||||||||||||
| Reinvestment of distributions |
2,183,145 | 48,400,319 | 2,934,286 | 66,696,305 | ||||||||||||
| Shares redeemed |
(6,074,741 | ) | (121,921,904 | ) | (7,270,958 | ) | (175,144,044 | ) | ||||||||
| 111,210 | 4,932,492 | (989,422 | ) | (27,359,705 | ) | |||||||||||
| Service Shares | ||||||||||||||||
| Shares sold |
315,191 | 3,580,580 | 339,162 | 5,113,887 | ||||||||||||
| Reinvestment of distributions |
528,155 | 6,332,584 | 523,212 | 7,141,844 | ||||||||||||
| Shares redeemed |
(661,619 | ) | (7,354,326 | ) | (577,657 | ) | (8,445,644 | ) | ||||||||
| 181,727 | 2,558,838 | 284,717 | 3,810,087 | |||||||||||||
| Investor Shares | ||||||||||||||||
| Shares sold |
638,441 | 9,842,010 | 924,701 | 17,746,694 | ||||||||||||
| Reinvestment of distributions |
955,153 | 15,664,510 | 1,022,341 | 17,952,306 | ||||||||||||
| Shares redeemed |
(1,221,717 | ) | (18,851,136 | ) | (1,143,338 | ) | (21,685,235 | ) | ||||||||
| 371,877 | 6,655,384 | 803,704 | 14,013,765 | |||||||||||||
| Class R6 Shares | ||||||||||||||||
| Shares sold |
1,423,855 | 28,208,823 | 2,314,802 | 56,501,509 | ||||||||||||
| Reinvestment of distributions |
1,333,749 | 29,622,564 | 1,443,405 | 32,851,908 | ||||||||||||
| Shares redeemed |
(1,892,491 | ) | (39,014,067 | ) | (2,181,156 | ) | (53,150,885 | ) | ||||||||
| 865,113 | 18,817,320 | 1,577,051 | 36,202,532 | |||||||||||||
| Class R Shares | ||||||||||||||||
| Shares sold |
716,459 | 7,939,787 | 576,764 | 8,612,699 | ||||||||||||
| Reinvestment of distributions |
828,335 | 9,948,299 | 885,453 | 12,112,994 | ||||||||||||
| Shares redeemed |
(1,417,620 | ) | (16,478,339 | ) | (1,165,474 | ) | (17,196,429 | ) | ||||||||
| 127,174 | 1,409,747 | 296,743 | 3,529,264 | |||||||||||||
| Class P Shares | ||||||||||||||||
| Shares sold |
360,167 | 7,650,531 | 598,466 | 14,037,916 | ||||||||||||
| Reinvestment of distributions |
482,933 | 10,730,775 | 594,960 | 13,547,235 | ||||||||||||
| Shares redeemed |
(1,308,156 | ) | (23,825,315 | ) | (787,397 | ) | (18,758,640 | ) | ||||||||
| (465,056 | ) | (5,444,009 | ) | 406,029 | 8,826,511 | |||||||||||
| NET INCREASE (DECREASE) |
(1,930,108 | ) | $ | 63,459,467 | 5,531,982 | $ | 68,644,228 | |||||||||
168
GOLDMAN SACHS FUNDAMENTAL EQUITY GROWTH FUNDS
| 12. SUMMARY OF SHARE TRANSACTIONS (continued) |
| Small Cap Growth Fund | ||||||||||||||||
|
|
|
|||||||||||||||
| For the Fiscal Year Ended August 31, 2022 |
For the Fiscal Year Ended August 31, 2021 |
|||||||||||||||
|
|
|
|||||||||||||||
| Shares | Dollars | Shares | Dollars | |||||||||||||
|
|
|
|||||||||||||||
| Class A Shares |
| |||||||||||||||
| Shares sold |
6,253 | $ | 86,930 | 38,347 | $ | 615,981 | ||||||||||
| Reinvestment of distributions |
3,949 | 56,194 | 1,558 | 22,970 | ||||||||||||
| Shares redeemed |
(9,371 | ) | (146,925 | ) | (14,010 | ) | (227,968 | ) | ||||||||
| 831 | (3,801 | ) | 25,895 | 410,983 | ||||||||||||
| Class C Shares | ||||||||||||||||
| Shares sold |
203 | 3,400 | 1,747 | 29,026 | ||||||||||||
| Reinvestment of distributions |
834 | 11,684 | 562 | 8,216 | ||||||||||||
| Shares redeemed |
(1,553 | ) | (18,917 | ) | (2,330 | ) | (38,703 | ) | ||||||||
| (516 | ) | (3,833 | ) | (21 | ) | (1,461 | ) | |||||||||
| Institutional Shares | ||||||||||||||||
| Shares sold |
987,112 | 13,306,036 | 266,393 | 4,401,259 | ||||||||||||
| Reinvestment of distributions |
117,713 | 1,688,009 | 64,374 | 953,009 | ||||||||||||
| Shares redeemed |
(292,642 | ) | (4,136,059 | ) | (306,862 | ) | (4,793,015 | ) | ||||||||
| 812,183 | 10,857,986 | 23,905 | 561,253 | |||||||||||||
| Investor Shares | ||||||||||||||||
| Reinvestment of distributions |
599 | 8,566 | 379 | 5,612 | ||||||||||||
| 599 | 8,566 | 379 | 5,612 | |||||||||||||
| Class R6 Shares | ||||||||||||||||
| Reinvestment of distributions |
598 | 8,574 | 383 | 5,676 | ||||||||||||
| 598 | 8,574 | 383 | 5,676 | |||||||||||||
| Class R Shares | ||||||||||||||||
| Reinvestment of distributions |
604 | 8,551 | 374 | 5,508 | ||||||||||||
| 604 | 8,551 | 374 | 5,508 | |||||||||||||
| Class P Shares | ||||||||||||||||
| Shares sold |
940,438 | 11,671,702 | 191,038 | 3,176,265 | ||||||||||||
| Reinvestment of distributions |
44,356 | 635,615 | 16,894 | 250,100 | ||||||||||||
| Shares redeemed |
(276,273 | ) | (3,271,244 | ) | (113,387 | ) | (1,774,800 | ) | ||||||||
| 708,521 | 9,036,073 | 94,545 | 1,651,565 | |||||||||||||
| NET INCREASE |
1,522,820 | $ | 19,912,116 | 145,460 | $ | 2,639,136 | ||||||||||
169
GOLDMAN SACHS FUNDAMENTAL EQUITY GROWTH FUNDS
Notes to Financial Statements (continued)
August 31, 2022
| 12. SUMMARY OF SHARE TRANSACTIONS (continued) |
| Small/Mid Cap Growth Fund | ||||||||||||||||
|
|
|
|||||||||||||||
| For the Fiscal Year Ended August 31, 2022 |
For the Fiscal Year Ended August 31, 2021 |
|||||||||||||||
|
|
|
|||||||||||||||
| Shares | Dollars | Shares | Dollars | |||||||||||||
|
|
|
|||||||||||||||
| Class A Shares |
| |||||||||||||||
| Shares sold |
3,114,189 | $ | 67,281,714 | 4,740,101 | $ | 123,361,276 | ||||||||||
| Reinvestment of distributions |
2,552,550 | 57,508,951 | 1,836,091 | 44,874,070 | ||||||||||||
| Shares redeemed |
(6,084,176 | ) | (121,086,582 | ) | (3,086,393 | ) | (80,138,991 | ) | ||||||||
| (417,437 | ) | 3,704,083 | 3,489,799 | 88,096,355 | ||||||||||||
| Class C Shares |
| |||||||||||||||
| Shares sold |
645,289 | 10,470,670 | 845,766 | 16,778,281 | ||||||||||||
| Reinvestment of distributions |
1,511,992 | 24,055,787 | 1,601,630 | 29,518,042 | ||||||||||||
| Shares redeemed |
(2,672,344 | ) | (40,083,086 | ) | (3,859,120 | ) | (76,651,705 | ) | ||||||||
| (515,063 | ) | (5,556,629 | ) | (1,411,724 | ) | (30,355,382 | ) | |||||||||
| Institutional Shares |
| |||||||||||||||
| Shares sold |
14,692,296 | 359,746,220 | 12,680,064 | 370,172,898 | ||||||||||||
| Reinvestment of distributions |
5,180,749 | 134,336,818 | 4,377,026 | 120,455,750 | ||||||||||||
| Shares redeemed |
(18,792,831 | ) | (423,747,448 | ) | (11,564,824 | ) | (338,002,572 | ) | ||||||||
| 1,080,214 | 70,335,590 | 5,492,266 | 152,626,076 | |||||||||||||
| Service Shares |
| |||||||||||||||
| Shares sold |
9,072 | 178,528 | 1,594,414 | 35,391,326 | ||||||||||||
| Reinvestment of distributions |
7,201 | 152,880 | 260,883 | 6,070,740 | ||||||||||||
| Shares redeemed |
(783,639 | ) | (21,409,133 | ) | (2,434,431 | ) | (60,424,848 | ) | ||||||||
| (767,366 | ) | (21,077,725 | ) | (579,134 | ) | (18,962,782 | ) | |||||||||
| Investor Shares |
| |||||||||||||||
| Shares sold |
8,827,310 | 204,480,247 | 10,541,900 | 296,328,064 | ||||||||||||
| Reinvestment of distributions |
4,273,625 | 104,404,651 | 2,963,694 | 77,470,953 | ||||||||||||
| Shares redeemed |
(16,873,637 | ) | (371,994,242 | ) | (6,490,683 | ) | (179,213,509 | ) | ||||||||
| (3,772,702 | ) | (63,109,344 | ) | 7,014,911 | 194,585,508 | |||||||||||
| Class R6 Shares |
| |||||||||||||||
| Shares sold |
4,742,519 | 114,758,803 | 2,174,127 | 64,179,364 | ||||||||||||
| Reinvestment of distributions |
649,318 | 16,856,287 | 431,371 | 11,884,258 | ||||||||||||
| Shares redeemed |
(1,807,490 | ) | (40,785,853 | ) | (1,072,329 | ) | (31,492,709 | ) | ||||||||
| 3,584,347 | 90,829,237 | 1,533,169 | 44,570,913 | |||||||||||||
| Class R Shares |
| |||||||||||||||
| Shares sold |
178,972 | 3,494,317 | 221,459 | 5,420,426 | ||||||||||||
| Reinvestment of distributions |
97,930 | 2,031,076 | 98,410 | 2,247,682 | ||||||||||||
| Shares redeemed |
(244,897 | ) | (4,750,679 | ) | (352,609 | ) | (8,610,079 | ) | ||||||||
| 32,005 | 774,714 | (32,740 | ) | (941,971 | ) | |||||||||||
| Class P Shares |
| |||||||||||||||
| Shares sold |
6,249,224 | 150,630,169 | 8,073,333 | 238,055,318 | ||||||||||||
| Reinvestment of distributions |
2,843,288 | 73,840,186 | 1,705,056 | 46,974,296 | ||||||||||||
| Shares redeemed |
(10,381,385 | ) | (224,248,462 | ) | (1,882,850 | ) | (54,615,458 | ) | ||||||||
| (1,288,873 | ) | 221,893 | 7,895,539 | 230,414,156 | ||||||||||||
| NET INCREASE (DECREASE) |
(2,064,875 | ) | $ | 76,121,819 | 23,402,086 | $ | 660,032,873 | |||||||||
170
GOLDMAN SACHS FUNDAMENTAL EQUITY GROWTH FUNDS
| 12. SUMMARY OF SHARE TRANSACTIONS (continued) |
| Strategic Growth Fund | ||||||||||||||||
|
|
|
|||||||||||||||
| For the Fiscal Year Ended August 31, 2022 |
For the Fiscal Year Ended August 31, 2021 |
|||||||||||||||
|
|
|
|||||||||||||||
| Shares | Dollars | Shares | Dollars | |||||||||||||
|
|
|
|||||||||||||||
| Class A Shares |
| |||||||||||||||
| Shares sold |
839,300 | $ | 8,591,829 | 2,211,800 | $ | 23,109,951 | ||||||||||
| Reinvestment of distributions |
706,291 | 7,599,696 | 539,120 | 5,353,462 | ||||||||||||
| Shares redeemed |
(2,490,756 | ) | (23,637,155 | ) | (854,990 | ) | (9,373,663 | ) | ||||||||
| (945,165 | ) | (7,445,630 | ) | 1,895,930 | 19,089,750 | |||||||||||
| Class C Shares |
| |||||||||||||||
| Shares sold |
164,639 | 877,411 | 146,125 | 896,160 | ||||||||||||
| Reinvestment of distributions |
182,565 | 870,836 | 242,301 | 1,240,583 | ||||||||||||
| Shares redeemed |
(327,266 | ) | (1,711,392 | ) | (453,098 | ) | (2,538,075 | ) | ||||||||
| Shares reduced by reverse share split |
(435,313 | ) | — | — | — | |||||||||||
| (415,375 | ) | 36,855 | (64,672 | ) | (401,332 | ) | ||||||||||
| Institutional Shares |
| |||||||||||||||
| Shares sold |
744,668 | 8,859,222 | 471,239 | 5,959,408 | ||||||||||||
| Reinvestment of distributions |
471,290 | 6,098,498 | 651,729 | 7,599,286 | ||||||||||||
| Shares redeemed |
(1,511,298 | ) | (17,831,363 | ) | (1,480,003 | ) | (18,734,640 | ) | ||||||||
| (295,340 | ) | (2,873,643 | ) | (357,035 | ) | (5,175,946 | ) | |||||||||
| Service Shares |
| |||||||||||||||
| Shares sold |
19,795 | 219,302 | 10,660 | 112,383 | ||||||||||||
| Reinvestment of distributions |
8,242 | 85,719 | 8,193 | 79,067 | ||||||||||||
| Shares redeemed |
(11,155 | ) | (127,012 | ) | (12,805 | ) | (128,377 | ) | ||||||||
| 16,882 | 178,009 | 6,048 | 63,073 | |||||||||||||
| Investor Shares |
| |||||||||||||||
| Shares sold |
179,540 | 2,060,532 | 71,697 | 904,045 | ||||||||||||
| Reinvestment of distributions |
28,316 | 363,863 | 32,993 | 382,724 | ||||||||||||
| Shares redeemed |
(89,595 | ) | (988,792 | ) | (95,477 | ) | (1,200,916 | ) | ||||||||
| 118,261 | 1,435,603 | 9,213 | 85,853 | |||||||||||||
| Class R6 Shares |
| |||||||||||||||
| Shares sold |
368,358 | 4,723,565 | 22,517 | 276,660 | ||||||||||||
| Reinvestment of distributions |
3,679 | 47,491 | 5,037 | 58,588 | ||||||||||||
| Shares redeemed |
(30,112 | ) | (363,709 | ) | (12,605 | ) | (160,196 | ) | ||||||||
| 341,925 | 4,407,347 | 14,949 | 175,052 | |||||||||||||
| Class R Shares |
| |||||||||||||||
| Shares sold |
1,538 | 14,236 | 13,998 | 137,988 | ||||||||||||
| Reinvestment of distributions |
2,846 | 28,431 | 720 | 6,717 | ||||||||||||
| Shares redeemed |
(62 | ) | (594 | ) | (2,423 | ) | (26,842 | ) | ||||||||
| 4,322 | 42,073 | 12,295 | 117,863 | |||||||||||||
| Class P Shares | ||||||||||||||||
| Shares sold |
207,968 | 2,331,844 | 391,470 | 4,905,669 | ||||||||||||
| Reinvestment of distributions |
731,810 | 9,425,707 | 919,738 | 10,678,494 | ||||||||||||
| Shares redeemed |
(967,911 | ) | (10,784,729 | ) | (1,140,145 | ) | (14,135,820 | ) | ||||||||
| (28,133 | ) | 972,822 | 171,063 | 1,448,343 | ||||||||||||
| NET INCREASE (DECREASE) |
(1,202,623 | ) | $ | (3,246,564 | ) | 1,687,791 | $ | 15,402,656 | ||||||||
171
GOLDMAN SACHS FUNDAMENTAL EQUITY GROWTH FUNDS
Notes to Financial Statements (continued)
August 31, 2022
| 12. SUMMARY OF SHARE TRANSACTIONS (continued) |
| Technology Opportunities Fund | ||||||||||||||||
|
|
|
|||||||||||||||
| For the Fiscal Year Ended August 31, 2022 |
For the Fiscal Year Ended August 31, 2021 |
|||||||||||||||
|
|
|
|||||||||||||||
| Shares | Dollars | Shares | Dollars | |||||||||||||
|
|
|
|||||||||||||||
| Class A Shares | ||||||||||||||||
| Shares sold |
1,687,062 | $ | 42,565,183 | 1,409,437 | $ | 42,207,117 | ||||||||||
| Reinvestment of distributions |
2,422,496 | 69,549,872 | 1,253,567 | 34,974,532 | ||||||||||||
| Shares redeemed |
(2,891,477 | ) | (76,452,357 | ) | (2,731,899 | ) | (82,269,590 | ) | ||||||||
| 1,218,081 | 35,662,698 | (68,895 | ) | (5,087,941 | ) | |||||||||||
| Class C Shares | ||||||||||||||||
| Shares sold |
235,539 | 3,906,159 | 175,693 | 3,723,127 | ||||||||||||
| Reinvestment of distributions |
318,359 | 5,845,080 | 172,234 | 3,368,893 | ||||||||||||
| Shares redeemed |
(414,959 | ) | (6,928,923 | ) | (592,805 | ) | (12,389,857 | ) | ||||||||
| 138,939 | 2,822,316 | (244,878 | ) | (5,297,837 | ) | |||||||||||
| Institutional Shares | ||||||||||||||||
| Shares sold |
944,827 | 29,735,429 | 1,305,235 | 45,946,399 | ||||||||||||
| Reinvestment of distributions |
634,728 | 22,139,319 | 340,510 | 11,192,560 | ||||||||||||
| Shares redeemed |
(2,359,252 | ) | (75,415,515 | ) | (1,589,060 | ) | (55,801,050 | ) | ||||||||
| (779,697 | ) | (23,540,767 | ) | 56,685 | 1,337,909 | |||||||||||
| Service Shares | ||||||||||||||||
| Shares sold |
114,091 | 2,817,967 | 229,563 | 6,509,328 | ||||||||||||
| Reinvestment of distributions |
72,669 | 1,988,963 | 123,618 | 3,320,385 | ||||||||||||
| Shares redeemed |
(917,371 | ) | (29,623,509 | ) | (632,428 | ) | (17,980,339 | ) | ||||||||
| (730,611 | ) | (24,816,579 | ) | (279,247 | ) | (8,150,626 | ) | |||||||||
| Investor Shares | ||||||||||||||||
| Shares sold |
276,365 | 8,380,247 | 324,085 | 10,955,177 | ||||||||||||
| Reinvestment of distributions |
161,194 | 5,462,866 | 124,715 | 3,999,623 | ||||||||||||
| Shares redeemed |
(406,065 | ) | (11,600,332 | ) | (855,462 | ) | (29,665,721 | ) | ||||||||
| 31,494 | 2,242,781 | (406,662 | ) | (14,710,921 | ) | |||||||||||
| Class R6 Shares | ||||||||||||||||
| Shares sold |
1,984,304 | 49,192,635 | 37,303 | 1,390,131 | ||||||||||||
| Reinvestment of distributions |
13,225 | 461,688 | 3,436 | 113,026 | ||||||||||||
| Shares redeemed |
(94,205 | ) | (2,474,371 | ) | (3,532 | ) | (130,198 | ) | ||||||||
| 1,903,324 | 47,179,952 | 37,207 | 1,372,959 | |||||||||||||
| Class P Shares | ||||||||||||||||
| Shares sold |
1,823,373 | 55,616,357 | 1,708,880 | 60,358,228 | ||||||||||||
| Reinvestment of distributions |
551,924 | 19,267,650 | 178,139 | 5,859,003 | ||||||||||||
| Shares redeemed |
(2,128,728 | ) | (62,268,189 | ) | (222,473 | ) | (7,857,580 | ) | ||||||||
| 246,569 | 12,615,818 | 1,664,546 | 58,359,651 | |||||||||||||
| NET INCREASE |
2,028,099 | $ | 52,166,219 | 758,756 | $ | 27,823,194 | ||||||||||
172
GOLDMAN SACHS FUNDAMENTAL EQUITY GROWTH FUNDS
| 12. SUMMARY OF SHARE TRANSACTIONS (continued) |
| U.S. Equity ESG Fund | ||||||||||||||||
|
|
|
|||||||||||||||
| For the Fiscal Year Ended August 31, 2022 |
For the Fiscal Year Ended August 31, 2021 |
|||||||||||||||
|
|
|
|||||||||||||||
| Shares | Dollars | Shares | Dollars | |||||||||||||
|
|
|
|||||||||||||||
| Class A Shares | ||||||||||||||||
| Shares sold |
100,303 | $ | 1,667,025 | 36,027 | $ | 602,085 | ||||||||||
| Reinvestment of distributions |
7,594 | 142,682 | 40,274 | 600,840 | ||||||||||||
| Shares redeemed |
(61,195 | ) | (1,001,721 | ) | (35,495 | ) | (577,139 | ) | ||||||||
| 46,702 | 807,986 | 40,806 | 625,786 | |||||||||||||
| Class C Shares | ||||||||||||||||
| Shares sold |
18,178 | 257,621 | 3,032 | 45,968 | ||||||||||||
| Reinvestment of distributions |
2,559 | 44,937 | 15,158 | 212,062 | ||||||||||||
| Shares redeemed |
(58,247 | ) | (849,110 | ) | (15,176 | ) | (237,192 | ) | ||||||||
| (37,510 | ) | (546,552 | ) | 3,014 | 20,838 | |||||||||||
| Institutional Shares | ||||||||||||||||
| Shares sold |
754,988 | 14,872,119 | 33,976 | 560,242 | ||||||||||||
| Reinvestment of distributions |
15,067 | 287,217 | 3,494 | 52,836 | ||||||||||||
| Shares redeemed |
(777,636 | ) | (13,906,355 | ) | (846 | ) | (14,980 | ) | ||||||||
| (7,581 | ) | 1,252,981 | 36,624 | 598,098 | ||||||||||||
| Investor Shares | ||||||||||||||||
| Shares sold |
41,836 | 782,804 | 24,270 | 427,247 | ||||||||||||
| Reinvestment of distributions |
1,640 | 31,256 | 2,516 | 38,039 | ||||||||||||
| Shares redeemed |
(12,811 | ) | (228,347 | ) | (2,659 | ) | (47,084 | ) | ||||||||
| 30,665 | 585,713 | 24,127 | 418,202 | |||||||||||||
| Class R6 Shares | ||||||||||||||||
| Shares sold |
41,686 | 702,788 | 11,345 | 193,173 | ||||||||||||
| Reinvestment of distributions |
1,374 | 26,210 | 8,342 | 126,140 | ||||||||||||
| Shares redeemed |
(29,343 | ) | (493,542 | ) | (40,849 | ) | (670,313 | ) | ||||||||
| 13,717 | 235,456 | (21,162 | ) | (351,000 | ) | |||||||||||
| Class R Shares | ||||||||||||||||
| Shares sold |
1,955 | 33,602 | 24,272 | 432,443 | ||||||||||||
| Reinvestment of distributions |
474 | 8,964 | 162 | 2,431 | ||||||||||||
| Shares redeemed |
(894 | ) | (15,712 | ) | (538 | ) | (9,952 | ) | ||||||||
| 1,535 | 26,854 | 23,896 | 424,922 | |||||||||||||
| Class P Shares | ||||||||||||||||
| Shares sold |
511,690 | 9,516,364 | 101,686 | 1,734,106 | ||||||||||||
| Reinvestment of distributions |
3,796 | 72,352 | 6,052 | 91,452 | ||||||||||||
| Shares redeemed |
(270,428 | ) | (5,090,066 | ) | (5,371 | ) | (81,152 | ) | ||||||||
| 245,058 | 4,498,650 | 102,367 | 1,744,406 | |||||||||||||
| NET INCREASE |
292,586 | $ | 6,861,088 | 209,672 | $ | 3,481,252 | ||||||||||
173
GOLDMAN SACHS FUNDAMENTAL EQUITY GROWTH FUNDS
Report of Independent Registered Public Accounting Firm
To the Board of Trustees of Goldman Sachs Trust and Shareholders of Goldman Sachs Large Cap Core Fund (formerly Goldman Sachs Capital Growth Fund), Goldman Sachs Concentrated Growth Fund, Goldman Sachs Flexible Cap Fund, Goldman Sachs Mid Cap Growth Fund (formerly Goldman Sachs Growth Opportunities Fund), Goldman Sachs Small Cap Growth Fund, Goldman Sachs Small/Mid Cap Growth Fund, Goldman Sachs Strategic Growth Fund, Goldman Sachs Technology Opportunities Fund, and Goldman Sachs U.S. Equity ESG Fund
Opinions on the Financial Statements
We have audited the accompanying statements of assets and liabilities, including the schedules of investments, of Goldman Sachs Large Cap Core Fund (formerly Goldman Sachs Capital Growth Fund), Goldman Sachs Concentrated Growth Fund, Goldman Sachs Flexible Cap Fund, Goldman Sachs Mid Cap Growth Fund (formerly Goldman Sachs Growth Opportunities Fund), Goldman Sachs Small Cap Growth Fund, Goldman Sachs Small/Mid Cap Growth Fund, Goldman Sachs Strategic Growth Fund, Goldman Sachs Technology Opportunities Fund, and Goldman Sachs U.S. Equity ESG Fund (nine of the funds constituting Goldman Sachs Trust, hereafter collectively referred to as the “Funds”) as of August 31, 2022, the related statements of operations for the year ended August 31, 2022, the statements of changes in net assets for each of the two years in the period ended August 31, 2022, including the related notes, and the financial highlights for each of the periods indicated therein (collectively referred to as the “financial statements”). In our opinion, the financial statements present fairly, in all material respects, the financial position of each of the Funds as of August 31, 2022, the results of each of their operations for the year then ended, the changes in each of their net assets for each of the two years in the period ended August 31, 2022 and each of the financial highlights for each of the periods indicated therein in conformity with accounting principles generally accepted in the United States of America.
Basis for Opinions
These financial statements are the responsibility of the Funds’ management. Our responsibility is to express an opinion on the Funds’ financial statements based on our audits. We are a public accounting firm registered with the Public Company Accounting Oversight Board (United States) (PCAOB) and are required to be independent with respect to the Funds in accordance with the U.S. federal securities laws and the applicable rules and regulations of the Securities and Exchange Commission and the PCAOB.
We conducted our audits of these financial statements in accordance with the standards of the PCAOB. Those standards require that we plan and perform the audit to obtain reasonable assurance about whether the financial statements are free of material misstatement, whether due to error or fraud.
Our audits included performing procedures to assess the risks of material misstatement of the financial statements, whether due to error or fraud, and performing procedures that respond to those risks. Such procedures included examining, on a test basis, evidence regarding the amounts and disclosures in the financial statements. Our audits also included evaluating the accounting principles used and significant estimates made by management, as well as evaluating the overall presentation of the financial statements. Our procedures included confirmation of securities owned as of August 31, 2022 by correspondence with the custodian, transfer agent and brokers; when replies were not received from brokers, we performed other auditing procedures. We believe that our audits provide a reasonable basis for our opinions.
/s/ PricewaterhouseCoopers LLP
Boston, Massachusetts
October 25, 2022
We have served as the auditor of one or more investment companies in Goldman Sachs fund complex since 2000.
174
GOLDMAN SACHS FUNDAMENTAL EQUITY GROWTH FUNDS
Statement Regarding Basis for Approval of Management Agreement (Unaudited)
Background
The Goldman Sachs Concentrated Growth Fund, Goldman Sachs Flexible Cap Fund, Goldman Sachs Large Cap Core Fund (formerly, Goldman Sachs Capital Growth Fund), Goldman Sachs Mid Cap Growth Fund (formerly, Goldman Sachs Growth Opportunities Fund), Goldman Sachs Small Cap Growth Fund, Goldman Sachs Small/Mid Cap Growth Fund, Goldman Sachs Strategic Growth Fund, Goldman Sachs Technology Opportunities Fund, and Goldman Sachs U.S. Equity ESG Fund (the “Funds”) are investment portfolios of Goldman Sachs Trust (the “Trust”). The Board of Trustees oversees the management of the Trust and reviews the investment performance and expenses of the Funds at regularly scheduled meetings held throughout the year. In addition, the Board of Trustees determines annually whether to approve the continuance of the Trust’s investment management agreement (the “Management Agreement”) with Goldman Sachs Asset Management, L.P. (the “Investment Adviser”) on behalf of the Funds.
The Management Agreement was most recently approved for continuation until June 30, 2023 by the Board of Trustees, including those Trustees who are not parties to the Management Agreement or “interested persons” (as defined in the Investment Company Act of 1940, as amended) of any party thereto (the “Independent Trustees”), at a meeting held on June 14-15, 2022 (the “Annual Meeting”).
The review process undertaken by the Trustees spans the course of the year and culminates with the Annual Meeting. To assist the Trustees in their deliberations, the Trustees have established a Contract Review Committee (the “Committee”), comprised of the Independent Trustees. The Committee held two meetings over the course of the year since the Management Agreement was last approved. At those Committee meetings, regularly scheduled Board or other committee meetings, and/or the Annual Meeting, matters relevant to the renewal of the Management Agreement were considered by the Board, or the Independent Trustees, as applicable. With respect to each Fund, such matters included:
| (a) | the nature and quality of the advisory, administrative, and other services provided to the Fund by the Investment Adviser and its affiliates, including information about: |
| (i) | the structure, staff, and capabilities of the Investment Adviser and its portfolio management teams; |
| (ii) | the groups within the Investment Adviser and its affiliates that support the portfolio management teams or provide other types of necessary services, including fund services groups (e.g., accounting and financial reporting, tax, shareholder services, and operations); controls and risk management groups (e.g., legal, compliance, valuation oversight, credit risk management, internal audit, compliance testing, market risk analysis, finance, and central funding); sales and distribution support groups, and others (e.g., information technology and training); |
| (iii) | trends in employee headcount; |
| (iv) | the Investment Adviser’s financial resources and ability to hire and retain talented personnel and strengthen its operations; and |
| (v) | the parent company’s support of the Investment Adviser and its mutual fund business, as expressed by the firm’s senior management; |
| (b) | information on the investment performance of the Fund, including comparisons to the performance of similar mutual funds, as provided by a third-party mutual fund data provider engaged as part of the contract review process (the “Outside Data Provider”), a benchmark performance index, and (in the case of the Concentrated Growth Fund and Strategic Growth Fund) a composite of accounts with comparable investment strategies managed by the Investment Adviser; and information on general investment outlooks in the markets in which the Fund invests; |
| (c) | information provided by the Investment Adviser indicating the Investment Adviser’s views on whether the Fund’s peer group and/or benchmark index had high, medium, or low relevance given the Fund’s particular investment strategy; |
| (d) | the terms of the Management Agreement and other agreements with affiliated service providers entered into by the Trust on behalf of the Fund; |
| (e) | fee and expense information for the Fund, including: |
| (i) | the relative management fee and expense levels of the Fund as compared to those of comparable funds managed by other advisers, as provided by the Outside Data Provider; |
| (ii) | the Fund’s expense trends over time; and |
| (iii) | to the extent the Investment Adviser manages other types of accounts (such as bank collective trusts, private wealth management accounts, institutional separate accounts, sub-advised mutual funds, and non-U.S. funds) having investment objectives and policies similar to those of the Fund, comparative information on the advisory fees charged and services provided to those accounts by the Investment Adviser; |
| (f) | with respect to the extensive investment performance and expense comparison data provided by the Outside Data Provider, its processes in producing that data for the Fund; |
| (g) | the undertakings of the Investment Adviser and its affiliates to implement fee waivers and/or expense limitations; |
175
GOLDMAN SACHS FUNDAMENTAL EQUITY GROWTH FUNDS
Statement Regarding Basis for Approval of Management Agreement (Unaudited) (continued)
| (h) | information relating to the profitability of the Management Agreement and the transfer agency and distribution and service arrangements of the Fund to the Investment Adviser and its affiliates; |
| (i) | whether the Fund’s existing management fee schedule adequately addressed any economies of scale; |
| (j) | a summary of the “fall-out” benefits derived by the Investment Adviser and its affiliates from their relationships with the Fund, including the fees received by the Investment Adviser’s affiliates from the Fund for transfer agency, portfolio trading, distribution and other services; |
| (k) | a summary of potential benefits derived by the Fund as a result of its relationship with the Investment Adviser; |
| (l) | information regarding commissions paid by the Fund and broker oversight, an update on the Investment Adviser’s soft dollars practices, other information regarding portfolio trading, and how the Investment Adviser carries out its duty to seek best execution; |
| (m) | portfolio manager ownership of Fund shares; the manner in which portfolio manager compensation is determined; and the number and types of accounts managed by the portfolio managers; |
| (n) | the nature and quality of the services provided to the Fund by its unaffiliated service providers, and the Investment Adviser’s general oversight and evaluation (including reports on due diligence) of those service providers as part of the administrative services provided under the Management Agreement; and |
| (o) | the Investment Adviser’s processes and policies addressing various types of potential conflicts of interest; its approach to risk management; the annual review of the effectiveness of the Fund’s compliance program; and periodic compliance reports. |
The Trustees also received an overview of the Funds’ distribution arrangements. They received information regarding the Funds’ assets, share purchase and redemption activity, and payment of distribution, service, and shareholder administration fees, as applicable. Information was also provided to the Trustees relating to revenue sharing payments made by and services provided by the Investment Adviser and its affiliates to intermediaries that promote the sale, distribution, and/or servicing of Fund shares. The Independent Trustees also discussed the broad range of other investment choices that are available to Fund investors, including the availability of comparable funds managed by other advisers.
The presentations made at the Board and Committee meetings and at the Annual Meeting encompassed the Funds and other mutual funds for which the Board of Trustees has responsibility. In evaluating the Management Agreement at the Annual Meeting, the Trustees relied upon their knowledge, resulting from their meetings and other interactions throughout the year, of the Investment Adviser and its affiliates, their services, and the Funds. In conjunction with these meetings, the Trustees received written materials and oral presentations on the topics covered, and the Investment Adviser addressed the questions and concerns of the Trustees, including concerns regarding the investment performance of certain of the funds they oversee. The Independent Trustees were advised by their independent legal counsel regarding their responsibilities and other regulatory requirements related to the approval and continuation of mutual fund investment management agreements under applicable law. In addition, the Investment Adviser and its affiliates provided the Independent Trustees with a written response to a formal request for information sent on behalf of the Independent Trustees by their independent legal counsel. During the course of their deliberations, the Independent Trustees met in executive sessions with their independent legal counsel, without representatives of the Investment Adviser or its affiliates present.
Nature, Extent, and Quality of the Services Provided Under the Management Agreement
As part of their review, the Trustees considered the nature, extent, and quality of the services provided to the Funds by the Investment Adviser. In this regard, the Trustees considered both the investment advisory services and non-advisory services that are provided by the Investment Adviser and its affiliates. The Trustees noted the transition in the leadership and changes in personnel of various of the Investment Adviser’s portfolio management teams that had occurred in recent periods, and the ongoing recruitment efforts aimed at bringing high quality investment talent to the Investment Adviser. They also noted the Investment Adviser’s commitment to maintaining high quality systems and expending substantial resources to respond to ongoing changes to the market, regulatory and control environment in which the Funds and their service providers operate, including developments associated with the COVID-19 pandemic, geopolitical events, and economic sanctions, as well as the efforts of the Investment Adviser and its affiliates to combat cyber security risks. The Trustees also considered information regarding the Investment Adviser’s business continuity planning and remote operations capabilities. The Trustees concluded that the Investment Adviser continued to commit substantial financial and operational resources to the Funds and expressed confidence that the Investment Adviser would continue to do so in the future. The Trustees also recognized that the Investment Adviser had made significant commitments to address regulatory compliance requirements applicable to the Funds and the Investment Adviser and its affiliates.
176
GOLDMAN SACHS FUNDAMENTAL EQUITY GROWTH FUNDS
Statement Regarding Basis for Approval of Management Agreement (Unaudited) (continued)
Investment Performance
The Trustees also considered the investment performance of the Funds. In this regard, they compared the investment performance of each Fund to its peers using rankings and (with the exception of the Small Cap Growth Fund) ratings compiled by the Outside Data Provider as of December 31, 2021, and updated performance information prepared by the Investment Adviser using the peer group identified by the Outside Data Provider as of March 31, 2022. The information on each Fund’s investment performance was provided for the one-, three-, five-, and ten-year periods ending on the applicable dates, to the extent that each Fund had been in existence for those periods. The Trustees also reviewed each Fund’s investment performance relative to its performance benchmark. As part of this review, they considered the investment performance trends of the Funds over time, and reviewed the investment performance of each Fund in light of its investment objective and policies and market conditions. The Trustees also received information comparing the Concentrated Growth Fund’s and Strategic Growth Fund’s performance to that of composites of accounts with comparable investment strategies managed by the Investment Adviser.
In addition, the Trustees considered materials prepared and presentations made by the Investment Adviser’s senior management and portfolio management personnel in which Fund performance was assessed. The Trustees also considered the Investment Adviser’s periodic reports with respect to the Funds’ risk profiles, and how the Investment Adviser’s approach to risk monitoring and management influences portfolio management.
The Trustees observed that the Concentrated Growth Fund’s Institutional Shares had placed in the top half of the Fund’s peer group for the one-, three-, and five-year periods and in the third quartile for the ten-year period, and underperformed the Fund’s benchmark index for the one-, three-, five-, and ten-year periods ended March 31, 2022. They noted that the Flexible Cap Fund’s Institutional Shares had placed in the top half of the Fund’s peer group for the one- and three-year periods, and in the third quartile for the five- and ten-year periods, and had outperformed the Fund’s benchmark index for the three- and five-year periods and underperformed for the one- and ten-year periods ended March 31, 2022. The Trustees noted that the Large Cap Core Fund’s Institutional Shares had placed in the top half of the Fund’s peer group for three-, five-, and ten-year periods and in the third quartile for the one-year period, and had outperformed the Fund’s benchmark index for the five- and ten-year periods and underperformed for the one- and three-year periods ended March 31, 2022. They noted that the former Capital Growth Fund had been repositioned as the Large Cap Core Fund in 2022, which involved changes to the Fund’s investment strategy and name. They considered that the Mid Cap Growth Fund’s Institutional Shares had placed in the top half of the Fund’s peer group for the three- and five-year periods and in the third quartile for the one- and ten-year periods and had outperformed the Fund’s benchmark index for the three- and five-year periods and underperformed for the one- and ten-year periods ended March 31, 2022. The Trustees observed that the Small Cap Growth Fund’s Institutional Shares had placed in the third quartile of the Fund’s peer group for the one-year period, and had outperformed the Fund’s benchmark index for the one-year period ended March 31, 2022. They noted that the Small/Mid Cap Growth Fund’s Institutional Shares had placed in the top half of the Fund’s peer group for the three-, five-, and ten-year periods, and in the fourth quartile for the one-year period, and had outperformed the Fund’s benchmark index for the three-, five-, and ten-year periods and underperformed for the one-year period ended March 31, 2022. The Trustees observed that the Strategic Growth Fund’s Institutional Shares had placed in the top half of the Fund’s peer group for the one-, three-, five-, and ten-year periods, and underperformed the Fund’s benchmark index for the one-, three-, five-, and ten-year periods ended March 31, 2022. They noted that the Technology Opportunities Fund’s Institutional Shares had placed in the top half of the Fund’s peer group for the one-, three-, and five-year periods and in the third quartile for the ten-year period, and had outperformed the Fund’s benchmark index for the five-year period and underperformed for the one-, three-, and ten-year periods ended March 31, 2022. The Trustees noted that the U.S. Equity ESG Fund’s Institutional Shares had placed in the top half of the Fund’s peer group for the three- and five-year periods, in the third quartile for the ten-year period, and in the fourth quartile for the one-year period, and underperformed the Fund’s benchmark index for the one-, three-, five-, and ten-year periods ended March 31, 2022.
Costs of Services Provided and Competitive Information
The Trustees considered the contractual terms of the Management Agreement and the fee rates payable by each Fund thereunder. In this regard, the Trustees considered information on the services rendered by the Investment Adviser to the Funds, which included both advisory and administrative services that were directed to the needs and operations of the Funds as registered mutual funds.
In particular, the Trustees reviewed analyses prepared by the Outside Data Provider regarding the expense rankings of the Funds. The analyses provided a comparison of each Fund’s management fee and breakpoints to those of a relevant peer group and category universe; an expense analysis which compared each Fund’s overall net and gross expenses to a peer group and a category universe; and data comparing each Fund’s net expenses to the peer and category medians. The analyses also compared each Fund’s other expenses and fee waivers/reimbursements to those of the peer group and category medians. The Trustees concluded that the
177
GOLDMAN SACHS FUNDAMENTAL EQUITY GROWTH FUNDS
Statement Regarding Basis for Approval of Management Agreement (Unaudited) (continued)
comparisons provided by the Outside Data Provider were useful in evaluating the reasonableness of the management fees and total expenses paid by the Funds.
In addition, the Trustees considered the Investment Adviser’s undertakings to implement fee waivers and/or expense limitations. The Trustees also noted that certain changes were being made to existing fee waiver or expense limitation arrangements of the Concentrated Growth Fund, Mid Cap Growth Fund, Small Cap Growth Fund, Strategic Growth Fund, and Technology Opportunities Fund that would have the effect of decreasing expenses of Class A, Class C, Investor, and Class R Shares of the Fund and/or to total Fund expenses, with such changes taking effect in connection with the Funds’ next annual registration statement update. They also considered, to the extent that the Investment Adviser manages other types of accounts having investment objectives and policies similar to those of the Funds, comparative fee information for services provided by the Investment Adviser to those accounts, and information that indicated that services provided to the Funds differed in various significant respects from the services provided to other types of accounts which, in many cases, operated under less stringent legal and regulatory structures, required fewer services from the Investment Adviser to a smaller number of client contact points, and were less time-intensive.
In addition, the Trustees noted that shareholders are able to redeem their Fund shares at any time if shareholders believe that the Fund fees and expenses are too high or if they are dissatisfied with the performance of the Fund.
Profitability
The Trustees reviewed each Fund’s contribution to the Investment Adviser’s revenues and pre-tax profit margins. In this regard the Trustees noted that they had received, among other things, profitability analyses and summaries, revenue and expense schedules by Fund and by function (i.e., investment management, transfer agency and distribution and service), and information on the Investment Adviser’s expense allocation methodology. They observed that the profitability and expense figures are substantially similar to those used by the Investment Adviser for many internal purposes, including compensation decisions among various business groups, and are thus subject to a vigorous internal debate about how certain revenue and expenses should be allocated. The Trustees also noted that the internal audit group within the Goldman Sachs organization periodically audits the expense allocation methodology and that the internal audit group was satisfied with the reasonableness, consistency, and accuracy of the Investment Adviser’s expense allocation methodology. Profitability data for each Fund was provided for 2021 and 2020, and the Trustees considered this information in relation to the Investment Adviser’s overall profitability.
Economies of Scale
The Trustees considered the information that had been provided regarding whether there have been economies of scale with respect to the management of the Funds. The Trustees also considered the breakpoints in the fee rate payable under the Management Agreement for each of the Funds at the following annual percentage rates of the average daily net assets of the Funds:
| Average Daily Net Assets |
Concentrated Fund |
Flexible Fund |
Large Fund |
Mid Cap Growth Fund |
Small Fund |
|||||||||||||||
| First $1 billion | 0.76 | % | 0.55 | % | 0.71 | % | 0.92 | % | 0.85 | % | ||||||||||
| Next $1 billion | 0.68 | 0.50 | 0.64 | 0.92 | 0.85 | |||||||||||||||
| Next $3 billion | 0.65 | 0.47 | 0.61 | 0.83 | 0.77 | |||||||||||||||
| Next $3 billion | 0.64 | 0.46 | 0.61 | 0.79 | 0.73 | |||||||||||||||
| Over $8 billion | 0.62 | 0.45 | 0.61 | 0.77 | 0.71 | |||||||||||||||
| Average Daily Net Assets |
Small/ Fund |
Strategic Fund |
Technology Opportunities Fund |
U.S. Fund |
||||||||||||
| First $1 billion | 0.85 | % | 0.71 | % | 0.94 | % | 0.55 | % | ||||||||
| Next $1 billion | 0.85 | 0.64 | 0.85 | 0.50 | ||||||||||||
| Next $3 billion | 0.77 | 0.61 | 0.80 | 0.47 | ||||||||||||
| Next $3 billion | 0.73 | 0.59 | 0.79 | 0.46 | ||||||||||||
| Over $8 billion | 0.71 | 0.58 | 0.77 | 0.45 | ||||||||||||
The Trustees noted that the breakpoints were designed to share potential economies of scale, if any, with the Funds and their shareholders as assets under management reach those asset levels. The Trustees considered the amounts of assets in the Funds; the Funds’ recent share purchase and redemption activity; the information provided by the Investment Adviser relating to the costs of
178
GOLDMAN SACHS FUNDAMENTAL EQUITY GROWTH FUNDS
Statement Regarding Basis for Approval of Management Agreement (Unaudited) (continued)
the services provided by the Investment Adviser and its affiliates and their realized profits; information comparing fee rates charged by the Investment Adviser with fee rates charged to other funds in the peer groups; and the Investment Adviser’s undertakings to waive a portion of its management fee for the Mid Cap Growth Fund, Technology Opportunities Fund, and Large Cap Core Fund and to limit certain expenses of the Funds that exceed specified levels, as well as Goldman Sachs & Co. LLC’s (“Goldman Sachs”) undertaking to waive a portion of the transfer agency fees paid by each Fund’s Class A, Class C, Investor, and Class R Shares, as applicable. Upon reviewing these matters at the Annual Meeting, the Trustees concluded that the fee breakpoints represented a means of assuring that benefits of scalability, if any, would be passed along to shareholders at the specified asset levels. They also noted that the Investment Adviser had passed along savings to shareholders of the Small/Mid Cap Growth Fund, which had asset levels above at least the first breakpoint during the prior fiscal year.
Other Benefits to the Investment Adviser and Its Affiliates
The Trustees also considered the other benefits derived by the Investment Adviser and its affiliates from their relationships with the Funds as stated above, including: (a) transfer agency fees received by Goldman Sachs; (b) brokerage and futures commissions earned by Goldman Sachs for executing securities and futures transactions on behalf of the Funds; (c) research received by the Investment Adviser from broker-dealers in exchange for executing certain transactions on behalf of the Funds; (d) trading efficiencies resulting from aggregation of orders of the Funds with those for other funds or accounts managed by the Investment Adviser; (e) fees earned by the Investment Adviser for managing the fund in which the Funds’ securities lending cash collateral is invested; (f) the Investment Adviser’s ability to leverage the infrastructure designed to service the Funds on behalf of its other clients; (g) the Investment Adviser’s ability to cross-market other products and services to Fund shareholders; (h) Goldman Sachs’ retention of certain fees as Fund Distributor; (i) the Investment Adviser’s ability to negotiate better pricing with custodians on behalf of its other clients, as a result of the relationship with the Funds; (j) the investment of cash and cash collateral in money market funds managed by the Investment Adviser that will result in increased assets under management for those money market funds; (k) the investment in exchange-traded funds (“ETFs”) managed by the Investment Adviser that will result in increased assets under management for those ETFs and may facilitate the development of the Investment Adviser’s ETF advisory business; and (l) the possibility that the working relationship between the Investment Adviser and the Funds’ third-party service providers may cause those service providers to be more likely to do business with other areas of Goldman Sachs. In the course of considering the foregoing, the Independent Trustees requested and received further information quantifying certain of these fall-out benefits.
Other Benefits to the Funds and Their Shareholders
The Trustees also noted that the Funds receive certain other potential benefits as a result of their relationship with the Investment Adviser, including: (a) trading efficiencies resulting from aggregation of orders of the Funds with those of other funds or accounts managed by the Investment Adviser; (b) enhanced servicing from vendors due to the volume of business generated by the Investment Adviser and its affiliates; (c) enhanced servicing from broker-dealers due to the volume of business generated by the Investment Adviser and its affiliates; (d) the advantages received from the Investment Adviser’s knowledge and experience gained from managing other accounts and products; (e) the Investment Adviser’s ability to hire and retain qualified personnel to provide services to the Funds because of the reputation of the Goldman Sachs organization; (f) the Funds’ access, through the Investment Adviser, to certain firm-wide resources (e.g., proprietary risk management systems and databases), subject to certain restrictions; and (g) the Funds’ access to certain affiliated distribution channels. In addition, the Trustees noted the competitive nature of the mutual fund marketplace, and considered that many of the Funds’ shareholders invested in the Funds in part because of the Funds’ relationship with the Investment Adviser and that those shareholders have a general expectation that the relationship will continue.
Conclusion
In connection with their consideration of the Management Agreement, the Trustees gave weight to each of the factors described above, but did not identify any particular factor as controlling their decision. After deliberation and consideration of all of the information provided, including the factors described above, the Trustees concluded, in the exercise of their business judgment, that the management fees paid by each of the Funds were reasonable in light of the services provided to it by the Investment Adviser, the Investment Adviser’s costs and each Fund’s current and reasonably foreseeable asset levels. The Trustees unanimously concluded that the Investment Adviser’s continued management likely would benefit each Fund and its shareholders and that the Management Agreement should be approved and continued with respect to each Fund until June 30, 2023.
179
GOLDMAN SACHS FUNDAMENTAL EQUITY GROWTH FUNDS
Fund Expenses — Six Month Period Ended August 31, 2022 (Unaudited)
As a shareholder of Class A, Class C, Institutional, Service, Investor, Class R6, Class R or Class P Shares of a Fund, you incur two types of costs: (1) transaction costs, including sales charges on purchase payments (with respect to Class A Shares), contingent deferred sales charges on redemptions (with respect to Class C Shares), and (2) ongoing costs, including management fees; distribution and/or service (12b-1) fees (with respect to Class A, Class C, Service and Class R Shares); and other Fund expenses. The example is intended to help you understand your ongoing costs (in dollars) of investing in Class A, Class C, Institutional, Service, Investor, Class R6, Class R and Class P Shares of the Funds and to compare these costs with the ongoing costs of investing in other mutual funds.
The example is based on an investment of $1,000 invested at the beginning of the period and held for the entire period from March 1, 2022 through August 31, 2022, which represents a period of 184 days of a 365 day year.
Actual Expenses — The first line under each share class in the table below provides information about actual account values and actual expenses. You may use the information in this line, together with the amount you invested, to estimate the expenses that you paid over the period. Simply divide your account value by $1,000 (for example, an $8,600 account value divided by $1,000=8.6), then multiply the result by the number in the first line under the heading entitled “Expenses Paid” to estimate the expenses you paid on your account during this period.
Hypothetical Example for Comparison Purposes — The second line under each share class in the table below provides information about hypothetical account values and hypothetical expenses based on the Funds’ actual net expense ratios and an assumed rate of return of 5% per year before expenses, which is not the Funds’ actual return. The hypothetical account values and expenses may not be used to estimate the actual ending account balance or expenses you paid for the period. You may use this information to compare the ongoing costs of investing in the Funds and other funds. To do so, compare this 5% hypothetical example with the 5% hypothetical examples that appear in the shareholder reports of the other funds.
Please note that the expenses shown in the table are meant to highlight your ongoing costs only and do not reflect any transactional costs, such as sales charges, redemption fees, or exchange fees. Therefore, the second line of the table is useful in comparing ongoing costs only, and will not help you determine the relative total costs of owning different funds. In addition, if these transactional costs were included, your costs would have been higher.
| Concentrated Growth Fund |
Flexible Cap Fund |
Large Cap Core Fund |
Mid Cap Growth Fund |
Small Cap Growth Fund |
||||||||||||||||||||||||||||||||||||||||||||||||||||||||
| Share Class |
Beginning |
Ending |
Expenses |
Beginning |
Ending |
Expenses |
Beginning |
Ending |
Expenses |
Beginning |
Ending |
Expenses |
Beginning |
Ending |
Expenses |
|||||||||||||||||||||||||||||||||||||||||||||
| Class A |
||||||||||||||||||||||||||||||||||||||||||||||||||||||||||||
|
Actual |
$ | 1,000.00 | $ | 851.32 | $ | 5.13 | $ | 1,000.00 | $ | 915.48 | $ | 4.63 | $ | 1,000.00 | $ | 899.69 | $ | 4.98 | $ | 1,000.00 | $ | 876.09 | $ | 5.82 | $ | 1,000.00 | $ | 888.54 | $ | 6.09 | ||||||||||||||||||||||||||||||
|
Hypothetical 5% return |
1,000.00 | 1,019.66 | + | 5.60 | 1,000.00 | 1,020.37 | + | 4.89 | 1,000.00 | 1,019.96 | + | 5.30 | 1,000.00 | 1,019.00 | + | 6.26 | 1,000.00 | 1,018.75 | 6.51 | |||||||||||||||||||||||||||||||||||||||||
| Class C |
||||||||||||||||||||||||||||||||||||||||||||||||||||||||||||
|
Actual |
1,000.00 | 847.75 | 8.62 | 1,000.00 | 911.74 | 8.24 | 1,000.00 | 896.17 | 8.56 | 1,000.00 | 873.50 | 9.35 | 1,000.00 | 885.02 | 9.65 | |||||||||||||||||||||||||||||||||||||||||||||
|
Hypothetical 5% return |
1,000.00 | 1,015.88 | + | 9.40 | 1,000.00 | 1,016.59 | + | 8.69 | 1,000.00 | 1,016.18 | + | 9.10 | 1,000.00 | 1,015.22 | + | 10.06 | 1,000.00 | 1,014.97 | 10.31 | |||||||||||||||||||||||||||||||||||||||||
| Institutional |
||||||||||||||||||||||||||||||||||||||||||||||||||||||||||||
|
Actual |
1,000.00 | 852.21 | 3.73 | 1,000.00 | 917.31 | 2.85 | 1,000.00 | 901.16 | 3.35 | 1,000.00 | 877.72 | 4.26 | 1,000.00 | 890.29 | 4.34 | |||||||||||||||||||||||||||||||||||||||||||||
|
Hypothetical 5% return |
1,000.00 | 1,021.17 | + | 4.08 | 1,000.00 | 1,022.23 | + | 3.01 | 1,000.00 | 1,021.68 | + | 3.57 | 1,000.00 | 1,020.67 | + | 4.58 | 1,000.00 | 1,020.62 | 4.63 | |||||||||||||||||||||||||||||||||||||||||
| Service |
||||||||||||||||||||||||||||||||||||||||||||||||||||||||||||
|
Actual |
N/A | N/A | N/A | N/A | N/A | N/A | 1,000.00 | 898.79 | 5.74 | 1,000.00 | 875.59 | 6.62 | N/A | N/A | N/A | |||||||||||||||||||||||||||||||||||||||||||||
|
Hypothetical 5% return |
N/A | N/A | N/A | N/A | N/A | N/A | 1,000.00 | 1,019.16 | + | 6.11 | 1,000.00 | 1,018.15 | + | 7.12 | N/A | N/A | N/A | |||||||||||||||||||||||||||||||||||||||||||
| Investor |
||||||||||||||||||||||||||||||||||||||||||||||||||||||||||||
|
Actual |
1,000.00 | 852.51 | 3.97 | 1,000.00 | 916.31 | 3.43 | 1,000.00 | 900.77 | 3.78 | 1,000.00 | 877.05 | 4.64 | 1,000.00 | 889.24 | 4.90 | |||||||||||||||||||||||||||||||||||||||||||||
|
Hypothetical 5% return |
1,000.00 | 1,020.92 | + | 4.33 | 1,000.00 | 1,021.63 | + | 3.62 | 1,000.00 | 1,021.22 | + | 4.02 | 1,000.00 | 1,020.27 | + | 4.99 | 1,000.00 | 1,020.01 | 5.24 | |||||||||||||||||||||||||||||||||||||||||
| Class R6 |
||||||||||||||||||||||||||||||||||||||||||||||||||||||||||||
|
Actual |
1,000.00 | 852.65 | 3.69 | 1,000.00 | 917.11 | 2.80 | 1,000.00 | 901.31 | 3.31 | 1,000.00 | 877.46 | 4.21 | 1,000.00 | 890.29 | 4.29 | |||||||||||||||||||||||||||||||||||||||||||||
|
Hypothetical 5% return |
1,000.00 | 1,021.22 | + | 4.02 | 1,000.00 | 1,022.28 | + | 2.96 | 1,000.00 | 1,021.73 | + | 3.52 | 1,000.00 | 1,020.72 | + | 4.53 | 1,000.00 | 1,020.67 | 4.58 | |||||||||||||||||||||||||||||||||||||||||
| Class R |
||||||||||||||||||||||||||||||||||||||||||||||||||||||||||||
|
Actual |
1,000.00 | 849.84 | 6.29 | 1,000.00 | 914.15 | 5.84 | 1,000.00 | 898.67 | 6.17 | 1,000.00 | 874.88 | 6.99 | 1,000.00 | 887.20 | 7.28 | |||||||||||||||||||||||||||||||||||||||||||||
|
Hypothetical 5% return |
1,000.00 | 1,018.40 | + | 6.87 | 1,000.00 | 1,019.11 | + | 6.16 | 1,000.00 | 1,018.70 | + | 6.56 | 1,000.00 | 1,017.74 | + | 7.53 | 1,000.00 | 1,017.49 | 7.78 | |||||||||||||||||||||||||||||||||||||||||
| Class P |
||||||||||||||||||||||||||||||||||||||||||||||||||||||||||||
|
Actual |
1,000.00 | 852.58 | 3.69 | 1,000.00 | 917.16 | 2.80 | 1,000.00 | 900.99 | 3.31 | 1,000.00 | 877.52 | 4.21 | 1,000.00 | 890.21 | 4.29 | |||||||||||||||||||||||||||||||||||||||||||||
|
Hypothetical 5% return |
1,000.00 | 1,021.22 | + | 4.02 | 1,000.00 | 1,022.28 | + | 2.96 | 1,000.00 | 1,021.73 | + | 3.52 | 1,000.00 | 1,020.72 | + | 4.53 | 1,000.00 | 1,020.67 | 4.58 | |||||||||||||||||||||||||||||||||||||||||
| + | Hypothetical expenses are based on each Fund’s actual annualized net expense ratios and an assumed rate of return of 5% per year before expenses. |
| * | Expenses for each share class are calculated using each Fund’s annualized net expense ratio for each class, which represents the ongoing expenses as a percentage of net assets for the six months ended August 31, 2022. Expenses are calculated by multiplying the annualized net expense ratio by the average account value for the period; then multiplying the result by the number of days in the most recent fiscal half year; and then dividing that result by the number of days in the fiscal year. The annualized net expense ratios for the period were as follows: |
| Fund |
Class A |
Class C |
Institutional |
Service |
Investor |
Class R6 |
Class R |
Class P |
||||||||||||||||||||||||
| Concentrated Growth |
1.10 | % | 1.85 | % | 0.80 | % | N/A | 0.85 | % | 0.79 | % | 1.35 | % | 0.79 | % | |||||||||||||||||
| Flexible Cap |
0.96 | 1.71 | 0.59 | N/A | 0.71 | 0.58 | 1.21 | 0.58 | ||||||||||||||||||||||||
| Large Cap Core |
1.04 | 1.79 | 0.70 | 1.20 | % | 0.79 | 0.69 | 1.29 | 0.69 | |||||||||||||||||||||||
| Mid Cap Growth |
1.23 | 1.98 | 0.90 | 1.40 | 0.98 | 0.89 | 1.48 | 0.89 | ||||||||||||||||||||||||
| Small Cap Growth |
1.28 | 2.03 | 0.91 | N/A | 1.03 | 0.90 | 1.53 | 0.90 | ||||||||||||||||||||||||
180
GOLDMAN SACHS FUNDAMENTAL EQUITY GROWTH FUNDS
Fund Expenses — Six Month Period Ended August 31, 2022 (Unaudited) (continued)
| Small/Mid Cap Growth Fund |
Strategic Growth Fund |
Technology Opportunities Fund |
U.S. Equity ESG Fund |
|||||||||||||||||||||||||||||||||||||||||||||
| Share Class |
Beginning |
Ending |
Expenses |
Beginning |
Ending |
Expenses |
Beginning |
Ending |
Expenses |
Beginning |
Ending |
Expenses |
||||||||||||||||||||||||||||||||||||
| Class A |
||||||||||||||||||||||||||||||||||||||||||||||||
|
Actual |
$ | 1,000.00 | $ | 883.02 | $ | 5.89 | $ | 1,000.00 | $ | 851.11 | $ | 5.13 | $ | 1,000.00 | $ | 830.28 | $ | 5.72 | $ | 1,000.00 | $ | 886.35 | $ | 4.94 | ||||||||||||||||||||||||
|
Hypothetical 5% return |
1,000.00 | 1,018.95 | + | 6.31 | 1,000.00 | 1,019.66 | + | 5.60 | 1,000.00 | 1,018.95 | + | 6.31 | 1,000.00 | 1,019.96 | + | 5.30 | ||||||||||||||||||||||||||||||||
| Class C |
||||||||||||||||||||||||||||||||||||||||||||||||
|
Actual |
1,000.00 | 879.59 | 9.43 | 1,000.00 | 848.63 | 8.62 | 1,000.00 | 827.20 | 9.17 | 1,000.00 | 882.61 | 8.49 | ||||||||||||||||||||||||||||||||||||
|
Hypothetical 5% return |
1,000.00 | 1,015.17 | + | 10.11 | 1,000.00 | 1,015.88 | + | 9.40 | 1,000.00 | 1,015.17 | + | 10.11 | 1,000.00 | 1,016.18 | + | 9.10 | ||||||||||||||||||||||||||||||||
| Institutional |
||||||||||||||||||||||||||||||||||||||||||||||||
|
Actual |
1,000.00 | 884.49 | 4.37 | 1,000.00 | 852.63 | 3.50 | 1,000.00 | 831.59 | 4.39 | 1,000.00 | 887.80 | 3.19 | ||||||||||||||||||||||||||||||||||||
|
Hypothetical 5% return |
1,000.00 | 1,020.57 | + | 4.69 | 1,000.00 | 1,021.42 | + | 3.82 | 1,000.00 | 1,020.42 | + | 4.84 | 1,000.00 | 1,021.83 | + | 3.41 | ||||||||||||||||||||||||||||||||
| Service |
||||||||||||||||||||||||||||||||||||||||||||||||
|
Actual |
1,000.00 | 881.87 | 6.74 | 1,000.00 | 850.27 | 5.83 | 1,000.00 | 829.43 | 6.69 | N/A | N/A | N/A | ||||||||||||||||||||||||||||||||||||
|
Hypothetical 5% return |
1,000.00 | 1,018.05 | + | 7.22 | 1,000.00 | 1,018.90 | + | 6.36 | 1,000.00 | 1,017.90 | + | 7.38 | N/A | N/A | N/A | |||||||||||||||||||||||||||||||||
| Investor |
||||||||||||||||||||||||||||||||||||||||||||||||
|
Actual |
1,000.00 | 884.07 | 4.70 | 1,000.00 | 852.47 | 3.97 | 1,000.00 | 831.37 | 4.57 | 1,000.00 | 887.28 | 3.76 | ||||||||||||||||||||||||||||||||||||
|
Hypothetical 5% return |
1,000.00 | 1,020.21 | + | 5.04 | 1,000.00 | 1,020.92 | + | 4.33 | 1,000.00 | 1,020.21 | + | 5.04 | 1,000.00 | 1,021.22 | + | 4.02 | ||||||||||||||||||||||||||||||||
| Class R6 |
||||||||||||||||||||||||||||||||||||||||||||||||
|
Actual |
1,000.00 | 884.65 | 4.32 | 1,000.00 | 853.12 | 3.46 | 1,000.00 | 831.70 | 4.34 | 1,000.00 | 887.86 | 3.14 | ||||||||||||||||||||||||||||||||||||
|
Hypothetical 5% return |
1,000.00 | 1,020.62 | + | 4.63 | 1,000.00 | 1,021.48 | + | 3.77 | 1,000.00 | 1,020.47 | + | 4.79 | 1,000.00 | 1,021.88 | + | 3.36 | ||||||||||||||||||||||||||||||||
| Class R |
||||||||||||||||||||||||||||||||||||||||||||||||
|
Actual |
1,000.00 | 881.89 | 7.07 | 1,000.00 | 849.83 | 6.29 | N/A | N/A | N/A | 1,000.00 | 885.20 | 6.13 | ||||||||||||||||||||||||||||||||||||
|
Hypothetical 5% return |
1,000.00 | 1,017.69 | + | 7.58 | 1,000.00 | 1,018.40 | + | 6.87 | N/A | N/A | N/A | 1,000.00 | 1,018.70 | + | 6.56 | |||||||||||||||||||||||||||||||||
| Class P |
||||||||||||||||||||||||||||||||||||||||||||||||
|
Actual |
1,000.00 | 884.25 | 4.27 | 1,000.00 | 852.86 | 3.46 | 1,000.00 | 831.70 | 4.34 | 1,000.00 | 887.80 | 3.14 | ||||||||||||||||||||||||||||||||||||
|
Hypothetical 5% return |
1,000.00 | 1,020.67 | + | 4.58 | 1,000.00 | 1,021.48 | + | 3.77 | 1,000.00 | 1,020.47 | + | 4.79 | 1,000.00 | 1,021.88 | + | 3.36 | ||||||||||||||||||||||||||||||||
| + | Hypothetical expenses are based on each Fund’s actual annualized net expense ratios and an assumed rate of return of 5% per year before expenses. |
| * | Expenses for each share class are calculated using each Fund’s annualized net expense ratio for each class, which represents the ongoing expenses as a percentage of net assets for the six months ended August 31, 2022. Expenses are calculated by multiplying the annualized net expense ratio by the average account value for the period; then multiplying the result by the number of days in the most recent fiscal half year; and then dividing that result by the number of days in the fiscal year. The annualized net expense ratios for the period were as follows: |
| Fund |
Class A |
Class C |
Institutional |
Service |
Investor |
Class R6 |
Class R |
Class P |
||||||||||||||||||||||||
| Small/Mid Cap Growth |
1.24 | % | 1.99 | % | 0.92 | % | 1.42 | % | 0.99 | % | 0.91 | % | 1.49 | % | 0.90 | % | ||||||||||||||||
| Strategic Growth |
1.10 | 1.85 | 0.75 | 1.25 | 0.85 | 0.74 | 1.35 | 0.74 | ||||||||||||||||||||||||
| Technology Opportunities |
1.24 | 1.99 | 0.95 | 1.45 | 0.99 | 0.94 | N/A | 0.94 | ||||||||||||||||||||||||
| U.S. Equity ESG |
1.04 | 1.79 | 0.67 | N/A | 0.79 | 0.66 | 1.29 | 0.66 | ||||||||||||||||||||||||
181
GOLDMAN SACHS FUNDAMENTAL EQUITY GROWTH FUNDS
Trustees and Officers (Unaudited)
Independent Trustees
| Name, Address and Age1 |
Position(s) Held with the Trust |
Term of Office and Length of Time Served2 |
Principal Occupation(s) During Past 5 Years |
Number of Portfolios in Fund Complex Overseen by Trustee3 |
Other Directorships Held by Trustee4 | |||||
| Jessica Palmer Age: 73 |
Chair of the Board of Trustees | Since 2018 (Trustee since 2007) | Ms. Palmer is retired. She was formerly Consultant, Citigroup Human Resources Department (2007-2008); Managing Director, Citigroup Corporate and Investment Banking (previously, Salomon Smith Barney/Salomon Brothers) (1984-2006). Ms. Palmer was a Member of the Board of Trustees of Indian Mountain School (private elementary and secondary school) (2004-2009).
Chair of the Board of Trustees — Goldman Sachs Trust and Goldman Sachs Variable Insurance Trust. |
103 | None | |||||
| Dwight L. Bush Age: 65 |
Trustee | Since 2020 | Ambassador Bush is President and CEO of D.L. Bush & Associates (a financial advisory and private investment firm) (2002-2014 and 2017-Present); Director of MoneyLion, Inc. (an operator of a data-driven, digital financial platform) (2021-Present); and was formerly U.S. Ambassador to the Kingdom of Morocco (2014-2017) and a Member of the Board of Directors of Santander Bank, N.A. (2018-2019). Previously, Ambassador Bush served as an Advisory Board Member of Goldman Sachs Trust and Goldman Sachs Variable Insurance Trust (October 2019-January 2020).
Trustee — Goldman Sachs Trust and Goldman Sachs Variable Insurance Trust. |
103 | MoneyLion, Inc. (an operator of a data-driven, digital financial platform) | |||||
| Kathryn A. Cassidy Age: 68 |
Trustee | Since 2015 | Ms. Cassidy is retired. She is Director, Vertical Aerospace Ltd. (an aerospace and technology company) (2021-Present). Formerly, Ms. Cassidy was Advisor to the Chairman (May 2014-December 2014); and Senior Vice President and Treasurer (2008-2014), General Electric Company & General Electric Capital Corporation (technology and financial services companies).
Trustee — Goldman Sachs Trust and Goldman Sachs Variable Insurance Trust |
103 | Vertical Aerospace Ltd. (an aerospace and technology company) | |||||
| John G. Chou Age: 65 |
Trustee | Since 2022 | Mr. Chou is Executive Vice President and Special Advisor to the Chairman and CEO of AmerisourceBergen Corporation (a pharmaceutical and healthcare company) (2021-Present); and formerly held various executive management positions with AmerisourceBergen Corporation, including Executive Vice President and Chief Legal Officer (2019-2021); Executive Vice President and Chief Legal & Business Officer (2017-2019); and Executive Vice President and General Counsel (2011-2017).
Trustee — Goldman Sachs Trust and Goldman Sachs Variable Insurance Trust. |
103 | None | |||||
| Diana M. Daniels Age: 73 |
Trustee | Since 2007 | Ms. Daniels is retired. Formerly, she was Vice President, General Counsel and Secretary, The Washington Post Company (1991-2006). Ms. Daniels is a Trustee Emeritus and serves as a Presidential Councillor of Cornell University (2013-Present); Director of 1735 NY Investments, LLC (oversees an investment fund that supports the mission of the American Institute of Architects) (2022-Present); former Member of the Legal Advisory Board, New York Stock Exchange (2003-2006) and of the Corporate Advisory Board, Standish Mellon Management Advisors (2006-2007).
Trustee — Goldman Sachs Trust and Goldman Sachs Variable Insurance Trust. |
103 | None | |||||
182
GOLDMAN SACHS FUNDAMENTAL EQUITY GROWTH FUNDS
Trustees and Officers (Unaudited) (continued)
Independent Trustees
| Name, Address and Age1 |
Position(s) Held with the Trust |
Term of Office and Length of Time Served2 |
Principal Occupation(s) During Past 5 Years |
Number of Portfolios in Fund Complex Overseen by Trustee3 |
Other Directorships Held by Trustee4 | |||||
| Joaquin Delgado Age: 62 |
Trustee | Since 2020 | Dr. Delgado is retired. He is Director, Stepan Company (a specialty chemical manufacturer) (2011-Present); and was formerly Director, Hexion Inc. (a specialty chemical manufacturer) (2019-2022); Executive Vice President, Consumer Business Group of 3M Company (July 2016-July 2019); and Executive Vice President, Health Care Business Group of 3M Company (October 2012-July 2016). Previously, Dr. Delgado served as an Advisory Board Member of Goldman Sachs Trust and Goldman Sachs Variable Insurance Trust (October 2019-January 2020).
Trustee — Goldman Sachs Trust and Goldman Sachs Variable Insurance Trust |
103 | Stepan Company (a specialty chemical manufacturer) | |||||
| Eileen H. Dowling Age: 59 |
Trustee | Since 2021 | Ms. Dowling is retired. Formerly, she was Senior Advisor (April 2021-September 2021); and Managing Director (2013-2021), BlackRock, Inc. (a financial services firm).
Trustee — Goldman Sachs Trust and Goldman Sachs Variable Insurance Trust. |
103 | None | |||||
| Gregory G. Weaver Age: 70 |
Trustee | Since 2015 | Mr. Weaver is retired. He is Director, Verizon Communications Inc. (2015-Present); and was formerly Chairman and Chief Executive Officer, Deloitte & Touche LLP (a professional services firm) (2001-2005 and 2012-2014); and Member of the Board of Directors, Deloitte & Touche LLP (2006-2012).
Trustee — Goldman Sachs Trust and Goldman Sachs Variable Insurance Trust. |
103 | Verizon Communications Inc. | |||||
| Paul C. Wirth Age: 64 |
Trustee | Since 2022 | Mr. Wirth is retired. Formerly, he was Deputy Chief Financial Officer and Principal Accounting Officer (2011-2020); Finance Director and Principal Accounting Officer (2010-2011); and Managing Director, Global Controller, and Chief Accounting Officer (2005-2010) of Morgan Stanley.
Trustee — Goldman Sachs Trust and Goldman Sachs Variable Insurance Trust. |
103 | None | |||||
183
GOLDMAN SACHS FUNDAMENTAL EQUITY GROWTH FUNDS
Trustees and Officers (Unaudited) (continued)
Interested Trustee*
| Name, Address and Age1 |
Position(s) Held with the Trust |
Term of Office and Length of Time Served2 |
Principal Occupation(s) During Past 5 Years |
Number of Portfolios in Fund Complex Overseen by Trustee3 |
Other Directorships Held by Trustee4 | |||||
| James A. McNamara Age: 59 |
President and Trustee | Since 2007 | Advisory Director, Goldman Sachs (January 2018-Present); Managing Director, Goldman Sachs (January 2000-December 2017); Director of Institutional Fund Sales, GSAM (April 1998-December 2000); and Senior Vice President and Manager, Dreyfus Institutional Service Corporation (January 1993-April 1998).
President and Trustee — Goldman Sachs Trust; Goldman Sachs Variable Insurance Trust; Goldman Sachs Trust II; Goldman Sachs MLP and Energy Renaissance Fund; Goldman Sachs ETF Trust; Goldman Sachs ETF Trust II; Goldman Sachs Credit Income Fund; and Goldman Sachs Real Estate Diversified Income Fund. |
172 | None | |||||
| * | Mr. McNamara is considered to be an “Interested Trustee” because he holds positions with Goldman Sachs and owns securities issued by The Goldman Sachs Group, Inc. Mr. McNamara holds comparable positions with certain other companies of which Goldman Sachs, GSAM or an affiliate thereof is the investment adviser, administrator and/or distributor. |
| 1 | Each Trustee may be contacted by writing to the Trustee, c/o Goldman Sachs, 200 West Street, New York, New York, 10282, Attn: Caroline Kraus. Information is provided as of August 31, 2022. |
| 2 | Subject to such policies as may be adopted by the Board from time-to-time, each Trustee holds office for an indefinite term, until the earliest of: (a) the election of his or her successor; (b) the date the Trustee resigns or is removed by the Board or shareholders, in accordance with the Trust’s Declaration of Trust; or (c) the termination of the Trust. The Board has adopted policies which provide that each Independent Trustee shall retire as of December 31st of the calendar year in which he or she reaches (a) his or her 75th birthday or (b) the 15th anniversary of the date he or she became a Trustee, whichever is earlier, unless a waiver of such requirements shall have been adopted by a majority of the other Trustees. These policies may be changed by the Trustees without shareholder vote. |
| 3 | The Goldman Sachs Fund Complex includes certain other companies listed above for each respective Trustee. As of August 31, 2022, Goldman Sachs Trust consisted of 88 portfolios; Goldman Sachs Variable Insurance Trust consisted of 15 portfolios (12 of which offered shares to the public); Goldman Sachs Trust II consisted of 18 portfolios (16 of which offered shares to the public); Goldman Sachs ETF Trust consisted of 46 portfolios (29 of which offered shares to the public); Goldman Sachs ETF Trust II consisted of 2 portfolios (1 of which offered shares to the public); and Goldman Sachs MLP and Energy Renaissance Fund, Goldman Sachs Credit Income Fund and Goldman Sachs Real Estate Diversified Income Fund each consisted of one portfolio. Goldman Sachs Credit Income Fund did not offer shares to the public. |
| 4 | This column includes only directorships of companies required to report to the Securities and Exchange Commission under the Securities Exchange Act of 1934 (i.e., “public companies”) or other investment companies registered under the Act. |
Additional information about the Trustees is available in the Funds’ Statement of Additional Information, which can be obtained from Goldman Sachs free of charge by calling this toll-free number (in the United States of America): 1-800-526-7384.
184
GOLDMAN SACHS FUNDAMENTAL EQUITY GROWTH FUNDS
Trustees and Officers (Unaudited) (continued)
Officers of the Trust*
| Name, Address and Age1 |
Positions Held with the Trust |
Term of Office and Length of Time Served2 |
Principal Occupation(s) During Past 5 Years | |||
| James A. McNamara 200 West Street New York, NY 10282 Age: 59 |
Trustee and President | Since 2007 | Advisory Director, Goldman Sachs (January 2018-Present); Managing Director, Goldman Sachs (January 2000-December 2017); Director of Institutional Fund Sales, GSAM (April 1998-December 2000); and Senior Vice President and Manager, Dreyfus Institutional Service Corporation (January 1993-April 1998).
President and Trustee — Goldman Sachs Trust; Goldman Sachs Variable Insurance Trust; Goldman Sachs Trust II; Goldman Sachs MLP and Energy Renaissance Fund; Goldman Sachs ETF Trust; Goldman Sachs ETF Trust II; Goldman Sachs Credit Income Fund; and Goldman Sachs Real Estate Diversified Income Fund. | |||
| Caroline L. Kraus 200 West Street New York, NY 10282 Age: 45 |
Secretary | Since 2012 | Managing Director, Goldman Sachs (January 2016-Present); Vice President, Goldman Sachs (August 2006-December 2015); Senior Counsel, Goldman Sachs (January 2020-Present); Associate General Counsel, Goldman Sachs (2012-December 2019); Assistant General Counsel, Goldman Sachs (August 2006-December 2011); and Associate, Weil, Gotshal & Manges, LLP (2002–2006).
Secretary — Goldman Sachs Trust (previously Assistant Secretary (2012)); Goldman Sachs Variable Insurance Trust (previously Assistant Secretary (2012)); Goldman Sachs Trust II; Goldman Sachs BDC, Inc.; Goldman Sachs Private Middle Market Credit LLC; Goldman Sachs Private Middle Market Credit II LLC; Goldman Sachs Middle Market Lending Corp.; Goldman Sachs MLP and Energy Renaissance Fund; Goldman Sachs ETF Trust; Goldman Sachs ETF Trust II; Goldman Sachs Credit Income Fund; and Goldman Sachs Real Estate Diversified Income Fund. | |||
| Joseph F. DiMaria 30 Hudson Street Jersey City, NJ 07302 Age: 54 |
Treasurer, Principal Financial Officer and Principal Accounting Officer | Since 2017 (Treasurer and Principal Financial Officer since 2019) | Managing Director, Goldman Sachs (November 2015-Present) and Vice President-Mutual Fund Administration, Columbia Management Investment Advisers, LLC (May 2010-October 2015).
Treasurer, Principal Financial Officer and Principal Accounting Officer — Goldman Sachs Trust (previously Assistant Treasurer (2016)); Goldman Sachs Variable Insurance Trust (previously Assistant Treasurer (2016)); Goldman Sachs Trust II (previously Assistant Treasurer (2017)); Goldman Sachs MLP and Energy Renaissance Fund (previously Assistant Treasurer (2017)); Goldman Sachs ETF Trust (previously Assistant Treasurer (2017)); Goldman Sachs ETF Trust II; Goldman Sachs Credit Income Fund; and Goldman Sachs Real Estate Diversified Income Fund. | |||
| * | Represents a partial list of officers of the Trust. Additional information about all the officers is available in the Funds’ Statement of Additional Information, which can be obtained from Goldman Sachs free of charge by calling this toll-free number (in the United States): 1-800-526-7384. |
| 1 | Information is provided as of August 31, 2022. |
| 2 | Officers hold office at the pleasure of the Board of Trustees or until their successors are duly elected and qualified. Each officer holds comparable positions with certain other companies of which Goldman Sachs, GSAM or an affiliate thereof is the investment adviser, administrator and/or distributor. |
Goldman Sachs Trust - Fundamental Equity Growth Funds - Tax Information (Unaudited)
For the year ended August 31, 2022, 15.97%, 41.00%, 44.98%, 7.66%, 2.66%, 15.49%, 12.25%, 21.85%, and 43.79% of the dividends paid from net investment company taxable income by the Concentrated Growth, Flexible Cap, Large Cap Core, Mid Cap Growth, Small Cap Growth, Small/Mid Cap Growth, Strategic Growth Technology Opportunities, and U.S. Equity ESG Funds, respectively, qualify for the dividends received deduction available to corporations.
Pursuant to Section 852 of the Internal Revenue Code, the Concentrated Growth, Flexible Cap, Large Cap Core, Mid Cap Growth, Small Cap Growth, Small/Mid Cap Growth, Strategic Growth, Technology Opportunities, and U.S. Equity ESG Funds, designate $27,668,649, $1,366,469, $90,741,725, $147,936,040, $1,258,935, $351,527,688, $19,787,592, $109,328,052, and $221,497, respectively, or if different, the maximum amount allowable, as capital gain dividends paid during the year ended August 31, 2022.
For the year ended August 31, 2022, 12.40%, 35.56%, 23.47%, 6.17%, 3.73%, 8.67%, 18.12%, 15.64%, and 47.34% of the dividends paid from net investment company taxable income by the Concentrated Growth, Flexible Cap, Large Cap Core, Mid Cap Growth, Small Cap Growth, Small/Mid Cap Growth, Strategic Growth, Technology Opportunities, and U.S. Equity ESG Funds, respectively, qualify for the reduced tax rate under the Jobs and Growth Tax Relief and Reconciliation Act of 2003.
During the fiscal year ended August 31, 2022, the Concentrated Growth, Flexible Cap, Large Cap Core, Mid Cap Growth, Small Cap Growth, Small/Mid Cap Growth, Strategic Growth, Technology Opportunities, and U.S. Equity ESG Funds, designate $6,748,756, $877,947, $41,150,272, $64,922,993, $1,158,258, $89,171,541, $5,130,133, $22,089,157, and $353,781 respectively, as short-term capital gain dividends pursuant to Section 871(k) of the Internal Revenue Code.
For the year ended August 31, 2022, 0.76%, 1.14%, 0.94%, 0.60%, 0.74% and 1.53% of the dividend paid from net investment company taxable income by the Concentrated Growth, Flexible Cap, Large Cap Core, Mid Cap Growth, Strategic Growth, and Technology Opportunities respectively, qualifies as section 199A dividends.
185
FUNDS PROFILE
Goldman Sachs Funds
Goldman Sachs is a premier financial services firm, known since 1869 for creating thoughtful and customized investment solutions in complex global markets.
Today, the Asset Management Division of Goldman Sachs serves a diverse set of clients worldwide, including private institutions, public entities and individuals. With approximately $2.27 trillion in assets under supervision as of June 30, 2022, Goldman Sachs Asset Management has portfolio management teams located around the world and our investment professionals bring firsthand knowledge of local markets to every investment decision. Assets under supervision includes assets under management and other client assets for which Goldman Sachs does not have full discretion. Goldman Sachs Asset Management leverages the resources of Goldman Sachs & Co. LLC subject to legal, internal and regulatory restrictions.
Money Market
Financial Square FundsSM
| ∎ | Financial Square Treasury Solutions Fund1 |
| ∎ | Financial Square Government Fund1 |
| ∎ | Financial Square Money Market Fund2 |
| ∎ | Financial Square Prime Obligations Fund2 |
| ∎ | Financial Square Treasury Instruments Fund1 |
| ∎ | Financial Square Treasury Obligations Fund1 |
| ∎ | Financial Square Federal Instruments Fund1 |
Investor FundsSM
| ∎ | Investor Money Market Fund3 |
| ∎ | Investor Tax-Exempt Money Market Fund3 |
Fixed Income
Short Duration and Government
| ∎ | Enhanced Income Fund |
| ∎ | Short-Term Conservative Income Fund |
| ∎ | Short Duration Government Fund |
| ∎ | Short Duration Bond Fund |
| ∎ | Government Income Fund |
| ∎ | Inflation Protected Securities Fund |
Multi-Sector
| ∎ | Bond Fund |
| ∎ | Core Fixed Income Fund |
| ∎ | Global Core Fixed Income Fund |
| ∎ | Strategic Income Fund |
| ∎ | Income Fund |
Municipal and Tax-Free
| ∎ | High Yield Municipal Fund |
| ∎ | Dynamic Municipal Income Fund |
| ∎ | Short Duration Tax-Free Fund |
| ∎ | Municipal Income Completion Fund |
Single Sector
| ∎ | Investment Grade Credit Fund |
| ∎ | U.S. Mortgages Fund |
| ∎ | High Yield Fund |
| ∎ | High Yield Floating Rate Fund |
| ∎ | Emerging Markets Debt Fund |
| ∎ | Local Emerging Markets Debt Fund |
Fixed Income Alternatives
| ∎ | Long Short Credit Strategies Fund |
Fundamental Equity
| ∎ | Equity Income Fund |
| ∎ | Small Cap Growth Fund |
| ∎ | Small Cap Value Fund |
| ∎ | Small/Mid Cap Value Fund |
| ∎ | Mid Cap Value Fund |
| ∎ | Large Cap Value Fund |
| ∎ | Focused Value Fund |
| ∎ | Large Cap Core Fund4 |
| ∎ | Strategic Growth Fund |
| ∎ | Small/Mid Cap Growth Fund |
| ∎ | Flexible Cap Fund |
| ∎ | Concentrated Growth Fund |
| ∎ | Technology Opportunities Fund |
| ∎ | Mid Cap Growth Fund5 |
| ∎ | Rising Dividend Growth Fund |
| ∎ | U.S. Equity ESG Fund |
| ∎ | Income Builder Fund |
Tax-Advantaged Equity
| ∎ | U.S. Tax-Managed Equity Fund |
| ∎ | International Tax-Managed Equity Fund |
| ∎ | U.S. Equity Dividend and Premium Fund |
| ∎ | International Equity Dividend and Premium Fund |
Equity Insights
| ∎ | Small Cap Equity Insights Fund |
| ∎ | U.S. Equity Insights Fund |
| ∎ | Small Cap Growth Insights Fund |
| ∎ | Large Cap Growth Insights Fund |
| ∎ | Large Cap Value Insights Fund |
| ∎ | Small Cap Value Insights Fund |
| ∎ | International Small Cap Insights Fund |
| ∎ | International Equity Insights Fund |
| ∎ | Emerging Markets Equity Insights Fund |
Fundamental Equity International
| ∎ | International Equity Income Fund |
| ∎ | International Equity ESG Fund |
| ∎ | China Equity Fund |
| ∎ | Emerging Markets Equity Fund |
| ∎ | ESG Emerging Markets Equity Fund |
Alternative
| ∎ | Clean Energy Income Fund |
| ∎ | Defensive Equity Fund |
| ∎ | Real Estate Securities Fund |
| ∎ | Commodity Strategy Fund |
| ∎ | Global Real Estate Securities Fund |
| ∎ | Absolute Return Tracker Fund |
| ∎ | Managed Futures Strategy Fund |
| ∎ | MLP Energy Infrastructure Fund |
| ∎ | Energy Infrastructure Fund |
| ∎ | Multi-Manager Alternatives Fund |
| ∎ | Global Infrastructure Fund |
Total Portfolio Solutions
| ∎ | Global Managed Beta Fund |
| ∎ | Multi-Manager Non-Core Fixed Income Fund |
| ∎ | Multi-Manager Global Equity Fund |
| ∎ | Multi-Manager International Equity Fund |
| ∎ | Tactical Tilt Overlay Fund |
| ∎ | Balanced Strategy Portfolio |
| ∎ | Multi-Manager U.S. Small Cap Equity Fund |
| ∎ | Multi-Manager Real Assets Strategy Fund |
| ∎ | Growth and Income Strategy Portfolio |
| ∎ | Growth Strategy Portfolio |
| ∎ | Dynamic Global Equity Fund |
| ∎ | Satellite Strategies Portfolio |
| ∎ | Enhanced Dividend Global Equity Portfolio |
| ∎ | Tax-Advantaged Global Equity Portfolio |
| ∎ | Strategic Factor Allocation Fund |
| ∎ | Strategic Volatility Premium Fund |
| ∎ | Target Date Retirement Portfolio |
| ∎ | Target Date 2025 Portfolio |
| ∎ | Target Date 2030 Portfolio |
| ∎ | Target Date 2035 Portfolio |
| ∎ | Target Date 2040 Portfolio |
| ∎ | Target Date 2045 Portfolio |
| ∎ | Target Date 2050 Portfolio |
| ∎ | Target Date 2055 Portfolio |
| ∎ | Target Date 2060 Portfolio |
| ∎ | GQG Partners International Opportunities Fund |
| 1 | You could lose money by investing in the Fund. Although the Fund seeks to preserve the value of your investment at $1.00 per share, it cannot guarantee it will do so. An investment in the Fund is not a deposit of a bank and is not insured or guaranteed by the Federal Deposit Insurance Corporation or any other government agency. The Fund’s sponsor has no legal obligation to provide financial support to the Fund, and you should not expect that the sponsor will provide financial support to the Fund at any time. |
| 2 | You could lose money by investing in the Fund. Because the share price of the Fund will fluctuate, when you sell your shares they may be worth more or less than what you originally paid for them. The Fund may impose a fee upon sale of your shares or may temporarily suspend your ability to sell shares if the Fund’s liquidity falls below required minimums because of market conditions or other factors. An investment in the Fund is not a deposit of a bank and is not insured or guaranteed by the Federal Deposit Insurance Corporation or any other government agency. The Fund’s sponsor has no legal obligation to provide financial support to the Fund, and you should not expect that the sponsor will provide financial support to the Fund at any time. |
| 3 | You could lose money by investing in the Fund. Although the Fund seeks to preserve the value of your investment at $1.00 per share, it cannot guarantee it will do so. The Fund may impose a fee upon sale of your shares or may temporarily suspend your ability to sell shares if the Fund’s liquidity falls below required minimums because of market conditions or other factors. An investment in the Fund is not a deposit of a bank and is not insured or guaranteed by the Federal Deposit Insurance Corporation or any other government agency. The Fund’s sponsor has no legal obligation to provide financial support to the Fund, and you should not expect that the sponsor will provide financial support to the Fund at any time. |
| 4 | Effective after the close of business on April 13, 2022, the Goldman Sachs Capital Growth Fund was renamed the Goldman Sachs Large Cap Core Fund. |
| 5 | Effective after the close of business on April 13, 2022, the Goldman Sachs Growth Opportunities Fund was renamed the Goldman Sachs Mid Cap Growth Fund. |
| Financial Square FundsSM and Investor FundsSM are registered service marks of Goldman Sachs & Co. LLC. |
| * | This list covers open-end funds only. Please visit our website at www.GSAMFUNDS.com to learn about our closed-end funds and exchange-traded funds. |
| TRUSTEES Jessica Palmer, Chair Dwight L. Bush Kathryn A. Cassidy John G. Chou Diana M. Daniels Joaquin Delgado Eileen H. Dowling James A. McNamara Gregory G. Weaver Paul C. Wirth |
OFFICERS James A. McNamara, President Joseph F. DiMaria, Principal Financial Officer, Principal Accounting Officer and Treasurer Caroline L. Kraus, Secretary | |
| GOLDMAN SACHS & CO. LLC Distributor and Transfer Agent |
GOLDMAN SACHS ASSET MANAGEMENT, L.P. Investment Adviser | |
Visit our web site at www.GSAMFUNDS.com to obtain the most recent month-end returns.
Goldman Sachs Asset Management, L.P. 200 West Street, New York, New York 10282
The reports concerning the Funds included in this shareholder report may contain certain forward-looking statements about the factors that may affect the performance of the Funds in the future. These statements are based on Fund management’s predictions and expectations concerning certain future events and their expected impact on the Funds, such as performance of the economy as a whole and of specific industry sectors, changes in the levels of interest rates, the impact of developing world events, and other factors that may influence the future performance of the Funds. Management believes these forward-looking statements to be reasonable, although they are inherently uncertain and difficult to predict. Actual events may cause adjustments in portfolio management strategies from those currently expected to be employed.
A description of the policies and procedures that the Funds use to determine how to vote proxies relating to portfolio securities and information regarding how a Fund voted proxies relating to portfolio securities during the most recent 12-month period ended June 30 is available (i) without charge, upon request by calling 1-800-526-7384 (for Retail Shareholders) or 1-800-621-2550 (for Institutional Shareholders); and (ii) on the Securities and Exchange Commission (“SEC”) web site at http://www.sec.gov.
The Funds will file their portfolio holdings information for each month in a fiscal quarter within 60 days after the end of the relevant fiscal quarter on Form N-PORT. Portfolio holdings information for the third month of each fiscal quarter will be made available on the SEC’s web site at http://www.sec.gov. Portfolio holdings information may be obtained upon request and without charge by calling 1-800-526-7384 (for Retail Shareholders) or 1-800-621-2550 (for Institutional Shareholders).
Goldman Sachs & Co. LLC (‘‘Goldman Sachs’’) does not provide legal, tax or accounting advice. Any statement contained in this communication (including any attachments) concerning U.S. tax matters was not intended or written to be used, and cannot be used, for the purpose of avoiding penalties under the Internal Revenue Code, and was written to support the promotion or marketing of the transaction(s) or matter(s) addressed. Clients of Goldman Sachs should obtain their own independent tax advice based on their particular circumstances.
Fund holdings and allocations shown are as of August 31, 2022 and may not be representative of future investments. Fund holdings should not be relied on in making investment decisions and should not be construed as research or investment advice regarding particular securities. Current and future holdings are subject to risk.
The Global Industry Classification Standard (GICS) was developed by and is the exclusive property and a service mark of Morgan Stanley Capital International Inc. (MSCI) and Standard & Poor’s®, a division of The McGraw-Hill Companies, Inc. (S&P) and is licensed for use by Goldman Sachs. Neither MSCI, S&P nor any other party involved in making or compiling the GICS or any GICS classifications makes any express or implied warranties or representations with respect to such standard or classification (or the results to be obtained by the use thereof), and all such parties hereby expressly disclaim all warranties of originality, accuracy, completeness, merchantability or fitness for a particular purpose with respect to any of such standard or classification. Without limiting any of the foregoing, in no event shall MSCI, S&P, any of their affiliates or any third party involved in making or compiling the GICS or any GICS classifications have any liability for any direct, indirect, special, punitive, consequential or any other damages (including lost profits) even if notified of the possibility of such damages.
The portfolio risk management process includes an effort to monitor and manage risk, but does not imply low risk.
This material is not authorized for distribution to prospective investors unless preceded or accompanied by a current Prospectus or summary prospectus, if applicable. Investors should consider a Fund’s objective, risks, and charges and expenses, and read the summary prospectus, if available, and/or the Prospectus carefully before investing or sending money. The summary prospectus, if available, and the Prospectus contain this and other information about a Fund and may be obtained from your authorized dealer or from Goldman Sachs & Co. LLC by calling (retail – 1-800-526-7384) (institutional – 1-800-621-2550).
© 2022 Goldman Sachs. All rights reserved. 295263-OTU-10/2022EQGRWAR-22
Goldman Sachs Funds
| Annual Report | August 31, 2022 | |||
| Fundamental Equity Value Funds | ||||
| Equity Income | ||||
| Focused Value | ||||
| Large Cap Value | ||||
| Mid Cap Value | ||||
| Small Cap Value | ||||
| Small/Mid Cap Value | ||||

Goldman Sachs Fundamental Equity Value Funds
| ∎ | EQUITY INCOME |
| ∎ | FOCUSED VALUE |
| ∎ | LARGE CAP VALUE |
| ∎ | MID CAP VALUE |
| ∎ | SMALL CAP VALUE |
| ∎ | SMALL/MID CAP VALUE |
|
| ||||
| 1 | ||||
| 3 | ||||
| 33 | ||||
| 49 | ||||
| 56 | ||||
| 64 | ||||
| 71 | ||||
| 79 | ||||
| 87 | ||||
| 95 | ||||
| 102 | ||||
| 121 | ||||
| 128 | ||||
| NOT FDIC-INSURED | May Lose Value | No Bank Guarantee | ||
MARKET REVIEW
Goldman Sachs Fundamental Equity Value Funds
Overall, U.S. equities struggled during the 12 months ended August 31, 2022 (the “Reporting Period”). The Standard & Poor’s® 500 Index (the “S&P 500 Index”) ended the Reporting Period with a return of -11.23%. The Russell 3000® Index generated a return of -13.28%. Persistent supply-chain disruptions, shifting U.S. Federal Reserve (“Fed”) policy, heightened inflation levels, COVID-19 pandemic overhangs and ongoing war between Russia and Ukraine were the primary concerns pressuring the U.S. equity markets during the Reporting Period.
As the Reporting Period began in September 2021, the S&P 500 Index saw its first decline since January 2021 and its worst month since September 2020. Investors’ focus centered around Fed tapering, complex legislative negotiations, persistent supply-chain disruptions, spread of the COVID-19 Delta variant, global risk events, rising energy costs and the rapid uptick in U.S. Treasury yields.
During the fourth quarter of 2021, the S&P 500 Index increased in October, fell in November and increased in December. The third quarter corporate earnings season propelled a U.S. equity market rally in October, with retail earnings upside surprises and hints of easing supply-chain constraints supporting the market’s upward trajectory into early November. Later in November, a $1 trillion infrastructure bill was signed into law, and Fed Chair Powell was appointed for a second term, bringing clarity to the Fed’s leadership. However, renewed concerns around COVID-19 developments pressured U.S. equities, with the emergence of the more contagious Omicron variant triggering a sell-off. Persistently high inflation also weighed on market sentiment. In December, the S&P 500 Index rebounded despite record COVID-19 case counts in many population centers in the U.S., as studies showed the variant was generally accompanied by milder symptoms than previous variants. Positive seasonality and the so-called “Santa Rally” also lifted the S&P 500 Index towards the end of the month. The Fed walked back its use of “transitory” in describing the inflationary environment and announced it would double its pace of asset purchase tapering and indicated potential interest rate hikes in 2022.
During the first quarter of 2022, the S&P 500 Index fell, marking its first quarterly decline since the first quarter of 2020. Among the major economic and geopolitical developments were the dramatic repricing of the Fed interest rate hike path and accelerated expectations for a more aggressive balance sheet runoff phase due to concerns about elevated and persistent inflation pressures. The hawkish Fed policy shift drove a large increase in bond yields, and U.S. Treasuries suffered one of their worst quarters on record. (Hawkish suggest higher interest rates; opposite of dovish.) COVID-19, and more specifically, the Omicron variant, was still an overhang, with resurgent cases bringing back supply-chain issues and worker shortages. Amid this backdrop, dampened corporate earnings momentum played into the bearish narrative for the U.S. equities markets. (Bearish refers to an expected downward movement in the prices of securities.) Growth equities meaningfully lagged value equities as a potential by-product of anticipated higher interest rates in the near term.
The S&P 500 Index fell more dramatically in the second quarter of 2022, as inflation, the Fed’s policy response and recession worries were at the core of investors’ narratives, resulting in a broad risk-off, or heightened risk aversion, atmosphere. Geopolitical overhang also remained a concern, as it affected energy prices, leading to low consumer sentiment and potentially changing consumer spending trends. On the other hand, equity inflows, buyback strength, insider buying, resilient consumer spending and some hints of cooling in the labor market were seen by the consensus as tailwinds. In late May/early June 2022, it remained unclear whether a rebound seen in the U.S. equity markets from the May 20, 2022 year-to-date low represented the start of a recovery or a bear-market rally. This question was quickly answered later in the month after the release of a higher than consensus expected May Consumer Price Index report, which sent the S&P 500 Index to a new year-to-date low. Moreover, following a 25 basis point hike in March 2022 and a 50 basis point increase in May 2022, the Fed agreed to a 75 basis point interest rate hike during its June 2022 meeting, wherein Fed Chair Powell asserted the Fed’s unconditional commitment to price stability with a policy response evolving based on incoming data. (A basis point is 1/100th of a percentage point.) At the end of the quarter, investors were looking ahead to the second quarter corporate earnings reporting season with some caution, as input price pressures and consumption trends factored into analyst arguments for downward revisions to earnings estimates.
In July 2022, U.S. equities rallied strongly, posting its largest monthly gain since November 2020 even as the Fed delivered another 75 basis point interest rate hike and Fed Chair Powell reiterated the central bank’s commitment to bringing inflation back to its target around 2%. Despite fears about aggressive monetary policy tightening and indications the U.S. economy had
1
MARKET REVIEW
contracted for a second consecutive quarter, stocks advanced amid mostly better than consensus expected corporate earnings and a decline in mid- to longer-term inflation expectations. U.S. equities continued to rally through mid-August 2022 driven by softer U.S. inflation readings and strong labor market data. However, the S&P 500 Index gave up its gains in the second half of the month on the back of hawkish Fed commentary. Business and consumer confidence remained depressed, pointing toward persistent weakness in economic activity. However, the U.S. labor market added 315,000 jobs in August. While the U.S. unemployment rate inched up from 3.5% to 3.7%, it was largely driven by a higher participation rate, i.e. increased labor supply rather than weaker labor demand. Nonetheless, given the moderating but elevated inflation, the Fed continued to signal further monetary tightening, which hurt the U.S. equity market in the latter half of August. In his speech at Jackson Hole, Fed Chair Powell reiterated that restoring price stability would likely require maintaining a restrictive policy stance for some time.
For the Reporting Period overall, only three of the 11 sectors of the S&P 500 Index posted absolute gains, led by the energy sector. Following at some distance were utilities and consumer staples, which also generated positive returns during the Reporting Period. On a relative basis, the weakest performing sectors in the S&P 500 Index were communication services, consumer discretionary and information technology.
Within the U.S. equity market, all capitalization segments generated negative absolute returns during the Reporting Period, but small-cap stocks, as measured by the Russell 2000® Index, were weakest, followed by mid-cap stocks, as measured by the Russell Midcap® Index, and then large-cap stocks, as measured by the Russell 1000® Index. From a style perspective, for the second consecutive 12-month period, value stocks meaningfully outperformed growth stocks on a relative basis across the capitalization spectrum during the Reporting Period. (All as measured by the FTSE Russell indices.)
Looking Ahead
At the end of the Reporting Period, we remained optimistic about the overall strength of the U.S. economy yet vigilant as we navigate anticipated U.S. equity market volatility ahead as the Fed’s hawkish stance, elevated inflation, high commodities prices, China’s economic growth slowdown, the U.S.’ resilient labor market and COVID-19 overhangs remain key factors to watch. While fears of a deep recession have waned, there remains the risk the Fed could overtighten monetary policy, and we do expect economic growth to slow in the U.S. through the end of 2022 and into 2023. Further, given higher oil and gas prices, strength in shelter inflation (inclusive of rent and lodging away from home) and potential COVID-19-related supply disruptions from China, we expect inflation to remain elevated in the near term but then to moderate gradually toward the end of the year. We expect the Fed’s monetary policy to continue to tighten to anchor inflation expectations. Finally, geopolitical uncertainties remain elevated. While uncertainty dominates, we believe some of this had already been priced into the U.S. equity market, as valuations, in our view, were more reasonable at the end of the Reporting Period than at the start of 2022. Amid this backdrop, we intend to stay true, as always, to our quality-first investment approach as we continue to seek to invest in businesses with healthy balance sheets, relatively stable cash flow generation and differentiated business models aligned to secular advantages. We continue to test our strategies and re-evaluate our assumptions with increasing information, staying focused on the long-term investment horizon.
Regardless of market direction, our fundamental, bottom-up stock selection continues to drive our process, rather than headlines or sentiment. We maintain high conviction in the companies the Fundamental Equity Value Funds (the “Funds”) own and believe they have the potential to outperform relative to the broader market regardless of economic growth conditions. We continue to focus on undervalued companies that we believe have comparatively greater control of their own destiny, such as innovators with differentiated products, companies with low cost structures or companies that have been investing in their own businesses and may be poised to gain market share. We remain focused on the long-term performance of the Funds.
As always, deep research resources, a forward-looking investment process and truly actively managed portfolios are keys, in our view, to both preserving capital and outperforming the market over the long term.
2
PORTFOLIO RESULTS
Goldman Sachs Equity Income Fund
Portfolio Composition
Under normal circumstances, the Fund invests at least 80% of its net assets plus any borrowings for investment purposes (measured at the time of purchase) (“Net Assets”) in equity investments. The Fund will generally invest in equity securities that the Goldman Sachs Fundamental Equity U.S. Equity Team considers to have favorable prospects for capital appreciation and/or dividend-paying ability. Although the Fund will invest primarily in publicly traded U.S. securities, including preferred and convertible securities, it may invest up to 25% of its Net Assets in foreign securities, including securities of issuers in emerging countries and securities quoted in foreign currencies. The Fund may also invest up to 20% of its Net Assets in fixed income securities, such as government, corporate and bank debt obligations, that offer the potential to further the Fund’s investment objective of long-term capital appreciation and growth of income.
Portfolio Management Discussion and Analysis
Below, the Goldman Sachs Fundamental Equity U.S. Equity Team discusses the Goldman Sachs Equity Income Fund’s (the “Fund”) performance and positioning for the 12-month period ended August 31, 2022 (the “Reporting Period”).
| Q | How did the Fund perform during the Reporting Period? |
| A | During the Reporting Period, the Fund’s Class A, Class C, Institutional, Service, Investor, Class R6, Class R and Class P Shares generated average annual total returns, without sales charges, of -3.79%, -4.51%, -3.49%, -3.98%, -3.55%, -3.48%, -4.02% and -3.48%, respectively. These returns compare to the -6.23% average annual total return of the Fund’s benchmark, the Russell 1000® Value Index (with dividends reinvested) (the “Russell Index”), during the same period. |
| Q | What key factors were responsible for the Fund’s performance during the Reporting Period? |
| A | While absolute returns disappointed, the Fund outperformed the Russell Index on a relative basis during the Reporting Period due primarily to stock selection. Sector allocation as a whole also contributed positively to the Fund’s relative performance. |
| Q | Which equity market sectors most significantly affected Fund performance? |
| A | The sectors that contributed most positively to the Fund’s relative results during the Reporting Period were communication services, information technology and consumer staples, wherein stock selection proved effective. Having an underweight to communication services, which was the weakest sector in the Russell Index during the Reporting Period, also helped. Only partially offsetting these positive contributors was stock selection in the real estate, materials and utilities sectors, which detracted. |
| Q | What were some of the Fund’s best-performing individual stocks? |
| A | The Fund benefited most relative to the Russell Index from positions in Devon Energy, M&T Bank and Pioneer Natural Resources. |
| Devon Energy, an exploration and production oil and gas company, posted fourth quarter 2021 earnings that featured strong results, with both earnings and dividend amounts higher than market expectations. Investor focus remained on 2022 production and a variable dividend wherein Devon Energy leads the industry. Each subsequent earnings report during the Reporting Period similarly featured results above market expectations, largely due to strong production and execution metrics. At the end of the Reporting Period, our investment thesis continued to revolve around a better than consensus expected variable dividend, increased buybacks and what we saw as a line of sight to significant capital returns. |
| M&T Bank provides retail and commercial banking services. Headwinds arose at the start of 2022, largely due to the bank’s lowered guidance for net interest income. This was a disappointment to many investors because M&T Bank was sitting on a good deal of liquidity that it could deploy into higher earning assets. In April 2022, it was announced that M&T Bank would be acquiring People’s United, but the market did not view this as a favorable transaction. However, its stock rebounded strongly when it reported its first quarter 2022 earnings, thanks to results above market expectations and assets that benefited from rising rates. Ultimately, at the end of the Reporting Period, we believed M&T Bank was on |
3
PORTFOLIO RESULTS
| pace for share buybacks, and investors would continue to closely monitor the net positive guidance the bank’s management had provided. |
| The strong performance of oil and gas exploration and production company Pioneer Natural Resources was supported by subdued oil production, high and improving demand, and new geopolitical tensions fueled by the war in Ukraine. Another point of optimism supporting its stock was that the company is committed to return 75% of its free cash flow in the form of distributions. At the end of the Reporting Period, we believed the company’s healthy balance sheet and efficient production would likely continue to drive performance and keep its earnings in line with market expectations. In our view, the company’s cash yield of approximately 15% also remained attractive. |
| Q | Which stocks detracted significantly from the Fund’s performance during the Reporting Period? |
| A | Detracting most from the Fund’s results relative to the Russell Index were positions in Exxon Mobil, Medtronic and JPMorgan Chase. |
| Oil and gas integrated energy company Exxon Mobil, a new purchase for the Fund during the Reporting Period, was a top detractor from relative results because the Fund held an underweight position in its strongly performing stock. Its shares benefited primarily from an increase in crude oil prices and favorable supply/demand dynamics. Also, in February 2022, it was announced that sweeping restructuring would be taking place across its global operations. Examples of changes included cost cutting and a new headquarters location in Houston. Further, earnings releases in the summer of 2022 featured significant outperformance of market expectations on both net income and earnings per share. Results from its liquid natural gas segment also proved favorable. At the end of the Reporting Period, we continued to see what we viewed as attractive trends in the operations of its business, and we looked to see further capital distributions put in place. |
| Medtronic develops and manufactures device-based medical therapies and services. In December 2021, the company guided down its diabetes-related revenue after a Food & Drug Administration warning letter was released pertaining to Medtronic’s main diabetes plant. Then in January 2022, a competitor received approval for its own device, which was another headwind for Medtronic. Its first quarter 2022 earnings results came in below expectations, but investors were somewhat comforted by an 8% increase in its dividend. We believed a reason for optimism was the Shanghai COVID-19 lockdowns being over, which should help subdue previously supply-chain concerns. At the end of the Reporting Period, we continued to hold the position in the Fund’s portfolio, as we viewed its valuation to be attractive and its dividend to be favorable in comparison to some of its peers. |
| U.S. bank JPMorgan Chase faced cost pressures that harmed its business even as its management remained focused on technology modernization to meet its objectives. Given the higher interest rate environment, JPMorgan Chase remained optimistic on the economy based on consumer spending trends, though geopolitical and economic tensions remained potential drivers of a downturn. The bank was also buying back stock, which typically is a sign of confidence from management, though that strategy was paused in July 2022 so it could build up more capital in the near term. In June 2022, the bank reiterated that it would not reduce its dividend, which was another well-received signal by the market. At the end of the Reporting Period, we maintained our conviction in JPMorgan Chase, as its earnings mostly stemmed during the Reporting Period from high quality sources such as net interest income, expenses and credit, and its valuation, in our view, looked attractive in our base-case economic scenarios. |
| Q | How did the Fund use derivatives and similar instruments during the Reporting Period? |
| A | During the Reporting Period, we did not use derivatives as part of an active management strategy. |
| Q | Did the Fund make any significant purchases or sales during the Reporting Period? |
| A | During the Reporting Period, in addition to the purchase of Exxon Mobil, mentioned earlier, we initiated a Fund position in ConocoPhillips, a predominantly U.S. oil producer. We believe the company has one of the most disciplined variable capital return policies. ConocoPhillips pays out a percentage of its cash flow from operations, while peers have adopted a percentage of free cash flow as their model. In our view, this policy may well help to ensure that ConocoPhillips stays disciplined regarding its capital spending plan. Since the time of the Fund’s purchase of its stock, ConocoPhillips experienced an increase in its production of oil per day and anticipated a further increase going forward. |
| Conversely, we eliminated the Fund’s position in Chevron, a global integrated energy, chemical and petroleum company, in early March 2022. Chevron has approximately 22% of its |
4
PORTFOLIO RESULTS
| production in Kazakhstan, which we viewed as a high regional risk that is not appropriate for the Fund’s strategy. |
| We sold the Fund’s position in snack food and beverage manufacturer Mondelez International in June 2022. Some uncontrollable factors such as foreign currency headwinds, inflation and geopolitical tensions had become rising concerns for us. Also, our conviction in other stocks was stronger, so we exited the position in favor of other investments. |
| Q | Were there any changes to the Fund’s portfolio management team during the Reporting Period? |
| A | There were no changes to the Fund’s portfolio management team during the Reporting Period. |
| Q | Were there any notable changes in the Fund’s weightings during the Reporting Period? |
| A | In constructing the Fund’s portfolio, we focus on picking stocks rather than on making industry or sector bets. We seek to outpace the benchmark index by overweighting stocks that we expect to outperform and underweighting those that we think may lag. Consequently, changes in its sector weights are generally the direct result of individual stock selection or of stock appreciation or depreciation. That said, during the Reporting Period, the Fund’s allocations compared to the Russell Index in communication services, financials, health care and industrials increased. The Fund’s exposure to consumer staples, materials, real estate and utilities decreased compared to the Russell Index. |
| Q | How was the Fund positioned relative to its benchmark index at the end of August 2022? |
| A | At the end of August 2022, the Fund had overweight positions relative to the Russell Index in the information technology, utilities and industrials sectors. On the same date, the Fund had underweight positions compared to the Russell Index in communication services and financials and was rather neutrally weighted to the Russell Index in consumer discretionary, consumer staples, energy, health care, materials and real estate. |
5
FUND BASICS
Equity Income Fund
as of August 31, 2022
| TOP 10 HOLDINGS AS OF 8/31/221 | ||||||||||
| Holding | % of Net Assets | Line of Business | Country | |||||||
| JPMorgan Chase & Co. | 3.1 | % | Banks | United States | ||||||
| Johnson & Johnson | 2.9 | Pharmaceuticals | United States | |||||||
| Bristol-Myers Squibb Co. | 2.4 | Pharmaceuticals | United States | |||||||
| NextEra Energy, Inc. | 2.3 | Electric Utilities | United States | |||||||
| ConocoPhillips | 2.1 | Oil, Gas & Consumable Fuels | United States | |||||||
| Bank of America Corp. | 2.1 | Banks | United States | |||||||
| Exxon Mobil Corp. | 2.1 | Oil, Gas & Consumable Fuels | United States | |||||||
| M&T Bank Corp. | 2.0 | Banks | United States | |||||||
| CVS Health Corp. | 2.0 | Health Care Providers & Services | United States | |||||||
| AT&T, Inc. | 1.9 | Diversified Telecommunication Services | United States | |||||||
| 1 | The top 10 holdings may not be representative of the Fund’s future investments. |
| FUND VS. BENCHMARK SECTOR ALLOCATIONS2 |
| As of August 31, 2022 |

| 2 | The Fund is actively managed and, as such, its composition may differ over time. Consequently, the Fund’s overall sector allocations may differ from the percentages contained in the graph above. Figures in the above graph may not sum to 100% due to the exclusion of other assets and liabilities. The graph categorizes investments using the Global Industry Classification Standard (“GICS”); however, the sector classifications used by the portfolio management team may differ from GICS. The percentage shown for each investment category reflects the value of investments in that category as a percentage of market value. Investments in the securities lending reinvestment vehicle represented 0.6% of the Fund’s net assets as of August 31, 2022. The graph depicts the Fund’s investments but may not represent the Fund’s market exposure due to the exclusion of certain derivatives, if any, as listed in the Additional Investment Information section of the Schedule of Investments. |
For more information about the Fund, please refer to www.GSAMFUNDS.com. There, you can learn more about the Fund’s investment strategies, holdings, and performance.
6
GOLDMAN SACHS EQUITY INCOME FUND
Performance Summary
August 31, 2022
The following graph shows the value, as of August 31, 2022, of a $10,000 investment made on September 1, 2012 in Class A Shares (with the maximum sales charge of 5.5%) . For comparative purposes, the performance of the Fund’s benchmark, the Russell 1000® Value Index (with dividends reinvested), is shown. Performance reflects applicable fee waivers and/or expense limitations in effect during the periods shown and in their absence, performance would be reduced. Returns do not reflect the deduction of taxes that a shareholder would pay on Fund distributions or the redemption of Fund shares. The returns set forth below represent past performance. Past performance does not guarantee future results. The Fund’s investment return and principal value will fluctuate so that an investor’s shares, when redeemed, may be worth more or less than their original cost. Current performance may be lower or higher than the performance quoted below. Please visit our web site at www.GSAMFUNDS.com to obtain the most recent month-end returns.
| Equity Income Fund’s 10 Year Performance |
Performance of a $10,000 Investment, including any applicable sales charges, with distributions reinvested, from September 1, 2012 through August 31, 2022.

| Average Annual Total Return through August 31, 2022* | One Year | Five Years | Ten Years | Since Inception | ||||||||||
| Class A |
||||||||||||||
| Excluding sales charges |
-3.79% | 7.73% | 9.79% | — | ||||||||||
| Including sales charges |
-9.08% | 6.51% | 9.17% | — | ||||||||||
|
| ||||||||||||||
| Class C |
||||||||||||||
| Excluding contingent deferred sales charges |
-4.51% | 6.94% | 8.98% | — | ||||||||||
| Including contingent deferred sales charges |
-5.46% | 6.94% | 8.98% | — | ||||||||||
|
| ||||||||||||||
| Institutional |
-3.49% | 8.10% | 10.20% | — | ||||||||||
|
| ||||||||||||||
| Service |
-3.98% | 7.56% | 9.66% | — | ||||||||||
|
| ||||||||||||||
| Investor |
-3.55% | 8.00% | 10.07% | — | ||||||||||
|
| ||||||||||||||
| Class R6 (Commenced July 31, 2015) |
-3.48% | 8.11% | N/A | 7.43% | ||||||||||
|
| ||||||||||||||
| Class R |
-4.02% | 7.46% | 9.52% | — | ||||||||||
|
| ||||||||||||||
| Class P (Commenced April 17, 2018) |
-3.48% | N/A | N/A | 7.83% | ||||||||||
|
| ||||||||||||||
| * | These returns assume reinvestment of all distributions at NAV and reflect a maximum initial sales charge of 5.50% for Class A Shares and the assumed contingent deferred sales charge for Class C Shares (1% if redeemed within 12 months of purchase). Because Institutional, Service, Investor, Class P, Class R and Class R6 Shares do not involve a sales charge, such a charge is not applied to their Average Annual Total Return. |
7
PORTFOLIO RESULTS
Goldman Sachs Focused Value Fund
Portfolio Composition
The Fund’s investment objective is to seek long-term capital appreciation. The Fund invests, under normal circumstances, at least 80% of its net assets plus any borrowings for investment purposes (measured at time of purchase) in a portfolio of equity investments, including common stocks, preferred stocks and other securities and instruments having equity characteristics. The Fund seeks to achieve its investment objective by investing, under normal circumstances, in approximately 20-40 companies that are considered value opportunities, which the Investment Adviser defines as companies with identifiable competitive advantages whose intrinsic value is not reflected in the stock price. The Fund may invest in securities of companies of any capitalization. Although the Fund will invest primarily in publicly traded U.S. securities, it may invest up to 20% of its total assets in foreign securities, including securities of issuers in countries with emerging markets or economies (“emerging countries”) and securities quoted in foreign currencies. The Fund may invest in fixed income securities, such as government, corporate and bank debt obligations.
Portfolio Management Discussion and Analysis
Below, the Goldman Sachs Fundamental Equity U.S. Equity Team discusses the Goldman Sachs Focused Value Fund’s (the “Fund”) performance and positioning for the 12-month period ended August 31, 2022 (the “Reporting Period”).
| Q | How did the Fund perform during the Reporting Period? |
| A | During the Reporting Period, the Fund’s Class A, Class C, Institutional, Investor, Class R6, Class R and Class P Shares generated average annual total returns, without sales charges, of -6.29%, -6.93%, -5.98%, -6.06%, -5.90%, -6.47% and -5.96%, respectively. These returns compare to the -6.23% average annual total return of the Fund’s benchmark, the Russell 1000® Value Index (with dividends reinvested) (the “Russell Index”), during the same period. |
| Q | What key factors were responsible for the Fund’s performance during the Reporting Period? |
| A | While absolute returns disappointed, several share classes of the Fund outperformed the Russell Index on a relative basis due primarily to sector allocation overall. Stock selection as a whole also contributed positively to the Fund’s performance relative to the Russell Index during the Reporting Period, albeit more modestly. |
| Q | Which equity market sectors most significantly affected Fund performance? |
| A | Contributing most positively to the Fund’s relative results were having an underweight to communication services, which underperformed the Russell Index during the Reporting Period, and having an overweight to consumer staples, which outperformed the Russell Index during the Reporting Period. Further, stock selection proved especially effective in the communication services, consumer staples and energy sectors. Only partially offsetting these positive contributors was stock selection in the materials, industrials and utilities sectors, which detracted. |
| Q | What were some of the Fund’s best-performing individual stocks? |
| A | The Fund benefited most relative to the Russell Index from positions in Devon Energy, Humana and Coca-Cola. |
| Devon Energy, an exploration and production oil and gas company, posted fourth quarter 2021 earnings that featured strong results, with both earnings and dividend amounts higher than market expectations. Investor focus remained on 2022 production and a variable dividend wherein Devon Energy leads the industry. Each subsequent earnings report during the Reporting Period similarly featured results above market expectations, largely due to strong production and execution metrics. At the end of the Reporting Period, our investment thesis continued to revolve around a better than consensus expected variable dividend, increased buybacks and what we saw as a line of sight to significant capital returns. |
| Shares of health insurance services provider Humana fell by approximately 10% in early January 2022 when its net membership growth estimates for Medicare Advantage products were reduced significantly. However, its shares rebounded relatively quickly after this announcement, as its earnings results continued to surpass market expectations throughout the first eight months of 2022. At the end of the |
8
PORTFOLIO RESULTS
| Reporting Period, we continued to view Humana as one of our preferred names within the health insurance industry. |
| Despite inflation and rising costs for both businesses and consumers, the products of beverage manufacturer and distributor Coca-Cola were relatively inelastic from a demand perspective during the Reporting Period. Its earnings reports reflected this as well, given the company surpassed estimates consistently during the Reporting Period. At the end of the Reporting Period, we continued to believe Coca-Cola has not only a durable supply chain that can endure potential headwinds but also strong brand loyalty and a commitment towards making its products more recyclable and environmentally friendly. |
| Q | Which stocks detracted significantly from the Fund’s performance during the Reporting Period? |
| A | Detracting most from the Fund’s results relative to the Russell Index were positions in industrial conglomerate General Electric, metal packaging provider Ball and cloud-based software solutions provider for customer relationship management Salesforce. |
| General Electric’s stock, in our view, remained a large, complicated turnaround story, and the difficult operating environment seen in 2022 made it difficult for company management to effectively weather the storm. For example, COVID-19-induced lockdowns in China were one of the major headwinds, harming General Electric’s production capacity, in particular. That said, in July 2022, company management sentiment was notably more positive, as much of the supply-chain disruptions had subdued, and operational results began to take a turn for the better. At the end of the Reporting Period, we believed the reasons for General Electric’s weak performance during the Reporting Period were more of a shorter-term concern, and we expected some of the synergies between its business segments to further realize in the relatively near term. |
| Shares of Ball, a new purchase for the Fund during the Reporting Period, performed well in the late part of 2021 based on strong performance reports, but its first quarter 2022 earnings report missed consensus expectations. The miss was mostly driven by an approximately 21% volume decline in its Latin American business due to flooding in the region. Also, its earnings report released in early August 2022 featured surprisingly weak results due to a sizeable slowdown in its Americas business, as consumers came under cost pressures. At the end of the Reporting Period, our longer-term investment thesis for Ball remained intact, as we continued to see a multi-year growth story for aluminum products, for which Ball should be a primary beneficiary. |
| In December 2021, Salesforce, another new purchase for the Fund during the Reporting Period, announced disappointing earnings results, largely attributable to underperformance in its Mulesoft business, which was working through some execution challenges during the Reporting Period. The company’s forward guidance was moderately optimistic through 2022, as Slack, the proprietary communication platform of Slack Technologies, was being integrated into the business, though lofty market expectations kept the bar high. At the end of the Reporting Period, we believed Salesforce’s management would likely remain diligent on operating margin expansion, and we believed synergies amongst its business arms could continue to drive further efficiency. |
| Q | How did the Fund use derivatives and similar instruments during the Reporting Period? |
| A | During the Reporting Period, we did not use derivatives as part of an active management strategy. |
| Q | Did the Fund make any significant purchases or sales during the Reporting Period? |
| A | During the Reporting Period, in addition to those purchases mentioned earlier, we initiated a Fund position in retailing giant Walmart, as the company had reported quarterly revenue that beat market expectations driven by strong U.S. comparable sales and double-digit growth in memberships. We continued to purchase shares of Walmart as the Reporting Period progressed at what we viewed as discounted valuations, as we expect challenges regarding inventory headwinds, supply-chain constraints and rising fuel costs to ease in the near future. We firmly believe in the long-term value of the company, as it has displayed strength with its grocery, subscription and private-label business segments. |
| We established a Fund position in commercial/personal property and casualty insurance provider Chubb during the Reporting Period. In our view, its stock benefitted from a difficult insurance market through the first half of 2022, and we expect strong execution with operational efficiency to potentially continue should the market begin to soften at this point in the market cycle. |
| Conversely, we exited the Fund’s position in Google parent company Alphabet in January 2022. At the time, we had concerns that 2022 would see a combination of tough |
9
PORTFOLIO RESULTS
| comparisons and expense pressures, limiting the ability for the company to further appreciate amid a weakening advertisement environment, so we reallocated the sales proceeds to other investment opportunities. |
| We eliminated the Fund’s position in semiconductor manufacturer Marvell Technology in June 2022. On the back of stronger than consensus anticipated earnings and performance to those names with exposure to the autos and industrial end-markets, we decided to realize some of the gains the Fund had seen from this holding and reallocate to what we saw as investments with more attractive risk/reward profiles. |
| Q | Were there any changes to the Fund’s portfolio management team during the Reporting Period? |
| A | There were no changes to the Fund’s portfolio management team during the Reporting Period. |
| Q | Were there any notable changes in the Fund’s weightings during the Reporting Period? |
| A | In constructing the Fund’s portfolio, we focus on picking stocks rather than on making industry or sector bets. We seek to outpace the benchmark index by overweighting stocks that we expect to outperform and underweighting those that we think may lag. Consequently, changes in its sector weights are generally the direct result of individual stock selection or of stock appreciation or depreciation. That said, during the Reporting Period, the Fund’s allocations compared to the Russell Index in consumer discretionary, consumer staples, financials, health care and information technology increased. The Fund’s exposure to the communication services, industrials, materials and real estate sectors decreased compared to the Russell Index. |
| Q | How was the Fund positioned relative to its benchmark index at the end of August 2022? |
| A | At the end of August 2022, the Fund was overweight in health care and consumer staples relative to the Russell Index. On the same date, the Fund was underweight in real estate, communication services, information technology and financials and was rather neutrally weighted to the Russell Index in consumer discretionary, industrials, utilities, energy and materials. |
10
FUND BASICS
Focused Value Fund
as of August 31, 2022
| TOP 10 HOLDINGS AS OF 8/31/221 | ||||||||||
| Holding | % of Net Assets | Line of Business | Country | |||||||
| Bristol-Myers Squibb Co. | 5.5 | % | Pharmaceuticals | United States | ||||||
| Walmart, Inc. | 5.1 | Food & Staples Retailing | United States | |||||||
| Humana, Inc. | 5.1 | Health Care Providers & Services | United States | |||||||
| Chubb Ltd. | 5.0 | Insurance | United States | |||||||
| Devon Energy Corp. | 4.2 | Oil, Gas & Consumable Fuels | United States | |||||||
| JPMorgan Chase & Co. | 3.9 | Banks | United States | |||||||
| Bank of America Corp. | 3.7 | Banks | United States | |||||||
| General Electric Co. | 3.5 | Industrial Conglomerates | United States | |||||||
| NextEra Energy, Inc. | 3.5 | Electric Utilities | United States | |||||||
| KLA Corp. | 3.5 | Semiconductors & Semiconductor Equipment | United States | |||||||
| 1 | The top 10 holdings may not be representative of the Fund’s future investments. |
| FUND VS. BENCHMARK SECTOR ALLOCATIONS2 |
| As of August 31, 2022 |

| 2 | The Fund is actively managed and, as such, its composition may differ over time. Consequently, the Fund’s overall sector allocations may differ from the percentages contained in the graph above. Figures in the above graph may not sum to 100% due to the exclusion of other assets and liabilities. The graph categorizes investments using the Global Industry Classification Standard (“GICS”); however, the sector classifications used by the portfolio management team may differ from GICS. The percentage shown for each investment category reflects the value of investments in that category as a percentage of market value. The graph depicts the Fund’s investments but may not represent the Fund’s market exposure due to the exclusion of certain derivatives, if any, as listed in the Additional Investment Information section of the Schedule of Investments. |
For more information about the Fund, please refer to www.GSAMFUNDS.com. There, you can learn more about the Fund’s investment strategies, holdings, and performance.
11
GOLDMAN SACHS FOCUSED VALUE FUND
Performance Summary
August 31, 2022
The following graph shows the value, as of August 31, 2022, of a $1,000,000 investment made on July 31, 2015 (commencement of operations) in Institutional Shares at NAV. For comparative purposes, the performance of the Fund’s benchmark, the Russell 1000® Value Index (with dividends reinvested), is shown. Performance reflects applicable fee waivers and/or expense limitations in effect during the periods shown and in their absence, performance would be reduced. Returns do not reflect the deduction of taxes that a shareholder would pay on Fund distributions or the redemption of Fund shares. The returns set forth below represent past performance. Past performance does not guarantee future results. The Fund’s investment return and principal value will fluctuate so that an investor’s shares, when redeemed, may be worth more or less than their original cost. Current performance may be lower or higher than the performance quoted below. Please visit our web site at www.GSAMFUNDS.com to obtain the most recent month-end returns.
| Focused Value Fund’s Lifetime Performance |
Performance of a $1,000,000 Investment, including any applicable sales charges, with distributions reinvested, from July 31, 2015 through August 31, 2022.
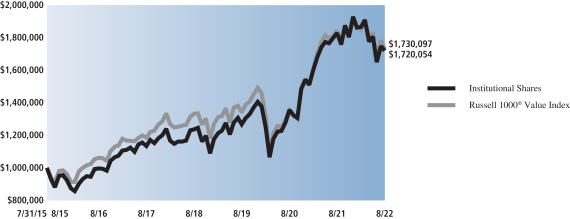
| Average Annual Total Return through August 31, 2022* | One Year | Five Years | Since Inception | |||||||
| Class A (Commenced July 31, 2015) |
||||||||||
| Excluding sales charges |
-6.29% | 8.29% | 7.56% | |||||||
| Including sales charges |
-11.42% | 7.07% | 6.71% | |||||||
|
| ||||||||||
| Class C (Commenced July 31, 2015) |
||||||||||
| Excluding contingent deferred sales charges |
-6.93% | 7.49% | 6.77% | |||||||
| Including contingent deferred sales charges |
-7.86% | 7.49% | 6.77% | |||||||
|
| ||||||||||
| Institutional (Commenced July 31, 2015) |
-5.98% | 8.67% | 7.95% | |||||||
|
| ||||||||||
| Investor (Commenced July 31, 2015) |
-6.06% | 8.57% | 7.83% | |||||||
|
| ||||||||||
| Class R6 (Commenced July 31, 2015) |
-5.90% | 8.68% | 7.97% | |||||||
|
| ||||||||||
| Class R (Commenced July 31, 2015) |
-6.47% | 8.02% | 7.30% | |||||||
|
| ||||||||||
| Class P (Commenced April 17, 2018) |
-5.96% | N/A | 9.20% | |||||||
|
| ||||||||||
| * | These returns assume reinvestment of all distributions at NAV and reflect a maximum initial sales charge of 5.50% for Class A Shares and the assumed contingent deferred sales charge for Class C Shares (1% if redeemed within 12 months of purchase). Because Institutional, Investor, Class P, Class R and Class R6 Shares do not involve a sales charge, such a charge is not applied to their Average Annual Total Return. |
12
PORTFOLIO RESULTS
Goldman Sachs Large Cap Value Fund
Portfolio Composition
The Fund invests, under normal circumstances, at least 80% of its net assets plus any borrowings for investment purposes (measured at the time of purchase) in a diversified portfolio of equity investments in large-cap issuers with public stock market capitalizations within the range of the market capitalization of companies constituting the Russell 1000® Value Index at the time of investment. The Fund seeks its investment objective of long-term capital appreciation by investing in value opportunities that the Goldman Sachs Fundamental Equity U.S. Equity Team defines as companies with identifiable competitive advantages whose intrinsic value is not reflected in the stock price. Although the Fund will invest primarily in publicly traded U.S. securities, including preferred and convertible securities, it may invest in foreign securities, including securities quoted in foreign currencies. The Fund may also invest in fixed income securities, such as government, corporate and bank debt obligations.
Portfolio Management Discussion and Analysis
Below, the Goldman Sachs Fundamental Equity U.S. Equity Team discusses the Goldman Sachs Large Cap Value Fund’s (the “Fund”) performance and positioning for the 12-month period ended August 31, 2022 (the “Reporting Period”).
| Q | How did the Fund perform during the Reporting Period? |
| A | During the Reporting Period, the Fund’s Class A, Class C, Institutional, Service, Investor, Class R6, Class R and Class P Shares generated average annual total returns, without sales charges, of -5.23%, -5.87%, -4.88%, -5.33%, -4.94%, -4.86%, -5.46% and -4.92%, respectively. These returns compare to the -6.23% average annual total return of the Fund’s benchmark, the Russell 1000® Value Index (with dividends reinvested) (the “Russell Index”), during the same period. |
| Q | What key factors were responsible for the Fund’s performance during the Reporting Period? |
| A | While absolute returns disappointed, the Fund outperformed the Russell Index on a relative basis due primarily to stock selection overall. Sector allocation as a whole also contributed positively, albeit more modestly, during the Reporting Period. |
| Q | Which equity market sectors most significantly affected Fund performance? |
| A | Contributing most positively to the Fund’s performance relative to the Russell Index was effective stock selection in the financials, energy and consumer staples sectors. Only partially offsetting these positive contributors were health care, materials and industrials, as stock selection in each detracted. |
| Q | What were some of the Fund’s best-performing individual stocks? |
| A | The Fund benefited most relative to the Russell Index from positions in the energy sector — namely, Devon Energy, ConocoPhillips and Hess. |
| Devon Energy, an exploration and production oil and gas company, posted fourth quarter 2021 earnings that featured strong results, with both earnings and dividend amounts higher than market expectations. Investor focus remained on 2022 production and a variable dividend wherein Devon Energy leads the industry. Each subsequent earnings report during the Reporting Period similarly featured results above market expectations, largely due to strong production and execution metrics. At the end of the Reporting Period, our investment thesis continued to revolve around a better than consensus expected variable dividend, increased buybacks and what we saw as a line of sight to significant capital returns. |
| ConocoPhillips, a predominantly U.S. oil producer, saw its stock appreciate in the first quarter of 2022 when it announced fourth quarter 2021 earnings higher than consensus expectations and increased its cash return guidance for 2022. The company also benefited from the broad rally in energy stocks, as crude oil prices rose in the wake of geopolitical tensions. In the second quarter of 2022, ConocoPhillips increased its 2022 cash return guidance from $2 billion to $10 billion. A significant expansion of its global liquid natural gas business through investment in new facilities was also viewed favorably by investors. At the end |
13
PORTFOLIO RESULTS
| of the Reporting Period, we remained optimistic about ConocoPhillips, as we believed the company continues to have a high level of execution with disciplined investment, consistent return of cash, and a high quality portfolio that we believe may well deliver free cash flow growth. |
| Exploration and production company Hess reported a strong fourth quarter earnings release, with earnings surpassing consensus expectations and capital expenditures being well below its previous guidance. The company also announced a number of new discoveries in Guyana through the first quarter of 2022 and benefited from the then-current operating environment. Its production was further expanded later in 2022 in an efficient manner thanks to further reserve discoveries in Guyana, though its disappointing North Dakota operations offset some of that. At the end of the Reporting Period, we remained optimistic about the prospects of Hess given a fairly significant inflection in its cash flow profile, and we were hoping to see further dividend increases and shareholder returns. |
| Q | Which stocks detracted significantly from the Fund’s performance during the Reporting Period? |
| A | Detracting most from the Fund’s results relative to the Russell Index were positions in Exxon Mobil, Salesforce and Ball. |
| Oil and gas integrated energy company Exxon Mobil, a new purchase for the Fund during the Reporting Period, was a top detractor from relative results because the Fund held an underweight position in its strongly performing stock. Its shares benefited primarily from an increase in crude oil prices and favorable supply/demand dynamics. Also, in February 2022, it was announced that sweeping restructuring would be taking place across its global operations. Examples of changes included cost cutting and a new headquarters location in Houston. Further, earnings releases in the summer of 2022 featured significant outperformance of market expectations on both net income and earnings per share. Results from its liquid natural gas segment also proved favorable. At the end of the Reporting Period, we continued to see what we viewed as attractive trends in the operations of its business, and we looked to see further capital distributions put in place. |
| Salesforce provides cloud-based software solutions for customer relationship management. In December 2021, Salesforce, another new purchase for the Fund during the Reporting Period, announced disappointing earnings results, largely attributable to underperformance in its MuleSoft business, which was working through some execution challenges during the Reporting Period. MuleSoft, a part of Salesforce since 2018, is a platform that seeks to give IT departments the tools to automate the integration of data and systems, workflows and processes, and digital experiences all in one place. The company’s forward guidance was moderately optimistic through 2022, as Slack, the proprietary communication platform of Slack Technologies, was being integrated into the business, though lofty market expectations kept the bar high. At the end of the Reporting Period, we believed Salesforce’s management would most likely remain diligent on operating margin expansion, and we believed synergies amongst its business arms could continue to drive further efficiency. |
| Shares of metal packing provider Ball performed well in the late part of 2021 based on strong performance reports, but its first quarter 2022 earnings report missed consensus expectations. The miss was mostly driven by an approximately 21% volume decline in its Latin American business due to flooding in the region. Also, its earnings report released in early August 2022 featured surprisingly weak results due to a sizeable slowdown in its Americas business, as consumers came under cost pressures. At the end of the Reporting Period, our longer-term investment thesis for Ball remained intact, as we continued to see a multi-year growth story for aluminum products, for which Ball should be a primary beneficiary. |
| Q | How did the Fund use derivatives and similar instruments during the Reporting Period? |
| A | During the Reporting Period, we did not use derivatives as part of an active management strategy. |
| Q | Did the Fund make any significant purchases or sales during the Reporting Period? |
| A | During the Reporting Period, in addition to those purchases already mentioned, we initiated a Fund position in Meta Platforms. The company, formerly known as Facebook, engages in the development of social media applications. We believe the company has an attractive valuation and is focusing its efforts on different new devices to diversify and enter new markets. We are also optimistic that the company will maintain what we view as its attractive operating margins and that the broader industry has positive tailwinds. |
| Conversely, we sold the Fund’s position in media and technology company Comcast in August 2022. Our investment thesis had become invalidated, so we decided to reallocate the sales proceeds toward other names in which we held more conviction. |
14
PORTFOLIO RESULTS
| We eliminated the Fund’s position in Chevron, a global integrated energy, chemical and petroleum company, in early March 2022. Chevron has approximately 22% of its production in Kazakhstan, which we viewed as a high regional risk that is not appropriate for the Fund’s strategy. |
| Q | Were there any changes to the Fund’s portfolio management team during the Reporting Period? |
| A | There were no changes to the Fund’s portfolio management team during the Reporting Period. |
| Q | Were there any notable changes in the Fund’s weightings during the Reporting Period? |
| A | In constructing the Fund’s portfolio, we focus on picking stocks rather than on making industry or sector bets. We seek to outpace the benchmark index by overweighting stocks that we expect to outperform and underweighting those that we think may lag. Consequently, changes in its sector weights are generally the direct result of individual stock selection or of stock appreciation or depreciation. That said, during the Reporting Period, the Fund’s allocation compared to the Russell Index in health care increased. The Fund’s exposure to financials and real estate decreased compared to the Russell Index. |
| Q | How was the Fund positioned relative to its benchmark index at the end of August 2022? |
| A | At the end of August 2022, the Fund had overweight positions relative to the Russell Index in the health care and materials sectors. On the same date, the Fund had underweight positions compared to the Russell Index in communication services, financials and real estate and had rather neutral allocations relative to the Russell Index in consumer discretionary, consumer staples, energy, industrials, information technology and utilities. |
15
FUND BASICS
Large Cap Value Fund
as of August 31, 2022
| TOP 10 HOLDINGS AS OF 8/31/221 | ||||||||||
| Holding | % of Net Assets | Line of Business | Country | |||||||
| Johnson & Johnson | 3.5 | % | Pharmaceuticals | United States | ||||||
| JPMorgan Chase & Co. | 2.8 | Banks | United States | |||||||
| Meta Platforms, Inc., Class A | 2.6 | Interactive Media & Services | United States | |||||||
| Bank of America Corp. | 2.4 | Banks | United States | |||||||
| ConocoPhillips | 2.3 | Oil, Gas & Consumable Fuels | United States | |||||||
| Exxon Mobil Corp. | 2.2 | Oil, Gas & Consumable Fuels | United States | |||||||
| NextEra Energy, Inc. | 2.2 | Electric Utilities | United States | |||||||
| Bristol-Myers Squibb Co. | 2.1 | Pharmaceuticals | United States | |||||||
| Walmart, Inc. | 2.1 | Food & Staples Retailing | United States | |||||||
| Morgan Stanley | 1.8 | Capital Markets | United States | |||||||
| 1 | The top 10 holdings may not be representative of the Fund’s future investments. |
| FUND VS. BENCHMARK SECTOR ALLOCATIONS2 |
| As of August 31, 2022 |

| 2 | The Fund is actively managed and, as such, its composition may differ over time. Consequently, the Fund’s overall sector allocations may differ from the percentages contained in the graph above. Figures in the above graph may not sum to 100% due to the exclusion of other assets and liabilities. The graph categorizes investments using the Global Industry Classification Standard (“GICS”); however, the sector classifications used by the portfolio management team may differ from GICS. The percentage shown for each investment category reflects the value of investments in that category as a percentage of market value. The graph depicts the Fund’s investments but may not represent the Fund’s market exposure due to the exclusion of certain derivatives, if any, as listed in the Additional Investment Information section of the Schedule of Investments. |
For more information about the Fund, please refer to www.GSAMFUNDS.com. There, you can learn more about the Fund’s investment strategies, holdings, and performance.
16
GOLDMAN SACHS LARGE CAP VALUE FUND
Performance Summary
August 31, 2022
The following graph shows the value, as of August 31, 2022, of a $1,000,000 investment made on September 1, 2012 in Institutional Shares at NAV. For comparative purposes, the performance of the Fund’s benchmark, the Russell 1000® Value Index (with dividends reinvested), is shown. Performance reflects applicable fee waivers and/or expense limitations in effect during the periods shown and in their absence, performance would be reduced. Returns do not reflect the deduction of taxes that a shareholder would pay on Fund distributions or the redemption of Fund shares. The returns set forth below represent past performance. Past performance does not guarantee future results. The Fund’s investment return and principal value will fluctuate so that an investor’s shares, when redeemed, may be worth more or less than their original cost. Current performance may be lower or higher than the performance quoted below. Please visit our web site at www.GSAMFUNDS.com to obtain the most recent month-end returns.
| Large Cap Value Fund’s 10 Year Performance |
Performance of a $1,000,000 Investment, including any applicable sales charges, with distributions reinvested, from September 1, 2012 through August 31, 2022.
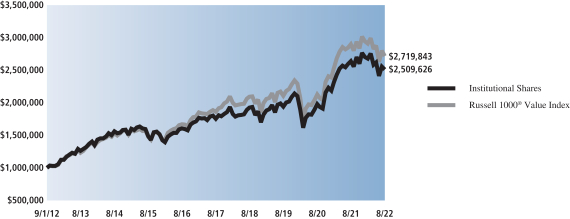
| Average Annual Total Return through August 31, 2022* | One Year | Five Years | Ten Years | Since Inception | ||||||||||
| Class A |
||||||||||||||
| Excluding sales charges |
-5.23% | 7.05% | 9.25% | — | ||||||||||
| Including sales charges |
-10.44% | 5.86% | 8.63% | — | ||||||||||
|
| ||||||||||||||
| Class C |
||||||||||||||
| Excluding contingent deferred sales charges |
-5.87% | 6.28% | 8.44% | — | ||||||||||
| Including contingent deferred sales charges |
-6.81% | 6.28% | 8.44% | — | ||||||||||
|
| ||||||||||||||
| Institutional |
-4.88% | 7.40% | 9.63% | — | ||||||||||
|
| ||||||||||||||
| Service |
-5.33% | 6.88% | 9.10% | — | ||||||||||
|
| ||||||||||||||
| Investor |
-4.94% | 7.33% | 9.52% | — | ||||||||||
|
| ||||||||||||||
| Class R6 (Commenced July 31, 2015) |
-4.86% | 7.42% | N/A | 6.63% | ||||||||||
|
| ||||||||||||||
| Class R |
-5.46% | 6.79% | 8.98% | — | ||||||||||
|
| ||||||||||||||
| Class P (Commenced April 17, 2018) |
-4.92% | N/A | N/A | 7.52% | ||||||||||
|
| ||||||||||||||
| * | These returns assume reinvestment of all distributions at NAV and reflect a maximum initial sales charge of 5.50% for Class A Shares and the assumed contingent deferred sales charge for Class C Shares (1% if redeemed within 12 months of purchase). Because Institutional, Service, Investor, Class P, Class R and Class R6 Shares do not involve a sales charge, such a charge is not applied to their Average Annual Total Return. |
17
PORTFOLIO RESULTS
Goldman Sachs Mid Cap Value Fund
Portfolio Composition
The Fund invests, under normal circumstances, at least 80% of its net assets (plus borrowings for investment purposes) (“Net Assets”) in a diversified portfolio of equity investments in mid-cap issuers with public stock market capitalizations within the range of the market capitalization of companies constituting the Russell Midcap® Value Index at the time of investment. The Fund seeks its investment objective of long-term capital appreciation by investing in value opportunities that the Investment Adviser defines as companies with identifiable competitive advantages whose intrinsic value is not reflected in the stock price. Although the Fund will invest primarily in publicly traded U.S. securities, it may invest up to 25% of its Net Assets in foreign securities, including securities of issuers in emerging countries and securities quoted in foreign currencies. The Fund may also invest in the aggregate up to 20% of its Net Assets in companies with public stock market capitalizations outside the range of companies constituting the Russell Midcap® Value Index at the time of investment and in fixed income securities, such as government, corporate and bank debt obligations.
Portfolio Management Discussion and Analysis
Below, the Goldman Sachs Fundamental Equity U.S. Equity Team discusses the Goldman Sachs Mid Cap Value Fund’s (the “Fund”) performance and positioning for the 12-month period ended August 31, 2022 (the “Reporting Period”).
| Q | How did the Fund perform during the Reporting Period? |
| A | During the Reporting Period, the Fund’s Class A, Class C, Institutional, Service, Investor, Class R6, Class R, and Class P Shares generated average annual total returns, without sales charges, of -4.46%, -5.20%, -4.12%, -4.60%, -4.21%, -4.09%, -4.68% and -4.09%, respectively. These returns compare to the -7.80% average annual total return of the Fund’s benchmark, the Russell Midcap® Value Index (with dividends reinvested) (the “Russell Index”), during the same period. |
| Q | What key factors were responsible for the Fund’s performance during the Reporting Period? |
| A | While absolute returns disappointed, the Fund outperformed the Russell Index on a relative basis due primarily to stock selection overall. Sector allocation as a whole also contributed positively, albeit more modestly. |
| Q | Which equity market sectors most significantly affected Fund performance? |
| A | Contributing most positively to the Fund’s performance relative to the Russell Index was stock selection in the financials, information technology and energy sectors. Only partially offsetting these positive contributors was stock selection in the consumer staples, materials and real estate sectors, which detracted. |
| Q | What were some of the Fund’s best-performing individual stocks? |
| A | The Fund benefited most relative to the Russell Index from positions in Devon Energy, Hess and ON Semiconductor. |
| Devon Energy, an exploration and production oil and gas company, posted fourth quarter 2021 earnings that featured strong results, with both earnings and dividend amounts higher than market expectations. Investor focus remained on 2022 production and a variable dividend wherein Devon Energy leads the industry. Each subsequent earnings report during the Reporting Period similarly featured results above market expectations, largely due to strong production and execution metrics. At the end of the Reporting Period, our investment thesis continued to revolve around a better than consensus expected variable dividend, increased buybacks and what we saw as a line of sight to significant capital returns. |
| Exploration and production company Hess reported a strong fourth quarter earnings release, with earnings surpassing consensus expectations and capital expenditures being well below its previous guidance. The company also announced a number of new discoveries in Guyana through the quarter and benefited from the then-current operating environment. Its production was further expanded later in 2022 in an efficient manner thanks to further reserve discoveries in Guyana, though its disappointing North Dakota operations offset some of that. While we remained optimistic about the prospects of Hess given a fairly significant inflection in its |
18
PORTFOLIO RESULTS
| cash flow profile, we opted to sell the Fund’s position in Hess, taking profits. |
| ON Semiconductor engages in the design, manufacture and marketing of a portfolio of semiconductor components. The year 2021 was an impressive one for many semiconductor firms, and ON Semiconductor was a beneficiary. Its performance in the fourth quarter of 2021 was driven by a strong beat of consensus expectations and raised guidance on earnings as well as by margins and top-line revenue growing organically amid ongoing supply-chain constraints. In June 2022, it was announced the company would be joining the S&P 500 Index, which drove its returns higher still. Strength in its results was also supported by strong performance in the auto and industrial end-markets. At the end of the Reporting Period, we continued to view the company as one of our favorite semiconductor names in the mid-cap universe. |
| Q | Which stocks detracted significantly from the Fund’s performance during the Reporting Period? |
| A | Detracting most from the Fund’s results relative to the Russell Index were positions in Ball, RH and Guardant Health. |
| Shares of Ball performed well in the late part of 2021 based on strong performance reports, but its first quarter 2022 earnings report missed consensus expectations. The miss was mostly driven by an approximately 21% volume decline in its Latin American business due to flooding in the region. Also, its earnings report released in early August 2022 featured surprisingly weak results due to a sizeable slowdown in its Americas business, as consumers came under cost pressures. At the end of the Reporting Period, our longer-term investment thesis for Ball remained intact, as we continued to see a multi-year growth story for aluminum products, for which Ball should be a primary beneficiary. |
| RH operates Restoration Hardware stores that sell various home goods. A number of headwinds were cited early in the first quarter of 2022 that troubled the business. Inventory concerns and consumer purchase trends in an inflationary environment were the largest overhangs, in our view. Its earnings release in late March 2022 featured mixed results with a miss on revenue but better than consensus expected earnings and margins. Despite these challenges, our long-term investment thesis on RH remained intact at the end of the Reporting Period, as its management continued to stay focused and take what we saw as appropriate actions to preserve profitability amid challenging conditions. Indeed, there was a slight rebound in RH’s shares during the summer of 2022 when RH updated its fiscal year 2022 guidance in a positive direction, though the weak macroenvironment could potentially delay consumers’ purchase decisions on luxury home goods items. Still, at the end of the Reporting Period, we believed the company had pricing power and an attractive valuation relative to its peers. |
| Guardant Health, a precision oncology treatment company, was a new purchase for the Fund during the Reporting Period. Its stock price then depreciated during the fourth quarter of 2021 due to no particular fundamental driver. We continued to like the company, as it reported a solid quarterly result and provided positive updates on its research and development progress. However, in May 2022, a poor earnings report caused the stock to face significant pressures. Our investment thesis became invalidated, and we ultimately decided to sell the name at that time to pursue what we viewed as more attractive investment opportunities. |
| Q | How did the Fund use derivatives and similar instruments during the Reporting Period? |
| A | During the Reporting Period, we did not use derivatives as part of an active management strategy. |
| Q | Did the Fund make any significant purchases or sales during the Reporting Period? |
| A | We initiated a Fund position in Steel Dynamics in March 2022. The company manufactures steel products and engages in metal recycling. Relative to other commodities within the materials sector, we saw the odds of a longer than consensus expected steel cycle as moving upward. We also believe the company to be in an advantaged position relative to global prices given its ability to price its products effectively amid import/export dynamics seen during the Reporting Period. |
| We established a Fund position in Woodward in September 2021. The company provides control system solutions and components for the aerospace and industrial markets. Despite poor earnings results year-to-date through August 2022, we believe the company is well positioned for earnings improvement as a result of share gains in aerospace, supported by capacity investments made prior to the COVID-19 pandemic. |
| Conversely, in addition to those sales already mentioned, we exited the Fund’s position in semiconductor manufacturer Marvell Technology in June 2022. On the back of stronger than consensus anticipated earnings and performance to those names with exposure to the autos and industrial end-markets, we decided to realize some of the gains the |
19
PORTFOLIO RESULTS
| Fund had seen from this holding and reallocate to what we saw as investments with more attractive risk/reward profiles. |
| We sold the Fund’s position in container products producer Packaging Corporation of America in October 2021. The packaging industry had not experienced the same level of price increases in comparison to other industrials and materials sector industries, so we decided to exit the position in favor of other names within similar industries but with exposure to different commodities. |
| Q | Were there any changes to the Fund’s portfolio management team during the Reporting Period? |
| A | There were no changes to the Fund’s portfolio management team during the Reporting Period. |
| Q | Were there any notable changes in the Fund’s weightings during the Reporting Period? |
| A | In constructing the Fund’s portfolio, we focus on picking stocks rather than on making industry or sector bets. We seek to outpace the benchmark index by overweighting stocks that we expect to outperform and underweighting those that we think may lag. Consequently, changes in its sector weights are generally the direct result of individual stock selection or of stock appreciation or depreciation. That said, during the Reporting Period, the Fund’s allocation compared to the Russell Index in materials increased. There were no other notable changes in the Fund’s weightings during the Reporting Period. |
| Q | How was the Fund positioned relative to its benchmark index at the end of August 2022? |
| A | At the end of August 2022, the Fund had underweight positions relative to the Russell Index in financials and real estate and was rather neutrally weighted to the remaining nine sectors in the Russell Index. |
20
FUND BASICS
Mid Cap Value Fund
as of August 31, 2022
| TOP 10 HOLDINGS AS OF 8/31/221 | ||||||||||
| Holding | % of Net Assets | Line of Business | Country | |||||||
| Ameren Corp. | 2.0 | % | Multi-Utilities | United States | ||||||
| Alexandria Real Estate Equities, Inc. REIT | 1.9 | Equity Real Estate Investment Trusts (REITs) | United States | |||||||
| Ball Corp. | 1.9 | Containers & Packaging | United States | |||||||
| Motorola Solutions, Inc. | 1.8 | Communications Equipment | United States | |||||||
| Cummins, Inc. | 1.8 | Machinery | United States | |||||||
| M&T Bank Corp. | 1.8 | Banks | United States | |||||||
| Xcel Energy, Inc. | 1.7 | Electric Utilities | United States | |||||||
| East West Bancorp, Inc. | 1.7 | Banks | United States | |||||||
| AvalonBay Communities, Inc. REIT | 1.6 | Equity Real Estate Investment Trusts (REITs) | United States | |||||||
| Zimmer Biomet Holdings, Inc. | 1.5 | Health Care Equipment & Supplies | United States | |||||||
| 1 | The top 10 holdings may not be representative of the Fund’s future investments. |
| FUND VS. BENCHMARK SECTOR ALLOCATIONS2 |
| As of August 31, 2022 |

| 2 | The Fund is actively managed and, as such, its composition may differ over time. Consequently, the Fund’s overall sector allocations may differ from the percentages contained in the graph above. Figures in the above graph may not sum to 100% due to the exclusion of other assets and liabilities. The graph categorizes investments using the Global Industry Classification Standard (“GICS”); however, the sector classifications used by the portfolio management team may differ from GICS. The percentage shown for each investment category reflects the value of investments in that category as a percentage of market value. The graph depicts the Fund’s investments but may not represent the Fund’s market exposure due to the exclusion of certain derivatives, if any, as listed in the Additional Investment Information section of the Schedule of Investments. |
For more information about the Fund, please refer to www.GSAMFUNDS.com. There, you can learn more about the Fund’s investment strategies, holdings, and performance.
21
GOLDMAN SACHS MID CAP VALUE FUND
Performance Summary
August 31, 2022
The following graph shows the value, as of August 31, 2022, of a $10,000 investment made on September 1, 2012 in Class A Shares at NAV. For comparative purposes, the performance of the Fund’s benchmark, the Russell Midcap® Value Index (with dividends reinvested), is shown. Performance reflects applicable fee waivers and/or expense limitations in effect during the periods shown and in their absence, performance would be reduced. Returns do not reflect the deduction of taxes that a shareholder would pay on Fund distributions or the redemption of Fund shares. The returns set forth below represent past performance. Past performance does not guarantee future results. The Fund’s investment return and principal value will fluctuate so that an investor’s shares, when redeemed, may be worth more or less than their original cost. Current performance may be lower or higher than the performance quoted below. Please visit our web site at www.GSAMFUNDS.com to obtain the most recent month-end returns.
| Mid Cap Value Fund’s 10 Year Performance |
Performance of a $10,000 Investment, including any applicable sales charges, with distributions reinvested, from September 1, 2012 through August 31, 2022.

| Average Annual Total Return through August 31, 2022* | One Year | Five Years | Ten Years | Since Inception | ||||||||||
| Class A |
||||||||||||||
| Excluding sales charges |
-4.46% | 9.37% | 10.12% | — | ||||||||||
| Including sales charges |
-9.71% | 8.14% | 9.50% | — | ||||||||||
|
| ||||||||||||||
| Class C |
||||||||||||||
| Excluding contingent deferred sales charges |
-5.20% | 8.55% | 9.30% | — | ||||||||||
| Including contingent deferred sales charges |
-6.14% | 8.55% | 9.30% | — | ||||||||||
|
| ||||||||||||||
| Institutional |
-4.12% | 9.78% | 10.55% | — | ||||||||||
|
| ||||||||||||||
| Service |
-4.60% | 9.24% | 10.00% | — | ||||||||||
|
| ||||||||||||||
| Investor |
-4.21% | 9.65% | 10.40% | — | ||||||||||
|
| ||||||||||||||
| Class R6 (Commenced July 31, 2015) |
-4.09% | 9.79% | N/A | 8.02% | ||||||||||
|
| ||||||||||||||
| Class R |
-4.68% | 9.10% | 9.85% | — | ||||||||||
|
| ||||||||||||||
| Class P (Commenced April 17, 2018) |
-4.09% | N/A | N/A | 9.58% | ||||||||||
|
| ||||||||||||||
| * | These returns assume reinvestment of all distributions at NAV and reflect a maximum initial sales charge of 5.50% for Class A Shares and the assumed contingent deferred sales charge for Class C Shares (1% if redeemed within 12 months of purchase). Because Institutional, Service, Investor, Class P, Class R and Class R6 Shares do not involve a sales charge, such a charge is not applied to their Average Annual Total Return. |
22
PORTFOLIO RESULTS
Goldman Sachs Small Cap Value Fund
Portfolio Composition
The Fund invests, under normal circumstances, at least 80% of its net assets (plus any borrowings for investment purposes) (“Net Assets”) in a diversified portfolio of equity investments in small-cap issuers with public stock market capitalizations within the range of the market capitalization of companies constituting the Russell 2000® Value Index at the time of investment. Under normal circumstances, the Fund’s investment horizon for ownership of stocks will be two to three years. The Fund seeks its investment objective of long-term capital appreciation by investing in value opportunities that the Investment Adviser defines as companies with identifiable competitive advantages whose intrinsic value is not reflected in the stock price. Although the Fund will invest primarily in publicly traded U.S. securities, it may invest up to 25% of its Net Assets in foreign securities, including securities of issuers in emerging countries and securities quoted in foreign currencies. The Fund may also invest in the aggregate up to 20% of its Net Assets in companies with public stock market capitalizations outside the range of companies constituting the Russell 2000® Value Index at the time of investment and in fixed income securities, such as government, corporate and bank debt obligations.
Portfolio Management Discussion and Analysis
Below, the Goldman Sachs Small Cap Value Team discusses the Goldman Sachs Small Cap Value Fund’s (the “Fund”) performance and positioning for the 12-month period ended August 31, 2022 (the “Reporting Period”).
| Q | How did the Fund perform during the Reporting Period? |
| A | During the Reporting Period, the Fund’s Class A, Class C, Institutional, Service, Investor, Class R6, Class R and Class P Shares generated average annual total returns, without sales charges, of -9.33%, -10.00%, -9.02%, -9.48%, -9.07%, -9.02%, -9.53% and -9.01%, respectively. These returns compare to the -10.18% average annual total return of the Fund’s benchmark, the Russell 2000® Value Index (with dividends reinvested) (the “Russell Index”), during the same period. |
| Q | What key factors were responsible for the Fund’s performance during the Reporting Period? |
| A | While absolute returns disappointed, the Fund outperformed the Russell Index on a relative basis during the Reporting Period due primarily to stock selection. Sector allocation as a whole also contributed positively to the Fund’s relative performance, albeit more modestly. |
| Q | Which equity market sectors most significantly affected Fund performance? |
| A | Effective stock selection in the health care, communication services and financials sectors contributed most positively to the Fund’s performance relative to the Russell Index. Having an underweighted allocation to health care, which underperformed the Russell Index during the Reporting Period, also added value. Only partially offsetting these positive contributors was weak stock selection in the real estate, information technology and utilities sectors, which detracted. |
| Q | What were some of the Fund’s best-performing individual stocks? |
| A | The Fund benefited most relative to the Russell Index from positions in AMC Entertainment Holdings, Antero Resources and SM Energy. |
| The Fund’s underweight to movie theatre chain and entertainment company AMC Entertainment Holdings, a new purchase for the Fund during the Reporting Period, contributed positively to its relative results, as its stock posted a robust double-digit decline in the Russell Index before being removed at the end of June 2022 as part of the annual Russell reconstitution. We had initiated the Fund position in early December 2021 given prospects of improving economic fundamentals. We exited the Fund position when the stock was removed from the Russell Index at the end of June 2022. |
| Antero Resources, an independent oil and gas company that engages in the development, production, exploration and acquisition of natural gas, saw its stock rise during the Reporting Period, supported by an increase in commodity prices as well as by an earlier than consensus expected share repurchasing program. The size of the company ultimately outgrew the Fund’s intended market capitalization strategy, |
23
PORTFOLIO RESULTS
| and we exited the Fund position during the second quarter of 2022. |
| Similarly, SM Energy, an independent energy company that engages in the acquisition, exploration, development and production of crude oil, natural gas and natural gas liquids, performed well during the Reporting Period, largely supported by an increase in commodity prices. |
| Q | Which stocks detracted significantly from the Fund’s performance during the Reporting Period? |
| A | Detracting most from the Fund’s results relative to the Russell Index were positions in Hudson Pacific Properties, Cerence and Murphy Oil. |
| Shares of Hudson Pacific Properties, a real estate company that owns, operates, develops and acquires office, media and entertainment properties, declined after the company announced first quarter 2022 earnings with conservative guidance for the full year. The market also reacted negatively to Hudson Pacific Properties’ completion of its previously announced acquisition of a state-of-the-art office development site in Seattle. Despite its recent weakness, we continued to like the holding at the end of the Reporting Period, as we believed leasing volumes were recovering, mark-to-market remained intact, and the company was aggressively repurchasing stock. (Mark-to-market is a term used to refer to the process of using a reasonable market value of an account, asset or liability at a specific point in time or during an accounting period.) |
| Cerence is a software company that builds automotive cognitive assistance solutions to power natural and intuitive interactions between automobiles, drivers and passengers, and the digital world. Rising interest rates, multiple (or price/earnings ratio) compression and broader macroeconomic uncertainties weighed on the software industry during the Reporting Period as well as on shares of Cerence. That said, at the end of the Reporting Period, we maintained high conviction in the company and believed it was well positioned to benefit from continued adoption of artificial intelligence-based virtual assistance and services, especially in cars. |
| Murphy Oil is a holding company that engages in the exploration and production of oil and natural gas. After initiating a Fund position in the company in March 2022, its shares declined along with the broader oil exploration and production industry, as commodity prices retreated. We ultimately exited the Fund position and reinvested the proceeds into higher conviction ideas elsewhere in the Fund’s portfolio. |
| Q | How did the Fund use derivatives and similar instruments during the Reporting Period? |
| A | During the Reporting Period, we did not use derivatives as part of an active management strategy. |
| Q | Did the Fund make any significant purchases or sales during the Reporting Period? |
| A | During the Reporting Period, we initiated a Fund position in Physicians Realty Trust, a real estate investment trust that engages in the acquisition, development and management of health care properties. We are optimistic about the company and believe its management has the company well positioned to deliver consistent earnings during the next few years. |
| We established a Fund position in ABM Industries, an integrated facility management services company focused on commercial, industrial and institutional holdings. We like ABM Industries as a “return to office” play and believe with more and more people coming back to in-person work, the need for building maintenance and management may well increase, further supporting the company’s stock. |
| Conversely, in addition to those sales mentioned earlier, we exited the Fund’s position in Tenet Healthcare, a diversified health care services company that operates more than 400 ambulatory surgery centers and surgical hospitals. Its shares were challenged during the Reporting Period amid a difficult operating environment, and we sold the position and reinvested the proceeds into what we felt were better risk/reward opportunities elsewhere. |
| We eliminated the Fund’s position in water solutions company Zurn Elkay Water Solutions during the Reporting Period. We initially established the Fund position in the company’s shares in November 2021. However, in July 2022, the company merged with Elkay Manufacturing to create one of the largest water management solutions companies. As our investment thesis changed, we sold the position and reinvested the proceeds into other, higher conviction ideas in the Fund’s portfolio. |
| Q | Were there any changes to the Fund’s portfolio management team during the Reporting Period? |
| A | Effective May 5, 2022, Sean A Butkus no longer served as a portfolio manager for the Fund. Sean continues to focus primarily on his sector research responsibilities, which currently include consumer and communication services, and he continues to share responsibilities for industrials with |
24
PORTFOLIO RESULTS
| Robert Crystal, a portfolio manager of the Fund. Indeed, Robert Crystal and Sally Pope Davis continue serving as portfolio managers for the Fund. By design, all investment decisions for the Fund are performed within a co-lead or team structure, with multiple subject matter experts. This strategic decision making has been a cornerstone of our approach and helps to ensure continuity in the Fund. |
| Q | Were there any notable changes in the Fund’s weightings during the Reporting Period? |
| A | In constructing the Fund’s portfolio, we focus on picking stocks rather than on making industry or sector bets. We seek to outpace the benchmark index by overweighting stocks that we expect to outperform and underweighting those that we think may lag. Consequently, changes in its sector weights are generally the direct result of individual stock selection or of stock appreciation or depreciation. That said, during the Reporting Period, the Fund’s allocations compared to the Russell Index in financials, industrials and consumer discretionary decreased. |
| Q | How was the Fund positioned relative to its benchmark index at the end of August 2022? |
| A | At the end of August 2022, the Fund was overweight compared to the Russell Index in industrials, and information technology, was underweight compared to the Russell Index in health care and financials, and was rather neutrally weighted to the remaining seven sectors in the Russell Index. |
25
FUND BASICS
Small Cap Value Fund
as of August 31, 2022
| TOP 10 HOLDINGS AS OF 8/31/221 | ||||||||||
| Holding | % of Net Assets | Line of Business | Country | |||||||
| Physicians Realty Trust REIT | 1.1 | % | Equity Real Estate Investment Trusts (REITs) | United States | ||||||
| Hancock Whitney Corp. | 1.1 | Banks | United States | |||||||
| ABM Industries, Inc. | 1.1 | Commercial Services & Supplies | United States | |||||||
| Avient Corp. | 1.0 | Chemicals | United States | |||||||
| Terreno Realty Corp. REIT | 1.0 | Equity Real Estate Investment Trusts (REITs) | United States | |||||||
| RLJ Lodging Trust REIT | 1.0 | Equity Real Estate Investment Trusts (REITs) | United States | |||||||
| Hostess Brands, Inc. | 0.9 | Food Products | United States | |||||||
| Selective Insurance Group, Inc. | 0.9 | Insurance | United States | |||||||
| United Community Banks, Inc. | 0.9 | Banks | United States | |||||||
| Ryman Hospitality Properties, Inc. REIT | 0.9 | Equity Real Estate Investment Trusts (REITs) | United States | |||||||
| 1 | The top 10 holdings may not be representative of the Fund’s future investments. |
| FUND VS. BENCHMARK SECTOR ALLOCATIONS2 |
| As of August 31, 2022 |

| 2 | The Fund is actively managed and, as such, its composition may differ over time. Consequently, the Fund’s overall sector allocations may differ from the percentages contained in the graph above. Figures in the above graph may not sum to 100% due to the exclusion of other assets and liabilities. The graph categorizes investments using the Global Industry Classification Standard (“GICS”), however, the sector classifications used by the portfolio management team may differ from GICS. Underlying sector allocations of Exchange Traded Funds held by the Fund (if any) are not reflected in the graph above. The percentage shown for each investment category reflects the value of investments in that category as a percentage of market value (excluding investments in the securities lending reinvestment vehicle, if any). Investments in the securities lending reinvestment vehicle represented 0.1% of the Fund’s net assets as of August 31, 2022. The graph depicts the Fund’s investments but may not represent the Fund’s market exposure due to the exclusion of certain derivatives, if any, as listed in the Additional Investment Information section of the Schedule of Investments. |
For more information about the Fund, please refer to www.GSAMFUNDS.com. There, you can learn more about the Fund’s investment strategies, holdings, and performance.
26
GOLDMAN SACHS SMALL CAP VALUE FUND
Performance Summary
August 31, 2022
The following graph shows the value, as of August 31, 2022, of a $1,000,000 investment made on September 1, 2012 in Institutional Shares at NAV. For comparative purposes, the performance of the Fund’s benchmark, the Russell 2000® Value Index (with dividends reinvested), is shown. Performance reflects applicable fee waivers and/or expense limitations in effect during the periods shown and in their absence, performance would be reduced. Returns do not reflect the deduction of taxes that a shareholder would pay on Fund distributions or the redemption of Fund shares. The returns set forth below represent past performance. Past performance does not guarantee future results. The Fund’s investment return and principal value will fluctuate so that an investor’s shares, when redeemed, may be worth more or less than their original cost. Current performance may be lower or higher than the performance quoted below. Please visit our web site at www.GSAMFUNDS.com to obtain the most recent month-end returns.
| Small Cap Value Fund’s 10 Year Performance |
Performance of a $1,000,000 Investment, including any applicable sales charges, with distributions reinvested, from September 1, 2012 through August 31, 2022.
| Average Annual Total Return through August 31, 2022* | One Year | Five Years | Ten Years | Since Inception | ||||||||||
| Class A |
||||||||||||||
| Excluding sales charges |
-9.33% | 5.12% | 8.90% | — | ||||||||||
| Including sales charges |
-14.31% | 3.93% | 8.28% | — | ||||||||||
|
| ||||||||||||||
| Class C |
||||||||||||||
| Excluding contingent deferred sales charges |
-10.00% | 4.33% | 8.08% | — | ||||||||||
| Including contingent deferred sales charges |
-10.90% | 4.33% | 8.08% | — | ||||||||||
|
| ||||||||||||||
| Institutional |
-9.02% | 5.50% | 9.31% | — | ||||||||||
|
| ||||||||||||||
| Service |
-9.48% | 4.98% | 8.77% | — | ||||||||||
|
| ||||||||||||||
| Investor |
-9.07% | 5.38% | 9.17% | — | ||||||||||
|
| ||||||||||||||
| Class R6 (Commenced July 31, 2015) |
-9.02% | 5.51% | N/A | 6.35% | ||||||||||
|
| ||||||||||||||
| Class R |
-9.53% | 4.86% | 8.62% | — | ||||||||||
|
| ||||||||||||||
| Class P (Commenced April 17, 2018) |
-9.01% | N/A | N/A | 3.79% | ||||||||||
|
| ||||||||||||||
| * | These returns assume reinvestment of all distributions at NAV and reflect a maximum initial sales charge of 5.50% for Class A Shares and the assumed contingent deferred sales charge for Class C Shares (1% if redeemed within 12 months of purchase). Because Institutional, Service, Investor, Class P, Class R and Class R6 Shares do not involve a sales charge, such a charge is not applied to their Average Annual Total Return. |
27
PORTFOLIO RESULTS
Goldman Sachs Small/Mid Cap Value Fund
Portfolio Composition
The Fund’s investment objective is to seek long-term capital appreciation. The Fund invests, under normal circumstances, at least 80% of its net assets plus any borrowings for investment purposes (measured at time of purchase) in a diversified portfolio of equity investments in small- and mid-cap issuers with public stock market capitalizations within the range of the market capitalization of companies constituting the Russell 2000® Value Index and the Russell Midcap Value Index, respectively, at the time of investment. As of August 31, 2022, the capitalization range of the companies in these indexes was between $17 million and $46.313 billion. Under normal circumstances, the Fund’s investment horizon for ownership of stocks will be two to three years. Although the Fund will invest primarily in publicly traded U.S. securities, it may also invest in foreign securities, including securities of issuers in emerging countries and securities quoted in foreign currencies. The Fund may invest in companies with public stock market capitalizations outside the range of companies constituting the Russell 2000® Value Index and the Russell Midcap Value Index at the time of investment and in fixed income securities, such as government, corporate and bank debt obligations.
Portfolio Management Discussion and Analysis
Below, the Goldman Sachs Small Cap Value Team discusses the Goldman Sachs Small/Mid Cap Value Fund’s (the “Fund”) performance and positioning for the 12-month period ended August 31, 2022 (the “Reporting Period”).
| Q | How did the Fund perform during the Reporting Period? |
| A | During the Reporting Period, the Fund’s Class A, Class C, Institutional, Investor, Class R6, Class R and Class P Shares generated average annual total returns, without sales charges, of -8.91%, -9.56%, -8.56%, -8.68%, -8.56%, -9.07% and -8.51%, respectively. These returns compare to the -8.34% average annual total return of the Fund’s benchmark, the Russell 2500® Value Index (with dividends reinvested) (the “Russell Index”), during the same period. |
| Q | What key factors were responsible for the Fund’s performance during the Reporting Period? |
| A | The Fund modestly underperformed the Russell Index on a relative basis during the Reporting Period due primarily to expenses, as described in its prospectus. Unmanaged indices, like the Russell Index, do not incur such expenses, but it is not possible to invest directly in these indices. |
| Q | Which equity market sectors most significantly affected Fund performance? |
| A | Effective stock selection in the communication services, health care and information technology sectors contributed most positively to the Fund’s performance relative to the Russell Index during the Reporting Period. Having underweighted allocations to communication services and health care, each of which underperformed the Russell Index during the Reporting Period, further boosted the Fund’s relative results. These positive contributors were partially offset by challenging stock selection in the real estate, materials and consumer staples sectors, which detracted. |
| Q | What were some of the Fund’s best-performing individual stocks? |
| A | The Fund benefited most relative to the Russell Index from positions in Diamondback Energy, Ovintiv and Devon Energy — each a constituent of the energy sector. |
| Diamondback Energy is an independent oil and natural gas company that engages in the acquisition, development, exploration and exploitation of unconventional, onshore oil and natural gas reserves. Its stock rose during the Reporting Period, largely supported by an increase in commodity prices. We exited the Fund’s position in Diamondback Energy in June 2022, as the company ultimately outgrew the intended market capitalization size for the Fund’s portfolio. |
| Ovintiv is an oil and gas exploration and production company. The energy sector as a whole performed well during the Reporting Period on the back of higher commodity prices resulting from supply constraints and geopolitical tensions. Additionally, unlike its peers, Ovintiv was successful in controlling its capital expenditures given its existing contracts with suppliers, which helped its margins relative to competitors. At the end of the Reporting Period, we continued to like the company and believed it was trading at an attractive valuation on free cash flows. |
28
PORTFOLIO RESULTS
| Devon Energy, an exploration and production oil and gas company, posted fourth quarter 2021 earnings that featured strong results, with both earnings and dividend amounts higher than market expectations. Investor focus remained on 2022 production and a variable dividend wherein Devon Energy leads the industry. Each subsequent earnings report during the Reporting Period similarly featured results above market expectations, largely due to strong production and execution metrics. We exited the Fund’s position in Devon Energy in June 2022, as its market capitalization became too large for the intended strategy of the Fund. |
| Q | Which stocks detracted significantly from the Fund’s performance during the Reporting Period? |
| A | Detracting most from the Fund’s results relative to the Russell Index were positions in Hudson Pacific Properties, Cerence and Enovis. |
| Shares of Hudson Pacific Properties, a real estate company that owns, operates, develops and acquires office, media and entertainment properties, declined after the company announced first quarter 2022 earnings with conservative guidance for the full year. The market also reacted negatively to Hudson Pacific Properties’ completion of its previously announced acquisition of Washington 1000, a fully entitled, state-of-the-art office development site in Seattle, for $85.6 million before closing adjustments. Despite its recent weakness, we continued to like the holding at the end of the Reporting Period, as we believed leasing volumes were recovering, mark-to-market remained intact, and the company was aggressively repurchasing stock. (Mark-to-market is a term used to refer to the process of using a reasonable market value of an account, asset or liability at a specific point in time or during an accounting period.) |
| Cerence is a software company that builds automotive cognitive assistance solutions to power natural and intuitive interactions between automobiles, drivers and passengers, and the digital world. Rising interest rates, multiple (or price/earnings ratio) compression and broader macroeconomic uncertainties weighed on the software industry during the Reporting Period as well as on shares of Cerence. We exited the Fund’s position in Cerence in February 2022 and reallocated the proceeds to what we felt were better risk/reward opportunities elsewhere. |
| Medical technology company Enovis is the stand-alone medical technology successor to Colfax, which was separated into two companies in April 2022. The legacy industrials business was spun off under the name ESAB and trades separately. Enovis’ shares declined since we initiated the Fund’s position in Colfax at the end of 2021. That said, at the end of the Reporting Period, we remained optimistic about Enovis, as it continued, in our view, to develop a track record with investors as a stand-alone medical technology company. |
| Q | How did the Fund use derivatives and similar instruments during the Reporting Period? |
| A | During the Reporting Period, we did not use derivatives as part of an active management strategy. |
| Q | Did the Fund make any significant purchases or sales during the Reporting Period? |
| A | During the Reporting Period, we initiated a Fund position in Terreno Realty, an industrial real estate company. Given its characters of assets, we think Terreno Realty could be the beneficiary of ongoing e-commerce growth as well as of a reconfiguring supply chain. We are also optimistic about its management’s ability to drive shareholder returns. |
| We established a Fund position in Flex, a manufacturing services company. The company delivers technology innovation, supply chain and manufacturing solutions to diverse industries and end-markets. We are optimistic about the company and believe it can expand its margins and drive earnings per share growth over time as it executes on its strategy to grow exposure to end-markets with longer product lifecycles. |
| Conversely, in addition to those sales mentioned earlier, we eliminated the Fund’s position in water solutions company Zurn Elkay Water Solutions during the Reporting Period. We initially established the Fund position in the company’s shares in November 2021. However, in July 2022, the company merged with Elkay Manufacturing to create one of the largest water management solutions companies. As our investment thesis changed, we sold the position and reinvested the proceeds into other, higher conviction ideas in the Fund’s portfolio. |
| Q | Were there any changes to the Fund’s portfolio management team during the Reporting Period? |
| A | Effective May 5, 2022, Sean A Butkus no longer served as a portfolio manager for the Fund. Sean continues to focus primarily on his sector research responsibilities, which currently include consumer and communication services, and he continues to share responsibilities for industrials with Robert Crystal, a portfolio manager of the Fund. Indeed, |
29
PORTFOLIO RESULTS
| Robert Crystal and Sally Pope Davis continue serving as portfolio managers for the Fund. By design, all investment decisions for the Fund are performed within a co-lead or team structure, with multiple subject matter experts. This strategic decision making has been a cornerstone of our approach and helps to ensure continuity in the Fund. |
| Q | Were there any notable changes in the Fund’s weightings during the Reporting Period? |
| A | In constructing the Fund’s portfolio, we focus on picking stocks rather than on making industry or sector bets. We seek to outpace the benchmark index by overweighting stocks that we expect to outperform and underweighting those that we think may lag. Consequently, changes in its sector weights are generally the direct result of individual stock selection or of stock appreciation or depreciation. That said, during the Reporting Period, the Fund’s allocation compared to the Russell Index in consumer staples increased, and its allocations compared to the Russell Index in health care and consumer discretionary decreased. |
| Q | How was the Fund positioned relative to its benchmark index at the end of August 2022? |
| A | At the end of August 2022, the Fund had an overweight position compared to the Russell Index in consumer staples, had an underweight position compared to the Russell Index in health care, and was rather neutrally weighted in the remaining nine sectors of the Russell Index. |
30
FUND BASICS
Small/Mid Cap Value Fund
as of August 31, 2022
| TOP 10 HOLDINGS AS OF 8/31/221 | ||||||||||
| Holding | % of Net Assets | Line of Business | Country | |||||||
| KBR, Inc. | 1.5 | % | Professional Services | United States | ||||||
| AECOM | 1.4 | Construction & Engineering | United States | |||||||
| National Instruments Corp. | 1.4 | Electronic Equipment, Instruments & Components | United States | |||||||
| CubeSmart REIT | 1.3 | Equity Real Estate Investment Trusts (REITs) | United States | |||||||
| Regency Centers Corp. REIT | 1.2 | Equity Real Estate Investment Trusts (REITs) | United States | |||||||
| Terreno Realty Corp. REIT | 1.2 | Equity Real Estate Investment Trusts (REITs) | United States | |||||||
| Camden Property Trust REIT | 1.1 | Equity Real Estate Investment Trusts (REITs) | United States | |||||||
| Globe Life, Inc. | 1.1 | Insurance | United States | |||||||
| IDACORP, Inc. | 1.1 | Electric Utilities | United States | |||||||
| Hubbell, Inc. | 1.1 | Electrical Equipment | United States | |||||||
| 1 | The top 10 holdings may not be representative of the Fund’s future investments. |
| FUND VS. BENCHMARK SECTOR ALLOCATIONS2 |
| As of August 31, 2022 |

| 2 | The Fund is actively managed and, as such, its composition may differ over time. Consequently, the Fund’s overall sector allocations may differ from the percentages contained in the graph above. Figures in the above graph may not sum to 100% due to the exclusion of other assets and liabilities. The graph categorizes investments using the Global Industry Classification Standard (“GICS”); however, the sector classifications used by the portfolio management team may differ from GICS. The percentage shown for each investment category reflects the value of investments in that category as a percentage of market value (excluding investments in the securities lending reinvestment vehicle, if any). Investments in the securities lending reinvestment vehicle represented 0.2% of the Fund’s net assets as of August 31, 2022. The graph depicts the Fund’s investments but may not represent the Fund’s market exposure due to the exclusion of certain derivatives, if any, as listed in the Additional Investment Information section of the Schedule of Investments. |
For more information about the Fund, please refer to www.GSAMFUNDS.com. There, you can learn more about the Fund’s investment strategies, holdings, and performance.
31
GOLDMAN SACHS SMALL/MID CAP VALUE FUND
Performance Summary
August 31, 2022
The following graph shows the value, as of August 31, 2022, of a $1,000,000 investment made on January 31, 2014 (commencement of operations) in Institutional Shares at NAV. For comparative purposes, the performance of the Fund’s benchmark, the Russell 2500® Value Index (with dividends reinvested), is shown. Performance reflects applicable fee waivers and/or expense limitations in effect during the periods shown and in their absence, performance would be reduced. Returns do not reflect the deduction of taxes that a shareholder would pay on Fund distributions or the redemption of Fund shares. The returns set forth below represent past performance. Past performance does not guarantee future results. The Fund’s investment return and principal value will fluctuate so that an investor’s shares, when redeemed, may be worth more or less than their original cost. Current performance may be lower or higher than the performance quoted below. Please visit our web site at www.GSAMFUNDS.com to obtain the most recent month-end returns.
| Small/Mid Cap Value Fund’s Lifetime Performance |
Performance of a $1,000,000 Investment, including any applicable sales charges, with distributions reinvested, from January 31, 2014 through August 31, 2022.
| Average Annual Total Return through August 31, 2022* | One Year | Five Years | Since Inception | |||||||
| Class A (Commenced January 31, 2014) |
||||||||||
| Excluding sales charges |
-8.91% | 7.45% | 7.25% | |||||||
| Including sales charges |
-13.90% | 6.24% | 6.55% | |||||||
|
| ||||||||||
| Class C (Commenced January 31, 2014) |
||||||||||
| Excluding contingent deferred sales charges |
-9.56% | 6.65% | 6.47% | |||||||
| Including contingent deferred sales charges |
-10.46% | 6.65% | 6.47% | |||||||
|
| ||||||||||
| Institutional (Commenced January 31, 2014) |
-8.56% | 7.86% | 7.69% | |||||||
|
| ||||||||||
| Investor (Commenced January 31, 2014) |
-8.68% | 7.72% | 7.52% | |||||||
|
| ||||||||||
| Class R6 (Commenced July 31, 2015) |
-8.56% | 7.86% | 7.46% | |||||||
|
| ||||||||||
| Class R (Commenced January 31, 2014) |
-9.07% | 7.18% | 7.00% | |||||||
|
| ||||||||||
| Class P (Commenced April 17, 2018) |
-8.51% | N/A | 6.50% | |||||||
|
| ||||||||||
| * | These returns assume reinvestment of all distributions at NAV and reflect a maximum initial sales charge of 5.50% for Class A Shares and the assumed contingent deferred sales charge for Class C Shares (1% if redeemed within 12 months of purchase). Because Institutional, Investor, Class P, Class R and Class R6 Shares do not involve a sales charge, such a charge is not applied to their Average Annual Total Return. |
32
GOLDMAN SACHS EQUITY INCOME FUND
August 31, 2022
| Shares | Description | Value |
||||||
| Common Stocks – 97.7% | ||||||||
| Aerospace & Defense – 1.6% | ||||||||
| 27,935 | L3Harris Technologies, Inc. | $ | 6,374,488 | |||||
|
|
|
|||||||
| Banks – 8.6% | ||||||||
| 251,241 | Bank of America Corp. | 8,444,210 | ||||||
| 109,692 | JPMorgan Chase & Co. | 12,475,271 | ||||||
| 44,407 | M&T Bank Corp. | 8,072,304 | ||||||
| 129,922 | Truist Financial Corp. | 6,085,547 | ||||||
|
|
|
|||||||
| 35,077,332 | ||||||||
|
|
|
|||||||
| Beverages – 1.8% | ||||||||
| 92,540 | Coca-Cola Co. (The) | 5,710,644 | ||||||
| 33,243 | Coca-Cola Europacific Partners PLC (United Kingdom) | 1,634,558 | ||||||
|
|
|
|||||||
| 7,345,202 | ||||||||
|
|
|
|||||||
| Biotechnology – 2.4% | ||||||||
| 15,554 | Amgen, Inc. | 3,737,626 | ||||||
| 92,530 | Gilead Sciences, Inc. | 5,872,879 | ||||||
|
|
|
|||||||
| 9,610,505 | ||||||||
|
|
|
|||||||
| Capital Markets – 4.0% | ||||||||
| 8,060 | BlackRock, Inc. | 5,371,104 | ||||||
| 50,531 | Morgan Stanley | 4,306,252 | ||||||
| 70,272 | Nasdaq, Inc. | 4,183,292 | ||||||
| 24,552 | Singapore Exchange Ltd. ADR (Singapore) | 2,500,621 | ||||||
|
|
|
|||||||
| 16,361,269 | ||||||||
|
|
|
|||||||
| Chemicals – 2.5% | ||||||||
| 16,626 | Air Products and Chemicals, Inc. | 4,197,234 | ||||||
| 21,448 | Linde PLC (United Kingdom) | 6,066,781 | ||||||
|
|
|
|||||||
| 10,264,015 | ||||||||
|
|
|
|||||||
| Commercial Services & Supplies – 1.9% | ||||||||
| 53,533 | Republic Services, Inc. | 7,640,230 | ||||||
|
|
|
|||||||
| Communications Equipment – 2.3% | ||||||||
| 166,716 | Cisco Systems, Inc. | 7,455,540 | ||||||
| 72,344 | Juniper Networks, Inc. | 2,056,016 | ||||||
|
|
|
|||||||
| 9,511,556 | ||||||||
|
|
|
|||||||
| Construction & Engineering – 0.5% | ||||||||
| 91,133 | Vinci SA ADR (France) | 2,098,793 | ||||||
|
|
|
|||||||
| Consumer Finance – 1.1% | ||||||||
| 27,995 | American Express Co. | 4,255,240 | ||||||
|
|
|
|||||||
| Containers & Packaging – 0.6% | ||||||||
| 60,078 | International Paper Co. | 2,500,446 | ||||||
|
|
|
|||||||
| Diversified Telecommunication Services – 1.9% | ||||||||
| 441,106 | AT&T, Inc. | 7,736,999 | ||||||
|
|
|
|||||||
| Electric Utilities – 3.2% | ||||||||
| 111,070 | NextEra Energy, Inc. | 9,447,614 | ||||||
| 49,708 | Xcel Energy, Inc. | 3,690,819 | ||||||
|
|
|
|||||||
| 13,138,433 | ||||||||
|
|
|
|||||||
| Common Stocks – (continued) | ||||||||
| Electrical Equipment – 1.8% | ||||||||
| 54,513 | Eaton Corp. PLC | 7,448,656 | ||||||
|
|
|
|||||||
| Electronic Equipment, Instruments & Components – 0.9% | ||||||||
| 30,158 | TE Connectivity Ltd. (Switzerland) | 3,806,241 | ||||||
|
|
|
|||||||
| Entertainment – 0.6% | ||||||||
| 19,901 | Electronic Arts, Inc. | 2,524,840 | ||||||
|
|
|
|||||||
| Equity Real Estate Investment Trusts (REITs) – 5.5% | ||||||||
| 22,902 | Alexandria Real Estate Equities, Inc. REIT | 3,513,167 | ||||||
| 17,650 | American Tower Corp. REIT | 4,483,983 | ||||||
| 25,440 | AvalonBay Communities, Inc. REIT | 5,111,150 | ||||||
| 91,117 | Healthpeak Properties, Inc. REIT | 2,391,821 | ||||||
| 104,502 | Hudson Pacific Properties, Inc. REIT | 1,380,471 | ||||||
| 30,803 | Regency Centers Corp. REIT | 1,874,055 | ||||||
| 70,661 | Ventas, Inc. REIT | 3,381,835 | ||||||
|
|
|
|||||||
| 22,136,482 | ||||||||
|
|
|
|||||||
| Food & Staples Retailing – 1.5% | ||||||||
| 44,408 | Walmart, Inc. | 5,886,280 | ||||||
|
|
|
|||||||
| Food Products – 2.1% | ||||||||
| 35,590 | Archer-Daniels-Midland Co. | 3,128,005 | ||||||
| 69,255 | General Mills, Inc. | 5,318,784 | ||||||
|
|
|
|||||||
| 8,446,789 | ||||||||
|
|
|
|||||||
| Health Care Equipment & Supplies – 3.5% | ||||||||
| 37,175 | Abbott Laboratories | 3,816,014 | ||||||
| 83,875 | Medtronic PLC | 7,374,290 | ||||||
| 30,039 | Zimmer Biomet Holdings, Inc. | 3,193,746 | ||||||
|
|
|
|||||||
| 14,384,050 | ||||||||
|
|
|
|||||||
| Health Care Providers & Services – 3.0% | ||||||||
| 81,676 | CVS Health Corp. | 8,016,500 | ||||||
| 7,900 | UnitedHealth Group, Inc. | 4,102,707 | ||||||
|
|
|
|||||||
| 12,119,207 | ||||||||
|
|
|
|||||||
| Hotels, Restaurants & Leisure – 3.1% | ||||||||
| 26,272 | McDonald’s Corp. | 6,627,900 | ||||||
| 23,551 | Starbucks Corp. | 1,979,932 | ||||||
| 34,865 | Yum! Brands, Inc. | 3,878,383 | ||||||
|
|
|
|||||||
| 12,486,215 | ||||||||
|
|
|
|||||||
| Household Products – 1.6% | ||||||||
| 17,806 | Clorox Co. (The) | 2,570,118 | ||||||
| 28,189 | Procter & Gamble Co. (The) | 3,888,391 | ||||||
|
|
|
|||||||
| 6,458,509 | ||||||||
|
|
|
|||||||
| Industrial Conglomerates – 1.1% | ||||||||
| 22,617 | Honeywell International, Inc. | 4,282,529 | ||||||
|
|
|
|||||||
| Insurance – 4.0% | ||||||||
| 31,817 | Chubb Ltd. | 6,015,004 | ||||||
| 29,751 | Marsh & McLennan Cos., Inc. | 4,800,919 | ||||||
| 81,518 | MetLife, Inc. | 5,244,053 | ||||||
|
|
|
|||||||
| 16,059,976 | ||||||||
|
|
|
|||||||
| The accompanying notes are an integral part of these financial statements. | 33 |
GOLDMAN SACHS EQUITY INCOME FUND
Schedule of Investments (continued)
August 31, 2022
| Shares | Description | Value |
||||||
| Common Stocks – (continued) | ||||||||
| IT Services – 3.6% | ||||||||
| 13,977 | Accenture PLC, Class A | $ | 4,031,805 | |||||
| 30,410 | Cognizant Technology Solutions Corp., Class A | 1,921,000 | ||||||
| 39,565 | Fidelity National Information Services, Inc. | 3,615,054 | ||||||
| 40,795 | International Business Machines Corp. | 5,240,118 | ||||||
|
|
|
|||||||
| 14,807,977 | ||||||||
|
|
|
|||||||
| Machinery – 3.2% | ||||||||
| 16,455 | Caterpillar, Inc. | 3,039,403 | ||||||
| 21,432 | Cummins, Inc. | 4,615,810 | ||||||
| 28,051 | Illinois Tool Works, Inc. | 5,465,176 | ||||||
|
|
|
|||||||
| 13,120,389 | ||||||||
|
|
|
|||||||
| Media – 1.6% | ||||||||
| 100,954 | Comcast Corp., Class A | 3,653,526 | ||||||
| 87,680 | New York Times Co. (The), Class A | 2,673,363 | ||||||
|
|
|
|||||||
| 6,326,889 | ||||||||
|
|
|
|||||||
| Metals & Mining – 1.1% | ||||||||
| 81,143 | Rio Tinto PLC ADR (Australia)(a) | 4,567,540 | ||||||
|
|
|
|||||||
| Multiline Retail – 0.9% | ||||||||
| 23,198 | Target Corp. | 3,719,567 | ||||||
|
|
|
|||||||
| Multi-Utilities – 3.4% | ||||||||
| 58,852 | Ameren Corp. | 5,450,872 | ||||||
| 69,184 | CMS Energy Corp. | 4,672,687 | ||||||
| 58,056 | National Grid PLC ADR (United Kingdom) | 3,668,559 | ||||||
|
|
|
|||||||
| 13,792,118 | ||||||||
|
|
|
|||||||
| Oil, Gas & Consumable Fuels – 8.0% | ||||||||
| 79,315 | ConocoPhillips | 8,681,027 | ||||||
| 103,918 | Devon Energy Corp. | 7,338,689 | ||||||
| 87,465 | Exxon Mobil Corp. | 8,360,779 | ||||||
| 22,395 | Pioneer Natural Resources Co. | 5,670,862 | ||||||
| 48,632 | Shell PLC ADR (Netherlands) | 2,576,524 | ||||||
|
|
|
|||||||
| 32,627,881 | ||||||||
|
|
|
|||||||
| Pharmaceuticals – 7.3% | ||||||||
| 147,249 | Bristol-Myers Squibb Co. | 9,926,055 | ||||||
| 25,645 | Eli Lilly & Co. | 7,725,044 | ||||||
| 73,621 | Johnson & Johnson | 11,878,012 | ||||||
|
|
|
|||||||
| 29,529,111 | ||||||||
|
|
|
|||||||
| Road & Rail – 1.1% | ||||||||
| 17,810 | Norfolk Southern Corp. | 4,330,145 | ||||||
|
|
|
|||||||
| Semiconductors & Semiconductor Equipment – 2.9% | ||||||||
| 13,597 | KLA Corp. | 4,679,136 | ||||||
| 73,290 | Marvell Technology, Inc. | 3,431,438 | ||||||
| 22,492 | Texas Instruments, Inc. | 3,715,903 | ||||||
|
|
|
|||||||
| 11,826,477 | ||||||||
|
|
|
|||||||
| Software – 0.8% | ||||||||
| 12,613 | Microsoft Corp. | 3,297,921 | ||||||
|
|
|
|||||||
| Common Stocks – (continued) | ||||||||
| Specialty Retail – 1.2% | ||||||||
| 12,234 | Advance Auto Parts, Inc. | 2,063,142 | ||||||
| 34,690 | Ross Stores, Inc. | 2,992,706 | ||||||
|
|
|
|||||||
| 5,055,848 | ||||||||
|
|
|
|||||||
| Technology Hardware, Storage & Peripherals – 0.5% | ||||||||
| 25,372 | NetApp, Inc. | 1,830,082 | ||||||
|
|
|
|||||||
| Water Utilities – 1.0% | ||||||||
| 26,360 | American Water Works Co., Inc. | 3,913,142 | ||||||
|
|
|
|||||||
| TOTAL COMMON STOCKS | ||||||||
| (Cost $335,385,362) | $ | 396,699,369 | ||||||
|
|
|
|||||||
| Shares | Dividend Rate |
Value | ||||||
| Investment Company – 2.2%(b) | ||||||||
| |
Goldman Sachs Financial Square Government Fund – |
| ||||||
| 8,778,605 | 2.154% | $ | 8,778,605 | |||||
| (Cost $8,778,605) | ||||||||
|
|
|
|||||||
| |
TOTAL INVESTMENTS BEFORE SECURITIES LENDING REINVESTMENT VEHICLE |
| ||||||
| (Cost $344,163,967) | $ | 405,477,974 | ||||||
|
|
|
|||||||
| Securities Lending Reinvestment Vehicle – 0.6%(b) | ||||||||
| |
Goldman Sachs Financial Square Government Fund – |
| ||||||
| 2,353,075 | 2.154% | $ | 2,353,075 | |||||
| (Cost $2,353,075) | ||||||||
|
|
|
|||||||
| TOTAL INVESTMENTS – 100.5% | ||||||||
| (Cost $346,517,042) | $ | 407,831,049 | ||||||
|
|
|
|||||||
| |
LIABILITIES IN EXCESS OF OTHER ASSETS – (0.5)% |
(1,883,968 | ) | |||||
|
|
|
|||||||
| NET ASSETS – 100.0% | $ | 405,947,081 | ||||||
|
|
|
|||||||
| The percentage shown for each investment category reflects the value of investments in that category as a percentage of net assets. | ||
| (a) |
All or a portion of security is on loan. | |
| (b) |
Represents an affiliated issuer. | |
|
| ||
| Investment Abbreviations: | ||
| ADR |
—American Depositary Receipt | |
| PLC |
—Public Limited Company | |
| REIT |
—Real Estate Investment Trust | |
|
| ||
| 34 | The accompanying notes are an integral part of these financial statements. |
GOLDMAN SACHS FOCUSED VALUE FUND
Schedule of Investments
August 31, 2022
| Shares | Description | Value |
||||||
| Common Stocks – 97.3% | ||||||||
| Aerospace & Defense – 2.5% | ||||||||
| 4,685 | L3Harris Technologies, Inc. | $ | 1,069,070 | |||||
|
|
|
|||||||
| Automobiles – 2.9% | ||||||||
| 32,084 | General Motors Co. | 1,225,930 | ||||||
|
|
|
|||||||
| Banks – 7.6% | ||||||||
| 46,853 | Bank of America Corp. | 1,574,729 | ||||||
| 14,750 | JPMorgan Chase & Co. | 1,677,518 | ||||||
|
|
|
|||||||
| 3,252,247 | ||||||||
|
|
|
|||||||
| Beverages – 1.9% | ||||||||
| 13,549 | Coca-Cola Co. (The) | 836,109 | ||||||
|
|
|
|||||||
| Biotechnology – 2.5% | ||||||||
| 11,722 | Gilead Sciences, Inc. | 743,995 | ||||||
| 3,139 | Neurocrine Biosciences, Inc.* | 328,434 | ||||||
|
|
|
|||||||
| 1,072,429 | ||||||||
|
|
|
|||||||
| Capital Markets – 5.2% | ||||||||
| 1,726 | BlackRock, Inc. | 1,150,189 | ||||||
| 15,305 | Charles Schwab Corp. (The) | 1,085,890 | ||||||
|
|
|
|||||||
| 2,236,079 | ||||||||
|
|
|
|||||||
| Construction Materials – 2.5% | ||||||||
| 3,125 | Martin Marietta Materials, Inc. | 1,086,594 | ||||||
|
|
|
|||||||
| Containers & Packaging – 2.1% | ||||||||
| 16,060 | Ball Corp. | 896,309 | ||||||
|
|
|
|||||||
| Diversified Telecommunication Services – 3.1% | ||||||||
| 75,468 | AT&T, Inc. | 1,323,709 | ||||||
|
|
|
|||||||
| Electric Utilities – 3.5% | ||||||||
| 17,665 | NextEra Energy, Inc. | 1,502,585 | ||||||
|
|
|
|||||||
| Equity Real Estate Investment Trusts (REITs) – 1.9% | ||||||||
| 5,205 | Alexandria Real Estate Equities, Inc. REIT | 798,447 | ||||||
|
|
|
|||||||
| Food & Staples Retailing – 5.1% | ||||||||
| 16,647 | Walmart, Inc. | 2,206,560 | ||||||
|
|
|
|||||||
| Food Products – 2.4% | ||||||||
| 11,633 | Archer-Daniels-Midland Co. | 1,022,424 | ||||||
|
|
|
|||||||
| Health Care Equipment & Supplies – 5.7% | ||||||||
| 32,468 | Boston Scientific Corp.* | 1,308,785 | ||||||
| 10,689 | Zimmer Biomet Holdings, Inc. | 1,136,454 | ||||||
|
|
|
|||||||
| 2,445,239 | ||||||||
|
|
|
|||||||
| Health Care Providers & Services – 5.0% | ||||||||
| 4,504 | Humana, Inc. | 2,169,937 | ||||||
|
|
|
|||||||
| Industrial Conglomerates – 3.5% | ||||||||
| 20,469 | General Electric Co. | 1,503,243 | ||||||
|
|
|
|||||||
| Insurance – 5.0% | ||||||||
| 11,397 | Chubb Ltd. | 2,154,603 | ||||||
|
|
|
|||||||
| Interactive Media & Services – 2.5% | ||||||||
| 6,712 | Meta Platforms, Inc., Class A* | 1,093,586 | ||||||
|
|
|
|||||||
| Common Stocks – (continued) | ||||||||
| Machinery – 2.2% | ||||||||
| 5,160 | Caterpillar, Inc. | 953,104 | ||||||
|
|
|
|||||||
| Multi-Utilities – 3.4% | ||||||||
| 15,664 | Ameren Corp. | 1,450,800 | ||||||
|
|
|
|||||||
| Oil, Gas & Consumable Fuels – 7.6% | ||||||||
| 13,318 | ConocoPhillips | 1,457,655 | ||||||
| 25,748 | Devon Energy Corp. | 1,818,324 | ||||||
|
|
|
|||||||
| 3,275,979 | ||||||||
|
|
|
|||||||
| Pharmaceuticals – 5.4% | ||||||||
| 34,740 | Bristol-Myers Squibb Co. | 2,341,823 | ||||||
|
|
|
|||||||
| Road & Rail – 2.7% | ||||||||
| 4,704 | Norfolk Southern Corp. | 1,143,683 | ||||||
|
|
|
|||||||
| Semiconductors & Semiconductor Equipment – 3.5% | ||||||||
| 4,347 | KLA Corp. | 1,495,933 | ||||||
|
|
|
|||||||
| Software – 4.6% | ||||||||
| 2,475 | Adobe, Inc.* | 924,264 | ||||||
| 6,627 | Salesforce, Inc.* | 1,034,607 | ||||||
|
|
|
|||||||
| 1,958,871 | ||||||||
|
|
|
|||||||
| Specialty Retail – 3.0% | ||||||||
| 15,114 | Ross Stores, Inc. | 1,303,885 | ||||||
|
|
|
|||||||
| TOTAL COMMON STOCKS | ||||||||
| (Cost $43,018,978) | $ | 41,819,178 | ||||||
|
|
|
|||||||
| Shares | Dividend Rate |
Value | ||||||
| Investment Company – 2.1%(a) | ||||||||
| |
Goldman Sachs Financial Square Government Fund – |
| ||||||
| 922,973 | 2.154% | $ | 922,973 | |||||
| (Cost $922,973) | ||||||||
|
|
|
|||||||
| TOTAL INVESTMENTS – 99.4% | ||||||||
| (Cost $43,941,951) | $ | 42,742,151 | ||||||
|
|
|
|||||||
| |
OTHER ASSETS IN EXCESS OF LIABILITIES – 0.6% |
236,382 | ||||||
|
|
|
|||||||
| NET ASSETS – 100.0% | $ | 42,978,533 | ||||||
|
|
|
|||||||
| The percentage shown for each investment category reflects the value of investments in that category as a percentage of net assets. | ||
| * |
Non-income producing security. | |
| (a) |
Represents an affiliated issuer. | |
|
| ||
| Investment Abbreviations: | ||
| REIT |
—Real Estate Investment Trust | |
|
| ||
| The accompanying notes are an integral part of these financial statements. | 35 |
GOLDMAN SACHS LARGE CAP VALUE FUND
Schedule of Investments
August 31, 2022
| Shares | Description | Value |
||||||
| Common Stocks – 98.8% | ||||||||
| Aerospace & Defense – 1.6% | ||||||||
| 32,003 | L3Harris Technologies, Inc. | $ | 7,302,765 | |||||
|
|
|
|||||||
| Airlines – 0.6% | ||||||||
| 82,252 | United Airlines Holdings, Inc.* | 2,879,642 | ||||||
|
|
|
|||||||
| Automobiles – 1.5% | ||||||||
| 175,774 | General Motors Co. | 6,716,325 | ||||||
|
|
|
|||||||
| Banks – 6.5% | ||||||||
| 324,276 | Bank of America Corp. | 10,898,916 | ||||||
| 108,983 | JPMorgan Chase & Co. | 12,394,637 | ||||||
| 15,936 | M&T Bank Corp. | 2,896,846 | ||||||
| 61,669 | Truist Financial Corp. | 2,888,576 | ||||||
|
|
|
|||||||
| 29,078,975 | ||||||||
|
|
|
|||||||
| Beverages – 1.9% | ||||||||
| 69,968 | Coca-Cola Co. (The) | 4,317,725 | ||||||
| 17,619 | Constellation Brands, Inc., Class A | 4,335,155 | ||||||
|
|
|
|||||||
| 8,652,880 | ||||||||
|
|
|
|||||||
| Biotechnology – 2.1% | ||||||||
| 4,730 | Argenx SE ADR (Netherlands)* | 1,787,325 | ||||||
| 5,583 | Biogen, Inc.* | 1,090,807 | ||||||
| 71,975 | Gilead Sciences, Inc. | 4,568,253 | ||||||
| 18,228 | Neurocrine Biosciences, Inc.* | 1,907,196 | ||||||
|
|
|
|||||||
| 9,353,581 | ||||||||
|
|
|
|||||||
| Capital Markets – 5.8% | ||||||||
| 9,971 | BlackRock, Inc. | 6,644,575 | ||||||
| 90,846 | Charles Schwab Corp. (The) | 6,445,524 | ||||||
| 96,866 | Morgan Stanley | 8,254,920 | ||||||
| 81,423 | Nasdaq, Inc. | 4,847,111 | ||||||
|
|
|
|||||||
| 26,192,130 | ||||||||
|
|
|
|||||||
| Chemicals – 2.6% | ||||||||
| 46,811 | Ashland, Inc. | 4,763,488 | ||||||
| 23,969 | Linde PLC (United Kingdom) | 6,779,871 | ||||||
|
|
|
|||||||
| 11,543,359 | ||||||||
|
|
|
|||||||
| Commercial Services & Supplies – 0.7% | ||||||||
| 23,987 | Waste Connections, Inc. | 3,338,511 | ||||||
|
|
|
|||||||
| Communications Equipment – 1.4% | ||||||||
| 144,658 | Cisco Systems, Inc. | 6,469,106 | ||||||
|
|
|
|||||||
| Construction Materials – 1.3% | ||||||||
| 17,159 | Martin Marietta Materials, Inc. | 5,966,356 | ||||||
|
|
|
|||||||
| Containers & Packaging – 0.9% | ||||||||
| 70,271 | Ball Corp. | 3,921,824 | ||||||
|
|
|
|||||||
| Diversified Financial Services – 1.1% | ||||||||
| 17,805 | Berkshire Hathaway, Inc., Class B* | 4,999,644 | ||||||
|
|
|
|||||||
| Diversified Telecommunication Services – 1.8% | ||||||||
| 449,553 | AT&T, Inc. | 7,885,160 | ||||||
|
|
|
|||||||
| Electric Utilities – 3.3% | ||||||||
| 113,770 | NextEra Energy, Inc. | 9,677,276 | ||||||
|
|
|
|||||||
| Common Stocks – (continued) | ||||||||
| Electric Utilities – (continued) | ||||||||
| 70,014 | Xcel Energy, Inc. | 5,198,540 | ||||||
|
|
|
|||||||
| 14,875,816 | ||||||||
|
|
|
|||||||
| Electrical Equipment – 1.2% | ||||||||
| 40,381 | Eaton Corp. PLC | 5,517,660 | ||||||
|
|
|
|||||||
| Electronic Equipment, Instruments & Components – 0.6% | ||||||||
| 16,203 | Keysight Technologies, Inc.* | 2,655,510 | ||||||
|
|
|
|||||||
| Entertainment – 0.7% | ||||||||
| 26,204 | Electronic Arts, Inc. | 3,324,501 | ||||||
|
|
|
|||||||
| Equity Real Estate Investment Trusts (REITs) – 3.6% | ||||||||
| 21,536 | Alexandria Real Estate Equities, Inc. REIT | 3,303,622 | ||||||
| 16,628 | American Tower Corp. REIT | 4,224,343 | ||||||
| 19,813 | AvalonBay Communities, Inc. REIT | 3,980,630 | ||||||
| 30,529 | Boston Properties, Inc. REIT | 2,424,919 | ||||||
| 6,423 | Public Storage REIT | 2,124,921 | ||||||
|
|
|
|||||||
| 16,058,435 | ||||||||
|
|
|
|||||||
| Food & Staples Retailing – 2.1% | ||||||||
| 69,795 | Walmart, Inc. | 9,251,327 | ||||||
|
|
|
|||||||
| Food Products – 2.0% | ||||||||
| 58,294 | Archer-Daniels-Midland Co. | 5,123,460 | ||||||
| 52,298 | General Mills, Inc. | 4,016,486 | ||||||
|
|
|
|||||||
| 9,139,946 | ||||||||
|
|
|
|||||||
| Gas Utilities – 0.6% | ||||||||
| 24,751 | Atmos Energy Corp. | 2,806,268 | ||||||
|
|
|
|||||||
| Health Care Equipment & Supplies – 5.0% | ||||||||
| 152,682 | Boston Scientific Corp.* | 6,154,611 | ||||||
| 10,494 | Cooper Cos., Inc. (The) | 3,016,395 | ||||||
| 31,218 | Edwards Lifesciences Corp.* | 2,812,742 | ||||||
| 58,454 | Medtronic PLC | 5,139,276 | ||||||
| 51,808 | Zimmer Biomet Holdings, Inc. | 5,508,227 | ||||||
|
|
|
|||||||
| 22,631,251 | ||||||||
|
|
|
|||||||
| Health Care Providers & Services – 4.1% | ||||||||
| 53,379 | Centene Corp.* | 4,790,232 | ||||||
| 58,127 | CVS Health Corp. | 5,705,165 | ||||||
| 16,744 | Humana, Inc. | 8,066,924 | ||||||
|
|
|
|||||||
| 18,562,321 | ||||||||
|
|
|
|||||||
| Hotels, Restaurants & Leisure – 1.5% | ||||||||
| 26,915 | McDonald’s Corp. | 6,790,116 | ||||||
|
|
|
|||||||
| Household Products – 2.1% | ||||||||
| 59,900 | Colgate-Palmolive Co. | 4,684,779 | ||||||
| 33,205 | Procter & Gamble Co. (The) | 4,580,298 | ||||||
|
|
|
|||||||
| 9,265,077 | ||||||||
|
|
|
|||||||
| Industrial Conglomerates – 1.5% | ||||||||
| 89,536 | General Electric Co. | 6,575,524 | ||||||
|
|
|
|||||||
| Insurance – 4.7% | ||||||||
| 28,718 | Chubb Ltd. | 5,429,138 | ||||||
|
|
|
|||||||
| 36 | The accompanying notes are an integral part of these financial statements. |
GOLDMAN SACHS LARGE CAP VALUE FUND
| Shares | Description | Value |
||||||
| Common Stocks – (continued) | ||||||||
| Insurance – (continued) | ||||||||
| 39,865 | Globe Life, Inc. | $ | 3,874,479 | |||||
| 94,835 | MetLife, Inc. | 6,100,736 | ||||||
| 48,140 | Progressive Corp. (The) | 5,904,371 | ||||||
|
|
|
|||||||
| 21,308,724 | ||||||||
|
|
|
|||||||
| Interactive Media & Services – 3.3% | ||||||||
| 30,076 | Alphabet, Inc., Class A* | 3,254,825 | ||||||
| 71,058 | Meta Platforms, Inc., Class A* | 11,577,480 | ||||||
|
|
|
|||||||
| 14,832,305 | ||||||||
|
|
|
|||||||
| IT Services – 3.5% | ||||||||
| 53,073 | Fidelity National Information Services, Inc. | 4,849,280 | ||||||
| 52,747 | International Business Machines Corp. | 6,775,352 | ||||||
| 43,647 | PayPal Holdings, Inc.* | 4,078,376 | ||||||
|
|
|
|||||||
| 15,703,008 | ||||||||
|
|
|
|||||||
| Machinery – 2.5% | ||||||||
| 27,112 | Caterpillar, Inc. | 5,007,857 | ||||||
| 20,016 | Illinois Tool Works, Inc. | 3,899,717 | ||||||
| 28,366 | Stanley Black & Decker, Inc. | 2,499,045 | ||||||
|
|
|
|||||||
| 11,406,619 | ||||||||
|
|
|
|||||||
| Media – 0.7% | ||||||||
| 105,580 | New York Times Co. (The), Class A | 3,219,134 | ||||||
|
|
|
|||||||
| Metals & Mining – 0.4% | ||||||||
| 66,459 | Freeport-McMoRan, Inc. | 1,967,186 | ||||||
|
|
|
|||||||
| Multiline Retail – 1.1% | ||||||||
| 29,325 | Target Corp. | 4,701,970 | ||||||
|
|
|
|||||||
| Multi-Utilities – 2.0% | ||||||||
| 65,520 | Ameren Corp. | 6,068,463 | ||||||
| 41,534 | CMS Energy Corp. | 2,805,206 | ||||||
|
|
|
|||||||
| 8,873,669 | ||||||||
|
|
|
|||||||
| Oil, Gas & Consumable Fuels – 8.1% | ||||||||
| 30,947 | Chesapeake Energy Corp. | 3,109,864 | ||||||
| 94,150 | ConocoPhillips | 10,304,717 | ||||||
| 113,780 | Devon Energy Corp. | 8,035,143 | ||||||
| 103,752 | Exxon Mobil Corp. | 9,917,654 | ||||||
| 41,470 | Hess Corp. | 5,008,747 | ||||||
|
|
|
|||||||
| 36,376,125 | ||||||||
|
|
|
|||||||
| Pharmaceuticals – 6.4% | ||||||||
| 57,100 | AstraZeneca PLC ADR (United Kingdom) | 3,561,898 | ||||||
| 142,093 | Bristol-Myers Squibb Co. | 9,578,489 | ||||||
| 96,167 | Johnson & Johnson | 15,515,584 | ||||||
|
|
|
|||||||
| 28,655,971 | ||||||||
|
|
|
|||||||
| Road & Rail – 2.3% | ||||||||
| 28,094 | Norfolk Southern Corp. | 6,830,494 | ||||||
| 13,010 | Old Dominion Freight Line, Inc. | 3,531,044 | ||||||
|
|
|
|||||||
| 10,361,538 | ||||||||
|
|
|
|||||||
| Common Stocks – (continued) | ||||||||
| Semiconductors & Semiconductor Equipment – 1.9% | ||||||||
| 10,100 | KLA Corp. | 3,475,713 | ||||||
| 37,144 | ON Semiconductor Corp.* | 2,554,393 | ||||||
| 22,016 | Wolfspeed, Inc.* | 2,498,155 | ||||||
|
|
|
|||||||
| 8,528,261 | ||||||||
|
|
|
|||||||
| Software – 2.3% | ||||||||
| 10,403 | Adobe, Inc.* | 3,884,896 | ||||||
| 41,963 | Salesforce, Inc.* | 6,551,264 | ||||||
|
|
|
|||||||
| 10,436,160 | ||||||||
|
|
|
|||||||
| Specialty Retail – 1.5% | ||||||||
| 80,448 | Ross Stores, Inc. | 6,940,249 | ||||||
|
|
|
|||||||
| TOTAL COMMON STOCKS | ||||||||
| (Cost $397,026,205) | $ | 445,064,929 | ||||||
|
|
|
|||||||
| Shares | Dividend Rate |
Value | ||||||
| Investment Company – 0.9%(a) | ||||||||
| |
Goldman Sachs Financial Square Government Fund – |
| ||||||
| 4,276,030 | 2.154% | $ | 4,276,030 | |||||
| (Cost $4,276,030) | ||||||||
|
|
|
|||||||
| TOTAL INVESTMENTS – 99.7% | ||||||||
| (Cost $401,302,235) | $ | 449,340,959 | ||||||
|
|
|
|||||||
| |
OTHER ASSETS IN EXCESS OF LIABILITIES – 0.3% |
963,967 | ||||||
|
|
|
|||||||
| NET ASSETS – 100.0% | $ | 450,304,926 | ||||||
|
|
|
|||||||
| The percentage shown for each investment category reflects the value of investments in that category as a percentage of net assets. | ||
| * |
Non-income producing security. | |
| (a) |
Represents an affiliated issuer. | |
|
| ||
| Investment Abbreviations: | ||
| ADR |
—American Depositary Receipt | |
| PLC |
—Public Limited Company | |
| REIT |
—Real Estate Investment Trust | |
|
| ||
| The accompanying notes are an integral part of these financial statements. | 37 |
GOLDMAN SACHS MID CAP VALUE FUND
Schedule of Investments
August 31, 2022
| Shares | Description | Value |
||||||
| Common Stocks – 98.0% | ||||||||
| Aerospace & Defense – 2.9% | ||||||||
| 48,238 | L3Harris Technologies, Inc. | $ | 11,007,429 | |||||
| 12,813 | TransDigm Group, Inc. | 7,692,797 | ||||||
| 158,715 | Woodward, Inc. | 14,771,605 | ||||||
|
|
|
|||||||
| 33,471,831 | ||||||||
|
|
|
|||||||
| Airlines – 0.4% | ||||||||
| 141,133 | United Airlines Holdings, Inc.* | 4,941,066 | ||||||
|
|
|
|||||||
| Auto Components – 1.1% | ||||||||
| 134,339 | Aptiv PLC* | 12,551,293 | ||||||
|
|
|
|||||||
| Banks – 5.5% | ||||||||
| 147,553 | Citizens Financial Group, Inc. | 5,412,244 | ||||||
| 263,300 | East West Bancorp, Inc. | 19,002,361 | ||||||
| 60,621 | First Republic Bank | 9,204,086 | ||||||
| 112,297 | M&T Bank Corp. | 20,413,349 | ||||||
| 112,363 | Pinnacle Financial Partners, Inc. | 9,068,818 | ||||||
|
|
|
|||||||
| 63,100,858 | ||||||||
|
|
|
|||||||
| Beverages – 1.1% | ||||||||
| 264,983 | Coca-Cola Europacific Partners PLC (United Kingdom) | 13,029,214 | ||||||
|
|
|
|||||||
| Biotechnology – 1.2% | ||||||||
| 13,012 | Argenx SE ADR (Netherlands)* | 4,916,844 | ||||||
| 29,316 | Biogen, Inc.* | 5,727,760 | ||||||
| 34,255 | Neurocrine Biosciences, Inc.* | 3,584,101 | ||||||
|
|
|
|||||||
| 14,228,705 | ||||||||
|
|
|
|||||||
| Building Products – 1.6% | ||||||||
| 86,598 | Allegion PLC | 8,235,470 | ||||||
| 63,500 | Trane Technologies PLC | 9,783,445 | ||||||
|
|
|
|||||||
| 18,018,915 | ||||||||
|
|
|
|||||||
| Capital Markets – 3.6% | ||||||||
| 183,298 | Carlyle Group, Inc. (The) | 5,962,684 | ||||||
| 14,530 | MSCI, Inc. | 6,527,457 | ||||||
| 240,858 | Nasdaq, Inc. | 14,338,277 | ||||||
| 143,196 | Raymond James Financial, Inc. | 14,945,366 | ||||||
|
|
|
|||||||
| 41,773,784 | ||||||||
|
|
|
|||||||
| Chemicals – 3.1% | ||||||||
| 151,244 | Ashland, Inc. | 15,390,589 | ||||||
| 182,892 | Corteva, Inc. | 11,235,056 | ||||||
| 74,197 | PPG Industries, Inc. | 9,421,535 | ||||||
|
|
|
|||||||
| 36,047,180 | ||||||||
|
|
|
|||||||
| Communications Equipment – 3.5% | ||||||||
| 208,815 | Juniper Networks, Inc. | 5,934,522 | ||||||
| 85,807 | Motorola Solutions, Inc. | 20,886,282 | ||||||
| 915,575 | Viavi Solutions, Inc.* | 12,891,296 | ||||||
|
|
|
|||||||
| 39,712,100 | ||||||||
|
|
|
|||||||
| Construction Materials – 1.2% | ||||||||
| 39,142 | Martin Marietta Materials, Inc. | 13,610,065 | ||||||
|
|
|
|||||||
| Containers & Packaging – 1.8% | ||||||||
| 380,587 | Ball Corp. | 21,240,561 | ||||||
|
|
|
|||||||
| Common Stocks – (continued) | ||||||||
| Diversified Financial Services – 0.5% | ||||||||
| 97,743 | Apollo Global Management, Inc. | 5,432,556 | ||||||
|
|
|
|||||||
| Electric Utilities – 1.7% | ||||||||
| 263,769 | Xcel Energy, Inc. | 19,584,848 | ||||||
|
|
|
|||||||
| Electrical Equipment – 2.1% | ||||||||
| 123,162 | AMETEK, Inc. | 14,799,146 | ||||||
| 38,602 | Rockwell Automation, Inc. | 9,146,358 | ||||||
|
|
|
|||||||
| 23,945,504 | ||||||||
|
|
|
|||||||
| Electronic Equipment, Instruments & Components – 1.8% | ||||||||
| 68,997 | Keysight Technologies, Inc.* | 11,307,918 | ||||||
| 409,431 | Vontier Corp. | 8,974,728 | ||||||
|
|
|
|||||||
| 20,282,646 | ||||||||
|
|
|
|||||||
| Energy Equipment & Services – 0.5% | ||||||||
| 219,608 | Baker Hughes Co. | 5,547,298 | ||||||
|
|
|
|||||||
| Entertainment – 2.5% | ||||||||
| 95,837 | Electronic Arts, Inc. | 12,158,840 | ||||||
| 96,728 | Live Nation Entertainment, Inc.* | 8,740,342 | ||||||
| 570,843 | Warner Bros Discovery, Inc.* | 7,557,962 | ||||||
|
|
|
|||||||
| 28,457,144 | ||||||||
|
|
|
|||||||
| Equity Real Estate Investment Trusts (REITs) – 10.4% | ||||||||
| 139,958 | Alexandria Real Estate Equities, Inc. REIT | 21,469,557 | ||||||
| 255,729 | Americold Realty Trust, Inc. REIT | 7,523,547 | ||||||
| 92,441 | AvalonBay Communities, Inc. REIT | 18,572,321 | ||||||
| 119,719 | CubeSmart REIT | 5,513,060 | ||||||
| 92,289 | Duke Realty Corp. REIT | 5,431,208 | ||||||
| 126,425 | Equity LifeStyle Properties, Inc. REIT | 8,862,393 | ||||||
| 38,184 | Essex Property Trust, Inc. REIT | 10,121,051 | ||||||
| 308,150 | Healthpeak Properties, Inc. REIT | 8,088,938 | ||||||
| 227,291 | Invitation Homes, Inc. REIT | 8,246,118 | ||||||
| 129,292 | Regency Centers Corp. REIT | 7,866,125 | ||||||
| 202,404 | Ventas, Inc. REIT | 9,687,055 | ||||||
| 253,303 | VICI Properties, Inc. REIT | 8,356,466 | ||||||
|
|
|
|||||||
| 119,737,839 | ||||||||
|
|
|
|||||||
| Food & Staples Retailing – 0.9% | ||||||||
| 196,179 | Performance Food Group Co.* | 9,805,026 | ||||||
|
|
|
|||||||
| Food Products – 1.6% | ||||||||
| 158,007 | McCormick & Co., Inc. | 13,283,648 | ||||||
| 328,801 | Utz Brands, Inc. | 5,477,825 | ||||||
|
|
|
|||||||
| 18,761,473 | ||||||||
|
|
|
|||||||
| Health Care Equipment & Supplies – 2.8% | ||||||||
| 54,774 | Cooper Cos., Inc. (The) | 15,744,239 | ||||||
| 158,831 | Zimmer Biomet Holdings, Inc. | 16,886,912 | ||||||
|
|
|
|||||||
| 32,631,151 | ||||||||
|
|
|
|||||||
| Health Care Providers & Services – 2.4% | ||||||||
| 79,883 | AmerisourceBergen Corp. | 11,707,652 | ||||||
| 111,647 | Centene Corp.* | 10,019,202 | ||||||
| 47,422 | Quest Diagnostics, Inc. | 5,942,451 | ||||||
|
|
|
|||||||
| 27,669,305 | ||||||||
|
|
|
|||||||
| 38 | The accompanying notes are an integral part of these financial statements. |
GOLDMAN SACHS MID CAP VALUE FUND
| Shares | Description | Value |
||||||
| Common Stocks – (continued) | ||||||||
| Hotels, Restaurants & Leisure – 2.0% | ||||||||
| 21,357 | Domino’s Pizza, Inc. | $ | 7,941,814 | |||||
| 78,545 | Expedia Group, Inc.* | 8,062,644 | ||||||
| 64,107 | Yum! Brands, Inc. | 7,131,263 | ||||||
|
|
|
|||||||
| 23,135,721 | ||||||||
|
|
|
|||||||
| Household Durables – 1.2% | ||||||||
| 173,210 | Lennar Corp., Class A | 13,415,115 | ||||||
|
|
|
|||||||
| Independent Power and Renewable Electricity Producers – 2.2% | ||||||||
| 597,978 | AES Corp. (The) | 15,218,540 | ||||||
| 120,813 | NextEra Energy Partners LP | 9,917,539 | ||||||
|
|
|
|||||||
| 25,136,079 | ||||||||
|
|
|
|||||||
| Insurance – 6.9% | ||||||||
| 101,462 | Allstate Corp. (The) | 12,226,171 | ||||||
| 48,208 | American Financial Group, Inc. | 6,155,197 | ||||||
| 220,924 | Arch Capital Group Ltd.* | 10,100,645 | ||||||
| 66,389 | Arthur J Gallagher & Co. | 12,054,251 | ||||||
| 144,073 | Globe Life, Inc. | 14,002,455 | ||||||
| 3,544 | Markel Corp.* | 4,231,926 | ||||||
| 188,683 | Principal Financial Group, Inc. | 14,105,941 | ||||||
| 165,799 | Unum Group | 6,275,492 | ||||||
|
|
|
|||||||
| 79,152,078 | ||||||||
|
|
|
|||||||
| Interactive Media & Services – 0.7% | ||||||||
| 719,533 | Snap, Inc., Class A* | 7,828,519 | ||||||
|
|
|
|||||||
| Internet & Direct Marketing Retail – 0.7% | ||||||||
| 72,971 | Etsy, Inc.* | 7,706,467 | ||||||
|
|
|
|||||||
| IT Services – 1.1% | ||||||||
| 104,710 | Global Payments, Inc. | 13,008,123 | ||||||
|
|
|
|||||||
| Machinery – 6.1% | ||||||||
| 40,763 | Chart Industries, Inc.* | 7,902,315 | ||||||
| 94,824 | Cummins, Inc. | 20,422,245 | ||||||
| 223,321 | Fortive Corp. | 14,142,919 | ||||||
| 217,974 | ITT, Inc. | 15,809,654 | ||||||
| 136,659 | Stanley Black & Decker, Inc. | 12,039,658 | ||||||
|
|
|
|||||||
| 70,316,791 | ||||||||
|
|
|
|||||||
| Metals & Mining – 1.9% | ||||||||
| 217,082 | ATI, Inc. * | 6,497,265 | ||||||
| 195,310 | Steel Dynamics, Inc. | 15,765,423 | ||||||
|
|
|
|||||||
| 22,262,688 | ||||||||
|
|
|
|||||||
| Multi-Utilities – 5.0% | ||||||||
| 246,025 | Ameren Corp. | 22,786,836 | ||||||
| 198,541 | CMS Energy Corp. | 13,409,459 | ||||||
| 139,121 | Public Service Enterprise Group, Inc. | 8,953,828 | ||||||
| 115,057 | WEC Energy Group, Inc. | 11,866,979 | ||||||
|
|
|
|||||||
| 57,017,102 | ||||||||
|
|
|
|||||||
| Oil, Gas & Consumable Fuels – 4.6% | ||||||||
| 82,273 | Cheniere Energy, Inc. | 13,178,489 | ||||||
| 105,584 | Chesapeake Energy Corp. | 10,610,136 | ||||||
| 154,466 | Devon Energy Corp. | 10,908,389 | ||||||
| 53,321 | Diamondback Energy, Inc. | 7,106,623 | ||||||
|
|
|
|||||||
| Common Stocks – (continued) | ||||||||
| Oil, Gas & Consumable Fuels – (continued) | ||||||||
| 440,514 | Marathon Oil Corp. | 11,272,753 | ||||||
|
|
|
|||||||
| 53,076,390 | ||||||||
|
|
|
|||||||
| Pharmaceuticals – 0.9% | ||||||||
| 118,454 | Catalent, Inc.* | 10,423,952 | ||||||
|
|
|
|||||||
| Road & Rail – 1.7% | ||||||||
| 138,901 | Knight-Swift Transportation Holdings, Inc. | 7,015,890 | ||||||
| 25,854 | Old Dominion Freight Line, Inc. | 7,017,034 | ||||||
| 24,193 | Saia, Inc.* | 5,003,838 | ||||||
|
|
|
|||||||
| 19,036,762 | ||||||||
|
|
|
|||||||
| Semiconductors & Semiconductor Equipment – 1.8% | ||||||||
| 103,811 | MKS Instruments, Inc. | 10,340,614 | ||||||
| 156,297 | ON Semiconductor Corp.* | 10,748,544 | ||||||
|
|
|
|||||||
| 21,089,158 | ||||||||
|
|
|
|||||||
| Software – 1.4% | ||||||||
| 54,180 | Bill.com Holdings, Inc.* | 8,770,659 | ||||||
| 196,873 | Dynatrace, Inc.* | 7,516,611 | ||||||
|
|
|
|||||||
| 16,287,270 | ||||||||
|
|
|
|||||||
| Specialty Retail – 3.2% | ||||||||
| 142,660 | Academy Sports & Outdoors, Inc. | 6,145,793 | ||||||
| 91,574 | Burlington Stores, Inc.* | 12,837,759 | ||||||
| 185,902 | National Vision Holdings, Inc.* | 6,177,523 | ||||||
| 8,347 | O’Reilly Automotive, Inc.* | 5,818,861 | ||||||
| 23,819 | RH* | 6,095,520 | ||||||
|
|
|
|||||||
| 37,075,456 | ||||||||
|
|
|
|||||||
| Textiles, Apparel & Luxury Goods – 1.2% | ||||||||
| 143,466 | Capri Holdings Ltd.* | 6,768,726 | ||||||
| 20,599 | Deckers Outdoor Corp.* | 6,624,020 | ||||||
|
|
|
|||||||
| 13,392,746 | ||||||||
|
|
|
|||||||
| Trading Companies & Distributors – 0.5% | ||||||||
| 114,335 | Fastenal Co. | 5,754,481 | ||||||
|
|
|
|||||||
| Water Utilities – 0.7% | ||||||||
| 51,618 | American Water Works Co., Inc. | 7,662,692 | ||||||
|
|
|
|||||||
| TOTAL COMMON STOCKS | ||||||||
| (Cost $1,005,276,677) | $ | 1,126,357,952 | ||||||
|
|
|
|||||||
| The accompanying notes are an integral part of these financial statements. | 39 |
GOLDMAN SACHS MID CAP VALUE FUND
Schedule of Investments (continued)
August 31, 2022
| Shares | Dividend Rate |
Value | ||||||
| Investment Company – 1.9%(a) | ||||||||
| |
Goldman Sachs Financial Square Government Fund – |
| ||||||
| 22,288,207 | 2.154% | $ | 22,288,207 | |||||
| (Cost $22,288,207) | ||||||||
|
|
|
|||||||
| TOTAL INVESTMENTS – 99.9% | ||||||||
| (Cost $1,027,564,884) | $ | 1,148,646,159 | ||||||
|
|
|
|||||||
| |
OTHER ASSETS IN EXCESS OF LIABILITIES – 0.1% |
125,180 | ||||||
|
|
|
|||||||
| NET ASSETS – 100.0% | $ | 1,148,771,339 | ||||||
|
|
|
|||||||
| The percentage shown for each investment category reflects the value of investments in that category as a percentage of net assets. | ||
| * |
Non-income producing security. | |
| (a) |
Represents an affiliated issuer. | |
|
| ||||
| Investment Abbreviations: | ||||
| ADR |
—American Depositary Receipt | |||
| LP |
—Limited Partnership | |||
| PLC |
—Public Limited Company | |||
| REIT |
—Real Estate Investment Trust | |||
|
| ||||
| 40 | The accompanying notes are an integral part of these financial statements. |
GOLDMAN SACHS SMALL CAP VALUE FUND
Schedule of Investments
August 31, 2022
| Shares | Description | Value |
||||||
| Common Stocks – 99.1% | ||||||||
| Aerospace & Defense – 1.7% | ||||||||
| 347,218 | AAR Corp.* | $ | 14,888,708 | |||||
| 389,187 | Aerojet Rocketdyne Holdings, Inc.* | 16,762,284 | ||||||
| 268,368 | Ducommun, Inc.* | 11,808,192 | ||||||
| 539,481 | Maxar Technologies, Inc. | 12,855,832 | ||||||
|
|
|
|||||||
| 56,315,016 | ||||||||
|
|
|
|||||||
| Airlines – 0.4% | ||||||||
| 523,079 | Spirit Airlines, Inc.* | 11,863,432 | ||||||
|
|
|
|||||||
| Auto Components – 0.9% | ||||||||
| 528,389 | Adient PLC* | 17,542,515 | ||||||
| 1,125,464 | American Axle & Manufacturing Holdings, Inc.* | 11,648,552 | ||||||
|
|
|
|||||||
| 29,191,067 | ||||||||
|
|
|
|||||||
| Banks – 19.2% | ||||||||
| 206,830 | Amalgamated Financial Corp. | 4,653,675 | ||||||
| 479,000 | Ameris Bancorp | 22,359,720 | ||||||
| 1,060,162 | Associated Banc-Corp. | 21,245,647 | ||||||
| 636,104 | Atlantic Union Bankshares Corp. | 20,641,575 | ||||||
| 440,773 | Banner Corp. | 26,781,368 | ||||||
| 259,593 | Berkshire Hills Bancorp, Inc. | 7,323,119 | ||||||
| 948,450 | Brookline Bancorp, Inc. | 11,827,172 | ||||||
| 479,402 | Cadence Bank | 12,215,163 | ||||||
| 257,256 | Community Bank System, Inc. | 16,819,397 | ||||||
| 653,218 | ConnectOne Bancorp, Inc. | 16,350,047 | ||||||
| 927,584 | CVB Financial Corp. | 24,339,804 | ||||||
| 1,306,591 | Eastern Bankshares, Inc. | 25,347,865 | ||||||
| 435,123 | FB Financial Corp. | 17,239,573 | ||||||
| 331,844 | First Financial Bankshares, Inc. | 14,106,688 | ||||||
| 548,922 | First Merchants Corp. | 21,858,074 | ||||||
| 303,687 | German American Bancorp, Inc. | 11,406,484 | ||||||
| 339,011 | Glacier Bancorp, Inc. | 17,181,078 | ||||||
| 747,131 | Hancock Whitney Corp. | 36,034,128 | ||||||
| 461,844 | Heritage Financial Corp. | 12,003,326 | ||||||
| 838,776 | Home BancShares, Inc. | 19,736,399 | ||||||
| 330,666 | Independent Bank Corp. | 25,868,001 | ||||||
| 217,793 | Independent Bank Group, Inc. | 14,670,536 | ||||||
| 310,877 | Lakeland Financial Corp. | 23,421,473 | ||||||
| 153,916 | NBT Bancorp, Inc. | 5,968,862 | ||||||
| 861,379 | OceanFirst Financial Corp. | 16,745,208 | ||||||
| 249,266 | Origin Bancorp, Inc. | 10,182,516 | ||||||
| 792,971 | Pacific Premier Bancorp, Inc. | 25,977,730 | ||||||
| 386,125 | PacWest Bancorp | 10,166,671 | ||||||
| 217,848 | Pinnacle Financial Partners, Inc. | 17,582,512 | ||||||
| 621,199 | Renasant Corp. | 20,710,775 | ||||||
| 345,351 | SouthState Corp. | 26,951,192 | ||||||
| 518,075 | Towne Bank | 14,759,957 | ||||||
| 387,481 | TriCo Bancshares | 18,285,228 | ||||||
| 921,376 | United Community Banks, Inc. | 30,893,737 | ||||||
| 915,785 | Washington Federal, Inc. | 29,314,278 | ||||||
|
|
|
|||||||
| 650,968,978 | ||||||||
|
|
|
|||||||
| Beverages – 0.7% | ||||||||
| 1,850,552 | Primo Water Corp. | 24,316,253 | ||||||
|
|
|
|||||||
| Common Stocks – (continued) | ||||||||
| Biotechnology – 4.8% | ||||||||
| 156,991 | 2seventy bio, Inc.* | 2,312,478 | ||||||
| 470,456 | Agios Pharmaceuticals, Inc.* | 11,996,628 | ||||||
| 310,938 | Alkermes PLC* | 7,359,903 | ||||||
| 620,707 | Allogene Therapeutics, Inc.* | 8,509,893 | ||||||
| 162,458 | Apellis Pharmaceuticals, Inc.* | 9,830,334 | ||||||
| 222,335 | Arcus Biosciences, Inc.* | 5,353,827 | ||||||
| 85,523 | Avidity Biosciences, Inc.* | 1,677,961 | ||||||
| 140,195 | Beam Therapeutics, Inc.* | 7,654,647 | ||||||
| 99,870 | Cytokinetics, Inc.* | 5,289,115 | ||||||
| 1,051,609 | EQRx, Inc.* | 5,142,368 | ||||||
| 97,188 | Intellia Therapeutics, Inc.* | 5,837,111 | ||||||
| 727,103 | Iovance Biotherapeutics, Inc.* | 7,794,544 | ||||||
| 406,848 | Kura Oncology, Inc.* | 5,638,913 | ||||||
| 797,906 | Mersana Therapeutics, Inc.* | 5,984,295 | ||||||
| 542,535 | Myriad Genetics, Inc.* | 12,120,232 | ||||||
| 256,153 | REGENXBIO, Inc.* | 7,556,514 | ||||||
| 425,557 | Relay Therapeutics, Inc.* | 9,775,044 | ||||||
| 371,739 | REVOLUTION Medicines, Inc.* | 7,743,323 | ||||||
| 363,205 | Sage Therapeutics, Inc.* | 13,678,300 | ||||||
| 93,228 | Ultragenyx Pharmaceutical, Inc.* | 4,446,043 | ||||||
| 398,607 | Veracyte, Inc.* | 8,131,583 | ||||||
| 261,011 | Xencor, Inc.* | 6,888,080 | ||||||
| 96,764 | Zentalis Pharmaceuticals, Inc.* | 2,594,243 | ||||||
|
|
|
|||||||
| 163,315,379 | ||||||||
|
|
|
|||||||
| Building Products – 0.7% | ||||||||
| 1,080,221 | Resideo Technologies, Inc.* | 22,490,201 | ||||||
|
|
|
|||||||
| Capital Markets – 1.0% | ||||||||
| 595,059 | P10, Inc., Class A | 7,426,336 | ||||||
| 74,820 | Piper Sandler Cos. | 8,572,128 | ||||||
| 122,804 | PJT Partners, Inc., Class A | 8,500,493 | ||||||
| 142,520 | Stifel Financial Corp. | 8,452,861 | ||||||
|
|
|
|||||||
| 32,951,818 | ||||||||
|
|
|
|||||||
| Chemicals – 2.1% | ||||||||
| 103,569 | Ashland, Inc. | 10,539,181 | ||||||
| 798,011 | Avient Corp. | 34,976,822 | ||||||
| 306,313 | HB Fuller Co. | 19,867,461 | ||||||
| 356,555 | Tronox Holdings PLC, Class A | 5,216,400 | ||||||
|
|
|
|||||||
| 70,599,864 | ||||||||
|
|
|
|||||||
| Commercial Services & Supplies – 1.7% | ||||||||
| 771,006 | ABM Industries, Inc. | 35,774,678 | ||||||
| 577,894 | Deluxe Corp. | 11,118,681 | ||||||
| 63,026 | UniFirst Corp. | 11,361,067 | ||||||
|
|
|
|||||||
| 58,254,426 | ||||||||
|
|
|
|||||||
| Communications Equipment – 0.3% | ||||||||
| 830,223 | Viavi Solutions, Inc.* | 11,689,540 | ||||||
|
|
|
|||||||
| Construction & Engineering – 1.9% | ||||||||
| 420,721 | Arcosa, Inc. | 24,591,142 | ||||||
| 77,249 | Dycom Industries, Inc.* | 8,661,158 | ||||||
| 231,013 | MasTec, Inc.* | 18,596,547 | ||||||
|
|
|
|||||||
| The accompanying notes are an integral part of these financial statements. | 41 |
GOLDMAN SACHS SMALL CAP VALUE FUND
Schedule of Investments (continued)
August 31, 2022
| Shares | Description | Value |
||||||
| Common Stocks – (continued) | ||||||||
| Construction & Engineering – (continued) | ||||||||
| 592,961 | Primoris Services Corp. | $ | 12,019,319 | |||||
|
|
|
|||||||
| 63,868,166 | ||||||||
|
|
|
|||||||
| Construction Materials – 0.5% | ||||||||
| 653,470 | Summit Materials, Inc., Class A* | 18,571,617 | ||||||
|
|
|
|||||||
| Consumer Finance – 0.5% | ||||||||
| 157,491 | FirstCash Holdings, Inc. | 12,277,998 | ||||||
| 360,882 | LendingClub Corp.* | 4,716,728 | ||||||
|
|
|
|||||||
| 16,994,726 | ||||||||
|
|
|
|||||||
| Diversified Consumer Services – 0.6% | ||||||||
| 499,171 | Adtalem Global Education, Inc.* | 18,813,755 | ||||||
|
|
|
|||||||
| Diversified Financial Services – 0.1% | ||||||||
| 122,517 | Alerus Financial Corp. | 2,911,004 | ||||||
|
|
|
|||||||
| Diversified Telecommunication Services – 0.4% | ||||||||
| 321,067 | Iridium Communications, Inc.* | 14,252,164 | ||||||
|
|
|
|||||||
| Electric Utilities – 2.4% | ||||||||
| 451,283 | ALLETE, Inc. | 26,706,928 | ||||||
| 251,898 | IDACORP, Inc. | 27,517,338 | ||||||
| 360,299 | MGE Energy, Inc. | 27,750,229 | ||||||
|
|
|
|||||||
| 81,974,495 | ||||||||
|
|
|
|||||||
| Electronic Equipment, Instruments & Components – 2.5% | ||||||||
| 278,515 | CTS Corp. | 11,786,755 | ||||||
| 391,345 | FARO Technologies, Inc.* | 13,129,625 | ||||||
| 297,579 | Itron, Inc.* | 14,158,809 | ||||||
| 806,458 | Knowles Corp.* | 12,217,839 | ||||||
| 357,164 | Sanmina Corp.* | 17,329,597 | ||||||
| 929,668 | TTM Technologies, Inc.* | 14,623,677 | ||||||
|
|
|
|||||||
| 83,246,302 | ||||||||
|
|
|
|||||||
| Energy Equipment & Services – 1.5% | ||||||||
| 591,792 | Helmerich & Payne, Inc. | 25,299,108 | ||||||
| 1,232,006 | NexTier Oilfield Solutions, Inc.* | 11,543,896 | ||||||
| 914,856 | Patterson-UTI Energy, Inc. | 13,631,355 | ||||||
|
|
|
|||||||
| 50,474,359 | ||||||||
|
|
|
|||||||
| Equity Real Estate Investment Trusts (REITs) – 9.2% | ||||||||
| 1,723,717 | Acadia Realty Trust REIT | 27,458,812 | ||||||
| 366,110 | Agree Realty Corp. REIT | 27,575,405 | ||||||
| 1,030,089 | Healthcare Realty Trust, Inc. REIT | 25,051,765 | ||||||
| 1,605,573 | Hudson Pacific Properties, Inc. REIT | 21,209,619 | ||||||
| 1,429,161 | Pebblebrook Hotel Trust REIT | 25,181,817 | ||||||
| 2,227,229 | Physicians Realty Trust REIT | 37,105,635 | ||||||
| 2,693,825 | RLJ Lodging Trust REIT | 32,487,530 | ||||||
| 372,370 | Ryman Hospitality Properties, Inc. REIT* | 30,616,261 | ||||||
| 1,666,701 | SITE Centers Corp. REIT | 21,600,445 | ||||||
| 929,158 | STAG Industrial, Inc. REIT | 28,618,066 | ||||||
| 549,333 | Terreno Realty Corp. REIT | 33,503,820 | ||||||
|
|
|
|||||||
| 310,409,175 | ||||||||
|
|
|
|||||||
| Common Stocks – (continued) | ||||||||
| Food & Staples Retailing – 1.0% | ||||||||
| 92,792 | BJ’s Wholesale Club Holdings, Inc.* | 6,912,076 | ||||||
| 293,402 | SpartanNash Co. | 8,928,223 | ||||||
| 421,102 | United Natural Foods, Inc.* | 18,562,176 | ||||||
|
|
|
|||||||
| 34,402,475 | ||||||||
|
|
|
|||||||
| Food Products – 1.6% | ||||||||
| 1,361,592 | Hostess Brands, Inc.* | 31,561,703 | ||||||
| 277,890 | Simply Good Foods Co. (The)* | 8,489,540 | ||||||
| 307,598 | Sovos Brands, Inc.* | 4,697,021 | ||||||
| 609,737 | Utz Brands, Inc. | 10,158,218 | ||||||
|
|
|
|||||||
| 54,906,482 | ||||||||
|
|
|
|||||||
| Gas Utilities – 1.6% | ||||||||
| 146,259 | Chesapeake Utilities Corp. | 18,472,512 | ||||||
| 365,473 | ONE Gas, Inc. | 28,605,572 | ||||||
| 111,630 | Southwest Gas Holdings, Inc. | 8,690,395 | ||||||
|
|
|
|||||||
| 55,768,479 | ||||||||
|
|
|
|||||||
| Health Care Equipment & Supplies – 2.1% | ||||||||
| 617,230 | Avanos Medical, Inc.* | 15,202,375 | ||||||
| 133,738 | CONMED Corp. | 11,845,175 | ||||||
| 345,630 | Enovis Corp.* | 17,506,159 | ||||||
| 237,740 | LivaNova PLC* | 13,372,875 | ||||||
| 340,704 | NuVasive, Inc.* | 14,483,327 | ||||||
|
|
|
|||||||
| 72,409,911 | ||||||||
|
|
|
|||||||
| Health Care Providers & Services – 1.0% | ||||||||
| 177,164 | Acadia Healthcare Co., Inc.* | 14,515,047 | ||||||
| 599,612 | Owens & Minor, Inc. | 17,694,550 | ||||||
|
|
|
|||||||
| 32,209,597 | ||||||||
|
|
|
|||||||
| Health Care Technology – 0.9% | ||||||||
| 1,145,305 | Allscripts Healthcare Solutions, Inc.* | 19,470,185 | ||||||
| 779,707 | Health Catalyst, Inc.* | 9,356,484 | ||||||
|
|
|
|||||||
| 28,826,669 | ||||||||
|
|
|
|||||||
| Hotels, Restaurants & Leisure – 2.4% | ||||||||
| 238,343 | Boyd Gaming Corp. | 12,973,009 | ||||||
| 904,670 | International Game Technology PLC | 16,229,780 | ||||||
| 578,660 | Krispy Kreme, Inc.(a) | 6,799,255 | ||||||
| 244,210 | Red Rock Resorts, Inc., Class A | 9,333,706 | ||||||
| 298,998 | SeaWorld Entertainment, Inc.* | 15,024,650 | ||||||
| 370,086 | Travel + Leisure Co. | 15,691,646 | ||||||
| 266,261 | Wendy’s Co. (The) | 5,106,886 | ||||||
|
|
|
|||||||
| 81,158,932 | ||||||||
|
|
|
|||||||
| Household Durables – 1.3% | ||||||||
| 248,077 | Century Communities, Inc. | 11,582,715 | ||||||
| 106,766 | Installed Building Products, Inc. | 9,668,729 | ||||||
| 302,156 | Meritage Homes Corp.* | 23,673,923 | ||||||
|
|
|
|||||||
| 44,925,367 | ||||||||
|
|
|
|||||||
| Independent Power and Renewable Electricity Producers – 0.5% | ||||||||
| 221,259 | NextEra Energy Partners LP | 18,163,151 | ||||||
|
|
|
|||||||
| 42 | The accompanying notes are an integral part of these financial statements. |
GOLDMAN SACHS SMALL CAP VALUE FUND
| Shares | Description | Value |
||||||
| Common Stocks – (continued) | ||||||||
| Insurance – 2.5% | ||||||||
| 163,566 | AMERISAFE, Inc. | $ | 7,821,726 | |||||
| 405,456 | CNO Financial Group, Inc. | 7,464,445 | ||||||
| 84,821 | Enstar Group Ltd.* | 16,052,374 | ||||||
| 97,977 | Hanover Insurance Group, Inc. (The) | 12,677,244 | ||||||
| 78,798 | RLI Corp. | 8,648,869 | ||||||
| 394,074 | Selective Insurance Group, Inc. | 31,297,357 | ||||||
|
|
|
|||||||
| 83,962,015 | ||||||||
|
|
|
|||||||
| Interactive Media & Services – 0.3% | ||||||||
| 471,804 | Bumble, Inc., Class A* | 11,818,690 | ||||||
|
|
|
|||||||
| IT Services – 0.4% | ||||||||
| 369,993 | Fastly, Inc., Class A* | 3,459,435 | ||||||
| 1,041,590 | Repay Holdings Corp.* | 9,676,371 | ||||||
|
|
|
|||||||
| 13,135,806 | ||||||||
|
|
|
|||||||
| Leisure Products – 0.5% | ||||||||
| 772,293 | Callaway Golf Co.* | 17,090,844 | ||||||
|
|
|
|||||||
| Life Sciences Tools & Services – 0.5% | ||||||||
| 1,284,660 | NeoGenomics, Inc.* | 12,910,833 | ||||||
| 917,596 | Pacific Biosciences of California, Inc.*(a) | 5,377,113 | ||||||
|
|
|
|||||||
| 18,287,946 | ||||||||
|
|
|
|||||||
| Machinery – 3.8% | ||||||||
| 359,684 | Astec Industries, Inc. | 13,732,735 | ||||||
| 520,683 | Columbus McKinnon Corp. | 15,948,520 | ||||||
| 226,558 | EnPro Industries, Inc. | 20,517,093 | ||||||
| 211,835 | ESCO Technologies, Inc. | 17,249,724 | ||||||
| 566,926 | Federal Signal Corp. | 22,603,340 | ||||||
| 271,149 | Kennametal, Inc. | 6,355,733 | ||||||
| 192,000 | SPX Technologies, Inc.* | 10,955,520 | ||||||
| 627,097 | Terex Corp. | 20,832,162 | ||||||
|
|
|
|||||||
| 128,194,827 | ||||||||
|
|
|
|||||||
| Media – 2.4% | ||||||||
| 1,479,648 | Entravision Communications Corp., Class A | 7,516,612 | ||||||
| 597,914 | Gray Television, Inc. | 11,420,157 | ||||||
| 423,645 | iHeartMedia, Inc., Class A* | 3,749,258 | ||||||
| 487,357 | John Wiley & Sons, Inc., Class A | 22,433,043 | ||||||
| 82,693 | Nexstar Media Group, Inc. | 15,820,825 | ||||||
| 957,148 | TEGNA, Inc. | 20,482,967 | ||||||
|
|
|
|||||||
| 81,422,862 | ||||||||
|
|
|
|||||||
| Metals & Mining – 1.9% | ||||||||
| 600,924 | ATI, Inc.* | 17,985,655 | ||||||
| 620,216 | Commercial Metals Co. | 25,124,950 | ||||||
| 1,068,865 | Constellium SE* | 14,237,282 | ||||||
| 1,816,418 | Hecla Mining Co. | 7,156,687 | ||||||
|
|
|
|||||||
| 64,504,574 | ||||||||
|
|
|
|||||||
| Mortgage Real Estate Investment Trusts (REITs) – 2.0% | ||||||||
| 966,556 | KKR Real Estate Finance Trust, Inc. REIT | 18,615,868 | ||||||
|
|
|
|||||||
| Common Stocks – (continued) | ||||||||
| Mortgage Real Estate Investment Trusts (REITs) – (continued) | ||||||||
| 1,731,522 | PennyMac Mortgage Investment Trust REIT | 25,713,102 | ||||||
| 1,246,520 | TPG RE Finance Trust, Inc. REIT | 11,542,775 | ||||||
| 2,753,294 | Two Harbors Investment Corp. REIT | 13,353,476 | ||||||
|
|
|
|||||||
| 69,225,221 | ||||||||
|
|
|
|||||||
| Multiline Retail – 0.2% | ||||||||
| 471,698 | Macy’s, Inc. | 8,169,809 | ||||||
|
|
|
|||||||
| Oil, Gas & Consumable Fuels – 3.6% | ||||||||
| 343,346 | Brigham Minerals, Inc., Class A | 10,214,544 | ||||||
| 513,459 | Callon Petroleum Co.* | 21,852,815 | ||||||
| 1,042,914 | Golar LNG Ltd. (Cameroon)* | 28,440,265 | ||||||
| 238,680 | Green Plains, Inc.* | 8,742,848 | ||||||
| 215,081 | PBF Energy, Inc., Class A* | 7,347,167 | ||||||
| 485,889 | Peabody Energy Corp.* | 11,982,023 | ||||||
| 679,341 | Permian Resources Corp., Class A* | 5,590,976 | ||||||
| 115,649 | Scorpio Tankers, Inc. (Monaco) | 4,810,998 | ||||||
| 354,806 | SM Energy Co. | 15,636,300 | ||||||
| 315,247 | World Fuel Services Corp. | 8,133,373 | ||||||
|
|
|
|||||||
| 122,751,309 | ||||||||
|
|
|
|||||||
| Personal Products – 0.3% | ||||||||
| 358,508 | BellRing Brands, Inc.* | 8,493,055 | ||||||
|
|
|
|||||||
| Professional Services – 2.8% | ||||||||
| 973,940 | Alight, Inc., Class A* | 7,674,647 | ||||||
| 211,840 | ASGN, Inc.* | 20,484,928 | ||||||
| 831,207 | First Advantage Corp.* | 11,503,905 | ||||||
| 192,352 | ICF International, Inc. | 19,535,269 | ||||||
| 565,591 | KBR, Inc. | 27,318,045 | ||||||
| 160,811 | Kforce, Inc. | 8,799,578 | ||||||
|
|
|
|||||||
| 95,316,372 | ||||||||
|
|
|
|||||||
| Real Estate Management & Development – 1.2% | ||||||||
| 935,458 | DigitalBridge Group, Inc.* | 16,651,153 | ||||||
| 1,288,556 | Kennedy-Wilson Holdings, Inc. | 22,627,043 | ||||||
|
|
|
|||||||
| 39,278,196 | ||||||||
|
|
|
|||||||
| Road & Rail – 0.7% | ||||||||
| 161,135 | ArcBest Corp. | 12,976,202 | ||||||
| 53,021 | Saia, Inc.* | 10,966,333 | ||||||
|
|
|
|||||||
| 23,942,535 | ||||||||
|
|
|
|||||||
| Semiconductors & Semiconductor Equipment – 1.5% | ||||||||
| 750,317 | Cohu, Inc.* | 20,131,005 | ||||||
| 322,167 | MACOM Technology Solutions Holdings, Inc.* | 17,767,510 | ||||||
| 159,146 | Onto Innovation, Inc.* | 11,297,775 | ||||||
|
|
|
|||||||
| 49,196,290 | ||||||||
|
|
|
|||||||
| Software – 2.1% | ||||||||
| 373,679 | Cerence, Inc.* | 7,477,317 | ||||||
| 378,150 | Domo, Inc., Class B* | 7,283,169 | ||||||
| 685,398 | JFrog Ltd. (Israel)* | 14,496,168 | ||||||
|
|
|
|||||||
| The accompanying notes are an integral part of these financial statements. | 43 |
GOLDMAN SACHS SMALL CAP VALUE FUND
Schedule of Investments (continued)
August 31, 2022
| Shares | Description | Value |
||||||
| Common Stocks – (continued) | ||||||||
| Software – (continued) | ||||||||
| 586,358 | LiveRamp Holdings, Inc.* | $ | 11,639,206 | |||||
| 206,487 | Smartsheet, Inc., Class A* | 6,869,822 | ||||||
| 324,210 | Tenable Holdings, Inc.* | 12,841,958 | ||||||
| 247,910 | Verint Systems, Inc.* | 12,021,156 | ||||||
|
|
|
|||||||
| 72,628,796 | ||||||||
|
|
|
|||||||
| Specialty Retail – 2.2% | ||||||||
| 617,743 | Academy Sports & Outdoors, Inc. | 26,612,368 | ||||||
| 412,718 | American Eagle Outfitters, Inc. | 4,647,205 | ||||||
| 87,634 | Asbury Automotive Group, Inc.* | 15,290,380 | ||||||
| 129,367 | Group 1 Automotive, Inc. | 23,103,653 | ||||||
| 56,548 | Signet Jewelers Ltd. | 3,696,543 | ||||||
|
|
|
|||||||
| 73,350,149 | ||||||||
|
|
|
|||||||
| Technology Hardware, Storage & Peripherals – 0.2% | ||||||||
| 371,807 | Xerox Holdings Corp. | 6,179,432 | ||||||
|
|
|
|||||||
| Textiles, Apparel & Luxury Goods – 1.1% | ||||||||
| 347,247 | Capri Holdings Ltd.* | 16,383,113 | ||||||
| 139,235 | Carter’s, Inc. | 10,282,505 | ||||||
| 37,240 | Deckers Outdoor Corp.* | 11,975,267 | ||||||
|
|
|
|||||||
| 38,640,885 | ||||||||
|
|
|
|||||||
| Thrifts & Mortgage Finance – 1.6% | ||||||||
| 1,793,946 | MGIC Investment Corp. | 25,635,488 | ||||||
| 666,926 | NMI Holdings, Inc., Class A* | 13,691,991 | ||||||
| 142,781 | Walker & Dunlop, Inc. | 14,343,779 | ||||||
|
|
|
|||||||
| 53,671,258 | ||||||||
|
|
|
|||||||
| Trading Companies & Distributors – 1.1% | ||||||||
| 313,814 | Beacon Roofing Supply, Inc.* | 17,231,527 | ||||||
| 59,872 | Herc Holdings, Inc. | 6,737,396 | ||||||
| 89,257 | WESCO International, Inc.* | 11,753,362 | ||||||
|
|
|
|||||||
| 35,722,285 | ||||||||
|
|
|
|||||||
| Water Utilities – 0.4% | ||||||||
| 186,514 | SJW Group | 11,992,850 | ||||||
|
|
|
|||||||
| Wireless Telecommunication Services – 0.3% | ||||||||
| 536,463 | Telephone and Data Systems, Inc. | 8,728,253 | ||||||
|
|
|
|||||||
| TOTAL COMMON STOCKS | ||||||||
| (Cost $2,951,660,917) | $ | 3,351,947,059 | ||||||
|
|
|
|||||||
| Shares | Dividend Rate |
Value | ||||||
| Investment Company – 0.7%(b) | ||||||||
| |
Goldman Sachs Financial Square Government Fund – |
| ||||||
| 22,581,860 | 2.154% | $ | 22,581,860 | |||||
| (Cost $22,581,860) | ||||||||
|
|
|
|||||||
| |
TOTAL INVESTMENTS BEFORE SECURITIES LENDING REINVESTMENT VEHICLE |
| ||||||
| (Cost $2,974,242,777) | $ | 3,374,528,919 | ||||||
|
|
|
|||||||
| Securities Lending Reinvestment Vehicle – 0.1%(b) | ||||||||
| |
Goldman Sachs Financial Square Government Fund – |
| ||||||
| 2,576,575 | 2.154% | $ | 2,576,575 | |||||
| (Cost $2,576,575) | ||||||||
|
|
|
|||||||
| TOTAL INVESTMENTS – 99.9% | ||||||||
| (Cost $2,976,819,352) | $ | 3,377,105,494 | ||||||
|
|
|
|||||||
| |
OTHER ASSETS IN EXCESS OF LIABILITIES – 0.1% |
6,281,919 | ||||||
|
|
|
|||||||
| NET ASSETS – 100.0% | $ | 3,383,387,413 | ||||||
|
|
|
|||||||
| The percentage shown for each investment category reflects the value of investments in that category as a percentage of net assets. | ||
| * |
Non-income producing security. | |
| (a) |
All or a portion of security is on loan. | |
| (b) |
Represents an affiliated issuer. | |
|
| ||||
| Investment Abbreviations: | ||||
| LP |
—Limited Partnership | |||
| PLC |
—Public Limited Company | |||
| REIT |
—Real Estate Investment Trust | |||
|
| ||||
| 44 | The accompanying notes are an integral part of these financial statements. |
GOLDMAN SACHS SMALL/MID CAP VALUE FUND
Schedule of Investments
August 31, 2022
| Shares | Description | Value |
||||||
| Common Stocks – 98.9% | ||||||||
| Aerospace & Defense – 2.2% | ||||||||
| 19,343 | AAR Corp.* | $ | 829,428 | |||||
| 5,084 | Curtiss-Wright Corp. | 748,314 | ||||||
| 20,970 | Maxar Technologies, Inc. | 499,715 | ||||||
| 9,318 | Mercury Systems, Inc.* | 448,475 | ||||||
| 9,336 | Textron, Inc. | 582,380 | ||||||
| 21,154 | Woodward, Inc. | 1,968,803 | ||||||
|
|
|
|||||||
| 5,077,115 | ||||||||
|
|
|
|||||||
| Airlines – 0.4% | ||||||||
| 36,504 | Spirit Airlines, Inc.* | 827,911 | ||||||
|
|
|
|||||||
| Auto Components – 1.2% | ||||||||
| 29,095 | Adient PLC* | 965,954 | ||||||
| 23,486 | Autoliv, Inc. (Sweden) | 1,826,976 | ||||||
|
|
|
|||||||
| 2,792,930 | ||||||||
|
|
|
|||||||
| Banks – 11.5% | ||||||||
| 76,063 | Associated Banc-Corp. | 1,524,303 | ||||||
| 13,767 | Cadence Bank | 350,783 | ||||||
| 15,589 | Columbia Banking System, Inc. | 466,891 | ||||||
| 33,345 | Commerce Bancshares, Inc. | 2,293,136 | ||||||
| 17,975 | Cullen/Frost Bankers, Inc. | 2,336,031 | ||||||
| 29,887 | East West Bancorp, Inc. | 2,156,945 | ||||||
| 29,065 | First Financial Bankshares, Inc. | 1,235,553 | ||||||
| 23,851 | Glacier Bancorp, Inc. | 1,208,769 | ||||||
| 43,041 | Hancock Whitney Corp. | 2,075,867 | ||||||
| 22,384 | Independent Bank Corp. | 1,751,100 | ||||||
| 24,946 | PacWest Bancorp | 656,828 | ||||||
| 23,633 | Pinnacle Financial Partners, Inc. | 1,907,419 | ||||||
| 29,115 | Prosperity Bancshares, Inc. | 2,063,671 | ||||||
| 7,421 | Signature Bank | 1,293,926 | ||||||
| 22,880 | SouthState Corp. | 1,785,555 | ||||||
| 48,177 | Washington Federal, Inc. | 1,542,146 | ||||||
| 22,345 | Wintrust Financial Corp. | 1,884,577 | ||||||
|
|
|
|||||||
| 26,533,500 | ||||||||
|
|
|
|||||||
| Beverages – 0.6% | ||||||||
| 105,688 | Primo Water Corp. | 1,388,740 | ||||||
|
|
|
|||||||
| Biotechnology – 1.8% | ||||||||
| 25,641 | Agios Pharmaceuticals, Inc.* | 653,846 | ||||||
| 23,167 | Alkermes PLC* | 548,363 | ||||||
| 8,946 | Apellis Pharmaceuticals, Inc.* | 541,323 | ||||||
| 14,964 | Exact Sciences Corp.* | 531,970 | ||||||
| 27,660 | Exelixis, Inc.* | 490,688 | ||||||
| 16,237 | Sage Therapeutics, Inc.* | 611,485 | ||||||
| 3,071 | United Therapeutics Corp.* | 695,950 | ||||||
|
|
|
|||||||
| 4,073,625 | ||||||||
|
|
|
|||||||
| Building Products – 0.7% | ||||||||
| 83,344 | Resideo Technologies, Inc.* | 1,735,222 | ||||||
|
|
|
|||||||
| Capital Markets – 2.9% | ||||||||
| 8,090 | Cboe Global Markets, Inc. | 954,377 | ||||||
| 9,560 | Evercore, Inc., Class A | 895,676 | ||||||
| 39,786 | Jefferies Financial Group, Inc. | 1,276,733 | ||||||
| 7,057 | LPL Financial Holdings, Inc. | 1,561,926 | ||||||
|
|
|
|||||||
| Common Stocks – (continued) | ||||||||
| Capital Markets – (continued) | ||||||||
| 17,886 | Stifel Financial Corp. | 1,060,819 | ||||||
| 32,425 | TPG, Inc. | 951,998 | ||||||
|
|
|
|||||||
| 6,701,529 | ||||||||
|
|
|
|||||||
| Chemicals – 2.8% | ||||||||
| 22,434 | Ashland, Inc. | 2,282,884 | ||||||
| 54,207 | Avient Corp. | 2,375,893 | ||||||
| 29,587 | Chemours Co. (The) | 997,969 | ||||||
| 36,798 | Element Solutions, Inc. | 687,019 | ||||||
|
|
|
|||||||
| 6,343,765 | ||||||||
|
|
|
|||||||
| Commercial Services & Supplies – 1.8% | ||||||||
| 20,696 | ABM Industries, Inc. | 960,294 | ||||||
| 66,659 | GFL Environmental, Inc. (Canada) | 1,873,118 | ||||||
| 8,966 | Tetra Tech, Inc. | 1,217,673 | ||||||
|
|
|
|||||||
| 4,051,085 | ||||||||
|
|
|
|||||||
| Communications Equipment – 2.2% | ||||||||
| 42,987 | Ciena Corp.* | 2,181,161 | ||||||
| 12,637 | F5, Inc.* | 1,984,767 | ||||||
| 70,413 | Viavi Solutions, Inc.* | 991,415 | ||||||
|
|
|
|||||||
| 5,157,343 | ||||||||
|
|
|
|||||||
| Construction & Engineering – 2.9% | ||||||||
| 44,193 | AECOM | 3,232,718 | ||||||
| 25,371 | MasTec, Inc.* | 2,042,366 | ||||||
| 9,614 | Quanta Services, Inc. | 1,358,458 | ||||||
|
|
|
|||||||
| 6,633,542 | ||||||||
|
|
|
|||||||
| Construction Materials – 0.3% | ||||||||
| 27,832 | Summit Materials, Inc., Class A* | 790,985 | ||||||
|
|
|
|||||||
| Consumer Finance – 0.5% | ||||||||
| 7,003 | FirstCash Holdings, Inc. | 545,954 | ||||||
| 17,081 | OneMain Holdings, Inc. | 596,639 | ||||||
|
|
|
|||||||
| 1,142,593 | ||||||||
|
|
|
|||||||
| Containers & Packaging – 0.8% | ||||||||
| 19,423 | Crown Holdings, Inc. | 1,759,530 | ||||||
|
|
|
|||||||
| Diversified Consumer Services – 0.6% | ||||||||
| 21,145 | Service Corp. International | 1,304,858 | ||||||
|
|
|
|||||||
| Diversified Financial Services – 0.5% | ||||||||
| 17,044 | Voya Financial, Inc. | 1,048,717 | ||||||
|
|
|
|||||||
| Electric Utilities – 2.8% | ||||||||
| 29,959 | ALLETE, Inc. | 1,772,974 | ||||||
| 34,848 | Alliant Energy Corp. | 2,127,122 | ||||||
| 22,559 | IDACORP, Inc. | 2,464,345 | ||||||
|
|
|
|||||||
| 6,364,441 | ||||||||
|
|
|
|||||||
| Electrical Equipment – 2.1% | ||||||||
| 11,901 | Hubbell, Inc. | 2,455,176 | ||||||
| 17,642 | Regal Rexnord Corp. | 2,427,363 | ||||||
|
|
|
|||||||
| 4,882,539 | ||||||||
|
|
|
|||||||
| The accompanying notes are an integral part of these financial statements. | 45 |
GOLDMAN SACHS SMALL/MID CAP VALUE FUND
Schedule of Investments (continued)
August 31, 2022
| Shares | Description | Value |
||||||
| Common Stocks – (continued) | ||||||||
| Electronic Equipment, Instruments & Components – 3.1% | ||||||||
| 115,317 | Flex Ltd.* | $ | 2,053,796 | |||||
| 7,414 | Littelfuse, Inc. | 1,758,749 | ||||||
| 81,212 | National Instruments Corp. | 3,228,989 | ||||||
|
|
|
|||||||
| 7,041,534 | ||||||||
|
|
|
|||||||
| Energy Equipment & Services – 0.5% | ||||||||
| 28,259 | Helmerich & Payne, Inc. | 1,208,072 | ||||||
|
|
|
|||||||
| Entertainment – 0.6% | ||||||||
| 21,118 | Liberty Media Corp.-Liberty Formula One, Class C* | 1,344,794 | ||||||
|
|
|
|||||||
| Equity Real Estate Investment Trusts (REITs) – 10.3% | ||||||||
| 74,742 | Americold Realty Trust, Inc. REIT | 2,198,910 | ||||||
| 20,240 | Camden Property Trust REIT | 2,601,042 | ||||||
| 62,412 | CubeSmart REIT | 2,874,073 | ||||||
| 25,584 | Equity LifeStyle Properties, Inc. REIT | 1,793,438 | ||||||
| 66,722 | Healthcare Realty Trust, Inc. REIT | 1,622,679 | ||||||
| 45,047 | Highwoods Properties, Inc. REIT | 1,369,879 | ||||||
| 90,304 | Hudson Pacific Properties, Inc. REIT | 1,192,916 | ||||||
| 125,764 | Park Hotels & Resorts, Inc. REIT | 1,760,696 | ||||||
| 45,718 | Regency Centers Corp. REIT | 2,781,483 | ||||||
| 105,768 | RLJ Lodging Trust REIT | 1,275,562 | ||||||
| 16,482 | Ryman Hospitality Properties, Inc. REIT* | 1,355,150 | ||||||
| 44,832 | Terreno Realty Corp. REIT | 2,734,304 | ||||||
|
|
|
|||||||
| 23,560,132 | ||||||||
|
|
|
|||||||
| Food & Staples Retailing – 1.9% | ||||||||
| 33,596 | Albertsons Cos., Inc., Class A | 924,226 | ||||||
| 10,476 | BJ’s Wholesale Club Holdings, Inc.* | 780,357 | ||||||
| 3,114 | Casey’s General Stores, Inc. | 665,680 | ||||||
| 25,316 | Performance Food Group Co.* | 1,265,293 | ||||||
| 17,660 | United Natural Foods, Inc.* | 778,453 | ||||||
|
|
|
|||||||
| 4,414,009 | ||||||||
|
|
|
|||||||
| Food Products – 1.7% | ||||||||
| 24,794 | Darling Ingredients, Inc.* | 1,885,832 | ||||||
| 69,953 | Hostess Brands, Inc.* | 1,621,511 | ||||||
| 17,086 | Simply Good Foods Co. (The)* | 521,977 | ||||||
|
|
|
|||||||
| 4,029,320 | ||||||||
|
|
|
|||||||
| Gas Utilities – 0.8% | ||||||||
| 23,835 | ONE Gas, Inc. | 1,865,565 | ||||||
|
|
|
|||||||
| Health Care Equipment & Supplies – 2.1% | ||||||||
| 12,224 | CONMED Corp. | 1,082,680 | ||||||
| 25,179 | Enovis Corp.* | 1,275,316 | ||||||
| 17,470 | LivaNova PLC* | 982,687 | ||||||
| 20,111 | QuidelOrtho Corp.* | 1,593,998 | ||||||
|
|
|
|||||||
| 4,934,681 | ||||||||
|
|
|
|||||||
| Health Care Providers & Services – 1.8% | ||||||||
| 24,819 | Acadia Healthcare Co., Inc.* | 2,033,421 | ||||||
| 38,603 | Tenet Healthcare Corp.* | 2,181,069 | ||||||
|
|
|
|||||||
| 4,214,490 | ||||||||
|
|
|
|||||||
| Common Stocks – (continued) | ||||||||
| Health Care Technology – 0.1% | ||||||||
| 9,694 | Teladoc Health, Inc.* | 301,096 | ||||||
|
|
|
|||||||
| Hotels, Restaurants & Leisure – 3.0% | ||||||||
| 52,271 | Aramark | 1,866,597 | ||||||
| 17,734 | Boyd Gaming Corp. | 965,262 | ||||||
| 14,181 | Marriott Vacations Worldwide Corp. | 2,019,658 | ||||||
| 24,369 | SeaWorld Entertainment, Inc.* | 1,224,542 | ||||||
| 19,724 | Travel + Leisure Co. | 836,298 | ||||||
|
|
|
|||||||
| 6,912,357 | ||||||||
|
|
|
|||||||
| Household Durables – 1.0% | ||||||||
| 12,521 | Meritage Homes Corp.* | 981,020 | ||||||
| 17,207 | PulteGroup, Inc. | 699,637 | ||||||
| 3,048 | TopBuild Corp.* | 560,100 | ||||||
|
|
|
|||||||
| 2,240,757 | ||||||||
|
|
|
|||||||
| Independent Power and Renewable Electricity Producers – 0.6% | ||||||||
| 18,359 | NextEra Energy Partners LP | 1,507,090 | ||||||
|
|
|
|||||||
| Insurance – 4.5% | ||||||||
| 16,299 | American Financial Group, Inc. | 2,081,056 | ||||||
| 8,204 | Brown & Brown, Inc. | 517,180 | ||||||
| 12,265 | CNO Financial Group, Inc. | 225,798 | ||||||
| 26,346 | Globe Life, Inc. | 2,560,568 | ||||||
| 9,774 | Hanover Insurance Group, Inc. (The) | 1,264,658 | ||||||
| 15,366 | Ryan Specialty Holdings, Inc.* | 650,904 | ||||||
| 23,769 | Selective Insurance Group, Inc. | 1,887,734 | ||||||
| 16,230 | W R Berkley Corp. | 1,051,704 | ||||||
|
|
|
|||||||
| 10,239,602 | ||||||||
|
|
|
|||||||
| Interactive Media & Services – 0.4% | ||||||||
| 13,498 | IAC, Inc.* | 867,516 | ||||||
|
|
|
|||||||
| Leisure Products – 1.0% | ||||||||
| 8,229 | Brunswick Corp. | 614,789 | ||||||
| 32,527 | Callaway Golf Co.* | 719,822 | ||||||
| 47,227 | Mattel, Inc.* | 1,044,661 | ||||||
|
|
|
|||||||
| 2,379,272 | ||||||||
|
|
|
|||||||
| Life Sciences Tools & Services – 1.2% | ||||||||
| 36,258 | QIAGEN NV* | 1,647,201 | ||||||
| 19,500 | Syneos Health, Inc.* | 1,172,145 | ||||||
|
|
|
|||||||
| 2,819,346 | ||||||||
|
|
|
|||||||
| Machinery – 2.8% | ||||||||
| 33,702 | Altra Industrial Motion Corp. | 1,278,991 | ||||||
| 8,211 | Chart Industries, Inc.* | 1,591,784 | ||||||
| 28,950 | ITT, Inc. | 2,099,744 | ||||||
| 17,849 | Oshkosh Corp. | 1,423,636 | ||||||
|
|
|
|||||||
| 6,394,155 | ||||||||
|
|
|
|||||||
| Media – 1.9% | ||||||||
| 32,732 | Gray Television, Inc. | 625,181 | ||||||
| 22,688 | Liberty Media Corp.-Liberty SiriusXM, Class C* | 938,376 | ||||||
| 10,872 | Nexstar Media Group, Inc. | 2,080,031 | ||||||
|
|
|
|||||||
| 46 | The accompanying notes are an integral part of these financial statements. |
GOLDMAN SACHS SMALL/MID CAP VALUE FUND
| Shares | Description | Value |
||||||
| Common Stocks – (continued) | ||||||||
| Media – (continued) | ||||||||
| 30,848 | TEGNA, Inc. | $ | 660,147 | |||||
|
|
|
|||||||
| 4,303,735 | ||||||||
|
|
|
|||||||
| Metals & Mining – 2.0% | ||||||||
| 34,416 | ATI, Inc.* | 1,030,071 | ||||||
| 45,739 | Cleveland-Cliffs, Inc.* | 789,913 | ||||||
| 45,573 | Commercial Metals Co. | 1,846,162 | ||||||
| 10,286 | Royal Gold, Inc. | 945,283 | ||||||
|
|
|
|||||||
| 4,611,429 | ||||||||
|
|
|
|||||||
| Mortgage Real Estate Investment Trusts (REITs) – 1.3% | ||||||||
| 98,742 | Apollo Commercial Real Estate Finance, Inc. REIT | 1,150,344 | ||||||
| 72,522 | PennyMac Mortgage Investment Trust REIT | 1,076,952 | ||||||
| 176,818 | Two Harbors Investment Corp. REIT | 857,567 | ||||||
|
|
|
|||||||
| 3,084,863 | ||||||||
|
|
|
|||||||
| Multiline Retail – 0.3% | ||||||||
| 38,336 | Macy’s, Inc. | 663,980 | ||||||
|
|
|
|||||||
| Oil, Gas & Consumable Fuels – 4.1% | ||||||||
| 22,968 | EQT Corp. | 1,097,870 | ||||||
| 22,028 | HF Sinclair Corp. | 1,159,334 | ||||||
| 40,555 | Ovintiv, Inc. | 2,155,093 | ||||||
| 62,295 | Range Resources Corp.* | 2,047,014 | ||||||
| 21,232 | SM Energy Co. | 935,694 | ||||||
| 28,959 | Targa Resources Corp. | 1,975,872 | ||||||
|
|
|
|||||||
| 9,370,877 | ||||||||
|
|
|
|||||||
| Pharmaceuticals – 0.4% | ||||||||
| 6,221 | Jazz Pharmaceuticals PLC* | 965,624 | ||||||
|
|
|
|||||||
| Professional Services – 2.5% | ||||||||
| 20,359 | ASGN, Inc.* | 1,968,715 | ||||||
| 31,226 | Clarivate PLC* | 364,408 | ||||||
| 69,748 | KBR, Inc. | 3,368,828 | ||||||
|
|
|
|||||||
| 5,701,951 | ||||||||
|
|
|
|||||||
| Real Estate Management & Development – 1.0% | ||||||||
| 68,773 | DigitalBridge Group, Inc.* | 1,224,160 | ||||||
| 63,645 | Kennedy-Wilson Holdings, Inc. | 1,117,606 | ||||||
|
|
|
|||||||
| 2,341,766 | ||||||||
|
|
|
|||||||
| Road & Rail – 1.0% | ||||||||
| 9,480 | ArcBest Corp. | 763,424 | ||||||
| 994 | Avis Budget Group, Inc.* | 166,376 | ||||||
| 6,468 | Saia, Inc.* | 1,337,777 | ||||||
|
|
|
|||||||
| 2,267,577 | ||||||||
|
|
|
|||||||
| Semiconductors & Semiconductor Equipment – 1.8% | ||||||||
| 17,332 | MKS Instruments, Inc. | 1,726,441 | ||||||
| 7,771 | Silicon Laboratories, Inc.* | 973,939 | ||||||
| 11,783 | Wolfspeed, Inc.* | 1,337,017 | ||||||
|
|
|
|||||||
| 4,037,397 | ||||||||
|
|
|
|||||||
| Common Stocks – (continued) | ||||||||
| Software – 2.0% | ||||||||
| 6,635 | Bill.com Holdings, Inc.* | 1,074,074 | ||||||
| 18,513 | Dynatrace, Inc.* | 706,826 | ||||||
| 3,665 | Paylocity Holding Corp.* | 883,265 | ||||||
| 17,199 | Smartsheet, Inc., Class A* | 572,211 | ||||||
| 23,159 | Tenable Holdings, Inc.* | 917,328 | ||||||
| 23,849 | UiPath, Inc., Class A* | 392,316 | ||||||
|
|
|
|||||||
| 4,546,020 | ||||||||
|
|
|
|||||||
| Specialty Retail – 2.0% | ||||||||
| 35,534 | Academy Sports & Outdoors, Inc. | 1,530,805 | ||||||
| 11,630 | AutoNation, Inc.* | 1,449,098 | ||||||
| 5,711 | Group 1 Automotive, Inc. | 1,019,927 | ||||||
| 36,162 | Petco Health & Wellness Co., Inc.*(a) | 539,537 | ||||||
|
|
|
|||||||
| 4,539,367 | ||||||||
|
|
|
|||||||
| Textiles, Apparel & Luxury Goods – 1.8% | ||||||||
| 25,871 | Capri Holdings Ltd.* | 1,220,594 | ||||||
| 4,168 | Deckers Outdoor Corp.* | 1,340,304 | ||||||
| 45,861 | Tapestry, Inc. | 1,592,752 | ||||||
|
|
|
|||||||
| 4,153,650 | ||||||||
|
|
|
|||||||
| Thrifts & Mortgage Finance – 0.8% | ||||||||
| 95,563 | MGIC Investment Corp. | 1,365,595 | ||||||
| 22,454 | NMI Holdings, Inc., Class A* | 460,981 | ||||||
|
|
|
|||||||
| 1,826,576 | ||||||||
|
|
|
|||||||
| TOTAL COMMON STOCKS | ||||||||
| (Cost $219,034,721) | $ | 227,298,570 | ||||||
|
|
|
|||||||
| Shares | Dividend Rate |
Value | ||||||
| Investment Company – 0.6%(b) | ||||||||
| |
Goldman Sachs Financial Square Government Fund – |
| ||||||
| 1,414,538 | 2.154% | $ | 1,414,538 | |||||
| (Cost $1,414,538) | ||||||||
|
|
|
|||||||
| |
TOTAL INVESTMENTS BEFORE SECURITIES LENDING REINVESTMENT VEHICLE |
| ||||||
| (Cost $220,449,259) | $ | 228,713,108 | ||||||
|
|
|
|||||||
| Securities Lending Reinvestment Vehicle – 0.2%(b) | ||||||||
| |
Goldman Sachs Financial Square Government Fund – |
| ||||||
| 489,327 | 2.154% | $ | 489,327 | |||||
| (Cost $489,327) | ||||||||
|
|
|
|||||||
| TOTAL INVESTMENTS – 99.7% | ||||||||
| (Cost $220,938,586) | $ | 229,202,435 | ||||||
|
|
|
|||||||
| |
OTHER ASSETS IN EXCESS OF LIABILITIES – 0.3% |
508,791 | ||||||
|
|
|
|||||||
| NET ASSETS – 100.0% | $ | 229,711,226 | ||||||
|
|
|
|||||||
| The accompanying notes are an integral part of these financial statements. | 47 |
GOLDMAN SACHS SMALL/MID CAP VALUE FUND
Schedule of Investments (continued)
August 31, 2022
| The percentage shown for each investment category reflects the value of investments in that category as a percentage of net assets. | ||
| * |
Non-income producing security. | |
| (a) |
All or a portion of security is on loan. | |
| (b) |
Represents an affiliated issuer. | |
|
| ||||
| Investment Abbreviations: | ||||
| LP |
—Limited Partnership | |||
| PLC |
—Public Limited Company | |||
| REIT |
—Real Estate Investment Trust | |||
|
| ||||
| 48 | The accompanying notes are an integral part of these financial statements. |
GOLDMAN SACHS FUNDAMENTAL EQUITY VALUE FUNDS
Statements of Assets and Liabilities
August 31, 2022
| Equity Income Fund |
Focused Value Fund |
Large Cap Value Fund |
||||||||||||
| Assets: | ||||||||||||||
| Investments in unaffiliated issuers, at value (cost $335,385,362, $43,018,978 and $397,026,205, respectively)(a) |
$ | 396,699,369 | $ | 41,819,178 | $ | 445,064,929 | ||||||||
| Investments in affiliated issuers, at value (cost $8,778,605, $922,973 and $4,276,030, respectively) |
8,778,605 | 922,973 | 4,276,030 | |||||||||||
| Investments in affiliated securities lending reinvestment vehicle, at value which equals cost |
2,353,075 | — | — | |||||||||||
| Cash |
622,459 | 54,907 | 625,055 | |||||||||||
| Receivables: |
||||||||||||||
| Dividends |
1,045,237 | 40,731 | 802,728 | |||||||||||
| Reimbursement from investment adviser |
64,045 | 22,152 | 52,296 | |||||||||||
| Fund shares sold |
57,133 | 191,730 | 99,360 | |||||||||||
| Foreign tax reclaims |
47,134 | 240 | 53,159 | |||||||||||
| Securities lending income |
848 | — | 155 | |||||||||||
| Other assets |
44,352 | 54,316 | 28,912 | |||||||||||
| Total assets | 409,712,257 | 43,106,227 | 451,002,624 | |||||||||||
| Liabilities: | ||||||||||||||
| Payables: |
||||||||||||||
| Payable upon return of securities loaned |
2,353,075 | — | — | |||||||||||
| Fund shares redeemed |
798,032 | — | 171,124 | |||||||||||
| Management fees |
246,216 | 25,300 | 273,214 | |||||||||||
| Distribution and Service fees and Transfer Agency fees |
169,076 | 1,780 | 69,435 | |||||||||||
| Accrued expenses |
198,777 | 100,614 | 183,925 | |||||||||||
| Total liabilities | 3,765,176 | 127,694 | 697,698 | |||||||||||
| Net Assets: | ||||||||||||||
| Paid-in capital |
329,376,129 | 40,842,153 | 367,048,855 | |||||||||||
| Total distributable earnings |
76,570,952 | 2,136,380 | 83,256,071 | |||||||||||
| NET ASSETS | $ | 405,947,081 | $ | 42,978,533 | $ | 450,304,926 | ||||||||
| Net Assets: |
||||||||||||||
| Class A |
$ | 300,621,209 | $ | 311,967 | $ | 77,258,945 | ||||||||
| Class C |
4,651,488 | 325,838 | 10,176,190 | |||||||||||
| Institutional |
31,702,130 | 2,167,217 | 155,699,603 | |||||||||||
| Service |
90,115 | — | 835,466 | |||||||||||
| Investor |
4,394,081 | 12,481 | 3,317,984 | |||||||||||
| Class R6 |
6,581,565 | 12,496 | 2,245,010 | |||||||||||
| Class R |
629,766 | 40,592 | 3,436,716 | |||||||||||
| Class P |
57,276,727 | 40,107,942 | 197,335,012 | |||||||||||
| Total Net Assets |
$ | 405,947,081 | $ | 42,978,533 | $ | 450,304,926 | ||||||||
| Shares outstanding $0.001 par value (unlimited number of shares authorized): |
||||||||||||||
| Class A |
7,175,738 | 23,867 | 5,138,725 | |||||||||||
| Class C |
117,390 | 25,361 | 724,983 | |||||||||||
| Institutional |
741,424 | 164,969 | 10,212,716 | |||||||||||
| Service |
2,141 | — | 55,826 | |||||||||||
| Investor |
105,080 | 953 | 220,463 | |||||||||||
| Class R6 |
153,908 | 953 | 143,123 | |||||||||||
| Class R |
15,131 | 3,127 | 237,467 | |||||||||||
| Class P |
1,339,814 | 3,059,917 | 12,582,125 | |||||||||||
| Net asset value, offering and redemption price per share:(b) |
||||||||||||||
| Class A |
$41.89 | $13.07 | $15.03 | |||||||||||
| Class C |
39.62 | 12.85 | 14.04 | |||||||||||
| Institutional |
42.76 | 13.14 | 15.25 | |||||||||||
| Service |
42.08 | — | 14.97 | |||||||||||
| Investor |
41.82 | 13.09 | 15.05 | |||||||||||
| Class R6 |
42.76 | 13.11 | 15.69 | |||||||||||
| Class R |
41.62 | 12.98 | 14.47 | |||||||||||
| Class P |
42.75 | 13.11 | 15.68 | |||||||||||
| (a) | Includes loaned securities having a market value of $2,171,387 for Equity Income Fund. |
| (b) | Maximum public offering price per share for Class A Shares of the Equity Income, Focused Value and Large Cap Value Funds is $44.33, $13.83 and $15.90, respectively. At redemption, Class C Shares may be subject to a contingent deferred sales charge, assessed on the amount equal to the lesser of the current net asset value (“NAV”) or the original purchase price of the shares. |
| The accompanying notes are an integral part of these financial statements. | 49 |
GOLDMAN SACHS FUNDAMENTAL EQUITY VALUE FUNDS
Statements of Assets and Liabilities (continued)
August 31, 2022
| Mid Cap Value Fund |
Small Cap Value Fund |
Small/Mid Cap Value Fund |
||||||||||||
| Assets: | ||||||||||||||
| Investments in unaffiliated issuers, at value (cost $1,005,276,677, $2,951,660,917, and $219,034,721, respectively)(a) |
$ | 1,126,357,952 | $ | 3,351,947,059 | $ | 227,298,570 | ||||||||
| Investments in affiliated issuers, at value (cost $22,288,207, $22,581,860 and $1,414,538, respectively) |
22,288,207 | 22,581,860 | 1,414,538 | |||||||||||
| Investments in affiliated securities lending reinvestment vehicle, at value which equals cost |
— | 2,576,575 | 489,327 | |||||||||||
| Cash |
847,055 | — | 544,468 | |||||||||||
| Receivables: |
||||||||||||||
| Dividends |
1,184,178 | 2,991,135 | 202,105 | |||||||||||
| Fund shares sold |
447,738 | 1,275,243 | 331,063 | |||||||||||
| Securities lending income |
903 | 2,072 | 285 | |||||||||||
| Investments sold |
— | 16,854,004 | 456,354 | |||||||||||
| Foreign tax reclaims |
— | 208,183 | 4,469 | |||||||||||
| Reimbursement from investment adviser |
— | 119,212 | 16,335 | |||||||||||
| Due from custodian |
— | 16,743,296 | — | |||||||||||
| Other assets |
69,229 | 91,800 | 28,244 | |||||||||||
| Total assets | 1,151,195,262 | 3,415,390,439 | 230,785,758 | |||||||||||
| Liabilities: | ||||||||||||||
| Payables: |
||||||||||||||
| Fund shares redeemed |
945,010 | 2,051,798 | 283,396 | |||||||||||
| Management fees |
760,964 | 2,897,089 | 162,549 | |||||||||||
| Distribution and Service fees and Transfer Agency fees |
337,534 | 337,562 | 10,669 | |||||||||||
| Investments purchased |
— | 7,712,187 | — | |||||||||||
| Payable upon return of securities loaned |
— | 2,576,575 | 489,327 | |||||||||||
| Cash overdraft |
— | 15,618,867 | — | |||||||||||
| Accrued expenses |
380,415 | 808,948 | 128,591 | |||||||||||
| Total liabilities | 2,423,923 | 32,003,026 | 1,074,532 | |||||||||||
| Net Assets: | ||||||||||||||
| Paid-in capital |
905,193,465 | 2,627,750,938 | 214,519,527 | |||||||||||
| Total distributable earnings |
243,577,874 | 755,636,475 | 15,191,699 | |||||||||||
| NET ASSETS | $ | 1,148,771,339 | $ | 3,383,387,413 | $ | 229,711,226 | ||||||||
| Net Assets: |
||||||||||||||
| Class A |
$ | 458,090,199 | $ | 333,814,426 | $ | 2,230,950 | ||||||||
| Class C |
9,336,560 | 1,788,084 | 997,422 | |||||||||||
| Institutional |
298,877,489 | 1,446,222,420 | 23,900,200 | |||||||||||
| Service |
34,532,692 | 17,138,391 | — | |||||||||||
| Investor |
68,948,327 | 131,529,804 | 11,177,541 | |||||||||||
| Class R6 |
83,399,851 | 1,145,840,206 | 93,903,827 | |||||||||||
| Class R |
18,759,584 | 41,857,080 | 105,338 | |||||||||||
| Class P |
176,826,637 | 265,197,002 | 97,395,948 | |||||||||||
| Total Net Assets |
$ | 1,148,771,339 | $ | 3,383,387,413 | $ | 229,711,226 | ||||||||
| Shares outstanding $0.001 par value (unlimited number of shares authorized): |
||||||||||||||
| Class A |
12,613,927 | 7,509,073 | 150,129 | |||||||||||
| Class C |
308,495 | 64,149 | 69,941 | |||||||||||
| Institutional |
8,094,234 | 29,031,520 | 1,582,079 | |||||||||||
| Service |
977,679 | 404,583 | — | |||||||||||
| Investor |
1,955,594 | 2,990,218 | 745,089 | |||||||||||
| Class R6 |
2,260,387 | 23,016,531 | 6,223,503 | |||||||||||
| Class R |
539,750 | 977,606 | 7,110 | |||||||||||
| Class P |
4,793,674 | 5,326,742 | 6,455,789 | |||||||||||
| Net asset value, offering and redemption price per share:(b) |
||||||||||||||
| Class A |
$36.32 | $44.45 | $14.86 | |||||||||||
| Class C |
30.26 | 27.87 | 14.26 | |||||||||||
| Institutional |
36.92 | 49.82 | 15.11 | |||||||||||
| Service |
35.32 | 42.36 | — | |||||||||||
| Investor |
35.26 | 43.99 | 15.00 | |||||||||||
| Class R6 |
36.90 | 49.78 | 15.09 | |||||||||||
| Class R |
34.76 | 42.82 | 14.82 | |||||||||||
| Class P |
36.89 | 49.79 | 15.09 | |||||||||||
| (a) | Includes loaned securities having a market value of $–, $2,564,302 and $478,738 for Small Cap Value Fund and Small/Mid Cap Value Fund, respectively. |
| (b) | Maximum public offering price per share for Class A Shares of the Mid Cap Value, Small Cap Value and Small/Mid Cap Value Funds is $38.43, $47.04 and $15.72, respectively. At redemption, Class C Shares may be subject to a contingent deferred sales charge, assessed on the amount equal to the lesser of the current net asset value (“NAV”) or the original purchase price of the shares. |
| 50 | The accompanying notes are an integral part of these financial statements. |
GOLDMAN SACHS FUNDAMENTAL EQUITY VALUE FUNDS
Statements of Operations
For the Fiscal Year Ended August 31, 2022
| Equity Income Fund |
Focused Value Fund |
Large Cap Value Fund |
||||||||||||
| Investment income: | ||||||||||||||
| Dividends — unaffiliated issuers (net of foreign withholding taxes of $11,085, $— and $4,483, respectively) |
$ | 11,032,560 | $ | 709,059 | $ | 9,529,342 | ||||||||
| Dividends — affiliated issuers |
40,754 | 3,268 | 24,627 | |||||||||||
| Securities lending income — unaffiliated issuer |
20,049 | — | 873 | |||||||||||
| Total investment income | 11,093,363 | 712,327 | 9,554,842 | |||||||||||
| Expenses: |
| |||||||||||||
| Management fees |
2,909,582 | 278,649 | 3,626,323 | |||||||||||
| Distribution and Service (12b-1) fees(a) |
853,171 | 2,155 | 315,810 | |||||||||||
| Transfer Agency fees(a) |
562,832 | 12,996 | 295,976 | |||||||||||
| Registration fees |
103,605 | 99,139 | 87,847 | |||||||||||
| Professional fees |
82,858 | 81,724 | 87,005 | |||||||||||
| Printing and mailing costs |
69,736 | 25,610 | 54,196 | |||||||||||
| Custody, accounting and administrative services |
41,677 | 14,261 | 45,622 | |||||||||||
| Trustee fees |
24,274 | 23,591 | 24,375 | |||||||||||
| Service fees — Class C |
12,548 | 411 | 28,573 | |||||||||||
| Shareholder Administration fees — Service Shares |
249 | — | 2,195 | |||||||||||
| Other |
8,802 | 2,932 | 9,412 | |||||||||||
| Total expenses | 4,669,334 | 541,468 | 4,577,334 | |||||||||||
| Less — expense reductions |
(519,052 | ) | (246,683 | ) | (646,668 | ) | ||||||||
| Net expenses | 4,150,282 | 294,785 | 3,930,666 | |||||||||||
| NET INVESTMENT INCOME | 6,943,081 | 417,542 | 5,624,176 | |||||||||||
| Realized and unrealized gain (loss): | ||||||||||||||
| Net realized gain (loss) from: |
||||||||||||||
| Investments — unaffiliated issuers |
14,818,153 | 3,648,935 | 44,259,805 | |||||||||||
| Foreign currency transactions |
— | — | 70 | |||||||||||
| Net change in unrealized gain (loss) on: |
||||||||||||||
| Investments — unaffiliated issuers |
(37,073,296 | ) | (6,565,141 | ) | (73,127,792 | ) | ||||||||
| Foreign currency translations |
— | — | (179 | ) | ||||||||||
| Net realized and unrealized loss | (22,255,143 | ) | (2,916,206 | ) | (28,868,096 | ) | ||||||||
| NET DECREASE IN NET ASSETS RESULTING FROM OPERATIONS | $ | (15,312,062 | ) | $ | (2,498,664 | ) | $ | (23,243,920 | ) | |||||
| (a) | Class specific Distribution and/or Service and Transfer Agency fees were as follows: |
| Distribution and/or Service (12b-1) Fees | Transfer Agency Fees | |||||||||||||||||||||||||||||||||||||||||||||||
| Fund |
Class A |
Class C |
Service |
Class R |
Class A |
Class C |
Institutional |
Service |
Investor |
Class R6 |
Class R |
Class P |
||||||||||||||||||||||||||||||||||||
| Equity Income Fund |
$ | 808,660 | $ | 37,645 | $ | 249 | $ | 6,618 | $ | 517,548 | $ | 8,031 | $ | 13,061 | $ | 40 | $ | 5,291 | $ | 2,023 | $ | 2,118 | $ | 14,720 | ||||||||||||||||||||||||
| Focused Value Fund |
708 | 1,232 | — | 215 | 453 | 263 | 903 | — | 21 | 4 | 69 | 11,283 | ||||||||||||||||||||||||||||||||||||
| Large Cap Value Fund |
211,231 | 85,718 | 2,195 | 16,666 | 135,190 | 18,287 | 68,794 | 351 | 5,667 | 613 | 5,333 | 61,741 | ||||||||||||||||||||||||||||||||||||
| The accompanying notes are an integral part of these financial statements. | 51 |
GOLDMAN SACHS FUNDAMENTAL EQUITY VALUE FUNDS
Statements of Operations (continued)
For the Fiscal Year Ended August 31, 2022
| Mid Cap Value Fund |
Small Cap Value Fund |
Small/Mid Cap Value Fund |
||||||||||||
| Investment income: | ||||||||||||||
| Dividends — unaffiliated issuers (net of foreign withholding taxes of $(330), $83,129 and $4,951, respectively) |
$ | 18,621,584 | $ | 62,148,297 | $ | 3,641,561 | ||||||||
| Dividends — affiliated issuers |
88,041 | 233,202 | 17,848 | |||||||||||
| Securities lending income — unaffiliated issuer |
6,183 | 196,385 | 2,665 | |||||||||||
| Total investment income | 18,715,808 | 62,577,884 | 3,662,074 | |||||||||||
| Expenses: |
| |||||||||||||
| Management fees |
9,129,474 | 38,955,472 | 1,915,951 | |||||||||||
| Distribution and Service (12b-1) fees(a) |
1,541,318 | 1,365,901 | 15,591 | |||||||||||
| Transfer Agency fees(a) |
1,166,195 | 2,261,410 | 96,324 | |||||||||||
| Printing and mailing costs |
154,449 | 180,512 | 27,777 | |||||||||||
| Registration fees |
144,372 | 203,778 | 96,231 | |||||||||||
| Custody, accounting and administrative services |
111,704 | 408,435 | 55,564 | |||||||||||
| Shareholder Administration fees — Service Shares |
91,656 | 56,034 | — | |||||||||||
| Professional fees |
88,645 | 83,907 | 82,067 | |||||||||||
| Service fees — Class C |
27,179 | 4,578 | 3,207 | |||||||||||
| Trustee fees |
25,654 | 30,296 | 23,949 | |||||||||||
| Other |
26,552 | 83,313 | 16,328 | |||||||||||
| Total expenses | 12,507,198 | 43,633,636 | 2,332,989 | |||||||||||
| Less — expense reductions |
(61,408 | ) | (1,188,748 | ) | (298,248 | ) | ||||||||
| Net expenses | 12,445,790 | 42,444,888 | 2,034,741 | |||||||||||
| NET INVESTMENT INCOME | 6,270,018 | 20,132,996 | 1,627,333 | |||||||||||
| Realized and unrealized gain (loss): | ||||||||||||||
| Net realized gain (loss) from: |
||||||||||||||
| Investments — unaffiliated issuers |
158,509,493 | 569,564,753 | 11,009,736 | |||||||||||
| Net change in unrealized gain (loss) on: |
||||||||||||||
| Investments — unaffiliated issuers |
(216,479,555 | ) | (920,760,237 | ) | (36,629,393 | ) | ||||||||
| Net realized and unrealized loss | (57,970,062 | ) | (351,195,484 | ) | (25,619,657 | ) | ||||||||
| NET DECREASE IN NET ASSETS RESULTING FROM OPERATIONS | $ | (51,700,044 | ) | $ | (331,062,488 | ) | $ | (23,992,324 | ) | |||||
| (a) | Class specific Distribution and/or Service and Transfer Agency fees were as follows: |
| Distribution and/or Service (12b-1) Fees | Transfer Agency Fees | |||||||||||||||||||||||||||||||||||||||||||||||
| Fund |
Class A |
Class C |
Service |
Class R |
Class A |
Class C |
Institutional |
Service |
Investor |
Class R6 |
Class R |
Class P |
||||||||||||||||||||||||||||||||||||
| Mid Cap Value Fund |
$ | 1,265,989 | $ | 81,539 | $ | 91,656 | $ | 102,134 | $ | 810,242 | $ | 17,395 | $ | 128,851 | $ | 14,665 | $ | 81,385 | $ | 24,682 | $ | 32,683 | $ | 56,292 | ||||||||||||||||||||||||
| Small Cap Value Fund |
1,031,056 | 13,734 | 56,034 | 265,077 | 659,883 | 2,930 | 755,773 | 8,966 | 249,715 | 403,067 | 84,826 | 96,250 | ||||||||||||||||||||||||||||||||||||
| Small/Mid Cap Value Fund |
5,450 | 9,622 | — | 519 | 3,488 | 2,053 | 8,732 | — | 21,732 | 29,553 | 166 | 30,600 | ||||||||||||||||||||||||||||||||||||
| 52 | The accompanying notes are an integral part of these financial statements. |
GOLDMAN SACHS FUNDAMENTAL EQUITY VALUE FUNDS
Statements of Changes in Net Assets
| Equity Income Fund | Focused Value Fund | |||||||||||||||||||||
| For the Fiscal Year Ended August 31, 2022 |
For the Fiscal Year Ended August 31, 2021 |
For the Fiscal Year Ended August 31, 2022 |
For the Fiscal Year Ended August 31, 2021 |
|||||||||||||||||||
| From operations: | ||||||||||||||||||||||
| Net investment income |
$ | 6,943,081 | $ | 5,592,651 | $ | 417,542 | $ | 200,809 | ||||||||||||||
| Net realized gain |
14,818,153 | 40,146,256 | 3,648,935 | 1,991,236 | ||||||||||||||||||
| Net change in unrealized gain (loss) |
(37,073,296 | ) | 44,279,659 | (6,565,141 | ) | 4,369,954 | ||||||||||||||||
| Net increase (decrease) in net assets resulting from operations | (15,312,062 | ) | 90,018,566 | (2,498,664 | ) | 6,561,999 | ||||||||||||||||
| Distributions to shareholders: | ||||||||||||||||||||||
| From distributable earnings: |
||||||||||||||||||||||
| Class A Shares |
(26,486,951 | ) | (4,116,697 | ) | (17,568 | ) | (2,864 | ) | ||||||||||||||
| Class C Shares |
(390,823 | ) | (34,681 | ) | (2,875 | ) | (390 | ) | ||||||||||||||
| Institutional Shares |
(2,720,942 | ) | (456,144 | ) | (94,204 | ) | (19,225 | ) | ||||||||||||||
| Service Shares |
(8,034 | ) | (1,462 | ) | — | — | ||||||||||||||||
| Investor Shares |
(255,958 | ) | (47,164 | ) | (869 | ) | (715 | ) | ||||||||||||||
| Class R6 Shares |
(558,521 | ) | (94,517 | ) | (880 | ) | (749 | ) | ||||||||||||||
| Class R Shares |
(103,134 | ) | (13,611 | ) | (2,652 | ) | (1,033 | ) | ||||||||||||||
| Class P Shares |
(3,671,657 | ) | (459,964 | ) | (2,350,232 | ) | (221,552 | ) | ||||||||||||||
| Total distributions to shareholders | (34,196,020 | ) | (5,224,240 | ) | (2,469,280 | ) | (246,528 | ) | ||||||||||||||
| From share transactions: | ||||||||||||||||||||||
| Proceeds from sales of shares |
42,035,572 | 38,748,349 | 14,779,334 | 28,455,067 | ||||||||||||||||||
| Reinvestment of distributions |
33,518,967 | 5,118,773 | 2,469,280 | 246,528 | ||||||||||||||||||
| Cost of shares redeemed |
(46,233,931 | ) | (52,150,664 | ) | (8,992,169 | ) | (5,136,268 | ) | ||||||||||||||
| Net increase (decrease) in net assets resulting from share transactions | 29,320,608 | (8,283,542 | ) | 8,256,445 | 23,565,327 | |||||||||||||||||
| TOTAL INCREASE (DECREASE) | (20,187,474 | ) | 76,510,784 | 3,288,501 | 29,880,798 | |||||||||||||||||
| Net Assets: | ||||||||||||||||||||||
| Beginning of year |
426,134,555 | 349,623,771 | 39,690,032 | 9,809,234 | ||||||||||||||||||
| End of year |
$ | 405,947,081 | $ | 426,134,555 | $ | 42,978,533 | $ | 39,690,032 | ||||||||||||||
| The accompanying notes are an integral part of these financial statements. | 53 |
GOLDMAN SACHS FUNDAMENTAL EQUITY VALUE FUNDS
Statements of Changes in Net Assets (continued)
| Large Cap Value Fund | Mid Cap Value Fund | |||||||||||||||||||||
| For the Fiscal Year Ended August 31, 2022 |
For the Fiscal Year Ended August 31, 2021 |
For the Fiscal Year Ended August 31, 2022 |
For the Fiscal Year Ended August 31, 2021 |
|||||||||||||||||||
| From operations: | ||||||||||||||||||||||
| Net investment income |
$ | 5,624,176 | $ | 4,305,257 | $ | 6,270,018 | $ | 2,029,960 | ||||||||||||||
| Net realized gain |
44,259,875 | 46,577,647 | 158,509,493 | 196,723,419 | ||||||||||||||||||
| Net change in unrealized gain (loss) |
(73,127,971 | ) | 75,981,760 | (216,479,555 | ) | 199,656,980 | ||||||||||||||||
| Net increase (decrease) in net assets resulting from operations | (23,243,920 | ) | 126,864,664 | (51,700,044 | ) | 398,410,359 | ||||||||||||||||
| Distributions to shareholders: | ||||||||||||||||||||||
| From distributable earnings: |
||||||||||||||||||||||
| Class A Shares |
(9,847,776 | ) | (2,596,115 | ) | (81,091,952 | ) | (1,732,461 | ) | ||||||||||||||
| Class C Shares |
(1,340,637 | ) | (463,197 | ) | (2,046,722 | ) | — | |||||||||||||||
| Institutional Shares |
(20,785,951 | ) | (5,488,119 | ) | (50,978,548 | ) | (1,983,199 | ) | ||||||||||||||
| Service Shares |
(94,128 | ) | (26,170 | ) | (5,405,769 | ) | (69,711 | ) | ||||||||||||||
| Investor Shares |
(416,593 | ) | (118,038 | ) | (6,718,024 | ) | (214,960 | ) | ||||||||||||||
| Class R6 Shares |
(219,492 | ) | (68,223 | ) | (12,632,771 | ) | (461,696 | ) | ||||||||||||||
| Class R Shares |
(360,604 | ) | (95,537 | ) | (3,286,387 | ) | (26,075 | ) | ||||||||||||||
| Class P Shares |
(23,402,507 | ) | (5,747,841 | ) | (29,991,781 | ) | (1,049,073 | ) | ||||||||||||||
| Total distributions to shareholders | (56,467,688 | ) | (14,603,240 | ) | (192,151,954 | ) | (5,537,175 | ) | ||||||||||||||
| From share transactions: | ||||||||||||||||||||||
| Proceeds from sales of shares |
43,863,133 | 48,264,420 | 240,283,675 | 145,667,551 | ||||||||||||||||||
| Reinvestment of distributions |
55,466,446 | 14,348,855 | 179,816,177 | 5,131,889 | ||||||||||||||||||
| Cost of shares redeemed |
(68,984,563 | ) | (71,581,795 | ) | (278,289,464 | ) | (270,253,443 | ) | ||||||||||||||
| Net increase (decrease) in net assets resulting from share transactions | 30,345,016 | (8,968,520 | ) | 141,810,388 | (119,454,003 | ) | ||||||||||||||||
| TOTAL INCREASE (DECREASE) | (49,366,592 | ) | 103,292,904 | (102,041,610 | ) | 273,419,181 | ||||||||||||||||
| Net Assets: | ||||||||||||||||||||||
| Beginning of year |
499,671,518 | 396,378,614 | 1,250,812,949 | 977,393,768 | ||||||||||||||||||
| End of year |
$ | 450,304,926 | $ | 499,671,518 | $ | 1,148,771,339 | $ | 1,250,812,949 | ||||||||||||||
| 54 | The accompanying notes are an integral part of these financial statements. |
GOLDMAN SACHS FUNDAMENTAL EQUITY VALUE FUNDS
Statements of Changes in Net Assets (continued)
| Small Cap Value Fund | Small/Mid Cap Value Fund | |||||||||||||||||||||
| For the Fiscal Year Ended August 31, 2022 |
For the Fiscal Year Ended August 31, 2021 |
For the Fiscal Year Ended August 31, 2022 |
For the Fiscal Year Ended August 31, 2021 |
|||||||||||||||||||
| From operations: | ||||||||||||||||||||||
| Net investment income |
$ | 20,132,996 | $ | 7,263,587 | $ | 1,627,333 | $ | 681,672 | ||||||||||||||
| Net realized gain |
569,564,753 | 1,205,015,881 | 11,009,736 | 18,641,348 | ||||||||||||||||||
| Net change in unrealized gain (loss) |
(920,760,237 | ) | 847,333,265 | (36,629,393 | ) | 36,742,167 | ||||||||||||||||
| Net increase (decrease) in net assets resulting from operations | (331,062,488 | ) | 2,059,612,733 | (23,992,324 | ) | 56,065,187 | ||||||||||||||||
| Distributions to shareholders: | ||||||||||||||||||||||
| From distributable earnings: |
||||||||||||||||||||||
| Class A Shares |
(86,760,802 | ) | (884,665 | ) | (119,467 | ) | (4,199 | ) | ||||||||||||||
| Class C Shares |
(495,489 | ) | — | (75,322 | ) | — | ||||||||||||||||
| Institutional Shares |
(372,106,140 | ) | (13,501,670 | ) | (1,191,915 | ) | (60,427 | ) | ||||||||||||||
| Service Shares |
(4,846,092 | ) | (18,081 | ) | — | — | ||||||||||||||||
| Investor Shares |
(34,654,005 | ) | (585,487 | ) | (800,656 | ) | (7,543 | ) | ||||||||||||||
| Class R6 Shares |
(250,111,215 | ) | (7,311,413 | ) | (5,624,330 | ) | (439,348 | ) | ||||||||||||||
| Class R Shares |
(12,118,156 | ) | — | (5,089 | ) | — | ||||||||||||||||
| Class P Shares |
(61,591,156 | ) | (1,337,472 | ) | (5,339,404 | ) | (332,143 | ) | ||||||||||||||
| Total distributions to shareholders | (822,683,055 | ) | (23,638,788 | ) | (13,156,183 | ) | (843,660 | ) | ||||||||||||||
| From share transactions: | ||||||||||||||||||||||
| Proceeds from sales of shares |
749,898,210 | 1,182,845,461 | 105,555,731 | 98,655,098 | ||||||||||||||||||
| Reinvestment of distributions |
794,278,372 | 23,006,155 | 13,155,489 | 842,799 | ||||||||||||||||||
| Cost of shares redeemed |
(1,809,688,954 | ) | (2,958,322,797 | ) | (76,873,076 | ) | (30,854,997 | ) | ||||||||||||||
| Net increase (decrease) in net assets resulting from share transactions | (265,512,372 | ) | (1,752,471,181 | ) | 41,838,144 | 68,642,900 | ||||||||||||||||
| TOTAL INCREASE (DECREASE) | (1,419,257,915 | ) | 283,502,764 | 4,689,637 | 123,864,427 | |||||||||||||||||
| Net Assets: | ||||||||||||||||||||||
| Beginning of year |
4,802,645,328 | 4,519,142,564 | 225,021,589 | 101,157,162 | ||||||||||||||||||
| End of year |
$ | 3,383,387,413 | $ | 4,802,645,328 | $ | 229,711,226 | $ | 225,021,589 | ||||||||||||||
| The accompanying notes are an integral part of these financial statements. | 55 |
GOLDMAN SACHS EQUITY INCOME FUND
Selected Data for a Share Outstanding Throughout Each Year
| (a) | Calculated based on the average shares outstanding methodology. |
| (b) | Assumes investment at the NAV at the beginning of the year, reinvestment of all dividends and distributions, a complete redemption of the investment at the NAV at the end of the year and no sales or redemption charges (if any). Total returns would be reduced if a sales or redemption charge was taken into account. Returns do not reflect the impact of taxes to shareholders relating to Fund distributions or the redemption of Fund shares. |
| (c) | The Fund’s portfolio turnover rate is calculated in accordance with regulatory requirements, without regard to transactions involving short term investments. If such transactions were included, the Fund’s portfolio turnover rate may be higher. |
| 56 | The accompanying notes are an integral part of these financial statements. |
GOLDMAN SACHS EQUITY INCOME FUND
Financial Highlights (continued)
Selected Data for a Share Outstanding Throughout Each Year
| Goldman Sachs Equity Income Fund | ||||||||||||||||||||||
| Class C Shares | ||||||||||||||||||||||
| Year Ended August 31, | ||||||||||||||||||||||
| 2022 | 2021 | 2020 | 2019 | 2018 | ||||||||||||||||||
| Per Share Data | ||||||||||||||||||||||
| Net asset value, beginning of year |
$ | 44.89 | $ | 36.06 | $ | 37.12 | $ | 36.41 | $ | 33.50 | ||||||||||||
| Net investment income(a) |
0.36 | 0.26 | 0.34 | 0.38 | 0.37 | |||||||||||||||||
| Net realized and unrealized gain (loss) |
(2.19 | ) | 8.82 | 0.54 | 0.96 | 2.98 | ||||||||||||||||
| Total from investment operations |
(1.83 | ) | 9.08 | 0.88 | 1.34 | 3.35 | ||||||||||||||||
| Distributions to shareholders from net investment income |
(0.41 | ) | (0.25 | ) | (0.37 | ) | (0.33 | ) | (0.44 | ) | ||||||||||||
| Distributions to shareholders from net realized gains |
(3.03 | ) | — | (1.57 | ) | (0.30 | ) | — | ||||||||||||||
| Total distributions |
(3.44 | ) | (0.25 | ) | (1.94 | ) | (0.63 | ) | (0.44 | ) | ||||||||||||
| Net asset value, end of year |
$ | 39.62 | $ | 44.89 | $ | 36.06 | $ | 37.12 | $ | 36.41 | ||||||||||||
| Total Return(b) | (4.51 | )% | 25.26 | % | 2.33 | % | 3.82 | % | 10.06 | % | ||||||||||||
| Net assets, end of year (in 000’s) |
$ | 4,651 | $ | 6,026 | $ | 5,477 | $ | 8,116 | $ | 16,982 | ||||||||||||
| Ratio of net expenses to average net assets |
1.79 | % | 1.79 | % | 1.83 | % | 1.85 | % | 1.87 | % | ||||||||||||
| Ratio of total expenses to average net assets |
1.93 | % | 1.95 | % | 2.00 | % | 2.00 | % | 2.02 | % | ||||||||||||
| Ratio of net investment income to average net assets |
0.84 | % | 0.65 | % | 0.94 | % | 1.05 | % | 1.06 | % | ||||||||||||
| Portfolio turnover rate(c) |
17 | % | 44 | % | 42 | % | 42 | % | 69 | % | ||||||||||||
| (a) | Calculated based on the average shares outstanding methodology. |
| (b) | Assumes investment at the NAV at the beginning of the year, reinvestment of all dividends and distributions, a complete redemption of the investment at the NAV at the end of the year and no sales or redemption charges (if any). Total returns would be reduced if a sales or redemption charge was taken into account. Returns do not reflect the impact of taxes to shareholders relating to Fund distributions or the redemption of Fund shares. |
| (c) | The Fund’s portfolio turnover rate is calculated in accordance with regulatory requirements, without regard to transactions involving short term investments. If such transactions were included, the Fund’s portfolio turnover rate may be higher. |
| The accompanying notes are an integral part of these financial statements. | 57 |
GOLDMAN SACHS EQUITY INCOME FUND
Financial Highlights (continued)
Selected Data for a Share Outstanding Throughout Each Year
| Goldman Sachs Equity Income Fund | ||||||||||||||||||||||
| Institutional Shares | ||||||||||||||||||||||
| Year Ended August 31, | ||||||||||||||||||||||
| 2022 | 2021 | 2020 | 2019 | 2018 | ||||||||||||||||||
| Per Share Data | ||||||||||||||||||||||
| Net asset value, beginning of year |
$ | 48.15 | $ | 38.65 | $ | 39.66 | $ | 38.92 | $ | 35.77 | ||||||||||||
| Net investment income(a) |
0.87 | 0.75 | 0.76 | 0.83 | 0.81 | |||||||||||||||||
| Net realized and unrealized gain (loss) |
(2.37 | ) | 9.44 | 0.58 | 1.01 | 3.18 | ||||||||||||||||
| Total from investment operations |
(1.50 | ) | 10.19 | 1.34 | 1.84 | 3.99 | ||||||||||||||||
| Distributions to shareholders from net investment income |
(0.86 | ) | (0.69 | ) | (0.78 | ) | (0.80 | ) | (0.84 | ) | ||||||||||||
| Distributions to shareholders from net realized gains |
(3.03 | ) | — | (1.57 | ) | (0.30 | ) | — | ||||||||||||||
| Total distributions |
(3.89 | ) | (0.69 | ) | (2.35 | ) | (1.10 | ) | (0.84 | ) | ||||||||||||
| Net asset value, end of year |
$ | 42.76 | $ | 48.15 | $ | 38.65 | $ | 39.66 | $ | 38.92 | ||||||||||||
| Total Return(b) | (3.49 | )% | 26.63 | % | 3.41 | % | 4.94 | % | 11.30 | % | ||||||||||||
| Net assets, end of year (in 000’s) |
$ | 31,702 | $ | 33,660 | $ | 22,592 | $ | 19,906 | $ | 24,658 | ||||||||||||
| Ratio of net expenses to average net assets |
0.73 | % | 0.73 | % | 0.74 | % | 0.73 | % | 0.73 | % | ||||||||||||
| Ratio of total expenses to average net assets |
0.81 | % | 0.83 | % | 0.86 | % | 0.86 | % | 0.87 | % | ||||||||||||
| Ratio of net investment income to average net assets |
1.90 | % | 1.73 | % | 2.00 | % | 2.17 | % | 2.17 | % | ||||||||||||
| Portfolio turnover rate(c) |
17 | % | 44 | % | 42 | % | 42 | % | 69 | % | ||||||||||||
| (a) | Calculated based on the average shares outstanding methodology. |
| (b) | Assumes investment at the NAV at the beginning of the year, reinvestment of all dividends and distributions, a complete redemption of the investment at the NAV at the end of the year and no sales or redemption charges (if any). Total returns would be reduced if a sales or redemption charge was taken into account. Returns do not reflect the impact of taxes to shareholders relating to Fund distributions or the redemption of Fund shares. |
| (c) | The Fund’s portfolio turnover rate is calculated in accordance with regulatory requirements, without regard to transactions involving short term investments. If such transactions were included, the Fund’s portfolio turnover rate may be higher. |
| 58 | The accompanying notes are an integral part of these financial statements. |
GOLDMAN SACHS EQUITY INCOME FUND
Financial Highlights (continued)
Selected Data for a Share Outstanding Throughout Each Year
| Goldman Sachs Equity Income Fund | ||||||||||||||||||||||
| Service Shares | ||||||||||||||||||||||
| Year Ended August 31, | ||||||||||||||||||||||
| 2022 | 2021 | 2020 | 2019 | 2018 | ||||||||||||||||||
| Per Share Data | ||||||||||||||||||||||
| Net asset value, beginning of year |
$ | 47.45 | $ | 38.08 | $ | 39.10 | $ | 38.39 | $ | 35.28 | ||||||||||||
| Net investment income(a) |
0.63 | 0.48 | 0.57 | 0.61 | 0.63 | |||||||||||||||||
| Net realized and unrealized gain (loss) |
(2.33 | ) | 9.35 | 0.57 | 1.01 | 3.13 | ||||||||||||||||
| Total from investment operations |
(1.70 | ) | 9.83 | 1.14 | 1.62 | 3.76 | ||||||||||||||||
| Distributions to shareholders from net investment income |
(0.64 | ) | (0.46 | ) | (0.59 | ) | (0.61 | ) | (0.65 | ) | ||||||||||||
| Distributions to shareholders from net realized gains |
(3.03 | ) | — | (1.57 | ) | (0.30 | ) | — | ||||||||||||||
| Total distributions |
(3.67 | ) | (0.46 | ) | (2.16 | ) | (0.91 | ) | (0.65 | ) | ||||||||||||
| Net asset value, end of year |
$ | 42.08 | $ | 47.45 | $ | 38.08 | $ | 39.10 | $ | 38.39 | ||||||||||||
| Total Return(b) | (3.98 | )% | 26.01 | % | 2.89 | % | 4.40 | % | 10.77 | % | ||||||||||||
| Net assets, end of year (in 000’s) |
$ | 90 | $ | 103 | $ | 161 | $ | 175 | $ | 84 | ||||||||||||
| Ratio of net expenses to average net assets |
1.23 | % | 1.23 | % | 1.24 | % | 1.23 | % | 1.23 | % | ||||||||||||
| Ratio of total expenses to average net assets |
1.31 | % | 1.33 | % | 1.37 | % | 1.36 | % | 1.38 | % | ||||||||||||
| Ratio of net investment income to average net assets |
1.39 | % | 1.16 | % | 1.52 | % | 1.60 | % | 1.70 | % | ||||||||||||
| Portfolio turnover rate(c) |
17 | % | 44 | % | 42 | % | 42 | % | 69 | % | ||||||||||||
| (a) | Calculated based on the average shares outstanding methodology. |
| (b) | Assumes investment at the NAV at the beginning of the year, reinvestment of all dividends and distributions, a complete redemption of the investment at the NAV at the end of the year and no sales or redemption charges (if any). Total returns would be reduced if a sales or redemption charge was taken into account. Returns do not reflect the impact of taxes to shareholders relating to Fund distributions or the redemption of Fund shares. |
| (c) | The Fund’s portfolio turnover rate is calculated in accordance with regulatory requirements, without regard to transactions involving short term investments. If such transactions were included, the Fund’s portfolio turnover rate may be higher. |
| The accompanying notes are an integral part of these financial statements. | 59 |
GOLDMAN SACHS EQUITY INCOME FUND
Financial Highlights (continued)
Selected Data for a Share Outstanding Throughout Each Year
| Goldman Sachs Equity Income Fund | ||||||||||||||||||||||
| Investor Shares | ||||||||||||||||||||||
| Year Ended August 31, | ||||||||||||||||||||||
| 2022 | 2021 | 2020 | 2019 | 2018 | ||||||||||||||||||
| Per Share Data | ||||||||||||||||||||||
| Net asset value, beginning of year |
$ | 47.18 | $ | 37.88 | $ | 38.91 | $ | 38.20 | $ | 35.12 | ||||||||||||
| Net investment income(a) |
0.83 | 0.69 | 0.71 | 0.76 | 0.76 | |||||||||||||||||
| Net realized and unrealized gain (loss) |
(2.32 | ) | 9.27 | 0.58 | 1.00 | 3.11 | ||||||||||||||||
| Total from investment operations |
(1.49 | ) | 9.96 | 1.29 | 1.76 | 3.87 | ||||||||||||||||
| Distributions to shareholders from net investment income |
(0.84 | ) | (0.66 | ) | (0.75 | ) | (0.75 | ) | (0.79 | ) | ||||||||||||
| Distributions to shareholders from net realized gains |
(3.03 | ) | — | (1.57 | ) | (0.30 | ) | — | ||||||||||||||
| Total distributions |
(3.87 | ) | (0.66 | ) | (2.32 | ) | (1.05 | ) | (0.79 | ) | ||||||||||||
| Net asset value, end of year |
$ | 41.82 | $ | 47.18 | $ | 37.88 | $ | 38.91 | $ | 38.20 | ||||||||||||
| Total Return(b) | (3.55 | )% | 26.54 | % | 3.33 | % | 4.82 | % | 11.15 | % | ||||||||||||
| Net assets, end of year (in 000’s) |
$ | 4,394 | $ | 3,042 | $ | 2,384 | $ | 2,321 | $ | 2,851 | ||||||||||||
| Ratio of net expenses to average net assets |
0.79 | % | 0.80 | % | 0.83 | % | 0.85 | % | 0.87 | % | ||||||||||||
| Ratio of total expenses to average net assets |
0.93 | % | 0.95 | % | 0.99 | % | 1.00 | % | 1.02 | % | ||||||||||||
| Ratio of net investment income to average net assets |
1.86 | % | 1.66 | % | 1.92 | % | 2.04 | % | 2.07 | % | ||||||||||||
| Portfolio turnover rate(c) |
17 | % | 44 | % | 42 | % | 42 | % | 69 | % | ||||||||||||
| (a) | Calculated based on the average shares outstanding methodology. |
| (b) | Assumes investment at the NAV at the beginning of the year, reinvestment of all dividends and distributions, a complete redemption of the investment at the NAV at the end of the year and no sales or redemption charges (if any). Total returns would be reduced if a sales or redemption charge was taken into account. Returns do not reflect the impact of taxes to shareholders relating to Fund distributions or the redemption of Fund shares. |
| (c) | The Fund’s portfolio turnover rate is calculated in accordance with regulatory requirements, without regard to transactions involving short term investments. If such transactions were included, the Fund’s portfolio turnover rate may be higher. |
| 60 | The accompanying notes are an integral part of these financial statements. |
GOLDMAN SACHS EQUITY INCOME FUND
Financial Highlights (continued)
Selected Data for a Share Outstanding Throughout Each Year
| Goldman Sachs Equity Income Fund | ||||||||||||||||||||||
| Class R6 Shares | ||||||||||||||||||||||
| Year Ended August 31, | ||||||||||||||||||||||
| 2022 | 2021 | 2020 | 2019 | 2018 | ||||||||||||||||||
| Per Share Data | ||||||||||||||||||||||
| Net asset value, beginning of year |
$ | 48.15 | $ | 38.65 | $ | 39.66 | $ | 38.92 | $ | 35.76 | ||||||||||||
| Net investment income(a) |
0.87 | 0.75 | 0.76 | 0.80 | 0.83 | |||||||||||||||||
| Net realized and unrealized gain (loss) |
(2.36 | ) | 9.44 | 0.58 | 1.04 | 3.17 | ||||||||||||||||
| Total from investment operations |
(1.49 | ) | 10.19 | 1.34 | 1.84 | 4.00 | ||||||||||||||||
| Distributions to shareholders from net investment income |
(0.87 | ) | (0.69 | ) | (0.78 | ) | (0.80 | ) | (0.84 | ) | ||||||||||||
| Distributions to shareholders from net realized gains |
(3.03 | ) | — | (1.57 | ) | (0.30 | ) | — | ||||||||||||||
| Total distributions |
(3.90 | ) | (0.69 | ) | (2.35 | ) | (1.10 | ) | (0.84 | ) | ||||||||||||
| Net asset value, end of year |
$ | 42.76 | $ | 48.15 | $ | 38.65 | $ | 39.66 | $ | 38.92 | ||||||||||||
| Total Return(b) | (3.48 | )% | 26.64 | % | 3.42 | % | 4.95 | % | 11.34 | % | ||||||||||||
| Net assets, end of year (in 000’s) |
$ | 6,582 | $ | 6,981 | $ | 5,378 | $ | 5,973 | $ | 13 | ||||||||||||
| Ratio of net expenses to average net assets |
0.72 | % | 0.72 | % | 0.73 | % | 0.72 | % | 0.72 | % | ||||||||||||
| Ratio of total expenses to average net assets |
0.80 | % | 0.82 | % | 0.86 | % | 0.85 | % | 0.86 | % | ||||||||||||
| Ratio of net investment income to average net assets |
1.90 | % | 1.73 | % | 2.00 | % | 2.08 | % | 2.22 | % | ||||||||||||
| Portfolio turnover rate(c) |
17 | % | 44 | % | 42 | % | 42 | % | 69 | % | ||||||||||||
| (a) | Calculated based on the average shares outstanding methodology. |
| (b) | Assumes investment at the NAV at the beginning of the year, reinvestment of all dividends and distributions, a complete redemption of the investment at the NAV at the end of the year and no sales or redemption charges (if any). Total returns would be reduced if a sales or redemption charge was taken into account. Returns do not reflect the impact of taxes to shareholders relating to Fund distributions or the redemption of Fund shares. |
| (c) | The Fund’s portfolio turnover rate is calculated in accordance with regulatory requirements, without regard to transactions involving short term investments. If such transactions were included, the Fund’s portfolio turnover rate may be higher. |
| The accompanying notes are an integral part of these financial statements. | 61 |
GOLDMAN SACHS EQUITY INCOME FUND
Financial Highlights (continued)
Selected Data for a Share Outstanding Throughout Each Year
| Goldman Sachs Equity Income Fund | ||||||||||||||||||||||
| Class R Shares | ||||||||||||||||||||||
| Year Ended August 31, | ||||||||||||||||||||||
| 2022 | 2021 | 2020 | 2019 | 2018 | ||||||||||||||||||
| Per Share Data | ||||||||||||||||||||||
| Net asset value, beginning of year |
$ | 46.98 | $ | 37.73 | $ | 38.75 | $ | 38.05 | $ | 34.98 | ||||||||||||
| Net investment income(a) |
0.60 | 0.49 | 0.53 | 0.57 | 0.57 | |||||||||||||||||
| Net realized and unrealized gain (loss) |
(2.31 | ) | 9.22 | 0.57 | 1.00 | 3.10 | ||||||||||||||||
| Total from investment operations |
(1.71 | ) | 9.71 | 1.10 | 1.57 | 3.67 | ||||||||||||||||
| Distributions to shareholders from net investment income |
(0.62 | ) | (0.46 | ) | (0.55 | ) | (0.57 | ) | (0.60 | ) | ||||||||||||
| Distributions to shareholders from net realized gains |
(3.03 | ) | — | (1.57 | ) | (0.30 | ) | — | ||||||||||||||
| Total distributions |
(3.65 | ) | (0.46 | ) | (2.12 | ) | (0.87 | ) | (0.60 | ) | ||||||||||||
| Net asset value, end of year |
$ | 41.62 | $ | 46.98 | $ | 37.73 | $ | 38.75 | $ | 38.05 | ||||||||||||
| Total Return(b) | (4.02 | )% | 25.91 | % | 2.82 | % | 4.29 | % | 10.59 | % | ||||||||||||
| Net assets, end of year (in 000’s) |
$ | 630 | $ | 1,337 | $ | 1,131 | $ | 1,525 | $ | 1,492 | ||||||||||||
| Ratio of net expenses to average net assets |
1.29 | % | 1.29 | % | 1.33 | % | 1.34 | % | 1.37 | % | ||||||||||||
| Ratio of total expenses to average net assets |
1.43 | % | 1.45 | % | 1.50 | % | 1.50 | % | 1.52 | % | ||||||||||||
| Ratio of net investment income to average net assets |
1.34 | % | 1.15 | % | 1.42 | % | 1.54 | % | 1.55 | % | ||||||||||||
| Portfolio turnover rate(c) |
17 | % | 44 | % | 42 | % | 42 | % | 69 | % | ||||||||||||
| (a) | Calculated based on the average shares outstanding methodology. |
| (b) | Assumes investment at the NAV at the beginning of the year, reinvestment of all dividends and distributions, a complete redemption of the investment at the NAV at the end of the year and no sales or redemption charges (if any). Total returns would be reduced if a sales or redemption charge was taken into account. Returns do not reflect the impact of taxes to shareholders relating to Fund distributions or the redemption of Fund shares. |
| (c) | The Fund’s portfolio turnover rate is calculated in accordance with regulatory requirements, without regard to transactions involving short term investments. If such transactions were included, the Fund’s portfolio turnover rate may be higher. |
| 62 | The accompanying notes are an integral part of these financial statements. |
GOLDMAN SACHS EQUITY INCOME FUND
Financial Highlights (continued)
Selected Data for a Share Outstanding Throughout Each Period
| Goldman Sachs Equity Income Fund | ||||||||||||||||||||||
| Class P Shares | ||||||||||||||||||||||
| Year Ended August 31, | Period Ended August 31, 2018(a) |
|||||||||||||||||||||
| 2022 | 2021 | 2020 | 2019 | |||||||||||||||||||
| Per Share Data | ||||||||||||||||||||||
| Net asset value, beginning of period |
$ | 48.14 | $ | 38.64 | $ | 39.65 | $ | 38.92 | $ | 37.37 | ||||||||||||
| Net investment income(b) |
0.88 | 0.76 | 0.76 | 0.82 | 0.31 | |||||||||||||||||
| Net realized and unrealized gain (loss) |
(2.37 | ) | 9.43 | 0.59 | 1.01 | 1.48 | ||||||||||||||||
| Total from investment operations |
(1.49 | ) | 10.19 | 1.35 | 1.83 | 1.79 | ||||||||||||||||
| Distributions to shareholders from net investment income |
(0.87 | ) | (0.69 | ) | (0.79 | ) | (0.80 | ) | (0.24 | ) | ||||||||||||
| Distributions to shareholders from net realized gains |
(3.03 | ) | — | (1.57 | ) | (0.30 | ) | — | ||||||||||||||
| Total distributions |
(3.90 | ) | (0.69 | ) | (2.36 | ) | (1.10 | ) | (0.24 | ) | ||||||||||||
| Net asset value, end of period |
$ | 42.75 | $ | 48.14 | $ | 38.64 | $ | 39.65 | $ | 38.92 | ||||||||||||
| Total Return(c) | (3.48 | )% | 26.65 | % | 3.43 | % | 4.92 | % | 4.84 | % | ||||||||||||
| Net assets, end of period (in 000’s) |
$ | 57,277 | $ | 40,099 | $ | 20,492 | $ | 11,500 | $ | 10,835 | ||||||||||||
| Ratio of net expenses to average net assets |
0.72 | % | 0.72 | % | 0.73 | % | 0.72 | % | 0.72 | %(d) | ||||||||||||
| Ratio of total expenses to average net assets |
0.80 | % | 0.82 | % | 0.85 | % | 0.85 | % | 0.95 | %(d) | ||||||||||||
| Ratio of net investment income to average net assets |
1.94 | % | 1.74 | % | 2.04 | % | 2.16 | % | 2.20 | %(d) | ||||||||||||
| Portfolio turnover rate(e) |
17 | % | 44 | % | 42 | % | 42 | % | 69 | % | ||||||||||||
| (a) | Commenced operations on April 17, 2018. |
| (b) | Calculated based on the average shares outstanding methodology. |
| (c) | Assumes investment at the NAV at the beginning of the period, reinvestment of all dividends and distributions, a complete redemption of the investment at the NAV at the end of the period and no sales or redemption charges (if any). Total returns would be reduced if a sales or redemption charge was taken into account. Returns do not reflect the impact of taxes to shareholders relating to Fund distributions or the redemption of Fund shares. Total returns for periods less than one full year are not annualized. |
| (d) | Annualized. |
| (e) | The Fund’s portfolio turnover rate is calculated in accordance with regulatory requirements, without regard to transactions involving short term investments. If such transactions were included, the Fund’s portfolio turnover rate may be higher. |
| The accompanying notes are an integral part of these financial statements. | 63 |
GOLDMAN SACHS FOCUSED VALUE FUND
Financial Highlights (continued)
Selected Data for a Share Outstanding Throughout Each Year
| (a) | Calculated based on the average shares outstanding methodology. |
| (b) | Assumes investment at the NAV at the beginning of the year, reinvestment of all dividends and distributions, a complete redemption of the investment at the NAV at the end of the year and no sales or redemption charges (if any). Total returns would be reduced if a sales or redemption charge was taken into account. Returns do not reflect the impact of taxes to shareholders relating to Fund distributions or the redemption of Fund shares. |
| (c) | The Fund’s portfolio turnover rate is calculated in accordance with regulatory requirements, without regard to transactions involving short term investments. If such transactions were included, the Fund’s portfolio turnover rate may be higher. |
| 64 | The accompanying notes are an integral part of these financial statements. |
GOLDMAN SACHS FOCUSED VALUE FUND
Financial Highlights (continued)
Selected Data for a Share Outstanding Throughout Each Year
| Goldman Sachs Focused Value Fund | ||||||||||||||||||||||
| Class C Shares | ||||||||||||||||||||||
| Year Ended August 31, | ||||||||||||||||||||||
| 2022 | 2021 | 2020 | 2019 | 2018 | ||||||||||||||||||
| Per Share Data | ||||||||||||||||||||||
| Net asset value, beginning of year |
$ | 14.65 | $ | 11.11 | $ | 10.60 | $ | 11.03 | $ | 11.05 | ||||||||||||
| Net investment income (loss)(a) |
— | (0.03 | ) | 0.01 | — | (0.03 | ) | |||||||||||||||
| Net realized and unrealized gain (loss) |
(0.94 | ) | 3.71 | 0.61 | 0.09 | 0.87 | ||||||||||||||||
| Total from investment operations |
(0.94 | ) | 3.68 | 0.62 | 0.09 | 0.84 | ||||||||||||||||
| Distributions to shareholders from net investment income |
— | — | — | (0.01 | ) | — | ||||||||||||||||
| Distributions to shareholders from net realized gains |
(0.86 | ) | (0.14 | ) | (0.11 | ) | (0.51 | ) | (0.86 | ) | ||||||||||||
| Total distributions |
(0.86 | ) | (0.14 | ) | (0.11 | ) | (0.52 | ) | (0.86 | ) | ||||||||||||
| Net asset value, end of year |
$ | 12.85 | $ | 14.65 | $ | 11.11 | $ | 10.60 | $ | 11.03 | ||||||||||||
| Total Return(b) | (6.93 | )% | 33.34 | % | 5.85 | % | 1.27 | % | 7.87 | % | ||||||||||||
| Net assets, end of year (in 000’s) |
$ | 326 | $ | 49 | $ | 32 | $ | 30 | $ | 30 | ||||||||||||
| Ratio of net expenses to average net assets |
1.79 | % | 1.79 | % | 1.85 | % | 1.85 | % | 1.87 | % | ||||||||||||
| Ratio of total expenses to average net assets |
2.43 | % | 2.99 | % | 5.81 | % | 8.79 | % | 5.77 | % | ||||||||||||
| Ratio of net investment income (loss) to average net assets |
0.04 | % | (0.24 | )% | 0.06 | % | 0.05 | % | (0.24 | )% | ||||||||||||
| Portfolio turnover rate(c) |
78 | % | 78 | % | 102 | % | 122 | % | 204 | % | ||||||||||||
| (a) | Calculated based on the average shares outstanding methodology. |
| (b) | Assumes investment at the NAV at the beginning of the year, reinvestment of all dividends and distributions, a complete redemption of the investment at the NAV at the end of the year and no sales or redemption charges (if any). Total returns would be reduced if a sales or redemption charge was taken into account. Returns do not reflect the impact of taxes to shareholders relating to Fund distributions or the redemption of Fund shares. |
| (c) | The Fund’s portfolio turnover rate is calculated in accordance with regulatory requirements, without regard to transactions involving short term investments. If such transactions were included, the Fund’s portfolio turnover rate may be higher. |
| The accompanying notes are an integral part of these financial statements. | 65 |
GOLDMAN SACHS FOCUSED VALUE FUND
Financial Highlights (continued)
Selected Data for a Share Outstanding Throughout Each Year
| Goldman Sachs Focused Value Fund | ||||||||||||||||||||||
| Institutional Shares | ||||||||||||||||||||||
| Year Ended August 31, | ||||||||||||||||||||||
| 2022 | 2021 | 2020 | 2019 | 2018 | ||||||||||||||||||
| Per Share Data | ||||||||||||||||||||||
| Net asset value, beginning of year |
$ | 14.92 | $ | 11.29 | $ | 10.72 | $ | 11.13 | $ | 11.14 | ||||||||||||
| Net investment income(a) |
0.16 | 0.11 | 0.12 | 0.12 | 0.09 | |||||||||||||||||
| Net realized and unrealized gain (loss) |
(0.97 | ) | 3.77 | 0.63 | 0.08 | 0.88 | ||||||||||||||||
| Total from investment operations |
(0.81 | ) | 3.88 | 0.75 | 0.20 | 0.97 | ||||||||||||||||
| Distributions to shareholders from net investment income |
(0.11 | ) | (0.11 | ) | (0.07 | ) | (0.10 | ) | (0.12 | ) | ||||||||||||
| Distributions to shareholders from net realized gains |
(0.86 | ) | (0.14 | ) | (0.11 | ) | (0.51 | ) | (0.86 | ) | ||||||||||||
| Total distributions |
(0.97 | ) | (0.25 | ) | (0.18 | ) | (0.61 | ) | (0.98 | ) | ||||||||||||
| Net asset value, end of year |
$ | 13.14 | $ | 14.92 | $ | 11.29 | $ | 10.72 | $ | 11.13 | ||||||||||||
| Total Return(b) | (5.98 | )% | 34.80 | % | 7.00 | % | 2.47 | % | 9.06 | % | ||||||||||||
| Net assets, end of year (in 000’s) |
$ | 2,167 | $ | 5,999 | $ | 871 | $ | 776 | $ | 1,007 | ||||||||||||
| Ratio of net expenses to average net assets |
0.73 | % | 0.73 | % | 0.76 | % | 0.73 | % | 0.73 | % | ||||||||||||
| Ratio of total expenses to average net assets |
1.41 | % | 1.65 | % | 4.65 | % | 7.57 | % | 4.40 | % | ||||||||||||
| Ratio of net investment income to average net assets |
1.10 | % | 0.82 | % | 1.13 | % | 1.16 | % | 0.86 | % | ||||||||||||
| Portfolio turnover rate(c) |
78 | % | 78 | % | 102 | % | 122 | % | 204 | % | ||||||||||||
| (a) | Calculated based on the average shares outstanding methodology. |
| (b) | Assumes investment at the NAV at the beginning of the year, reinvestment of all dividends and distributions, a complete redemption of the investment at the NAV at the end of the year and no sales or redemption charges (if any). Total returns would be reduced if a sales or redemption charge was taken into account. Returns do not reflect the impact of taxes to shareholders relating to Fund distributions or the redemption of Fund shares. |
| (c) | The Fund’s portfolio turnover rate is calculated in accordance with regulatory requirements, without regard to transactions involving short term investments. If such transactions were included, the Fund’s portfolio turnover rate may be higher. |
| 66 | The accompanying notes are an integral part of these financial statements. |
GOLDMAN SACHS FOCUSED VALUE FUND
Financial Highlights (continued)
Selected Data for a Share Outstanding Throughout Each Year
| Goldman Sachs Focused Value Fund | ||||||||||||||||||||||
| Investor Shares | ||||||||||||||||||||||
| Year Ended August 31, | ||||||||||||||||||||||
| 2022 | 2021 | 2020 | 2019 | 2018 | ||||||||||||||||||
| Per Share Data | ||||||||||||||||||||||
| Net asset value, beginning of year |
$ | 14.88 | $ | 11.26 | $ | 10.69 | $ | 11.13 | $ | 11.13 | ||||||||||||
| Net investment income(a) |
0.14 | 0.09 | 0.11 | 0.11 | 0.08 | |||||||||||||||||
| Net realized and unrealized gain (loss) |
(0.96 | ) | 3.77 | 0.63 | 0.07 | 0.88 | ||||||||||||||||
| Total from investment operations |
(0.82 | ) | 3.86 | 0.74 | 0.18 | 0.96 | ||||||||||||||||
| Distributions to shareholders from net investment income |
(0.11 | ) | (0.10 | ) | (0.06 | ) | (0.11 | ) | (0.10 | ) | ||||||||||||
| Distributions to shareholders from net realized gains |
(0.86 | ) | (0.14 | ) | (0.11 | ) | (0.51 | ) | (0.86 | ) | ||||||||||||
| Total distributions |
(0.97 | ) | (0.24 | ) | (0.17 | ) | (0.62 | ) | (0.96 | ) | ||||||||||||
| Net asset value, end of year |
$ | 13.09 | $ | 14.88 | $ | 11.26 | $ | 10.69 | $ | 11.13 | ||||||||||||
| Total Return(b) | (6.06 | )% | 34.71 | % | 6.92 | % | 2.26 | % | 9.01 | % | ||||||||||||
| Net assets, end of year (in 000’s) |
$ | 12 | $ | 13 | $ | 34 | $ | 32 | $ | 31 | ||||||||||||
| Ratio of net expenses to average net assets |
0.80 | % | 0.80 | % | 0.85 | % | 0.85 | % | 0.87 | % | ||||||||||||
| Ratio of total expenses to average net assets |
1.47 | % | 2.61 | % | 4.81 | % | 7.79 | % | 4.77 | % | ||||||||||||
| Ratio of net investment income to average net assets |
0.97 | % | 0.69 | % | 1.04 | % | 1.05 | % | 0.72 | % | ||||||||||||
| Portfolio turnover rate(c) |
78 | % | 78 | % | 102 | % | 122 | % | 204 | % | ||||||||||||
| (a) | Calculated based on the average shares outstanding methodology. |
| (b) | Assumes investment at the NAV at the beginning of the year, reinvestment of all dividends and distributions, a complete redemption of the investment at the NAV at the end of the year and no sales or redemption charges (if any). Total returns would be reduced if a sales or redemption charge was taken into account. Returns do not reflect the impact of taxes to shareholders relating to Fund distributions or the redemption of Fund shares. |
| (c) | The Fund’s portfolio turnover rate is calculated in accordance with regulatory requirements, without regard to transactions involving short term investments. If such transactions were included, the Fund’s portfolio turnover rate may be higher. |
| The accompanying notes are an integral part of these financial statements. | 67 |
GOLDMAN SACHS FOCUSED VALUE FUND
Financial Highlights (continued)
Selected Data for a Share Outstanding Throughout Each Year
| Goldman Sachs Focused Value Fund | ||||||||||||||||||||||
| Class R6 Shares | ||||||||||||||||||||||
| Year Ended August 31, | ||||||||||||||||||||||
| 2022 | 2021 | 2020 | 2019 | 2018 | ||||||||||||||||||
| Per Share Data | ||||||||||||||||||||||
| Net asset value, beginning of year |
$ | 14.89 | $ | 11.27 | $ | 10.71 | $ | 11.14 | $ | 11.15 | ||||||||||||
| Net investment income(a) |
0.15 | 0.10 | 0.12 | 0.12 | 0.10 | |||||||||||||||||
| Net realized and unrealized gain (loss) |
(0.95 | ) | 3.77 | 0.62 | 0.09 | 0.87 | ||||||||||||||||
| Total from investment operations |
(0.80 | ) | 3.87 | 0.74 | 0.21 | 0.97 | ||||||||||||||||
| Distributions to shareholders from net investment income |
(0.12 | ) | (0.11 | ) | (0.07 | ) | (0.13 | ) | (0.12 | ) | ||||||||||||
| Distributions to shareholders from net realized gains |
(0.86 | ) | (0.14 | ) | (0.11 | ) | (0.51 | ) | (0.86 | ) | ||||||||||||
| Total distributions |
(0.98 | ) | (0.25 | ) | (0.18 | ) | (0.64 | ) | (0.98 | ) | ||||||||||||
| Net asset value, end of year |
$ | 13.11 | $ | 14.89 | $ | 11.27 | $ | 10.71 | $ | 11.14 | ||||||||||||
| Total Return(b) | (5.90 | )% | 34.79 | % | 6.92 | % | 2.52 | % | 9.06 | % | ||||||||||||
| Net assets, end of year (in 000’s) |
$ | 12 | $ | 13 | $ | 34 | $ | 32 | $ | 31 | ||||||||||||
| Ratio of net expenses to average net assets |
0.72 | % | 0.72 | % | 0.75 | % | 0.72 | % | 0.72 | % | ||||||||||||
| Ratio of total expenses to average net assets |
1.33 | % | 2.48 | % | 4.67 | % | 7.64 | % | 4.64 | % | ||||||||||||
| Ratio of net investment income to average net assets |
1.05 | % | 0.77 | % | 1.13 | % | 1.16 | % | 0.87 | % | ||||||||||||
| Portfolio turnover rate(c) |
78 | % | 78 | % | 102 | % | 122 | % | 204 | % | ||||||||||||
| (a) | Calculated based on the average shares outstanding methodology. |
| (b) | Assumes investment at the NAV at the beginning of the year, reinvestment of all dividends and distributions, a complete redemption of the investment at the NAV at the end of the year and no sales or redemption charges (if any). Total returns would be reduced if a sales or redemption charge was taken into account. Returns do not reflect the impact of taxes to shareholders relating to Fund distributions or the redemption of Fund shares. |
| (c) | The Fund’s portfolio turnover rate is calculated in accordance with regulatory requirements, without regard to transactions involving short term investments. If such transactions were included, the Fund’s portfolio turnover rate may be higher. |
| 68 | The accompanying notes are an integral part of these financial statements. |
GOLDMAN SACHS FOCUSED VALUE FUND
Financial Highlights (continued)
Selected Data for a Share Outstanding Throughout Each Year
| Goldman Sachs Focused Value Fund | ||||||||||||||||||||||
| Class R Shares | ||||||||||||||||||||||
| Year Ended August 31, | ||||||||||||||||||||||
| 2022 | 2021 | 2020 | 2019 | 2018 | ||||||||||||||||||
| Per Share Data | ||||||||||||||||||||||
| Net asset value, beginning of year |
$ | 14.76 | $ | 11.20 | $ | 10.65 | $ | 11.07 | $ | 11.09 | ||||||||||||
| Net investment income(a) |
0.07 | 0.03 | 0.06 | 0.06 | 0.02 | |||||||||||||||||
| Net realized and unrealized gain (loss) |
(0.95 | ) | 3.74 | 0.61 | 0.09 | 0.87 | ||||||||||||||||
| Total from investment operations |
(0.88 | ) | 3.77 | 0.67 | 0.15 | 0.89 | ||||||||||||||||
| Distributions to shareholders from net investment income |
(0.04 | ) | (0.07 | ) | (0.01 | ) | (0.06 | ) | (0.05 | ) | ||||||||||||
| Distributions to shareholders from net realized gains |
(0.86 | ) | (0.14 | ) | (0.11 | ) | (0.51 | ) | (0.86 | ) | ||||||||||||
| Total distributions |
(0.90 | ) | (0.21 | ) | (0.12 | ) | (0.57 | ) | (0.91 | ) | ||||||||||||
| Net asset value, end of year |
$ | 12.98 | $ | 14.76 | $ | 11.20 | $ | 10.65 | $ | 11.07 | ||||||||||||
| Total Return(b) | (6.47 | )% | 34.04 | % | 6.27 | % | 1.91 | % | 8.35 | % | ||||||||||||
| Net assets, end of year (in 000’s) |
$ | 41 | $ | 43 | $ | 33 | $ | 31 | $ | 30 | ||||||||||||
| Ratio of net expenses to average net assets |
1.29 | % | 1.29 | % | 1.35 | % | 1.35 | % | 1.37 | % | ||||||||||||
| Ratio of total expenses to average net assets |
1.96 | % | 2.69 | % | 5.31 | % | 8.29 | % | 5.27 | % | ||||||||||||
| Ratio of net investment income to average net assets |
0.47 | % | 0.23 | % | 0.55 | % | 0.54 | % | 0.22 | % | ||||||||||||
| Portfolio turnover rate(c) |
78 | % | 78 | % | 102 | % | 122 | % | 204 | % | ||||||||||||
| (a) | Calculated based on the average shares outstanding methodology. |
| (b) | Assumes investment at the NAV at the beginning of the year, reinvestment of all dividends and distributions, a complete redemption of the investment at the NAV at the end of the year and no sales or redemption charges (if any). Total returns would be reduced if a sales or redemption charge was taken into account. Returns do not reflect the impact of taxes to shareholders relating to Fund distributions or the redemption of Fund shares. |
| (c) | The Fund’s portfolio turnover rate is calculated in accordance with regulatory requirements, without regard to transactions involving short term investments. If such transactions were included, the Fund’s portfolio turnover rate may be higher. |
| The accompanying notes are an integral part of these financial statements. | 69 |
GOLDMAN SACHS FOCUSED VALUE FUND
Financial Highlights (continued)
Selected Data for a Share Outstanding Throughout Each Period
| Goldman Sachs Focused Value Fund | ||||||||||||||||||||||
| Class P Shares | ||||||||||||||||||||||
| Year Ended August 31, | Period Ended August 31, 2018(a) |
|||||||||||||||||||||
| 2022 | 2021 | 2020 | 2019 | |||||||||||||||||||
| Per Share Data | ||||||||||||||||||||||
| Net asset value, beginning of period |
$ | 14.90 | $ | 11.28 | $ | 10.71 | $ | 11.15 | $ | 10.54 | ||||||||||||
| Net investment income(b) |
0.15 | 0.11 | 0.12 | 0.12 | 0.04 | |||||||||||||||||
| Net realized and unrealized gain (loss) |
(0.96 | ) | 3.76 | 0.63 | 0.08 | 0.57 | ||||||||||||||||
| Total from investment operations |
(0.81 | ) | 3.87 | 0.75 | 0.20 | 0.61 | ||||||||||||||||
| Distributions to shareholders from net investment income |
(0.12 | ) | (0.11 | ) | (0.07 | ) | (0.13 | ) | — | |||||||||||||
| Distributions to shareholders from net realized gains |
(0.86 | ) | (0.14 | ) | (0.11 | ) | (0.51 | ) | — | |||||||||||||
| Total distributions |
(0.98 | ) | (0.25 | ) | (0.18 | ) | (0.64 | ) | — | |||||||||||||
| Net asset value, end of period |
$ | 13.11 | $ | 14.90 | $ | 11.28 | $ | 10.71 | $ | 11.15 | ||||||||||||
| Total Return(c) | (5.96 | )% | 34.76 | % | 7.03 | % | 2.44 | % | 5.79 | % | ||||||||||||
| Net assets, end of period (in 000’s) |
$ | 40,108 | $ | 33,202 | $ | 8,657 | $ | 4,739 | $ | 5,652 | ||||||||||||
| Ratio of net expenses to average net assets |
0.72 | % | 0.72 | % | 0.74 | % | 0.72 | % | 0.72 | %(d) | ||||||||||||
| Ratio of total expenses to average net assets |
1.33 | % | 1.80 | % | 4.45 | % | 7.47 | % | 5.91 | %(d) | ||||||||||||
| Ratio of net investment income to average net assets |
1.04 | % | 0.82 | % | 1.16 | % | 1.16 | % | 0.89 | %(d) | ||||||||||||
| Portfolio turnover rate(e) |
78 | % | 78 | % | 102 | % | 122 | % | 204 | % | ||||||||||||
| (a) | Commenced operations on April 17, 2018. |
| (b) | Calculated based on the average shares outstanding methodology. |
| (c) | Assumes investment at the NAV at the beginning of the period, reinvestment of all dividends and distributions, a complete redemption of the investment at the NAV at the end of the period and no sales or redemption charges (if any). Total returns would be reduced if a sales or redemption charge was taken into account. Returns do not reflect the impact of taxes to shareholders relating to Fund distributions or the redemption of Fund shares. Total returns for periods less than one full year are not annualized. |
| (d) | Annualized. |
| (e) | The Fund’s portfolio turnover rate is calculated in accordance with regulatory requirements, without regard to transactions involving short term investments. If such transactions were included, the Fund’s portfolio turnover rate may be higher. |
| 70 | The accompanying notes are an integral part of these financial statements. |
GOLDMAN SACHS LARGE CAP VALUE FUND
Financial Highlights (continued)
Selected Data for a Share Outstanding Throughout Each Year
| (a) | Calculated based on the average shares outstanding methodology. |
| (b) | Assumes investment at the NAV at the beginning of the year, reinvestment of all dividends and distributions, a complete redemption of the investment at the NAV at the end of the year and no sales or redemption charges (if any). Total returns would be reduced if a sales or redemption charge was taken into account. Returns do not reflect the impact of taxes to shareholders relating to Fund distributions or the redemption of Fund shares. |
| (c) | The Fund’s portfolio turnover rate is calculated in accordance with regulatory requirements, without regard to transactions involving short term investments. If such transactions were included, the Fund’s portfolio turnover rate may be higher. |
| The accompanying notes are an integral part of these financial statements. | 71 |
GOLDMAN SACHS LARGE CAP VALUE FUND
Financial Highlights (continued)
Selected Data for a Share Outstanding Throughout Each Year
| Goldman Sachs Large Cap Value Fund | ||||||||||||||||||||||
| Class C Shares | ||||||||||||||||||||||
| Year Ended August 31, | ||||||||||||||||||||||
| 2022 | 2021 | 2020 | 2019 | 2018 | ||||||||||||||||||
| Per Share Data | ||||||||||||||||||||||
| Net asset value, beginning of year |
$ | 16.80 | $ | 13.12 | $ | 13.64 | $ | 15.32 | $ | 16.51 | ||||||||||||
| Net investment income(a) |
0.03 | — | 0.05 | 0.05 | 0.01 | |||||||||||||||||
| Net realized and unrealized gain (loss) |
(0.88 | ) | 4.06 | 0.17 | (0.22 | ) | 1.29 | |||||||||||||||
| Total from investment operations |
(0.85 | ) | 4.06 | 0.22 | (0.17 | ) | 1.30 | |||||||||||||||
| Distributions to shareholders from net investment income |
— | (0.05 | ) | (0.07 | ) | — | (0.13 | ) | ||||||||||||||
| Distributions to shareholders from net realized gains |
(1.91 | ) | (0.33 | ) | (0.67 | ) | (1.51 | ) | (2.36 | ) | ||||||||||||
| Total distributions |
(1.91 | ) | (0.38 | ) | (0.74 | ) | (1.51 | ) | (2.49 | ) | ||||||||||||
| Net asset value, end of year |
$ | 14.04 | $ | 16.80 | $ | 13.12 | $ | 13.64 | $ | 15.32 | ||||||||||||
| Total Return(b) | (5.87 | )% | 31.59 | % | 1.21 | % | (0.28 | )% | 8.46 | % | ||||||||||||
| Net assets, end of year (in 000’s) |
$ | 10,176 | $ | 12,948 | $ | 17,422 | $ | 21,481 | $ | 36,819 | ||||||||||||
| Ratio of net expenses to average net assets |
1.79 | % | 1.79 | % | 1.82 | % | 1.86 | % | 1.86 | % | ||||||||||||
| Ratio of total expenses to average net assets |
1.97 | % | 1.99 | % | 2.03 | % | 2.03 | % | 1.99 | % | ||||||||||||
| Ratio of net investment income to average net assets |
0.18 | % | 0.00 | % | 0.39 | % | 0.35 | % | 0.06 | % | ||||||||||||
| Portfolio turnover rate(c) |
46 | % | 53 | % | 64 | % | 62 | % | 171 | % | ||||||||||||
| (a) | Calculated based on the average shares outstanding methodology. |
| (b) | Assumes investment at the NAV at the beginning of the year, reinvestment of all dividends and distributions, a complete redemption of the investment at the NAV at the end of the year and no sales or redemption charges (if any). Total returns would be reduced if a sales or redemption charge was taken into account. Returns do not reflect the impact of taxes to shareholders relating to Fund distributions or the redemption of Fund shares. |
| (c) | The Fund’s portfolio turnover rate is calculated in accordance with regulatory requirements, without regard to transactions involving short term investments. If such transactions were included, the Fund’s portfolio turnover rate may be higher. |
| 72 | The accompanying notes are an integral part of these financial statements. |
GOLDMAN SACHS LARGE CAP VALUE FUND
Financial Highlights (continued)
Selected Data for a Share Outstanding Throughout Each Year
| Goldman Sachs Large Cap Value Fund | ||||||||||||||||||||||
| Institutional Shares | ||||||||||||||||||||||
| Year Ended August 31, | ||||||||||||||||||||||
| 2022 | 2021 | 2020 | 2019 | 2018 | ||||||||||||||||||
| Per Share Data | ||||||||||||||||||||||
| Net asset value, beginning of year |
$ | 18.08 | $ | 14.08 | $ | 14.58 | $ | 16.32 | $ | 17.42 | ||||||||||||
| Net investment income(a) |
0.21 | 0.17 | 0.20 | 0.21 | 0.19 | |||||||||||||||||
| Net realized and unrealized gain (loss) |
(0.96 | ) | 4.37 | 0.19 | (0.26 | ) | 1.36 | |||||||||||||||
| Total from investment operations |
(0.75 | ) | 4.54 | 0.39 | (0.05 | ) | 1.55 | |||||||||||||||
| Distributions to shareholders from net investment income |
(0.17 | ) | (0.21 | ) | (0.22 | ) | (0.18 | ) | (0.28 | ) | ||||||||||||
| Distributions to shareholders from net realized gains |
(1.91 | ) | (0.33 | ) | (0.67 | ) | (1.51 | ) | (2.37 | ) | ||||||||||||
| Total distributions |
(2.08 | ) | (0.54 | ) | (0.89 | ) | (1.69 | ) | (2.65 | ) | ||||||||||||
| Net asset value, end of year |
$ | 15.25 | $ | 18.08 | $ | 14.08 | $ | 14.58 | $ | 16.32 | ||||||||||||
| Total Return(b) | (4.88 | )% | 33.08 | % | 2.26 | % | 0.69 | % | 9.65 | % | ||||||||||||
| Net assets, end of year (in 000’s) |
$ | 155,700 | $ | 181,806 | $ | 140,814 | $ | 177,613 | $ | 174,803 | ||||||||||||
| Ratio of net expenses to average net assets |
0.73 | % | 0.73 | % | 0.76 | % | 0.79 | % | 0.79 | % | ||||||||||||
| Ratio of total expenses to average net assets |
0.85 | % | 0.87 | % | 0.90 | % | 0.89 | % | 0.85 | % | ||||||||||||
| Ratio of net investment income to average net assets |
1.24 | % | 1.04 | % | 1.43 | % | 1.42 | % | 1.13 | % | ||||||||||||
| Portfolio turnover rate(c) |
46 | % | 53 | % | 64 | % | 62 | % | 171 | % | ||||||||||||
| (a) | Calculated based on the average shares outstanding methodology. |
| (b) | Assumes investment at the NAV at the beginning of the year, reinvestment of all dividends and distributions, a complete redemption of the investment at the NAV at the end of the year and no sales or redemption charges (if any). Total returns would be reduced if a sales or redemption charge was taken into account. Returns do not reflect the impact of taxes to shareholders relating to Fund distributions or the redemption of Fund shares. |
| (c) | The Fund’s portfolio turnover rate is calculated in accordance with regulatory requirements, without regard to transactions involving short term investments. If such transactions were included, the Fund’s portfolio turnover rate may be higher. |
| The accompanying notes are an integral part of these financial statements. | 73 |
GOLDMAN SACHS LARGE CAP VALUE FUND
Financial Highlights (continued)
Selected Data for a Share Outstanding Throughout Each Year
| Goldman Sachs Large Cap Value Fund | ||||||||||||||||||||||
| Service Shares | ||||||||||||||||||||||
| Year Ended August 31, | ||||||||||||||||||||||
| 2022 | 2021 | 2020 | 2019 | 2018 | ||||||||||||||||||
| Per Share Data | ||||||||||||||||||||||
| Net asset value, beginning of year |
$ | 17.78 | $ | 13.86 | $ | 14.36 | $ | 16.03 | $ | 17.14 | ||||||||||||
| Net investment income(a) |
0.12 | 0.09 | 0.13 | 0.13 | 0.10 | |||||||||||||||||
| Net realized and unrealized gain (loss) |
(0.93 | ) | 4.29 | 0.19 | (0.24 | ) | 1.35 | |||||||||||||||
| Total from investment operations |
(0.81 | ) | 4.38 | 0.32 | (0.11 | ) | 1.45 | |||||||||||||||
| Distributions to shareholders from net investment income |
(0.09 | ) | (0.13 | ) | (0.15 | ) | (0.05 | ) | (0.20 | ) | ||||||||||||
| Distributions to shareholders from net realized gains |
(1.91 | ) | (0.33 | ) | (0.67 | ) | (1.51 | ) | (2.36 | ) | ||||||||||||
| Total distributions |
(2.00 | ) | (0.46 | ) | (0.82 | ) | (1.56 | ) | (2.56 | ) | ||||||||||||
| Net asset value, end of year |
$ | 14.97 | $ | 17.78 | $ | 13.86 | $ | 14.36 | $ | 16.03 | ||||||||||||
| Total Return(b) | (5.33 | )% | 32.36 | % | 1.80 | % | 0.20 | % | 9.15 | % | ||||||||||||
| Net assets, end of year (in 000’s) |
$ | 835 | $ | 846 | $ | 836 | $ | 1,004 | $ | 1,201 | ||||||||||||
| Ratio of net expenses to average net assets |
1.23 | % | 1.23 | % | 1.26 | % | 1.29 | % | 1.29 | % | ||||||||||||
| Ratio of total expenses to average net assets |
1.35 | % | 1.37 | % | 1.40 | % | 1.39 | % | 1.35 | % | ||||||||||||
| Ratio of net investment income to average net assets |
0.74 | % | 0.55 | % | 0.94 | % | 0.91 | % | 0.64 | % | ||||||||||||
| Portfolio turnover rate(c) |
46 | % | 53 | % | 64 | % | 62 | % | 171 | % | ||||||||||||
| (a) | Calculated based on the average shares outstanding methodology. |
| (b) | Assumes investment at the NAV at the beginning of the year, reinvestment of all dividends and distributions, a complete redemption of the investment at the NAV at the end of the year and no sales or redemption charges (if any). Total returns would be reduced if a sales or redemption charge was taken into account. Returns do not reflect the impact of taxes to shareholders relating to Fund distributions or the redemption of Fund shares. |
| (c) | The Fund’s portfolio turnover rate is calculated in accordance with regulatory requirements, without regard to transactions involving short term investments. If such transactions were included, the Fund’s portfolio turnover rate may be higher. |
| 74 | The accompanying notes are an integral part of these financial statements. |
GOLDMAN SACHS LARGE CAP VALUE FUND
Financial Highlights (continued)
Selected Data for a Share Outstanding Throughout Each Year
| Goldman Sachs Large Cap Value Fund | ||||||||||||||||||||||
| Investor Shares | ||||||||||||||||||||||
| Year Ended August 31, | ||||||||||||||||||||||
| 2022 | 2021 | 2020 | 2019 | 2018 | ||||||||||||||||||
| Per Share Data | ||||||||||||||||||||||
| Net asset value, beginning of year |
$ | 17.87 | $ | 13.93 | $ | 14.43 | $ | 16.17 | $ | 17.28 | ||||||||||||
| Net investment income(a) |
0.19 | 0.16 | 0.19 | 0.20 | 0.17 | |||||||||||||||||
| Net realized and unrealized gain (loss) |
(0.94 | ) | 4.31 | 0.19 | (0.26 | ) | 1.36 | |||||||||||||||
| Total from investment operations |
(0.75 | ) | 4.47 | 0.38 | (0.06 | ) | 1.53 | |||||||||||||||
| Distributions to shareholders from net investment income |
(0.16 | ) | (0.20 | ) | (0.21 | ) | (0.17 | ) | (0.27 | ) | ||||||||||||
| Distributions to shareholders from net realized gains |
(1.91 | ) | (0.33 | ) | (0.67 | ) | (1.51 | ) | (2.37 | ) | ||||||||||||
| Total distributions |
(2.07 | ) | (0.53 | ) | (0.88 | ) | (1.68 | ) | (2.64 | ) | ||||||||||||
| Net asset value, end of year |
$ | 15.05 | $ | 17.87 | $ | 13.93 | $ | 14.43 | $ | 16.17 | ||||||||||||
| Total Return(b) | (4.94 | )% | 32.92 | % | 2.22 | % | 0.64 | % | 9.61 | % | ||||||||||||
| Net assets, end of year (in 000’s) |
$ | 3,318 | $ | 3,559 | $ | 3,460 | $ | 4,191 | $ | 7,447 | ||||||||||||
| Ratio of net expenses to average net assets |
0.79 | % | 0.79 | % | 0.82 | % | 0.86 | % | 0.86 | % | ||||||||||||
| Ratio of total expenses to average net assets |
0.97 | % | 0.99 | % | 1.03 | % | 1.03 | % | 0.99 | % | ||||||||||||
| Ratio of net investment income to average net assets |
1.19 | % | 0.99 | % | 1.37 | % | 1.35 | % | 1.06 | % | ||||||||||||
| Portfolio turnover rate(c) |
46 | % | 53 | % | 64 | % | 62 | % | 171 | % | ||||||||||||
| (a) | Calculated based on the average shares outstanding methodology. |
| (b) | Assumes investment at the NAV at the beginning of the year, reinvestment of all dividends and distributions, a complete redemption of the investment at the NAV at the end of the year and no sales or redemption charges (if any). Total returns would be reduced if a sales or redemption charge was taken into account. Returns do not reflect the impact of taxes to shareholders relating to Fund distributions or the redemption of Fund shares. |
| (c) | The Fund’s portfolio turnover rate is calculated in accordance with regulatory requirements, without regard to transactions involving short term investments. If such transactions were included, the Fund’s portfolio turnover rate may be higher. |
| The accompanying notes are an integral part of these financial statements. | 75 |
GOLDMAN SACHS LARGE CAP VALUE FUND
Financial Highlights (continued)
Selected Data for a Share Outstanding Throughout Each Year
| Goldman Sachs Large Cap Value Fund | ||||||||||||||||||||||
| Class R6 Shares | ||||||||||||||||||||||
| Year Ended August 31, | ||||||||||||||||||||||
| 2022 | 2021 | 2020 | 2019 | 2018 | ||||||||||||||||||
| Per Share Data | ||||||||||||||||||||||
| Net asset value, beginning of year |
$ | 18.54 | $ | 14.43 | $ | 14.92 | $ | 16.66 | $ | 17.45 | ||||||||||||
| Net investment income(a) |
0.21 | 0.17 | 0.21 | 0.22 | 0.18 | |||||||||||||||||
| Net realized and unrealized gain (loss) |
(0.97 | ) | 4.48 | 0.19 | (0.26 | ) | 1.39 | |||||||||||||||
| Total from investment operations |
(0.76 | ) | 4.65 | 0.40 | (0.04 | ) | 1.57 | |||||||||||||||
| Distributions to shareholders from net investment income |
(0.18 | ) | (0.21 | ) | (0.22 | ) | (0.19 | ) | — | |||||||||||||
| Distributions to shareholders from net realized gains |
(1.91 | ) | (0.33 | ) | (0.67 | ) | (1.51 | ) | (2.36 | ) | ||||||||||||
| Total distributions |
(2.09 | ) | (0.54 | ) | (0.89 | ) | (1.70 | ) | (2.36 | ) | ||||||||||||
| Net asset value, end of year |
$ | 15.69 | $ | 18.54 | $ | 14.43 | $ | 14.92 | $ | 16.66 | ||||||||||||
| Total Return(b) | (4.86 | )% | 33.05 | % | 2.29 | % | 0.73 | % | 9.67 | % | ||||||||||||
| Net assets, end of year (in 000’s) |
$ | 2,245 | $ | 1,958 | $ | 1,636 | $ | 2,172 | $ | 1,106 | ||||||||||||
| Ratio of net expenses to average net assets |
0.72 | % | 0.72 | % | 0.75 | % | 0.78 | % | 0.78 | % | ||||||||||||
| Ratio of total expenses to average net assets |
0.84 | % | 0.86 | % | 0.89 | % | 0.89 | % | 0.85 | % | ||||||||||||
| Ratio of net investment income to average net assets |
1.26 | % | 1.06 | % | 1.43 | % | 1.44 | % | 1.12 | % | ||||||||||||
| Portfolio turnover rate(c) |
46 | % | 53 | % | 64 | % | 62 | % | 171 | % | ||||||||||||
| (a) | Calculated based on the average shares outstanding methodology. |
| (b) | Assumes investment at the NAV at the beginning of the year, reinvestment of all dividends and distributions, a complete redemption of the investment at the NAV at the end of the year and no sales or redemption charges (if any). Total returns would be reduced if a sales or redemption charge was taken into account. Returns do not reflect the impact of taxes to shareholders relating to Fund distributions or the redemption of Fund shares. |
| (c) | The Fund’s portfolio turnover rate is calculated in accordance with regulatory requirements, without regard to transactions involving short term investments. If such transactions were included, the Fund’s portfolio turnover rate may be higher. |
| 76 | The accompanying notes are an integral part of these financial statements. |
GOLDMAN SACHS LARGE CAP VALUE FUND
Financial Highlights (continued)
Selected Data for a Share Outstanding Throughout Each Year
| Goldman Sachs Large Cap Value Fund | ||||||||||||||||||||||
| Class R Shares | ||||||||||||||||||||||
| Year Ended August 31, | ||||||||||||||||||||||
| 2022 | 2021 | 2020 | 2019 | 2018 | ||||||||||||||||||
| Per Share Data | ||||||||||||||||||||||
| Net asset value, beginning of year |
$ | 17.27 | $ | 13.47 | $ | 13.97 | $ | 15.71 | $ | 16.86 | ||||||||||||
| Net investment income(a) |
0.11 | 0.07 | 0.12 | 0.12 | 0.09 | |||||||||||||||||
| Net realized and unrealized gain (loss) |
(0.91 | ) | 4.18 | 0.17 | (0.25 | ) | 1.32 | |||||||||||||||
| Total from investment operations |
(0.80 | ) | 4.25 | 0.29 | (0.13 | ) | 1.41 | |||||||||||||||
| Distributions to shareholders from net investment income |
(0.09 | ) | (0.12 | ) | (0.12 | ) | (0.10 | ) | (0.20 | ) | ||||||||||||
| Distributions to shareholders from net realized gains |
(1.91 | ) | (0.33 | ) | (0.67 | ) | (1.51 | ) | (2.36 | ) | ||||||||||||
| Total distributions |
(2.00 | ) | (0.45 | ) | (0.79 | ) | (1.61 | ) | (2.56 | ) | ||||||||||||
| Net asset value, end of year |
$ | 14.47 | $ | 17.27 | $ | 13.47 | $ | 13.97 | $ | 15.71 | ||||||||||||
| Total Return(b) | (5.46 | )% | 32.32 | % | 1.70 | % | 0.12 | % | 9.05 | % | ||||||||||||
| Net assets, end of year (in 000’s) |
$ | 3,437 | $ | 3,269 | $ | 2,932 | $ | 4,008 | $ | 5,252 | ||||||||||||
| Ratio of net expenses to average net assets |
1.29 | % | 1.29 | % | 1.32 | % | 1.36 | % | 1.36 | % | ||||||||||||
| Ratio of total expenses to average net assets |
1.47 | % | 1.49 | % | 1.53 | % | 1.53 | % | 1.49 | % | ||||||||||||
| Ratio of net investment income to average net assets |
0.69 | % | 0.49 | % | 0.89 | % | 0.85 | % | 0.56 | % | ||||||||||||
| Portfolio turnover rate(c) |
46 | % | 53 | % | 64 | % | 62 | % | 171 | % | ||||||||||||
| (a) | Calculated based on the average shares outstanding methodology. |
| (b) | Assumes investment at the NAV at the beginning of the year, reinvestment of all dividends and distributions, a complete redemption of the investment at the NAV at the end of the year and no sales or redemption charges (if any). Total returns would be reduced if a sales or redemption charge was taken into account. Returns do not reflect the impact of taxes to shareholders relating to Fund distributions or the redemption of Fund shares. |
| (c) | The Fund’s portfolio turnover rate is calculated in accordance with regulatory requirements, without regard to transactions involving short term investments. If such transactions were included, the Fund’s portfolio turnover rate may be higher. |
| The accompanying notes are an integral part of these financial statements. | 77 |
GOLDMAN SACHS LARGE CAP VALUE FUND
Financial Highlights (continued)
Selected Data for a Share Outstanding Throughout Each Period
| Goldman Sachs Large Cap Value Fund | ||||||||||||||||||||||
| Class P Shares | ||||||||||||||||||||||
| Year Ended August 31, | Period Ended August 31, 2018(a) |
|||||||||||||||||||||
| 2022 | 2021 | 2020 | 2019 | |||||||||||||||||||
| Per Share Data | ||||||||||||||||||||||
| Net asset value, beginning of period |
$ | 18.54 | $ | 14.43 | $ | 14.92 | $ | 16.66 | $ | 15.81 | ||||||||||||
| Net investment income(b) |
0.21 | 0.17 | 0.21 | 0.21 | 0.08 | |||||||||||||||||
| Net realized and unrealized gain (loss) |
(0.98 | ) | 4.48 | 0.19 | (0.25 | ) | 0.77 | |||||||||||||||
| Total from investment operations |
(0.77 | ) | 4.65 | 0.40 | (0.04 | ) | 0.85 | |||||||||||||||
| Distributions to shareholders from net investment income |
(0.18 | ) | (0.21 | ) | (0.22 | ) | (0.19 | ) | — | |||||||||||||
| Distributions to shareholders from net realized gains |
(1.91 | ) | (0.33 | ) | (0.67 | ) | (1.51 | ) | — | |||||||||||||
| Total distributions |
(2.09 | ) | (0.54 | ) | (0.89 | ) | (1.70 | ) | — | |||||||||||||
| Net asset value, end of period |
$ | 15.68 | $ | 18.54 | $ | 14.43 | $ | 14.92 | $ | 16.66 | ||||||||||||
| Total Return(c) | (4.92 | )% | 33.05 | % | 2.29 | % | 0.74 | % | 5.38 | % | ||||||||||||
| Net assets, end of period (in 000’s) |
$ | 197,335 | $ | 207,926 | $ | 154,720 | $ | 180,475 | $ | 248,012 | ||||||||||||
| Ratio of net expenses to average net assets |
0.72 | % | 0.72 | % | 0.75 | % | 0.78 | % | 0.78 | %(d) | ||||||||||||
| Ratio of total expenses to average net assets |
0.84 | % | 0.86 | % | 0.89 | % | 0.88 | % | 0.85 | %(d) | ||||||||||||
| Ratio of net investment income to average net assets |
1.26 | % | 1.05 | % | 1.45 | % | 1.43 | % | 1.26 | %(d) | ||||||||||||
| Portfolio turnover rate(e) |
46 | % | 53 | % | 64 | % | 62 | % | 171 | % | ||||||||||||
| (a) | Commenced operations on April 17, 2018. |
| (b) | Calculated based on the average shares outstanding methodology. |
| (c) | Assumes investment at the NAV at the beginning of the period, reinvestment of all dividends and distributions, a complete redemption of the investment at the NAV at the end of the period and no sales or redemption charges (if any). Total returns would be reduced if a sales or redemption charge was taken into account. Returns do not reflect the impact of taxes to shareholders relating to Fund distributions or the redemption of Fund shares. Total returns for periods less than one full year are not annualized. |
| (d) | Annualized. |
| (e) | The Fund’s portfolio turnover rate is calculated in accordance with regulatory requirements, without regard to transactions involving short term investments. If such transactions were included, the Fund’s portfolio turnover rate may be higher. |
| 78 | The accompanying notes are an integral part of these financial statements. |
GOLDMAN SACHS MID CAP VALUE FUND
Financial Highlights (continued)
Selected Data for a Share Outstanding Throughout Each Year
| (a) | Calculated based on the average shares outstanding methodology. |
| (b) | Assumes investment at the NAV at the beginning of the year, reinvestment of all dividends and distributions, a complete redemption of the investment at the NAV at the end of the year and no sales or redemption charges (if any). Total returns would be reduced if a sales or redemption charge was taken into account. Returns do not reflect the impact of taxes to shareholders relating to Fund distributions or the redemption of Fund shares. |
| (c) | The Fund’s portfolio turnover rate is calculated in accordance with regulatory requirements, without regard to transactions involving short term investments. If such transactions were included, the Fund’s portfolio turnover rate may be higher. |
| The accompanying notes are an integral part of these financial statements. | 79 |
GOLDMAN SACHS MID CAP VALUE FUND
Financial Highlights (continued)
Selected Data for a Share Outstanding Throughout Each Year
| Goldman Sachs Mid Cap Value Fund | ||||||||||||||||||||||
| Class C Shares | ||||||||||||||||||||||
| Year Ended August 31, | ||||||||||||||||||||||
| 2022 | 2021 | 2020 | 2019 | 2018 | ||||||||||||||||||
| Per Share Data | ||||||||||||||||||||||
| Net asset value, beginning of year |
$ | 38.53 | $ | 27.00 | $ | 28.10 | $ | 32.59 | $ | 34.68 | ||||||||||||
| Net investment loss(a) |
(0.14 | ) | (0.24 | ) | (0.02 | ) | (0.07 | ) | (0.17 | ) | ||||||||||||
| Net realized and unrealized gain (loss) |
(1.30 | ) | 11.77 | (0.24 | ) | 0.29 | 3.33 | |||||||||||||||
| Total from investment operations |
(1.44 | ) | 11.53 | (0.26 | ) | 0.22 | 3.16 | |||||||||||||||
| Distributions to shareholders from net realized gains |
(6.83 | ) | — | (0.81 | ) | (4.71 | ) | (5.25 | ) | |||||||||||||
| Distributions to shareholders from return of capital |
— | — | (0.03 | ) | — | — | ||||||||||||||||
| Total distributions |
(6.83 | ) | — | (0.84 | ) | (4.71 | ) | (5.25 | ) | |||||||||||||
| Net asset value, end of year |
$ | 30.26 | $ | 38.53 | $ | 27.00 | $ | 28.10 | $ | 32.59 | ||||||||||||
| Total Return(b) | (5.20 | )% | 42.70 | % | (1.14 | )% | 2.58 | % | 9.86 | % | ||||||||||||
| Net assets, end of year (in 000’s) |
$ | 9,337 | $ | 12,836 | $ | 16,230 | $ | 28,175 | $ | 78,897 | ||||||||||||
| Ratio of net expenses to average net assets |
1.95 | % | 1.96 | % | 1.99 | % | 1.98 | % | 1.97 | % | ||||||||||||
| Ratio of total expenses to average net assets |
1.96 | % | 1.96 | % | 1.99 | % | 1.98 | % | 1.97 | % | ||||||||||||
| Ratio of net investment loss to average net assets |
(0.42 | )% | (0.73 | )% | (0.07 | )% | (0.24 | )% | (0.53 | )% | ||||||||||||
| Portfolio turnover rate(c) |
69 | % | 66 | % | 87 | % | 82 | % | 137 | % | ||||||||||||
| (a) | Calculated based on the average shares outstanding methodology. |
| (b) | Assumes investment at the NAV at the beginning of the year, reinvestment of all dividends and distributions, a complete redemption of the investment at the NAV at the end of the year and no sales or redemption charges (if any). Total returns would be reduced if a sales or redemption charge was taken into account. Returns do not reflect the impact of taxes to shareholders relating to Fund distributions or the redemption of Fund shares. |
| (c) | The Fund’s portfolio turnover rate is calculated in accordance with regulatory requirements, without regard to transactions involving short term investments. If such transactions were included, the Fund’s portfolio turnover rate may be higher. |
| 80 | The accompanying notes are an integral part of these financial statements. |
GOLDMAN SACHS MID CAP VALUE FUND
Financial Highlights (continued)
Selected Data for a Share Outstanding Throughout Each Year
| Goldman Sachs Mid Cap Value Fund | ||||||||||||||||||||||
| Institutional Shares | ||||||||||||||||||||||
| Year Ended August 31, | ||||||||||||||||||||||
| 2022 | 2021 | 2020 | 2019 | 2018 | ||||||||||||||||||
| Per Share Data | ||||||||||||||||||||||
| Net asset value, beginning of year |
$ | 45.34 | $ | 31.65 | $ | 32.76 | $ | 37.06 | $ | 38.68 | ||||||||||||
| Net investment income(a) |
0.28 | 0.15 | 0.26 | 0.29 | 0.21 | |||||||||||||||||
| Net realized and unrealized gain (loss) |
(1.62 | ) | 13.80 | (0.19 | ) | 0.39 | 3.77 | |||||||||||||||
| Total from investment operations |
(1.34 | ) | 13.95 | 0.07 | 0.68 | 3.98 | ||||||||||||||||
| Distributions to shareholders from net investment income |
(0.25 | ) | (0.26 | ) | (0.30 | ) | (0.27 | ) | (0.26 | ) | ||||||||||||
| Distributions to shareholders from net realized gains |
(6.83 | ) | — | (0.84 | ) | (4.71 | ) | (5.34 | ) | |||||||||||||
| Distributions to shareholders from return of capital |
— | — | (0.04 | ) | — | — | ||||||||||||||||
| Total distributions |
(7.08 | ) | (0.26 | ) | (1.18 | ) | (4.98 | ) | (5.60 | ) | ||||||||||||
| Net asset value, end of year |
$ | 36.92 | $ | 45.34 | $ | 31.65 | $ | 32.76 | $ | 37.06 | ||||||||||||
| Total Return(b) | (4.12 | )% | 44.27 | % | (0.03 | )% | 3.78 | % | 11.13 | % | ||||||||||||
| Net assets, end of year (in 000’s) |
$ | 298,877 | $ | 331,383 | $ | 271,283 | $ | 346,004 | $ | 555,930 | ||||||||||||
| Ratio of net expenses to average net assets |
0.83 | % | 0.84 | % | 0.86 | % | 0.84 | % | 0.83 | % | ||||||||||||
| Ratio of total expenses to average net assets |
0.84 | % | 0.84 | % | 0.86 | % | 0.84 | % | 0.83 | % | ||||||||||||
| Ratio of net investment income to average net assets |
0.71 | % | 0.38 | % | 0.82 | % | 0.89 | % | 0.58 | % | ||||||||||||
| Portfolio turnover rate(c) |
69 | % | 66 | % | 87 | % | 82 | % | 137 | % | ||||||||||||
| (a) | Calculated based on the average shares outstanding methodology. |
| (b) | Assumes investment at the NAV at the beginning of the year, reinvestment of all dividends and distributions, a complete redemption of the investment at the NAV at the end of the year and no sales or redemption charges (if any). Total returns would be reduced if a sales or redemption charge was taken into account. Returns do not reflect the impact of taxes to shareholders relating to Fund distributions or the redemption of Fund shares. |
| (c) | The Fund’s portfolio turnover rate is calculated in accordance with regulatory requirements, without regard to transactions involving short term investments. If such transactions were included, the Fund’s portfolio turnover rate may be higher. |
| The accompanying notes are an integral part of these financial statements. | 81 |
GOLDMAN SACHS MID CAP VALUE FUND
Financial Highlights (continued)
Selected Data for a Share Outstanding Throughout Each Year
| Goldman Sachs Mid Cap Value Fund | ||||||||||||||||||||||
| Service Shares | ||||||||||||||||||||||
| Year Ended August 31, | ||||||||||||||||||||||
| 2022 | 2021 | 2020 | 2019 | 2018 | ||||||||||||||||||
| Per Share Data | ||||||||||||||||||||||
| Net asset value, beginning of year |
$ | 43.69 | $ | 30.50 | $ | 31.58 | $ | 35.89 | $ | 37.61 | ||||||||||||
| Net investment income (loss)(a) |
0.08 | (0.04 | ) | 0.13 | 0.12 | 0.04 | ||||||||||||||||
| Net realized and unrealized gain (loss) |
(1.55 | ) | 13.31 | (0.23 | ) | 0.38 | 3.65 | |||||||||||||||
| Total from investment operations |
(1.47 | ) | 13.27 | (0.10 | ) | 0.50 | 3.69 | |||||||||||||||
| Distributions to shareholders from net investment income |
(0.07 | ) | (0.08 | ) | (0.11 | ) | (0.10 | ) | (0.12 | ) | ||||||||||||
| Distributions to shareholders from net realized gains |
(6.83 | ) | — | (0.84 | ) | (4.71 | ) | (5.29 | ) | |||||||||||||
| Distributions to shareholders from return of capital |
— | — | (0.03 | ) | — | — | ||||||||||||||||
| Total distributions |
(6.90 | ) | (0.08 | ) | (0.98 | ) | (4.81 | ) | (5.41 | ) | ||||||||||||
| Net asset value, end of year |
$ | 35.32 | $ | 43.69 | $ | 30.50 | $ | 31.58 | $ | 35.89 | ||||||||||||
| Total Return(b) | (4.60 | )% | 43.57 | % | (0.52 | )% | 3.25 | % | 10.58 | % | ||||||||||||
| Net assets, end of year (in 000’s) |
$ | 34,533 | $ | 34,851 | $ | 30,424 | $ | 47,597 | $ | 65,727 | ||||||||||||
| Ratio of net expenses to average net assets |
1.33 | % | 1.34 | % | 1.36 | % | 1.34 | % | 1.33 | % | ||||||||||||
| Ratio of total expenses to average net assets |
1.34 | % | 1.34 | % | 1.36 | % | 1.34 | % | 1.33 | % | ||||||||||||
| Ratio of net investment income (loss) to average net assets |
0.20 | % | (0.12 | )% | 0.43 | % | 0.38 | % | 0.11 | % | ||||||||||||
| Portfolio turnover rate(c) |
69 | % | 66 | % | 87 | % | 82 | % | 137 | % | ||||||||||||
| (a) | Calculated based on the average shares outstanding methodology. |
| (b) | Assumes investment at the NAV at the beginning of the year, reinvestment of all dividends and distributions, a complete redemption of the investment at the NAV at the end of the year and no sales or redemption charges (if any). Total returns would be reduced if a sales or redemption charge was taken into account. Returns do not reflect the impact of taxes to shareholders relating to Fund distributions or the redemption of Fund shares. |
| (c) | The Fund’s portfolio turnover rate is calculated in accordance with regulatory requirements, without regard to transactions involving short term investments. If such transactions were included, the Fund’s portfolio turnover rate may be higher. |
| 82 | The accompanying notes are an integral part of these financial statements. |
GOLDMAN SACHS MID CAP VALUE FUND
Financial Highlights (continued)
Selected Data for a Share Outstanding Throughout Each Year
| Goldman Sachs Mid Cap Value Fund | ||||||||||||||||||||||
| Investor Shares | ||||||||||||||||||||||
| Year Ended August 31, | ||||||||||||||||||||||
| 2022 | 2021 | 2020 | 2019 | 2018 | ||||||||||||||||||
| Per Share Data | ||||||||||||||||||||||
| Net asset value, beginning of year |
$ | 43.60 | $ | 30.44 | $ | 31.55 | $ | 35.89 | $ | 37.57 | ||||||||||||
| Net investment income(a) |
0.25 | 0.10 | 0.22 | 0.23 | 0.17 | |||||||||||||||||
| Net realized and unrealized gain (loss) |
(1.55 | ) | 13.28 | (0.19 | ) | 0.37 | 3.63 | |||||||||||||||
| Total from investment operations |
(1.30 | ) | 13.38 | 0.03 | 0.60 | 3.80 | ||||||||||||||||
| Distributions to shareholders from net investment income |
(0.21 | ) | (0.22 | ) | (0.26 | ) | (0.23 | ) | (0.18 | ) | ||||||||||||
| Distributions to shareholders from net realized gains |
(6.83 | ) | — | (0.84 | ) | (4.71 | ) | (5.30 | ) | |||||||||||||
| Distributions to shareholders from return of capital |
— | — | (0.04 | ) | — | — | ||||||||||||||||
| Total distributions |
(7.04 | ) | (0.22 | ) | (1.14 | ) | (4.94 | ) | (5.48 | ) | ||||||||||||
| Net asset value, end of year |
$ | 35.26 | $ | 43.60 | $ | 30.44 | $ | 31.55 | $ | 35.89 | ||||||||||||
| Total Return(b) | (4.21 | )% | 44.11 | % | (0.16 | )% | 3.63 | % | 10.98 | % | ||||||||||||
| Net assets, end of year (in 000’s) |
$ | 68,948 | $ | 42,206 | $ | 33,249 | $ | 41,809 | $ | 51,375 | ||||||||||||
| Ratio of net expenses to average net assets |
0.95 | % | 0.96 | % | 0.99 | % | 0.97 | % | 0.97 | % | ||||||||||||
| Ratio of total expenses to average net assets |
0.96 | % | 0.96 | % | 0.99 | % | 0.98 | % | 0.97 | % | ||||||||||||
| Ratio of net investment income to average net assets |
0.65 | % | 0.26 | % | 0.72 | % | 0.74 | % | 0.47 | % | ||||||||||||
| Portfolio turnover rate(c) |
69 | % | 66 | % | 87 | % | 82 | % | 137 | % | ||||||||||||
| (a) | Calculated based on the average shares outstanding methodology. |
| (b) | Assumes investment at the NAV at the beginning of the year, reinvestment of all dividends and distributions, a complete redemption of the investment at the NAV at the end of the year and no sales or redemption charges (if any). Total returns would be reduced if a sales or redemption charge was taken into account. Returns do not reflect the impact of taxes to shareholders relating to Fund distributions or the redemption of Fund shares. |
| (c) | The Fund’s portfolio turnover rate is calculated in accordance with regulatory requirements, without regard to transactions involving short term investments. If such transactions were included, the Fund’s portfolio turnover rate may be higher. |
| The accompanying notes are an integral part of these financial statements. | 83 |
GOLDMAN SACHS MID CAP VALUE FUND
Financial Highlights (continued)
Selected Data for a Share Outstanding Throughout Each Year
| Goldman Sachs Mid Cap Value Fund | ||||||||||||||||||||||
| Class R6 Shares | ||||||||||||||||||||||
| Year Ended August 31, | ||||||||||||||||||||||
| 2022 | 2021 | 2020 | 2019 | 2018 | ||||||||||||||||||
| Per Share Data | ||||||||||||||||||||||
| Net asset value, beginning of year |
$ | 45.31 | $ | 31.62 | $ | 32.74 | $ | 37.04 | $ | 38.66 | ||||||||||||
| Net investment income(a) |
0.29 | 0.15 | 0.25 | 0.27 | 0.22 | |||||||||||||||||
| Net realized and unrealized gain (loss) |
(1.61 | ) | 13.80 | (0.18 | ) | 0.41 | 3.76 | |||||||||||||||
| Total from investment operations |
(1.32 | ) | 13.95 | 0.07 | 0.68 | 3.98 | ||||||||||||||||
| Distributions to shareholders from net investment income |
(0.26 | ) | (0.26 | ) | (0.27 | ) | (0.27 | ) | (0.27 | ) | ||||||||||||
| Distributions to shareholders from net realized gains |
(6.83 | ) | — | (0.84 | ) | (4.71 | ) | (5.33 | ) | |||||||||||||
| Distributions to shareholders from return of capital |
— | — | (0.08 | ) | — | — | ||||||||||||||||
| Total distributions |
(7.09 | ) | (0.26 | ) | (1.19 | ) | (4.98 | ) | (5.60 | ) | ||||||||||||
| Net asset value, end of year |
$ | 36.90 | $ | 45.31 | $ | 31.62 | $ | 32.74 | $ | 37.04 | ||||||||||||
| Total Return(b) | (4.09 | )% | 44.33 | % | (0.05 | )% | 3.79 | % | 11.10 | % | ||||||||||||
| Net assets, end of year (in 000’s) |
$ | 83,400 | $ | 80,114 | $ | 54,633 | $ | 50,538 | $ | 39,520 | ||||||||||||
| Ratio of net expenses to average net assets |
0.82 | % | 0.83 | % | 0.85 | % | 0.82 | % | 0.82 | % | ||||||||||||
| Ratio of total expenses to average net assets |
0.83 | % | 0.83 | % | 0.85 | % | 0.83 | % | 0.82 | % | ||||||||||||
| Ratio of net investment income to average net assets |
0.72 | % | 0.39 | % | 0.82 | % | 0.85 | % | 0.60 | % | ||||||||||||
| Portfolio turnover rate(c) |
69 | % | 66 | % | 87 | % | 82 | % | 137 | % | ||||||||||||
| (a) | Calculated based on the average shares outstanding methodology. |
| (b) | Assumes investment at the NAV at the beginning of the year, reinvestment of all dividends and distributions, a complete redemption of the investment at the NAV at the end of the year and no sales or redemption charges (if any). Total returns would be reduced if a sales or redemption charge was taken into account. Returns do not reflect the impact of taxes to shareholders relating to Fund distributions or the redemption of Fund shares. |
| (c) | The Fund’s portfolio turnover rate is calculated in accordance with regulatory requirements, without regard to transactions involving short term investments. If such transactions were included, the Fund’s portfolio turnover rate may be higher. |
| 84 | The accompanying notes are an integral part of these financial statements. |
GOLDMAN SACHS MID CAP VALUE FUND
Financial Highlights (continued)
Selected Data for a Share Outstanding Throughout Each Year
| Goldman Sachs Mid Cap Value Fund | ||||||||||||||||||||||
| Class R Shares | ||||||||||||||||||||||
| Year Ended August 31, | ||||||||||||||||||||||
| 2022 | 2021 | 2020 | 2019 | 2018 | ||||||||||||||||||
| Per Share Data | ||||||||||||||||||||||
| Net asset value, beginning of year |
$ | 43.09 | $ | 30.09 | $ | 31.20 | $ | 35.52 | $ | 37.28 | ||||||||||||
| Net investment income (loss)(a) |
0.04 | (0.09 | ) | 0.10 | 0.08 | (0.01 | ) | |||||||||||||||
| Net realized and unrealized gain (loss) |
(1.52 | ) | 13.14 | (0.24 | ) | 0.37 | 3.61 | |||||||||||||||
| Total from investment operations |
(1.48 | ) | 13.05 | (0.14 | ) | 0.45 | 3.60 | |||||||||||||||
| Distributions to shareholders from net investment income |
(0.02 | ) | (0.05 | ) | (0.10 | ) | (0.06 | ) | (0.09 | ) | ||||||||||||
| Distributions to shareholders from net realized gains |
(6.83 | ) | — | (0.84 | ) | (4.71 | ) | (5.27 | ) | |||||||||||||
| Distributions to shareholders from return of capital |
— | — | (0.03 | ) | — | — | ||||||||||||||||
| Total distributions |
(6.85 | ) | (0.05 | ) | (0.97 | ) | (4.77 | ) | (5.36 | ) | ||||||||||||
| Net asset value, end of year |
$ | 34.76 | $ | 43.09 | $ | 30.09 | $ | 31.20 | $ | 35.52 | ||||||||||||
| Total Return(b) | (4.68 | )% | 43.41 | % | (0.65 | )% | 3.10 | % | 10.43 | % | ||||||||||||
| Net assets, end of year (in 000’s) |
$ | 18,760 | $ | 21,249 | $ | 17,015 | $ | 21,916 | $ | 28,103 | ||||||||||||
| Ratio of net expenses to average net assets |
1.45 | % | 1.46 | % | 1.49 | % | 1.47 | % | 1.47 | % | ||||||||||||
| Ratio of total expenses to average net assets |
1.46 | % | 1.46 | % | 1.49 | % | 1.48 | % | 1.47 | % | ||||||||||||
| Ratio of net investment income (loss) to average net assets |
0.09 | % | (0.23 | )% | 0.32 | % | 0.25 | % | (0.03 | )% | ||||||||||||
| Portfolio turnover rate(c) |
69 | % | 66 | % | 87 | % | 82 | % | 137 | % | ||||||||||||
| (a) | Calculated based on the average shares outstanding methodology. |
| (b) | Assumes investment at the NAV at the beginning of the year, reinvestment of all dividends and distributions, a complete redemption of the investment at the NAV at the end of the year and no sales or redemption charges (if any). Total returns would be reduced if a sales or redemption charge was taken into account. Returns do not reflect the impact of taxes to shareholders relating to Fund distributions or the redemption of Fund shares. |
| (c) | The Fund’s portfolio turnover rate is calculated in accordance with regulatory requirements, without regard to transactions involving short term investments. If such transactions were included, the Fund’s portfolio turnover rate may be higher. |
| The accompanying notes are an integral part of these financial statements. | 85 |
GOLDMAN SACHS MID CAP VALUE FUND
Financial Highlights (continued)
Selected Data for a Share Outstanding Throughout Each Period
| Goldman Sachs Mid Cap Value Fund | ||||||||||||||||||||||
| Class P Shares | ||||||||||||||||||||||
| Year Ended August 31, | Period Ended August 31, 2018(a) |
|||||||||||||||||||||
| 2022 | 2021 | 2020 | 2019 | |||||||||||||||||||
| Per Share Data | ||||||||||||||||||||||
| Net asset value, beginning of period |
$ | 45.30 | $ | 31.62 | $ | 32.73 | $ | 37.04 | $ | 35.64 | ||||||||||||
| Net investment income(b) |
0.29 | 0.15 | 0.26 | 0.29 | 0.13 | |||||||||||||||||
| Net realized and unrealized gain (loss) |
(1.61 | ) | 13.79 | (0.19 | ) | 0.39 | 1.27 | |||||||||||||||
| Total from investment operations |
(1.32 | ) | 13.94 | 0.07 | 0.68 | 1.40 | ||||||||||||||||
| Distributions to shareholders from net investment income |
(0.26 | ) | (0.26 | ) | (0.33 | ) | (0.28 | ) | — | |||||||||||||
| Distributions to shareholders from net realized gains |
(6.83 | ) | — | (0.84 | ) | (4.71 | ) | — | ||||||||||||||
| Distributions to shareholders from return of capital |
— | — | (0.01 | ) | — | — | ||||||||||||||||
| Total distributions |
(7.09 | ) | (0.26 | ) | (1.18 | ) | (4.99 | ) | — | |||||||||||||
| Net asset value, end of period |
$ | 36.89 | $ | 45.30 | $ | 31.62 | $ | 32.73 | $ | 37.04 | ||||||||||||
| Total Return(c) | (4.09 | )% | 44.30 | % | (0.02 | )% | 3.80 | % | 3.93 | % | ||||||||||||
| Net assets, end of period (in 000’s) |
$ | 176,827 | $ | 191,790 | $ | 129,680 | $ | 141,460 | $ | 172,003 | ||||||||||||
| Ratio of net expenses to average net assets |
0.82 | % | 0.83 | % | 0.85 | % | 0.83 | % | 0.86 | %(d) | ||||||||||||
| Ratio of total expenses to average net assets |
0.83 | % | 0.83 | % | 0.85 | % | 0.83 | % | 0.86 | %(d) | ||||||||||||
| Ratio of net investment income to average net assets |
0.71 | % | 0.39 | % | 0.82 | % | 0.89 | % | 0.94 | %(d) | ||||||||||||
| Portfolio turnover rate(e) |
69 | % | 66 | % | 87 | % | 82 | % | 137 | % | ||||||||||||
| (a) | Commenced operations on April 17, 2018. |
| (b) | Calculated based on the average shares outstanding methodology. |
| (c) | Assumes investment at the NAV at the beginning of the period, reinvestment of all dividends and distributions, a complete redemption of the investment at the NAV at the end of the period and no sales or redemption charges (if any). Total returns would be reduced if a sales or redemption charge was taken into account. Returns do not reflect the impact of taxes to shareholders relating to Fund distributions or the redemption of Fund shares. Total returns for periods less than one full year are not annualized. |
| (d) | Annualized. |
| (e) | The Fund’s portfolio turnover rate is calculated in accordance with regulatory requirements, without regard to transactions involving short term investments. If such transactions were included, the Fund’s portfolio turnover rate may be higher. |
| 86 | The accompanying notes are an integral part of these financial statements. |
GOLDMAN SACHS SMALL CAP VALUE FUND
Financial Highlights (continued)
Selected Data for a Share Outstanding Throughout Each Year
| (a) | Calculated based on the average shares outstanding methodology. |
| (b) | Assumes investment at the NAV at the beginning of the year, reinvestment of all dividends and distributions, a complete redemption of the investment at the NAV at the end of the year and no sales or redemption charges (if any). Total returns would be reduced if a sales or redemption charge was taken into account. Returns do not reflect the impact of taxes to shareholders relating to Fund distributions or the redemption of Fund shares. |
| (c) | The Fund’s portfolio turnover rate is calculated in accordance with regulatory requirements, without regard to transactions involving short term investments. If such transactions were included, the Fund’s portfolio turnover rate may be higher. |
| The accompanying notes are an integral part of these financial statements. | 87 |
GOLDMAN SACHS SMALL CAP VALUE FUND
Financial Highlights (continued)
Selected Data for a Share Outstanding Throughout Each Year
| Goldman Sachs Small Cap Value Fund | ||||||||||||||||||||||
| Class C Shares | ||||||||||||||||||||||
| Year Ended August 31, | ||||||||||||||||||||||
| 2022 | 2021 | 2020 | 2019 | 2018 | ||||||||||||||||||
| Per Share Data | ||||||||||||||||||||||
| Net asset value, beginning of year |
$ | 42.63 | $ | 28.68 | $ | 33.97 | $ | 45.37 | $ | 44.50 | ||||||||||||
| Net investment loss(a) |
(0.18 | ) | (0.33 | ) | (0.02 | ) | (0.13 | ) | (0.31 | ) | ||||||||||||
| Net realized and unrealized gain (loss) |
(2.73 | ) | 14.28 | (3.21 | ) | (5.43 | ) | 7.49 | ||||||||||||||
| Total from investment operations |
(2.91 | ) | 13.95 | (3.23 | ) | (5.56 | ) | 7.18 | ||||||||||||||
| Distributions to shareholders from net realized gains |
(11.85 | ) | — | (2.06 | ) | (5.84 | ) | (6.31 | ) | |||||||||||||
| Net asset value, end of year |
$ | 27.87 | $ | 42.63 | $ | 28.68 | $ | 33.97 | $ | 45.37 | ||||||||||||
| Total Return(b) | (10.00 | )% | 48.69 | % | (10.61 | )% | (11.83 | )% | 17.26 | % | ||||||||||||
| Net assets, end of year (in 000’s) |
$ | 1,788 | $ | 2,204 | $ | 3,220 | $ | 8,867 | $ | 37,157 | ||||||||||||
| Ratio of net expenses to average net assets |
2.04 | % | 2.05 | % | 2.09 | % | 2.09 | % | 2.08 | % | ||||||||||||
| Ratio of total expenses to average net assets |
2.11 | % | 2.11 | % | 2.12 | % | 2.11 | % | 2.11 | % | ||||||||||||
| Ratio of net investment loss to average net assets |
(0.54 | )% | (0.89 | )% | (0.05 | )% | (0.36 | )% | (0.69 | )% | ||||||||||||
| Portfolio turnover rate(c) |
65 | % | 64 | % | 75 | % | 47 | % | 55 | % | ||||||||||||
| (a) | Calculated based on the average shares outstanding methodology. |
| (b) | Assumes investment at the NAV at the beginning of the year, reinvestment of all dividends and distributions, a complete redemption of the investment at the NAV at the end of the year and no sales or redemption charges (if any). Total returns would be reduced if a sales or redemption charge was taken into account. Returns do not reflect the impact of taxes to shareholders relating to Fund distributions or the redemption of Fund shares. |
| (c) | The Fund’s portfolio turnover rate is calculated in accordance with regulatory requirements, without regard to transactions involving short term investments. If such transactions were included, the Fund’s portfolio turnover rate may be higher. |
| 88 | The accompanying notes are an integral part of these financial statements. |
GOLDMAN SACHS SMALL CAP VALUE FUND
Financial Highlights (continued)
Selected Data for a Share Outstanding Throughout Each Year
| Goldman Sachs Small Cap Value Fund | ||||||||||||||||||||||
| Institutional Shares | ||||||||||||||||||||||
| Year Ended August 31, | ||||||||||||||||||||||
| 2022 | 2021 | 2020 | 2019 | 2018 | ||||||||||||||||||
| Per Share Data | ||||||||||||||||||||||
| Net asset value, beginning of year |
$ | 66.58 | $ | 44.52 | $ | 51.56 | $ | 64.90 | $ | 60.78 | ||||||||||||
| Net investment income(a) |
0.30 | 0.11 | 0.35 | 0.43 | 0.28 | |||||||||||||||||
| Net realized and unrealized gain (loss) |
(5.02 | ) | 22.22 | (4.87 | ) | (7.71 | ) | 10.46 | ||||||||||||||
| Total from investment operations |
(4.72 | ) | 22.33 | (4.52 | ) | (7.28 | ) | 10.74 | ||||||||||||||
| Distributions to shareholders from net investment income |
(0.19 | ) | (0.27 | ) | (0.46 | ) | (0.22 | ) | (0.31 | ) | ||||||||||||
| Distributions to shareholders from net realized gains |
(11.85 | ) | — | (2.06 | ) | (5.84 | ) | (6.31 | ) | |||||||||||||
| Total distributions |
(12.04 | ) | (0.27 | ) | (2.52 | ) | (6.06 | ) | (6.62 | ) | ||||||||||||
| Net asset value, end of year |
$ | 49.82 | $ | 66.58 | $ | 44.52 | $ | 51.56 | $ | 64.90 | ||||||||||||
| Total Return(b) | (9.02 | )% | 50.29 | % | (9.60 | )% | (10.81 | )% | 18.62 | % | ||||||||||||
| Net assets, end of year (in 000’s) |
$ | 1,446,222 | $ | 2,331,482 | $ | 2,454,781 | $ | 3,114,853 | $ | 4,304,041 | ||||||||||||
| Ratio of net expenses to average net assets |
0.97 | % | 0.96 | % | 0.96 | % | 0.95 | % | 0.94 | % | ||||||||||||
| Ratio of total expenses to average net assets |
0.99 | % | 0.99 | % | 0.99 | % | 0.97 | % | 0.97 | % | ||||||||||||
| Ratio of net investment income to average net assets |
0.51 | % | 0.19 | % | 0.74 | % | 0.78 | % | 0.45 | % | ||||||||||||
| Portfolio turnover rate(c) |
65 | % | 64 | % | 75 | % | 47 | % | 55 | % | ||||||||||||
| (a) | Calculated based on the average shares outstanding methodology. |
| (b) | Assumes investment at the NAV at the beginning of the year, reinvestment of all dividends and distributions, a complete redemption of the investment at the NAV at the end of the year and no sales or redemption charges (if any). Total returns would be reduced if a sales or redemption charge was taken into account. Returns do not reflect the impact of taxes to shareholders relating to Fund distributions or the redemption of Fund shares. |
| (c) | The Fund’s portfolio turnover rate is calculated in accordance with regulatory requirements, without regard to transactions involving short term investments. If such transactions were included, the Fund’s portfolio turnover rate may be higher. |
| The accompanying notes are an integral part of these financial statements. | 89 |
GOLDMAN SACHS SMALL CAP VALUE FUND
Financial Highlights (continued)
Selected Data for a Share Outstanding Throughout Each Year
| Goldman Sachs Small Cap Value Fund | ||||||||||||||||||||||
| Service Shares | ||||||||||||||||||||||
| Year Ended August 31, | ||||||||||||||||||||||
| 2022 | 2021 | 2020 | 2019 | 2018 | ||||||||||||||||||
| Per Share Data | ||||||||||||||||||||||
| Net asset value, beginning of year |
$ | 58.44 | $ | 39.10 | $ | 45.50 | $ | 58.10 | $ | 55.04 | ||||||||||||
| Net investment income (loss)(a) |
0.01 | (0.15 | ) | 0.16 | 0.14 | (0.03 | ) | |||||||||||||||
| Net realized and unrealized gain (loss) |
(4.24 | ) | 19.51 | (4.35 | ) | (6.90 | ) | 9.42 | ||||||||||||||
| Total from investment operations |
(4.23 | ) | 19.36 | (4.19 | ) | (6.76 | ) | 9.39 | ||||||||||||||
| Distributions to shareholders from net investment income |
— | (0.02 | ) | (0.15 | ) | — | (0.02 | ) | ||||||||||||||
| Distributions to shareholders from net realized gains |
(11.85 | ) | — | (2.06 | ) | (5.84 | ) | (6.31 | ) | |||||||||||||
| Total distributions |
(11.85 | ) | (0.02 | ) | (2.21 | ) | (5.84 | ) | (6.33 | ) | ||||||||||||
| Net asset value, end of year |
$ | 42.36 | $ | 58.44 | $ | 39.10 | $ | 45.50 | $ | 58.10 | ||||||||||||
| Total Return(b) | (9.48 | )% | 49.53 | % | (10.04 | )% | (11.26 | )% | 18.02 | % | ||||||||||||
| Net assets, end of year (in 000’s) |
$ | 17,138 | $ | 27,102 | $ | 39,295 | $ | 75,860 | $ | 110,636 | ||||||||||||
| Ratio of net expenses to average net assets |
1.47 | % | 1.46 | % | 1.46 | % | 1.45 | % | 1.44 | % | ||||||||||||
| Ratio of total expenses to average net assets |
1.49 | % | 1.49 | % | 1.49 | % | 1.47 | % | 1.47 | % | ||||||||||||
| Ratio of net investment income (loss) to average net assets |
0.01 | % | (0.31 | )% | 0.39 | % | 0.29 | % | (0.06 | )% | ||||||||||||
| Portfolio turnover rate(c) |
65 | % | 64 | % | 75 | % | 47 | % | 55 | % | ||||||||||||
| (a) | Calculated based on the average shares outstanding methodology. |
| (b) | Assumes investment at the NAV at the beginning of the year, reinvestment of all dividends and distributions, a complete redemption of the investment at the NAV at the end of the year and no sales or redemption charges (if any). Total returns would be reduced if a sales or redemption charge was taken into account. Returns do not reflect the impact of taxes to shareholders relating to Fund distributions or the redemption of Fund shares. |
| (c) | The Fund’s portfolio turnover rate is calculated in accordance with regulatory requirements, without regard to transactions involving short term investments. If such transactions were included, the Fund’s portfolio turnover rate may be higher. |
| 90 | The accompanying notes are an integral part of these financial statements. |
GOLDMAN SACHS SMALL CAP VALUE FUND
Financial Highlights (continued)
Selected Data for a Share Outstanding Throughout Each Year
| Goldman Sachs Small Cap Value Fund | ||||||||||||||||||||||
| Investor Shares | ||||||||||||||||||||||
| Year Ended August 31, | ||||||||||||||||||||||
| 2022 | 2021 | 2020 | 2019 | 2018 | ||||||||||||||||||
| Per Share Data | ||||||||||||||||||||||
| Net asset value, beginning of year |
$ | 60.18 | $ | 40.26 | $ | 46.84 | $ | 59.60 | $ | 56.32 | ||||||||||||
| Net investment income(a) |
0.24 | 0.05 | 0.27 | 0.32 | 0.18 | |||||||||||||||||
| Net realized and unrealized gain (loss) |
(4.41 | ) | 20.09 | (4.39 | ) | (7.09 | ) | 9.64 | ||||||||||||||
| Total from investment operations |
(4.17 | ) | 20.14 | (4.12 | ) | (6.77 | ) | 9.82 | ||||||||||||||
| Distributions to shareholders from net investment income |
(0.17 | ) | (0.22 | ) | (0.40 | ) | (0.15 | ) | (0.23 | ) | ||||||||||||
| Distributions to shareholders from net realized gains |
(11.85 | ) | — | (2.06 | ) | (5.84 | ) | (6.31 | ) | |||||||||||||
| Total distributions |
(12.02 | ) | (0.22 | ) | (2.46 | ) | (5.99 | ) | (6.54 | ) | ||||||||||||
| Net asset value, end of year |
$ | 43.99 | $ | 60.18 | $ | 40.26 | $ | 46.84 | $ | 59.60 | ||||||||||||
| Total Return(b) | (9.07 | )% | 50.14 | % | (9.70 | )% | (10.94 | )% | 18.44 | % | ||||||||||||
| Net assets, end of year (in 000’s) |
$ | 131,530 | $ | 140,918 | $ | 115,491 | $ | 132,434 | $ | 173,176 | ||||||||||||
| Ratio of net expenses to average net assets |
1.04 | % | 1.04 | % | 1.09 | % | 1.09 | % | 1.08 | % | ||||||||||||
| Ratio of total expenses to average net assets |
1.11 | % | 1.11 | % | 1.12 | % | 1.11 | % | 1.11 | % | ||||||||||||
| Ratio of net investment income to average net assets |
0.46 | % | 0.09 | % | 0.64 | % | 0.64 | % | 0.31 | % | ||||||||||||
| Portfolio turnover rate(c) |
65 | % | 64 | % | 75 | % | 47 | % | 55 | % | ||||||||||||
| (a) | Calculated based on the average shares outstanding methodology. |
| (b) | Assumes investment at the NAV at the beginning of the year, reinvestment of all dividends and distributions, a complete redemption of the investment at the NAV at the end of the year and no sales or redemption charges (if any). Total returns would be reduced if a sales or redemption charge was taken into account. Returns do not reflect the impact of taxes to shareholders relating to Fund distributions or the redemption of Fund shares. |
| (c) | The Fund’s portfolio turnover rate is calculated in accordance with regulatory requirements, without regard to transactions involving short term investments. If such transactions were included, the Fund’s portfolio turnover rate may be higher. |
| The accompanying notes are an integral part of these financial statements. | 91 |
GOLDMAN SACHS SMALL CAP VALUE FUND
Financial Highlights (continued)
Selected Data for a Share Outstanding Throughout Each Year
| Goldman Sachs Small Cap Value Fund | ||||||||||||||||||||||
| Class R6 Shares | ||||||||||||||||||||||
| Year Ended August 31, | ||||||||||||||||||||||
| 2022 | 2021 | 2020 | 2019 | 2018 | ||||||||||||||||||
| Per Share Data | ||||||||||||||||||||||
| Net asset value, beginning of year |
$ | 66.55 | $ | 44.50 | $ | 51.53 | $ | 64.88 | $ | 60.77 | ||||||||||||
| Net investment income(a) |
0.31 | 0.11 | 0.35 | 0.42 | 0.27 | |||||||||||||||||
| Net realized and unrealized gain (loss) |
(5.02 | ) | 22.22 | (4.85 | ) | (7.70 | ) | 10.47 | ||||||||||||||
| Total from investment operations |
(4.71 | ) | 22.33 | (4.50 | ) | (7.28 | ) | 10.74 | ||||||||||||||
| Distributions to shareholders from net investment income |
(0.21 | ) | (0.28 | ) | (0.47 | ) | (0.23 | ) | (0.32 | ) | ||||||||||||
| Distributions to shareholders from net realized gains |
(11.85 | ) | — | (2.06 | ) | (5.84 | ) | (6.31 | ) | |||||||||||||
| Total distributions |
(12.06 | ) | (0.28 | ) | (2.53 | ) | (6.07 | ) | (6.63 | ) | ||||||||||||
| Net asset value, end of year |
$ | 49.78 | $ | 66.55 | $ | 44.50 | $ | 51.53 | $ | 64.88 | ||||||||||||
| Total Return(b) | (9.02 | )% | 50.31 | % | (9.58 | )% | (10.81 | )% | 18.63 | % | ||||||||||||
| Net assets, end of year (in 000’s) |
$ | 1,145,840 | $ | 1,436,954 | $ | 1,229,047 | $ | 1,302,069 | $ | 1,146,132 | ||||||||||||
| Ratio of net expenses to average net assets |
0.96 | % | 0.95 | % | 0.95 | % | 0.94 | % | 0.93 | % | ||||||||||||
| Ratio of total expenses to average net assets |
0.98 | % | 0.98 | % | 0.98 | % | 0.96 | % | 0.96 | % | ||||||||||||
| Ratio of net investment income to average net assets |
0.54 | % | 0.19 | % | 0.74 | % | 0.77 | % | 0.44 | % | ||||||||||||
| Portfolio turnover rate(c) |
65 | % | 64 | % | 75 | % | 47 | % | 55 | % | ||||||||||||
| (a) | Calculated based on the average shares outstanding methodology. |
| (b) | Assumes investment at the NAV at the beginning of the year, reinvestment of all dividends and distributions, a complete redemption of the investment at the NAV at the end of the year and no sales or redemption charges (if any). Total returns would be reduced if a sales or redemption charge was taken into account. Returns do not reflect the impact of taxes to shareholders relating to Fund distributions or the redemption of Fund shares. |
| (c) | The Fund’s portfolio turnover rate is calculated in accordance with regulatory requirements, without regard to transactions involving short term investments. If such transactions were included, the Fund’s portfolio turnover rate may be higher. |
| 92 | The accompanying notes are an integral part of these financial statements. |
GOLDMAN SACHS SMALL CAP VALUE FUND
Financial Highlights (continued)
Selected Data for a Share Outstanding Throughout Each Year
| Goldman Sachs Small Cap Value Fund | ||||||||||||||||||||||
| Class R Shares | ||||||||||||||||||||||
| Year Ended August 31, | ||||||||||||||||||||||
| 2022 | 2021 | 2020 | 2019 | 2018 | ||||||||||||||||||
| Per Share Data | ||||||||||||||||||||||
| Net asset value, beginning of year |
$ | 58.98 | $ | 39.48 | $ | 45.96 | $ | 58.69 | $ | 55.60 | ||||||||||||
| Net investment income (loss)(a) |
(0.03 | ) | (0.21 | ) | 0.13 | 0.07 | (0.11 | ) | ||||||||||||||
| Net realized and unrealized gain (loss) |
(4.28 | ) | 19.71 | (4.42 | ) | (6.96 | ) | 9.51 | ||||||||||||||
| Total from investment operations |
(4.31 | ) | 19.50 | (4.29 | ) | (6.89 | ) | 9.40 | ||||||||||||||
| Distributions to shareholders from net investment income |
— | — | (0.13 | ) | — | — | ||||||||||||||||
| Distributions to shareholders from net realized gains |
(11.85 | ) | — | (2.06 | ) | (5.84 | ) | (6.31 | ) | |||||||||||||
| Total distributions |
(11.85 | ) | — | (2.19 | ) | (5.84 | ) | (6.31 | ) | |||||||||||||
| Net asset value, end of year |
$ | 42.82 | $ | 58.98 | $ | 39.48 | $ | 45.96 | $ | 58.69 | ||||||||||||
| Total Return(b) | (9.53 | )% | 49.39 | % | (10.16 | )% | 11.37 | % | 17.85 | % | ||||||||||||
| Net assets, end of year (in 000’s) |
$ | 41,857 | $ | 62,339 | $ | 57,272 | $ | 84,684 | $ | 123,288 | ||||||||||||
| Ratio of net expenses to average net assets |
1.54 | % | 1.55 | % | 1.59 | % | 1.59 | % | 1.58 | % | ||||||||||||
| Ratio of total expenses to average net assets |
1.61 | % | 1.61 | % | 1.62 | % | 1.61 | % | 1.61 | % | ||||||||||||
| Ratio of net investment income (loss) to average net assets |
(0.06 | )% | (0.40 | )% | 0.30 | % | 0.15 | % | (0.19 | )% | ||||||||||||
| Portfolio turnover rate(c) |
65 | % | 64 | % | 75 | % | 47 | % | 55 | % | ||||||||||||
| (a) | Calculated based on the average shares outstanding methodology. |
| (b) | Assumes investment at the NAV at the beginning of the year, reinvestment of all dividends and distributions, a complete redemption of the investment at the NAV at the end of the year and no sales or redemption charges (if any). Total returns would be reduced if a sales or redemption charge was taken into account. Returns do not reflect the impact of taxes to shareholders relating to Fund distributions or the redemption of Fund shares. |
| (c) | The Fund’s portfolio turnover rate is calculated in accordance with regulatory requirements, without regard to transactions involving short term investments. If such transactions were included, the Fund’s portfolio turnover rate may be higher. |
| The accompanying notes are an integral part of these financial statements. | 93 |
GOLDMAN SACHS SMALL CAP VALUE FUND
Financial Highlights (continued)
Selected Data for a Share Outstanding Throughout Each Period
| Goldman Sachs Small Cap Value Fund | ||||||||||||||||||||||
| Class P Shares | ||||||||||||||||||||||
| Year Ended August 31, | Period Ended August 31, 2018(a) |
|||||||||||||||||||||
| 2022 | 2021 | 2020 | 2019 | |||||||||||||||||||
| Per Share Data | ||||||||||||||||||||||
| Net asset value, beginning of period |
$ | 66.55 | $ | 44.50 | $ | 51.53 | $ | 64.88 | $ | 60.80 | ||||||||||||
| Net investment income(b) |
0.31 | 0.11 | 0.34 | 0.43 | 0.11 | |||||||||||||||||
| Net realized and unrealized gain (loss) |
(5.01 | ) | 22.22 | (4.85 | ) | (7.71 | ) | 3.97 | ||||||||||||||
| Total from investment operations |
(4.70 | ) | 22.33 | (4.51 | ) | (7.28 | ) | 4.08 | ||||||||||||||
| Distributions to shareholders from net investment income |
(0.21 | ) | (0.28 | ) | (0.46 | ) | (0.23 | ) | — | |||||||||||||
| Distributions to shareholders from net realized gains |
(11.85 | ) | — | (2.06 | ) | (5.84 | ) | — | ||||||||||||||
| Total distributions |
(12.06 | ) | (0.28 | ) | (2.52 | ) | (6.07 | ) | — | |||||||||||||
| Net asset value, end of period |
$ | 49.79 | $ | 66.55 | $ | 44.50 | $ | 51.53 | $ | 64.88 | ||||||||||||
| Total Return(c) | (9.01 | )% | 50.28 | % | (9.56 | )% | (10.80 | )% | 6.71 | % | ||||||||||||
| Net assets, end of period (in 000’s) |
$ | 265,197 | $ | 333,524 | $ | 206,370 | $ | 231,930 | $ | 317,224 | ||||||||||||
| Ratio of net expenses to average net assets |
0.96 | % | 0.95 | % | 0.95 | % | 0.94 | % | 0.93 | %(d) | ||||||||||||
| Ratio of total expenses to average net assets |
0.98 | % | 0.98 | % | 0.98 | % | 0.96 | % | 0.97 | %(d) | ||||||||||||
| Ratio of net investment income to average net assets |
0.53 | % | 0.18 | % | 0.74 | % | 0.79 | % | 0.46 | %(d) | ||||||||||||
| Portfolio turnover rate(e) |
65 | % | 64 | % | 75 | % | 47 | % | 55 | % | ||||||||||||
| (a) | Commenced operations on April 17, 2018. |
| (b) | Calculated based on the average shares outstanding methodology. |
| (c) | Assumes investment at the NAV at the beginning of the period, reinvestment of all dividends and distributions, a complete redemption of the investment at the NAV at the end of the period and no sales or redemption charges (if any). Total returns would be reduced if a sales or redemption charge was taken into account. Returns do not reflect the impact of taxes to shareholders relating to Fund distributions or the redemption of Fund shares. Total returns for periods less than one full year are not annualized. |
| (d) | Annualized. |
| (e) | The Fund’s portfolio turnover rate is calculated in accordance with regulatory requirements, without regard to transactions involving short term investments. If such transactions were included, the Fund’s portfolio turnover rate may be higher. |
| 94 | The accompanying notes are an integral part of these financial statements. |
GOLDMAN SACHS SMALL/MID CAP VALUE FUND
Financial Highlights (continued)
Selected Data for a Share Outstanding Throughout Each Year
| (a) | Calculated based on the average shares outstanding methodology. |
| (b) | Assumes investment at the NAV at the beginning of the year, reinvestment of all dividends and distributions, a complete redemption of the investment at the NAV at the end of the year and no sales or redemption charges (if any). Total returns would be reduced if a sales or redemption charge was taken into account. Returns do not reflect the impact of taxes to shareholders relating to Fund distributions or the redemption of Fund shares. |
| (c) | The Fund’s portfolio turnover rate is calculated in accordance with regulatory requirements, without regard to transactions involving short term investments. If such transactions were included, the Fund’s portfolio turnover rate may be higher. |
| The accompanying notes are an integral part of these financial statements. | 95 |
GOLDMAN SACHS SMALL/MID CAP VALUE FUND
Financial Highlights (continued)
Selected Data for a Share Outstanding Throughout Each Year
| Goldman Sachs Small/Mid Cap Value Fund | ||||||||||||||||||||||
| Class C Shares | ||||||||||||||||||||||
| Year Ended August 31, | ||||||||||||||||||||||
| 2022 | 2021 | 2020 | 2019 | 2018 | ||||||||||||||||||
| Per Share Data | ||||||||||||||||||||||
| Net asset value, beginning of year |
$ | 16.68 | $ | 11.17 | $ | 11.67 | $ | 13.30 | $ | 12.14 | ||||||||||||
| Net investment loss(a) |
(0.07 | ) | (0.10 | ) | (0.01 | ) | (0.02 | ) | (0.06 | ) | ||||||||||||
| Net realized and unrealized gain (loss) |
(1.42 | ) | 5.61 | (0.49 | ) | (0.85 | ) | 1.69 | ||||||||||||||
| Total from investment operations |
(1.49 | ) | 5.51 | (0.50 | ) | (0.87 | ) | 1.63 | ||||||||||||||
| Distributions to shareholders from net realized gains |
(0.93 | ) | — | — | (0.76 | ) | (0.47 | ) | ||||||||||||||
| Net asset value, end of year |
$ | 14.26 | $ | 16.68 | $ | 11.17 | $ | 11.67 | $ | 13.30 | ||||||||||||
| Total Return(b) | (9.56 | )% | 49.46 | % | (4.36 | )% | (6.07 | )% | 13.63 | % | ||||||||||||
| Net assets, end of year (in 000’s) |
$ | 997 | $ | 1,483 | $ | 948 | $ | 994 | $ | 1,140 | ||||||||||||
| Ratio of net expenses to average net assets |
1.96 | % | 1.96 | % | 1.98 | % | 1.98 | % | 1.98 | % | ||||||||||||
| Ratio of total expenses to average net assets |
2.09 | % | 2.17 | % | 2.24 | % | 2.31 | % | 2.22 | % | ||||||||||||
| Ratio of net investment loss to average net assets |
(0.44 | )% | (0.69 | )% | (0.07 | )% | (0.15 | )% | (0.44 | )% | ||||||||||||
| Portfolio turnover rate(c) |
90 | % | 78 | % | 76 | % | 73 | % | 105 | % | ||||||||||||
| (a) | Calculated based on the average shares outstanding methodology. |
| (b) | Assumes investment at the NAV at the beginning of the year, reinvestment of all dividends and distributions, a complete redemption of the investment at the NAV at the end of the year and no sales or redemption charges (if any). Total returns would be reduced if a sales or redemption charge was taken into account. Returns do not reflect the impact of taxes to shareholders relating to Fund distributions or the redemption of Fund shares. |
| (c) | The Fund’s portfolio turnover rate is calculated in accordance with regulatory requirements, without regard to transactions involving short term investments. If such transactions were included, the Fund’s portfolio turnover rate may be higher. |
| 96 | The accompanying notes are an integral part of these financial statements. |
GOLDMAN SACHS SMALL/MID CAP VALUE FUND
Financial Highlights (continued)
Selected Data for a Share Outstanding Throughout Each Year
| Goldman Sachs Small/Mid Cap Value Fund | ||||||||||||||||||||||
| Institutional Shares | ||||||||||||||||||||||
| Year Ended August 31, | ||||||||||||||||||||||
| 2022 | 2021 | 2020 | 2019 | 2018 | ||||||||||||||||||
| Per Share Data | ||||||||||||||||||||||
| Net asset value, beginning of year |
$ | 17.51 | $ | 11.67 | $ | 12.18 | $ | 13.74 | $ | 12.50 | ||||||||||||
| Net investment income(a) |
0.12 | 0.07 | 0.09 | 0.12 | 0.08 | |||||||||||||||||
| Net realized and unrealized gain (loss) |
(1.50 | ) | 5.87 | (0.47 | ) | (0.88 | ) | 1.75 | ||||||||||||||
| Total from investment operations |
(1.38 | ) | 5.94 | (0.38 | ) | (0.76 | ) | 1.83 | ||||||||||||||
| Distributions to shareholders from net investment income |
(0.09 | ) | (0.10 | ) | (0.13 | ) | (0.04 | ) | (0.12 | ) | ||||||||||||
| Distributions to shareholders from net realized gains |
(0.93 | ) | — | — | (0.76 | ) | (0.47 | ) | ||||||||||||||
| Total distributions |
(1.02 | ) | (0.10 | ) | (0.13 | ) | (0.80 | ) | (0.59 | ) | ||||||||||||
| Net asset value, end of year |
$ | 15.11 | $ | 17.51 | $ | 11.67 | $ | 12.18 | $ | 13.74 | ||||||||||||
| Total Return(b) | (8.56 | )% | 51.16 | % | (3.26 | )% | (5.00 | )% | 14.93 | % | ||||||||||||
| Net assets, end of year (in 000’s) |
$ | 23,900 | $ | 18,472 | $ | 7,054 | $ | 6,223 | $ | 5,666 | ||||||||||||
| Ratio of net expenses to average net assets |
0.84 | % | 0.84 | % | 0.85 | % | 0.84 | % | 0.84 | % | ||||||||||||
| Ratio of total expenses to average net assets |
0.97 | % | 1.05 | % | 1.12 | % | 1.17 | % | 1.08 | % | ||||||||||||
| Ratio of net investment income to average net assets |
0.72 | % | 0.44 | % | 0.78 | % | 0.99 | % | 0.58 | % | ||||||||||||
| Portfolio turnover rate(c) |
90 | % | 78 | % | 76 | % | 73 | % | 105 | % | ||||||||||||
| (a) | Calculated based on the average shares outstanding methodology. |
| (b) | Assumes investment at the NAV at the beginning of the year, reinvestment of all dividends and distributions, a complete redemption of the investment at the NAV at the end of the year and no sales or redemption charges (if any). Total returns would be reduced if a sales or redemption charge was taken into account. Returns do not reflect the impact of taxes to shareholders relating to Fund distributions or the redemption of Fund shares. |
| (c) | The Fund’s portfolio turnover rate is calculated in accordance with regulatory requirements, without regard to transactions involving short term investments. If such transactions were included, the Fund’s portfolio turnover rate may be higher. |
| The accompanying notes are an integral part of these financial statements. | 97 |
GOLDMAN SACHS SMALL/MID CAP VALUE FUND
Financial Highlights (continued)
Selected Data for a Share Outstanding Throughout Each Year
| Goldman Sachs Small/Mid Cap Value Fund | ||||||||||||||||||||||
| Investor Shares | ||||||||||||||||||||||
| Year Ended August 31, | ||||||||||||||||||||||
| 2022 | 2021 | 2020 | 2019 | 2018 | ||||||||||||||||||
| Per Share Data | ||||||||||||||||||||||
| Net asset value, beginning of year |
$ | 17.41 | $ | 11.59 | $ | 12.09 | $ | 13.67 | $ | 12.44 | ||||||||||||
| Net investment income(a) |
0.09 | 0.07 | 0.08 | 0.10 | 0.08 | |||||||||||||||||
| Net realized and unrealized gain (loss) |
(1.49 | ) | 5.82 | (0.47 | ) | (0.88 | ) | 1.73 | ||||||||||||||
| Total from investment operations |
(1.40 | ) | 5.89 | (0.39 | ) | (0.78 | ) | 1.81 | ||||||||||||||
| Distributions to shareholders from net investment income |
(0.08 | ) | (0.07 | ) | (0.11 | ) | (0.04 | ) | (0.11 | ) | ||||||||||||
| Distributions to shareholders from net realized gains |
(0.93 | ) | — | — | (0.76 | ) | (0.47 | ) | ||||||||||||||
| Total distributions |
(1.01 | ) | (0.07 | ) | (0.11 | ) | (0.80 | ) | (0.58 | ) | ||||||||||||
| Net asset value, end of year |
$ | 15.00 | $ | 17.41 | $ | 11.59 | $ | 12.09 | $ | 13.67 | ||||||||||||
| Total Return(b) | (8.68 | )% | 50.98 | % | (3.32 | )% | (5.19 | )% | 14.82 | % | ||||||||||||
| Net assets, end of year (in 000’s) |
$ | 11,178 | $ | 13,553 | $ | 1,435 | $ | 3,253 | $ | 5,541 | ||||||||||||
| Ratio of net expenses to average net assets |
0.96 | % | 0.96 | % | 0.98 | % | 0.98 | % | 0.98 | % | ||||||||||||
| Ratio of total expenses to average net assets |
1.08 | % | 1.15 | % | 1.26 | % | 1.30 | % | 1.22 | % | ||||||||||||
| Ratio of net investment income to average net assets |
0.55 | % | 0.40 | % | 0.74 | % | 0.85 | % | 0.61 | % | ||||||||||||
| Portfolio turnover rate(c) |
90 | % | 78 | % | 76 | % | 73 | % | 105 | % | ||||||||||||
| (a) | Calculated based on the average shares outstanding methodology. |
| (b) | Assumes investment at the NAV at the beginning of the year, reinvestment of all dividends and distributions, a complete redemption of the investment at the NAV at the end of the year and no sales or redemption charges (if any). Total returns would be reduced if a sales or redemption charge was taken into account. Returns do not reflect the impact of taxes to shareholders relating to Fund distributions or the redemption of Fund shares. |
| (c) | The Fund’s portfolio turnover rate is calculated in accordance with regulatory requirements, without regard to transactions involving short term investments. If such transactions were included, the Fund’s portfolio turnover rate may be higher. |
| 98 | The accompanying notes are an integral part of these financial statements. |
GOLDMAN SACHS SMALL/MID CAP VALUE FUND
Financial Highlights (continued)
Selected Data for a Share Outstanding Throughout Each Year
| Goldman Sachs Small/Mid Cap Value Fund | ||||||||||||||||||||||
| Class R6 Shares | ||||||||||||||||||||||
| Year Ended August 31, | ||||||||||||||||||||||
| 2022 | 2021 | 2020 | 2019 | 2018 | ||||||||||||||||||
| Per Share Data | ||||||||||||||||||||||
| Net asset value, beginning of year |
$ | 17.50 | $ | 11.66 | $ | 12.16 | $ | 13.75 | $ | 12.51 | ||||||||||||
| Net investment income(a) |
0.12 | 0.07 | 0.09 | 0.12 | 0.10 | |||||||||||||||||
| Net realized and unrealized gain (loss) |
(1.51 | ) | 5.87 | (0.46 | ) | (0.89 | ) | 1.73 | ||||||||||||||
| Total from investment operations |
(1.39 | ) | 5.94 | (0.37 | ) | (0.77 | ) | 1.83 | ||||||||||||||
| Distributions to shareholders from net investment income |
(0.09 | ) | (0.10 | ) | (0.13 | ) | (0.06 | ) | (0.12 | ) | ||||||||||||
| Distributions to shareholders from net realized gains |
(0.93 | ) | — | — | (0.76 | ) | (0.47 | ) | ||||||||||||||
| Total distributions |
(1.02 | ) | (0.10 | ) | (0.13 | ) | (0.82 | ) | (0.59 | ) | ||||||||||||
| Net asset value, end of year |
$ | 15.09 | $ | 17.50 | $ | 11.66 | $ | 12.16 | $ | 13.75 | ||||||||||||
| Total Return(b) | (8.56 | )% | 51.12 | % | (3.17 | )% | (5.06 | )% | 14.94 | % | ||||||||||||
| Net assets, end of year (in 000’s) |
$ | 93,904 | $ | 97,324 | $ | 52,507 | $ | 57,055 | $ | 60,931 | ||||||||||||
| Ratio of net expenses to average net assets |
0.83 | % | 0.83 | % | 0.84 | % | 0.83 | % | 0.83 | % | ||||||||||||
| Ratio of total expenses to average net assets |
0.96 | % | 1.04 | % | 1.11 | % | 1.16 | % | 1.07 | % | ||||||||||||
| Ratio of net investment income to average net assets |
0.70 | % | 0.44 | % | 0.79 | % | 1.00 | % | 0.75 | % | ||||||||||||
| Portfolio turnover rate(c) |
90 | % | 78 | % | 76 | % | 73 | % | 105 | % | ||||||||||||
| (a) | Calculated based on the average shares outstanding methodology. |
| (b) | Assumes investment at the NAV at the beginning of the year, reinvestment of all dividends and distributions, a complete redemption of the investment at the NAV at the end of the year and no sales or redemption charges (if any). Total returns would be reduced if a sales or redemption charge was taken into account. Returns do not reflect the impact of taxes to shareholders relating to Fund distributions or the redemption of Fund shares. |
| (c) | The Fund’s portfolio turnover rate is calculated in accordance with regulatory requirements, without regard to transactions involving short term investments. If such transactions were included, the Fund’s portfolio turnover rate may be higher. |
| The accompanying notes are an integral part of these financial statements. | 99 |
GOLDMAN SACHS SMALL/MID CAP VALUE FUND
Financial Highlights (continued)
Selected Data for a Share Outstanding Throughout Each Year
| Goldman Sachs Small/Mid Cap Value Fund | ||||||||||||||||||||||
| Class R Shares | ||||||||||||||||||||||
| Year Ended August 31, | ||||||||||||||||||||||
| 2022 | 2021 | 2020 | 2019 | 2018 | ||||||||||||||||||
| Per Share Data | ||||||||||||||||||||||
| Net asset value, beginning of year |
$ | 17.21 | $ | 11.46 | $ | 11.96 | $ | 13.56 | $ | 12.35 | ||||||||||||
| Net investment income (loss)(a) |
0.01 | (0.03 | ) | 0.03 | 0.04 | 0.01 | ||||||||||||||||
| Net realized and unrealized gain (loss) |
(1.47 | ) | 5.78 | (0.49 | ) | (0.87 | ) | 1.72 | ||||||||||||||
| Total from investment operations |
(1.46 | ) | 5.75 | (0.46 | ) | (0.83 | ) | 1.73 | ||||||||||||||
| Distributions to shareholders from net investment income |
— | — | (0.04 | ) | (0.01 | ) | (0.05 | ) | ||||||||||||||
| Distributions to shareholders from net realized gains |
(0.93 | ) | — | — | (0.76 | ) | (0.47 | ) | ||||||||||||||
| Total distributions |
(0.93 | ) | — | (0.04 | ) | (0.77 | ) | (0.52 | ) | |||||||||||||
| Net asset value, end of year |
$ | 14.82 | $ | 17.21 | $ | 11.46 | $ | 11.96 | $ | 13.56 | ||||||||||||
| Total Return(b) | (9.07 | )% | 50.17 | % | (3.85 | )% | (5.65 | )% | 14.20 | % | ||||||||||||
| Net assets, end of year (in 000’s) |
$ | 105 | $ | 99 | $ | 74 | $ | 160 | $ | 207 | ||||||||||||
| Ratio of net expenses to average net assets |
1.45 | % | 1.46 | % | 1.48 | % | 1.48 | % | 1.48 | % | ||||||||||||
| Ratio of total expenses to average net assets |
1.58 | % | 1.67 | % | 1.76 | % | 1.81 | % | 1.72 | % | ||||||||||||
| Ratio of net investment income (loss) to average net assets |
0.07 | % | (0.19 | )% | 0.29 | % | 0.36 | % | 0.09 | % | ||||||||||||
| Portfolio turnover rate(c) |
90 | % | 78 | % | 76 | % | 73 | % | 105 | % | ||||||||||||
| (a) | Calculated based on the average shares outstanding methodology. |
| (b) | Assumes investment at the NAV at the beginning of the year, reinvestment of all dividends and distributions, a complete redemption of the investment at the NAV at the end of the year and no sales or redemption charges (if any). Total returns would be reduced if a sales or redemption charge was taken into account. Returns do not reflect the impact of taxes to shareholders relating to Fund distributions or the redemption of Fund shares. |
| (c) | The Fund’s portfolio turnover rate is calculated in accordance with regulatory requirements, without regard to transactions involving short term investments. If such transactions were included, the Fund’s portfolio turnover rate may be higher. |
| 100 | The accompanying notes are an integral part of these financial statements. |
GOLDMAN SACHS SMALL/MID CAP VALUE FUND
Financial Highlights (continued)
Selected Data for a Share Outstanding Throughout Each Period
| Goldman Sachs Small/Mid Cap Value Fund | ||||||||||||||||||||||
| Class P Shares | ||||||||||||||||||||||
| Year Ended August 31, | Period Ended August 31, 2018(a) |
|||||||||||||||||||||
| 2022 | 2021 | 2020 | 2019 | |||||||||||||||||||
| Per Share Data | ||||||||||||||||||||||
| Net asset value, beginning of period |
$ | 17.49 | $ | 11.66 | $ | 12.16 | $ | 13.75 | $ | 13.26 | ||||||||||||
| Net investment income(b) |
0.12 | 0.07 | 0.09 | 0.12 | 0.05 | |||||||||||||||||
| Net realized and unrealized gain (loss) |
(1.50 | ) | 5.86 | (0.46 | ) | (0.89 | ) | 0.44 | ||||||||||||||
| Total from investment operations |
(1.38 | ) | 5.93 | (0.37 | ) | (0.77 | ) | 0.49 | ||||||||||||||
| Distributions to shareholders from net investment income |
(0.09 | ) | (0.10 | ) | (0.13 | ) | (0.06 | ) | — | |||||||||||||
| Distributions to shareholders from net realized gains |
(0.93 | ) | — | — | (0.76 | ) | — | |||||||||||||||
| Total distributions |
(1.02 | ) | (0.10 | ) | (0.13 | ) | (0.82 | ) | — | |||||||||||||
| Net asset value, end of period |
$ | 15.09 | $ | 17.49 | $ | 11.66 | $ | 12.16 | $ | 13.75 | ||||||||||||
| Total Return(c) | (8.51 | )% | 51.04 | % | (3.17 | )% | (5.05 | )% | 3.70 | % | ||||||||||||
| Net assets, end of period (in 000’s) |
$ | 97,396 | $ | 92,056 | $ | 38,153 | $ | 48,725 | $ | 54,660 | ||||||||||||
| Ratio of net expenses to average net assets |
0.83 | % | 0.83 | % | 0.84 | % | 0.83 | % | 0.83 | %(d) | ||||||||||||
| Ratio of total expenses to average net assets |
0.96 | % | 1.04 | % | 1.11 | % | 1.16 | % | 1.09 | %(d) | ||||||||||||
| Ratio of net investment income to average net assets |
0.70 | % | 0.44 | % | 0.79 | % | 1.00 | % | 0.99 | %(d) | ||||||||||||
| Portfolio turnover rate(e) |
90 | % | 78 | % | 76 | % | 73 | % | 105 | % | ||||||||||||
| (a) | Commenced operations on April 17, 2018. |
| (b) | Calculated based on the average shares outstanding methodology. |
| (c) | Assumes investment at the NAV at the beginning of the period, reinvestment of all dividends and distributions, a complete redemption of the investment at the NAV at the end of the period and no sales or redemption charges (if any). Total returns would be reduced if a sales or redemption charge was taken into account. Returns do not reflect the impact of taxes to shareholders relating to Fund distributions or the redemption of Fund shares. Total returns for periods less than one full year are not annualized. |
| (d) | Annualized. |
| (e) | The Fund’s portfolio turnover rate is calculated in accordance with regulatory requirements, without regard to transactions involving short term investments. If such transactions were included, the Fund’s portfolio turnover rate may be higher. |
| The accompanying notes are an integral part of these financial statements. | 101 |
GOLDMAN SACHS FUNDAMENTAL EQUITY VALUE FUNDS
August 31, 2022
| 1. ORGANIZATION |
Goldman Sachs Trust (the “Trust”) is a Delaware statutory trust registered under the Investment Company Act of 1940, as amended (the “Act”), as an open-end management investment company. The following table lists those series of the Trust that are included in this report (collectively, the “Funds” or individually a “Fund”), along with their corresponding share classes and respective diversification status under the Act:
| Fund | Share Classes Offered | Diversified/ Non-Diversified | ||
| Focused Value |
A, C, Institutional, Investor, P, R and R6 |
Non-Diversified | ||
| Equity Income, Large Cap Value, Mid Cap Value, Small Cap Value |
A, C, Institutional, Service, Investor, P, R and R6 |
Diversified | ||
| Small/Mid Cap Value |
A, C, Institutional, Investor, P, R and R6 |
Diversified |
Class A Shares are sold with a front-end sales charge of up to 5.50%. Class C Shares are sold with a contingent deferred sales charge (“CDSC”) of 1.00%, which is imposed on redemptions made within 12 months of purchase. Institutional, Service, Investor, Class R6, Class R and Class P Shares are not subject to a sales charge.
Goldman Sachs Asset Management, L.P. (“GSAM”), an affiliate of Goldman Sachs & Co. LLC (“Goldman Sachs”), serves as investment adviser to the Funds pursuant to a management agreement (the “Agreement”) with the Trust.
| 2. SIGNIFICANT ACCOUNTING POLICIES |
The financial statements have been prepared in accordance with accounting principles generally accepted in the United States of America (“GAAP”) and require management to make estimates and assumptions that may affect the reported amounts and disclosures. Actual results may differ from those estimates and assumptions. Each Fund is an investment company under GAAP and follows the accounting and reporting guidance applicable to investment companies.
A. Investment Valuation — The Funds’ valuation policy is to value investments at fair value.
B. Investment Income and Investments — Investment income includes interest income, dividend income and securities lending income, if any. Interest income is accrued daily and adjusted for amortization of premiums and accretion of discounts. Dividend income is recognized on ex-dividend date or, for certain foreign securities, as soon as such information is obtained subsequent to the ex-dividend date. Non-cash dividends, if any, are recorded at the fair market value of the securities received. Investment transactions are reflected on trade date. Realized gains and losses are calculated using identified cost. Investment transactions are recorded on the following business day for daily net asset value (“NAV”) calculations. Investment income is recorded net of any foreign withholding taxes, less any amounts reclaimable. The Funds may file withholding tax reclaims in certain jurisdictions to recover a portion of amounts previously withheld. These reclaims, if any, are recorded when the amount is known and there are no significant uncertainties on collectability. Such amounts recovered, if any, are reflected as other income in the Statements of Operations. Any foreign capital gains tax is accrued daily based upon net unrealized gains, and is payable upon sale of such investments. Distributions received from the Funds’ investments in U.S. real estate investment trusts (“REITs”) may be characterized as ordinary income, net capital gain and/or a return of capital. A return of capital is recorded by the Funds as a reduction to the cost basis of the REIT.
C. Class Allocations and Expenses — Investment income, realized and unrealized gain (loss), if any, and non-class specific expenses of each Fund are allocated daily based upon the proportion of net assets of each class. Non-class specific expenses directly incurred by a Fund are charged to that Fund, while such expenses incurred by the Trust are allocated across the applicable Funds on a straight-line and/or pro-rata basis depending upon the nature of the expenses. Class specific expenses, where applicable, are borne by the respective share classes and include Distribution and Service, Transfer Agency and Service and Shareholder Administration fees.
D. Federal Taxes and Distributions to Shareholders — It is each Fund’s policy to comply with the requirements of the Internal Revenue Code of 1986, as amended (the “Code”), applicable to regulated investment companies and to distribute each
102
GOLDMAN SACHS FUNDAMENTAL EQUITY VALUE FUNDS
| 2. SIGNIFICANT ACCOUNTING POLICIES (continued) |
year substantially all of its investment company taxable income and capital gains to its shareholders. Accordingly, each Fund is not required to make any provisions for the payment of federal income tax. Distributions to shareholders are recorded on the ex-dividend date. Income and capital gains distributions, if any, are declared and paid according to the following schedule:
| Fund | Income Distributions Declared/Paid |
Capital Gains Distributions Declared/Paid | ||||
| Equity Income |
Quarterly | Annually | ||||
|
Focused Value, Large Cap Value, Mid Cap Value, Small Cap Value and Small/Mid Cap Value |
Annually | Annually |
Net capital losses, if any, are carried forward to future fiscal years and may be used to the extent allowed by the Code to offset any future capital gains. Losses that are carried forward will retain their character as either short-term or long-term capital losses. Utilization of capital loss carryforwards will reduce the requirement of future capital gains distributions.
The characterization of distributions to shareholders for financial reporting purposes is determined in accordance with federal income tax rules, which may differ from GAAP. The source of each Fund’s distributions may be shown in the accompanying financial statements as either from distributable earnings or capital. Certain components of the Funds’ net assets on the Statements of Assets and Liabilities reflect permanent GAAP/tax differences based on the appropriate tax character.
E. Foreign Currency Translation — The accounting records and reporting currency of the Funds are maintained in U.S. dollars. Assets and liabilities denominated in foreign currencies are translated into U.S. dollars using the current exchange rates at the close of each business day. The effect of changes in foreign currency exchange rates on investments is included within net realized and unrealized gain (loss) on investments. Changes in the value of other assets and liabilities as a result of fluctuations in foreign exchange rates are included in the Statements of Operations within net change in unrealized gain (loss) on foreign currency translation. Transactions denominated in foreign currencies are translated into U.S. dollars on the date the transaction occurred, the effects of which are included within net realized gain (loss) on foreign currency transactions.
| 3. INVESTMENTS AND FAIR VALUE MEASUREMENTS |
U.S. GAAP defines the fair value of a financial instrument as the amount that would be received to sell an asset or paid to transfer a liability in an orderly transaction between market participants at the measurement date (i.e., the exit price); the Funds’ policy is to use the market approach. GAAP establishes a fair value hierarchy that prioritizes the inputs to valuation techniques used to measure fair value. The hierarchy gives the highest priority to unadjusted quoted prices in active markets for identical assets or liabilities (Level 1 measurements) and the lowest priority to unobservable inputs (Level 3 measurements). The level in the fair value hierarchy within which the fair value measurement in its entirety falls shall be determined based on the lowest level input that is significant to the fair value measurement in its entirety. The levels used for classifying investments are not necessarily an indication of the risk associated with investing in these investments. The three levels of the fair value hierarchy are described below:
Level 1 — Unadjusted quoted prices in active markets that are accessible at the measurement date for identical, unrestricted assets or liabilities;
Level 2 — Quoted prices in markets that are not active or financial instruments for which significant inputs are observable (including, but not limited to, quoted prices for similar investments, interest rates, foreign exchange rates, volatility and credit spreads), either directly or indirectly;
Level 3 — Prices or valuations that require significant unobservable inputs (including GSAM’s assumptions in determining fair value measurement).
The Board of Trustees (“Trustees”) has approved Valuation Procedures that govern the valuation of the portfolio investments held by the Funds, including investments for which market quotations are not readily available. With respect to the Funds’ investments that do not have readily available market quotations, the Trustees have designated the Adviser as the valuation designee to perform
103
GOLDMAN SACHS FUNDAMENTAL EQUITY VALUE FUNDS
Notes to Financial Statements (continued)
August 31, 2022
| 3. INVESTMENTS AND FAIR VALUE MEASUREMENTS (continued) |
fair valuations pursuant to Rule 2a-5 under the Investment Company Act of 1940 (the "Valuation Designee"). GSAM has day-to-day responsibility for implementing and maintaining internal controls and procedures related to the valuation of the Funds’ investments. To assess the continuing appropriateness of pricing sources and methodologies, GSAM regularly performs price verification procedures and issues challenges as necessary to third party pricing vendors or brokers, and any differences are reviewed in accordance with the Valuation Procedures.
A. Level 1 and Level 2 Fair Value Investments — The valuation techniques and significant inputs used in determining the fair values for investments classified as Level 1 and Level 2 are as follows:
Equity Securities — Equity securities traded on a United States (“U.S.”) securities exchange or the NASDAQ system, or those located on certain foreign exchanges, including but not limited to the Americas, are valued daily at their last sale price or official closing price on the principal exchange or system on which they are traded. If there is no sale or official closing price or such price is believed by GSAM to not represent fair value, equity securities will be valued at the valid closing bid price for long positions and at the valid closing ask price for short positions (i.e. where there is sufficient volume, during normal exchange trading hours). If no valid bid/ask price is available, the equity security will be valued pursuant to the Valuation Procedures and consistent with applicable regulatory guidance. To the extent these investments are actively traded, they are classified as Level 1 of the fair value hierarchy, otherwise they are generally classified as Level 2. Certain equity securities containing unique attributes may be classified as Level 2.
Unlisted equity securities for which market quotations are available are valued at the last sale price on the valuation date, or if no sale occurs, at the last bid price for long positions or the last ask price for short positions, and are generally classified as Level 2. Securities traded on certain foreign securities exchanges are valued daily at fair value determined by an independent fair value service (if available) under Fair Valuation Procedures approved by the Trustees and consistent with applicable regulatory guidance. The independent fair value service takes into account multiple factors including, but not limited to, movements in the securities markets, certain depositary receipts, futures contracts and foreign currency exchange rates that have occurred subsequent to the close of the foreign securities exchange. These investments are generally classified as Level 2 of the fair value hierarchy.
Underlying Funds (including Money Market Funds) — Underlying funds (“Underlying Funds”) include other investment companies and exchange-traded funds (“ETFs”). Investments in the Underlying Funds (except ETFs) are valued at the NAV per share on the day of valuation. ETFs are valued daily at the last sale price or official closing price on the principal exchange or system on which the investment is traded. Because the Funds invest in Underlying Funds that fluctuate in value, the Funds’ shares will correspondingly fluctuate in value. To the extent these investments are actively traded, they are classified as Level 1 of the fair value hierarchy, otherwise they are generally classified as Level 2. For information regarding an Underlying Fund’s accounting policies and investment holdings, please see the Underlying Fund’s shareholder report.
B. Level 3 Fair Value Investments — To the extent that significant inputs to valuation models and other alternative pricing sources are unobservable, or if quotations are not readily available, or if GSAM believes that such quotations do not accurately reflect fair value, the fair value of a Fund’s investments may be determined under Valuation Procedures. GSAM, consistent with its procedures and applicable regulatory guidance, may make an adjustment to the most recent valuation prices of either domestic or foreign securities in light of significant events to reflect what it believes to be the fair value of the securities at the time of determining a Fund’s NAV. To the extent investments are valued using single source broker quotations obtained directly from the broker or passed through from third party pricing vendors, such investments are classified as Level 3 investments.
104
GOLDMAN SACHS FUNDAMENTAL EQUITY VALUE FUNDS
| 3. INVESTMENTS AND FAIR VALUE MEASUREMENTS (continued) |
C. Fair Value Hierarchy — The following is a summary of the Funds’ investments classified in the fair value hierarchy as of August 31, 2022:
| EQUITY INCOME FUND |
| |||||||||||
| Investment Type | Level 1 | Level 2 | Level 3 | |||||||||
| Assets | ||||||||||||
| Common Stock and/or Other Equity Investments(a) |
||||||||||||
| Asia |
$ | 2,500,621 | $ | — | $ | — | ||||||
| Europe |
19,851,456 | — | — | |||||||||
| North America |
369,779,752 | — | — | |||||||||
| Oceania |
4,567,540 | — | — | |||||||||
| Investment Company |
8,778,605 | — | — | |||||||||
| Securities Lending Reinvestment Vehicle |
2,353,075 | — | — | |||||||||
| Total | $ | 407,831,049 | $ | — | $ | — | ||||||
| FOCUSED VALUE FUND | ||||||||||||
| Investment Type | Level 1 | Level 2 | Level 3 | |||||||||
| Assets | ||||||||||||
| Common Stock and/or Other Equity Investments(a) |
||||||||||||
| North America |
$ | 41,819,178 | $ | — | $ | — | ||||||
| Investment Company |
922,973 | — | — | |||||||||
| Total | $ | 42,742,151 | $ | — | $ | — | ||||||
| LARGE CAP VALUE FUND | ||||||||||||
| Investment Type | Level 1 | Level 2 | Level 3 | |||||||||
| Assets | ||||||||||||
| Common Stock and/or Other Equity Investments(a) |
||||||||||||
| Europe |
$ | 12,129,094 | $ | — | $ | — | ||||||
| North America |
432,935,835 | — | — | |||||||||
| Investment Company |
4,276,030 | — | — | |||||||||
| Total | $ | 449,340,959 | $ | — | $ | — | ||||||
| MID CAP VALUE FUND | ||||||||||||
| Investment Type | Level 1 | Level 2 | Level 3 | |||||||||
| Assets | ||||||||||||
| Common Stock and/or Other Equity Investments(a) |
||||||||||||
| Europe |
$ | 17,946,058 | $ | — | $ | — | ||||||
| North America |
1,108,411,894 | — | — | |||||||||
| Investment Company |
22,288,207 | — | — | |||||||||
| Total | $ | 1,148,646,159 | $ | — | $ | — | ||||||
| (a) | Amounts are disclosed by continent to highlight the impact of time zone differences between local market close and the calculation of NAV. Security valuations are based on the principal exchange or system on which they are traded, which may differ from country of domicile noted in table. |
105
GOLDMAN SACHS FUNDAMENTAL EQUITY VALUE FUNDS
Notes to Financial Statements (continued)
August 31, 2022
| 3. INVESTMENTS AND FAIR VALUE MEASUREMENTS (continued) |
| SMALL CAP VALUE FUND | ||||||||||||
| Investment Type | Level 1 | Level 2 | Level 3 | |||||||||
| Assets | ||||||||||||
| Common Stock and/or Other Equity Investments(a) |
||||||||||||
| Africa |
$ | 28,440,265 | $ | — | $ | — | ||||||
| Asia |
14,496,168 | — | — | |||||||||
| Europe |
4,810,998 | — | — | |||||||||
| North America |
3,304,199,628 | — | — | |||||||||
| Investment Company |
22,581,860 | — | — | |||||||||
| Securities Lending Reinvestment Vehicle |
2,576,575 | — | — | |||||||||
| Total | $ | 3,377,105,494 | $ | — | $ | — | ||||||
| SMALL/MID CAP VALUE FUND | ||||||||||||
| Investment Type | Level 1 | Level 2 | Level 3 | |||||||||
| Assets | ||||||||||||
| Common Stock and/or Other Equity Investments(a) |
||||||||||||
| Europe |
$ | 1,826,976 | $ | — | $ | — | ||||||
| North America |
225,471,594 | — | — | |||||||||
| Investment Company |
1,414,538 | — | — | |||||||||
| Securities Lending Reinvestment Vehicle |
489,327 | — | — | |||||||||
| Total | $ | 229,202,435 | $ | — | $ | — | ||||||
| (a) | Amounts are disclosed by continent to highlight the impact of time zone differences between local market close and the calculation of NAV. Security valuations are based on the principal exchange or system on which they are traded, which may differ from country of domicile noted in table. |
For further information regarding security characteristics, see the Schedules of Investments.
| 4. AGREEMENTS AND AFFILIATED TRANSACTIONS |
A. Management Agreement — Under the Agreement, GSAM manages the Funds, subject to the general supervision of the Trustees.
As compensation for the services rendered pursuant to the Agreement, the assumption of the expenses related thereto and administration of the Funds’ business affairs, including providing facilities, GSAM is entitled to a management fee, accrued daily and paid monthly, equal to an annual percentage rate of each Fund’s average daily net assets.
106
GOLDMAN SACHS FUNDAMENTAL EQUITY VALUE FUNDS
| 4. AGREEMENTS AND AFFILIATED TRANSACTIONS (continued) |
As of August 31, 2022, contractual and effective net management fees with GSAM were at the following rates:
| Contractual Management Rate | Effective Contractual Management Rate |
Effective Net Management Rate# |
||||||||||||||||||||||||||||
| Fund | First $1 billion |
Next $1 billion |
Next $3 billion |
Next $3 billion |
Over $8 billion |
|||||||||||||||||||||||||
| Equity Income |
0.69 | % | 0.62 | % | 0.59 | % | 0.58 | % | 0.57 | % | 0.69 | % | 0.69 | % | ||||||||||||||||
| Focused Value |
0.69 | 0.62 | 0.59 | 0.58 | 0.57 | 0.69 | 0.69 | |||||||||||||||||||||||
| Large Cap Value |
0.75 | 0.68 | 0.65 | 0.64 | 0.63 | 0.75 | 0.69 | * | ||||||||||||||||||||||
| Mid Cap Value |
0.75 | 0.75 | 0.68 | 0.65 | 0.64 | 0.75 | 0.75 | |||||||||||||||||||||||
| Small Cap Value |
0.98 | 0.98 | 0.88 | 0.84 | 0.82 | 0.93 | 0.93 | |||||||||||||||||||||||
| Small/Mid Cap Value |
0.80 | 0.80 | 0.72 | 0.68 | 0.67 | 0.80 | 0.80 | |||||||||||||||||||||||
| # | The Effective Net Management Rate includes the impact of management fee waivers of affiliated underlying funds, if any. The Effective Net Management Rate may not correlate to the Contractual Management Rate as a result of management fee waivers that may be in effect from time to time. |
| * | GSAM agreed to waive a portion of its management fee with respect to the Large Cap Value Fund in order to achieve an effective net management fee rate of 0.69% as an annual percentage of the Fund’s average daily net assets. This arrangement will remain in effect through at least December 29, 2022, and prior to such date, GSAM may not terminate the arrangement without the approval of the Board of Trustees. |
The Funds invest in Institutional Shares of the Goldman Sachs Financial Square Government Fund (“Government Money Market Fund”), which is an affiliated Underlying Fund. GSAM has agreed to waive a portion of its management fee payable by the Funds in an amount equal to the management fee it earns as an investment adviser to the affiliated Underlying Fund in which the Funds invest, except those management fees it earns from the Funds’ investments of cash collateral received in connection with securities lending transactions in the Government Money Market Fund. For the fiscal year ended August 31, 2022, the management fee waived by GSAM for each Fund was as follows:
| Fund | Management Fee Waived |
|||||
| Equity Income |
$ | 5,103 | ||||
| Focused Value |
740 | |||||
| Large Cap Value |
5,789 | |||||
| Mid Cap Value |
22,638 | |||||
| Small Cap Value |
54,812 | |||||
| Small/Mid Cap Value |
4,775 | |||||
B. Distribution and/or Service (12b-1) Plans — The Trust, on behalf of Class A and Class R Shares of each applicable Fund, has adopted Distribution and Service Plans subject to Rule 12b-1 under the Act. Under the Distribution and Service Plans, Goldman Sachs, which serves as distributor (the “Distributor”), is entitled to a fee accrued daily and paid monthly for distribution services and personal and account maintenance services, which may then be paid by Goldman Sachs to authorized dealers. These fees are equal to an annual percentage rate of the average daily net assets attributable to Class A or Class R Shares of the Funds, as applicable, as set forth below.
The Trust, on behalf of Class C Shares of each applicable Fund, has adopted a Distribution Plan subject to Rule 12b-1 under the Act. Under the Distribution Plan, Goldman Sachs as Distributor is entitled to a fee accrued daily and paid monthly for distribution services, which may then be paid by Goldman Sachs to authorized dealers. These fees are equal to an annual percentage rate of the average daily net assets attributable to Class C Shares of the Funds, as set forth below.
107
GOLDMAN SACHS FUNDAMENTAL EQUITY VALUE FUNDS
Notes to Financial Statements (continued)
August 31, 2022
| 4. AGREEMENTS AND AFFILIATED TRANSACTIONS (continued) |
The Trust, on behalf of Service Shares of each applicable Fund, has adopted a Service Plan subject to Rule 12b-1 under the Act to allow Service Shares to compensate service organizations (including Goldman Sachs) for providing personal and account maintenance services to their customers who are beneficial owners of such shares. The Service Plan provides for compensation to the service organizations equal to an annual percentage rate of the average daily net assets attributable to Service Shares of the Funds, as set forth below.
| Distribution and/or Service Plan Rates | ||||||||||||||||
| Class A* | Class C | Service | Class R* | |||||||||||||
| Distribution and/or Service Plan |
0.25 | % | 0.75 | % | 0.25 | % | 0.50 | % | ||||||||
| * | With respect to Class A and Class R Shares, the Distributor at its discretion may use compensation for distribution services paid under the Distribution and/or Service Plans to compensate service organizations for personal and account maintenance services and expenses as long as such total compensation does not exceed the maximum cap on “service fees” imposed by the Financial Industry Regulatory Authority. |
C. Distribution Agreement — Goldman Sachs, as Distributor of the shares of the Funds pursuant to a Distribution Agreement, may retain a portion of the Class A Shares’ front end sales charge and Class C Shares’ CDSC. During the fiscal year ended August 31, 2022, Goldman Sachs retained the following amounts:
| Front End Sales Charge |
Contingent Deferred Sales Charge |
|||||||||
| Fund | Class A | Class C | ||||||||
| Equity Income |
$ | — | $ | — | ||||||
| Focused Value |
633 | — | ||||||||
| Large Cap Value |
3,742 | — | ||||||||
| Mid Cap Value |
18,552 | — | ||||||||
| Small Cap Value |
5,575 | — | ||||||||
| Small/Mid Cap Value |
882 | — | ||||||||
D. Service and Shareholder Administration Plans — The Trust, on behalf of each applicable Fund, has adopted Service Plans to allow Class C Shares and Shareholder Administration Plans to allow Service Shares, respectively, to compensate service organizations (including Goldman Sachs) for providing varying levels of personal and account maintenance or shareholder administration services to their customers who are beneficial owners of such shares. The Service and Shareholder Administration Plans each provide for compensation to the service organizations equal to an annual percentage rate of 0.25% of the average daily net assets attributable to Class C and Service Shares of the Funds, respectively.
E. Transfer Agency Agreement — Goldman Sachs also serves as the transfer agent of the Funds for a fee pursuant to the Transfer Agency Agreement. The fees charged for such transfer agency services are accrued daily and paid monthly at annual rates as follows: 0.16% of the average daily net assets of Class A, Class C, Investor and Class R Shares; 0.03% of the average daily net assets of Class R6 and Class P Shares; and 0.04% of the average daily net assets of Institutional and Service Shares.
108
GOLDMAN SACHS FUNDAMENTAL EQUITY VALUE FUNDS
| 4. AGREEMENTS AND AFFILIATED TRANSACTIONS (continued) |
For the fiscal year ended August 31, 2022, the transfer agency fee waivers were as follows:
| Transfer Agency Waivers (Class A, Class C, Investor, and Class R Shares) | ||||||||||
| Fund | Before December 29, 2021 | As of December 29, 2021* | ||||||||
| Equity Income |
0.06 | % | 0.06 | % | ||||||
| Focused Value |
0.06 | % | 0.06 | % | ||||||
| Large Cap Value |
0.06 | % | 0.06 | % | ||||||
| Mid Cap Value |
— | 0.01 | % | |||||||
| Small Cap Value |
0.05 | % | 0.05 | % | ||||||
| Small/Mid Cap Value |
— | 0.01 | % | |||||||
| * | These arrangements will remain in effect through at least December 29, 2022, and prior to such date, Goldman Sachs may not terminate the arrangement without the approval of the Board of Trustees. |
F. Other Expense Agreements and Affiliated Transactions — GSAM has agreed to reduce or limit certain “Other Expenses” of the Funds (excluding acquired fund fees and expenses, transfer agency fees and expenses, service fees and shareholder administration fees (as applicable), taxes, interest, brokerage fees, expenses of shareholder meetings, litigation and indemnification, and extraordinary expenses) to the extent such expenses exceed, on an annual basis, a percentage rate of the average daily net assets of each Fund. Such Other Expense reimbursements, if any, are accrued daily and paid monthly. In addition, the Funds are not obligated to reimburse GSAM for prior fiscal year expense reimbursements, if any. The Other Expense limitations as an annual percentage rate of average daily net assets for Equity Income, Focused Value, Large Cap Value, Small Cap Value and Small/Mid Cap Value Funds is 0.004% and for Mid Cap Value Fund is 0.104%. These Other Expense limitations will remain in place through at least December 29, 2022, and prior to such date GSAM may not terminate the arrangements without the approval of the Trustees. In addition, the Funds have entered into certain offset arrangements with the transfer agent, which may result in a reduction of the Funds’ expenses and are received irrespective of the application of the “Other Expense” limitations described above.
Goldman Sachs may voluntarily waive a portion of any payments under a Fund’s Distribution and Service Plan, Service Plan and Shareholder Administration Plan, and Transfer Agency Agreement, and these waivers are in addition to what is stipulated in any contractual fee waiver arrangements (as applicable). These temporary waivers may be modified or terminated at any time at the option of Goldman Sachs without shareholder approval.
For the fiscal year ended August 31, 2022, these expense reductions, including any fee waivers and Other Expense reimbursements, were as follows:
| Fund | Management Fee Waiver |
Transfer Agency Fee Waiver/Credits |
Other Expense |
Total Expense Reductions |
||||||||||||||
| Equity Income |
$ | 5,103 | $ | 199,865 | $ | 314,084 | $ | 519,052 | ||||||||||
| Focused Value |
740 | 301 | 245,642 | 246,683 | ||||||||||||||
| Large Cap Value |
295,874 | 61,677 | 289,117 | 646,668 | ||||||||||||||
| Mid Cap Value |
22,638 | 38,770 | — | 61,408 | ||||||||||||||
| Small Cap Value |
54,812 | 311,679 | 822,257 | 1,188,748 | ||||||||||||||
| Small/Mid Cap Value |
4,775 | 1,137 | 292,336 | 298,248 | ||||||||||||||
G. Line of Credit Facility — As of August 31, 2022, the Funds participated in a $1,250,000,000 committed, unsecured revolving line of credit facility (the “facility”) together with other funds of the Trust and certain registered investment companies
109
GOLDMAN SACHS FUNDAMENTAL EQUITY VALUE FUNDS
Notes to Financial Statements (continued)
August 31, 2022
| 4. AGREEMENTS AND AFFILIATED TRANSACTIONS (continued) |
having management agreements with GSAM or its affiliates. This facility is to be used for temporary emergency purposes, or to allow for an orderly liquidation of securities to meet redemption requests. The interest rate on borrowings is based on the federal funds rate. The facility also requires a fee to be paid by the Funds based on the amount of the commitment that has not been utilized. For the fiscal year ended August 31, 2022, the Funds did not have any borrowings under the facility. Prior to April 22, 2022, the facility was $1,000,000,000.
H. Other Transactions with Affiliates — The table below shows the transactions in and earnings from investments in the Government Money Market Fund — Institutional Shares for the fiscal year ended August 31, 2022:
| Fund | Beginning Value as of August 31, 2021 |
Purchases at Cost |
Proceeds from Sales |
Ending Value as of August 31, 2022 |
Shares as of August 31, 2022 |
Dividend Income |
||||||||||||||||||||
| Equity Income |
$ | 809,595 | $ | 34,778,465 | $ | (26,809,455 | ) | $ | 8,778,605 | 8,778,605 | $ | 40,754 | ||||||||||||||
| Focused Value |
426,826 | 11,305,942 | (10,809,795 | ) | 922,973 | 922,973 | 3,268 | |||||||||||||||||||
| Large Cap Value |
5,056,208 | 49,871,971 | (50,652,149 | ) | 4,276,030 | 4,276,030 | 24,627 | |||||||||||||||||||
| Mid Cap Value |
10,084,240 | 203,944,795 | (191,740,828 | ) | 22,288,207 | 22,288,207 | 88,041 | |||||||||||||||||||
| Small Cap Value |
5,404,503 | 1,043,071,863 | (1,025,894,506 | ) | 22,581,860 | 22,581,860 | 233,202 | |||||||||||||||||||
| Small/Mid Cap Value |
583,228 | 78,482,626 | (77,651,316 | ) | 1,414,538 | 1,414,538 | 17,848 | |||||||||||||||||||
As of August 31, 2022, The Goldman Sachs Group, Inc. was the beneficial owner of 5% or more of outstanding shares of the following Funds:
| Fund | Investor | Class R | Class R6 | |||||||||||
| Focused Value |
100 | % | 31 | % | 100 | % | ||||||||
| Small/Mid Cap Value |
— | 9 | — | |||||||||||
For the fiscal year ended August 31, 2022, Goldman Sachs earned $27,454, $1,741 in brokerage commissions from portfolio transactions, on behalf of the Small Cap Value and Small/Mid Cap Value Funds, respectively.
| 5. PORTFOLIO SECURITIES TRANSACTIONS |
The cost of purchases and proceeds from sales and maturities of long-term securities for the fiscal year ended August 31, 2022, were as follows:
| Fund | Purchases | Sales and Maturities | ||||||||
| Equity Income |
$ | 72,638,650 | $ | 77,457,487 | ||||||
| Focused Value |
36,628,912 | 31,074,057 | ||||||||
| Large Cap Value |
217,401,903 | 237,136,609 | ||||||||
| Mid Cap Value |
825,492,339 | 879,090,790 | ||||||||
| Small Cap Value |
2,663,994,901 | 3,750,038,273 | ||||||||
| Small/Mid Cap Value |
240,710,291 | 211,395,329 | ||||||||
110
GOLDMAN SACHS FUNDAMENTAL EQUITY VALUE FUNDS
| 6. SECURITIES LENDING |
The Funds may lend their securities through a securities lending agent, the Bank of New York Mellon (“BNYM”), to certain qualified borrowers. In accordance with the Funds’ securities lending procedures, the Funds receive cash collateral at least equal to the market value of the securities on loan. The market value of the loaned securities is determined at the close of business of the Funds, at their last sale price or official closing price on the principal exchange or system on which they are traded, and any additional required collateral is delivered to the Funds on the next business day. As with other extensions of credit, the Funds may experience delay in the recovery of their securities or incur a loss should the borrower of the securities breach its agreement with the Funds or become insolvent at a time when the collateral is insufficient to cover the cost of repurchasing securities on loan. Dividend income received from securities on loan may not be subject to withholding taxes and therefore withholding taxes paid may differ from the amounts listed in the Statements of Operations. Loans of securities are terminable at any time and as such 1) the remaining contractual maturities of the outstanding securities lending transactions are considered to be overnight and continuous and 2) the borrower, after notice, is required to return borrowed securities within the standard time period for settlement of securities transactions.
The Funds invest the cash collateral received in connection with securities lending transactions in the Government Money Market Fund, an affiliated series of the Goldman Sachs Trust. The Government Money Market Fund is registered under the Act as an open end investment company, is subject to Rule 2a-7 under the Act, and is managed by GSAM, for which GSAM may receive a management fee of up to 0.16% on an annualized basis of the average daily net assets of the Government Money Market Fund.
In the event of a default by a borrower with respect to any loan, BNYM may exercise any and all remedies provided under the applicable borrower agreement to make the Funds whole. These remedies include purchasing replacement securities by applying the collateral held from the defaulting broker against the purchase cost of the replacement securities. If BNYM is unable to purchase replacement securities, BNYM will indemnify the Funds by paying the Funds an amount equal to the market value of the securities loaned minus the value of cash collateral received from the borrower for the loan, subject to an exclusion for any shortfalls resulting from a loss of value in such cash collateral due to reinvestment risk. The Funds’ master netting agreements with certain borrowers provide the right, in the event of a default (including bankruptcy or insolvency), for the non-defaulting party to liquidate the collateral and calculate net exposure to the defaulting party or request additional collateral. However, in the event of a default by a borrower, a resolution authority could determine that such rights are not enforceable due to the restrictions or prohibitions against the right of set-off that may be imposed in accordance with a particular jurisdiction’s bankruptcy or insolvency laws. The Funds’ loaned securities were all subject to enforceable Securities Lending Agreements and the value of the collateral was at least equal to the value of the cash received. The amounts of the Funds’ overnight and continuous agreements, which represent the gross amounts of recognized liabilities for securities lending transactions outstanding as of August 31, 2022, are disclosed as “Payable upon return of securities loaned” on the Statements of Assets and Liabilities, where applicable.
Each of the Funds and BNYM received compensation relating to the lending of the Funds’ securities. The amounts earned, if any, by the Funds for the fiscal year ended August 31, 2022, are reported under Investment Income on the Statements of Operations.
The following table provides information about the Funds’ investments in the Government Money Market Fund for the fiscal year ended August 31, 2022:
| Fund | Beginning Value as of August 31, 2021 |
Purchases at Cost |
Proceeds from Sales |
Ending Value as of August 31, 2022 |
||||||||||||||
| Equity Income |
$ | — | $ | 76,545,034 | $ | (74,191,959 | ) | $ | 2,353,075 | |||||||||
| Large Cap Value |
6,285,539 | (6,285,539 | ) | — | ||||||||||||||
| Mid Cap Value |
— | 47,198,686 | (47,198,686 | ) | — | |||||||||||||
| Small Cap Value |
26,189,986 | 251,995,464 | (275,608,875 | ) | 2,576,575 | |||||||||||||
| Small/Mid Cap Value |
764,357 | 16,965,967 | (17,240,997 | ) | 489,327 | |||||||||||||
111
GOLDMAN SACHS FUNDAMENTAL EQUITY VALUE FUNDS
Notes to Financial Statements (continued)
August 31, 2022
| 7. TAX INFORMATION |
The tax character of distributions paid during the fiscal year ended August 31, 2022 was as follows:
| Equity Income |
Focused Value |
Large Cap Value |
Mid Cap Value |
Small Cap Value |
Small/Mid Cap Value |
|||||||||||||||||||
| Distributions paid from: |
||||||||||||||||||||||||
| Ordinary Income |
$ | 7,079,175 | $ | 1,688,667 | $ | 23,706,400 | $ | 82,393,152 | $ | 261,516,537 | $ | 5,745,544 | ||||||||||||
| Net long-term capital gains |
27,116,845 | 780,613 | 32,761,288 | 109,758,802 | 561,166,518 | 7,410,639 | ||||||||||||||||||
| Total taxable distributions |
$ | 34,196,020 | $ | 2,469,280 | $ | 56,467,688 | $ | 192,151,954 | $ | 822,683,055 | $ | 13,156,183 | ||||||||||||
The tax character of distributions paid during the fiscal year ended August 31, 2021 was as follows:
| Equity Income |
Focused Value |
Large Cap Value |
Mid Cap Value |
Small Cap Value |
Small/Mid Cap Value |
|||||||||||||||||||
| Distributions paid from: |
||||||||||||||||||||||||
| Ordinary Income |
$ | 5,224,240 | $ | 113,569 | $ | 5,316,686 | $ | 5,537,175 | $ | 23,638,788 | $ | 843,660 | ||||||||||||
| Net long-term capital gains |
— | 132,959 | 9,286,554 | — | — | — | ||||||||||||||||||
| Total taxable distributions |
$ | 5,224,240 | $ | 246,528 | $ | 14,603,240 | $ | 5,537,175 | $ | 23,638,788 | $ | 843,660 | ||||||||||||
As of August 31, 2022, the components of accumulated earnings (losses) on a tax basis were as follows:
| Equity Income |
Focused Value |
Large Cap Value |
Mid Cap Value |
Small Cap Value |
Small/Mid Cap Value |
|||||||||||||||||||
| Undistributed ordinary income — net |
$ | 2,414,190 | $ | 1,801,714 | $ | 4,729,058 | $ | 714,029 | $ | 6,873,810 | $ | 878,801 | ||||||||||||
| Undistributed long-term capital gains |
12,881,236 | 1,853,261 | 32,029,313 | 129,938,542 | 446,948,406 | 13,539,786 | ||||||||||||||||||
| Total undistributed earnings |
$ | 15,295,426 | $ | 3,654,975 | $ | 36,758,371 | $ | 130,652,571 | $ | 453,822,216 | $ | 14,418,587 | ||||||||||||
| Timing differences (Post October Capital Loss Deferral) |
$ | — | $ | — | $ | (59,929 | ) | $ | (1,345,688 | ) | $ | (48,657,000 | ) | $ | (5,294,551 | ) | ||||||||
| Unrealized gains (losses) — net |
61,275,526 | (1,518,595 | ) | 46,557,629 | 114,270,991 | 350,471,259 | 6,067,663 | |||||||||||||||||
| Total accumulated earnings (losses) — net |
$ | 76,570,952 | $ | 2,136,380 | $ | 83,256,071 | $ | 243,577,874 | $ | 755,636,475 | $ | 15,191,699 | ||||||||||||
As of August 31, 2022, the Funds’ aggregate security unrealized gains and losses based on cost for U.S. federal income tax purposes were as follows:
| Equity Income |
Focused Value |
Large Cap Value |
Mid Cap Value |
Small Cap Value |
Small/Mid Cap Value |
|||||||||||||||||||
| Tax Cost |
$ | 346,555,523 | $ | 44,260,747 | $ | 402,783,248 | $ | 1,034,375,168 | $ | 3,026,634,235 | $ | 223,134,772 | ||||||||||||
| Gross unrealized gain |
78,625,410 | 3,157,662 | 75,450,308 | 174,263,258 | 599,894,034 | 25,626,975 | ||||||||||||||||||
| Gross unrealized loss |
(17,349,884 | ) | (4,676,258 | ) | (28,892,679 | ) | (59,992,267 | ) | (249,422,775 | ) | (19,559,312 | ) | ||||||||||||
| Net unrealized gains (losses) |
$ | 61,275,526 | $ | (1,518,596 | ) | $ | 46,557,629 | $ | 114,270,991 | $ | 350,471,259 | $ | 6,067,663 | |||||||||||
112
GOLDMAN SACHS FUNDAMENTAL EQUITY VALUE FUNDS
| 7. TAX INFORMATION (continued) |
The difference between GAAP-basis and tax basis unrealized gains (losses) is attributable primarily to wash sales.
The Small Cap Value Fund reclassed $53,359,964 from distributable earnings to paid-in capital. In order to present certain components of the Funds’ capital accounts on a tax-basis, certain reclassifications have been recorded to the Funds’ accounts. These reclassifications have no impact on the net asset value of the Funds’ and result primarily from redemptions utilized as distributions.
GSAM has reviewed the Funds’ tax positions for all open tax years (the current and prior three years, as applicable) and has concluded that no provision for income tax is required in the Funds’ financial statements. Such open tax years remain subject to examination and adjustment by tax authorities.
| 8. OTHER RISKS |
The Funds’ risks include, but are not limited to, the following:
Dividend-Paying Investments Risk — A Fund’s investments in dividend-paying securities could cause a Fund to underperform other funds. Securities that pay dividends, as a group, can fall out of favor with the market, causing such securities to underperform securities that do not pay dividends. Depending upon market conditions and political and legislative responses to such conditions, dividend-paying securities that meet a Fund’s investment criteria may not be widely available and/or may be highly concentrated in only a few market sectors. In addition, issuers that have paid regular dividends or distributions to shareholders may not continue to do so at the same level or at all in the future. This may limit the ability of a Fund to produce current income.
Foreign and Emerging Countries Risk — Investing in foreign markets may involve special risks and considerations not typically associated with investing in the U.S. Foreign securities may be subject to risk of loss because of more or less foreign government regulation; less public information; less stringent investor protections; less stringent accounting, corporate governance, financial reporting and disclosure standards; and less economic, political and social stability in the countries in which a Fund invests. The imposition of sanctions, exchange controls (including repatriation restrictions), confiscation of assets and property, trade restrictions (including tariffs) and other government restrictions by the U.S. or other governments, or problems with registration, settlement or custody, may also result in losses. The type and severity of sanctions and other similar measures, including counter sanctions and other retaliatory actions, that may be imposed could vary broadly in scope, and their impact is impossible to predict. For example, the imposition of sanctions and other similar measures could, among other things, cause a decline in the value and/or liquidity of securities issued by the sanctioned country or companies located in or economically tied to the sanctioned country and increase market volatility and disruption in the sanctioned country and throughout the world. Sanctions and other similar measures could limit or prevent a Fund from buying and selling securities (in the sanctioned country and other markets), significantly delay or prevent the settlement of securities transactions, and significantly impact a Fund’s liquidity and performance. Foreign risk also involves the risk of negative foreign currency exchange rate fluctuations, which may cause the value of securities denominated in such foreign currency (or other instruments through which a Fund has exposure to foreign currencies) to decline in value. Currency exchange rates may fluctuate significantly over short periods of time.
Foreign Custody Risk — The Funds may invest in foreign securities, and as such the Funds may hold such securities and cash with foreign banks, agents, and securities depositories appointed by each Fund’s custodian (each a “Foreign Custodian”). Some foreign custodians may be recently organized or new to the foreign custody business. In some countries, Foreign Custodians may be subject to little or no regulatory oversight over, or independent evaluation of, their operations. Further, the laws of certain countries may place limitations on a Fund’s ability to recover its assets if a Foreign Custodian enters bankruptcy. Investments in emerging markets may be subject to even greater custody risks than investments in more developed markets. Custody services in emerging market countries are very often undeveloped and may be considerably less well regulated than in more developed countries, and thus may not afford the same level of investor protection as would apply in developed countries.
Investments in Other Investment Companies Risk — As a shareholder of another investment company, a Fund will indirectly bear its proportionate share of any net management fees and other expenses paid by such other investment companies, in addition to the fees and expenses regularly borne by the Fund.
113
GOLDMAN SACHS FUNDAMENTAL EQUITY VALUE FUNDS
Notes to Financial Statements (continued)
August 31, 2022
| 8. OTHER RISKS (continued) |
Large Shareholder Transactions Risk — A Fund may experience adverse effects when certain large shareholders, such as other funds, institutional investors (including those trading by use of non-discretionary mathematical formulas), financial intermediaries (who may make investment decisions on behalf of underlying clients and/or include a Fund in their investment model), individuals, accounts and Goldman Sachs affiliates, purchase or redeem large amounts of shares of a Fund. Such large shareholder redemptions, which may occur rapidly or unexpectedly, may cause a Fund to sell portfolio securities at times when it would not otherwise do so, which may negatively impact a Fund’s NAV and liquidity. These transactions may also accelerate the realization of taxable income to shareholders if such sales of investments resulted in gains, and may also increase transaction costs. In addition, a large redemption could result in a Fund’s current expenses being allocated over a smaller asset base, leading to an increase in the Fund’s expense ratio. Similarly, large Fund share purchases may adversely affect a Fund’s performance to the extent that the Fund is delayed in investing new cash or otherwise maintains a larger cash position than it ordinarily would.
Liquidity Risk — A Fund may make investments that are illiquid or that may become less liquid in response to market developments or adverse investor perceptions. Illiquid investments may be more difficult to value. Liquidity risk may also refer to the risk that a Fund will not be able to pay redemption proceeds within the allowable time period or without significant dilution to remaining investors’ interests because of unusual market conditions, an unusually high volume of redemption requests, or other reasons. To meet redemption requests, a Fund may be forced to sell investments at an unfavorable time and/or under unfavorable conditions. If a Fund is forced to sell securities at an unfavorable time and/or under unfavorable conditions, such sales may adversely affect the Fund’s NAV and dilute remaining investors’ interests. These risks may be more pronounced in connection with the Funds’ investments in securities of issuers located in emerging market countries. Redemptions by large shareholders may have a negative impact on a Fund’s liquidity.
Market and Credit Risks — In the normal course of business, a Fund trades financial instruments and enters into financial transactions where risk of potential loss exists due to changes in the market (market risk). The value of the securities in which a Fund invests may go up or down in response to the prospects of individual companies, particular sectors or governments and/or general economic conditions throughout the world due to increasingly interconnected global economies and financial markets. Events such as war, acts of terrorism, social unrest, natural disasters, the spread of infectious illness or other public health threats could also significantly impact a Fund and its investments. Additionally, a Fund may also be exposed to credit risk in the event that an issuer or guarantor fails to perform or that an institution or entity with which the Fund has unsettled or open transactions defaults.
Non-Diversification Risk — The Focused Value Fund is non-diversified, meaning that it is permitted to invest a larger percentage of its assets in one or more issuers or fewer issuers than diversified mutual funds. Thus, the Fund may be more susceptible to adverse developments affecting any single issuer held in its portfolio, and may be more susceptible to greater losses because of these developments.
| 9. INDEMNIFICATIONS |
Under the Trust’s organizational documents, its Trustees, officers, employees and agents are indemnified, to the extent permitted by the Act and state law, against certain liabilities that may arise out of performance of their duties to the Funds. Additionally, in the course of business, the Funds enter into contracts that contain a variety of indemnification clauses. The Funds’ maximum exposure under these arrangements is unknown, as this would involve future claims that may be made against the Funds that have not yet occurred. However, GSAM believes the risk of loss under these arrangements to be remote.
| 10. SUBSEQUENT EVENTS |
Subsequent events after the Statements of Assets and Liabilities date have been evaluated, and GSAM has concluded that there is no impact requiring adjustment or disclosure in the financial statements.
114
GOLDMAN SACHS FUNDAMENTAL EQUITY VALUE FUNDS
| 11. SUMMARY OF SHARE TRANSACTIONS |
Share activity is as follows:
| Equity Income Fund | ||||||||||||||||
|
|
|
|||||||||||||||
| For the Fiscal Year Ended August 31, 2022 |
For the Fiscal Year Ended August 31, 2021 |
|||||||||||||||
|
|
|
|||||||||||||||
| Shares | Dollars | Shares | Dollars | |||||||||||||
|
|
|
|||||||||||||||
| Class A Shares | ||||||||||||||||
| Shares sold |
212,235 | $ | 9,347,093 | 155,231 | $ | 6,592,880 | ||||||||||
| Reinvestment |
578,113 | 25,872,061 | 97,564 | 4,022,902 | ||||||||||||
| Shares redeemed |
(701,423 | ) | (31,322,062 | ) | (861,842 | ) | (36,162,254 | ) | ||||||||
| 88,925 | 3,897,092 | (609,047 | ) | (25,546,472 | ) | |||||||||||
| Class C Shares | ||||||||||||||||
| Shares sold |
29,330 | 1,221,995 | 33,026 | 1,364,079 | ||||||||||||
| Reinvestment |
9,217 | 390,565 | 881 | 34,582 | ||||||||||||
| Shares redeemed |
(55,384 | ) | (2,342,631 | ) | (51,543 | ) | (2,050,249 | ) | ||||||||
| (16,837 | ) | (730,071 | ) | (17,636 | ) | (651,588 | ) | |||||||||
| Institutional Shares | ||||||||||||||||
| Shares sold |
111,994 | 5,062,050 | 295,751 | 12,080,551 | ||||||||||||
| Reinvestment |
58,273 | 2,659,792 | 10,545 | 444,680 | ||||||||||||
| Shares redeemed |
(127,915 | ) | (5,883,824 | ) | (191,746 | ) | (7,887,747 | ) | ||||||||
| 42,352 | 1,838,018 | 114,550 | 4,637,484 | |||||||||||||
| Service Shares | ||||||||||||||||
| Shares sold |
1 | 43 | — | — | ||||||||||||
| Reinvestment |
162 | 7,278 | 34 | 1,353 | ||||||||||||
| Shares redeemed |
(201 | ) | (8,998 | ) | (2,083 | ) | (85,486 | ) | ||||||||
| (38 | ) | (1,677 | ) | (2,049 | ) | (84,133 | ) | |||||||||
| Investor Shares | ||||||||||||||||
| Shares sold |
51,928 | 2,264,233 | 59,768 | 2,292,195 | ||||||||||||
| Reinvestment |
5,745 | 255,958 | 1,162 | 47,164 | ||||||||||||
| Shares redeemed |
(17,083 | ) | (767,315 | ) | (59,364 | ) | (2,405,016 | ) | ||||||||
| 40,590 | 1,752,876 | 1,566 | (65,657 | ) | ||||||||||||
| Class R6 Shares | ||||||||||||||||
| Shares sold |
24,082 | 1,080,508 | 35,637 | 1,564,651 | ||||||||||||
| Reinvestment |
12,235 | 558,521 | 2,242 | 94,517 | ||||||||||||
| Shares redeemed |
(27,394 | ) | (1,251,980 | ) | (32,034 | ) | (1,334,620 | ) | ||||||||
| 8,923 | 387,049 | 5,845 | 324,548 | |||||||||||||
| Class R Shares | ||||||||||||||||
| Shares sold |
1,107 | 49,414 | 1,469 | 60,884 | ||||||||||||
| Reinvestment |
2,319 | 103,135 | 332 | 13,611 | ||||||||||||
| Shares redeemed |
(16,755 | ) | (703,600 | ) | (3,324 | ) | (145,641 | ) | ||||||||
| (13,329 | ) | (551,051 | ) | (1,523 | ) | (71,146 | ) | |||||||||
| Class P Shares | ||||||||||||||||
| Shares sold |
513,448 | 23,010,236 | 339,311 | 14,793,109 | ||||||||||||
| Reinvestment |
80,631 | 3,671,657 | 10,775 | 459,964 | ||||||||||||
| Shares redeemed |
(87,212 | ) | (3,953,521 | ) | (47,396 | ) | (2,079,651 | ) | ||||||||
| 506,867 | 22,728,372 | 302,690 | 13,173,422 | |||||||||||||
| NET INCREASE/(DECREASE) |
657,453 | $ | 29,320,608 | (205,604 | ) | $ | (8,283,542 | ) | ||||||||
115
GOLDMAN SACHS FUNDAMENTAL EQUITY VALUE FUNDS
Notes to Financial Statements (continued)
August 31, 2022
| 11. SUMMARY OF SHARE TRANSACTIONS (continued) |
| Focused Value Fund | ||||||||||||||||
|
|
|
|||||||||||||||
| For the Fiscal Year Ended August 31, 2022 |
For the Fiscal Year Ended August 31, 2021 |
|||||||||||||||
|
|
|
|||||||||||||||
| Shares | Dollars | Shares | Dollars | |||||||||||||
|
|
|
|||||||||||||||
| Class A Shares | ||||||||||||||||
| Shares sold |
7,679 | $ | 104,758 | 13,820 | $ | 187,410 | ||||||||||
| Reinvestment |
1,229 | 17,568 | 233 | 2,864 | ||||||||||||
| Shares redeemed |
(9,910 | ) | (145,232 | ) | (2,372 | ) | (29,891 | ) | ||||||||
| (1,002 | ) | (22,906 | ) | 11,681 | 160,383 | |||||||||||
| Class C Shares | ||||||||||||||||
| Shares sold |
21,802 | 303,369 | 4,449 | 56,724 | ||||||||||||
| Reinvestment |
205 | 2,875 | 32 | 390 | ||||||||||||
| Shares redeemed |
— | — | (4,012 | ) | (53,213 | ) | ||||||||||
| 22,007 | 306,244 | 469 | 3,901 | |||||||||||||
| Institutional Shares | ||||||||||||||||
| Shares sold |
124,969 | 1,706,005 | 461,883 | 5,966,246 | ||||||||||||
| Reinvestment |
6,555 | 94,204 | 1,558 | 19,225 | ||||||||||||
| Shares redeemed |
(368,709 | ) | (5,584,597 | ) | (138,463 | ) | (1,851,275 | ) | ||||||||
| (237,185 | ) | (3,784,388 | ) | 324,978 | 4,134,196 | |||||||||||
| Investor Shares | ||||||||||||||||
| Reinvestment |
60 | 869 | 58 | 715 | ||||||||||||
| Shares redeemed |
— | — | (2,160 | ) | (27,117 | ) | ||||||||||
| 60 | 869 | (2,102 | ) | (26,402 | ) | |||||||||||
| Class R6 Shares | ||||||||||||||||
| Reinvestment |
61 | 880 | 61 | 749 | ||||||||||||
| Shares redeemed |
— | — | (2,182 | ) | (27,410 | ) | ||||||||||
| 61 | 880 | (2,121 | ) | (26,661 | ) | |||||||||||
| Class R Shares | ||||||||||||||||
| Shares sold |
— | — | 2,009 | 25,005 | ||||||||||||
| Reinvestment |
186 | 2,652 | 85 | 1,033 | ||||||||||||
| Shares redeemed |
— | — | (2,087 | ) | (26,067 | ) | ||||||||||
| 186 | 2,652 | 7 | (29 | ) | ||||||||||||
| Class P Shares | ||||||||||||||||
| Shares sold |
908,004 | 12,665,202 | 1,680,361 | 22,219,682 | ||||||||||||
| Reinvestment |
163,759 | 2,350,232 | 17,987 | 221,552 | ||||||||||||
| Shares redeemed |
(240,447 | ) | (3,262,340 | ) | (237,498 | ) | (3,121,295 | ) | ||||||||
| 831,316 | 11,753,094 | 1,460,850 | 19,319,939 | |||||||||||||
| NET INCREASE |
615,443 | $ | 8,256,445 | 1,793,762 | $ | 23,565,327 | ||||||||||
116
GOLDMAN SACHS FUNDAMENTAL EQUITY VALUE FUNDS
| 11. SUMMARY OF SHARE TRANSACTIONS (continued) |
| Large Cap Value Fund | ||||||||||||||||
|
|
|
|||||||||||||||
| For the Fiscal Year Ended August 31, 2022 |
For the Fiscal Year Ended August 31, 2021 |
|||||||||||||||
|
|
|
|||||||||||||||
| Shares | Dollars | Shares | Dollars | |||||||||||||
|
|
|
|||||||||||||||
| Class A Shares | ||||||||||||||||
| Shares sold |
365,242 | $ | 5,943,759 | 349,972 | $ | 5,579,387 | ||||||||||
| Reinvestment |
563,194 | 9,144,779 | 162,305 | 2,413,491 | ||||||||||||
| Shares redeemed |
(681,679 | ) | (11,082,735 | ) | (976,224 | ) | (15,456,763 | ) | ||||||||
| 246,757 | 4,005,803 | (463,947 | ) | (7,463,885 | ) | |||||||||||
| Class C Shares | ||||||||||||||||
| Shares sold |
56,511 | 851,308 | 33,158 | 494,929 | ||||||||||||
| Reinvestment |
88,611 | 1,339,801 | 33,099 | 462,331 | ||||||||||||
| Shares redeemed |
(190,926 | ) | (2,938,426 | ) | (623,860 | ) | (9,457,795 | ) | ||||||||
| (45,804 | ) | (747,317 | ) | (557,603 | ) | (8,500,535 | ) | |||||||||
| Institutional Shares | ||||||||||||||||
| Shares sold |
626,059 | 10,409,164 | 1,375,088 | 22,207,339 | ||||||||||||
| Reinvestment |
1,247,850 | 20,558,707 | 361,313 | 5,436,359 | ||||||||||||
| Shares redeemed |
(1,719,366 | ) | (28,307,265 | ) | (1,677,335 | ) | (27,508,892 | ) | ||||||||
| 154,543 | 2,660,606 | 59,066 | 134,806 | |||||||||||||
| Service Shares | ||||||||||||||||
| Shares sold |
10,994 | 174,367 | 3,136 | 48,786 | ||||||||||||
| Reinvestment |
2,024 | 32,674 | 692 | 10,246 | ||||||||||||
| Shares redeemed |
(4,778 | ) | (74,784 | ) | (16,547 | ) | (259,774 | ) | ||||||||
| 8,240 | 132,257 | (12,719 | ) | (200,742 | ) | |||||||||||
| Investor Shares | ||||||||||||||||
| Shares sold |
24,532 | 401,303 | 24,135 | 376,684 | ||||||||||||
| Reinvestment |
25,598 | 416,384 | 7,936 | 118,038 | ||||||||||||
| Shares redeemed |
(28,850 | ) | (460,428 | ) | (81,344 | ) | (1,249,105 | ) | ||||||||
| 21,280 | 357,259 | (49,273 | ) | (754,383 | ) | |||||||||||
| Class R6 Shares | ||||||||||||||||
| Shares sold |
60,339 | 1,021,138 | 52,133 | 862,049 | ||||||||||||
| Reinvestment |
12,450 | 210,990 | 4,213 | 65,011 | ||||||||||||
| Shares redeemed |
(35,290 | ) | (611,952 | ) | (64,052 | ) | (1,054,244 | ) | ||||||||
| 37,499 | 620,176 | (7,706 | ) | (127,184 | ) | |||||||||||
| Class R Shares | ||||||||||||||||
| Shares sold |
66,137 | 1,041,116 | 40,768 | 647,742 | ||||||||||||
| Reinvestment |
23,077 | 360,604 | 6,647 | 95,537 | ||||||||||||
| Shares redeemed |
(41,066 | ) | (665,638 | ) | (75,778 | ) | (1,189,156 | ) | ||||||||
| 48,148 | 736,082 | (28,363 | ) | (445,877 | ) | |||||||||||
| Class P Shares | ||||||||||||||||
| Shares sold |
1,459,316 | 24,020,978 | 1,071,554 | 18,047,504 | ||||||||||||
| Reinvestment |
1,381,051 | 23,402,507 | 372,659 | 5,747,842 | ||||||||||||
| Shares redeemed |
(1,475,581 | ) | (24,843,335 | ) | (950,225 | ) | (15,406,066 | ) | ||||||||
| 1,364,786 | 22,580,150 | 493,988 | 8,389,280 | |||||||||||||
| NET INCREASE/(DECREASE) |
1,835,449 | $ | 30,345,016 | (566,557 | ) | $ | (8,968,520 | ) | ||||||||
117
GOLDMAN SACHS FUNDAMENTAL EQUITY VALUE FUNDS
Notes to Financial Statements (continued)
August 31, 2022
| 11. SUMMARY OF SHARE TRANSACTIONS (continued) |
| Mid Cap Value Fund | ||||||||||||||||
|
|
|
|||||||||||||||
| For the Fiscal Year Ended August 31, 2022 |
For the Fiscal Year Ended August 31, 2021 |
|||||||||||||||
|
|
|
|||||||||||||||
| Shares | Dollars | Shares | Dollars | |||||||||||||
|
|
|
|||||||||||||||
| Class A Shares | ||||||||||||||||
| Shares sold |
1,091,758 | $ | 43,233,623 | 1,031,436 | $ | 40,336,696 | ||||||||||
| Reinvestment |
1,933,259 | 76,270,620 | 44,871 | 1,625,681 | ||||||||||||
| Shares redeemed |
(2,406,280 | ) | (95,958,872 | ) | (2,690,532 | ) | (101,945,991 | ) | ||||||||
| 618,737 | 23,545,371 | (1,614,225 | ) | (59,983,614 | ) | |||||||||||
| Class C Shares | ||||||||||||||||
| Shares sold |
54,763 | 1,816,117 | 35,182 | 1,171,604 | ||||||||||||
| Reinvestment |
59,326 | 1,955,389 | — | — | ||||||||||||
| Shares redeemed |
(138,744 | ) | (4,679,204 | ) | (303,124 | ) | (10,089,221 | ) | ||||||||
| (24,655 | ) | (907,698 | ) | (267,942 | ) | (8,917,617 | ) | |||||||||
| Institutional Shares | ||||||||||||||||
| Shares sold |
2,346,250 | 93,437,964 | 1,155,486 | 46,128,697 | ||||||||||||
| Reinvestment |
1,122,095 | 45,050,337 | 47,467 | 1,739,185 | ||||||||||||
| Shares redeemed |
(2,682,482 | ) | (106,188,234 | ) | (2,467,004 | ) | (92,066,490 | ) | ||||||||
| 785,863 | 32,300,067 | (1,264,051 | ) | (44,198,608 | ) | |||||||||||
| Service Shares | ||||||||||||||||
| Shares sold |
276,388 | 10,612,720 | 109,090 | 4,268,167 | ||||||||||||
| Reinvestment |
136,339 | 5,231,527 | 1,886 | 66,820 | ||||||||||||
| Shares redeemed |
(232,747 | ) | (8,929,907 | ) | (310,922 | ) | (11,312,414 | ) | ||||||||
| 179,980 | 6,914,340 | (199,946 | ) | (6,977,427 | ) | |||||||||||
| Investor Shares | ||||||||||||||||
| Shares sold |
1,233,197 | 45,791,416 | 171,226 | 6,545,668 | ||||||||||||
| Reinvestment |
175,218 | 6,717,802 | 6,094 | 214,953 | ||||||||||||
| Shares redeemed |
(420,756 | ) | (15,885,773 | ) | (301,636 | ) | (10,961,443 | ) | ||||||||
| 987,659 | 36,623,445 | (124,316 | ) | (4,200,822 | ) | |||||||||||
| Class R6 Shares | ||||||||||||||||
| Shares sold |
654,916 | 25,788,895 | 454,732 | 17,604,466 | ||||||||||||
| Reinvestment |
282,541 | 11,334,959 | 11,214 | 410,672 | ||||||||||||
| Shares redeemed |
(445,147 | ) | (17,926,659 | ) | (425,465 | ) | (16,518,630 | ) | ||||||||
| 492,310 | 19,197,195 | 40,481 | 1,496,508 | |||||||||||||
| Class R Shares | ||||||||||||||||
| Shares sold |
159,583 | 5,992,308 | 234,713 | 8,995,740 | ||||||||||||
| Reinvestment |
86,479 | 3,263,762 | 729 | 25,504 | ||||||||||||
| Shares redeemed |
(199,386 | ) | (7,485,820 | ) | (307,787 | ) | (11,513,139 | ) | ||||||||
| 46,676 | 1,770,250 | (72,345 | ) | (2,491,895 | ) | |||||||||||
| Class P Shares | ||||||||||||||||
| Shares sold |
334,180 | 13,610,632 | 526,646 | 20,616,514 | ||||||||||||
| Reinvestment |
747,768 | 29,991,781 | 28,656 | 1,049,073 | ||||||||||||
| Shares redeemed |
(521,675 | ) | (21,234,995 | ) | (423,122 | ) | (15,846,115 | ) | ||||||||
| 560,273 | 22,367,418 | 132,180 | 5,819,472 | |||||||||||||
| NET INCREASE/(DECREASE) |
3,646,843 | $ | 141,810,388 | (3,370,164 | ) | $ | (119,454,003 | ) | ||||||||
118
GOLDMAN SACHS FUNDAMENTAL EQUITY VALUE FUNDS
| 11. SUMMARY OF SHARE TRANSACTIONS (continued) |
| Small Cap Value Fund | ||||||||||||||||
|
|
|
|||||||||||||||
| For the Fiscal Year Ended August 31, 2022 |
For the Fiscal Year Ended August 31, 2021 |
|||||||||||||||
|
|
|
|||||||||||||||
| Shares | Dollars | Shares | Dollars | |||||||||||||
|
|
|
|||||||||||||||
| Class A Shares | ||||||||||||||||
| Shares sold |
1,016,199 | $ | 52,298,451 | 1,230,906 | $ | 67,319,753 | ||||||||||
| Reinvestment |
1,548,652 | 77,307,443 | 15,527 | 780,234 | ||||||||||||
| Shares redeemed |
(2,769,477 | ) | (142,660,949 | ) | (3,721,510 | ) | (196,881,407 | ) | ||||||||
| (204,626 | ) | (13,055,055 | ) | (2,475,077 | ) | (128,781,420 | ) | |||||||||
| Class C Shares | ||||||||||||||||
| Shares sold |
22,416 | 731,298 | 25,903 | 972,425 | ||||||||||||
| Reinvestment |
15,673 | 492,910 | — | — | ||||||||||||
| Shares redeemed |
(25,641 | ) | (948,730 | ) | (86,499 | ) | (3,056,637 | ) | ||||||||
| 12,448 | 275,478 | (60,596 | ) | (2,084,212 | ) | |||||||||||
| Institutional Shares | ||||||||||||||||
| Shares sold |
4,448,777 | 259,305,224 | 9,341,548 | 554,439,718 | ||||||||||||
| Reinvestment |
6,413,362 | 358,897,882 | 238,033 | 13,094,190 | ||||||||||||
| Shares redeemed |
(16,849,617 | ) | (997,469,120 | ) | (29,696,072 | ) | (1,786,075,531 | ) | ||||||||
| (5,987,478 | ) | (379,266,014 | ) | (20,116,491 | ) | (1,218,541,623 | ) | |||||||||
| Service Shares | ||||||||||||||||
| Shares sold |
83,082 | 4,086,919 | 251,396 | 12,665,663 | ||||||||||||
| Reinvestment |
97,079 | 4,620,960 | 362 | 17,550 | ||||||||||||
| Shares redeemed |
(239,333 | ) | (11,860,096 | ) | (793,000 | ) | (40,000,177 | ) | ||||||||
| (59,172 | ) | (3,152,217 | ) | (541,242 | ) | (27,316,964 | ) | |||||||||
| Investor Shares | ||||||||||||||||
| Shares sold |
2,020,703 | 109,296,547 | 1,283,937 | 69,289,196 | ||||||||||||
| Reinvestment |
700,738 | 34,646,372 | 11,766 | 585,347 | ||||||||||||
| Shares redeemed |
(2,072,762 | ) | (106,724,172 | ) | (1,822,724 | ) | (99,813,142 | ) | ||||||||
| 648,679 | 37,218,747 | (527,021 | ) | (29,938,599 | ) | |||||||||||
| Class R6 Shares | ||||||||||||||||
| Shares sold |
4,726,559 | 274,470,391 | 6,802,883 | 402,384,039 | ||||||||||||
| Reinvestment |
4,374,531 | 244,668,903 | 130,800 | 7,191,362 | ||||||||||||
| Shares redeemed |
(7,677,920 | ) | (443,747,032 | ) | (12,958,106 | ) | (758,278,892 | ) | ||||||||
| 1,423,170 | 75,392,262 | (6,024,423 | ) | (348,703,491 | ) | |||||||||||
| Class R Shares | ||||||||||||||||
| Shares sold |
213,009 | 10,356,347 | 263,888 | 14,384,017 | ||||||||||||
| Reinvestment |
250,421 | 12,052,746 | — | — | ||||||||||||
| Shares redeemed |
(542,785 | ) | (26,668,443 | ) | (657,475 | ) | (33,897,526 | ) | ||||||||
| (79,355 | ) | (4,259,350 | ) | (393,587 | ) | (19,513,509 | ) | |||||||||
| Class P Shares | ||||||||||||||||
| Shares sold |
696,839 | 39,353,033 | 1,036,383 | 61,390,650 | ||||||||||||
| Reinvestment |
1,101,018 | 61,591,156 | 24,327 | 1,337,472 | ||||||||||||
| Shares redeemed |
(1,482,798 | ) | (79,610,412 | ) | (686,123 | ) | (40,319,485 | ) | ||||||||
| 315,059 | 21,333,777 | 374,587 | 22,408,637 | |||||||||||||
| NET DECREASE |
(3,931,275 | ) | $ | (265,512,372 | ) | (29,763,850 | ) | $ | (1,752,471,181 | ) | ||||||
119
GOLDMAN SACHS FUNDAMENTAL EQUITY VALUE FUNDS
Notes to Financial Statements (continued)
August 31, 2022
| 11. SUMMARY OF SHARE TRANSACTIONS (continued) |
| Small/Mid Cap Value Fund | ||||||||||||||||
|
|
|
|||||||||||||||
| For the Fiscal Year Ended August 31, 2022 |
For the Fiscal Year Ended August 31, 2021 |
|||||||||||||||
|
|
|
|||||||||||||||
| Shares | Dollars | Shares | Dollars | |||||||||||||
|
|
|
|||||||||||||||
| Class A Shares | ||||||||||||||||
| Shares sold |
49,387 | $ | 809,215 | 55,184 | $ | 864,878 | ||||||||||
| Reinvestment |
7,123 | 119,225 | 302 | 4,187 | ||||||||||||
| Shares redeemed |
(24,243 | ) | (407,696 | ) | (23,483 | ) | (325,941 | ) | ||||||||
| 32,267 | 520,744 | 32,003 | 543,124 | |||||||||||||
| Class C Shares | ||||||||||||||||
| Shares sold |
5,354 | 83,081 | 23,361 | 347,476 | ||||||||||||
| Reinvestment |
4,667 | 75,226 | — | — | ||||||||||||
| Shares redeemed |
(28,997 | ) | (458,571 | ) | (19,317 | ) | (288,737 | ) | ||||||||
| (18,976 | ) | (300,264 | ) | 4,044 | 58,739 | |||||||||||
| Institutional Shares | ||||||||||||||||
| Shares sold |
1,334,667 | 22,531,073 | 580,268 | 8,963,655 | ||||||||||||
| Reinvestment |
70,009 | 1,191,559 | 4,243 | 59,578 | ||||||||||||
| Shares redeemed |
(877,236 | ) | (14,873,658 | ) | (134,272 | ) | (2,032,908 | ) | ||||||||
| 527,440 | 8,848,974 | 450,239 | 6,990,325 | |||||||||||||
| Investor Shares | ||||||||||||||||
| Shares sold |
607,274 | 9,838,989 | 709,366 | 11,793,257 | ||||||||||||
| Reinvestment |
47,370 | 800,656 | 540 | 7,543 | ||||||||||||
| Shares redeemed |
(688,133 | ) | (10,797,900 | ) | (55,116 | ) | (788,661 | ) | ||||||||
| (33,489 | ) | (158,255 | ) | 654,790 | 11,012,139 | |||||||||||
| Class R6 Shares | ||||||||||||||||
| Shares sold |
1,747,124 | 29,238,130 | 2,544,113 | 40,710,040 | ||||||||||||
| Reinvestment |
330,864 | 5,624,330 | 31,315 | 439,348 | ||||||||||||
| Shares redeemed |
(1,416,819 | ) | (23,274,689 | ) | (1,517,091 | ) | (23,566,994 | ) | ||||||||
| 661,169 | 11,587,771 | 1,058,337 | 17,582,394 | |||||||||||||
| Class R Shares | ||||||||||||||||
| Shares sold |
1,902 | 31,970 | 1,131 | 17,646 | ||||||||||||
| Reinvestment |
305 | 5,089 | — | — | ||||||||||||
| Shares redeemed |
(859 | ) | (14,597 | ) | (1,788 | ) | (27,296 | ) | ||||||||
| 1,348 | 22,462 | (657 | ) | (9,650 | ) | |||||||||||
| Class P Shares | ||||||||||||||||
| Shares sold |
2,554,772 | 43,023,273 | 2,217,823 | 35,958,146 | ||||||||||||
| Reinvestment |
314,116 | 5,339,404 | 23,673 | 332,143 | ||||||||||||
| Shares redeemed |
(1,675,101 | ) | (27,045,965 | ) | (252,700 | ) | (3,824,460 | ) | ||||||||
| 1,193,787 | 21,316,712 | 1,988,796 | 32,465,829 | |||||||||||||
| NET INCREASE |
2,363,546 | $ | 41,838,144 | 4,187,552 | $ | 68,642,900 | ||||||||||
120
Report of Independent Registered Public
Accounting Firm
To the Board of Trustees of Goldman Sachs Trust and Shareholders of Goldman Sachs Equity Income Fund, Goldman Sachs Focused Value Fund, Goldman Sachs Large Cap Value Fund, Goldman Sachs Mid Cap Value Fund, Goldman Sachs Small Cap Value Fund, and Goldman Sachs Small/Mid Cap Value Fund
Opinions on the Financial Statements
We have audited the accompanying statements of assets and liabilities, including the schedules of investments, of Goldman Sachs Equity Income Fund, Goldman Sachs Focused Value Fund, Goldman Sachs Large Cap Value Fund, Goldman Sachs Mid Cap Value Fund, Goldman Sachs Small Cap Value Fund, and Goldman Sachs Small/Mid Cap Value Fund (six of the funds constituting Goldman Sachs Trust, hereafter collectively referred to as the “Funds”) as of August 31, 2022, the related statements of operations for the year ended August 31, 2022, the statements of changes in net assets for each of the two years in the period ended August 31, 2022, including the related notes, and the financial highlights for each of the periods indicated therein (collectively referred to as the “financial statements”). In our opinion, the financial statements present fairly, in all material respects, the financial position of each of the Funds as of August 31, 2022, the results of each of their operations for the year then ended, the changes in each of their net assets for each of the two years in the period ended August 31, 2022 and each of the financial highlights for each of the periods indicated therein in conformity with accounting principles generally accepted in the United States of America.
Basis for Opinions
These financial statements are the responsibility of the Funds’ management. Our responsibility is to express an opinion on the Funds’ financial statements based on our audits. We are a public accounting firm registered with the Public Company Accounting Oversight Board (United States) (PCAOB) and are required to be independent with respect to the Funds in accordance with the U.S. federal securities laws and the applicable rules and regulations of the Securities and Exchange Commission and the PCAOB.
We conducted our audits of these financial statements in accordance with the standards of the PCAOB. Those standards require that we plan and perform the audit to obtain reasonable assurance about whether the financial statements are free of material misstatement, whether due to error or fraud.
Our audits included performing procedures to assess the risks of material misstatement of the financial statements, whether due to error or fraud, and performing procedures that respond to those risks. Such procedures included examining, on a test basis, evidence regarding the amounts and disclosures in the financial statements. Our audits also included evaluating the accounting principles used and significant estimates made by management, as well as evaluating the overall presentation of the financial statements. Our procedures included confirmation of securities owned as of August 31, 2022 by correspondence with the custodian, transfer agent and brokers; when replies were not received from brokers, we performed other auditing procedures. We believe that our audits provide a reasonable basis for our opinions.
/s/ PricewaterhouseCoopers LLP
Boston, Massachusetts
October 25, 2022
We have served as the auditor of one or more investment companies in the Goldman Sachs fund complex since 2000.
121
GOLDMAN SACHS FUNDAMENTAL EQUITY VALUE FUNDS
Statement Regarding Basis for Approval of Management Agreement (Unaudited)
Background
The Goldman Sachs Equity Income Fund, Goldman Sachs Focused Value Fund, Goldman Sachs Large Cap Value Fund, Goldman Sachs Mid Cap Value Fund, Goldman Sachs Small Cap Value Fund, and Goldman Sachs Small/Mid Cap Value Fund (the “Funds”) are investment portfolios of Goldman Sachs Trust (the “Trust”). The Board of Trustees oversees the management of the Trust and reviews the investment performance and expenses of the Funds at regularly scheduled meetings held throughout the year. In addition, the Board of Trustees determines annually whether to approve the continuance of the Trust’s investment management agreement (the “Management Agreement”) with Goldman Sachs Asset Management, L.P. (the “Investment Adviser”) on behalf of the Funds.
The Management Agreement was most recently approved for continuation until June 30, 2023 by the Board of Trustees, including those Trustees who are not parties to the Management Agreement or “interested persons” (as defined in the Investment Company Act of 1940, as amended) of any party thereto (the “Independent Trustees”), at a meeting held on June 14-15, 2022 (the “Annual Meeting”).
The review process undertaken by the Trustees spans the course of the year and culminates with the Annual Meeting. To assist the Trustees in their deliberations, the Trustees have established a Contract Review Committee (the “Committee”), comprised of the Independent Trustees. The Committee held two meetings over the course of the year since the Management Agreement was last approved. At those Committee meetings, regularly scheduled Board or other committee meetings, and/or the Annual Meeting, matters relevant to the renewal of the Management Agreement were considered by the Board, or the Independent Trustees, as applicable. With respect to each Fund, such matters included:
| (a) | the nature and quality of the advisory, administrative, and other services provided to the Fund by the Investment Adviser and its affiliates, including information about: |
| (i) | the structure, staff, and capabilities of the Investment Adviser and its portfolio management teams; |
| (ii) | the groups within the Investment Adviser and its affiliates that support the portfolio management teams or provide other types of necessary services, including fund services groups (e.g., accounting and financial reporting, tax, shareholder services, and operations); controls and risk management groups (e.g., legal, compliance, valuation oversight, credit risk management, internal audit, compliance testing, market risk analysis, finance, and central funding); sales and distribution support groups, and others (e.g., information technology and training); |
| (iii) | trends in employee headcount; |
| (iv) | the Investment Adviser’s financial resources and ability to hire and retain talented personnel and strengthen its operations; and |
| (v) | the parent company’s support of the Investment Adviser and its mutual fund business, as expressed by the firm’s senior management; |
| (b) | information on the investment performance of the Fund, including comparisons to the performance of similar mutual funds, as provided by a third-party mutual fund data provider engaged as part of the contract review process (the “Outside Data Provider”), a benchmark performance index, and (in the case of the Mid Cap Value Fund and Small Cap Value Fund) a composite of accounts with comparable investment strategies managed by the Investment Adviser; and information on general investment outlooks in the markets in which the Fund invests; |
| (c) | information provided by the Investment Adviser indicating the Investment Adviser’s views on whether the Fund’s peer group and/or benchmark index had high, medium, or low relevance given the Fund’s particular investment strategy; |
| (d) | the terms of the Management Agreement and other agreements with affiliated service providers entered into by the Trust on behalf of the Fund; |
| (e) | fee and expense information for the Fund, including: |
| (i) | the relative management fee and expense levels of the Fund as compared to those of comparable funds managed by other advisers, as provided by the Outside Data Provider; |
| (ii) | the Fund’s expense trends over time; and |
| (iii) | to the extent the Investment Adviser manages other types of accounts (such as bank collective trusts, private wealth management accounts, institutional separate accounts, sub-advised mutual funds, and non-U.S. funds) having investment objectives and policies similar to those of the Fund, comparative information on the advisory fees charged and services provided to those accounts by the Investment Adviser; |
| (f) | with respect to the extensive investment performance and expense comparison data provided by the Outside Data Provider, its processes in producing that data for the Fund; |
| (g) | the undertakings of the Investment Adviser and its affiliates to implement fee waivers and/or expense limitations; |
| (h) | information relating to the profitability of the Management Agreement and the transfer agency and distribution and service arrangements of the Fund to the Investment Adviser and its affiliates; |
122
GOLDMAN SACHS FUNDAMENTAL EQUITY VALUE FUNDS
Statement Regarding Basis for Approval of Management Agreement (Unaudited) (continued)
| (i) | whether the Fund’s existing management fee schedule adequately addressed any economies of scale; |
| (j) | a summary of the “fall-out” benefits derived by the Investment Adviser and its affiliates from their relationships with the Fund, including the fees received by the Investment Adviser’s affiliates from the Fund for transfer agency, portfolio trading, distribution and other services; |
| (k) | a summary of potential benefits derived by the Fund as a result of its relationship with the Investment Adviser; |
| (l) | information regarding commissions paid by the Fund and broker oversight, an update on the Investment Adviser’s soft dollars practices, other information regarding portfolio trading, and how the Investment Adviser carries out its duty to seek best execution; |
| (m) | portfolio manager ownership of Fund shares; the manner in which portfolio manager compensation is determined; and the number and types of accounts managed by the portfolio managers; |
| (n) | the nature and quality of the services provided to the Fund by its unaffiliated service providers, and the Investment Adviser’s general oversight and evaluation (including reports on due diligence) of those service providers as part of the administrative services provided under the Management Agreement; and |
| (o) | the Investment Adviser’s processes and policies addressing various types of potential conflicts of interest; its approach to risk management; the annual review of the effectiveness of the Fund’s compliance program; and periodic compliance reports. |
The Trustees also received an overview of the Funds’ distribution arrangements. They received information regarding the Funds’ assets, share purchase and redemption activity, and payment of distribution, service, and shareholder administration fees, as applicable. Information was also provided to the Trustees relating to revenue sharing payments made by and services provided by the Investment Adviser and its affiliates to intermediaries that promote the sale, distribution, and/or servicing of Fund shares. The Independent Trustees also discussed the broad range of other investment choices that are available to Fund investors, including the availability of comparable funds managed by other advisers.
The presentations made at the Board and Committee meetings and at the Annual Meeting encompassed the Funds and other mutual funds for which the Board of Trustees has responsibility. In evaluating the Management Agreement at the Annual Meeting, the Trustees relied upon their knowledge, resulting from their meetings and other interactions throughout the year, of the Investment Adviser and its affiliates, their services, and the Funds. In conjunction with these meetings, the Trustees received written materials and oral presentations on the topics covered, and the Investment Adviser addressed the questions and concerns of the Trustees, including concerns regarding the investment performance of certain of the funds they oversee. The Independent Trustees were advised by their independent legal counsel regarding their responsibilities and other regulatory requirements related to the approval and continuation of mutual fund investment management agreements under applicable law. In addition, the Investment Adviser and its affiliates provided the Independent Trustees with a written response to a formal request for information sent on behalf of the Independent Trustees by their independent legal counsel. During the course of their deliberations, the Independent Trustees met in executive sessions with their independent legal counsel, without representatives of the Investment Adviser or its affiliates present.
Nature, Extent, and Quality of the Services Provided Under the Management Agreement
As part of their review, the Trustees considered the nature, extent, and quality of the services provided to the Funds by the Investment Adviser. In this regard, the Trustees considered both the investment advisory services and non-advisory services that are provided by the Investment Adviser and its affiliates. The Trustees noted the transition in the leadership and changes in personnel of various of the Investment Adviser’s portfolio management teams that had occurred in recent periods, and the ongoing recruitment efforts aimed at bringing high quality investment talent to the Investment Adviser. They also noted the Investment Adviser’s commitment to maintaining high quality systems and expending substantial resources to respond to ongoing changes to the market, regulatory and control environment in which the Funds and their service providers operate, including developments associated with the COVID-19 pandemic, geopolitical events, and economic sanctions, as well as the efforts of the Investment Adviser and its affiliates to combat cyber security risks. The Trustees also considered information regarding the Investment Adviser’s business continuity planning and remote operations capabilities. The Trustees concluded that the Investment Adviser continued to commit substantial financial and operational resources to the Funds and expressed confidence that the Investment Adviser would continue to do so in the future. The Trustees also recognized that the Investment Adviser had made significant commitments to address regulatory compliance requirements applicable to the Funds and the Investment Adviser and its affiliates.
Investment Performance
The Trustees also considered the investment performance of the Funds. In this regard, they compared the investment performance of each Fund to its peers using rankings and ratings compiled by the Outside Data Provider as of December 31, 2021,
123
GOLDMAN SACHS FUNDAMENTAL EQUITY VALUE FUNDS
Statement Regarding Basis for Approval of Management Agreement (Unaudited) (continued)
and updated performance information prepared by the Investment Adviser using the peer group identified by the Outside Data Provider as of March 31, 2022. The information on each Fund’s investment performance was provided for the one-, three-, five-, and ten-year periods ending on the applicable dates, to the extent that each Fund had been in existence for those periods. The Trustees also reviewed each Fund’s investment performance relative to its performance benchmark. As part of this review, they considered the investment performance trends of the Funds over time, and reviewed the investment performance of each Fund in light of its investment objective and policies and market conditions. The Trustees also received information comparing the Mid Cap Value Fund’s and Small Cap Value Fund’s performance to that of composites of accounts with comparable investment strategies managed by the Investment Adviser.
In addition, the Trustees considered materials prepared and presentations made by the Investment Adviser’s senior management and portfolio management personnel in which Fund performance was assessed. The Trustees also considered the Investment Adviser’s periodic reports with respect to the Funds’ risk profiles, and how the Investment Adviser’s approach to risk monitoring and management influences portfolio management.
The Trustees observed that the Equity Income Fund’s Institutional Shares had placed in the top half of the Fund’s peer group for the one-year period and in the third quartile for the three-, five-, and ten-year periods, and had outperformed the Fund’s benchmark index for the one-year period and underperformed for the three-, five-, and ten-year periods ended March 31, 2022. They considered that the Focused Value Fund’s Institutional Shares had placed in the top half of the Fund’s peer group for the one-year period, in the third quartile for the three-year period, and in the fourth quartile for the five-year period, and had outperformed the Fund’s benchmark index for the one-, three-, and five-year periods ended March 31, 2022. The Trustees noted that the Large Cap Value Fund’s Institutional Shares had placed in the in the top half of the Fund’s peer group for the one-year period, in the third quartile for the three- and ten-year periods, and in the fourth quartile for the five-year period, and had outperformed the Fund’s benchmark index for the one- and three-year periods and underperformed for the five- and ten-year periods ended March 31, 2022. They observed that the Mid Cap Value Fund’s Institutional Shares had placed in the top half of the Fund’s peer group for the one-, three-, and five-year periods and in the third quartile for the ten-year period, and had outperformed the Fund’s benchmark index for the one-, three-, and five-year periods and underperformed for the ten-year period ended March 31, 2022. The Trustees considered that the Small Cap Value Fund’s Institutional Shares had placed in the top half of the Fund’s peer group for the one-year period, in the third quartile for the ten-year period, and in the fourth quartile for the three- and five-year periods, and had outperformed the Fund’s benchmark index for the one- and ten-year periods and underperformed for the three- and five-year periods ended March 31, 2022. They noted that the Small/Mid Cap Value Fund’s Institutional Shares had placed in the top half of the Fund’s peer group for the one- and three-year periods and in the third quartile for the five-year period, and had outperformed the Fund’s benchmark index for the one-, three-, and five-year periods ended March 31, 2022. The Trustees observed that the Small Cap Value Fund and Small/Mid Cap Value Fund had each experienced certain portfolio management changes in 2022.
Costs of Services Provided and Competitive Information
The Trustees considered the contractual terms of the Management Agreement and the fee rates payable by each Fund thereunder. In this regard, the Trustees considered information on the services rendered by the Investment Adviser to the Funds, which included both advisory and administrative services that were directed to the needs and operations of the Funds as registered mutual funds.
In particular, the Trustees reviewed analyses prepared by the Outside Data Provider regarding the expense rankings of the Funds. The analyses provided a comparison of each Fund’s management fee and breakpoints to those of a relevant peer group and category universe; an expense analysis which compared each Fund’s overall net and gross expenses to a peer group and a category universe; and data comparing each Fund’s net expenses to the peer and category medians. The analyses also compared each Fund’s other expenses and fee waivers/reimbursements to those of the peer group and category medians. The Trustees concluded that the comparisons provided by the Outside Data Provider were useful in evaluating the reasonableness of the management fees and total expenses paid by the Funds.
In addition, the Trustees considered the Investment Adviser’s undertakings to implement fee waivers and/or expense limitations. The Trustees also noted that certain changes were being made to existing fee waiver or expense limitation arrangements of the Focused Value Fund that would have the effect of decreasing total Fund expenses, and that certain changes were being made to existing fee waiver or expense reimbursement arrangements of the Small Cap Value Fund that would have the effect of decreasing expenses of Class A, Class C, Investor, and Class R Shares of the Fund, with such changes taking effect in connection with each Fund’s next annual registration statement update. They also considered, to the extent that the Investment Adviser manages other types of accounts having investment objectives and policies similar to those of the Funds, comparative fee information for services provided by the Investment Adviser to those accounts, and information that indicated that services
124
GOLDMAN SACHS FUNDAMENTAL EQUITY VALUE FUNDS
Statement Regarding Basis for Approval of Management Agreement (Unaudited) (continued)
provided to the Funds differed in various significant respects from the services provided to other types of accounts which, in many cases, operated under less stringent legal and regulatory structures, required fewer services from the Investment Adviser to a smaller number of client contact points, and were less time-intensive.
In addition, the Trustees noted that shareholders are able to redeem their shares at any time if shareholders believe that the Fund fees and expenses are too high or if they are dissatisfied with the performance of the Fund.
Profitability
The Trustees reviewed each Fund’s contribution to the Investment Adviser’s revenues and pre-tax profit margins. In this regard the Trustees noted that they had received, among other things, profitability analyses and summaries, revenue and expense schedules by Fund and by function (i.e., investment management, transfer agency and distribution and service), and information on the Investment Adviser’s expense allocation methodology. They observed that the profitability and expense figures are substantially similar to those used by the Investment Adviser for many internal purposes, including compensation decisions among various business groups, and are thus subject to a vigorous internal debate about how certain revenue and expenses should be allocated. The Trustees also noted that the internal audit group within the Goldman Sachs organization periodically audits the expense allocation methodology and that the internal audit group was satisfied with the reasonableness, consistency, and accuracy of the Investment Adviser’s expense allocation methodology. Profitability data for each Fund was provided for 2021 and 2020, and the Trustees considered this information in relation to the Investment Adviser’s overall profitability.
Economies of Scale
The Trustees considered the information that had been provided regarding whether there have been economies of scale with respect to the management of the Funds. The Trustees also considered the breakpoints in the fee rate payable under the Management Agreement for each of the Funds at the following annual percentage rates of the average daily net assets of the Funds:
| Equity Income Fund |
Focused Value Fund |
Large Cap Value |
Mid Cap Value |
Small Cap Value |
Small/Mid Cap Value Fund |
|||||||||||||||||||
| First $1 billion | 0.69 | % | 0.69 | % | 0.75 | % | 0.75 | % | 0.98 | % | 0.80 | % | ||||||||||||
| Next $1 billion | 0.62 | 0.62 | 0.68 | 0.75 | 0.98 | 0.80 | ||||||||||||||||||
| Next $3 billion | 0.59 | 0.59 | 0.65 | 0.68 | 0.88 | 0.72 | ||||||||||||||||||
| Next $3 billion | 0.58 | 0.58 | 0.64 | 0.65 | 0.84 | 0.68 | ||||||||||||||||||
| Over $8 billion | 0.57 | 0.57 | 0.63 | 0.64 | 0.82 | 0.67 | ||||||||||||||||||
The Trustees noted that the breakpoints were designed to share potential economies of scale, if any, with the Funds and their shareholders as assets under management reach those asset levels. The Trustees considered the amounts of assets in the Funds; the Funds’ recent share purchase and redemption activity; the information provided by the Investment Adviser relating to the costs of the services provided by the Investment Adviser and its affiliates and their realized profits; information comparing fee rates charged by the Investment Adviser with fee rates charged to other funds in the peer groups; and the Investment Adviser’s undertakings to waive a portion of its management fee for the Large Cap Value Fund and to limit certain expenses of the Funds that exceed specified levels, as well as Goldman Sachs & Co. LLC’s (“Goldman Sachs”) undertaking to waive a portion of the transfer agency fees paid by each Fund’s Class A, Class C, Investor, and Class R Shares. Upon reviewing these matters at the Annual Meeting, the Trustees concluded that the fee breakpoints represented a means of assuring that benefits of scalability, if any, would be passed along to shareholders at the specified asset levels. They also noted that the Investment Adviser had passed along savings to shareholders of the Small Cap Value Fund, which had asset levels above at least the first breakpoint during the prior fiscal year.
Other Benefits to the Investment Adviser and Its Affiliates
The Trustees also considered the other benefits derived by the Investment Adviser and its affiliates from their relationships with the Funds as stated above, including: (a) transfer agency fees received by Goldman Sachs; (b) brokerage and futures commissions earned by Goldman Sachs for executing securities and futures transactions on behalf of the Funds; (c) research received by the Investment Adviser from broker-dealers in exchange for executing certain transactions on behalf of the Funds; (d) trading efficiencies resulting from aggregation of orders of the Funds with those for other funds or accounts managed by the Investment Adviser; (e) fees earned by the Investment Adviser for managing the fund in which the Funds’ securities lending cash collateral is invested; (f) the Investment Adviser’s ability to leverage the infrastructure designed to service the Funds on behalf of its other clients; (g) the Investment Adviser’s ability to cross-market other products and services to Fund shareholders;
125
GOLDMAN SACHS FUNDAMENTAL EQUITY VALUE FUNDS
Statement Regarding Basis for Approval of Management Agreement (Unaudited) (continued)
(h) Goldman Sachs’ retention of certain fees as Fund Distributor; (i) the Investment Adviser’s ability to negotiate better pricing with custodians on behalf of its other clients, as a result of the relationship with the Funds; (j) the investment of cash and cash collateral in money market funds managed by the Investment Adviser that will result in increased assets under management for those money market funds; (k) the investment in exchange-traded funds (“ETFs”) managed by the Investment Adviser that will result in increased assets under management for those ETFs and may facilitate the development of the Investment Adviser’s ETF advisory business; and (l) the possibility that the working relationship between the Investment Adviser and the Funds’ third-party service providers may cause those service providers to be more likely to do business with other areas of Goldman Sachs. In the course of considering the foregoing, the Independent Trustees requested and received further information quantifying certain of these fall-out benefits.
Other Benefits to the Funds and Their Shareholders
The Trustees also noted that the Funds receive certain other potential benefits as a result of their relationship with the Investment Adviser, including: (a) trading efficiencies resulting from aggregation of orders of the Funds with those of other funds or accounts managed by the Investment Adviser; (b) enhanced servicing from vendors due to the volume of business generated by the Investment Adviser and its affiliates; (c) enhanced servicing from broker-dealers due to the volume of business generated by the Investment Adviser and its affiliates; (d) the advantages received from the Investment Adviser’s knowledge and experience gained from managing other accounts and products; (e) the Investment Adviser’s ability to hire and retain qualified personnel to provide services to the Funds because of the reputation of the Goldman Sachs organization; (f) the Funds’ access, through the Investment Adviser, to certain firm-wide resources (e.g., proprietary risk management systems and databases), subject to certain restrictions; and (g) the Funds’ access to certain affiliated distribution channels. In addition, the Trustees noted the competitive nature of the mutual fund marketplace, and considered that many of the Funds’ shareholders invested in the Funds in part because of the Funds’ relationship with the Investment Adviser and that those shareholders have a general expectation that the relationship will continue.
Conclusion
In connection with their consideration of the Management Agreement, the Trustees gave weight to each of the factors described above, but did not identify any particular factor as controlling their decision. After deliberation and consideration of all of the information provided, including the factors described above, the Trustees concluded, in the exercise of their business judgment, that the management fees paid by each of the Funds were reasonable in light of the services provided to it by the Investment Adviser, the Investment Adviser’s costs and each Fund’s current and reasonably foreseeable asset levels. The Trustees unanimously concluded that the Investment Adviser’s continued management likely would benefit each Fund and its shareholders and that the Management Agreement should be approved and continued with respect to each Fund until June 30, 2023.
126
GOLDMAN SACHS FUNDAMENTAL EQUITY VALUE FUNDS
Fund Expenses — Six Month Period Ended August 31, 2022 (Unaudited)
As a shareholder of Class A, Class C, Institutional, Service, Investor, Class R6, Class R and Class P Shares of a Fund, you incur two types of costs: (1) transaction costs, including sales charges on purchase payments (with respect to Class A Shares), contingent deferred sales charges on redemptions (with respect to Class C Shares), and (2) ongoing costs, including management fees; distribution and/or service (12b-1) fees (with respect to Class A, Class C, Service Class R Shares); and other Fund expenses. This example is intended to help you understand your ongoing costs (in dollars) of investing in Class A, Class C, Institutional, Service, Investor, Class R6, Class R and Class P Shares of the Funds and to compare these costs with the ongoing costs of investing in other mutual funds.
The example is based on an investment of $1,000 invested at the beginning of the period and held for the entire period from March 1, 2022 through August 31, 2022, which represents a period of 184 days of a 365 day year.
Actual Expenses — The first line under each share class in the table below provides information about actual account values and actual expenses. You may use the information in this line, together with the amount you invested, to estimate the expenses that you paid over the period. Simply divide your account value by $1,000 (for example, an $8,600 account value divided by $1,000=8.6), then multiply the result by the number in the first line under the heading entitled “Expenses Paid” to estimate the expenses you paid on your account during this period.
Hypothetical Example for Comparison Purposes — The second line under each share class in the table below provides information about hypothetical account values and hypothetical expenses based on the Funds’ actual net expense ratios and an assumed rate of return of 5% per year before expenses, which is not the Funds’ actual return. The hypothetical account values and expenses may not be used to estimate the actual ending account balance or expenses you paid for the period. You may use this information to compare the ongoing costs of investing in the Funds and other funds. To do so, compare this 5% hypothetical example with the 5% hypothetical examples that appear in the shareholder reports of the other funds.
Please note that the expenses shown in the table are meant to highlight your ongoing costs only and do not reflect any transactional costs, such as sales charges, redemption fees, or exchange fees. Therefore, the second line of the table is useful in comparing ongoing costs only, and will not help you determine the relative total costs of owning different funds. In addition, if these transactional costs were included, your costs would have been higher:
| Equity Income Fund | Focused Value Fund | Large Cap Value Fund | ||||||||||||||||||||||||||||||||||
| Share Class | Beginning Account Value 3/1/22 |
Ending Account Value 8/31/22 |
Expenses Paid for the 6 months ended 8/31/2022* |
Beginning Account Value 3/1/22 |
Ending Account Value 8/31/22 |
Expenses Paid for the 6 months ended 8/31/2022* |
Beginning Account Value 3/1/22 |
Ending Account Value 8/31/22 |
Expenses Paid for the 6 months ended 8/31/2022* |
|||||||||||||||||||||||||||
| Class A | ||||||||||||||||||||||||||||||||||||
|
Actual |
$ | 1,000.00 | $ | 952.72 | $ | 5.12 | $ | 1,000.00 | $ | 919.78 | $ | 5.03 | $ | 1,000.00 | $ | 934.12 | $ | 5.07 | ||||||||||||||||||
|
Hypothetical 5% return |
1,000.00 | 1,019.96 | + | 5.30 | 1,000.00 | 1,019.96 | + | 5.30 | 1,000.00 | 1,019.96 | + | 5.30 | ||||||||||||||||||||||||
| Class C | ||||||||||||||||||||||||||||||||||||
|
Actual |
1,000.00 | 949.08 | 8.79 | 1,000.00 | 916.55 | 8.65 | 1,000.00 | 931.03 | 8.71 | |||||||||||||||||||||||||||
|
Hypothetical 5% return |
1,000.00 | 1,016.18 | + | 9.10 | 1,000.00 | 1,016.18 | + | 9.10 | 1,000.00 | 1,016.18 | + | 9.10 | ||||||||||||||||||||||||
| Institutional | ||||||||||||||||||||||||||||||||||||
|
Actual |
1,000.00 | 954.41 | 3.60 | 1,000.00 | 921.46 | 3.54 | 1,000.00 | 936.16 | 3.56 | |||||||||||||||||||||||||||
|
Hypothetical 5% return |
1,000.00 | 1,021.53 | + | 3.72 | 1,000.00 | 1,021.53 | + | 3.72 | 1,000.00 | 1,021.53 | + | 3.72 | ||||||||||||||||||||||||
| Service | ||||||||||||||||||||||||||||||||||||
|
Actual |
1,000.00 | 951.78 | 6.05 | N/A | N/A | N/A | 1,000.00 | 933.87 | 6.00 | |||||||||||||||||||||||||||
|
Hypothetical 5% return |
1,000.00 | 1,019.00 | + | 6.26 | N/A | N/A | N/A | 1,000.00 | 1,019.00 | + | 6.26 | |||||||||||||||||||||||||
| Investor | ||||||||||||||||||||||||||||||||||||
|
Actual |
1,000.00 | 954.09 | 3.89 | 1,000.00 | 921.18 | 3.83 | 1,000.00 | 935.36 | 3.85 | |||||||||||||||||||||||||||
|
Hypothetical 5% return |
1,000.00 | 1,021.22 | + | 4.02 | 1,000.00 | 1,021.22 | + | 4.02 | 1,000.00 | 1,021.22 | + | 4.02 | ||||||||||||||||||||||||
| Class R6 | ||||||||||||||||||||||||||||||||||||
|
Actual |
1,000.00 | 954.25 | 3.55 | 1,000.00 | 921.29 | 3.49 | 1,000.00 | 936.16 | 3.51 | |||||||||||||||||||||||||||
|
Hypothetical 5% return |
1,000.00 | 1,021.58 | + | 3.67 | 1,000.00 | 1,021.58 | + | 3.67 | 1,000.00 | 1,021.58 | + | 3.67 | ||||||||||||||||||||||||
| Class R | ||||||||||||||||||||||||||||||||||||
|
Actual |
1,000.00 | 951.76 | 6.35 | 1,000.00 | 918.61 | 6.24 | 1,000.00 | 932.95 | 6.29 | |||||||||||||||||||||||||||
|
Hypothetical 5% return |
1,000.00 | 1,018.70 | + | 6.56 | 1,000.00 | 1,018.70 | + | 6.56 | 1,000.00 | 1,018.70 | + | 6.56 | ||||||||||||||||||||||||
| Class P | ||||||||||||||||||||||||||||||||||||
|
Actual |
1,000.00 | 954.25 | 3.55 | 1,000.00 | 921.29 | 3.49 | 1,000.00 | 935.56 | 3.51 | |||||||||||||||||||||||||||
|
Hypothetical 5% return |
1,000.00 | 1,021.58 | + | 3.67 | 1,000.00 | 1,021.58 | + | 3.67 | 1,000.00 | 1,021.58 | + | 3.67 | ||||||||||||||||||||||||
| + | Hypothetical expenses are based on each Fund’s actual annualized net expense ratios and an assumed rate of return of 5% per year before expenses. |
| * | Expenses for each share class are calculated using each Fund’s annualized net expense ratio for each class, which represents the ongoing expenses as a percentage of net assets for the six months ended August 31, 2022. Expenses are calculated by multiplying the annualized net expense ratio by the average account value for the period; then multiplying the result by the number of days in the most recent fiscal half year; and then dividing that result by the number of days in the fiscal year. The annualized net expense ratios for the period were as follows: |
| Fund | Class A | Class C | Institutional | Service | Investor | Class R6 | Class R | Class P | ||||||||||||||||||||||||
| Equity Income |
1.04 | % | 1.79 | % | 0.73 | % | 1.23 | % | 0.79 | % | 0.72 | % | 1.29 | % | 0.72 | % | ||||||||||||||||
| Focused Value |
1.04 | 1.79 | 0.73 | N/A | 0.79 | 0.72 | 1.29 | 0.72 | ||||||||||||||||||||||||
| Large Cap Value |
1.04 | 1.79 | 0.73 | 1.23 | 0.79 | 0.72 | 1.29 | 0.72 | ||||||||||||||||||||||||
127
GOLDMAN SACHS FUNDAMENTAL EQUITY VALUE FUNDS
Fund Expenses — Six Month Period Ended August 31, 2022 (Unaudited) (continued)
| Mid Cap Value Fund | Small Cap Value Fund | Small/Mid Cap Value Fund | ||||||||||||||||||||||||||||||||||
| Share Class | Beginning Account Value 3/1/22 |
Ending Account Value 8/31/22 |
Expenses Paid for the 6 months ended 8/31/2022* |
Beginning Account Value 3/1/22 |
Ending Account Value 8/31/22 |
Expenses Paid for the 6 months ended 8/31/2022* |
Beginning Account Value 3/1/22 |
Ending Account Value 8/31/22 |
Expenses Paid for the 6 months ended 8/31/2022* |
|||||||||||||||||||||||||||
| Class A | ||||||||||||||||||||||||||||||||||||
|
Actual |
$ | 1,000.00 | $ | 933.92 | $ | 5.83 | $ | 1,000.00 | $ | 892.21 | $ | 6.15 | $ | 1,000.00 | $ | 888.23 | $ | 5.71 | ||||||||||||||||||
|
Hypothetical 5% return |
1,000.00 | 1,019.18 | + | 6.09 | 1,000.00 | 1,018.70 | + | 6.56 | 1,000.00 | 1,019.16 | + | 6.11 | ||||||||||||||||||||||||
| Class C | ||||||||||||||||||||||||||||||||||||
|
Actual |
1,000.00 | 930.22 | 9.47 | 1,000.00 | 888.71 | 9.71 | 1,000.00 | 885.16 | 9.27 | |||||||||||||||||||||||||||
|
Hypothetical 5% return |
1,000.00 | 1,015.40 | + | 9.89 | 1,000.00 | 1,014.92 | + | 10.36 | 1,000.00 | 1,015.38 | + | 9.91 | ||||||||||||||||||||||||
| Institutional | ||||||||||||||||||||||||||||||||||||
|
Actual |
1,000.00 | 935.39 | 4.08 | 1,000.00 | 893.79 | 4.63 | 1,000.00 | 890.40 | 4.00 | |||||||||||||||||||||||||||
|
Hypothetical 5% return |
1,000.00 | 1,020.99 | + | 4.26 | 1,000.00 | 1,020.32 | + | 4.94 | 1,000.00 | 1,020.97 | + | 4.28 | ||||||||||||||||||||||||
| Service | ||||||||||||||||||||||||||||||||||||
|
Actual |
1,000.00 | 933.16 | 6.51 | 1,000.00 | 891.60 | 7.01 | N/A | N/A | N/A | |||||||||||||||||||||||||||
|
Hypothetical 5% return |
1,000.00 | 1,018.47 | + | 6.80 | 1,000.00 | 1,017.80 | + | 7.48 | N/A | N/A | N/A | |||||||||||||||||||||||||
| Investor | ||||||||||||||||||||||||||||||||||||
|
Actual |
1,000.00 | 935.03 | 4.62 | 1,000.00 | 893.56 | 4.96 | 1,000.00 | 889.68 | 4.52 | |||||||||||||||||||||||||||
|
Hypothetical 5% return |
1,000.00 | 1,020.43 | + | 4.82 | 1,000.00 | 1,019.96 | + | 5.30 | 1,000.00 | 1,020.42 | + | 4.84 | ||||||||||||||||||||||||
| Class R6 | ||||||||||||||||||||||||||||||||||||
|
Actual |
1,000.00 | 935.84 | 4.03 | 1,000.00 | 893.72 | 4.58 | 1,000.00 | 890.27 | 3.95 | |||||||||||||||||||||||||||
|
Hypothetical 5% return |
1,000.00 | 1,021.04 | + | 4.21 | 1,000.00 | 1,020.37 | + | 4.89 | 1,000.00 | 1,021.02 | + | 4.23 | ||||||||||||||||||||||||
| Class R | ||||||||||||||||||||||||||||||||||||
|
Actual |
1,000.00 | 932.90 | 7.05 | 1,000.00 | 891.34 | 7.34 | 1,000.00 | 887.43 | 6.90 | |||||||||||||||||||||||||||
|
Hypothetical 5% return |
1,000.00 | 1,017.91 | + | 7.36 | 1,000.00 | 1,017.44 | + | 7.83 | 1,000.00 | 1,017.90 | + | 7.38 | ||||||||||||||||||||||||
| Class P |
||||||||||||||||||||||||||||||||||||
|
Actual |
1,000.00 | 935.58 | 4.03 | 1,000.00 | 893.90 | 4.58 | 1,000.00 | 890.27 | 3.95 | |||||||||||||||||||||||||||
|
Hypothetical 5% return |
1,000.00 | 1,021.04 | + | 4.21 | 1,000.00 | 1,020.37 | + | 4.89 | 1,000.00 | 1,021.02 | + | 4.23 | ||||||||||||||||||||||||
| + | Hypothetical expenses are based on each Fund’s actual annualized net expense ratios and an assumed rate of return of 5% per year before expenses. |
| * | Expenses for each share class are calculated using each Fund’s annualized net expense ratio for each class, which represents the ongoing expenses as a percentage of net assets for the six months ended August 31, 2022. Expenses are calculated by multiplying the annualized net expense ratio by the average account value for the period; then multiplying the result by the number of days in the most recent fiscal half year; and then dividing that result by the number of days in the fiscal year. The annualized net expense ratios for the period were as follows: |
| Fund | Class A | Class C | Institutional | Service | Investor | Class R6 | Class R | Class P | ||||||||||||||||||||||||
| Mid Cap Value |
1.20 | % | 1.95 | % | 0.84 | % | 1.34 | % | 0.95 | % | 0.83 | % | 1.45 | % | 0.83 | % | ||||||||||||||||
| Small Cap Value |
1.29 | 2.04 | 0.97 | 1.47 | 1.04 | 0.96 | 1.54 | 0.96 | ||||||||||||||||||||||||
| Small/Mid Cap Value |
1.20 | 1.95 | 0.84 | N/A | 0.95 | 0.83 | 1.45 | 0.83 | ||||||||||||||||||||||||
128
GOLDMAN SACHS FUNDAMENTAL EQUITY VALUE FUNDS
Trustees and Officers (Unaudited)
Independent Trustees
| Name, Address and Age1 |
Position(s) Held with the Trust |
Term of Office and Length of Time Served2 |
Principal Occupation(s) During Past 5 Years |
Number of Portfolios in Fund Complex Overseen by Trustee3 |
Other Directorships Held by Trustee4 | |||||
| Jessica Palmer Age: 73 |
Chair of the Board of Trustees | Since 2018 (Trustee since 2007) | Ms. Palmer is retired. She was formerly Consultant, Citigroup Human Resources Department (2007-2008); Managing Director, Citigroup Corporate and Investment Banking (previously, Salomon Smith Barney/Salomon Brothers) (1984-2006). Ms. Palmer was a Member of the Board of Trustees of Indian Mountain School (private elementary and secondary school) (2004-2009).
Chair of the Board of Trustees — Goldman Sachs Trust and Goldman Sachs Variable Insurance Trust. |
103 | None | |||||
| Dwight L. Bush Age: 65 |
Trustee | Since 2020 | Ambassador Bush is President and CEO of D.L. Bush & Associates (a financial advisory and private investment firm) (2002-2014 and 2017-Present); Director of MoneyLion, Inc. (an operator of a data-driven, digital financial platform) (2021-Present); and was formerly U.S. Ambassador to the Kingdom of Morocco (2014-2017) and a Member of the Board of Directors of Santander Bank, N.A. (2018-2019). Previously, Ambassador Bush served as an Advisory Board Member of Goldman Sachs Trust and Goldman Sachs Variable Insurance Trust (October 2019-January 2020).
Trustee — Goldman Sachs Trust and Goldman Sachs Variable Insurance Trust. |
103 | MoneyLion, Inc. (an operator of a data-driven, digital financial platform) | |||||
| Kathryn A. Cassidy Age: 68 |
Trustee | Since 2015 | Ms. Cassidy is retired. She is Director, Vertical Aerospace Ltd. (an aerospace and technology company) (2021-Present). Formerly, Ms. Cassidy was Advisor to the Chairman (May 2014-December 2014); and Senior Vice President and Treasurer (2008-2014), General Electric Company & General Electric Capital Corporation (technology and financial services companies).
Trustee — Goldman Sachs Trust and Goldman Sachs Variable Insurance Trust |
103 | Vertical Aerospace Ltd. (an aerospace and technology company) | |||||
| John G. Chou Age: 65 |
Trustee | Since 2022 | Mr. Chou is Executive Vice President and Special Advisor to the Chairman and CEO of AmerisourceBergen Corporation (a pharmaceutical and healthcare company) (2021-Present); and formerly held various executive management positions with AmerisourceBergen Corporation, including Executive Vice President and Chief Legal Officer (2019-2021); Executive Vice President and Chief Legal & Business Officer (2017-2019); and Executive Vice President and General Counsel (2011-2017).
Trustee — Goldman Sachs Trust and Goldman Sachs Variable Insurance Trust. |
103 | None | |||||
| Diana M. Daniels Age: 73 |
Trustee | Since 2007 | Ms. Daniels is retired. Formerly, she was Vice President, General Counsel and Secretary, The Washington Post Company (1991-2006). Ms. Daniels is a Trustee Emeritus and serves as a Presidential Councillor of Cornell University (2013-Present); Director of 1735 NY Investments, LLC (oversees an investment fund that supports the mission of the American Institute of Architects) (2022-Present); former Member of the Legal Advisory Board, New York Stock Exchange (2003-2006) and of the Corporate Advisory Board, Standish Mellon Management Advisors (2006-2007).
Trustee — Goldman Sachs Trust and Goldman Sachs Variable Insurance Trust. |
103 | None | |||||
129
GOLDMAN SACHS FUNDAMENTAL EQUITY VALUE FUNDS
Trustees and Officers (Unaudited) (continued)
Independent Trustees
| Name, Address and Age1 |
Position(s) Held with the Trust |
Term of Office and Length of Time Served2 |
Principal Occupation(s) During Past 5 Years |
Number of Portfolios in Fund Complex Overseen by Trustee3 |
Other Directorships Held by Trustee4 | |||||
| Joaquin Delgado Age: 62 |
Trustee | Since 2020 | Dr. Delgado is retired. He is Director, Stepan Company (a specialty chemical manufacturer) (2011-Present); and was formerly Director, Hexion Inc. (a specialty chemical manufacturer) (2019-2022); Executive Vice President, Consumer Business Group of 3M Company (July 2016-July 2019); and Executive Vice President, Health Care Business Group of 3M Company (October 2012-July 2016). Previously, Dr. Delgado served as an Advisory Board Member of Goldman Sachs Trust and Goldman Sachs Variable Insurance Trust (October 2019- January 2020).
Trustee — Goldman Sachs Trust and Goldman Sachs Variable Insurance Trust |
103 | Stepan Company (a specialty chemical manufacturer) | |||||
| Eileen H. Dowling Age: 59 |
Trustee | Since 2021 | Ms. Dowling is retired. Formerly, she was Senior Advisor (April 2021-September 2021); and Managing Director (2013-2021), BlackRock, Inc. (a financial services firm).
Trustee — Goldman Sachs Trust and Goldman Sachs Variable Insurance Trust. |
103 | None | |||||
| Gregory G. Weaver Age: 70 |
Trustee | Since 2015 | Mr. Weaver is retired. He is Director, Verizon Communications Inc. (2015-Present); and was formerly Chairman and Chief Executive Officer, Deloitte & Touche LLP (a professional services firm) (2001-2005 and 2012-2014); and Member of the Board of Directors, Deloitte & Touche LLP (2006-2012).
Trustee — Goldman Sachs Trust and Goldman Sachs Variable Insurance Trust. |
103 | Verizon Communications Inc. | |||||
| Paul C. Wirth Age: 64 |
Trustee | Since 2022 | Mr. Wirth is retired. Formerly, he was Deputy Chief Financial Officer and Principal Accounting Officer (2011-2020); Finance Director and Principal Accounting Officer (2010-2011); and Managing Director, Global Controller, and Chief Accounting Officer (2005-2010) of Morgan Stanley.
Trustee — Goldman Sachs Trust and Goldman Sachs Variable Insurance Trust. |
103 | None | |||||
130
GOLDMAN SACHS FUNDAMENTAL EQUITY VALUE FUNDS
Trustees and Officers (Unaudited) (continued)
Interested Trustee*
| Name, Address and Age1 |
Position(s) Held with the Trust |
Term of Office and Length of Time Served2 |
Principal Occupation(s) During Past 5 Years |
Number of Portfolios in Fund Complex Overseen by Trustee3 |
Other Directorships Held by Trustee4 | |||||
| James A. McNamara Age: 59 |
President and Trustee | Since 2007 | Advisory Director, Goldman Sachs (January 2018-Present); Managing Director, Goldman Sachs (January 2000-December 2017); Director of Institutional Fund Sales, GSAM (April 1998-December 2000); and Senior Vice President and Manager, Dreyfus Institutional Service Corporation (January 1993-April 1998).
President and Trustee — Goldman Sachs Trust; Goldman Sachs Variable Insurance Trust; Goldman Sachs Trust II; Goldman Sachs MLP and Energy Renaissance Fund; Goldman Sachs ETF Trust; Goldman Sachs ETF Trust II; Goldman Sachs Credit Income Fund; and Goldman Sachs Real Estate Diversified Income Fund. |
172 | None | |||||
| * | Mr. McNamara is considered to be an “Interested Trustee” because he holds positions with Goldman Sachs and owns securities issued by The Goldman Sachs Group, Inc. Mr. McNamara holds comparable positions with certain other companies of which Goldman Sachs, GSAM or an affiliate thereof is the investment adviser, administrator and/or distributor. |
| 1 | Each Trustee may be contacted by writing to the Trustee, c/o Goldman Sachs, 200 West Street, New York, New York, 10282, Attn: Caroline Kraus. Information is provided as of August 31, 2022. |
| 2 | Subject to such policies as may be adopted by the Board from time-to-time, each Trustee holds office for an indefinite term, until the earliest of: (a) the election of his or her successor; (b) the date the Trustee resigns or is removed by the Board or shareholders, in accordance with the Trust’s Declaration of Trust; or (c) the termination of the Trust. The Board has adopted policies which provide that each Independent Trustee shall retire as of December 31st of the calendar year in which he or she reaches (a) his or her 75th birthday or (b) the 15th anniversary of the date he or she became a Trustee, whichever is earlier, unless a waiver of such requirements shall have been adopted by a majority of the other Trustees. These policies may be changed by the Trustees without shareholder vote. |
| 3 | The Goldman Sachs Fund Complex includes certain other companies listed above for each respective Trustee. As of August 31, 2022, Goldman Sachs Trust consisted of 88 portfolios; Goldman Sachs Variable Insurance Trust consisted of 15 portfolios (12 of which offered shares to the public); Goldman Sachs Trust II consisted of 18 portfolios (16 of which offered shares to the public); Goldman Sachs ETF Trust consisted of 46 portfolios (29 of which offered shares to the public); Goldman Sachs ETF Trust II consisted of 2 portfolios (1 of which offered shares to the public); and Goldman Sachs MLP and Energy Renaissance Fund, Goldman Sachs Credit Income Fund and Goldman Sachs Real Estate Diversified Income Fund each consisted of one portfolio. Goldman Sachs Credit Income Fund did not offer shares to the public. |
| 4 | This column includes only directorships of companies required to report to the Securities and Exchange Commission under the Securities Exchange Act of 1934 (i.e., “public companies”) or other investment companies registered under the Act. |
Additional information about the Trustees is available in the Funds’ Statement of Additional Information, which can be obtained from Goldman Sachs free of charge by calling this toll-free number (in the United States of America): 1-800-526-7384.
131
GOLDMAN SACHS FUNDAMENTAL EQUITY VALUE FUNDS
Trustees and Officers (Unaudited) (continued)
Officers of the Trust*
| Name, Address and Age1 |
Positions Held with the Trust |
Term of Office and Length of Time Served2 |
Principal Occupation(s) During Past 5 Years | |||
| James A. McNamara 200 West Street New York, NY 10282 Age: 59 |
Trustee and President | Since 2007 | Advisory Director, Goldman Sachs (January 2018-Present); Managing Director, Goldman Sachs (January 2000-December 2017); Director of Institutional Fund Sales, GSAM (April 1998-December 2000); and Senior Vice President and Manager, Dreyfus Institutional Service Corporation (January 1993-April 1998).
President and Trustee — Goldman Sachs Trust; Goldman Sachs Variable Insurance Trust; Goldman Sachs Trust II; Goldman Sachs MLP and Energy Renaissance Fund; Goldman Sachs ETF Trust; Goldman Sachs ETF Trust II; Goldman Sachs Credit Income Fund; and Goldman Sachs Real Estate Diversified Income Fund. | |||
| Caroline L. Kraus 200 West Street New York, NY 10282 Age: 45 |
Secretary | Since 2012 | Managing Director, Goldman Sachs (January 2016-Present); Vice President, Goldman Sachs (August 2006-December 2015); Senior Counsel, Goldman Sachs (January 2020-Present); Associate General Counsel, Goldman Sachs (2012-December 2019); Assistant General Counsel, Goldman Sachs (August 2006-December 2011); and Associate, Weil, Gotshal & Manges, LLP (2002-2006).
Secretary — Goldman Sachs Trust (previously Assistant Secretary (2012)); Goldman Sachs Variable Insurance Trust (previously Assistant Secretary (2012)); Goldman Sachs Trust II; Goldman Sachs BDC, Inc.; Goldman Sachs Private Middle Market Credit LLC; Goldman Sachs Private Middle Market Credit II LLC; Goldman Sachs Middle Market Lending Corp.; Goldman Sachs MLP and Energy Renaissance Fund; Goldman Sachs ETF Trust; Goldman Sachs ETF Trust II; Goldman Sachs Credit Income Fund; and Goldman Sachs Real Estate Diversified Income Fund. | |||
| Joseph F. DiMaria 30 Hudson Street Jersey City, NJ 07302 Age: 54 |
Treasurer, Principal Financial Officer and Principal Accounting Officer | Since 2017 (Treasurer and Principal Financial Officer since 2019) | Managing Director, Goldman Sachs (November 2015-Present) and Vice President-Mutual Fund Administration, Columbia Management Investment Advisers, LLC (May 2010-October 2015).
Treasurer, Principal Financial Officer and Principal Accounting Officer — Goldman Sachs Trust (previously Assistant Treasurer (2016)); Goldman Sachs Variable Insurance Trust (previously Assistant Treasurer (2016)); Goldman Sachs Trust II (previously Assistant Treasurer (2017)); Goldman Sachs MLP and Energy Renaissance Fund (previously Assistant Treasurer (2017)); Goldman Sachs ETF Trust (previously Assistant Treasurer (2017)); Goldman Sachs ETF Trust II; Goldman Sachs Credit Income Fund; and Goldman Sachs Real Estate Diversified Income Fund. | |||
| * | Represents a partial list of officers of the Trust. Additional information about all the officers is available in the Funds’ Statement of Additional Information, which can be obtained from Goldman Sachs free of charge by calling this toll-free number (in the United States): 1-800-526-7384. |
| 1 | Information is provided as of August 31, 2022. |
| 2 | Officers hold office at the pleasure of the Board of Trustees or until their successors are duly elected and qualified. Each officer holds comparable positions with certain other companies of which Goldman Sachs, GSAM or an affiliate thereof is the investment adviser, administrator and/or distributor. |
Goldman Sachs Trust – Fundamental Equity Value Funds – Tax Information (Unaudited)
For the year ended August 31, 2022, 100%, 26.99%, 42.34%, 30.86%, 24.98% and 60.68%, respectively, of the dividends paid from net investment company taxable income by the Equity Income, Focused Value, Large Cap Value, Mid Cap Value, Small Cap Value and Small/Mid Cap Value Funds, respectively, qualify for the dividends received deduction available to corporations.
Pursuant to Section 852 of the Internal Revenue Code, the Equity Income, Focused Value, Large Cap Value, Mid Cap Value, Small Cap Value, and Small/Mid Cap Value Funds designate $27,116,845, $780,613, $32,761,288, $109,758,802, $561,166,518, and $7,410,639 respectively or if different, the maximum amount allowable, as capital gain dividends paid during the fiscal year ended August 31, 2022.
For the year ended August 31, 2022, the Equity Income, Focused Value, Large Cap Value, Mid Cap Value, Small Cap Value and Small/Mid Cap Value Funds designate 100%, 29.14%, 33.41%, 16.20%, 18.30% and 40.01%, respectively, of the dividends paid from net investment company taxable income as qualifying for the reduced tax rate under the Jobs and Growth Tax Relief and Reconciliation Act of 2003.
During the fiscal year ended August 31, 2022, the Focused Value, Large Cap Value, Mid Cap Value, Small Cap Value, and Small/Mid Cap Value Funds designate $1,373,512, $18,992,444, $76,410,252, $244,875,050, and $4,541,178 respectively, as short-term capital gain dividends pursuant to Section 871(k) of the Internal Revenue Code.
For the year ended August 31, 2022, 1.40%, 1.66%, 2.28%, 3.76%, and 5.59% of the dividends paid from net investment company taxable income by the Focused Value, Large Cap Value, Mid Cap Value, Small Cap Value, and Small Mid/Cap Value Funds, respectively, qualify as section 199A dividends.
132
FUNDS PROFILE
Goldman Sachs Funds
Goldman Sachs is a premier financial services firm, known since 1869 for creating thoughtful and customized investment solutions in complex global markets.
Today, the Asset Management Division of Goldman Sachs serves a diverse set of clients worldwide, including private institutions, public entities and individuals. With approximately $2.27 trillion in assets under supervision as of June 30, 2022, Goldman Sachs Asset Management has portfolio management teams located around the world and our investment professionals bring firsthand knowledge of local markets to every investment decision. Assets under supervision includes assets under management and other client assets for which Goldman Sachs does not have full discretion. Goldman Sachs Asset Management leverages the resources of Goldman Sachs & Co. LLC subject to legal, internal and regulatory restrictions.
Money Market
Financial Square FundsSM
| ∎ | Financial Square Treasury Solutions Fund1 |
| ∎ | Financial Square Government Fund1 |
| ∎ | Financial Square Money Market Fund2 |
| ∎ | Financial Square Prime Obligations Fund2 |
| ∎ | Financial Square Treasury Instruments Fund1 |
| ∎ | Financial Square Treasury Obligations Fund1 |
| ∎ | Financial Square Federal Instruments Fund1 |
Investor FundsSM
| ∎ | Investor Money Market Fund3 |
| ∎ | Investor Tax-Exempt Money Market Fund3 |
Fixed Income
Short Duration and Government
| ∎ | Enhanced Income Fund |
| ∎ | Short-Term Conservative Income Fund |
| ∎ | Short Duration Government Fund |
| ∎ | Short Duration Bond Fund |
| ∎ | Government Income Fund |
| ∎ | Inflation Protected Securities Fund |
Multi-Sector
| ∎ | Bond Fund |
| ∎ | Core Fixed Income Fund |
| ∎ | Global Core Fixed Income Fund |
| ∎ | Strategic Income Fund |
| ∎ | Income Fund |
Municipal and Tax-Free
| ∎ | High Yield Municipal Fund |
| ∎ | Dynamic Municipal Income Fund |
| ∎ | Short Duration Tax-Free Fund |
| ∎ | Municipal Income Completion Fund |
Single Sector
| ∎ | Investment Grade Credit Fund |
| ∎ | U.S. Mortgages Fund |
| ∎ | High Yield Fund |
| ∎ | High Yield Floating Rate Fund |
| ∎ | Emerging Markets Debt Fund |
| ∎ | Local Emerging Markets Debt Fund |
Fixed Income Alternatives
| ∎ | Long Short Credit Strategies Fund |
Fundamental Equity
| ∎ | Equity Income Fund |
| ∎ | Small Cap Growth Fund |
| ∎ | Small Cap Value Fund |
| ∎ | Small/Mid Cap Value Fund |
| ∎ | Mid Cap Value Fund |
| ∎ | Large Cap Value Fund |
| ∎ | Focused Value Fund |
| ∎ | Large Cap Core Fund4 |
| ∎ | Strategic Growth Fund |
| ∎ | Small/Mid Cap Growth Fund |
| ∎ | Flexible Cap Fund |
| ∎ | Concentrated Growth Fund |
| ∎ | Technology Opportunities Fund |
| ∎ | Mid Cap Growth Fund5 |
| ∎ | Rising Dividend Growth Fund |
| ∎ | U.S. Equity ESG Fund |
| ∎ | Income Builder Fund |
Tax-Advantaged Equity
| ∎ | U.S. Tax-Managed Equity Fund |
| ∎ | International Tax-Managed Equity Fund |
| ∎ | U.S. Equity Dividend and Premium Fund |
| ∎ | International Equity Dividend and Premium Fund |
Equity Insights
| ∎ | Small Cap Equity Insights Fund |
| ∎ | U.S. Equity Insights Fund |
| ∎ | Small Cap Growth Insights Fund |
| ∎ | Large Cap Growth Insights Fund |
| ∎ | Large Cap Value Insights Fund |
| ∎ | Small Cap Value Insights Fund |
| ∎ | International Small Cap Insights Fund |
| ∎ | International Equity Insights Fund |
| ∎ | Emerging Markets Equity Insights Fund |
Fundamental Equity International
| ∎ | International Equity Income Fund |
| ∎ | International Equity ESG Fund |
| ∎ | China Equity Fund |
| ∎ | Emerging Markets Equity Fund |
| ∎ | ESG Emerging Markets Equity Fund |
Alternative
| ∎ | Clean Energy Income Fund |
| ∎ | Defensive Equity Fund |
| ∎ | Real Estate Securities Fund |
| ∎ | Commodity Strategy Fund |
| ∎ | Global Real Estate Securities Fund |
| ∎ | Absolute Return Tracker Fund |
| ∎ | Managed Futures Strategy Fund |
| ∎ | MLP Energy Infrastructure Fund |
| ∎ | Energy Infrastructure Fund |
| ∎ | Multi-Manager Alternatives Fund |
| ∎ | Global Infrastructure Fund |
Total Portfolio Solutions
| ∎ | Global Managed Beta Fund |
| ∎ | Multi-Manager Non-Core Fixed Income Fund |
| ∎ | Multi-Manager Global Equity Fund |
| ∎ | Multi-Manager International Equity Fund |
| ∎ | Tactical Tilt Overlay Fund |
| ∎ | Balanced Strategy Portfolio |
| ∎ | Multi-Manager U.S. Small Cap Equity Fund |
| ∎ | Multi-Manager Real Assets Strategy Fund |
| ∎ | Growth and Income Strategy Portfolio |
| ∎ | Growth Strategy Portfolio |
| ∎ | Dynamic Global Equity Fund |
| ∎ | Satellite Strategies Portfolio |
| ∎ | Enhanced Dividend Global Equity Portfolio |
| ∎ | Tax-Advantaged Global Equity Portfolio |
| ∎ | Strategic Factor Allocation Fund |
| ∎ | Strategic Volatility Premium Fund |
| ∎ | Target Date Retirement Portfolio |
| ∎ | Target Date 2025 Portfolio |
| ∎ | Target Date 2030 Portfolio |
| ∎ | Target Date 2035 Portfolio |
| ∎ | Target Date 2040 Portfolio |
| ∎ | Target Date 2045 Portfolio |
| ∎ | Target Date 2050 Portfolio |
| ∎ | Target Date 2055 Portfolio |
| ∎ | Target Date 2060 Portfolio |
| ∎ | GQG Partners International Opportunities Fund |
| 1 | You could lose money by investing in the Fund. Although the Fund seeks to preserve the value of your investment at $1.00 per share, it cannot guarantee it will do so. An investment in the Fund is not a deposit of a bank and is not insured or guaranteed by the Federal Deposit Insurance Corporation or any other government agency. The Fund’s sponsor has no legal obligation to provide financial support to the Fund, and you should not expect that the sponsor will provide financial support to the Fund at any time. |
| 2 | You could lose money by investing in the Fund. Because the share price of the Fund will fluctuate, when you sell your shares they may be worth more or less than what you originally paid for them. The Fund may impose a fee upon sale of your shares or may temporarily suspend your ability to sell shares if the Fund’s liquidity falls below required minimums because of market conditions or other factors. An investment in the Fund is not a deposit of a bank and is not insured or guaranteed by the Federal Deposit Insurance Corporation or any other government agency. The Fund’s sponsor has no legal obligation to provide financial support to the Fund, and you should not expect that the sponsor will provide financial support to the Fund at any time. |
| 3 | You could lose money by investing in the Fund. Although the Fund seeks to preserve the value of your investment at $1.00 per share, it cannot guarantee it will do so. The Fund may impose a fee upon sale of your shares or may temporarily suspend your ability to sell shares if the Fund’s liquidity falls below required minimums because of market conditions or other factors. An investment in the Fund is not a deposit of a bank and is not insured or guaranteed by the Federal Deposit Insurance Corporation or any other government agency. The Fund’s sponsor has no legal obligation to provide financial support to the Fund, and you should not expect that the sponsor will provide financial support to the Fund at any time. |
| 4 | Effective after the close of business on April 13, 2022, the Goldman Sachs Capital Growth Fund was renamed the Goldman Sachs Large Cap Core Fund. |
| 5 | Effective after the close of business on April 13, 2022, the Goldman Sachs Growth Opportunities Fund was renamed the Goldman Sachs Mid Cap Growth Fund. |
| Financial Square FundsSM and Investor FundsSM are registered service marks of Goldman Sachs & Co. LLC. |
| * | This list covers open-end funds only. Please visit our website at www.GSAMFUNDS.com to learn about our closed-end funds and exchange-traded funds. |
| TRUSTEES Jessica Palmer, Chair Dwight L. Bush Kathryn A. Cassidy John G. Chou Diana M. Daniels Joaquin Delgado Eileen H. Dowling James A. McNamara Gregory G. Weaver Paul C. Wirth |
OFFICERS James A. McNamara, President Joseph F. DiMaria, Principal Financial Officer, Principal Accounting Officer and Treasurer Caroline L. Kraus, Secretary | |
| GOLDMAN SACHS & CO. LLC Distributor and Transfer Agent |
GOLDMAN SACHS ASSET MANAGEMENT, L.P. Investment Adviser | |
Visit our web site at www.GSAMFUNDS.com to obtain the most recent month-end returns.
Goldman Sachs Asset Management, L .P. 200 West Street, New York, New York 10282
The reports concerning the Funds included in this shareholder report may contain certain forward-looking statements about the factors that may affect the performance of the Funds in the future. These statements are based on Fund management’s predictions and expectations concerning certain future events and their expected impact on the Funds, such as performance of the economy as a whole and of specific industry sectors, changes in the levels of interest rates, the impact of developing world events, and other factors that may influence the future performance of the Funds. Management believes these forward-looking statements to be reasonable, although they are inherently uncertain and difficult to predict. Actual events may cause adjustments in portfolio management strategies from those currently expected to be employed.
A description of the policies and procedures that the Funds use to determine how to vote proxies relating to portfolio securities and information regarding how a Fund voted proxies relating to portfolio securities during the most recent 12-month period ended June 30 is available (i) without charge, upon request by calling 1-800-526-7384 (for Retail Shareholders) or 1-800-621-2550 (for Institutional Shareholders); and (ii) on the Securities and Exchange Commission (“SEC”) web site at http://www.sec.gov.
The Funds will file their portfolio holdings information for each month in a fiscal quarter within 60 days after the end of the relevant fiscal quarter on Form N-PORT. Portfolio holdings information for the third month of each fiscal quarter will be made available on the SEC’s web site at http://www.sec.gov. Portfolio holdings information may be obtained upon request and without charge by calling 1-800-526-7384 (for Retail Shareholders) or 1-800-621-2550 (for Institutional Shareholders).
Goldman Sachs & Co. LLC (‘‘Goldman Sachs’’) does not provide legal, tax or accounting advice. Any statement contained in this communication (including any attachments) concerning U.S. tax matters was not intended or written to be used, and cannot be used, for the purpose of avoiding penalties under the Internal Revenue Code, and was written to support the promotion or marketing of the transaction(s) or matter(s) addressed. Clients of Goldman Sachs should obtain their own independent tax advice based on their particular circumstances.
Fund holdings and allocations shown are as of August 31, 2022 and may not be representative of future investments. Fund holdings should not be relied on in making investment decisions and should not be construed as research or investment advice regarding particular securities. Current and future holdings are subject to risk.
The Global Industry Classification Standard (GICS) was developed by and is the exclusive property and a service mark of Morgan Stanley Capital International Inc. (MSCI) and Standard & Poor’s, a division of The McGraw-Hill Companies, Inc. (S&P) and is licensed for use by Goldman Sachs. Neither MSCI, S&P nor any other party involved in making or compiling the GICS or any GICS classifications makes any express or implied warranties or representations with respect to such standard or classification (or the results to be obtained by the use thereof), and all such parties hereby expressly disclaim all warranties of originality, accuracy, completeness, merchantability or fitness for a particular purpose with respect to any of such standard or classification. Without limiting any of the foregoing, in no event shall MSCI, S&P, any of their affiliates or any third party involved in making or compiling the GICS or any GICS classifications have any liability for any direct, indirect, special, punitive, consequential or any other damages (including lost profits) even if notified of the possibility of such damages.
The portfolio risk management process includes an effort to monitor and manage risk, but does not imply low risk.
This material is not authorized for distribution to prospective investors unless preceded or accompanied by a current Prospectus or summary prospectus, if applicable. Investors should consider a Fund’s objective, risks, and charges and expenses, and read the summary prospectus, if available, and/or the Prospectus carefully before investing or sending money. The summary prospectus, if available, and the Prospectus contain this and other information about a Fund and may be obtained from your Authorized Institution or from Goldman Sachs & Co. LLC by calling (retail – 1-800-526-7384) (institutional – 1-800-621-2550).
© 2022 Goldman Sachs. All rights reserved. 295256-OTU-1687449 EQVALAR-22
Goldman Sachs Funds
| Annual Report | August 31, 2022 | |||
| Global Tax-Aware Equity Portfolios | ||||
| Enhanced Dividend Global Equity Portfolio | ||||
| Tax-Advantaged Global Equity Portfolio | ||||

Goldman Sachs Global Tax-Aware Equity Portfolios
| ∎ | ENHANCED DIVIDEND GLOBAL EQUITY PORTFOLIO |
| ∎ | TAX-ADVANTAGED GLOBAL EQUITY PORTFOLIO |
| 1 | ||||
| 4 | ||||
| 16 | ||||
| 17 | ||||
| 25 | ||||
| 28 | ||||
| 28 | ||||
| 32 | ||||
| 36 | ||||
| 53 | ||||
| 59 | ||||
| NOT FDIC-INSURED | May Lose Value | No Bank Guarantee | ||
MARKET REVIEW
Goldman Sachs Global Tax-Aware Equity Portfolios
| Investment Strategy |
| The Portfolios invest in a strategic mix of Underlying Funds (as defined below) and other securities with the goal of achieving long-term growth of capital (both Portfolios) and current income (Goldman Sachs Enhanced Dividend Global Equity Portfolio only). Under normal conditions, at least 80% of the Portfolios’ total assets measured at the time of purchase will be allocated among the Underlying Funds that currently exist or that may become available for investment in the future for which Goldman Sachs Asset Management or an affiliate, now or in the future, acts as investment adviser or principal underwriter (“Underlying Funds”). Also under normal circumstances, each of the Portfolios invests up to 10% of its total assets to implement investment ideas that are generally derived from short-term or medium-term market views on a variety of asset classes and instruments (“Tactical Views”) generated by the Goldman Sachs Investment Strategy Group. |
During the 12 months ended August 31, 2022 (the “Reporting Period”), the financial markets were most influenced by inflationary pressures, shifting central bank monetary policy, rising interest rates, macroeconomic data and the Russia/Ukraine war.
In September 2021, when the Reporting Period began, risk assets weakened following strong calendar year performance through August. The weakness was driven by a debt crisis at Evergrande, one of China’s largest property developers, and an increase in inflation that led many global central banks, including the U.S. Federal Reserve (the “Fed”) and the European Central Bank (“ECB”), to upgrade their inflation forecasts. Fed policymakers hinted they could start tapering the Fed’s $120 billion a month asset purchase program in the near term and end it entirely by mid-2022. Additionally, the Fed’s median dot plot projection indicated interest rate hikes could begin in 2022, rather than in 2023 as previously forecast. (The dot plot shows interest rate projections of the members of the Federal Open Market Committee.) Higher inflation expectations and the Fed’s more hawkish stance pushed up U.S. Treasury yields, as markets priced in a potential 25 basis point interest rate hike by the end of 2022. (Hawkish tends to imply higher interest rates; opposite of dovish. A basis point is 1/100th of a percentage point.) In this environment, global equities declined, led by U.S. and European stocks. In contrast, Japanese equities registered gains. Emerging markets equities broadly declined as well. Within fixed income, U.S. Treasury yields rose modestly, with the yield on the bellwether 10-year U.S. Treasury security climbing 20 basis points. Within commodities, crude oil and natural gas prices rose, while metals prices fell. In currencies, the U.S. dollar strengthened versus other major currencies, benefiting from the global equity market decline and higher U.S. Treasury yields.
During the fourth quarter of 2021, global economic activity stabilized somewhat following a rather weak third calendar quarter, though inflation remained elevated. The U.S. labor market strengthened, with the unemployment rate falling to 3.9% in December, a pandemic-era low. The backdrop of a tightening labor market, healthy economic growth and accelerating inflation led the Fed to signal that its monetary policy would be less accommodative going forward. During December, policymakers began to scale back the Fed’s asset purchase program and then announced they would accelerate the pace of tapering, starting in January 2022. They also indicated the Fed might hike interest rates three times in 2022. Policy guidance in China was the opposite, as the People’s Bank of China (“PBoC”) signaled more accommodative policy to support economic growth. In the financial markets, equity performance saw significant dispersion across countries. Developed markets equities rose substantially, while emerging markets equities fell modestly. U.S. stocks were the best performers among developed markets equities, followed by European stocks. Japanese equities declined slightly. In the emerging markets, Chinese equities weighed on overall performance, while Taiwanese equities rallied. Concerns around China’s property sector, negative earnings revisions and regulatory risks, especially for technology companies, pressured Chinese stocks. Within fixed income, government bond yields were volatile. The 10-year U.S. Treasury yield began the quarter at 1.50% and then rose to 1.67% by the end of October as inflation remained elevated and the Fed started to shift its policy stance. The emergence of the COVID-19 Omicron variant pushed that yield down to 1.34% in early December. As market participants learned that Omicron, though highly transmissible, was not as severe as initially feared, risk sentiment improved. Along with the Fed’s hawkish stance, this helped push the 10-year U.S. Treasury yield back toward 1.50% by the end of the fourth calendar quarter. Within commodities, crude oil prices were generally flat, with significant volatility throughout the quarter, while metals experienced positive performance. Within currencies, the Chinese renminbi appreciated versus the U.S. dollar, while the U.S. dollar continued to strengthen versus developed markets currencies.
1
MARKET REVIEW
In the first quarter of 2022, inflationary pressures intensified, with many developed nations experiencing their fastest price increases in decades. As a result, a number of central banks took policy action. In March, the Fed hiked interest rates for the first time since 2018. Fed Chair Jerome Powell also indicated the U.S. central bank was prepared to act even more aggressively to tackle inflation. Elsewhere, the Bank of England raised rates, while the ECB opened the door for rate increases some time in 2022. Meanwhile, China’s central bank pledged to keep its monetary policy flexible and responsive to changing economic conditions, with an overriding objective of achieving stability. The PBoC cut its interest rates, reduced the amount of cash banks had to hold in reserve and boosted credit expansion in an effort to help bolster the country’s slowing economy. The economic slowdown was driven, in part, by China’s continued “zero-COVID” strategy, as a growing wave of local COVID-19 cases led authorities to place both Shenzhen and Shanghai into lockdown. During February, geopolitical tensions added uncertainty to an already complex investment backdrop, as energy and commodity prices jumped in response to Russia’s invasion of Ukraine late in the month. Global equities broadly declined during the first calendar quarter, with Russia’s invasion of Ukraine exacerbating the sell-off. Within fixed income, government bond yields rose meaningfully, pushed higher by rising inflation and hawkish central banks. Among currencies, the U.S. dollar was rather flat versus the Chinese renminbi but appreciated versus developed markets currencies. Of particular note, the Russian ruble hit an all-time low relative to the U.S. dollar during the quarter.
Global economic activity moderated noticeably in the second quarter of 2022 amid tighter financial conditions and COVID-19 flare-ups in China. Inflation accelerated, as food and energy prices rose in the wake of Russia’s attack on Ukraine. Higher inflation led to weaker consumer purchasing power and weaker consumer sentiment, which, in turn, weighed on consumption. However, job creation remained strong, especially in the U.S. Major central banks focused on taming inflation, signaling they would continue to tighten monetary policy until inflation came down toward their respective target levels. In the U.S., the Fed raised interest rates twice during the second calendar quarter and suggested rates would be higher still by the end of 2022 calendar year. Meanwhile, the ECB announced the end of its Pandemic Emergency Purchase Programme, effective July 1, 2022. The two outliers among major central banks were the Bank of Japan and the PBoC. Both remained dovish in an effort to support economic growth as inflation was not considered to be a major problem in either country. (Dovish tends to imply lower interest rates; opposite of hawkish.) Against this backdrop, global equities continued to sell off, led by a steep drop in the U.S stock market. Emerging market equities also fell, though Chinese stocks broadly recorded gains. In fixed income, government bond yield volatility continued as markets continued to struggle to price in higher inflation on the one hand and recession fears on the other. Overall, government bond yields rose during the quarter in response to inflationary pressures and hawkish central banks. Within commodities, crude oil prices rallied but metals prices suffered substantial losses. In currencies, the U.S. dollar continued its strong performance, appreciating versus most other global currencies during the second calendar quarter.
In July 2022, global equities generated positive returns despite macroeconomic weakness and elevated inflation, as investors focused on less hawkish Fed commentary and better than market expected second calendar quarter corporate earnings and guidance. Although the Fed raised interest rates during the month, Fed Chair Powell suggested the pace of rate hikes might slow going forward and become more data dependent. In Europe, the ECB increased interest rates and also signaled that future hikes were likely to be data dependent. Within global equities, the developed equity markets broadly recorded gains, while the performance of emerging markets equities was rather flat. Many emerging equity markets performed well during the month, but they were held back overall by a decline in Chinese stocks amid growing investor concerns about China’s property market. In fixed income, government bond yields fell in response to weaker macroeconomic data. Commodities struggled across the board, as both precious and industrial metals followed crude oil prices lower against the backdrop of slower global economic growth. As for currencies, the U.S. dollar appreciated versus the euro and Chinese renminbi but weakened versus the Japanese yen.
In August 2022, global equity markets were volatile. They rallied during the first half of the month, as U.S. inflation eased and the U.S. labor market remained robust, but then sold off in the second half of the month on the back of hawkish Fed commentary. Although U.S. inflation moderated, it remained elevated, prompting the Fed to signal further monetary policy tightening. For August overall, global equities broadly posted losses. Within developed markets equities, U.S. and European stocks retreated and Japanese equities advanced. Emerging markets equities recorded a modest gain. In fixed income, government bond yields rose amid ongoing inflationary pressures and hawkish central bank rhetoric. Commodities continued their poor run, with crude oil, natural gas and metals prices all declining during the month. In currencies, the U.S. dollar appreciated versus developed market currencies and the Chinese renminbi, as investor risk aversion increased and government bond yields rose.
2
MARKET REVIEW
For the Reporting Period overall, global equity markets, as measured by the MSCI All Country World Index Investable Market Index, declined 14.32%. Developed markets stocks, represented by the MSCI World Index, fell 10.80%, with U.S. stocks, as measured by the S&P 500® Index, dropping 11.23% and non-U.S. developed markets stocks, as measured by the MSCI EAFE Index, dropping 19.37%. Emerging markets equities, as measured by the MSCI Emerging Markets Index, fell 21.48%. In fixed income, except in the very shortest maturities, bond prices broadly declined as yields rose. Commodities, as represented by the S&P GSCI Commodity Index, generated a gain of 42.19%. The U.S. dollar appreciated versus most global currencies during the Reporting Period overall.
Looking Ahead
At the end of the Reporting Period, we thought risk assets were facing a number of headwinds, including slower economic growth, high U.S. home prices, the tight U.S. labor market, elevated oil prices and the Russia/Ukraine conflict. Overall, we believed the risk of a global recession had increased materially given macroeconomic weakness and generally hawkish central banks. Within equities, we believed fundamentals had softened, as market expectations for earnings per share and profit margins were trending downward at the end of the Reporting Period. Although corporate earnings generally remained strong, forward guidance was modestly lower in certain consumer-facing industries. Against this backdrop, we believed the risk-reward for equities was skewed to the downside. However, we thought the decline in equity valuations during the Reporting Period, along with ongoing weakness in investor sentiment, could potentially provide attractive opportunities in the near term. As for fixed income, we expected government bond yields to grind higher overall, but we thought they could fall on expectations of slower economic growth and heightened geopolitical uncertainty.
3
PORTFOLIO RESULTS
Goldman Sachs Enhanced Dividend
Global Equity Portfolio
Investment Objective
The Portfolio seeks long-term growth of capital and current income.
Portfolio Management Discussion and Analysis
Effective January 18, 2022, changes were made to the principal investment strategy of the Goldman Sachs Enhanced Dividend Global Equity Portfolio (the “Portfolio”) wherein the Portfolio no longer implemented tactical views through an investment in the Goldman Sachs Tactical Tilt Overlay Fund but directly implemented tactical views by investing up to 10% of its total net assets in any one or in any combination of U.S. and foreign equity securities, including common and preferred stocks; pooled investment vehicles, including, but not limited to, unaffiliated investment companies, ETFs, exchange-traded notes and the Underlying Funds; fixed income instruments, which include, among others, debt issued by U.S. and foreign governments, their agencies, instrumentalities, sponsored entities, and political subdivisions, notes, commercial paper, certificates of deposit, debt participations and non-investment grade securities; and derivatives.
Below, the Goldman Sachs Multi-Asset Solutions Team and the Goldman Sachs Quantitative Investment Strategies Team discuss the Portfolio’s performance and positioning for the 12-month period ended August 31, 2022 (the “Reporting Period”).
| Q | How did the Portfolio perform during the Reporting Period? |
| A | During the Reporting Period, the Portfolio’s Class A, Institutional, Class R6 and Class P Shares generated average annual total returns, without sales charges, of -9.61%, -9.32%, -9.25% and -9.26%, respectively. These returns compare to the -15.70% average annual total return of the Portfolio’s blended benchmark, the Enhanced Dividend Global Equity Composite Index (“EDGE Composite Index”), over the same time period. The components of the EDGE Composite Index — the MSCI All Country World Index (ACWI) Investable Market Index (“MSCI ACWI IMI”) (90%) and the Bloomberg U.S. Aggregate Bond Index (10%) — returned -16.24% and -11.52%, respectively, during the Reporting Period. |
| Q | What key factors affected the Portfolio’s performance during the Reporting Period? |
| A | While absolute returns disappointed, relative to the EDGE Composite Index, the Portfolio benefited during the Reporting Period from its strategic weightings, our tactical allocation decisions (“Tactical Views”) and the overall performance of the Underlying Funds. (The strategic weightings are based upon Goldman Sachs Investment Strategy Group’s (“ISG”) assumptions regarding long-term expected returns, expected volatilities and expected correlations as well as the investment views of the Goldman Sachs ISG.) Within its strategic weightings, the Fund’s lower allocation than the EDGE Composite Index to investment grade fixed income added to its performance, as yields rose during the Reporting Period. |
| Q | How were the Portfolio’s tactical asset allocation decisions managed during the Reporting Period? |
| A | In keeping with our investment process, we implemented Tactical Views in an effort to enhance performance. From the beginning of the Reporting Period through January 17, 2022, these Tactical Views were implemented through an investment in the Goldman Sachs Tactical Tilt Overlay Fund (the “Underlying Tactical Fund”), which seeks long-term total return through the implementation of investment ideas that are generally derived from short-term or medium-term market views on a variety of asset classes and instruments. Beginning January 18, 2022, the Portfolio implemented its Tactical Views directly by investing up to 10% of its total net assets in a variety of securities and instruments to implement investment ideas that are generally derived from short-term |
4
PORTFOLIO RESULTS
| or medium-term market views on a variety of asset classes and instruments generated by the Goldman Sachs ISG. |
| As mentioned previously, the Portfolio’s Tactical Views contributed positively to its performance during the Reporting Period overall. |
| Q | How did the Portfolio’s Underlying Funds perform relative to their respective benchmark indices during the Reporting Period? |
| A | To implement strategic asset allocation decisions, the Portfolio invests in ten Underlying Funds (“Underlying Strategic Funds”). The Underlying Tactical Fund was used to implement Tactical Views from the start of the Reporting Period through January 17, 2022. |
| During the Reporting Period, the Portfolio was invested in eight of the nine Underlying Strategic Funds, four of which outperformed their respective benchmark indices. (The Portfolio did not have an allocation to the Goldman Sachs Core Fixed Income Fund during the Reporting Period.) |
| Two of the Underlying Strategic Funds that outperformed in relative terms — the Goldman Sachs U.S. Equity Dividend and Premium Fund and the Goldman Sachs International Equity Dividend and Premium Fund — are those in which the Portfolio invested a significant percentage of its equity allocation. The other Underlying Strategic Funds that outperformed their respective benchmark indices during the Reporting Period were the Goldman Sachs Small Cap Equity Insights Fund and the Goldman Sachs International Small Cap Insights Fund. |
| The Goldman Sachs Real Estate Securities Fund, the Goldman Sachs Global Infrastructure Fund, the Goldman Sachs MLP Energy Infrastructure Fund and the Goldman Sachs Emerging Markets Equity Insights Fund underperformed their respective benchmark indices during the Reporting Period. |
| From the beginning of the Reporting Period through January 17, 2022, the Portfolio’s Underlying Tactical Fund underperformed its cash benchmark index1 by 51 basis points.2 |
| Q | How did call writing affect performance? |
| A | As mentioned above, the Portfolio’s two largest allocations were to the Goldman Sachs U.S. Equity Dividend and Premium Fund and the Goldman Sachs International Equity Dividend and Premium Fund, which earn premiums through an equity index call writing strategy. When equity markets are down, flat or modestly positive, these Underlying Strategic Funds tend to outperform their respective benchmark indices because of the premiums they earn from call writing. When equity markets rally strongly, these two Underlying Strategic Funds are likely to trail their respective benchmark indices. Although the Underlying Strategic Funds keep the premiums they earn from call writing, they can underperform when the call options are exercised. |
| During the Reporting Period, the call writing strategies of the Goldman Sachs U.S. Equity Dividend and Premium Fund and the Goldman Sachs International Equity Dividend and Premium Fund contributed positively to their performance, as the U.S. and international equity markets declined. |
| Q | What changes did you make during the Reporting Period within the Portfolio? |
| A | As mentioned previously, the Portfolio’s Tactical Views were implemented through an investment in the Underlying Tactical Fund from the start of the Reporting Period through January 17, 2022. As of January 18, 2022, we implemented Tactical Views directly, first by adding most of the tactical tilts that were represented in the Underlying Tactical Fund to the Portfolio and then by making a number of changes through the rest of the Reporting Period. |
| Regarding equity-related exposures, during March 2022, we removed the systematic upside improvement tilt, which seeks to identify stocks likely to outperform the market based on a variety of technical and fundamental ranking factors. This tilt tends to have a bias toward value stocks and had realized substantial gains since January 2022, as value stocks broadly outperformed growth stocks. The Portfolio continued to have exposure to value stocks through long positions in energy stocks, accomplished through an Underlying Fund, and in European banks, accomplished through total return swaps. During May, we purchased an S&P 500® Index call option and sold an S&P 500® Index put option based on our belief that investors were rather defensively positioned and that risk mitigation efforts had created conditions for a possible equity market rally. (A call option is an option that gives the holder the right to buy a certain quantity of an underlying security at an agreed-upon price at the time of expiry. A put option is an |
| 1 | ICE BofA 3-Month U.S. Treasury Bill Index (the “Index”). The Index is an unmanaged market index of U.S. Treasury securities maturing in 90 days that assumes reinvestment of all income. |
| 2 | Performance quoted is for Institutional Shares. A basis point is 1/100th of a percentage point. |
5
PORTFOLIO RESULTS
| option contract that gives the holder the right, but not the obligation, to sell a certain quantity of an underlying security at an agreed-upon price at the time of expiry.) In July, we implemented an S&P 500® Energy Index call option spread. (An option spread is an options strategy that involves buying and selling the same number of options on an underlying asset, but at different strike prices and maturities.) At the time, we thought weakness in energy stocks was at odds with solid company fundamentals and seemed to reflect a significant risk premium for slowing economic growth. We believed the energy sector could rebound as investors gained more confidence in the durability of capital discipline by company managements and the persistence of tight oil markets. However, due to continued uncertainties around the path of inflation and the degree of further monetary policy tightening, we decided it would be prudent to mitigate potential downside risk for the Portfolio’s long positions in energy stocks by expressing our positive views about the sector via a call option spread. During August 2022, we established an S&P 500® Index calendar put spread to help hedge against the impact of a short-term market decline. (A calendar spread is a derivatives strategy in which an investor takes a long and a short position on the same asset using derivatives contracts with different expiration dates. The goal is to profit from the difference in price on the underlying asset between the two expiration dates.) Also in August, we removed a portion of the Portfolio’s long position in European banks. Given increasing near-term risks and because of a significant rally during July, we decided to mitigate potential downside risk by closing half of the Portfolio’s position. |
| Regarding fixed income-related exposures, in February 2022, we established a position in a five-year Mexican interest rate swap, as we expected Mexico’s interest rates to fall on the back of a central bank hiking cycle that was shallower than the market had expected. We exited this position in March, as the Russia/Ukraine conflict drove up the prices of commodities, such as wheat and corn, which could undermine the disinflationary path we had envisioned for Mexico. At the same time, we thought the conflict was likely to dampen investor sentiment for emerging economies, including Mexico. During April, we added a position in two-year U.S. Treasury futures because we thought they offered an attractive cash alternative for investors who were willing to hold them through what is likely to be a volatile period for bonds. During July, we reduced the Portfolio’s long position in U.S. bank loans, implemented through Underlying Funds, in the wake of strong performance. |
| In terms of currency-related exposures, during March 2022, we eliminated the Portfolio’s long position in the U.S. dollar versus its short position in the Japanese yen. We removed the position as the U.S. dollar had appreciated significantly and it appeared that downside risks to the Japanese yen had eased. During May, we removed the Portfolio’s long position in the U.S. dollar versus its short position in the Swiss franc after the rapid depreciation of the Swiss franc had brought the currency closer to its value before the onset of the COVID-19 pandemic. In July, we initiated a short position in the euro relative to a long position in the Swiss franc, as slowing European economic growth, coupled with rising risks from an energy shortage, suggested the euro could weaken relative to the Swiss franc in the near term. Also during July, we established a long position in the Brazilian real versus a short position in the U.S. dollar because we thought the Brazilian real might strengthen as election uncertainty in Brazil declined. |
| As for commodities-related exposures, in a risk management move during July, we trimmed the Portfolio’s long position in energy master limited partnerships, which was accomplished through Underlying Funds, based on strong 2022 year-to-date performance and signs of slowing economic growth. |
| The Portfolio’s strategic weightings were modified on June 30, 2022 to reflect Goldman Sachs ISG’s investment outlook across asset classes. As a result, the Portfolio’s strategic allocation to U.S. equities increased, while its strategic allocations to international small-cap and large-cap equities, as well as its strategic allocation to emerging markets equities, decreased. |
| Q | How did the Portfolio use derivatives and similar instruments during the Reporting Period? |
| A | During the Reporting Period, the Portfolio employed equity index options to implement Tactical Views on a variety of equity markets. The use of equity index options had a positive impact on performance. Equity options were used to tactically adjust the amount of equity risk in the Portfolio, which added to the Portfolio’s returns. In addition, the Portfolio’s use of total return swaps within the systematic upside improvement tilt, as well as to express Tactical Views on a number of equity markets and European bank stocks, had a positive impact on performance. The Portfolio employed interest rate swaps to express Tactical Views on Mexican interest rates, which had a negative impact on performance. In addition, the Portfolio utilized U.S. Treasury futures and swaptions to implement Tactical Views on the |
6
PORTFOLIO RESULTS
| direction of U.S. interest rates. U.S. Treasury futures detracted from the Portfolio’s returns, while swaptions added to performance. Forward foreign currency exchange contracts, which were used to hedge the Portfolio’s exposure to the British pound, euro, Australian dollar, Swiss franc and Japanese yen, added to performance during the Reporting Period. The overall use of equities options and swaps detracted from performance during the Reporting Period. |
| In addition, some of the Portfolio’s Underlying Funds, including the Portfolio’s Underlying Tactical Fund, used derivatives to apply their active investment views with greater versatility or to afford greater risk management precision. As market conditions warranted during the Reporting Period, some of these Underlying Funds engaged in forward foreign currency exchange contracts, financial futures contracts, options and swap contracts to enhance portfolio return and for hedging purposes. |
| Q | Were there any changes to the Portfolio’s portfolio management team during the Reporting Period? |
| A | Effective January 18, 2022, Sergey Kraytman and David Hale became portfolio managers of the Portfolio. As of February 11, 2022, Monali Vora no longer served as a portfolio manager for the Portfolio. At the end of the Reporting Period, Sergey Kraytman, David Hale, Aron Kershner and John Sienkiewicz were portfolio managers for the Portfolio. By design, all investment decisions for the Portfolio are performed within a team structure, with multiple subject matter experts. This strategic decision making has been a cornerstone of our approach and helps ensure continuity in the Portfolio. |
| Q | What was the Portfolio’s strategy at the end of the Reporting Period? |
| A | Going forward, we plan to maintain the Portfolio’s strategic weightings and Tactical Views according to the Goldman Sachs ISG’s views as we continue to seek long-term growth of capital. |
7
PORTFOLIO BASICS
Enhanced Dividend Global Equity Portfolio
as of August 31, 2022
| OVERALL UNDERLYING FUND WEIGHTINGS1 | ||||
| Percentage of Net Assets | ||||
| 1 | The Portfolio is actively managed and, as such, its composition may differ over time. The percentage shown for each Underlying Fund reflects the value of that Underlying Fund as a percentage of net assets of the Portfolio. Figures in the graph above may not sum to 100% due to rounding and/or exclusion of other assets and liabilities. The above graph depicts the Portfolio’s investments but may not represent the Portfolio’s market exposure due to the exclusion of certain derivatives, if any, as listed in the Additional Investment Information section of the Schedule of Investments. |
| 2 | Represents unaffiliated funds. |
For more information about the Portfolio, please refer to www.GSAMFUNDS.com. There, you can learn more about the Portfolio’s investment strategies, holdings, and performance.
8
GOLDMAN SACHS ENHANCED DIVIDEND GLOBAL EQUITY PORTFOLIO
Performance Summary
August 31, 2022
The following graph shows the value, as of August 31, 2022, of a $1,000,000 investment made on September 1, 2012 in Institutional Shares at NAV. For comparative purposes, the performance of the Portfolio’s benchmark the Enhanced Dividend Global Equity Composite Index (“EDGE Composite Index”), which is comprised of 10% of the Bloomberg U.S. Aggregate Bond Index, and 90% of the Morgan Stanley Capital International (MSCI) All Country World Index (ACWI) Investable Market Index (IMI) (“MSCI ACWI IMI”) (Net, USD, Unhedged), is shown. Performance reflects applicable fee waivers and/or expense limitations currently in effect and in their absence, performance would be reduced. Returns do not reflect the deduction of taxes that a shareholder would pay on Portfolio distributions or the redemption of Portfolio shares. The returns set forth below represent past performance. Past performance does not guarantee future results. The Portfolio’s investment return and principal value will fluctuate so that an investor’s shares, when redeemed, may be worth more or less than their original cost. Current performance may be lower or higher than the performance quoted below. Please visit our web site at www.GSAMFUNDS.com to obtain the most recent month-end returns.
| Enhanced Dividend Global Equity Portfolio’s 10 Year Performance |
Performance of a $1,000,000 Investment, including any applicable sales charges, with distributions reinvested, from September 1, 2012 through August 31, 2022.

| Average Annual Total Return through August 31, 2022* | One Year | Five Years | Ten Years | Since Inception | ||||||||||
| Class A |
||||||||||||||
| Excluding sales charges |
-9.61% | 5.34% | 7.03% | — | ||||||||||
| Including sales charges |
-14.61% | 4.15% | 6.43% | — | ||||||||||
|
| ||||||||||||||
| Institutional |
-9.32% | 5.73% | 7.46% | — | ||||||||||
|
| ||||||||||||||
| Class R6 (Commenced December 29, 2017) |
-9.25% | N/A | N/A | 4.87% | ||||||||||
|
| ||||||||||||||
| Class P (Commenced April 17, 2018) |
-9.26% | N/A | N/A | 5.08% | ||||||||||
|
| ||||||||||||||
| * | These returns assume reinvestment of all distributions at NAV and reflect a maximum initial sales charge of 5.50% for Class A Shares. Because Institutional, Class R6 and Class P Shares do not involve a sales charge, such a charge is not applied to their Average Annual Total Return. |
9
PORTFOLIO RESULTS
Goldman Sachs Tax-Advantaged
Global Equity Portfolio
Investment Objective
The Portfolio seeks long-term growth of capital.
Portfolio Management Discussion and Analysis
Effective January 18, 2022, changes were made to the principal investment strategy of the Goldman Sachs Enhanced Dividend Global Equity Portfolio (the “Portfolio”) wherein the Portfolio no longer implemented tactical views through an investment in the Goldman Sachs Tactical Tilt Overlay Fund but directly implemented tactical views by investing up to 10% of its total net assets in any one or in any combination of U.S. and foreign equity securities, including common and preferred stocks; pooled investment vehicles, including, but not limited to, unaffiliated investment companies, ETFs, exchange-traded notes and the Underlying Funds; fixed income instruments, which include, among others, debt issued by U.S. and foreign governments, their agencies, instrumentalities, sponsored entities, and political subdivisions, notes, commercial paper, certificates of deposit, debt participations and non-investment grade securities; and derivatives.
Below, the Goldman Sachs Multi-Asset Solutions Team and the Goldman Sachs Quantitative Investment Strategies Team discuss the Portfolio’s performance and positioning for the 12-month period ended August 31, 2022 (the “Reporting Period”).
| Q | How did the Portfolio perform during the Reporting Period? |
| A | During the Reporting Period, the Portfolio’s Class A, Institutional, Class R6 and Class P Shares generated average annual total returns, without sales charges, of -12.59%, -12.31%, -12.24% and -12.28%, respectively. These returns compare to the -15.70% average annual total return of the Portfolio’s blended benchmark, the Tax-Advantaged Global Equity Composite Index (“TAG Composite Index”), over the same time period. The components of the TAG Composite Index — the MSCI All Country World Index (ACWI) Investable Market Index (“MSCI ACWI IMI”) (90%) and the Bloomberg U.S. Aggregate Bond Index (10%) — returned -16.24% and -11.52%, respectively, during the Reporting Period. |
| Q | What key factors affected the Portfolio’s performance during the Reporting Period? |
| A | While absolute returns disappointed, the Portfolio’s strategic weightings and tactical allocation decisions (“Tactical Views”) added to its performance relative to the TAG Composite Index during the Reporting Period. The overall performance of the Underlying Funds detracted from relative returns. (The strategic weightings are based upon Goldman Sachs Investment Strategy Group’s (“ISG”) assumptions regarding long-term expected returns, expected volatilities and expected correlations as well as the investments views of the Goldman Sachs ISG.) Within its strategic weightings, the Fund’s lower allocation than the TAG Composite Index to investment grade fixed income added to its performance, as yields rose during the Reporting Period. |
| Q | How were the Portfolio’s tactical asset allocation decisions managed during the Reporting Period? |
| A | In keeping with our investment process, we implemented Tactical Views in an effort to enhance performance. From the beginning of the Reporting Period through January 17, 2022, these Tactical Views were implemented through an investment in the Goldman Sachs Tactical Tilt Overlay Fund (the “Underlying Tactical Fund”), which seeks long-term total return through the implementation of investment ideas that are generally derived from short-term or medium-term market views on a variety of asset classes and instruments. Beginning January 18, 2022, the Portfolio implemented its Tactical Views directly by investing up to 10% of its total net assets in a variety of securities and instruments to implement investment ideas that are generally derived from short-term |
10
PORTFOLIO RESULTS
| or medium-term market views on a variety of asset classes and instruments generated by the Goldman Sachs ISG. |
| As mentioned previously, the Portfolio’s Tactical Views contributed positively to its performance during the Reporting Period overall. |
| Q | How did the Portfolio’s Underlying Funds perform relative to their respective benchmark indices during the Reporting Period? |
| A | To implement strategic asset allocation decisions, the Portfolio invests in nine Underlying Funds (“Underlying Strategic Funds”). The Underlying Tactical Fund was used to implement Tactical Views from the start of the Reporting Period through January 17, 2022. |
| During the Reporting Period, the Portfolio was invested in seven of the eight Underlying Strategic Funds, six of which underperformed their respective benchmark indices. (The Portfolio did not have an allocation to the Goldman Sachs Core Fixed Income Fund during the Reporting Period.) |
| Two of the Underlying Strategic Funds that underperformed in relative terms — the Goldman Sachs U.S. Tax-Managed Equity Fund and the Goldman Sachs International Tax-Managed Equity Fund — are those in which the Portfolio held its largest weightings. The other Underlying Strategic Funds that underperformed their respective benchmark indices during the Reporting Period were the Goldman Sachs Global Real Estate Securities Fund, the Goldman Sachs Global Infrastructure Fund, the Goldman Sachs MLP Energy Infrastructure Fund and the Goldman Sachs Emerging Markets Equity Insights Fund. |
| The Goldman Sachs International Small Cap Insights Fund outperformed its benchmark index during the Reporting Period. |
| From the beginning of the Reporting Period through January 17, 2022, the Portfolio’s Underlying Tactical Fund underperformed its cash benchmark index1 by 51 basis points.2 |
| Q | What changes did you make during the Reporting Period within the Portfolio? |
| A | As mentioned previously, the Portfolio’s Tactical Views were implemented through an investment in the Underlying Tactical Fund from the start of the Reporting Period through January 17, 2022. As of January 18, 2022, we implemented Tactical Views directly, first by adding most of the tactical tilts that were represented in the Underlying Tactical Fund to the Portfolio and then by making a number of changes through the rest of the Reporting Period. |
| Regarding equity-related exposures, during March 2022, we removed the systematic upside improvement tilt, which seeks to identify stocks likely to outperform the market based on a variety of technical and fundamental ranking factors. This tilt tends to have a bias toward value stocks and had realized substantial gains since January 2022, as value stocks broadly outperformed growth stocks. The Portfolio continued to have exposure to value stocks through long positions in energy stocks, accomplished through an Underlying Fund, and in European banks, accomplished through total return swaps. During May, we purchased an S&P 500® Index call option and sold an S&P 500® Index put option based on our belief that investors were rather defensively positioned and that risk mitigation efforts had created conditions for a possible equity market rally. (A call option is an option that gives the holder the right to buy a certain quantity of an underlying security at an agreed-upon price at the time of expiry. A put option is an option contract that gives the holder the right, but not the obligation, to sell a certain quantity of an underlying security at an agreed-upon price at the time of expiry.) In July, we implemented an S&P 500® Energy Index call option spread. (An option spread is an options strategy that involves buying and selling the same number of options on an underlying asset, but at different strike prices and maturities.) At the time, we thought weakness in energy stocks was at odds with solid company fundamentals and seemed to reflect a significant risk premium for slowing economic growth. We believed the energy sector could rebound as investors gained more confidence in the durability of company managements’ capital discipline and the persistence of tight oil markets. However, due to continued uncertainties around the path of inflation and the degree of further monetary policy tightening, we decided it would be prudent to mitigate potential downside risk for the Portfolio’s long positions in energy stocks by expressing our positive views about the sector via the call option spread. During August 2022, we established an S&P 500® Index calendar put spread to help |
| 1 | ICE BofA 3-Month U.S. Treasury Bill Index (the “Index”). The Index is an unmanaged market index of U.S. Treasury securities maturing in 90 days that assumes reinvestment of all income. |
| 2 | Performance quoted is for Institutional Shares. A basis point is 1/100th of a percentage point. |
11
PORTFOLIO RESULTS
| hedge against the impact of a short-term market decline. (A calendar spread is a derivatives strategy in which an investor takes a long and a short position on the same asset using derivatives contracts with different expiration dates. The goal is to profit from the difference in price on the underlying asset between the two expiration dates.) Also in August, we removed a portion of the Portfolio’s long position in European banks. Given increasing near-term risks and because of a significant rally during July, we decided to mitigate potential downside risk by closing half of the Portfolio’s position. |
| Regarding fixed income-related exposures, in February 2022, we established a position in a five-year Mexican interest rate swap, as we expected Mexico’s interest rates to fall on the back of a central bank hiking cycle that was shallower than the market had expected. We exited this position in March, as the Russia/Ukraine conflict drove up the prices of commodities, such as wheat and corn, which could undermine the disinflationary path we had envisioned for Mexico. At the same time, we thought the conflict was likely to dampen investor sentiment for emerging economies, including Mexico. During April, we added a position in two-year U.S. Treasury futures because we thought they offered an attractive cash alternative for investors who were willing to hold them through what is likely to be a volatile period for bonds. During July, we reduced the Portfolio’s long position in U.S. bank loans, implemented through Underlying Funds, in the wake of strong performance. |
| In terms of currency-related exposures, during March 2022, we eliminated the Portfolio’s long position in the U.S. dollar versus its short position in the Japanese yen. We removed the position as the U.S. dollar had appreciated significantly and it appeared that downside risks to the Japanese yen had eased. During May, we removed the Portfolio’s long position in the U.S. dollar versus its short position in the Swiss franc after the rapid depreciation of the Swiss franc had brought the currency closer to its value before the onset of the COVID-19 pandemic. In July, we initiated a short position in the euro relative to a long position in the Swiss franc, as slowing European economic growth, coupled with rising risks from an energy shortage, suggested the euro could weaken relative to the Swiss franc in the near term. Also during July, we established a long position in the Brazilian real versus a short position in the U.S. dollar because we thought the Brazilian real might strengthen as election uncertainty in Brazil declined. |
| As for commodities-related exposures, in a risk management move during July, we trimmed the Portfolio’s long position in energy master limited partnerships, which was accomplished through Underlying Funds, based on strong 2022 year-to-date performance and signs of slowing economic growth. |
| Regarding the Portfolio’s strategic weightings, they were modified on June 30, 2022 to reflect Goldman Sachs ISG’s investment outlook across asset classes. As a result, the Portfolio’s strategic allocation to U.S. equities increased, while its strategic allocations to international small-cap and large-cap equities, as well as its strategic allocation to emerging markets equities, decreased. |
| Q | How did the Portfolio use derivatives and similar instruments during the Reporting Period? |
| A | During the Reporting Period, the Portfolio employed equity index options to implement Tactical Views on a variety of equity markets. The use of equity index options had a positive impact on performance. Equity options were used to tactically adjust the amount of equity risk in the Portfolio, which added to the Portfolio’s returns. In addition, the Portfolio’s use of total return swaps within the systematic upside improvement tilt, as well as to express Tactical Views on a number of equity markets and European bank stocks, had a positive impact on performance. The Portfolio employed interest rate swaps to express Tactical Views on Mexican interest rates, which had a negative impact on performance. In addition, the Portfolio utilized U.S. Treasury futures and swaptions to implement Tactical Views on the direction of U.S. interest rates. U.S. Treasury futures detracted from the Portfolio’s returns, while swaptions added to performance. Forward foreign currency exchange contracts, which were used to hedge the Portfolio’s exposure to the British pound, euro, Australian dollar, Swiss franc and Japanese yen, added to performance during the Reporting Period. The overall use of equities options and swaps detracted from performance during the Reporting Period. |
| In addition, some of the Portfolio’s Underlying Funds, including the Portfolio’s Underlying Tactical Fund, used derivatives to apply their active investment views with greater versatility or to afford greater risk management precision. As market conditions warranted during the Reporting Period, some of these Underlying Funds engaged in forward foreign currency exchange contracts, financial futures contracts, options and swap contracts to enhance portfolio return and for hedging purposes. |
12
PORTFOLIO RESULTS
| Q | Were there any changes to the Portfolio’s portfolio management team during the Reporting Period? |
| A | Effective January 18, 2022, Sergey Kraytman and David Hale became portfolio managers of the Portfolio. As of February 11, 2022, Monali Vora no longer served as a portfolio manager for the Portfolio. At the end of the Reporting Period, Sergey Kraytman, David Hale, Aron Kershner and John Sienkiewicz were portfolio managers for the Portfolio. By design, all investment decisions for the Portfolio are performed within a team structure, with multiple subject matter experts. This strategic decision making has been a cornerstone of our approach and helps ensure continuity in the Portfolio. |
| Q | What was the Portfolio’s strategy at the end of the Reporting Period? |
| A | Going forward, we plan to maintain the Portfolio’s strategic weightings and Tactical Views according to the Goldman Sachs ISG’s views as we continue to seek long-term growth of capital. |
13
PORTFOLIO BASICS
Tax-Advantaged Global Equity Portfolio
as of August 31, 2022
| OVERALL UNDERLYING FUND WEIGHTINGS1 | ||||
| Percentage of Net Assets | ||||

| 1 | The Portfolio is actively managed and, as such, its composition may differ over time. The percentage shown for each Underlying Fund reflects the value of that Underlying Fund as a percentage of net assets of the Portfolio. Figures in the graph above may not sum to 100% due to rounding and/or exclusion of other assets and liabilities. The above graph depicts the Portfolio’s investments but may not represent the Portfolio’s market exposure due to the exclusion of certain derivatives, if any, as listed in the Additional Investment Information section of the Schedule of Investments. |
| 2 | Represents unaffiliated funds. |
For more information about the Portfolio, please refer to www.GSAMFUNDS.com. There, you can learn more about the Portfolio’s investment strategies, holdings, and performance.
14
GOLDMAN SACHS TAX-ADVANTAGED GLOBAL EQUITY PORTFOLIO
Performance Summary
August 31, 2022
The following graph shows the value, as of August 31, 2022, of a $1,000,000 investment made on September 1, 2012 in Institutional Shares at NAV. For comparative purposes, the performance of the Portfolio’s benchmark the Goldman Sachs Tax-Advantaged Global Composite Index (“TAG Composite Index”), which is comprised of 10% of the Bloomberg U.S. Aggregate Bond Index, and 90% of the Morgan Stanley Capital International (MSCI) All Country World Index (ACWI) Investable Market Index (IMI) (“MSCI ACWI IMI”) (Net, USD, Unhedged), is shown. Performance reflects applicable fee waivers and/or expense limitations currently in effect and in their absence, performance would be reduced. Returns do not reflect the deduction of taxes that a shareholder would pay on Portfolio distributions or the redemption of Portfolio shares. The returns set forth below represent past performance. Past performance does not guarantee future results. The Portfolio’s investment return and principal value will fluctuate so that an investor’s shares, when redeemed, may be worth more or less than their original cost. Current performance may be lower or higher than the performance quoted below. Please visit our web site at www.GSAMFUNDS.com to obtain the most recent month-end returns.
| Tax-Advantaged Global Equity Portfolio’s 10 Year Performance |
Performance of a $1,000,000 Investment, including any applicable sales charges, with distributions reinvested, from September 1, 2012 through August 31, 2022.
| Average Annual Total Return through August 31, 2022* | One Year | Five Years | Ten Years | Since Inception | ||||||||||
| Class A |
||||||||||||||
| Excluding sales charges |
-12.59% | 6.18% | 8.48% | — | ||||||||||
| Including sales charges |
-17.40% | 4.99% | 7.87% | — | ||||||||||
|
| ||||||||||||||
| Institutional |
-12.31% | 6.58% | 8.89% | — | ||||||||||
|
| ||||||||||||||
| Class R6 (Commenced December 29, 2017) |
-12.24% | N/A | N/A | 5.47% | ||||||||||
|
| ||||||||||||||
| Class P (Commenced April 17, 2018) |
-12.28% | N/A | N/A | 5.47% | ||||||||||
|
| ||||||||||||||
| * | These returns assume reinvestment of all distributions at NAV and reflect a maximum initial sales charge of 5.50% for Class A Shares. Because Institutional, Class R6 and Class P Shares do not involve a sales charge, such a charge is not applied to their Average Annual Total Return. |
15
GOLDMAN SACHS GLOBAL TAX-AWARE EQUITY PORTFOLIOS
S&P 500® Index is a U.S. stock market index based on the market capitalizations of 500 large companies having common stock listed on the New York Stock Exchange or NASDAQ. The S&P 500® Index components and their weightings are determined by S&P Dow Jones Indices.
The EDGE Composite Index (“EDGE Composite”) is a composite representation prepared by the investment adviser of the performance of the Portfolio’s asset classes weighted according to their respective weightings in the Portfolio’s target range.
The EDGE Composite is comprised of MSCI ACWI IMI (90%) and the Bloomberg U.S. Aggregate Bond Index (10%).
The EDGE Composite figures do not reflect any deduction for fees, expenses or taxes.
The TAG Composite Index (“TAG Composite”) is a composite representation prepared by the investment adviser of the performance of the Portfolio’s asset classes weighted according to their respective weightings in the Portfolio’s target range.
The TAG Composite is comprised of the MSCI ACWI IMI (90%) and the Bloomberg U.S. Aggregate Bond Index (10%).
The TAG Composite figures do not reflect any deduction for fees, expenses or taxes.
The Bloomberg U.S. Aggregate Bond Index represents an unmanaged diversified portfolio of fixed income securities, including U.S. Treasuries, investment grade corporate bonds and mortgage backed and asset-backed securities.
The MSCI ACWI IMI captures large, mid and small cap representation across 23 developed markets and 24 emerging markets.
With 9,261 constituents, the MSCI ACWI IMI is comprehensive, covering approximately 99% of the global equity investment opportunity set. As of August 31, 2022, the 23 developed markets in the MSCI ACWI IMI include Australia, Austria, Belgium, Canada, Denmark, Finland, France, Germany, Hong Kong, Ireland, Israel, Italy, Japan, Netherlands, New Zealand, Norway, Portugal, Singapore, Spain, Sweden, Switzerland, the UK and the US The 24 emerging markets include Brazil, Chile, China, Colombia, Czech Republic, Egypt, Greece, Hungary, India, Indonesia, Korea, Kuwait, Malaysia, Mexico, Peru, Philippines, Poland, Qatar, Saudi Arabia, South Africa, Taiwan, Thailand, Turkey and United Arab Emirates
It is not possible to invest directly in an unmanaged index.
16
GOLDMAN SACHS ENHANCED DIVIDEND GLOBAL EQUITY PORTFOLIO
August 31, 2022
| Shares | Description | Value |
||||||
| Underlying Funds (Class R6 Shares)(a) – 90.4% | ||||||||
| Equity – 90.1% | ||||||||
| 15,400,005 | Goldman Sachs US Equity Dividend and Premium Fund | $ | 216,986,076 | |||||
| 11,529,956 | Goldman Sachs International Equity Dividend and Premium Fund | 68,603,239 | ||||||
| 1,421,108 | Goldman Sachs Small Cap Equity Insights Fund | 32,472,311 | ||||||
| 1,167,703 | Goldman Sachs International Small Cap Insights Fund | 12,669,574 | ||||||
| 1,228,155 | Goldman Sachs Emerging Markets Equity Insights Fund | 9,923,491 | ||||||
| 275,568 | Goldman Sachs MLP Energy Infrastructure Fund | 7,941,873 | ||||||
| 568,308 | Goldman Sachs Global Infrastructure Fund | 7,331,174 | ||||||
| 656,590 | Goldman Sachs Global Real Estate Securities Fund | 6,467,410 | ||||||
| 59,558 | Goldman Sachs Energy Infrastructure Fund | 662,285 | ||||||
|
|
|
|||||||
| 363,057,433 | ||||||||
|
|
|
|||||||
| Fixed Income – 0.3% | ||||||||
| 143,300 | Goldman Sachs High Yield Floating Rate Fund | 1,279,665 | ||||||
|
|
|
|||||||
| TOTAL UNDERLYING FUNDS (CLASS R6 SHARES) | ||||||||
| (Cost $282,616,507) | $ | 364,337,098 | ||||||
|
|
|
|||||||
| Exchange Traded Funds – 0.8% | ||||||||
| 10,942 | Energy Select Sector SPDR Fund | $ | 880,831 | |||||
| 10,957 | Health Care Select Sector SPDR Fund | 1,366,995 | ||||||
| 2,804 | iShares Core MSCI Emerging Markets ETF | 135,882 | ||||||
| 1,243 | iShares iBoxx $ Investment Grade Corporate Bond ETF | 135,823 | ||||||
| 1,652 | iShares iBoxx High Yield Corporate Bond ETF | 123,124 | ||||||
|
|
|
|||||||
| Exchange Traded Funds – (continued) | ||||||||
| 28,200 | Sprott Physical Uranium Trust* | 354,070 | ||||||
|
|
|
|||||||
| TOTAL EXCHANGE TRADED FUNDS | ||||||||
| (Cost $2,970,017) | $ | 2,996,725 | ||||||
|
|
|
|||||||
| Shares | Dividend Rate |
Value | ||||||
| Investment Company – 7.6%(a) | ||||||||
| |
Goldman Sachs Financial Square Government Fund – |
| ||||||
| 30,671,846 | 2.154% | $ | 30,671,846 | |||||
| (Cost $30,671,846) | ||||||||
|
|
|
|||||||
| TOTAL INVESTMENTS – 98.8% | ||||||||
| (Cost $316,258,370) | $ | 398,005,669 | ||||||
|
|
|
|||||||
| |
OTHER ASSETS IN EXCESS OF LIABILITIES – 1.2% |
4,923,576 | ||||||
|
|
|
|||||||
| NET ASSETS – 100.0% | $ | 402,929,245 | ||||||
|
|
|
|||||||
| The percentage shown for each investment category reflects the value of investments in that category as a percentage of net assets. | ||
| * |
Non-income producing security. | |
| (a) |
Represents an affiliated issuer. | |
|
| ||||
| Currency Abbreviations: | ||||
| AUD |
—Australian Dollar | |||
| CHF |
—Swiss Franc | |||
| EUR |
—Euro | |||
| GBP |
—British Pound | |||
| JPY |
—Japanese Yen | |||
| NOK |
—Norwegian Krone | |||
| NZD |
—New Zealand Dollar | |||
| SEK |
—Swedish Krona | |||
| USD |
—United States Dollar | |||
|
| ||||
| ADDITIONAL INVESTMENT INFORMATION |
FORWARD FOREIGN CURRENCY EXCHANGE CONTRACTS — At August 31, 2022, the Portfolio had the following forward foreign currency exchange contracts:
FORWARD FOREIGN CURRENCY EXCHANGE CONTRACTS WITH UNREALIZED GAIN
| Counterparty | Currency Purchased |
Currency Sold |
Settlement Date |
Unrealized Gain |
||||||||||||||||
| Bank of New York Company |
USD | 1,337,635 | DKK | 9,300,000 | 9/21/2022 | $ | 79,409 | |||||||||||||
| Bank of New York Company |
USD | 228,617 | ILS | 760,000 | 9/21/2022 | 252 | ||||||||||||||
| Bank of New York Company |
USD | 369,626 | NOK | 3,500,000 | 9/21/2022 | 17,310 | ||||||||||||||
| Barclays Bank PLC |
USD | 1,373,709 | HKD | 10,750,000 | 9/21/2022 | 3,463 | ||||||||||||||
| Deutsche Bank Securities |
ILS | 40,000 | USD | 12,004 | 9/21/2022 | 15 | ||||||||||||||
| The accompanying notes are an integral part of these financial statements. | 17 |
GOLDMAN SACHS ENHANCED DIVIDEND GLOBAL EQUITY PORTFOLIO
Schedule of Investments (continued)
August 31, 2022
| ADDITIONAL INVESTMENT INFORMATION (continued) |
FORWARD FOREIGN CURRENCY EXCHANGE CONTRACTS WITH UNREALIZED GAIN (continued)
| Counterparty | Currency Purchased |
Currency Sold |
Settlement Date |
Unrealized Gain |
||||||||||||||||
| Deutsche Bank Securities |
USD | 14,385 | AUD | 20,000 | 9/21/2022 | $ | 695 | |||||||||||||
| Deutsche Bank Securities |
USD | 18,718 | DKK | 130,000 | 9/21/2022 | 1,130 | ||||||||||||||
| Deutsche Bank Securities |
USD | 556,894 | EUR | 520,000 | 9/21/2022 | 33,646 | ||||||||||||||
| Deutsche Bank Securities |
USD | 8,000,568 | GBP | 6,409,415 | 9/21/2022 | 551,988 | ||||||||||||||
| Deutsche Bank Securities |
USD | 76,663 | HKD | 600,000 | 9/21/2022 | 184 | ||||||||||||||
| Deutsche Bank Securities |
USD | 502,162 | JPY | 65,000,000 | 9/21/2022 | 33,557 | ||||||||||||||
| Deutsche Bank Securities |
USD | 26,450 | NOK | 250,000 | 9/21/2022 | 1,285 | ||||||||||||||
| Deutsche Bank Securities |
USD | 96,812 | NZD | 150,000 | 9/21/2022 | 5,036 | ||||||||||||||
| Deutsche Bank Securities |
USD | 61,108 | SEK | 600,000 | 9/21/2022 | 4,769 | ||||||||||||||
| Deutsche Bank Securities |
USD | 7,277 | SGD | 10,000 | 9/21/2022 | 120 | ||||||||||||||
| JP Morgan & Chase Co. |
USD | 15,436,690 | EUR | 14,424,225 | 9/21/2022 | 922,373 | ||||||||||||||
| RBC Capital Markets |
USD | 10,709,232 | JPY | 1,384,272,100 | 9/21/2022 | 729,595 | ||||||||||||||
| RBC Capital Markets |
USD | 604,250 | SGD | 830,000 | 9/21/2022 | 10,261 | ||||||||||||||
| UBS Financial Services |
USD | 4,022,236 | AUD | 5,609,962 | 9/21/2022 | 182,400 | ||||||||||||||
| UBS Financial Services |
USD | 5,198,310 | CHF | 4,980,844 | 9/21/2022 | 94,823 | ||||||||||||||
| UBS Financial Services |
USD | 1,687,362 | SEK | 16,575,000 | 9/21/2022 | 130,999 | ||||||||||||||
| TOTAL |
|
$ | 2,803,310 | |||||||||||||||||
FORWARD FOREIGN CURRENCY EXCHANGE CONTRACTS WITH UNREALIZED LOSS
| Counterparty | Currency Purchased |
Currency Sold |
Settlement Date |
Unrealized Loss |
||||||||||||||||
| Deutsche Bank Securities |
CHF | 20,000 | USD | 20,923 | 9/21/2022 | $ | (431 | ) | ||||||||||||
| Morgan Stanley Co., Inc. |
AUD | 560,000 | USD | 386,747 | 9/21/2022 | (3,445 | ) | |||||||||||||
| Morgan Stanley Co., Inc. |
CHF | 590,000 | USD | 621,437 | 9/21/2022 | (16,910 | ) | |||||||||||||
| Morgan Stanley Co., Inc. |
DKK | 890,000 | USD | 126,110 | 9/21/2022 | (5,699 | ) | |||||||||||||
| Morgan Stanley Co., Inc. |
EUR | 1,840,000 | USD | 1,939,026 | 9/21/2022 | (87,534 | ) | |||||||||||||
| Morgan Stanley Co., Inc. |
GBP | 605,000 | USD | 737,512 | 9/21/2022 | (34,422 | ) | |||||||||||||
| Morgan Stanley Co., Inc. |
HKD | 380,000 | USD | 48,536 | 9/21/2022 | (100 | ) | |||||||||||||
| Morgan Stanley Co., Inc. |
USD | 11,503 | ILS | 40,000 | 9/21/2022 | (516 | ) | |||||||||||||
| Morgan Stanley Co., Inc. |
JPY | 111,000,000 | USD | 822,523 | 9/21/2022 | (22,290 | ) | |||||||||||||
| Morgan Stanley Co., Inc. |
NOK | 50,000 | USD | 5,085 | 9/21/2022 | (52 | ) | |||||||||||||
| Morgan Stanley Co., Inc. |
NZD | 20,000 | USD | 12,479 | 9/21/2022 | (242 | ) | |||||||||||||
| Morgan Stanley Co., Inc. |
SEK | 1,875,000 | USD | 183,906 | 9/21/2022 | (7,847 | ) | |||||||||||||
| Morgan Stanley Co., Inc. |
SGD | 70,000 | USD | 50,411 | 9/21/2022 | (316 | ) | |||||||||||||
| TOTAL |
|
$ | (179,804 | ) | ||||||||||||||||
FUTURES CONTRACTS — At August 31, 2022, the Portfolio had the following futures contracts:
| Description | Number of Contracts |
Expiration Date |
Notional Amount |
Unrealized Appreciation/ (Depreciation) |
||||||||||||
| Long position contracts: |
||||||||||||||||
| S&P 500 E-Mini Index |
6 | 09/16/22 | $ | 1,205,216 | $ | (18,266 | ) | |||||||||
| Stoxx Europe 600 Index Future |
5 | 09/16/22 | 109,534 | (5,220 | ) | |||||||||||
| U.S. Treasury 10 Year Note |
37 | 12/20/22 | 4,343,701 | (28,576 | ) | |||||||||||
| U.S. Treasury 2 Year Note |
45 | 12/30/22 | 9,396,566 | (24,964 | ) | |||||||||||
| U.S. Treasury 5 Year Note |
22 | 12/30/22 | 2,446,438 | (11,485 | ) | |||||||||||
| TOTAL FUTURES CONTRACTS |
|
$ | (88,511 | ) | ||||||||||||
| 18 | The accompanying notes are an integral part of these financial statements. |
GOLDMAN SACHS ENHANCED DIVIDEND GLOBAL EQUITY PORTFOLIO
| ADDITIONAL INVESTMENT INFORMATION (continued) |
OVER THE COUNTER TOTAL RETURN SWAP CONTRACTS
| Reference Obligation/Index | Financing Rate Received/(Paid) by the Portfolio |
Counterparty | Termination Date(a) |
Notional Amount (000’s) |
Unrealized Appreciation/ (Depreciation)* |
|||||||||||||||||
| JPGSVENK Index |
0.090 | %(b) | J.P. Morgan Securities LLC | 10/06/2022 | $ | 1,292 | $ | 55,618 | ||||||||||||||
| SX7T Index |
(0.150 | )(c) | Bank of America, LLC | 04/05/2023 | EUR | 674 | 35,188 | |||||||||||||||
| SX7T Index |
(0.150 | )(c) | Bank of America, LLC | 04/05/2023 | EUR | 1,395 | (14,014 | ) | ||||||||||||||
| TOTAL | $ | 76,792 | ||||||||||||||||||||
| * | There are no upfront payments on the swap contracts, therefore the unrealized gain (loss) on the swap contracts is equal to their market value. |
| (a) | The Portfolio pays/receives annual coupon payments in accordance with the swap contract. On the termination date of the swap contract(s), the Portfolio will either receive from or pay to the counterparty an amount equal to the net of the accrued financing fees and the value of the reference security subtracted from the original notional cost (notional multiplied by the price change of the reference security, converted to U.S. Dollars). |
| (b) | Payments made monthly. |
| (c) | Payments made quarterly. |
PURCHASED & WRITTEN OPTIONS CONTRACTS — At August 31, 2022, the Portfolio had the following purchased option contracts:
OVER THE COUNTER OPTIONS ON FOREIGN CURRENCY
| Description | Counterparty | Exercise Rate |
Expiration Date |
Number of Contracts |
Notional Amount |
Market Value |
Premiums Paid (Received) by the Portfolio |
Unrealized Appreciation/ (Depreciation) |
||||||||||||||||||||||
| Purchased Option Contracts: |
||||||||||||||||||||||||||||||
| Puts |
||||||||||||||||||||||||||||||
| Put EUR/Call USD |
Morgan Stanley and Co. | $ | 1.132 | 03/08/2023 | 520,000 | $ | 520,000 | $ | 58,780 | $ | 11,563 | $ | 47,217 | |||||||||||||||||
| Put EUR/Call CHF |
Bank of America N.A. | 0.980 | 12/22/2022 | 620,000 | 620,000 | 10,892 | 11,338 | (446 | ) | |||||||||||||||||||||
| Put USD/Call BRL |
Morgan Stanley Capital Services LLC | 5.224 | 09/23/2022 | 1,260,000 | 1,260,000 | 24,060 | 13,772 | 10,288 | ||||||||||||||||||||||
| TOTAL | $ | 2,400,000 | $ | 93,732 | $ | 36,673 | $ | 57,059 | ||||||||||||||||||||||
| Written Option Contracts: |
||||||||||||||||||||||||||||||
| Puts |
||||||||||||||||||||||||||||||
| Put EUR/Call USD |
Morgan Stanley and Co. | $ | 1.132 | 03/08/2023 | (520,000 | ) | $ | (520,000 | ) | $ | (58,780 | ) | $ | (9,527 | ) | $ | (49,253 | ) | ||||||||||||
| Put EUR/Call CHF |
Bank of America N.A. | 0.940 | 12/22/2022 | (620,000 | ) | (620,000 | ) | (3,591 | ) | (4,606 | ) | 1,015 | ||||||||||||||||||
| TOTAL | $ | (1,140,000 | ) | $ | (62,371 | ) | $ | (14,133 | ) | $ | (48,238 | ) | ||||||||||||||||||
OVER THE COUNTER OPTIONS ON EQUITIES CONTRACTS
| Description | Counterparty | Exercise Rate |
Expiration Date |
Number of Contracts |
Notional Amount |
Market Value |
Premiums Paid (Received) by the Portfolio |
Unrealized Appreciation/ (Depreciation) |
||||||||||||||||||||||
| Purchased Option Contracts: |
||||||||||||||||||||||||||||||
| Calls |
||||||||||||||||||||||||||||||
| KraneShares CSI China Internet ETF |
JPMorgan Chase Bank, N.A. | $ | 39.728 | 01/02/2023 | 15,384 | $ | 15,384 | $ | 12,647 | $ | 41,560 | $ | (28,913 | ) | ||||||||||||||||
| Energy Select Sector SPDR ETF |
Morgan Stanley Capital Services LLC | 76.560 | 10/03/2022 | 17,436 | 17,436 | 98,566 | 77,590 | 20,976 | ||||||||||||||||||||||
| $ | 32,820 | $ | 111,213 | $ | 119,150 | $ | (7,937 | ) | ||||||||||||||||||||||
| The accompanying notes are an integral part of these financial statements. | 19 |
GOLDMAN SACHS ENHANCED DIVIDEND GLOBAL EQUITY PORTFOLIO
Schedule of Investments (continued)
August 31, 2022
| ADDITIONAL INVESTMENT INFORMATION (continued) |
OVER THE COUNTER OPTIONS ON EQUITIES CONTRACTS (continued)
| Description | Counterparty | Exercise Rate |
Expiration Date |
Number of Contracts |
Notional Amount |
Market Value |
Premiums Paid (Received) by the Portfolio |
Unrealized Appreciation/ (Depreciation) |
||||||||||||||||||||||
| Puts |
||||||||||||||||||||||||||||||
| S&P 500 Index |
Morgan Stanley Capital Services LLC | $ | 4,215.730 | 10/03/2022 | 624 | $ | 624 | $ | 168,666 | $ | 74,986 | $ | 93,680 | |||||||||||||||||
| TOTAL | $ | 33,444 | $ | 279,879 | $ | 194,136 | $ | 85,743 | ||||||||||||||||||||||
| Written Option Contracts: |
||||||||||||||||||||||||||||||
| Calls |
||||||||||||||||||||||||||||||
| KraneShares CSI China Internet ETF |
JPMorgan Chase Bank, N.A. | $ | 44.496 | 01/02/2023 | (15,384 | ) | $ | (15,384 | ) | $ | (7,052 | ) | $ | (25,669 | ) | $ | 18,617 | |||||||||||||
| Energy Select Sector SPDR ETF |
Morgan Stanley Capital Services LLC | 85.070 | 10/03/2022 | (17,436 | ) | (17,436 | ) | (26,955 | ) | (41,743 | ) | 14,788 | ||||||||||||||||||
| $ | (32,820 | ) | $ | (34,007 | ) | $ | (67,412 | ) | $ | 33,405 | ||||||||||||||||||||
| Puts |
||||||||||||||||||||||||||||||
| S&P 500 Index |
Morgan Stanley Capital Services LLC | $ | 4,004.970 | 01/02/2023 | (947 | ) | $ | (947 | ) | $ | (210,970 | ) | $ | (193,323 | ) | $ | (17,647 | ) | ||||||||||||
| XLV Index |
Morgan Stanley and Co. | 125.580 | 01/02/2023 | (10,982 | ) | (10,982 | ) | (66,273 | ) | (81,586 | ) | 15,313 | ||||||||||||||||||
| S&P 500 Index |
Morgan Stanley Capital Services LLC | 3,983.470 | 01/02/2023 | (327 | ) | (327 | ) | (69,914 | ) | (96,644 | ) | 26,730 | ||||||||||||||||||
| S&P 500 Index |
Morgan Stanley Capital Services LLC | 3,645.000 | 01/23/2023 | (321 | ) | (321 | ) | (38,314 | ) | (54,891 | ) | 16,577 | ||||||||||||||||||
| S&P 500 Index |
Morgan Stanley Capital Services LLC | 3,688.770 | 12/31/2022 | (624 | ) | (624 | ) | (72,580 | ) | (48,047 | ) | (24,533 | ) | |||||||||||||||||
| $ | (13,201 | ) | $ | (458,051 | ) | $ | (474,491 | ) | $ | 16,440 | ||||||||||||||||||||
| TOTAL | $ | (46,021 | ) | $ | (492,058 | ) | $ | (541,903 | ) | $ | 49,845 | |||||||||||||||||||
OVER THE COUNTER INTEREST RATE SWAPTIONS
| Description | Counterparty | Exercise Rate |
Expiration Date |
Number of Contracts |
Notional Amount |
Market Value |
Premiums Paid (Received) by the Portfolio |
Unrealized Appreciation/ (Depreciation) |
||||||||||||||||||||||
| Purchased Option Contracts: |
||||||||||||||||||||||||||||||
| Calls |
||||||||||||||||||||||||||||||
| 3M IRS |
Morgan Stanley Capital Services LLC | $ | 2.430 | 01/27/2023 | 760,000 | $ | 760,000 | $ | 20,937 | $ | 40,480 | $ | (19,543 | ) | ||||||||||||||||
| Written Option Contracts: |
||||||||||||||||||||||||||||||
| Calls |
||||||||||||||||||||||||||||||
| 3M IRS |
Morgan Stanley Capital Services LLC | 1.930 | 01/27/2023 | (760,000 | ) | (760,000 | ) | (5,738 | ) | (15,180 | ) | 9,442 | ||||||||||||||||||
| Puts |
||||||||||||||||||||||||||||||
| 3M IRS |
Morgan Stanley Capital Services LLC | 2.830 | 01/27/2023 | (760,000 | ) | (760,000 | ) | (28,307 | ) | (16,940 | ) | (11,367 | ) | |||||||||||||||||
| TOTAL | $ | (1,520 | ) | $ | (34,045 | ) | $ | (32,120 | ) | $ | (1,925 | ) | ||||||||||||||||||
|
| ||
| Abbreviations: | ||
| 3M IRS |
—3 Months Interest Rate Swaptions | |
| SX7T Index |
—Euro STOXX Banks Net Return Index | |
| XLV Index |
—Health Care Select Sector SPDR Fund | |
|
| ||
| 20 | The accompanying notes are an integral part of these financial statements. |
GOLDMAN SACHS TAX-ADVANTAGED GLOBAL EQUITY PORTFOLIO
Schedule of Investments
August 31, 2022
| Shares | Description | Value |
||||||
| Underlying Funds (Class R6 Shares)(a) – 89.9% | ||||||||
| Equity – 89.6% | ||||||||
| 63,590,626 | Goldman Sachs US Tax-Managed Equity Fund | $ | 2,019,002,376 | |||||
| 56,809,668 | Goldman Sachs International Tax-Managed Equity Fund | 555,030,461 | ||||||
| 9,127,139 | Goldman Sachs International Small Cap Insights Fund | 99,029,462 | ||||||
| 10,080,621 | Goldman Sachs Emerging Markets Equity Insights Fund | 81,451,417 | ||||||
| 2,254,713 | Goldman Sachs MLP Energy Infrastructure Fund | 64,980,832 | ||||||
| 4,650,946 | Goldman Sachs Global Infrastructure Fund | 59,997,200 | ||||||
| 5,443,304 | Goldman Sachs Global Real Estate Securities Fund | 53,616,546 | ||||||
| 479,041 | Goldman Sachs Energy Infrastructure Fund | 5,326,935 | ||||||
|
|
|
|||||||
| 2,938,435,229 | ||||||||
|
|
|
|||||||
| Fixed Income – 0.3% | ||||||||
| 1,148,509 | Goldman Sachs High Yield Floating Rate Fund | 10,256,182 | ||||||
|
|
|
|||||||
| TOTAL UNDERLYING FUNDS (CLASS R6 SHARES) | ||||||||
| (Cost $1,848,982,466) | $ | 2,948,691,411 | ||||||
|
|
|
|||||||
| Exchange Traded Funds – 0.7% | ||||||||
| 89,150 | Energy Select Sector SPDR Fund | $ | 7,176,575 | |||||
| 86,724 | Health Care Select Sector SPDR Fund | 10,819,686 | ||||||
| 22,594 | iShares Core MSCI Emerging Markets ETF | 1,094,905 | ||||||
| 9,965 | iShares iBoxx $ Investment Grade Corporate Bond ETF | 1,088,876 | ||||||
| 13,317 | iShares iBoxx High Yield Corporate Bond ETF | 992,516 | ||||||
|
|
|
|||||||
| 233,000 | Sprott Physical Uranium Trust* | 2,925,473 | ||||||
|
|
|
|||||||
| TOTAL EXCHANGE TRADED FUNDS | ||||||||
| (Cost $23,951,190) | $ | 24,098,031 | ||||||
|
|
|
|||||||
| Shares | Dividend Rate |
Value | ||||||
| Investment Company – 8.0%(a) | ||||||||
| |
Goldman Sachs Financial Square Government Fund – |
| ||||||
| 261,283,135 | 2.154% | $ | 261,283,135 | |||||
| (Cost $261,283,135) | ||||||||
|
|
|
|||||||
| TOTAL INVESTMENTS – 98.6% | ||||||||
| (Cost $2,134,216,791) | $ | 3,234,072,577 | ||||||
|
|
|
|||||||
| |
OTHER ASSETS IN EXCESS OF LIABILITIES – 1.4% |
45,364,445 | ||||||
|
|
|
|||||||
| NET ASSETS – 100.0% | $ | 3,279,437,022 | ||||||
|
|
|
|||||||
| The percentage shown for each investment category reflects the value of investments in that category as a percentage of net assets. | ||
| * |
Non-income producing security. | |
| (a) |
Represents an affiliated issuer. | |
|
| ||||
| Currency Abbreviations: | ||||
| AUD |
—Australian Dollar | |||
| CHF |
—Swiss Franc | |||
| EUR |
—Euro | |||
| GBP |
—British Pound | |||
| JPY |
—Japanese Yen | |||
| NOK |
—Norwegian Krone | |||
| NZD |
—New Zealand Dollar | |||
| SEK |
—Swedish Krona | |||
| USD |
—United States Dollar | |||
|
| ||||
| ADDITIONAL INVESTMENT INFORMATION |
FORWARD FOREIGN CURRENCY EXCHANGE CONTRACTS — At August 31, 2022, the Portfolio had the following forward foreign currency exchange contracts:
FORWARD FOREIGN CURRENCY EXCHANGE CONTRACTS WITH UNREALIZED GAIN
| Counterparty | Currency Purchased |
Currency Sold |
Settlement Date |
Unrealized Gain |
||||||||||||||||
| Bank of New York Company |
USD | 3,168,515 | CHF | 3,030,000 | 9/21/2022 | $ | 63,907 | |||||||||||||
| Bank of New York Company |
USD | 11,020,345 | DKK | 76,600,000 | 9/21/2022 | 656,895 | ||||||||||||||
| Bank of New York Company |
USD | 13,602,538 | EUR | 12,690,000 | 9/21/2022 | 833,278 | ||||||||||||||
| Bank of New York Company |
USD | 1,684,544 | ILS | 5,600,000 | 9/21/2022 | 1,854 | ||||||||||||||
| Bank of New York Company |
USD | 91,056,074 | JPY | 11,775,154,282 | 9/21/2022 | 6,165,419 | ||||||||||||||
| Bank of New York Company |
USD | 2,782,752 | NOK | 26,350,000 | 9/21/2022 | 130,316 | ||||||||||||||
| The accompanying notes are an integral part of these financial statements. | 21 |
GOLDMAN SACHS TAX-ADVANTAGED GLOBAL EQUITY PORTFOLIO
Schedule of Investments (continued)
August 31, 2022
| ADDITIONAL INVESTMENT INFORMATION (continued) |
FORWARD FOREIGN CURRENCY EXCHANGE CONTRACTS WITH UNREALIZED GAIN (continued)
| Counterparty | Currency Purchased |
Currency Sold |
Settlement Date |
Unrealized Gain |
||||||||||||||||
| Barclays Bank PLC |
USD | 22,137,413 | HKD | 173,240,000 | 9/21/2022 | $ | 55,432 | |||||||||||||
| Barclays Bank PLC |
USD | 434,031 | NOK | 4,100,000 | 9/21/2022 | 21,318 | ||||||||||||||
| Barclays Bank PLC |
USD | 1,506,618 | SEK | 14,775,000 | 9/21/2022 | 119,272 | ||||||||||||||
| Citigroup Global Markets |
USD | 342,091 | SGD | 470,000 | 9/21/2022 | 5,736 | ||||||||||||||
| Deutsche Bank Securities |
USD | 58,390,571 | GBP | 46,781,169 | 9/21/2022 | 4,024,715 | ||||||||||||||
| Deutsche Bank Securities |
USD | 716,408 | NZD | 1,110,000 | 9/21/2022 | 37,268 | ||||||||||||||
| JP Morgan & Chase Co. |
USD | 2,474,716 | AUD | 3,440,000 | 9/21/2022 | 120,148 | ||||||||||||||
| JP Morgan & Chase Co. |
USD | 116,387,616 | EUR | 108,753,958 | 9/21/2022 | 6,954,394 | ||||||||||||||
| JP Morgan & Chase Co. |
USD | 6,619,113 | GBP | 5,295,000 | 9/21/2022 | 465,628 | ||||||||||||||
| RBC Capital Markets |
USD | 4,608,315 | SGD | 6,330,000 | 9/21/2022 | 78,256 | ||||||||||||||
| Standard Chartered Bank |
USD | 71,247 | NZD | 110,000 | 9/21/2022 | 3,945 | ||||||||||||||
| UBS Financial Services |
USD | 30,353,229 | AUD | 42,334,774 | 9/21/2022 | 1,376,453 | ||||||||||||||
| UBS Financial Services |
USD | 38,858,594 | CHF | 37,232,984 | 9/21/2022 | 708,826 | ||||||||||||||
| UBS Financial Services |
USD | 12,712,475 | SEK | 124,875,000 | 9/21/2022 | 986,935 | ||||||||||||||
| TOTAL |
|
$ | 22,809,995 | |||||||||||||||||
FORWARD FOREIGN CURRENCY EXCHANGE CONTRACTS WITH UNREALIZED LOSS
| Counterparty | Currency Purchased |
Currency Sold |
Settlement Date |
Unrealized Loss |
||||||||||||||||
| Barclays Bank PLC |
ILS | 5,200,000 | USD | 1,562,806 | 9/21/2022 | $ | (308 | ) | ||||||||||||
| Deutsche Bank Securities |
AUD | 5,030,000 | USD | 3,474,095 | 9/21/2022 | (31,224 | ) | |||||||||||||
| Deutsche Bank Securities |
CHF | 4,510,000 | USD | 4,750,309 | 9/21/2022 | (129,259 | ) | |||||||||||||
| Deutsche Bank Securities |
DKK | 6,010,000 | USD | 851,651 | 9/21/2022 | (38,540 | ) | |||||||||||||
| Deutsche Bank Securities |
EUR | 15,420,000 | USD | 16,248,578 | 9/21/2022 | (732,267 | ) | |||||||||||||
| Deutsche Bank Securities |
GBP | 5,395,000 | USD | 6,576,926 | 9/21/2022 | (307,228 | ) | |||||||||||||
| Deutsche Bank Securities |
HKD | 85,560,000 | USD | 10,928,818 | 9/21/2022 | (22,940 | ) | |||||||||||||
| Deutsche Bank Securities |
USD | 1,646,079 | ILS | 5,720,000 | 9/21/2022 | (72,669 | ) | |||||||||||||
| Deutsche Bank Securities |
JPY | 1,023,000,000 | USD | 7,580,118 | 9/21/2022 | (205,000 | ) | |||||||||||||
| Deutsche Bank Securities |
NOK | 1,350,000 | USD | 137,306 | 9/21/2022 | (1,413 | ) | |||||||||||||
| Deutsche Bank Securities |
NZD | 200,000 | USD | 124,798 | 9/21/2022 | (2,430 | ) | |||||||||||||
| Deutsche Bank Securities |
SEK | 14,325,000 | USD | 1,405,034 | 9/21/2022 | (59,942 | ) | |||||||||||||
| Deutsche Bank Securities |
SGD | 550,000 | USD | 396,129 | 9/21/2022 | (2,522 | ) | |||||||||||||
| TOTAL |
|
$ | (1,605,742 | ) | ||||||||||||||||
FUTURES CONTRACTS — At August 31, 2022, the Portfolio had the following futures contracts:
| Description | Number of Contracts |
Expiration Date |
Notional Amount |
Unrealized Appreciation/ (Depreciation) |
||||||||||||
| Long position contracts: |
||||||||||||||||
| S&P 500 E-Mini Index |
50 | 09/16/22 | $ | 10,043,470 | $ | (152,220 | ) | |||||||||
| Stoxx Europe 600 Index Future |
40 | 09/16/22 | 876,268 | (41,756 | ) | |||||||||||
| U.S. Treasury 10 Year Note |
302 | 12/20/22 | 35,453,990 | (233,241 | ) | |||||||||||
| U.S. Treasury 2 Year Note |
363 | 12/30/22 | 75,798,964 | (201,378 | ) | |||||||||||
| U.S. Treasury 5 Year Note |
173 | 12/30/22 | 19,237,898 | (90,312 | ) | |||||||||||
| TOTAL FUTURES CONTRACTS |
|
$ | (718,907 | ) | ||||||||||||
| 22 | The accompanying notes are an integral part of these financial statements. |
GOLDMAN SACHS TAX-ADVANTAGED GLOBAL EQUITY PORTFOLIO
| ADDITIONAL INVESTMENT INFORMATION (continued) |
OVER THE COUNTER TOTAL RETURN SWAP CONTRACTS
| Reference Obligation/Index | Financing Rate Received/(Paid) by the Portfolio |
Counterparty | Termination Date(a) |
Notional |
Unrealized Appreciation/ (Depreciation)* |
|||||||||||||||||
| JPGSVENK Index |
0.090 | %(b) | J.P. Morgan Securities LLC | 10/06/2022 | $ | 10,512 | $ | 452,629 | ||||||||||||||
| SX7T Index |
(0.150 | )(c) | Bank of America, LLC | 04/05/2023 | EUR | 5,511 | 287,743 | |||||||||||||||
| SX7T Index |
(0.150 | )(c) | Bank of America, LLC | 04/05/2023 | EUR | 11,354 | (114,084 | ) | ||||||||||||||
| TOTAL | $ | 626,288 | ||||||||||||||||||||
| * | There are no upfront payments on the swap contracts, therefore the unrealized gain (loss) on the swap contracts is equal to their market value. |
| (a) | The Portfolio pays/receives annual coupon payments in accordance with the swap contract. On the termination date of the swap contract(s), the Portfolio will either receive from or pay to the counterparty an amount equal to the net of the accrued financing fees and the value of the reference security subtracted from the original notional cost (notional multiplied by the price change of the reference security, converted to U.S. Dollars). |
| (b) | Payments made monthly. |
| (c) | Payments made quarterly. |
PURCHASED & WRITTEN OPTIONS CONTRACTS — At August 31, 2022, the Portfolio had the following purchased option contracts:
OVER THE COUNTER OPTIONS ON FOREIGN CURRENCY
| Description | Counterparty | Exercise Rate |
Expiration Date |
Number of Contracts |
Notional Amount |
Market Value |
Premiums Paid (Received) by the Portfolio |
Unrealized Appreciation/ (Depreciation) |
||||||||||||||||||||||
| Purchased Option Contracts: |
||||||||||||||||||||||||||||||
| Puts |
||||||||||||||||||||||||||||||
| Put EUR/Call USD |
Morgan Stanley and Co. | $ | 0.011 | 03/08/2023 | 4,080,000 | $ | 4,080,000 | $ | 461,198 | $ | 80,565 | $ | 380,633 | |||||||||||||||||
| Put EUR/Call CHF |
Bank of America NA | 0.010 | 12/22/2022 | 4,930,000 | 4,930,000 | 86,608 | 89,031 | (2,423 | ) | |||||||||||||||||||||
| Put USD/Call BRL |
Morgan Stanley and Co. | 0.052 | 09/23/2022 | 10,120,000 | 10,120,000 | 193,245 | 110,611 | 82,634 | ||||||||||||||||||||||
| TOTAL | $ | 19,130,000 | $ | 741,051 | $ | 280,207 | $ | 460,844 | ||||||||||||||||||||||
| Written Option Contracts: |
||||||||||||||||||||||||||||||
| Puts |
||||||||||||||||||||||||||||||
| Put EUR/Call USD |
Morgan Stanley and Co. | $ | 0.011 | 03/08/2023 | (4,080,000 | ) | $ | (4,080,000 | ) | $ | (461,198 | ) | $ | (65,584 | ) | $ | (395,614 | ) | ||||||||||||
| Put EUR/Call CHF |
Bank of America NA | 0.009 | 12/22/2022 | (4,930,000 | ) | (4,930,000 | ) | (28,556 | ) | (36,167 | ) | 7,611 | ||||||||||||||||||
| TOTAL | $ | (9,010,000 | ) | $ | (489,754 | ) | $ | (101,751 | ) | $ | (388,003 | ) | ||||||||||||||||||
OVER THE COUNTER OPTIONS ON EQUITIES CONTRACTS
| Description | Exercise Rate |
Expiration Date |
Number of Contracts |
Notional Amount |
Market Value |
Premiums Paid (Received) by the Portfolio |
Unrealized Appreciation/ (Depreciation) |
|||||||||||||||||||||
| Purchased Option Contracts: |
|
|||||||||||||||||||||||||||
| Calls |
||||||||||||||||||||||||||||
| KraneShares CSI China Internet ETF |
$ | 39.728 | 01/02/2023 | 124,326 | $ | 124,326 | $ | 102,206 | $ | 335,867 | $ | (233,661 | ) | |||||||||||||||
| Energy Select Sector SPDR ETF |
76.560 | 10/03/2022 | 138,466 | 138,466 | 782,750 | 616,174 | 166,576 | |||||||||||||||||||||
| $ | 262,792 | $ | 884,956 | $ | 952,041 | $ | (67,085 | ) | ||||||||||||||||||||
| Puts |
||||||||||||||||||||||||||||
| S&P 500 Index |
$ | 215.730 | 10/03/2022 | 5,061 | $ | 5,061 | $ | 1,367,977 | $ | 608,176 | $ | 759,801 | ||||||||||||||||
| TOTAL | $ | 267,853 | $ | 2,252,933 | $ | 1,560,217 | $ | 692,716 | ||||||||||||||||||||
| The accompanying notes are an integral part of these financial statements. | 23 |
GOLDMAN SACHS TAX-ADVANTAGED GLOBAL EQUITY PORTFOLIO
Schedule of Investments (continued)
August 31, 2022
| ADDITIONAL INVESTMENT INFORMATION (continued) |
OVER THE COUNTER OPTIONS ON EQUITIES CONTRACTS (continued)
| Description | Exercise Rate |
Expiration Date |
Number of Contracts |
Notional Amount |
Market Value |
Premiums Paid (Received) by the Portfolio |
Unrealized Appreciation/ (Depreciation) |
|||||||||||||||||||||
| Written Option Contracts: |
|
|||||||||||||||||||||||||||
| Calls |
||||||||||||||||||||||||||||
| KraneShares CSI China Internet ETF |
$ | 44.496 | 01/02/2023 | (124,326 | ) | $ | (124,326 | ) | $ | (56,993 | ) | $ | (207,450 | ) | $ | 150,457 | ||||||||||||
| Energy Select Sector SPDR ETF |
85.070 | 10/03/2022 | (138,466 | ) | (138,466 | ) | (214,060 | ) | (331,501 | ) | 117,441 | |||||||||||||||||
| $ | (262,792 | ) | $ | (271,053 | ) | $ | (538,951 | ) | $ | 267,898 | ||||||||||||||||||
| Puts |
||||||||||||||||||||||||||||
| S&P 500 Index |
$ | 4,004.970 | 01/02/2023 | (7,487 | ) | $ | (7,487 | ) | $ | (1,667,924 | ) | $ | (1,528,397 | ) | $ | (139,527 | ) | |||||||||||
| XLV Index |
125.580 | 01/02/2023 | (86,799 | ) | (86,799 | ) | (523,808 | ) | (644,839 | ) | 121,031 | |||||||||||||||||
| S&P 500 Index |
3,983.470 | 01/02/2023 | (2,577 | ) | (2,577 | ) | (550,968 | ) | (761,626 | ) | 210,658 | |||||||||||||||||
| S&P 500 Index |
3,645.000 | 01/23/2023 | (2,606 | ) | (2,606 | ) | (311,048 | ) | (445,626 | ) | 134,578 | |||||||||||||||||
| S&P 500 Index |
688.770 | 12/31/2022 | (5,061 | ) | (5,061 | ) | (588,676 | ) | (389,697 | ) | (198,979 | ) | ||||||||||||||||
| $ | (104,530 | ) | $ | (3,642,424 | ) | $ | (3,770,185 | ) | $ | 127,761 | ||||||||||||||||||
| TOTAL |
|
$ | (367,322 | ) | $ | (3,913,477 | ) | $ | (4,309,136 | ) | $ | 395,659 | ||||||||||||||||
OVER THE COUNTER INTEREST RATE SWAPTIONS
| Description | Counterparty | Exercise Rate |
Expiration Date |
Number of Contracts |
Notional Amount |
Market Value |
Premiums Paid (Received) by the Portfolio |
Unrealized Appreciation/ (Depreciation) |
||||||||||||||||||||||
| Purchased Option Contracts: |
||||||||||||||||||||||||||||||
| Calls |
||||||||||||||||||||||||||||||
| 3M IRS |
Morgan Stanley and Co. | $ | 2.430 | 01/27/2023 | 6,110,000 | $ | 6,110,000 | $ | 168,320 | $ | 325,430 | $ | (157,110 | ) | ||||||||||||||||
| Written Option Contracts: |
||||||||||||||||||||||||||||||
| Calls |
||||||||||||||||||||||||||||||
| 3M IRS |
Morgan Stanley and Co. | 1.930 | 01/27/2023 | (6,110,000 | ) | (6,110,000 | ) | (46,134 | ) | (122,040 | ) | 75,906 | ||||||||||||||||||
| Puts |
||||||||||||||||||||||||||||||
| 3M IRS |
Morgan Stanley and Co. | 2.830 | 01/27/2023 | (6,110,000 | ) | (6,110,000 | ) | (227,572 | ) | (136,190 | ) | (91,382 | ) | |||||||||||||||||
| TOTAL | $ | (12,220,000 | ) | $ | (273,706 | ) | $ | (258,230 | ) | $ | (15,476 | ) | ||||||||||||||||||
|
| ||
| Abbreviations: | ||
| 3M IRS |
—3 Months Interest Rate Swaptions | |
| SX7T Index |
—Euro STOXX Banks Net Return Index | |
| XLV Index |
—Health Care Select Sector SPDR Fund | |
|
| ||
| 24 | The accompanying notes are an integral part of these financial statements. |
GOLDMAN SACHS GLOBAL TAX-AWARE EQUITY PORTFOLIOS
Statements of Assets and Liabilities
August 31, 2022
| Enhanced Dividend Global Equity Portfolio |
Tax-Advantaged Global Equity Portfolio |
|||||||||
| Assets: | ||||||||||
| Investments in unaffiliated issuers, at value (cost $2,970,017 and $23,951,190, respectively) |
$ | 2,996,725 | $ | 24,098,031 | ||||||
| Investments in affiliated issuers, at value (cost $313,288,353 and $2,110,265,601, respectively) |
395,008,944 | 3,209,974,546 | ||||||||
| Purchased Options, at value (premiums paid $271,289 and $2,165,854, respectively) |
394,548 | 3,162,304 | ||||||||
| Cash |
4,097,555 | 33,941,313 | ||||||||
| Foreign currency, at value (cost $44,481 and $330,401, respectively) |
42,590 | 324,331 | ||||||||
| Receivables: |
||||||||||
| Due from broker(a) |
360,365 | 3,116,959 | ||||||||
| Reimbursement from investment adviser |
54,142 | — | ||||||||
| Fund shares sold |
503 | 3,502,258 | ||||||||
| Foreign tax reclaims |
— | 2,307 | ||||||||
| Unrealized gain on swap contracts |
90,806 | 740,372 | ||||||||
| Unrealized gain on forward foreign currency exchange contracts |
2,803,310 | 22,809,995 | ||||||||
| Other assets |
44,524 | 100,633 | ||||||||
| Total assets | 405,894,012 | 3,301,773,049 | ||||||||
| Liabilities: | ||||||||||
| Variation margin on futures contracts |
14,998 | 125,328 | ||||||||
| Unrealized loss on swap contracts |
14,014 | 114,084 | ||||||||
| Unrealized loss on forward foreign currency exchange contracts |
179,804 | 1,605,742 | ||||||||
| Written options, at value (premiums received $(588,156) and $(4,669,117), respectively) |
588,474 | 4,676,937 | ||||||||
| Payables: |
||||||||||
| Due to broker(a) |
1,700,000 | 14,210,002 | ||||||||
| Fund shares redeemed |
201,532 | 774,548 | ||||||||
| Management fees |
109,125 | 479,659 | ||||||||
| Distribution and Service fees and Transfer Agency fees |
12,251 | 87,307 | ||||||||
| Accrued expenses |
144,569 | 262,420 | ||||||||
| Total liabilities | 2,964,767 | 22,336,027 | ||||||||
| Net Assets: | ||||||||||
| Paid-in capital |
310,238,030 | 2,184,873,589 | ||||||||
| Total distributable earnings |
92,691,215 | 1,094,563,433 | ||||||||
| NET ASSETS | $ | 402,929,245 | $ | 3,279,437,022 | ||||||
| Net Assets: |
||||||||||
| Class A |
$ | 2,712,986 | $ | 525,618 | ||||||
| Institutional |
9,109,235 | 37,590,987 | ||||||||
| Class R6 |
12,492 | 8,342,979 | ||||||||
| Class P |
391,094,532 | 3,232,977,438 | ||||||||
| Total Net Assets |
$ | 402,929,245 | $ | 3,279,437,022 | ||||||
| Shares outstanding $0.001 par value (unlimited shares authorized): |
||||||||||
| Class A |
224,515 | 27,945 | ||||||||
| Institutional |
744,521 | 1,980,040 | ||||||||
| Class R6 |
1,023 | 445,507 | ||||||||
| Class P |
32,056,369 | 172,612,002 | ||||||||
| Net asset value, offering and redemption price per share:(b) |
||||||||||
| Class A |
$12.08 | $18.81 | ||||||||
| Institutional |
12.24 | 18.98 | ||||||||
| Class R6 |
12.21 | 18.73 | ||||||||
| Class P |
12.20 | 18.73 | ||||||||
| (a) | Segregated for initial margin and/or collateral on transactions as follows: |
| Portfolio | Forwards | Futures | Swaps | |||||||||
| Enhanced Dividend Global Equity |
$ | (1,700,000 | ) | $ | 240,330 | $ | 120,035 | |||||
| Tax-Advantaged Global Equity |
(13,710,000 | ) | 1,786,957 | 830,000 | ||||||||
| (b) | Maximum public offering price per share for Class A Shares of the Enhanced Dividend Global Equity Portfolio and Tax-Advantaged Global Equity Portfolio is $12.78 and $19.90, respectively. |
| The accompanying notes are an integral part of these financial statements. | 25 |
GOLDMAN SACHS GLOBAL TAX-AWARE EQUITY PORTFOLIOS
Statements of Operations
For the Fiscal Year Ended August 31, 2022
| Enhanced Dividend Global Equity Portfolio |
Tax-Advantaged Global Equity Portfolio |
|||||||||
| Investment income: | ||||||||||
| Dividends from affiliated Underlying Funds |
$ | 10,686,229 | $ | 55,350,565 | ||||||
| Dividends — unaffiliated issuers (net of foreign withholding taxes of $— and $363, respectively) |
16,937 | 138,314 | ||||||||
| Total investment income | 10,703,166 | 55,488,879 | ||||||||
| Expenses: | ||||||||||
| Management fees |
664,344 | 5,261,841 | ||||||||
| Transfer Agency fees(a) |
138,610 | 1,058,521 | ||||||||
| Custody, accounting and administrative services |
71,511 | 236,784 | ||||||||
| Registration fees |
67,682 | 107,301 | ||||||||
| Professional fees |
43,319 | 44,820 | ||||||||
| Trustee fees |
30,673 | 32,099 | ||||||||
| Printing and mailing costs |
20,831 | 33,662 | ||||||||
| Distribution and Service (12b–1) fees |
8,361 | 1,426 | ||||||||
| Other |
11,188 | 57,205 | ||||||||
| Total expenses | 1,056,519 | 6,833,659 | ||||||||
| Less — expense reductions |
(308,051 | ) | (1,005,922 | ) | ||||||
| Net expenses | 748,468 | 5,827,737 | ||||||||
| NET INVESTMENT INCOME | 9,954,698 | 49,661,142 | ||||||||
| Realized and unrealized gain (loss): | ||||||||||
| Net realized gain (loss) from: |
||||||||||
| Investments — unaffiliated issuers |
68,374 | 195,194 | ||||||||
| Investments in affiliated Underlying Funds |
10,634,428 | (3,875,873 | ) | |||||||
| Futures contracts |
(380,504 | ) | (3,831,452 | ) | ||||||
| Swap contracts |
(475,188 | ) | (3,771,501 | ) | ||||||
| Written options |
48,887 | 303,329 | ||||||||
| Purchased options |
39,685 | 390,223 | ||||||||
| Forward foreign currency exchange contracts |
6,246,824 | 47,955,004 | ||||||||
| Foreign currency transactions |
1,691 | (73,294 | ) | |||||||
| Capital gain distributions from affiliated Underlying Funds |
23,095,200 | 29,501,122 | ||||||||
| Net change in unrealized gain (loss) on: |
||||||||||
| Investments — unaffiliated issuers |
26,708 | 146,841 | ||||||||
| Investments in affiliated Underlying Funds |
(91,890,316 | ) | (583,717,380 | ) | ||||||
| Futures contracts |
(414,809 | ) | (3,073,930 | ) | ||||||
| Written options |
(318 | ) | (7,820 | ) | ||||||
| Purchased Options |
123,259 | 996,450 | ||||||||
| Swap contracts |
76,792 | 626,288 | ||||||||
| Forward foreign currency exchange contracts |
1,476,826 | 12,809,185 | ||||||||
| Foreign currency translations |
(1,881 | ) | (3,878 | ) | ||||||
| Net realized and unrealized loss | (51,324,342 | ) | (505,431,492 | ) | ||||||
| NET DECREASE IN NET ASSETS RESULTING FROM OPERATIONS | $ | (41,369,644 | ) | $ | (455,770,350 | ) | ||||
| (a) | Class specific Transfer Agency fees were as follows: |
| Transfer Agency Fees | ||||||||||||||||
| Portfolio |
Class A |
Institutional |
Class R6 |
Class P |
||||||||||||
| Enhanced Dividend Global Equity |
$ | 5,351 | $ | 4,556 | $ | 4 | $ | 128,699 | ||||||||
| Tax-Advantaged Global Equity |
913 | 14,522 | 2,782 | 1,040,304 | ||||||||||||
| 26 | The accompanying notes are an integral part of these financial statements. |
GOLDMAN SACHS GLOBAL TAX-AWARE EQUITY PORTFOLIOS
Statements of Changes in Net Assets
| Enhanced Dividend Global Equity Portfolio |
Tax-Advantaged Global Equity Portfolio | |||||||||||||||||||||
| For the Fiscal Year Ended August 31, 2022 |
For the Fiscal Year Ended August 31, 2021 |
For the Fiscal Year Ended August 31, 2022 |
For the Fiscal Year Ended August 31, 2021 |
|||||||||||||||||||
| From operations: | ||||||||||||||||||||||
| Net investment income |
$ | 9,954,698 | $ | 8,995,410 | $ | 49,661,142 | $ | 37,140,247 | ||||||||||||||
| Net realized gain |
39,279,397 | 27,397,698 | 66,792,752 | 21,458,342 | ||||||||||||||||||
| Net change in unrealized gain (loss) |
(90,603,739 | ) | 72,549,305 | (572,224,244 | ) | 741,365,772 | ||||||||||||||||
| Net increase (decrease) in net assets resulting from operations | (41,369,644 | ) | 108,942,413 | (455,770,350 | ) | 799,964,361 | ||||||||||||||||
| Distributions to shareholders: | ||||||||||||||||||||||
| From distributable earnings: |
||||||||||||||||||||||
| Class A Shares |
(301,288 | ) | (64,411 | ) | (8,759 | ) | (4,264 | ) | ||||||||||||||
| Institutional Shares |
(1,079,344 | ) | (277,955 | ) | (601,722 | ) | (336,299 | ) | ||||||||||||||
| Class R6 Shares |
(1,181 | ) | (237 | ) | (180,128 | ) | (103,968 | ) | ||||||||||||||
| Class P Shares |
(38,674,032 | ) | (8,888,953 | ) | (66,835,908 | ) | (34,570,994 | ) | ||||||||||||||
| Total distributions to shareholders | (40,055,845 | ) | (9,231,556 | ) | (67,626,517 | ) | (35,015,525 | ) | ||||||||||||||
| From share transactions: | ||||||||||||||||||||||
| Proceeds from sales of shares |
24,193,568 | 38,842,005 | 407,850,486 | 339,367,529 | ||||||||||||||||||
| Reinvestment of distributions |
39,967,912 | 9,207,895 | 67,376,255 | 34,861,505 | ||||||||||||||||||
| Cost of shares redeemed |
(67,626,449 | ) | (124,107,392 | ) | (301,692,350 | ) | (255,063,368 | ) | ||||||||||||||
| Net increase (decrease) in net assets resulting from share transactions | (3,464,969 | ) | (76,057,492 | ) | 173,534,391 | 119,165,666 | ||||||||||||||||
| TOTAL INCREASE (DECREASE) | (84,890,458 | ) | 23,653,365 | (349,862,476 | ) | 884,114,502 | ||||||||||||||||
| Net Assets: | ||||||||||||||||||||||
| Beginning of year |
487,819,703 | 464,166,338 | 3,629,299,498 | 2,745,184,996 | ||||||||||||||||||
| End of year |
$ | 402,929,245 | $ | 487,819,703 | $ | 3,279,437,022 | $ | 3,629,299,498 | ||||||||||||||
| The accompanying notes are an integral part of these financial statements. | 27 |
GOLDMAN SACHS ENHANCED DIVIDEND GLOBAL EQUITY PORTFOLIO
Selected Data for a Share Outstanding Throughout Each Year
| (a) | Calculated based on the average shares outstanding methodology. |
| (b) | Recognition of net investment income by the Portfolio is affected by the timing of declaration of dividends by the Underlying Funds in which the Portfolio invests. |
| (c) | Assumes investment at the NAV at the beginning of the year, reinvestment of all dividends and distributions, a complete redemption of the investment at the NAV at the end of the year and no sales or redemption charges (if any). Total returns would be reduced if a sales or redemption charge was taken into account. Returns do not reflect the impact of taxes to shareholders relating to Portfolio distributions or the redemption of Portfolio shares. |
| (d) | Expense ratios exclude the expenses of the Underlying Funds in which the Portfolio invests. |
| (e) | The Portfolio’s portfolio turnover rate is calculated in accordance with regulatory requirements, without regard to transactions involving short term investments. If such transactions were included, the Portfolio’s portfolio turnover rate may be higher. |
| 28 | The accompanying notes are an integral part of these financial statements. |
GOLDMAN SACHS ENHANCED DIVIDEND GLOBAL EQUITY PORTFOLIO
Financial Highlights (continued)
Selected Data for a Share Outstanding Throughout Each Year
| Goldman Sachs Enhanced Dividend Global Equity Portfolio | ||||||||||||||||||||||
| Institutional Shares | ||||||||||||||||||||||
| Year Ended August 31, | ||||||||||||||||||||||
| 2022 | 2021 | 2020 | 2019 | 2018 | ||||||||||||||||||
| Per Share Data | ||||||||||||||||||||||
| Net asset value, beginning of year |
$ | 14.71 | $ | 11.90 | $ | 11.63 | $ | 12.48 | $ | 11.80 | ||||||||||||
| Net investment income(a)(b) |
0.30 | 0.25 | 0.22 | 0.23 | 0.17 | |||||||||||||||||
| Net realized and unrealized gain (loss) |
(1.55 | ) | 2.81 | 0.59 | (0.44 | ) | 0.93 | |||||||||||||||
| Total from investment operations |
(1.25 | ) | 3.06 | 0.81 | (0.21 | ) | 1.10 | |||||||||||||||
| Distributions to shareholders from net investment income |
(0.50 | ) | (0.25 | ) | (0.26 | ) | (0.32 | ) | (0.28 | ) | ||||||||||||
| Distributions to shareholders from net realized gains |
(0.72 | ) | — | (0.27 | ) | (0.32 | ) | (0.14 | ) | |||||||||||||
| Distributions to shareholders from return of capital |
— | — | (0.01 | ) | — | — | ||||||||||||||||
| Total distributions |
(1.22 | ) | (0.25 | ) | (0.54 | ) | (0.64 | ) | (0.42 | ) | ||||||||||||
| Net asset value, end of year |
$ | 12.24 | $ | 14.71 | $ | 11.90 | $ | 11.63 | $ | 12.48 | ||||||||||||
| Total Return(c) | (9.32 | )% | 26.05 | % | 7.17 | % | (1.46 | )% | 9.45 | % | ||||||||||||
| Net assets, end of year (in 000’s) |
$ | 9,109 | $ | 13,638 | $ | 19,695 | $ | 25,244 | $ | 33,490 | ||||||||||||
| Ratio of net expenses to average net assets(d) |
0.17 | % | 0.13 | % | 0.13 | % | 0.13 | % | 0.13 | % | ||||||||||||
| Ratio of total expenses to average net assets(d) |
0.24 | % | 0.26 | % | 0.26 | % | 0.26 | % | 0.23 | % | ||||||||||||
| Ratio of net investment income to average net assets |
2.24 | % | 1.87 | % | 1.90 | % | 2.00 | % | 1.43 | % | ||||||||||||
| Portfolio turnover rate(e) |
23 | % | 16 | % | 13 | % | 15 | % | 20 | % | ||||||||||||
| (a) | Calculated based on the average shares outstanding methodology. |
| (b) | Recognition of net investment income by the Portfolio is affected by the timing of declaration of dividends by the Underlying Funds in which the Portfolio invests. |
| (c) | Assumes investment at the NAV at the beginning of the year, reinvestment of all dividends and distributions, a complete redemption of the investment at the NAV at the end of the year and no sales or redemption charges (if any). Total returns would be reduced if a sales or redemption charge was taken into account. Returns do not reflect the impact of taxes to shareholders relating to Portfolio distributions or the redemption of Portfolio shares. |
| (d) | Expense ratios exclude the expenses of the Underlying Funds in which the Portfolio invests. |
| (e) | The Portfolio’s portfolio turnover rate is calculated in accordance with regulatory requirements, without regard to transactions involving short term investments. If such transactions were included, the Portfolio’s portfolio turnover rate may be higher. |
| The accompanying notes are an integral part of these financial statements. | 29 |
GOLDMAN SACHS ENHANCED DIVIDEND GLOBAL EQUITY PORTFOLIO
Financial Highlights (continued)
Selected Data for a Share Outstanding Throughout Each Period
| Goldman Sachs Enhanced Dividend Global Equity Portfolio | ||||||||||||||||||||||
| Class R6 Shares | ||||||||||||||||||||||
| Year Ended August 31, | Period Ended August 31, 2018(a) |
|||||||||||||||||||||
| 2022 | 2021 | 2020 | 2019 | |||||||||||||||||||
| Per Share Data | ||||||||||||||||||||||
| Net asset value, beginning of period |
$ | 14.68 | $ | 11.88 | $ | 11.60 | $ | 12.46 | $ | 12.17 | ||||||||||||
| Net investment income(b)(c) |
0.30 | 0.25 | 0.21 | 0.23 | 0.10 | |||||||||||||||||
| Net realized and unrealized gain (loss) |
(1.55 | ) | 2.81 | 0.61 | (0.45 | ) | 0.31 | |||||||||||||||
| Total from investment operations |
(1.25 | ) | 3.06 | 0.82 | (0.22 | ) | 0.41 | |||||||||||||||
| Distributions to shareholders from net investment income |
(0.50 | ) | (0.26 | ) | (0.26 | ) | (0.32 | ) | (0.12 | ) | ||||||||||||
| Distributions to shareholders from net realized gains |
(0.72 | ) | — | (0.27 | ) | (0.32 | ) | — | ||||||||||||||
| Distributions to shareholders from return of capital |
— | — | (0.01 | ) | — | — | ||||||||||||||||
| Total distributions |
(1.22 | ) | (0.26 | ) | (0.54 | ) | (0.64 | ) | (0.12 | ) | ||||||||||||
| Net asset value, end of period |
$ | 12.21 | $ | 14.68 | $ | 11.88 | $ | 11.60 | $ | 12.46 | ||||||||||||
| Total Return(d) | (9.25 | )% | 26.03 | % | 7.28 | % | (1.54 | )% | 3.39 | % | ||||||||||||
| Net assets, end of period (in 000’s) |
$ | 12 | $ | 14 | $ | 11 | $ | 10 | $ | 10 | ||||||||||||
| Ratio of net expenses to average net assets(e) |
0.17 | % | 0.13 | % | 0.12 | % | 0.12 | % | 0.12 | %(f) | ||||||||||||
| Ratio of total expenses to average net assets(e) |
0.22 | % | 0.23 | % | 0.22 | % | 0.23 | % | 0.18 | %(f) | ||||||||||||
| Ratio of net investment income to average net assets |
2.24 | % | 1.86 | % | 1.87 | % | 2.01 | % | 1.27 | %(f) | ||||||||||||
| Portfolio turnover rate(g) |
23 | % | 16 | % | 13 | % | 15 | % | 20 | % | ||||||||||||
| (a) | Commenced operations on December 29, 2017. |
| (b) | Calculated based on the average shares outstanding methodology. |
| (c) | Recognition of net investment income by the Portfolio is affected by the timing of declaration of dividends by the Underlying Funds in which the Portfolio invests. |
| (d) | Assumes investment at the NAV at the beginning of the period, reinvestment of all dividends and distributions, a complete redemption of the investment at the NAV at the end of the period and no sales or redemption charges (if any). Total returns would be reduced if a sales or redemption charge was taken into account. Returns do not reflect the impact of taxes to shareholders relating to Portfolio distributions or the redemption of Portfolio shares. Total returns for periods less than one full year are not annualized. |
| (e) | Expense ratios exclude the expenses of the Underlying Funds in which the Portfolio invests. |
| (f) | Annualized. |
| (g) | The Portfolio’s portfolio turnover rate is calculated in accordance with regulatory requirements, without regard to transactions involving short term investments. If such transactions were included, the Portfolio’s portfolio turnover rate may be higher. |
| 30 | The accompanying notes are an integral part of these financial statements. |
GOLDMAN SACHS ENHANCED DIVIDEND GLOBAL EQUITY PORTFOLIO
Financial Highlights (continued)
Selected Data for a Share Outstanding Throughout Each Period
| Goldman Sachs Enhanced Dividend Global Equity Portfolio | ||||||||||||||||||||||
| Class P Shares | ||||||||||||||||||||||
| Year Ended August 31, | Period Ended August 31, 2018(a) |
|||||||||||||||||||||
| 2022 | 2021 | 2020 | 2019 | |||||||||||||||||||
| Per Share Data | ||||||||||||||||||||||
| Net asset value, beginning of period |
$ | 14.67 | $ | 11.87 | $ | 11.60 | $ | 12.45 | $ | 12.18 | ||||||||||||
| Net investment income(b)(c) |
0.30 | 0.25 | 0.22 | 0.23 | 0.11 | |||||||||||||||||
| Net realized and unrealized gain (loss) |
(1.55 | ) | 2.81 | 0.59 | (0.44 | ) | 0.23 | |||||||||||||||
| Total from investment operations |
(1.25 | ) | 3.06 | 0.81 | (0.21 | ) | 0.34 | |||||||||||||||
| Distributions to shareholders from net investment income |
(0.50 | ) | (0.26 | ) | (0.26 | ) | (0.32 | ) | (0.07 | ) | ||||||||||||
| Distributions to shareholders from net realized gains |
(0.72 | ) | — | (0.27 | ) | (0.32 | ) | — | ||||||||||||||
| Distributions to shareholders from return of capital |
— | — | (0.01 | ) | — | — | ||||||||||||||||
| Total distributions |
(1.22 | ) | (0.26 | ) | (0.54 | ) | (0.64 | ) | (0.07 | ) | ||||||||||||
| Net asset value, end of period |
$ | 12.20 | $ | 14.67 | $ | 11.87 | $ | 11.60 | $ | 12.45 | ||||||||||||
| Total Return(d) | (9.26 | )% | 26.05 | % | 7.20 | % | (1.45 | )% | 2.80 | % | ||||||||||||
| Net assets, end of period (in 000’s) |
$ | 391,095 | $ | 470,368 | $ | 438,960 | $ | 573,771 | $ | 636,733 | ||||||||||||
| Ratio of net expenses to average net assets(e) |
0.17 | % | 0.12 | % | 0.12 | % | 0.12 | % | 0.13 | %(f) | ||||||||||||
| Ratio of total expenses to average net assets(e) |
0.23 | % | 0.25 | % | 0.25 | % | 0.25 | % | 0.25 | %(f) | ||||||||||||
| Ratio of net investment income to average net assets |
2.25 | % | 1.91 | % | 1.92 | % | 2.02 | % | 2.48 | %(f) | ||||||||||||
| Portfolio turnover rate(g) |
23 | % | 16 | % | 13 | % | 15 | % | 20 | % | ||||||||||||
| (a) | Commenced operations on April 17, 2018. |
| (b) | Calculated based on the average shares outstanding methodology. |
| (c) | Recognition of net investment income by the Portfolio is affected by the timing of declaration of dividends by the Underlying Funds in which the Portfolio invests. |
| (d) | Assumes investment at the NAV at the beginning of the period, reinvestment of all dividends and distributions, a complete redemption of the investment at the NAV at the end of the period and no sales or redemption charges (if any). Total returns would be reduced if a sales or redemption charge was taken into account. Returns do not reflect the impact of taxes to shareholders relating to Portfolio distributions or the redemption of Portfolio shares. Total returns for periods less than one full year are not annualized. |
| (e) | Expense ratios exclude the expenses of the Underlying Funds in which the Portfolio invests. |
| (f) | Annualized. |
| (g) | The Portfolio’s portfolio turnover rate is calculated in accordance with regulatory requirements, without regard to transactions involving short term investments. If such transactions were included, the Portfolio’s portfolio turnover rate may be higher. |
| The accompanying notes are an integral part of these financial statements. | 31 |
GOLDMAN SACHS TAX-ADVANTAGED GLOBAL EQUITY PORTFOLIO
Financial Highlights (continued)
Selected Data for a Share Outstanding Throughout Each Year
| (a) | Calculated based on the average shares outstanding methodology. |
| (b) | Recognition of net investment income by the Portfolio is affected by the timing of declaration of dividends by the Underlying Funds in which the Portfolio invests. |
| (c) | Assumes investment at the NAV at the beginning of the year, reinvestment of all dividends and distributions, a complete redemption of the investment at the NAV at the end of the year and no sales or redemption charges (if any). Total returns would be reduced if a sales or redemption charge was taken into account. Returns do not reflect the impact of taxes to shareholders relating to Portfolio distributions or the redemption of Portfolio shares. |
| (d) | Expense ratios exclude the expenses of the Underlying Funds in which the Portfolio invests. |
| (e) | The Portfolio’s portfolio turnover rate is calculated in accordance with regulatory requirements, without regard to transactions involving short term investments. If such transactions were included, the Portfolio’s portfolio turnover rate may be higher. |
| 32 | The accompanying notes are an integral part of these financial statements. |
GOLDMAN SACHS TAX-ADVANTAGED GLOBAL EQUITY PORTFOLIO
Financial Highlights (continued)
Selected Data for a Share Outstanding Throughout Each Year
| Goldman Sachs Tax-Advantaged Global Equity Portfolio | ||||||||||||||||||||||
| Institutional Shares | ||||||||||||||||||||||
| Year Ended August 31, | ||||||||||||||||||||||
| 2022 | 2021 | 2020 | 2019 | 2018 | ||||||||||||||||||
| Per Share Data | ||||||||||||||||||||||
| Net asset value, beginning of year |
$ | 22.03 | $ | 17.30 | $ | 15.58 | $ | 16.46 | $ | 14.72 | ||||||||||||
| Net investment income(a)(b) |
0.29 | 0.23 | 0.22 | 0.20 | 0.17 | |||||||||||||||||
| Net realized and unrealized gain (loss) |
(2.94 | ) | 4.71 | 1.74 | (0.96 | ) | 1.78 | |||||||||||||||
| Total from investment operations |
(2.65 | ) | 4.94 | 1.96 | (0.76 | ) | 1.95 | |||||||||||||||
| Distributions to shareholders from net investment income |
(0.35 | ) | (0.21 | ) | (0.20 | ) | (0.02 | ) | (0.21 | ) | ||||||||||||
| Distributions to shareholders from net realized gains |
(0.05 | ) | — | (0.04 | ) | (0.10 | ) | — | ||||||||||||||
| Total distributions |
(0.40 | ) | (0.21 | ) | (0.24 | ) | (0.12 | ) | (0.21 | ) | ||||||||||||
| Net asset value, end of year |
$ | 18.98 | $ | 22.03 | $ | 17.30 | $ | 15.58 | $ | 16.46 | ||||||||||||
| Total Return(c) | (12.31 | )% | 28.81 | % | 12.60 | % | (4.61 | )% | 13.32 | % | ||||||||||||
| Net assets, end of year (in 000’s) |
$ | 37,591 | $ | 33,151 | $ | 33,800 | $ | 43,565 | $ | 62,718 | ||||||||||||
| Ratio of net expenses to average net assets(d) |
0.18 | % | 0.13 | % | 0.13 | % | 0.13 | % | 0.13 | % | ||||||||||||
| Ratio of total expenses to average net assets(d) |
0.20 | % | 0.21 | % | 0.21 | % | 0.22 | % | 0.21 | % | ||||||||||||
| Ratio of net investment income to average net assets |
1.40 | % | 1.17 | % | 1.41 | % | 1.28 | % | 1.06 | % | ||||||||||||
| Portfolio turnover rate(e) |
22 | % | 16 | % | 12 | % | 14 | % | 17 | % | ||||||||||||
| (a) | Calculated based on the average shares outstanding methodology. |
| (b) | Recognition of net investment income by the Portfolio is affected by the timing of declaration of dividends by the Underlying Funds in which the Portfolio invests. |
| (c) | Assumes investment at the NAV at the beginning of the year, reinvestment of all dividends and distributions, a complete redemption of the investment at the NAV at the end of the year and no sales or redemption charges (if any). Total returns would be reduced if a sales or redemption charge was taken into account. Returns do not reflect the impact of taxes to shareholders relating to Portfolio distributions or the redemption of Portfolio shares. |
| (d) | Expense ratios exclude the expenses of the Underlying Funds in which the Portfolio invests. |
| (e) | The Portfolio’s portfolio turnover rate is calculated in accordance with regulatory requirements, without regard to transactions involving short term investments. If such transactions were included, the Portfolio’s portfolio turnover rate may be higher. |
| The accompanying notes are an integral part of these financial statements. | 33 |
GOLDMAN SACHS TAX-ADVANTAGED GLOBAL EQUITY PORTFOLIO
Financial Highlights (continued)
Selected Data for a Share Outstanding Throughout Each Period
| Goldman Sachs Tax-Advantaged Global Equity Portfolio | ||||||||||||||||||||||
| Class R6 Shares | ||||||||||||||||||||||
| Year Ended August 31, | Period Ended August 31, 2018(a) |
|||||||||||||||||||||
| 2022 | 2021 | 2020 | 2019 | |||||||||||||||||||
| Per Share Data | ||||||||||||||||||||||
| Net asset value, beginning of period |
$ | 21.73 | $ | 17.07 | $ | 15.38 | $ | 16.46 | $ | 15.59 | ||||||||||||
| Net investment income (loss)(b)(c) |
0.29 | 0.26 | 0.20 | 0.19 | (0.01 | ) | ||||||||||||||||
| Net realized and unrealized gain (loss) |
(2.89 | ) | 4.62 | 1.73 | (0.97 | ) | 0.88 | |||||||||||||||
| Total from investment operations |
(2.60 | ) | 4.88 | 1.93 | (0.78 | ) | 0.87 | |||||||||||||||
| Distributions to shareholders from net investment income |
(0.35 | ) | (0.22 | ) | (0.20 | ) | (0.20 | ) | — | |||||||||||||
| Distributions to shareholders from net realized gains |
(0.05 | ) | — | (0.04 | ) | (0.10 | ) | — | ||||||||||||||
| Total distributions |
(0.40 | ) | (0.22 | ) | (0.24 | ) | (0.30 | ) | — | |||||||||||||
| Net asset value, end of period |
$ | 18.73 | $ | 21.73 | $ | 17.07 | $ | 15.38 | $ | 16.46 | ||||||||||||
| Total Return(d) | (12.24 | )% | 28.84 | % | 12.58 | % | (4.57 | )% | 5.58 | % | ||||||||||||
| Net assets, end of period (in 000’s) |
$ | 8,343 | $ | 9,971 | $ | 11 | $ | 10 | $ | 11 | ||||||||||||
| Ratio of net expenses to average net assets(e) |
0.16 | % | 0.12 | % | 0.12 | % | 0.12 | % | 0.12 | %(f) | ||||||||||||
| Ratio of total expenses to average net assets(e) |
0.19 | % | 0.20 | % | 0.18 | % | 0.19 | % | 0.18 | %(f) | ||||||||||||
| Ratio of net investment income (loss) to average net assets |
1.41 | % | 1.36 | % | 1.25 | % | 1.22 | % | (0.05 | )%(f) | ||||||||||||
| Portfolio turnover rate(g) |
22 | % | 16 | % | 12 | % | 14 | % | 17 | % | ||||||||||||
| (a) | Commenced operations on December 29, 2017. |
| (b) | Calculated based on the average shares outstanding methodology. |
| (c) | Recognition of net investment income by the Portfolio is affected by the timing of declaration of dividends by the Underlying Funds in which the Portfolio invests. |
| (d) | Assumes investment at the NAV at the beginning of the period, reinvestment of all dividends and distributions, a complete redemption of the investment at the NAV at the end of the period and no sales or redemption charges (if any). Total returns would be reduced if a sales or redemption charge was taken into account. Returns do not reflect the impact of taxes to shareholders relating to Portfolio distributions or the redemption of Portfolio shares. Total returns for periods less than one full year are not annualized. |
| (e) | Expense ratios exclude the expenses of the Underlying Funds in which the Portfolio invests. |
| (f) | Annualized. |
| (g) | The Portfolio’s portfolio turnover rate is calculated in accordance with regulatory requirements, without regard to transactions involving short term investments. If such transactions were included, the Portfolio’s portfolio turnover rate may be higher. |
| 34 | The accompanying notes are an integral part of these financial statements. |
GOLDMAN SACHS TAX-ADVANTAGED GLOBAL EQUITY PORTFOLIO
Financial Highlights (continued)
Selected Data for a Share Outstanding Throughout Each Period
| Goldman Sachs Tax-Advantaged Global Equity Portfolio | ||||||||||||||||||||||
| Class P Shares | ||||||||||||||||||||||
| Year Ended August 31, | Period Ended August 31, 2018(a) |
|||||||||||||||||||||
| 2022 | 2021 | 2020 | 2019 | |||||||||||||||||||
| Per Share Data | ||||||||||||||||||||||
| Net asset value, beginning of period |
$ | 21.74 | $ | 17.07 | $ | 15.38 | $ | 16.47 | $ | 15.84 | ||||||||||||
| Net investment income(b)(c) |
0.29 | 0.23 | 0.20 | 0.19 | 0.01 | |||||||||||||||||
| Net realized and unrealized gain (loss) |
(2.90 | ) | 4.66 | 1.74 | (0.98 | ) | 0.62 | |||||||||||||||
| Total from investment operations |
(2.61 | ) | 4.89 | 1.94 | (0.79 | ) | 0.63 | |||||||||||||||
| Distributions to shareholders from net investment income |
(0.35 | ) | (0.22 | ) | (0.21 | ) | (0.20 | ) | — | |||||||||||||
| Distributions to shareholders from net realized gains |
(0.05 | ) | — | (0.04 | ) | (0.10 | ) | — | ||||||||||||||
| Total distributions |
(0.40 | ) | (0.22 | ) | (0.25 | ) | (0.30 | ) | — | |||||||||||||
| Net asset value, end of period |
$ | 18.73 | $ | 21.74 | $ | 17.07 | $ | 15.38 | $ | 16.47 | ||||||||||||
| Total Return(d) | (12.28 | )% | 28.87 | % | 12.59 | % | (4.60 | )% | 3.98 | % | ||||||||||||
| Net assets, end of period (in 000’s) |
$ | 3,232,977 | $ | 3,585,571 | $ | 2,710,904 | $ | 2,743,392 | $ | 2,797,271 | ||||||||||||
| Ratio of net expenses to average net assets(e) |
0.17 | % | 0.12 | % | 0.12 | % | 0.12 | % | 0.12 | %(f) | ||||||||||||
| Ratio of total expenses to average net assets(e) |
0.19 | % | 0.20 | % | 0.20 | % | 0.21 | % | 0.20 | %(f) | ||||||||||||
| Ratio of net investment income to average net assets |
1.41 | % | 1.18 | % | 1.30 | % | 1.21 | % | 0.15 | %(f) | ||||||||||||
| Portfolio turnover rate(g) |
22 | % | 16 | % | 12 | % | 14 | % | 17 | % | ||||||||||||
| (a) | Commenced operations on April 17, 2018. |
| (b) | Calculated based on the average shares outstanding methodology. |
| (c) | Recognition of net investment income by the Portfolio is affected by the timing of declaration of dividends by the Underlying Funds in which the Portfolio invests. |
| (d) | Assumes investment at the NAV at the beginning of the period, reinvestment of all dividends and distributions, a complete redemption of the investment at the NAV at the end of the period and no sales or redemption charges (if any). Total returns would be reduced if a sales or redemption charge was taken into account. Returns do not reflect the impact of taxes to shareholders relating to Portfolio distributions or the redemption of Portfolio shares. Total returns for periods less than one full year are not annualized. |
| (e) | Expense ratios exclude the expenses of the Underlying Funds in which the Portfolio invests. |
| (f) | Annualized. |
| (g) | The Portfolio’s portfolio turnover rate is calculated in accordance with regulatory requirements, without regard to transactions involving short term investments. If such transactions were included, the Portfolio’s portfolio turnover rate may be higher. |
| The accompanying notes are an integral part of these financial statements. | 35 |
GOLDMAN SACHS GLOBAL TAX-AWARE EQUITY PORTFOLIOS
August 31, 2022
| 1. ORGANIZATION |
Goldman Sachs Trust (the “Trust”) is a Delaware statutory trust registered under the Investment Company Act of 1940, as amended (the “Act”), as an open-end management investment company. The following table lists those series of the Trust that are included in this report (collectively, the “Portfolios” or individually a “Portfolio”), along with their corresponding share classes and respective diversification status under the Act:
| Portfolio |
Share Classes Offered | Diversification/ Non-diversified | ||
| Enhanced Dividend Global Equity and Tax-Advantaged Global Equity |
A, Institutional, R6 and P |
Diversified |
Class A Shares are sold with a front-end sales charge of up to 5.50%. Institutional, Class R6 and Class P Shares are not subject to a sales charge.
Goldman Sachs Asset Management, L.P. (“GSAM”), an affiliate of Goldman Sachs & Co. LLC (“Goldman Sachs”), serves as investment adviser to the Portfolios pursuant to a management agreement (the “Agreement”) with the Trust.
The Portfolios are expected to invest primarily in a combination of domestic and international equity and fixed income underlying funds (“Underlying Funds”) which are registered under the Act, for which GSAM acts as the investment adviser. Additionally, these Portfolios may invest a portion of their assets directly in other securities and instruments, including unaffiliated exchange traded funds.
| 2. SIGNIFICANT ACCOUNTING POLICIES |
The financial statements have been prepared in accordance with accounting principles generally accepted in the United States (“U.S.”) of America (“GAAP”) and require management to make estimates and assumptions that may affect the reported amounts and disclosures. Actual results may differ from those estimates and assumptions. Each Portfolio is an investment company under GAAP and follows the accounting and reporting guidance applicable to investment companies.
A. Investment Valuation — The valuation policy of the Portfolios and Underlying Funds is to value investments at fair value.
B. Investment Income and Investments — Investment income includes interest income, dividend income, and securities lending income, if any. Interest income is accrued daily and adjusted for amortization of premiums and accretion of discounts. Dividend income is recognized on ex-dividend date or, for certain foreign securities, as soon as such information is obtained subsequent to the ex-dividend date. Non-cash dividends, if any, are recorded at the fair market value of the securities received. Investment transactions are reflected on trade date. Realized gains and losses are calculated using identified cost. Investment transactions are recorded on the following business day for daily net asset value (“NAV”) calculations. Distributions from master limited partnerships (“MLPs”) are generally recorded based on the characterization reported on the MLP’s tax return. The Goldman Sachs MLP Energy Infrastructure Fund (the “Underlying MLP Fund”) records its pro-rata share of the income/loss and capital gains/losses, allocated from the underlying partnerships and adjusts the cost basis of the underlying partnerships accordingly. Income distributions are recognized as capital gains or income in the financial statements in accordance with the character that is distributed.
For derivative contracts, unrealized gains and losses are recorded daily and become gains and losses upon disposition or termination of the contract.
C. Class Allocations and Expenses — Investment income, realized and unrealized gain (loss), if any, and non-class specific expenses of each Portfolio are allocated daily based upon the proportion of net assets of each class. Non-class specific expenses directly incurred by a Portfolio are charged to that Portfolio while such expenses incurred by the Trust are allocated across the applicable Portfolios on a straight-line and/or pro-rata basis depending upon the nature of the expenses. Class specific expenses, where applicable, are borne by the respective share classes and include Distribution and Service and Transfer Agency fees. Expenses included in the accompanying financial statements reflect the expenses of each Portfolio and do not include any expenses associated with the Underlying Funds. Because the Underlying Funds have varied expense and fee levels and the Portfolios may
36
GOLDMAN SACHS GLOBAL TAX-AWARE EQUITY PORTFOLIOS
| 2. SIGNIFICANT ACCOUNTING POLICIES (continued) |
own different proportions of the Underlying Funds at different times, the amount of fees and expenses incurred indirectly by each Fund will vary.
D. Federal Taxes and Distributions to Shareholders — It is each Portfolio’s policy to comply with the requirements of the Internal Revenue Code of 1986, as amended (the “Code”), applicable to regulated investment companies and to distribute each year substantially all of its investment company taxable income and capital gains to its shareholders. Accordingly, each Portfolio is not required to make any provisions for the payment of federal income tax. Distributions to shareholders are recorded on the ex-dividend date. For each Portfolio income distributions, if any, are declared and paid according to the following schedule:
| Portfolio | Income Distributions Declared/Paid |
Capital Gains Distributions Declared/Paid | ||||
| Enhanced Dividend Global Equity |
Quarterly | Annually | ||||
|
Tax-Advantaged Global Equity |
Annually | Annually |
Net capital losses, if any, are carried forward to future fiscal years and may be used to the extent allowed by the Code to offset any future capital gains. Losses that are carried forward will retain their character as either short-term or long-term capital losses. Utilization of capital loss carryforwards will reduce the requirement of future capital gains distributions.
The characterization of distributions to shareholders for financial reporting purposes is determined in accordance with federal income tax rules, which may differ from GAAP. The source of each Portfolio’s distributions may be shown in the accompanying financial statements as either from distributable earnings or capital. Certain components of the Portfolios’ net assets on the Statements of Assets and Liabilities reflect permanent GAAP/tax differences based on the appropriate tax character.
E. Foreign Currency Translation — The accounting records and reporting currency of a Portfolio are maintained in U.S. dollars. Assets and liabilities denominated in foreign currencies are translated into U.S. dollars using the current exchange rates at the close of each business day. The effect of changes in foreign currency exchange rates on investments is included within net realized and unrealized gain (loss) on investments. Changes in the value of other assets and liabilities as a result of fluctuations in foreign exchange rates are included in the Statements of Operations within net change in unrealized gain (loss) on foreign currency translation. Transactions denominated in foreign currencies are translated into U.S. dollars on the date the transaction occurred, the effects of which are included within net realized gain (loss) on foreign currency transactions.
| 3. INVESTMENTS AND FAIR VALUE MEASUREMENTS |
U.S. GAAP defines the fair value of a financial instrument as the amount that would be received to sell an asset or paid to transfer a liability in an orderly transaction between market participants at the measurement date (i.e., the exit price); the Portfolios’ policy is to use the market approach. GAAP establishes a fair value hierarchy that prioritizes the inputs to valuation techniques used to measure fair value. The hierarchy gives the highest priority to unadjusted quoted prices in active markets for identical assets or liabilities (Level 1 measurements) and the lowest priority to unobservable inputs (Level 3 measurements). The level in the fair value hierarchy within which the fair value measurement in its entirety falls shall be determined based on the lowest level input that is significant to the fair value measurement in its entirety. The levels used for classifying investments are not necessarily an indication of the risk associated with investing in these investments. The three levels of the fair value hierarchy are described below:
Level 1 — Unadjusted quoted prices in active markets that are accessible at the measurement date for identical, unrestricted assets or liabilities;
Level 2 — Quoted prices in markets that are not active or financial instruments for which significant inputs are observable (including, but not limited to, quoted prices for similar investments, interest rates, foreign exchange rates, volatility and credit spreads), either directly or indirectly;
Level 3 — Prices or valuations that require significant unobservable inputs (including GSAM’s assumptions in determining fair value measurement).
37
GOLDMAN SACHS GLOBAL TAX-AWARE EQUITY PORTFOLIOS
Notes to Financial Statements (continued)
August 31, 2022
| 3. INVESTMENTS AND FAIR VALUE MEASUREMENTS (continued) |
The Board of Trustees (“Trustees”) has approved Valuation Procedures that govern the valuation of the portfolio investments held by the Portfolios, including investments for which market quotations are not readily available. With respect to the Portfolios’ investments that do not have readily available market quotations, the Trustees have designated GSAM as the valuation designee to perform fair valuations pursuant to Rule 2a-5 under the Investment Company Act of 1940 (“the Valuation Designee”). GSAM has day-to-day responsibility for implementing and maintaining internal controls and procedures related to the valuation of the Portfolios’ investments. To assess the continuing appropriateness of pricing sources and methodologies, GSAM regularly performs price verification procedures and issues challenges as necessary to third party pricing vendors or brokers, and any differences are reviewed in accordance with the Valuation Procedures.
A. Level 1 and Level 2 Fair Value Investments — The valuation techniques and significant inputs used in determining the
fair values for investments classified as Level 1 and Level 2 are as follows:
Equity Securities — Equity securities traded on a U.S. securities exchange or the NASDAQ system, or those located on certain foreign exchanges, including but not limited to the Americas, are valued daily at their last sale price or official closing price on the principal exchange or system on which they are traded. If there is no sale or official closing price or such price is believed by GSAM to not represent fair value, equity securities will be valued at the valid closing bid price for long positions and at the valid closing ask price for short positions (i.e. where there is sufficient volume, during normal exchange trading hours). If no valid bid/ask price is available, the equity security will be valued pursuant to the Valuation Procedures and consistent with applicable regulatory guidance. To the extent these investments are actively traded, they are classified as Level 1 of the fair value hierarchy, otherwise they are generally classified as Level 2. Certain equity securities containing unique attributes may be classified as Level 2.
Unlisted equity securities for which market quotations are available are valued at the last sale price on the valuation date, or if no sale occurs, at the last bid price for long positions or the last ask price for short positions, and are generally classified as Level 2.
Underlying Funds (including Money Market Funds) — Underlying funds (“Underlying Funds”) include other investment companies and exchange-traded funds (“ETFs”). Investments in the Underlying Funds (except ETFs) are valued at the NAV per share on the day of valuation. ETFs are valued daily at the last sale price or official closing price on the principal exchange or system on which the investment is traded. Because the Portfolios invest in Underlying Funds that fluctuate in value, the Portfolios’ shares will correspondingly fluctuate in value. Underlying Funds are generally classified as Level 1 of the fair value hierarchy. To the extent that underlying ETFs are actively traded, they are classified as Level 1 of the fair value hierarchy, otherwise they are generally classified as Level 2. For information regarding an Underlying Fund’s accounting policies and investment holdings, please see the Underlying Fund’s shareholder report.
Derivative Contracts — A derivative is an instrument whose value is derived from underlying assets, indices, reference rates or a combination of these factors. A Portfolio enters into derivative transactions to hedge against changes in interest rates, securities prices, and/or currency exchange rates, to increase total return, or to gain access to certain markets or attain exposure to other underliers. For financial reporting purposes, cash collateral that has been pledged to cover obligations of a Portfolio and cash collateral received, if any, is reported separately on the Statements of Assets and Liabilities as receivables/payables for collateral on certain derivatives contracts. Non-cash collateral pledged by a Portfolio, if any, is noted in the Schedules of Investments.
Exchange-traded derivatives, including futures and options contracts, are generally valued at the last sale or settlement price on the exchange where they are principally traded. Exchange-traded options without settlement prices are generally valued at the last bid price for long positions and the last ask price for short positions on the exchange where they are principally traded. Exchange-traded derivatives typically fall within Level 1 of the fair value hierarchy.
Over-the-counter (“OTC”) and centrally cleared derivatives are valued using market transactions and other market evidence, including market-based inputs to models, calibration to market-clearing transactions, broker or dealer quotations, or other alternative pricing sources. Where models are used, the selection of a particular model to value OTC and centrally cleared derivatives depends upon the contractual terms of, and specific risks inherent in, the instrument, as well as the availability of pricing information in the market. Valuation models require a variety of inputs, including contractual terms, market prices, yield curves, credit curves, measures of volatility, voluntary and involuntary prepayment rates, loss severity rates and correlations of such inputs. For OTC and centrally cleared derivatives that trade in liquid markets, model inputs can generally be verified and
38
GOLDMAN SACHS GLOBAL TAX-AWARE EQUITY PORTFOLIOS
| 3. INVESTMENTS AND FAIR VALUE MEASUREMENTS (continued) |
model selection does not involve significant management judgment. OTC and centrally cleared derivatives are classified within Level 2 of the fair value hierarchy when significant inputs are corroborated by market evidence.
i. Forward Contracts — A forward contract is a contract between two parties to buy or sell an asset at a specified price on a future date. A forward contract settlement can occur on a cash or delivery basis. Forward contracts are marked-to-market daily using independent vendor prices, and the change in value, if any, is recorded as an unrealized gain or loss. Cash and certain investments may be used to collateralize forward contracts.
A forward foreign currency exchange contract is a forward contract in which a Portfolio agrees to receive or deliver a fixed quantity of one currency for another, at a pre-determined price at a future date. All forward foreign currency exchange contracts are marked to market daily by using the outright forward rates or interpolating based upon maturity dates, where available. Non-deliverable forward foreign currency exchange contracts are settled with the counterparty in cash without the delivery of foreign currency.
ii. Futures Contracts — Futures contracts are contracts to buy or sell a standardized quantity of a specified commodity or security. Upon entering into a futures contract, a Portfolio deposits cash or securities in an account on behalf of the broker in an amount sufficient to meet the initial margin requirement. Subsequent payments are made or received by a Portfolio equal to the daily change in the contract value and are recorded as variation margin receivable or payable with a corresponding offset to unrealized gains or losses.
iii. Options — When the Portfolio writes call or put options, an amount equal to the premium received is recorded as a liability and is subsequently marked-to-market to reflect the current value of the option written. Swaptions are options on swap contracts.
Upon the purchase of a call option or a put option by the Portfolio, the premium paid is recorded as an investment and subsequently marked-to-market to reflect the current value of the option. Certain options may be purchased with premiums to be determined on a future date. The premiums for these options are based upon implied volatility parameters at specified terms.
iv. Swap Contracts — Bilateral swap contracts are agreements in which the Portfolio and a counterparty agree to exchange periodic payments on a specified notional amount or make a net payment upon termination. Bilateral swap transactions are privately negotiated in the OTC market and payments are settled through direct payments between the Portfolio and the counterparty. By contrast, certain swap transactions are subject to mandatory central clearing. These swaps are executed through a derivatives clearing member (“DCM”), acting in an agency capacity, and submitted to a central counterparty (“CCP”) (“centrally cleared swaps”), in which case all payments are settled with the CCP through the DCM. Swaps are marked-to-market daily using pricing vendor quotations, counterparty or clearinghouse prices or model prices, and the change in value, if any, is recorded as an unrealized gain or loss. Upon entering into a swap contract, a Portfolio is required to satisfy an initial margin requirement by delivering cash or securities to the counterparty (or in some cases, segregated in a triparty account on behalf of the counterparty), which can be adjusted by any mark-to-market gains or losses pursuant to bilateral or centrally cleared arrangements. For centrally cleared swaps the daily change in valuation, if any, is recorded as a receivable or payable for variation margin.
A total return swap is an agreement that gives the Portfolio the right to receive or pay the appreciation or depreciation, as applicable, in the value of a specified security, an index, a basket of securities or indices or other instrument in return for a fee paid to the counterparty, which will typically be an agreed upon interest rate. If the underlying asset declines in value over the term of the swap, the Portfolio may also be required to pay the dollar value of that decline to the counterparty.
B. Level 3 Fair Value Investments — To the extent that significant inputs to valuation models and other alternative pricing
sources are unobservable, or if quotations are not readily available, or if GSAM believes that such quotations do not accurately reflect fair value, the fair value of a Portfolio’s investments may be determined under Valuation Procedures approved by the Trustees. GSAM, consistent with its procedures and applicable regulatory guidance, may make an adjustment to the most recent valuation prices of either domestic or foreign securities in light of significant events to reflect what it believes to be the fair value of the securities at the time of determining a Portfolio’s NAV. To the extent investments are valued using single source broker quotations obtained directly from the broker or passed through from third party pricing vendors, such investments are classified as Level 3 investments.
39
GOLDMAN SACHS GLOBAL TAX-AWARE EQUITY PORTFOLIOS
Notes to Financial Statements (continued)
August 31, 2022
| 3. INVESTMENTS AND FAIR VALUE MEASUREMENTS (continued) |
C. Fair Value Hierarchy — The following is a summary of the Portfolios’ investments and derivatives classified in the fair value hierarchy as of August 31, 2022:
| ENHANCED DIVIDEND GLOBAL EQUITY PORTFOLIO | ||||||||||||
| Investment Type | Level 1 | Level 2 | Level 3 | |||||||||
| Assets | ||||||||||||
| Underlying Equity Funds |
$ | 364,337,098 | $ | — | $ | — | ||||||
| Investment Company |
30,671,846 | — | — | |||||||||
| Exchange Traded Funds |
2,996,725 | — | — | |||||||||
| Total | $ | 398,005,669 | $ | — | $ | — | ||||||
| Derivative Type | ||||||||||||
| Assets | ||||||||||||
| Forward Foreign Currency Contracts(a) |
$ | — | $ | 2,803,310 | $ | — | ||||||
| Purchased Option Contracts |
— | 394,548 | — | |||||||||
| Total Return Swaps Contracts(a) |
— | 90,806 | — | |||||||||
| Total | $ | — | $ | 3,288,664 | $ | — | ||||||
| Liabilities | ||||||||||||
| Forward Foreign Currency Contracts(a) |
$ | — | $ | (179,804 | ) | $ | — | |||||
| Futures Contracts(a) |
(88,511 | ) | — | — | ||||||||
| Written Option Contracts |
— | (588,474 | ) | — | ||||||||
| Total Return Swaps Contracts(a) |
— | (14,014 | ) | — | ||||||||
| Total | $ | (88,511 | ) | $ | (782,292 | ) | $ | — | ||||
| TAX-ADVANTAGED GLOBAL EQUITY PORTFOLIO | ||||||||||||
| Investment Type | Level 1 | Level 2 | Level 3 | |||||||||
| Assets | ||||||||||||
| Underlying Equity Funds |
$ | 2,948,691,411 | $ | — | $ | — | ||||||
| Investment Company |
261,283,135 | — | — | |||||||||
| Exchange Traded Funds |
24,098,031 | — | — | |||||||||
| Total | $ | 3,234,072,577 | $ | — | $ | — | ||||||
| Derivative Type | ||||||||||||
| Assets | ||||||||||||
| Forward Foreign Currency Contracts(a) |
$ | — | $ | 22,809,995 | $ | — | ||||||
| Purchased Option Contracts |
— | 3,162,304 | — | |||||||||
| Total Return Swaps Contracts(a) |
— | 740,372 | — | |||||||||
| Total | $ | — | $ | 26,712,671 | $ | — | ||||||
| (a) | Amount shown represents unrealized gain (loss) at fiscal year end. |
40
GOLDMAN SACHS GLOBAL TAX-AWARE EQUITY PORTFOLIOS
| 3. INVESTMENTS AND FAIR VALUE MEASUREMENTS (continued) |
| TAX-ADVANTAGED GLOBAL EQUITY PORTFOLIO (continued) | ||||||||||||
| Derivative Type | Level 1 | Level 2 | Level 3 | |||||||||
| Liabilities | ||||||||||||
| Forward Foreign Currency Contracts(a) |
$ | — | $ | (1,605,742 | ) | $ | — | |||||
| Futures Contracts(a) |
(718,907 | ) | — | — | ||||||||
| Written Option Contracts |
— | (4,676,937 | ) | — | ||||||||
| Total Return Swaps Contracts(a) |
— | (114,084 | ) | — | ||||||||
| Total | $ | (718,907 | ) | $ | (6,396,763 | ) | $ | — | ||||
| (a) | Amount shown represents unrealized gain (loss) at fiscal year end. |
For further information regarding security characteristics, see the Schedules of Investments.
| 4. INVESTMENTS IN DERIVATIVES |
The following table sets forth, by certain risk types, the gross value of derivative contracts (not considered to be hedging instruments for accounting disclosure purposes) as of August 31, 2022. These instruments were used as part of the Portfolios’ investment strategies and to obtain and/or manage exposure related to the risks below. The values in the table below exclude the effects of cash collateral received or posted pursuant to these derivative contracts, and therefore are not representative of the Portfolios’ net exposure.
| Enhanced Dividend Global Equity | ||||||||||||
| Risk | Statements of Assets and Liabilities |
Assets | Statements of Assets and Liabilities |
Liabilities | ||||||||
| Interest Rate |
Purchased options, at value |
$ | 20,937 | Variation margin on futures contracts and written options, at value | $ | (99,070) | (a) | |||||
| Currency |
Receivable for unrealized gain on forward foreign currency exchange contracts and purchased options, at value | 2,897,042 | Payable for unrealized loss on forward foreign currency exchange contracts and written options, at value | (242,175) | ||||||||
| Equity |
Receivable for unrealized gain on swap contracts and purchased options, at value |
370,685 | Variation margin on futures contracts, unrealized loss on swap contracts and written options, at value |
(529,558) | (a) | |||||||
| Total | $ | 3,288,664 | $ | (870,803) | ||||||||
| Tax-Advantaged Global Equity | ||||||||||||
| Risk | Statements of Assets and Liabilities |
Assets | Statements of Assets and Liabilities |
Liabilities | ||||||||
| Interest Rate |
Purchased options, at value |
$ | 168,320 | Variation margin on futures contracts and written options, at value | $ | (798,637) | (a) | |||||
| Currency |
Receivable for unrealized gain on forward foreign currency exchange contracts and purchased options, at value | 23,551,046 | Payable for unrealized loss on forward foreign currency exchange contracts and written options, at value | (2,095,496) | ||||||||
| Equity |
Receivable for unrealized gain on swap contracts and purchased options, at value |
2,993,305 | (a) | Variation margin on futures contracts, unrealized loss on swap contracts and written options, at value |
(4,221,537) | (a) | ||||||
| Total | $ | 26,712,671 | $ | (7,115,670) | ||||||||
| (a) | Includes unrealized gain (loss) on futures contracts described in the Additional Investment Information sections of the Schedule of Investments. Only variation margin as of August 31, 2022 is reported within the Statements of Assets and Liabilities. |
41
GOLDMAN SACHS GLOBAL TAX-AWARE EQUITY PORTFOLIOS
Notes to Financial Statements (continued)
August 31, 2022
| 4. INVESTMENTS IN DERIVATIVES (continued) |
The following table sets forth, by certain risk types, the Portfolios’ gains (losses) related to these derivatives and their indicative volumes for the fiscal year ended August 31, 2022. These gains (losses) should be considered in the context that these derivative contracts may have been executed to create investment opportunities and/or economically hedge certain investments, and accordingly, certain gains (losses) on such derivative contracts may offset certain (losses) gains attributable to investments. These gains (losses) are included in “Net realized gain (loss)” or “Net change in unrealized gain (loss)” on the Statements of Operations:
| Enhanced Dividend Global Equity | ||||||||||
| Risk | Statement of Operations | Net Realized Gain (Loss) |
Net Change in Unrealized Gain (Loss) |
|||||||
| Interest Rate | Net realized gain (loss) from futures contracts and written options/Net change in unrealized gain (loss) on futures contracts, written option and purchased options | $ | (602,661 | ) | $ | (86,493 | ) | |||
| Currency | Net realized gain (loss) from forward foreign currency exchange contracts, written option and purchased options/Net change in unrealized gain (loss) on forward foreign currency exchange contracts, written option and purchased options | 6,330,417 | 1,485,647 | |||||||
| Equity | Net realized gain (loss) from futures contracts, swaps, written option and purchased options/Net change in unrealized gain (loss) on futures contracts, swaps, written option and purchased options | (248,052 | ) | (137,404 | ) | |||||
| Total | $ | 5,479,704 | $ | 1,261,750 | ||||||
| Tax-Advantaged Global Equity | ||||||||||
| Risk | Statement of Operations | Net Realized Gain (Loss) |
Net Change in Unrealized Gain (Loss) |
|||||||
| Interest Rate | Net realized gain (loss) from futures contracts and purchased options/Net change in unrealized gain (loss) on futures contracts and purchased options | $ | (5,472,110 | ) | $ | (452,090 | ) | |||
| Currency | Net realized gain (loss) from forward foreign currency exchange contracts, written option and purchased options/Net change in unrealized gain (loss) on forward foreign currency exchange contracts, written option and purchased options | 48,615,033 | 13,897,560 | |||||||
| Equity | Net realized gain (loss) from swaps, written option, and purchased options/Net change in unrealized gain (loss) on futures contracts, swaps, written option and purchased options | (2,097,320 | ) | (2,095,297 | ) | |||||
| Total | $ | 41,045,603 | $ | 11,350,173 | ||||||
For the fiscal year ended August 31, 2022, the relevant values for each derivative type was as follows:
| Average number of Contracts or Notional Amounts(1) | ||||||||||||||||||||
| Portfolio | Futures Contracts |
Forward Contracts |
Swap Agreements |
Purchased Options |
Written Options |
|||||||||||||||
| Enhanced Dividend Global Equity |
81 | $ | 45,843,509 | $ | 14,479 | 2,833,838 | 2,345,027 | |||||||||||||
| Tax-Advantaged Global Equity |
647 | 350,614,770 | 114,170 | 22,439,343 | 18,573,305 | |||||||||||||||
| (1) | Amounts disclosed represent average number of contracts for futures contracts, purchased options and written options, notional amounts for forward contracts and swap contracts, based on absolute values, which is indicative of volume of this derivative type, for the months that each Portfolio held such derivatives during the fiscal year ended August 31, 2022. |
| 5. AGREEMENTS AND AFFILIATED TRANSACTIONS |
A. Management Agreement — Under the Agreement, GSAM manages the Portfolios, subject to the general supervision of the Trustees.
As compensation for the services rendered pursuant to the Agreement, the assumption of the expenses related thereto and administration of the Portfolios’ business affairs, including providing facilities, GSAM is entitled to a management fee, accrued
42
GOLDMAN SACHS GLOBAL TAX-AWARE EQUITY PORTFOLIOS
| 5. AGREEMENTS AND AFFILIATED TRANSACTIONS (continued) |
daily and paid monthly, equal to an annual percentage rate of 0.15% of each Portfolio’s average daily net assets. Prior to December 29, 2021 GSAM waived a portion of its management fee in order to achieve an effective net rate of 0.08% as an annual percentage rate of average daily net assets of each Portfolio.
The Portfolios invest in Class R6 Shares of the Goldman Sachs High Yield Floating Rate and Goldman Sachs MLP Energy Infrastructure Funds and Institutional Shares of the Goldman Sachs Financial Square Government Fund (“Government Money Market Fund”), which are affiliated Underlying Funds. GSAM has agreed to waive a portion of its management fee payable by the Portfolios in an amount equal to the management fee it earns as an investment adviser to the above affiliated Underlying Funds in which the Portfolios invest, except those management fees it earns from the Portfolios’ investments of cash collateral received in connection with securities lending transactions in the Government Money Market Fund. For the fiscal year ended August 31, 2022, the management fee waived by GSAM for each Portfolio was as follows:
| Portfolio | Management Fee Waived |
|||
| Enhanced Dividend Global Equity |
$ | 15,141 | ||
|
Tax-Advantaged Global Equity |
119,968 | |||
B. Distribution and/or Service (12b-1) Plan — The Trust, on behalf of Class A Shares of each applicable Portfolio, has adopted a Distribution and Service Plan subject to Rule 12b-1 under the Act. Under the Distribution and Service Plan, Goldman Sachs, which serves as distributor (the “Distributor”), is entitled to a fee accrued daily and paid monthly for distribution services and personal and account maintenance services, which may then be paid by Goldman Sachs to authorized dealers. These fees are equal to an annual percentage rate of 0.25% of the average daily net assets attributable to Class A Shares of the Portfolios.
C. Distribution Agreement — Goldman Sachs, as Distributor of the shares of the Portfolios pursuant to a Distribution
Agreement, may retain a portion of the Class A Shares’ front end sales charge. During the fiscal year ended August 31, 2022, Goldman Sachs retained front-end sales charges of $260 for the Enhanced Dividend Global Equity Portfolio.
D. Transfer Agency Agreement — Goldman Sachs also serves as the transfer agent of the Portfolios for a fee pursuant to the
Transfer Agency Agreement. The fees charged for such transfer agency services are accrued daily and paid monthly at annual rates as follows: 0.16% of the average daily net assets of Class A Shares; 0.03% of the average daily net assets of Class R6 and Class P Shares; and 0.04% of the average daily net assets of Institutional Shares. Effective December 29, 2021 Goldman Sachs began waiving 0.04% of its transfer agent fee of the class A shares of the Enhanced Dividend Global Equity Portfolio.
E. Other Expense Agreements and Affiliated Transactions — GSAM has agreed to reduce or limit certain “Other
Expenses” of the Portfolios (excluding acquired fund fees and expenses, transfer agency fees and expenses, service fees and
shareholder administration fees (as applicable), taxes, interest, brokerage fees, expenses of shareholder meetings, litigation and indemnification, and extraordinary expenses) to the extent such expenses exceed, on an annual basis, a percentage rate of the average daily net assets of each Portfolio. Such Other Expense reimbursements, if any, are accrued daily and paid monthly. In addition, the Portfolios are not obligated to reimburse GSAM for prior fiscal year expense reimbursements, if any. The Other Expense limitations as an annual percentage rate of average daily net assets for the Portfolios is 0.014%. These Other Expense limitations will remain in place through at least December 29, 2022, and prior to such date GSAM may not terminate the arrangements without the approval of the Trustees. In addition, the Portfolios have entered into certain offset arrangements with the custodian and the transfer agent, which may result in a reduction of the Portfolios’ expenses and are received irrespective of the application of the “Other Expense” limitations described above.
43
GOLDMAN SACHS GLOBAL TAX-AWARE EQUITY PORTFOLIOS
Notes to Financial Statements (continued)
August 31, 2022
| 5. AGREEMENTS AND AFFILIATED TRANSACTIONS (continued) |
For the fiscal year ended August 31, 2022, these expense reductions, including any fee waivers and Other Expense reimbursements, were as follows:
| Management Fee Waiver |
Other Expense Reimbursement |
Transfer Agency Waivers/ Credits |
Total Expense Reductions |
|||||||||||||||
| Enhanced Dividend Global Equity |
$ | 124,117 | $ | 183,084 | $ | 850 | $ | 308,051 | ||||||||||
|
Tax-Advantaged Global Equity |
954,321 | 51,601 | — | 1,005,922 | ||||||||||||||
F. Line of Credit Facility — As of August 31, 2022, the Portfolios participated in a $1,250,000,000 committed, unsecured
revolving line of credit facility (the “facility”) together with other funds of the Trust and certain registered investment companies having management agreements with GSAM or its affiliates. This facility is to be used for temporary emergency purposes, or to allow for an orderly liquidation of securities to meet redemption requests. The interest rate on borrowings is based on the federal funds rate. The facility also requires a fee to be paid by the Portfolios based on the amount of the commitment that has not been utilized. For the fiscal year ended August 31, 2022, the Portfolios did not have any borrowings under the facility. Prior to April 22, 2022, the facility was $1,000,000,000.
G. Other Transactions with Affiliates — The Portfolios invest primarily in Class R6 Shares of the Underlying Funds. These Underlying Funds are considered to be affiliated with the Portfolios. The tables below show the transactions in and earnings from investments in these Underlying Funds for the fiscal year ended August 31, 2022:
| Enhanced Dividend Global Equity |
| |||||||||||||||||||||||||||||||||||||||
| Underlying Funds | Beginning Value as of August 31, 2021 |
Purchases at Cost |
Proceeds from Sales |
Return of Capital on Dividends |
Net Realized Gain/(Loss) |
Change in Unrealized Appreciation/ (Depreciation) |
Ending Value as of August 31, 2022 |
Shares as of August 31, 2022 |
Dividend Income |
Capital Gain Distributions |
||||||||||||||||||||||||||||||
| Goldman Sachs Emerging Markets Equity Insights Fund |
$ | 24,106,846 | $ | 9,766,729 | $ | (14,014,757 | ) | $ | — | $ | 866,406 | $ | (10,801,733 | ) | $ | 9,923,491 | 1,228,155 | $ | 542,637 | $ | 3,744,881 | |||||||||||||||||||
| Goldman Sachs Energy Infrastructure Fund |
— | 1,001,531 | (434,475 | ) | (105,796 | ) | 141,970 | 59,055 | 662,285 | 59,558 | 18,896 | — | ||||||||||||||||||||||||||||
| Goldman Sachs Financial Square Government Fund (Institutional Shares) |
3,321,545 | 188,935,725 | (161,585,424 | ) | — | — | — | 30,671,846 | 30,671,846 | 133,958 | — | |||||||||||||||||||||||||||||
| Goldman Sachs Global Infrastructure Fund |
8,686,612 | 311,045 | (1,496,390 | ) | (5,274 | ) | 256,196 | (421,015 | ) | 7,331,174 | 568,308 | 141,265 | 26,609 | |||||||||||||||||||||||||||
| Goldman Sachs Global Real Estate Securities Fund |
8,768,488 | 328,609 | (926,390 | ) | (1,174 | ) | 90,215 | (1,792,338 | ) | 6,467,410 | 656,590 | 185,438 | — | |||||||||||||||||||||||||||
| Goldman Sachs High Yield Floating Rate Fund |
— | 3,006,360 | (1,560,941 | ) | — | (102,763 | ) | (62,991 | ) | 1,279,665 | 143,300 | 67,859 | — | |||||||||||||||||||||||||||
| Goldman Sachs International Equity Dividend and Premium Fund |
92,684,445 | 13,040,790 | (17,823,901 | ) | (6,342 | ) | (8,256 | ) | (19,283,497 | ) | 68,603,239 | 11,529,956 | 4,601,010 | — | ||||||||||||||||||||||||||
| Goldman Sachs International Small Cap Insights Fund |
17,701,945 | 1,657,158 | (1,867,191 | ) | — | 245,951 | (5,068,289 | ) | 12,669,574 | 1,167,703 | 558,602 | — | ||||||||||||||||||||||||||||
44
GOLDMAN SACHS GLOBAL TAX-AWARE EQUITY PORTFOLIOS
| 5. AGREEMENTS AND AFFILIATED TRANSACTIONS (continued) |
| Enhanced Dividend Global Equity (continued) |
| |||||||||||||||||||||||||||||||||||||||
| Underlying Funds | Beginning Value as of August 31, 2021 |
Purchases at Cost |
Proceeds from Sales |
Return of Capital on Dividends |
Net Realized Gain/(Loss) |
Change in Unrealized Appreciation/ (Depreciation) |
Ending Value as of August 31, 2022 |
Shares as of August 31, 2022 |
Dividend Income |
Capital Gain Distributions |
||||||||||||||||||||||||||||||
| Goldman Sachs MLP Energy Infrastructure Fund |
$ | 7,888,167 | $ | 1,134,418 | $ | (3,076,390 | ) | $ | — | $ | 1,415,852 | $ | 579,826 | $ | 7,941,873 | 275,568 | $ | 501,247 | $ | — | ||||||||||||||||||||
| Goldman Sachs Small Cap Equity Insights Fund |
37,609,230 | 13,896,547 | (4,160,815 | ) | — | 1,171,465 | (16,044,116 | ) | 32,472,311 | 1,421,108 | 2 | 8,664,222 | ||||||||||||||||||||||||||||
| Goldman SachsTactical Tilt Overlay Fund |
47,687,260 | 3,318,053 | (51,064,029 | ) | — | 3,355,933 | (3,297,217 | ) | — | — | 959,139 | — | ||||||||||||||||||||||||||||
| Goldman Sachs US Equity Dividend and Premium Fund |
238,205,328 | 46,175,000 | (34,921,267 | ) | (468 | ) | 3,179,729 | (36,122,690 | ) | 216,986,076 | 15,400,005 | 2,976,176 | 10,659,488 | |||||||||||||||||||||||||||
| Total |
$ | 486,659,866 | $ | 282,571,965 | $ | (292,931,970 | ) | $ | (119,054 | ) | $ | 10,613,634 | $ | (92,255,005 | ) | $ | 395,008,944 | $ | 10,686,229 | $ | 23,095,200 | |||||||||||||||||||
| Tax-Advantaged Global Equity |
| |||||||||||||||||||||||||||||||||||||||
| Underlying Funds | Beginning Value as of August 31, 2021 |
Purchases at Cost |
Proceeds from Sales |
Return of Capital on Dividends |
Net Realized Gain/(Loss) |
Change in Unrealized Appreciation/ (Depreciation) |
Ending Value as of August 31, 2022 |
Shares as of August 31, 2022 |
Dividend Income |
Capital Gain Distributions |
||||||||||||||||||||||||||||||
| Goldman Sachs Emerging Markets Equity Insights Fund |
$ | 175,328,302 | $ | 74,232,309 | $ | (90,153,358 | ) | $ | — | $ | (18,986,023 | ) | $ | (58,969,813 | ) | $ | 81,451,417 | 10,080,621 | $ | 4,273,178 | $ | 29,299,711 | ||||||||||||||||||
| Goldman Sachs Energy Infrastructure Fund |
— | 7,926,661 | (3,353,962 | ) | — | 279,244 | 474,992 | 5,326,935 | 479,041 | 149,554 | — | |||||||||||||||||||||||||||||
| Goldman Sachs Financial Square Government Fund (Institutional Shares) |
26,923,612 | 1,529,933,453 | (1,295,573,930 | ) | — | — | — | 261,283,135 | 261,283,135 | 1,180,052 | — | |||||||||||||||||||||||||||||
| Goldman Sachs Global Infrastructure Fund |
62,101,355 | 7,033,205 | (7,936,290 | ) | (969 | ) | 374,622 | (1,574,723 | ) | 59,997,200 | 4,650,946 | 1,109,335 | 201,411 | |||||||||||||||||||||||||||
| Goldman Sachs Global Real Estate Securities Fund |
64,881,581 | 4,608,063 | (2,016,290 | ) | — | (75,118 | ) | (13,781,690 | ) | 53,616,546 | 5,443,304 | 1,465,604 | — | |||||||||||||||||||||||||||
| Goldman Sachs High Yield Floating Rate Fund |
— | 23,794,675 | (12,228,335 | ) | — | (805,044 | ) | (505,114 | ) | 10,256,182 | 1,148,509 | 537,777 | — | |||||||||||||||||||||||||||
| Goldman Sachs International Small Cap Insights Fund |
129,760,845 | 18,645,360 | (10,566,732 | ) | — | (2,474,635 | ) | (36,335,376 | ) | 99,029,462 | 9,127,139 | 4,398,372 | — | |||||||||||||||||||||||||||
| Goldman Sachs International Tax-Managed Equity Fund |
693,930,551 | 96,353,882 | (62,138,904 | ) | — | (11,032,897 | ) | (162,082,171 | ) | 555,030,461 | 56,809,668 | 21,438,168 | — | |||||||||||||||||||||||||||
| Goldman Sachs MLP Energy Infrastructure Fund |
57,865,617 | 11,818,402 | (20,536,290 | ) | (91,179 | ) | 5,625,356 | 10,298,926 | 64,980,832 | 2,254,713 | 4,015,942 | — | ||||||||||||||||||||||||||||
| Goldman Sachs Tactical Tilt Overlay Fund |
349,793,299 | 33,671,758 | (383,696,640 | ) | — | 19,468,751 | (19,237,168 | ) | — | — | 7,633,892 | — | ||||||||||||||||||||||||||||
| Goldman Sachs U.S. Tax-Managed Equity Fund Class R6 |
2,056,883,627 | 429,095,783 | (168,658,041 | ) | — | 3,594,101 | (301,913,094 | ) | 2,019,002,376 | 63,590,626 | 9,148,691 | — | ||||||||||||||||||||||||||||
| Total |
$ | 3,617,468,789 | $ | 2,237,113,551 | $ | (2,056,858,772 | ) | $ | (92,148 | ) | $ | (4,031,643 | ) | $ | (583,625,231 | ) | $ | 3,209,974,546 | $ | 55,350,565 | $ | 29,501,122 | ||||||||||||||||||
45
GOLDMAN SACHS GLOBAL TAX-AWARE EQUITY PORTFOLIOS
Notes to Financial Statements (continued)
August 31, 2022
| 5. AGREEMENTS AND AFFILIATED TRANSACTIONS (continued) |
As of August 31, 2022, the Portfolios were beneficial owners of 5% or more of total outstanding shares of the following Funds:
| Underlying Funds | Enhanced Dividend Global Equity |
Tax-Advantaged Global Equity |
||||||||
| Goldman Sachs Global Infrastructure Fund |
— | % | 22 | % | ||||||
| Goldman Sachs Global Real Estate Securities Fund |
— | 35 | ||||||||
| Goldman Sachs International Equity Dividend and Premium Fund |
49 | — | ||||||||
| Goldman Sachs International Tax-Managed Equity Fund |
— | 86 | ||||||||
| Goldman Sachs Small Cap Equity Insights Fund |
7 | — | ||||||||
| Goldman Sachs U.S. Equity Dividend and Premium Fund |
8 | — | ||||||||
| Goldman Sachs U.S. Tax-Managed Equity Fund |
— | 85 | ||||||||
As of August 31, 2022, The Goldman Sachs Group, Inc. was the beneficial owner of the following share class of the Portfolios:
| Portfolio | Class R6 | |||||
|
Enhanced Dividend Global Equity |
100 | % | ||||
| 6. PORTFOLIO SECURITIES TRANSACTIONS |
The cost of purchases and proceeds from sales of long-term securities for the fiscal year ended August 31, 2022, were as follows:
| Portfolios | Purchases | Sales | ||||||||
| Enhanced Dividend Global Equity |
$ | 97,916,792 | $ | 132,744,858 | ||||||
|
Tax-Advantaged Global Equity |
741,452,338 | 797,546,763 | ||||||||
| 7. TAX INFORMATION |
The tax character of distributions paid during the fiscal year ended August 31, 2022 was as follows:
| Enhanced Dividend Global Equity |
Tax-Advantaged Global Equity |
|||||||
| Distributions paid from: |
||||||||
| Ordinary income |
$ | 20,750,864 | $ | 63,731,445 | ||||
| Net long-term capital gains |
19,304,981 | 3,895,072 | ||||||
| Total taxable distributions |
$ | 40,055,845 | $ | 67,626,517 | ||||
The tax character of distributions paid during the fiscal year ended August 31, 2021 was as follows:
| Enhanced Dividend Global Equity |
Tax-Advantaged Global Equity |
|||||||
| Distributions paid from: |
||||||||
| Ordinary income |
$ | 9,231,556 | $ | 35,015,525 | ||||
| Net long-term capital gains |
— | — | ||||||
| Total taxable distributions |
$ | 9,231,556 | $ | 35,015,525 | ||||
46
GOLDMAN SACHS GLOBAL TAX-AWARE EQUITY PORTFOLIOS
| 7. TAX INFORMATION (continued) |
As of August 31, 2022, the components of accumulated earnings (losses) on a tax-basis were as follows:
| Enhanced Dividend Global Equity |
Tax-Advantaged Global Equity |
|||||||
| Undistributed ordinary income — net |
$ | 2,663,979 | $ | 2,135,581 | ||||
| Undistributed long-term capital gains |
23,754,187 | 59,998,853 | ||||||
| Total undistributed earnings |
$ | 26,418,166 | $ | 62,134,434 | ||||
| Timing differences (Post October Capital Loss Deferral) |
— | (3,068,963 | ) | |||||
| Unrealized gains — net |
66,273,049 | 1,035,497,962 | ||||||
| Total accumulated earnings — net |
$ | 92,691,215 | $ | 1,094,563,433 | ||||
As of August 31, 2022, the Portfolios’ aggregate security unrealized gains and losses based on cost for U.S. federal income tax purposes were as follows:
| Enhanced Dividend Global Equity |
Tax-Advantaged Global Equity |
|||||||
| Tax cost |
$ | 334,736,756 | $ | 2,222,838,012 | ||||
| Gross unrealized gain |
73,835,761 | 1,062,857,514 | ||||||
| Gross unrealized loss |
(7,562,712 | ) | (27,359,552 | ) | ||||
| Net unrealized gain |
$ | 66,273,049 | $ | 1,035,497,962 | ||||
The difference between GAAP-basis and tax-basis unrealized gains (losses) is attributable primarily to wash sales, net mark to market gains/(losses) on regulated futures contracts, net mark to market gains/(losses) on foreign currency contracts, and differences in the tax treatment of swap transactions.
GSAM has reviewed the Portfolios’ tax positions for all open tax years (the current and prior three years, as applicable) and has concluded that no provision for income tax is required in the Portfolios’ financial statements. Such open tax years remain subject to examination and adjustment by tax authorities.
| 8. OTHER RISKS |
The Portfolios’ and Underlying Funds’ risks include, but are not limited to, the following:
Derivatives Risk — The Portfolios’ use of derivatives may result in loss. Derivative instruments, which may pose risks in addition to and greater than those associated with investing directly in securities, currencies or other instruments, may be illiquid or less liquid, volatile, difficult to price and leveraged so that small changes in the value of the underlying instruments may produce disproportionate losses to the Portfolios. Derivatives are also subject to counterparty risk, which is the risk that the other party in the transaction will not fulfill its contractual obligation. The use of derivatives is a highly specialized activity that involves investment techniques and risks different from those associated with investments in more traditional securities and instruments. Losses from derivatives can also result from a lack of correlation between changes in the value of derivative instruments and the portfolio assets (if any) being hedged.
Dividend-Paying Investments Risk — A Portfolio’s investments in dividend-paying securities could cause a Portfolio to underperform other funds. Securities that pay dividends, as a group, can fall out of favor with the market, causing such securities to underperform securities that do not pay dividends. Depending upon market conditions and political and legislative responses to such conditions, dividend-paying securities that meet a Portfolio’s investment criteria may not be widely available and/or may be highly concentrated in only a few market sectors. In addition, issuers that have paid regular dividends or distributions to
47
GOLDMAN SACHS GLOBAL TAX-AWARE EQUITY PORTFOLIOS
Notes to Financial Statements (continued)
August 31, 2022
| 8. OTHER RISKS (continued) |
shareholders may not continue to do so at the same level or at all in the future. This may limit the ability of a Portfolio to produce current income.
Energy Sector Risk — The Underlying MLP Fund concentrates its investments in the energy sector, and will therefore be
susceptible to adverse economic, environmental, business, regulatory or other occurrences affecting that sector. The energy sector has historically experienced substantial price volatility. MLPs and other companies operating in the energy sector are subject to specific risks, including, among others: fluctuations in commodity prices; reduced consumer demand for commodities such as oil, natural gas or petroleum products; reduced availability of natural gas or other commodities for transporting, processing, storing or delivering; slowdowns in new construction; extreme weather or other natural disasters; and threats of attack by terrorists on energy assets. Additionally, changes in the regulatory environment for energy companies may adversely impact their profitability. Over time, depletion of natural gas reserves and other energy reserves may also affect the profitability of energy companies.
Foreign and Emerging Countries Risk — Investing in foreign markets may involve special risks and considerations not typically associated with investing in the U.S. Foreign securities may be subject to risk of loss because of more or less foreign government regulation; less public information; less stringent investor protections; less stringent accounting, corporate governance, financial reporting and disclosure standards; and less economic, political and social stability in the countries in which a Fund invests. The imposition of sanctions, exchange controls (including repatriation restrictions), confiscation of assets and property, trade restrictions (including tariffs) and other government restrictions by the U.S. or other governments, or problems with registration, settlement or custody, may also result in losses. The type and severity of sanctions and other similar measures, including counter sanctions and other retaliatory actions, that may be imposed could vary broadly in scope, and their impact is impossible to predict. For example, the imposition of sanctions and other similar measures could, among other things, cause a decline in the value and/or liquidity of securities issued by the sanctioned country or companies located in or economically tied to the sanctioned country and increase market volatility and disruption in the sanctioned country and throughout the world. Sanctions and other similar measures could limit or prevent a Portfolio from buying and selling securities (in the sanctioned country and other markets), significantly delay or prevent the settlement of securities transactions, and significantly impact a Portfolio’s liquidity and performance. Foreign risk also involves the risk of negative foreign currency exchange rate fluctuations, which may cause the value of securities denominated in such foreign currency (or other instruments through which a Portfolio has exposure to foreign currencies) to decline in value. Currency exchange rates may fluctuate significantly over short periods of time. To the extent that a Portfolio also invests in securities of issuers located in, or economically tied to, emerging markets, these risks may be more pronounced.
Investments in Other Investment Companies Risk — As a shareholder of another investment company, including an ETF, a Portfolio will indirectly bear its proportionate share of any net management fees and other expenses paid by such other investment companies, in addition to the fees and expenses regularly borne by the Portfolio.
Investments in the Underlying Funds — The Portfolio invest primarily in a combination of Underlying Funds (including ETFs and other registered investment companies) subject to statutory limitations prescribed by the Act or exemptive relief or regulations thereunder. A Portfolio’s investment performance is directly related to the investment performance of the Underlying Funds it holds, and are subject to the risk factors associated with the investments of those Underlying Funds in direct proportion to the amount of assets allocated to each. If the Portfolios have a relative concentration of their portfolio in a single Underlying Fund, they may be more susceptible to adverse developments affecting that Underlying Fund, and may be more susceptible to losses because of these developments. A strategy used by the Underlying Funds may fail to produce the intended results. As of August 31, 2022, the Enhanced Dividend Global Equity Portfolio invested 53.9% and 17.0% of its net assets in the Goldman Sachs U.S. Equity Dividend and Premium Fund (the “U.S. Equity Dividend and Premium Fund”) and the Goldman Sachs International Equity Dividend and Premium Fund (the “International Equity Dividend and Premium Fund”), respectively. Because of the high concentration of its assets in these Underlying Funds, the Enhanced Dividend Global Equity Portfolio has greater exposure to the risks associated with these Underlying Funds than it does to the risks associated with the other Underlying Funds in which it invests. The U.S. Equity Dividend and Premium Fund invests primarily in dividend paying equity investments in large-capitalization U.S. issuers, with public stock market capitalizations within the range of the market capitalization of the S&P 500®
48
GOLDMAN SACHS GLOBAL TAX-AWARE EQUITY PORTFOLIOS
| 8. OTHER RISKS (continued) |
Index at the time of investment. This Underlying Fund expects that, under normal circumstances, it will write (sell) call options on the S&P 500® Index or related exchange-traded funds in an amount that is between 20% and 75% of the value of its portfolio. The International Equity Dividend and Premium Fund invests primarily in dividend-paying equity investments in non-U.S. issuers with public stock market capitalizations within the range of capitalization of the Morgan Stanley Capital International (“MSCI”) Europe, Australasia, Far East (“EAFE”) Index (“MSCI EAFE Index”) at the time of investment. This Underlying Fund expects that, under normal circumstances, it will write (sell) call options on the MSCI EAFE Index, other national or regional stock market indices or related exchange-traded funds in an amount that is between 20% and 75% of the value of its portfolio.
As of August 31, 2022, the Tax-Advantaged Global Equity Portfolio invested 61.6% and 16.9% of its net assets in the Goldman Sachs U.S. Tax-Managed Equity Fund (the “U.S. Tax-Managed Equity Fund”) and the Goldman Sachs International Tax-Managed Equity Fund (the “International Tax-Managed Equity Fund”), respectively. Because of the high concentration of its assets in these Underlying Funds, the Tax-Advantaged Global Equity Portfolio has greater exposure to the risks associated with these Underlying Funds than it does to the risks associated with the other Underlying Funds in which it invests. The U.S Tax-Managed Equity Fund invests primarily in equity investments in U.S. issuers. This Underlying Fund will seek to maintain risk, style, capitalization and industry characteristics similar to the Russell 3000 Index. The International Tax-Managed Equity Fund invests primarily in equity investments in non-U.S. issuers. This Underlying Fund will seek to maintain risk, style, capitalization and industry characteristics similar to the MSCI EAFE Index. The investment adviser may seek tax-efficiency by offsetting gains and losses, limiting portfolio turnover or selling high tax basis securities for both Underlying Funds.
The Portfolios do not invest in the Underlying Funds for the purpose of exercising management or control; however, investments by the Portfolios within their principal investment strategies may represent a significant portion of an Underlying Fund’s net assets.
Large Shareholder Transactions Risk — A Portfolio or an Underlying Fund may experience adverse effects when certain large shareholders, such as other funds, institutional investors (including those trading by use of non-discretionary mathematical formulas), financial intermediaries (who may make investment decisions on behalf of underlying clients and/or include a or an Underlying Fund in their investment model), individuals, accounts and Goldman Sachs affiliates, purchase or redeem large amounts of shares of a Portfolio or an Underlying Fund. Such large shareholder redemptions, which may occur rapidly or unexpectedly, may cause a Portfolio or an Underlying Fund to sell portfolio securities at times when it would not otherwise do so, which may negatively impact a Portfolio’s or an Underlying Fund’s NAV and liquidity. These transactions may also accelerate the realization of taxable income to shareholders if such sales of investments resulted in gains, and may also increase transaction costs. In addition, a large redemption could result in a Portfolio’s or an Underlying Fund’s current expenses being allocated over a smaller asset base, leading to an increase in the Portfolio’s or the Underlying Fund’s expense ratio. Similarly, large Portfolio or Underlying Fund share purchases may adversely affect a Portfolio’s or an Underlying Fund’s performance to the extent that the Portfolio or the Underlying Fund is delayed in investing new cash or otherwise maintains a larger cash position than it ordinarily would.
Liquidity Risk — A Portfolio or an Underlying Fund may make investments that are illiquid or that may become less liquid in
response to market developments or adverse investor perceptions. Illiquid investments may be more difficult to value. Liquidity risk may also refer to the risk that a Portfolio or Underlying Fund will not be able to pay redemption proceeds within the allowable time period or without significant dilution to remaining investors’ interests because of unusual market conditions, an unusually high volume of redemption requests, or other reasons. To meet redemption requests, a Portfolio or Underlying Fund may be forced to sell investments at an unfavorable time and/or under unfavorable conditions. If a Portfolio or Underlying Fund is forced to sell securities at an unfavorable time and/or under unfavorable conditions, such sales may adversely affect the Portfolio’s or Underlying Fund’s NAV and dilute remaining investors’ interests. Liquidity risk may be the result of, among other things, the reduced number and capacity of traditional market participants to make a market in fixed income securities or the lack of an active market. The potential for liquidity risk may be magnified by a rising interest rate environment or other circumstances where investor redemptions from fixed income funds may be higher than normal, potentially causing increased supply in the market due to selling activity. These risks may be more pronounced in connection with a Portfolio’s investments in securities of issuers located
49
GOLDMAN SACHS GLOBAL TAX-AWARE EQUITY PORTFOLIOS
Notes to Financial Statements (continued)
August 31, 2022
| 8. OTHER RISKS (continued) |
in emerging market countries. Redemptions by large shareholders may have a negative impact on a Fund’s or Underlying Fund’s liquidity.
Market and Credit Risks — In the normal course of business, a Portfolio and/or an Underlying Fund trades financial instruments and enters into financial transactions where risk of potential loss exists due to changes in the market (market risk). The value of the securities in which a Portfolio and/or an Underlying Fund invests may go up or down in response to the prospects of individual companies, particular sectors or governments and/or general economic conditions throughout the world due to increasingly interconnected global economies and financial markets. Events such as war, acts of terrorism, social unrest, natural disasters, the spread of infectious illness or other public health threats could also significantly impact a Portfolio and/or an Underlying Fund and their investments. Additionally, a Portfolio and/or an Underlying Fund may also be exposed to credit risk in the event that an issuer or guarantor fails to perform or that an institution or entity with which the Portfolio and the Underlying Fund has unsettled or open transactions defaults.
| 9. INDEMNIFICATIONS |
Under the Trust’s organizational documents, its Trustees, officers, employees and agents are indemnified, to the extent permitted by the Act and state law, against certain liabilities that may arise out of performance of their duties to the Portfolios. Additionally, in the course of business, the Portfolios enter into contracts that contain a variety of indemnification clauses. The Portfolios’ maximum exposure under these arrangements is unknown, as this would involve future claims that may be made against the Portfolios that have not yet occurred. However, GSAM believes the risk of loss under these arrangements to be remote.
| 10. SUBSEQUENT EVENTS |
Subsequent events after the Statements of Assets and Liabilities date have been evaluated and GSAM has concluded that there is no impact requiring adjustment or disclosure in the financial statements.
50
GOLDMAN SACHS GLOBAL TAX-AWARE EQUITY PORTFOLIOS
| 11. SUMMARY OF SHARE TRANSACTIONS |
Share activity is as follows:
| Enhanced Dividend Global Equity Portfolio | ||||||||||||||||
|
|
|
|||||||||||||||
| For the Fiscal Year Ended August 31, 2022 |
For the Fiscal Year Ended August 31, 2021 |
|||||||||||||||
|
|
|
|||||||||||||||
| Shares | Dollars | Shares | Dollars | |||||||||||||
|
|
|
|||||||||||||||
| Class A Shares | ||||||||||||||||
| Shares sold |
13,495 | $ | 178,671 | 37,935 | $ | 429,619 | ||||||||||
| Reinvestment |
19,885 | 273,296 | 26,127 | 304,108 | ||||||||||||
| Shares redeemed |
(70,321 | ) | (918,052 | ) | (349,960 | ) | (3,934,449 | ) | ||||||||
| (36,941 | ) | (466,085 | ) | (285,898 | ) | (3,200,722 | ) | |||||||||
| Institutional Shares | ||||||||||||||||
| Shares sold |
68,751 | 952,092 | 100,714 | 1,172,359 | ||||||||||||
| Reinvestment |
73,323 | 1,019,403 | 61,169 | 715,382 | ||||||||||||
| Shares redeemed |
(324,907 | ) | (4,418,774 | ) | (678,244 | ) | (7,424,170 | ) | ||||||||
| (182,833 | ) | (2,447,279 | ) | (516,361 | ) | (5,536,429 | ) | |||||||||
| Class R6 Shares | ||||||||||||||||
| Reinvestment |
85 | 1,181 | 42 | 487 | ||||||||||||
| 85 | 1,181 | 42 | 487 | |||||||||||||
| Class P Shares | ||||||||||||||||
| Shares sold |
1,731,292 | 23,062,805 | 2,177,793 | 25,111,874 | ||||||||||||
| Reinvestment |
2,795,911 | 38,674,032 | 2,213,900 | 25,859,881 | ||||||||||||
| Shares redeemed |
(4,539,509 | ) | (62,289,623 | ) | (16,881,525 | ) | (175,745,356 | ) | ||||||||
| (12,306 | ) | (552,786 | ) | (12,489,832 | ) | (124,773,601 | ) | |||||||||
| NET DECREASE |
(231,995 | ) | $ | (3,464,969 | ) | (13,292,049 | ) | $ | (133,510,265 | ) | ||||||
51
GOLDMAN SACHS GLOBAL TAX-AWARE EQUITY PORTFOLIOS
Notes to Financial Statements (continued)
August 31, 2022
| 11. SUMMARY OF SHARE TRANSACTIONS (continued) |
| Tax-Advantaged Global Equity Portfolio | ||||||||||||||||
|
|
|
|||||||||||||||
| For the Fiscal Year Ended August 31, 2022 |
For the Fiscal Year Ended August 31, 2021 |
|||||||||||||||
|
|
|
|||||||||||||||
| Shares | Dollars | Shares | Dollars | |||||||||||||
|
|
|
|||||||||||||||
| Class A Shares | ||||||||||||||||
| Shares sold |
734 | $ | 14,891 | 381 | $ | 7,519 | ||||||||||
| Reinvestment |
396 | 8,759 | 232 | 4,264 | ||||||||||||
| Shares redeemed |
(940 | ) | (19,173 | ) | (247 | ) | (4,982 | ) | ||||||||
| 190 | 4,477 | 366 | 6,801 | |||||||||||||
| Institutional Shares | ||||||||||||||||
| Shares sold |
561,307 | 11,551,838 | 126,637 | 2,141,685 | ||||||||||||
| Reinvestment |
26,959 | 601,083 | 18,178 | 336,299 | ||||||||||||
| Shares redeemed |
(113,232 | ) | (2,299,870 | ) | (593,534 | ) | (10,630,812 | ) | ||||||||
| 475,034 | 9,853,051 | (448,719 | ) | (8,152,828 | ) | |||||||||||
| Class R6 Shares | ||||||||||||||||
| Shares sold |
34,470 | 764,903 | 516,402 | 9,050,583 | ||||||||||||
| Reinvestment |
8,189 | 180,128 | 5,697 | 103,968 | ||||||||||||
| Shares redeemed |
(55,972 | ) | (1,214,492 | ) | (63,944 | ) | (1,324,008 | ) | ||||||||
| (13,313 | ) | (269,461 | ) | 458,155 | 7,830,543 | |||||||||||
| Class P Shares | ||||||||||||||||
| Shares sold |
19,316,934 | 395,518,854 | 17,223,132 | 328,167,742 | ||||||||||||
| Reinvestment |
3,027,052 | 66,586,285 | 1,885,862 | 34,416,974 | ||||||||||||
| Shares redeemed |
(14,691,275 | ) | (298,158,815 | ) | (12,918,851 | ) | (243,103,566 | ) | ||||||||
| 7,652,711 | 163,946,324 | 6,190,143 | 119,481,150 | |||||||||||||
| NET INCREASE |
8,114,622 | $ | 173,534,391 | 6,199,945 | $ | 119,165,666 | ||||||||||
52
Report of Independent Registered Public
Accounting Firm
To the Board of Trustees of Goldman Sachs Trust and Shareholders of Goldman Sachs Enhanced Dividend Global Equity Portfolio and Goldman Sachs Tax-Advantaged Global Equity Portfolio
Opinions on the Financial Statements
We have audited the accompanying statements of assets and liabilities, including the schedules of investments, of Goldman Sachs Enhanced Dividend Global Equity Portfolio and Goldman Sachs Tax-Advantaged Global Equity Portfolio (two of the portfolios constituting Goldman Sachs Trust, hereafter collectively referred to as the “Portfolios”) as of August 31, 2022, the related statements of operations for the year ended August 31, 2022, the statements of changes in net assets for each of the two years in the period ended August 31, 2022, including the related notes, and the financial highlights for each of the periods indicated therein (collectively referred to as the “financial statements”). In our opinion, the financial statements present fairly, in all material respects, the financial position of each of the Portfolios as of August 31, 2022, the results of each of their operations for the year then ended, the changes in each of their net assets for each of the two years in the period ended August 31, 2022 and each of the financial highlights for each of the periods indicated therein in conformity with accounting principles generally accepted in the United States of America.
Basis for Opinions
These financial statements are the responsibility of the Portfolios’ management. Our responsibility is to express an opinion on the Portfolios’ financial statements based on our audits. We are a public accounting firm registered with the Public Company Accounting Oversight Board (United States) (PCAOB) and are required to be independent with respect to the Portfolios in accordance with the U.S. federal securities laws and the applicable rules and regulations of the Securities and Exchange Commission and the PCAOB.
We conducted our audits of these financial statements in accordance with the standards of the PCAOB. Those standards require that we plan and perform the audit to obtain reasonable assurance about whether the financial statements are free of material misstatement, whether due to error or fraud.
Our audits included performing procedures to assess the risks of material misstatement of the financial statements, whether due to error or fraud, and performing procedures that respond to those risks. Such procedures included examining, on a test basis, evidence regarding the amounts and disclosures in the financial statements. Our audits also included evaluating the accounting principles used and significant estimates made by management, as well as evaluating the overall presentation of the financial statements. Our procedures included confirmation of securities owned as of August 31, 2022 by correspondence with the custodian, transfer agent and brokers; when replies were not received from brokers, we performed other auditing procedures. We believe that our audits provide a reasonable basis for our opinions.
/s/ PricewaterhouseCoopers LLP
Boston, Massachusetts
October 25, 2022
We have served as the auditor of one or more investment companies in the Goldman Sachs fund complex since 2000.
53
GOLDMAN SACHS GLOBAL TAX-AWARE EQUITY PORTFOLIOS
Statement Regarding Basis for Approval of Management Agreement (Unaudited)
Background
The Goldman Sachs Enhanced Dividend Global Equity Portfolio and Goldman Sachs Tax-Advantaged Global Equity Portfolio (the “Portfolios”) are investment portfolios of Goldman Sachs Trust (the “Trust”). The Board of Trustees oversees the management of the Trust and reviews the investment performance and expenses of the Portfolios at regularly scheduled meetings held throughout the year. In addition, the Board of Trustees determines annually whether to approve the continuance of the Trust’s investment management agreement (the “Management Agreement”) with Goldman Sachs Asset Management, L.P. (the “Investment Adviser”) on behalf of the Portfolios.
The Management Agreement was most recently approved for continuation until June 30, 2023 by the Board of Trustees, including those Trustees who are not parties to the Management Agreement or “interested persons” (as defined in the Investment Company Act of 1940, as amended) of any party thereto (the “Independent Trustees”), at a meeting held on June 14-15, 2022 (the “Annual Meeting”).
The review process undertaken by the Trustees spans the course of the year and culminates with the Annual Meeting. To assist the Trustees in their deliberations, the Trustees have established a Contract Review Committee (the “Committee”), comprised of the Independent Trustees. The Committee held two meetings over the course of the year since the Management Agreement was last approved. At those Committee meetings, regularly scheduled Board or other committee meetings, and/or the Annual Meeting, matters relevant to the renewal of the Management Agreement were considered by the Board, or the Independent Trustees, as applicable. With respect to each Portfolio, such matters included:
| (a) | the nature and quality of the advisory, administrative, and other services provided to the Portfolio and the underlying funds in which it invests (the “Underlying Funds”) by the Investment Adviser and its affiliates, including information about: |
| (i) | the structure, staff, and capabilities of the Investment Adviser and its portfolio management teams; |
| (ii) | the groups within the Investment Adviser and its affiliates that support the portfolio management teams or provide other types of necessary services, including fund services groups (e.g., accounting and financial reporting, tax, shareholder services, and operations); controls and risk management groups (e.g., legal, compliance, valuation oversight, credit risk management, internal audit, compliance testing, market risk analysis, finance, and central funding); sales and distribution support groups, and others (e.g., information technology and training); |
| (iii) | trends in employee headcount; |
| (iv) | the Investment Adviser’s financial resources and ability to hire and retain talented personnel and strengthen its operations; and |
| (v) | the parent company’s support of the Investment Adviser and its mutual fund business, as expressed by the firm’s senior management; |
| (b) | information on the investment performance of the Portfolio and the Underlying Funds, including comparisons to the performance of similar mutual funds, as provided by a third-party mutual fund data provider engaged as part of the contract review process (the “Outside Data Provider”), and a benchmark performance index; and information on general investment outlooks in the markets in which the Underlying Funds invest; |
| (c) | information provided by the Investment Adviser indicating the Investment Adviser’s views on whether the Portfolio’s peer group and/or benchmark index had high, medium, or low relevance given the Portfolio’s particular investment strategy; |
| (d) | the terms of the Management Agreement and other agreements with affiliated service providers entered into by the Trust on behalf of the Portfolio; |
| (e) | fee and expense information for the Portfolio, including: |
| (i) | the relative management fee and expense levels of the Portfolio as compared to those of comparable funds managed by other advisers, as provided by the Outside Data Provider; |
| (ii) | the Portfolio’s expense trends over time; and |
| (iii) | to the extent the Investment Adviser manages other types of accounts (such as bank collective trusts, private wealth management accounts, institutional separate accounts, sub-advised mutual funds, and non-U.S. funds) having investment objectives and policies similar to those of the Portfolio, comparative information on the advisory fees charged and services provided to those accounts by the Investment Adviser; |
| (f) | with respect to the extensive investment performance and expense comparison data provided by the Outside Data Provider, its processes in producing that data for the Portfolio; |
| (g) | the undertakings of the Investment Adviser and its affiliates to implement fee waivers and/or expense limitations with respect to the Portfolio and the Underlying Funds; |
54
GOLDMAN SACHS GLOBAL TAX-AWARE EQUITY PORTFOLIOS
Statement Regarding Basis for Approval of Management Agreement (Unaudited) (continued)
| (h) | information relating to the profitability of the Management Agreement and the transfer agency and distribution and service arrangements of the Portfolio to the Investment Adviser and its affiliates; |
| (i) | whether the Portfolio’s existing management fee schedule, together with the management fee schedules of the Underlying Funds, adequately addressed any economies of scale; |
| (j) | a summary of the “fall-out” benefits derived by the Investment Adviser and its affiliates from their relationships with the Portfolio and/or the Underlying Funds, including the fees received by the Investment Adviser’s affiliates from the Portfolio and/or the Underlying Funds for transfer agency, securities lending, portfolio trading, distribution and other services; |
| (k) | a summary of potential benefits derived by the Portfolio and/or the Underlying Funds as a result of their relationship with the Investment Adviser; |
| (l) | with respect to the applicable Underlying Funds, information regarding commissions paid by the Underlying Funds that are equity funds and broker oversight, an update on the Investment Adviser’s soft dollars practices, other information regarding portfolio trading, and how the Investment Adviser carries out its duty to seek best execution; |
| (m) | portfolio manager ownership of Portfolio shares; the manner in which portfolio manager compensation is determined; and the number and types of accounts managed by the portfolio managers; |
| (n) | the nature and quality of the services provided to the Portfolio and the Underlying Funds by their unaffiliated service providers, and the Investment Adviser’s general oversight and evaluation (including reports on due diligence) of those service providers as part of the administrative services provided under the Management Agreement; and |
| (o) | the Investment Adviser’s processes and policies addressing various types of potential conflicts of interest; its approach to risk management; the annual review of the effectiveness of the Portfolio’s compliance program; and periodic compliance reports. |
The Trustees also received an overview of the Portfolios’ distribution arrangements. They received information regarding the Portfolios’ assets, share purchase and redemption activity, and payment of distribution and service fees. Information was also provided to the Trustees relating to revenue sharing payments made by and services provided by the Investment Adviser and its affiliates to intermediaries that promote the sale, distribution, and/or servicing of Portfolio shares. The Independent Trustees also discussed the broad range of other investment choices that are available to Portfolio investors, including the availability of comparable funds managed by other advisers.
The presentations made at the Board and Committee meetings and at the Annual Meeting encompassed the Portfolios and other mutual funds for which the Board of Trustees has responsibility. In evaluating the Management Agreement at the Annual Meeting, the Trustees relied upon their knowledge, resulting from their meetings and other interactions throughout the year, of the Investment Adviser and its affiliates, their services, and the Portfolios. In conjunction with these meetings, the Trustees received written materials and oral presentations on the topics covered, and the Investment Adviser addressed the questions and concerns of the Trustees, including concerns regarding the investment performance of certain of the funds they oversee. The Independent Trustees were advised by their independent legal counsel regarding their responsibilities and other regulatory requirements related to the approval and continuation of mutual fund investment management agreements under applicable law. In addition, the Investment Adviser and its affiliates provided the Independent Trustees with a written response to a formal request for information sent on behalf of the Independent Trustees by their independent legal counsel. During the course of their deliberations, the Independent Trustees met in executive sessions with their independent legal counsel, without representatives of the Investment Adviser or its affiliates present.
Nature, Extent, and Quality of the Services Provided Under the Management Agreement
As part of their review, the Trustees considered the nature, extent, and quality of the services provided to the Portfolios and the Underlying Funds by the Investment Adviser. In this regard, the Trustees considered both the investment advisory services and non-advisory services that are provided by the Investment Adviser and its affiliates. The Trustees noted the transition in the leadership and changes in personnel of various of the Investment Adviser’s portfolio management teams that had occurred in recent periods, and the ongoing recruitment efforts aimed at bringing high quality investment talent to the Investment Adviser. They also noted the Investment Adviser’s commitment to maintaining high quality systems and expending substantial resources to respond to ongoing changes to the market, regulatory and control environment in which the Portfolios and the Underlying Funds and their service providers operate, including developments associated with the COVID-19 pandemic, geopolitical events, and economic sanctions, as well as the efforts of the Investment Adviser and its affiliates to combat cyber security risks. The Trustees also considered information regarding the Investment Adviser’s business continuity planning and remote operations capabilities. The Trustees concluded that the Investment Adviser continued to commit substantial financial and operational resources to the Portfolios and expressed confidence that the Investment Adviser would continue to do so in the future. The Trustees also
55
GOLDMAN SACHS GLOBAL TAX-AWARE EQUITY PORTFOLIOS
Statement Regarding Basis for Approval of Management Agreement (Unaudited) (continued)
recognized that the Investment Adviser had made significant commitments to address regulatory compliance requirements applicable to the Portfolios, the Underlying Funds, and the Investment Adviser and its affiliates.
Investment Performance
The Trustees also considered the investment performance of the Portfolios and the Underlying Funds. In this regard, they compared the investment performance of each Portfolio to its peers using rankings and ratings compiled by the Outside Data Provider as of December 31, 2021, and updated performance information prepared by the Investment Adviser using the peer group identified by the Outside Data Provider as of March 31, 2022. The information on each Portfolio’s investment performance was provided for the one-, three-, five-, and ten-year periods ending on the applicable dates. The Trustees also reviewed each Portfolio’s investment performance relative to its performance benchmark. As part of this review, they considered the investment performance trends of the Portfolios over time, and reviewed the investment performance of each Portfolio in light of its investment objective and policies and market conditions.
In addition, the Trustees considered materials prepared and presentations made by the Investment Adviser’s senior management and portfolio management personnel in which Portfolio performance was assessed. The Trustees also considered the Investment Adviser’s periodic reports with respect to the Underlying Funds’ risk profiles, and how the Investment Adviser’s approach to risk monitoring and management influences portfolio management. They noted the efforts of the portfolio management teams of certain Underlying Funds to continue to enhance the investment models used in managing those Underlying Funds.
The Trustees observed that the Tax-Advantaged Global Equity Portfolio’s Institutional Shares had placed in the fourth quartile of the Portfolio’s peer group for the one-, three-, five-, and ten-year periods, and had outperformed the Portfolio’s benchmark index for the one- and ten-year periods and underperformed for the three- and five-year periods ended March 31, 2022. They considered that the Enhanced Dividend Global Equity Portfolio’s Institutional Shares had placed in the top half of the Portfolio’s peer group for the one-year period, in the third quartile for the three-year period, and in the fourth quartile for the five- and ten-year periods, and had outperformed the Portfolio’s benchmark index for the one-year period and underperformed for the three-, five-, and ten-year periods ended March 31, 2022. The Trustees noted that each Portfolio had certain significant differences from its peer group that caused the peer group to be an imperfect basis for comparison. They also observed that the Portfolios had each experienced certain portfolio management changes in early 2022.
Costs of Services Provided and Competitive Information
The Trustees considered the contractual terms of the Management Agreement and the fee rates payable by each Portfolio thereunder. In this regard, the Trustees considered information on the services rendered by the Investment Adviser to the Portfolios, which included both advisory and administrative services that were directed to the needs and operations of the Portfolios as registered mutual funds.
In particular, the Trustees reviewed analyses prepared by the Outside Data Provider regarding the expense rankings of the Portfolios. The analyses provided a comparison of each Portfolio’s management fee to those of a relevant peer group and category universe; an expense analysis which compared each Portfolio’s overall net and gross expenses to a peer group and a category universe; and data comparing each Portfolio’s net expenses to the peer and category medians. The analyses also compared each Portfolio’s other expenses and fee waivers/reimbursements to those of the peer group and category medians. The Trustees concluded that the comparisons provided by the Outside Data Provider were useful in evaluating the reasonableness of the management fees and total expenses paid by the Portfolios.
In addition, the Trustees considered the Investment Adviser’s undertakings to implement fee waivers and/or expense limitations with respect to the Portfolios and the Underlying Funds. They also considered, to the extent that the Investment Adviser manages other types of accounts having investment objectives and policies similar to those of the Portfolios, comparative fee information for services provided by the Investment Adviser to those accounts, and information that indicated that services provided to the Portfolios differed in various significant respects from the services provided to other types of accounts which, in many cases, operated under less stringent legal and regulatory structures, required fewer services from the Investment Adviser to a smaller number of client contact points, and were less time-intensive.
In addition, the Trustees noted that shareholders are able to redeem their shares at any time if shareholders believe that the Portfolio fees and expenses are too high or if they are dissatisfied with the performance of the Portfolio.
Profitability
The Trustees reviewed each Portfolio’s contribution to the Investment Adviser’s revenues and pre-tax profit margins. In this regard the Trustees noted that they had received, among other things, profitability analyses and summaries, revenue and expense
56
GOLDMAN SACHS GLOBAL TAX-AWARE EQUITY PORTFOLIOS
Statement Regarding Basis for Approval of Management Agreement (Unaudited) (continued)
schedules by Portfolio and by function (i.e., investment management, transfer agency and distribution and service), and information on the Investment Adviser’s expense allocation methodology. They observed that the profitability and expense figures are substantially similar to those used by the Investment Adviser for many internal purposes, including compensation decisions among various business groups, and are thus subject to a vigorous internal debate about how certain revenue and expenses should be allocated. The Trustees also noted that the internal audit group within the Goldman Sachs organization periodically audits the expense allocation methodology and that the internal audit group was satisfied with the reasonableness, consistency, and accuracy of the Investment Adviser’s expense allocation methodology. Profitability data for each Portfolio was provided for 2021 and 2020, and the Trustees considered this information in relation to the Investment Adviser’s overall profitability.
Economies of Scale
The Trustees considered the information that had been provided regarding whether there have been economies of scale with respect to the management of the Portfolios. The Trustees noted that, although the Portfolios themselves do not have breakpoints in their management fee schedules, any benefits of the breakpoints in the management fee schedules of certain Underlying Funds, when reached, would pass through to the shareholders in the Portfolios at the specified asset levels. The Trustees considered the amounts of assets in the Portfolios; the Portfolios’ recent purchase and redemption activity; the information provided by the Investment Adviser relating to the costs of the services provided by the Investment Adviser and its affiliates and the profits realized by them; information comparing the fee rates charged by the Investment Adviser with fee rates charged to other funds in the peer groups; and the Investment Adviser’s undertaking to limit certain expenses of the Portfolios and Underlying Funds that exceed specified levels. They also considered the services provided to the Portfolios under the Management Agreement and the fees and expenses borne by the Underlying Funds and considered the Investment Adviser’s finding that the management fees payable by the Portfolios were not duplicative of the management fees paid at the Underlying Fund level.
Other Benefits to the Investment Adviser and Its Affiliates
The Trustees also considered the other benefits derived by the Investment Adviser and its affiliates from their relationships with the Portfolios and/or the Underlying Funds as stated above, including: (a) transfer agency fees received by Goldman Sachs & Co. LLC (“Goldman Sachs”); (b) brokerage and futures commissions earned by Goldman Sachs for executing securities and futures transactions on behalf of certain Underlying Funds; (c) research received by the Investment Adviser from broker-dealers in exchange for executing certain transactions on behalf of certain Underlying Funds; (d) trading efficiencies resulting from aggregation of orders of the Underlying Funds with those for other funds or accounts managed by the Investment Adviser; (e) fees earned by Goldman Sachs Agency Lending (“GSAL”), an affiliate of the Investment Adviser, as securities lending agent for certain Underlying Funds (and fees earned by the Investment Adviser for managing the fund in which those Underlying Funds’ cash collateral is invested); (f) the Investment Adviser’s ability to leverage the infrastructure designed to service the Portfolios on behalf of its other clients; (g) the Investment Adviser’s ability to cross-market other products and services to Portfolio shareholders; (h) Goldman Sachs’ retention of certain fees as Portfolio Distributor; (i) the Investment Adviser’s ability to negotiate better pricing with custodians on behalf of its other clients, as a result of the relationship with the Portfolios and Underlying Funds; (j) the investment of cash and cash collateral in money market funds managed by the Investment Adviser that will result in increased assets under management for those money market funds; (k) with respect to certain Underlying Funds, the investment in exchange-traded funds (“ETFs”) managed by the Investment Adviser that will result in increased assets under management for those ETFs and may facilitate the development of the Investment Adviser’s ETF advisory business; and (l) the possibility that the working relationship between the Investment Adviser and the Portfolios’ and Underlying Funds’ third-party service providers may cause those service providers to be more likely to do business with other areas of Goldman Sachs. In the course of considering the foregoing, the Independent Trustees requested and received further information quantifying certain of these fall-out benefits.
Other Benefits to the Portfolios and Their Shareholders
The Trustees also noted that the Portfolios and/or the Underlying Funds receive certain other potential benefits as a result of their relationship with the Investment Adviser, including: (a) trading efficiencies resulting from aggregation of orders of the Underlying Funds with those of other funds or accounts managed by the Investment Adviser; (b) enhanced servicing from vendors due to the volume of business generated by the Investment Adviser and its affiliates; (c) with respect to the Underlying Funds, enhanced servicing from broker-dealers due to the volume of business generated by the Investment Adviser and its affiliates; (d) with respect to certain Underlying Funds, the Investment Adviser’s ability to negotiate favorable terms with derivatives counterparties as a result of the size and reputation of the Goldman Sachs organization; (e) the advantages received from the Investment Adviser’s knowledge and experience gained from managing other accounts and products; (f) the Investment Adviser’s ability to hire and retain qualified personnel to provide services to the Portfolios and the Underlying Funds because of the
57
GOLDMAN SACHS GLOBAL TAX-AWARE EQUITY PORTFOLIOS
Statement Regarding Basis for Approval of Management Agreement (Unaudited) (continued)
reputation of the Goldman Sachs organization; (g) the Portfolios’ and Underlying Funds’ access, through the Investment Adviser, to certain firm-wide resources (e.g., proprietary risk management systems and databases), subject to certain restrictions; (h) with respect to certain Underlying Funds, the ability to participate in the securities lending program administered by GSAL, as measured by the revenue received by the Underlying Funds in connection with the program; and (i) the Portfolios’ access to certain affiliated distribution channels. In addition, the Trustees noted the competitive nature of the mutual fund marketplace, and considered that many of the Portfolios’ shareholders invested in the Portfolios in part because of the Portfolios’ relationship with the Investment Adviser and that those shareholders have a general expectation that the relationship will continue.
Conclusion
In connection with their consideration of the Management Agreement, the Trustees gave weight to each of the factors described above, but did not identify any particular factor as controlling their decision. After deliberation and consideration of all of the information provided, including the factors described above, the Trustees concluded, in the exercise of their business judgment, that the management fees paid by each of the Portfolios were reasonable in light of the services provided to it by the Investment Adviser, the Investment Adviser’s costs and each Portfolio’s current and reasonably foreseeable asset levels. The Trustees unanimously concluded that the Investment Adviser’s continued management likely would benefit each Portfolio and its shareholders and that the Management Agreement should be approved and continued with respect to each Portfolio until June 30, 2023.
58
GOLDMAN SACHS GLOBAL TAX-AWARE EQUITY PORTFOLIOS
|
Portfolio Expenses — Six Month Period Ended August 31, 2022 (Unaudited) |
||
As a shareholder of Class A, Institutional, Class R6 or Class P Shares of a Portfolio, you incur two types of costs: (1) transaction costs, including sales charges on purchase payments (with respect to Class A Shares), and (2) ongoing costs, including management fees; distribution and/or service (12b-1) fees (with respect to Class A Shares); and other Portfolio expenses. This example is intended to help you understand your ongoing costs (in dollars) of investing in Class A, Institutional, Class R6 and Class P Shares of the Portfolios and to compare these costs with the ongoing costs of investing in other mutual funds.
The example is based on an investment of $1,000 invested at the beginning of the period and held for the entire period from March 1, 2022 through August 31, 2022, which represents a period of 184 days of a 365 day year.
Actual Expenses — The first line under each share class in the table below provides information about actual account values and actual expenses. You may use the information in this line, together with the amount you invested, to estimate the expenses that you paid over the period. Simply divide your account value by $1,000 (for example, an $8,600 account value divided by $1,000=8.6), then multiply the result by the number in the first line under the heading entitled “Expenses Paid” to estimate the expenses you paid on your account during this period.
Hypothetical Example for Comparison Purposes — The second line under each share class in the table below provides information about hypothetical account values and hypothetical expenses based on the Portfolios’ actual net expense ratios and an assumed rate of return of 5% per year before expenses, which is not the Portfolios’ actual return. The hypothetical account values and expenses may not be used to estimate the actual ending account balance or expenses you paid for the period. You may use this information to compare the ongoing costs of investing in the Portfolios and other funds. To do so, compare this 5% hypothetical example with the 5% hypothetical examples that appear in the shareholder reports of the other funds.
Please note that the expenses shown in the table are meant to highlight your ongoing costs only and do not reflect any transactional costs, such as sales charges, redemption fees, or exchange fees and do not include expenses of Underlying Funds in which the Portfolios invest. Therefore, the second line of the table is useful in comparing ongoing costs only and will not help you determine the relative total costs of owning different funds. In addition, if these transactional costs were included, your costs would have been higher.
| Enhanced Dividend Global Equity Portfolio | Tax-Advantaged Global Equity Portfolio | |||||||||||||||||||||||
| Share Class | Beginning Account Value 3/1/22 |
Ending Account Value 8/31/22 |
Expenses Paid for the 6 months ended 8/31/2022* |
Beginning Account Value 3/1/22 |
Ending Account Value 8/31/22 |
Expenses Paid for the 6 months ended 8/31/2022* |
||||||||||||||||||
| Class A | ||||||||||||||||||||||||
|
Actual |
$ | 1,000.00 | $ | 925.48 | $ | 2.57 | $ | 1,000.00 | $ | 914.88 | $ | 2.75 | ||||||||||||
|
Hypothetical 5% return |
1,000.00 | 1,022.53 | + | 2.70 | 1,000.00 | 1,022.33 | + | 2.91 | ||||||||||||||||
| Institutional | ||||||||||||||||||||||||
|
Actual |
1,000.00 | 927.16 | 0.97 | 1,000.00 | 916.47 | 0.97 | ||||||||||||||||||
|
Hypothetical 5% return |
1,000.00 | 1,024.20 | + | 1.02 | 1,000.00 | 1,024.20 | + | 1.02 | ||||||||||||||||
| Class R6 | ||||||||||||||||||||||||
|
Actual |
1,000.00 | 927.82 | 0.92 | 1,000.00 | 916.79 | 0.92 | ||||||||||||||||||
|
Hypothetical 5% return |
1,000.00 | 1,024.25 | + | 0.97 | 1,000.00 | 1,024.25 | + | 0.97 | ||||||||||||||||
| Class P | ||||||||||||||||||||||||
|
Actual |
1,000.00 | 927.75 | 0.92 | 1,000.00 | 916.79 | 0.92 | ||||||||||||||||||
|
Hypothetical 5% return |
1,000.00 | 1,024.25 | + | 0.97 | 1,000.00 | 1,024.25 | + | 0.97 | ||||||||||||||||
| + | Hypothetical expenses are based on each Portfolio’s actual annualized net expense ratios and an assumed rate of return of 5% per year before expenses. |
| * | Expenses are calculated using each Portfolio’s annualized net expense ratio for each class, which represents the ongoing expenses as a percentage of net assets for the six months ended August 31, 2022. Expenses are calculated by multiplying the annualized net expense ratio by the average account value for the period; then multiplying the result by the number of days in the most recent fiscal half year; and then dividing that result by the number of days in the fiscal year. The annualized net expense ratios for the period were as follows: |
| Portfolio | Class A | Institutional | Class R6 | Class P | ||||||||||||
| Enhanced Dividend Global Equity |
0.53 | % | 0.20 | % | 0.19 | % | 0.19 | % | ||||||||
|
Tax-Advantaged Global Equity |
0.57 | 0.20 | 0.19 | 0.19 | ||||||||||||
59
GOLDMAN SACHS GLOBAL TAX-AWARE EQUITY PORTFOLIOS
Trustees and Officers (Unaudited)
Independent Trustees
| Name, Address and Age1 |
Position(s) Held with the Trust |
Term of Office and Length of Time Served2 |
Principal Occupation(s) During Past 5 Years |
Number of Portfolios in Fund Complex Overseen by Trustee3 |
Other Directorships Held by Trustee4 | |||||
| Jessica Palmer Age: 73 |
Chair of the Board of Trustees | Since 2018 (Trustee since 2007) | Ms. Palmer is retired. She was formerly Consultant, Citigroup Human Resources Department (2007-2008); Managing Director, Citigroup Corporate and Investment Banking (previously, Salomon Smith Barney/Salomon Brothers) (1984-2006). Ms. Palmer was a Member of the Board of Trustees of Indian Mountain School (private elementary and secondary school) (2004-2009).
Chair of the Board of Trustees — Goldman Sachs Trust and Goldman Sachs Variable Insurance Trust. |
103 | None | |||||
| Dwight L. Bush Age: 65 |
Trustee | Since 2020 | Ambassador Bush is President and CEO of D.L. Bush & Associates (a financial advisory and private investment firm) (2002-2014 and 2017-Present); Director of MoneyLion, Inc. (an operator of a data-driven, digital financial platform) (2021-Present); and was formerly U.S. Ambassador to the Kingdom of Morocco (2014-2017) and a Member of the Board of Directors of Santander Bank, N.A. (2018-2019). Previously, Ambassador Bush served as an Advisory Board Member of Goldman Sachs Trust and Goldman Sachs Variable Insurance Trust (October 2019-January 2020).
Trustee — Goldman Sachs Trust and Goldman Sachs Variable Insurance Trust. |
103 | MoneyLion, Inc. (an operator of a data-driven, digital financial platform) | |||||
| Kathryn A. Cassidy Age: 68 |
Trustee | Since 2015 | Ms. Cassidy is retired. She is Director, Vertical Aerospace Ltd. (an aerospace and technology company) (2021-Present). Formerly, Ms. Cassidy was Advisor to the Chairman (May 2014-December 2014); and Senior Vice President and Treasurer (2008-2014), General Electric Company & General Electric Capital Corporation (technology and financial services companies).
Trustee — Goldman Sachs Trust and Goldman Sachs Variable Insurance Trust |
103 | Vertical Aerospace Ltd. (an aerospace and technology company) | |||||
| John G. Chou Age: 65 |
Trustee | Since 2022 | Mr. Chou is Executive Vice President and Special Advisor to the Chairman and CEO of AmerisourceBergen Corporation (a pharmaceutical and healthcare company) (2021-Present); and formerly held various executive management positions with AmerisourceBergen Corporation, including Executive Vice President and Chief Legal Officer (2019-2021); Executive Vice President and Chief Legal & Business Officer (2017-2019); and Executive Vice President and General Counsel (2011-2017).
Trustee — Goldman Sachs Trust and Goldman Sachs Variable Insurance Trust. |
103 | None | |||||
| Diana M. Daniels Age: 73 |
Trustee | Since 2007 | Ms. Daniels is retired. Formerly, she was Vice President, General Counsel and Secretary, The Washington Post Company (1991-2006). Ms. Daniels is a Trustee Emeritus and serves as a Presidential Councillor of Cornell University (2013-Present); Director of 1735 NY Investments, LLC (oversees an investment fund that supports the mission of the American Institute of Architects) (2022-Present); former Member of the Legal Advisory Board, New York Stock Exchange (2003-2006) and of the Corporate Advisory Board, Standish Mellon Management Advisors (2006-2007).
Trustee — Goldman Sachs Trust and Goldman Sachs Variable Insurance Trust. |
103 | None | |||||
60
GOLDMAN SACHS GLOBAL TAX-AWARE EQUITY PORTFOLIOS
Trustees and Officers (Unaudited) (continued)
Independent Trustees
| Name, Address and Age1 |
Position(s) Held with the Trust |
Term of Office and Length of Time Served2 |
Principal Occupation(s) During Past 5 Years |
Number of Portfolios in Fund Complex Overseen by Trustee3 |
Other Directorships Held by Trustee4 | |||||
| Joaquin Delgado Age: 62 |
Trustee | Since 2020 | Dr. Delgado is retired. He is Director, Stepan Company (a specialty chemical manufacturer) (2011-Present); and was formerly Director, Hexion Inc. (a specialty chemical manufacturer) (2019-2022); Executive Vice President, Consumer Business Group of 3M Company (July 2016-July 2019); and Executive Vice President, Health Care Business Group of 3M Company (October 2012-July 2016). Previously, Dr. Delgado served as an Advisory Board Member of Goldman Sachs Trust and Goldman Sachs Variable Insurance Trust (October 2019-January 2020).
Trustee — Goldman Sachs Trust and Goldman Sachs Variable Insurance Trust |
103 | Stepan Company (a specialty chemical manufacturer) | |||||
| Eileen H. Dowling Age: 59 |
Trustee | Since 2021 | Ms. Dowling is retired. Formerly, she was Senior Advisor (April 2021-September 2021); and Managing Director (2013-2021), BlackRock, Inc. (a financial services firm).
Trustee — Goldman Sachs Trust and Goldman Sachs Variable Insurance Trust. |
103 | None | |||||
| Gregory G. Weaver Age: 70 |
Trustee | Since 2015 | Mr. Weaver is retired. He is Director, Verizon Communications Inc. (2015-Present); and was formerly Chairman and Chief Executive Officer, Deloitte & Touche LLP (a professional services firm) (2001-2005 and 2012-2014); and Member of the Board of Directors, Deloitte & Touche LLP (2006-2012).
Trustee — Goldman Sachs Trust and Goldman Sachs Variable Insurance Trust. |
103 | Verizon Communications Inc. | |||||
| Paul C. Wirth Age: 64 |
Trustee | Since 2022 | Mr. Wirth is retired. Formerly, he was Deputy Chief Financial Officer and Principal Accounting Officer (2011-2020); Finance Director and Principal Accounting Officer (2010-2011); and Managing Director, Global Controller, and Chief Accounting Officer (2005-2010) of Morgan Stanley.
Trustee — Goldman Sachs Trust and Goldman Sachs Variable Insurance Trust. |
103 | None | |||||
61
GOLDMAN SACHS GLOBAL TAX-AWARE EQUITY PORTFOLIOS
Trustees and Officers (Unaudited) (continued)
Interested Trustee*
| Name, Address and Age1 |
Position(s) Held with the Trust |
Term of Office and Length of Time Served2 |
Principal Occupation(s) During Past 5 Years |
Number of Portfolios in Fund Complex Overseen by Trustee3 |
Other Directorships Held by Trustee4 | |||||
| James A. McNamara Age: 59 |
President and Trustee | Since 2007 | Advisory Director, Goldman Sachs (January 2018-Present); Managing Director, Goldman Sachs (January 2000-December 2017); Director of Institutional Fund Sales, GSAM (April 1998-December 2000); and Senior Vice President and Manager, Dreyfus Institutional Service Corporation (January 1993-April 1998).
President and Trustee — Goldman Sachs Trust; Goldman Sachs Variable Insurance Trust; Goldman Sachs Trust II; Goldman Sachs MLP and Energy Renaissance Fund; Goldman Sachs ETF Trust; Goldman Sachs ETF Trust II; Goldman Sachs Credit Income Fund; and Goldman Sachs Real Estate Diversified Income Fund. |
172 | None | |||||
| * | Mr. McNamara is considered to be an “Interested Trustee” because he holds positions with Goldman Sachs and owns securities issued by The Goldman Sachs Group, Inc. Mr. McNamara holds comparable positions with certain other companies of which Goldman Sachs, GSAM or an affiliate thereof is the investment adviser, administrator and/or distributor. |
| 1 | Each Trustee may be contacted by writing to the Trustee, c/o Goldman Sachs, 200 West Street, New York, New York, 10282, Attn: Caroline Kraus. Information is provided as of August 31, 2022. |
| 2 | Subject to such policies as may be adopted by the Board from time-to-time, each Trustee holds office for an indefinite term, until the earliest of: (a) the election of his or her successor; (b) the date the Trustee resigns or is removed by the Board or shareholders, in accordance with the Trust’s Declaration of Trust; or (c) the termination of the Trust. The Board has adopted policies which provide that each Independent Trustee shall retire as of December 31st of the calendar year in which he or she reaches (a) his or her 75th birthday or (b) the 15th anniversary of the date he or she became a Trustee, whichever is earlier, unless a waiver of such requirements shall have been adopted by a majority of the other Trustees. These policies may be changed by the Trustees without shareholder vote. |
| 3 | The Goldman Sachs Fund Complex includes certain other companies listed above for each respective Trustee. As of August 31, 2022, Goldman Sachs Trust consisted of 88 portfolios; Goldman Sachs Variable Insurance Trust consisted of 15 portfolios (12 of which offered shares to the public); Goldman Sachs Trust II consisted of 18 portfolios (16 of which offered shares to the public); Goldman Sachs ETF Trust consisted of 46 portfolios (29 of which offered shares to the public); Goldman Sachs ETF Trust II consisted of 2 portfolios (1 of which offered shares to the public); and Goldman Sachs MLP and Energy Renaissance Fund, Goldman Sachs Credit Income Fund and Goldman Sachs Real Estate Diversified Income Fund each consisted of one portfolio. Goldman Sachs Credit Income Fund did not offer shares to the public. |
| 4 | This column includes only directorships of companies required to report to the Securities and Exchange Commission under the Securities Exchange Act of 1934 (i.e., “public companies”) or other investment companies registered under the Act. |
Additional information about the Trustees is available in the Funds’ Statement of Additional Information, which can be obtained from Goldman Sachs free of charge by calling this toll-free number (in the United States of America): 1-800-526-7384.
62
GOLDMAN SACHS GLOBAL TAX-AWARE EQUITY PORTFOLIOS
Trustees and Officers (Unaudited) (continued)
Officers of the Trust*
| Name, Address and Age1 | Positions Held with the Trust |
Term of Office and Length of Time Served2 |
Principal Occupation(s) During Past 5 Years | |||
| James A. McNamara 200 West Street New York, NY 10282 Age: 59 |
Trustee and President | Since 2007 | Advisory Director, Goldman Sachs (January 2018-Present); Managing Director, Goldman Sachs (January 2000-December 2017); Director of Institutional Fund Sales, GSAM (April 1998-December 2000); and Senior Vice President and Manager, Dreyfus Institutional Service Corporation (January 1993-April 1998).
President and Trustee — Goldman Sachs Trust; Goldman Sachs Variable Insurance Trust; Goldman Sachs Trust II; Goldman Sachs MLP and Energy Renaissance Fund; Goldman Sachs ETF Trust; Goldman Sachs ETF Trust II; Goldman Sachs Credit Income Fund; and Goldman Sachs Real Estate Diversified Income Fund. | |||
| Caroline L. Kraus 200 West Street New York, NY 10282 Age: 45 |
Secretary | Since 2012 | Managing Director, Goldman Sachs (January 2016-Present); Vice President, Goldman Sachs (August 2006 – December 2015); Senior Counsel, Goldman Sachs (January 2020-Present); Associate General Counsel, Goldman Sachs (2012-December 2019); Assistant General Counsel, Goldman Sachs (August 2006-December 2011); and Associate, Weil, Gotshal & Manges, LLP (2002-2006).
Secretary — Goldman Sachs Trust (previously Assistant Secretary (2012)); Goldman Sachs Variable Insurance Trust (previously Assistant Secretary (2012)); Goldman Sachs Trust II; Goldman Sachs BDC, Inc.; Goldman Sachs Private Middle Market Credit LLC; Goldman Sachs Private Middle Market Credit II LLC; Goldman Sachs Middle Market Lending Corp.; Goldman Sachs MLP and Energy Renaissance Fund; Goldman Sachs ETF Trust; Goldman Sachs ETF Trust II; Goldman Sachs Credit Income Fund; and Goldman Sachs Real Estate Diversified Income Fund. | |||
| Joseph F. DiMaria 30 Hudson Street Jersey City, NJ 07302 Age: 54 |
Treasurer, Principal Financial Officer and Principal Accounting Officer | Since 2017 (Treasurer and Principal Financial Officer since 2019) | Managing Director, Goldman Sachs (November 2015-Present) and Vice President-Mutual Fund Administration, Columbia Management Investment Advisers, LLC (May 2010-October 2015).
Treasurer, Principal Financial Officer and Principal Accounting Officer — Goldman Sachs Trust (previously Assistant Treasurer (2016)); Goldman Sachs Variable Insurance Trust (previously Assistant Treasurer (2016)); Goldman Sachs Trust II (previously Assistant Treasurer (2017)); Goldman Sachs MLP and Energy Renaissance Fund (previously Assistant Treasurer (2017)); Goldman Sachs ETF Trust (previously Assistant Treasurer (2017)); Goldman Sachs ETF Trust II; Goldman Sachs Credit Income Fund; and Goldman Sachs Real Estate Diversified Income Fund. | |||
| * | Represents a partial list of officers of the Trust. Additional information about all the officers is available in the Funds’ Statement of Additional Information, which can be obtained from Goldman Sachs free of charge by calling this toll-free number (in the United States): 1-800-526-7384. |
| 1 | Information is provided as of August 31, 2022. |
| 2 | Officers hold office at the pleasure of the Board of Trustees or until their successors are duly elected and qualified. Each officer holds comparable positions with certain other companies of which Goldman Sachs, GSAM or an affiliate thereof is the investment adviser, administrator and/or distributor. |
Goldman Sachs Trust – Global Tax-Aware Equity Portfolios – Tax Information (Unaudited)
For the fiscal year ended August 31, 2022, 19.31% and 21.42% of the dividends paid from net investment company taxable income by the Enhanced Dividend Global Equity and Tax-Advantaged Global Equity Portfolios, respectively, qualify for the dividends received deduction available to corporations.
From distributions paid during the fiscal year ended August 31, 2022, the total amount of income received by the Enhanced Dividend Global Equity and Tax-Advantaged Global Equity Portfolios from sources within foreign countries and possessions of the United States was $0.1237 and $0.1783 per share, respectively, all of which is attributable to qualified passive income. The percentage of net investment income dividends paid from foreign sources by the Enhanced Dividend Global Equity and Tax-Advantaged Global Equity Portfolios was 17.78% and 37.69%, respectively. The total amount of taxes paid by the Enhanced Dividend Global Equity and Tax-Advantaged Global Equity Portfolios to such countries was $0.0119 and $0.0246 per share, respectively.
For the fiscal year ended August 31, 2022, the Enhanced Dividend Global Equity and Tax-Advantaged Global Equity Portfolios designate 40.27% and 57.98%, respectively, of the dividends paid from net investment company taxable income as qualifying for the reduced tax rate under the Jobs and Growth Tax Relief and Reconciliation Act of 2003.
Pursuant to Section 852 of the Internal Revenue Code, the Enhanced Dividend Global Equity and Tax-Advantaged Global Equity Portfolios designate $19,304,981 and $3,895,072 respectively, or, if different, the maximum amount allowable, as capital gain dividends paid during the fiscal year ended August 31, 2022.
During the fiscal year ended August 31, 2022, the Enhanced Dividend Global Equity and Tax-Advantaged Global Equity Portfolios designate $4,089,026 and $4,081,873 as short-term capital gain dividends pursuant to Section 871(k) of the Internal Revenue Code.
63
FUNDS PROFILE
Goldman Sachs Funds
Goldman Sachs is a premier financial services firm, known since 1869 for creating thoughtful and customized investment solutions in complex global markets.
Today, the Asset Management Division of Goldman Sachs serves a diverse set of clients worldwide, including private institutions, public entities and individuals. With approximately $2.27 trillion in assets under supervision as of June 30, 2022, Goldman Sachs Asset Management has portfolio management teams located around the world and our investment professionals bring firsthand knowledge of local markets to every investment decision. Assets under supervision includes assets under management and other client assets for which Goldman Sachs does not have full discretion. Goldman Sachs Asset Management leverages the resources of Goldman Sachs & Co. LLC subject to legal, internal and regulatory restrictions.
Money Market
Financial Square FundsSM
| ∎ | Financial Square Treasury Solutions Fund1 |
| ∎ | Financial Square Government Fund1 |
| ∎ | Financial Square Money Market Fund2 |
| ∎ | Financial Square Prime Obligations Fund2 |
| ∎ | Financial Square Treasury Instruments Fund1 |
| ∎ | Financial Square Treasury Obligations Fund1 |
| ∎ | Financial Square Federal Instruments Fund1 |
Investor FundsSM
| ∎ | Investor Money Market Fund3 |
| ∎ | Investor Tax-Exempt Money Market Fund3 |
Fixed Income
Short Duration and Government
| ∎ | Enhanced Income Fund |
| ∎ | Short-Term Conservative Income Fund |
| ∎ | Short Duration Government Fund |
| ∎ | Short Duration Bond Fund |
| ∎ | Government Income Fund |
| ∎ | Inflation Protected Securities Fund |
Multi-Sector
| ∎ | Bond Fund |
| ∎ | Core Fixed Income Fund |
| ∎ | Global Core Fixed Income Fund |
| ∎ | Strategic Income Fund |
| ∎ | Income Fund |
Municipal and Tax-Free
| ∎ | High Yield Municipal Fund |
| ∎ | Dynamic Municipal Income Fund |
| ∎ | Short Duration Tax-Free Fund |
| ∎ | Municipal Income Completion Fund |
Single Sector
| ∎ | Investment Grade Credit Fund |
| ∎ | U.S. Mortgages Fund |
| ∎ | High Yield Fund |
| ∎ | High Yield Floating Rate Fund |
| ∎ | Emerging Markets Debt Fund |
| ∎ | Local Emerging Markets Debt Fund |
Fixed Income Alternatives
| ∎ | Long Short Credit Strategies Fund |
Fundamental Equity
| ∎ | Equity Income Fund |
| ∎ | Small Cap Growth Fund |
| ∎ | Small Cap Value Fund |
| ∎ | Small/Mid Cap Value Fund |
| ∎ | Mid Cap Value Fund |
| ∎ | Large Cap Value Fund |
| ∎ | Focused Value Fund |
| ∎ | Large Cap Core Fund4 |
| ∎ | Strategic Growth Fund |
| ∎ | Small/Mid Cap Growth Fund |
| ∎ | Flexible Cap Fund |
| ∎ | Concentrated Growth Fund |
| ∎ | Technology Opportunities Fund |
| ∎ | Mid Cap Growth Fund5 |
| ∎ | Rising Dividend Growth Fund |
| ∎ | U.S. Equity ESG Fund |
| ∎ | Income Builder Fund |
Tax-Advantaged Equity
| ∎ | U.S. Tax-Managed Equity Fund |
| ∎ | International Tax-Managed Equity Fund |
| ∎ | U.S. Equity Dividend and Premium Fund |
| ∎ | International Equity Dividend and Premium Fund |
Equity Insights
| ∎ | Small Cap Equity Insights Fund |
| ∎ | U.S. Equity Insights Fund |
| ∎ | Small Cap Growth Insights Fund |
| ∎ | Large Cap Growth Insights Fund |
| ∎ | Large Cap Value Insights Fund |
| ∎ | Small Cap Value Insights Fund |
| ∎ | International Small Cap Insights Fund |
| ∎ | International Equity Insights Fund |
| ∎ | Emerging Markets Equity Insights Fund |
Fundamental Equity International
| ∎ | International Equity Income Fund |
| ∎ | International Equity ESG Fund |
| ∎ | China Equity Fund |
| ∎ | Emerging Markets Equity Fund |
| ∎ | ESG Emerging Markets Equity Fund |
Alternative
| ∎ | Clean Energy Income Fund |
| ∎ | Defensive Equity Fund |
| ∎ | Real Estate Securities Fund |
| ∎ | Commodity Strategy Fund |
| ∎ | Global Real Estate Securities Fund |
| ∎ | Absolute Return Tracker Fund |
| ∎ | Managed Futures Strategy Fund |
| ∎ | MLP Energy Infrastructure Fund |
| ∎ | Energy Infrastructure Fund |
| ∎ | Multi-Manager Alternatives Fund |
| ∎ | Global Infrastructure Fund |
Total Portfolio Solutions
| ∎ | Global Managed Beta Fund |
| ∎ | Multi-Manager Non-Core Fixed Income Fund |
| ∎ | Multi-Manager Global Equity Fund |
| ∎ | Multi-Manager International Equity Fund |
| ∎ | Tactical Tilt Overlay Fund |
| ∎ | Balanced Strategy Portfolio |
| ∎ | Multi-Manager U.S. Small Cap Equity Fund |
| ∎ | Multi-Manager Real Assets Strategy Fund |
| ∎ | Growth and Income Strategy Portfolio |
| ∎ | Growth Strategy Portfolio |
| ∎ | Dynamic Global Equity Fund |
| ∎ | Satellite Strategies Portfolio |
| ∎ | Enhanced Dividend Global Equity Portfolio |
| ∎ | Tax-Advantaged Global Equity Portfolio |
| ∎ | Strategic Factor Allocation Fund |
| ∎ | Strategic Volatility Premium Fund |
| ∎ | Target Date Retirement Portfolio |
| ∎ | Target Date 2025 Portfolio |
| ∎ | Target Date 2030 Portfolio |
| ∎ | Target Date 2035 Portfolio |
| ∎ | Target Date 2040 Portfolio |
| ∎ | Target Date 2045 Portfolio |
| ∎ | Target Date 2050 Portfolio |
| ∎ | Target Date 2055 Portfolio |
| ∎ | Target Date 2060 Portfolio |
| ∎ | GQG Partners International Opportunities Fund |
| 1 | You could lose money by investing in the Fund. Although the Fund seeks to preserve the value of your investment at $1.00 per share, it cannot guarantee it will do so. An investment in the Fund is not a deposit of a bank and is not insured or guaranteed by the Federal Deposit Insurance Corporation or any other government agency. The Fund’s sponsor has no legal obligation to provide financial support to the Fund, and you should not expect that the sponsor will provide financial support to the Fund at any time. |
| 2 | You could lose money by investing in the Fund. Because the share price of the Fund will fluctuate, when you sell your shares they may be worth more or less than what you originally paid for them. The Fund may impose a fee upon sale of your shares or may temporarily suspend your ability to sell shares if the Fund’s liquidity falls below required minimums because of market conditions or other factors. An investment in the Fund is not a deposit of a bank and is not insured or guaranteed by the Federal Deposit Insurance Corporation or any other government agency. The Fund’s sponsor has no legal obligation to provide financial support to the Fund, and you should not expect that the sponsor will provide financial support to the Fund at any time. |
| 3 | You could lose money by investing in the Fund. Although the Fund seeks to preserve the value of your investment at $1.00 per share, it cannot guarantee it will do so. The Fund may impose a fee upon sale of your shares or may temporarily suspend your ability to sell shares if the Fund’s liquidity falls below required minimums because of market conditions or other factors. An investment in the Fund is not a deposit of a bank and is not insured or guaranteed by the Federal Deposit Insurance Corporation or any other government agency. The Fund’s sponsor has no legal obligation to provide financial support to the Fund, and you should not expect that the sponsor will provide financial support to the Fund at any time. |
| 4 | Effective after the close of business on April 13, 2022, the Goldman Sachs Capital Growth Fund was renamed the Goldman Sachs Large Cap Core Fund. |
| 5 | Effective after the close of business on April 13, 2022, the Goldman Sachs Growth Opportunities Fund was renamed the Goldman Sachs Mid Cap Growth Fund. |
| Financial Square FundsSM and Investor FundsSM are registered service marks of Goldman Sachs & Co. LLC. |
| * | This list covers open-end funds only. Please visit our website at www.GSAMFUNDS.com to learn about our closed-end funds and exchange-traded funds. |
| TRUSTEES Jessica Palmer, Chair Dwight L. Bush Kathryn A. Cassidy John G. Chou Diana M. Daniels Joaquin Delgado Eileen H. Dowling James A. McNamara Gregory G. Weaver Paul C. Wirth |
OFFICERS James A. McNamara, President Joseph F. DiMaria, Principal Financial Officer, Principal Accounting Officer and Treasurer Caroline L. Kraus, Secretary | |
| GOLDMAN SACHS & CO. LLC Distributor and Transfer Agent |
GOLDMAN SACHS ASSET MANAGEMENT, L.P. Investment Adviser | |
Visit our web site at www.GSAMFUNDS.com to obtain the most recent month-end returns.
Goldman Sachs Asset Management, L.P., 200 West Street, New York, New York 10282
The reports concerning the Portfolios included in this shareholder report may contain certain forward-looking statements about the factors that may affect the performance of the Portfolios in the future. These statements are based on Portfolio management’s predictions and expectations concerning certain future events and their expected impact on the Portfolios, such as performance of the economy as a whole and of specific industry sectors, changes in the levels of interest rates, the impact of developing world events, and other factors that may influence the future performance of the Portfolios. Management believes these forward-looking statements to be reasonable, although they are inherently uncertain and difficult to predict. Actual events may cause adjustments in portfolio management strategies from those currently expected to be employed.
A description of the policies and procedures that the Portfolios use to determine how to vote proxies relating to portfolio securities and information regarding how a Portfolio voted proxies relating to portfolio securities during the most recent 12-month period ended June 30 is available (i) without charge, upon request by calling 1-800-526-7384 (for Retail Shareholders) or 1-800-621-2550 (for Institutional Shareholders); and (ii) on the Securities and Exchange Commission (“SEC”) web site at http://www.sec.gov.
The Portfolios will file portfolio holdings information for each month in a fiscal quarter within 60 days after the end of the relevant fiscal quarter on Form N-PORT. Portfolio holdings information for the third month of each fiscal quarter will be made available on the SEC’s web site at http://www.sec.gov. Portfolio holdings information may be obtained upon request and without charge by calling 1-800-526-7384 (for Retail Shareholders) or 1-800-621-2550 (for Institutional Shareholders).
Economic and market forecasts presented herein reflect our judgment as of the date of this report and are subject to change without notice. These forecasts do not take into account the specific investment objectives, restrictions, tax and financial situation or other needs of any specific client. Actual data will vary and may not be reflected here. These forecasts are subject to high levels of uncertainty that may affect actual performance. Accordingly, these forecasts should be viewed as merely representative of a broad range of possible outcomes. These forecasts are estimated, based on assumptions, and are subject to significant revision and may change materially as economic and market conditions change. Goldman Sachs has no obligation to provide updates or changes to these forecasts. Case studies and examples are for illustrative purposes only.
Goldman Sachs & Co. LLC (“Goldman Sachs”) does not provide legal, tax or accounting advice. Any statement contained in this communication (including any attachments) concerning U.S. tax matters was not intended or written to be used, and cannot be used, for the purpose of avoiding penalties under the Internal Revenue Code, and was written to support the promotion or marketing of the transaction(s) or matter(s) addressed. Clients of Goldman Sachs should obtain their own independent tax advice based on their particular circumstances.
Portfolio holdings and allocations shown are as of August 31, 2022 and may not be representative of future investments. Portfolio holdings should not be relied on in making investment decisions and should not be construed as research or investment advice regarding particular securities. Current and future holdings are subject to risk. Diversification does not protect an investor from market risk and does not ensure a profit.
This material is not authorized for distribution to prospective investors unless preceded or accompanied by a current Prospectus or summary prospectus, if applicable. Investors should consider a Portfolio’s objective, risks, and charges and expenses, and read the summary prospectus, if available, and/or the Prospectus carefully before investing or sending money. The summary prospectus, if available, and the Prospectus contain this and other information about a Portfolio and may be obtained from your authorized dealer or from Goldman Sachs & Co. LLC by calling (retail – 1-800-526-7384) (institutional – 1-800-621-2550).
Goldman Sachs & Co. LLC is the distributor of the Goldman Sachs Funds.
© 2022 Goldman Sachs. All rights reserved. 295265-OTU-10/2022 TAGEDGAR-22
Goldman Sachs Funds
| Annual Report | August 31, 2022 | |||
| Allocation Funds | ||||
| Global Managed Beta Fund | ||||
| Strategic Factor Allocation Fund | ||||
| Strategic Volatility Premium Fund | ||||
| Tactical Tilt Overlay Fund | ||||

Goldman Sachs Allocation Funds
| ∎ | GLOBAL MANAGED BETA FUND |
| ∎ | STRATEGIC FACTOR ALLOCATION FUND |
| ∎ | STRATEGIC VOLATILITY PREMIUM FUND |
| ∎ | TACTICAL TILT OVERLAY FUND |
| 1 | ||||
| 4 | ||||
| 7 | ||||
| 24 | ||||
| 25 | ||||
| 57 | ||||
| 63 | ||||
| 63 | ||||
| 64 | ||||
| 67 | ||||
| 69 | ||||
| 72 | ||||
| 97 | ||||
| 98 | ||||
| NOT FDIC-INSURED | May Lose Value | No Bank Guarantee | ||
MARKET REVIEW
Goldman Sachs Allocation Funds
During the 12-month period ended August 31, 2022 (the “Reporting Period”), the financial markets were most influenced by inflationary pressures, shifting central bank monetary policy, rising interest rates, macroeconomic data and the Russia/Ukraine war.
In September 2021, when the Reporting Period began, risk assets weakened following strong calendar year performance through August. The weakness was driven by a debt crisis at Evergrande, one of China’s largest property developers, and an increase in inflation that led many global central banks, including the U.S. Federal Reserve (the “Fed”) and the European Central Bank (“ECB”), to upgrade their inflation forecasts. Fed policymakers hinted that they could start tapering the Fed’s $120 billion a month asset purchase program in the near term and end it entirely by mid-2022. Additionally, the Fed’s median dot plot projection indicated interest rate hikes could begin in 2022, rather than in 2023 as previously forecast. (The dot plot shows interest rate projections of the members of the Federal Open Market Committee.) Higher inflation expectations and the Fed’s more hawkish stance pushed up U.S. Treasury yields, as markets priced in a potential 25 basis point interest rate hike by the end of 2021. (Hawkish tends to imply higher interest rates; opposite of dovish. A basis point is 1/100th of a percentage point.) In this environment, global equities declined, led by U.S. and European stocks. In contrast, Japanese equities registered gains. Emerging markets equities broadly declined as well. Within fixed income, yields rose modestly, with the yield on the bellwether 10-year U.S. Treasury climbing 20 basis points. Within commodities, crude oil and natural gas prices rose, while metals prices fell. In currencies, the U.S. dollar strengthened versus other major currencies, benefiting from the global equity market decline and higher U.S. Treasury yields.
During the fourth quarter of 2021, global economic activity stabilized somewhat following a rather weak third calendar quarter, though inflation remained elevated. The U.S. labor market strengthened, with the unemployment rate falling to 3.9% in December, a pandemic-era low. The backdrop of a tightening labor market, healthy economic growth and accelerating inflation led the Fed to signal that its monetary policy would be less accommodative going forward. During December, policymakers began to scale back the Fed’s asset purchase program and then announced they would accelerate the pace of tapering, starting in January 2022. They also indicated the Fed might hike interest rates three times in 2022. Policy guidance in China was the opposite, as the People’s Bank of China (“PBoC”) signaled more accommodative policy to support economic growth. In the financial markets, equity performance saw significant dispersion across countries. Developed markets equities rose substantially, while emerging markets equities fell modestly. U.S. stocks were the best performers among developed markets equities, followed by European stocks. Japanese equities declined slightly. In the emerging markets, Chinese equities weighed on overall performance, while Taiwanese equities rallied. Concerns around China’s property sector, negative earnings revisions and regulatory risks, especially for technology companies, pressured Chinese stocks. Within fixed income, U.S. Treasury yields were volatile. The 10-year U.S. Treasury yield began the quarter at 1.50% and then rose to 1.67% by the end of October as inflation remained elevated and the Fed started to shift its policy stance. The emergence of the Omicron COVID-19 variant pushed that yield down to 1.34% in early December. As market participants learned that Omicron, though highly transmissible, was not as severe as initially feared, risk sentiment improved. Along with the Fed’s hawkish stance, this helped push the 10-year U.S. Treasury yield back toward 1.50% by the end of the fourth calendar quarter. Within commodities, crude oil prices were generally flat, with significant volatility throughout the quarter, while metals experienced positive performance. Within currencies, the Chinese renminbi appreciated versus the U.S. dollar, while the U.S. dollar continued to strengthen versus developed markets currencies.
In the first quarter of 2022, inflationary pressures intensified, with many developed nations experiencing their fastest price increases in decades. As a result, a number of central banks took policy action. In March, the Fed hiked interest rates for the first time since 2018. Fed Chair Jerome Powell also indicated the U.S. central bank was prepared to act even more aggressively to tackle inflation. Elsewhere, the Bank of England raised rates, while the ECB opened the door for rate increases some time in 2022. Meanwhile, China’s central bank pledged to keep its monetary policy flexible and responsive to changing economic conditions, with an overriding objective of achieving stability. The PBoC cut its interest rates, reduced the amount of cash banks had to hold in reserve and boosted credit expansion to help bolster the country’s slowing economy. The economic slowdown was driven, in part, by China’s “zero-COVID” strategy, as a growing wave of local COVID-19 cases led authorities to place both Shenzhen and Shanghai into lockdown. During February, geopolitical tensions added uncertainty to an already complex investment backdrop, as energy and commodity prices jumped in response to Russia’s invasion of Ukraine late in the month. Global equities broadly declined during the first calendar quarter, with Russia’s invasion of Ukraine exacerbating the sell-off. Within fixed income,
1
MARKET REVIEW
government bond yields rose meaningfully, pushed higher by rising inflation and hawkish central banks. Among currencies, the U.S. dollar was rather flat versus the Chinese renminbi but appreciated versus developed markets currencies. Of particular note: the Russian ruble hit an all-time low relative to the U.S. dollar during the quarter.
Global economic activity moderated noticeably in the second quarter of 2022 amid tighter financial conditions and COVID-19 flare-ups in China. Inflation accelerated, as food and energy prices rose in the wake of Russia’s attack on Ukraine. Higher inflation led to weaker consumer purchasing power and weaker consumer sentiment, which, in turn, weighed on consumption. However, job creation remained strong, especially in the U.S. Major central banks focused on taming inflation, signaling they would continue to tighten monetary policy until inflation came down toward their respective target levels. In the U.S., the Fed raised interest rates twice during the second calendar quarter and suggested rates would be higher still by the end of 2022. Meanwhile, the ECB announced the end of its Pandemic Emergency Purchase Programme, effective July 1, 2022. The two outliers among major central banks were the Bank of Japan and the PBoC. Both remained dovish in an effort to support economic growth, as inflation was not considered to be a major problem in either country. (Dovish tends to imply lower interest rates; opposite of hawkish.) Against this backdrop, global equities continued to sell off, led by a steep drop in the U.S stock market. Emerging market equities also fell, though Chinese stocks broadly recorded gains. In fixed income, government bond yield volatility persisted as markets continued to struggle to price in higher inflation on the one hand and recession fears on the other. Overall, government bond yields rose during the quarter in response to inflationary pressures and hawkish central banks. Within commodities, crude oil prices rallied but metals prices suffered substantial losses. In currencies, the U.S. dollar continued its strong performance, appreciating versus most other global currencies during the second calendar quarter.
In July 2022, global equities generated positive returns despite macroeconomic weakness and elevated inflation, as investors focused on less hawkish Fed commentary and better than market expected second calendar quarter corporate earnings and guidance. Although the Fed raised interest rates during the month, Fed Chair Powell suggested the pace of rate hikes might slow going forward and become more data dependent. In Europe, the ECB increased interest rates and also signaled that future hikes were likely to be data dependent. Within global equities, the developed equity markets broadly recorded gains, while the performance of emerging markets equities was rather flat. Many emerging equity markets performed well during the month, but they were held back overall by a decline in Chinese stocks amid growing investor concerns about China’s property market. In fixed income, government bond yields fell in response to weaker macroeconomic data. Commodities struggled across the board, as both precious and industrial metals followed crude oil prices lower against the backdrop of slower global economic growth. As for currencies, the U.S. dollar appreciated versus the euro and Chinese renminbi but weakened versus the Japanese yen.
In August 2022, global equity markets were volatile. They rallied during the first half of the month, as U.S. inflation eased and the U.S. labor market remained robust, but then sold off in the second half of the month on the back of hawkish Fed commentary. Although U.S. inflation moderated, it remained elevated, prompting the Fed to signal further monetary policy tightening. For August overall, global equities broadly posted losses. Within developed markets equities, U.S. and European stocks retreated and Japanese equities advanced. Emerging markets equities recorded a modest gain. In fixed income, government bond yields rose amid ongoing inflationary pressures and hawkish central bank rhetoric. Commodities continued their poor run, with crude oil, natural gas and metals prices all declining during the month. In currencies, the U.S. dollar appreciated versus developed market currencies and versus the Chinese renminbi, as investor risk aversion increased and interest rates rose.
For the Reporting Period overall, global equity markets, as measured by the MSCI All Country World Index Investable Market Index, declined 14.32%. Developed markets stocks, as represented by the MSCI World Index, fell 10.80%, with U.S. stocks, as measured by the S&P 500® Index, dropping 11.23% and non-U.S. developed markets stocks, as measured by the MSCI EAFE Index, dropping 19.37%. Emerging markets equities, as measured by the MSCI Emerging Markets Index, fell 21.48%. In fixed income, except in the very shortest maturities, bond prices broadly declined as yields rose. Commodities, as represented by the S&P GSCI Commodity Index, generated a gain of 42.19%. The U.S. dollar appreciated versus most global currencies during the Reporting Period overall.
At the end of the Reporting Period, we thought risk assets were facing a number of headwinds, including slower economic growth, high U.S. home prices, the tight U.S. labor market, elevated oil prices and the Russia/Ukraine conflict. Overall, we believed the risk of a global recession had increased materially given macroeconomic weakness and generally hawkish central banks. Within equities, we believed fundamentals had softened, as market expectations for earnings per share and profit margins were trending
2
MARKET REVIEW
downward at the end of the Reporting Period. Although corporate earnings generally remained strong, forward guidance was modestly lower in certain consumer-facing industries. Against this backdrop, we believed the risk-reward for equities was skewed to the downside. However, we thought the decline in equity valuations during the Reporting Period, along with ongoing weakness in investor sentiment, could potentially provide attractive opportunities in the near term. As for fixed income, we expected government bond yields to grind higher overall, but we thought they could fall on expectations of slower economic growth and heightened geopolitical uncertainty.
3
PORTFOLIO RESULTS
Goldman Sachs Global Managed Beta Fund
Investment Objective
The Fund seeks to provide long-term capital growth.
Portfolio Management Discussion and Analysis
Below, the Goldman Sachs Multi-Asset Solutions (“MAS”) Group discusses the Goldman Sachs Global Managed Beta Fund’s (the “Fund”) performance and positioning for the 12-month period ended August 31, 2022 (the “Reporting Period”).
| Q | How did the Fund perform during the Reporting Period? |
| A | During the Reporting Period, the Fund’s Institutional Shares generated an average annual total return of -15.81%. This return compares to the -14.32% average annual total return of the Fund’s benchmark, the MSCI All Country World Index Investable Market Index (“ACWI IMI”) (Net, USD, 50% Non-US Developed Hedged to USD) (the “Index”), during the same time period. |
| Q | What key factors affected the Fund’s performance during the Reporting Period? |
| A | The Fund primarily seeks to achieve its investment objective by investing in a diversified portfolio of underlying asset classes that provide broad beta exposure to the global equity markets. (Beta refers to the component of returns that is attributable to market risk exposure, rather than manager skill.) The MAS Group determines allocations to the underlying asset classes — and within the underlying asset classes — based on its cycle-aware long-term strategic allocation model, which may include factor-based diversification. The factor-based diversification approach is implemented through a separately managed account composed of individual stock positions. In addition, the MAS Group uses an options-based strategy, which seeks to generate returns in moderately rising or moderately declining global equity markets where the realized volatility may be lower than the volatility implied by options prices. |
| During the Reporting Period, the Fund underperformed the Index due in part to its strategic allocation to the macro hedging strategy (through which we seek to diversify the Fund’s overall exposure to global equity asset classes). More specifically, the Fund was hurt within its macro hedging strategy by a modest position in interest rate floor contracts, which detracted from returns as the U.S. Federal Reserve (the “Fed”) began raising short-term interest rates. (An interest rate floor is a derivative contract in which the buyer receives payments at the end of each period in which the interest rate is below the agreed strike price.) In addition, the Fund’s long positions in equity market segments, such as small-cap equities and emerging markets equities, detracted from relative returns during the Reporting Period. Small-cap stocks, which tend to be sensitive to economic growth, were weak as investors favored cyclical stocks amid the slowing global economic recovery and the easing of supportive measures from governments and central banks. Finally, the Fund’s factor-based strategies overall detracted from relative performance. Our factor-based strategies are Momentum, Valuation, Quality and Volatility. The Momentum factor seeks to identify companies whose stock prices are expected to increase or decrease (by, among other things, evaluating each company’s recent performance results). The Valuation factor seeks to identify companies whose stock prices are trading at a discount to their fundamental or intrinsic value (by, among other things, comparing each company’s book value to market value). The Quality factor seeks to identify companies that are expected to generate higher returns on assets (i.e., more profitable). The Volatility factor seeks to identify companies whose stock prices are expected to have a relatively lower degree of fluctuation over time. |
| On the positive side, the Fund benefited from a strategic allocation to a volatility selling strategy, which added to performance. (Volatility selling seeks to benefit from changes in the level of market implied volatility (i.e., expectations of future volatility) in equity markets.) Market implied volatility eased during the Reporting Period despite ongoing equity market weakness. Additionally, within the macro hedging strategy, the Fund was helped by investments in currency options through which we sought to hedge against foreign currency risk. |
4
PORTFOLIO RESULTS
| Dynamic asset allocation also added to the Fund’s relative returns during the Reporting Period overall. The Fund benefited from its long positions in energy master limited partnerships, our decision to increase energy sector exposure during the first quarter of 2022, and our efforts to reduce the Fund’s overall exposure to equities. |
| Q | How was the Fund positioned at the beginning of the Reporting Period? |
| A | In terms of its strategic allocations at the beginning of the Reporting Period, the Fund had had 105.40% of its total net assets invested in equity-related investments, 0.70% in the macro hedging strategy, 6.00% in the volatility selling strategy and 0% in cash and cash equivalents. However, the Fund maintained a position in cash and cash equivalents to cover the exposure of various derivatives positions. This above sector breakout is inclusive of derivative exposure across all asset classes. |
| Q | How did you tactically manage the Fund’s allocations during the Reporting Period? |
| A | Within the Fund’s strategic allocations during the Reporting Period, we maintained the view that the Fund have a lesser weighting in the macro hedging strategy and a larger weighting in the volatility selling strategy. However, as interest rates rose in 2022, we opportunistically added to the Fund’s investments in interest rate floor contracts, thereby increasing its weighting in the macro hedging strategy. |
| In February 2022, we eliminated a view that the Fund be overweight compared to the Index in U.S. large-cap equities, which are sensitive to a cyclical economic recovery. We also decreased the Fund’s overall allocation to equities, largely by reducing its long positions in small-cap stocks and emerging markets equities. |
| Q | How did the Fund use derivatives and similar instruments during the Reporting Period? |
| A | During the Reporting Period, equity futures were employed to express our passive investment views with greater versatility. The use of these instruments to gain exposure to U.S. large-cap equities, U.S. small-cap equities and Canadian equities during the Reporting Period detracted from the Fund’s performance, as these positions delivered returns similar to the asset classes they represented. The Fund also employed currency forwards, currency options, U.S. Treasury futures and interest rate floor contracts to afford greater risk management of macroeconomic and foreign exchange risks in the portfolio. Currency forwards had a positive impact on the Fund’s returns due to strength in the U.S. dollar versus other developed markets currencies. Currency options detracted from the Fund’s returns, though they partially accomplished their intended purpose of hedging against downside currency risks during periods of risk-off investor sentiment, or reduced risk appetite. U.S. Treasury futures and interest rate floor contracts detracted from the Fund’s performance, as the Fed began hiking short-term interest rates in early 2022. Finally, the Fund used equity index options as part of the volatility selling strategy. The impact of equity index options on the Fund’s performance was positive during the Reporting Period. |
| Q | Were there any changes to the Fund’s portfolio management team during the Reporting Period? |
| A | There were no changes to the Fund’s portfolio management team during the Reporting Period. |
| Q | How was the Fund positioned at the end of the Reporting Period? |
| A | In terms of its strategic allocations at the end of the Reporting Period, the Fund had 102.50% of its total net assets invested in equity-related investments, 2.01% in the macro hedging strategy, 7.70% in the volatility selling strategy and 0% in cash and cash equivalents. However, the Fund maintained a position in cash and cash equivalents to cover the exposure of various derivatives positions. This above sector breakout is inclusive of derivative exposure across all asset classes. |
| Q | What is the Fund’s tactical asset allocation view and strategy for the months ahead? |
| A | At the end of the Reporting Period, we expected economic growth in the U.S. and Europe to continue slowing into the end of 2022, and we believed both economies were likely to grow below trend in 2023. We thought China’s economic growth would gradually improve and be near trend in 2023. Risks to this view include China’s property sector and/or the failure of the government’s “zero-COVID” policy. |
| As for inflation, at the end of the Reporting Period, we anticipated it would remain elevated in the near term, given rather high oil and gas prices. In the U.S., inflation should moderate gradually toward the end of 2022, in our opinion, but short-term risks of high inflation could linger given rising prices for housing and the potential for ongoing COVID-19-related supply disruptions from China. |
| Regarding monetary policy, we expected many of the world’s central banks to continue tightening, which could, in |
5
PORTFOLIO RESULTS
| turn, anchor investors’ inflation expectations even if macroeconomic weakness persists. In our view, uncertainty around the Fed’s interest rate path was likely to drive financial market volatility in the near term. We believed there was a risk the Fed could overtighten its monetary policy, leading to a U.S. recession. |
| Looking ahead, we thought risk assets were likely to face headwinds through the end of 2022 and into 2023. Among those headwinds were slowing economic growth, high U.S. home prices, a tight U.S. labor market, elevated oil prices and the Russia/Ukraine conflict. That said, we believed some of those risks were priced into the markets at the end of the Reporting Period given that valuations seemed more reasonable to us than they did at the beginning of the 2022 calendar year. |
| In terms of positioning at the end of the Reporting Period, the Fund had modest exposure to equities, as we expected economic growth to continue slowing and saw an elevated risk of recession in the near term. We intended to wait for inflation data to moderate before we considered increasing the Fund’s equity exposure. We also believed there needed to be a shift in the Fed’s monetary policy stance that could support economic growth and potentially lead to a sustainable equity market rally. That said, within equities at the end of Reporting Period, the Fund had exposure to Chinese Internet stocks, as we found their valuations attractive, regulatory constraints seemed to be easing and China’s economic activity should pick up through the end of 2022, in our opinion. Within the macro hedging strategy, we planned to add to the Fund’s position in interest rate floor contracts should risks to economic growth increase and central banks near the end of their tightening cycles. |
6
Global Managed Beta Fund
as of August 31, 2022
| FUND COMPOSITION1 | ||||
| Percentage of Net Assets | ||||

| 1 | Underlying sector allocations of exchange traded funds and investment companies held by the Fund are not reflected in the graph above. The percentage shown for each investment category reflects the value of investments in that category as a percentage of net assets. Figures in the graph may not sum to 100% due to the exclusion of other assets and liabilities. The graph does not depict the investment in the securities lending reinvestment vehicle. The investment in the securities lending reinvestment vehicle represented 4.3% of the Fund’s net assets as of August 31, 2022. The graph depicts the Fund’s investments but may not represent the Fund’s market exposure due to the exclusion of certain derivatives, if any, as listed in the Additional Investment Information section of the Schedule of Investments. |
For more information about your Fund, please refer to www.GSAMFUNDS.com. There, you can learn more about your Fund’s investment strategies, holdings, and performance.
7
GOLDMAN SACHS GLOBAL MANAGED BETA FUND
Performance Summary
August 31, 2022
The following graph shows the value, as of August 31, 2022, of a $1,000,000 investment made on April 30, 2015 (commencement of operations) in Institutional Shares at NAV. The performance data in the graph for the Fund’s Institutional Shares, which do not impose an initial sales charge, do not reflect an initial sales charge for the period shown. For comparative purposes, the performance of the Fund’s benchmark, the MSCI All Country World Index Investable Market Index (Net, USD, 50% Non-US Developed Hedged to USD), is shown. Performance reflects applicable fee waivers and/or expense limitations in effect during the periods shown and in their absence, performance would be reduced. Returns do not reflect the deduction of taxes that a shareholder would pay on Fund distributions or the redemption of Fund shares. The returns set forth below represent past performance. Past performance does not guarantee future results. The Fund’s investment return and principal value will fluctuate so that an investor’s shares, when redeemed, may be worth more or less than their original cost. Current performance may be lower or higher than the performance quoted below. Please visit our web site at www.GSAMFUNDS.com to obtain the most recent month-end returns.
| Global Managed Beta Fund’s Lifetime Performance |
Performance of a $1,000,000 Investment, with distributions reinvested, from April 30, 2015 through August 31, 2022.
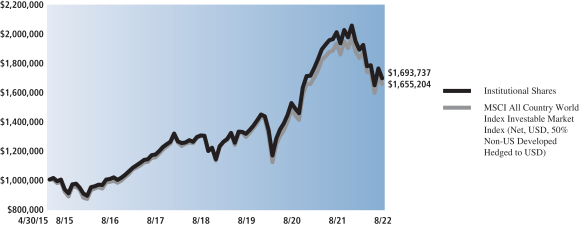
| Average Annual Total Return through August 31, 2022* | One Year | Five Years | Since Inception | |||||||
| Institutional (Commenced April 30, 2015) |
-15.81% | 7.64% | 7.44% | |||||||
|
| ||||||||||
| * | Because Institutional Shares do not involve a sales charge, such a charge is not applied to its Average Annual Total Return. |
8
PORTFOLIO RESULTS
Goldman Sachs Strategic Factor Allocation Fund
Investment Objective
The Fund seeks long-term total return.
Portfolio Management Discussion and Analysis
Below, the Goldman Sachs Quantitative Investment Strategies Team (“QIS Team”) discusses the Goldman Sachs Strategic Factor Allocation Fund’s (the “Fund”) performance and positioning for the 12-month period ended August 31, 2022 (the “Reporting Period”).
| Q | How did the Fund perform during the Reporting Period? |
| A | During the Reporting Period, the Fund’s Institutional, Class R6 and Class P Shares generated average annual total returns of -6.47%, -6.37% and -6.47%, respectively. These returns compare to the -11.08% average annual total return of the Fund’s blended benchmark, the Strategic Factor Allocation Composite Index (the “Index”), which is composed 50% of the S&P 500® Index and 50% of the Bloomberg U.S. Aggregate Bond Index, during the same period. The components of the Fund’s blended benchmark, the S&P 500® Index and the Bloomberg U.S. Aggregate Bond Index, generated average annual total returns of -11.23% and -11.52%, respectively, during the Reporting Period. |
| Q | What key factors affected the Fund’s performance during the Reporting Period? |
| A | The Fund seeks to achieve its investment objective through the implementation of the Goldman Sachs Strategic Factor Allocation process (“Strategic Allocation”), which is derived from the Goldman Sachs Investment Strategy Group’s (“ISG”) market views on a variety of asset classes and instruments. The Strategic Allocation was developed to provide exposure to “factors,” which are academically derived drivers of investment returns that the Goldman Sachs ISG believes offer the potential for greater and more consistent returns in various market environments. These factors include, but are not limited to, Equity, Term, Flow and Volatility. The QIS Team implements the Strategic Allocation by investing in derivatives and pooled investment vehicles, including, but not limited to, investment companies, including exchange-traded funds (“ETFs”) (the “Underlying Funds”) and exchange-traded notes (“ETNs”). The Underlying Funds may include affiliated investment companies. The Strategic Allocation may also be implemented by investing in any one or a combination of the following asset classes: (i) U.S. and foreign equity securities, including common and preferred stocks; (ii) fixed income instruments, which include, among others, debt issued by governments (including the U.S. and foreign governments), their agencies, instrumentalities, sponsored entities, and political subdivisions, notes, debt participations and non-investment grade securities (commonly known as “junk bonds”); and (iii) foreign exchange contracts. |
| During the Reporting Period, the Strategic Allocation added overall to the Fund’s performance. In relative terms, the Term, Flow and Volatility factors contributed positively to returns, while the Equity factor detracted from performance. On an absolute basis, the Flow and Volatility factors added to returns, while the Equity and Term factors detracted from results. The Flow factor seeks to systematically capitalize on flows within and across asset classes. The Volatility factor seeks to capture the “fear premium” associated with equity risk. (The fear premium is the amount investors tend to overpay to preserve capital during periods of financial market volatility.). The Equity factor seeks to capture the premium associated with equity risk. The Term factor seeks to capture the premium associated with interest rate and inflation risk. |
| Q | How was the Fund positioned at the beginning of the Reporting Period? |
| A | In terms of its Strategic Allocation at the beginning of the Reporting Period, the Fund maintained equal weightings in the Equity, Flow and Volatility factors. It had a relatively smaller weighting in the Term factor. |
| In terms of underlying asset classes and instruments, the Fund held positions in U.S. equities, listed U.S. equity index options, U.S. fixed income and listed U.S. fixed income options. In terms of currencies, it had long positions versus the U.S. dollar in the Australian dollar and the New Zealand |
9
PORTFOLIO RESULTS
| dollar. It had short positions relative to the U.S. dollar in the Canadian dollar, euro, Swiss franc and Japanese yen. The Fund did not hold a position versus the U.S. dollar in the British pound at the start of the Reporting Period. |
| Q | How did the Fund use derivatives and similar instruments during the Reporting Period? |
| A | The Fund uses derivatives for both hedging and non-hedging purposes in the implementation of the Strategic Allocation. During the Reporting Period, the Fund employed listed equity index futures and listed equity index options to implement views on the U.S. equity market. The use of listed equity index futures detracted from performance, while the use of listed equity index options contributed positively. In addition, the Fund used listed fixed income futures to express views on the U.S. fixed income market, which had a negative impact on returns. Forward foreign currency exchange contracts, which were used to take long and short positions in select developed markets currencies, had a positive impact overall on the Fund’s results during the Reporting Period. |
| Q | Were there any changes to the Fund’s portfolio management team during the Reporting Period? |
| A | Effective June 23, 2022, Federico Gilly no longer served as a portfolio manager for the Fund and as of that date, the portfolio managers for the Fund were James Park and Patrick Harnett. (Effective September 22, 2022, after the end of the Reporting Period, James Park no longer served as a portfolio manager for the Fund and Oliver Bunn joined Patrick Harnett as a portfolio manager of the Fund.) By design, all investment decisions for the Fund are performed within a team structure, with multiple subject matter experts. This strategic decision making has been a cornerstone of our approach and helps ensure continuity in the Fund. |
| Q | How was the Fund positioned at the end of the Reporting Period? |
| A | In terms of its Strategic Allocation at the end of the Reporting Period, the Fund had equal weightings in the Equity, Flow and Volatility factors. It maintained a relatively smaller weighting in the Term factor. |
| In terms of underlying asset classes and instruments, the Fund held positions in U.S. equities, listed U.S. equity index options, U.S. fixed income and listed U.S. fixed income options. In terms of currencies, it had long positions versus the U.S. dollar in the Canadian dollar and the New Zealand dollar. It held short positions relative to the U.S. dollar in the Swiss franc, euro, Japanese yen and British pound. The Fund did not hold a position versus the U.S. dollar in the Australian dollar at the end of the Reporting Period. |
| Q | What was the Fund’s strategy at the end of the Reporting Period? |
| A | Going forward, the QIS Team plans to continue implementing the Goldman Sachs Strategic Factor Allocation process as it seeks long-term total return. |
10
FUND BASICS
Strategic Factor Allocation Fund
as of August 31, 2022
| HOLDINGS AS OF 8/31/221 | ||||||||
| Holding | % of Net Assets | Line of Business | ||||||
| Goldman Sachs Financial Square Government Fund — Institutional Shares | 74.2 | % | Investment Companies | |||||
| 1 | The holdings may not be representative of the Fund’s future investments. Figures in the table above may not sum to 100% due to the exclusion of other assets and liabilities. The holdings may not represent the Fund’s market exposure due to the exclusion of certain derivatives, if any, as listed in the Additional Investment Information section of the Schedule of Investments. |
For more information about your Fund, please refer to www.GSAMFUNDS.com. There, you can learn more about your Fund’s investment strategies, holdings, and performance.
11
GOLDMAN SACHS STRATEGIC FACTOR ALLOCATION FUND
Performance Summary
August 31, 2022
The following graph shows the value, as of August 31, 2022, of a $1,000,000 investment made on May 31, 2016 (commencement of operations) in Institutional Shares at NAV. For comparative purposes, the performance of the Fund’s benchmark, the Strategic Factor Allocation Composite Index, which is comprised of 50% of the S&P 500® Index and 50% of the Bloomberg U.S. Aggregate Bond Index, is shown. Performance reflects applicable fee waivers and/or expense limitations in effect during the periods shown and in their absence, performance would be reduced. Returns do not reflect the deduction of taxes that a shareholder would pay on Fund distributions or the redemption of Fund shares. The returns set forth below represent past performance. Past performance does not guarantee future results. The Fund’s investment return and principal value will fluctuate so that an investor’s shares, when redeemed, may be worth more or less than their original cost. Current performance may be lower or higher than the performance quoted below. Please visit our web site at www.GSAMFUNDS.com to obtain the most recent month-end returns.
| Strategic Factor Allocation Fund’s Lifetime Performance |
Performance of a $1,000,000 Investment, including any applicable sales charges, with distributions reinvested, from May 31, 2016 through August 31, 2022.

| Average Annual Total Return through August 31, 2022* | One Year | Five Years | Since Inception | |||||||
| Institutional (Commenced May 31, 2016) |
-6.47% | 5.54% | 6.09% | |||||||
|
| ||||||||||
| Class R6 (Commenced December 29, 2017) |
-6.37% | N/A | 5.16% | |||||||
|
| ||||||||||
| Class P (Commenced April 17, 2018) |
-6.47% | N/A | 6.08% | |||||||
|
| ||||||||||
| * | These returns assume reinvestment of all distributions at NAV. Because Institutional, Class R6 and Class P Shares do not involve a sales charge, such a charge is not applied to their Average Annual Total Return. |
12
PORTFOLIO RESULTS
Goldman Sachs Strategic Volatility Premium Fund
Investment objective
The Fund seeks long-term total return.
Portfolio Management Discussion and Analysis
Below, the Goldman Sachs Quantitative Investment Strategies Team (“QIS Team”) discusses the Goldman Sachs Strategic Volatility Premium Fund’s (the “Fund”) performance and positioning for the 12-month period ended August 31, 2022 (the “Reporting Period”).
| Q | How did the Fund perform during the Reporting Period? |
| A | During the Reporting Period, the Fund’s Institutional and Class P Shares generated average annual total returns of -4.09% and -4.09%, respectively. These returns compare to the -5.73% average annual total return of the Fund’s benchmark, the Bloomberg 1-5 Year U.S. Treasury Index, during the Reporting Period. |
| Q | What key factors affected the Fund’s performance during the Reporting Period? |
| A | The Fund seeks to achieve its investment objective through the implementation of a volatility overlay strategy (“Strategic Volatility Premium”), which is a “factor” within the Strategic Factor Allocation process of the Goldman Sachs Investment Strategy Group (“ISG”). The Strategic Allocation was developed to provide exposure to “factors,” which are academically derived drivers of investment returns the Goldman Sachs ISG believes offer the potential for greater and more consistent returns in various market environments. Through the Strategic Volatility Premium, the QIS Team seeks to enhance the returns of a fixed income allocation to U.S. Treasury securities by using an options-based overlay strategy and hedging with S&P 500® Index futures. The Fund may use futures contracts, primarily futures on indexes, options on indexes and options on futures to more effectively gain targeted exposure to the Strategic Volatility Premium, to equitize cash and to hedge the Fund’s portfolio if it is unable to purchase or write the necessary options for its overlay strategy. |
| During the Reporting Period, the Strategic Volatility Premium recorded negative absolute returns but outperformed the Fund’s benchmark. |
| Q | How did the Fund’s options-based overlay strategy affect its performance? |
| A | Consistent with our investment approach, we construct the Fund’s options-based overlay by simultaneously selling out-of-the-money short-dated put options while buying further out-of-the-money longer-dated put options on the S&P 500® Index. To limit the downside risk of the written put options, further out-of-the-money long put options and S&P 500® Index futures are used to reduce the impact to the Fund if the S&P 500® Index approaches or falls past the strike price of the written put options. (“Out-of-the-money” is a term used to describe a put option with a strike price that is lower than the market price of the underlying asset. A put option is an option contract that gives the holder the right, but not the obligation, to sell a specified amount of an underlying asset at a specified price within a specified time.) The options-based overlay strategy is designed to provide the Fund with enhanced returns and additional income. The downside risk is mitigated to the extent of the difference between the strike price of a put option purchased and the strike price of a put option sold, as well as futures-based hedging positions. |
| As the seller of put options, the Fund will receive cash (the “premium”) from the purchaser. If the purchaser exercises the put option, the Fund pays the purchaser the difference between the strike price of the option and the price of the index at the time of exercise. The premium, the exercise price and the market price of the index determine the gain or loss realized by the Fund as the seller of put options. As the buyer of put options, the Fund will pay the “premium” to the seller. If the Fund exercises the put option, the seller will pay the Fund the difference between the strike price of the option and the price of the index at the time of exercise. The premium, the exercise price and the market price of the index determine the gain or loss realized by the Fund as the buyer of put options. |
13
PORTFOLIO RESULTS
| During periods in which expected volatility in the U.S. equity markets exceeds subsequent realized volatility, a portfolio of U.S. Treasury securities, with an options-based overlay strategy, may outperform the same portfolio without such an options-based overlay strategy. However, a portfolio with an options-based overlay strategy may underperform the same portfolio without such an options-based overlay if realized volatility in the U.S. equity markets exceeds expected volatility. |
| During the Reporting Period, expected volatility in the U.S. equity markets exceeded subsequent realized volatility, and thus the Fund’s options-based overlay strategy added to performance. |
| Q | How was the Fund positioned at the beginning of the Reporting Period? |
| A | At the start of the Reporting Period, the Fund maintained a long position in bond futures and a short position in equity options. It also held a modest long position in equity index futures to hedge its position in equity options. |
| Q | How did the Fund use derivatives and similar instruments during the Reporting Period? |
| A | The Fund uses derivatives for both hedging and non-hedging purposes in the implementation of the Strategic Volatility Premium. During the Reporting Period, the Fund employed listed equity index futures and listed equity index options to implement views on the U.S. equity market, with each contributing positively to performance. It used bond futures to express views on the U.S. fixed income market, which had a negative impact on returns during the Reporting Period. |
| Q | Were there any changes to the Fund’s portfolio management team during the Reporting Period? |
| A | Effective June 23, 2022, Federico Gilly no longer served as a portfolio manager for the Fund and as of that date, the portfolio managers for the Fund were James Park and Patrick Harnett. (Effective September 22, 2022, after the end of the Reporting Period, James Park no longer served as a portfolio manager for the Fund and Oliver Bunn joined Patrick Harnett as a portfolio manager of the Fund.) By design, all investment decisions for the Fund are performed within a team structure, with multiple subject matter experts. This strategic decision making has been a cornerstone of our approach and helps ensure continuity in the Fund. |
| Q | How was the Fund positioned at the end of the Reporting Period? |
| A | At the end of the Reporting Period, the Fund maintained a long position in bond futures, a long position in equity options and a modest long position in equity index futures to hedge its position in equity options. |
| Q | What was the Fund’s strategy at the end of the Reporting Period? |
| A | Going forward, the QIS Team plans to continue implementing the Strategic Volatility Premium as it seeks long-term total return. |
14
FUND BASICS
Strategic Volatility Premium Fund
as of August 31, 2022
| HOLDINGS AS OF 8/31/221 | ||||||||
| Holding | % of Net Assets | Line of Business | ||||||
| Goldman Sachs Financial Square Government Fund — Institutional Shares | 67.1 | % | Investment Companies | |||||
| 1 | The holdings may not be representative of the Fund’s future investments. Figures in the table above may not sum to 100% due to the exclusion of other assets and liabilities. The holdings may not represent the Fund’s market exposure due to the exclusion of certain derivatives, if any, as listed in the Additional Investment Information section of the Schedules of Investments. |
For more information about your Fund, please refer to www.GSAMFUNDS.com. There, you can learn more about your Fund’s investment strategies, holdings, and performance.
15
GOLDMAN SACHS STRATEGIC VOLATILITY PREMIUM FUND
Performance Summary
August 31, 2022
The following graph shows the value, as of August 31, 2022, of a $1,000,000 investment made on March 29, 2021 (commencement of operations) in Institutional Shares at NAV. The performance data in the graph for the Fund’s Institutional Shares, which do not impose an initial sales charge, do not reflect an initial sales charge for the period shown. For comparative purposes, the performance of the Fund’s benchmark, the Bloomberg 1-5 Year U.S. Treasury Index, is shown. Performance reflects applicable fee waivers and/or expense limitations in effect during the periods shown and in their absence, performance would be reduced. Returns do not reflect the deduction of taxes that a shareholder would pay on Fund distributions or the redemption of Fund shares. The returns set forth below represent past performance. Past performance does not guarantee future results. The Fund’s investment return and principal value will fluctuate so that an investor’s shares, when redeemed, may be worth more or less than their original cost. Current performance may be lower or higher than the performance quoted below. Please visit our web site at www.GSAMFUNDS.com to obtain the most recent month-end returns.
| Strategic Volatility Premium Fund’s Lifetime Performance |
Performance of a $1,000,000 Investment, with distributions reinvested, from March 29, 2021 through August 31, 2022.

| Average Annual Total Return through August 31, 2022* | One Year | Since Inception | ||||||||
| Institutional (Commenced March 29, 2021) |
-4.09% | -2.21% | ||||||||
|
| ||||||||||
| Class P (Commenced March 29, 2021) |
-4.09% | -2.21% | ||||||||
|
| ||||||||||
| * | These returns assume reinvestment of all distributions at NAV. Because Institutional and Class P Shares do not involve a sales charge, such a charge is not applied to their Average Annual Total Return. |
For more information about your Fund, please refer to www.GSAMFUNDS.com. There, you can learn more about your Fund’s investment strategies, holdings, and performance.
16
PORTFOLIO RESULTS
Goldman Sachs Tactical Tilt Overlay Fund
Investment Objective
The Fund seeks long-term total return.
Portfolio Management Discussion and Analysis
Below, the Goldman Sachs Multi-Asset Solutions (“MAS”) Group discusses the Goldman Sachs Tactical Tilt Overlay Fund’s (the “Fund”) performance and positioning for the 12-month period ended August 31, 2022 (the “Reporting Period”).
| Q | How did the Fund perform during the Reporting Period? |
| A | During the Reporting Period, the Fund’s Institutional, Class R6 and Class P Shares generated average annual total returns of 0.49%, 0.49% and 0.49%, respectively. These returns compare to the 0.38% average annual total return of the Fund’s benchmark, the ICE BofA 3-Month U.S. Treasury Bill Index (the “Index”), during the same time period. |
| References to the Fund’s benchmark and to other indices, if any, mentioned herein are for informational purposes only, and unless otherwise noted, are not indications of how the Fund is managed. The use of the Index as the Fund’s benchmark does not imply the Fund is being managed like cash and does not imply low risk or low volatility. |
| Q | What key factors affected the Fund’s performance during the Reporting Period? |
| A | The Fund seeks to achieve its investment objective through the implementation of investment ideas that are generally derived from short-term or medium-term market views on a variety of asset classes and instruments. |
| During the Reporting Period, the Fund benefited most from its equity-related exposures. Specifically, its long positions in U.S. energy stocks and energy master limited partnerships (“MLPs”) contributed positively to results. Energy-related equities outperformed U.S. large-cap stocks, as measured by the S&P 500® Index, during the Reporting Period, as supply-chain disruptions, increased energy demand and geopolitical uncertainty pushed up crude oil prices. |
| The Fund’s commodity and currency exposures added modestly to performance. Within commodities, the Fund was helped by the implementation of a West Texas Intermediate (“WTI”) crude oil option spread, which benefited from a rally in crude oil prices during the Reporting Period. (An option spread is an options strategy that involves buying and selling the same number of options on an underlying asset, but at different strike prices and maturities.) |
| Within currency exposures, the Fund was aided by a long position in the U.S. dollar versus short positions in the euro, Japanese yen and Swiss franc. Also bolstering the Fund’s performance was a long position in the Brazilian real versus a short position in the U.S. dollar. |
| The Fund’s fixed income exposures detracted from its returns. Most of the underperformance was due to the Fund’s sizable allocation to investment grade fixed income, which weakened as higher than market expected inflation data drove up yields during the Reporting Period. |
| Q | How was the Fund positioned at the beginning of the Reporting Period? |
| A | At the beginning of the Reporting Period, the Fund had approximately 18.56% of its total net assets invested in long equity-related investments; approximately 23.55% of its total net assets invested in long fixed income-related investments; 0.00% of its total net assets invested in long currency-related investments; and 0.00% of its total net assets invested in long commodity-related investments. The Fund had a short position (representing approximately -5.27% of its total net assets) in equity-related investments. Specifically, the Fund held a short position (representing approximately -3.15% of its total net assets) in a basket of large-cap equity-related investments we believed might underperform the U.S. stock market, and it held a short position in S&P 500® Index futures (representing approximately -2.12% of its total net assets) as part of a relative value tilt wherein the Fund held a long position in the U.S. health care sector versus a short position in U.S. large-cap stocks. In addition, the Fund had a short position (representing approximately -2.34% of its total net assets) in currency-related investments. The Fund had no short positions in fixed income-related investments or commodity-related investments at the start of the Reporting Period. |
17
PORTFOLIO RESULTS
| The above sector breakout is inclusive of derivative exposure across all asset classes, but it does not necessarily include the cash held to support those positions. Derivatives positions are mostly supported by cash held in the Fund specifically to cover its exposure and any potential margin calls or future losses experienced. Given the line-up of positions held, most of them were derivatives-based, so the cash allocation at the beginning of the Reporting Period was high. |
| Q | How did you tactically manage the Fund’s allocations during the Reporting Period? |
| A | During the Reporting Period, in response to shifting macroeconomic and market dynamics, we made a number of tactical changes to the Fund’s exposures. |
| In terms of equity-related exposures, during October 2021, we increased the Fund’s position in a Nikkei 225 Index call option. (A call option is an option that gives the holder the right to buy a certain quantity of an underlying security at an agreed-upon price at the time of expiry.) Japanese equities have historically posted strongly positive returns near calendar year ends, and we anticipated a significant acceleration in Japan’s economic growth during the fourth quarter of 2021 as pent-up demand from COVID-19-related restrictions was released. In November, we sold put options on the S&P 500® Health Care Index, thereby increasing the Fund’s position in the health care sector while also hedging its overall exposure; we believed the health care sector was characterized by attractive valuations, resilient earnings growth and scope for policy risk to recede. (A put option is an option contract that gives the holder the right, but not the obligation, to sell a certain quantity of an underlying security at an agreed-upon price at the time of expiry.) In December, we added an S&P 500® Index options tilt, which consisted of a short position in a put option and a long position in a call option, to give the Fund potential upside participation in S&P 500® Index gains while hedging that exposure in the face of a number of risks, such as the Omicron COVID-19 variant, a more hawkish Fed and the then-upcoming debate in Congress about the U.S. debt ceiling. During January 2022, we sold S&P 500® Index put options, as we believed the U.S. economy was in a multiple year expansion that would support equity returns. Historically, the S&P 500® Index has generated positive annual total returns about 88% of the time the U.S. economy is growing, according to the Goldman Sachs Investment Strategy Group. Although we recognized that COVID-19 continued to be a source of potential downside risk, we did not think the virus would upend the U.S. recovery, especially given the starting point of well above-trend growth, ample household savings, a large share of vaccinated individuals, and U.S. policymakers’ resistance to widespread lockdowns that would cripple economic growth. In March 2022, we removed the systematic upside improvement tilt, which seeks to identify stocks likely to outperform the market based on a variety of technical and fundamental ranking factors. This tilt tends to have a bias toward value stocks and had realized substantial gains since January 2022, as value stocks broadly outperformed growth stocks. The Fund continued to have exposure to value stocks through its long positions in U.S. energy stocks and European bank stocks. During May, we purchased a S&P 500® Index call option and sold an S&P 500® Index put option based on our belief that investors were rather defensively positioned and that risk mitigation efforts had created conditions for a possible equity market rally. In July, we implemented an S&P 500® Energy Index call option spread. At the time, we thought weakness in energy stocks was at odds with solid company fundamentals and seemed to reflect a significant risk premium for slowing economic growth. We believed the energy sector could rebound as investors gained more confidence in the durability of company managements’ capital discipline and the persistence of tight oil markets. However, due to continued uncertainties around the path of inflation and the degree of further monetary policy tightening, we decided it would be prudent to mitigate potential downside risk for the Fund’s existing long positions by expressing our positive views about the sector via the call option spread. During August 2022, we established an S&P 500® Index calendar put spread to help hedge against the impact of a short-term market decline. (A calendar spread is a derivatives strategy in which an investor takes a long and a short position on the same asset using derivatives contracts with different expiration dates. The goal is to profit from the difference in price on the underlying asset between the two expiration dates.) Also in August, we removed a portion of the Fund’s long position in Eurozone banks. Given increasing near-term risks, and because of a significant rally during July, we decided to mitigate potential downside risk by closing half the Fund’s position. |
| Regarding fixed income-related exposures, in January 2022, we increased the Fund’s existing long position in U.S. bank loans, because we thought they offered attractive incremental yields compared to cash, investment grade corporate bonds and high yield corporate bonds. Also in January, we established a Fund position in a five-year Mexican interest rate swap, as we expected Mexico’s interest rates to fall on the back of a central bank hiking cycle that was shallower |
18
PORTFOLIO RESULTS
| than the market had expected. We exited this position in March, as the Russia/Ukraine conflict drove up the prices of commodities, such as wheat and corn, which could undermine the disinflationary path we had envisioned for Mexico. At the same time, we thought the conflict was likely to dampen investor sentiment for emerging economies, including Mexico. During April, we added a long position in two-year U.S. Treasury securities, because we thought they offered an attractive cash alternative for investors who were willing to hold them through what is likely to be a volatile period for bonds. During July, we reduced the Fund’s long position in U.S. bank loans in the wake of strong performance. |
| In terms of currency-related exposures, during December 2021, we established a long position in the Brazilian real versus a short position in the U.S. dollar, so the Fund could benefit if the Brazilian real appreciated relative to the U.S. dollar. In our view, investors were overly pessimistic about Brazil’s fiscal and political environment and as a result, the Brazilian real was fundamentally undervalued relative to the U.S. dollar. We removed this positioning in January 2022, locking in Fund gains after the Brazilian real strengthened considerably versus the U.S. dollar. During March 2022, we eliminated the Fund’s long position in the U.S. dollar versus its short position in the Japanese yen, as the U.S. dollar had appreciated significantly and downside risks to the Japanese yen had eased. During May, we removed the Fund’s long position in the U.S. dollar versus its short position in the Swiss franc after the rapid depreciation of the Swiss franc had brought the currency closer to its value before the onset of the COVID-19 pandemic. In July, we initiated a short position in the euro relative to a long position in the Swiss franc, as slowing European economic growth, coupled with rising risks from an energy shortage, suggested the euro could weaken relative to the Swiss franc in the near term. Also during July, we reinitiated the Fund’s long position in the Brazilian real versus its short position in the U.S. dollar because we thought the Brazilian real might strengthen as election uncertainty in Brazil declined. |
| As for commodities-related exposures, we implemented a WTI crude oil option spread in November 2021 and also established a short position in a December 2022 WTI put option. During March 2022, we removed the WTI crude oil option spread given that the Fund’s position was deep in the money and had, in our view, realized most of its maximum profit potential. (“In the money” is a term used to describe a call option with a strike price that is lower than the market price of the underlying asset, or a put option with a strike price that is higher than the market price of the underlying asset. “Deep in the money” means the strike price of a call option is well below the market price of the underlying asset, or well above the market price of the underlying asset in the case of a put option.) During July, in a risk management move, we trimmed the Fund’s long position in energy MLPs based on strong 2022 year-to-date performance and signs of slowing economic growth. |
| Q | How did the Fund use derivatives and similar instruments during the Reporting Period? |
| A | The Fund used derivatives and similar instruments as part of its investment strategy to express views implemented in the Fund. Positions were supported predominantly by cash held in the Fund specifically to cover its exposure to derivative instruments and any potential margin calls or future losses experienced. |
| During the Reporting Period, the Fund employed equity futures, equity options and equity index options, bond futures, interest rate swaps, total return swaps, swaptions, options on commodity futures and currency options to express active investment views with greater versatility across regional equity markets, global market sectors, commodities markets and currency markets. The Fund’s use of equity futures to gain exposure to U.S. and European securities had a negative impact on performance. To afford greater risk management precision, equity options and options on equity indices were employed to tactically adjust the amount of equity risk and downside risk in the Fund. The Fund’s use of equity options to gain exposure to U.S., U.K., European and Japanese equities, to U.S. health care and energy stocks, and to Chinese technology stocks collectively added to performance. Bond futures, which the Fund employed to gain exposure to U.S. Treasury securities, detracted from results. The Fund also employed interest rate swaps to gain exposure to Mexican interest rates, which had a negative impact on performance during the Reporting Period. |
| In addition, the Fund’s use of total return swaps within the systematic downside mitigation tactical tilt and the systematic upside improvement tilt, as well as to take both long and short positions on a basket of large-cap stocks and to gain exposure to European bank stocks, had a positive impact on performance. (The systematic downside mitigation tactical tilt seeks to limit the Fund’s exposure to potential market declines through the shorting of U.S. large-cap stocks we believed might underperform the broader U.S. stock |
19
PORTFOLIO RESULTS
| market, while at the same time taking a long position in the broader U.S. stock market. As a reminder, the systematic upside improvement tilt seeks to identify stocks likely to outperform the market based on a variety of technical and fundamental ranking factors. The resulting long positions are then held against an equally sized short position in the S&P 500® Index.) Swaptions, which were used to express our views on U.S. interest rates, added to performance. Additionally, the Fund used options on commodity futures to express our views of WTI crude oil, which had a positive impact on results. Finally, currency options, which were employed to gain exposure to numerous non-U.S. currencies, had a positive impact on the Fund’s performance during the Reporting Period overall. |
| Q | Were there any changes to the Fund’s portfolio management team during the Reporting Period? |
| A | There were no changes to the Fund’s portfolio management team during the Reporting Period. |
| Q | How was the Fund positioned at the end of the Reporting Period? |
| A | At the end of the Reporting Period, the Fund had approximately 17.49% of its total net assets invested in long equity-related investments and approximately 46.07% of its total net assets invested in long fixed income-related investments. In terms of currency-related investments, the Fund had a long position in the Brazilian real versus a short position in the U.S. dollar (representing 1.52% of the Fund’s total net assets) and a long position in the euro versus a short position in the Swiss franc (representing 0.46% of the Fund’s total net assets). In terms of commodity-related investments, the Fund had a long position (representing approximately 0.80% of the Fund’s total net assets) in uranium, implemented via a closed-end trust. Additionally, the Fund had a short position (representing approximately -3.15% of its total net assets) in equity-related investments at the end of the Reporting Period. The Fund had a short position (representing approximately -1.34% of its total net assets) in fixed income-related investments. Specifically, the Fund maintained a swaption tilt, implemented through 30-year payer and receiver swaptions, to express our views of U.S. interest rates. (In a payer swaption, the purchaser has the right but not the obligation to enter into a swap contract wherein they become the fixed-rate payer and the floating-rate receiver. In a receiver swaption, the purchaser has the option to enter into a swap contract wherein they will receive the fixed rate and pay the floating rate.) The Fund had no short positions in currency-related or commodity-related investments at the end of the Reporting Period. |
| The above sector breakout is inclusive of derivative exposure across all asset classes, but it does not necessarily include the cash held to support those positions. Derivatives positions are mostly supported by cash held in the Fund specifically to cover its exposure and any potential margin calls or future losses experienced. Given the line-up of positions held, most of them were derivatives-based, so the cash allocation at the end of the Reporting Period was high. |
| Q | What is the Fund’s tactical asset allocation view and strategy for the months ahead? |
| A | At the end of the Reporting Period, we had a positive view on U.S. equities, but were mindful that they faced a number of near-term headwinds, including rising geopolitical tensions, elevated inflation and the Fed’s less accommodative monetary policy. In our opinion, the Fed’s aggressive interest rate hikes and generally tighter financial conditions may dampen economic growth, which would increase the risk of a U.S. recession some time in 2023 or 2024. At the sector level, we favored energy stocks, largely because of ongoing capital discipline by management teams and significant cash flow generation at cheap valuations. We also liked health care stocks based on what we saw as their attractive relative valuations and superior earnings growth in the sector. In Europe, we expected recession risk to remain elevated, suggesting to us that European equities would deliver low returns through the end of 2022. Other factors supporting this view were uncertainties around the economic impact of the Russia/Ukraine war, gas supply disruptions and inflationary trends. Nevertheless, we remained positive on European banks at the end of the Reporting Period, as we believed they could benefit from rising interest rates, resilient balance sheets and attractive valuations. |
| Within fixed income, the U.S. market was pricing in a steep hiking cycle at the end of the Reporting Period, implying there was a high hurdle for significant additional increases in interest rates. That said, we believed higher rates overall could provide us with an opportunity to gradually increase the Fund’s duration. (Duration is price sensitivity to changes in yield.) Outside of the U.S., interest rates in developed economies, with the exception of Japan, were likely to trend upwards, in our opinion. |
| As for commodities, we thought many of the supply-side risks caused by the Russia/Ukraine war were fading into the background at the end of the Reporting Period, as sanctions |
20
PORTFOLIO RESULTS
| on Russia turned out to be less effective than expected. The near-term picture appeared to be dominated by a slowdown in demand across macro-driven commodities, particularly in the face of recessionary trends and persistent “zero COVID-19” policies in China. Still, inventories of major commodities remained low, increasing the likelihood, in our view, of ongoing price volatility — both up and down. Although we expected crude oil prices to regain the $100-$120 per barrel range in the near term, we saw an increased risk that they could drop to around $80 a barrel. Meanwhile, the extent of China’s policy stimulus was the main question mark for industrial metals, in our opinion. |
21
FUND BASICS
Tactical Tilt Overlay Fund
as of August 31, 2022
| PORTFOLIO COMPOSITION1 | ||||
| Percentage of Net Assets | ||||
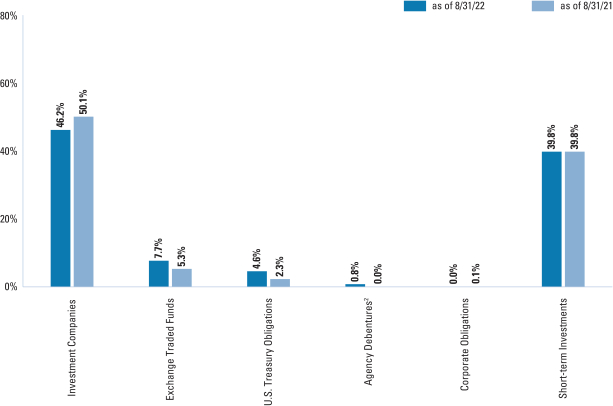
| 1 | The percentage shown for each investment category reflects the value of investments in that category as a percentage of net assets. Short-term investments represent certificate of deposit and commercial paper. Figures in the graph may not sum to 100% due to the exclusion of other assets and liabilities. The graph does not depict the investment in the securities lending reinvestment vehicle. The Investment in the securities lending reinvestment vehicle represented 1.1% and 0.1% of the Fund’s net assets as of August 31, 2022 and 2021. The graph depicts the Fund’s investments but may not represent the Fund’s market exposure due to the exclusion of certain derivatives, if any, as listed in the Additional Investment Information section of the Consolidated Schedule of Investments. |
| 2 | “Agency Debentures” include agency securities offered by companies such as Federal National Mortgage Association (“FNMA”) and Federal Home Loan Mortgage Corp. (“FHLMC”), which operate under a government charter. While they are required to report to a government regulator, their assets are not explicitly guaranteed by the government and they otherwise operate like any other publicly traded company. |
For more information about your Fund, please refer to www.GSAMFUNDS.com. There, you can learn more about your Fund’s investment strategies, holdings, and performance.
22
GOLDMAN SACHS TACTICAL TILT OVERLAY FUND
Performance Summary
August 31, 2022
The following graph shows the value, as of August 31, 2022, of a $1,000,000 investment made on July 31, 2014 (commencement of operations) in Institutional Shares at NAV. For comparative purposes, the performance of the Fund’s benchmark, the ICE® BofAML® Three-Month U.S. Treasury Bill Index is shown. Performance reflects applicable fee waivers and/or expense limitations in effect during the periods shown and in their absence, performance would be reduced. Returns do not reflect the deduction of taxes that a shareholder would pay on Fund distributions or the redemption of Fund shares. The returns set forth below represent past performance. Past performance does not guarantee future results. The Fund’s investment return and principal value will fluctuate so that an investor’s shares, when redeemed, may be worth more or less than their original cost. Current performance may be lower or higher than the performance quoted below. Please visit our web site at www.GSAMFUNDS.com to obtain the most recent month-end returns.
| Tactical Tilt Overlay Fund’s Lifetime Performance |
Performance of a $1,000,000 Investment, with distributions reinvested, from July 31, 2014 through August 31, 2022.

| Average Annual Total Return through August 31, 2022* | One Year | Five Years | Since Inception | |||||||
| Institutional (Commenced July 31, 2014) |
0.49% | 3.30% | 2.65% | |||||||
|
| ||||||||||
| Class R6 (Commenced December 29, 2017) |
0.49% | N/A | 3.14% | |||||||
|
| ||||||||||
| Class P (Commenced April 17, 2018) |
0.49% | N/A | 3.48% | |||||||
|
| ||||||||||
| * | These returns assume reinvestment of all distributions at NAV. Because Institutional, Class R6 and Class P Shares do not involve a sales charge, such a charge is not applied to their Average Annual Total Return. |
23
PORTFOLIO RESULTS
MSCI All Country World Index Investable Market Index is designed to represent performance of the full opportunity set of large- and mid-cap stocks across 23 developed and 24 emerging markets. The index covers approximately 85% of the free float-adjusted market capitalization in each market.
MSCI EAFE Index is an equity index that captures large-cap and mid-cap representation across 21 developed markets countries around the world, excluding the U.S. and Canada. The index covers approximately 85% of the free float-adjusted market capitalization in each country.
MSCI Emerging Markets Index captures large-cap and mid-cap representation across 27 emerging markets countries. The index covers approximately 85% of the free float-adjusted market capitalization in each country.
MSCI World Index is a broad global equity index that represents large and mid-cap equity performance across 23 developed markets countries. It covers approximately 85% of the free float-adjusted market capitalization in each country.
Nikkei 225 is a price-weighted average of 225 top-rated Japanese companies listed in the First Section of the Tokyo Stock Exchange.
S&P 500® Index is a market-capitalization-weighted index of the 500 largest U.S. publicly traded companies by market value and covers approximately 80% of available market capitalization. The S&P 500® Index components and their weightings are determined by S&P Dow Jones Indices.
S&P GSCI Index is a composite index of commodities that measures the performance of the commodity market. It is composed of up of 24 exchange-traded futures contracts that cover physical commodities spanning five sectors.
S&P 500® Health Care Index comprises those companies included in the S&P 500® Index that are classified as members of the Global Industry Classification Standard, or GICS®, health care sector.
S&P 500® Energy Index comprises those companies included in the S&P 500® Index that are classified as members of the Global Industry Classification Standard, or GICS®, energy sector.
Strategic Factor Allocation Composite Index is a blend of 50% the S&P 500® Index and 50% the Bloomberg Barclays U.S. Aggregate Bond Index. It is not possible to invest in an unmanaged index.
Bloomberg U.S. Aggregate Bond Index represents an unmanaged diversified portfolio of fixed income securities, including U.S. Treasuries, investment-grade corporate bonds and mortgage-backed and asset-backed securities. The Index figure does not reflect any deduction for fees, expenses or taxes. It is not possible to invest directly in an index.
Bloomberg 1-5 Year U.S. Treasury Index Bloomberg 1-5 Year Corporate Index: Measures the investment grade, fixed-rate, taxable corporate bond market with 1-5 year maturities. Bloomberg 1-5 Year Government/Credit Index: Is a broad-based benchmark that measures the non-securitized component of the US Aggregate Index.
ICE BofA 3-Month U.S. Treasury Bill Index, an unmanaged index, measures total return on cash, including price and Interest income, based on short-term government Treasury Bills of about 90-day maturity, as reported by Bank of America Merrill Lynch, and does not reflect any deduction for fees, expenses or taxes. It is not possible to invest directly in an unmanaged index.
It is not possible to invest directly in an unmanaged index.
24
GOLDMAN SACHS GLOBAL MANAGED BETA FUND
August 31, 2022
| Shares | Description | Value |
||||||
| Common Stocks – 10.8% | ||||||||
| Aerospace & Defense – 0.1% | ||||||||
| 10,905 | BAE Systems PLC | $ | 98,211 | |||||
| 945 | General Dynamics Corp. | 216,339 | ||||||
| 190 | HEICO Corp. | 28,937 | ||||||
| 171 | HEICO Corp. Class A | 20,961 | ||||||
| 814 | Huntington Ingalls Industries, Inc. | 187,432 | ||||||
| 1,317 | Kongsberg Gruppen ASA | 45,016 | ||||||
| 698 | L3Harris Technologies, Inc. | 159,277 | ||||||
| 505 | Lockheed Martin Corp. | 212,156 | ||||||
| 452 | Northrop Grumman Corp. | 216,051 | ||||||
| 2,036 | Raytheon Technologies Corp. | 182,731 | ||||||
| 7,753 | Singapore Technologies Engineering Ltd. | 20,660 | ||||||
| 3,850 | Textron, Inc. | 240,163 | ||||||
| 523 | Thales SA | 63,053 | ||||||
| 234 | The Boeing Co.* | 37,498 | ||||||
|
|
|
|||||||
| 1,728,485 | ||||||||
|
|
|
|||||||
| Air Freight & Logistics – 0.1% | ||||||||
| 1,608 | C.H. Robinson Worldwide, Inc. | 183,553 | ||||||
| 10,499 | Deutsche Post AG | 383,204 | ||||||
| 643 | DSV A/S | 95,015 | ||||||
| 1,049 | Expeditors International of Washington, Inc. | 107,932 | ||||||
| 1,160 | FedEx Corp. | 244,540 | ||||||
| 1,410 | United Parcel Service, Inc. Class B | 274,259 | ||||||
| 1,555 | Yamato Holdings Co. Ltd. | 24,241 | ||||||
|
|
|
|||||||
| 1,312,744 | ||||||||
|
|
|
|||||||
| Airlines* – 0.0% | ||||||||
| 5,077 | Qantas Airways Ltd. | 18,245 | ||||||
|
|
|
|||||||
| Auto Components – 0.0% | ||||||||
| 255 | Aptiv PLC* | 23,825 | ||||||
| 3,257 | BorgWarner, Inc. | 122,789 | ||||||
| 1,222 | Bridgestone Corp. | 46,893 | ||||||
| 1,272 | Cie Generale des Etablissements Michelin SCA | 30,936 | ||||||
| 799 | Denso Corp. | 43,610 | ||||||
| 127 | Lear Corp. | 17,607 | ||||||
| 1,244 | Magna International, Inc. | 71,864 | ||||||
| 1,887 | Sumitomo Electric Industries Ltd. | 21,615 | ||||||
| 2,143 | Valeo | 40,935 | ||||||
|
|
|
|||||||
| 420,074 | ||||||||
|
|
|
|||||||
| Automobiles – 0.2% | ||||||||
| 1,035 | Bayerische Motoren Werke AG | 76,257 | ||||||
| 300 | Ferrari NV | 57,913 | ||||||
| 24,196 | Ford Motor Co. | 368,747 | ||||||
| 763 | General Motors Co. | 29,154 | ||||||
| 5,826 | Honda Motor Co. Ltd. | 155,101 | ||||||
| 2,072 | Isuzu Motors Ltd. | 25,734 | ||||||
| 7,964 | Mazda Motor Corp. | 70,530 | ||||||
| 2,524 | Mercedes-Benz Group AG | 141,510 | ||||||
| 1,574 | Renault SA* | 44,832 | ||||||
| 7,565 | Stellantis NV | 100,770 | ||||||
| 2,254 | Subaru Corp. | 40,972 | ||||||
| 4,599 | Tesla, Inc.* | 1,267,530 | ||||||
|
|
|
|||||||
| Common Stocks – (continued) | ||||||||
| Automobiles – (continued) | ||||||||
| 17,321 | Toyota Motor Corp. | 259,210 | ||||||
| 293 | Volkswagen AG | 54,196 | ||||||
|
|
|
|||||||
| 2,692,456 | ||||||||
|
|
|
|||||||
| Banks – 0.5% | ||||||||
| 3,306 | ABN AMRO Bank NV(a) | 31,760 | ||||||
| 7,704 | Australia & New Zealand Banking Group Ltd. | 119,093 | ||||||
| 12,254 | Banco Bilbao Vizcaya Argentaria SA | 54,986 | ||||||
| 33,107 | Banco Santander SA | 80,142 | ||||||
| 4,450 | Bank Hapoalim BM | 46,135 | ||||||
| 14,802 | Bank Leumi Le-Israel BM | 156,475 | ||||||
| 19,557 | Bank of America Corp. | 657,311 | ||||||
| 1,831 | Bank of Montreal | 169,040 | ||||||
| 44,042 | Barclays PLC | 83,975 | ||||||
| 2,355 | BNP Paribas SA | 109,437 | ||||||
| 40,706 | BOC Hong Kong Holdings Ltd. | 140,102 | ||||||
| 8,373 | CaixaBank SA | 25,282 | ||||||
| 3,082 | Canadian Imperial Bank of Commerce | 145,752 | ||||||
| 5,847 | Citigroup, Inc. | 285,392 | ||||||
| 1,977 | Citizens Financial Group, Inc. | 72,516 | ||||||
| 3,112 | Commonwealth Bank of Australia | 205,648 | ||||||
| 5,383 | Credit Agricole SA | 49,543 | ||||||
| 3,416 | Danske Bank A/S | 45,614 | ||||||
| 4,329 | DBS Group Holdings Ltd. | 100,794 | ||||||
| 2,734 | DNB Bank ASA | 51,984 | ||||||
| 1,077 | Erste Groupe Bank AG | 24,219 | ||||||
| 2,099 | Fifth Third Bancorp | 71,681 | ||||||
| 1,688 | FinecoBank Banca Fineco SpA | 18,251 | ||||||
| 264 | First Republic Bank | 40,083 | ||||||
| 1,949 | Hang Seng Bank Ltd. | 30,515 | ||||||
| 28,738 | HSBC Holdings PLC | 176,073 | ||||||
| 2,283 | Huntington Bancshares, Inc. | 30,592 | ||||||
| 8,045 | ING Groep NV | 70,510 | ||||||
| 21,803 | Intesa Sanpaolo SpA | 37,534 | ||||||
| 10,673 | Israel Discount Bank Ltd. Class A | 65,251 | ||||||
| 4,046 | Japan Post Bank Co. Ltd. | 29,493 | ||||||
| 9,358 | JPMorgan Chase & Co. | 1,064,285 | ||||||
| 381 | KBC Group NV | 18,171 | ||||||
| 2,689 | KeyCorp. | 47,568 | ||||||
| 188,358 | Lloyds Banking Group PLC | 95,452 | ||||||
| 439 | M&T Bank Corp. | 79,801 | ||||||
| 3,912 | Mediobanca Banca di Credito Finanziario SpA | 30,967 | ||||||
| 25,685 | Mitsubishi UFJ Financial Group, Inc. | 133,150 | ||||||
| 2,319 | Mizrahi Tefahot Bank Ltd. | 94,315 | ||||||
| 4,613 | Mizuho Financial Group, Inc. | 52,821 | ||||||
| 6,802 | National Australia Bank Ltd. | 141,047 | ||||||
| 2,335 | National Bank of Canada | 154,481 | ||||||
| 7,425 | NatWest Group PLC | 21,188 | ||||||
| 10,017 | Nordea Bank Abp | 92,876 | ||||||
| 26,306 | Oversea-Chinese Banking Corp. Ltd. | 226,735 | ||||||
| 3,381 | Regions Financial Corp. | 73,266 | ||||||
| 10,756 | Resona Holdings, Inc. | 39,595 | ||||||
| 4,048 | Royal Bank of Canada | 376,428 | ||||||
| 282 | Signature Bank | 49,170 | ||||||
|
|
|
|||||||
| The accompanying notes are an integral part of these financial statements. | 25 |
GOLDMAN SACHS GLOBAL MANAGED BETA FUND
Schedule of Investments (continued)
August 31, 2022
| Shares | Description | Value |
||||||
| Common Stocks – (continued) | ||||||||
| Banks – (continued) | ||||||||
| 5,390 | Skandinaviska Enskilda Banken AB Class A | $ | 53,731 | |||||
| 2,298 | Societe Generale SA | 50,660 | ||||||
| 4,380 | Standard Chartered PLC | 30,337 | ||||||
| 6,587 | Sumitomo Mitsui Financial Group, Inc. | 198,685 | ||||||
| 1,315 | Sumitomo Mitsui Trust Holdings, Inc. | 40,901 | ||||||
| 36 | SVB Financial Group* | 14,635 | ||||||
| 6,339 | Svenska Handelsbanken AB Class A | 51,918 | ||||||
| 3,705 | Swedbank AB Class A | 47,887 | ||||||
| 2,750 | The Bank of Nova Scotia | 152,058 | ||||||
| 751 | The PNC Financial Services Group, Inc. | 118,658 | ||||||
| 2,611 | The Shizuoka Bank Ltd. | 15,110 | ||||||
| 5,114 | The Toronto-Dominion Bank | 328,992 | ||||||
| 1,978 | Truist Financial Corp. | 92,650 | ||||||
| 2,824 | U.S. Bancorp | 128,803 | ||||||
| 5,366 | United Overseas Bank Ltd. | 104,634 | ||||||
| 10,007 | Wells Fargo & Co. | 437,406 | ||||||
| 8,485 | Westpac Banking Corp. | 124,539 | ||||||
|
|
|
|||||||
| 8,008,103 | ||||||||
|
|
|
|||||||
| Beverages – 0.2% | ||||||||
| 2,009 | Anheuser-Busch InBev SA | 97,024 | ||||||
| 2,186 | Asahi Group Holdings Ltd. | 73,293 | ||||||
| 1,163 | Brown-Forman Corp. Class B | 84,550 | ||||||
| 433 | Carlsberg AS Class B | 56,225 | ||||||
| 2,126 | Coca-Cola Europacific Partners PLC | 104,535 | ||||||
| 1,097 | Coca-Cola HBC AG | 25,033 | ||||||
| 307 | Constellation Brands, Inc. Class A | 75,537 | ||||||
| 3,438 | Davide Campari-Milano NV | 33,730 | ||||||
| 4,559 | Diageo PLC | 198,072 | ||||||
| 1,900 | Heineken Holding NV | 134,782 | ||||||
| 440 | Heineken NV | 39,547 | ||||||
| 3,245 | Ito En Ltd. | 142,414 | ||||||
| 2,945 | Keurig Dr Pepper, Inc. | 112,263 | ||||||
| 1,807 | Kirin Holdings Co. Ltd. | 29,746 | ||||||
| 6,953 | Molson Coors Beverage Co. Class B | 359,261 | ||||||
| 2,638 | Monster Beverage Corp.* | 234,334 | ||||||
| 4,518 | PepsiCo, Inc. | 778,316 | ||||||
| 426 | Pernod Ricard SA | 78,166 | ||||||
| 254 | Remy Cointreau SA | 47,108 | ||||||
| 1,619 | Suntory Beverage & Food Ltd. | 59,137 | ||||||
| 6,581 | The Coca-Cola Co. | 406,113 | ||||||
|
|
|
|||||||
| 3,169,186 | ||||||||
|
|
|
|||||||
| Biotechnology – 0.2% | ||||||||
| 5,675 | AbbVie, Inc. | 763,060 | ||||||
| 833 | Amgen, Inc. | 200,170 | ||||||
| 96 | Argenx SE* | 36,150 | ||||||
| 1,261 | Biogen, Inc.* | 246,374 | ||||||
| 406 | BioMarin Pharmaceutical, Inc.* | 36,215 | ||||||
| 440 | CSL Ltd. | 88,008 | ||||||
| 44 | Genmab A/S* | 15,663 | ||||||
| 4,868 | Gilead Sciences, Inc. | 308,972 | ||||||
| 525 | Horizon Therapeutics PLC* | 31,085 | ||||||
| 3,263 | Incyte Corp.* | 229,813 | ||||||
|
|
|
|||||||
| Common Stocks – (continued) | ||||||||
| Biotechnology – (continued) | ||||||||
| 1,611 | Moderna, Inc.* | 213,087 | ||||||
| 379 | Regeneron Pharmaceuticals, Inc.* | 220,222 | ||||||
| 975 | Seagen, Inc.* | 150,433 | ||||||
| 2,602 | Swedish Orphan Biovitrum AB* | 57,457 | ||||||
| 1,224 | Vertex Pharmaceuticals, Inc.* | 344,874 | ||||||
|
|
|
|||||||
| 2,941,583 | ||||||||
|
|
|
|||||||
| Building Products – 0.1% | ||||||||
| 1,336 | A.O. Smith Corp. | 75,417 | ||||||
| 978 | AGC, Inc. | 33,192 | ||||||
| 696 | Allegion PLC | 66,190 | ||||||
| 1,075 | Assa Abloy AB Class B | 21,773 | ||||||
| 2,707 | Carrier Global Corp. | 105,898 | ||||||
| 3,299 | Cie de Saint-Gobain | 132,876 | ||||||
| 1,121 | Fortune Brands Home & Security, Inc. | 68,863 | ||||||
| 161 | Geberit AG | 74,389 | ||||||
| 1,760 | Johnson Controls International PLC | 95,287 | ||||||
| 529 | Kingspan Group PLC | 29,951 | ||||||
| 794 | Lennox International, Inc. | 190,655 | ||||||
| 1,685 | Lixil Corp. | 29,301 | ||||||
| 5,174 | Masco Corp. | 263,202 | ||||||
| 6,008 | Nibe Industrier AB Class B | 56,263 | ||||||
| 2,425 | Owens Corning | 198,195 | ||||||
| 100 | Rockwool A/S | 20,584 | ||||||
| 396 | Trane Technologies PLC | 61,012 | ||||||
|
|
|
|||||||
| 1,523,048 | ||||||||
|
|
|
|||||||
| Capital Markets – 0.3% | ||||||||
| 2,433 | 3i Group PLC | 34,248 | ||||||
| 32,235 | abrdn PLC | 54,782 | ||||||
| 730 | Ameriprise Financial, Inc. | 195,647 | ||||||
| 938 | ASX Ltd. | 49,932 | ||||||
| 233 | BlackRock, Inc. | 155,269 | ||||||
| 3,114 | Blackstone, Inc. | 292,529 | ||||||
| 1,888 | Brookfield Asset Management, Inc. Class A | 90,824 | ||||||
| 462 | Cboe Global Markets, Inc. | 54,502 | ||||||
| 526 | CME Group, Inc. | 102,891 | ||||||
| 758 | Coinbase Global, Inc. Class A* | 50,634 | ||||||
| 7,380 | Daiwa Securities Group, Inc. | 32,215 | ||||||
| 8,566 | Deutsche Bank AG | 71,465 | ||||||
| 407 | Deutsche Boerse AG | 68,813 | ||||||
| 2,099 | EQT AB | 47,013 | ||||||
| 320 | Euronext NV(a) | 23,649 | ||||||
| 744 | FactSet Research Systems, Inc. | 322,405 | ||||||
| 1,972 | Franklin Resources, Inc. | 51,410 | ||||||
| 11,418 | Hargreaves Lansdown PLC | 108,096 | ||||||
| 3,279 | Hong Kong Exchanges & Clearing Ltd. | 132,126 | ||||||
| 1,471 | IGM Financial, Inc. | 40,041 | ||||||
| 1,224 | Intercontinental Exchange, Inc. | 123,440 | ||||||
| 9,387 | Invesco Ltd. | 154,604 | ||||||
| 2,804 | KKR & Co., Inc. | 141,770 | ||||||
| 447 | London Stock Exchange Group PLC | 41,929 | ||||||
| 99 | LPL Financial Holdings, Inc. | 21,912 | ||||||
| 888 | Macquarie Group Ltd. | 106,252 | ||||||
| 55 | MarketAxess Holdings, Inc. | 13,672 | ||||||
|
|
|
|||||||
| 26 | The accompanying notes are an integral part of these financial statements. |
GOLDMAN SACHS GLOBAL MANAGED BETA FUND
| Shares | Description | Value |
||||||
| Common Stocks – (continued) | ||||||||
| Capital Markets – (continued) | ||||||||
| 1,423 | Moody’s Corp. | $ | 404,872 | |||||
| 4,469 | Morgan Stanley | 380,848 | ||||||
| 119 | MSCI, Inc. Class A | 53,460 | ||||||
| 2,106 | Nasdaq, Inc. | 125,370 | ||||||
| 4,853 | Nomura Holdings, Inc. | 17,572 | ||||||
| 594 | Northern Trust Corp. | 56,484 | ||||||
| 367 | Onex Corp. | 18,150 | ||||||
| 160 | Partners Group Holding AG | 154,441 | ||||||
| 842 | Raymond James Financial, Inc. | 87,880 | ||||||
| 747 | S&P Global, Inc. | 263,079 | ||||||
| 1,726 | SBI Holdings, Inc. | 33,916 | ||||||
| 645 | Schroders PLC | 20,064 | ||||||
| 1,766 | SEI Investments Co. | 96,600 | ||||||
| 27,688 | Singapore Exchange Ltd. | 187,891 | ||||||
| 1,810 | St. James’s Place PLC | 23,168 | ||||||
| 1,704 | State Street Corp. | 116,468 | ||||||
| 1,300 | T. Rowe Price Group, Inc. | 156,000 | ||||||
| 2,889 | The Bank of New York Mellon Corp. | 119,980 | ||||||
| 4,392 | The Carlyle Group, Inc. | 142,872 | ||||||
| 2,522 | The Charles Schwab Corp. | 178,936 | ||||||
| 395 | TMX Group Ltd. | 39,670 | ||||||
| 804 | Tradeweb Markets, Inc. Class A | 55,950 | ||||||
| 9,955 | UBS Group AG | 157,754 | ||||||
|
|
|
|||||||
| 5,473,495 | ||||||||
|
|
|
|||||||
| Chemicals – 0.2% | ||||||||
| 750 | Air Liquide SA | 93,985 | ||||||
| 281 | Air Products & Chemicals, Inc. | 70,938 | ||||||
| 404 | Akzo Nobel NV | 25,453 | ||||||
| 79 | Albemarle Corp. | 21,169 | ||||||
| 385 | Arkema SA | 32,502 | ||||||
| 770 | BASF SE | 32,570 | ||||||
| 359 | Celanese Corp. | 39,799 | ||||||
| 366 | CF Industries Holdings, Inc. | 37,866 | ||||||
| 330 | Chr Hansen Holding A/S | 19,228 | ||||||
| 2,186 | Corteva, Inc. | 134,286 | ||||||
| 1,824 | Covestro AG(a) | 54,997 | ||||||
| 937 | Croda International PLC | 73,034 | ||||||
| 1,675 | Dow, Inc. | 85,425 | ||||||
| 1,181 | DuPont de Nemours, Inc. | 65,711 | ||||||
| 859 | Eastman Chemical Co. | 78,169 | ||||||
| 383 | Ecolab, Inc. | 62,747 | ||||||
| 77 | EMS-Chemie Holding AG | 54,072 | ||||||
| 838 | Evonik Industries AG | 15,625 | ||||||
| 268 | FMC Corp. | 28,965 | ||||||
| 34 | Givaudan SA | 108,480 | ||||||
| 2,562 | ICL Group Ltd. | 24,464 | ||||||
| 274 | International Flavors & Fragrances, Inc. | 30,271 | ||||||
| 1,991 | Johnson Matthey PLC | 46,452 | ||||||
| 1,243 | JSR Corp. | 27,727 | ||||||
| 490 | Koninklijke DSM NV | 62,483 | ||||||
| 758 | Linde PLC | 214,408 | ||||||
| 171 | LyondellBasell Industries NV Class A | 14,193 | ||||||
| 13,513 | Mitsubishi Chemical Group Corp. | 70,943 | ||||||
| 2,221 | Nippon Sanso Holdings Corp. | 40,394 | ||||||
| 264 | Nitto Denko Corp. | 16,271 | ||||||
|
|
|
|||||||
| Common Stocks – (continued) | ||||||||
| Chemicals – (continued) | ||||||||
| 898 | Novozymes A/S Class B | 51,539 | ||||||
| 1,506 | Nutrien Ltd. | 138,256 | ||||||
| 580 | OCI NV | 21,775 | ||||||
| 391 | PPG Industries, Inc. | 49,649 | ||||||
| 831 | RPM International, Inc. | 77,416 | ||||||
| 271 | Shin-Etsu Chemical Co. Ltd. | 31,472 | ||||||
| 376 | Sika AG | 84,598 | ||||||
| 502 | Solvay SA | 40,525 | ||||||
| 15,186 | Sumitomo Chemical Co. Ltd. | 59,777 | ||||||
| 435 | Symrise AG | 45,516 | ||||||
| 3,590 | The Mosaic Co. | 193,393 | ||||||
| 921 | The Sherwin-Williams Co. | 213,764 | ||||||
| 2,308 | Tosoh Corp. | 29,842 | ||||||
| 680 | Umicore SA | 21,614 | ||||||
| 693 | Yara International ASA | 29,312 | ||||||
|
|
|
|||||||
| 2,771,075 | ||||||||
|
|
|
|||||||
| Commercial Services & Supplies – 0.1% | ||||||||
| 3,315 | Brambles Ltd. | 27,900 | ||||||
| 573 | Cintas Corp. | 233,119 | ||||||
| 306 | Copart, Inc.* | 36,613 | ||||||
| 1,156 | Dai Nippon Printing Co. Ltd. | 24,333 | ||||||
| 7,952 | Rentokil Initial PLC | 48,026 | ||||||
| 1,120 | Republic Services, Inc. Class A | 159,846 | ||||||
| 8,494 | Rollins, Inc. | 286,757 | ||||||
| 460 | Secom Co. Ltd. | 29,306 | ||||||
| 8,056 | Securitas AB Class B | 70,544 | ||||||
| 1,511 | Toppan, Inc. | 23,730 | ||||||
| 1,057 | Waste Connections, Inc. | 147,113 | ||||||
| 1,164 | Waste Management, Inc. | 196,751 | ||||||
|
|
|
|||||||
| 1,284,038 | ||||||||
|
|
|
|||||||
| Communications Equipment – 0.1% | ||||||||
| 952 | Arista Networks, Inc.* | 114,126 | ||||||
| 11,477 | Cisco Systems, Inc. | 513,251 | ||||||
| 707 | F5, Inc.* | 111,041 | ||||||
| 3,543 | Juniper Networks, Inc. | 100,692 | ||||||
| 645 | Motorola Solutions, Inc. | 157,000 | ||||||
| 14,930 | Nokia Oyj | 75,238 | ||||||
| 6,541 | Telefonaktiebolaget LM Ericsson Class B | 48,916 | ||||||
|
|
|
|||||||
| 1,120,264 | ||||||||
|
|
|
|||||||
| Construction & Engineering – 0.1% | ||||||||
| 3,201 | ACS Actividades de Construccion y Servicios SA | 71,317 | ||||||
| 878 | Bouygues SA | 25,791 | ||||||
| 1,712 | Eiffage SA | 150,579 | ||||||
| 1,279 | Ferrovial SA | 32,071 | ||||||
| 2,133 | Kajima Corp. | 22,445 | ||||||
| 2,419 | Obayashi Corp. | 16,731 | ||||||
| 3,125 | Shimizu Corp. | 17,136 | ||||||
| 1,301 | Skanska AB Class B | 19,219 | ||||||
| 1,151 | Taisei Corp. | 34,898 | ||||||
| 1,724 | Vinci SA | 159,045 | ||||||
| 3,004 | WSP Global, Inc. | 357,982 | ||||||
|
|
|
|||||||
| 907,214 | ||||||||
|
|
|
|||||||
| The accompanying notes are an integral part of these financial statements. | 27 |
GOLDMAN SACHS GLOBAL MANAGED BETA FUND
Schedule of Investments (continued)
August 31, 2022
| Shares | Description | Value |
||||||
| Common Stocks – (continued) | ||||||||
| Construction Materials – 0.0% | ||||||||
| 1,432 | CRH PLC | $ | 52,880 | |||||
| 1,364 | HeidelbergCement AG | 61,595 | ||||||
| 2,545 | Holcim Ltd.* | 112,808 | ||||||
| 2,086 | James Hardie Industries PLC | 47,280 | ||||||
| 139 | Martin Marietta Materials, Inc. | 48,332 | ||||||
| 244 | Vulcan Materials Co. | 40,624 | ||||||
|
|
|
|||||||
| 363,519 | ||||||||
|
|
|
|||||||
| Consumer Finance – 0.1% | ||||||||
| 4,672 | Ally Financial, Inc. | 155,110 | ||||||
| 1,675 | American Express Co. | 254,600 | ||||||
| 2,011 | Capital One Financial Corp. | 212,804 | ||||||
| 1,855 | Discover Financial Services | 186,412 | ||||||
| 5,706 | Synchrony Financial | 186,872 | ||||||
|
|
|
|||||||
| 995,798 | ||||||||
|
|
|
|||||||
| Containers & Packaging – 0.0% | ||||||||
| 3,871 | Amcor PLC | 46,491 | ||||||
| 280 | Avery Dennison Corp. | 51,414 | ||||||
| 632 | Ball Corp. | 35,272 | ||||||
| 591 | CCL Industries, Inc. Class B | 28,989 | ||||||
| 567 | Crown Holdings, Inc. | 51,364 | ||||||
| 2,711 | International Paper Co. | 112,832 | ||||||
| 296 | Packaging Corp. of America | 40,528 | ||||||
| 672 | Sealed Air Corp. | 36,160 | ||||||
| 923 | Smurfit Kappa Group PLC | 30,948 | ||||||
| 3,985 | Westrock Co. | 161,751 | ||||||
|
|
|
|||||||
| 595,749 | ||||||||
|
|
|
|||||||
| Distributors – 0.1% | ||||||||
| 220 | D’ieteren Group | 33,165 | ||||||
| 2,228 | Genuine Parts Co. | 347,590 | ||||||
| 6,659 | LKQ Corp. | 354,392 | ||||||
| 683 | Pool Corp. | 231,667 | ||||||
|
|
|
|||||||
| 966,814 | ||||||||
|
|
|
|||||||
| Diversified Consumer Services – 0.0% | ||||||||
| 1,216 | IDP Education Ltd. | 23,939 | ||||||
|
|
|
|||||||
| Diversified Financial Services – 0.1% | ||||||||
| 455 | Apollo Global Management, Inc. | 25,289 | ||||||
| 4,442 | Berkshire Hathaway, Inc. Class B* | 1,247,314 | ||||||
| 1,195 | Eurazeo SE | 71,365 | ||||||
| 342 | Groupe Bruxelles Lambert SA | 25,854 | ||||||
| 1,495 | Industrivarden AB Class A | 33,132 | ||||||
| 1,446 | Industrivarden AB Class C | 31,722 | ||||||
| 2,027 | Investor AB Class A | 33,690 | ||||||
| 7,320 | Investor AB Class B | 115,372 | ||||||
| 1,189 | Kinnevik AB Class B* | 16,921 | ||||||
| 696 | L E Lundbergforetagen AB Class B | 28,746 | ||||||
| 3,871 | Mitsubishi HC Capital, Inc. | 18,760 | ||||||
| 4,094 | ORIX Corp. | 67,295 | ||||||
| 290 | Sofina SA | 58,132 | ||||||
| 195 | Wendel SE | 15,321 | ||||||
|
|
|
|||||||
| 1,788,913 | ||||||||
|
|
|
|||||||
| Common Stocks – (continued) | ||||||||
| Diversified Telecommunication Services – 0.2% | ||||||||
| 19,367 | AT&T, Inc. | 339,697 | ||||||
| 1,043 | BCE, Inc. | 50,333 | ||||||
| 7,991 | BT Group PLC | 13,979 | ||||||
| 427 | Cellnex Telecom SA(a) | 16,628 | ||||||
| 11,214 | Deutsche Telekom AG | 211,353 | ||||||
| 1,376 | Elisa Oyj | 73,586 | ||||||
| 37,703 | HKT Trust & HKT Ltd. | 50,582 | ||||||
| 3,075 | Infrastrutture Wireless Italiane SpA(a) | 28,499 | ||||||
| 24,369 | Koninklijke KPN NV | 77,544 | ||||||
| 8,376 | Liberty Global PLC Class A* | 169,195 | ||||||
| 8,485 | Liberty Global PLC Class C* | 180,815 | ||||||
| 17,204 | Lumen Technologies, Inc. | 171,352 | ||||||
| 10,490 | Nippon Telegraph & Telephone Corp. | 284,324 | ||||||
| 5,570 | Orange SA | 56,409 | ||||||
| 1,116 | Proximus SADP | 14,206 | ||||||
| 31,550 | Singapore Telecommunications Ltd. | 59,272 | ||||||
| 14,275 | Spark New Zealand Ltd. | 47,220 | ||||||
| 153 | Swisscom AG | 79,106 | ||||||
| 18,497 | Telefonica SA | 76,337 | ||||||
| 3,393 | Telenor ASA | 37,130 | ||||||
| 19,695 | Telia Co. AB | 69,321 | ||||||
| 25,333 | Telstra Corp. Ltd. | 68,507 | ||||||
| 3,004 | TELUS Corp. | 67,658 | ||||||
| 1,866 | United Internet AG | 42,210 | ||||||
| 8,704 | Verizon Communications, Inc. | 363,914 | ||||||
|
|
|
|||||||
| 2,649,177 | ||||||||
|
|
|
|||||||
| Electric Utilities – 0.2% | ||||||||
| 986 | Alliant Energy Corp. | 60,185 | ||||||
| 1,017 | American Electric Power Co., Inc. | 101,903 | ||||||
| 4,683 | Chubu Electric Power Co., Inc. | 47,621 | ||||||
| 3,877 | CK Infrastructure Holdings Ltd. | 23,576 | ||||||
| 3,420 | CLP Holdings Ltd. | 29,468 | ||||||
| 822 | Constellation Energy Corp. | 67,067 | ||||||
| 1,760 | Duke Energy Corp. | 188,162 | ||||||
| 1,053 | Edison International | 71,362 | ||||||
| 444 | Elia Group SA | 64,500 | ||||||
| 1,295 | Emera, Inc. | 59,921 | ||||||
| 1,399 | Endesa SA | 23,996 | ||||||
| 5,906 | Enel SpA | 27,753 | ||||||
| 523 | Entergy Corp. | 60,302 | ||||||
| 1,289 | Evergy, Inc. | 88,335 | ||||||
| 578 | Eversource Energy | 51,841 | ||||||
| 3,192 | Exelon Corp. | 140,161 | ||||||
| 2,378 | FirstEnergy Corp. | 94,050 | ||||||
| 1,339 | Fortis, Inc. | 59,072 | ||||||
| 32,706 | HK Electric Investments & HK Electric Investments Ltd. | 27,294 | ||||||
| 2,391 | Hydro One Ltd.(a) | 64,738 | ||||||
| 8,869 | Iberdrola SA | 92,341 | ||||||
| 2,363 | NextEra Energy, Inc. | 200,997 | ||||||
| 9,501 | NRG Energy, Inc. | 392,201 | ||||||
| 6,876 | Origin Energy Ltd. | 29,285 | ||||||
| 9,797 | Power Assets Holdings Ltd. | 58,598 | ||||||
| 1,945 | PPL Corp. | 56,561 | ||||||
| 3,207 | Red Electrica Corp. SA | 58,633 | ||||||
|
|
|
|||||||
| 28 | The accompanying notes are an integral part of these financial statements. |
GOLDMAN SACHS GLOBAL MANAGED BETA FUND
| Shares | Description | Value |
||||||
| Common Stocks – (continued) | ||||||||
| Electric Utilities – (continued) | ||||||||
| 3,917 | SSE PLC | $ | 75,060 | |||||
| 6,654 | Terna – Rete Elettrica Nazionale | 47,305 | ||||||
| 3,155 | The Kansai Electric Power Co., Inc. | 30,577 | ||||||
| 2,090 | The Southern Co. | 161,076 | ||||||
| 619 | Verbund AG | 59,150 | ||||||
| 945 | Xcel Energy, Inc. | 70,166 | ||||||
|
|
|
|||||||
| 2,683,257 | ||||||||
|
|
|
|||||||
| Electrical Equipment – 0.0% | ||||||||
| 3,678 | ABB Ltd. | 101,379 | ||||||
| 580 | AMETEK, Inc. | 69,693 | ||||||
| 1,115 | Eaton Corp. PLC | 152,354 | ||||||
| 899 | Emerson Electric Co. | 73,484 | ||||||
| 614 | Legrand SA | 44,426 | ||||||
| 2,971 | Mitsubishi Electric Corp. | 30,037 | ||||||
| 246 | Nidec Corp. | 16,342 | ||||||
| 806 | Prysmian SpA | 24,730 | ||||||
| 234 | Rockwell Automation, Inc. | 55,444 | ||||||
| 1,076 | Schneider Electric SE | 127,890 | ||||||
| 1,259 | Sensata Technologies Holding PLC | 50,713 | ||||||
| 2,165 | Siemens Energy AG* | 31,846 | ||||||
|
|
|
|||||||
| 778,338 | ||||||||
|
|
|
|||||||
| Electronic Equipment, Instruments & Components – 0.1% | ||||||||
| 1,540 | Amphenol Corp. Class A | 113,236 | ||||||
| 1,702 | Arrow Electronics, Inc.* | 178,387 | ||||||
| 496 | Azbil Corp. | 14,133 | ||||||
| 537 | CDW Corp. | 91,666 | ||||||
| 601 | Cognex Corp. | 25,308 | ||||||
| 2,163 | Corning, Inc. | 74,234 | ||||||
| 1,216 | Halma PLC | 29,251 | ||||||
| 4,284 | Hexagon AB Class B | 43,778 | ||||||
| 200 | Hirose Electric Co. Ltd. | 28,339 | ||||||
| 807 | Ibiden Co. Ltd. | 25,613 | ||||||
| 209 | Keyence Corp. | 78,474 | ||||||
| 1,440 | Keysight Technologies, Inc.* | 236,002 | ||||||
| 634 | Kyocera Corp. | 35,240 | ||||||
| 738 | Murata Manufacturing Co. Ltd. | 39,739 | ||||||
| 626 | Omron Corp. | 32,944 | ||||||
| 579 | TE Connectivity Ltd. | 73,076 | ||||||
| 144 | Teledyne Technologies, Inc.* | 53,044 | ||||||
| 820 | Trimble, Inc.* | 51,865 | ||||||
| 391 | Zebra Technologies Corp. Class A* | 117,941 | ||||||
|
|
|
|||||||
| 1,342,270 | ||||||||
|
|
|
|||||||
| Energy Equipment & Services – 0.0% | ||||||||
| 3,643 | Baker Hughes Co. Class A | 92,022 | ||||||
| 2,273 | Halliburton Co. | 68,486 | ||||||
| 2,574 | Schlumberger N.V | 98,198 | ||||||
| 4,196 | Tenaris SA | 57,399 | ||||||
|
|
|
|||||||
| 316,105 | ||||||||
|
|
|
|||||||
| Entertainment – 0.1% | ||||||||
| 608 | Activision Blizzard, Inc. | 47,722 | ||||||
| 32,886 | Bollore SA | 157,155 | ||||||
| 3,070 | Capcom Co. Ltd. | 83,795 | ||||||
|
|
|
|||||||
| Common Stocks – (continued) | ||||||||
| Entertainment – (continued) | ||||||||
| 630 | Electronic Arts, Inc. | 79,928 | ||||||
| 479 | Konami Group Corp. | 24,309 | ||||||
| 1,313 | Liberty Media Corp.-Liberty Formula One Class C* | 83,612 | ||||||
| 295 | Live Nation Entertainment, Inc.* | 26,656 | ||||||
| 396 | Netflix, Inc.* | 88,530 | ||||||
| 106 | Nintendo Co. Ltd. | 43,391 | ||||||
| 444 | Roku, Inc.* | 30,192 | ||||||
| 1,496 | Square Enix Holdings Co. Ltd. | 64,958 | ||||||
| 253 | Take-Two Interactive Software, Inc.* | 31,008 | ||||||
| 1,380 | The Walt Disney Co.* | 154,670 | ||||||
| 397 | Toho Co. Ltd. | 15,077 | ||||||
| 1,312 | Ubisoft Entertainment SA* | 60,503 | ||||||
| 1,211 | Universal Music Group NV | 24,048 | ||||||
| 9,887 | Warner Bros Discovery, Inc.* | 130,904 | ||||||
|
|
|
|||||||
| 1,146,458 | ||||||||
|
|
|
|||||||
| Equity Real Estate Investment Trusts (REITs) – 0.2% | ||||||||
| 526 | Alexandria Real Estate Equities, Inc. | 80,688 | ||||||
| 978 | American Homes 4 Rent Class A | 34,778 | ||||||
| 586 | American Tower Corp. | 148,873 | ||||||
| 526 | AvalonBay Communities, Inc. | 105,679 | ||||||
| 629 | Boston Properties, Inc. | 49,961 | ||||||
| 1,098 | Camden Property Trust | 141,104 | ||||||
| 814 | Canadian Apartment Properties REIT | 27,686 | ||||||
| 23,645 | CapitaLand Integrated Commercial Trust | 34,972 | ||||||
| 645 | Crown Castle, Inc. | 110,185 | ||||||
| 23 | Daiwa House REIT Investment Corp. | 53,171 | ||||||
| 6,711 | Dexus | 39,695 | ||||||
| 921 | Digital Realty Trust, Inc. | 113,863 | ||||||
| 2,429 | Duke Realty Corp. | 142,947 | ||||||
| 138 | Equinix, Inc. | 90,717 | ||||||
| 1,547 | Equity LifeStyle Properties, Inc. | 108,445 | ||||||
| 1,384 | Equity Residential | 101,281 | ||||||
| 227 | Essex Property Trust, Inc. | 60,169 | ||||||
| 749 | Extra Space Storage, Inc. | 148,849 | ||||||
| 192 | Gecina SA | 17,088 | ||||||
| 21 | GLP J-REIT | 25,582 | ||||||
| 6,503 | Goodman Group | 86,477 | ||||||
| 1,184 | Healthpeak Properties, Inc. | 31,080 | ||||||
| 4,826 | Host Hotels & Resorts, Inc. | 85,758 | ||||||
| 2,688 | Invitation Homes, Inc. | 97,521 | ||||||
| 2,073 | Iron Mountain, Inc. | 109,061 | ||||||
| 24 | Japan Metropolitan Fund Investment Corp. | 19,060 | ||||||
| 6 | Japan Real Estate Investment Corp. | 27,789 | ||||||
| 820 | Kimco Realty Corp. | 17,286 | ||||||
| 948 | Klepierre SA* | 19,446 | ||||||
| 4,158 | Land Securities Group PLC | 31,361 | ||||||
| 3,020 | Link REIT | 23,372 | ||||||
| 1,154 | Medical Properties Trust, Inc. | 16,860 | ||||||
| 773 | Mid-America Apartment Communities, Inc. | 128,063 | ||||||
| 6 | Nippon Building Fund, Inc. | 29,886 | ||||||
| 21 | Nippon Prologis REIT, Inc. | 52,830 | ||||||
|
|
|
|||||||
| The accompanying notes are an integral part of these financial statements. | 29 |
GOLDMAN SACHS GLOBAL MANAGED BETA FUND
Schedule of Investments (continued)
August 31, 2022
| Shares | Description | Value |
||||||
| Common Stocks – (continued) | ||||||||
| Equity Real Estate Investment Trusts (REITs) – (continued) | ||||||||
| 35 | Nomura Real Estate Master Fund, Inc. | $ | 42,807 | |||||
| 1,539 | Prologis, Inc. | 191,621 | ||||||
| 604 | Public Storage | 199,821 | ||||||
| 1,237 | Realty Income Corp. | 84,462 | ||||||
| 1,116 | Regency Centers Corp. | 67,897 | ||||||
| 222 | SBA Communications Corp. | 72,206 | ||||||
| 16,689 | Scentre Group | 33,166 | ||||||
| 6,568 | Segro PLC | 71,676 | ||||||
| 523 | Simon Property Group, Inc. | 53,336 | ||||||
| 5,994 | Stockland | 14,744 | ||||||
| 764 | Sun Communities, Inc. | 117,434 | ||||||
| 2,846 | The British Land Co. PLC | 14,196 | ||||||
| 9,861 | The GPT Group | 28,099 | ||||||
| 1,656 | UDR, Inc. | 74,305 | ||||||
| 852 | Ventas, Inc. | 40,777 | ||||||
| 2,055 | VICI Properties, Inc. | 67,794 | ||||||
| 24,768 | Vicinity Centres | 32,427 | ||||||
| 3,006 | Vornado Realty Trust | 78,817 | ||||||
| 1,217 | Warehouses De Pauw CVA | 37,030 | ||||||
| 815 | Welltower, Inc. | 62,470 | ||||||
| 8,245 | Weyerhaeuser Co. | 281,649 | ||||||
| 594 | WP Carey, Inc. | 49,914 | ||||||
|
|
|
|||||||
| 4,128,231 | ||||||||
|
|
|
|||||||
| Food & Staples Retailing – 0.3% | ||||||||
| 2,009 | Aeon Co. Ltd. | 39,187 | ||||||
| 3,664 | Alimentation Couche-Tard, Inc. | 157,457 | ||||||
| 8,538 | Carrefour SA | 142,503 | ||||||
| 17,628 | Coles Group Ltd. | 210,993 | ||||||
| 1,393 | Costco Wholesale Corp. | 727,285 | ||||||
| 11,664 | Empire Co. Ltd. Class A | 332,242 | ||||||
| 9,350 | Endeavour Group Ltd. | 46,271 | ||||||
| 1,837 | George Weston Ltd. | 210,017 | ||||||
| 3,143 | HelloFresh SE* | 75,042 | ||||||
| 61,641 | J Sainsbury PLC | 145,495 | ||||||
| 12,025 | Jeronimo Martins SGPS SA | 266,615 | ||||||
| 2,127 | Kesko Oyj Class B | 44,747 | ||||||
| 14,743 | Koninklijke Ahold Delhaize NV | 405,533 | ||||||
| 3,797 | Loblaw Cos. Ltd. | 335,568 | ||||||
| 1,273 | Metro, Inc. | 66,958 | ||||||
| 3,436 | Seven & i Holdings Co. Ltd. | 136,497 | ||||||
| 3,184 | Sysco Corp. | 261,788 | ||||||
| 35,314 | Tesco PLC | 101,996 | ||||||
| 13,204 | The Kroger Co. | 633,000 | ||||||
| 4,897 | Walgreens Boots Alliance, Inc. | 171,689 | ||||||
| 6,062 | Walmart, Inc. | 803,518 | ||||||
| 6,870 | Welcia Holdings Co. Ltd. | 143,881 | ||||||
| 10,486 | Woolworths Group Ltd. | 258,509 | ||||||
|
|
|
|||||||
| 5,716,791 | ||||||||
|
|
|
|||||||
| Food Products – 0.2% | ||||||||
| 3,853 | Ajinomoto Co., Inc. | 106,496 | ||||||
| 3,717 | Archer-Daniels-Midland Co. | 326,687 | ||||||
| 3,372 | Associated British Foods PLC | 59,553 | ||||||
| 16 | Barry Callebaut AG | 32,738 | ||||||
| 1,164 | Bunge Ltd. | 115,434 | ||||||
|
|
|
|||||||
| Common Stocks – (continued) | ||||||||
| Food Products – (continued) | ||||||||
| 1,425 | Campbell Soup Co. | 71,791 | ||||||
| 6 | Chocoladefabriken Lindt & Spruengli AG | 161,833 | ||||||
| 2,452 | Conagra Brands, Inc. | 84,300 | ||||||
| 1,828 | Danone SA | 96,190 | ||||||
| 3,865 | General Mills, Inc. | 296,832 | ||||||
| 1,685 | Hormel Foods Corp. | 84,722 | ||||||
| 3,735 | JDE Peet’s NV | 115,170 | ||||||
| 1,263 | Kellogg Co. | 91,871 | ||||||
| 253 | Kerry Group PLC Class A | 26,090 | ||||||
| 531 | Kikkoman Corp. | 32,470 | ||||||
| 957 | McCormick & Co., Inc. | 80,455 | ||||||
| 646 | MEIJI Holdings Co. Ltd. | 30,775 | ||||||
| 2,812 | Mondelez International, Inc. | 173,950 | ||||||
| 2,164 | Mowi ASA | 44,366 | ||||||
| 6,190 | Nestle SA | 724,372 | ||||||
| 3,633 | Nisshin Seifun Group, Inc. | 40,885 | ||||||
| 396 | Nissin Foods Holdings Co. Ltd. | 28,332 | ||||||
| 3,767 | Orkla ASA | 31,544 | ||||||
| 523 | Salmar ASA | 34,585 | ||||||
| 1,103 | Saputo, Inc. | 28,009 | ||||||
| 1,297 | The Hershey Co. | 291,397 | ||||||
| 1,587 | The J.M. Smucker Co. | 222,164 | ||||||
| 6,058 | The Kraft Heinz Co. | 226,569 | ||||||
| 4,132 | Tyson Foods, Inc. Class A | 311,470 | ||||||
| 176,534 | WH Group Ltd.(a) | 120,277 | ||||||
| 700 | Yakult Honsha Co. Ltd. | 41,402 | ||||||
|
|
|
|||||||
| 4,132,729 | ||||||||
|
|
|
|||||||
| Gas Utilities – 0.0% | ||||||||
| 2,615 | AltaGas Ltd. | 56,388 | ||||||
| 8,739 | APA Group | 65,899 | ||||||
| 423 | Atmos Energy Corp. | 47,960 | ||||||
| 1,419 | Enagas SA | 25,911 | ||||||
| 22,723 | Hong Kong & China Gas Co. Ltd. | 22,402 | ||||||
| 2,240 | Naturgy Energy Group SA | 61,767 | ||||||
| 2,254 | Osaka Gas Co. Ltd. | 37,965 | ||||||
| 8,515 | Snam SpA | 40,471 | ||||||
| 1,903 | Tokyo Gas Co. Ltd. | 35,703 | ||||||
| 6,732 | UGI Corp. | 265,914 | ||||||
|
|
|
|||||||
| 660,380 | ||||||||
|
|
|
|||||||
| Health Care Equipment & Supplies – 0.2% | ||||||||
| 3,607 | Abbott Laboratories | 370,259 | ||||||
| 580 | ABIOMED, Inc.* | 150,382 | ||||||
| 456 | Alcon, Inc. | 30,024 | ||||||
| 377 | Align Technology, Inc.* | 91,875 | ||||||
| 1,170 | Asahi Intecc Co. Ltd. | 20,811 | ||||||
| 1,106 | Baxter International, Inc. | 63,551 | ||||||
| 445 | Becton Dickinson & Co. | 112,327 | ||||||
| 1,057 | BioMerieux | 96,662 | ||||||
| 2,004 | Boston Scientific Corp.* | 80,781 | ||||||
| 311 | Carl Zeiss Meditec AG | 38,707 | ||||||
| 1,054 | Cochlear Ltd. | 153,438 | ||||||
| 904 | Coloplast A/S Class B | 103,265 | ||||||
| 884 | Dentsply Sirona, Inc. | 28,969 | ||||||
|
|
|
|||||||
| 30 | The accompanying notes are an integral part of these financial statements. |
GOLDMAN SACHS GLOBAL MANAGED BETA FUND
| Shares | Description | Value |
||||||
| Common Stocks – (continued) | ||||||||
| Health Care Equipment & Supplies – (continued) | ||||||||
| 824 | DexCom, Inc.* | $ | 67,741 | |||||
| 3,378 | Edwards Lifesciences Corp.* | 304,358 | ||||||
| 6,593 | Fisher & Paykel Healthcare Corp. Ltd. | 78,929 | ||||||
| 1,145 | Getinge AB Class B | 21,207 | ||||||
| 440 | GN Store Nord A/S | 12,444 | ||||||
| 1,754 | Hologic, Inc.* | 118,500 | ||||||
| 2,216 | Hoya Corp. | 225,981 | ||||||
| 861 | IDEXX Laboratories, Inc.* | 299,301 | ||||||
| 474 | Intuitive Surgical, Inc.* | 97,521 | ||||||
| 4,146 | Koninklijke Philips NV | 68,857 | ||||||
| 560 | Masimo Corp.* | 82,258 | ||||||
| 1,250 | Medtronic PLC | 109,900 | ||||||
| 853 | Novocure Ltd.* | 70,057 | ||||||
| 6,374 | Olympus Corp. | 135,749 | ||||||
| 963 | ResMed, Inc. | 211,783 | ||||||
| 1,103 | Siemens Healthineers AG(a) | 53,899 | ||||||
| 2,611 | Smith & Nephew PLC | 30,713 | ||||||
| 221 | Sonova Holding AG | 58,228 | ||||||
| 351 | STERIS PLC | 70,684 | ||||||
| 1,190 | Straumann Holding AG | 130,403 | ||||||
| 394 | Stryker Corp. | 80,849 | ||||||
| 669 | Sysmex Corp. | 40,894 | ||||||
| 107 | Teleflex, Inc. | 24,210 | ||||||
| 705 | Terumo Corp. | 22,632 | ||||||
| 180 | The Cooper Cos., Inc. | 51,739 | ||||||
| 332 | Zimmer Biomet Holdings, Inc. | 35,298 | ||||||
|
|
|
|||||||
| 3,845,186 | ||||||||
|
|
|
|||||||
| Health Care Providers & Services – 0.4% | ||||||||
| 1,678 | AmerisourceBergen Corp. | 245,928 | ||||||
| 1,671 | Cardinal Health, Inc. | 118,173 | ||||||
| 4,218 | Centene Corp.* | 378,523 | ||||||
| 1,735 | Cigna Corp. | 491,786 | ||||||
| 6,251 | CVS Health Corp. | 613,535 | ||||||
| 1,599 | DaVita, Inc.* | 136,379 | ||||||
| 889 | Elevance Health, Inc. | 431,263 | ||||||
| 2,155 | Fresenius Medical Care AG & Co. KGaA | 73,786 | ||||||
| 3,677 | Fresenius SE & Co. KGaA | 90,963 | ||||||
| 746 | HCA Healthcare, Inc. | 147,611 | ||||||
| 3,162 | Henry Schein, Inc.* | 232,122 | ||||||
| 432 | Humana, Inc. | 208,129 | ||||||
| 1,293 | Laboratory Corp. of America Holdings | 291,274 | ||||||
| 1,344 | McKesson Corp. | 493,248 | ||||||
| 489 | Molina Healthcare, Inc.* | 164,974 | ||||||
| 1,559 | Quest Diagnostics, Inc. | 195,358 | ||||||
| 588 | Ramsay Health Care Ltd. | 28,657 | ||||||
| 3,450 | Sonic Healthcare Ltd. | 79,781 | ||||||
| 2,930 | UnitedHealth Group, Inc. | 1,521,637 | ||||||
| 355 | Universal Health Services, Inc. Class B | 34,733 | ||||||
|
|
|
|||||||
| 5,977,860 | ||||||||
|
|
|
|||||||
| Health Care Technology – 0.0% | ||||||||
| 524 | M3, Inc. | 16,785 | ||||||
|
|
|
|||||||
| Common Stocks – (continued) | ||||||||
| Health Care Technology – (continued) | ||||||||
| 379 | Veeva Systems, Inc. Class A* | 75,542 | ||||||
|
|
|
|||||||
| 92,327 | ||||||||
|
|
|
|||||||
| Hotels, Restaurants & Leisure – 0.1% | ||||||||
| 915 | Aramark | 32,675 | ||||||
| 1,836 | Aristocrat Leisure Ltd. | 44,314 | ||||||
| 72 | Booking Holdings, Inc.* | 135,058 | ||||||
| 224 | Caesars Entertainment, Inc.* | 9,659 | ||||||
| 29 | Chipotle Mexican Grill, Inc.* | 46,307 | ||||||
| 7,402 | Compass Group PLC | 159,225 | ||||||
| 801 | Darden Restaurants, Inc. | 99,092 | ||||||
| 891 | Domino’s Pizza, Inc. | 331,327 | ||||||
| 935 | Entain PLC | 13,756 | ||||||
| 2,005 | Expedia Group, Inc.* | 205,813 | ||||||
| 392 | Hilton Worldwide Holdings, Inc. | 49,925 | ||||||
| 316 | InterContinental Hotels Group PLC | 17,154 | ||||||
| 6,142 | La Francaise des Jeux SAEM(a) | 199,211 | ||||||
| 290 | Marriott International, Inc. Class A | 44,585 | ||||||
| 1,278 | McDonald’s Corp. | 322,414 | ||||||
| 1,329 | McDonald’s Holdings Co. Japan Ltd. | 47,502 | ||||||
| 720 | MGM Resorts International | 23,501 | ||||||
| 374 | Oriental Land Co. Ltd. | 55,759 | ||||||
| 1,564 | Starbucks Corp. | 131,486 | ||||||
| 119 | Vail Resorts, Inc. | 26,737 | ||||||
| 2,750 | Yum! Brands, Inc. | 305,910 | ||||||
|
|
|
|||||||
| 2,301,410 | ||||||||
|
|
|
|||||||
| Household Durables – 0.1% | ||||||||
| 2,034 | Barratt Developments PLC | 10,070 | ||||||
| 356 | Berkeley Group Holdings PLC | 15,071 | ||||||
| 346 | D.R. Horton, Inc. | 24,618 | ||||||
| 833 | Electrolux AB Class B | 10,533 | ||||||
| 553 | Garmin Ltd. | 48,935 | ||||||
| 1,969 | Lennar Corp. Class A | 152,499 | ||||||
| 1,402 | Mohawk Industries, Inc.* | 154,725 | ||||||
| 735 | Newell Brands, Inc. | 13,120 | ||||||
| 25 | NVR, Inc.* | 103,501 | ||||||
| 2,743 | Panasonic Corp. | 22,258 | ||||||
| 937 | Persimmon PLC | 16,033 | ||||||
| 2,135 | PulteGroup, Inc. | 86,809 | ||||||
| 1,278 | SEB SA | 94,655 | ||||||
| 1,346 | Sekisui Chemical Co. Ltd. | 18,350 | ||||||
| 2,578 | Sekisui House Ltd. | 43,838 | ||||||
| 3,206 | Sharp Corp. | 22,950 | ||||||
| 2,749 | Sony Group Corp. | 218,555 | ||||||
| 14,371 | Taylor Wimpey PLC | 18,029 | ||||||
| 688 | Whirlpool Corp. | 107,741 | ||||||
|
|
|
|||||||
| 1,182,290 | ||||||||
|
|
|
|||||||
| Household Products – 0.1% | ||||||||
| 1,266 | Church & Dwight Co., Inc. | 105,977 | ||||||
| 5,593 | Colgate-Palmolive Co. | 437,428 | ||||||
| 1,335 | Essity AB Class B | 29,615 | ||||||
| 565 | Henkel AG & Co. KGaA | 35,335 | ||||||
| 1,581 | Kimberly-Clark Corp. | 201,609 | ||||||
| 1,083 | Reckitt Benckiser Group PLC | 83,566 | ||||||
|
|
|
|||||||
| The accompanying notes are an integral part of these financial statements. | 31 |
GOLDMAN SACHS GLOBAL MANAGED BETA FUND
Schedule of Investments (continued)
August 31, 2022
| Shares | Description | Value |
||||||
| Common Stocks – (continued) | ||||||||
| Household Products – (continued) | ||||||||
| 1,253 | The Clorox Co. | $ | 180,858 | |||||
| 5,715 | The Procter & Gamble Co. | 788,327 | ||||||
| 1,362 | Unicharm Corp. | 47,332 | ||||||
|
|
|
|||||||
| 1,910,047 | ||||||||
|
|
|
|||||||
| Independent Power and Renewable Electricity Producers – 0.0% | ||||||||
| 717 | Northland Power, Inc. | 24,545 | ||||||
| 4,627 | RWE AG | 176,647 | ||||||
| 954 | The AES Corp. | 24,280 | ||||||
| 560 | Uniper SE | 3,030 | ||||||
| 7,879 | Vistra Corp. | 195,005 | ||||||
|
|
|
|||||||
| 423,507 | ||||||||
|
|
|
|||||||
| Industrial Conglomerates – 0.1% | ||||||||
| 1,232 | 3M Co. | 153,199 | ||||||
| 26,389 | CK Hutchison Holdings Ltd. | 170,411 | ||||||
| 1,153 | DCC PLC | 66,360 | ||||||
| 1,782 | General Electric Co. | 130,870 | ||||||
| 3,116 | Hitachi Ltd. | 155,682 | ||||||
| 590 | Honeywell International, Inc. | 111,717 | ||||||
| 2,179 | Jardine Matheson Holdings Ltd. | 115,556 | ||||||
| 6,791 | Keppel Corp. Ltd. | 35,269 | ||||||
| 1,160 | Lifco AB Class B | 18,018 | ||||||
| 25,432 | Melrose Industries PLC | 40,133 | ||||||
| 667 | Siemens AG | 67,563 | ||||||
| 975 | Smiths Group PLC | 16,844 | ||||||
|
|
|
|||||||
| 1,081,622 | ||||||||
|
|
|
|||||||
| Insurance – 0.4% | ||||||||
| 8,367 | Admiral Group PLC | 205,818 | ||||||
| 6,927 | Aegon NV | 30,957 | ||||||
| 2,561 | Aflac, Inc. | 152,175 | ||||||
| 1,622 | Ageas SA | 65,813 | ||||||
| 13,599 | AIA Group Ltd. | 130,839 | ||||||
| 109 | Alleghany Corp.* | 91,689 | ||||||
| 1,201 | Allianz SE | 203,013 | ||||||
| 447 | American Financial Group, Inc. | 57,073 | ||||||
| 2,554 | American International Group, Inc. | 132,169 | ||||||
| 1,395 | Aon PLC, Class A | 389,568 | ||||||
| 3,046 | Arch Capital Group Ltd.* | 139,263 | ||||||
| 1,249 | Arthur J. Gallagher & Co. | 226,781 | ||||||
| 7,809 | Assicurazioni Generali SpA | 114,533 | ||||||
| 525 | Assurant, Inc. | 83,207 | ||||||
| 18,616 | Aviva PLC | 90,311 | ||||||
| 6,037 | AXA SA | 142,181 | ||||||
| 475 | Baloise Holding AG | 68,551 | ||||||
| 1,605 | Brown & Brown, Inc. | 101,179 | ||||||
| 1,006 | Chubb Ltd. | 190,184 | ||||||
| 659 | Cincinnati Financial Corp. | 63,897 | ||||||
| 2,532 | Dai-ichi Life Holdings, Inc. | 43,748 | ||||||
| 260 | Erie Indemnity Co. Class A | 55,882 | ||||||
| 412 | Everest Re Group Ltd. | 110,849 | ||||||
| 311 | Fairfax Financial Holdings Ltd. | 155,042 | ||||||
| 2,674 | Fidelity National Financial, Inc. | 104,553 | ||||||
| 4,181 | Gjensidige Forsikring ASA | 84,843 | ||||||
| 520 | Globe Life, Inc. | 50,539 | ||||||
|
|
|
|||||||
| Common Stocks – (continued) | ||||||||
| Insurance – (continued) | ||||||||
| 4,402 | Great-West Lifeco, Inc. | 103,401 | ||||||
| 548 | Hannover Rueck SE | 80,768 | ||||||
| 3,425 | iA Financial Corp., Inc. | 183,983 | ||||||
| 7,993 | Insurance Australia Group Ltd. | 25,257 | ||||||
| 739 | Intact Financial Corp. | 107,050 | ||||||
| 8,448 | Japan Post Holdings Co. Ltd. | 58,281 | ||||||
| 1,156 | Japan Post Insurance Co. Ltd. | 17,707 | ||||||
| 34,153 | Legal & General Group PLC | 100,036 | ||||||
| 2,384 | Lincoln National Corp. | 109,807 | ||||||
| 1,500 | Loews Corp. | 82,965 | ||||||
| 7,202 | Manulife Financial Corp. | 124,589 | ||||||
| 64 | Markel Corp.* | 76,423 | ||||||
| 1,749 | Marsh & McLennan Cos., Inc. | 282,236 | ||||||
| 17,262 | Medibank Pvt. Ltd. | 43,482 | ||||||
| 3,382 | MetLife, Inc. | 217,564 | ||||||
| 1,693 | MS&AD Insurance Group Holdings, Inc. | 50,512 | ||||||
| 371 | Muenchener Rueckversicherungs-Gesellschaft AG in Muenchen | 88,640 | ||||||
| 2,761 | NN Group NV | 113,471 | ||||||
| 2,999 | Phoenix Group Holdings PLC | 20,947 | ||||||
| 8,327 | Poste Italiane SpA(a) | 66,549 | ||||||
| 8,464 | Power Corp. of Canada | 217,634 | ||||||
| 1,436 | Principal Financial Group, Inc. | 107,355 | ||||||
| 1,211 | Prudential Financial, Inc. | 115,953 | ||||||
| 2,302 | Prudential PLC | 24,160 | ||||||
| 2,604 | QBE Insurance Group Ltd. | 21,350 | ||||||
| 1,254 | Sampo Oyj Class A | 56,731 | ||||||
| 1,102 | Sompo Holdings, Inc. | 47,250 | ||||||
| 2,152 | Sun Life Financial, Inc. | 94,807 | ||||||
| 11,150 | Suncorp Group Ltd. | 82,346 | ||||||
| 237 | Swiss Life Holding AG | 123,874 | ||||||
| 554 | Swiss Re AG | 43,077 | ||||||
| 2,125 | The Allstate Corp. | 256,062 | ||||||
| 1,684 | The Hartford Financial Services Group, Inc. | 108,298 | ||||||
| 1,774 | The Progressive Corp. | 217,581 | ||||||
| 878 | The Travelers Cos., Inc. | 141,920 | ||||||
| 1,583 | Tokio Marine Holdings, Inc. | 87,729 | ||||||
| 1,794 | Tryg A/S | 40,537 | ||||||
| 876 | W.R. Berkley Corp. | 56,765 | ||||||
| 288 | Willis Towers Watson PLC | 59,567 | ||||||
| 358 | Zurich Insurance Group AG | 158,916 | ||||||
|
|
|
|||||||
| 7,300,237 | ||||||||
|
|
|
|||||||
| Interactive Media & Services – 0.3% | ||||||||
| 17,480 | Alphabet, Inc. Class A* | 1,891,686 | ||||||
| 17,540 | Alphabet, Inc. Class C* | 1,914,491 | ||||||
| 35,790 | Auto Trader Group PLC(a) | 270,239 | ||||||
| 163 | IAC, Inc.* | 10,476 | ||||||
| 706 | Match Group, Inc.* | 39,910 | ||||||
| 7,425 | Meta Platforms, Inc. Class A* | 1,209,755 | ||||||
| 4,556 | Pinterest, Inc. Class A* | 104,970 | ||||||
| 1,110 | REA Group Ltd. | 95,725 | ||||||
| 184 | Scout24 SE(a) | 10,601 | ||||||
| 790 | Twitter, Inc.* | 30,612 | ||||||
|
|
|
|||||||
| 5,578,465 | ||||||||
|
|
|
|||||||
| 32 | The accompanying notes are an integral part of these financial statements. |
GOLDMAN SACHS GLOBAL MANAGED BETA FUND
| Shares | Description | Value |
||||||
| Common Stocks – (continued) | ||||||||
| Internet & Direct Marketing Retail – 0.2% | ||||||||
| 26,260 | Amazon.com, Inc.* | $ | 3,328,980 | |||||
| 1,289 | Chewy, Inc. Class A* | 44,251 | ||||||
| 4,036 | eBay, Inc. | 178,109 | ||||||
| 1,240 | Etsy, Inc.* | 130,956 | ||||||
| 55 | MercadoLibre, Inc.* | 47,045 | ||||||
| 11,889 | Rakuten Group, Inc. | 57,700 | ||||||
| 2,629 | Wayfair, Inc. Class A* | 138,575 | ||||||
| 3,397 | Zalando SE*(a) | 78,650 | ||||||
| 8,637 | ZOZO, Inc. | 190,906 | ||||||
|
|
|
|||||||
| 4,195,172 | ||||||||
|
|
|
|||||||
| IT Services – 0.4% | ||||||||
| 2,441 | Accenture PLC Class A | 704,131 | ||||||
| 1,284 | Akamai Technologies, Inc.* | 115,920 | ||||||
| 1,106 | Automatic Data Processing, Inc. | 270,318 | ||||||
| 507 | Bechtle AG | 19,423 | ||||||
| 222 | Block, Inc.* | 15,298 | ||||||
| 619 | Broadridge Financial Solutions, Inc. | 105,954 | ||||||
| 1,025 | Capgemini SE | 177,097 | ||||||
| 1,896 | CGI, Inc.* | 150,138 | ||||||
| 559 | Cloudflare, Inc. Class A* | 34,977 | ||||||
| 4,900 | Cognizant Technology Solutions Corp. Class A | 309,533 | ||||||
| 3,517 | Computershare Ltd. | 58,656 | ||||||
| 654 | Edenred | 33,079 | ||||||
| 217 | EPAM Systems, Inc.* | 92,551 | ||||||
| 3,800 | Fidelity National Information Services, Inc. | 347,206 | ||||||
| 2,927 | Fiserv, Inc.* | 296,183 | ||||||
| 663 | FleetCor Technologies, Inc.* | 140,907 | ||||||
| 682 | Fujitsu Ltd. | 80,253 | ||||||
| 1,166 | Gartner, Inc.* | 332,683 | ||||||
| 2,396 | Global Payments, Inc. | 297,655 | ||||||
| 2,618 | GoDaddy, Inc. Class A* | 198,497 | ||||||
| 4,574 | International Business Machines Corp. | 587,530 | ||||||
| 725 | Itochu Techno-Solutions Corp. | 18,297 | ||||||
| 493 | Jack Henry & Associates, Inc. | 94,755 | ||||||
| 1,268 | Mastercard, Inc. Class A | 411,301 | ||||||
| 2,845 | NEC Corp. | 103,762 | ||||||
| 1,492 | Nomura Research Institute Ltd. | 40,155 | ||||||
| 2,940 | NTT Data Corp. | 41,373 | ||||||
| 141 | Okta, Inc.* | 12,887 | ||||||
| 522 | Otsuka Corp. | 16,873 | ||||||
| 1,624 | Paychex, Inc. | 200,304 | ||||||
| 1,270 | PayPal Holdings, Inc.* | 118,669 | ||||||
| 1,214 | SCSK Corp. | 19,768 | ||||||
| 138 | Snowflake, Inc. Class A* | 24,971 | ||||||
| 4,599 | SS&C Technologies Holdings, Inc. | 256,440 | ||||||
| 12,426 | The Western Union Co. | 184,153 | ||||||
| 772 | TIS, Inc. | 21,984 | ||||||
| 135 | Twilio, Inc. Class A* | 9,393 | ||||||
| 1,099 | VeriSign, Inc.* | 200,260 | ||||||
| 2,745 | Visa, Inc. Class A | 545,459 | ||||||
|
|
|
|||||||
| 6,688,793 | ||||||||
|
|
|
|||||||
| Common Stocks – (continued) | ||||||||
| Leisure Products – 0.0% | ||||||||
| 736 | Bandai Namco Holdings, Inc. | 55,227 | ||||||
| 410 | Hasbro, Inc. | 32,316 | ||||||
| 170 | Shimano, Inc. | 30,075 | ||||||
|
|
|
|||||||
| 117,618 | ||||||||
|
|
|
|||||||
| Life Sciences Tools & Services – 0.1% | ||||||||
| 1,029 | Agilent Technologies, Inc. | 131,969 | ||||||
| 1,217 | Avantor, Inc.* | 30,315 | ||||||
| 191 | Bio-Rad Laboratories, Inc. Class A* | 92,643 | ||||||
| 74 | Bio-Techne Corp. | 24,554 | ||||||
| 340 | Charles River Laboratories International, Inc.* | 69,785 | ||||||
| 1,433 | Danaher Corp. | 386,781 | ||||||
| 828 | Eurofins Scientific SE | 57,288 | ||||||
| 79 | Illumina, Inc.* | 15,930 | ||||||
| 647 | IQVIA Holdings, Inc.* | 137,591 | ||||||
| 110 | Lonza Group AG | 58,665 | ||||||
| 295 | Mettler-Toledo International, Inc.* | 357,676 | ||||||
| 982 | PerkinElmer, Inc. | 132,629 | ||||||
| 1,504 | QIAGEN NV* | 68,216 | ||||||
| 222 | Sartorius Stedim Biotech | 81,199 | ||||||
| 915 | Thermo Fisher Scientific, Inc. | 498,968 | ||||||
| 844 | Waters Corp.* | 252,018 | ||||||
| 376 | West Pharmaceutical Services, Inc. | 111,555 | ||||||
|
|
|
|||||||
| 2,507,782 | ||||||||
|
|
|
|||||||
| Machinery – 0.2% | ||||||||
| 5,204 | Atlas Copco AB Class A | 52,826 | ||||||
| 4,168 | Atlas Copco AB Class B | 37,953 | ||||||
| 551 | Caterpillar, Inc. | 101,775 | ||||||
| 8,166 | CNH Industrial NV | 99,422 | ||||||
| 676 | Cummins, Inc. | 145,590 | ||||||
| 2,123 | Daimler Truck Holding AG* | 54,283 | ||||||
| 320 | Deere & Co. | 116,880 | ||||||
| 779 | Dover Corp. | 97,344 | ||||||
| 2,914 | Epiroc AB Class A | 44,587 | ||||||
| 1,494 | Epiroc AB Class B | 20,339 | ||||||
| 640 | Fortive Corp. | 40,531 | ||||||
| 1,223 | GEA Group AG | 42,544 | ||||||
| 616 | Hoshizaki Corp. | 18,300 | ||||||
| 3,363 | Husqvarna AB Class B | 22,628 | ||||||
| 339 | IDEX Corp. | 68,210 | ||||||
| 874 | Illinois Tool Works, Inc. | 170,281 | ||||||
| 868 | Ingersoll Rand, Inc. | 41,117 | ||||||
| 992 | Knorr-Bremse AG | 48,077 | ||||||
| 537 | Komatsu Ltd. | 11,233 | ||||||
| 444 | Kone Oyj Class B | 17,757 | ||||||
| 3,451 | MISUMI Group, Inc. | 84,709 | ||||||
| 1,210 | Mitsubishi Heavy Industries Ltd. | 46,646 | ||||||
| 224 | Nordson Corp. | 50,886 | ||||||
| 1,409 | Otis Worldwide Corp. | 101,758 | ||||||
| 648 | PACCAR, Inc. | 56,707 | ||||||
| 522 | Parker-Hannifin Corp. | 138,330 | ||||||
| 1,018 | Pentair PLC | 45,301 | ||||||
| 84 | Rational AG | 45,306 | ||||||
| 1,093 | Sandvik AB | 17,040 | ||||||
|
|
|
|||||||
| The accompanying notes are an integral part of these financial statements. | 33 |
GOLDMAN SACHS GLOBAL MANAGED BETA FUND
Schedule of Investments (continued)
August 31, 2022
| Shares | Description | Value |
||||||
| Common Stocks – (continued) | ||||||||
| Machinery – (continued) | ||||||||
| 325 | Schindler Holding AG | $ | 55,793 | |||||
| 23 | SMC Corp. | 10,912 | ||||||
| 1,366 | Snap-on, Inc. | 297,597 | ||||||
| 439 | Spirax-Sarco Engineering PLC | 53,592 | ||||||
| 311 | Stanley Black & Decker, Inc. | 27,399 | ||||||
| 10,758 | Techtronic Industries Co. Ltd. | 126,882 | ||||||
| 262 | Toyota Industries Corp. | 14,644 | ||||||
| 98 | VAT Group AG*(a) | 23,432 | ||||||
| 969 | Volvo AB Class B | 15,349 | ||||||
| 6,203 | Wartsila OYJ Abp | 51,145 | ||||||
| 1,570 | Westinghouse Air Brake Technologies Corp. | 137,611 | ||||||
| 425 | Xylem, Inc. | 38,718 | ||||||
|
|
|
|||||||
| 2,691,434 | ||||||||
|
|
|
|||||||
| Marine – 0.0% | ||||||||
| 79 | AP Moller – Maersk A/S Class A | 184,553 | ||||||
| 77 | AP Moller – Maersk A/S Class B | 184,735 | ||||||
| 1,000 | Kuehne & Nagel International AG | 231,111 | ||||||
| 1,321 | Mitsui OSK Lines Ltd. | 34,417 | ||||||
| 1,402 | Nippon Yusen KK | 106,936 | ||||||
| 6,670 | SITC International Holdings Co. Ltd. | 16,914 | ||||||
| 1,925 | ZIM Integrated Shipping Services Ltd. | 69,473 | ||||||
|
|
|
|||||||
| 828,139 | ||||||||
|
|
|
|||||||
| Media – 0.2% | ||||||||
| 36 | Cable One, Inc. | 40,860 | ||||||
| 366 | Charter Communications, Inc. Class A* | 151,023 | ||||||
| 11,597 | Comcast Corp. Class A | 419,695 | ||||||
| 13,388 | CyberAgent, Inc. | 130,523 | ||||||
| 2,749 | Dentsu Group, Inc. | 88,531 | ||||||
| 5,971 | Fox Corp. Class A | 204,089 | ||||||
| 6,058 | Fox Corp. Class B | 191,554 | ||||||
| 2,474 | Hakuhodo DY Holdings, Inc. | 22,072 | ||||||
| 519 | Liberty Broadband Corp. Class C* | 52,782 | ||||||
| 4,541 | Liberty Media Corp.-Liberty SiriusXM Class A* | 188,633 | ||||||
| 4,473 | Liberty Media Corp.-Liberty SiriusXM Class C* | 185,003 | ||||||
| 11,049 | News Corp. Class A | 186,949 | ||||||
| 2,045 | Omnicom Group, Inc. | 136,810 | ||||||
| 579 | Paramount Global Class B | 13,543 | ||||||
| 1,838 | Pearson PLC | 18,395 | ||||||
| 2,256 | Publicis Groupe SA | 110,150 | ||||||
| 1,596 | Quebecor, Inc. Class B | 34,476 | ||||||
| 686 | Shaw Communications, Inc. Class B | 17,592 | ||||||
| 11,214 | Sirius XM Holdings, Inc. | 68,293 | ||||||
| 6,456 | The Interpublic Group of Cos., Inc. | 178,444 | ||||||
| 2,262 | Vivendi SE | 20,504 | ||||||
| 9,200 | WPP PLC | 79,240 | ||||||
|
|
|
|||||||
| 2,539,161 | ||||||||
|
|
|
|||||||
| Metals & Mining – 0.2% | ||||||||
| 357 | Alcoa Corp. | 17,664 | ||||||
| 219 | Alleima AB | 878 | ||||||
| 3,462 | Anglo American PLC | 111,249 | ||||||
|
|
|
|||||||
| Common Stocks – (continued) | ||||||||
| Metals & Mining – (continued) | ||||||||
| 1,054 | Antofagasta PLC | 13,411 | ||||||
| 7,927 | ArcelorMittal SA | 188,140 | ||||||
| 4,303 | Barrick Gold Corp. | 63,889 | ||||||
| 8,946 | BHP Group Ltd. | 244,047 | ||||||
| 14,919 | BlueScope Steel Ltd. | 167,389 | ||||||
| 904 | Boliden AB | 28,948 | ||||||
| 1,117 | Cleveland-Cliffs, Inc.* | 19,291 | ||||||
| 3,082 | First Quantum Minerals Ltd. | 54,537 | ||||||
| 11,709 | Fortescue Metals Group Ltd. | 145,514 | ||||||
| 2,874 | Freeport-McMoRan, Inc. | 85,070 | ||||||
| 28,991 | Glencore PLC | 158,510 | ||||||
| 2,895 | Hitachi Metals Ltd.* | 43,560 | ||||||
| 3,621 | Ivanhoe Mines, Ltd. Class A* | 23,270 | ||||||
| 1,918 | JFE Holdings, Inc. | 20,606 | ||||||
| 4,858 | Lundin Mining Corp. | 25,264 | ||||||
| 661 | Mineral Resources Ltd. | 28,163 | ||||||
| 739 | Newcrest Mining Ltd. | 8,884 | ||||||
| 1,092 | Newmont Corp. | 45,165 | ||||||
| 2,511 | Nippon Steel Corp. | 39,664 | ||||||
| 11,668 | Norsk Hydro ASA | 80,172 | ||||||
| 2,290 | Nucor Corp. | 304,433 | ||||||
| 1,501 | Rio Tinto Ltd. | 95,334 | ||||||
| 3,225 | Rio Tinto PLC | 178,053 | ||||||
| 55,641 | South32 Ltd. | 153,219 | ||||||
| 1,428 | Steel Dynamics, Inc. | 115,268 | ||||||
| 863 | Teck Resources Ltd. Class B | 29,228 | ||||||
| 4,129 | Voestalpine AG | 83,086 | ||||||
|
|
|
|||||||
| 2,571,906 | ||||||||
|
|
|
|||||||
| Mortgage Real Estate Investment Trusts (REITs) – 0.0% | ||||||||
| 19,182 | Annaly Capital Management, Inc. | 123,724 | ||||||
|
|
|
|||||||
| Multi-Utilities – 0.1% | ||||||||
| 674 | Ameren Corp. | 62,426 | ||||||
| 1,346 | Canadian Utilities Ltd. Class A | 41,179 | ||||||
| 2,163 | CenterPoint Energy, Inc. | 68,199 | ||||||
| 890 | CMS Energy Corp. | 60,111 | ||||||
| 889 | Consolidated Edison, Inc. | 86,891 | ||||||
| 1,300 | Dominion Energy, Inc. | 106,340 | ||||||
| 533 | DTE Energy Co. | 69,471 | ||||||
| 5,759 | E.ON SE | 49,122 | ||||||
| 8,901 | Engie SA | 105,718 | ||||||
| 10,243 | National Grid PLC | 127,544 | ||||||
| 1,593 | NiSource, Inc. | 47,009 | ||||||
| 1,180 | Public Service Enterprise Group, Inc. | 75,945 | ||||||
| 602 | Sempra Energy | 99,312 | ||||||
| 2,467 | Veolia Environnement SA | 54,983 | ||||||
| 648 | WEC Energy Group, Inc. | 66,835 | ||||||
|
|
|
|||||||
| 1,121,085 | ||||||||
|
|
|
|||||||
| Multiline Retail – 0.1% | ||||||||
| 789 | Canadian Tire Corp. Ltd. Class A | 92,798 | ||||||
| 1,125 | Dollar General Corp. | 267,098 | ||||||
| 2,163 | Dollar Tree, Inc.* | 293,476 | ||||||
| 3,134 | Dollarama, Inc. | 190,853 | ||||||
| 2,049 | Next PLC | 137,983 | ||||||
| 3,479 | Target Corp. | 557,823 | ||||||
|
|
|
|||||||
| 34 | The accompanying notes are an integral part of these financial statements. |
GOLDMAN SACHS GLOBAL MANAGED BETA FUND
| Shares | Description | Value |
||||||
| Common Stocks – (continued) | ||||||||
| Multiline Retail – (continued) | ||||||||
| 7,446 | Wesfarmers Ltd. | $ | 238,190 | |||||
|
|
|
|||||||
| 1,778,221 | ||||||||
|
|
|
|||||||
| Oil, Gas & Consumable Fuels – 0.4% | ||||||||
| 1,678 | Aker BP ASA | 58,782 | ||||||
| 1,738 | Ampol Ltd. | 40,851 | ||||||
| 410 | APA Corp. | 16,035 | ||||||
| 1,270 | ARC Resources Ltd. | 17,532 | ||||||
| 45,343 | BP PLC | 231,699 | ||||||
| 794 | Cameco Corp. | 23,143 | ||||||
| 1,935 | Canadian Natural Resources Ltd. | 106,080 | ||||||
| 9,153 | Cenovus Energy, Inc. | 171,721 | ||||||
| 936 | Cheniere Energy, Inc. | 149,928 | ||||||
| 3,650 | Chevron Corp. | 576,919 | ||||||
| 2,860 | ConocoPhillips | 313,027 | ||||||
| 1,132 | Coterra Energy, Inc. | 34,990 | ||||||
| 1,718 | Devon Energy Corp. | 121,325 | ||||||
| 520 | Diamondback Energy, Inc. | 69,306 | ||||||
| 3,595 | Enbridge, Inc. | 148,251 | ||||||
| 9,474 | ENEOS Holdings, Inc. | 35,802 | ||||||
| 10,295 | Eni SpA | 121,614 | ||||||
| 979 | EOG Resources, Inc. | 118,753 | ||||||
| 1,336 | EQT Corp. | 63,861 | ||||||
| 3,134 | Equinor ASA | 121,632 | ||||||
| 8,858 | Exxon Mobil Corp. | 846,736 | ||||||
| 467 | Hess Corp. | 56,404 | ||||||
| 2,107 | Idemitsu Kosan Co. Ltd. | 55,556 | ||||||
| 3,549 | Imperial Oil Ltd. | 174,187 | ||||||
| 12,574 | Inpex Corp. | 144,533 | ||||||
| 11,859 | Kinder Morgan, Inc. | 217,257 | ||||||
| 672 | Marathon Oil Corp. | 17,196 | ||||||
| 1,996 | Marathon Petroleum Corp. | 201,097 | ||||||
| 6,010 | Occidental Petroleum Corp. | 426,710 | ||||||
| 2,437 | OMV AG | 98,192 | ||||||
| 1,413 | ONEOK, Inc. | 86,518 | ||||||
| 790 | Parkland Corp. | 19,393 | ||||||
| 778 | Pembina Pipeline Corp. | 27,474 | ||||||
| 534 | Phillips 66 | 47,772 | ||||||
| 391 | Pioneer Natural Resources Co. | 99,009 | ||||||
| 12,720 | Repsol SA | 165,208 | ||||||
| 5,772 | Santos Ltd. | 30,813 | ||||||
| 21,800 | Shell PLC | 577,003 | ||||||
| 946 | Suncor Energy, Inc. | 30,605 | ||||||
| 929 | Targa Resources Corp. | 63,386 | ||||||
| 1,829 | TC Energy Corp. | 88,139 | ||||||
| 3,261 | The Williams Cos., Inc. | 110,972 | ||||||
| 3,871 | TotalEnergies SE | 195,987 | ||||||
| 975 | Tourmaline Oil Corp. | 57,646 | ||||||
| 705 | Valero Energy Corp. | 82,570 | ||||||
| 1,239 | Woodside Energy Group Ltd. | 28,780 | ||||||
|
|
|
|||||||
| 6,490,394 | ||||||||
|
|
|
|||||||
| Paper & Forest Products – 0.0% | ||||||||
| 475 | Holmen AB Class B | 20,380 | ||||||
| 570 | Mondi PLC | 9,676 | ||||||
| 7,217 | Oji Holdings Corp. | 28,795 | ||||||
|
|
|
|||||||
| Common Stocks – (continued) | ||||||||
| Paper & Forest Products – (continued) | ||||||||
| 2,407 | Stora Enso Oyj Class R | 35,830 | ||||||
| 1,908 | Svenska Cellulosa AB SCA Class B | 28,588 | ||||||
| 1,299 | UPM-Kymmene Oyj | 44,133 | ||||||
| 2,474 | West Fraser Timber Co. Ltd. | 221,339 | ||||||
|
|
|
|||||||
| 388,741 | ||||||||
|
|
|
|||||||
| Personal Products – 0.1% | ||||||||
| 619 | Beiersdorf AG | 62,482 | ||||||
| 12,934 | Haleon PLC* | 38,893 | ||||||
| 688 | Kao Corp. | 29,791 | ||||||
| 323 | Kobayashi Pharmaceutical Co. Ltd. | 18,305 | ||||||
| 220 | Kose Corp. | 20,718 | ||||||
| 1,303 | L’Oreal SA | 447,508 | ||||||
| 3,704 | Shiseido Co. Ltd. | 139,914 | ||||||
| 1,685 | The Estee Lauder Cos., Inc. Class A | 428,630 | ||||||
| 2,745 | Unilever PLC | 124,520 | ||||||
|
|
|
|||||||
| 1,310,761 | ||||||||
|
|
|
|||||||
| Pharmaceuticals – 0.6% | ||||||||
| 9,414 | Astellas Pharma, Inc. | 133,470 | ||||||
| 2,743 | AstraZeneca PLC | 339,288 | ||||||
| 2,962 | Bausch Health Cos., Inc.* | 17,772 | ||||||
| 2,016 | Bayer AG | 106,622 | ||||||
| 8,268 | Bristol-Myers Squibb Co. | 557,346 | ||||||
| 318 | Catalent, Inc.* | 27,984 | ||||||
| 2,849 | Chugai Pharmaceutical Co. Ltd. | 73,527 | ||||||
| 1,373 | Daiichi Sankyo Co. Ltd. | 41,261 | ||||||
| 1,477 | Eisai Co. Ltd. | 60,222 | ||||||
| 1,627 | Elanco Animal Health, Inc.* | 24,617 | ||||||
| 2,536 | Eli Lilly & Co. | 763,919 | ||||||
| 10,347 | GSK PLC | 165,397 | ||||||
| 5,885 | Hikma Pharmaceuticals PLC | 89,691 | ||||||
| 5,020 | Ipsen SA | 481,102 | ||||||
| 2,106 | Jazz Pharmaceuticals PLC* | 326,893 | ||||||
| 7,456 | Johnson & Johnson | 1,202,951 | ||||||
| 494 | Kyowa Kirin Co. Ltd. | 11,073 | ||||||
| 6,259 | Merck & Co., Inc. | 534,268 | ||||||
| 1,007 | Merck KGaA | 172,982 | ||||||
| 313 | Nippon Shinyaku Co. Ltd. | 17,121 | ||||||
| 4,432 | Novartis AG | 358,496 | ||||||
| 5,249 | Novo Nordisk A/S Class B | 561,191 | ||||||
| 2,216 | Ono Pharmaceutical Co. Ltd. | 52,896 | ||||||
| 3,855 | Orion Oyj Class B | 174,786 | ||||||
| 1,176 | Otsuka Holdings Co. Ltd. | 38,411 | ||||||
| 16,052 | Pfizer, Inc. | 726,032 | ||||||
| 2,201 | Recordati Industria Chimica e Farmaceutica SpA | 89,801 | ||||||
| 2,376 | Roche Holding AG | 775,439 | ||||||
| 1,668 | Royalty Pharma PLC Class A | 69,739 | ||||||
| 2,942 | Sanofi | 240,508 | ||||||
| 774 | Shionogi & Co. Ltd. | 37,790 | ||||||
| 5,468 | Takeda Pharmaceutical Co. Ltd. | 151,136 | ||||||
| 22,590 | Teva Pharmaceutical Industries Ltd. ADR* | 204,214 | ||||||
| 1,681 | UCB SA | 118,119 | ||||||
| 28,638 | Viatris, Inc. | 273,493 | ||||||
|
|
|
|||||||
| The accompanying notes are an integral part of these financial statements. | 35 |
GOLDMAN SACHS GLOBAL MANAGED BETA FUND
Schedule of Investments (continued)
August 31, 2022
| Shares | Description | Value |
||||||
| Common Stocks – (continued) | ||||||||
| Pharmaceuticals – (continued) | ||||||||
| 1,414 | Zoetis, Inc. | $ | 221,333 | |||||
|
|
|
|||||||
| 9,240,890 | ||||||||
|
|
|
|||||||
| Professional Services – 0.1% | ||||||||
| 969 | Adecco Group AG | 30,718 | ||||||
| 1,223 | Booz Allen Hamilton Holding Corp. | 117,041 | ||||||
| 2,245 | Bureau Veritas SA | 55,721 | ||||||
| 169 | Equifax, Inc. | 31,899 | ||||||
| 2,493 | Experian PLC | 75,651 | ||||||
| 642 | Intertek Group PLC | 29,467 | ||||||
| 1,705 | Jacobs Solutions, Inc. | 212,409 | ||||||
| 2,349 | Leidos Holdings, Inc. | 223,272 | ||||||
| 1,476 | Nihon M&A Center Holdings, Inc. | 18,292 | ||||||
| 6,458 | Persol Holdings Co. Ltd. | 129,639 | ||||||
| 2,462 | Randstad NV | 114,657 | ||||||
| 6,162 | Recruit Holdings Co. Ltd. | 195,894 | ||||||
| 6,359 | RELX PLC | 166,766 | ||||||
| 4,252 | Robert Half International, Inc. | 327,276 | ||||||
| 130 | SGS SA | 286,284 | ||||||
| 154 | Teleperformance | 43,860 | ||||||
| 460 | Thomson Reuters Corp. | 50,653 | ||||||
| 450 | TransUnion | 33,242 | ||||||
| 398 | Verisk Analytics, Inc. Class A | 74,490 | ||||||
| 1,605 | Wolters Kluwer NV | 156,957 | ||||||
|
|
|
|||||||
| 2,374,188 | ||||||||
|
|
|
|||||||
| Real Estate Management & Development – 0.1% | ||||||||
| 390 | Azrieli Group Ltd. | 32,353 | ||||||
| 5,031 | CBRE Group, Inc. Class A* | 397,248 | ||||||
| 15,811 | CK Asset Holdings Ltd. | 106,721 | ||||||
| 972 | Daito Trust Construction Co. Ltd. | 95,623 | ||||||
| 705 | Daiwa House Industry Co. Ltd. | 15,762 | ||||||
| 490 | FirstService Corp. | 61,295 | ||||||
| 4,334 | Henderson Land Development Co. Ltd. | 14,498 | ||||||
| 3,931 | Hongkong Land Holdings Ltd. | 19,003 | ||||||
| 2,516 | Hulic Co. Ltd. | 19,066 | ||||||
| 299 | LEG Immobilien SE | 22,597 | ||||||
| 1,710 | Mitsubishi Estate Co. Ltd. | 23,028 | ||||||
| 912 | Mitsui Fudosan Co. Ltd. | 18,459 | ||||||
| 5,334 | New World Development Co. Ltd. | 17,381 | ||||||
| 1,156 | Sagax AB Class B | 24,862 | ||||||
| 32,599 | Sino Land Co. Ltd. | 47,670 | ||||||
| 2,323 | Sun Hung Kai Properties Ltd. | 27,291 | ||||||
| 23,982 | Swire Pacific Ltd. | 165,878 | ||||||
| 474 | Swiss Prime Site AG | 40,765 | ||||||
| 7,078 | UOL Group Ltd. | 35,021 | ||||||
| 866 | Vonovia SE | 23,444 | ||||||
|
|
|
|||||||
| 1,207,965 | ||||||||
|
|
|
|||||||
| Road & Rail – 0.1% | ||||||||
| 62 | AMERCO | 32,592 | ||||||
| 11,973 | Aurizon Holdings Ltd. | 30,281 | ||||||
| 741 | Canadian National Railway Co. | 88,123 | ||||||
| 491 | Canadian Pacific Railway Ltd. | 36,757 | ||||||
| 152 | Central Japan Railway Co. | 17,895 | ||||||
| 3,357 | CSX Corp. | 106,249 | ||||||
|
|
|
|||||||
| Common Stocks – (continued) | ||||||||
| Road & Rail – (continued) | ||||||||
| 362 | East Japan Railway Co. | 18,750 | ||||||
| 677 | Hankyu Hanshin Holdings, Inc. | 20,302 | ||||||
| 264 | J.B. Hunt Transport Services, Inc. | 45,941 | ||||||
| 652 | Kintetsu Group Holdings Co. Ltd. | 22,140 | ||||||
| 5,699 | Knight-Swift Transportation Holdings, Inc. | 287,857 | ||||||
| 4,647 | MTR Corp. Ltd. | 23,799 | ||||||
| 516 | Norfolk Southern Corp. | 125,455 | ||||||
| 413 | Old Dominion Freight Line, Inc. | 112,092 | ||||||
| 813 | Tobu Railway Co. Ltd. | 19,208 | ||||||
| 1,609 | Tokyu Corp. | 19,128 | ||||||
| 898 | Union Pacific Corp. | 201,610 | ||||||
|
|
|
|||||||
| 1,208,179 | ||||||||
|
|
|
|||||||
| Semiconductors & Semiconductor Equipment – 0.4% | ||||||||
| 4,535 | Advanced Micro Devices, Inc.* | 384,886 | ||||||
| 1,211 | Advantest Corp. | 68,585 | ||||||
| 646 | Analog Devices, Inc. | 97,888 | ||||||
| 3,310 | Applied Materials, Inc. | 311,372 | ||||||
| 199 | ASM International NV | 54,106 | ||||||
| 770 | ASML Holding NV | 375,849 | ||||||
| 1,065 | Broadcom, Inc. | 531,552 | ||||||
| 15,314 | Intel Corp. | 488,823 | ||||||
| 410 | KLA Corp. | 141,093 | ||||||
| 447 | Lam Research Corp. | 195,746 | ||||||
| 103 | Lasertec Corp. | 14,260 | ||||||
| 1,348 | Marvell Technology, Inc. | 63,113 | ||||||
| 2,172 | Microchip Technology, Inc. | 141,723 | ||||||
| 4,696 | Micron Technology, Inc. | 265,465 | ||||||
| 243 | Monolithic Power Systems, Inc. | 110,123 | ||||||
| 6,115 | NVIDIA Corp. | 922,998 | ||||||
| 1,145 | NXP Semiconductors NV | 188,444 | ||||||
| 6,209 | ON Semiconductor Corp.* | 426,993 | ||||||
| 1,955 | Qorvo, Inc.* | 175,520 | ||||||
| 3,510 | QUALCOMM, Inc. | 464,268 | ||||||
| 7,939 | Renesas Electronics Corp.* | 75,171 | ||||||
| 815 | Skyworks Solutions, Inc. | 80,318 | ||||||
| 1,657 | STMicroelectronics NV | 57,747 | ||||||
| 2,163 | Teradyne, Inc. | 183,076 | ||||||
| 3,481 | Texas Instruments, Inc. | 575,096 | ||||||
| 377 | Tokyo Electron Ltd. | 118,241 | ||||||
|
|
|
|||||||
| 6,512,456 | ||||||||
|
|
|
|||||||
| Software – 0.7% | ||||||||
| 1,518 | Adobe, Inc.* | 566,882 | ||||||
| 108 | ANSYS, Inc.* | 26,816 | ||||||
| 870 | Autodesk, Inc.* | 175,514 | ||||||
| 2,114 | Black Knight, Inc.* | 139,862 | ||||||
| 2,974 | Cadence Design Systems, Inc.* | 516,792 | ||||||
| 336 | Ceridian HCM Holding, Inc.* | 20,039 | ||||||
| 504 | Check Point Software Technologies Ltd.* | 60,601 | ||||||
| 2,790 | Citrix Systems, Inc. | 286,728 | ||||||
| 264 | Constellation Software, Inc. | 397,406 | ||||||
| 126 | Crowdstrike Holdings, Inc. Class A* | 23,009 | ||||||
| 1,730 | Dassault Systemes SE | 66,714 | ||||||
|
|
|
|||||||
| 36 | The accompanying notes are an integral part of these financial statements. |
GOLDMAN SACHS GLOBAL MANAGED BETA FUND
| Shares | Description | Value |
||||||
| Common Stocks – (continued) | ||||||||
| Software – (continued) | ||||||||
| 475 | Datadog, Inc. Class A* | $ | 49,851 | |||||
| 1,398 | DocuSign, Inc.* | 81,392 | ||||||
| 10,926 | Dropbox, Inc. Class A* | 233,707 | ||||||
| 426 | Fair Isaac Corp.* | 191,444 | ||||||
| 4,095 | Fortinet, Inc.* | 199,386 | ||||||
| 504 | Guidewire Software, Inc.* | 36,142 | ||||||
| 247 | HubSpot, Inc.* | 83,249 | ||||||
| 1,031 | Intuit, Inc. | 445,165 | ||||||
| 21,879 | Microsoft Corp. | 5,720,702 | ||||||
| 1,826 | Nemetschek SE | 107,570 | ||||||
| 7,611 | NortonLifeLock, Inc. | 171,932 | ||||||
| 797 | Open Text Corp. | 25,105 | ||||||
| 4,092 | Oracle Corp. | 294,864 | ||||||
| 381 | Palo Alto Networks, Inc.* | 212,145 | ||||||
| 98 | Paycom Software, Inc.* | 34,418 | ||||||
| 621 | PTC, Inc.* | 71,347 | ||||||
| 947 | RingCentral, Inc. Class A* | 40,759 | ||||||
| 226 | Roper Technologies, Inc. | 90,983 | ||||||
| 2,108 | Salesforce, Inc.* | 329,101 | ||||||
| 1,481 | SAP SE | 126,136 | ||||||
| 603 | ServiceNow, Inc.* | 262,076 | ||||||
| 180 | Splunk, Inc.* | 16,205 | ||||||
| 439 | Synopsys, Inc.* | 151,903 | ||||||
| 20,634 | The Sage Group PLC | 171,029 | ||||||
| 349 | The Trade Desk, Inc. Class A* | 21,882 | ||||||
| 383 | Trend Micro, Inc. | 23,581 | ||||||
| 95 | Tyler Technologies, Inc.* | 35,293 | ||||||
| 1,670 | VMware, Inc. Class A | 193,770 | ||||||
| 1,138 | WiseTech Global, Ltd. | 44,950 | ||||||
| 326 | Workday, Inc. Class A* | 53,647 | ||||||
| 478 | Xero Ltd.* | 28,120 | ||||||
| 739 | Zendesk, Inc.* | 56,733 | ||||||
| 548 | Zoom Video Communications, Inc. Class A* | 44,059 | ||||||
| 198 | Zscaler, Inc.* | 31,530 | ||||||
|
|
|
|||||||
| 11,960,539 | ||||||||
|
|
|
|||||||
| Specialty Retail – 0.3% | ||||||||
| 1,267 | Advance Auto Parts, Inc. | 213,667 | ||||||
| 291 | AutoZone, Inc.* | 616,690 | ||||||
| 4,821 | Bath & Body Works, Inc. | 179,968 | ||||||
| 4,587 | Best Buy Co., Inc. | 324,255 | ||||||
| 622 | Burlington Stores, Inc.* | 87,198 | ||||||
| 227 | CarMax, Inc.* | 20,076 | ||||||
| 35 | Fast Retailing Co. Ltd. | 20,466 | ||||||
| 9,638 | Hennes & Mauritz AB Class B | 100,094 | ||||||
| 1,851 | Industria de Diseno Textil SA | 39,966 | ||||||
| 85,865 | JD Sports Fashion PLC | 112,314 | ||||||
| 25,178 | Kingfisher PLC | 67,635 | ||||||
| 3,804 | Lowe’s Cos., Inc. | 738,509 | ||||||
| 396 | Nitori Holdings Co. Ltd. | 37,858 | ||||||
| 686 | O’Reilly Automotive, Inc.* | 478,224 | ||||||
| 1,243 | Ross Stores, Inc. | 107,234 | ||||||
| 3,803 | The Home Depot, Inc. | 1,096,861 | ||||||
| 4,661 | The TJX Cos., Inc. | 290,613 | ||||||
| 1,795 | Tractor Supply Co. | 332,344 | ||||||
|
|
|
|||||||
| Common Stocks – (continued) | ||||||||
| Specialty Retail – (continued) | ||||||||
| 855 | Ulta Beauty, Inc.* | 358,989 | ||||||
| 1,871 | USS Co. Ltd. | 33,017 | ||||||
|
|
|
|||||||
| 5,255,978 | ||||||||
|
|
|
|||||||
| Technology Hardware, Storage & Peripherals – 0.6% | ||||||||
| 49,864 | Apple, Inc. | 7,839,618 | ||||||
| 4,598 | Brother Industries Ltd. | 87,994 | ||||||
| 2,379 | Canon, Inc. | 56,975 | ||||||
| 3,318 | Dell Technologies, Inc. Class C | 127,046 | ||||||
| 2,216 | FUJIFILM Holdings Corp. | 112,499 | ||||||
| 17,300 | Hewlett Packard Enterprise Co. | 235,280 | ||||||
| 7,174 | HP, Inc. | 205,966 | ||||||
| 1,860 | Logitech International SA | 92,546 | ||||||
| 2,434 | NetApp, Inc. | 175,565 | ||||||
| 10,223 | Ricoh Co. Ltd. | 80,347 | ||||||
| 1,472 | Seagate Technology Holdings PLC | 98,565 | ||||||
| 3,609 | Seiko Epson Corp. | 56,711 | ||||||
| 514 | Western Digital Corp.* | 21,722 | ||||||
|
|
|
|||||||
| 9,190,834 | ||||||||
|
|
|
|||||||
| Textiles, Apparel & Luxury Goods – 0.2% | ||||||||
| 905 | Adidas AG | 134,196 | ||||||
| 9,321 | Burberry Group PLC | 188,552 | ||||||
| 677 | Cie Financiere Richemont SA Class A | 75,708 | ||||||
| 626 | EssilorLuxottica SA | 93,235 | ||||||
| 623 | Gildan Activewear, Inc. | 18,424 | ||||||
| 242 | Hermes International | 309,945 | ||||||
| 231 | Kering SA | 115,905 | ||||||
| 1,086 | Lululemon Athletica, Inc.* | 325,756 | ||||||
| 741 | LVMH Moet Hennessy Louis Vuitton SE | 478,143 | ||||||
| 1,919 | Moncler SpA | 85,380 | ||||||
| 3,508 | NIKE, Inc. Class B | 373,426 | ||||||
| 956 | Pandora A/S | 57,433 | ||||||
| 2,198 | Puma SE | 134,349 | ||||||
| 2,227 | The Swatch Group AG | 167,282 | ||||||
| 2,346 | VF Corp. | 97,242 | ||||||
|
|
|
|||||||
| 2,654,976 | ||||||||
|
|
|
|||||||
| Tobacco – 0.1% | ||||||||
| 3,433 | Altria Group, Inc. | 154,897 | ||||||
| 6,267 | British American Tobacco PLC | 251,011 | ||||||
| 3,838 | Imperial Brands PLC | 84,405 | ||||||
| 3,318 | Japan Tobacco, Inc. | 56,218 | ||||||
| 6,099 | Philip Morris International, Inc. | 582,393 | ||||||
| 25,280 | Swedish Match AB | 253,789 | ||||||
|
|
|
|||||||
| 1,382,713 | ||||||||
|
|
|
|||||||
| Trading Companies & Distributors – 0.1% | ||||||||
| 919 | AerCap Holdings NV* | 40,482 | ||||||
| 386 | Ashtead Group PLC | 18,963 | ||||||
| 1,145 | Brenntag SE | 75,075 | ||||||
| 2,566 | Bunzl PLC | 85,099 | ||||||
| 7,976 | Fastenal Co. | 401,432 | ||||||
| 2,572 | Ferguson PLC | 297,858 | ||||||
|
|
|
|||||||
| The accompanying notes are an integral part of these financial statements. | 37 |
GOLDMAN SACHS GLOBAL MANAGED BETA FUND
Schedule of Investments (continued)
August 31, 2022
| Shares | Description | Value |
||||||
| Common Stocks – (continued) | ||||||||
| Trading Companies & Distributors – (continued) | ||||||||
| 402 | IMCD NV | $ | 55,458 | |||||
| 4,864 | ITOCHU Corp. | 133,861 | ||||||
| 23,901 | Marubeni Corp. | 249,103 | ||||||
| 4,158 | Mitsubishi Corp. | 136,136 | ||||||
| 5,513 | Mitsui & Co. Ltd. | 129,385 | ||||||
| 9,386 | MonotaRO Co. Ltd. | 168,406 | ||||||
| 2,728 | Reece Ltd. | 29,535 | ||||||
| 6,369 | Sumitomo Corp. | 89,584 | ||||||
| 744 | Toromont Industries Ltd. | 57,589 | ||||||
| 213 | United Rentals, Inc.* | 62,205 | ||||||
| 885 | W.W. Grainger, Inc. | 491,122 | ||||||
|
|
|
|||||||
| 2,521,293 | ||||||||
|
|
|
|||||||
| Transportation Infrastructure – 0.0% | ||||||||
| 4,994 | Atlantia SpA | 114,355 | ||||||
| 1,952 | Getlink SE | 36,758 | ||||||
| 6,722 | Transurban Group | 63,775 | ||||||
|
|
|
|||||||
| 214,888 | ||||||||
|
|
|
|||||||
| Water Utilities – 0.0% | ||||||||
| 648 | American Water Works Co., Inc. | 96,196 | ||||||
| 880 | Essential Utilities, Inc. | 43,252 | ||||||
| 2,366 | Severn Trent PLC | 76,425 | ||||||
| 5,863 | United Utilities Group PLC | 71,859 | ||||||
|
|
|
|||||||
| 287,732 | ||||||||
|
|
|
|||||||
| Wireless Telecommunication Services – 0.0% | ||||||||
| 6,240 | KDDI Corp. | 190,951 | ||||||
| 1,015 | Rogers Communications, Inc. Class B | 43,704 | ||||||
| 9,217 | SoftBank Corp. | 101,048 | ||||||
| 1,290 | SoftBank Group Corp. | 51,099 | ||||||
| 731 | T-Mobile US, Inc.* | 105,235 | ||||||
| 5,009 | Tele2 AB Class B | 53,344 | ||||||
| 80,292 | Vodafone Group PLC | 107,499 | ||||||
|
|
|
|||||||
| 652,880 | ||||||||
|
|
|
|||||||
| |
TOTAL COMMON STOCKS (Cost $131,606,514) |
$ | 179,369,871 | |||||
|
|
|
|||||||
| Shares | Dividend Rate |
Value | ||||||
| Preferred Stocks – 0.0% | ||||||||
| Automobiles – 0.0% | ||||||||
| Bayerische Motoren Werke AG |
||||||||
| EUR | 820 | 2.847% | $ | 57,010 | ||||
| Volkswagen AG |
||||||||
| 541 | 2.476 | 76,951 | ||||||
|
|
|
|||||||
| 133,961 | ||||||||
|
|
|
|||||||
| Household Products – 0.0% | ||||||||
| Henkel AG & Co. KGaA |
||||||||
| 615 | 2.342 | 39,688 | ||||||
|
|
|
|||||||
| Life Sciences Tools & Services – 0.0% | ||||||||
| Sartorius AG |
||||||||
| 142 | 0.126% | 59,161 | ||||||
|
|
|
|||||||
| TOTAL PREFERRED STOCKS | ||||||||
| (Cost $261,509) | $ | 232,810 | ||||||
|
|
|
|||||||
| Shares | Description | Value | ||||||
| Exchange Traded Funds – 73.3% | ||||||||
| 749,848 | Goldman Sachs ActiveBeta Emerging Markets Equity ETF(b) | $ | 21,768,087 | |||||
| 4,838,079 | Goldman Sachs MarketBeta International Equity ETF(b) | 214,490,911 | ||||||
| 5,419,772 | Goldman Sachs MarketBeta U.S. Equity ETF(b) | 292,505,095 | ||||||
| 3,639,233 | iShares Core MSCI Emerging Markets ETF | 176,357,231 | ||||||
| 1,540 | iShares MSCI Canada ETF | 51,883 | ||||||
| 1,707,376 | iShares MSCI EAFE ETF(c) | 105,345,099 | ||||||
| 1,159,834 | iShares MSCI EAFE Small-Cap ETF | 63,535,707 | ||||||
| 949,516 | Vanguard S&P 500 ETF | 344,816,735 | ||||||
|
|
|
|||||||
| TOTAL EXCHANGE TRADED FUNDS | ||||||||
| (Cost $1,046,701,404) | $ | 1,218,870,748 | ||||||
|
|
|
|||||||
| Shares | Dividend Rate |
Value | ||||||
| Investment Company(b) – 10.6% | ||||||||
| |
Goldman Sachs Financial Square Government Fund – |
| ||||||
| 175,934,056 | 2.154% | $ | 175,934,056 | |||||
| (Cost $175,934,056) | ||||||||
|
|
|
|||||||
| |
TOTAL INVESTMENTS BEFORE SECURITIES LENDING REINVESTMENT |
| ||||||
| (Cost $1,354,503,483) | $ | 1,574,407,485 | ||||||
|
|
|
|||||||
| Shares | Distribution Rate |
Value | ||||||
| Securities Lending Reinvestment Vehicle(b) – 4.3% | ||||||||
| |
Goldman Sachs Financial Square Government Fund – |
| ||||||
| 70,746,676 | 2.154% | $ | 70,746,676 | |||||
| (Cost $70,746,676) | ||||||||
|
|
|
|||||||
| TOTAL INVESTMENTS – 99.0% | ||||||||
| (Cost $1,425,250,159) | $ | 1,645,154,161 | ||||||
|
|
|
|||||||
| |
OTHER ASSETS IN EXCESS OF LIABILITIES – 1.0% |
17,369,804 | ||||||
|
|
|
|||||||
| NET ASSETS – 100.0% | $ | 1,662,523,965 | ||||||
|
|
|
|||||||
| 38 | The accompanying notes are an integral part of these financial statements. |
GOLDMAN SACHS GLOBAL MANAGED BETA FUND
| The percentage shown for each investment category reflects the value of investments in that category as a percentage of net assets. | ||
| * |
Non-income producing security. | |
| (a) |
Exempt from registration under Rule 144A of the Securities Act of 1933. | |
| (b) |
Represents an affiliated fund. | |
| (c) |
All or a portion of security is on loan. | |
|
| ||
| Currency Abbreviations: | ||
| AUD |
—Australian Dollar | |
| CAD |
—Canadian Dollar | |
| CHF |
—Swiss Franc | |
| DKK |
—Danish Krone | |
| EUR |
—Euro | |
| GBP |
—British Pound | |
| HKD |
—Hong Kong Dollar | |
| ILS |
—Israeli Shekel | |
| JPY |
—Japanese Yen | |
| NOK |
—Norwegian Krone | |
| NZD |
—New Zealand Dollar | |
| SEK |
—Swedish Krona | |
| SGD |
—Singapore Dollar | |
| USD |
—U.S. Dollar | |
| Investment Abbreviations: | ||
| ADR |
—American Depositary Receipt | |
| ETF |
—Exchange Traded Fund | |
| MSCI |
—Morgan Stanley Capital International | |
| PLC |
—Public Limited Company | |
| REIT |
—Real Estate Investment Trust | |
|
| ||
| ADDITIONAL INVESTMENT INFORMATION |
FORWARD FOREIGN CURRENCY EXCHANGE CONTRACTS — At August 31, 2022, the Fund had the following forward foreign currency exchange contracts:
FORWARD FOREIGN CURRENCY EXCHANGE CONTRACTS WITH UNREALIZED GAIN
| Counterparty | Currency Purchased |
Currency Sold |
Settlement Date |
Unrealized Gain |
||||||||||||||||
| MS & Co. Int. PLC |
AUD | 4,520,000 | USD | 3,093,732 | 09/21/22 | $ | 137 | |||||||||||||
| CHF | 3,980,000 | USD | 4,077,468 | 09/21/22 | 1,084 | |||||||||||||||
| DKK | 10,250,000 | USD | 1,385,745 | 09/21/22 | 1,188 | |||||||||||||||
| EUR | 12,910,000 | USD | 12,987,205 | 09/21/22 | 5,086 | |||||||||||||||
| GBP | 5,680,000 | USD | 6,600,433 | 09/21/22 | 706 | |||||||||||||||
| HKD | 12,840,000 | USD | 1,636,670 | 09/21/22 | 81 | |||||||||||||||
| ILS | 1,080,000 | USD | 322,643 | 09/21/22 | 1,928 | |||||||||||||||
| JPY | 1,094,000,000 | USD | 7,885,665 | 09/21/22 | 2,312 | |||||||||||||||
| NOK | 3,900,000 | USD | 392,572 | 09/21/22 | 21 | |||||||||||||||
| NZD | 100,000 | USD | 61,174 | 09/21/22 | 8 | |||||||||||||||
| SEK | 15,525,000 | USD | 1,457,365 | 09/21/22 | 534 | |||||||||||||||
| USD | 33,798,080 | AUD | 47,240,000 | 09/21/22 | 1,463,044 | |||||||||||||||
| USD | 38,625,875 | CHF | 37,010,000 | 09/21/22 | 699,439 | |||||||||||||||
| USD | 11,108,328 | DKK | 77,350,000 | 09/21/22 | 642,050 | |||||||||||||||
| USD | 129,989,665 | EUR | 121,630,000 | 09/21/22 | 7,584,372 | |||||||||||||||
| USD | 65,658,814 | GBP | 52,715,000 | 09/21/22 | 4,394,897 | |||||||||||||||
| USD | 12,064,443 | HKD | 94,420,000 | 09/21/22 | 28,465 | |||||||||||||||
| The accompanying notes are an integral part of these financial statements. | 39 |
GOLDMAN SACHS GLOBAL MANAGED BETA FUND
Schedule of Investments (continued)
August 31, 2022
| ADDITIONAL INVESTMENT INFORMATION (continued) |
FORWARD FOREIGN CURRENCY EXCHANGE CONTRACTS WITH UNREALIZED GAIN (continued)
| Counterparty | Currency Purchased |
Currency Sold |
Settlement Date |
Unrealized Gain |
||||||||||||||||
| MS & Co. Int. PLC (continued) |
USD | 1,840,838 | ILS | 6,120,000 | 09/21/22 | $ | 1,602 | |||||||||||||
| USD | 94,587,012 | JPY | 12,284,000,000 | 09/21/22 | 6,016,710 | |||||||||||||||
| USD | 3,473,954 | NOK | 33,050,000 | 09/21/22 | 146,981 | |||||||||||||||
| USD | 741,363 | NZD | 1,150,000 | 09/21/22 | 37,769 | |||||||||||||||
| USD | 15,062,307 | SEK | 148,350,000 | 09/21/22 | 1,131,262 | |||||||||||||||
| USD | 5,054,865 | SGD | 6,950,000 | 09/21/22 | 81,094 | |||||||||||||||
| TOTAL |
|
$ | 22,240,770 | |||||||||||||||||
FORWARD FOREIGN CURRENCY EXCHANGE CONTRACTS WITH UNREALIZED LOSS
| Counterparty | Currency Purchased |
Currency Sold |
Settlement Date |
Unrealized Loss |
||||||||||||||||
| MS & Co. Int. PLC |
AUD | 3,610,000 | USD | 2,492,414 | 09/21/22 | $ | (21,425 | ) | ||||||||||||
| CAD | 26,940,000 | USD | 21,250,019 | 09/21/22 | (740,846 | ) | ||||||||||||||
| CHF | 3,080,000 | USD | 3,187,447 | 09/21/22 | (31,181 | ) | ||||||||||||||
| DKK | 1,140,000 | USD | 156,579 | 09/21/22 | (2,325 | ) | ||||||||||||||
| EUR | 10,580,000 | USD | 10,841,178 | 09/21/22 | (193,739 | ) | ||||||||||||||
| GBP | 3,480,000 | USD | 4,176,727 | 09/21/22 | (132,368 | ) | ||||||||||||||
| HKD | 6,230,000 | USD | 795,044 | 09/21/22 | (889 | ) | ||||||||||||||
| JPY | 847,000,000 | USD | 6,162,548 | 09/21/22 | (55,494 | ) | ||||||||||||||
| NOK | 1,050,000 | USD | 106,244 | 09/21/22 | (546 | ) | ||||||||||||||
| NZD | 50,000 | USD | 31,289 | 09/21/22 | (698 | ) | ||||||||||||||
| SEK | 15,450,000 | USD | 1,513,061 | 09/21/22 | (62,204 | ) | ||||||||||||||
| SGD | 1,020,000 | USD | 730,975 | 09/21/22 | (1,012 | ) | ||||||||||||||
| USD | 3,790,745 | CAD | 4,980,000 | 09/21/22 | (483 | ) | ||||||||||||||
| USD | 2,851,338 | CHF | 2,800,000 | 09/21/22 | (17,995 | ) | ||||||||||||||
| USD | 343,361 | ILS | 1,160,000 | 09/21/22 | (5,250 | ) | ||||||||||||||
| USD | 42,919 | SGD | 60,000 | 09/21/22 | (21 | ) | ||||||||||||||
| TOTAL |
|
$ | (1,266,476 | ) | ||||||||||||||||
FUTURES CONTRACTS — At August 31, 2022, the Fund had the following futures contracts:
| Description | Number of Contracts |
Expiration Date |
Notional Amount |
Unrealized Appreciation/ (Depreciation) |
||||||||||||
| Long position contracts: |
||||||||||||||||
| E-Mini Russell 2000 Index |
1,154 | 09/16/22 | $ | 106,433,420 | $ | (338,208 | ) | |||||||||
| S&P 500 E-Mini Index |
737 | 09/16/22 | 145,797,025 | (153,345 | ) | |||||||||||
| S&P Toronto Stock Exchange 60 Index |
298 | 09/15/22 | 52,867,857 | (1,389,138 | ) | |||||||||||
| TOTAL FUTURES CONTRACTS |
|
$ | (1,880,691 | ) | ||||||||||||
| 40 | The accompanying notes are an integral part of these financial statements. |
GOLDMAN SACHS GLOBAL MANAGED BETA FUND
| ADDITIONAL INVESTMENT INFORMATION (continued) |
PURCHASED AND WRITTEN OPTIONS CONTRACTS — At August 31, 2022, the Fund had the following purchased and written options:
EXCHANGE TRADED OPTIONS ON FUTURES
| Description | Exercise Price |
Expiration Date |
Number of Contracts |
Notional Amount |
Market Value |
Premiums Paid (Received) by Fund |
Unrealized Appreciation/ (Depreciation) |
|||||||||||||||||||
| Purchased option contracts |
||||||||||||||||||||||||||
| Calls |
||||||||||||||||||||||||||
| Eurodollar Futures |
$98.250 | 09/19/2022 | 456 | $ | 1,140,000 | $ | 2,850 | $ | 1,089,758 | $ | (1,086,908 | ) | ||||||||||||||
| Eurodollar Futures |
99.000 | 09/19/2022 | 1,254 | 3,135,000 | 7,837 | 959,084 | (951,247 | ) | ||||||||||||||||||
| Eurodollar Futures |
98.000 | 12/19/2022 | 440 | 1,100,000 | 11,000 | 1,095,521 | (1,084,521 | ) | ||||||||||||||||||
| Eurodollar Futures |
98.750 | 12/19/2022 | 1,214 | 3,035,000 | 22,763 | 1,125,767 | (1,103,004 | ) | ||||||||||||||||||
| Eurodollar Futures |
99.000 | 12/19/2022 | 4,624 | 11,560,000 | 57,801 | 6,584,669 | (6,526,868 | ) | ||||||||||||||||||
| Eurodollar Futures |
95.875 | 03/13/2023 | 409 | 1,022,500 | 337,425 | 946,649 | (609,224 | ) | ||||||||||||||||||
| Eurodollar Futures |
97.750 | 03/13/2023 | 1,661 | 4,152,500 | 114,194 | 6,003,736 | (5,889,542 | ) | ||||||||||||||||||
| Eurodollar Futures |
95.875 | 06/20/2023 | 649 | 1,622,500 | 762,575 | 1,528,393 | (765,818 | ) | ||||||||||||||||||
| Eurodollar Futures |
97.750 | 06/20/2023 | 935 | 2,337,500 | 128,562 | 3,813,056 | (3,684,494 | ) | ||||||||||||||||||
| Eurodollar Futures |
95.875 | 09/18/2023 | 609 | 1,522,500 | 993,431 | 1,589,275 | (595,844 | ) | ||||||||||||||||||
| Eurodollar Futures |
97.250 | 12/18/2023 | 933 | 2,332,500 | 635,606 | 1,077,136 | (441,530 | ) | ||||||||||||||||||
| Eurodollar Futures |
97.500 | 03/18/2024 | 2,415 | 6,037,500 | 1,796,156 | 2,868,978 | (1,072,822 | ) | ||||||||||||||||||
| Eurodollar Futures |
97.500 | 06/17/2024 | 2,117 | 5,292,500 | 2,011,150 | 2,828,186 | (817,036 | ) | ||||||||||||||||||
| TOTAL | 17,716 | $ | 44,290,000 | $ | 6,881,350 | $ | 31,510,208 | $ | (24,628,858 | ) | ||||||||||||||||
EXCHANGE TRADED OPTIONS ON EQUITIES CONTRACTS
| Description | Exercise Price |
Expiration Date |
Number of Contracts |
Notional Amount |
Market Value |
Premiums Paid (Received) by Fund |
Unrealized Appreciation/ (Depreciation) |
|||||||||||||||||||
| Written option contracts |
||||||||||||||||||||||||||
| Calls |
||||||||||||||||||||||||||
| Euro Stoxx 50 Index |
$ 3,550.000 | 09/16/2022 | (45 | ) | $ | (15,975,000 | ) | $ | (27,225 | ) | $ | (42,477 | ) | $ | 15,252 | |||||||||||
| Euro Stoxx 50 Index |
3,600.000 | 09/16/2022 | (7 | ) | (2,520,000 | ) | (2,708 | ) | (9,150 | ) | 6,442 | |||||||||||||||
| Euro Stoxx 50 Index |
3,625.000 | 09/16/2022 | (20 | ) | (7,250,000 | ) | (5,989 | ) | (14,843 | ) | 8,854 | |||||||||||||||
| Euro Stoxx 50 Index |
3,650.000 | 09/16/2022 | (32 | ) | (11,680,000 | ) | (7,236 | ) | (22,933 | ) | 15,697 | |||||||||||||||
| Euro Stoxx 50 Index |
3,750.000 | 09/16/2022 | (37 | ) | (13,875,000 | ) | (2,343 | ) | (20,992 | ) | 18,649 | |||||||||||||||
| Euro Stoxx 50 Index |
3,775.000 | 09/16/2022 | (26 | ) | (9,815,000 | ) | (1,176 | ) | (19,853 | ) | 18,677 | |||||||||||||||
| Euro Stoxx 50 Index |
3,875.000 | 09/16/2022 | (33 | ) | (12,787,500 | ) | (398 | ) | (11,937 | ) | 11,539 | |||||||||||||||
| Euro Stoxx 50 Index |
3,800.000 | 10/21/2022 | (7 | ) | (2,660,000 | ) | (1,646 | ) | (5,083 | ) | 3,437 | |||||||||||||||
| Euro Stoxx 50 Index |
3,825.000 | 10/21/2022 | (50 | ) | (19,125,000 | ) | (9,598 | ) | (30,203 | ) | 20,605 | |||||||||||||||
| Euro Stoxx 50 Index |
3,925.000 | 10/21/2022 | (48 | ) | (18,840,000 | ) | (3,907 | ) | (27,637 | ) | 23,730 | |||||||||||||||
| Euro Stoxx 50 Index |
3,950.000 | 10/21/2022 | (36 | ) | (14,220,000 | ) | (2,315 | ) | (13,622 | ) | 11,307 | |||||||||||||||
| Euro Stoxx 50 Index |
3,875.000 | 11/18/2022 | (6 | ) | (2,325,000 | ) | (1,634 | ) | (3,079 | ) | 1,445 | |||||||||||||||
| FTSE 100 Index |
7,300.000 | 09/16/2022 | (10 | ) | (7,300,000 | ) | (12,023 | ) | (14,917 | ) | 2,894 | |||||||||||||||
| FTSE 100 Index |
7,325.000 | 09/16/2022 | (2 | ) | (1,465,000 | ) | (2,092 | ) | (4,236 | ) | 2,144 | |||||||||||||||
| FTSE 100 Index |
7,450.000 | 09/16/2022 | (7 | ) | (5,215,000 | ) | (3,090 | ) | (8,938 | ) | 5,848 | |||||||||||||||
| FTSE 100 Index |
7,475.000 | 09/16/2022 | (12 | ) | (8,970,000 | ) | (4,322 | ) | (12,850 | ) | 8,528 | |||||||||||||||
| FTSE 100 Index |
7,525.000 | 09/16/2022 | (6 | ) | (4,515,000 | ) | (1,394 | ) | (7,202 | ) | 5,808 | |||||||||||||||
| FTSE 100 Index |
7,625.000 | 09/16/2022 | (7 | ) | (5,337,500 | ) | (569 | ) | (4,701 | ) | 4,132 | |||||||||||||||
| FTSE 100 Index |
7,700.000 | 09/16/2022 | (1 | ) | (770,000 | ) | (35 | ) | (530 | ) | 495 | |||||||||||||||
| FTSE 100 Index |
7,575.000 | 10/21/2022 | (2 | ) | (1,515,000 | ) | (1,522 | ) | (2,456 | ) | 934 | |||||||||||||||
| FTSE 100 Index |
7,625.000 | 10/21/2022 | (3 | ) | (2,287,500 | ) | (1,795 | ) | (4,398 | ) | 2,603 | |||||||||||||||
| FTSE 100 Index |
7,725.000 | 10/21/2022 | (4 | ) | (3,090,000 | ) | (1,394 | ) | (4,000 | ) | 2,606 | |||||||||||||||
| FTSE 100 Index |
7,750.000 | 10/21/2022 | (14 | ) | (10,850,000 | ) | (4,228 | ) | (11,091 | ) | 6,863 | |||||||||||||||
| The accompanying notes are an integral part of these financial statements. | 41 |
GOLDMAN SACHS GLOBAL MANAGED BETA FUND
Schedule of Investments (continued)
August 31, 2022
| ADDITIONAL INVESTMENT INFORMATION (continued) |
EXCHANGE TRADED OPTIONS ON EQUITIES CONTRACTS (continued)
| Description | Exercise Price |
Expiration Date |
Number of Contracts |
Notional Amount |
Market Value |
Premiums Paid (Received) by Fund |
Unrealized Appreciation/ (Depreciation) |
|||||||||||||||||||
| FTSE 100 Index |
$ 7,825.000 | 10/21/2022 | (8 | ) | $ | (6,260,000 | ) | $ | (1,580 | ) | $ | (6,462 | ) | $ | 4,882 | |||||||||||
| FTSE 100 Index |
7,825.000 | 11/18/2022 | (1 | ) | (782,500 | ) | (499 | ) | (955 | ) | 456 | |||||||||||||||
| Nikkei 225 Index |
27,250.000 | 09/09/2022 | (6 | ) | (16,350,000 | ) | (41,029 | ) | (26,846 | ) | (14,183 | ) | ||||||||||||||
| Nikkei 225 Index |
27,375.000 | 09/09/2022 | (2 | ) | (5,475,000 | ) | (12,165 | ) | (9,002 | ) | (3,163 | ) | ||||||||||||||
| Nikkei 225 Index |
27,500.000 | 09/09/2022 | (5 | ) | (13,750,000 | ) | (25,913 | ) | (19,160 | ) | (6,753 | ) | ||||||||||||||
| Nikkei 225 Index |
27,750.000 | 09/09/2022 | (1 | ) | (2,775,000 | ) | (3,887 | ) | (2,738 | ) | (1,149 | ) | ||||||||||||||
| Nikkei 225 Index |
28,000.000 | 09/09/2022 | (4 | ) | (11,200,000 | ) | (9,789 | ) | (6,770 | ) | (3,019 | ) | ||||||||||||||
| Nikkei 225 Index |
28,625.000 | 09/09/2022 | (4 | ) | (11,450,000 | ) | (2,505 | ) | (9,156 | ) | 6,651 | |||||||||||||||
| Nikkei 225 Index |
28,750.000 | 09/09/2022 | (4 | ) | (11,500,000 | ) | (1,728 | ) | (10,821 | ) | 9,093 | |||||||||||||||
| Nikkei 225 Index |
27,625.000 | 10/14/2022 | (1 | ) | (2,762,500 | ) | (6,083 | ) | (4,339 | ) | (1,744 | ) | ||||||||||||||
| Nikkei 225 Index |
28,750.000 | 10/14/2022 | (4 | ) | (11,500,000 | ) | (8,206 | ) | (13,465 | ) | 5,259 | |||||||||||||||
| Nikkei 225 Index |
28,875.000 | 10/14/2022 | (5 | ) | (14,437,500 | ) | (8,818 | ) | (15,257 | ) | 6,439 | |||||||||||||||
| Nikkei 225 Index |
29,000.000 | 10/14/2022 | (5 | ) | (14,500,000 | ) | (7,558 | ) | (18,743 | ) | 11,185 | |||||||||||||||
| Nikkei 225 Index |
29,125.000 | 10/14/2022 | (3 | ) | (8,737,500 | ) | (3,995 | ) | (8,428 | ) | 4,433 | |||||||||||||||
| Nikkei 225 Index |
30,125.000 | 10/14/2022 | (4 | ) | (12,050,000 | ) | (1,296 | ) | (5,374 | ) | 4,078 | |||||||||||||||
| Nikkei 225 Index |
29,500.000 | 11/11/2022 | (2 | ) | (5,900,000 | ) | (3,743 | ) | (6,556 | ) | 2,813 | |||||||||||||||
| Nikkei 225 Index |
30,500.000 | 11/11/2022 | (1 | ) | (3,050,000 | ) | (713 | ) | (1,780 | ) | 1,067 | |||||||||||||||
| S&P 500 Index |
4,225.000 | 09/07/2022 | (25 | ) | (10,562,500 | ) | (625 | ) | (170,219 | ) | 169,594 | |||||||||||||||
| S&P 500 Index |
4,425.000 | 09/14/2022 | (24 | ) | (10,620,000 | ) | (420 | ) | (50,701 | ) | 50,281 | |||||||||||||||
| S&P 500 Index |
4,250.000 | 09/21/2022 | (26 | ) | (11,050,000 | ) | (13,780 | ) | (118,197 | ) | 104,417 | |||||||||||||||
| S&P 500 Index |
4,110.000 | 09/28/2022 | (27 | ) | (11,097,000 | ) | (97,875 | ) | (129,958 | ) | 32,083 | |||||||||||||||
| S&P 500 Index |
4,015.000 | 09/30/2022 | (3 | ) | (1,204,500 | ) | (23,115 | ) | (20,698 | ) | (2,417 | ) | ||||||||||||||
| S&P 500 Index |
4,035.000 | 09/30/2022 | (1 | ) | (403,500 | ) | (6,725 | ) | (8,559 | ) | 1,834 | |||||||||||||||
| S&P 500 Index |
4,100.000 | 09/30/2022 | (7 | ) | (2,870,000 | ) | (29,610 | ) | (55,155 | ) | 25,545 | |||||||||||||||
| S&P 500 Index |
4,115.000 | 09/30/2022 | (21 | ) | (8,641,500 | ) | (80,220 | ) | (105,946 | ) | 25,726 | |||||||||||||||
| S&P 500 Index |
4,120.000 | 09/30/2022 | (21 | ) | (8,652,000 | ) | (76,965 | ) | (101,099 | ) | 24,134 | |||||||||||||||
| S&P 500 Index |
4,125.000 | 09/30/2022 | (26 | ) | (10,725,000 | ) | (89,830 | ) | (137,697 | ) | 47,867 | |||||||||||||||
| S&P 500 Index |
4,130.000 | 09/30/2022 | (21 | ) | (8,673,000 | ) | (70,770 | ) | (94,061 | ) | 23,291 | |||||||||||||||
| S&P 500 Index |
4,135.000 | 09/30/2022 | (21 | ) | (8,683,500 | ) | (67,830 | ) | (90,403 | ) | 22,573 | |||||||||||||||
| S&P 500 Index |
4,270.000 | 09/30/2022 | (8 | ) | (3,416,000 | ) | (7,040 | ) | (52,534 | ) | 45,494 | |||||||||||||||
| S&P 500 Index |
4,280.000 | 09/30/2022 | (2 | ) | (856,000 | ) | (1,599 | ) | (10,158 | ) | 8,559 | |||||||||||||||
| S&P 500 Index |
4,290.000 | 09/30/2022 | (6 | ) | (2,574,000 | ) | (4,320 | ) | (46,940 | ) | 42,620 | |||||||||||||||
| S&P 500 Index |
4,460.000 | 09/30/2022 | (4 | ) | (1,784,000 | ) | (470 | ) | (10,461 | ) | 9,991 | |||||||||||||||
| S&P 500 Index |
4,180.000 | 10/31/2022 | (8 | ) | (3,344,000 | ) | (41,160 | ) | (50,463 | ) | 9,303 | |||||||||||||||
| S&P 500 Index |
4,340.000 | 10/31/2022 | (6 | ) | (2,604,000 | ) | (9,810 | ) | (38,396 | ) | 28,586 | |||||||||||||||
| S&P 500 Index |
4,345.000 | 10/31/2022 | (2 | ) | (869,000 | ) | (3,209 | ) | (18,018 | ) | 14,809 | |||||||||||||||
| S&P 500 Index |
4,520.000 | 10/31/2022 | (4 | ) | (1,808,000 | ) | (1,580 | ) | (18,557 | ) | 16,977 | |||||||||||||||
| (738 | ) | $ | (445,305,000 | ) | $ | (865,099 | ) | $ | (1,791,200 | ) | $ | 926,101 | ||||||||||||||
| Puts |
||||||||||||||||||||||||||
| Euro Stoxx 50 Index |
26,875.000 | 09/09/2022 | (3 | ) | (8,062,500 | ) | (950 | ) | (7,398 | ) | 6,448 | |||||||||||||||
| Euro Stoxx 50 Index |
3,475.000 | 09/16/2022 | (26 | ) | (9,035,000 | ) | (15,233 | ) | (11,433 | ) | (3,800 | ) | ||||||||||||||
| Euro Stoxx 50 Index |
3,830.000 | 09/30/2022 | (21 | ) | (8,043,000 | ) | (128,415 | ) | (110,495 | ) | (17,920 | ) | ||||||||||||||
| Euro Stoxx 50 Index |
3,150.000 | 09/16/2022 | (45 | ) | (14,175,000 | ) | (2,985 | ) | (29,659 | ) | 26,674 | |||||||||||||||
| Euro Stoxx 50 Index |
3,175.000 | 09/16/2022 | (27 | ) | (8,572,500 | ) | (2,143 | ) | (21,960 | ) | 19,817 | |||||||||||||||
| Euro Stoxx 50 Index |
3,225.000 | 09/16/2022 | (32 | ) | (10,320,000 | ) | (3,569 | ) | (24,912 | ) | 21,343 | |||||||||||||||
| Euro Stoxx 50 Index |
3,400.000 | 09/16/2022 | (37 | ) | (12,580,000 | ) | (13,683 | ) | (25,038 | ) | 11,355 | |||||||||||||||
| Euro Stoxx 50 Index |
3,600.000 | 09/16/2022 | (19 | ) | (6,840,000 | ) | (22,626 | ) | (11,051 | ) | (11,575 | ) | ||||||||||||||
| Euro Stoxx 50 Index |
3,625.000 | 09/16/2022 | (11 | ) | (3,987,500 | ) | (14,901 | ) | (4,893 | ) | (10,008 | ) | ||||||||||||||
| Euro Stoxx 50 Index |
3,675.000 | 09/16/2022 | (3 | ) | (1,102,500 | ) | (5,177 | ) | (1,693 | ) | (3,484 | ) | ||||||||||||||
| Euro Stoxx 50 Index |
3,350.000 | 10/21/2022 | (7 | ) | (2,345,000 | ) | (5,269 | ) | (6,558 | ) | 1,289 | |||||||||||||||
| 42 | The accompanying notes are an integral part of these financial statements. |
GOLDMAN SACHS GLOBAL MANAGED BETA FUND
| ADDITIONAL INVESTMENT INFORMATION (continued) |
EXCHANGE TRADED OPTIONS ON EQUITIES CONTRACTS (continued)
| Description | Exercise Price |
Expiration Date |
Number of Contracts |
Notional Amount |
Market Value |
Premiums Paid (Received) by Fund |
Unrealized Appreciation/ (Depreciation) |
|||||||||||||||||||
| Euro Stoxx 50 Index |
$ 3,425.000 | 10/21/2022 | (15 | ) | $ | (5,137,500 | ) | $ | (14,607 | ) | $ | (10,528 | ) | $ | (4,079 | ) | ||||||||||
| Euro Stoxx 50 Index |
3,500.000 | 10/21/2022 | (35 | ) | (12,250,000 | ) | (43,791 | ) | (27,502 | ) | (16,289 | ) | ||||||||||||||
| Euro Stoxx 50 Index |
3,550.000 | 10/21/2022 | (20 | ) | (7,100,000 | ) | (29,425 | ) | (17,635 | ) | (11,790 | ) | ||||||||||||||
| Euro Stoxx 50 Index |
3,575.000 | 10/21/2022 | (28 | ) | (10,010,000 | ) | (44,627 | ) | (21,623 | ) | (23,004 | ) | ||||||||||||||
| Euro Stoxx 50 Index |
3,600.000 | 10/21/2022 | (36 | ) | (12,960,000 | ) | (62,045 | ) | (30,129 | ) | (31,916 | ) | ||||||||||||||
| Euro Stoxx 50 Index |
3,450.000 | 11/18/2022 | (6 | ) | (2,070,000 | ) | (8,321 | ) | (5,661 | ) | (2,660 | ) | ||||||||||||||
| FTSE 100 Index |
6,600.000 | 09/16/2022 | (2 | ) | (1,320,000 | ) | (174 | ) | (2,872 | ) | 2,698 | |||||||||||||||
| FTSE 100 Index |
6,650.000 | 09/16/2022 | (10 | ) | (6,650,000 | ) | (1,045 | ) | (13,504 | ) | 12,459 | |||||||||||||||
| FTSE 100 Index |
6,750.000 | 09/16/2022 | (4 | ) | (2,700,000 | ) | (581 | ) | (7,688 | ) | 7,107 | |||||||||||||||
| FTSE 100 Index |
6,775.000 | 09/16/2022 | (7 | ) | (4,742,500 | ) | (1,139 | ) | (12,309 | ) | 11,170 | |||||||||||||||
| FTSE 100 Index |
6,950.000 | 09/16/2022 | (8 | ) | (5,560,000 | ) | (2,556 | ) | (10,371 | ) | 7,815 | |||||||||||||||
| FTSE 100 Index |
7,075.000 | 09/16/2022 | (6 | ) | (4,245,000 | ) | (3,241 | ) | (5,742 | ) | 2,501 | |||||||||||||||
| FTSE 100 Index |
7,225.000 | 09/16/2022 | (4 | ) | (2,890,000 | ) | (3,996 | ) | (4,222 | ) | 226 | |||||||||||||||
| FTSE 100 Index |
7,300.000 | 09/16/2022 | (2 | ) | (1,460,000 | ) | (2,695 | ) | (1,793 | ) | (902 | ) | ||||||||||||||
| FTSE 100 Index |
7,400.000 | 09/16/2022 | (1 | ) | (740,000 | ) | (1,951 | ) | (720 | ) | (1,231 | ) | ||||||||||||||
| FTSE 100 Index |
6,900.000 | 10/21/2022 | (2 | ) | (1,380,000 | ) | (1,940 | ) | (3,692 | ) | 1,752 | |||||||||||||||
| FTSE 100 Index |
7,000.000 | 10/21/2022 | (3 | ) | (2,100,000 | ) | (3,642 | ) | (4,398 | ) | 756 | |||||||||||||||
| FTSE 100 Index |
7,150.000 | 10/21/2022 | (4 | ) | (2,860,000 | ) | (6,761 | ) | (6,467 | ) | (294 | ) | ||||||||||||||
| FTSE 100 Index |
7,225.000 | 10/21/2022 | (6 | ) | (4,335,000 | ) | (11,884 | ) | (8,964 | ) | (2,920 | ) | ||||||||||||||
| FTSE 100 Index |
7,275.000 | 10/21/2022 | (8 | ) | (5,820,000 | ) | (17,658 | ) | (10,858 | ) | (6,800 | ) | ||||||||||||||
| FTSE 100 Index |
7,325.000 | 10/21/2022 | (8 | ) | (5,860,000 | ) | (19,656 | ) | (10,670 | ) | (8,986 | ) | ||||||||||||||
| FTSE 100 Index |
7,225.000 | 11/18/2022 | (1 | ) | (722,500 | ) | (2,602 | ) | (1,812 | ) | (790 | ) | ||||||||||||||
| Nikkei 225 Index |
24,500.000 | 09/09/2022 | (2 | ) | (4,900,000 | ) | (58 | ) | (6,566 | ) | 6,508 | |||||||||||||||
| Nikkei 225 Index |
24,625.000 | 09/09/2022 | (6 | ) | (14,775,000 | ) | (216 | ) | (14,617 | ) | 14,401 | |||||||||||||||
| Nikkei 225 Index |
24,750.000 | 09/09/2022 | (1 | ) | (2,475,000 | ) | (36 | ) | (5,552 | ) | 5,516 | |||||||||||||||
| Nikkei 225 Index |
25,250.000 | 09/09/2022 | (5 | ) | (12,625,000 | ) | (252 | ) | (13,553 | ) | 13,301 | |||||||||||||||
| Nikkei 225 Index |
25,375.000 | 09/09/2022 | (4 | ) | (10,150,000 | ) | (202 | ) | (22,246 | ) | 22,044 | |||||||||||||||
| Nikkei 225 Index |
26,625.000 | 09/09/2022 | (4 | ) | (10,650,000 | ) | (921 | ) | (10,089 | ) | 9,168 | |||||||||||||||
| Nikkei 225 Index |
27,000.000 | 09/09/2022 | (1 | ) | (2,700,000 | ) | (359 | ) | (1,959 | ) | 1,600 | |||||||||||||||
| Nikkei 225 Index |
24,750.000 | 10/14/2022 | (1 | ) | (2,475,000 | ) | (756 | ) | (3,724 | ) | 2,968 | |||||||||||||||
| Nikkei 225 Index |
26,125.000 | 10/14/2022 | (2 | ) | (5,225,000 | ) | (3,311 | ) | (7,459 | ) | 4,148 | |||||||||||||||
| Nikkei 225 Index |
26,375.000 | 10/14/2022 | (7 | ) | (18,462,500 | ) | (13,353 | ) | (23,701 | ) | 10,348 | |||||||||||||||
| Nikkei 225 Index |
26,750.000 | 10/14/2022 | (5 | ) | (13,375,000 | ) | (11,877 | ) | (12,741 | ) | 864 | |||||||||||||||
| Nikkei 225 Index |
27,250.000 | 10/14/2022 | (3 | ) | (8,175,000 | ) | (9,933 | ) | (6,697 | ) | (3,236 | ) | ||||||||||||||
| Nikkei 225 Index |
28,125.000 | 10/14/2022 | (4 | ) | (11,250,000 | ) | (22,603 | ) | (16,869 | ) | (5,734 | ) | ||||||||||||||
| Nikkei 225 Index |
27,000.000 | 11/11/2022 | (2 | ) | (5,400,000 | ) | (9,070 | ) | (6,556 | ) | (2,514 | ) | ||||||||||||||
| Nikkei 225 Index |
27,875.000 | 11/11/2022 | (1 | ) | (2,787,500 | ) | (6,766 | ) | (5,163 | ) | (1,603 | ) | ||||||||||||||
| S&P 500 Index |
4,000.000 | 09/07/2022 | (26 | ) | (10,400,000 | ) | (181,480 | ) | (67,111 | ) | (114,369 | ) | ||||||||||||||
| S&P 500 Index |
4,200.000 | 09/14/2022 | (24 | ) | (10,080,000 | ) | (595,320 | ) | (138,513 | ) | (456,807 | ) | ||||||||||||||
| S&P 500 Index |
4,010.000 | 09/21/2022 | (26 | ) | (10,426,000 | ) | (300,300 | ) | (125,230 | ) | (175,070 | ) | ||||||||||||||
| S&P 500 Index |
3,850.000 | 09/28/2022 | (27 | ) | (10,395,000 | ) | (169,020 | ) | (143,485 | ) | (25,535 | ) | ||||||||||||||
| S&P 500 Index |
3,550.000 | 09/30/2022 | (4 | ) | (1,420,000 | ) | (7,060 | ) | (37,762 | ) | 30,702 | |||||||||||||||
| S&P 500 Index |
3,695.000 | 09/30/2022 | (5 | ) | (1,847,500 | ) | (17,000 | ) | (37,749 | ) | 20,749 | |||||||||||||||
| S&P 500 Index |
3,700.000 | 09/30/2022 | (7 | ) | (2,590,000 | ) | (24,395 | ) | (47,091 | ) | 22,696 | |||||||||||||||
| S&P 500 Index |
3,825.000 | 09/30/2022 | (21 | ) | (8,032,500 | ) | (125,580 | ) | (107,771 | ) | (17,809 | ) | ||||||||||||||
| S&P 500 Index |
3,835.000 | 09/30/2022 | (21 | ) | (8,053,500 | ) | (131,250 | ) | (112,961 | ) | (18,289 | ) | ||||||||||||||
| S&P 500 Index |
3,840.000 | 09/30/2022 | (21 | ) | (8,064,000 | ) | (134,190 | ) | (115,481 | ) | (18,709 | ) | ||||||||||||||
| S&P 500 Index |
3,845.000 | 09/30/2022 | (21 | ) | (8,074,500 | ) | (137,025 | ) | (117,763 | ) | (19,262 | ) | ||||||||||||||
| S&P 500 Index |
3,895.000 | 09/30/2022 | (8 | ) | (3,116,000 | ) | (65,440 | ) | (51,977 | ) | (13,463 | ) | ||||||||||||||
| S&P 500 Index |
3,955.000 | 09/30/2022 | (6 | ) | (2,373,000 | ) | (62,820 | ) | (28,602 | ) | (34,218 | ) | ||||||||||||||
| S&P 500 Index |
3,985.000 | 09/30/2022 | (2 | ) | (797,000 | ) | (23,781 | ) | (10,899 | ) | (12,882 | ) | ||||||||||||||
| S&P 500 Index |
4,170.000 | 09/30/2022 | (4 | ) | (1,668,000 | ) | (93,420 | ) | (43,547 | ) | (49,873 | ) | ||||||||||||||
| The accompanying notes are an integral part of these financial statements. | 43 |
GOLDMAN SACHS GLOBAL MANAGED BETA FUND
Schedule of Investments (continued)
August 31, 2022
| ADDITIONAL INVESTMENT INFORMATION (continued) |
EXCHANGE TRADED OPTIONS ON EQUITIES CONTRACTS (continued)
| Description | Exercise Price |
Expiration Date |
Number of Contracts |
Notional Amount |
Market Value |
Premiums Paid (Received) by Fund |
Unrealized Appreciation/ (Depreciation) |
|||||||||||||||||||
| S&P 500 Index |
$ 3,785.000 | 10/31/2022 | (8 | ) | $ | (3,028,000 | ) | $ | (68,480 | ) | $ | (61,248 | ) | $ | (7,232 | ) | ||||||||||
| S&P 500 Index |
3,920.000 | 10/31/2022 | (2 | ) | (784,000 | ) | (26,231 | ) | (13,719 | ) | (12,512 | ) | ||||||||||||||
| S&P 500 Index |
3,945.000 | 10/31/2022 | (6 | ) | (2,367,000 | ) | (84,031 | ) | (47,576 | ) | (36,455 | ) | ||||||||||||||
| S&P 500 Index |
4,135.000 | 10/31/2022 | (4 | ) | (1,654,000 | ) | (94,380 | ) | (40,213 | ) | (54,167 | ) | ||||||||||||||
| (738 | ) | $ | (408,570,500 | ) | $ | (2,920,204 | ) | $ | (1,980,440 | ) | $ | (939,764 | ) | |||||||||||||
| TOTAL | (1,476 | ) | $ | (853,875,500 | ) | $ | (3,785,303 | ) | $ | (3,771,640 | ) | $ | (13,663 | ) | ||||||||||||
OVER-THE-COUNTER OPTIONS ON FOREIGN CURRENCY
| Description | Counterparty | Exercise Price |
Expiration Date |
Number of Contracts |
Notional Amount |
Market Value |
Premiums Paid (Received) by Fund |
Unrealized Appreciation/ (Depreciation) |
||||||||||||||||||||||
| Purchased option contracts |
||||||||||||||||||||||||||||||
| Calls |
||||||||||||||||||||||||||||||
| Call CHF/Put SEK |
MS & Co. Int. PLC | $ | 10.177 | 11/10/2022 | 83,303,000 | $ | 83,303,000 | $ | 5,980,005 | $ | 967,724 | $ | 5,012,281 | |||||||||||||||||
| Call JPY/Put KRW |
MS & Co. Int. PLC | 11.634 | 11/11/2022 | 7,431,822,000 | 7,431,822,000 | 19,419 | 915,432 | (896,013 | ) | |||||||||||||||||||||
| Call CHF/Put NOK |
MS & Co. Int. PLC | 10.969 | 01/27/2023 | 27,202,000 | 27,202,000 | 339,781 | 489,630 | (149,849 | ) | |||||||||||||||||||||
| Call USD/Put CAD |
MS & Co. Int. PLC | 1.335 | 11/09/2022 | 80,791,000 | 80,791,000 | 643,662 | 678,644 | (34,982 | ) | |||||||||||||||||||||
| 7,623,118,000 | 7,623,118,000 | 6,982,867 | 3,051,430 | 3,931,437 | ||||||||||||||||||||||||||
| Puts |
||||||||||||||||||||||||||||||
| Put NZD/Call USD |
MS & Co. Int. PLC | 0.636 | 11/11/2022 | 69,837,000 | 69,837,000 | 1,976,294 | 657,376 | 1,318,918 | ||||||||||||||||||||||
| Put AUD/Call USD |
MS & Co. Int. PLC | 0.672 | 11/14/2022 | 34,183,000 | 34,183,000 | 351,056 | 348,267 | 2,789 | ||||||||||||||||||||||
| Put AUD/Call USD |
MS & Co. Int. PLC | 0.646 | 01/27/2023 | 27,781,000 | 27,781,000 | 235,961 | 274,866 | (38,905 | ) | |||||||||||||||||||||
| 131,801,000 | 131,801,000 | 2,563,311 | 1,280,509 | 1,282,802 | ||||||||||||||||||||||||||
| Total Purchased Option Contracts |
|
7,754,919,000 | $ | 7,754,919,000 | $ | 9,546,178 | $ | 4,331,939 | $ | 5,214,239 | ||||||||||||||||||||
| Written option contracts |
||||||||||||||||||||||||||||||
| Calls |
||||||||||||||||||||||||||||||
| Call CHF/Put C SEK |
MS & Co. Int. PLC | 10.177 | 11/10/2022 | (83,303,000 | ) | (83,303,000 | ) | (5,980,005 | ) | (2,027,570 | ) | (3,952,435 | ) | |||||||||||||||||
| TOTAL |
|
7,671,616,000 | $ | 7,671,616,000 | $ | 3,566,173 | $ | 2,304,369 | $ | 1,261,804 | ||||||||||||||||||||
|
| ||
| Abbreviation: | ||
| MS & Co. Int. PLC |
—Morgan Stanley & Co. International PLC | |
|
| ||
| 44 | The accompanying notes are an integral part of these financial statements. |
GOLDMAN SACHS STRATEGIC FACTOR ALLOCATION FUND
Schedule of Investments
August 31, 2022
| Shares | Dividend Rate |
Value | ||||||
| Investment Company(a) – 74.2% | ||||||||
| Goldman Sachs Financial Square Government Fund – Institutional Shares |
||||||||
| 1,564,632,614 | 2.154 | % | $ | 1,564,632,614 | ||||
| (Cost $1,564,632,614) | ||||||||
|
|
||||||||
| TOTAL INVESTMENTS – 74.2% |
||||||||
| (Cost $1,564,632,614) | $ | 1,564,632,614 | ||||||
|
|
||||||||
| OTHER ASSETS IN EXCESS OF LIABILITIES – 25.8% |
543,730,601 | |||||||
|
|
||||||||
| NET ASSETS – 100.0% | $ | 2,108,363,215 | ||||||
|
|
||||||||
| The percentage shown for each investment category reflects the value of investments in that category as a percentage of net assets. | ||
| (a) |
Represents an affiliated fund. | |
|
| ||
| Currency Abbreviations: | ||
| CAD |
—Canadian Dollar | |
| CHF |
—Swiss Franc | |
| EUR |
—Euro | |
| GBP |
—British Pound | |
| JPY |
—Japanese Yen | |
| NZD |
—New Zealand Dollar | |
| USD |
—U.S. Dollar | |
|
| ||
| ADDITIONAL INVESTMENT INFORMATION |
FORWARD FOREIGN CURRENCY EXCHANGE CONTRACTS — At August 31, 2022, the Fund had the following forward foreign currency exchange contracts:
FORWARD FOREIGN CURRENCY EXCHANGE CONTRACTS WITH UNREALIZED GAIN
| Counterparty | Currency Purchased |
Currency Sold |
Settlement Date |
Unrealized Gain |
||||||||||||||||
| MS & Co. Int. PLC |
USD | 48,495,848 | CHF | 47,190,000 | 09/23/22 | $ | 129,048 | |||||||||||||
| USD | 206,750,028 | GBP | 174,860,000 | 09/23/22 | 3,524,478 | |||||||||||||||
| USD | 40,872,653 | JPY | 5,658,630,000 | 09/26/22 | 55,245 | |||||||||||||||
| TOTAL |
|
$ | 3,708,771 | |||||||||||||||||
FORWARD FOREIGN CURRENCY EXCHANGE CONTRACTS WITH UNREALIZED LOSS
| Counterparty | Currency Purchased |
Currency Sold |
Settlement Date |
Unrealized Loss |
||||||||||||||||
| MS & Co. Int. PLC |
CAD | 62,430,000 | USD | 47,768,862 | 09/23/22 | $ | (242,425 | ) | ||||||||||||
| CHF | 27,310,000 | USD | 28,550,804 | 09/23/22 | (559,761 | ) | ||||||||||||||
| GBP | 157,320,000 | USD | 183,256,149 | 09/23/22 | (415,914 | ) | ||||||||||||||
| NZD | 25,920,000 | USD | 15,901,609 | 09/23/22 | (43,151 | ) | ||||||||||||||
| USD | 82,077,036 | EUR | 81,600,000 | 09/23/22 | (54,357 | ) | ||||||||||||||
| TOTAL |
|
$ | (1,315,608 | ) | ||||||||||||||||
FUTURES CONTRACTS — At August 31, 2022, the Fund had the following futures contracts:
| Description | Number of Contracts |
Expiration Date |
Notional Amount |
Unrealized Appreciation/ (Depreciation) |
||||||||||||
| Long position contracts: |
||||||||||||||||
| S&P 500 E-Mini Index |
5,420 | 09/16/22 | $ | 1,072,211,500 | $ | 1,516,542 | ||||||||||
| 10 Year U.S. Treasury Notes |
9,509 | 12/20/22 | 1,111,661,531 | (7,369,422 | ) | |||||||||||
| Total |
|
$ | (5,852,880 | ) | ||||||||||||
| Short position contracts: |
||||||||||||||||
| 20 Year U.S. Treasury Bonds |
(1,114 | ) | 12/20/22 | $ | (151,329,937 | ) | $ | 1,328,832 | ||||||||
| TOTAL FUTURES CONTRACTS |
|
$ | (4,524,048 | ) | ||||||||||||
| The accompanying notes are an integral part of these financial statements. | 45 |
GOLDMAN SACHS STRATEGIC FACTOR ALLOCATION FUND
Schedule of Investments (continued)
August 31, 2022
| ADDITIONAL INVESTMENT INFORMATION (continued) |
PURCHASED AND WRITTEN OPTIONS CONTRACTS — At August 31, 2022, the Fund had the following purchased and written options:
EXCHANGE TRADED OPTIONS ON FUTURES
| Description | Exercise Price |
Expiration Date |
Number of Contracts |
Notional Amount |
Market Value |
Premiums Paid (Received) by Fund |
Unrealized Appreciation/ (Depreciation) |
|||||||||||||||||||
| Written option contracts |
||||||||||||||||||||||||||
| Puts |
||||||||||||||||||||||||||
| U.S. Treasury Bonds |
$131.000 | 09/23/2022 | (975 | ) | $ | (975,000 | ) | $ | (380,859 | ) | $ | (576,731 | ) | $ | 195,872 | |||||||||||
| U.S. Treasury Bonds |
131.000 | 10/21/2022 | (1,006 | ) | (1,006,000 | ) | (1,131,750 | ) | (951,485 | ) | (180,265 | ) | ||||||||||||||
| U.S. Treasury Bonds |
137.000 | 09/23/2022 | (978 | ) | (978,000 | ) | (2,567,250 | ) | (853,882 | ) | (1,713,368 | ) | ||||||||||||||
| TOTAL | (2,959 | ) | $ | (2,959,000 | ) | $ | (4,079,859 | ) | $ | (2,382,098 | ) | $ | (1,697,761 | ) | ||||||||||||
EXCHANGE TRADED OPTIONS ON EQUITIES CONTRACTS
| Description | Exercise Price |
Expiration Date |
Number of Contracts |
Notional Amount |
Market Value |
Premiums Paid (Received) by Fund |
Unrealized Appreciation/ (Depreciation) |
|||||||||||||||||||
| Purchased option contracts |
||||||||||||||||||||||||||
| Puts |
||||||||||||||||||||||||||
| S&P 500 Index |
$3,100.000 | 09/02/2022 | 489 | $ | 151,590,000 | $ | 1,222 | $ | 53,363 | $ | (52,141 | ) | ||||||||||||||
| S&P 500 Index |
3,150.000 | 09/02/2022 | 484 | 152,460,000 | 1,210 | 57,606 | (56,396 | ) | ||||||||||||||||||
| S&P 500 Index |
3,675.000 | 09/02/2022 | 403 | 148,102,500 | 6,045 | 33,764 | (27,719 | ) | ||||||||||||||||||
| S&P 500 Index |
3,000.000 | 09/06/2022 | 485 | 145,500,000 | 1,212 | 44,358 | (43,146 | ) | ||||||||||||||||||
| S&P 500 Index |
3,000.000 | 09/09/2022 | 488 | 146,400,000 | 4,880 | 55,450 | (50,570 | ) | ||||||||||||||||||
| S&P 500 Index |
3,150.000 | 09/09/2022 | 479 | 150,885,000 | 9,580 | 64,630 | (55,050 | ) | ||||||||||||||||||
| S&P 500 Index |
3,200.000 | 09/09/2022 | 484 | 154,880,000 | 12,100 | 61,216 | (49,116 | ) | ||||||||||||||||||
| S&P 500 Index |
3,040.000 | 09/16/2022 | 476 | 144,704,000 | 28,560 | 61,415 | (32,855 | ) | ||||||||||||||||||
| S&P 500 Index |
3,110.000 | 09/16/2022 | 469 | 145,859,000 | 35,175 | 60,971 | (25,796 | ) | ||||||||||||||||||
| S&P 500 Index |
3,175.000 | 09/16/2022 | 938 | 297,815,000 | 89,110 | 111,732 | (22,622 | ) | ||||||||||||||||||
| S&P 500 Index |
3,260.000 | 09/16/2022 | 469 | 152,894,000 | 62,142 | 60,435 | 1,707 | |||||||||||||||||||
| S&P 500 Index |
2,800.000 | 09/23/2022 | 970 | 271,600,000 | 67,900 | 113,207 | (45,307 | ) | ||||||||||||||||||
| S&P 500 Index |
2,900.000 | 09/23/2022 | 486 | 140,940,000 | 47,386 | 51,395 | (4,009 | ) | ||||||||||||||||||
| S&P 500 Index |
3,000.000 | 09/23/2022 | 959 | 287,700,000 | 127,068 | 116,714 | 10,354 | |||||||||||||||||||
| S&P 500 Index |
2,650.000 | 09/30/2022 | 501 | 132,765,000 | 42,585 | 58,590 | (16,005 | ) | ||||||||||||||||||
| S&P 500 Index |
2,700.000 | 09/30/2022 | 497 | 134,190,000 | 48,458 | 58,956 | (10,498 | ) | ||||||||||||||||||
| S&P 500 Index |
2,800.000 | 09/30/2022 | 975 | 273,000,000 | 126,750 | 136,035 | (9,285 | ) | ||||||||||||||||||
| Total purchased option contracts |
|
10,052 | $ | 3,031,284,500 | $ | 711,383 | $ | 1,199,837 | $ | (488,454 | ) | |||||||||||||||
| Written option contracts |
||||||||||||||||||||||||||
| Puts |
||||||||||||||||||||||||||
| S&P 500 Index |
3,650.000 | 09/06/2022 | (2,014 | ) | $ | (735,110,000 | ) | $ | (70,490 | ) | $ | (227,582 | ) | $ | 157,092 | |||||||||||
| S&P 500 Index |
3,700.000 | 09/07/2022 | (1,966 | ) | (727,420,000 | ) | (265,410 | ) | (300,798 | ) | 35,388 | |||||||||||||||
| S&P 500 Index |
3,750.000 | 09/02/2022 | (1,996 | ) | (748,500,000 | ) | (44,910 | ) | (215,568 | ) | 170,658 | |||||||||||||||
| S&P 500 Index |
3,775.000 | 09/02/2022 | (1,941 | ) | (732,727,500 | ) | (53,378 | ) | (296,973 | ) | 243,595 | |||||||||||||||
| Total written option contracts | (7,917 | ) | $ | (2,943,757,500 | ) | $ | (434,188 | ) | $ | (1,040,921 | ) | $ | 606,733 | |||||||||||||
| TOTAL | 2,135 | $ | 87,527,000 | $ | 277,195 | $ | 158,916 | $ | 118,279 | |||||||||||||||||
|
| ||
| Abbreviation: | ||
| MS & Co. Int. PLC—Morgan Stanley & Co. International PLC | ||
|
| ||
| 46 | The accompanying notes are an integral part of these financial statements. |
GOLDMAN SACHS STRATEGIC VOLATILITY PREMIUM FUND
Schedule of Investments
August 31, 2022
| Shares | Dividend Rate |
Value | ||||||
| Investment Company(a) – 67.1% | ||||||||
| Goldman Sachs Financial Square Government Fund – Institutional Shares |
||||||||
| 343,787,202 | 2.154 | % | $ | 343,787,202 | ||||
| (Cost $343,787,202) | ||||||||
|
|
||||||||
| TOTAL INVESTMENTS – 67.1% | ||||||||
| (Cost $343,787,202) | $ | 343,787,202 | ||||||
|
|
||||||||
| OTHER ASSETS IN EXCESS OF LIABILITIES – 32.9% |
168,281,368 | |||||||
|
|
||||||||
| NET ASSETS – 100.0% | $ | 512,068,570 | ||||||
|
|
||||||||
| The percentage shown for each investment category reflects the value of investments in that category as a percentage of net assets. | ||||
| (a) |
Represents an affiliated fund. | |||
| ADDITIONAL INVESTMENT INFORMATION |
FUTURES CONTRACTS — At August 31, 2022, the Fund had the following futures contracts:
| Description | Number of Contracts |
Expiration Date |
Notional Amount |
Unrealized Appreciation/ (Depreciation) |
||||||||||||
| Long position contracts: |
||||||||||||||||
| S&P 500 E-Mini Index |
26 | 09/16/22 | $ | 5,143,450 | $ | (152,745 | ) | |||||||||
| 5 Year U.S. Treasury Notes |
1,328 | 12/30/22 | 147,169,376 | (538,566 | ) | |||||||||||
| 2 Year U.S. Treasury Notes |
1,628 | 12/30/22 | 339,158,189 | (504,396 | ) | |||||||||||
| TOTAL FUTURES CONTRACTS |
|
$ | (1,195,707 | ) | ||||||||||||
PURCHASED AND WRITTEN OPTIONS CONTRACTS — At August 31, 2022, the Fund had the following purchased and written options:
EXCHANGE TRADED OPTIONS ON EQUITIES CONTRACTS
| Description | Exercise Price |
Expiration Date |
Number of Contracts |
Notional Amount |
Market Value |
Premiums Paid (Received) by Fund |
Unrealized Appreciation/ (Depreciation) |
|||||||||||||||||||
| Purchased option contracts |
||||||||||||||||||||||||||
| Puts |
||||||||||||||||||||||||||
| S&P 500 Index |
$3,100.000 | 09/02/2022 | 129 | $ | 39,990,000 | $ | 322 | $ | 14,077 | $ | (13,755 | ) | ||||||||||||||
| S&P 500 Index |
3,150.000 | 09/02/2022 | 127 | 40,005,000 | 318 | 15,116 | (14,798 | ) | ||||||||||||||||||
| S&P 500 Index |
3,000.000 | 09/06/2022 | 128 | 38,400,000 | 320 | 11,707 | (11,387 | ) | ||||||||||||||||||
| S&P 500 Index |
3,000.000 | 09/09/2022 | 128 | 38,400,000 | 1,280 | 14,544 | (13,264 | ) | ||||||||||||||||||
| S&P 500 Index |
3,150.000 | 09/09/2022 | 126 | 39,690,000 | 2,520 | 17,001 | (14,481 | ) | ||||||||||||||||||
| S&P 500 Index |
3,200.000 | 09/09/2022 | 128 | 40,960,000 | 3,200 | 16,189 | (12,989 | ) | ||||||||||||||||||
| S&P 500 Index |
3,040.000 | 09/16/2022 | 126 | 38,304,000 | 7,560 | 16,257 | (8,697 | ) | ||||||||||||||||||
| S&P 500 Index |
3,110.000 | 09/16/2022 | 124 | 38,564,000 | 9,300 | 16,120 | (6,820 | ) | ||||||||||||||||||
| S&P 500 Index |
3,175.000 | 09/16/2022 | 240 | 76,200,000 | 22,800 | 28,593 | (5,793 | ) | ||||||||||||||||||
| S&P 500 Index |
3,260.000 | 09/16/2022 | 121 | 39,446,000 | 16,033 | 15,592 | 441 | |||||||||||||||||||
| S&P 500 Index |
2,800.000 | 09/23/2022 | 247 | 69,160,000 | 17,290 | 28,795 | (11,505 | ) | ||||||||||||||||||
| S&P 500 Index |
2,900.000 | 09/23/2022 | 123 | 35,670,000 | 11,992 | 13,007 | (1,015 | ) | ||||||||||||||||||
| S&P 500 Index |
3,000.000 | 09/23/2022 | 244 | 73,200,000 | 32,330 | 29,720 | 2,610 | |||||||||||||||||||
| S&P 500 Index |
2,650.000 | 09/30/2022 | 128 | 33,920,000 | 10,880 | 14,969 | (4,089 | ) | ||||||||||||||||||
| S&P 500 Index |
2,700.000 | 09/30/2022 | 128 | 34,560,000 | 12,480 | 15,184 | (2,704 | ) | ||||||||||||||||||
| S&P 500 Index |
2,800.000 | 09/30/2022 | 255 | 71,400,000 | 33,150 | 35,584 | (2,434 | ) | ||||||||||||||||||
| Total purchased option contracts |
|
2,502 | $ | 747,869,000 | $ | 181,775 | $ | 302,455 | $ | (120,680 | ) | |||||||||||||||
| The accompanying notes are an integral part of these financial statements. | 47 |
GOLDMAN SACHS STRATEGIC VOLATILITY PREMIUM FUND
Schedule of Investments (continued)
August 31, 2022
| ADDITIONAL INVESTMENT INFORMATION (continued) |
EXCHANGE TRADED OPTIONS ON EQUITIES CONTRACTS (continued)
| Description | Exercise Price |
Expiration Date |
Number of Contracts |
Notional Amount |
Market Value |
Premiums Paid (Received) by Fund |
Unrealized Appreciation/ (Depreciation) |
|||||||||||||||||||
| Written option contracts |
| |||||||||||||||||||||||||
| Puts |
||||||||||||||||||||||||||
| S&P 500 Index |
$3,650.000 | 09/06/2022 | (516 | ) | $ | (188,340,000 | ) | $ | (18,060 | ) | $ | (58,308 | ) | $ | 40,248 | |||||||||||
| S&P 500 Index |
3,700.000 | 09/07/2022 | (514 | ) | (190,180,000 | ) | (69,390 | ) | (78,642 | ) | 9,252 | |||||||||||||||
| S&P 500 Index |
3,750.000 | 09/02/2022 | (513 | ) | (192,375,000 | ) | (11,542 | ) | (55,404 | ) | 43,862 | |||||||||||||||
| S&P 500 Index |
3,775.000 | 09/02/2022 | (497 | ) | (187,617,500 | ) | (13,668 | ) | (76,041 | ) | 62,373 | |||||||||||||||
| Total written option contracts | (2,040 | ) | $ | (758,512,500 | ) | $ | (112,660 | ) | $ | (268,395 | ) | $ | 155,735 | |||||||||||||
| TOTAL | 462 | $ | (10,643,500 | ) | $ | 69,115 | $ | 34,060 | $ | 35,055 | ||||||||||||||||
| 48 | The accompanying notes are an integral part of these financial statements. |
GOLDMAN SACHS TACTICAL TILT OVERLAY FUND
Consolidated Schedule of Investments
August 31, 2022
| Principal Amount |
Interest Rate |
Maturity Date |
Value | |||||||||||
| Agency Debentures – 0.8% | ||||||||||||||
| Federal Home Loan Bank |
||||||||||||||
| $ | 21,610,000 | 3.375 | % | 09/01/23 | $ | 21,583,204 | ||||||||
| Federal Home Loan Bank Discount Notes(a) |
||||||||||||||
| 15,669,000 | 0.000 | 09/07/22 | 15,663,048 | |||||||||||
|
|
|
|||||||||||||
| TOTAL AGENCY DEBENTURES | ||||||||||||||
| (Cost $37,227,648) | $ | 37,246,252 | ||||||||||||
|
|
|
|||||||||||||
| U.S. Treasury Obligations – 4.6% | ||||||||||||||
| United States Cash Management Bills(a) |
||||||||||||||
| $ | 20,500,000 | 0.000 | % | 11/22/22 | $ | 20,371,287 | ||||||||
| 62,542,000 | 0.000 | 11/29/22 | 62,106,416 | |||||||||||
| United States Treasury Bill(a) |
||||||||||||||
| 20,000,000 | 0.000 | 01/26/23 | 19,751,642 | |||||||||||
| United States Treasury Notes(b) |
||||||||||||||
| (3M Treasury money market yield + 0.035%) |
||||||||||||||
| 66,600,000 | 2.936 | 10/31/23 | 66,631,618 | |||||||||||
| (3M Treasury money market yield – 0.015%) |
||||||||||||||
| 41,600,000 | 2.886 | 01/31/24 | 41,579,532 | |||||||||||
|
|
|
|||||||||||||
| TOTAL U.S. TREASURY OBLIGATIONS | ||||||||||||||
| (Cost $210,467,182) | $ | 210,440,495 | ||||||||||||
|
|
|
|||||||||||||
| Shares | Description | Value | ||||
| Exchange Traded Funds – 7.7% | ||||||
| 116,749 | Alerian MLP ETF(c) | $ | 4,615,088 | |||
| 1,110,483 | Energy Select Sector SPDR Fund | 89,393,882 | ||||
| 1,037,003 | Health Care Select Sector SPDR Fund |
129,376,494 | ||||
| 2,095,332 | Invesco Senior Loan ETF(c) | 43,939,112 | ||||
| 306,609 | iShares Core MSCI Emerging Markets ETF |
14,858,272 | ||||
| 136,020 | iShares iBoxx $ Investment Grade Corporate Bond ETF |
14,862,905 | ||||
| 180,721 | iShares iBoxx High Yield Corporate Bond ETF(c) |
13,469,136 | ||||
| 2,901,853 | Sprott Physical Uranium Trust* | 36,434,733 | ||||
|
|
||||||
| TOTAL EXCHANGE TRADED FUNDS (Cost $286,159,592) |
$ | 346,949,622 | ||||
|
|
||||||
| Shares | Dividend Rate |
Value | ||||||||||||
| Investment Companies(d) – 46.2% | ||||||||||||||
| Goldman Sachs Financial Square Government Fund – Institutional Shares |
| |||||||||||||
| 1,918,580,927 | 2.154 | % | $ | 1,918,580,927 | ||||||||||
| Goldman Sachs High Yield Floating Rate Fund – Class R6 |
| |||||||||||||
| 12,277,515 | 4.044 | 109,638,212 | ||||||||||||
| Goldman Sachs Energy Infrastructure Fund – Class R6 |
| |||||||||||||
| 6,514,741 | 3.487 | 72,443,922 | ||||||||||||
|
|
||||||||||||||
| TOTAL INVESTMENT COMPANIES (Cost $2,066,336,085) |
|
$ | 2,100,663,061 | |||||||||||
|
|
||||||||||||||
| TOTAL INVESTMENTS BEFORE SHORT-TERM INVESTMENT (Cost $2,600,190,507) |
|
$ | 2,695,299,430 | |||||||||||
|
|
||||||||||||||
| Principal Amount |
Interest Rate |
Maturity Date |
Value | |||||||||||
| Short-term Investments – 39.8% | ||||||||||||||
| Certificates of Deposit – 11.7% | ||||||||||||||
| Alpine Securitization LLC(b)(e) (SOFR + 0.440%) |
||||||||||||||
| $ | 12,100,000 | 2.720 | % | 10/27/22 | $ | 12,101,912 | ||||||||
| Atlantic Asset Securitization LLC(b)(e) (SOFR + 0.400%) |
||||||||||||||
| 10,404,000 | 2.680 | 10/13/22 | 10,406,430 | |||||||||||
| Bank of Montreal |
||||||||||||||
| 16,000,000 | 0.400 | 11/18/22 | 15,915,659 | |||||||||||
| (SOFR + 0.400%) |
||||||||||||||
| 6,000,000 | 2.680 | (b) | 03/01/23 | 5,999,938 | ||||||||||
| Bank of Nova Scotia(b) |
||||||||||||||
| (FEDL01 + 0.380%) |
||||||||||||||
| 7,608,000 | 2.710 | 12/20/22 | 7,610,979 | |||||||||||
| (SOFR + 0.500%) |
||||||||||||||
| 2,101,000 | 2.780 | 03/09/23 | 2,101,322 | |||||||||||
| Barclays Bank PLC(b) |
||||||||||||||
| (SOFR + 0.290%) |
||||||||||||||
| 8,000,000 | 2.570 | 02/16/23 | 7,993,318 | |||||||||||
| (SOFR + 0.400%) |
||||||||||||||
| 14,700,000 | 1.930 | (e) | 11/01/22 | 14,701,486 | ||||||||||
| Bedford Row Funding Corp.(b)(e) (FEDL01 + 0.120%) |
||||||||||||||
| 10,000,000 | 2.450 | 09/01/22 | 10,000,000 | |||||||||||
| BNZ International Funding Ltd.(b)(e) (SOFR + 0.700%) |
||||||||||||||
| 5,083,000 | 0.750 | 09/09/22 | 5,083,473 | |||||||||||
| Canadian Imperial Bank of Commerce(b) |
||||||||||||||
| (SOFR + 0.250%) |
||||||||||||||
| 5,000,000 | 2.530 | 12/23/22 | 4,999,178 | |||||||||||
| (SOFR + 0.250%) |
||||||||||||||
| 7,000,000 | 2.530 | 02/13/23 | 6,995,665 | |||||||||||
| (SOFR + 0.500%) |
||||||||||||||
| 2,062,000 | 2.780 | 05/05/23 | 2,063,020 | |||||||||||
| Citibank N.A. |
||||||||||||||
| 2,000,000 | 3.600 | 02/13/23 | 2,000,762 | |||||||||||
| 8,100,000 | 4.060 | 08/01/23 | 8,090,370 | |||||||||||
| Collateralized Commercial Paper FLEX Co. LLC(b)(e) |
||||||||||||||
| (SOFR + 0.300%) |
||||||||||||||
| 12,290,000 | 2.580 | 12/01/22 | 12,290,500 | |||||||||||
| (SOFR + 0.500%) |
||||||||||||||
| 10,513,000 | 2.790 | 12/14/22 | 10,517,303 | |||||||||||
| Commonwealth Bank of Australia(b)(e) (SOFR + 0.130%) |
||||||||||||||
| 2,000,000 | 2.410 | 09/29/22 | 1,999,905 | |||||||||||
| Cooperatieve Rabobank UA(b) |
||||||||||||||
| (SOFR + 0.230%) |
||||||||||||||
| 9,881,000 | 1.500 | 10/17/22 | 9,868,059 | |||||||||||
| (SOFR + 0.490%) |
||||||||||||||
| 3,674,000 | 2.770 | 11/25/22 | 3,675,841 | |||||||||||
| (SOFR + 0.530%) |
||||||||||||||
| 7,500,000 | 2.820 | 02/06/23 | 7,503,646 | |||||||||||
| Credit Industriel ET Commercial(b) (SOFR + 0.230%) |
||||||||||||||
| 200,000 | 1.000 | 01/06/23 | 199,928 | |||||||||||
| Credit Suisse New York |
||||||||||||||
| 12,000,000 | 0.400 | 11/10/22 | 11,941,019 | |||||||||||
| DNB Bank ASA |
||||||||||||||
| 1,000,000 | 2.770 | 06/01/23 | 1,000,000 | |||||||||||
| (SOFR + 0.520%) |
||||||||||||||
| 8,323,000 | 2.810 | (b)(e) | 02/06/23 | 8,330,989 | ||||||||||
| Enel Finance America LLC(b)(e) (SOFR + 0.800%) |
||||||||||||||
| 12,575,000 | 3.080 | 10/27/22 | 12,578,046 | |||||||||||
|
|
|
|||||||||||||
| The accompanying notes are an integral part of these financial statements. | 49 |
GOLDMAN SACHS TACTICAL TILT OVERLAY FUND
Consolidated Schedule of Investments (continued)
August 31, 2022
| Principal Amount |
Interest Rate |
Maturity Date |
Value | |||||||||||
| Short-term Investments – (continued) | ||||||||||||||
| Certificates of Deposit – (continued) | ||||||||||||||
| Fairway Finance Co. LLC(b)(e) |
||||||||||||||
| (SOFR + 0.540%) |
||||||||||||||
| $ | 14,994,000 | 2.820 | % | 01/23/23 | $ | 15,001,182 | ||||||||
| (SOFR + 0.580%) |
||||||||||||||
| 14,409,000 | 2.880 | 02/02/23 | 14,415,771 | |||||||||||
| Federation des Caisses Desjardins du Quebec(b)(e) |
||||||||||||||
| (SOFR + 0.600%) |
||||||||||||||
| 18,719,000 | 2.880 | 06/23/23 | 18,728,704 | |||||||||||
| HSBC Bank PLC(b) |
||||||||||||||
| (SOFR + 0.240%) |
||||||||||||||
| 12,603,000 | 2.520 | 11/18/22 | 12,600,129 | |||||||||||
| (SOFR + 0.600%) |
||||||||||||||
| 4,163,000 | 1.380 | (e) | 06/06/23 | 4,161,410 | ||||||||||
| (SOFR + 0.500%) |
||||||||||||||
| 5,000,000 | 2.780 | 12/21/22 | 5,001,214 | |||||||||||
| J.P. Morgan Securities LLC(b)(e) |
||||||||||||||
| (SOFR + 0.130%) |
||||||||||||||
| 2,300,000 | 2.410 | 09/01/22 | 2,300,007 | |||||||||||
| (SOFR + 0.330%) |
||||||||||||||
| 5,500,000 | 2.610 | 10/03/22 | 5,501,408 | |||||||||||
| Landesbank Baden-Wuerttemberg(b) (SOFR + 0.400%) |
||||||||||||||
| 9,000,000 | 2.680 | 10/12/22 | 9,001,267 | |||||||||||
| Lloyds Bank Corporate Markets PLC(b) |
||||||||||||||
| (SOFR + 0.270%) |
||||||||||||||
| 12,000,000 | 2.540 | 01/20/23 | 11,995,134 | |||||||||||
| (SOFR + 0.500%) |
||||||||||||||
| 2,748,000 | 2.770 | 04/03/23 | 2,748,520 | |||||||||||
| Macquarie Bank Ltd.(b)(e) |
||||||||||||||
| (SOFR + 0.330%) |
||||||||||||||
| 17,000,000 | 2.610 | 12/05/22 | 17,001,970 | |||||||||||
| (SOFR + 0.400%) |
||||||||||||||
| 4,000,000 | 2.680 | 10/19/22 | 4,000,674 | |||||||||||
| (SOFR + 0.750%) |
||||||||||||||
| 5,200,000 | 2.250 | 06/27/23 | 5,207,267 | |||||||||||
| Matchpoint Finance PLC(b)(e) (SOFR + 0.410%) |
||||||||||||||
| 10,394,000 | 2.680 | 10/17/22 | 10,395,164 | |||||||||||
| Mizuho Bank Ltd.(b) (SOFR + 0.280%) |
||||||||||||||
| 5,952,000 | 2.560 | 02/10/23 | 5,948,542 | |||||||||||
| MUFG Bank Ltd. |
||||||||||||||
| 6,750,000 | 0.260 | 10/13/22 | 6,731,875 | |||||||||||
| 14,000,000 | 0.380 | 11/04/22 | 13,943,815 | |||||||||||
| (SOFR + 0.280%) |
||||||||||||||
| 2,740,000 | 2.550 | (b) | 01/23/23 | 2,738,581 | ||||||||||
| National Australia Bank Ltd.(b)(e) (SOFR + 0.500%) |
||||||||||||||
| 3,122,000 | 2.780 | 03/08/23 | 3,123,899 | |||||||||||
| Natixis SA(b) (SOFR + 0.600%) |
||||||||||||||
| 100,000 | 2.870 | 03/24/23 | 100,091 | |||||||||||
| Nordea Bank ABP(b) (SOFR + 0.530%) |
||||||||||||||
| 12,000,000 | 2.810 | 12/23/22 | 12,006,926 | |||||||||||
| Old Line Funding LLC(b)(e) (FEDL01 + 0.270%) |
||||||||||||||
| 4,000,000 | 2.600 | 10/03/22 | 4,000,069 | |||||||||||
| Oversea-Chinese Banking Corp. Ltd.(b) (SOFR + 0.320%) |
||||||||||||||
| 5,200,000 | 2.590 | 09/23/22 | 5,200,453 | |||||||||||
| Royal Bank of Canada(b)(e) |
||||||||||||||
| (FEDL01 + 0.430%) |
||||||||||||||
| 4,599,000 | 2.010 | 12/23/22 | 4,601,528 | |||||||||||
|
|
|
|||||||||||||
| Short-term Investments – (continued) | ||||||||||||||
| Certificates of Deposit – (continued) | ||||||||||||||
| Royal Bank of Canada(b)(e) – (continued) |
||||||||||||||
| (SOFR + 0.430%) |
||||||||||||||
| 2,000,000 | 2.710 | 03/01/23 | 1,999,950 | |||||||||||
| (SOFR + 0.730%) |
||||||||||||||
| 10,000,000 | 3.070 | 08/08/23 | 10,011,015 | |||||||||||
| Salisbury Receivables Co. LLC(b)(e) (SOFR + 0.340%) |
||||||||||||||
| 10,000,000 | 2.620 | 02/01/23 | 9,991,971 | |||||||||||
| Skandinaviska Enskilda Banken AB |
||||||||||||||
| 9,800,000 | 0.420 | 12/01/22 | 9,738,761 | |||||||||||
| 3,100,000 | 1.830 | 10/05/22 | 3,098,234 | |||||||||||
| 500,000 | 2.820 | 12/15/22 | 499,752 | |||||||||||
| Standard Chartered Bank |
||||||||||||||
| 8,300,000 | 0.220 | 09/22/22 | 8,289,172 | |||||||||||
| Sumitomo Mitsui Banking Corp.(b) |
||||||||||||||
| (SOFR + 0.280%) |
||||||||||||||
| 2,885,000 | 2.560 | 03/01/23 | 2,882,380 | |||||||||||
| (SOFR + 0.500%) |
||||||||||||||
| 19,800,000 | 2.780 | 03/31/23 | 19,803,112 | |||||||||||
| (SOFR + 0.600%) |
||||||||||||||
| 6,244,000 | 2.870 | 06/07/23 | 6,246,248 | |||||||||||
| Sumitomo Mitsui Trust Ltd. |
||||||||||||||
| 10,154,000 | 3.200 | 12/28/22 | 10,151,914 | |||||||||||
| Svenska Handelsbanken AB |
||||||||||||||
| 21,647,000 | 2.795 | 05/25/23 | 21,465,321 | |||||||||||
| (SOFR + 0.510%) |
||||||||||||||
| 5,532,000 | 2.790 | (b) | 03/28/23 | 5,533,270 | ||||||||||
| Swedbank AB(b)(SOFR + 0.500%) |
||||||||||||||
| 2,082,000 | 2.780 | 12/15/22 | 2,083,126 | |||||||||||
| Toronto-Dominion Bank |
||||||||||||||
| 4,749,000 | 1.350 | 09/09/22 | 4,747,805 | |||||||||||
| 13,500,000 | 2.690 | 04/28/23 | 13,386,651 | |||||||||||
| (SOFR + 0.730%) |
||||||||||||||
| 3,000,000 | 3.010 | (b)(e) | 08/08/23 | 3,003,780 | ||||||||||
| Versailles Commercial Paper LLC(b)(e) (SOFR + 0.450%) |
||||||||||||||
| 6,998,000 | 2.730 | 11/14/22 | 6,998,208 | |||||||||||
| Westpac Banking Corp. |
||||||||||||||
| 3,084,000 | 1.150 | 09/07/22 | 3,083,279 | |||||||||||
|
|
|
|||||||||||||
| 535,438,297 | ||||||||||||||
|
|
|
|||||||||||||
| Commercial Paper(a) – 28.1% | ||||||||||||||
| Adventist Health System |
||||||||||||||
| 25,000,000 | 0.000 | 09/08/22 | 24,986,989 | |||||||||||
| Albion Capital Corp. |
||||||||||||||
| 3,114,000 | 0.000 | 09/02/22 | 3,113,600 | |||||||||||
| 4,000,000 | 0.000 | 09/20/22 | 3,994,611 | |||||||||||
| Alimentation Couche-Tard, Inc. |
||||||||||||||
| 11,533,000 | 0.000 | 09/01/22 | 11,532,160 | |||||||||||
| 5,000,000 | 0.000 | 09/06/22 | 4,997,809 | |||||||||||
| Amazon.com, Inc. |
||||||||||||||
| 14,000,000 | 0.000 | 10/06/22 | 13,966,232 | |||||||||||
| 10,000,000 | 0.000 | 11/08/22 | 9,948,269 | |||||||||||
| Antalis SA |
||||||||||||||
| 11,167,000 | 0.000 | 10/19/22 | 11,126,296 | |||||||||||
| 12,357,000 | 0.000 | 10/26/22 | 12,304,389 | |||||||||||
| AT&T, Inc. |
||||||||||||||
| 9,000,000 | 0.000 | 09/13/22 | 8,991,570 | |||||||||||
| 20,200,000 | 0.000 | 09/27/22 | 20,159,504 | |||||||||||
| 4,480,000 | 0.000 | 09/28/22 | 4,470,665 | |||||||||||
|
|
|
|||||||||||||
| 50 | The accompanying notes are an integral part of these financial statements. |
GOLDMAN SACHS TACTICAL TILT OVERLAY FUND
| Principal Amount |
Interest Rate |
Maturity Date |
Value | |||||||||||
| Short-term Investments – (continued) | ||||||||||||||
| Commercial Paper(a) – (continued) | ||||||||||||||
| Atlantic Asset Securitization LLC |
||||||||||||||
| $ | 4,051,000 | 0.000 | % | 10/17/22 | $ | 4,037,027 | ||||||||
| AutoZone, Inc. |
||||||||||||||
| 5,000,000 | 0.000 | 09/08/22 | 4,997,157 | |||||||||||
| Barton Capital SA |
||||||||||||||
| 11,973,000 | 0.000 | 09/14/22 | 11,961,886 | |||||||||||
| 18,000,000 | 0.000 | 09/22/22 | 17,973,017 | |||||||||||
| 10,000,000 | 0.000 | 11/18/22 | 9,934,079 | |||||||||||
| BASF SE |
||||||||||||||
| 14,102,000 | 0.000 | 09/20/22 | 14,083,338 | |||||||||||
| 10,890,000 | 0.000 | 09/27/22 | 10,870,390 | |||||||||||
| 4,666,000 | 0.000 | 10/03/22 | 4,655,547 | |||||||||||
| BAT International Finance PLC |
||||||||||||||
| 5,750,000 | 0.000 | 09/07/22 | 5,747,138 | |||||||||||
| BNG Bank NV |
||||||||||||||
| 18,554,000 | 0.000 | 10/11/22 | 18,500,919 | |||||||||||
| BP Capital Markets PLC |
||||||||||||||
| 13,500,000 | 0.000 | 09/07/22 | 13,493,857 | |||||||||||
| 9,487,000 | 0.000 | 09/22/22 | 9,471,973 | |||||||||||
| CAFCO LLC |
||||||||||||||
| 4,148,000 | 0.000 | 11/08/22 | 4,125,342 | |||||||||||
| Caisse d’Amortissement de la Dette Sociale |
||||||||||||||
| 23,776,000 | 0.000 | 01/05/23 | 23,503,569 | |||||||||||
| Cancara Asset Securitisation LLC |
||||||||||||||
| 6,185,000 | 0.000 | 09/20/22 | 6,176,557 | |||||||||||
| CDP Financial, Inc. |
||||||||||||||
| 13,102,000 | 0.000 | 06/16/23 | 12,678,125 | |||||||||||
| 9,500,000 | 0.000 | 06/27/23 | 9,177,317 | |||||||||||
| CenterPoint Energy Resources Corp. |
||||||||||||||
| 5,000,000 | 0.000 | 09/26/22 | 4,990,250 | |||||||||||
| Charlotte Mecklenb |
||||||||||||||
| 21,000,000 | 0.000 | 12/08/22 | 20,808,480 | |||||||||||
| CHARTA LLC |
||||||||||||||
| 10,270,000 | 0.000 | 11/08/22 | 10,213,703 | |||||||||||
| CIESCO LCC |
||||||||||||||
| 19,293,000 | 0.000 | 02/07/23 | 18,992,629 | |||||||||||
| Citigroup Global Markets, Inc. |
||||||||||||||
| 6,024,000 | 0.000 | 04/21/23 | 5,877,870 | |||||||||||
| 8,000,000 | 0.000 | 06/06/23 | 7,757,518 | |||||||||||
| Collateralized Commercial Paper FLEX Co. LLC |
||||||||||||||
| 250,000 | 0.000 | 09/07/22 | 249,887 | |||||||||||
| 7,637,000 | 0.000 | 12/02/22 | 7,574,676 | |||||||||||
| Commonwealth Bank of Australia |
||||||||||||||
| 8,081,000 | 0.000 | 10/21/22 | 8,052,059 | |||||||||||
| 7,656,000 | 0.000 | 11/02/22 | 7,620,710 | |||||||||||
| CRC Funding LLC |
||||||||||||||
| 8,371,000 | 0.000 | 11/09/22 | 8,323,471 | |||||||||||
| Dexia Credit Local SA |
||||||||||||||
| 18,000,000 | 0.000 | 09/30/22 | 17,963,550 | |||||||||||
| 9,454,000 | 0.000 | 10/19/22 | 9,420,698 | |||||||||||
| DNB Bank ASA |
||||||||||||||
| 14,694,000 | 0.000 | 11/23/22 | 14,595,051 | |||||||||||
| DTE Electric Co. |
||||||||||||||
| 11,500,000 | 0.000 | 09/15/22 | 11,488,212 | |||||||||||
| EI du Pont de Nemours & Co. |
||||||||||||||
| 3,550,000 | 0.000 | 12/12/22 | 3,516,238 | |||||||||||
|
|
|
|||||||||||||
| Short-term Investments – (continued) | ||||||||||||||
| Commercial Paper(a) – (continued) | ||||||||||||||
| Enbridge U.S., Inc |
||||||||||||||
| 12,500,000 | 0.000 | 01/19/23 | 12,315,329 | |||||||||||
| 5,500,000 | 0.000 | 02/06/23 | 5,405,870 | |||||||||||
| Entergy Corp. |
||||||||||||||
| 2,048,000 | 0.000 | 10/17/22 | 2,040,642 | |||||||||||
| 14,000,000 | 0.000 | 11/15/22 | 13,911,215 | |||||||||||
| Erste Abwicklungsanstalt |
||||||||||||||
| 25,000,000 | 0.000 | 09/19/22 | 24,968,729 | |||||||||||
| EssilorLuxottica SA |
||||||||||||||
| 20,000,000 | 0.000 | 09/22/22 | 19,971,571 | |||||||||||
| First Abu Dhabi Bank PJSC |
||||||||||||||
| 6,320,000 | 0.000 | 11/29/22 | 6,273,390 | |||||||||||
| Gotham Funding Corp. |
||||||||||||||
| 2,922,000 | 0.000 | 09/30/22 | 2,915,864 | |||||||||||
| 5,714,000 | 0.000 | 10/25/22 | 5,689,627 | |||||||||||
| GTA Funding LLC |
||||||||||||||
| 8,377,000 | 0.000 | 09/28/22 | 8,360,692 | |||||||||||
| 7,346,000 | 0.000 | 11/07/22 | 7,306,412 | |||||||||||
| Hewlett Packard Enterprise Co. |
||||||||||||||
| 8,000,000 | 0.000 | 09/22/22 | 7,986,947 | |||||||||||
| Ionic Capital III Trust |
||||||||||||||
| 3,000,000 | 0.000 | 09/20/22 | 2,995,938 | |||||||||||
| 8,000,000 | 0.000 | 09/29/22 | 7,983,812 | |||||||||||
| JP Morgan Securities LLC |
||||||||||||||
| 7,000,000 | 0.000 | 02/15/23 | 6,884,817 | |||||||||||
| Kaiser Foundation Hospitals |
||||||||||||||
| 10,000,000 | 0.000 | 10/06/22 | 9,974,700 | |||||||||||
| Kreditanstalt fuer Wiederaufbau |
||||||||||||||
| 11,333,000 | 0.000 | 01/03/23 | 11,212,548 | |||||||||||
| Lime Funding LLC |
||||||||||||||
| 2,869,000 | 0.000 | 09/09/22 | 2,867,318 | |||||||||||
| 5,002,000 | 0.000 | 09/22/22 | 4,994,502 | |||||||||||
| LMA-Americas LLC |
||||||||||||||
| 2,500,000 | 0.000 | 10/13/22 | 2,492,036 | |||||||||||
| 10,000,000 | 0.000 | 11/21/22 | 9,930,642 | |||||||||||
| 8,000,000 | 0.000 | 12/08/22 | 7,930,524 | |||||||||||
| 14,747,000 | 0.000 | 01/12/23 | 14,559,545 | |||||||||||
| McCormick & Co., Inc. |
||||||||||||||
| 6,895,000 | 0.000 | 09/16/22 | 6,886,953 | |||||||||||
| 12,629,000 | 0.000 | 09/26/22 | 12,604,373 | |||||||||||
| MetLife Short Term Funding LLC |
||||||||||||||
| 13,674,000 | 0.000 | 05/26/23 | 13,278,627 | |||||||||||
| Mitsubishi UFJ Trust & Banking Corp. |
||||||||||||||
| 6,025,000 | 0.000 | 10/18/22 | 6,005,447 | |||||||||||
| Mondelez International, Inc. |
||||||||||||||
| 5,000,000 | 0.000 | 09/06/22 | 4,997,868 | |||||||||||
| 5,000,000 | 0.000 | 09/15/22 | 4,994,669 | |||||||||||
| 10,000,000 | 0.000 | 09/20/22 | 9,985,578 | |||||||||||
| National Australia Bank Ltd. |
||||||||||||||
| 2,000,000 | 0.000 | 09/09/22 | 1,998,852 | |||||||||||
| 3,000,000 | 0.000 | 11/01/22 | 2,986,345 | |||||||||||
| 7,000,000 | 0.000 | 02/15/23 | 6,886,385 | |||||||||||
| National Bank of Canada |
||||||||||||||
| 6,058,000 | 0.000 | 10/26/22 | 6,032,717 | |||||||||||
| National Securities Clearing Corp. |
||||||||||||||
| 15,677,000 | 0.000 | 10/07/22 | 15,637,073 | |||||||||||
| 7,000,000 | 0.000 | 10/17/22 | 6,976,586 | |||||||||||
|
|
|
|||||||||||||
| The accompanying notes are an integral part of these financial statements. | 51 |
GOLDMAN SACHS TACTICAL TILT OVERLAY FUND
Consolidated Schedule of Investments (continued)
August 31, 2022
| Principal Amount |
Interest Rate |
Maturity Date |
Value | |||||||||||
| Short-term Investments – (continued) | ||||||||||||||
| Commercial Paper(a) – (continued) | ||||||||||||||
| Nederlandse Waterschapsbank |
||||||||||||||
| $ | 15,478,000 | 0.000 | % | 09/27/22 | $ | 15,449,594 | ||||||||
| New York Power Authority |
||||||||||||||
| 21,000,000 | 0.000 | 11/02/22 | 20,906,760 | |||||||||||
| Nieuw Amsterdam Receivables Corp. BV |
||||||||||||||
| 20,119,000 | 0.000 | 09/21/22 | 20,089,836 | |||||||||||
| NRW Bank |
||||||||||||||
| 16,877,000 | 0.000 | 09/21/22 | 16,854,652 | |||||||||||
| 13,553,000 | 0.000 | 11/25/22 | 13,459,853 | |||||||||||
| Nutrien Ltd. |
||||||||||||||
| 4,600,000 | 0.000 | 09/07/22 | 4,597,674 | |||||||||||
| 2,200,000 | 0.000 | 09/27/22 | 2,195,466 | |||||||||||
| 9,750,000 | 0.000 | 10/18/22 | 9,711,598 | |||||||||||
| Oesterreichische Kontrollbank AG |
||||||||||||||
| 18,000,000 | 0.000 | 09/27/22 | 17,967,505 | |||||||||||
| 15,000,000 | 0.000 | 10/26/22 | 14,938,820 | |||||||||||
| Pacific Life Short Term Funding LLC |
||||||||||||||
| 15,834,000 | 0.000 | 05/19/23 | 15,382,620 | |||||||||||
| PSP Capital, Inc. |
||||||||||||||
| 12,029,000 | 0.000 | 09/22/22 | 12,011,475 | |||||||||||
| QUALCOMM, Inc. |
||||||||||||||
| 6,000,000 | 0.000 | 09/01/22 | 5,999,616 | |||||||||||
| Raytheon Technologies Corp. |
||||||||||||||
| 4,000,000 | 0.000 | 10/24/22 | 3,981,724 | |||||||||||
| 5,000,000 | 0.000 | 12/01/22 | 4,956,581 | |||||||||||
| 4,000,000 | 0.000 | 02/06/23 | 3,929,757 | |||||||||||
| Reckitt Benckiser Treasury Services PLC |
||||||||||||||
| 9,227,000 | 0.000 | 09/19/22 | 9,214,923 | |||||||||||
| 5,000,000 | 0.000 | 09/26/22 | 4,990,687 | |||||||||||
| 5,379,000 | 0.000 | 09/28/22 | 5,368,064 | |||||||||||
| Regency Markets No. 1 LLC |
||||||||||||||
| 12,000,000 | 0.000 | 09/12/22 | 11,990,520 | |||||||||||
| Ridgefield Funding Co. LLC |
||||||||||||||
| 8,409,000 | 0.000 | 11/21/22 | 8,351,175 | |||||||||||
| Royal Bank of Canada |
||||||||||||||
| 2,509,000 | 0.000 | 11/09/22 | 2,495,047 | |||||||||||
| Sanofi |
||||||||||||||
| 20,000,000 | 0.000 | 09/22/22 | 19,971,327 | |||||||||||
| Sheffield Receivables Co. LLC |
||||||||||||||
| 3,600,000 | 0.000 | 10/28/22 | 3,583,627 | |||||||||||
| Societe Generale SA |
||||||||||||||
| 6,295,000 | 0.000 | 10/31/22 | 6,267,288 | |||||||||||
| Spire, Inc. |
||||||||||||||
| 14,750,000 | 0.000 | 09/20/22 | 14,728,235 | |||||||||||
| Starbird Funding Corp. |
||||||||||||||
| 7,178,000 | 0.000 | 01/05/23 | 7,095,120 | |||||||||||
| Suncor Energy, Inc. |
||||||||||||||
| 6,000,000 | 0.000 | 09/06/22 | 5,997,441 | |||||||||||
| 5,000,000 | 0.000 | 09/16/22 | 4,994,164 | |||||||||||
| 5,750,000 | 0.000 | 10/27/22 | 5,722,524 | |||||||||||
| TELUS Corp. |
||||||||||||||
| 15,000,000 | 0.000 | 09/13/22 | 14,985,895 | |||||||||||
| 10,160,000 | 0.000 | 09/22/22 | 10,143,422 | |||||||||||
| 4,750,000 | 0.000 | 10/20/22 | 4,730,584 | |||||||||||
| The Procter & Gamble Co. |
||||||||||||||
| 21,191,000 | 0.000 | 10/13/22 | 21,128,076 | |||||||||||
|
|
|
|||||||||||||
| Short-term Investments – (continued) | ||||||||||||||
| Commercial Paper(a) – (continued) | ||||||||||||||
| The Stanley Works |
||||||||||||||
| 2,000,000 | 0.000 | 09/19/22 | 1,997,445 | |||||||||||
| 10,000,000 | 0.000 | 09/20/22 | 9,986,489 | |||||||||||
| 10,271,000 | 0.000 | 09/21/22 | 10,256,357 | |||||||||||
| The Toronto-Dominion Bank |
||||||||||||||
| 10,000,000 | 0.000 | 06/02/23 | 9,691,313 | |||||||||||
| The Walt Disney Co. |
||||||||||||||
| 4,500,000 | 0.000 | 09/15/22 | 4,495,511 | |||||||||||
| Thunder Bay Funding LLC |
||||||||||||||
| 4,800,000 | 0.000 | 11/14/22 | 4,771,000 | |||||||||||
| TransCanada PipeLines Ltd. |
||||||||||||||
| 7,612,000 | 0.000 | 09/13/22 | 7,604,842 | |||||||||||
| 7,000,000 | 0.000 | 10/03/22 | 6,982,277 | |||||||||||
| Trinity Health Corp. |
||||||||||||||
| 5,900,000 | 0.000 | 09/28/22 | 5,889,234 | |||||||||||
| UDR, Inc. |
||||||||||||||
| 9,852,000 | 0.000 | 09/07/22 | 9,847,096 | |||||||||||
| 5,018,000 | 0.000 | 09/19/22 | 5,010,987 | |||||||||||
| Ventas Realty LP |
||||||||||||||
| 6,750,000 | 0.000 | 09/06/22 | 6,747,121 | |||||||||||
| Verizon Communications, Inc. |
||||||||||||||
| 11,440,000 | 0.000 | 09/14/22 | 11,428,379 | |||||||||||
| Versailles LLC |
||||||||||||||
| 15,000,000 | 0.000 | 12/05/22 | 14,873,520 | |||||||||||
| Victory Receivables Corp. |
||||||||||||||
| 7,441,000 | 0.000 | 09/22/22 | 7,429,818 | |||||||||||
| 9,881,000 | 0.000 | 09/27/22 | 9,862,266 | |||||||||||
| Volvo Treasury North America LP |
||||||||||||||
| 8,764,000 | 0.000 | 09/29/22 | 8,744,776 | |||||||||||
| Waste Management, Inc. |
||||||||||||||
| 2,000,000 | 0.000 | 09/02/22 | 1,999,716 | |||||||||||
| 7,185,000 | 0.000 | 11/08/22 | 7,142,860 | |||||||||||
| Westpac Banking Corp. |
||||||||||||||
| 8,800,000 | 0.000 | 10/12/22 | 8,774,929 | |||||||||||
| 13,656,000 | 0.000 | 11/01/22 | 13,594,240 | |||||||||||
|
|
|
|||||||||||||
| 1,277,990,303 | ||||||||||||||
|
|
|
|||||||||||||
| TOTAL SHORT-TERM INVESTMENTS | ||||||||||||||
| (Cost $1,815,181,596) | $ | 1,813,428,600 | ||||||||||||
|
|
|
|||||||||||||
| |
TOTAL INVESTMENTS BEFORE SECURITIES LENDING REINVESTMENT |
| ||||||||||||
| (Cost $4,415,372,103) | $ | 4,508,728,030 | ||||||||||||
|
|
|
|||||||||||||
| 52 | The accompanying notes are an integral part of these financial statements. |
GOLDMAN SACHS TACTICAL TILT OVERLAY FUND
| Shares | Dividend Rate |
Value | ||||||
| Securities Lending Reinvestment Vehicle(d) – 1.1% | ||||||||
| |
Goldman Sachs Financial Square Government Fund – |
| ||||||
| 49,625,697 | 2.154% | $ | 49,625,697 | |||||
| (Cost $49,625,697) | ||||||||
|
|
|
|||||||
| |
TOTAL INVESTMENTS – 100.2% (Cost $4,464,997,800) |
$ | 4,558,353,727 | |||||
|
|
|
|||||||
| |
LIABILITIES IN EXCESS OF OTHER ASSETS – (0.2)% |
(11,069,405 | ) | |||||
|
|
|
|||||||
| NET ASSETS – 100.0% | $ | 4,547,284,322 | ||||||
|
|
|
|||||||
| The percentage shown for each investment category reflects the value of investments in that category as a percentage of net assets. | ||
| * |
Non-income producing security. | |
| (a) |
Issued with a zero coupon. Income is recognized through the accretion of discount. | |
| (b) |
Variable rate security. Except for floating rate notes (for which final maturity is disclosed), maturity date disclosed is the next interest reset date. Interest rate disclosed is that which is in effect on August 31, 2022. | |
| (c) |
All or a portion of security is on loan. | |
| (d) |
Represents an affiliated fund. | |
| (e) |
Exempt from registration under Rule 144A of the Securities Act of 1933. | |
|
| ||
| Currency Abbreviations: | ||
| BRL |
—Brazilian Real | |
| CAD |
—Canadian Dollar | |
| CHF |
—Swiss Franc | |
| EUR |
—Euro | |
| USD |
—U.S. Dollar | |
| Investment Abbreviations: | ||
| ETF |
—Exchange Traded Fund | |
| LLC |
—Limited Liability Company | |
| LP |
—Limited Partnership | |
| MLP |
—Master Limited Partnership | |
| PJSC |
—Public Joint-Stock Company | |
| PLC |
—Public Limited Company | |
| SOFR |
—Secured Overnight Funding Rate | |
| SPDR |
—Standard and Poor’s Depository Receipt | |
|
| ||
| ADDITIONAL INVESTMENT INFORMATION |
FUTURES CONTRACTS — At August 31, 2022, the Fund had the following futures contracts:
| Description | Number of Contracts |
Expiration Date |
Notional Amount |
Unrealized Appreciation/ (Depreciation) |
||||||||||
| Long position contracts: |
| |||||||||||||
| S&P 500 E-Mini Index |
689 | 09/16/22 | $ | 136,301,425 | $ | 402,295 | ||||||||
| Stoxx Europe 600 Index |
548 | 09/16/22 | 11,432,798 | (587,625 | ) | |||||||||
| 2 Year U.S. Treasury Notes |
5,130 | 12/30/22 | 1,068,723,286 | (2,485,218 | ) | |||||||||
| 5 Year U.S. Treasury Notes |
2,457 | 12/30/22 | 272,285,509 | (937,120 | ) | |||||||||
| 10 Year U.S. Treasury Notes |
4,263 | 12/20/22 | 498,371,344 | (2,093,431 | ) | |||||||||
| TOTAL FUTURES CONTRACTS |
|
$ | (5,701,099 | ) | ||||||||||
SWAP CONTRACTS — At August 31, 2022, the Fund had the following swap contracts:
OVER THE COUNTER TOTAL RETURN SWAP CONTRACTS
| Reference Obligation/ Index | Financing Rate Paid by the Fund |
Counterparty | Termination Date(a) |
Notional Amount (000s) |
Unrealized Appreciation/ (Depreciation)* |
|||||||||
| SX7T Index |
3M EURIBOR – 0.670%(b) | BofA Securities LLC | 04/04/23 | EUR | 213,343 | $ | 2,566,243 | |||||||
| SX7T Index |
3M EURIBOR – 0.110(b) | BofA Securities LLC | 04/04/23 | EUR | 9,797 | (95,066 | ) | |||||||
| JPGSVENK Index(c) |
1M USD LIBOR + 0.900(d) | J.P. Morgan Securities LLC | 10/05/22 | $ | 142,647 | 6,443,326 | ||||||||
| TOTAL |
|
$ | 8,914,503 | |||||||||||
| * | There are no upfront payments on the swap contracts (s), therefore the unrealized gain (loss) on the swap contracts is equal to their market value. |
| (a) | The Fund pays/receives annual coupon payments in accordance with the swap contract(s). On the termination date of the swap contract(s), the Fund will either receive from or pay to the counterparty an amount equal to the net of the accrued financing fees and the value of the reference security subtracted from the original notional cost (notional multiplied by the price change of the reference security, converted to U.S. Dollars). |
| (b) | Payments made quarterly. |
| (c) | The top 50 components are shown below. |
| (d) | Payments made monthly. |
| The accompanying notes are an integral part of these financial statements. | 53 |
GOLDMAN SACHS TACTICAL TILT OVERLAY FUND
Consolidated Schedule of Investments (continued)
August 31, 2022
| ADDITIONAL INVESTMENT INFORMATION (continued) |
A basket (JPGSVENK) of common stocks
| Common Stocks | Sector | Shares | Value | Weight | ||||||||||
| Deere & Co |
Industrial | 380 | $ | 138,639 | 2.15 | % | ||||||||
| CH Robinson Worldwide Inc |
Industrial | 1,170 | 133,575 | 2.07 | ||||||||||
| Twitter Inc |
Communications | 3,139 | 121,649 | 1.89 | ||||||||||
| Amazon.com Inc |
Communications | 948 | 120,194 | 1.87 | ||||||||||
| West Pharmaceutical Services Inc |
Consumer, Non-cyclical | 379 | 112,333 | 1.74 | ||||||||||
| EPAM Systems Inc |
Technology | 234 | 99,610 | 1.55 | ||||||||||
| Royal Caribbean Cruises Ltd |
Consumer, Cyclical | 2,391 | 97,677 | 1.52 | ||||||||||
| Norwegian Cruise Line Holdings Ltd |
Consumer, Cyclical | 7,143 | 93,436 | 1.45 | ||||||||||
| Ceridian HCM Holding Inc |
Technology | 1,540 | 91,830 | 1.43 | ||||||||||
| Carnival Corp |
Consumer, Cyclical | 9,594 | 90,759 | 1.41 | ||||||||||
| Paycom Software Inc |
Technology | 258 | 90,511 | 1.40 | ||||||||||
| Ross Stores Inc |
Consumer, Cyclical | 1,040 | 89,706 | 1.39 | ||||||||||
| Enphase Energy Inc |
Energy | 305 | 87,269 | 1.35 | ||||||||||
| Xylem Inc/NY |
Industrial | 938 | 85,484 | 1.33 | ||||||||||
| Netflix Inc |
Communications | 378 | 84,576 | 1.31 | ||||||||||
| Boston Scientific Corp |
Consumer, Non-cyclical | 2,085 | 84,036 | 1.30 | ||||||||||
| AMETEK Inc |
Industrial | 699 | 84,026 | 1.30 | ||||||||||
| Dexcom Inc |
Consumer, Non-cyclical | 1,021 | 83,924 | 1.30 | ||||||||||
| State Street Corp |
Financial | 1,216 | 83,134 | 1.29 | ||||||||||
| Intuit Inc |
Technology | 191 | 82,395 | 1.28 | ||||||||||
| Take-Two Interactive Software Inc |
Technology | 671 | 82,224 | 1.28 | ||||||||||
| Wynn Resorts Ltd |
Consumer, Cyclical | 1,347 | 81,605 | 1.27 | ||||||||||
| MSCI Inc |
Technology | 179 | 80,622 | 1.25 | ||||||||||
| Rockwell Automation Inc |
Industrial | 339 | 80,282 | 1.25 | ||||||||||
| Illumina Inc |
Consumer, Non-cyclical | 397 | 80,033 | 1.24 | ||||||||||
| Tesla Inc |
Consumer, Cyclical | 288 | 79,341 | 1.23 | ||||||||||
| Tyler Technologies Inc |
Technology | 213 | 79,229 | 1.23 | ||||||||||
| American Airlines Group Inc |
Basic Materials | 5,993 | 77,847 | 1.21 | ||||||||||
| Stanley Black & Decker Inc |
Industrial | 881 | 77,630 | 1.20 | ||||||||||
| STERIS PLC |
Industrial | 385 | 77,452 | 1.20 | ||||||||||
| Intuitive Surgical Inc |
Consumer, Non-cyclical | 374 | 77,041 | 1.20 | ||||||||||
| ABIOMED Inc |
Consumer, Non-cyclical | 293 | 76,015 | 1.18 | ||||||||||
| International Flavors & Fragrances Inc |
Basic Materials | 684 | 75,547 | 1.17 | ||||||||||
| CarMax Inc |
Consumer, Cyclical | 839 | 74,231 | 1.15 | ||||||||||
| Generac Holdings Inc |
Industrial | 323 | 71,181 | 1.10 | ||||||||||
| Charles River Laboratories International |
Consumer, Non-cyclical | 343 | 70,350 | 1.09 | ||||||||||
| NVIDIA Corp |
Technology | 464 | 70,046 | 1.09 | ||||||||||
| Edison International |
Utilities | 1,022 | 69,265 | 1.07 | ||||||||||
| Alliant Energy Corp |
Utilities | 1,124 | 68,625 | 1.07 | ||||||||||
| American Tower Corp |
Financial | 270 | 68,530 | 1.06 | ||||||||||
| NextEra Energy Inc |
Utilities | 803 | 68,267 | 1.06 | ||||||||||
| Alexandria Real Estate Equities Inc |
Financial | 441 | 67,645 | 1.05 | ||||||||||
| SolarEdge Technologies Inc |
Energy | 239 | 65,861 | 1.02 | ||||||||||
| American Water Works Co Inc |
Utilities | 437 | 64,892 | 1.01 | ||||||||||
| Atmos Energy Corp |
Utilities | 565 | 64,066 | 0.99 | ||||||||||
| Albemarle Corp |
Basic Materials | 238 | 63,709 | 0.99 | ||||||||||
| Broadridge Financial Solutions Inc |
Technology | 354 | 60,528 | 0.94 | ||||||||||
| Walt Disney Co/The |
Communications | 537 | 60,200 | 0.93 | ||||||||||
| General Motors Co |
Consumer, Cyclical | 1,552 | 59,286 | 0.92 | ||||||||||
| Chipotle Mexican Grill Inc |
Consumer, Cyclical | 37 | 58,496 | 0.91 | ||||||||||
| 54 | The accompanying notes are an integral part of these financial statements. |
GOLDMAN SACHS TACTICAL TILT OVERLAY FUND
| ADDITIONAL INVESTMENT INFORMATION (continued) |
PURCHASED AND WRITTEN OPTIONS CONTRACTS — At August 31, 2022, the Fund had the following purchased and written options:
EXCHANGE TRADED OPTIONS ON FUTURES
| Description | Exercise Price |
Expiration Date |
Number of Contracts |
Notional Amount |
Market Value |
Premiums Paid (Received) by Fund |
Unrealized Appreciation/ (Depreciation) |
|||||||||||||||||||
| Written option contracts |
| |||||||||||||||||||||||||
| Puts |
| |||||||||||||||||||||||||
| Crude Oil |
$45.000 | 11/16/2022 | (2,081 | ) | $ | (2,081,000 | ) | $ | (395,390 | ) | $ | (7,243,050 | ) | $ | 6,847,660 | |||||||||||
OVER-THE-COUNTER INTEREST RATE SWAPTIONS
| Description | Counterparty | Exercise Rate |
Expiration Date |
Number of Contracts |
Notional Amount |
Market Value |
Premiums Paid (Received) by Fund |
Unrealized Appreciation/ (Depreciation) |
||||||||||||||||||||||
| Purchased option contracts |
| |||||||||||||||||||||||||||||
| Calls |
| |||||||||||||||||||||||||||||
| 6M IRS |
MS & Co. Int. PLC | 2.430 | % | 01/26/2023 | 84,010,000 | $ | 84,010,000 | $ | 2,188,335 | $ | 991,318 | $ | 1,197,017 | |||||||||||||||||
| Written option contracts |
||||||||||||||||||||||||||||||
| Calls |
| |||||||||||||||||||||||||||||
| 6M IRS |
MS & Co. Int. PLC | 1.930 | 01/26/2023 | (84,010,000 | ) | $ | (84,010,000 | ) | $ | (595,581 | ) | $ | — | $ | (595,581 | ) | ||||||||||||||
| Puts |
| |||||||||||||||||||||||||||||
| 6M IRS |
MS & Co. Int. PLC | 2.830 | 01/26/2023 | (84,010,000 | ) | (84,010,000 | ) | (3,250,960 | ) | — | (3,250,960 | ) | ||||||||||||||||||
| Total written option contracts | (168,020,000 | ) | $ | (168,020,000 | ) | $ | (3,846,541 | ) | $ | — | $ | (3,846,541 | ) | |||||||||||||||||
| TOTAL |
|
(84,010,000 | ) | $ | (84,010,000 | ) | $ | (1,658,206 | ) | $ | 991,318 | $ | (2,649,524 | ) | ||||||||||||||||
OVER-THE-COUNTER OPTIONS ON EQUITIES
| Description | Counterparty | Exercise Price |
Expiration Date |
Number of Contracts |
Notional Amount |
Market Value |
Premiums Paid (Received) by Fund |
Unrealized Appreciation/ (Depreciation) |
||||||||||||||||||||||
| Purchased option contracts |
| |||||||||||||||||||||||||||||
| Calls |
| |||||||||||||||||||||||||||||
| KWEB Index |
JPMorgan Securities, Inc. | $ | 39.728 | 12/30/2022 | 1,766,189 | $ | 7,016,733,321 | $ | 1,481,699 | $ | 4,771,360 | $ | (3,289,661 | ) | ||||||||||||||||
| XLE Index |
MS & Co. Int. PLC | 76.920 | 09/30/2022 | 1,948,325 | 14,986,515,900 | 10,348,834 | 8,728,496 | 1,620,338 | ||||||||||||||||||||||
| 3,714,514 | $ | 22,003,249,221 | $ | 11,830,533 | $ | 13,499,856 | $ | (1,669,323 | ) | |||||||||||||||||||||
| Puts |
| |||||||||||||||||||||||||||||
| S&P 500 Index |
MS & Co. Int. PLC | $ | 4,215.730 | 09/30/2022 | 67,409 | $ | 28,417,814,357 | $ | 18,250,191 | $ | 8,100,479 | $ | 10,149,712 | |||||||||||||||||
| Total purchased option contracts |
|
3,781,923 | $ | 50,421,063,578 | $ | 30,080,724 | $ | 21,600,335 | $ | 8,480,389 | ||||||||||||||||||||
| Written option contracts |
| |||||||||||||||||||||||||||||
| Calls |
| |||||||||||||||||||||||||||||
| KWEB Index |
JPMorgan Securities, Inc. | $ | 44.496 | 12/30/2022 | (1,766,189 | ) | $ | (7,858,746,265 | ) | $ | (754,410 | ) | $ | (2,947,063 | ) | $ | 2,192,653 | |||||||||||||
| XLE Index |
MS & Co. Int. PLC | 85.460 | 09/30/2022 | (1,948,325 | ) | (16,650,385,450 | ) | (2,733,867 | ) | (4,718,454 | ) | 1,984,587 | ||||||||||||||||||
| (3,714,514 | ) | $ | (24,509,131,715 | ) | $ | (3,488,277 | ) | $ | (7,665,517 | ) | $ | 4,177,240 | ||||||||||||||||||
| The accompanying notes are an integral part of these financial statements. | 55 |
GOLDMAN SACHS TACTICAL TILT OVERLAY FUND
Consolidated Schedule of Investments (continued)
August 31, 2022
| ADDITIONAL INVESTMENT INFORMATION (continued) |
OVER-THE-COUNTER OPTIONS ON EQUITIES (continued)
| Description | Counterparty | Exercise Price |
Expiration Date |
Number of Contracts |
Notional Amount |
Market Value |
Premiums Paid (Received) by Fund |
Unrealized Appreciation/ (Depreciation) |
||||||||||||||||||||||
| Puts |
| |||||||||||||||||||||||||||||
| S&P 500 Index |
Citibank NA | $ | 3,877.570 | 12/30/2022 | (61,820 | ) | $ | (23,971,137,740 | ) | $ | (10,711,140 | ) | $ | (13,311,083 | ) | $ | 2,599,943 | |||||||||||||
| XLV Index |
Citibank NA | 127.250 | 12/30/2022 | (1,052,774 | ) | (13,396,549,150 | ) | (7,268,137 | ) | (8,461,039 | ) | 1,192,902 | ||||||||||||||||||
| S&P 500 Index |
MS & Co. Int. PLC | 3,645.000 | 01/20/2023 | (35,507 | ) | (12,942,301,500 | ) | (4,246,910 | ) | (6,071,697 | ) | 1,824,787 | ||||||||||||||||||
| S&P 500 Index |
MS & Co. Int. PLC | 4,210.380 | 12/30/2022 | (27,878 | ) | (11,737,697,364 | ) | (9,141,386 | ) | (6,749,177 | ) | (2,392,209 | ) | |||||||||||||||||
| S&P 500 Index |
MS & Co. Int. PLC | 3,983.470 | 12/30/2022 | (31,143 | ) | (12,405,720,621 | ) | (6,664,623 | ) | (9,204,242 | ) | 2,539,619 | ||||||||||||||||||
| S&P 500 Index |
MS & Co. Int. PLC | 3,688.770 | 12/30/2022 | (67,409 | ) | (24,865,629,693 | ) | (7,844,866 | ) | (5,190,493 | ) | (2,654,373 | ) | |||||||||||||||||
| (1,276,531 | ) | $ | (99,319,036,068 | ) | $ | (45,877,062 | ) | $ | (48,987,731 | ) | $ | 3,110,669 | ||||||||||||||||||
| Total written option contracts |
|
(4,991,045 | ) | $ | (123,828,167,783 | ) | $ | (49,365,339 | ) | $ | (56,653,248 | ) | $ | 7,287,909 | ||||||||||||||||
| TOTAL | (1,209,122 | ) | $ | (73,407,104,205 | ) | $ | (19,284,615 | ) | $ | (35,052,913 | ) | $ | 15,768,298 | |||||||||||||||||
OVER-THE-COUNTER OPTIONS ON FOREIGN CURRENCY
| Description | Counterparty | Exercise Price |
Expiration Date |
Number of Contracts |
Notional Amount |
Market Value |
Premiums Paid (Received) by Fund |
Unrealized Appreciation/ (Depreciation) |
||||||||||||||||||||||
| Purchased option contracts |
| |||||||||||||||||||||||||||||
| Puts |
| |||||||||||||||||||||||||||||
| Put EUR/Call CHF |
BofA Securities LLC | $ | 0.980 | 12/21/2022 | 68,300,000 | $ | 68,300,000 | $ | 1,199,863 | $ | 1,249,014 | $ | (49,151 | ) | ||||||||||||||||
| Put USD/Call BRL |
MS & Co. Int. PLC |
5.224 | 09/23/2022 | 139,630,000 | 139,630,000 | 2,661,348 | 1,526,156 | 1,135,192 | ||||||||||||||||||||||
| Put EUR/Call USD |
MS & Co. Int. PLC | 1.192 | 03/07/2023 | 36,490,000 | 36,490,000 | 6,255,461 | 1,405,395 | 4,850,066 | ||||||||||||||||||||||
| Total purchased option contracts |
|
244,420,000 | $ | 244,420,000 | $ | 10,116,672 | $ | 4,180,565 | $ | 5,936,107 | ||||||||||||||||||||
| Written option contracts |
| |||||||||||||||||||||||||||||
| Puts |
| |||||||||||||||||||||||||||||
| Put EUR/Call CHF |
BofA Securities LLC | $ | 0.940 | 12/21/2022 | (68,300,000 | ) | $ | (68,300,000 | ) | $ | (395,630 | ) | $ | (507,390 | ) | $ | 111,760 | |||||||||||||
| Put EUR/Call USD |
MS & Co. Int. PLC | 1.192 | 03/07/2023 | (36,490,000 | ) | (36,490,000 | ) | (6,255,462 | ) | (1,750,718 | ) | (4,504,744 | ) | |||||||||||||||||
| Total written option contracts |
|
(104,790,000 | ) | $ | (104,790,000 | ) | $ | (6,651,092 | ) | $ | (2,258,108 | ) | $ | (4,392,984 | ) | |||||||||||||||
| TOTAL | 139,630,000 | $ | 139,630,000 | $ | 3,465,580 | $ | 1,922,457 | $ | 1,543,123 | |||||||||||||||||||||
|
| ||
| Abbreviations: | ||
| 6M IRS |
—6 Months Interest Rate Swaptions | |
| BofA Securities LLC |
—Bank of America Securities LLC | |
| MS & Co. Int. PLC |
—Morgan Stanley & Co. International PLC | |
| SX7T Index |
—Euro STOXX Banks Net Return Index | |
|
| ||
| 56 | The accompanying notes are an integral part of these financial statements. |
GOLDMAN SACHS ALLOCATION FUNDS
Statements of Assets and Liabilities
August 31, 2022
| Global Managed Beta Fund |
Strategic Factor Allocation Fund |
|||||||||
| Assets: | ||||||||||
| Investments of unaffiliated issuers, at value (cost $690,984,101 and $0, respectively)(a) |
$ | 869,709,336 | $ | — | ||||||
| Investments of affiliated issuers, at value (cost $663,519,382 and $1,564,632,614, respectively) |
704,698,149 | 1,564,632,614 | ||||||||
| Investments in securities lending reinvestment vehicle — affiliated issuer, at value (cost $70,746,676 and $0, respectively) |
70,746,676 | — | ||||||||
| Purchased options, at value (premium paid $35,842,147 and $1,199,837, respectively) |
16,427,528 | 711,383 | ||||||||
| Cash |
28,194,478 | 66,289,233 | ||||||||
| Foreign currencies, at value (cost $5,604,412 and $0, respectively) |
5,400,656 | — | ||||||||
| Unrealized gain on forward foreign currency exchange contracts |
22,240,770 | 3,708,771 | ||||||||
| Receivables: |
| |||||||||
| Investments sold |
182,092,426 | 300,798 | ||||||||
| Collateral on certain derivative contracts(b) |
41,488,038 | 488,326,144 | ||||||||
| Dividends and interest |
683,815 | 2,923,505 | ||||||||
| Fund shares sold |
271,820 | 874,950 | ||||||||
| Foreign tax reclaims |
221,440 | — | ||||||||
| Securities lending income |
28,495 | — | ||||||||
| Reimbursement from investment adviser |
26,460 | — | ||||||||
| Investments sold on an extended-settlement basis |
1,477 | — | ||||||||
| Other assets |
22,060 | 36,656 | ||||||||
| Total assets | 1,942,253,624 | 2,127,804,054 | ||||||||
| Liabilities: | ||||||||||
| Foreign currency overdraft, at value (cost $0 and $1,198, respectively) |
— | 1,181 | ||||||||
| Written option contracts, at value (premium received $5,799,210 and $3,423,019, respectively) |
9,765,308 | 4,514,047 | ||||||||
| Unrealized loss on forward foreign currency exchange contracts |
1,266,476 | 1,315,608 | ||||||||
| Variation margin on futures contracts |
1,310,569 | 6,301,216 | ||||||||
| Payables: |
| |||||||||
| Fund shares redeemed |
179,109,288 | 2,754,313 | ||||||||
| Payable upon return of securities loaned |
70,746,676 | — | ||||||||
| Due to broker |
16,300,013 | — | ||||||||
| Management fees |
423,126 | 1,154,507 | ||||||||
| Investments purchased |
347,149 | 2,992,704 | ||||||||
| Transfer Agency fees |
33,165 | 55,613 | ||||||||
| Accrued expenses |
427,889 | 351,650 | ||||||||
| Total liabilities | 279,729,659 | 19,440,839 | ||||||||
| Net Assets: | ||||||||||
| Paid-in capital |
1,448,693,654 | 2,276,926,012 | ||||||||
| Total distributable earnings (loss) |
213,830,311 | (168,562,797 | ) | |||||||
| NET ASSETS | $ | 1,662,523,965 | $ | 2,108,363,215 | ||||||
| Net Assets: |
||||||||||
| Institutional |
$ | 1,662,523,965 | $ | 12,455,207 | ||||||
| Class R6 |
— | 12,663 | ||||||||
| Class P |
— | 2,095,895,345 | ||||||||
| Total Net Assets |
$ | 1,662,523,965 | $ | 2,108,363,215 | ||||||
| Shares Outstanding $0.001 par value (unlimited number of shares authorized): |
||||||||||
| Institutional |
129,256,956 | 1,185,709 | ||||||||
| Class R6 |
— | 1,219 | ||||||||
| Class P |
— | 201,985,593 | ||||||||
| Net asset value, offering and redemption price per share: |
||||||||||
| Institutional |
$12.86 | $10.50 | ||||||||
| Class R6 |
— | 10.39 | ||||||||
| Class P |
— | 10.38 | ||||||||
| (a) | Includes loaned securities having market value of $68,934,875 and $0, for the Global Managed Beta and Strategic Factor Allocation Funds respectively. |
| (b) | Segregated for initial margin and/or collateral as follows: |
| Fund | Futures | Forward |
Options | |||||||||
| Global Managed Beta |
$ | 16,289,920 | $ | — | $ | 25,198,118 | ||||||
| Strategic Factor Allocation |
85,997,225 | 3,360,000 | 398,968,919 | |||||||||
| The accompanying notes are an integral part of these financial statements. | 57 |
GOLDMAN SACHS ALLOCATION FUNDS
Statements of Assets and Liabilities (continued)
August 31, 2022
| Strategic Volatility Premium Fund |
Tactical Tilt Overlay Fund(a) |
|||||||||
| Assets: | ||||||||||
| Investments of unaffiliated issuers, at value (cost $0 and $2,349,036,018, respectively)(b) |
$ | — | $ | 2,408,064,969 | ||||||
| Investments of affiliated issuers, at value (cost $343,787,202 and $2,066,336,085, respectively) |
343,787,202 | 2,100,663,061 | ||||||||
| Investments in securities lending reinvestment vehicle — affiliated issuer, at value (cost $0 and $49,625,697, respectively) |
— | 49,625,697 | ||||||||
| Purchased options, at value (premium paid $302,455 and $26,772,218, respectively) |
181,775 | 42,385,731 | ||||||||
| Cash |
59,094,655 | 58,557,604 | ||||||||
| Foreign currencies, at value (cost $0 and $1,806,087, respectively) |
— | 1,579,312 | ||||||||
| Unrealized gain on swap contracts |
— | 9,009,569 | ||||||||
| Variation margin on futures contracts |
74,242 | — | ||||||||
| Receivables: |
| |||||||||
| Collateral on certain derivative contracts(c) |
109,445,860 | 45,121,904 | ||||||||
| Investments sold |
192,354 | — | ||||||||
| Dividends and interest |
710,343 | 5,541,274 | ||||||||
| Reimbursement from investment adviser |
11,626 | 5,635 | ||||||||
| Fund shares sold |
— | 4,440,700 | ||||||||
| Securities lending income |
— | 77,667 | ||||||||
| Due from broker |
— | 401,021 | ||||||||
| Other assets |
25,717 | 84,524 | ||||||||
| Total assets | 513,523,774 | 4,725,558,668 | ||||||||
| Liabilities: | ||||||||||
| Written option contracts, at value (premium received $268,395 and $66,154,406, respectively) |
112,660 | 60,258,362 | ||||||||
| Unrealized loss on swap contracts |
— | 95,066 | ||||||||
| Variation margin on futures contracts |
— | 1,893,157 | ||||||||
| Variation margin on swaps contracts |
— | 2,361 | ||||||||
| Payables: |
| |||||||||
| Investments purchased |
758,921 | 38,327,579 | ||||||||
| Fund shares redeemed |
243,500 | 13,789,502 | ||||||||
| Payable upon return of securities loaned |
— | 49,625,697 | ||||||||
| Management fees |
121,617 | 2,457,829 | ||||||||
| Transfer Agency fees |
13,212 | 116,591 | ||||||||
| Due to broker |
— | 11,100,000 | ||||||||
| Accrued expenses |
205,294 | 608,202 | ||||||||
| Total liabilities | 1,455,204 | 178,274,346 | ||||||||
| Net Assets: | ||||||||||
| Paid-in capital |
532,286,813 | 4,638,141,146 | ||||||||
| Total distributable loss |
(20,218,243 | ) | (90,856,824 | ) | ||||||
| NET ASSETS | $ | 512,068,570 | $ | 4,547,284,322 | ||||||
| Net Assets: |
||||||||||
| Institutional |
$ | 306,052 | $ | 21,588,336 | ||||||
| Class R6 |
— | 573,866,166 | ||||||||
| Class P |
511,762,518 | 3,951,829,820 | ||||||||
| Total Net Assets |
$ | 512,068,570 | $ | 4,547,284,322 | ||||||
| Shares Outstanding $0.001 par value (unlimited number of shares authorized): |
||||||||||
| Institutional |
31,696 | 2,054,982 | ||||||||
| Class R6 |
— | 56,408,470 | ||||||||
| Class P |
52,993,500 | 388,512,336 | ||||||||
| Net asset value, offering and redemption price per share: |
||||||||||
| Institutional |
$9.66 | $10.51 | ||||||||
| Class R6 |
— | 10.17 | ||||||||
| Class P |
9.66 | 10.17 | ||||||||
| (a) | Consolidated Statement of Assets and Liabilities for the Fund is consolidated and includes the balances of a wholly owned subsidiary, Cayman Commodity — TTIF, Ltd. Accordingly, all interfund balances and transactions have been eliminated. |
| (b) | Includes loaned securities having market value of $0 and $48,501,871, for the Strategic Volatility Premium and Tactical Tilt Overlay Funds respectively. |
| (c) | Segregated for initial margin and/or collateral as follows: |
| Fund | Futures | Options | Swaps | |||||||||
| Strategic Volatility Premium |
$ | 4,301,000 | $ | 105,144,860 | $ | — | ||||||
| Tactical Tilt Overlay |
26,871,904 | — | 18,250,000 | |||||||||
| 58 | The accompanying notes are an integral part of these financial statements. |
GOLDMAN SACHS ALLOCATION FUNDS
Statements of Operations
For the Fiscal Year Ended August 31, 2022
| Global Managed Beta Fund |
Strategic Factor Allocation Fund |
|||||||||
| Investment income: |
| |||||||||
| Dividends — unaffiliated issuers (net of foreign withholding taxes of $216,538 and $0, respectively) |
$ | 27,492,816 | $ | — | ||||||
| Dividends — affiliated issuers |
16,115,191 | 8,167,282 | ||||||||
| Interest — unaffiliated issuers |
36,910 | 79,498 | ||||||||
| Securities lending income — unaffiliated issuers |
226,514 | — | ||||||||
| Total investment income | 43,871,431 | 8,246,780 | ||||||||
| Expenses: |
| |||||||||
| Management fees |
5,884,985 | 16,938,587 | ||||||||
| Transfer Agency fees(a) |
392,332 | 686,317 | ||||||||
| Custody, accounting and administrative services |
368,947 | 210,276 | ||||||||
| Registration fees |
154,528 | 88,264 | ||||||||
| Professional fees |
92,761 | 117,065 | ||||||||
| Printing and mailing costs |
45,501 | 59,678 | ||||||||
| Trustee fees |
28,621 | 29,287 | ||||||||
| Prime broker fees |
7,238 | 21,069 | ||||||||
| Other |
37,762 | 59,222 | ||||||||
| Total expenses | 7,012,675 | 18,209,765 | ||||||||
| Less — expense reductions |
(1,141,474 | ) | (2,798,642 | ) | ||||||
| Net expenses | 5,871,201 | 15,411,123 | ||||||||
| NET INVESTMENT INCOME (LOSS) | 38,000,230 | (7,164,343 | ) | |||||||
| Realized and unrealized gain (loss): |
| |||||||||
| Net realized gain (loss) from: |
||||||||||
| Investments — unaffiliated issuers |
18,057,819 | — | ||||||||
| Investment — affiliated issuers |
(12,093,438 | ) | — | |||||||
| Purchased options |
(962,745 | ) | (17,919,456 | ) | ||||||
| Futures contracts |
(34,468,640 | ) | (142,734,876 | ) | ||||||
| Written options |
5,406,477 | 36,790,419 | ||||||||
| Swap contracts |
3,425,475 | — | ||||||||
| Forward foreign currency exchange contracts |
51,738,290 | 29,561,996 | ||||||||
| Foreign currency transactions |
(567,361 | ) | (1,332,441 | ) | ||||||
| Net change in unrealized gain (loss) on: |
||||||||||
| Investments — unaffiliated issuers |
(234,502,498 | ) | — | |||||||
| Investments — affiliated issuers |
(122,385,649 | ) | — | |||||||
| Purchased options |
(19,980,087 | ) | 299,608 | |||||||
| Futures contracts |
(9,386,604 | ) | (41,833,358 | ) | ||||||
| Written options |
(4,582,609 | ) | (2,376,685 | ) | ||||||
| Swap contracts |
11,718 | — | ||||||||
| Forward foreign currency exchange contracts |
11,741,295 | 2,821,697 | ||||||||
| Foreign currency translation |
(222,218 | ) | 17 | |||||||
| Net realized and unrealized loss | (348,770,775 | ) | (136,723,079 | ) | ||||||
| NET DECREASE IN NET ASSETS RESULTING FROM OPERATIONS | $ | (310,770,545 | ) | $ | (143,887,422 | ) | ||||
| (a) | Class specific Transfer Agency fees were as follows: |
| Fund |
Institutional |
Class R6 |
Class P |
|||||||||
| Global Managed Beta |
$ | 392,332 | $ | — | $ | — | ||||||
| Strategic Factor Allocation |
3,168 | 4 | 683,145 | |||||||||
| The accompanying notes are an integral part of these financial statements. | 59 |
GOLDMAN SACHS ALLOCATION FUNDS
Statements of Operations (continued)
For the Fiscal Year Ended August 31, 2022
| Strategic Volatility Premium Fund |
Tactical Tilt Overlay Fund(a) |
|||||||||
| Investment income: |
| |||||||||
| Dividends — unaffiliated issuers |
$ | — | $ | 8,668,558 | ||||||
| Dividends — affiliated issuers |
2,016,756 | 20,177,816 | ||||||||
| Interest — unaffiliated issuers |
5,221 | 14,943,304 | ||||||||
| Securities lending income — unaffiliated issuers |
— | 1,428,887 | ||||||||
| Total investment income | 2,021,977 | 45,218,565 | ||||||||
| Expenses: |
| |||||||||
| Management fees |
2,454,670 | 33,833,576 | ||||||||
| Transfer Agency fees(b) |
147,313 | 1,340,667 | ||||||||
| Professional fees |
116,008 | 175,325 | ||||||||
| Custody, accounting and administrative services |
83,156 | 363,643 | ||||||||
| Amortization of offering costs |
68,456 | — | ||||||||
| Printing and mailing costs |
30,718 | 68,627 | ||||||||
| Trustee fees |
26,274 | 33,152 | ||||||||
| Registration fees |
20,365 | 151,604 | ||||||||
| Other |
17,907 | 44,199 | ||||||||
| Total expenses | 2,964,867 | 36,010,793 | ||||||||
| Less — expense reductions |
(1,167,302 | ) | (6,228,124 | ) | ||||||
| Net expenses | 1,797,565 | 29,782,669 | ||||||||
| NET INVESTMENT INCOME | 224,412 | 15,435,896 | ||||||||
| Realized and unrealized gain (loss): |
| |||||||||
| Capital gain distributions from Affiliated Underlying Funds |
— | 3,366,151 | ||||||||
| Net realized gain (loss) from: |
||||||||||
| Investments — unaffiliated issuers |
— | 17,242,417 | ||||||||
| Investment — affiliated issuers |
— | 15,545,094 | ||||||||
| Purchased options |
(3,937,828 | ) | 67,215,648 | |||||||
| Futures contracts |
(26,153,724 | ) | (100,022,556 | ) | ||||||
| Written options |
11,337,330 | 36,954,186 | ||||||||
| Swap contracts |
— | 280,016 | ||||||||
| Foreign currency transactions |
— | (1,063,009 | ) | |||||||
| Net change in unrealized gain (loss) on: |
||||||||||
| Investments — unaffiliated issuers |
— | 6,624,920 | ||||||||
| Investments — affiliated issuers |
— | (7,364,132 | ) | |||||||
| Purchased options |
1,689 | 25,414,172 | ||||||||
| Futures contracts |
(1,783,855 | ) | (375,936 | ) | ||||||
| Written options |
38,398 | (60,684,081 | ) | |||||||
| Swap contracts |
— | 5,229,842 | ||||||||
| Foreign currency translation |
— | (327,982 | ) | |||||||
| Net realized and unrealized gain (loss) | (20,497,990 | ) | 8,034,750 | |||||||
| NET INCREASE (DECREASE) IN NET ASSETS RESULTING FROM OPERATIONS | $ | (20,273,578 | ) | $ | 23,470,646 | |||||
| (a) | Statement of Operations for the Fund is consolidated and includes the balances of a wholly owned subsidiary, Cayman Commodity — TTIF Ltd. Accordingly, all interfund balances and transactions have been eliminated. |
| (b) | Class specific Transfer Agency fees were as follows: |
| Fund |
Institutional |
Class R6 |
Class P |
|||||||||
| Strategic Volatility Premium |
$ | 131 | $ | — | $ | 147,182 | ||||||
| Tactical Tilt Overlay |
5,802 | 246,942 | 1,087,923 | |||||||||
| 60 | The accompanying notes are an integral part of these financial statements. |
GOLDMAN SACHS ALLOCATION FUNDS
Statements of Changes in Net Assets
| Global Managed Beta Fund | Strategic Factor Allocation Fund | |||||||||||||||||||||
| For the Fiscal Year Ended August 31, 2022 |
For the Fiscal Year Ended August 31, 2021 |
For the Fiscal Year Ended August 31, 2022 |
For the Fiscal Year Ended August 31, 2021 |
|||||||||||||||||||
| From operations: |
|
|||||||||||||||||||||
| Net investment income (loss) |
$ | 38,000,230 | $ | 26,532,140 | $ | (7,164,343 | ) | $ | (12,672,976 | ) | ||||||||||||
| Net realized gain (loss) |
30,535,877 | 132,173,076 | (95,634,358 | ) | 315,947,241 | |||||||||||||||||
| Net change in unrealized gain (loss) |
(379,306,652 | ) | 356,161,408 | (41,088,721 | ) | (24,484,336 | ) | |||||||||||||||
| Net increase (decrease) in net assets resulting from operations | (310,770,545 | ) | 514,866,624 | (143,887,422 | ) | 278,789,929 | ||||||||||||||||
| Distributions to shareholders: |
|
|||||||||||||||||||||
| From distributable earnings: |
||||||||||||||||||||||
| Institutional Shares |
(184,192,220 | ) | (81,014,178 | ) | (485,488 | ) | (353,924 | ) | ||||||||||||||
| Class R6 Shares |
— | — | (1,686 | ) | (899 | ) | ||||||||||||||||
| Class P Shares |
— | — | (302,965,029 | ) | (125,892,465 | ) | ||||||||||||||||
| Total distributions to shareholders | (184,192,220 | ) | (81,014,178 | ) | (303,452,203 | ) | (126,247,288 | ) | ||||||||||||||
| From share transactions: |
|
|||||||||||||||||||||
| Proceeds from sales of shares |
538,309,195 | 821,037,700 | 527,591,055 | 763,180,945 | ||||||||||||||||||
| Reinvestment of distributions |
184,192,220 | 81,014,178 | 303,452,203 | 126,247,288 | ||||||||||||||||||
| Cost of shares redeemed |
(827,610,016 | ) | (666,596,798 | ) | (627,152,661 | ) | (309,213,299 | ) | ||||||||||||||
| Net increase (decrease) in net assets resulting from share transactions | (105,108,601 | ) | 235,455,080 | 203,890,597 | 580,214,934 | |||||||||||||||||
| TOTAL INCREASE (DECREASE) | (600,071,366 | ) | 669,307,526 | (243,449,028 | ) | 732,757,575 | ||||||||||||||||
| Net assets: |
|
|||||||||||||||||||||
| Beginning of year |
2,262,595,331 | 1,593,287,805 | 2,351,812,243 | 1,619,054,668 | ||||||||||||||||||
| End of year |
$ | 1,662,523,965 | $ | 2,262,595,331 | $ | 2,108,363,215 | $ | 2,351,812,243 | ||||||||||||||
| The accompanying notes are an integral part of these financial statements. | 61 |
GOLDMAN SACHS ALLOCATION FUNDS
Statements of Changes in Net Assets (continued)
| Strategic Volatility Premium Fund | Tactical Tilt Overlay Fund(b) | |||||||||||||||||||||
| For the Fiscal Year Ended August 31, 2022 |
For the Fiscal Year Ended August 31, 2021(a) |
For the Fiscal Year Ended August 31, 2022 |
For the Fiscal Year Ended August 31, 2021 |
|||||||||||||||||||
| From operations: |
|
|||||||||||||||||||||
| Net investment income (loss) |
$ | 224,412 | $ | (265,378 | ) | $ | 15,435,896 | $ | (2,929,316 | ) | ||||||||||||
| Net realized gain (loss) |
(18,754,222 | ) | 1,437,141 | 39,517,947 | 171,153,951 | |||||||||||||||||
| Net change in unrealized gain (loss) |
(1,743,768 | ) | 583,116 | (31,483,197 | ) | 138,035,440 | ||||||||||||||||
| Net increase (decrease) in net assets resulting from operations | (20,273,578 | ) | 1,754,879 | 23,470,646 | 306,260,075 | |||||||||||||||||
| Distributions to shareholders: |
|
|||||||||||||||||||||
| From distributable earnings: |
||||||||||||||||||||||
| Institutional Shares |
(1,365 | ) | — | (225,531 | ) | (88,055 | ) | |||||||||||||||
| Class R6 Shares |
— | — | (24,009,953 | ) | (41,354,663 | ) | ||||||||||||||||
| Class P Shares |
(1,774,163 | ) | — | (70,771,569 | ) | (113,568,116 | ) | |||||||||||||||
| Total distributions to shareholders | (1,775,528 | ) | — | (95,007,053 | ) | (155,010,834 | ) | |||||||||||||||
| From share transactions: |
|
|||||||||||||||||||||
| Proceeds from sales of shares |
405,331,474 | 429,347,526 | 1,559,262,518 | 1,193,782,805 | ||||||||||||||||||
| Reinvestment of distributions |
1,775,528 | — | 95,007,053 | 155,010,834 | ||||||||||||||||||
| Cost of shares redeemed |
(295,908,477 | ) | (8,183,254 | ) | (1,132,927,933 | ) | (431,948,453 | ) | ||||||||||||||
| Net increase in net assets resulting from share transactions | 111,198,525 | 421,164,272 | 521,341,638 | 916,845,186 | ||||||||||||||||||
| TOTAL INCREASE | 89,149,419 | 422,919,151 | 449,805,231 | 1,068,094,427 | ||||||||||||||||||
| Net assets: |
|
|||||||||||||||||||||
| Beginning of year |
422,919,151 | — | 4,097,479,091 | 3,029,384,664 | ||||||||||||||||||
| End of year |
$ | 512,068,570 | $ | 422,919,151 | $ | 4,547,284,322 | $ | 4,097,479,091 | ||||||||||||||
| (a) | Commenced operations on March 29, 2021. |
| (b) | Statement of Changes in Net Assets for the Fund is consolidated and includes the balances of a wholly owned subsidiary, Cayman Commodity — TTIF, Ltd. Accordingly, all interfund balances and transactions have been eliminated. |
| 62 | The accompanying notes are an integral part of these financial statements. |
GOLDMAN SACHS GLOBAL MANAGED BETA FUND
Selected Share Data for a Share Outstanding Throughout Each Year
| (a) | Calculated based on the average shares outstanding methodology. |
| (b) | Assumes investment at the NAV at the beginning of the year, reinvestment of all dividends and distributions, a complete redemption of the investment at the NAV at the end of the year and no sales or redemption charges (if any). Total returns would be reduced if a sales or redemption charge was taken into account. Returns do not reflect the impact of taxes to shareholders relating to Fund distributions or the redemption of Fund shares. |
| (c) | Expense ratios exclude the expenses of the Underlying Funds in which the Fund invests. |
| (d) | The Fund’s portfolio turnover rate is calculated in accordance with regulatory requirements, without regard to transactions involving short term investments and certain derivatives. If such transactions were included, the Fund’s portfolio turnover rate may be higher. |
| The accompanying notes are an integral part of these financial statements. | 63 |
GOLDMAN SACHS STRATEGIC FACTOR ALLOCATION FUND
Financial Highlights (continued)
Selected Share Data for a Share Outstanding Throughout Each Year
| (a) | Calculated based on the average shares outstanding methodology. |
| (b) | Assumes investment at the NAV at the beginning of the year, reinvestment of all dividends and distributions, a complete redemption of the investment at the NAV at the end of the year and no sales or redemption charges (if any). Total returns would be reduced if a sales or redemption charge was taken into account. Returns do not reflect the impact of taxes to shareholders relating to Fund distributions or the redemption of Fund shares. |
| (c) | The Fund’s portfolio turnover rate is calculated in accordance with regulatory requirements, without regard to transactions involving short term investments and certain derivatives. If such transactions were included, the Fund’s portfolio turnover rate may be higher. |
| (d) | There were no long-term transactions for the year ended August 31, 2022, August 31, 2021 and August 31, 2020, respectively. |
| 64 | The accompanying notes are an integral part of these financial statements. |
GOLDMAN SACHS STRATEGIC FACTOR ALLOCATION FUND
Financial Highlights (continued)
Selected Share Data for a Share Outstanding Throughout Each Period
| Goldman Sachs Strategic Factor Allocation Fund | ||||||||||||||||||||||
| Class R6 Shares | ||||||||||||||||||||||
| Year Ended August 31, | Period Ended August 31, 2018(a) |
|||||||||||||||||||||
| 2022 | 2021 | 2020 | 2019 | |||||||||||||||||||
| Per Share Data |
| |||||||||||||||||||||
| Net asset value, beginning of period |
$ | 12.63 | $ | 11.87 | $ | 10.96 | $ | 11.26 | $ | 11.10 | ||||||||||||
| Net investment income (loss)(b) |
(0.03 | ) | (0.08 | ) | 0.02 | 0.12 | 0.04 | |||||||||||||||
| Net realized and unrealized gain (loss) |
(0.63 | ) | 1.75 | 1.19 | 0.28 | 0.12 | ||||||||||||||||
| Total from investment operations |
(0.66 | ) | 1.67 | 1.21 | 0.40 | 0.16 | ||||||||||||||||
| Distributions to shareholders from net investment income |
— | — | (0.16 | ) | (0.09 | ) | — | |||||||||||||||
| Distributions to shareholders from net realized gains |
(1.58 | ) | (0.91 | ) | (0.14 | ) | (0.61 | ) | — | |||||||||||||
| Total distributions |
(1.58 | ) | (0.91 | ) | (0.30 | ) | (0.70 | ) | — | |||||||||||||
| Net asset value, end of period |
$ | 10.39 | $ | 12.63 | $ | 11.87 | $ | 10.96 | $ | 11.26 | ||||||||||||
| Total return(c) | (6.37 | )% | 15.08 | % | 11.12 | % | 4.14 | % | 1.44 | % | ||||||||||||
| Net assets, end of period (in 000s) |
$ | 13 | $ | 14 | $ | 12 | $ | 11 | $ | 10 | ||||||||||||
| Ratio of net expenses to average net assets |
0.65 | % | 0.66 | % | 0.66 | % | 0.68 | % | 0.69 | %(d) | ||||||||||||
| Ratio of total expenses to average net assets |
0.77 | % | 0.78 | % | 0.80 | % | 0.80 | % | 0.79 | %(d) | ||||||||||||
| Ratio of net investment income (loss) to average net assets |
(0.28 | )% | (0.64 | )% | 0.15 | % | 1.08 | % | 0.58 | %(d) | ||||||||||||
| Portfolio turnover rate(e) |
— | %(f) | — | %(f) | — | %(f) | 962 | % | 725 | % | ||||||||||||
| (a) | Commenced operations on December 29, 2017. |
| (b) | Calculated based on the average shares outstanding methodology. |
| (c) | Assumes investment at the NAV at the beginning of the period, reinvestment of all distributions, a complete redemption of the investment at the NAV at the end of the period and no sales or redemption charges (if any). Total returns would be reduced if a sales or redemption charge was taken into account. Returns do not reflect the impact of taxes to shareholders relating to Fund distributions or the redemption of Fund shares. Total returns for periods less than one full year are not annualized. |
| (d) | Annualized. |
| (e) | The Fund’s portfolio turnover rate is calculated in accordance with regulatory requirements, without regard to transactions involving short term investments and certain derivatives. If such transactions were included, the Fund’s portfolio turnover rate may be higher. |
| (f) | There were no long-term transactions for the year ended August 31, 2022, August 31, 2021 and August 31, 2020, respectively. |
| The accompanying notes are an integral part of these financial statements. | 65 |
GOLDMAN SACHS STRATEGIC FACTOR ALLOCATION FUND
Financial Highlights (continued)
Selected Share Data for a Share Outstanding Throughout Each Period
| Goldman Sachs Strategic Factor Allocation Fund | ||||||||||||||||||||||
| Class P Shares | ||||||||||||||||||||||
| Year Ended August 31, | Period Ended August 31, 2018(a) |
|||||||||||||||||||||
| 2022 | 2021 | 2020 | 2019 | |||||||||||||||||||
| Per Share Data |
| |||||||||||||||||||||
| Net asset value, beginning of period |
$ | 12.62 | $ | 11.86 | $ | 10.96 | $ | 11.26 | $ | 10.83 | ||||||||||||
| Net investment income (loss)(b) |
(0.04 | ) | (0.08 | ) | 0.02 | 0.11 | 0.02 | |||||||||||||||
| Net realized and unrealized gain (loss) |
(0.62 | ) | 1.75 | 1.18 | 0.29 | 0.41 | ||||||||||||||||
| Total from investment operations |
(0.66 | ) | 1.67 | 1.20 | 0.40 | 0.43 | ||||||||||||||||
| Distributions to shareholders from net investment income |
— | — | (0.16 | ) | (0.09 | ) | — | |||||||||||||||
| Distributions to shareholders from net realized gains |
(1.58 | ) | (0.91 | ) | (0.14 | ) | (0.61 | ) | — | |||||||||||||
| Total distributions |
(1.58 | ) | (0.91 | ) | (0.30 | ) | (0.70 | ) | — | |||||||||||||
| Net asset value, end of period |
$ | 10.38 | $ | 12.62 | $ | 11.86 | $ | 10.96 | $ | 11.26 | ||||||||||||
| Total return(c) | (6.47 | )% | 15.09 | % | 11.03 | % | 4.16 | % | 3.97 | % | ||||||||||||
| Net assets, end of period (in 000s) |
$ | 2,095,895 | $ | 2,347,839 | $ | 1,616,030 | $ | 1,565,955 | $ | 2,467,490 | ||||||||||||
| Ratio of net expenses to average net assets |
0.67 | % | 0.68 | % | 0.68 | % | 0.71 | % | 0.71 | %(d) | ||||||||||||
| Ratio of total expenses to average net assets |
0.80 | % | 0.81 | % | 0.82 | % | 0.82 | % | 0.80 | %(d) | ||||||||||||
| Ratio of net investment income (loss) to average net assets |
(0.31 | )% | (0.66 | )% | 0.15 | % | 1.07 | % | 0.40 | %(d) | ||||||||||||
| Portfolio turnover rate(e) |
— | %(f) | — | %(f) | — | %(f) | 962 | % | 725 | % | ||||||||||||
| (a) | Commenced operations on April 17, 2018. |
| (b) | Calculated based on the average shares outstanding methodology. |
| (c) | Assumes investment at the NAV at the beginning of the period, reinvestment of all dividends and distributions, a complete redemption of the investment at the NAV at the end of the period and no sales or redemption charges (if any). Total returns would be reduced if a sales or redemption charge was taken into account. Returns do not reflect the impact of taxes to shareholders relating to Fund distributions or the redemption of Fund shares. Total returns for periods less than one full year are not annualized. |
| (d) | Annualized. |
| (e) | The Fund’s portfolio turnover rate is calculated in accordance with regulatory requirements, without regard to transactions involving short term investments and certain derivatives. If such transactions were included, the Fund’s portfolio turnover rate may be higher. |
| (f) | There were no long-term transactions for the year ended August 31, 2022, August 31, 2021 and August 31, 2020, respectively. |
| 66 | The accompanying notes are an integral part of these financial statements. |
GOLDMAN SACHS STRATEGIC VOLATILITY PREMIUM FUND
Financial Highlights (continued)
Selected Share Data for a Share Outstanding Throughout Each Period
| (a) | Commenced operations on March 29, 2021. |
| (b) | Calculated based on the average shares outstanding methodology. |
| (c) | Amount is less than $0.005 per share. |
| (d) | Assumes investment at the NAV at the beginning of the period, reinvestment of all dividends and distributions, a complete redemption of the investment at the NAV at the end of the period and no sales or redemption charges (if any). Total returns would be reduced if a sales or redemption charge was taken into account. Returns do not reflect the impact of taxes to shareholders relating to Fund distributions or the redemption of Fund shares. Total returns for periods less than one full year are not annualized. |
| (e) | Annualized. |
| (f) | The Fund’s portfolio turnover rate is calculated in accordance with regulatory requirements, without regard to transactions involving short term investments and certain derivatives. If such transactions were included, the Fund’s portfolio turnover rate may be higher. |
| (g) | There were no long-term transactions for the year ended August 31, 2022 and period ended August 31, 2021. |
| The accompanying notes are an integral part of these financial statements. | 67 |
GOLDMAN SACHS STRATEGIC VOLATILITY PREMIUM FUND
Financial Highlights (continued)
Selected Share Data for a Share Outstanding Throughout Each Period
| Goldman Sachs Strategic Volatility Premium Fund |
||||||||||
| Class P Shares | ||||||||||
| Year Ended August 31, 2022 |
Period Ended August 31, 2021(a) |
|||||||||
| Per Share Data |
|
|||||||||
| Net asset value, beginning of period |
$ | 10.10 | $ | 10.00 | ||||||
| Net investment income (loss)(b) |
— | (c) | (0.01 | ) | ||||||
| Net realized and unrealized gain (loss) |
(0.40 | ) | 0.11 | |||||||
| Total from investment operations |
(0.40 | ) | 0.10 | |||||||
| Distributions to shareholders from net realized gains |
(0.04 | ) | — | |||||||
| Net asset value, end of period |
$ | 9.66 | $ | 10.10 | ||||||
| Total return(d) | (4.09 | )% | 1.00 | % | ||||||
| Net assets, end of period (in 000s) |
$ | 511,763 | $ | 422,570 | ||||||
| Ratio of net expenses to average net assets |
0.37 | % | 0.37 | %(e) | ||||||
| Ratio of total expenses to average net assets |
0.60 | % | 0.79 | %(e) | ||||||
| Ratio of net investment income (loss) to average net assets |
0.05 | % | (0.35 | )%(e) | ||||||
| Portfolio turnover rate(f) |
— | %(g) | — | %(g) | ||||||
| (a) | Commenced operations on March 29, 2021. |
| (b) | Calculated based on the average shares outstanding methodology. |
| (c) | Amount is less than ($0.005) per share. |
| (d) | Assumes investment at the NAV at the beginning of the period, reinvestment of all dividends and distributions, a complete redemption of the investment at the NAV at the end of the period and no sales or redemption charges (if any). Total returns would be reduced if a sales or redemption charge was taken into account. Returns do not reflect the impact of taxes to shareholders relating to Fund distributions or the redemption of Fund shares. Total returns for periods less than one full year are not annualized. |
| (e) | Annualized. |
| (f) | The Fund’s portfolio turnover rate is calculated in accordance with regulatory requirements, without regard to transactions involving short term investments and certain derivatives. If such transactions were included, the Fund’s portfolio turnover rate may be higher. |
| (g) | There were no long-term transactions for the year ended August 31, 2022 and period ended August 31, 2021. |
| 68 | The accompanying notes are an integral part of these financial statements. |
GOLDMAN SACHS TACTICAL TILT OVERLAY FUND
Consolidated Financial Highlights (continued)
Selected Share Data for a Share Outstanding Throughout Each Year
| (a) | Calculated based on the average shares outstanding methodology. |
| (b) | Assumes investment at the NAV at the beginning of the year, reinvestment of all dividends and distributions, a complete redemption of the investment at the NAV at the end of the year and no sales or redemption charges (if any). Total returns would be reduced if a sales or redemption charge was taken into account. Returns do not reflect the impact of taxes to shareholders relating to Fund distributions or the redemption of Fund shares. |
| (c) | Expense ratios exclude the expenses of the Underlying Funds in which the Fund invests. |
| (d) | The Fund’s portfolio turnover rate is calculated in accordance with regulatory requirements, without regard to transactions involving short term investments and certain derivatives. If such transactions were included, the Fund’s portfolio turnover rate may be higher. |
| The accompanying notes are an integral part of these financial statements. | 69 |
GOLDMAN SACHS TACTICAL TILT OVERLAY FUND
Consolidated Financial Highlights (continued)
Selected Share Data for a Share Outstanding Throughout Each Period
| Goldman Sachs Tactical Tilt Overlay Fund | ||||||||||||||||||||||
| Class R6 Shares | ||||||||||||||||||||||
| Year Ended August 31, | Period Ended August 31, 2018(a) |
|||||||||||||||||||||
| 2022 | 2021 | 2020 | 2019 | |||||||||||||||||||
| Per Share Data |
| |||||||||||||||||||||
| Net asset value, beginning of period |
$ | 10.33 | $ | 9.91 | $ | 9.67 | $ | 9.87 | $ | 9.81 | ||||||||||||
| Net investment income (loss)(b) |
0.02 | (0.01 | ) | 0.07 | 0.26 | 0.11 | ||||||||||||||||
| Net realized and unrealized gain (loss) |
0.03 | 0.92 | 0.28 | (0.20 | ) | (0.05 | ) | |||||||||||||||
| Total from investment operations |
0.05 | 0.91 | 0.35 | 0.06 | 0.06 | |||||||||||||||||
| Distributions to shareholders from net investment income |
(0.21 | ) | (0.49 | ) | (0.11 | ) | (0.26 | ) | — | |||||||||||||
| Net asset value, end of period |
$ | 10.17 | $ | 10.33 | $ | 9.91 | $ | 9.67 | $ | 9.87 | ||||||||||||
| Total return(c) | 0.49 | % | 9.48 | % | 3.80 | % | 0.58 | % | 0.61 | % | ||||||||||||
| Net assets, end of period (in 000s) |
$ | 573,866 | $ | 1,054,147 | $ | 736,643 | $ | 714,633 | $ | 343,370 | ||||||||||||
| Ratio of net expenses to average net assets(d) |
0.67 | % | 0.69 | % | 0.72 | % | 0.73 | % | 0.69 | %(e) | ||||||||||||
| Ratio of total expenses to average net assets(d) |
0.76 | % | 0.77 | % | 0.78 | % | 0.78 | % | 0.76 | %(e) | ||||||||||||
| Ratio of net investment income (loss) to average net assets |
0.23 | % | (0.09 | )% | 0.73 | % | 2.65 | % | 1.77 | %(e) | ||||||||||||
| Portfolio turnover rate(f) |
61 | % | 60 | % | 70 | % | 46 | % | 41 | % | ||||||||||||
| (a) | Commenced operations on December 29, 2017. |
| (b) | Calculated based on the average shares outstanding methodology. |
| (c) | Assumes investment at the NAV at the beginning of the period, reinvestment of all dividends and distributions, a complete redemption of the investment at the NAV at the end of the period and no sales or redemption charges (if any). Total returns would be reduced if a sales or redemption charge was taken into account. Returns do not reflect the impact of taxes to shareholders relating to Fund distributions or the redemption of Fund shares. Total returns for periods less than one full year are not annualized. |
| (d) | Expense ratios exclude the expenses of the Underlying Funds in which the Fund invests. |
| (e) | Annualized. |
| (f) | The Fund’s portfolio turnover rate is calculated in accordance with regulatory requirements, without regard to transactions involving short term investments and certain derivatives. If such transactions were included, the Fund’s portfolio turnover rate may be higher. |
| 70 | The accompanying notes are an integral part of these financial statements. |
GOLDMAN SACHS TACTICAL TILT OVERLAY FUND
Consolidated Financial Highlights (continued)
Selected Share Data for a Share Outstanding Throughout Each Period
| Goldman Sachs Tactical Tilt Overlay Fund | ||||||||||||||||||||||
| Class P Shares | ||||||||||||||||||||||
| Year Ended August 31, | Period Ended August 31, 2018(a) |
|||||||||||||||||||||
| 2022 | 2021 | 2020 | 2019 | |||||||||||||||||||
| Per Share Data |
| |||||||||||||||||||||
| Net asset value, beginning of period |
$ | 10.33 | $ | 9.91 | $ | 9.66 | $ | 9.87 | $ | 9.76 | ||||||||||||
| Net investment income (loss)(b) |
0.04 | (0.01 | ) | 0.08 | 0.20 | 0.14 | ||||||||||||||||
| Net realized and unrealized gain (loss) |
0.01 | 0.92 | 0.28 | (0.15 | ) | (0.03 | ) | |||||||||||||||
| Total from investment operations |
0.05 | 0.91 | 0.36 | 0.05 | 0.11 | |||||||||||||||||
| Distributions to shareholders from net investment income |
(0.21 | ) | (0.49 | ) | (0.11 | ) | (0.26 | ) | — | |||||||||||||
| Net asset value, end of period |
$ | 10.17 | $ | 10.33 | $ | 9.91 | $ | 9.66 | $ | 9.87 | ||||||||||||
| Total return(c) | 0.49 | % | 9.47 | % | 3.79 | % | 0.59 | % | 1.13 | % | ||||||||||||
| Net assets, end of period (in 000s) |
$ | 3,951,830 | $ | 3,037,227 | $ | 2,291,061 | $ | 3,190,855 | $ | 4,045,246 | ||||||||||||
| Ratio of net expenses to average net assets(d) |
0.67 | % | 0.69 | % | 0.72 | % | 0.72 | % | 0.71 | %(e) | ||||||||||||
| Ratio of total expenses to average net assets(d) |
0.76 | % | 0.77 | % | 0.78 | % | 0.78 | % | 0.77 | %(e) | ||||||||||||
| Ratio of net investment income (loss) to average net assets |
0.37 | % | (0.08 | )% | 0.78 | % | 2.07 | % | 3.80 | %(e) | ||||||||||||
| Portfolio turnover rate(f) |
61 | % | 60 | % | 70 | % | 46 | % | 41 | % | ||||||||||||
| (a) | Commenced operations on April 17, 2018. |
| (b) | Calculated based on the average shares outstanding methodology. |
| (c) | Assumes investment at the NAV at the beginning of the period, reinvestment of all dividends and distributions, a complete redemption of the investment at the NAV at the end of the period and no sales or redemption charges (if any). Total returns would be reduced if a sales or redemption charge was taken into account. Returns do not reflect the impact of taxes to shareholders relating to Fund distributions or the redemption of Fund shares. Total returns for periods less than one full year are not annualized. |
| (d) | Expense ratios exclude the expenses of the Underlying Funds in which the Fund invests. |
| (e) | Annualized. |
| (f) | The Fund’s portfolio turnover rate is calculated in accordance with regulatory requirements, without regard to transactions involving short term investments and certain derivatives. If such transactions were included, the Fund’s portfolio turnover rate may be higher. |
| The accompanying notes are an integral part of these financial statements. | 71 |
GOLDMAN SACHS ALLOCATION FUNDS
August 31, 2022
| 1. ORGANIZATION |
Goldman Sachs Trust (the “Trust”) is a Delaware statutory trust registered under the Investment Company Act of 1940, as amended (the “Act”), as an open-end management investment company. The following table lists those series of the Trust that are included in this report (collectively, the “Funds” or individually a “Fund”), along with their corresponding share classes and respective diversification status under the Act:
| Fund | Share Classes Offered | Diversified/ Non-diversified | ||
| Global Managed Beta |
Institutional |
Diversified | ||
| Strategic Factor Allocation |
Institutional, R6 and P |
Diversified | ||
| Strategic Volatility Premium |
Institutional and P |
Diversified | ||
| Tactical Tilt Overlay |
Institutional, R6 and P |
Diversified |
Goldman Sachs Asset Management, L.P. (“GSAM”), an affiliate of Goldman Sachs & Co. LLC (“Goldman Sachs”), serves as investment adviser to each of the Global Managed Beta, Strategic Factor Allocation, Strategic Volatility Premium and Tactical Tilt Overlay Funds pursuant to management agreements (the “Agreement”) with the Trust.
| 2. SIGNIFICANT ACCOUNTING POLICIES |
The financial statements have been prepared in accordance with accounting principles generally accepted in the United States of America (“GAAP”) and require management to make estimates and assumptions that may affect the reported amounts and disclosures. Actual results may differ from those estimates and assumptions. Each Fund is an investment company under GAAP and follows the accounting and reporting guidance applicable to investment companies.
A. Basis of Consolidation for Goldman Sachs Tactical Tilt Overlay Fund — The Cayman Commodity – TTIF, LLC. (the “Subsidiary”), a Cayman Islands exempted company is currently a wholly-owned subsidiary of the Tactical Tilt Overlay Fund. The Subsidiary acts as an investment vehicle for the Fund to enable the Fund to gain exposure to certain types of commodity-linked derivative instruments. The Fund is the sole shareholder of the Subsidiary and it is intended that the Fund will remain the sole shareholder and will continue to control the Subsidiary. All inter-fund balances and transactions have been eliminated in consolidation. As of August 31, 2022, the Fund’s net assets were $4,547,284,322, of which, $503,890,566, or 11.1%, represented the Subsidiary’s net assets.
B. Investment Valuation — Each Fund’s valuation policies are to value investments at fair value.
C. Investment Income and Investments — Investment income includes interest income, dividend income and securities lending income, if any. Interest income is accrued daily and adjusted for amortization of premiums and accretion of discounts. Dividend income is recognized on ex-dividend date or, for certain foreign securities, as soon as such information is obtained subsequent to the ex-dividend date. Non-cash dividends, if any, are recorded at the fair market value of the securities received. Investment transactions are reflected on trade date. Realized gains and losses are calculated using identified cost. Investment transactions are recorded on the following business day for daily net asset value (“NAV”) calculations. Investment income is recorded net of any foreign withholding taxes, less any amounts reclaimable. The Funds may file withholding tax reclaims in certain jurisdictions to recover a portion of amounts previously withheld. For the Global Managed Beta Fund, these reclaims, if any, are recorded when the amount is known and there are no significant uncertainties on collectability. Such amounts recovered, if any, are reflected as other income in the Statement of Operations. Any foreign capital gains tax is accrued daily based upon net unrealized gains, and is payable upon sale of such investments. Distributions received from a Fund’s investments in U.S. real estate investment trusts (“REITs”) may be characterized as ordinary income, net capital gain and/or a return of capital. A return of capital is recorded by the Fund as a reduction to the cost basis of the REIT.
72
GOLDMAN SACHS ALLOCATION FUNDS
| 2. SIGNIFICANT ACCOUNTING POLICIES (continued) |
Distributions from master limited partnerships (“MLPs”) are generally recorded based on the characterization reported on the MLP’s tax return. A Fund records its pro-rata share of the income/loss and capital gains/losses, allocated from the underlying partnerships and adjusts the cost basis of the underlying partnerships accordingly. Income distributions are recognized as capital gains or income in the financial statements in accordance with the character that is distributed.
For derivative contracts, unrealized gains and losses are recorded daily and become realized gains and losses upon disposition or termination of the contract. Upfront payments, if any, are made or received upon entering into a swap agreement and are reflected in the Statements of Assets and Liabilities and Consolidated Statement of Assets and Liabilities. Upfront payments are recognized over the contract’s term/event as realized gains or losses, with the exception of forward starting swap contracts whose realized gains or losses are recognized from the effective start date. For securities with paydown provisions, principal payments received are treated as a proportionate reduction to the cost basis of the securities, and excess or shortfall amounts are recorded as income. For treasury inflation protected securities (“TIPS”), adjustments to principal due to inflation/deflation are reflected as increases/decreases to interest income with a corresponding adjustment to cost.
D. Class Allocations and Expenses for Tactical Tilt Overlay Fund, Strategic Factor Allocation Fund and Strategic Volatility Premium Fund — Investment income, realized and unrealized gain (loss), if any, and non-class specific expenses of each Fund are allocated daily based upon the proportion of net assets of each class. Non-class specific expenses directly incurred by a Fund are charged to that Fund, while such expenses incurred by the Trust are allocated across the applicable Fund on a straight-line and/or pro-rata basis depending upon the nature of the expenses. Class specific expenses, where applicable, are borne by the respective share classes and include Transfer Agency fees.
E. Expenses for Global Managed Beta Fund — Expenses incurred directly by the Fund are charged to the Fund, and certain expenses incurred by the Trust that may not solely relate to the Fund are allocated to the Fund and the other applicable funds of the Trust on a straight-line and/or pro-rata basis, depending upon the nature of the expenses, and are accrued daily.
F. Offering Costs — Offering costs paid in connection with the initial offering of shares of the Strategic Volatility Premium Fund were being amortized on a straight-line basis over 12 months from the date of commencement of operations.
G. Federal Taxes and Distributions to Shareholders — It is each Fund’s policy to comply with the requirements of the Internal Revenue Code of 1986, as amended (the “Code”), applicable to regulated investment companies and to distribute each year substantially all of its investment company taxable income and capital gains to its shareholders. Accordingly, each Fund is not required to make any provisions for the payment of federal income tax. Distributions to shareholders are recorded on the ex-dividend date. Income and capital gains distributions, if any, are declared and paid at least annually.
The Subsidiary is classified as a controlled foreign corporation under the Code. Therefore, the Tactical Tilt Overlay Fund is required to increase its taxable income by its share of the Subsidiary’s income. Net losses of the Subsidiary cannot be deducted by the Fund in the current period nor carried forward to offset taxable income in future periods.
Net capital losses, if any, are carried forward to future fiscal years and may be used to the extent allowed by the Code to offset any future capital gains. Losses that are carried forward will retain their character as either short-term or long-term capital losses. Utilization of capital loss carryforwards will reduce the requirement of future capital gains distributions.
The characterization of distributions to shareholders for financial reporting purposes is determined in accordance with federal income tax rules, which may differ from GAAP. The source of each Fund’s distributions may be shown in the accompanying financial statements as either from distributable earnings or capital. Certain components of the Fund’s net assets on the Statements of Assets and Liabilities and Consolidated Statement of Assets and Liabilities reflect permanent GAAP/tax differences based on the appropriate tax character.
H. Foreign Currency Translation — The accounting records and reporting currency of the Funds are maintained in U.S. dollars. Assets and liabilities denominated in foreign currencies are translated into U.S. dollars using the current exchange rates at the close of each business day. The effect of changes in foreign currency exchange rates on investments is included within net realized and unrealized gain (loss) on investments. Changes in the value of other assets and liabilities as a result of fluctuations in foreign exchange rates are included in the Statements of Operations and Consolidated Statement of Operations within net change in unrealized gain (loss) on foreign currency translation. Transactions denominated in foreign currencies are translated into U.S. dollars on the date the transaction occurred, the effects of which are included within net realized gain (loss) on foreign currency transactions.
73
GOLDMAN SACHS ALLOCATION FUNDS
Notes to Financial Statements (continued)
August 31, 2022
| 3. INVESTMENTS AND FAIR VALUE MEASUREMENTS |
U.S. GAAP defines the fair value of a financial instrument as the amount that would be received to sell an asset or paid to transfer a liability in an orderly transaction between market participants at the measurement date (i.e., the exit price); the Funds’ policy is to use the market approach. GAAP establishes a fair value hierarchy that prioritizes the inputs to valuation techniques used to measure fair value. The hierarchy gives the highest priority to unadjusted quoted prices in active markets for identical assets or liabilities (Level 1 measurements) and the lowest priority to unobservable inputs (Level 3 measurements). The level in the fair value hierarchy within which the fair value measurement in its entirety falls shall be determined based on the lowest level input that is significant to the fair value measurement in its entirety. The levels used for classifying investments are not necessarily an indication of the risk associated with investing in these investments. The three levels of the fair value hierarchy are described below:
Level 1 — Unadjusted quoted prices in active markets that are accessible at the measurement date for identical, unrestricted assets or liabilities;
Level 2 — Quoted prices in markets that are not active or financial instruments for which significant inputs are observable (including, but not limited to, quoted prices for similar investments, interest rates, foreign exchange rates, volatility and credit spreads), either directly or indirectly;
Level 3 — Prices or valuations that require significant unobservable inputs (including GSAM’s assumptions in determining fair value measurement).
The Board of Trustees (“Trustees”) has approved Valuation Procedures that govern the valuation of the portfolio investments held by the Funds, including investments for which market quotations are not readily available. With respect to a Fund’s investments that do not have readily available market quotations, the Trustees have designated the Adviser as the valuation designee to perform fair valuations pursuant to Rule 2a-5 under the Investment Company Act of 1940 (the “Valuation Designee”). GSAM has day-to-day responsibility for implementing and maintaining internal controls and procedures related to the valuation of the Fund’s investments. To assess the continuing appropriateness of pricing sources and methodologies, GSAM regularly performs price verification procedures and issues challenges as necessary to third party pricing vendors or brokers, and any differences are reviewed in accordance with the Valuation Procedures.
A. Level 1 and Level 2 Fair Value Investments — The valuation techniques and significant inputs used in determining the fair values for investments classified as Level 1 and Level 2 are as follows:
Equity Securities — Equity securities traded on a United States (“U.S.”) securities exchange or the NASDAQ system, or those located on certain foreign exchanges, including but not limited to the Americas, are valued daily at their last sale price or official closing price on the principal exchange or system on which they are traded. If there is no sale or official closing price or such price is believed by GSAM to not represent fair value, equity securities will be valued at the valid closing bid price for long positions and at the valid closing ask price for short positions (i.e. where there is sufficient volume, during normal exchange trading hours). If no valid bid/ask price is available, the equity security will be valued pursuant to the Valuation Procedures and consistent with applicable regulatory guidance. To the extent these investments are actively traded, they are classified as Level 1 of the fair value hierarchy, otherwise they are generally classified as Level 2. Certain equity securities containing unique attributes may be classified as Level 2.
Unlisted equity securities for which market quotations are available are valued at the last sale price on the valuation date, or if no sale occurs, at the last bid price for long positions or the last ask price for short positions, and are generally classified as Level 2. Securities traded on certain foreign securities exchanges are valued daily at fair value determined by an independent fair value service (if available) under the Valuation Procedures and consistent with applicable regulatory guidance. The independent fair value service takes into account multiple factors including, but not limited to, movements in the securities markets, certain depositary receipts, futures contracts and foreign currency exchange rates that have occurred subsequent to the close of the foreign securities exchange. These investments are generally classified as Level 2 of the fair value hierarchy.
Underlying Funds (including Money Market Funds) — Underlying funds (“Underlying Funds”) include other investment companies and exchange-traded funds (“ETFs”). Investments in the Underlying Funds (except ETFs) are valued at the NAV per share on the day of valuation. ETFs are valued daily at the last sale price or official closing price on the principal exchange or
74
GOLDMAN SACHS ALLOCATION FUNDS
| 3. INVESTMENTS AND FAIR VALUE MEASUREMENTS (continued) |
system on which the investment is traded. Because the Funds invest in Underlying Funds that fluctuate in value, the Funds’ shares will correspondingly fluctuate in value. Underlying Funds are generally classified as Level 1 of the fair value hierarchy. To the extent that underlying ETFs are actively traded, they are classified as Level 1 of the fair value hierarchy, otherwise they are generally classified as Level 2. For information regarding an Underlying Fund’s accounting policies and investment holdings, please see the Underlying Fund’s shareholder report.
Debt Securities — Debt securities for which market quotations are readily available are valued daily on the basis of quotations supplied by dealers or an independent pricing service. The pricing services may use valuation models or matrix pricing, which consider: (i) yield or price with respect to bonds that are considered comparable in characteristics such as rating, interest rate and maturity date or (ii) quotations from securities dealers to determine current value. With the exception of treasury securities of G7 countries, which are generally classified as Level 1, these investments are generally classified as Level 2 of the fair value hierarchy.
i. Commercial Paper — Commercial paper normally represents short-term unsecured promissory notes issued in bearer form by banks or bank holding companies, corporations, finance companies and other issuers. Commercial paper consists of direct U.S. dollar-denominated obligations of domestic or foreign issuers. Asset-backed commercial paper is issued by a special purpose entity that is organized to issue the commercial paper and to purchase trade receivables or other financial assets.
Derivative Contracts — A derivative is an instrument whose value is derived from underlying assets, indices, reference rates or a combination of these factors. A Fund enters into derivative transactions to hedge against changes in interest rates, securities prices, and/or currency exchange rates, to increase total return, or to gain access to certain markets or attain exposure to other underliers. For financial reporting purposes, cash collateral that has been pledged to cover obligations of a Fund and cash collateral received, if any, is reported separately on the Statements of Assets and Liabilities and Consolidated Statement of Assets and Liabilities as either due to broker/receivable for collateral on certain derivative contracts. Non-cash collateral pledged by a Fund, if any, is noted in the Schedules and Consolidated Schedule of Investments.
Exchange-traded derivatives, including futures and options contracts, are generally valued at the last sale or settlement price on the exchange where they are principally traded. Exchange-traded options without settlement prices are generally valued at the midpoint of the bid and ask prices on the exchange where they are principally traded (or, in the absence of two-way trading, at the last bid price for long positions and the last ask price for short positions). Exchange-traded derivatives typically fall within Level 1 of the fair value hierarchy. Over-the-counter (“OTC”) and centrally cleared derivatives are valued using market transactions and other market evidence, including market-based inputs to models, calibration to market-clearing transactions, broker or dealer quotations, or other alternative pricing sources. Where models are used, the selection of a particular model to value OTC and centrally cleared derivatives depends upon the contractual terms of, and specific risks inherent in, the instrument, as well as the availability of pricing information in the market. Valuation models require a variety of inputs, including contractual terms, market prices, yield curves, credit curves, measures of volatility, voluntary and involuntary prepayment rates, loss severity rates and correlations of such inputs. For OTC and centrally cleared derivatives that trade in liquid markets, model inputs can generally be verified and model selection does not involve significant management judgment. OTC and centrally cleared derivatives are
classified within Level 2 of the fair value hierarchy when significant inputs are corroborated by market evidence.
i. Forward Contracts — A forward contract is a contract between two parties to buy or sell an asset at a specified price on a future date. A forward contract settlement can occur on a cash or delivery basis. Forward contracts are marked-to-market daily using independent vendor prices, and the change in value, if any, is recorded as an unrealized gain or loss. Cash and certain investments may be used to collateralize forward contracts.
A forward foreign currency exchange contract is a forward contract in which a Fund agrees to receive or deliver a fixed quantity of one currency for another, at a pre-determined price at a future date. All forward foreign currency exchange contracts are marked to market daily by using the outright forward rates or interpolating based upon maturity dates, where available. Non-deliverable forward foreign currency exchange contracts are settled with the counterparty in cash without the delivery of foreign currency.
75
GOLDMAN SACHS ALLOCATION FUNDS
Notes to Financial Statements (continued)
August 31, 2022
| 3. INVESTMENTS AND FAIR VALUE MEASUREMENTS (continued) |
ii. Futures Contracts — Futures contracts are contracts to buy or sell a standardized quantity of a specified commodity or security. Upon entering into a futures contract, a Fund deposits cash or securities in an account on behalf of the broker in an amount sufficient to meet the initial margin requirement. Subsequent payments are made or received by a Fund equal to the daily change in the contract value and are recorded as variation margin receivable or payable with a corresponding offset to unrealized gains or losses.
iii. Options — When a Fund writes call or put options, an amount equal to the premium received is recorded as a liability and is subsequently marked-to-market to reflect the current value of the option written. Swaptions are options on swap contracts.
Upon the purchase of a call option or a put option by a Fund, the premium paid is recorded as an investment and subsequently marked-to-market to reflect the current value of the option. Certain options may be purchased with premiums to be determined on a future date. The premiums for these options are based upon implied volatility parameters at specified terms.
iv. Swap Contracts — Bilateral swap contracts are agreements in which a Fund and a counterparty agree to exchange periodic payments on a specified notional amount or make a net payment upon termination. Bilateral swap transactions are privately negotiated in the OTC market and payments are settled through direct payments between a Fund and the counterparty. By contrast, certain swap transactions are subject to mandatory central clearing. These swaps are executed through a derivatives clearing member (“DCM”), acting in an agency capacity, and submitted to a central counterparty (“CCP”) (“centrally cleared swaps”), in which case all payments are settled with the CCP through the DCM. Swaps are marked-to-market daily using pricing vendor quotations, counterparty or clearinghouse prices or model prices, and the change in value, if any, is recorded as an unrealized gain or loss. Upon entering into a swap contract, a Fund is required to satisfy an initial margin requirement by delivering cash or securities to the counterparty (or in some cases, segregated in a triparty account on behalf of the counterparty), which can be adjusted by any mark-to-market gains or losses pursuant to bilateral or centrally cleared arrangements. For centrally cleared swaps the daily change in valuation, if any, is recorded as a receivable or payable for variation margin.
An interest rate swap is an agreement that obligates two parties to exchange a series of cash flows at specified intervals, based upon or calculated by reference to changes in interest rates on a specified notional principal amount. The payment flows are usually netted against each other, with the difference being paid by one party to the other.
As a seller of protection, a Fund generally receives a payment stream throughout the term of the swap, provided that there is no credit event. In addition, if a Fund sells protection through a credit default swap, a Fund could suffer a loss because the value of the referenced obligation and the premium payments received may be less than the notional amount of the swap paid to the buyer of protection. Upon the occurrence of a specified credit event, a Fund, as a seller of credit protection, may be required to take possession of the defaulted reference obligation and pay the buyer an amount equal to the notional amount of the swap in a physically settled trade. A Fund may also pay a net settlement amount in the form of cash or securities equal to the notional amount of the swap reduced by the recovery value of the reference obligation in a cash settled trade. Recovery values are at times established through the credit event auction process in which market participants are ensured that a transparent price has been set for the defaulted security or obligation. In addition, a Fund is entitled to a return of any assets, which have been pledged as collateral to the counterparty upon settlement.
The maximum potential amount of future payments (undiscounted) that a Fund as seller of protection could be required to make under a credit default swap would be an amount equal to the notional amount of the agreement. These potential amounts would be partially offset by any recovery values of the respective referenced obligations or net amounts received from a settlement of a credit default swap for the same reference security or obligation where the Fund bought credit protection.
A total return swap is an agreement that gives a Fund the right to receive or pay the appreciation or depreciation, as applicable, in the value of a specified security, an index, a basket of securities or indices or other instrument in return for a fee paid to the counterparty, which will typically be an agreed upon interest rate. If the underlying asset declines in value over the term of the swap, a Fund may also be required to pay the dollar value of that decline to the counterparty.
76
GOLDMAN SACHS ALLOCATION FUNDS
| 3. INVESTMENTS AND FAIR VALUE MEASUREMENTS (continued) |
B. Level 3 Fair Value Investments — To the extent that significant inputs to valuation models and other alternative pricing sources are unobservable, or if quotations are not readily available, or if GSAM believes that such quotations do not accurately reflect fair value, the fair value of each Fund’s investments may be determined under the Valuation Procedures. GSAM, consistent with its procedures and applicable regulatory guidance, may make an adjustment to the most recent valuation prices of either domestic or foreign securities in light of significant events to reflect what it believes to be the fair value of the securities at the time of determining a Fund’s NAV. To the extent investments are valued using single source broker quotations obtained directly from the broker or passed through from third party pricing vendors, such investments are classified as Level 3 investments.
C. Fair Value Hierarchy — The following is a summary of the Fund’s investments and derivatives classified in the fair value hierarchy as of August 31, 2022:
| GLOBAL MANAGED BETA |
| |||||||||||
| Investment Type | Level 1 | Level 2 | Level 3 | |||||||||
| Assets | ||||||||||||
| Common Stock and/or Other Equity Investments(a) |
||||||||||||
| Asia |
$ | 361,582 | $ | 13,526,336 | $ | — | ||||||
| Australia and Oceania |
— | 3,955,675 | — | |||||||||
| Europe |
3,071,528 | 31,131,529 | — | |||||||||
| North America |
127,542,620 | — | — | |||||||||
| South America |
— | 13,411 | — | |||||||||
| Exchange Traded Funds |
1,218,870,748 | — | — | |||||||||
| Investment Company |
175,934,056 | — | — | |||||||||
| Securities Lending Reinvestment Vehicle |
70,746,676 | — | — | |||||||||
| Total | $ | 1,596,527,210 | $ | 48,626,951 | $ | — | ||||||
| Derivative Type | ||||||||||||
| Assets | ||||||||||||
| Forward Foreign Currency Exchange Contracts(b) |
$ | — | $ | 22,240,770 | $ | — | ||||||
| Purchased Option Contracts |
6,881,350 | 9,546,178 | — | |||||||||
| Total | $ | 6,881,350 | $ | 31,786,948 | $ | — | ||||||
| Liabilities | ||||||||||||
| Forward Foreign Currency Exchange Contracts(b) |
$ | — | $ | (1,266,476 | ) | $ | — | |||||
| Futures Contracts(b) |
(1,880,691 | ) | — | — | ||||||||
| Written Option Contracts |
(3,785,303 | ) | (5,980,005 | ) | — | |||||||
| Total | $ | (5,665,994 | ) | $ | (7,246,481 | ) | $ | — | ||||
| (a) | Amounts are disclosed by continent to highlight the impact of time zone differences between local market close and the calculation of net asset value. Security valuations are based on the principal exchange or system on which they are traded, which may differ from country of domicile. The Fund utilizes fair value model prices provided by an independent fair value service for international equities, resulting in a Level 2 classification. |
| (b) | Amount shown represents unrealized gain (loss) at period end. |
77
GOLDMAN SACHS ALLOCATION FUNDS
Notes to Financial Statements (continued)
August 31, 2022
| 3. INVESTMENTS AND FAIR VALUE MEASUREMENTS (continued) |
| STRATEGIC FACTOR ALLOCATION |
| |||||||||||
| Investment Type | Level 1 | Level 2 | Level 3 | |||||||||
| Assets | ||||||||||||
| Investment Company |
$ | 1,564,632,614 | $ | — | $ | — | ||||||
| Derivative Type | ||||||||||||
| Assets | ||||||||||||
| Forward Foreign Currency Exchange Contracts(a) |
$ | — | $ | 3,708,771 | $ | — | ||||||
| Futures Contracts(a) |
2,845,374 | — | — | |||||||||
| Purchased Option Contracts |
711,383 | — | — | |||||||||
| Total | $ | 3,556,757 | $ | 3,708,771 | $ | — | ||||||
| Liabilities | ||||||||||||
| Forward Foreign Currency Exchange Contracts(a) |
$ | — | $ | (1,315,608 | ) | $ | — | |||||
| Futures Contracts(a) |
(7,369,422 | ) | — | — | ||||||||
| Written Option Contracts |
(4,514,047 | ) | — | — | ||||||||
| Total | $ | (11,883,469 | ) | $ | (1,315,608 | ) | $ | — | ||||
| GS STRATEGIC VOLATILITY PREMIUM |
| |||||||||||
| Investment Type | Level 1 | Level 2 | Level 3 | |||||||||
| Assets | ||||||||||||
| Investment Company |
$ | 343,787,202 | $ | — | $ | — | ||||||
| Derivative Type | ||||||||||||
| Assets | ||||||||||||
| Purchased Option Contracts |
$ | 181,775 | $ | — | $ | — | ||||||
| Liabilities | ||||||||||||
| Futures Contracts(a) |
$ | (1,195,707 | ) | $ | — | $ | — | |||||
| Written Option Contracts |
(112,660 | ) | — | — | ||||||||
| Total | $ | (1,308,367 | ) | $ | — | $ | — | |||||
| (a) | Amount shown represents unrealized gain (loss) at period end. |
78
GOLDMAN SACHS ALLOCATION FUNDS
| 3. INVESTMENTS AND FAIR VALUE MEASUREMENTS (continued) |
| TACTICAL TILT OVERLAY | ||||||||||||
| Investment Type | Level 1 | Level 2 | Level 3 | |||||||||
| Assets | ||||||||||||
| Fixed Income |
||||||||||||
| U.S. Treasury Obligations and/or Other U.S. Government Agencies |
$ | 210,440,495 | $ | 37,246,252 | $ | — | ||||||
| Exchange Traded Funds |
346,949,622 | — | — | |||||||||
| Investment Companies |
2,100,663,061 | — | — | |||||||||
| Short-Term Investments |
— | 1,813,428,600 | — | |||||||||
| Securities Lending Reinvestment Vehicle |
49,625,697 | — | — | |||||||||
| Total | $ | 2,707,678,875 | $ | 1,850,674,852 | $ | — | ||||||
| Derivative Type | ||||||||||||
| Assets | ||||||||||||
| Futures Contracts(a) |
$ | 402,295 | $ | — | $ | — | ||||||
| Total Return Swap Contracts(a) |
— | 9,009,569 | — | |||||||||
| Purchased Option Contracts |
— | 42,385,731 | — | |||||||||
| Total | $ | 402,295 | $ | 51,395,300 | $ | — | ||||||
| Liabilities | ||||||||||||
| Futures Contracts(a) |
$ | (6,103,394 | ) | $ | — | $ | — | |||||
| Total Return Swap Contracts(a) |
— | (95,066 | ) | — | ||||||||
| Written Option Contracts |
(395,390 | ) | (59,862,972 | ) | — | |||||||
| Total | $ | (6,498,784 | ) | $ | (59,958,038 | ) | $ | — | ||||
| (a) | Amount shown represents unrealized gain (loss) at period end. |
For further information regarding security characteristics, see the Schedules and Consolidated Schedule of Investments.
| 4. INVESTMENTS IN DERIVATIVES |
The following tables set forth, by certain risk types, the gross value of derivative contracts (not considered to be hedging instruments for accounting disclosure purposes) as of August 31, 2022. These instruments were used as part of a Fund’s investment strategies and to obtain and/or manage exposure related to the risks below. The values in the tables below exclude the effects of
79
GOLDMAN SACHS ALLOCATION FUNDS
Notes to Financial Statements (continued)
August 31, 2022
| 4. INVESTMENTS IN DERIVATIVES (continued) |
cash collateral received or posted pursuant to these derivative contracts, and therefore are not representative of a Fund’s net exposure.
| Global Managed Beta | ||||||||||||
| Risk | Statements of Assets and Liabilities |
Assets | Statements of Assets and Liabilities |
Liabilities | ||||||||
| Equity |
— | $ | — | Variation margin on futures contracts; Written options, at value | $ | (5,665,994) | (a) | |||||
| Interest Rate |
Purchased options, at value | 6,881,350 | — | — | ||||||||
| Currency |
Receivable for unrealized gain on forward foreign currency exchange contracts; Purchased options, at value | 31,786,948 | Payable for unrealized loss on forward foreign currency exchange contracts; Written options, at value | (7,246,481) | ||||||||
| Total | $ | 38,668,298 | $ | (12,912,475) | ||||||||
| Strategic Factor Allocation | ||||||||||||
| Risk | Statements of Assets and Liabilities |
Assets | Statements of Assets and Liabilities |
Liabilities | ||||||||
| Equity |
Variation margin on futures contracts; Purchased options, at value | $ | 2,227,925 | (a) | Written options, at value | $ | (434,188) | |||||
| Interest Rate |
Variation margin on futures contracts | 1,328,832 | (a) | Variation margin on futures contracts; Written options, at value | (11,449,281) | (a) | ||||||
| Currency |
Receivable for unrealized gain on forward foreign currency exchange contracts | 3,708,771 | Payable for unrealized loss on forward foreign currency exchange contracts | (1,315,608) | ||||||||
| Total | $ | 7,265,528 | $ | (13,199,077) | ||||||||
| Strategic Volatility Premium | ||||||||||||
| Risk | Statements of Assets and Liabilities |
Assets | Statements of Assets and Liabilities |
Liabilities | ||||||||
| Equity |
Variation margin on futures contracts; Purchased options, at value | $ | 181,775 | (a) | Variation margin on futures contracts; Written options, at value | $ | (265,405) | (a) | ||||
| Interest Rate |
— | — | Variation margin on futures contracts | (1,042,962) | (a) | |||||||
| Total | $ | 181,775 | $ | (1,308,367) | ||||||||
| (a) | Includes unrealized gain (loss) on futures contracts described in the Additional Investment Information sections of the Schedule of Investments. Only current day’s variation margin is reported within the Statement of Assets and Liabilities. |
80
GOLDMAN SACHS ALLOCATION FUNDS
| 4. INVESTMENTS IN DERIVATIVES (continued) |
| Tactical Tilt Overlay | ||||||||||||
| Risk | Consolidated Statement of Assets and Liabilities |
Assets | Consolidated Statement of Assets and Liabilities |
Liabilities | ||||||||
| Equity |
Receivable for unrealized gain on swap contracts; Variation margin on futures contracts; Purchased options, at value | $ | 39,492,588 | (a) | Payable for unrealized loss on swap contracts; Variation margin on futures contracts; Written options, at value | $ | (50,048,030) | (a)(b) | ||||
| Interest Rate |
Purchased options, at value | 2,188,335 | (a) | Variation margin on futures contracts; Written options, at value | (9,362,310) | (a) | ||||||
| Commodity |
— | — | Written options, at value | (395,390) | ||||||||
| Currency |
Purchased options, at value | 10,116,672 | Written options, at value | (6,651,092) | ||||||||
| Total | $ | 51,797,595 | $ | (66,456,822) | ||||||||
| (a) | Includes unrealized gain (loss) on futures contracts described in the Additional Investment Information sections of the Consolidated Schedule of Investments. Only current day’s variation margin is reported within the Consolidated Statement of Assets and Liabilities. |
| (b) | Aggregate of amounts include $95,066 for Tactical Tilt Overlay Fund which represents the payments to be made pursuant to bilateral agreements should counterparties exercise their “right to terminate” provisions based on, among others, the Fund’s performance, their failure to pay on their obligations or failure to pledge collateral. Such amount does not include incremental charges directly associated with the close-out of the agreements. It also does not reflect the fair value of any assets pledged as collateral which, through the daily margining process, substantially offsets the aforementioned amounts and for which the Fund is entitled to a full return. |
The following tables set forth, by certain risk types, each Fund’s gains (losses) related to these derivatives and their indicative volumes for the fiscal year ended August 31, 2022. These gains (losses) should be considered in the context that these derivative contracts may have been executed to create investment opportunities and/or economically hedge certain investments, and accordingly, certain gains (losses) on such derivative contracts may offset certain (losses) gains attributable to investments. These gains (losses) are included in “Net realized gain (loss)” or “Net change in unrealized gain (loss)” on the Statements and Consolidated Statement of Operations:
| Global Managed Beta | ||||||||||
| Risk | Statements of Operations | Net Realized Gain (Loss) |
Net Change in Unrealized Gain (Loss) |
|||||||
| Equity | Net realized gain (loss) from futures contracts, swap contracts, purchased and written options/Net change in unrealized gain (loss) on futures contracts, swap contracts and written options | $ | (20,810,350 | ) | $ | (10,005,060 | ) | |||
| Interest Rate | Net realized gain (loss) from futures contracts/Net change in unrealized gain (loss) on purchased options | (5,763,955 | ) | (25,194,326 | ) | |||||
| Currency | Net realized gain (loss) from forward foreign currency exchange contracts and purchased options/Net change in unrealized gain (loss) on forward foreign currency exchange contracts, purchased and written options | 51,713,162 | 13,003,099 | |||||||
| Total | $ | 25,138,857 | $ | (22,196,287 | ) | |||||
81
GOLDMAN SACHS ALLOCATION FUNDS
Notes to Financial Statements (continued)
August 31, 2022
| 4. INVESTMENTS IN DERIVATIVES (continued) |
| Strategic Factor Allocation | ||||||||||
| Risk | Statements of Operations | Net Realized Gain (Loss) |
Net Change in Unrealized Gain (Loss) |
|||||||
| Equity | Net realized gain (loss) from futures contracts, purchased options and written options/Net change in unrealized gain (loss) on futures contracts, purchased options and written options | $ | (20,382,761 | ) | $ | (34,275,188 | ) | |||
| Interest Rate | Net realized gain (loss) from futures contracts and written options/Net change in unrealized gain (loss) on futures contracts and written options | (103,481,152 | ) | (9,635,247 | ) | |||||
| Currency | Net realized gain (loss) from forward foreign currency exchange contracts/Net change in unrealized gain (loss) on forward foreign currency exchange contracts | 29,561,996 | 2,821,697 | |||||||
| Total | $ | (94,301,917 | ) | $ | (41,088,738 | ) | ||||
| Strategic Volatility Premium | ||||||||||
| Risk | Statements of Operations | Net Realized Gain (Loss) |
Net Change in Unrealized Gain (Loss) |
|||||||
| Equity | Net realized gain (loss) from futures contracts, purchased options and written options/Net change in unrealized gain (loss) on futures contracts, purchased options and written options | $ | 10,936,830 | $ | (139,936 | ) | ||||
| Interest Rate | Net realized gain (loss) from futures contracts/Net change in unrealized gain (loss) on futures contracts | (29,691,052 | ) | (1,603,832 | ) | |||||
| Total | $ | (18,754,222 | ) | $ | (1,743,768 | ) | ||||
| Tactical Tilt Overlay | ||||||||||
| Risk | Consolidated Statement of Operations | Net Realized Gain (Loss) |
Net Change in Unrealized Gain (Loss) |
|||||||
| Equity | Net realized gain (loss) from futures contracts, swap contracts, purchased options and written options/Net change in unrealized gain (loss) on futures contracts, swap contracts, purchased options and written options | $ | 73,803,350 | $ | (41,474,382 | ) | ||||
| Interest Rate | Net realized gain (loss) from futures contracts, swap contracts, purchased options and written options /Net change in unrealized gain (loss) on futures contracts, purchased options and written options | (86,295,873 | ) | 1,328,272 | ||||||
| Commodity | Net realized gain (loss) from purchased options and written options/Net change in unrealized gain (loss) written options contracts | 10,607,203 | 6,847,660 | |||||||
| Currency | Net realized gain (loss) from purchased options and written options/Net change in unrealized gain (loss) on purchased options and written options | 6,312,614 | 2,882,447 | |||||||
| Total | $ | 4,427,294 | $ | (30,416,003 | ) | |||||
82
GOLDMAN SACHS ALLOCATION FUNDS
| 4. INVESTMENTS IN DERIVATIVES (continued) |
For the fiscal year ended August 31, 2022, the relevant values for each derivative type was as follows:
| Average Number of Contracts, Notional Amounts, or Shares/Units(a) | ||||||||||||||||||||||||||||
| Fund | Futures contracts |
Forward contracts |
Swap Agreements |
Purchased Options |
Purchased Swaptions |
Written Options |
Written Swaptions |
|||||||||||||||||||||
| Global Managed Beta |
2,232 | $ | 496,549,653 | $ | — | 6,446,339,219 | $ | — | 48,594,832 | $ | — | |||||||||||||||||
| Strategic Factor Allocation |
11,909 | 756,221,565 | — | 1,048,217 | — | 4,012,067 | — | |||||||||||||||||||||
| Strategic Volatility Premium |
2,925 | — | — | 234,767 | — | 218,858 | — | |||||||||||||||||||||
| Tactical Tilt Overlay |
9,477 | — | 593,882,409 | 150,457,650 | 161,847,500 | 40,222,216 | 293,216,250 | |||||||||||||||||||||
| (a) | Amounts disclosed represent average number of contracts for futures contracts, notional amounts for forward contracts, swap agreements, purchased and written swaptions, or shares/units outstanding for purchased options and written options, based on absolute values, which is indicative of volume for this derivative type, for the months that each Fund held such derivatives during the fiscal year ended August 31, 2022. |
In order to better define its contractual rights and to secure rights that will help a Fund mitigate its counterparty risk, a Fund may enter into an International Swaps and Derivatives Association, Inc. Master Agreement (“ISDA Master Agreement”) or similar agreement with its derivatives counterparties. An ISDA Master Agreement is a bilateral agreement between a Fund and a counterparty that governs OTC derivatives (including forward foreign currency exchange contracts, and certain options and swaps), and typically contains, among other things, collateral posting terms and netting provisions in the event of a default and/or termination event. The provisions of the ISDA Master Agreement typically permit a single net payment in the event of a default (close-out netting) or similar event, including the bankruptcy or insolvency of the counterparty.
Collateral and margin requirements differ between exchange traded derivatives and OTC derivatives. Margin requirements are established by the broker or clearing house for exchange-traded and centrally cleared derivatives (financial futures contracts, options and centrally cleared swaps) pursuant to governing agreements for those instrument types. Brokers can ask for margin in excess of the minimum in certain circumstances. Collateral terms are contract-specific for OTC derivatives. For derivatives traded under an ISDA Master Agreement, the collateral requirements are typically calculated by netting the marked to market amount for each transaction under such agreement and comparing that amount to the value of any collateral currently pledged by a Fund and the counterparty. Additionally, a Fund may be required to post initial margin to the counterparty, the terms of which would be outlined in the confirmation of the OTC transaction.
Generally, the amount of collateral due from or to a counterparty must exceed a minimum transfer amount threshold before a transfer is required to be made. To the extent amounts due to a Fund from its counterparties are not fully collateralized, contractually or otherwise, a Fund bears the risk of loss from counterparty nonperformance. A Fund attempts to mitigate counterparty risk by only entering into agreements with counterparties that the Investment Adviser believes to be of good standing and by monitoring the financial stability of those counterparties.
Additionally, the netting of assets and liabilities and the offsetting of collateral pledged or received are based on contractual netting/set-off provisions in the ISDA Master Agreement or similar agreements. However, in the event of a default or insolvency of a counterparty, a court could determine that such rights are not enforceable due to the restrictions or prohibitions against the right of setoff that may be imposed in accordance with a particular jurisdiction’s bankruptcy or insolvency laws.
83
GOLDMAN SACHS ALLOCATION FUNDS
Notes to Financial Statements (continued)
August 31, 2022
| 4. INVESTMENTS IN DERIVATIVES (continued) |
The following tables set forth the Funds’ net exposure for derivative instruments that are subject to enforceable master netting arrangements or similar agreements as of August 31, 2022:
| Global Managed Beta | ||||||||||||||||||||||||||||||||||||
| Derivative Assets(1) | Derivative Liabilities(1) | Net Derivative Asset (Liabilities) |
Collateral (Received) Pledged(1) |
Net Amount(2) |
||||||||||||||||||||||||||||||||
| Counterparty | Options Purchased |
Forward Currency Contracts |
Total | Forward Currency Contracts |
Options Written |
Total | ||||||||||||||||||||||||||||||
| MS & Co. Int. PLC. |
$ | 9,546,178 | $ | 22,240,770 | $ | 31,786,948 | $ | (1,266,476 | ) | $ | (5,980,005 | ) | $ | (7,246,481 | ) | $ | 24,540,467 | $ | (16,300,000 | ) | $ | 8,240,467 | ||||||||||||||
| Tactical Tilt Overlay | ||||||||||||||||||||||||||||||||||||
| Derivative Assets(1) | Derivative Liabilities(1) | Net Derivative Asset (Liabilities) |
Collateral |
Net Amount(2) | ||||||||||||||||||||||||||||||||
| Counterparty | Options Purchased |
Swaps | Total | Swaps | Options Written |
Total | ||||||||||||||||||||||||||||||
| BofA Securities LLC |
$ | 1,199,863 | $ | 2,566,243 | $ | 3,766,106 | $ | (95,066 | ) | $ | (395,630 | ) | $ | (490,696 | ) | $ | 3,275,410 | $ | (3,030,000 | ) | $ | 245,410 | ||||||||||||||
| Citibank NA |
— | — | — | — | (17,979,277 | ) | (17,979,277 | ) | (17,979,277 | ) | 17,130,000 | (849,277 | ) | |||||||||||||||||||||||
| JPMorgan Securities, Inc. |
1,481,699 | 6,443,326 | 7,925,025 | — | (754,410 | ) | (754,410 | ) | 7,170,615 | (5,720,000 | ) | 1,450,615 | ||||||||||||||||||||||||
| MS & Co. Int. PLC |
39,704,169 | — | 39,704,169 | — | (40,733,655 | ) | (40,733,655 | ) | (1,029,486 | ) | — | (1,029,486 | ) | |||||||||||||||||||||||
| Total |
$ | 42,385,731 | $ | 9,009,569 | $ | 51,395,300 | $ | (95,066 | ) | $ | (59,862,972 | ) | $ | (59,958,038 | ) | $ | (8,562,738 | ) | $ | 8,380,000 | $ | (182,738 | ) | |||||||||||||
| (1) | Gross amounts available for offset but not netted in the Statement and Consolidated Statement of Assets and Liabilities. |
| (2) | Net amount represents the net amount due (to) from counterparty in the event of a default based on the contractual set-off rights under the agreement. Net amount excludes any over-collateralized amounts. |
| 5. AGREEMENTS AND AFFILIATED TRANSACTIONS |
A. Management Agreement — Under the Agreement, GSAM manages each Fund subject to the general supervision of the Trustees.
As compensation for the services rendered pursuant to the Agreement, the assumption of the expenses related thereto and administration of the Funds’ business affairs, including providing facilities, GSAM is entitled to a management fee, accrued daily and paid monthly, equal to an annual percentage rate of the Funds’ average daily net assets.
For the fiscal year ended August 31, 2022, contractual and effective net management fees with GSAM were at the following rates:
| Contractual Management Rate | Effective Net Management Fee Rate*^ |
|||||||||||||||||||||||||
| Fund | First $2 billion |
Next $3 billion |
Next $3 billion |
Over $8 billion |
Effective Rate |
|||||||||||||||||||||
| Global Managed Beta |
0.30 | % | 0.30 | % | 0.30 | % | 0.30 | % | 0.30 | % | 0.24 | % | ||||||||||||||
| Strategic Factor Allocation |
0.75 | % | 0.68 | % | 0.64 | % | 0.62 | % | 0.74 | % | 0.62 | % | ||||||||||||||
| Strategic Volatility Premium |
0.50 | % | 0.45 | % | 0.43 | % | 0.42 | % | 0.50 | % | 0.27 | % | ||||||||||||||
| Tactical Tilt Overlay |
0.75 | % | 0.68 | % | 0.64 | % | 0.62 | % | 0.71 | % | 0.62 | %(a) | ||||||||||||||
| * | GSAM has agreed to waive a portion of its management fee payable by the Fund in an amount equal to any management fee it earns as an investment adviser to any of the affiliated funds in which the Fund invests through at least December 29, 2022. Prior to such date GSAM may not terminate the arrangement without the approval of the Trustees. |
| ^ | Effective Net Management Rate includes the impact of management fee waivers of affiliated underlying funds, if any. |
| (a) | Reflects combined management fees paid to GSAM under the Agreement and the Subsidiary Agreement (as defined below) after waivers. |
84
GOLDMAN SACHS ALLOCATION FUNDS
| 5. AGREEMENTS AND AFFILIATED TRANSACTIONS (continued) |
GSAM has agreed to waive a portion of its management fee in order to achieve an effective net management fee rate of 0.40%
as an annual percentage rate of the Strategic Volatility Premium Fund’s average daily net assets. This arrangement will remain in effect at least through December 29, 2022.
The Funds invest in Institutional Shares of the Goldman Sachs Financial Square Government Fund (“Government Money Market Fund”). The Global Managed Beta Fund invests in each of the Goldman Sachs ActiveBeta Emerging Markets Equity ETF, Goldman Sachs MarketBeta International Equity ETF and the Goldman Sachs MarketBeta US Equity ETF, and the Tactical Tilt Overlay Fund invests in each of the Goldman Sachs Energy Infrastructure Fund, Goldman Sachs High Yield Floating Rate Fund and the Goldman Sachs MLP Energy Infrastructure Fund, which are affiliated Underlying Funds. GSAM has agreed to waive a portion of its management fee payable by the Funds in an amount equal to the management fee it earns as an investment adviser to the affiliated Underlying Funds in which the Funds invest, except those management fees it earns from the Funds’ investment of cash collateral received in connection with securities lending transactions in the Government Money Market Fund. For the fiscal year ended August 31, 2022, GSAM waived $1,141,474, $2,798,642, $627,681 and $2,798,790 of the Global Managed Beta, Strategic Factor Allocation, Strategic Volatility Premium and Tactical Tilt Overlay Funds’ management fees, respectively.
GSAM also provides management services to the Tactical Tilt Overlay Fund’s Subsidiary pursuant to a Subsidiary Management Agreement (the “Subsidiary Agreement”) and is entitled to a management fee accrued daily and paid monthly, equal to an annual percentage rate of 0.42% of the Subsidiary’s average daily net assets. In consideration of the Subsidiary’s management fee, and for as long as the Subsidiary Agreement remains in effect, GSAM has contractually agreed to waive irrevocably a portion of the Tactical Tilt Overlay Fund’s management fee in an amount equal to the management fee accrued and paid to GSAM by the Subsidiary under the Subsidiary Agreement. For the fiscal year ended August 31, 2022, GSAM waived $3,358,004 of the Tactical Tilt Overlay Fund’s management fee.
B. Transfer Agency Agreement — Goldman Sachs also serves as the transfer agent of the Funds for a fee pursuant to the Transfer Agency Agreement. The fees charged for such transfer agency services are accrued daily and paid monthly at annual rates of 0.04% of the average daily net assets of Institutional Shares for the Tactical Tilt Overlay Fund, Strategic Factor Allocation Fund and Strategic Volatility Premium Fund, 0.02% of the average daily net assets of Institutional Shares for the Global Managed Beta Fund and 0.03% of the average daily net assets of Class R6 Shares and Class P Shares for the Tactical Tilt Overlay Fund and Strategic Factor Allocation Fund and 0.03% of the average daily net assets of Class P Shares for the Strategic Volatility Premium Fund.
C. Other Expense Agreements and Affiliated Transactions — GSAM has agreed to reduce or limit certain “Other Expenses” of the Funds (excluding acquired fund fees and expenses, transfer agency fees and expenses, service fees and shareholder administration fees (as applicable), taxes, interest, brokerage fees, expenses of shareholder meetings, litigation and indemnification, and extraordinary expenses) to the extent such expenses exceed, on an annual basis, a percentage rate of the average daily net assets of the Funds. Such Other Expense reimbursements, if any, are accrued daily and paid monthly. In addition, the Funds are not obligated to reimburse GSAM for prior fiscal year expense reimbursements, if any. The Other Expense limitations as an annual percentage rate of average daily net assets for the Global Managed Beta, Strategic Factor Allocation, Strategic Volatility Premium and Tactical Tilt Overlay Funds are 0.204%, 0.164%, 0.064% and 0.164%, respectively. These Other Expense limitations will remain in place through at least December 29, 2022 and prior to such date GSAM may not terminate the arrangement without the approval of the Trustees. In addition, the Funds have entered into certain offset arrangements with the transfer agent, which may result in a reduction of the Funds expenses and are received irrespective of the application of the “Other
Expense” limitations described above.
85
GOLDMAN SACHS ALLOCATION FUNDS
Notes to Financial Statements (continued)
August 31, 2022
| 5. AGREEMENTS AND AFFILIATED TRANSACTIONS (continued) |
For the fiscal year ended August 31, 2022, these expense reductions, including any fee waivers and Other Expense reimbursements, were as follows:
| Fund | Management Fee Waiver |
Other Expense Reimbursements |
Total Expense Reductions |
|||||||||||
| Global Managed Beta |
$ | 1,141,474 | $ | — | $ | 1,141,474 | ||||||||
| Strategic Factor Allocation |
2,798,642 | — | 2,798,642 | |||||||||||
| Strategic Volatility Premium |
1,118,615 | 48,687 | 1,167,302 | |||||||||||
| Tactical Tilt Overlay |
6,156,794 | 71,330 | 6,228,124 | |||||||||||
D. Line of Credit Facility — As of August 31, 2022, the Funds participated in a $1,250,000,000 committed, unsecured revolving line of credit facility (the “facility”) together with other funds of the Trust and certain registered investment companies having management agreements with GSAM or its affiliates. This facility is to be used for temporary emergency purposes, or to allow for an orderly liquidation of securities to meet redemption requests. The interest rate on borrowings is based on the federal funds rate. The facility also requires a fee to be paid by the Funds based on the amount of the commitment that has not been utilized. For the fiscal year ended August 31, 2022, the Funds did not have any borrowings under the facility. Prior to April 22, 2022, the facility was $1,000,000,000.
E. Other Transactions with Affiliates — For the fiscal year ended August 31, 2022, Goldman Sachs earned $110,561, in brokerage commissions from fund transactions, including futures transactions executed with Goldman Sachs as the Futures Commission Merchant, on behalf of the Tactical Tilt Overlay Fund.
As of August 31, 2022, The Goldman Sachs Group, Inc. was the beneficial owner of 5% or more of total outstanding shares of the following Funds:
| Fund | Institutional | Class R6 | ||||||||
| Strategic Factor Allocation |
— | % | 100 | % | ||||||
| Strategic Volatility Premium |
16 | — | ||||||||
86
GOLDMAN SACHS ALLOCATION FUNDS
| 5. AGREEMENTS AND AFFILIATED TRANSACTIONS (continued) |
The table below shows the transactions in and earnings from investments in the Underlying Funds for the fiscal year ended August 31, 2022:
| Global Managed Beta |
|
|||||||||||||||||||||||||||||||
| Underlying Funds | Beginning Value as of August 31, 2021 |
Purchases at Cost |
Proceeds from Sales |
Net Realized Gain/(Loss) |
Change in Unrealized Gain/(Loss) |
Ending Value as of August 31, 2022 |
Shares as of August 31, 2022 |
Dividend Income |
||||||||||||||||||||||||
| Goldman Sachs ActiveBeta Emerging Markets Equity ETF |
$ | 29,364,048 | $ | — | $ | — | $ | — | $ | (7,595,961 | ) | $ | 21,768,087 | 749,848 | $ | 1,116,659 | ||||||||||||||||
| Goldman Sachs Financial Square Government Fund — Institutional Shares |
191,755,643 | 1,440,211,481 | (1,456,033,068 | ) | — | — | 175,934,056 | 175,934,056 | 786,577 | |||||||||||||||||||||||
| Goldman Sachs MarketBeta International Equity ETF |
316,708,078 | 42,320,285 | (67,174,998 | ) | (9,942,078 | ) | (67,420,376 | ) | 214,490,911 | 4,838,079 | 10,236,132 | |||||||||||||||||||||
| Goldman Sachs MarketBeta US Equity ETF |
325,682,063 | 91,618,915 | (75,275,211 | ) | (2,151,360 | ) | (47,369,312 | ) | 292,505,095 | 5,419,772 | 3,975,823 | |||||||||||||||||||||
| Total |
$ | 863,509,832 | $ | 1,574,150,681 | $(1,598,483,277) | $ | (12,093,438 | ) | $ | (122,385,649 | ) | $ | 704,698,149 | $ | 16,115,191 | |||||||||||||||||
| Strategic Factor Allocation |
| |||||||||||||||||||||||
| Underlying Funds | Beginning Value as of August 31, 2021 |
Purchases at Cost |
Proceeds from Sales |
Ending Value as of August 31, 2022 |
Shares as of August 31, 2022 |
Dividend Income |
||||||||||||||||||
| Goldman Sachs Financial Square Government Fund — Institutional Shares |
$ | 1,729,160,031 | $ | 5,749,227,127 | $ | (5,913,754,544 | ) | $ | 1,564,632,614 | 1,564,632,614 | $ | 8,167,282 | ||||||||||||
| Strategic Volatility Premium |
| |||||||||||||||||||||||
| Underlying Funds | Beginning Value as of August 31, 2021 |
Purchases at Cost |
Proceeds from Sales |
Ending Value as of August 31, 2022 |
Shares as of August 31, 2022 |
Dividend Income |
||||||||||||||||||
| Goldman Sachs Financial Square Government Fund — Institutional Shares |
$ | 368,029,368 | $ | 1,230,828,291 | $ | (1,255,070,457 | ) | $ | 343,787,202 | 343,787,202 | $ | 2,016,756 | ||||||||||||
87
GOLDMAN SACHS ALLOCATION FUNDS
Notes to Financial Statements (continued)
August 31, 2022
| 5. AGREEMENTS AND AFFILIATED TRANSACTIONS (continued) |
| Tactical Tilt Overlay |
| |||||||||||||||||||||||||||||||||||
| Underlying Funds | Beginning Value as of August 31, 2021 |
Purchases at Cost |
Proceeds from Sales |
Net Realized Gain/(Loss) |
Change in Unrealized Gain/(Loss) |
Ending Value as of August 31, 2022 |
Shares as of August 31, 2022 |
Dividend Income |
Capital Gains Distribution |
|||||||||||||||||||||||||||
| Goldman Sachs Financial Square Government Fund — Institutional Shares |
$ | 1,850,734,808 | $ | 3,702,225,168 | $ | (3,634,379,049 | ) | $ | — | $ | — | $ | 1,918,580,927 | 1,918,580,927 | $ | 8,612,760 | $ | — | ||||||||||||||||||
| Goldman Sachs High Yield Floating Rate Fund — Class R6 |
104,904,518 | 149,657,934 | (132,520,195 | ) | (8,493,591 | ) | (3,910,454 | ) | 109,638,212 | 12,277,515 | 7,259,342 | — | ||||||||||||||||||||||||
| Goldman Sachs MLP Energy Infrastructure Fund — Class R6 Shares |
19,074,456 | 1,015,789 | (24,629,225 | ) | 13,215,345 | (8,676,365 | ) | — | — | 1,015,789 | — | |||||||||||||||||||||||||
| Goldman Sachs Energy Infrastructure Fund — Class R6 |
76,333,727 | 6,656,077 | (26,591,909 | ) | 10,823,340 | 5,222,687 | 72,443,922 | 6,514,741 | 3,289,925 | 3,366,151 | ||||||||||||||||||||||||||
| Total |
$ | 2,051,047,509 | $ | 3,859,554,968 | $ | (3,818,120,378 | ) | $ | 15,545,094 | $ | (7,364,132 | ) | $ | 2,100,663,061 | $ | 20,177,816 | $ | 3,366,151 | ||||||||||||||||||
| 6. PORTFOLIO SECURITIES TRANSACTIONS |
The cost of purchases and proceeds from sales and maturities of long-term securities for the fiscal year ended August 31, 2022, were as follows:
| Fund | Government Purchases |
Non-Government Purchases |
Sales and Maturities |
|||||||||||
| Global Managed Beta |
$ | — | $ | 448,090,937 | $ | 669,731,644 | ||||||||
| Tactical Tilt Overlay |
129,773,679 | 466,539,189 | 395,104,541 | |||||||||||
For the fiscal year ended August 31, 2022, there were no purchases and proceeds from sales and maturities of long-term securities for the Strategic Factor Allocation and Strategic Volatility Premium Funds.
| 7. SECURITIES LENDING |
The Global Managed Beta Fund and Tactical Tilt Overlay Fund may lend their securities through a securities lending agent, the
Bank of New York Mellon (“BNYM”), to certain qualified borrowers. In accordance with the Funds’ securities lending procedures, the Funds receive cash collateral at least equal to the market value of the securities on loan. The market value of the loaned securities is determined at the close of business of the Funds, at their last sale price or official closing price on the principal exchange or system on which they are traded, and any additional required collateral is delivered to the Funds on the next business day. As with other extensions of credit, the Funds may experience delay in the recovery of its securities or incur a loss should the borrower of the securities breach its agreement with the Funds or become insolvent at a time when the collateral is insufficient to cover the cost of repurchasing securities on loan. Dividend income received from securities on loan may not be subject to
88
GOLDMAN SACHS ALLOCATION FUNDS
| 7. SECURITIES LENDING (continued) |
withholding taxes and therefore withholding taxes paid may differ from the amounts listed in the Statement and/or Consolidated Statement of Operations. Loans of securities are terminable at any time and as such 1) the remaining contractual maturities of the outstanding securities lending transactions are considered to be overnight and continuous and 2) the borrower, after notice, is required to return borrowed securities within the standard time period for settlement of securities transactions.
The Funds invest the cash collateral received in connection with securities lending transactions in the Government Money Market Fund, an affiliated series of the Goldman Sachs Trust. The Government Money Market Fund is registered under the Act as an open end investment company, is subject to Rule 2a-7 under the Act, and is managed by GSAM, for which GSAM may receive a management fee of up to 0.16% on an annualized basis of the average daily net assets of the Government Money Market Fund.
In the event of a default by a borrower with respect to any loan, BNYM may exercise any and all remedies provided under the applicable borrower agreement to make the Funds whole. These remedies include purchasing replacement securities by applying the collateral held from the defaulting broker against the purchase cost of the replacement securities. If BNYM is unable to purchase replacement securities, BNYM will indemnify the Funds by paying the Funds an amount equal to the market value of the securities loaned minus the value of cash collateral received from the borrower for the loan, subject to an exclusion for any shortfalls resulting from a loss of value in such cash collateral due to reinvestment risk. The Funds’ master netting agreements with certain borrowers provide the right, in the event of a default (including bankruptcy or insolvency), for the non-defaulting party to liquidate the collateral and calculate net exposure to the defaulting party or request additional collateral. However, in the event of a default by a borrower, a resolution authority could determine that such rights are not enforceable due to the restrictions or prohibitions against the right of set-off that may be imposed in accordance with a particular jurisdiction’s bankruptcy or insolvency laws. The Funds’ loaned securities were all subject to enforceable Securities Lending Agreements and the value of the collateral was at least equal to the value of the cash received. The amounts of the Funds’ overnight and continuous agreements, which represent the gross amounts of recognized liabilities for securities lending transactions outstanding as of August 31, 2022, are disclosed as “Payable upon return of securities loaned” on the Statement and Consolidated Statement of Assets and Liabilities, where applicable.
Both the Funds and BNYM received compensation relating to the lending of the Funds’ securities. The amounts earned, if any, by the Fund’s for the fiscal year ended August 31, 2022, are reported under Investment Income on the Statement and Consolidated Statement of Operations.
The following table provides information about the Funds’ investment in the Government Money Market Fund for the fiscal year ended August 31, 2022.
| Fund | Beginning Value as of August 31, 2021 |
Purchases at Cost |
Proceeds from Sales |
Ending Value as of August 31, 2022 |
||||||||||||||
| Global Managed Beta |
$ | 961,050 | $ | 1,644,936,774 | $ | (1,575,151,148 | ) | $ | 70,746,676 | |||||||||
| Tactical Tilt Overlay |
5,522,825 | 968,410,175 | (924,307,303 | ) | 49,625,697 | |||||||||||||
| 8. TAX INFORMATION |
The tax character of distributions paid during the fiscal year ended August 31, 2022 was as follows:
| Global Managed Beta |
Strategic Factor Allocation |
Strategic Volatility Premium |
Tactical Tilt Overlay |
|||||||||||||||
| Distribution paid from: |
||||||||||||||||||
| Ordinary income |
$ | 120,695,128 | $ | 114,127,787 | $ | 563,374 | $ | 95,007,053 | ||||||||||
|
Net long-term capital gains |
63,497,092 | 189,324,416 | 1,212,154 | — | ||||||||||||||
| Total taxable distributions |
$ | 184,192,220 | $ | 303,452,203 | $ | 1,775,528 | $ | 95,007,053 | ||||||||||
89
GOLDMAN SACHS ALLOCATION FUNDS
Notes to Financial Statements (continued)
August 31, 2022
| 8. TAX INFORMATION (continued) |
The tax character of distributions paid during the fiscal year ended August 31, 2021 was as follows:
| Global Managed Beta |
Strategic Factor Allocation |
Strategic Volatility Premium |
Tactical Tilt Overlay |
|||||||||||||||
| Distribution paid from: |
||||||||||||||||||
| Ordinary income |
$ | 51,809,640 | $ | 39,852,191 | $ | — | $ | 155,010,834 | ||||||||||
|
Net long-term capital gains |
29,204,538 | 86,395,097 | — | — | ||||||||||||||
| Total taxable distributions |
$ | 81,014,178 | $ | 126,247,288 | $ | — | $ | 155,010,834 | ||||||||||
As of August 31, 2022, the components of accumulated earnings (losses) on a tax basis were as follows:
| Global Managed Beta |
Strategic Factor Allocation |
Strategic Volatility Premium |
Tactical Tilt Overlay |
|||||||||||||
| Undistributed ordinary income — net | $ | 76,374,772 | $ | 29,322,457 | $ | 279,747 | $ | 27,773,121 | ||||||||
| Undistributed long-term capital gains |
— | — | — | — | ||||||||||||
| Total undistributed earnings |
$ | 76,374,772 | $ | 29,322,457 | $ | 279,747 | $ | 27,773,121 | ||||||||
| Capital loss carryforwards(1): |
||||||||||||||||
| Perpetual Long-Term |
— | — | $ | (1,086,895 | ) | (37,626,675 | ) | |||||||||
| Perpetual Short-Term |
— | — | ( 724,596 | ) | (142,071,293 | ) | ||||||||||
| Total capital loss carryforwards |
$ | — | $ | — | $ | (1,811,491 | ) | $ | (179,697,968 | ) | ||||||
| Timing differences (Post October Capital Loss Deferral/Late Year Ordinary Loss Deferral and Straddle Loss Deferral) |
$ | (77,001,603 | ) | $ | (197,885,271 | ) | $ | (18,686,499 | ) | $ | (52,562,395 | ) | ||||
| Unrealized gains (losses) — net |
214,457,142 | 17 | — | 113,630,418 | ||||||||||||
| Total accumulated earnings (losses) net |
$ | 213,830,311 | $ | (168,562,797 | ) | $ | (20,218,243 | ) | $ | (90,856,824 | ) | |||||
| (1) | The Tactical Tilt Overlay Fund utilized $46,906,450 of capital losses in the current fiscal year. |
As of August 31, 2022, the Funds aggregate security unrealized gains and losses based on cost for U.S. federal income tax purposes were as follows:
| Global Managed Beta |
Strategic Factor Allocation |
Strategic Volatility Premium |
Tactical Tilt Overlay |
|||||||||||||
| Tax Cost |
$ | 1,462,029,479 | $ | 1,562,122,084 | $ | 342,929,005 | $ | 4,495,505,745 | ||||||||
| Gross unrealized gain |
255,237,108 | 17 | — | 231,805,447 | ||||||||||||
| Gross unrealized loss |
(40,779,966 | ) | — | — | (118,175,029 | ) | ||||||||||
| Net unrealized gains (losses) |
$ | 214,457,142 | $ | 17 | $ | — | $ | 113,630,418 | ||||||||
The difference between GAAP-basis and tax basis unrealized gains (losses) is attributable primarily to wash sales, net mark to market gains/(losses) on regulated futures contracts, net mark to market gains/(losses) on regulated options contracts, net mark to market gains/(losses) on foreign currency contracts, and differences in the tax treatment of swap transactions, partnership investments, and passive foreign investment company investments.
The Strategic Volatility Premium Fund reclassed $59,271 from paid in capital to distributable earnings for the year ending August 31, 2022. In order to present certain components of the Fund’s capital accounts on a tax-basis, certain reclassifications have been recorded to the Fund’s accounts. These reclassifications have no impact on the net asset value of the Fund and result primarily from certain non-deductible expenses.
The Tactical Tilt Overlay Fund reclassed $6,761,266 from paid in capital to distributable earnings for the year ending August 31, 2022. In order to present certain components of the Fund’s capital accounts on a tax-basis, certain reclassifications have been recorded to the Fund’s accounts. These reclassifications have no impact on the net asset value of the Tactical Tilt Overlay Fund and result primarily from eliminating entries related to the Subsidiary.
90
GOLDMAN SACHS ALLOCATION FUNDS
| 8. TAX INFORMATION (continued) |
GSAM has reviewed each Fund’s tax positions for all open tax years (the current and prior three years, as applicable) and has concluded that no provision for income tax is required in each Fund’s financial statements. Such open tax years remain subject to examination and adjustment by tax authorities.
| 9. OTHER RISKS |
The Funds’ risks include, but are not limited to, the following:
Credit/Default Risk — An issuer or guarantor of a security held by a Fund or a bank or other financial institution that has entered into a repurchase agreement with a Fund may default on its obligation to pay interest and repay principal or default on any other obligation. Additionally, the credit quality of securities may deteriorate rapidly, which may impair a Fund’s liquidity and cause significant deterioration in NAV.
Derivatives Risk — A Fund’s use of derivatives may result in loss. Derivative instruments, which may pose risks in addition to and greater than those associated with investing directly in securities, currencies or other instruments, may be illiquid or less liquid, volatile, difficult to price and leveraged so that small changes in the value of the underlying instruments may produce disproportionate losses to a Fund. Derivatives are also subject to counterparty risk, which is the risk that the other party in the transaction will not fulfill its contractual obligation. The use of derivatives is a highly specialized activity that involves investment techniques and risks different from those associated with investments in more traditional securities and instruments. Losses from derivatives can also result from a lack of correlation between changes in the value of derivative instruments and the portfolio assets (if any) being hedged.
Dividend-Paying Investments Risk — Each Fund’s investments in dividend-paying securities could cause the Fund to underperform other funds. Securities that pay dividends, as a group, can fall out of favor with the market, causing such securities to underperform securities that do not pay dividends. Depending upon market conditions and political and legislative responses to such conditions, dividend-paying securities that meet a Fund’s investment criteria may not be widely available and/or may be highly concentrated in only a few market sectors. In addition, issuers that have paid regular dividends or distributions to shareholders may not continue to do so at the same level or at all in the future. This may limit the ability of a Fund to produce current income.
Floating and Variable Rate Obligations Risk — Floating rate and variable rate obligations are debt instruments issued by companies or other entities with interest rates that reset periodically (typically, daily, monthly, quarterly, or semiannually) in response to changes in the market rate of interest on which the interest rate is based. Such market rates are generally the Secured Overnight Financing Rate, London Interbank Offered Rate (“LIBOR”), the Prime Rate of a designated U.S. bank, the Federal Funds Rate, or another base lending rate used by commercial lenders. For floating and variable rate obligations, there may be a lag between an actual change in the underlying interest rate benchmark and the reset time for an interest payment of such an obligation, which could harm or benefit a Fund, depending on the interest rate environment or other circumstances. In a rising interest rate environment, for example, a floating or variable rate obligation that does not reset immediately would prevent a Fund from taking full advantage of rising interest rates in a timely manner. However, in a declining interest rate environment, a Fund may benefit from a lag due to an obligation’s interest rate payment not being immediately impacted by a decline in interest rates.
At the end of 2021, certain LIBORs were discontinued, but the most widely used LIBORs may continue to be provided on a representative basis until June 2023. The unavailability or replacement of LIBOR may affect the value, liquidity or return on certain Fund investments and may result in costs incurred in connection with closing out positions and entering into new trades. Any pricing adjustments to a Fund’s investments resulting from a substitute reference rate may also adversely affect a Fund’s performance and/or NAV.
Foreign and Emerging Countries Risk — Investing in foreign markets may involve special risks and considerations not typically associated with investing in the U.S. Foreign securities may be subject to risk of loss because of more or less foreign government regulation; less public information; less stringent investor protections; less stringent accounting, corporate governance, financial reporting and disclosure standards; and less economic, political and social stability in the countries in which a Fund invests. The imposition of sanctions, exchange controls (including repatriation restrictions), confiscation of assets and property,
91
GOLDMAN SACHS ALLOCATION FUNDS
Notes to Financial Statements (continued)
August 31, 2022
| 9. OTHER RISKS (continued) |
trade restrictions (including tariffs) and other government restrictions by the U.S. or other governments, or from problems in registration, settlement or custody, may also result in losses. The type and severity of sanctions and other similar measures, including counter sanctions and other retaliatory actions, that may be imposed could vary broadly in scope, and their impact is impossible to predict. For example, the imposition of sanctions and other similar measures could, among other things, cause a decline in the value and/or liquidity of securities issued by the sanctioned country or companies located in or economically tied to the sanctioned country and increase market volatility and disruption in the sanctioned country and throughout the world. Sanctions and other similar measures could limit or prevent a Fund from buying and selling securities (in the sanctioned country and other markets), significantly delay or prevent the settlement of securities transactions, and significantly impact a Fund’s liquidity and performance. Foreign risk also involves the risk of negative foreign currency exchange rate fluctuations, which may cause the value of securities denominated in such foreign currency (or other instruments through which a Fund has exposure to foreign currencies) to decline in value. Currency exchange rates may fluctuate significantly over short periods of time. To the extent that a Fund also invests in securities of issuers located in, or economically tied to, emerging markets, these risks may be more pronounced.
Foreign Custody Risk — Each Fund invests in foreign securities, and as such the Fund may hold such securities and cash with foreign banks, agents, and securities depositories appointed by a Fund’s custodian (each a “Foreign Custodian”). Some foreign custodians may be recently organized or new to the foreign custody business. In some countries, Foreign Custodians may be subject to little or no regulatory oversight over, or independent evaluation of, their operations. Further, the laws of certain countries may place limitations on a Fund’s ability to recover its assets if a Foreign Custodian enters bankruptcy. Investments in emerging markets may be subject to even greater custody risks than investments in more developed markets. Custody services in emerging market countries are very often undeveloped and may be considerably less well regulated than in more developed countries, and thus may not afford the same level of investor protection as would apply in developed countries.
Geographic Risk — If a Fund focuses its investments in securities of issuers located in a particular country or geographic region, a Fund may be subjected, to a greater extent than if its investments were less focused, to the risks of volatile economic cycles and/ or conditions and developments that may be particular to that country or region, such as: adverse securities markets; adverse exchange rates; adverse social, political, regulatory, economic, business, environmental or other developments; or natural disasters.
Interest Rate Risk — When interest rates increase, fixed income securities or instruments held by a Fund will generally decline in value. The Fund may face a heightened level of interest rate risk in connection with the type and extent of certain monetary policy changes made by the Federal Reserve, such as target interest rate changes. Long-term fixed income securities or instruments will normally have more price volatility because of this risk than short-term fixed income securities or instruments. A wide variety of market factors can cause interest rates to rise, including central bank monetary policy, rising inflation and changes in general economic conditions. The risks associated with changing interest rates may have unpredictable effects on the markets and a Fund’s investments. Fluctuations in interest rates may also affect the liquidity of fixed income securities and instruments held by a Fund. A sudden or unpredictable increase in interest rates may cause volatility in the market and may decrease the liquidity of the Fund’s investments, which would make it harder for the Fund to sell its investments at an advantageous time.
Investments in Other Investment Companies Risk — As a shareholder of another investment company, including an ETF, each Fund will indirectly bear its proportionate share of any net management fees and other expenses paid by such other investment companies, in addition to the fees and expenses regularly borne by a Fund. ETFs are subject to risks that do not apply to conventional mutual funds, including, but not limited to, the following: (i) the market price of the ETF’s shares may trade at a premium or a discount to their NAV; and (ii) an active trading market for an ETF’s shares may not develop or be maintained.
Investments in the Underlying Funds Risk — The investments of a Fund may be concentrated in one or more Underlying Funds (including ETFs and other registered investment companies) subject to statutory limitations prescribed by the Act or exemptive relief or regulations thereunder. A Fund’s investment performance is directly related to the investment performance of the Underlying Funds it holds. A Fund is subject to the risk factors associated with the investments of the Underlying Funds and will be affected by the investment policies and practices of the Underlying Funds in direct proportion to the amount of assets
92
GOLDMAN SACHS ALLOCATION FUNDS
| 9. OTHER RISKS (continued) |
allocated to each. If a Fund has a relative concentration of its portfolio in a single Underlying Fund, it may be more susceptible to adverse developments affecting that Underlying Fund, and may be more susceptible to losses because of these developments. A strategy used by the Underlying Funds may fail to produce the intended results.
Large Shareholder Transactions Risk — A Fund may experience adverse effects when certain large shareholders, such as other funds, institutional investors (including those trading by use of non-discretionary mathematical formulas), financial intermediaries (who may make investment decisions on behalf of underlying clients and/or include a Fund in their investment model), individuals, accounts and Goldman Sachs affiliates, purchase or redeem large amounts of shares of a Fund. Such large shareholder redemptions, which may occur rapidly or unexpectedly, may cause a Fund to sell portfolio securities at times when it would not otherwise do so, which may negatively impact a Fund’s NAV and liquidity. These transactions may also accelerate the realization of taxable income to shareholders if such sales of investments resulted in gains, and may also increase transaction costs. In addition, a large redemption could result in a Fund’s current expenses being allocated over a smaller asset base, leading to an increase in a Fund’s expense ratio. Similarly, large Fund share purchases may adversely affect a Fund’s performance to the extent that a Fund is delayed in investing new cash or otherwise maintains a larger cash position than it ordinarily would.
Liquidity Risk — A Fund or an Underlying Fund may make investments that are illiquid or that may become less liquid in response to market developments or adverse investor perceptions. Illiquid investments may be more difficult to value. To the extent a Fund engages in cash redemptions, then liquidity risk may also refer to the risk that a Fund or an Underlying Fund will not be able to pay redemption proceeds within the allowable time period or without significant dilution to remaining investors’ interests because of unusual market conditions, an unusually high volume of redemption requests, or other reasons. To meet redemption requests, a Fund or an Underlying Fund may be forced to sell investments at an unfavorable time and/or under unfavorable conditions. If a Fund or an Underlying Fund are forced to sell securities at an unfavorable time and/or under unfavorable conditions, such sales may adversely affect a Fund’s or an Underlying Fund’s NAV and dilute remaining investors’ interests. Liquidity risk may be the result of, among other things, the reduced number and capacity of traditional market participants to make a market in fixed income securities or the lack of an active market. The potential for liquidity risk may be magnified by a rising interest rate environment or other circumstances where investor redemptions from fixed income mutual funds may be higher than normal, potentially causing increased supply in the market due to selling activity. These risks may be more pronounced in connection with a Fund’s or an Underlying Fund’s investments in securities of issuers located in emerging market countries. Redemptions by large shareholders may have a negative impact on a Fund’s or an Underlying Fund’s liquidity.
Market and Credit Risks — In the normal course of business, a Fund trades financial instruments and enters into financial transactions where risk of potential loss exists due to changes in the market (market risk). The value of the securities in which a Fund invests may go up or down in response to the prospects of individual companies, particular sectors or governments and/or general economic conditions throughout the world due to increasingly interconnected global economies and financial markets. Events such as war, acts of terrorism, social unrest, natural disasters, the spread of infectious illness or other public health threats could also significantly impact a Fund and its investments. Additionally, a Fund may also be exposed to credit risk in the event that an issuer or guarantor fails to perform or that an institution or entity with which a Fund has unsettled or open transactions defaults.
Sector Risk — To the extent a Fund focuses its investments in securities of issuers in one or more sectors (such as the financial services or telecommunications sectors), a Fund may be subjected, to a greater extent than if its investments were diversified across different sectors, to the risks of volatile economic cycles and/or conditions and developments that may be particular to that sector, such as: adverse economic, business, political, environmental or other developments.
Short Position Risk — A Fund may enter into a short position through a futures contract, an option or swap agreement or through short sales of any instrument that a Fund may purchase for investment. Taking short positions involves leverage of a Fund’s assets and presents various risks, including counterparty risk. If the value of the underlying instrument or market in which a Fund has taken a short position increases, then a Fund will incur a loss equal to the increase in value from the time that the short position was entered into plus any related interest payments or other fees. Taking short positions involves the risk that losses may be disproportionate, may exceed the amount invested, and may be unlimited. To the extent that a Fund uses the proceeds it receives
93
GOLDMAN SACHS ALLOCATION FUNDS
Notes to Financial Statements (continued)
August 31, 2022
| 9. OTHER RISKS (continued) |
from a short position to take additional long positions, the risks associated with the short position, including leverage risks, may be heightened, because doing so increases the exposure of a Fund to the markets and therefore could magnify changes to a Fund’s NAV.
Tax Risk — The Tactical Tilt Overlay Fund will seek to gain exposure to the commodity markets primarily through investments in the Subsidiary and/or commodity index-linked structured notes, as applicable. Historically, the Internal Revenue Service (“IRS”) issued private letter rulings (“PLRs”) in which the IRS specifically concluded that income and gains from investments in commodity index linked structured notes (the “Notes Rulings”) or a wholly-owned foreign subsidiary that invests in commodity linked instruments are “qualifying income” for purposes of compliance with Subchapter M of the Code. However, the Tactical Tilt Overlay Fund has not received a PLR, and is not able to rely on PLRs issued to other taxpayers. The IRS recently issued final regulations that, would generally treat the Tactical Tilt Overlay Fund’s income inclusion with respect to a subsidiary as qualifying income either if (A) there is a distribution out of the earnings and profits of a subsidiary that are attributable to such income inclusion or (B) such inclusion is derived with respect to the Tactical Tilt Overlay Fund’s business of investing in stock, securities, or currencies.
The IRS also issued a revenue procedure, which states that the IRS will not in the future issue PLRs that would require a determination of whether an asset (such as a commodity index-linked note) is a “security” under the Investment Company Act of 1940. In connection with issuing such revenue procedure, the IRS has revoked the Notes Ruling on a prospective basis. In light of the revocation of the Notes Rulings, the Tactical Tilt Overlay Fund has limited its investments in commodity index-linked structured notes. The Tactical Tilt Overlay Fund has obtained an opinion of counsel that the Fund’s income from investments in the Subsidiary should constitute “qualifying income.” However, no assurances can be provided that the IRS would not be able to successfully assert that the Tactical Tilt Overlay Fund’s income from such investments was not “qualifying income,” in which case the Tactical Tilt Overlay Fund would fail to qualify as a regulated investment company (“RIC”) under Subchapter M of the Code if over 10% of its gross income were derived from these investments. If the Tactical Tilt Overlay Fund failed to qualify as a RIC, it would be subject to federal and state income tax on all of its taxable income at regular corporate tax rates with no deduction for any distributions paid to shareholders, which would significantly adversely affect the returns to, and could cause substantial losses for, Tactical Tilt Overlay Fund shareholders.
| 10. INDEMNIFICATIONS |
Under the Trust’s organizational documents, its Trustees, officers, employees and agents are indemnified, to the extent permitted by the Act and state law, against certain liabilities that may arise out of performance of their duties to the Funds. Additionally, in the course of business, the Funds enter into contracts that contain a variety of indemnification clauses. The Funds’ maximum exposure under these arrangements is unknown, as this would involve future claims that may be made against the Funds that have not yet occurred. However, GSAM believes the risk of loss under these arrangements to be remote.
| 11. SUBSEQUENT EVENTS |
Subsequent events after the Statements and Consolidated Statement of Assets and Liabilities date have been evaluated, and GSAM has concluded that there is no impact requiring adjustment or disclosure in the financial statements.
94
GOLDMAN SACHS ALLOCATION FUNDS
| 12. SUMMARY OF SHARE TRANSACTIONS |
Share activity is as follows:
| Global Managed Beta Fund | ||||||||||||||||
|
|
|
|||||||||||||||
| For the Fiscal Year Ended August 31, 2022 |
For the Fiscal Year Ended August 31, 2021 |
|||||||||||||||
|
|
|
|||||||||||||||
| Shares | Dollars | Shares | Dollars | |||||||||||||
|
|
|
|||||||||||||||
| Institutional Shares | ||||||||||||||||
| Shares sold |
38,515,995 | $ | 538,309,195 | 54,237,188 | $ | 821,037,700 | ||||||||||
| Reinvestment of distributions |
11,856,265 | 184,192,220 | 5,764,208 | 81,014,178 | ||||||||||||
| Shares redeemed |
(56,511,209 | ) | (827,610,016 | ) | (44,743,393 | ) | (666,596,798 | ) | ||||||||
| NET INCREASE (DECREASE) |
(6,138,949 | ) | $ | (105,108,601 | ) | 15,258,003 | $ | 235,455,080 | ||||||||
| Strategic Factor Allocation Fund | ||||||||||||||||
|
|
|
|||||||||||||||
| For the Fiscal Year Ended August 31, 2022 |
For the Fiscal Year Ended August 31, 2021 |
|||||||||||||||
|
|
|
|||||||||||||||
| Shares | Dollars | Shares | Dollars | |||||||||||||
|
|
|
|||||||||||||||
| Institutional Shares | ||||||||||||||||
| Shares sold |
1,000,972 | $ | 11,079,050 | 187,646 | $ | 2,253,911 | ||||||||||
| Reinvestment of distributions |
42,401 | 485,488 | 31,128 | 353,924 | ||||||||||||
| Shares redeemed |
(168,005 | ) | (1,840,322 | ) | (159,843 | ) | (1,888,077 | ) | ||||||||
| 875,368 | 9,724,216 | 58,931 | 719,758 | |||||||||||||
| Class R6 Shares | ||||||||||||||||
| Reinvestment of distributions |
149 | 1,686 | 80 | 899 | ||||||||||||
| 149 | 1,686 | 80 | 899 | |||||||||||||
| Class P Shares | ||||||||||||||||
| Shares sold |
45,788,073 | 516,512,005 | 64,661,223 | 760,927,034 | ||||||||||||
| Reinvestment of distributions |
26,787,359 | 302,965,029 | 11,190,441 | 125,892,465 | ||||||||||||
| Shares redeemed |
(56,643,865 | ) | (625,312,339 | ) | (26,073,017 | ) | (307,325,222 | ) | ||||||||
| 15,931,567 | 194,164,695 | 49,778,647 | 579,494,277 | |||||||||||||
| NET INCREASE |
16,807,084 | $ | 203,890,597 | 49,837,658 | $ | 580,214,934 | ||||||||||
95
GOLDMAN SACHS ALLOCATION FUNDS
Notes to Financial Statements (continued)
August 31, 2022
| 12. SUMMARY OF SHARE TRANSACTIONS (continued) |
| GS Strategic Volatility Premium Fund | ||||||||||||||||
|
|
|
|||||||||||||||
| For the Fiscal Year Ended August 31, 2022 |
For the Period Ended August 31, 2021(a) |
|||||||||||||||
|
|
|
|||||||||||||||
| Shares | Dollars | Shares | Dollars | |||||||||||||
|
|
|
|||||||||||||||
| Institutional Shares | ||||||||||||||||
| Shares sold |
18,657 | $ | 186,077 | 34,622 | $ | 347,110 | ||||||||||
| Reinvestment of distributions |
136 | 1,365 | — | — | ||||||||||||
| Shares redeemed |
(21,718 | ) | (217,081 | ) | (1 | ) | (10 | ) | ||||||||
| (2,925 | ) | (29,639 | ) | 34,621 | 347,100 | |||||||||||
| Class P Shares | ||||||||||||||||
| Shares sold |
41,107,256 | 405,145,397 | 42,669,960 | 429,000,416 | ||||||||||||
| Reinvestment of distributions |
176,886 | 1,774,163 | — | — | ||||||||||||
| Shares redeemed |
(30,146,098 | ) | (295,691,396 | ) | (814,504 | ) | (8,183,244 | ) | ||||||||
| 11,138,044 | 111,228,164 | 41,855,456 | 420,817,172 | |||||||||||||
| NET INCREASE |
11,135,119 | $ | 111,198,525 | 41,890,077 | $ | 421,164,272 | ||||||||||
| (a) | Commenced operations on March 29, 2021. |
| Tactical Tilt Overlay Fund | ||||||||||||||||
|
|
|
|||||||||||||||
| For the Fiscal Year Ended August 31, 2022 |
For the Fiscal Year Ended August 31, 2021 |
|||||||||||||||
|
|
|
|||||||||||||||
| Shares | Dollars | Shares | Dollars | |||||||||||||
|
|
|
|||||||||||||||
| Institutional Shares | ||||||||||||||||
| Shares sold |
1,782,056 | $ | 18,966,440 | 550,145 | $ | 5,746,917 | ||||||||||
| Reinvestment of distributions |
21,277 | 225,531 | 8,823 | 88,055 | ||||||||||||
| Shares redeemed |
(320,989 | ) | (3,385,774 | ) | (151,058 | ) | (1,550,598 | ) | ||||||||
| 1,482,344 | 15,806,197 | 407,910 | 4,284,374 | |||||||||||||
| Class R6 Shares | ||||||||||||||||
| Shares sold |
20,556,236 | 212,873,814 | 28,297,761 | 284,154,037 | ||||||||||||
| Reinvestment of distributions |
2,340,151 | 24,009,953 | 4,276,594 | 41,354,663 | ||||||||||||
| Shares redeemed |
(68,573,658 | ) | (707,568,184 | ) | (4,820,051 | ) | (48,576,023 | ) | ||||||||
| (45,677,271 | ) | (470,684,417 | ) | 27,754,304 | 276,932,677 | |||||||||||
| Class P Shares | ||||||||||||||||
| Shares sold |
128,768,013 | 1,327,422,264 | 89,171,451 | 903,881,851 | ||||||||||||
| Reinvestment of distributions |
6,897,814 | 70,771,569 | 11,744,376 | 113,568,116 | ||||||||||||
| Shares redeemed |
(41,268,081 | ) | (421,973,975 | ) | (37,989,658 | ) | (381,821,832 | ) | ||||||||
| 94,397,746 | 976,219,858 | 62,926,169 | 635,628,135 | |||||||||||||
| NET INCREASE |
50,202,819 | $ | 521,341,638 | 91,088,383 | $ | 916,845,186 | ||||||||||
96
Report of Independent Registered Public
Accounting Firm
To the Board of Trustees of Goldman Sachs Trust and Shareholders of Goldman Sachs Global Managed Beta Fund, Goldman Sachs Strategic Factor Allocation Fund, Goldman Sachs Strategic Volatility Premium Fund, and Goldman Sachs Tactical Tilt Overlay Fund
Opinions on the Financial Statements
We have audited the accompanying statements of assets and liabilities, including the schedules of investments, of each of the funds indicated in the table below (four of the funds constituting Goldman Sachs Trust, hereafter collectively referred to as the “Funds”) as of August 31, 2022, the related statements of operations and of changes in net assets for each of the periods indicated in the table below, including the related notes, and the financial highlights for each of the periods indicated in the table below (collectively referred to as the “financial statements”). In our opinion, the financial statements present fairly, in all material respects, the financial position of each of the Funds as of August 31, 2022, the results of each of their operations, the changes in each of their net assets, and each of the financial highlights for each of the periods indicated in the table below, in conformity with accounting principles generally accepted in the United States of America.
| Fund | Statement of operations |
Statements of changes in net assets |
Financial highlights | |||
| Goldman Sachs Global Managed Beta Fund, Goldman Sachs Strategic Factor Allocation Fund, and Goldman Sachs Tactical Tilt Overlay Fund | For the year ended August 31, 2022 | For the two years ended August 31, 2022 | For each of the periods indicated therein | |||
| Goldman Sachs Strategic Volatility Premium Fund | For the year ended August 31, 2022 | For the year ended August 31, 2022 and for the period March 29, 2021 (commencement of operations) through August 31, 2021 | ||||
Basis for Opinions
These financial statements are the responsibility of the Funds’ management. Our responsibility is to express an opinion on the Funds’ financial statements based on our audits. We are a public accounting firm registered with the Public Company Accounting Oversight Board (United States) (PCAOB) and are required to be independent with respect to the Funds in accordance with the U.S. federal securities laws and the applicable rules and regulations of the Securities and Exchange Commission and the PCAOB.
We conducted our audits of these financial statements in accordance with the standards of the PCAOB. Those standards require that we plan and perform the audit to obtain reasonable assurance about whether the financial statements are free of material misstatement, whether due to error or fraud.
Our audits included performing procedures to assess the risks of material misstatement of the financial statements, whether due to error or fraud, and performing procedures that respond to those risks. Such procedures included examining, on a test basis, evidence regarding the amounts and disclosures in the financial statements. Our audits also included evaluating the accounting principles used and significant estimates made by management, as well as evaluating the overall presentation of the financial statements. Our procedures included confirmation of securities owned as of August 31, 2022 by correspondence with the custodian, transfer agent and brokers; when replies were not received from brokers, we performed other auditing procedures. We believe that our audits provide a reasonable basis for our opinions.
/s/ PricewaterhouseCoopers LLP
Boston, Massachusetts
October 25, 2022
We have served as the auditor of one or more investment companies in the Goldman Sachs fund complex since 2000.
97
GOLDMAN SACHS ALLOCATION FUNDS
Fund Expenses — Six Month Period Ended August 31, 2022 (Unaudited)
As a shareholder of Institutional, Class R6 and Class P Shares of the Fund you incur two types of costs: (1) transaction costs and (2) ongoing costs, including management fees and other Fund expenses. This example is intended to help you understand your ongoing costs (in dollars) of investing in Institutional, Class R6 and Class P Shares of the Fund and to compare these costs with the ongoing costs of investing in other mutual funds.
The example is based on an investment of $1,000 invested at the beginning of the period and held for the entire period from March 1, 2022, through August 31, 2022, which represents a period of 184 days in a 365-day year.
Actual Expenses — The first line in the table below provides information about actual account values and actual expenses. You may use the information in this line, together with the amount you invested, to estimate the expenses that you paid over the period. Simply divide your account value by $1,000 (for example, an $8,600 account value divided by $1,000=8.6), then multiply the result by the number in the first line under the heading entitled “Expenses Paid” to estimate the expenses you paid on your account during this period.
Hypothetical Example for Comparison Purposes — The second line in the table below provides information about hypothetical account values and hypothetical expenses based on the Funds’ actual net expense ratios and an assumed rate of return of 5% per year before expenses, which is not the Funds’ actual return. The hypothetical account values and expenses may not be used to estimate the actual ending account balance or expenses you paid for the period. You may use this information to compare the ongoing costs of investing in the Funds and other funds. To do so, compare this 5% hypothetical example with the 5% hypothetical examples that appear in the shareholder reports of the other funds.
Please note that the expenses shown in the table are meant to highlight your ongoing costs only and do not reflect any transactional costs, such as sales charges, redemption fees, or exchange fees. Therefore, the second line of the table is useful in comparing ongoing costs only, and will not help you determine the relative total costs of owning different funds. In addition, if these transactional costs were included, your costs would have been higher.
| Global Managed Beta Fund | Strategic Factor Allocation Fund | Strategic Volatility Premium Fund | Tactical Tilt Overlay Fund | |||||||||||||||||||||||||||||||||||||||||||||
| Share Class | Beginning Account Value 3/1/22 |
Ending Account Value 8/31/22 |
Expenses Paid for the 6 months ended 8/31/22* |
Beginning Account Value 3/1/22 |
Ending Account Value 8/31/22 |
Expenses Paid for the 6 months ended 8/31/22* |
Beginning Account Value 3/1/22 |
Ending Account Value 8/31/21 |
Expenses Paid for the 6 months ended 8/31/22* |
Beginning Account Value 3/1/22 |
Ending Account Value 8/31/22 |
Ending Account Value 8/31/22 |
||||||||||||||||||||||||||||||||||||
| Institutional | ||||||||||||||||||||||||||||||||||||||||||||||||
|
Actual |
$ | 1,000.00 | $ | 895.50 | $ | 1.43 | $ | 1,000.00 | $ | 938.30 | $ | 3.37 | $ | 1,000.00 | $ | 966.90 | $ | 1.88 | $ | 1,000.00 | $ | 988.70 | $ | 3.41 | ||||||||||||||||||||||||
|
Hypothetical 5% return |
1,000.00 | 1,023.69 | + | 1.53 | 1,000.00 | 1,021.73 | + | 3.52 | 1,000.00 | 1,023.29 | + | 1.94 | 1,000.00 | 1,021.78 | + | 3.47 | ||||||||||||||||||||||||||||||||
| Class R6 | ||||||||||||||||||||||||||||||||||||||||||||||||
|
Actual |
— | — | — | 1,000.00 | 939.40 | 3.23 | — | — | — | 1,000.00 | 988.30 | 3.36 | ||||||||||||||||||||||||||||||||||||
|
Hypothetical 5% return |
— | — | — | 1,000.00 | 1,021.88 | + | 3.36 | — | — | — | 1,000.00 | 1,021.83 | + | 3.41 | ||||||||||||||||||||||||||||||||||
| Class P | ||||||||||||||||||||||||||||||||||||||||||||||||
|
Actual |
— | — | — | 1,000.00 | 938.40 | 3.32 | 1,000.00 | 966.90 | 1.83 | 1,000.00 | 988.30 | 3.36 | ||||||||||||||||||||||||||||||||||||
|
Hypothetical 5% return |
— | — | — | 1,000.00 | 1,021.78 | + | 3.47 | 1,000.00 | 1,023.34 | + | 1.89 | 1,000.00 | 1,021.83 | + | 3.41 | |||||||||||||||||||||||||||||||||
| * | Expenses are calculated using each Fund’s annualized net expense ratio (excluding proxy fees) for each class, which represents the ongoing expenses as a percentage of net assets for the six months ended August 31, 2022. Expenses are calculated by multiplying the annualized net expense ratio by the average account value for the period; then multiplying the result by the number of days in the most recent fiscal half year; and then dividing that result by the number of days in the fiscal year. The annualized net expense ratios for the period were as follows: |
| Fund | Institutional | Class R6 | Class P | |||||||||
| Global Managed Beta |
0.30 | % | — | % | — | % | ||||||
| Strategic Factor Allocation |
0.69 | 0.66 | 0.68 | |||||||||
| Strategic Volatility Premium |
0.38 | — | 0.37 | |||||||||
| Tactical Tilt Overlay |
0.68 | 0.67 | 0.67 | |||||||||
| + | Hypothetical expenses are based on Fund’s actual annualized net expense ratios (excluding proxy fees) and an assumed rate of return of 5% per year before expenses. |
98
GOLDMAN SACHS ALLOCATION FUNDS
Statement Regarding Basis for Approval of Management Agreement (Unaudited)
Background
The Goldman Sachs Global Managed Beta Fund, Goldman Sachs Strategic Factor Allocation Fund, Goldman Sachs Strategic Volatility Premium Fund and Goldman Sachs Tactical Tilt Overlay Fund (the “Funds”) are investment portfolios of Goldman Sachs Trust (the “Trust”). The Board of Trustees oversees the management of the Trust and reviews the investment performance and expenses of the Funds at regularly scheduled meetings held throughout the year. In addition, the Board of Trustees determines annually whether to approve the continuance of the Trust’s investment management agreement (the “Management Agreement”) with Goldman Sachs Asset Management, L.P. (the “Investment Adviser”) on behalf of the Funds.
The Management Agreement was most recently approved for continuation until June 30, 2023 by the Board of Trustees, including those Trustees who are not parties to the Management Agreement or “interested persons” (as defined in the Investment Company Act of 1940, as amended) of any party thereto (the “Independent Trustees”), at a meeting held on June 14-15, 2022 (the “Annual Meeting”).
The review process undertaken by the Trustees spans the course of the year and culminates with the Annual Meeting. To assist the Trustees in their deliberations, the Trustees have established a Contract Review Committee (the “Committee”), comprised of the Independent Trustees. The Committee held two meetings over the course of the year since the Management Agreement was last approved. At those Committee meetings, regularly scheduled Board or other committee meetings, and/or the Annual Meeting, matters relevant to the renewal of the Management Agreement were considered by the Board, or the Independent Trustees, as applicable. With respect to each Fund, such matters included:
| (a) | the nature and quality of the advisory, administrative, and other services provided to the Fund and the underlying funds in which the Tactical Tilt Overlay Fund invests (the “Underlying Funds”) by the Investment Adviser and its affiliates, including information about: |
| (i) | the structure, staff, and capabilities of the Investment Adviser and its portfolio management teams; |
| (ii) | the groups within the Investment Adviser and its affiliates that support the portfolio management teams or provide other types of necessary services, including fund services groups (e.g., accounting and financial reporting, tax, shareholder services, and operations); controls and risk management groups (e.g., legal, compliance, valuation oversight, credit risk management, internal audit, compliance testing, market risk analysis, finance, and central funding); sales and distribution support groups, and others (e.g., information technology and training); |
| (iii) | trends in employee headcount; |
| (iv) | the Investment Adviser’s financial resources and ability to hire and retain talented personnel and strengthen its operations; and |
| (v) | the parent company’s support of the Investment Adviser and its mutual fund business, as expressed by the firm’s senior management; |
| (b) | information on the investment performance of the Fund and the Underlying Funds, including comparisons to the performance of similar mutual funds, as provided by a third-party mutual fund data provider engaged as part of the contract review process (the “Outside Data Provider”), and a benchmark performance index; and information on general investment outlooks in the markets in which the Fund and the Underlying Funds invest; |
| (c) | information provided by the Investment Adviser indicating the Investment Adviser’s views on whether the Fund’s peer group and/or benchmark index had high, medium, or low relevance given the Fund’s particular investment strategy; |
| (d) | the terms of the Management Agreement and other agreements with affiliated service providers entered into by the Trust on behalf of the Fund; |
| (e) | fee and expense information for the Fund, including: |
| (i) | the relative management fee and expense levels of the Fund as compared to those of comparable funds managed by other advisers, as provided by the Outside Data Provider; |
| (ii) | the Fund’s expense trends over time (except for the Strategic Volatility Premium Fund, which commenced operations on March 29, 2021); and |
| (iii) | to the extent the Investment Adviser manages other types of accounts (such as bank collective trusts, private wealth management accounts, institutional separate accounts, sub-advised mutual funds, and non-U.S. funds) having investment objectives and policies similar to those of the Fund, comparative information on the advisory fees charged and services provided to those accounts by the Investment Adviser; |
| (f) | with respect to the extensive investment performance and expense comparison data provided by the Outside Data Provider, its processes in producing that data for the Fund; |
| (g) | the undertakings of the Investment Adviser and its affiliates to implement fee waivers and/or expense limitations; |
| (h) | information relating to the profitability of the Management Agreement and the transfer agency and distribution and service arrangements of the Fund to the Investment Adviser and its affiliates; |
99
GOLDMAN SACHS ALLOCATION FUNDS
Statement Regarding Basis for Approval of Management Agreement (Unaudited) (continued)
| (i) | whether the Fund’s existing management fee schedule, together with the management fee schedules of the Underlying Funds, adequately addressed any economies of scale; |
| (j) | a summary of the “fall-out” benefits derived by the Investment Adviser and its affiliates from their relationships with the Fund and/or the Underlying Funds, including the fees received by the Investment Adviser’s affiliates from the Fund and/or the Underlying Funds for transfer agency, portfolio trading, distribution and other services; |
| (k) | a summary of potential benefits derived by the Fund and/or the Underlying Funds as a result of its relationship with the Investment Adviser; |
| (l) | information regarding commissions paid by the Fund and/or the Underlying Funds and broker oversight, an update on the Investment Adviser’s soft dollars practices, other information regarding portfolio trading, and how the Investment Adviser carries out its duty to seek best execution, as applicable; |
| (m) | portfolio manager ownership of Fund shares; the manner in which portfolio manager compensation is determined; and the number and types of accounts managed by the portfolio managers; |
| (n) | the nature and quality of the services provided to the Fund and the Underlying Funds by their unaffiliated service providers, and the Investment Adviser’s general oversight and evaluation (including reports on due diligence) of those service providers as part of the administrative services provided under the Management Agreement; and |
| (o) | the Investment Adviser’s processes and policies addressing various types of potential conflicts of interest; its approach to risk management; the annual review of the effectiveness of the Fund’s compliance program; and periodic compliance reports. |
The Trustees also received an overview of the Funds’ distribution arrangements. They received information regarding the Funds’ assets, share purchase and redemption activity. Information was also provided to the Trustees relating to revenue sharing payments made by and services provided by the Investment Adviser and its affiliates to intermediaries that promote the sale, distribution, and/or servicing of Fund shares. The Independent Trustees also discussed the broad range of other investment choices that are available to Fund investors, including the availability of comparable funds managed by other advisers.
The presentations made at the Board and Committee meetings and at the Annual Meeting encompassed the Funds and other mutual funds for which the Board of Trustees has responsibility. In evaluating the Management Agreement at the Annual Meeting, the Trustees relied upon their knowledge, resulting from their meetings and other interactions throughout the year, of the Investment Adviser and its affiliates, their services, and the Funds. In conjunction with these meetings, the Trustees received written materials and oral presentations on the topics covered, and the Investment Adviser addressed the questions and concerns of the Trustees, including concerns regarding the investment performance of certain of the funds they oversee. The Independent Trustees were advised by their independent legal counsel regarding their responsibilities and other regulatory requirements related to the approval and continuation of mutual fund investment management agreements under applicable law. In addition, the Investment Adviser and its affiliates provided the Independent Trustees with a written response to a formal request for information sent on behalf of the Independent Trustees by their independent legal counsel. During the course of their deliberations, the Independent Trustees met in executive sessions with their independent legal counsel, without representatives of the Investment Adviser or its affiliates present.
Nature, Extent, and Quality of the Services Provided Under the Management Agreement
As part of their review, the Trustees considered the nature, extent, and quality of the services provided to the Funds and the Underlying Funds by the Investment Adviser. In this regard, the Trustees considered both the investment advisory services and non-advisory services that are provided by the Investment Adviser and its affiliates. The Trustees noted the transition in the leadership and changes in personnel of various of the Investment Adviser’s portfolio management teams that had occurred in recent periods, and the ongoing recruitment efforts aimed at bringing high quality investment talent to the Investment Adviser. They also noted the Investment Adviser’s commitment to maintaining high quality systems and expending substantial resources to respond to ongoing changes to the market, regulatory and control environment in which the Funds, the Underlying Funds, and their service providers operate, including developments associated with the COVID-19 pandemic, geopolitical events, and economic sanctions, as well as the efforts of the Investment Adviser and its affiliates to combat cyber security risks. The Trustees also considered information regarding the Investment Adviser’s business continuity planning and remote operations capabilities. The Trustees concluded that the Investment Adviser continued to commit substantial financial and operational resources to the Funds and expressed confidence that the Investment Adviser would continue to do so in the future. The Trustees also recognized that the Investment Adviser had made significant commitments to address regulatory compliance requirements applicable to the Funds, the Underlying Funds, and the Investment Adviser and its affiliates.
100
GOLDMAN SACHS ALLOCATION FUNDS
Statement Regarding Basis for Approval of Management Agreement (Unaudited) (continued)
Investment Performance
The Trustees also considered the investment performance of the Funds and the Underlying Funds. In this regard, they compared the investment performance of each Fund to its peers using rankings and ratings compiled by the Outside Data Provider as of December 31, 2021, and (in the case of the Strategic Volatility Premium Fund) updated performance information prepared by the Investment Adviser using the peer group identified by the Outside Data Provider as of March 31, 2022. The information on each Fund’s investment performance was provided for the one-, three-, and five-year periods ending on the applicable dates, to the extent that each Fund had been in existence for those periods. The Trustees also reviewed each Fund’s investment performance relative to its performance benchmark. As part of this review, they considered the investment performance trends of the Funds over time, and reviewed the investment performance of each Fund in light of its investment objective and policies and market conditions.
In addition, the Trustees considered materials prepared and presentations made by the Investment Adviser’s senior management and portfolio management personnel in which Fund performance was assessed. The Trustees also considered the Investment Adviser’s periodic reports with respect to the Funds’ and the Underlying Funds’ risk profiles, and how the Investment Adviser’s approach to risk monitoring and management influences portfolio management. For the Strategic Factor Allocation Fund and Strategic Volatility Premium Fund, they noted the efforts of the Funds’ portfolio management team to continue to enhance the investment models used in managing the Funds.
The Trustees observed that the Global Managed Beta Fund’s Institutional Shares had placed in the top half of the Fund’s peer group for the three- and five-year periods, and in the third quartile for the one-year period ended December 31, 2021, and had outperformed the Fund’s benchmark index for the three- and five-year periods and underperformed for the one-year period ended March 31, 2022. The Trustees considered that the Strategic Factor Allocation Fund’s Institutional Shares had placed in the top half of the Fund’s peer group for the one-, three-, and five-year periods ended December 31, 2021, and had outperformed the Fund’s benchmark index for the one-year period and underperformed for the three- and five-year periods ended March 31, 2022. The Trustees noted that the Strategic Volatility Premium Fund’s Institutional Shares had placed in the fourth quartile of the Fund’s peer group for the one-year period, and had outperformed the Fund’s benchmark index for the one-year period ended March 31, 2022. The Trustees observed that the Tactical Tilt Overlay Fund’s Institutional Shares had placed in the fourth quartile of the Fund’s peer group for the one-, three-, and five-year periods ended December 31, 2021, and had outperformed the Fund’s benchmark index for the one-, three-, and five-year periods ended March 31, 2022. They also noted that the Tactical Tilt Overlay Fund had experienced a benchmark index change in 2021.
Costs of Services Provided and Competitive Information
The Trustees considered the contractual terms of the Management Agreement and the fee rates payable by each Fund thereunder. In this regard, the Trustees considered information on the services rendered by the Investment Adviser to the Funds, which included both advisory and administrative services that were directed to the needs and operations of the Funds as registered mutual funds.
In particular, the Trustees reviewed analyses prepared by the Outside Data Provider regarding the expense rankings of the Funds. The analyses provided a comparison of each Fund’s management fee and (in the case of the Strategic Factor Allocation Fund, Strategic Volatility Premium Fund, and Tactical Tilt Overlay Fund) breakpoints, to those of a relevant peer group and category universe; an expense analysis which compared each Fund’s overall net and gross expenses to a peer group and a category universe; and data comparing each Fund’s net expenses to the peer and category medians. The analyses also compared each Fund’s other expenses and fee waivers/reimbursements to those of the peer group and category medians. The Trustees concluded that the comparisons provided by the Outside Data Provider were useful in evaluating the reasonableness of the management fees and total expenses paid by the Funds.
In addition, the Trustees considered the Investment Adviser’s undertakings to implement fee waivers and/or expense limitations with respect to the Funds and the Underlying Funds. With respect to the Tactical Tilt Overlay Fund, the Trustees noted that the Investment Adviser had agreed to waive a portion of its management fee in an amount equal to the entire management fee paid to the Investment Adviser as the investment adviser to the Fund’s wholly-owned subsidiary. They also considered, to the extent that the Investment Adviser manages other types of accounts having investment objectives and policies similar to those of the Funds, comparative fee information for services provided by the Investment Adviser to those accounts, and information that indicated that services provided to the Funds differed in various significant respects from the services provided to other types of accounts which, in many cases, operated under less stringent legal and regulatory structures, required fewer services from the Investment Adviser to a smaller number of client contact points, and were less time-intensive.
In addition, the Trustees noted that shareholders are able to redeem their shares at any time if shareholders believe that the Fund fees and expenses are too high or if they are dissatisfied with the performance of the Fund.
101
GOLDMAN SACHS ALLOCATION FUNDS
Statement Regarding Basis for Approval of Management Agreement (Unaudited) (continued)
Profitability
The Trustees reviewed each Fund’s contribution to the Investment Adviser’s revenues and pre-tax profit margins. In this regard the Trustees noted that they had received, among other things, profitability analyses and summaries, revenue and expense schedules by Fund and by function (i.e., investment management, transfer agency and distribution and service), and information on the Investment Adviser’s expense allocation methodology. They observed that the profitability and expense figures are substantially similar to those used by the Investment Adviser for many internal purposes, including compensation decisions among various business groups, and are thus subject to a vigorous internal debate about how certain revenue and expenses should be allocated. The Trustees also noted that the internal audit group within the Goldman Sachs organization periodically audits the expense allocation methodology and that the internal audit group was satisfied with the reasonableness, consistency, and accuracy of the Investment Adviser’s expense allocation methodology. Profitability data for each Fund was provided for 2021 and 2020 (2021 only for the Strategic Volatility Premium Fund), and the Trustees considered this information in relation to the Investment Adviser’s overall profitability.
Economies of Scale
The Trustees considered the information that had been provided regarding whether there have been economies of scale with respect to the management of the Funds. For the Strategic Factor Allocation Fund, Strategic Volatility Premium Fund and Tactical Tilt Overlay Fund, the Trustees also considered the breakpoints in the fee rate payable under the Management Agreement at the following annual percentage rates of the average daily net assets of each Fund:
| Strategic Factor Allocation Fund |
Strategic Volatility Premium Fund |
Tactical Tilt Overlay Fund |
||||||||||
| First $2 billion |
0.75 | % | 0.50 | % | 0.75 | % | ||||||
| Next $3 billion |
0.68 | 0.45 | 0.68 | |||||||||
| Next $3 billion |
0.64 | 0.43 | 0.64 | |||||||||
| Over $8 billion |
0.62 | 0.42 | 0.62 | |||||||||
The Trustees noted that the breakpoints were designed to share potential economies of scale, if any, with the Funds and their shareholders as assets under management reach those asset levels. The Trustees considered the amounts of assets in the Funds; the Funds’ recent share purchase and redemption activity; the information provided by the Investment Adviser relating to the costs of the services provided by the Investment Adviser and its affiliates and their realized profits; information comparing fee rates charged by the Investment Adviser with fee rates charged to other funds in the peer groups; and the Investment Adviser’s undertaking to limit certain expenses of the Funds that exceed specified levels. Upon reviewing these matters at the Annual Meeting, the Trustees concluded that the fee breakpoints for the Strategic Factor Allocation Fund, Strategic Volatility Premium Fund and Tactical Tilt Overlay Fund represented a means of assuring that benefits of scalability, if any, would be passed along to shareholders at the specified asset levels. Upon reviewing these materials at the Annual Meeting, the Trustees concluded that the fee breakpoints represented a means of assuring that benefits of scalability, if any, would be passed along to shareholders at the specified asset levels. They also noted that the Investment Adviser had passed along savings to shareholders of the Tactical Tilt Overlay Fund, which had asset levels above at least the first breakpoint during the prior fiscal year. The Trustees also considered the services provided to the Tactical Tilt Overlay Fund under the Management Agreement and the fees and expenses borne by the Underlying Funds and considered the Investment Adviser’s finding that the management fees payable by the Fund were not duplicative of the management fees paid at the Underlying Fund level.
With respect to Global Managed Beta Fund, the Trustees noted that the Fund does not have management fee breakpoints. They considered the asset levels in the Fund; the Fund’s recent purchase and redemption activity; the information provided by the Investment Adviser relating to the costs of the services provided by the Investment Adviser and its affiliates and their realized profits; information comparing the contractual fee rates charged by the Investment Adviser with fee rates charged to other funds in the peer group; and the Investment Adviser’s undertaking to limit certain expenses of the Fund that exceed a specified level.
Other Benefits to the Investment Adviser and Its Affiliates
The Trustees also considered the other benefits derived by the Investment Adviser and its affiliates from their relationships with the Funds and/or the Underlying Funds as stated above, including: (a) transfer agency fees received by Goldman Sachs & Co. LLC (“Goldman Sachs”); (b) brokerage and futures commissions earned by Goldman Sachs for executing securities and futures transactions on behalf of the Funds and certain Underlying Funds; (c) in the case of the Global Managed Beta Fund and Tactical
102
GOLDMAN SACHS ALLOCATION FUNDS
Statement Regarding Basis for Approval of Management Agreement (Unaudited) (continued)
Tilt Overlay Fund, research received by the Investment Adviser from broker-dealers in exchange for executing certain transactions on behalf of the Funds and certain Underlying Funds; (d) trading efficiencies resulting from aggregation of orders of the Funds or Underlying Funds with those for other funds or accounts managed by the Investment Adviser; (e) in the case of the Tactical Tilt Overlay Fund and Global Managed Beta Fund, fees earned by the Investment Adviser for managing the fund in which each Fund’s and certain Underlying Funds’ securities lending cash collateral is invested; (f) the Investment Adviser’s ability to leverage the infrastructure designed to service the Funds on behalf of its other clients; (g) the Investment Adviser’s ability to cross-market other products and services to Fund shareholders; (h) Goldman Sachs’ retention of certain fees as Fund Distributor; (i) the Investment Adviser’s ability to negotiate better pricing with custodians on behalf of its other clients, as a result of the relationship with the Funds and the Underlying Funds; (j) the investment of cash and cash collateral in money market funds managed by the Investment Adviser that will result in increased assets under management for those money market funds; (k) the investment in exchange-traded funds (“ETFs”) managed by the Investment Adviser that will result in increased assets under management for those ETFs and may facilitate the development of the Investment Adviser’s ETF advisory business; and (l) the possibility that the working relationship between the Investment Adviser and the Funds’ and the Underlying Funds’ third-party service providers may cause those service providers to be more likely to do business with other areas of Goldman Sachs. In the course of considering the foregoing, the Independent Trustees requested and received further information quantifying certain of these fall-out benefits.
Other Benefits to the Funds and Their Shareholders
The Trustees also noted that the Funds and/or the Underlying Funds (as applicable) receive certain other potential benefits as a result of their relationship with the Investment Adviser, including: (a) trading efficiencies resulting from aggregation of orders of the Funds and/or the Underlying Funds with those of other funds or accounts managed by the Investment Adviser; (b) enhanced servicing from vendors due to the volume of business generated by the Investment Adviser and its affiliates; (c) enhanced servicing from broker-dealers due to the volume of business generated by the Investment Adviser and its affiliates; (d) the Investment Adviser’s ability to negotiate favorable terms with derivatives counterparties on behalf of the Funds and the Underlying Funds as a result of the size and reputation of the Goldman Sachs organization; (e) the advantages received from the Investment Adviser’s knowledge and experience gained from managing other accounts and products; (f) the Investment Adviser’s ability to hire and retain qualified personnel to provide services to the Funds and the Underlying Funds because of the reputation of the Goldman Sachs organization; (g) the Funds’ and the Underlying Funds’ access, through the Investment Adviser, to certain firm-wide resources (e.g., proprietary risk management systems and databases), subject to certain restrictions; and (h) the Funds’ access to certain affiliated distribution channels. In addition, the Trustees noted the competitive nature of the mutual fund marketplace, and considered that many of the Funds’ shareholders invested in the Funds in part because of the Funds’ relationship with the Investment Adviser and that those shareholders have a general expectation that the relationship will continue.
Conclusion
In connection with their consideration of the Management Agreement, the Trustees gave weight to each of the factors described above, but did not identify any particular factor as controlling their decision. After deliberation and consideration of all of the information provided, including the factors described above, the Trustees concluded, in the exercise of their business judgment, that the management fees paid by each of the Funds were reasonable in light of the services provided to it by the Investment Adviser, the Investment Adviser’s costs and each Fund’s current and reasonably foreseeable asset levels. The Trustees unanimously concluded that the Investment Adviser’s continued management likely would benefit each Fund and its shareholders and that the Management Agreement should be approved and continued with respect to each Fund until June 30, 2023.
103
GOLDMAN SACHS ALLOCATION FUNDS
Trustees and Officers (Unaudited)
Independent Trustees
| Name, Address and Age1 |
Position(s) Held with the Trust |
Term of Office and Length of Time Served2 |
Principal Occupation(s) During Past 5 Years |
Number of Portfolios in Fund Complex Overseen by Trustee3 |
Other Directorships Held by Trustee4 | |||||
| Jessica Palmer Age: 73 |
Chair of the Board of Trustees | Since 2018 (Trustee since 2007) | Ms. Palmer is retired. She was formerly Consultant, Citigroup Human Resources Department (2007-2008); Managing Director, Citigroup Corporate and Investment Banking (previously, Salomon Smith Barney/Salomon Brothers) (1984-2006). Ms. Palmer was a Member of the Board of Trustees of Indian Mountain School (private elementary and secondary school) (2004-2009).
Chair of the Board of Trustees — Goldman Sachs Trust and Goldman Sachs Variable Insurance Trust. |
103 | None | |||||
| Dwight L. Bush Age: 65 |
Trustee | Since 2020 | Ambassador Bush is President and CEO of D.L. Bush & Associates (a financial advisory and private investment firm) (2002-2014 and 2017- Present); Director of MoneyLion Inc. (an operator of a data-driven, digital financial platform) (2021- Present); and was formerly U.S. Ambassador to the Kingdom of Morocco (2014-2017) and a Member of the Board of Directors of Santander Bank, N.A. (2018-2019). Previously, Ambassador Bush served as an Advisory Board Member of Goldman Sachs Trust and Goldman Sachs Variable Insurance Trust (October 2019-January 2020).
Trustee — Goldman Sachs Trust and Goldman Sachs Variable Insurance Trust. |
103 | MoneyLion, Inc. (an operator of a data-driven, digital financial platform) | |||||
| Kathryn A. Cassidy Age: 68 |
Trustee | Since 2015 | Ms. Cassidy is retired. She is Director, Vertical Aerospace Ltd. (an aerospace and technology company) (2021-Present). Formerly, Ms. Cassidy was Advisor to the Chairman (May 2014-December 2014); and Senior Vice President and Treasurer (2008-2014), General Electric Company & General Electric Capital Corporation (technology and financial services companies).
Trustee — Goldman Sachs Trust and Goldman Sachs Variable Insurance Trust. |
103 | Vertical Aerospace Ltd. (an aerospace and technology company) | |||||
| John G. Chou Age: 65 |
Trustee | Since 2022 | Mr. Chou is Executive Vice President and Special Advisor to the Chairman and CEO of AmerisourceBergen Corporation (a pharmaceutical and healthcare company) (2021-Present); and formerly held various executive management positions with AmerisourceBergen Corporation, including Executive Vice President and Chief Legal Officer (2019-2021); Executive Vice President and Chief Legal & Business Officer (2017-2019); and Executive Vice President and General Counsel (2011-2017).
Trustee — Goldman Sachs Trust and Goldman Sachs Variable Insurance Trust. |
103 | None | |||||
| Diana M. Daniels Age: 73 |
Trustee | Since 2007 | Ms. Daniels is retired. Formerly, she was Vice President, General Counsel and Secretary, The Washington Post Company (1991-2006). Ms. Daniels is a Trustee Emeritus and serves as a Presidential Councillor of Cornell University (2013-Present); Director of 1735 NY Investments, LLC (oversees an investment fund that supports the mission of the American Institute of Architects) (2022-Present); former Member of the Legal Advisory Board, New York Stock Exchange (2003-2006) and of the Corporate Advisory Board, Standish Mellon Management Advisors (2006-2007).
Trustee — Goldman Sachs Trust and Goldman Sachs Variable Insurance Trust. |
103 | None | |||||
104
GOLDMAN SACHS ALLOCATION FUNDS
Trustees and Officers (Unaudited) (continued)
Independent Trustees
| Name, Address and Age1 |
Position(s) Held with the Trust |
Term of Office and Length of Time Served2 |
Principal Occupation(s) During Past 5 Years |
Number of Portfolios in Fund Complex Overseen by Trustee3 |
Other Directorships Held by Trustee4 | |||||
| Joaquin Delgado Age: 62 |
Trustee | Since 2020 | Dr. Delgado is retired. He is Director, Stepan Company (a specialty chemical manufacturer) (2011-Present); and was formerly Director, Hexion Inc. (a specialty chemical manufacturer) (2019-2022); Executive Vice President, Consumer Business Group of 3M Company (July 2016-July 2019); and Executive Vice President, Health Care Business Group of 3M Company (October 2012-July 2016). Previously, Dr. Delgado served as an Advisory Board Member of Goldman Sachs Trust and Goldman Sachs Variable Insurance Trust (October 2019-January 2020).
Trustee — Goldman Sachs Trust and Goldman Sachs Variable Insurance Trust |
103 | Stepan Company (a specialty chemical manufacturer) | |||||
| Eileen H. Dowling Age: 59 |
Trustee | Since 2021 | Ms. Dowling is retired. Formerly, she was Senior Advisor (April 2021-September 2021); and Managing Director (2013-2021), BlackRock, Inc. (a financial services firm).
Trustee — Goldman Sachs Trust and Goldman Sachs Variable Insurance Trust. |
103 | None | |||||
| Gregory G. Weaver Age: 70 |
Trustee | Since 2015 | Mr. Weaver is retired. He is Director, Verizon Communications Inc. (2015-Present); and was formerly Chairman and Chief Executive Officer, Deloitte & Touche LLP (a professional services firm) (2001-2005 and 2012-2014); and Member of the Board of Directors, Deloitte & Touche LLP (2006-2012).
Trustee — Goldman Sachs Trust and Goldman Sachs Variable Insurance Trust. |
103 | Verizon Communications Inc. | |||||
| Paul C. Wirth Age: 64 |
Trustee | Since 2022 | Mr. Wirth is retired. Formerly, he was Deputy Chief Financial Officerand Principal Accounting Officer (2011-2020); Finance Director and Principal Accounting Officer (2010-2011); and Managing Director, Global Controller, and Chief Accounting Officer (2005-2010) of Morgan Stanley.
Trustee — Goldman Sachs Trust and Goldman Sachs Variable Insurance Trust. |
103 | None | |||||
105
GOLDMAN SACHS ALLOCATION FUNDS
Trustees and Officers (Unaudited) (continued)
Interested Trustee*
| Name, Address and Age1 |
Position(s) Held with the Trust |
Term of Office and Length of Time Served2 |
Principal Occupation(s) During Past 5 Years |
Number of Portfolios in Fund Complex Overseen by Trustee3 |
Other Directorships Held by Trustee4 | |||||
| James A. McNamara Age: 59 |
President and Trustee | Since 2007 | Advisory Director, Goldman Sachs (January 2018-Present); Managing Director, Goldman Sachs (January 2000-December 2017); Director of Institutional Fund Sales, GSAM (April 1998-December 2000); and Senior Vice President and Manager, Dreyfus Institutional Service Corporation (January 1993-April 1998).
President and Trustee — Goldman Sachs Trust; Goldman Sachs Variable Insurance Trust; Goldman Sachs Trust II; Goldman Sachs ETF Trust; Goldman Sachs ETF Trust II; Goldman Sachs MLP and Energy Renaissance Fund; Goldman Sachs Credit Income Fund; and Goldman Sachs Real Estate Diversified Income Fund. |
172 | None | |||||
| * | Mr. McNamara is considered to be an “Interested Trustee” because he holds positions with Goldman Sachs and owns securities issued by The Goldman Sachs Group, Inc. Mr. McNamara holds comparable positions with certain other companies of which Goldman Sachs, GSAM or an affiliate thereof is the investment adviser, administrator and/or distributor. |
| 1 | Each Trustee may be contacted by writing to the Trustee, c/o Goldman Sachs, 200 West Street, New York, New York, 10282, Attn: Caroline Kraus. Information is provided as of August 31, 2022. |
| 2 | Subject to such policies as may be adopted by the Board from time-to-time, each Trustee holds office for an indefinite term, until the earliest of: (a) the election of his or her successor; (b) the date the Trustee resigns or is removed by the Board or shareholders, in accordance with the Trust’s Declaration of Trust; or (c) the termination of the Trust. The Board has adopted policies which provide that each Independent Trustee shall retire as of December 31st of the calendar year in which he or she reaches (a) his or her 75th birthday or (b) the 15th anniversary of the date he or she became a Trustee, whichever is earlier, unless a waiver of such requirements shall have been adopted by a majority of the other Trustees. These policies may be changed by the Trustees without shareholder vote. |
| 3 | The Goldman Sachs Fund Complex includes certain other companies listed above for each respective Trustee. As of August 31, 2022, Goldman Sachs Trust consisted of 88 portfolios; Goldman Sachs Variable Insurance Trust consisted of 15 portfolios (12 of which offered shares to the public); Goldman Sachs Trust II consisted of 18 portfolios (16 of which offered shares to the public); Goldman Sachs ETF Trust consisted of 46 portfolios (29 of which offered shares to the public); Goldman Sachs ETF Trust II consisted of 2 portfolios (1 of which offered shares to the public); and Goldman Sachs MLP and Energy Renaissance Fund, Goldman Sachs Credit Income Fund and Goldman Sachs Real Estate Diversified Income Fund each consisted of one portfolio. Goldman Sachs Credit Income Fund did not offer shares to the public. |
| 4 | This column includes only directorships of companies required to report to the Securities and Exchange Commission under the Securities Exchange Act of 1934 (i.e., “public companies”) or other investment companies registered under the Act. |
Additional information about the Trustees is available in the Funds’ Statement of Additional Information, which can be obtained from Goldman Sachs free of charge by calling this toll-free number (in the United States of America): 1-800-526-7384.
106
GOLDMAN SACHS ALLOCATION FUNDS
Trustees and Officers (Unaudited) (continued)
Officers of the Trust*
| Name, Address and Age1 | Position(s) Held with the Trust |
Term of Office and Length of Time Served2 |
Principal Occupation(s) During Past 5 Years | |||
| James A. McNamara 200 West Street New York, NY 10282 Age: 59 |
Trustee and President | Since 2007 | Advisory Director, Goldman Sachs (January 2018-Present); Managing Director, Goldman Sachs (January 2000-December 2017); Director of Institutional Fund Sales, GSAM (April 1998-December 2000); and Senior Vice President and Manager, Dreyfus Institutional Service Corporation (January 1993-April 1998).
President and Trustee — Goldman Sachs Trust; Goldman Sachs Variable Insurance Trust; Goldman Sachs Trust II; Goldman Sachs ETF Trust; Goldman Sachs ETF Trust II; Goldman Sachs MLP and Energy Renaissance Fund; Goldman Sachs Credit Income Fund; and Goldman Sachs Real Estate Diversified Income Fund. | |||
| Caroline L. Kraus 200 West Street New York, NY 10282 Age: 45 |
Secretary | Since 2012 | Managing Director, Goldman Sachs (January 2016-Present); Vice President, Goldman Sachs (August 2006-December 2015); Senior Counsel, Goldman Sachs (January 2020-Present); Associate General Counsel, Goldman Sachs (2012-December 2019); Assistant General Counsel, Goldman Sachs (August 2006-December 2011); and Associate, Weil, Gotshal & Manges, LLP (2002-2006).
Secretary — Goldman Sachs Trust (previously Assistant Secretary (2012)); Goldman Sachs Variable Insurance Trust (previously Assistant Secretary (2012)); Goldman Sachs Trust II; Goldman Sachs BDC, Inc.; Goldman Sachs Private Middle Market Credit LLC; Goldman Sachs Private Middle Market Credit II LLC; Goldman Sachs Middle Market Lending Corp.; Goldman Sachs MLP and Energy Renaissance Fund; Goldman Sachs ETF Trust; Goldman Sachs ETF Trust II; Goldman Sachs Credit Income Fund; and Goldman Sachs Real Estate Diversified Income Fund. | |||
| Joseph F. DiMaria 30 Hudson Street Jersey City, NJ 07302 Age: 54 |
Treasurer, Principal Financial Officer and Principal Accounting Officer | Since 2017 (Treasurer and Principal Financial Officer since 2019) | Managing Director, Goldman Sachs (November 2015-Present) and Vice President — Mutual Fund Administration, Columbia Management Investment Advisers, LLC (May 2010- October 2015).
Treasurer, Principal Financial Officer and Principal Accounting Officer — Goldman Sachs Trust (previously Assistant Treasurer (2016)); Goldman Sachs Variable Insurance Trust (previously Assistant Treasurer (2016)); Goldman Sachs Trust II (previously Assistant Treasurer (2017)); Goldman Sachs MLP and Energy Renaissance Fund (previously Assistant Treasurer (2017)); Goldman Sachs ETF Trust (previously Assistant Treasurer (2017)); Goldman Sachs ETF Trust II; Goldman Sachs Credit Income Fund; and Goldman Sachs Real Estate Diversified Income Fund. | |||
| * | Represents a partial list of officers of the Trust. Additional information about all the officers is available in the Funds’ Statement of Additional Information, which can be obtained from Goldman Sachs free of charge by calling this toll-free number (in the United States): 1-800-526-7384. |
| 1 | Information is provided as of August 31, 2022. |
| 2 | Officers hold office at the pleasure of the Board of Trustees or until their successors are duly elected and qualified. Each officer holds comparable positions with certain other companies of which Goldman Sachs, GSAM or an affiliate thereof is the investment adviser, administrator and/or distributor. |
Goldman Sachs Trust — Allocation Funds — Tax Information (Unaudited)
For the year ended August 31, 2022, 10.41% and 8.94% of the dividends paid from net investment company taxable income by the Global Managed Beta and Tactical Tilt Overlay Funds qualify for the dividends received deduction available to corporations.
From distributions paid during the fiscal year ended August 31, 2022, the total amount of income received by the Global Managed Beta Fund from sources within foreign countries and possessions of the United States was $0.1877 per share, all of which is attributable to qualified passive income. The percentage of net investment income dividends paid from foreign sources by the Global Managed Beta Fund was 21.38%. The total amount of taxes paid by the Global Managed Beta Fund to such countries was $0.0136.
For the year ended August 31, 2022, the Global Managed Beta and Tactical Tilt Overlay Funds designate 24.57% and 12.65%, respectively, of the dividends paid from net investment company taxable income as qualifying for the reduced tax rate under the Jobs and Growth Tax Relief and Reconciliation Act of 2003.
Pursuant to Section 852 of the Internal Revenue Code, the Global Managed Beta, Strategic Factor Allocation, and Strategic Volatility Premium Funds designate $63,497,092, $189,324,416, and $1,212,154, or if different, the maximum amount allowable, as capital gain dividends paid during the fiscal year ended August 31, 2022.
During the year ended August 31, 2022, the Global Managed Beta, Strategic Factor Allocation, and Strategic Volatility Premium Funds designate $76,863,775, $114,127,787, and $559,438 respectively, as short-term capital gain dividends pursuant to Section 871(k) of the Internal Revenue Code.
107
FUNDS PROFILE
Goldman Sachs Funds
Goldman Sachs is a premier financial services firm, known since 1869 for creating thoughtful and customized investment solutions in complex global markets.
Today, the Asset Management Division of Goldman Sachs serves a diverse set of clients worldwide, including private institutions, public entities and individuals. With approximately $2.27 trillion in assets under supervision as of June 30, 2022, Goldman Sachs Asset Management has portfolio management teams located around the world and our investment professionals bring firsthand knowledge of local markets to every investment decision. Assets under supervision includes assets under management and other client assets for which Goldman Sachs does not have full discretion. Goldman Sachs Asset Management leverages the resources of Goldman Sachs & Co. LLC subject to legal, internal and regulatory restrictions.
Money Market
Financial Square FundsSM
| ∎ | Financial Square Treasury Solutions Fund1 |
| ∎ | Financial Square Government Fund1 |
| ∎ | Financial Square Money Market Fund2 |
| ∎ | Financial Square Prime Obligations Fund2 |
| ∎ | Financial Square Treasury Instruments Fund1 |
| ∎ | Financial Square Treasury Obligations Fund1 |
| ∎ | Financial Square Federal Instruments Fund1 |
Investor FundsSM
| ∎ | Investor Money Market Fund3 |
| ∎ | Investor Tax-Exempt Money Market Fund3 |
Fixed Income
Short Duration and Government
| ∎ | Enhanced Income Fund |
| ∎ | Short-Term Conservative Income Fund |
| ∎ | Short Duration Government Fund |
| ∎ | Short Duration Bond Fund |
| ∎ | Government Income Fund |
| ∎ | Inflation Protected Securities Fund |
Multi-Sector
| ∎ | Bond Fund |
| ∎ | Core Fixed Income Fund |
| ∎ | Global Core Fixed Income Fund4 |
| ∎ | Strategic Income Fund |
| ∎ | Income Fund |
Municipal and Tax-Free
| ∎ | High Yield Municipal Fund |
| ∎ | Dynamic Municipal Income Fund |
| ∎ | Short Duration Tax-Free Fund |
| ∎ | Municipal Income Completion Fund |
Single Sector
| ∎ | Investment Grade Credit Fund |
| ∎ | U.S. Mortgages Fund |
| ∎ | High Yield Fund |
| ∎ | High Yield Floating Rate Fund |
| ∎ | Emerging Markets Debt Fund |
| ∎ | Local Emerging Markets Debt Fund |
Fixed Income Alternatives
| ∎ | Long Short Credit Strategies Fund |
Fundamental Equity
| ∎ | Equity Income Fund |
| ∎ | Small Cap Growth Fund |
| ∎ | Small Cap Value Fund |
| ∎ | Small/Mid Cap Value Fund |
| ∎ | Mid Cap Value Fund |
| ∎ | Large Cap Value Fund |
| ∎ | Focused Value Fund |
| ∎ | Large Cap Core Fund4 |
| ∎ | Strategic Growth Fund |
| ∎ | Small/Mid Cap Growth Fund |
| ∎ | Flexible Cap Fund |
| ∎ | Concentrated Growth Fund |
| ∎ | Technology Opportunities Fund |
| ∎ | Mid Cap Growth Fund5 |
| ∎ | Rising Dividend Growth Fund |
| ∎ | U.S. Equity ESG Fund |
| ∎ | Income Builder Fund |
Tax-Advantaged Equity
| ∎ | U.S. Tax-Managed Equity Fund |
| ∎ | International Tax-Managed Equity Fund |
| ∎ | U.S. Equity Dividend and Premium Fund |
| ∎ | International Equity Dividend and Premium Fund |
Equity Insights
| ∎ | Small Cap Equity Insights Fund |
| ∎ | U.S. Equity Insights Fund |
| ∎ | Small Cap Growth Insights Fund |
| ∎ | Large Cap Growth Insights Fund |
| ∎ | Large Cap Value Insights Fund |
| ∎ | Small Cap Value Insights Fund |
| ∎ | International Small Cap Insights Fund |
| ∎ | International Equity Insights Fund |
| ∎ | Emerging Markets Equity Insights Fund |
Fundamental Equity International
| ∎ | International Equity Income Fund |
| ∎ | International Equity ESG Fund |
| ∎ | China Equity Fund |
| ∎ | Emerging Markets Equity Fund |
| ∎ | ESG Emerging Markets Equity Fund |
Alternative
| ∎ | Clean Energy Income Fund |
| ∎ | Defensive Equity Fund |
| ∎ | Real Estate Securities Fund |
| ∎ | Commodity Strategy Fund |
| ∎ | Global Real Estate Securities Fund |
| ∎ | Absolute Return Tracker Fund |
| ∎ | Managed Futures Strategy Fund |
| ∎ | MLP Energy Infrastructure Fund |
| ∎ | Energy Infrastructure Fund |
| ∎ | Multi-Manager Alternatives Fund |
| ∎ | Global Infrastructure Fund |
Total Portfolio Solutions
| ∎ | Global Managed Beta Fund |
| ∎ | Multi-Manager Non-Core Fixed Income Fund |
| ∎ | Multi-Manager U.S. Dynamic Equity Fund |
| ∎ | Multi-Manager Global Equity Fund |
| ∎ | Multi-Manager International Equity Fund |
| ∎ | Tactical Tilt Overlay Fund |
| ∎ | Balanced Strategy Portfolio |
| ∎ | Multi-Manager U.S. Small Cap Equity Fund |
| ∎ | Multi-Manager Real Assets Strategy Fund |
| ∎ | Growth and Income Strategy Portfolio |
| ∎ | Growth Strategy Portfolio |
| ∎ | Dynamic Global Equity Fund |
| ∎ | Satellite Strategies Portfolio |
| ∎ | Enhanced Dividend Global Equity Portfolio |
| ∎ | Tax-Advantaged Global Equity Portfolio |
| ∎ | Strategic Factor Allocation Fund |
| ∎ | Strategic Volatility Premium Fund |
| ∎ | Target Date Retirement Portfolio |
| ∎ | Target Date 2025 Portfolio |
| ∎ | Target Date 2030 Portfolio |
| ∎ | Target Date 2035 Portfolio |
| ∎ | Target Date 2040 Portfolio |
| ∎ | Target Date 2045 Portfolio |
| ∎ | Target Date 2050 Portfolio |
| ∎ | Target Date 2055 Portfolio |
| ∎ | Target Date 2060 Portfolio |
| ∎ | GQG Partners International Opportunities Fund |
| 1 | You could lose money by investing in the Fund. Although the Fund seeks to preserve the value of your investment at $1.00 per share, it cannot guarantee it will do so. An investment in the Fund is not a deposit of a bank and is not insured or guaranteed by the Federal Deposit Insurance Corporation or any other government agency. The Fund’s sponsor has no legal obligation to provide financial support to the Fund, and you should not expect that the sponsor will provide financial support to the Fund at any time. |
| 2 | You could lose money by investing in the Fund. Because the share price of the Fund will fluctuate, when you sell your shares they may be worth more or less than what you originally paid for them. The Fund may impose a fee upon sale of your shares or may temporarily suspend your ability to sell shares if the Fund’s liquidity falls below required minimums because of market conditions or other factors. An investment in the Fund is not a deposit of a bank and is not insured or guaranteed by the Federal Deposit Insurance Corporation or any other government agency. The Fund’s sponsor has no legal obligation to provide financial support to the Fund, and you should not expect that the sponsor will provide financial support to the Fund at any time. |
| 3 | You could lose money by investing in the Fund. Although the Fund seeks to preserve the value of your investment at $1.00 per share, it cannot guarantee it will do so. The Fund may impose a fee upon sale of your shares or may temporarily suspend your ability to sell shares if the Fund’s liquidity falls below required minimums because of market conditions or other factors. An investment in the Fund is not a deposit of a bank and is not insured or guaranteed by the Federal Deposit Insurance Corporation or any other government agency. The Fund’s sponsor has no legal obligation to provide financial support to the Fund, and you should not expect that the sponsor will provide financial support to the Fund at any time. |
| 4Effective | after the close of business on April 13, 2022, the Goldman Sachs Capital Growth Fund was renamed the Goldman Sachs Large Cap Core Fund. |
| 5 | Effective after the close of business on April 13, 2022, the Goldman Sachs Growth Opportunities Fund was renamed the Goldman Sachs Mid Cap Growth Fund. |
| Financial Square FundsSM and Investor FundsSM are registered service marks of Goldman Sachs & Co. LLC. |
| * | This list covers open-end funds only. Please visit our website at www.GSAMFUNDS.com to learn about our closed-end funds and exchange-traded funds. |
| TRUSTEES Jessica Palmer, Chair Dwight L. Bush Kathryn A. Cassidy John G. Chou Diana M. Daniels Joaquin Delgado Eileen H. Dowling James A. McNamara Gregory G. Weaver Paul C. Wirth |
OFFICERS James A. McNamara, President Joseph F. DiMaria, Principal Financial Officer, Principal Accounting Officer and Treasurer Caroline L. Kraus, Secretary | |
| GOLDMAN SACHS & CO. LLC Distributor and Transfer Agent |
GOLDMAN SACHS ASSET MANAGEMENT, L.P. Investment Adviser | |
Visit our web site at www.GSAMFUNDS.com to obtain the most recent month-end returns.
Goldman Sachs Asset Management, L.P., 200 West Street, New York, New York 10282
The reports concerning the Fund included in this shareholder report may contain certain forward-looking statements about the factors that may affect the performance of the Fund in the future. These statements are based on Fund management’s predictions and expectations concerning certain future events and their expected impact on the Fund, such as performance of the economy as a whole and of specific industry sectors, changes in the levels of interest rates, the impact of developing world events, and other factors that may influence the future performance of the Fund. Management believes these forward-looking statements to be reasonable, although they are inherently uncertain and difficult to predict. Actual events may cause adjustments in portfolio management strategies from those currently expected to be employed.
A description of the policies and procedures that the Fund uses to determine how to vote proxies relating to portfolio securities and information regarding how the Fund voted proxies relating to portfolio securities during the most recent 12-month period ended June 30 is available (i) without charge, upon request by calling 1-800-621-2550 (for Institutional Shareholders); and (ii) on the Securities and Exchange Commission (“SEC”) web site at http://www.sec.gov.
The website links provided are for your convenience only and are not an endorsement or recommendation by GSAM of any of these websites or the products or services offered. GSAM is not responsible for the accuracy and validity of the content of these websites.
The Fund will file portfolio holdings information for each month in a fiscal quarter within 60 days after the end of the relevant fiscal quarter on Form N-PORT. Portfolio holdings information for the third month of each fiscal quarter will be made available on the SEC’s web site at http://www.sec.gov. Portfolio holdings information may be obtained upon request and without charge by calling 1-800-621-2550 (for Institutional Shareholders).
Fund holdings and allocations shown are as of August 31, 2022 and may not be representative of future investments. Fund holdings should not be relied on in making investment decisions and should not be construed as research or investment advice regarding particular securities. Current and future holdings are subject to risk.
Economic and market forecasts presented herein reflect our judgment as of the date of this presentation and are subject to change without notice. These forecasts do not take into account the specific investment objectives, restrictions, tax and financial situation or other needs of any specific client. Actual data will vary and may not be reflected here. These forecasts are subject to high levels of uncertainty that may affect actual performance. Accordingly, these forecasts should be viewed as merely representative of a broad range of possible outcomes. These forecasts are estimated, based on assumptions, and are subject to significant revision and may change materially as economic and market conditions change. Goldman Sachs has no obligation to provide updates or changes to these forecasts. Case studies and examples are for illustrative purposes only.
Diversification does not protect an investor from market risk and does not ensure a profit.
This material is not authorized for distribution to prospective investors unless preceded or accompanied by a current Prospectus or summary prospectus, if applicable. Investors should consider the Fund’s objective, risks, and charges and expenses, and read the summary prospectus, if available, and/or the Prospectus carefully before investing or sending money. The summary prospectus, if available, and the Prospectus contain this and other information about the Fund and may be obtained from your authorized dealer or from Goldman Sachs & Co. LLC by calling 1-800-621-2550.
© 2022 Goldman Sachs. All rights reserved. 295267-OTU-10/2022 ALLOCATEAR-22
| ITEM 2. | CODE OF ETHICS. |
(a) As of the end of the period covered by this report, the registrant has adopted a code of ethics that applies to the registrant’s principal executive officer, principal financial officer, principal accounting officer or controller, or persons performing similar functions, regardless of whether these individuals are employed by the registrant or a third party (the “Code of Ethics”).
(b) Not applicable.
(c) During the period covered by this report, no amendments were made to the provisions of the Code of Ethics.
(d) During the period covered by this report, the registrant did not grant any waivers, including an implicit waiver, from any provision of the Code of Ethics.
(e) Not applicable.
(f) A copy of the Code of Ethics is available as provided in Item 13(a)(1) of this report.
| ITEM 3. | AUDIT COMMITTEE FINANCIAL EXPERT. |
The registrant’s board of trustees has determined that the registrant has at least one “audit committee financial expert” (as defined in Item 3 of Form N-CSR) serving on its audit committee. Gregory G. Weaver is the “audit committee financial expert” and is “independent” (as each term is defined in Item 3 of Form N-CSR).
| ITEM 4. | PRINCIPAL ACCOUNTANT FEES AND SERVICES. |
Table 1 — Items 4(a) - 4(d). The accountant fees below reflect the aggregate fees billed by all of the Funds of the Goldman Sachs Trust and includes the Goldman Sachs Funds to which this certified shareholder report relates.
| 2022 | 2021 | Description of Services Rendered | ||||||||||
|
|
|
|
|
| ||||||||
| Audit Fees: |
||||||||||||
| • PricewaterhouseCoopers LLP (“PwC”) |
3,874,745 | $ | 3,038,544 | Financial Statement audits. | ||||||||
| Audit-Related Fees: |
||||||||||||
| • PwC |
438,000 | $ | 571,408 | Other attest services. | ||||||||
| Tax Fees: |
||||||||||||
| • PwC |
0 | $ | 0 | Tax compliance services provided in connection with the preparation and review of registrant’s tax returns and certain other tax-related services. | ||||||||
Table 2 — Items 4(b)(c) & (d). Non-Audit Services to the Goldman Sachs Trust’s service affiliates* that were pre-approved by the Audit Committee of the Goldman Sachs Trust pursuant to Rule 2-01(c)(7)(ii) of Regulation S-X.
| 2022 | 2021 | Description of Services Rendered | ||||||||||
|
|
|
|
|
| ||||||||
| Audit-Related Fees: |
||||||||||||
| • PwC |
$ | 1,906,448 | $ | 1,906,448 | Internal control review performed in accordance with Statement on Standards for Attestation Engagements No. 16 and semi-annual updates related to withholding tax accrual for non-US jurisdictions. These fees are borne by the Funds’ Adviser. | |||||||
| * | These include the advisor (excluding sub-advisors) and any entity controlling, controlled by or under common control with the advisor that provides ongoing services to the registrant (hereinafter referred to as “service affiliates”). |
Item 4(e)(1) — Audit Committee Pre-Approval Policies and Procedures
Pre-Approval of Audit and Non-Audit Services Provided to the Funds of the Goldman Sachs Trust. The Audit and Non-Audit Services Pre-Approval Policy (the “Policy”) adopted by the Audit Committee of Goldman Sachs Trust (“GST”) sets forth the procedures and the conditions pursuant to which services performed by an independent auditor for GST may be pre-approved. Services may be pre-approved specifically by the Audit Committee as a whole or, in certain circumstances, by the Audit Committee Chairman or the person designated as the Audit Committee Financial Expert. In addition, subject to specified cost limitations, certain services may be pre-approved under the provisions of the Policy. The Policy provides that the Audit Committee will consider whether the services provided by an independent auditor are consistent with the Securities and Exchange Commission’s rules on auditor independence. The Policy provides for periodic review and pre-approval by the Audit Committee of the services that may be provided by the independent auditor.
De Minimis Waiver. The pre-approval requirements of the Policy may be waived with respect to the provision of non-audit services that are permissible for an independent auditor to perform, provided (1) the aggregate amount of all such services provided constitutes no more than five percent of the total amount of revenues subject to pre-approval that was paid to the independent auditors during the fiscal year in which the services are provided; (2) such services were not recognized by GST at the time of the engagement to be non-audit services; and (3) such services are promptly brought to the attention of the Audit Committee and approved prior to the completion of the audit by the Audit Committee or by one or more members of the Audit Committee to whom authority to grant such approvals has been delegated by the Audit Committee, pursuant to the pre-approval provisions of the Policy.
Pre-Approval of Non-Audit Services Provided to GST’s Investment Advisers. The Policy provides that, in addition to requiring pre-approval of audit and non-audit services provided to GST, the Audit Committee will pre-approve those non-audit services provided to GST’s investment advisers (and entities controlling, controlled by or under common control with the investment advisers that provide ongoing services to GST) where the engagement relates directly to the operations or financial reporting of GST.
Item 4(e)(2) – 0% of the audit-related fees, tax fees and other fees listed in Table 1 were approved by GST’s Audit Committee pursuant to the “de minimis” exception of Rule 2-01(c)(7)(i)(C) of Regulation S-X. In addition, 0% of the non-audit services to the GST’s service affiliates 438,000 listed in Table 2 were approved by GST’s Audit Committee pursuant to the “de minimis” exception of Rule 2-0114.4 (c)(7)(i)(C) of Regulation S-X.
Item 4(f) – Not applicable.
Item 4(g) Aggregate Non-Audit Fees Disclosure
The aggregate non-audit fees billed to GST by PwC for the twelve months ended August 31, 2022 and August 31, 2021 were approximately $438,000 and $571,408, respectively. The aggregate non-audit fees billed to GST’s adviser and service affiliates by PwC for non-audit services for the twelve months ended December 31, 2021 and December 31, 2020 were approximately $14.4 million and $14.5 million, respectively. With regard to the aggregate non-audit fees billed to GST’s adviser and service affiliates, the 2021 and 2020 amounts include fees for non-audit services required to be pre-approved [see Table 2] and fees for non-audit services that did not require pre-approval since they did not directly relate to GST’s operations or financial reporting.
Item 4(h) — GST’s Audit Committee has considered whether the provision of non-audit services to GST’s investment adviser and service affiliates that did not require pre-approval pursuant to paragraph (c)(7)(ii) of Rule 2-01 of Regulation S-X is compatible with maintaining the auditors’ independence.
| ITEM 5. | AUDIT COMMITTEE OF LISTED REGISTRANTS. |
| Not applicable. |
| ITEM 6. | SCHEDULE OF INVESTMENTS. |
| Schedule of Investments is included as part of the Report to Shareholders filed under Item 1. |
| ITEM 7. | DISCLOSURE OF PROXY VOTING POLICIES AND PROCEDURES FOR CLOSED-END MANAGEMENT INVESTMENT COMPANIES. |
| Not applicable. |
| ITEM 8. | PORTFOLIO MANAGERS OF CLOSED-END MANAGEMENT INVESTMENT COMPANIES. |
| Not applicable. |
| ITEM 9. | PURCHASES OF EQUITY SECURITIES BY CLOSED-END MANAGEMENT INVESTMENT COMPANY AND AFFILIATED PURCHASERS. |
| Not applicable. |
| ITEM 10. | SUBMISSION OF MATTERS TO A VOTE OF SECURITY HOLDERS. |
| There have been no material changes to the procedures by which shareholders may recommend nominees to the registrant’s board of trustees. |
| ITEM 11. | CONTROLS AND PROCEDURES. |
| (a) | The registrant’s principal executive and principal financial officers, or persons performing similar functions have concluded that the registrant’s disclosure controls and procedures (as defined in Rule 30a-3(c) under the Investment Company Act of 1940, as amended (the “1940 Act”)) are effective as of a date within 90 days of the filing of this report that includes the disclosure required by this paragraph, based on the evaluation of these controls and procedures required by Rule 30a-3(b) under the 1940 Act and 15d-15(b) under the Securities Exchange Act of 1934, as amended. |
| (b) | There were no changes in the registrant’s internal control over financial reporting (as defined in Rule 30a-3(d) under the 1940 Act) that occurred during the period covered by this report that have materially affected, or are reasonably likely to materially affect, the registrant’s internal control over financial reporting. |
| ITEM 12. | DISCLOSURE OF SECURITIES LENDING ACTIVITIES FOR CLOSED-END MANAGEMENT INVESTMENT COMPANIES. |
| Not applicable. |
| ITEM 13. | EXHIBITS. |
| (a)(1) | Goldman Sachs Trust’s Code of Ethics for Principal Executive and Senior Financial Officers is incorporated by reference to Exhibit 13(a)(1) of the registrant’s Form N-CSR filed on August 26, 2022. | |||
| (a)(2) | Exhibit 99.CERT | Certifications pursuant to Section 302 of the Sarbanes-Oxley Act of 2002 filed herewith. | ||
| (a)(3) | Not applicable to open-end investment companies. | |||
| (a)(4) | There was no change in the registrant’s independent public accountant for the period covered by this report. | |||
| (b) | Exhibit 99.906CERT | Certifications pursuant to Section 906 of the Sarbanes-Oxley Act of 2002 filed herewith. | ||
SIGNATURES
Pursuant to the requirements of the Securities Exchange Act of 1934 and the Investment Company Act of 1940, the registrant has duly caused this report to be signed on its behalf by the undersigned, thereunto duly authorized.
| Goldman Sachs Trust | ||
| By: | /s/ James A. McNamara | |
|
| ||
|
James A. McNamara | ||
| President/Chief Executive Officer | ||
| Goldman Sachs Trust | ||
| Date: | November 3, 2022 | |
Pursuant to the requirements of the Securities Exchange Act of 1934 and the Investment Company Act of 1940, this report has been signed below by the following persons on behalf of the registrant and in the capacities and on the dates indicated.
| By: | /s/ James A. McNamara | |
|
| ||
|
James A. McNamara | ||
| President/Chief Executive Officer | ||
| Goldman Sachs Trust | ||
| Date: | November 3, 2022 | |
| By: | /s/ Joseph F. DiMaria | |
|
| ||
|
Joseph F. DiMaria | ||
| Principal Financial Officer | ||
| Goldman Sachs Trust | ||
| Date: | November 3, 2022 | |