UNITED STATES
SECURITIES AND EXCHANGE COMMISSION
Washington, D.C. 20549
___________________________________________________________________________________________________________
FORM 10-K
ý | ANNUAL REPORT PURSUANT TO SECTION 13 OR 15(d) OF THE SECURITIES EXCHANGE ACT OF 1934 | |
For the fiscal year ended December 31, 2015 | ||
OR | ||
o | TRANSITION REPORT PURSUANT TO SECTION 13 OR 15(d) OF THE SECURITIES EXCHANGE ACT OF 1934 | |
For the transition period from to . | ||
COMMISSION FILE NO. 001-34223
___________________________________________________________________________________________________________
CLEAN HARBORS, INC.
(Exact name of registrant as specified in its charter)
___________________________________________________________________________________________________________
Massachusetts (State or other jurisdiction of incorporation or organization) | 04-2997780 (IRS Employer Identification No.) | |
42 Longwater Drive, Norwell, MA (Address of principal executive offices) | 02061-9149 (Zip Code) | |
Registrant's telephone number: (781) 792-5000 | ||
Securities registered pursuant to Section 12(b) of the Securities Exchange Act of 1934:
Title of each class: | Name of each exchange on which registered: | |
Common Stock, $.01 par value | New York Stock Exchange | |
Securities registered pursuant to Section 12(g) of the Securities Exchange Act of 1934:
None
Indicate by check mark if the registrant is a well-known seasoned issuer, as defined in Rule 405 of the Securities Act. Yes ý No o
Indicate by check mark if the registrant is not required to file reports pursuant to Section 13 or Section 15(d) of the Exchange Act. Yes o No ý
Indicate by check mark whether the registrant (1) has filed all reports required to be filed by Section 13 or 15(d) of the Securities Exchange Act of 1934 during the preceding twelve months (or for such shorter period that the registrant was required to file such reports) and (2) has been subject to such filing requirements for the past 90 days. Yes ý No o
Indicate by check mark whether the registrant has submitted electronically and posted on its corporate Web site, if any, every Interactive Data File required to be submitted and posted pursuant to Rule 405 of Regulation S-T during the preceding 12 months (or for such shorter period that the registrant was required to submit and post such files). Yes ý No o
Indicate by check mark if disclosure of delinquent filers pursuant to Item 405 of Regulation S-K is not contained herein, and will not be contained, to the best of the registrant's knowledge, in definitive proxy or information statements incorporated by reference in Part III of this Form 10-K or any amendment to this Form 10-K. ý
Indicate by check mark whether the registrant is a large accelerated filer, an accelerated filer, a non-accelerated filer, or a smaller reporting company. See the definitions of "large accelerated filer," "accelerated filer" and "smaller reporting company" in Rule 12b-2 of the Exchange Act. (Check one):
Large accelerated filer ý | Accelerated filer o | Non-accelerated filer o (Do not check if a smaller reporting company) | Smaller reporting company o | |||
Indicate by check mark whether the registrant is a shell company (as defined in Rule 12b-2 of the Exchange Act). Yes o No ý
On June 30, 2015 (the last business day of the registrant's most recently completed second fiscal quarter), the aggregate market value of the voting and non-voting common stock of the registrant held by non-affiliates of the registrant was approximately $2.9 billion, based on the closing price of such common stock as of that date on the New York Stock Exchange. Reference is made to Part III of this report for the assumptions on which this calculation is based.
On February 19, 2016, there were outstanding 57,604,283 shares of Common Stock, $.01 par value.
DOCUMENTS INCORPORATED BY REFERENCE
Certain portions of the registrant's definitive proxy statement for its 2016 annual meeting of stockholders (which will be filed with the Commission not later than April 30, 2016) are incorporated by reference into Part III of this report.
CLEAN HARBORS, INC.
ANNUAL REPORT ON FORM 10-K
YEAR ENDED DECEMBER 31, 2015
TABLE OF CONTENTS
Page No | ||
Disclosure Regarding Forward-Looking Statements
In addition to historical information, this annual report contains forward-looking statements, which are generally identifiable by use of the words "believes," "expects," "intends," "anticipates," "plans to," "estimates," "projects," or similar expressions. These forward-looking statements are subject to certain risks and uncertainties that could cause actual results to differ materially from those reflected in these forward-looking statements. Factors that might cause such a difference include, but are not limited to, those discussed in this report under Item 1A, "Risk Factors," and Item 7, "Management's Discussion and Analysis on Financial Condition and Results of Operations." Readers are cautioned not to place undue reliance on these forward-looking statements, which reflect management's opinions only as of the date hereof. We undertake no obligation to revise or publicly release the results of any revision to these forward-looking statements. Readers should also carefully review the risk factors described in other documents which we file from time to time with the Securities and Exchange Commission (the "SEC"), including the quarterly reports on Form 10-Q to be filed by us during 2016.
PART I
ITEM 1. BUSINESS
General
Clean Harbors, Inc. and its subsidiaries (collectively, "we," "Clean Harbors" or the "Company") is a leading provider of environmental, energy and industrial services throughout North America.
Our operations are managed in six reportable segments: Technical Services, Industrial and Field Services which consists of the Industrial Services and Field Services operating segments, Kleen Performance Products, SK Environmental Services, Lodging Services and Oil and Gas Field Services.
• | Technical Services — provides a broad range of hazardous material management services including the packaging, collection, transportation, treatment and disposal of hazardous and non-hazardous waste at our incineration, landfill, wastewater and other treatment facilities. |
• | Industrial and Field Services — provides industrial and specialty services such as high-pressure and chemical cleaning, catalyst handling, decoking and material processing to refineries, chemical plants, oil sands facilities, pulp and paper mills, and other industrial facilities. Also provides a wide variety of environmental cleanup services on customer sites or other locations on a scheduled or emergency response basis including tank cleaning, decontamination, remediation, and spill cleanup. |
• | Kleen Performance Products (formerly Oil Re-refining and Recycling) — processes used oil into high quality base and blended lubricating oils which are then sold to third party customers, and provides recycling of oil in excess of our current re-refining capacity into recycled fuel oil which is then sold to third parties. Processing into base and blended lubricating oils takes place in our three owned and operated re-refineries and recycling of oil into recycled fuel oil takes place in one of our used oil terminals. |
• | SK Environmental Services — consists of Safety-Kleen's branches and provides a broad range of environmental services such as parts cleaning, containerized waste services, used oil collection, and other complementary products and services, including vacuum services, allied products and other environmental services. |
• | Lodging Services — provides lodges and remote workforce accommodation facilities throughout Western Canada. These include both client and open lodges, operator camps, and drill camps. Also included within the segment are manufacturing of modular units and wastewater processing plants, operating services and parts. |
• | Oil and Gas Field Services — provides fluid handling, fluid hauling, production servicing, surface rentals, seismic services, and directional boring services to the energy sector serving oil and gas exploration and production, and power generation. |
Clean Harbors, Inc. was incorporated in Massachusetts in 1980 and our principal office is located in Norwell, Massachusetts. We maintain a website at the following Internet address: http://www.cleanharbors.com. Through a link on this website to the SEC website, http://www.sec.gov, we provide free access to our annual reports on Form 10-K, quarterly reports on Form 10-Q, current reports on Form 8-K and amendments to those reports filed or furnished pursuant to Section 13(a) or 15(d) of the Securities Exchange Act of 1934 as soon as reasonably practicable after electronic filing with the SEC. Our guidelines on corporate governance, the charters for our board committees, and our code of ethics for members of the board of directors, our chief executive officer and our other senior officers are also available on our website, and we will post on our
1
website any waivers of, or amendments to, such code of ethics. Our website and the information contained therein or connected thereto are not incorporated by reference into this annual report.
Health and Safety
Health and Safety is our #1 priority—companywide. Employees at all levels of our Company share this philosophy and are committed to ensuring our safety goals are met. Our commitment to health and safety benefits everyone—our employees, our customers, the community, and the environment. In 2015 we continued with our very successful Safety Starts With Me: Live It 3-6-5 program which is a key component in our overall safety program and along with our many other programs has continued to lower our Total Recordable Incident Rate, or "TRIR;" Days Away, Restricted Activity and Transfer Rate, or "DART;" and Experience Modification Rate, or "EMR." For the year ended December 31, 2015, our Company wide TRIR, DART and EMR were 1.33, 0.83 and 0.54, respectively. For the year ended December 31, 2014, our Company wide TRIR, DART and EMR were 1.57, 1.01 and 0.54, respectively.
In order to protect our employees, continue to lower our incident rates, and satisfy our customers' demands to retain the best service providers with the lowest TRIR, DART and EMR rates, we are fully committed to continuously improving our health and safety performance. All employees recognize the importance of protecting themselves, their fellow employees, their customers, and all those around them from harm. This commitment is supported by the philosophies and Golden Rules of Safety that is the cornerstone of the Safety Starts with Me: Live It 3-6-5 program. Live It 3-6-5 is our dedication to the safety of our workers through each and every employee’s commitment to our three Safety philosophies, our six Golden Rules of Safety and each employee’s five personal reasons why they choose to be safe both at work, on the road and at home.
Compliance
We regard compliance with applicable environmental regulations as a critical component of our overall operations. We strive to maintain the highest professional standards in our compliance activities. Our internal operating requirements are in many instances more stringent than those imposed by regulation. Our compliance program has been developed for each of our waste management facilities and service centers under the direction of our compliance staff. The compliance staff is responsible for facilities permitting and regulatory compliance, compliance training, transportation compliance, and related record keeping. To ensure the effectiveness of our regulatory compliance program, our compliance staff monitors daily operational activities. We also have an Environmental Health and Safety Compliance Internal Audit Program designed to identify any weaknesses or opportunities for improvement in our ongoing compliance programs. We also perform periodic audits and inspections of the disposal facilities owned by other companies which we utilize.
Our facilities are frequently inspected and audited by regulatory agencies, as well as by customers. Although our facilities have been cited on occasion for regulatory violations, we believe that each of our facilities is currently in substantial compliance with applicable permit requirements.
Strategy
Our strategy is to develop and maintain ongoing relationships with a diversified group of customers that have recurring needs for environmental, energy or industrial services. We strive to be recognized as the premier supplier of a broad range of value-added services based upon quality, responsiveness, customer service, information technologies, breadth of service offerings and cost effectiveness.
The principal elements of our business strategy are to:
• | Expand Service Offerings and Geographic Coverage—We believe our Technical, Industrial and Field Services, and SK Environmental segments have a competitive advantage, particularly in areas where we maintain service locations at or near a treatment, storage and disposal facility, or "TSDF." By opening additional service locations in close proximity to our TSDFs, we believe that we can, with minimal capital expenditures, increase our market share within the Industrial and Field Services segment. We believe this will drive additional waste to our existing facilities, thereby increasing utilization and enhancing overall profitability. |
• | Cross-Sell Across Segments—We believe the breadth of our service offerings allows us to provide additional services to existing customers. In particular, we believe we can provide industrial and field services to customers that traditionally have only used our technical services and technical services to customers that use our industrial services or oil and gas field services. At the same time, we see a variety of cross-selling opportunities between our Technical, Industrial and Field Services offerings and SK Environmental Services’ 200,000 customers. Evidencing this strategy, we have been successfully cross selling the services of Safety-Kleen, Inc. ("Safety-Kleen"), since our acquisition of Safety-Kleen in December 2012, such as parts washers, Allied products and recycling services, to legacy Clean |
2
Harbors customers. We believe leveraging our ability to cross-sell across all of our segments will drive additional revenue for our Company.
• | Capture Large-Scale Projects—We provide turnkey offsite transportation and landfill or incineration disposal services for soil and other contaminated media generated from remediation activities. We also assist remediation contractors and project managers with support services including groundwater disposal, investigation derived waste disposal, rolloff container management, and many other related services. We believe this will drive incremental waste volume to our existing facilities, thereby increasing utilization and enhancing overall profitability. |
• | Expand Throughput Capacity of Existing Waste Facilities—We operate an extensive network of hazardous waste management facilities and have made substantial investments in these facilities, which provide us with significant operating leverage as volumes increase. In addition, there are opportunities to expand waste handling capacity at these facilities by modifying the terms of the existing permits and by adding equipment and new technology. Through selected permit modifications, we can expand the range of treatment services offered to our customers without the large capital investment necessary to acquire or build new waste management facilities. |
• | Pursue Selective Acquisitions—We actively pursue accretive acquisitions in certain services or market sectors where we believe the acquisitions can enhance and expand our business, such as the oil collection and refinery markets. We believe that we can expand existing services, especially in our non-disposal services, through strategic acquisitions in order to generate incremental revenues from existing and new customers and to obtain greater market share. |
• | Execute Strategic Mergers and Divestitures—To complement our acquisition strategy and our focus on internal growth, we regularly review and evaluate our existing operations to determine whether our business model should change through the merger or divestiture of certain businesses. Accordingly, from time to time, we may merge or divest certain non-core businesses and reallocate our resources to businesses that better align with our long-term strategic direction. |
• | Focus on Cost, Pricing and Productivity Initiatives—We continually seek to increase efficiency and to reduce costs in our business through enhanced technology, process efficiencies and stringent expense management. For instance, in 2014, we successfully executed a significant cost reduction program that included headcount reductions, branch consolidations, reduction in third-party rentals, greater internalization of maintenance costs, procurement and supply chain improvements and lowering reliance on outside transportation. |
Acquisitions and Other Business Transactions
Acquisitions are an element of our business strategy that involves expansion through the acquisition of businesses that complement our existing company and create multiple opportunities for profitable growth.
On February 3, 2016, we purchased a re-refinery facility located in Nevada from Vertex Energy, Inc. for a purchase price of $35.0 million in cash, subject to customary post-closing adjustments. The acquired re-refinery facility further expands our re-refinery network within our Kleen Performance Products segment.
On April 11, 2015, we acquired Thermo Fluids Inc. (“TFI”) for approximately $78.6 million inclusive of current estimates of and subject to certain closing and post-closing adjustments relating to working capital and other assumed liabilities. TFI provides environmental services, including used oil recycling, used oil filter recycling, antifreeze products, parts washers and solvent recycling, and industrial waste management services, including vacuum services, remediation, lab pack and hazardous waste management. The acquisition expands our environmental services customer base while also complimenting the SK Environmental Services network and presence in the western United States.
In December 2015, we acquired certain assets and assumed certain defined liabilities of a privately owned company for approximately $14.7 million in cash. That Company specialized in the collection and recycling of used oil filters and was a service provider to the SK Environmental Services segment prior to the acquisition. The acquired company has been integrated into the SK Environmental Services segment.
In 2014, we acquired the assets of two privately owned companies for approximately $16.1 million in cash, net of cash acquired. The purchase price is subject to customary post-closing adjustments based upon finalized working capital amounts. The acquired companies have been integrated into the Technical Services and Lodging Services segments.
On September 13, 2013, we acquired all of the outstanding shares of Evergreen Oil, Inc. (“Evergreen”) for approximately $56.3 million in cash, net of cash acquired. Evergreen, headquartered in Irvine, California, specializes in the recovery and re-refining of used oil. Evergreen owns and operates an oil re-refining operation in the western United States and also offers other ancillary environmental services, including parts cleaning and containerized waste services, vacuum services and hazardous waste management services. The acquisition of Evergreen enables us to further penetrate the small quantity waste generator
3
market and further expand its oil re-refining, oil recycling and waste treatment capabilities. Financial information and results of Evergreen have been recorded in our consolidated financial statements since acquisition and are primarily included in the Kleen Performance Products segment.
For additional information relating to our acquisition activities during fiscal years 2015, 2014 and 2013, see Note 3, "Business Combinations," to our consolidated financial statements included in Item 8 of this report.
Other business transactions may consist of mergers or divestitures and is another element of our business strategy that involves review of our portfolio of assets to determine the extent to which they are contributing to our objectives and growth strategy.
We have announced a planned carve-out of our Oil and Gas Field Services and Lodging Services segments into a standalone public company. Ultimate completion of the planned transaction is subject to certain conditions including, but not limited to, market conditions, determination of the most advantageous structure from a financial and tax standpoint, overall costs to our Company, receipt of regulatory approvals, compliance with our debt covenants, the effectiveness of securities laws filings and final approval by our board of directors. There can be no assurance regarding the ultimate structure and timing of the proposed transaction or whether the transaction will be completed.
Protecting the Environment and Corporate Sustainability
Our core business is to provide industry, government and the public a wide range of environmental, energy and industrial services that protect and restore North America's natural environment.
As North America's premier provider of environmental as well as energy and industrial services, our first goal is to help our customers prevent the release of hazardous wastes into the environment. We also are the leading service provider in the recovery and decontamination of pollutants that have been released to the environment. This includes the safe destruction or disposal of hazardous materials in a manner that ensures these materials are no longer a danger to the environment. When providing these services, we are committed to the recycling, reuse and reclamation of these wastes whenever possible using a variety of methods more fully explained below in the sections describing our general operations. Our Safety-Kleen branded services exemplify our commitment to sustainability and providing environmental solutions to the marketplace. Where possible, liquids such as solvents, chemicals and used oil are recycled to our high-quality standards and made into useful products. Tolling programs provide a closed-loop cycle in which the customer’s spent solvents are recycled to their precise specifications and returned directly to them.
We have become the leading North American provider of services to protect the ozone layer from the destructive effects of chlorofluorocarbons, or "CFCs," which are ozone layer depleting substances and global warming compounds that have global warming potentials up to 10,000 times more powerful than carbon dioxide. Global-warming potential is a relative measure of how much heat a green house gas traps in the atmosphere.
Since 2013, California Air Resources Board has issued over 7,000,000 emission reduction credits that were generated by destroying CFC’s at Clean Harbors’ El Dorado Arkansas incinerator. Over 7,000,000 metric tons of carbon dioxide emissions were avoided by destroying these greenhouse gases. That is equivalent to removing over 1,473,684 passenger vehicles from the road for one year .
One of our most highly visible public programs for various governmental and community entities involves the removal of thousands of tons of hazardous wastes, from households throughout the United States and Canada, that might otherwise be improperly disposed of or become dangerous to the communities where they are stored.
As we provide these wide-ranging services throughout North America, we are committed to ensuring that our own operations are environmentally responsible. Our sustainability efforts are guided by a formal policy, strategy and plan and we continue to build on our past efforts, such as implementing numerous energy efficiency improvements and various transportation initiatives. Our 1.5 Mw solar array at a closed and capped landfill in New Jersey continues to provide virtually all of the power for the ongoing operation of the onsite ground water decontamination pump and treatment system.
Competitive Strengths
• | Leading Provider of Environmental, Energy and Industrial Services—We are one of the largest providers of environmental, energy and industrial services and the largest operator of non-nuclear hazardous waste treatment facilities in North America. We provide multi-faceted and low cost services to a broad mix of customers. We attract and better serve our customers because of our capabilities and the size, scale and geographic location of our assets, which allow us to serve multiple locations. Based on latest industry data, we service approximately 65% of North America's commercial hazardous incineration volume and 24% of North America's hazardous landfill volume. |
4
• | Largest collector and recycler of used motor oil— As the largest re-refiner and recycler of used oil in the world, we returned approximately 160 million gallons of new re-refined oil, lubricants and byproducts back into the marketplace. In 2015, our re-refining process eliminated over one million metric tons of greenhouse gas ("GHG"), which is the equivalent of growing more than 32 million trees for 10 years in an urban environment, or taking over 200,000 passenger cars off the road for one year. |
• | Large and Diversified Customer Base—Our customers range from Fortune 500 companies to midsize and small public and private entities that span multiple industries and business types, including governmental entities. This diversification limits our credit exposure to any one customer and potential cyclicality to any one industry. As a percentage of our 2015 revenues, the top ten industries we serviced totaled approximately 71% and included government (13%), chemical (12%), refineries and oil sands (11%), general manufacturing (9%), automotive (6%), base oil, blenders and packagers (6%), utilities (4%), oil gas production (4%), oil gas exploration (3%) and energy and consulting (3%). |
• | Stable and Recurring Revenue Base—We have long-standing relationships with our customers. Our diversified customer base also provides stable and recurring revenues as a majority of our revenues are derived from previously served customers with recurring needs for our services. In addition, switching costs for many of our customers are high. This is due to many customers' desire to audit disposal facilities prior to their qualification as approved sites and to limit the number of facilities to which their hazardous wastes are shipped in order to reduce their potential liability under United States and Canadian environmental regulations. We have been selected as an approved vendor by large and small generators of waste because we possess comprehensive collection, recycling, treatment, transportation, disposal, and waste tracking capabilities and have the expertise necessary to comply with applicable environmental laws and regulations. Those customers that have selected us as an approved vendor typically continue to use our services on a recurring basis. |
• | Comprehensive Service Capabilities—Our comprehensive service offerings allow us to act as a full-service provider to our customers. Our full-service orientation creates incremental revenue growth as customers seek to minimize the number of outside vendors and demand "one-stop shop" service providers. |
• | Integrated Network of Assets—We believe we operate, in the aggregate, the largest number of hazardous waste incinerators, landfills, treatment facilities and TSDFs in North America. Our broad service network enables us to effectively handle a waste stream from origin through disposal and to efficiently direct and internalize our waste streams to reduce costs. As our processing of wastes increases, our size allows us to increase our profit margins as we can internalize a greater volume of waste in our incinerators, landfills and other disposal facilities. |
• | Regulatory Compliance—We continue to make capital investments in our facilities to ensure that they are in compliance with current federal, state, provincial and local regulations. Companies that rely on in-house disposal may find the current regulatory requirements to be too capital intensive or complicated, and may choose to outsource many of their hazardous waste disposal needs. |
• | Effective Cost Management—Our significant scale allows us to maintain low costs through standardized compliance procedures, significant purchasing power, research and development capabilities and our ability to efficiently utilize logistics and transportation to economically direct waste streams to the most efficient facility. We also have the ability to transport and process with internal resources the substantial majority of all hazardous waste that we manage for our customers. |
• | Proven and Experienced Management Team—Our executive management team provides depth and continuity. Our 13 executive officers collectively have approximately 252 years of experience in the environmental, energy and industrial services industries. Our chief executive officer founded our Company in 1980, and the average experience of the 12 other members of the executive management team is approximately 18 years. |
Operations
General
Seasonality and Cyclical Nature of Business. Our operations may be affected by seasonal fluctuations due to weather and budgetary cycles influencing the timing of customers' spending for remedial activities. Typically during the first quarter of each year there is less demand for environmental services due to the cold weather, particularly in the Northern and Midwestern United States and Canada. Accordingly, reduced volumes of waste are received at our facilities and higher operating costs are associated with operating in sub-freezing weather and high levels of snowfall. In addition, factory closings for the year-end holidays reduce the volume of industrial waste generated, which results in lower volumes of waste handled by us during the first quarter of the following year. In addition, our oil collection and recycling business may be affected by seasonal fluctuations due to weather cycles influencing the timing of customers' need for products and services. Typically during the first
5
quarter of each year there is less demand for our products and services due to the lower levels of activities by our customers as a result of the cold weather, particularly in the Northern and Midwestern regions of the United States and in Canada. This lower level of activity also results in lower volumes of used oil generated for collection by us in the first quarter.
Conversely, typically during the first quarter of each year there is more demand for our Industrial and Field Services and Oil and Gas Field Services segments due to the cold weather, particularly in Alberta, Canada, and less demand during the warmer months. The main reason for this is that the areas we service in Alberta are easier to access when the cold conditions make the terrain more suitable for companies to deploy their equipment. During the warmer months, thawing and muddy conditions may impede deployment of equipment.
Geographical Information. For the year ended December 31, 2015, we generated $2,576.2 million or 78.7% of our revenues in the United States and Puerto Rico, $695.0 million or 21.2% of revenues in Canada, and less than 1% of revenues in other international locations. For the year ended December 31, 2014, we generated $2,414.6 million or 71.0% of our revenues in the United States and Puerto Rico, $982.1 million or 28.9% of revenues in Canada, and less than 1% of revenues in other international locations. For additional information about the geographical areas from which our revenues are derived and in which our assets are located, see Note 17, "Segment Reporting," to our consolidated financial statements included in Item 8 of this report.
Technical Services
These services involve the collection, transportation, treatment and disposal of hazardous and non-hazardous wastes, and include resource recovery, physical treatment, fuels blending, incineration, landfill disposal, wastewater treatment, lab chemical disposal, explosives management, and CleanPack® services. Our CleanPack services include the collection, identification and categorization, specialized packaging, transportation and disposal of laboratory chemicals and household hazardous wastes. Our technical services are provided through a network of service centers from which a fleet of trucks are dispatched to pick up customers' wastes either on a predetermined schedule or on-demand, and to deliver the wastes to permitted facilities, which are usually Company-owned. Our service centers also can dispatch chemists to a customer location for the collection of chemical and laboratory waste for disposal.
Collection, Transportation and Logistics Management. As an integral part of our services, we collect industrial wastes from customers and transport such wastes to and between our facilities for treatment or bulking for shipment to final disposal locations. Customers typically accumulate wastes in containers, such as 55-gallon drums, bulk storage tanks or 20-cubic-yard roll-off containers. In providing this service, we utilize a variety of specially designed and constructed tank trucks and semi-trailers as well as third-party transporters, including railroads.
Treatment and Disposal. We recycle, treat and dispose of hazardous and non-hazardous industrial wastes. The wastes handled include substances which are classified as "hazardous" because of their corrosive, ignitable, infectious, reactive or toxic properties, and other substances subject to federal, state and provincial environmental regulation. We provide final treatment and disposal services designed to manage wastes which cannot be otherwise economically recycled or reused. The wastes we handle come in solid, sludge, liquid and gas form.
We operate a network of TSDFs that collect, temporarily store and/or consolidate compatible waste streams for more efficient transportation to final recycling, treatment or disposal destinations. These facilities hold special permits, such as Part B permits under the Resource Conservation and Recovery Act, or "RCRA," in the United States, which allow them to process waste through various technologies including recycling, incineration, and landfill and wastewater treatment.
Resource Recovery and Fuels Blending. We operate recycling systems for the reclamation and reuse of certain wastes, particularly solvent-based wastes generated by industrial cleaning operations, metal finishing and other manufacturing processes. Resource recovery involves the treatment of wastes using various methods, which effectively remove contaminants from the original material to restore its fitness for its intended purpose and to reduce the volume of waste requiring disposal.
We also operate a recycling facility that recycles refinery waste and spent catalyst. The recycled oil and recycled catalyst are sold to third parties.
Incineration. Incineration is the preferred method for the treatment of organic hazardous waste, because it effectively destroys the contaminants at high temperatures. High temperature incineration effectively eliminates organic wastes such as herbicides, halogenated solvents, pesticides, and pharmaceutical and refinery wastes, regardless of whether they are gases, liquids, sludge or solids. Federal and state incineration regulations require a destruction and removal efficiency of 99.99% for most organic wastes and 99.9999% for polychlorinated biphenyls, or "PCB," and dioxins.
As of December 31, 2015, we had eight active incinerators operating in five incineration facilities that offer a wide range of technological capabilities to customers through this network. In the United States, we operate a fluidized bed thermal
6
oxidation unit for maximum destruction efficiency of hazardous waste with an estimated annual capacity of 58,808 tons and three solids and liquids capable incineration facilities with a combined estimated annual capacity of 327,387 tons. We also operate one hazardous waste liquid injection incinerator in Canada with total annual capacity of 105,526 tons. Construction remains on schedule at our state-of-the-art hazardous waste incinerator at our El Dorado, Arkansas site. We expect this facility, the largest internal investment in Clean Harbors’ history, to become commercially operational by year’s end and to add approximately 70,000 tons of additional capacity.
Our incineration facilities in Kimball, Nebraska, Deer Park, Texas, El Dorado, Arkansas and Aragonite, Utah, are designed to process liquid organic wastes, sludge, solids, soil and debris. Our Deer Park facility has two kilns and a rotary reactor. Our El Dorado incineration facility specializes in the treatment of bulk and containerized hazardous liquids, solids and sludge through two rotary kilns. Our incineration facilities in Kimball and Deer Park have on-site landfills for the disposal of ash produced as a result of the incineration process.
Our incineration facilities in Lambton, Ontario are liquid injection incinerators, designed primarily for the destruction of liquid organic wastes. Typical waste streams include wastewater with low levels of organics and other higher concentration organic liquid wastes not amenable to conventional physical or chemical waste treatment.
Landfills. Landfills are primarily used for the disposal of inorganic wastes. In the United States and Canada, we operate nine commercial landfills. Seven of our commercial landfills are designed and permitted for the disposal of hazardous wastes and two of our landfills are operated for non-hazardous industrial waste disposal and, to a lesser extent, municipal solid waste. In addition to our commercial landfills, we also own and operate two non-commercial landfills that only accept waste from our on-site incinerators.
Of our seven commercial landfills used for disposal of hazardous waste, five are located in the United States and two are located in Canada. As of December 31, 2015, the useful economic lives of these landfills include approximately 24.9 million cubic yards of remaining capacity. This estimate of the useful economic lives of these landfills includes permitted airspace and unpermitted airspace that our management believes to be probable of being permitted based on our analysis of various factors. In addition to the capacity included in the useful economic lives of these landfills, there are approximately 31.9 million cubic yards of additional unpermitted airspace capacity included in the footprints of these landfills that may ultimately be permitted, although there can be no assurance that this unpermitted additional capacity will be permitted. In addition to the hazardous waste landfills, we operate two non-hazardous industrial landfills with 4.4 million cubic yards of remaining permitted capacity. These two facilities are located in the United States and have been issued operating permits under the authority of Subtitle D of RCRA. Our non-hazardous landfill facilities are permitted to accept commercial industrial waste, including wastes from foundries, demolition and construction, machine shops, automobile manufacturing, printing, metal fabrications and recycling.
Wastewater Treatment. We operate seven wastewater treatment facilities that offer a range of wastewater treatment technologies. These wastewater treatment operations involve processing hazardous and non-hazardous wastes through the use of physical and chemical treatment methods. These facilities treat a broad range of industrial liquid and semi-liquid wastes containing heavy metals, organics and suspended solids.
Industrial and Field Services
Industrial services include a wide range of industrial maintenance services and specialty industrial services provided at refineries, mines, upgraders, chemical plants, pulp and paper mills, manufacturing, and power generation facilities. We provide these services throughout North America, including a presence in the oil sands region in Alberta, Canada.
Our crews handle as-needed in-plant services to support ongoing in-plant cleaning and maintenance services, including liquid/dry vacuum, hydro-blasting, steam cleaning and chemical hauling. We provide a variety of specialized industrial services including plant outage and turnaround services, decoking and pigging, catalyst handling, chemical cleaning, high and ultra-high pressure water cleaning, and large tank and surface impoundment cleaning.
Field services provide customers with highly skilled experts who utilize specialty equipment and resources to perform services at any chosen location. Our field service crews and equipment are dispatched on a planned or emergency basis, and perform services such as confined space entry for tank cleaning, site decontamination, large remediation projects, demolition, spill cleanup, railcar cleaning, product recovery and transfer, scarifying and media blasting and vacuum services. Additional services include used oil and oil products recycling. Other services include filtration and water treatment services.
We are a leader in providing response services for environmental emergencies of any scale from man-made disasters, such as oil spills, and natural disasters such as hurricanes.
7
Kleen Performance Products
The used oil collected by the SK Environmental Services branch network is processed or re-refined to convert into a variety of products, mostly base lubricating oils, and much smaller quantities of asphalt-like material, glycols and fuels. As the largest re-refiner of used oil in the world, we process the used oil collected through our four re-refineries located in East Chicago, Indiana, Newark, California and Breslau, Ontario. Our recent acquisition on February 3, 2016 further expands our re-refinery network, with an additional facility located in Nevada. Our primary goal is to produce and sell high-quality blended oils, which are created by combining our re-refined base and other base oils with performance additives in accordance with our proprietary formulations and American Petroleum Institute licenses. Our Performance Plus brand, and our “green” proprietary brand, EcoPower, are sold to on and off-road corporate fleets, government entities, automotive service shops and industrial plants, which are serviced through our internal distribution network, as well as an extensive U.S. and Canada-wide independent distributor network. We also sell unbranded blended oils to distributors that resell them under their private label brands. The base oil we do not blend and sell ourselves is sold to independent blenders/packagers that use it to blend their own branded or private label oils. With more than 200 million gallons of used oil processed annually, we were able to return in 2015 approximately 160 million gallons of new re-refined oil, lubricants and byproducts back into the marketplace.
SK Environmental Services
Our Safety-Kleen service brand offers an array of environmental services and complementary products to a diverse range of customers including automobile repair shops, car and truck dealers, metal fabricators, machine manufacturers, fleet maintenance shops and other automotive, industrial and retail customers.
As the largest provider of parts cleaning services in North America, our Safety-Kleen operation offers a complete line of specially designed parts washers to customer locations and then delivers recurring service that includes machine cleaning and maintenance and the disposal and replacement of clean solvent or aqueous fluids. We performed more than 950,000 parts washer services in 2015. We also sell allied products including degreasers, glass and floor cleaners, hand cleaners, absorbents, antifreeze, windshield washer fluid, mats and spill kits.
Utilizing our collection network, we provide the pickup and transportation of hazardous and non-hazardous containerized waste for recycling or disposal, primarily through the Clean Harbors network of recycling and waste treatment and disposal facilities. Some of the collected waste consists of used oil which serves as feedstock for our oil re-refineries, although a portion of the used oil brought to the re-refineries is either not suitable for re-refining or cannot be re-refined because we do not have sufficient re-refining capacity at a specific point in time. That oil is processed into recycled fuel oil, or “RFO.” The RFO is then sold to various customers, such as asphalt plants, industrial plants, pulp and paper companies, and vacuum gas oil and marine diesel oil producers.
Our vacuum services provide the removal of solids, residual oily water and sludge and other fluids from customers' oil/water separators, sumps and collection tanks. We also remove and collect waste fluids found at large and small industrial locations, including metal fabricators, auto maintenance providers, and general manufacturers.
We provide total project management services in areas such as chemical packing, on-site waste management, remediation, compliance training and emergency spill response, while leveraging the Clean Harbors network of Technical, Industrial and Field Services centers and capabilities.
Lodging Services
Lodging Services consists of four lines of businesses; Lodge Operations, Mobile Camp Operations, Hospitality Operations, and Manufacturing. Synergy is created amongst all the lines of businesses within Lodging Services itself, as well with other Clean Harbors divisions by providing turnkey remote accommodations and manufacturing support.
Lodge Operations operates fixed lodges, ranging in size from 300 to 600 beds throughout Western Canada, primarily the Fort McMurray area. These include both client and open lodges, with amenities that include superior catering and housekeeping services, fully equipped common areas, fitness rooms and computer rooms, wireless internet and public phones, powered parking stalls, laundry facilities, and daily towel service.
Mobile Camp Operations include remote workforce accommodation facilities throughout Western Canada, currently in British Columbia, Saskatchewan and Alberta, with multiple accommodation types. These include both client and open camps, operator camps, and drill camps. Hospitality services are provided internally to the majority of the Lodges and Camps being operated, and include food services prepared by Red Seal Chefs, hospitality services, camp and lodge managers, and housekeeping. Furthermore, Hospitality services are available as a standalone service to clients who have other accommodation arrangements.
8
Manufacturing is provided through BCT Structures Inc. and Sanitherm Inc. BCT is a premier custom manufacturer of modular buildings specializing in providing workforce housing, office complexes, schools, lavatories, multi story buildings, affordable housing, kitchen facilities and other customized modular solutions for various industries. Sanitherm manufactures and operates water and wastewater treatment equipment and processes.
Oil and Gas Field Services
These services support exploration, drilling and production programs for oil and gas companies.
Seismic and Right-of-Way: On the exploration side, we provide integrated seismic and right-of-way services for efficient resource discovery and site preparation. These services include: (i) seismic surveying that minimizes costs, environmental impact, and time in field; (ii) mulching/line clearing that expedites additional geophysical activities and minimizes environmental impact; (iii) shot-hole drilling that provides safe and efficient operations in every terrain, including hostile and inaccessible regions; and (iv) borehole directional services that improve the efficient installation of pipeline, fiberoptic, cable, gas, water and sewer lines.
Surface Rentals: These services support oil and gas companies' drilling and well completion programs. Key to our services is our ability to provide solids control to support the drilling process. Our technologies help manage liquids, solids and semi-solid material during the drilling operation, and include centrifuges, tanks, and drilling fluid recovery. We also can provide container rentals for the safe collection of drill cuttings and other wastes, as well as manage disposal for drilling fluids and solids. We also supply surface rental equipment to support drill sites by providing wellsite trailers, wastewater treatment systems and holding tanks, light towers, and generators and handling tools.
Oilfield Transport and Production: These services support oil and gas companies drilling, completions and production programs. On the drilling and completions side, we provide vehicles and services for fluid hauling and disposal for ad hoc and turnkey operations. We also provide services and equipment for drilling site cleanups and support. On the production side, we provide complete turnarounds and tank cleaning services. Our downhole well equipment helps maintain and increase well productivity. Our other services include special chemical hauling, hydro-excavation, pressure/hydro testing equipment that tests pipelines and facilities, wellheads before operations startups, and rental production equipment for oil and gas well production.
Competition
The hazardous waste management industry in which we compete is highly competitive. The sources of competition vary by locality and by type of service rendered, with competition coming from national and regional waste services companies and hundreds of privately-owned firms. Veolia Environmental Services, or "Veolia," Waste Management, Inc., or "WM," and U.S. Ecology are the principal national firms with which we compete. Each of these competitors is able to provide one or more of the environmental services offered by us.
Under federal and state environmental laws in the United States, generators of hazardous wastes remain liable for improper disposal of such wastes. Although generators may hire various companies that have the proper permits and licenses, because of the generators' potential liability, they are very interested in the reputation and financial strength of the companies they use for the management of their hazardous wastes. We believe that our technical proficiency and reputation are important considerations to our customers in selecting and continuing to utilize our services.
We believe that the depth of our recycling, treatment and disposal capabilities and our ability to collect and transport waste products efficiently, quality of service, safety, and pricing are the most significant factors in the market for treatment and disposal services.
For our Technical Services segment, competitors include several major national and regional environmental services firms, as well as numerous smaller local firms. We believe the availability of skilled technical professional personnel, quality of performance, diversity of services and price are the key competitive factors in this service industry.
For our Industrial and Field Services segment, competitors vary by locality and by type of service rendered, with competition coming from national and regional service providers and hundreds of privately-owned firms that offer energy or industrial services. CEDA International Corporation and Newalta in Canada, and Philip Services Corporation, Hydrochem and Veolia in the United States, are the principal national firms with which we compete. Each of these competitors is able to provide one or more of the industrial and field services offered by us. We believe the availability of specialized equipment, skilled technical professional personnel, quality of performance, diversity of services and price are the key competitive factors in this industry.
9
For our Kleen Performance Products and SK Environmental Services segments, competitors vary by locality and by type of service rendered, with competition coming from Heritage Crystal Clean, and Veolia, along with several regional and local firms.
For our Lodging Services segment, competitors vary by locality and type of services provided. Our primary competitors in our lodging and remote camps business are Civeo, Black Diamond, Horizon North Logistics, Noralta, Royal Camps and William Scotsman, and in our manufacturing business, Atco Structures, Britco Manufacturing, Civeo, Horizon North Logistics and William Scotsman.
For our Oil and Gas Field Services segment, competitors vary by locality and type of service provided, with competition coming from national, regional and local service providers. Some of these competitors are able to provide one or more of the oil and gas services offered by us. Others only provide a limited range of equipment or services tailored for local markets. Competition is based on a number of factors, including safety, quality, performance, reliability, service, price, response time, and, in some cases, breadth of service offering.
The principal methods of competition for all of our services are price, quality, reliability of service rendered and technical proficiency. We believe that we offer a more comprehensive range of environmental, energy and industrial services than our competitors in major portions of our service territory.
Employees
As of December 31, 2015, we employed approximately 12,900 active full-time employees, of which 600 in the United States and 600 in Canada were represented by labor unions. We believe that our relationship with our employees is satisfactory. As part of our commitment to employee safety and quality customer service, we have an extensive compliance program and a trained environmental, health and safety staff. We adhere to a risk management program designed to reduce potential liabilities to us and to our customers.
Intellectual Property
We have invested significantly in the development of proprietary technology and also to establish and maintain an extensive knowledge of leading technologies and incorporate these technologies into the services we offer and provide to our customers. As of December 31, 2015, we held a total of 52 U.S. and 22 foreign issued or granted patents (which will expire between 2016 and 2031), 4 U.S. and 11 foreign pending patent applications, 70 U.S. and 52 foreign trademark registrations, and 13 U.S. and 11 foreign trademark applications. We also license software and other intellectual property from various third parties. We enter into confidentiality agreements with certain of our employees, consultants and corporate partners, and control access to software documentation and other proprietary information. We believe that we hold adequate rights to all intellectual property used in our business and that we do not infringe upon any intellectual property rights held by other parties.
Management of Risks
We adhere to a program of risk management policies and practices designed to reduce potential liability, as well as to manage customers' ongoing environmental exposures. This program includes installation of risk management systems at our facilities, such as fire suppression, employee training, environmental, auditing and policy decisions restricting the types of wastes handled. We evaluate all revenue opportunities and decline those that we believe involve unacceptable risks.
We dispose of wastes at our incineration, wastewater treatment and landfill facilities, or at facilities owned and operated by other firms that we have audited and approved. We apply established technologies to the treatment, storage and recovery of hazardous wastes. We believe our operations are conducted in a safe and prudent manner and in substantial compliance with applicable laws and regulations.
Insurance and Financial Assurance
Our insurance programs cover the potential risks associated with our multifaceted operations from two primary exposures: direct physical damage and third party liability. We maintain a casualty insurance program providing coverage for vehicles, employer's liability and commercial general liability in the aggregate amount of $105.0 million, $102.0 million and $104.0 million, respectively, per year, subject to retentions of $2.0 million per occurrence for auto and commercial general liability and $1.0 million for employers' liability in the United States and $2.0 million in Canada. We also have workers' compensation insurance whose limits are established by state statutes.
We have pollution liability insurance policies covering potential risks in three areas: as a contractor performing services at customer sites, as a transporter of waste and as a processor of waste at our facilities. The contractor's pollution liability insurance has limits of $20.0 million per occurrence and $25.0 million in the aggregate, covering offsite remedial activities and associated liabilities.
10
For sudden and accidental in-transit pollution liability, our auto liability policy provides the primary $5.0 million per occurrence of transportation pollution insurance. Our pollution liability policies provide an additional $60.0 million per occurrence and $85.0 million in the aggregate for a total of $65.0 million per occurrence and $90.0 million, respectively. A $2.0 million deductible per occurrence applies to this coverage in the United States and Canada.
Federal and state regulations require liability insurance coverage for all facilities that treat, store or dispose of hazardous waste. RCRA, the Toxic Substances Control Act, and comparable state hazardous waste regulations typically require hazardous waste handling facilities to maintain pollution liability insurance in the amount of $1.0 million per occurrence and $2.0 million in the aggregate for sudden occurrences, and $3.0 million per occurrence and $6.0 million in the aggregate for non-sudden occurrences. Our liability insurance coverage meets or exceeds all federal and state regulations.
Our international operations are insured under locally placed insurance policies that are compulsory to place in a specific country. In addition, we have a global foreign liability policy that will provide excess and difference in condition coverage in international countries.
Under our insurance programs, coverage is obtained for catastrophic exposures as well as those risks required to be insured by law or contract. It is our policy to retain a significant portion of certain expected losses related primarily to employee benefit, workers' compensation, commercial general and vehicle liability. Provisions for losses expected under these programs are recorded based upon our estimates of the actuarial calculation of the aggregate liability for claims. We believe that policy cancellation terms are similar to those of companies in other industries.
Operators of hazardous waste handling facilities are also required by federal, state and provincial regulations to provide financial assurance for closure and post-closure care of those facilities should the facilities cease operation. Closure would include the cost of removing the waste stored at a facility which ceased operating and sending the material to another facility for disposal and the cost of performing certain procedures for decontamination of the facility. As of December 31, 2015, our total estimated closure and post-closure costs requiring financial assurance by regulators were $429.5 million for our U.S. facilities and $38.9 million for our Canadian facilities. We have obtained all of the required financial assurance for our facilities through a combination of surety bonds, funded trusts, letters of credit and insurance from a qualified insurance company. The financial assurance related to closure and post-closure obligations of our U.S. facilities will renew in 2016. Our Canadian facilities utilize surety bonds, which renew at various dates throughout 2016, as well as letters of credit. In connection with obtaining such insurance and surety bonds, we have provided our insurance companies $81.8 million of letters of credit which we obtained from our lenders under our revolving credit agreement.
Environmental Regulation
While our business has benefited substantially from increased governmental regulation of hazardous waste transportation, storage and disposal, the environmental services industry itself is the subject of extensive and evolving regulation by federal, state, provincial and local authorities. We are required to obtain federal, state, provincial and local permits or approvals for each of our hazardous waste facilities. Such permits are difficult to obtain and, in many instances, extensive studies, tests, and public hearings are required before the approvals can be issued. We have acquired all operating permits and approvals now required for the current operation of our business, and have applied for, or are in the process of applying for, all permits and approvals needed in connection with continued operation and planned expansion or modifications of our operations.
We make a continuing effort to anticipate regulatory, political and legal developments that might affect operations, but are not always able to do so. We cannot predict the extent to which any environmental legislation or regulation that may be enacted or enforced in the future may affect our operations.
United States Hazardous Waste Regulation
Federal Regulations. The most significant federal environmental laws affecting us are the Resource Conservation and Recovery Act, or "RCRA," the Comprehensive Environmental Response, Compensation and Liability Act, or "CERCLA," also known as the "Superfund Act," the Clean Air Act, the Clean Water Act, and the Toxic Substances Control Act, or "TSCA."
RCRA. RCRA is the principal federal statute governing hazardous waste generation, treatment, transportation, storage and disposal. Pursuant to RCRA, the EPA has established a comprehensive "cradle-to-grave" system for the management of a wide range of materials identified as hazardous waste. States that have adopted hazardous waste management programs with standards at least as stringent as those promulgated by the EPA have been delegated authority by the EPA to administer their facility permitting programs in lieu of the EPA's program.
Every facility that treats, stores or disposes of hazardous waste must obtain a RCRA permit from the EPA or an authorized state agency unless a specific exemption exists, and must comply with certain operating requirements (the Part B permitting process). RCRA also requires that Part B permits contain provisions for required on-site study and cleanup activities,
11
known as "corrective action," including detailed compliance schedules and provisions for assurance of financial responsibility. See Note 8, "Closure and Post-Closure Liabilities," and Note 9, "Remedial Liabilities," to our consolidated financial statements included in Item 8 of this report for a discussion of our environmental liabilities. See "Insurance and Financial Assurance" above for a discussion of our financial assurance requirements.
The Superfund Act. The Superfund Act is the primary federal statute regulating the cleanup of inactive hazardous substance sites and imposing liability for cleanup on the responsible parties. It also provides for immediate response and removal actions coordinated by the EPA to releases of hazardous substances into the environment, and authorizes the government to respond to the release or threatened release of hazardous substances or to order responsible persons to perform any necessary cleanup. The statute provides for strict and, in certain cases, joint and several liability for these responses and other related costs, and for liability for the cost of damages to natural resources, to the parties involved in the generation, transportation and disposal of hazardous substances. Under the statute, we may be deemed liable as a generator or transporter of a hazardous substance which is released into the environment, or as the owner or operator of a facility from which there is a release of a hazardous substance into the environment. See Note 16, "Commitments and Contingencies," to our consolidated financial statements included in Item 8 of this report for a description of the principal such proceedings in which we are involved.
The Clean Air Act. The Clean Air Act was passed by Congress to control the emissions of pollutants into the air and requires permits to be obtained for certain sources of toxic air pollutants such as vinyl chloride, or criteria pollutants, such as carbon monoxide. In 1990, Congress amended the Clean Air Act to require further reductions of air pollutants with specific targets for non-attainment areas in order to meet certain ambient air quality standards. These amendments also require the EPA to promulgate regulations which (i) control emissions of 189 hazardous air pollutants; (ii) create uniform operating permits for major industrial facilities similar to RCRA operating permits; (iii) mandate the phase-out of ozone depleting chemicals; and (iv) provide for enhanced enforcement.
The Clean Water Act. This legislation prohibits discharge of pollutants into the waters of the United States without governmental authorization and regulates the discharge of pollutants into surface waters and sewers from a variety of sources, including disposal sites and treatment facilities. The EPA has promulgated "pretreatment" regulations under the Clean Water Act, which establish pretreatment standards for introduction of pollutants into publicly owned treatment works. In the course of the treatment process, our wastewater treatment facilities generate wastewater, which we discharge to publicly owned treatment works pursuant to permits issued by the appropriate governmental authority. We are required to obtain discharge permits and conduct sampling and monitoring programs. We believe each of our operating facilities complies in all material respects with the applicable requirements.
TSCA. We also operate a network of collection, treatment and field services (remediation) activities throughout North America that are regulated under provisions of TSCA. TSCA established a national program for the management of substances classified as polychlorinated biphenyls, or "PCBs," which include waste PCBs as well as RCRA wastes contaminated with PCBs. The rules set minimum design and operating requirements for storage, treatment and disposal of PCB wastes. Since their initial publication, the rules have been modified to enhance the management standards for TSCA-regulated operations including the decommissioning of PCB transformers and articles, detoxification of transformer oils, incineration of PCB liquids and solids, landfill disposal of PCB solids, and remediation of PCB contamination at customer sites.
Other Federal Laws. In addition to regulations specifically directed at the transportation, storage, and disposal facilities, there are a number of regulations that may "pass-through" to the facilities based on the acceptance of regulated waste from affected client facilities. Each facility that accepts affected waste must comply with the regulations for that waste, facility or industry. Examples of this type of regulation are National Emission Standards for Benzene Waste Operations and National Emissions Standards for Pharmaceuticals Production. Each of our facilities addresses these regulations on a case-by-case basis determined by its ability to comply with the pass-through regulations.
In our transportation operations, we are regulated by the U.S. Department of Transportation, the Federal Railroad Administration, the Federal Aviation Administration and the U.S. Coast Guard, as well as by the regulatory agencies of each state in which we operate or through which our vehicles pass.
Health and safety standards under the Occupational Safety and Health Act, or "OSHA," are also applicable to all of our operations.
State and Local Regulations. Pursuant to the EPA's authorization of their RCRA equivalent programs, a number of U.S. states have regulatory programs governing the operations and permitting of hazardous waste facilities. Accordingly, the hazardous waste treatment, storage and disposal activities of a number of our facilities are regulated by the relevant state agencies in addition to federal EPA regulation.
12
Some states classify as hazardous some wastes that are not regulated under RCRA. For example, Massachusetts considers used oil as "hazardous waste" while RCRA does not. Accordingly, we must comply with state requirements for handling state regulated wastes, and, when necessary, obtain state licenses for treating, storing, and disposing of such wastes at our facilities.
Our facilities are regulated pursuant to state statutes, including those addressing clean water and clean air. Local sewer discharge and flammable storage requirements are applicable to certain of our facilities. Our facilities are also subject to local siting, zoning and land use restrictions. We believe that each of our facilities is in substantial compliance with the applicable requirements of federal and state licenses which we have obtained pursuant thereto. Once issued, such licenses have maximum fixed terms of a given number of years, which differ from state to state, ranging from three to ten years. The issuing state agency may review or modify a license at any time during its term. We anticipate that once a license is issued with respect to a facility, the license will be renewed at the end of its term if the facility's operations are in compliance with applicable requirements. However, there can be no assurance that regulations governing future licensing will remain static, or that we will be able to comply with such requirements.
Canadian Hazardous Waste Regulation
In Canada, the provinces retain control over environmental issues within their boundaries and thus have the primary responsibility for regulating management of hazardous wastes. The federal government regulates issues of national scope or where activities cross provincial boundaries.
Provincial Regulations. Most of Canada's industrial development and the major part of its population are located in four provinces: Ontario, Quebec, Alberta and British Columbia. These provinces have the most detailed environmental regulations. We operate major waste management facilities in each of these provinces, as well as waste transfer facilities in Nova Scotia and Manitoba.
The main provincial acts dealing with hazardous waste management are:
• | Ontario—Environmental Protection Act; |
• | Quebec—Environmental Quality Act; |
• | Alberta—Environmental Protection and Enhancement Act; and |
• | British Columbia—Waste Management Act. |
These pieces of legislation were developed by the provinces independently and, among other things, generally control the generation, characterization, transport, treatment and disposal of hazardous wastes. Regulations developed by the provinces under the relevant legislation are also developed independently, but are often quite similar in effect and sometimes in application. For example, there is some uniformity in manifest design and utilization.
Provincial legislation also provides for the establishment of waste management facilities. In this case, the facilities are also controlled by provincial statutes and regulations governing emissions to air, groundwater and surface water and prescribing design criteria and operational guidelines.
Waste transporters require a permit to operate under provincial waste management regulations and are subject to the requirements of the Federal Transportation of Dangerous Goods legislation. They are required to report the quantities and disposition of materials shipped.
Canadian Federal Regulations. The Canadian federal government has authority for those matters which are national in scope and in impact and for Canada's relations with other nations. The main federal laws governing hazardous waste management are:
• | Canadian Environmental Protection Act (1999) ("CEPA 99"), and |
• | Transportation of Dangerous Goods Act. |
Environment Canada is the federal agency with responsibility for environmental matters and the main legislative instrument is the Canadian Environmental Protection Act. This act charges Environment Canada and Health Canada with protection of human health and the environment and seeks to control the production, importation and use of substances in Canada and to control their impact on the environment.
The Export and Import of Hazardous Wastes Regulations under CEPA 99 control the export and import of hazardous wastes and hazardous recyclable materials. By reference, these regulations incorporate the Transportation of Dangerous Goods Act and Regulations, which address identification, packaging, marking and documentation of hazardous materials during transport. CEPA 99 requires that anyone proposing to export or import hazardous wastes or hazardous recyclable materials or to
13
transport them through Canada notify the Minister of the Environment and obtain a permit to do so. Section 9 of CEPA 99 allows the federal government to enter into administrative agreements with the provinces and territories for the development and improvement of environmental standards. These agreements represent cooperation towards a common goal rather than a delegation of authority under CEPA 99. To facilitate the development of provincial and territorial agreements, the federal, provincial and territorial governments participate in the Canadian Council of Ministers of the Environment ("CCME"). The CCME comprises the 14 environment ministers from the federal, provincial and territorial governments, who normally meet twice a year to discuss national environmental priorities and to determine work to be carried out under the auspices of the CCME.
Canadian Local and Municipal Regulations. Local and municipal regulations seldom reference direct control of hazardous waste management activities. Municipal regulations and by-laws, however, control such issues as land use designation, access to municipal services and use of emergency services, all of which can have a significant impact on facility operation.
Compliance with Environmental Regulations
We incur costs and make capital investments in order to comply with the previously discussed environmental regulations. These regulations require that we remediate contaminated sites, operate our facilities in accordance with enacted regulations, obtain required financial assurance for closure and post-closure care of our facilities should such facilities cease operations, and make capital investments in order to keep our facilities in compliance with environmental regulations.
As further discussed in Note 8, "Closure and Post-Closure Liabilities," and Note 9, "Remedial Liabilities," to our consolidated financial statements included in Item 8 of this report, we have accrued environmental liabilities as of December 31, 2015, of $188.2 million. For the years ended December 31, 2015 and 2014, we spent $20.1 million and $20.2 million, respectively, to address environmental liabilities.
As discussed more fully above under the heading "Insurance and Financial Assurance," we are required to provide financial assurance with respect to certain statutorily required closure, post-closure and corrective action obligations at our facilities. We have placed the required financial assurance primarily through a qualified insurance company.
As described in Note 16, "Commitments and Contingencies," to our consolidated financial statements included in Item 8 of this report, we are involved in legal proceedings arising under environmental laws and regulations. Alleged failure to comply with laws and regulations may lead to the imposition of fines or the denial, revocation or delay of the renewal of permits and licenses by governmental entities. In addition, such governmental entities, as well as surrounding landowners, may claim that we are liable for environmental damages. Citizens groups have become increasingly active in challenging the grant or renewal of permits and licenses for hazardous waste facilities, and responding to such challenges has further increased the costs associated with establishing new facilities or expanding current facilities. A significant judgment against us, the loss of a significant permit or license, or the imposition of a significant fine could have a material effect on our business and future prospects.
ITEM 1A. RISK FACTORS
An investment in our securities involves certain risks, including those described below. You should consider carefully these risk factors together with all of the information included in this report before investing in our securities.
Risks Affecting All of Our Businesses
Our businesses are subject to operational and safety risks.
Provision of environmental, energy and industrial services to our customers by all six of our business segments involves risks such as equipment defects, malfunctions and failures, and natural disasters, which could potentially result in releases of hazardous materials, injury or death of our employees, or a need to shut down or reduce operation of our facilities while remedial actions are undertaken. Our employees often work under potentially hazardous conditions. These risks expose us to potential liability for pollution and other environmental damages, personal injury, loss of life, business interruption, and property damage or destruction. We must also maintain a solid safety record in order to remain a preferred supplier to our major customers.
While we seek to minimize our exposure to such risks through comprehensive training programs, vehicle and equipment maintenance programs, and insurance, such programs and insurance may not be adequate to cover all of our potential liabilities and such insurance may not in the future be available at commercially reasonable rates. If we were to incur substantial liabilities in excess of policy limits or at a time when we were not able to obtain adequate liability insurance on commercially reasonable terms, our business, results of operations and financial condition could be adversely affected to a material extent.
14
Furthermore, should our safety record deteriorate, we could be subject to a potential reduction of revenues from our major customers.
Our businesses are subject to numerous statutory and regulatory requirements, which may increase in the future.
Our businesses are subject to numerous statutory and regulatory requirements, and our ability to continue to hold licenses and permits required for our businesses is subject to maintaining satisfactory compliance with such requirements. These requirements may increase in the future as a result of statutory and regulatory changes. Although we are very committed to compliance and safety, we may not, either now or in the future, be in full compliance at all times with such statutory and regulatory requirements. Consequently, we could be required to incur significant costs to maintain or improve our compliance with such requirements.
Certain adverse conditions have required, and future conditions might require, us to make substantial write-downs in our assets, which have adversely affected or would adversely affect our balance sheet and results of operations.
We review our long-lived tangible and intangible assets for impairment whenever events or changes in circumstances indicate that the carrying value of an asset may not be recoverable. We also test our goodwill and indefinite-lived intangible assets for impairment at least annually on December 31, or when events or changes in the business environment indicate that the carrying value of a reporting unit may exceed its fair value. Based on the results of those tests, we determined
during the second quarter of 2015 that the then carrying amount of our Oil and Gas Field Services reporting unit exceeded the estimated fair value of that unit and we therefore then recognized a goodwill impairment charge of $32.0 million with respect to that unit. During the third quarter of 2014, we determined that the then carrying amount of our Kleen Performance Products reporting unit exceeded the estimated fair value of that unit and we therefore then recognized a goodwill impairment charge of $123.4 million with respect to that unit. During and as of the end of each of 2015 and 2014, we determined that no other asset write-downs were required. However, if conditions in any of the businesses in which we compete were to deteriorate, we could determine that certain of our assets were impaired and we would then be required to write-off all or a portion of our costs for such assets. Any such significant write-offs would adversely affect our balance sheet and results of operations.
Fluctuations in foreign currency exchange could affect our financial results.
We earn revenues, pay expenses, own assets and incur liabilities in countries using currencies other than the U.S. dollar. In fiscal 2015, we recorded 21% of our revenues outside of the United States, primarily in Canada. Because our consolidated financial statements are presented in U.S. dollars, we must translate revenues, income and expenses as well as assets and liabilities into U.S. dollars at exchange rates in effect during or at the end of each reporting period. Therefore, increases or decreases in the value of the U.S. dollar against other currencies in countries where we operate will affect our results of operations and the value of balance sheet items denominated in foreign currencies. These risks are non-cash exposures, and we manage these risks through normal operating and financing activities. However, we may not be successful in reducing the risks inherent in exposures to foreign currency fluctuations.
Failure to effectively manage acquisitions and divestitures could adversely impact our future results.
We continuously evaluate potential acquisition candidates and from time to time acquire companies that we believe will strategically fit into our business and growth objectives. In particular, we acquired on December 28, 2012, all of the outstanding shares of Safety-Kleen for approximately $1.26 billion in cash, on September 13, 2013, all of the outstanding shares of Evergreen Oil, Inc. for approximately $56.3 million in cash, and on April 11, 2015, all of the outstanding shares of Thermo Fluids Inc. for approximately $78.6 million in cash, subject to customary closing conditions. If we are unable to successfully integrate and develop acquired businesses, we could fail to achieve anticipated synergies and cost savings, including any expected increases in revenues and operating results, which could have a material adverse effect on our financial results. We also continually review our portfolio of assets to determine the extent to which they are contributing to our objectives and growth strategy. In particular, on January 20, 2015, we announced a planned carve-out to include our Oil and Gas Field Service segment and the drilling-related mobile assets of our Lodging Services segment, subject to certain conditions, and on May 6, 2015, we announced the expansion of the planned carve-out to include our entire Lodging Services segment, subject to certain conditions. However, we may not be successful in separating underperforming or non-strategic assets, and gains or losses on the divestiture of, or lost operating income from, such assets may adversely affect our earnings. Moreover, we may incur asset impairment charges related to acquisitions or divestitures that reduce our earnings.
Our acquisitions may expose us to unknown liabilities.
Because we have acquired, and expect generally to acquire, all the outstanding shares of most of our acquired companies, our investment in those companies are or will be subject to all of their liabilities other than their respective debts which we paid or will pay at the time of the acquisitions. If there are unknown liabilities or other obligations, our business could be materially
15
affected. We may also experience issues relating to internal controls over financial reporting, issues that could affect our ability to comply with the Sarbanes-Oxley Act, or issues that could affect our ability to comply with other applicable laws.
A cyber security incident could negatively impact our business and our relationships with customers.
We use computers in substantially all aspects of our business operations and also mobile devices and other online activities to connect with our employees and customers. Such uses give rise to cyber security risks, including security breach, espionage, system disruption, theft and inadvertent release of information. Our business involves the storage and transmission of numerous classes of sensitive and/or confidential information and intellectual property including, but not limited to, private information about employees, and financial and strategic information about our Company and our business partners. Furthermore, as we pursue our strategy to grow through acquisitions and new initiatives that improve our operations and cost structure, we are also expanding and improving our information technologies, resulting in a larger technological presence and corresponding exposure to cyber security risk. If we fail to assess and identify cyber security risks associated with acquisitions and new initiatives, we may become increasingly vulnerable to such risks. Additionally, while we have implemented measures to prevent security breaches and cyber incidents, our preventative measures and incident response efforts may not be entirely effective. The theft, destruction, loss, misappropriation, or release of sensitive and/or confidential information or intellectual property, or interference with our information technology systems or the technology systems of third parties on which we rely, could result in business disruption, negative publicity, brand damage, violation of privacy laws, loss of customers, potential liability and competitive disadvantage.
Additional Risks of Our Technical Services Business
The hazardous waste management business conducted by our Technical Services segment is subject to significant environmental liabilities.
We have accrued environmental liabilities valued as of December 31, 2015, at $188.2 million, substantially all of which we assumed in connection with certain acquisitions. We calculate our environmental liabilities on a present value basis in accordance with generally accepted accounting principles, which take into consideration both the amount of such liabilities and the timing when it is projected that we will be required to pay such liabilities. We anticipate our environmental liabilities will be payable over many years and that cash flows generated from our operations will generally be sufficient to fund the payment of such liabilities when required. However, events not now anticipated (such as future changes in environmental laws and regulations or their enforcement) could require that such payments be made earlier or in greater amounts than now estimated, which could adversely affect our financial condition and results of operations.
We may also assume additional environmental liabilities as part of further acquisitions. Although we will endeavor to accurately estimate and limit environmental liabilities presented by the businesses or facilities to be acquired, some liabilities, including ones that may exist only because of the past operations of an acquired business or facility, may prove to be more difficult or costly to address than we then estimate. It is also possible that government officials responsible for enforcing environmental laws may believe an environmental liability is more significant than we then estimate, or that we will fail to identify or fully appreciate an existing liability before we become legally responsible to address it.
If we become unable to obtain at reasonable cost the insurance, surety bonds, letters of credit and other forms of financial assurance required for our facilities and operations, our business and results of operations would be adversely affected.
We are required to provide substantial amounts of financial assurance to governmental agencies for closure and post-closure care of our licensed hazardous waste treatment facilities should those facilities cease operation, and we are also occasionally required to post surety, bid and performance bonds in connection with certain projects. As of December 31, 2015, our total estimated closure and post-closure costs requiring financial assurance by regulators were $429.5 million for our U.S. facilities and $38.9 million for our Canadian facilities. We have obtained all of the required financial assurance for our facilities through a combination of surety bonds, funded trusts, letters of credit and insurance from a qualified insurance company. The financial assurance related to closure and post-closure obligations of our U.S. facilities will renew in 2016. Our Canadian facilities utilize surety bonds, which renew at various dates throughout 2016, as well as letters of credit. In connection with obtaining such insurance and surety bonds, we have provided our insurance companies $81.8 million of letters of credit which we obtained under our revolving credit agreement.
Our ability to continue operating our facilities and conducting our other operations would be adversely affected if we became unable to obtain sufficient insurance, surety bonds, letters of credit and other forms of financial assurance at reasonable cost to meet our regulatory and other business requirements. The availability of insurance, surety bonds, letters of credit and
16
other forms of financial assurance is affected by our insurers', sureties' and lenders' assessment of our risk and by other factors outside of our control such as general conditions in the insurance and credit markets.
The hazardous waste management industry in which we participate is subject to significant economic and business risks.
The future operating results of our Technical Services segment may be affected by such factors as our ability to utilize our facilities and workforce profitably in the face of intense price competition, maintain or increase market share in an industry which has in the past experienced significant downsizing and consolidation, realize benefits from cost reduction programs, invest in new technologies for treatment of hazardous waste, generate incremental volumes of waste to be handled through our facilities from existing and acquired sales offices and service centers, obtain sufficient volumes of waste at prices which produce revenue sufficient to offset the operating costs of our facilities, minimize downtime and disruptions of operations, and develop our field services business. In particular, economic downturns or recessionary conditions in North America, and increased outsourcing by North American manufacturers to plants located in countries with lower wage costs and less stringent environmental regulations, have adversely affected and may in the future adversely affect the demand for our services. Our Technical Services segment is also cyclical to the extent that it is dependent upon a stream of waste from cyclical industries such as chemical and petrochemical, primary metals, paper, furniture and aerospace. If those cyclical industries slow significantly, the business that we receive from them would likely decrease.
The extensive environmental regulations to which we are subject may increase our costs and potential liabilities and limit our ability to expand our facilities.
Our operations and those of others in the environmental services industry are subject to extensive federal, state, provincial and local environmental requirements in both the United States and Canada, including those relating to emissions to air, discharged wastewater, storage, treatment, transport and disposal of regulated materials, and cleanup of soil and groundwater contamination. For example, any failure to comply with governmental regulations governing the transport of hazardous materials could negatively impact our ability to collect, process and ultimately dispose of hazardous wastes generated by our customers. While increasing environmental regulation often presents new business opportunities for us, it often also results in increased operating and compliance costs. Efforts to conduct our operations in compliance with all applicable laws and regulations, including environmental rules and regulations, require programs to promote compliance, such as training employees and customers, purchasing health and safety equipment, and in some cases hiring outside consultants and lawyers. Even with these programs, we and other companies in the environmental services industry are routinely faced with governmental enforcement proceedings, which can result in fines or other sanctions and require expenditures for remedial work on waste management facilities and contaminated sites. Certain of these laws impose strict and, under certain circumstances, joint and several liability on current and former owners and operators of facilities that release regulated materials or that generate those materials and arrange for their disposal or treatment at contaminated sites. Such liabilities can relate to required cleanup of releases of regulated materials and related natural resource damages.
From time to time, we have paid fines or penalties in governmental environmental enforcement proceedings, usually involving our waste treatment, storage and disposal facilities. Although none of these fines or penalties that we have paid in the past has had a material adverse effect upon us, we might in the future be required to make substantial expenditures as a result of governmental proceedings which would have a negative impact on our earnings. Furthermore, regulators have the power to suspend or revoke permits or licenses needed for operation of our plants, equipment, and vehicles based on, among other factors, our compliance record, and customers may decide not to use a particular disposal facility or do business with us because of concerns about our compliance record. Suspension or revocation of permits or licenses would impact our operations and could have a material impact on our financial results. Although we have never had any of our facilities' operating permits revoked, suspended or non-renewed involuntarily, it is possible that such an event could occur in the future.
Some environmental laws and regulations impose liability and responsibility on present and former owners, operators or users of facilities and sites for contamination at such facilities and sites without regard to causation or knowledge of contamination. In the past, practices have resulted in releases of regulated materials at and from certain of our facilities, or the disposal of regulated materials at third party sites, which may require investigation and remediation, and potentially result in claims of personal injury, property damage and damages to natural resources. In addition, we occasionally evaluate various alternatives with respect to our facilities, including possible dispositions or closures. Investigations undertaken in connection with these activities may lead to discoveries of contamination that must be remediated, and closures of facilities might trigger compliance requirements that are not applicable to operating facilities. We are currently conducting remedial activities at certain of our facilities and paying a portion of the remediation costs at certain sites owned by third parties. While, based on available information, we do not believe these remedial activities will result in a material effect upon our operations or financial condition, these activities or the discovery of previously unknown conditions could result in material costs.
17
In addition to the costs of complying with environmental laws and regulations, we incur costs defending against environmental litigation brought by governmental agencies and private parties. We are now, and may in the future be, a defendant in lawsuits brought by parties alleging environmental damage, personal injury, and/or property damage, which may result in our payment of significant amounts of liabilities.
Environmental and land use laws also impact our ability to expand our facilities. In addition, we are required to obtain governmental permits to operate our facilities, including all of our landfills. Even if we comply with all applicable environmental laws, we might not be able to obtain requisite permits from applicable governmental authorities to extend or modify such permits to fit our business needs.
If our assumptions relating to expansion of our landfills should prove inaccurate, our results of operations and cash flow could be adversely affected.
When we include expansion airspace in our calculation of available airspace, we adjust our landfill liabilities to the present value of projected costs for cell closure and landfill closure and post-closure. It is possible that our estimates or assumptions could ultimately turn out to be significantly different from actual results. In some cases we may be unsuccessful in obtaining an expansion permit or we may determine that an expansion permit that we previously thought was probable has become unlikely. To the extent that such estimates, or the assumptions used to make those estimates, prove to be significantly different than actual results, or our belief that we will receive an expansion permit changes adversely in a significant manner, the landfill assets, including the assets incurred in the pursuit of the expansion, may be subject to impairment testing and lower prospective profitability may result due to increased interest accretion and depreciation or asset impairments related to the removal of previously included expansion airspace. In addition, if our assumptions concerning expansion airspace should prove inaccurate, certain of our cash expenditures for closure of landfills could be accelerated and adversely affect our results of operations and cash flow.
Additional Risks of Our Industrial and Field Services Business
A significant portion of our Industrial and Field Services business depends upon the demand for cleanup of major spills and other remedial projects and regulatory developments over which we have no control.
Our operations can be affected by the commencement and completion of cleanup of major spills and other events, customers' decisions to undertake remedial projects, seasonal fluctuations due to weather and budgetary cycles influencing the timing of customers' spending for remedial activities, the timing of regulatory decisions relating to hazardous waste management projects, changes in regulations governing the management of hazardous waste, secular changes in the waste processing industry towards waste minimization and the propensity for delays in the demand for remedial services, and changes in the myriad of governmental regulations governing our diverse operations. We do not control such factors and, as a result, our revenue and income can vary from quarter to quarter, and past financial performance for certain quarters may not be a reliable indicator of future performance for comparable quarters in subsequent years.
Additional Risks of Our Kleen Performance Products Business
Fluctuations in oil prices may have a negative effect on our Kleen Performance Products business.
A significant portion of our business involves collecting used oil from certain of our customers, re-refining a portion of such used oil into base and blended lubricating oils, and then selling both such re-refined oil and the excess recycled oil which we do not currently have the capacity to re-refine, or ‘‘RFO,’’ to other customers. The prices at which we sell our re-refined oil and RFO are affected by changes in the reported spot market prices of oil. If applicable rates increase or decrease, we typically will charge a higher or lower corresponding price for our re-refined oil and RFO. The price at which we sell our re-refined oil and RFO is affected by changes in certain indices measuring changes in the price of heavy fuel oil, with increases and decreases in the indices typically translating into a higher or lower price for our RFO. The cost to collect used oil, including the amounts we pay to obtain a portion of our used oil and therefore ability to collect necessary volumes as well as the fuel costs of our oil collection fleet, typically also increases or decreases when the relevant indices increase or decrease. However, even though the prices we can charge for our re-refined oil and RFO and the costs to collect and re-refine used oil and process RFO typically increase and decrease together, there is no assurance that when our costs to collect and re-refine used oil and process RFO increase we will be able to increase the prices we charge for our re-refined oil and RFO to cover such increased costs, or that our costs to collect and re-refine used oil and process RFO will decline when the prices we can charge for re-refined oil and RFO decline. These risks are exacerbated when there are rapid fluctuations in these oil indices.
18
Additional Risks of Our SK Environmental Services Business
Environmental laws and regulations have adversely affected and may adversely affect Safety-Kleen's parts cleaning and other solvent related services.
In connection with its parts cleaning and other solvent related services, Safety-Kleen has been subject to fines and certain orders requiring it to take environmental remedial action. Safety-Kleen may be subject to monetary fines, civil or criminal penalties, remediation, cleanup or stop orders, injunctions, orders to cease or suspend certain practices or denial of permits required for the operation of its facilities. The outcome of any proceeding and associated costs and expenses could have a material adverse impact on Safety-Kleen’s financial condition and results of operations.
Recent and potential changes in environmental laws and regulations may also adversely affect in the future Safety-Kleen's parts cleaning and other solvent related services. Interpretation or enforcement of existing laws and regulations, or the adoption of new laws and regulations, may require Safety-Kleen to modify or curtail its operations or replace or upgrade its facilities or equipment at substantial cost, which we may not be able to pass on to our customers, and we may choose to indemnify our customers from any fines or penalties they may incur as a result of these new laws and regulations. On the other hand, in some cases if new laws and regulations are less stringent, Safety-Kleen’s customers or competitors may be able to manage waste more effectively themselves, which could decrease the need for Safety-Kleen’s services or increase competition, which could adversely affect Safety-Kleen’s results of operations.
Safety-Kleen is subject to existing and potential product liability lawsuits.
Safety-Kleen has been named from time to time as a defendant in various product liability lawsuits in various courts and jurisdictions throughout the United States. As of December 31, 2015, Safety-Kleen was involved in approximately 58 proceedings (including cases which have been settled but not formally dismissed) wherein persons claim personal injury resulting from the use of its parts cleaning equipment or cleaning products. These proceedings typically involve allegations that the solvent used in Safety-Kleen’s parts cleaning equipment contains contaminants or that Safety-Kleen’s recycling process does not effectively remove the contaminants that become entrained in the solvent during their use. In addition, certain claimants assert that Safety-Kleen failed to warn adequately the product user of potential risks, including a historic failure to warn that solvent contains trace amounts of toxic or hazardous substances such as benzene. Although Safety-Kleen maintains insurance that we believe will provide coverage for these claims (over amounts accrued for self-insured retentions and deductibles in certain limited cases), this insurance may not provide coverage for potential awards of punitive damages against Safety-Kleen. Although Safety-Kleen has vigorously defended and will continue to vigorously defend itself and the safety of its products against all of these claims, these matters are subject to many uncertainties and outcomes are not predictable with assurance. Safety-Kleen may also be named in similar, additional lawsuits in the future, including claims for which insurance coverage may not be available. If one or more of these claims were decided unfavorably against Safety-Kleen and the plaintiffs were awarded punitive damages, or if insurance coverage were not available for any such claim, our financial condition and results of operations could be materially and adversely affected. Additionally, if one or more of these claims were decided unfavorably against Safety-Kleen, such outcome may encourage more lawsuits against us.
Safety-Kleen is dependent on third parties for the manufacturing of the majority of its equipment.
Safety-Kleen does not manufacture the majority of the equipment, including parts washers, that Safety-Kleen places at customer sites. Accordingly, Safety-Kleen relies on a limited number of third party suppliers for manufacturing this equipment. The supply of third party equipment could be interrupted or halted by a termination of Safety-Kleen’s relationships, a failure of quality control or other operational problems at such suppliers or a significant decline in their financial condition. If Safety-Kleen were not able to retain these providers or obtain its requests from them, Safety-Kleen may not be able to obtain alternate providers in a timely manner or on economically attractive terms, and as a result, Safety-Kleen may not be able to compete successfully for new business, complete existing engagements profitably or retain its existing customers. Additionally, if Safety-Kleen’s third party suppliers provide it with defective equipment, it may be subject to reputational damage or product liability claims which may negatively impact its reputation, financial condition and results of operations. Further, Safety-Kleen generally does not have long-term contracts with its third party suppliers, and as a result these suppliers may increase the price of the equipment they provide to Safety-Kleen, which may hurt Safety-Kleen’s results of operations.
19
Additional Risks of Our Lodging Services Business
All of our major Canadian lodges are located on land subject to leases; if we were unable to renew a lease, we could be materially and adversely affected.
All of our major Canadian lodges are located on land subject to leases. Accordingly, while we own the accommodations assets and can move them to other locations, if necessary, we only own a leasehold in those properties. If we were found to be in breach of a lease, we could lose the right to use the property. In addition, unless we could extend the terms of these leases before their expiration, we would lose our right to operate our facilities located on these properties upon expiration of the leases. In that event, we would be required to remove our accommodations assets and remediate the sites. We may not be able to renew our leases upon expiration on similar terms, or at all, and if we were unable to renew leases on similar terms, it may have an adverse effect on our business. In addition, if we were to lose the right to use a lodge due to non-renewal of a lease, we would be unable to derive income from such lodge, which could materially and adversely affect us.
Due to the significant concentration of our Lodging Services business in the oil sands region of Alberta, Canada, adverse events in that region could negatively impact our business.
Because of the concentration of our accommodations business in the oil sands region of Alberta, Canada, we have increased exposure to political, economic, regulatory, environmental, labor, climate or natural disaster events or developments that could disproportionately impact our operations and financial results.
Our Lodging Services business depends significantly on several major customers, and the loss of one or more such customers or the inability of one or more such customers to meet their obligations to us could adversely affect our results of operations.
Our Lodging Services business depends significantly on several major customers engaged primarily in oil and gas exploration and production. Declines in the general level of oil and gas exploration and production in the oil sands region resulting in decreased demand in our lodging services have occured in recent periods and could occur in the future, and have had and could have in the future adverse effects on the revenues and profitability of our Lodging Services business. The loss of any one or more of such large customers or a sustained decrease in demand by any of them have resulted and could result in a substantial loss of revenues and have had and could have a material adverse effect on our results of operations. In addition, the concentration of our customers in oil and gas exploration and production may impact our overall exposure to credit risk, either positively or negatively, because our customers may be similarly affected by changes in economic and industry conditions. While we perform ongoing credit evaluations of our customers, we do not generally require collateral in support of our trade receivables. As a result, we are subject to risks of loss resulting from nonpayment or nonperformance by our customers.
We may be adversely affected if customers reduce their accommodations outsourcing.
The business and growth strategy of our Lodging Services business depends in large part on the continuation of a current trend toward outsourcing services. Many oil and gas companies in our core markets own their own accommodations facilities, while others outsource all or part of their accommodations requirements. Customers have largely built their accommodations in the past but will outsource if they perceive that outsourcing may provide quality services at a lower overall cost or allow them to accelerate the timing of their projects. We cannot be certain that this trend will continue and not be reversed or that customers that have outsourced accommodations will not decide to perform these functions themselves or only outsource accommodations during the development or construction phases of their projects. In addition, labor unions representing customer employees and contractors have, in the past, opposed outsourcing accommodations to the extent that the unions believe that third-party accommodations negatively impact union membership and recruiting. The reversal or reduction in customer outsourcing of accommodations could negatively impact our financial results and growth prospects.
Increased operating costs and obstacles to cost recovery due to the pricing and cancellation terms of our accommodation services contracts may constrain our ability to make a profit.
The profitability of our Lodging Services business can be adversely affected by cost increases for food, wages and other labor related expenses, insurance, fuel and utilities, especially to the extent we are unable to recover such increased costs through increases in the prices for our services due to general economic conditions, competitive conditions or contractual provisions in our customer contracts. Oil and natural gas prices have fluctuated significantly in the last several years, and substantial increases in the cost of fuel and utilities have historically resulted in cost increases for our lodges. From time to time we have also experienced increases in our food costs. While we believe a portion of these increases were attributable to fuel prices, we believe the increases also resulted from rising global food demand. In addition, food prices can fluctuate as a result
20
of temporary changes in supply, including as a result of severe weather such as droughts, heavy rains and late freezes. While our long term contracts often provide for annual escalation in our room rates for food, labor and utility inflation, we may be unable to fully recover costs and such increases in costs would negatively impact our profitability on contracts that do not contain inflation protections.
Additional Risks of Our Oil and Gas Field Services Business
A large portion of our Oil and Gas Field Services business is dependent on the oil and gas industry in Western Canada, and declines in oil and gas exploration and production in that region have adversely affected and could in the future adversely affect our business.
Our Oil and Gas Field Services business generates a significant portion of its total revenues from customers in the oil and gas industry operating in Western Canada, although a majority of the services we provide to such customers relate to oil and gas production and refining which is less volatile than oil and gas exploration. Accordingly, declines in the general level of oil and gas exploration and production in Western Canada have had and could potentially have significant adverse effects on the revenues and profitability of our Oil and Gas Field Services business and have resulted and could also potentially result in asset impairment charges being recognized, including the goodwill impairment charge of $32.0 million we recognized with respect to our Oil and Gas Field Services reporting unit during the third quarter of 2015. Such declines have occurred and could potentially occur in the future if reductions in the commodity prices of oil and gas result in reduced oil and gas exploration, production and refining. Such declines could also be triggered by technological and regulatory changes, such as those affecting the availability and cost of alternative energy sources and other changes in industry and worldwide economic and political conditions.
Many of our major customers in the oil and gas industry conduct a significant portion of their operations in the Alberta oil sands. The Alberta oil sands contain large oil deposits, but extraction may involve significantly greater cost and environmental concerns than conventional drilling. While we believe our major involvement in the oil sands region will provide significant future growth opportunities, such involvement also increases the risk that our business will be adversely affected if future economic activity in the Alberta oil sands were to further decline. Major factors that could cause such a decline might include a prolonged reduction in the commodity price of oil, future changes in environmental restrictions and regulations, and technological and regulatory changes relating to production of oil from the oil sands. The downturn in worldwide economic conditions and in the commodity price of oil and gas which has recently occurred and continues to occur has caused certain of our customers to delay a number of large projects in the planning and early development phases within the oil sands region. In addition, customers are revisiting their operating budgets and challenging their suppliers to reduce costs and achieve better efficiencies in their work programs.
Although we plan to carve-out our Oil and Gas Field Services and Lodging Services segments into a stand-alone new public company, there is no assurance if and when such carve-out will occur. Furthermore, even if and when such carve-out does occur, we will remain subject to the risks now associated with our Oil and Gas Field Services and Lodging Services segments as long as we retain a significant ownership interest in such new public company.
On January 20, 2015, we announced that we plan to carve out primarily our Oil and Gas Field Services segment and our lodging drill camps business from our Lodging Services segment into a new standalone public company. On May 6, 2015, we expanded the planned carve-out to include our entire Lodging Services segment as part of that new company. Timing could take more than 12 months and completion of the carve-out is subject to certain conditions including, but not limited to, market conditions, determination of the most advantageous structure from a financial and tax standpoint, overall costs to our Company, receipt of regulatory approvals, compliance with our debt covenants, the effectiveness of securities laws filings and final approval by our board of directors. There can be no assurance regarding the ultimate structure and timing of the proposed transaction or whether the transaction will be completed. Furthermore, even if and when such carve-out does occur, we will remain subject to the risks now associated with our Oil and Gas Field Services and Lodging Services segments as long as we retain a significant ownership interest in the new public company.
Risks Relating to Our Level of Debt, Letters of Credit and Senior Unsecured Notes
Our substantial levels of outstanding debt and letters of credit could adversely affect our financial condition and ability to fulfill our obligations.
As of December 31, 2015, we had outstanding $1.4 billion of senior unsecured notes and $144.6 million of letters of credit. Our substantial levels of outstanding debt and letters of credit may:
• | adversely impact our ability to obtain additional financing in the future for working capital, capital expenditures, acquisitions or other general corporate purposes or to repurchase the notes from holders upon any change of control; |
21
• | require us to dedicate a substantial portion of our cash flow to the payment of interest on our debt and fees on our letters of credit, which reduces the availability of our cash flow to fund working capital, capital expenditures, acquisitions and other general corporate purposes; |
• | subject us to the risk of increased sensitivity to interest rate increases based upon variable interest rates, including borrowings (if any) under our revolving credit facility; |
• | increase the possibility of an event of default under the financial and operating covenants contained in our debt instruments; and |
• | limit our ability to adjust to rapidly changing market conditions, reduce our ability to withstand competitive pressures and make us more vulnerable to a downturn in general economic conditions of our business than our competitors with less debt. |
Our ability to make scheduled payments of principal or interest with respect to our debt, including our outstanding notes, any revolving loans and our capital leases, and to pay fee obligations with respect to our letters of credit, will depend on our ability to generate cash and on our future financial results. If we were unable to generate sufficient cash flow from operations in the future to service our debt and letter of credit fee obligations, we might be required to refinance all or a portion of our existing debt and letter of credit facilities or to obtain new or additional such facilities. However, we might not be able to obtain any such new or additional facilities on favorable terms or at all.
Despite our substantial levels of outstanding debt and letters of credit, we could incur substantially more debt and letter of credit obligations in the future.
Although our revolving credit agreement and the indentures governing our outstanding notes contain restrictions on the incurrence of additional indebtedness (including, for this purpose, reimbursement obligations under outstanding letters of credit), these restrictions are subject to a number of qualifications and exceptions and the additional indebtedness which we might incur in the future in compliance with these restrictions could be substantial. In particular, we had available at December 31, 2015, up to an additional approximately $178.5 million for purposes of additional borrowings and letters of credit. The revolving credit agreement and the indentures governing our outstanding notes also allow us to borrow significant amounts of money from other sources. These restrictions would also not prevent us from incurring obligations (such as operating leases) that do not constitute “indebtedness” as defined in the relevant agreements. To the extent we incur in the future additional debt and letter of credit obligations, the related risks would increase.
The covenants in our debt agreements restrict our ability to operate our business and might lead to a default under our debt agreements.
Our revolving credit agreement and the indentures governing our outstanding notes limit, among other things, our ability and the ability of our restricted subsidiaries to:
• | incur or guarantee additional indebtedness (including, for this purpose, reimbursement obligations under letters of credit) or issue preferred stock; |
• | pay dividends or make other distributions to our stockholders; |
• | purchase or redeem capital stock or subordinated indebtedness; |
• | make investments; |
• | create liens; |
• | incur restrictions on the ability of our restricted subsidiaries to pay dividends or make other payments to us; |
• | sell assets, including capital stock of our subsidiaries; |
• | consolidate or merge with or into other companies or transfer all or substantially all of our assets; and |
• | engage in transactions with affiliates. |
As a result of these covenants, we may not be able to respond to changes in business and economic conditions and to obtain additional financing, if needed, and we may be prevented from engaging in transactions that might otherwise be beneficial to us. Our revolving credit facility requires, and our future credit facilities may require, us to maintain certain financial ratios and satisfy certain other financial condition tests. Our ability to meet these financial ratios and tests can be affected by events beyond our control, and we may not be able to meet those tests. The breach of any of these covenants could result in a default under our revolving credit facility or future credit facilities. Upon the occurrence of an event of default, the lenders could elect to declare all amounts outstanding under such credit facilities, including accrued interest or other obligations, to be immediately due and payable. If amounts outstanding under such credit facilities were to be accelerated, our assets might not be sufficient to repay in full that indebtedness and our other indebtedness.
22
Our revolving credit agreement and the indentures governing our outstanding notes also contain cross-default and cross-acceleration provisions. Under these provisions, a default or acceleration under one instrument governing our debt may constitute a default under our other debt instruments that contain cross-default and cross-acceleration provisions, which could result in the related debt and the debt issued under such other instruments becoming immediately due and payable. In such event, we would need to raise funds from alternative sources, which funds might not be available to us on favorable terms, on a timely basis or at all. Alternatively, such a default could require us to sell assets and otherwise curtail operations to pay our creditors. The proceeds of such a sale of assets, or curtailment of operations, might not enable us to pay all of our liabilities.
Other Risks Relating to Our Common Stock
The Massachusetts Business Corporation Act and our By-Laws contain certain anti-takeover provisions.
Sections 8.06 and 7.02 of the Massachusetts Business Corporation Act provide that Massachusetts corporations which are publicly-held must have a staggered board of directors and that written demand by holders of at least 40% of the outstanding shares of each relevant voting group of stockholders is required for stockholders to call a special meeting unless such corporations take certain actions to affirmatively "opt-out" of such requirements. In accordance with these provisions, our By-Laws provide for a staggered Board of Directors which consists of three classes of directors of which one class is elected each year for a three-year term, and require that written application by holders of at least 25% (which is less than the 40% which would otherwise be applicable without such a specific provision in our By-Laws) of our outstanding shares of common stock is required for stockholders to call a special meeting. In addition, our By-Laws prohibit the removal by the stockholders of a director except for cause. These provisions could inhibit a takeover of our Company by restricting stockholders' action to replace the existing directors or approve other actions which a party seeking to acquire us might propose. A takeover transaction would frequently afford stockholders an opportunity to sell their shares at a premium over then market prices.
ITEM 1B. UNRESOLVED STAFF COMMENTS
Not applicable.
ITEM 2. PROPERTIES
Our principal executive offices are in Norwell, Massachusetts where approximately 151,000 square feet is leased under arrangements expiring in 2022. There are also regional administrative offices in Texas, South Carolina and Alberta, Canada. Our properties are sufficient and suitable for our current needs.
We have a network of more than 450 service locations across 47 states, eight Canadian provinces, Puerto Rico, Mexico, and Trinidad. Those service locations include service centers, satellite locations, branches, active hazardous waste management properties, lodging facilities and oil processing facilities. The service centers and branches are the principal sales and service centers from which we provide our environmental, energy and industrial services. The active hazardous waste management properties include incineration facilities, commercial and non-commercial landfills, wastewater treatment facilities, treatment, storage and disposal facilities ("TSDFs"), solvent recovery management and recycling facilities, locations specializing in polychlorinated biphenyls ("PCBs") management, oil accumulation centers, oil terminals and oil re-refineries. Some of our properties offer multiple capabilities. The following sets forth certain information as of December 31, 2015 regarding our properties. Our principal owned operating properties located in the United States are mortgaged as collateral under our revolving credit facility.
Service Centers, Satellite Locations and Branches
We have approximately 330 service centers, satellite locations and branches throughout the United States and Canada which serve as principal sales and service centers from which we provide parts cleaning services, containerized waste services, oil collection services and other environmental services.
23
Active Hazardous Waste Management Properties
Incineration Facilities. We own five operating incineration facilities that have a total of eight incinerators with 491,721 tons of total practical capacity and an average utilization rate for 2015 of 90.9%. The Company’s practical capacity is not based on a theoretical 24-hour, seven-day operation, but rather is determined as the production level at which the incinerator can operate with an acceptable degree of efficiency, taking into consideration factors such as longer term customer demand, permanent staffing levels, operating shifts, holidays, scheduled maintenance and mix of product. Capacity utilization is calculated by dividing actual production pounds by practical capacity at each incinerator.
# of Incinerators | Practical Capacity (Tons) | Utilization Rate Year Ended December 31, 2015 | ||||||
Arkansas | 2 | 95,072 | 80.5 | % | ||||
Nebraska | 1 | 58,808 | 79.2 | % | ||||
Utah | 1 | 66,815 | 83.0 | % | ||||
Texas | 3 | 165,500 | 94.6 | % | ||||
Ontario, Canada | 1 | 105,526 | 105.9 | % | ||||
8 | 491,721 | 90.9 | % | |||||
Our incinerators offer a wide range of technological capabilities to customers through this network. Incineration in the United States is provided by one fluidized bed thermal oxidation unit and three solids and liquids-capable incineration facilities and in Canada, we operate one active hazardous waste liquid injection incinerator. In addition, construction remains on schedule at our state-of-the-art hazardous waste incinerator at our El Dorado, Arkansas site. We expect this facility, the largest internal investment in Clean Harbors’ history, to become commercially operational by year’s end and to add approximately 70,000 tons of additional capacity.
Commercial and Non-Commercial Landfills. In the United States and Canada, we operate nine commercial landfills with approximately 29.3 million cubic yards of remaining highly probable airspace. Seven of our commercial landfills are designed and permitted for the disposal of hazardous wastes and two landfills are operated for nonhazardous industrial waste disposal and, to a lesser extent, municipal solid waste. In addition to our commercial landfills, we also own and operate two non-commercial landfills that only accept waste from our on-site incinerators. See "Landfill Accounting" within Note 2, "Significant Accounting Policies," to our consolidated financial statements included in Item 8 of this report for additional information on our commercial and non-commercial landfills.
Wastewater Treatment Facilities. We operate a total of seven facilities, of which five are owned and two are leased, that offer a range of wastewater treatment technologies and customer services. Wastewater treatment consists primarily of three types of services: hazardous wastewater treatment, sludge de-watering or drying, and non-hazardous wastewater treatment.
Treatment, Storage and Disposal Facilities. We operate 22 TSDFs, of which 20 are owned and two are leased, in the United States and Canada. Our TSDFs facilitate the movement of materials among our network of service centers and treatment and disposal facilities. Transportation may be accomplished by truck, rail, barge or a combination of modes, with our own assets or in conjunction with third-party transporters. Specially designed containment systems, vehicles and other equipment permitted for hazardous and industrial waste transport, together with drivers trained in transportation and waste handling procedures, provide for the movement of customer waste streams.
Solvent Recovery Management and Recycling Operations. We own two facilities specializing in solvent recovery management.
PCB Management Facilities and Oil Storage or Recycling Capabilities. We operate nine facilities, of which seven are owned and two are leased, specializing in PCB management or providing oil recycling capabilities.
Lodging Facilities
Lodge Operations. We operate seven fixed lodges, all of which are owned and located on sites in Alberta, Canada that are leased under long term operating agreements.
24
Camps. We operate various camp facilities that can grow and shrink in size and location. Generally, we have ongoing operations at 2-4 larger facilities that we expect to operate on a multi-year basis. Additionally, in our fleet we can operate five office complexes, six mini-camps, and approximately 50 single and double occupancy drill camps. All of our camp facilities are owned and located on various sites throughout Western Canada. Sites for the larger facilities are generally leased, whereas sites for the smaller facilities are generally provided by our customers.
Oil Processing Facilities
Oil Accumulation Centers. We operate a total of nine accumulation centers, of which eight are owned and one is leased, used for accumulating waste oil from our branches.
Oil Terminals. We operate a total of 56 oil terminals, of which 25 are owned and 31 are leased, which collect or process used oil prior to delivery to re-refineries or distribution as RFO.
Oil Recycling and Re-refining Facilities. With our recent acquisition we now own four oil re-refineries, three in the United States and one in Canada. With more than 200 million gallons of used oil processed annually, we were able to return in 2015 over 160 million gallons of new re-refined oil, lubricants and byproducts back into the marketplace.
ITEM 3. LEGAL PROCEEDINGS
See Note 16, "Commitments and Contingencies," to our consolidated financial statements included in Item 8 of this report for a description of legal proceedings.
ITEM 4. MINE SAFETY DISCLOSURES
Not applicable.
25
PART II
ITEM 5. MARKET FOR REGISTRANT'S COMMON EQUITY, RELATED STOCKHOLDER MATTERS AND ISSUER PURCHASES OF EQUITY SECURITIES
Common Stock
Our common stock trades on the New York Stock Exchange (the "NYSE") under the symbol CLH. The following table sets forth the high and low sales prices of our common stock for the indicated periods as reported by the NYSE.
2015 | 2014 | ||||||||||||||
High | Low | High | Low | ||||||||||||
First Quarter | $ | 58.44 | $ | 44.70 | $ | 60.47 | $ | 44.95 | |||||||
Second Quarter | $ | 59.29 | $ | 50.65 | $ | 64.30 | $ | 52.02 | |||||||
Third Quarter | $ | 54.31 | $ | 43.00 | $ | 65.53 | $ | 53.66 | |||||||
Fourth Quarter | $ | 48.05 | $ | 39.89 | $ | 53.84 | $ | 43.05 | |||||||
On February 19, 2016, the closing price of our common stock on the NYSE was $42.53 and there were 301 stockholders of record of our common stock, excluding stockholders whose shares were held in nominee, or "street," name. We estimate that approximately 24,800 additional stockholders beneficially held shares in street name on that date.
We have never declared nor paid any cash dividends on our common stock, and we do not intend to pay any dividends on our common stock in the foreseeable future. We intend to retain our future earnings, if any, for use in the operation and expansion of our business, payment of our outstanding debt and our stock repurchase program. In addition, our current credit agreement and indentures limit the amount we could pay as cash dividends on, or for repurchase of, our common stock. See "Liquidity and Capital Resources" under Item 7, "Management's Discussion and Analysis of Financial Condition and Results of Operations" for additional information.
Issuer Purchases of Equity Securities
______________________
Period | Total Number of Shares Purchased (1) | Average Price Paid Per Share (2) | Total Number of Shares Purchased as Part of Publicly Announced Plans or Programs | Approximate Dollar Value of Shares that May Yet Be Purchased Under the Plans or Programs (3) | |||||||||
October 1, 2015 through October 31, 2015 | 78,903 | $ | 45.07 | 78,398 | $ | 122,311,562 | |||||||
November 1, 2015 through November 30, 2015 | 421 | $ | 46.49 | — | $ | 122,311,562 | |||||||
December 1, 2015 through December 31, 2015 | 2,161 | $ | 41.44 | — | $ | 122,311,562 | |||||||
Total | 81,485 | $ | 44.98 | 78,398 | $ | 122,311,562 | |||||||
(1) | Includes 3,087 shares withheld by us from employees to satisfy employee tax obligations upon vesting of restricted stock units granted to our employees under our long-term equity incentive programs. |
(2) | The average price paid per share of common stock repurchased under our stock repurchase program includes the commissions paid to the brokers. |
(3) | On March 13, 2015, our board of directors increased the size of our current share repurchase program from up to $150 million to up to $300 million. We intend to fund the repurchases through available cash resources. The stock repurchase program authorizes us to purchase our common stock on the open market from time to time. The stock repurchases will be made in a manner that complies with applicable U.S. securities laws. The number of shares purchased and the timing of the purchases will depend on a number of factors, including share price, cash required for future business plans, trading volume and other conditions. We have no obligation to repurchase stock under this program and may suspend or terminate the repurchase program at any time. |
26
COMPARISON OF 5-YEAR CUMULATIVE TOTAL RETURN
AMONG CLEAN HARBORS, INC.,
NYSE COMPOSITE INDEX, AND CUSTOM PEER GROUP
Performance Graph
The following graph compares the five-year return from investing $100 in each of our common stock, the NYSE Composite Index, and an index of environmental services companies (custom peer group) compiled by CoreData. The environmental services group used by CoreData includes all companies whose listed line-of-business is SIC Code 4953 (refuse systems), and assumes reinvestment of dividends on the ex-dividend date. An index compares relative performance since a particular starting date. In this instance, the starting date was December 31, 2010, when our common stock closed at $42.04 per share.
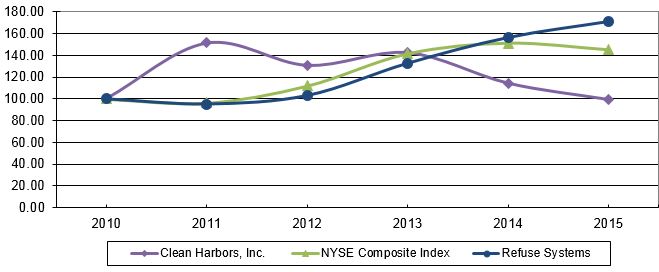
ASSUMES $100 INVESTED ON JAN. 01, 2010
ASSUMES DIVIDEND REINVESTED
Securities Authorized For Issuance Under Equity Compensation Plans
See Item 12, "Security Ownership of Certain Beneficial Owners and Management and Related Stockholder Matters," for a description of the securities which are authorized for issuance under our equity compensation plans.
27
ITEM 6. SELECTED FINANCIAL DATA
The following summary of consolidated financial information has been derived from the audited consolidated financial statements included in Item 8, "Financial Statements and Supplementary Data," of this report and in the annual reports we previously filed with the SEC. This information should be reviewed in conjunction with Item 7, "Management's Discussion and Analysis of Financial Condition and Results of Operations," and the financial statements and the notes thereto included in Item 8, "Financial Statements and Supplementary Data," of this report.
For the Year Ended December 31, | |||||||||||||||||||
(in thousands except per share amounts) | 2015 | 2014 | 2013 | 2012 | 2011 | ||||||||||||||
Income Statement Data: | |||||||||||||||||||
Total revenues | $ | 3,275,137 | $ | 3,401,636 | $ | 3,509,656 | $ | 2,187,908 | $ | 1,984,136 | |||||||||
Net income (loss) (1) | $ | 44,102 | $ | (28,328 | ) | $ | 95,566 | $ | 129,674 | $ | 127,252 | ||||||||
Earnings (loss) per share: (1)(2) | |||||||||||||||||||
Basic | $ | 0.76 | $ | (0.47 | ) | $ | 1.58 | $ | 2.41 | $ | 2.40 | ||||||||
Diluted | $ | 0.76 | $ | (0.47 | ) | $ | 1.57 | $ | 2.40 | $ | 2.39 | ||||||||
Other Financial Data: | |||||||||||||||||||
Adjusted EBITDA (3) | $ | 504,167 | $ | 521,919 | $ | 510,105 | $ | 373,767 | $ | 350,008 | |||||||||
At December 31, | |||||||||||||||||||
(in thousands) | 2015 | 2014 | 2013 | 2012 | 2011 | ||||||||||||||
Balance Sheet Data: | |||||||||||||||||||
Total assets (4) | $ | 3,431,428 | $ | 3,689,423 | $ | 3,936,430 | $ | 3,819,338 | $ | 2,076,089 | |||||||||
Long-term obligations (including current portion) (4) | 1,382,543 | 1,380,681 | 1,385,516 | 1,389,223 | 529,174 | ||||||||||||||
Stockholders' equity (2) | 1,096,282 | 1,262,871 | 1,475,639 | 1,432,072 | 900,987 | ||||||||||||||
___________________________________________
(1) | The 2015 results include a $32.0 million goodwill impairment charge in our Oil and Gas Field Services reporting unit and the 2014 results include a $123.4 million goodwill impairment charge in our Kleen Performance Products reporting unit. In 2015 and 2014, we recorded an income tax benefit of $2.0 million and $2.7 million, respectively, as a result of the goodwill impairment charge. See Note 6, "Goodwill and Other Intangible Assets," to our consolidated financial statements included in Item 8 of this report for additional information regarding those goodwill impairment charges. The 2012 results include a $26.4 million loss on early extinguishment of debt in connection with a redemption and repurchase of our $520.0 million previously outstanding senior secured notes and a benefit for income taxes of $1.9 million primarily due to a decrease in unrecognized tax benefits of $52.4 million (net of interest and penalties of $29.3 million) resulting from expiring statute of limitation periods related to a historical Canadian debt restructuring transaction. |
(2) | We issued 6.9 million shares of our common stock in December 2012 upon the closing of a public offering for aggregate net proceeds of $369.3 million. |
(3) | See "Adjusted EBITDA" under Item 7, "Management's Discussion and Analysis of Financial Condition and Results of Operations," of this report for a discussion of Adjusted EBITDA. |
(4) | As a result of the adoption of a new accounting pronouncement issued in 2015 and discussed further in Note 2 under item 8, "Financial Statements and Supplementary Data" under the heading Recent Accounting Pronouncements, total assets and long-term obligations previously reported in prior period financial statements have been reclassified in accordance with the adopted pronouncements. |
28
ITEM 7. MANAGEMENT'S DISCUSSION AND ANALYSIS OF FINANCIAL CONDITION AND RESULTS OF OPERATIONS
Overview
We are North America’s leading provider of environmental, energy and industrial services. We serve a diverse customer base, including a majority of the Fortune 500, across the chemical, energy, manufacturing and additional markets, as well as numerous government agencies. These customers rely on us to deliver a broad range of services including but not limited to end-to-end hazardous waste management, emergency spill response, industrial cleaning and maintenance, and recycling services. Through our acquisition in December 2012 of Safety-Kleen, Inc. ("Safety-Kleen"), we are also the largest re-refiner and recycler of used oil in the world and the largest provider of parts cleaning and environmental services to commercial, industrial and automotive customers in North America. On April 11, 2015, we acquired Thermo Fluids Inc. ("TFI") for an estimated preliminary acquisition price of approximately $78.6 million. Results of this business are included in the SK Environmental Services segment.
Performance of our segments is evaluated on several factors of which the primary financial measure is Adjusted EBITDA as described more fully below. The following is a discussion of how management evaluates its segments in regards to other factors including key performance indicators that management uses to assess the segments’ results as well as certain macroeconomic trends and influences that impact each reportable segment:
• | Technical Services - Technical Services segment results are predicated upon the demand by our customers for waste services directly attributable to waste volumes generated by them and the existence of project work contracted by the Technical Services segment and/or other segments of Clean Harbors whereby waste handling and/or disposal is required. In managing the business and evaluating performance, management tracks the volumes of waste handled and disposed of through our owned incinerators and landfills as well as the utilization of such incinerators. Levels of activity and ultimate performance associated with this segment can be impacted by inherent seasonality in the business and weather conditions, market conditions and overall levels of industrial activity, efficiency of our operations, competition and market pricing of our services and the management of our related operating costs. |
• | Industrial and Field Services - Industrial and Field Services segment results are impacted by the demand for planned and unplanned industrial related cleaning and maintenance services at customer sites and the requirement for environmental cleanup services on a scheduled or emergency basis, including response to national events such as major oil spills, natural disasters or other events where immediate and specialized services are pertinent. Management considers the number of plant sites where services are contracted and expected site turnaround schedules to be indicators of the businesses’ performance along with the existence of local or national events. |
• | Kleen Performance Products - Kleen Performance Products results are significantly impacted by the overall market pricing and product mix associated with base and blended oil products and more specifically the published prices of Group II base oils, which historically have seen correlation with overall crude oil prices which experienced significant declines for much of 2014 and into 2015. Costs associated with used oils, which are raw materials associated with the segment’s products, can also be volatile as was the case for much of 2014 and into 2015 when such costs were disconnected from market pricing of the based and blended oil products sold by the segment. Given the impact of these falling prices, we are now charging disposal rates in order to mitigate the market-derived pressure on our margins and avoid further deterioration in the existing spread. |
• | SK Environmental Services - SK Environmental Services segment results are significantly impacted by the number of parts washers serviced by the business and the ability to attract small quantity waste producers as customers and integrate them into the Clean Harbors waste network. Performance is also predicated upon the segment management’s ability to manage related costs associated with transportation and the servicing of customers and successfully managing costs associated with the collection of used oils which are then transferred to the Kleen Performance Products segment. |
• | Lodging Services - Lodging Services segment results are dependent upon levels of construction and maintenance activity associated with the oil and related industries in the Oil Sands and other regions of Western Canada in which our camps and lodges operate and demand for our modular unit production. Levels of overall activity in these regions drive the demand and related pricing for lodging and camp accommodations and related services. To mitigate the decrease in demand experienced in this business we have targeted more non-traditional markets such as schools and hospitals to offer our modular unit accommodations and related services. Given that segment |
29
operations are located entirely in Canada the impact of foreign currency translations which result from changes in the exchange rates between the U.S. and Canadian dollar can significantly impact the amounts associated with overall business results.
• | Oil and Gas Field Services - Oil and Gas Field Services segment results are significantly impacted by overall levels of oil and gas related exploration, drilling activity and production in North America. The levels of such exploration, drilling activity and production are largely dependent upon the number of oil rigs in operation as well as global and North American oil prices on which such activity levels are strongly predicated. Since the third quarter of 2014 crude oil prices have declined approximately 62%. This recent oil price volatility and future price uncertainty has resulted in lower activity levels which are negatively impacting the business’ results. The majority of the segment's operations are in Canada, and therefore the impacts of US to Canadian dollar foreign currency translation also significantly impacts the segment’s results. |
Highlights
Total revenues for 2015 decreased 3.7% to $3.28 billion from $3.40 billion in 2014. Decreases in total revenue were primarily attributable to lower revenues in those segments most impacted by the low oil price environment which existed in 2015, along with corresponding decreases in base oil prices. Our Kleen Performance Products, Oil and Gas Field Services and Lodging Services segments were significantly and negatively impacted by lower oil prices in 2015. The results in these segments were partially offset by significant revenues earned by the Industrial and Field Services segment from emergency response projects and increased U.S. industrial turnaround activity which occurred in 2015. The weakening Canadian dollar and related effects of foreign currency translation on our Canadian business operations also negatively impacted direct revenues by approximately $108.3 million in 2015 as compared to 2014. Changes in segment revenues are more fully described in our Segment Performance section below.
We reported income from operations in 2015 of $187.6 million compared with $111.8 million in 2014. Income from operations in 2015 included a $32.0 million goodwill impairment charge recorded on our Oil and Gas Field Services reporting unit, while income from operations in 2014 included a $123.4 million goodwill impairment charge recorded on our Kleen Performance Products reporting unit. Adjusted EBITDA, which is the primary financial measure by which our segments are evaluated, decreased 3.4% to $504.2 million for 2015 from $521.9 million for 2014. Additional information, including a reconciliation of Adjusted EBITDA to net income (loss), appears below under the heading "Adjusted EBITDA."
30
Segment Performance
Performance of our segments is evaluated on several factors of which the primary financial measure is Adjusted EBITDA. The following table sets forth certain operating data associated with our results of operations for the years ended December 31, 2015, 2014 and 2013.
___________________________________
Summary of Operations (in thousands) | |||||||||||||||||||||||||
Year Ended December 31, | 2015 over 2014 | 2014 over 2013 | |||||||||||||||||||||||
2015 | 2014 | 2013 | $ Change | % Change | $ Change | % Change | |||||||||||||||||||
Third Party Revenues(1): | |||||||||||||||||||||||||
Technical Services | $ | 991,410 | $ | 1,043,267 | $ | 1,023,926 | $ | (51,857 | ) | (5.0 | )% | $ | 19,341 | 1.9 | % | ||||||||||
Industrial and Field Services | 957,337 | 681,779 | 708,523 | 275,558 | 40.4 | (26,744 | ) | (3.8 | ) | ||||||||||||||||
Kleen Performance Products | 386,824 | 533,587 | 528,636 | (146,763 | ) | (27.5 | ) | 4,951 | 100.0 | ||||||||||||||||
SK Environmental Services | 674,102 | 667,320 | 665,008 | 6,782 | 1.0 | 2,312 | 100.0 | ||||||||||||||||||
Lodging Services | 89,060 | 172,218 | 208,545 | (83,158 | ) | (48.3 | ) | (36,327 | ) | (17.4 | ) | ||||||||||||||
Oil and Gas Field Services | 175,946 | 303,189 | 383,959 | (127,243 | ) | (42.0 | ) | (80,770 | ) | (21.0 | ) | ||||||||||||||
Corporate Items(2) | 458 | 276 | (8,941 | ) | 182 | (65.9 | ) | 9,217 | (103.1 | ) | |||||||||||||||
Total | $ | 3,275,137 | $ | 3,401,636 | $ | 3,509,656 | $ | (126,499 | ) | (3.7 | )% | $ | (108,020 | ) | (3.1 | )% | |||||||||
Direct Revenues(1): | |||||||||||||||||||||||||
Technical Services | $ | 1,139,080 | $ | 1,205,383 | $ | 1,147,815 | $ | (66,303 | ) | (5.5 | )% | $ | 57,568 | 5.0 | % | ||||||||||
Industrial and Field Services | 923,599 | 639,369 | 663,589 | 284,230 | 44.5 | (24,220 | ) | (3.6 | ) | ||||||||||||||||
Kleen Performance Products | 306,825 | 331,723 | 335,627 | (24,898 | ) | (7.5 | ) | (3,904 | ) | (1.2 | ) | ||||||||||||||
SK Environmental Services | 634,864 | 747,739 | 772,099 | (112,875 | ) | (15.1 | ) | (24,360 | ) | (3.2 | ) | ||||||||||||||
Lodging Services | 91,713 | 174,732 | 212,385 | (83,019 | ) | (47.5 | ) | (37,653 | ) | (17.7 | ) | ||||||||||||||
Oil and Gas Field Services | 181,780 | 308,270 | 390,505 | (126,490 | ) | (41.0 | ) | (82,235 | ) | (21.1 | ) | ||||||||||||||
Corporate Items(2) | (2,724 | ) | (5,580 | ) | (12,364 | ) | 2,856 | 51.2 | 6,784 | 54.9 | |||||||||||||||
Total | 3,275,137 | 3,401,636 | 3,509,656 | (126,499 | ) | (3.7 | ) | (108,020 | ) | (3.1 | ) | ||||||||||||||
Cost of Revenues(3): | |||||||||||||||||||||||||
Technical Services | 769,625 | 791,824 | 779,472 | (22,199 | ) | (2.8 | ) | 12,352 | 1.6 | ||||||||||||||||
Industrial and Field Services | 706,093 | 499,423 | 513,519 | 206,670 | 41.4 | (14,096 | ) | (2.7 | ) | ||||||||||||||||
Kleen Performance Products | 258,653 | 264,437 | 259,905 | (5,784 | ) | (2.2 | ) | 4,532 | 100.0 | ||||||||||||||||
SK Environmental Services | 390,664 | 524,280 | 551,129 | (133,616 | ) | (25.5 | ) | (26,849 | ) | 100.0 | |||||||||||||||
Lodging Services | 70,331 | 108,066 | 127,259 | (37,735 | ) | (34.9 | ) | (19,193 | ) | (15.1 | ) | ||||||||||||||
Oil and Gas Field Services | 160,840 | 244,642 | 295,659 | (83,802 | ) | (34.3 | ) | (51,017 | ) | (17.3 | ) | ||||||||||||||
Corporate Items(2) | 600 | 9,124 | 15,690 | (8,524 | ) | (93.4 | ) | (6,566 | ) | (41.8 | ) | ||||||||||||||
Total | 2,356,806 | 2,441,796 | 2,542,633 | (84,990 | ) | (3.5 | ) | (100,837 | ) | (4.0 | ) | ||||||||||||||
Selling, General and Administrative Expenses: | |||||||||||||||||||||||||
Technical Services | 77,718 | 85,429 | 82,823 | (7,711 | ) | (9.0 | ) | 2,606 | 3.1 | ||||||||||||||||
Industrial and Field Services | 60,006 | 52,355 | 53,266 | 7,651 | 14.6 | (911 | ) | (1.7 | ) | ||||||||||||||||
Kleen Performance Products | 15,983 | 15,725 | 18,719 | 258 | 1.6 | (2,994 | ) | 100.0 | |||||||||||||||||
SK Environmental Services | 104,127 | 109,473 | 108,248 | (5,346 | ) | (4.9 | ) | 1,225 | 100.0 | ||||||||||||||||
Lodging Services | 4,904 | 5,228 | 4,768 | (324 | ) | (6.2 | ) | 460 | 9.6 | ||||||||||||||||
Oil and Gas Field Services | 21,767 | 23,514 | 26,991 | (1,747 | ) | (7.4 | ) | (3,477 | ) | (12.9 | ) | ||||||||||||||
Corporate Items | 129,659 | 146,197 | 175,662 | (16,538 | ) | (11.3 | ) | (29,465 | ) | (16.8 | ) | ||||||||||||||
Total | 414,164 | 437,921 | 470,477 | (23,757 | ) | (5.4 | ) | (32,556 | ) | (6.9 | ) | ||||||||||||||
Adjusted EBITDA | |||||||||||||||||||||||||
Technical Services | 291,737 | 328,130 | 285,520 | (36,393 | ) | (11.1 | ) | 42,610 | 14.9 | ||||||||||||||||
Industrial and Field Services | 157,500 | 87,591 | 96,804 | 69,909 | 79.8 | (9,213 | ) | (9.5 | ) | ||||||||||||||||
Kleen Performance Products | 32,189 | 51,561 | 57,003 | (19,372 | ) | (37.6 | ) | (5,442 | ) | 100.0 | |||||||||||||||
SK Environmental Services | 140,073 | 113,986 | 112,722 | 26,087 | 22.9 | 1,264 | 100.0 | ||||||||||||||||||
Lodging Services | 16,478 | 61,438 | 80,358 | (44,960 | ) | (73.2 | ) | (18,920 | ) | (23.5 | ) | ||||||||||||||
Oil and Gas Field Services | (827 | ) | 40,114 | 67,855 | (40,941 | ) | (102.1 | ) | (27,741 | ) | (40.9 | ) | |||||||||||||
Corporate Items | (132,983 | ) | (160,901 | ) | (190,157 | ) | 27,918 | 17.4 | 29,256 | 15.4 | |||||||||||||||
Total | $ | 504,167 | $ | 521,919 | $ | 510,105 | $ | (17,752 | ) | (3.4 | )% | $ | 11,814 | 2.3 | % | ||||||||||
(1) | Third party revenue is revenue billed to outside customers by a particular segment. Direct revenue is revenue allocated to the segment performing the provided service. |
(2) | Corporate Items revenues and costs of revenues for the year ended December 31, 2013 includes purchase price measurement period adjustments. |
(3) | Cost of revenue is shown exclusive of items presented separately on the statements of income, which consist of (i) accretion of environmental liabilities and (ii) depreciation and amortization. |
31
Direct Revenues
There are many factors which have impacted, and continue to impact, our revenues. These factors include, but are not limited to: foreign currency translation, acquisitions, general conditions of the oil and gas related industries, competitive industry pricing, the effects of fuel prices on our fuel recovery fees, and the level of emergency response projects.
Technical Services
For the years ended December 31, | 2015 over 2014 | 2014 over 2013 | |||||||||||||||||||||||
2015 | 2014 | 2013 | $ Change | % Change | $ Change | % Change | |||||||||||||||||||
Direct revenues | $ | 1,139,080 | $ | 1,205,383 | $ | 1,147,815 | $ | (66,303 | ) | (5.5 | )% | $ | 57,568 | 5.0 | % | ||||||||||
Technical Services direct revenues for the year ended December 31, 2015 decreased 5.5%, or $66.3 million, from the comparable period in 2014 primarily due to decreased revenues associated with our waste disposal services whereby waste is disposed of through our incinerator and landfill facilities network. This direct revenue decrease was impacted by lower waste volumes disposed of in our landfills, which decreased 28.6% primarily due to lower oil and gas production waste streams and project delays. Pricing attributable to our recycled products and fuel recovery revenues were also negatively impacted from overall lower market rates. The utilization rate at our incinerators was 90.9% for year ended December 31, 2015, respectively, compared with 91.2% in the comparable period of 2014.
Direct revenues for the year ended December 31, 2014 increased 5.0% or $57.6 million, from the comparable period in 2013 primarily due to increased revenues associated with our waste disposal services whereby waste is disposed of through our incinerator and landfill facilities network. This direct revenue increase was primarily due to higher waste volumes disposed of in our landfills, which increased 10.0%. In 2014, we made several upgrades and enhancements to our Canada incinerator increasing its practical capacity by approximately 12,000 tons. The utilization rate at our incinerators was 91.2% for the year ended December 31, 2014, compared with 89.2% in the comparable period of 2013.
Industrial and Field Services
For the years ended December 31, | 2015 over 2014 | 2014 over 2013 | |||||||||||||||||||||||
2015 | 2014 | 2013 | $ Change | % Change | $ Change | % Change | |||||||||||||||||||
Direct revenues | $ | 923,599 | $ | 639,369 | $ | 663,589 | $ | 284,230 | 44.5 | % | $ | (24,220 | ) | (3.6 | )% | ||||||||||
Industrial and Field Services direct revenues for the year ended December 31, 2015 increased 44.5%, or $284.2 million, from the comparable period in 2014. The increase was primarily due to revenues associated with our Field Services business, which included emergency response service projects that took place during 2015 and accounted for approximately $306.6 million of incremental revenues for the year ended December 31, 2015. The significant level of emergency response projects responded to during 2015 included services primarily in response to outbreaks of the avian flu and oil spill related incidents. In addition, for the year ended December 31, 2015, U.S. industrial turnaround activity primarily at refineries increased $13.4 million from the comparable period in 2014. This increase was offset primarily by lower revenue amounts generated from industrial services work performed in the Oil Sands region of Canada. Lower activity levels in this region reduced customer maintenance and projects, which negatively impacted our revenues by $40.0 million in the year ended December 31, 2015, from the comparable period in 2014. Inclusive in the year over year changes within this segment were also the negative impacts of foreign currency translation on our Canadian operations of approximately $31.8 million as a result of the weakening Canadian dollar in the year ended December 31, 2015 from the comparable period in 2014.
Direct revenues for the year ended December 31, 2014 decreased 3.6%, or $24.2 million, from the comparable period in 2013, primarily due to decreasing global oil prices which were a catalyst to lower levels of activity in 2014. These lower activity levels in 2014 accounted for decreases and postponements of plant turnaround services which, combined with the natural cyclicality of such planned turnaround activity, amounted to $20.5 million of decreased revenues as compared to the comparable period of 2013. Inclusive in the year over year changes within this segment were also the negative impacts of foreign currency translation on our Canadian operations of approximately $12.9 million as a result of the weakening Canadian dollar in the year ended December 31, 2014 from the comparable period in 2013.
32
Kleen Performance Products
For the years ended December 31, | 2015 over 2014 | 2014 over 2013 | |||||||||||||||||||||||
2015 | 2014 | 2013 | $ Change | % Change | $ Change | % Change | |||||||||||||||||||
Direct revenues | $ | 306,825 | $ | 331,723 | $ | 335,627 | $ | (24,898 | ) | (7.5 | )% | $ | (3,904 | ) | (1.2 | )% | |||||||||
Kleen Performance Products direct revenues represent third party revenues, which are earned on sales to external customers, reduced by intersegment revenues consisting of amounts paid to the SK Environmental Services segment for used oil collections, which are then further processed in manufacturing base and blended oil products sold by this segment. Direct revenues attributable to the Kleen Performance Products segment decreased 7.5%, or $24.9 million, from the comparable period in 2014. Decreases in base and blended oil volumes and decreases in pricing of oil products both had negative impacts on direct revenues in the year ended December 31, 2015. Lower volumes accounted for $20.4 million from the comparable period in 2014, with lower pricing accounting for $134.1 million from the comparable period of 2014. These negative impacts to revenues were partially offset by the lower levels of intersegment revenue related to lower reimbursement to the SK Environmental segment for used oil. As compared to the comparable period in 2014, intersegment revenues were reduced by $121.9 million during the year ended December 31, 2015. Inclusive in the year over year changes within this segment were also the negative impacts of foreign currency translation on our Canadian operations of approximately $13.2 million as a result of the weakening Canadian dollar in the year ended December 31, 2015 from the comparable period in 2014.
Direct revenues for the year ended December 31, 2014 decreased 1.2%, or $3.9 million, from the comparable period in 2013. Decreases in base and blended oil pricing, as well as an increase in intersegment revenue primarily related to higher reimbursement to the SK Environmental segment for used oil, both had negative impacts on direct revenues in the year ended December 31, 2014. As compared to the comparable period in 2013, lower pricing accounted for $18.8 million and intersegment revenue accounted for $8.9 million of the reduced revenue during the year ended December 31, 2014. These negative impacts to revenues were offset by increased overall volumes primarily resulting from a full years operation of the refinery acquired in our acquisition of Evergreen on September 13, 2013. The increased volumes accounted for $27.3 million of additional revenue in 2014. Inclusive in the year over year changes within this segment were also the negative impacts of foreign currency translation on our Canadian operations of approximately $4.0 million as a result of the weakening Canadian dollar in the year ended December 31, 2014 from the comparable period in 2013.
SK Environmental Services
For the years ended December 31, | 2015 over 2014 | 2014 over 2013 | |||||||||||||||||||||||
2015 | 2014 | 2013 | $ Change | % Change | $ Change | % Change | |||||||||||||||||||
Direct revenues | $ | 634,864 | $ | 747,739 | $ | 772,099 | $ | (112,875 | ) | (15.1 | )% | $ | (24,360 | ) | (3.2 | )% | |||||||||
SK Environmental Services direct revenues include intersegment revenues earned from the sale of used oil collections to the Kleen Performance Products segment. SK Environmental Services direct revenues for the year ended December 31, 2015 decreased 15.1%, or $112.9 million, from the comparable period in 2014. This decrease was the result of expected reductions in intersegment revenues related to the sale of used oil to the Kleen Performance Products segment in the amount of approximately $153.1 million due to successful management in our pay-for-oil program. This decrease in intersegment amounts impacting direct revenues were offset in the year ended December 31, 2015 by additional revenues from the TFI acquisition of $34.4 million and increases of other services primarily related to containerized waste, Allied products and parts washers for the year ended December 31, 2015 from the comparable period in 2014.
Direct revenues for the year ended December 31, 2014 decreased 3.2%, or $24.4 million, from the comparable period in 2013. This decrease was primarily due to system integration changes which occurred in May of 2013 and changed the manner by which waste is tracked across our disposal network.
33
Lodging Services
For the years ended December 31, | 2015 over 2014 | 2014 over 2013 | |||||||||||||||||||||||
2015 | 2014 | 2013 | $ Change | % Change | $ Change | % Change | |||||||||||||||||||
Direct revenues | $ | 91,713 | $ | 174,732 | $ | 212,385 | $ | (83,019 | ) | (47.5 | )% | $ | (37,653 | ) | (17.7 | )% | |||||||||
Lodging Services direct revenues for the year ended December 31, 2015 decreased 47.5%, or $83.0 million, from the comparable period in 2014 primarily due to decreases in the occupancy rates at our lodges resulting from overall lower activity in oil related industries in Western Canada. Occupancy rates at our primary fixed lodges for the year ended December 31, 2015 were 33%, compared to 61% in the comparable period in 2014. The decrease in demand also negatively impacted pricing consistent with overall market conditions which combined resulted in decreases in direct revenue of $57.8 million for the year ended December 31, 2015 from the comparable period in 2014. Direct revenues derived from our camps and catering services also decreased $15.0 million in the year ended December 31, 2015 from the comparable period in 2014. Manufacturing revenues decreased during the year ended December 31, 2015 by $9.4 million from the comparable period in 2014 due to a large project which occurred in 2014. Inclusive in the year over year changes within this segment were also the negative impacts of foreign currency translation on our Canadian operations of approximately $14.2 million as a result of the weakening Canadian dollar in the year ended December 31, 2015 from the comparable period in 2014.
Direct revenues for the year ended December 31, 2014 decreased 17.7%, or $37.7 million, from the comparable period in 2013 primarily due to a slow down in overall market activity in the oil sands region and other areas of Western Canada where the majority of this segment operates and therefore decreased demand for our Lodging Services. The decrease in overall market demand also negatively impacted pricing, which combined with the decrease in demand, resulted in decreases in direct revenue of $16.2 million for the year ended December 31, 2014 from the comparable period in 2013. Direct revenues derived from our camps and catering services also decreased $12.2 million in the year ended December 31, 2014 from the comparable period in 2013. Manufacturing revenues decreased during the year ended December 31, 2014 by $10.0 million from the comparable period in 2013. Inclusive in the year over year changes within this segment were also the negative impacts of foreign currency translation on our Canadian operations of approximately $9.1 million as a result of the weakening Canadian dollar in the year ended December 31, 2014 from the comparable period in 2013.
Oil and Gas Field Services
For the years ended December 31, | 2015 over 2014 | 2014 over 2013 | |||||||||||||||||||||||
2015 | 2014 | 2013 | $ Change | % Change | $ Change | % Change | |||||||||||||||||||
Direct revenues | $ | 181,780 | $ | 308,270 | $ | 390,505 | $ | (126,490 | ) | (41.0 | )% | $ | (82,235 | ) | (21.1 | )% | |||||||||
Oil and Gas Field Services direct revenues for the year ended December 31, 2015 decreased 41.0%, or $126.5 million, from the comparable period in 2014 primarily due to lower levels of activity and rig counts serviced by the businesses which negatively impacted the utilization and overall pricing of our rental equipment and productions services assets. Rig count serviced by the Oil and Gas Field Services segment decreased approximately 32% in the year ended December 31, 2015 from the comparable period in 2014. Project cancellations and lower exploration budgets of our customers decreased overall activity levels in the marketplace, which also negatively impacted results in 2015. Inclusive in the year over year changes within this segment were also the negative impacts of foreign currency translation on our Canadian operations of approximately $19.6 million as a result of the weakening Canadian dollar in the year ended December 31, 2015 from the comparable period in 2014.
Direct revenues for the year ended December 31, 2014 decreased 21.1%, or $82.2 million, from the comparable period in 2013 primarily due to lower levels of activity and project delays in our exploration and production services of approximately $80.1 million related to event and project related work which occurred in 2013 and did not reoccur in 2014. The lower levels of overall activity in the Oil and Gas exploration markets which existed during 2014 were attributed to the volatility and resulting uncertainties experienced in oil pricing which, led to reductions in our customers' and the industries' operating budgets. Inclusive in the year over year changes within this segment were also the negative impacts of foreign currency translation on our Canadian operations of approximately $11.7 million as a result of the weakening Canadian dollar in the year ended December 31, 2014 from the comparable period in 2013.
34
Cost of Revenues
We believe that our ability to manage operating costs is important to our ability to remain price competitive. We continue to upgrade the quality and efficiency of our services through the development of new technology and continued modifications at our facilities, and implementation of strategic sourcing and other cost reduction initiatives in an effort to improve our operating margins.
Technical Services
For the years ended December 31, | 2015 over 2014 | 2014 over 2013 | |||||||||||||||||||||||
2015 | 2014 | 2013 | $ Change | % Change | $ Change | % Change | |||||||||||||||||||
Cost of revenues | $ | 769,625 | $ | 791,824 | $ | 779,472 | $ | (22,199 | ) | (2.8 | )% | $ | 12,352 | 1.6 | % | ||||||||||
As a % of Direct Revenue | 67.6 | % | 65.7 | % | 67.9 | % | 1.9 | % | (2.2 | )% | |||||||||||||||
Technical Services cost of revenues for the year ended December 31, 2015 decreased 2.8%, or $22.2 million, from the comparable period in 2014 due to decreases in fuel expense of $13.2 million and transportation of $9.3 million. As a percentage of revenues, our costs increased 1.9% for the year ended December 31, 2015 as compared to 2014, primarily due to lower revenue levels associated with higher margin businesses such as landfills in 2015.
Cost of revenues for the year ended December 31, 2014 increased 1.6%, or $12.4 million, from the comparable period in 2013 due to increased costs of materials and supplies of approximately $5.7 million, outside transportation costs of approximately $4.9 million and utilities costs of approximately $1.8 million. These increases primarily resulted from the incremental revenue generated during the period. As a percentage of revenues, costs decreased 2.2% basis points from operating efficiencies realized at our incinerators and further integration of Safety-Kleen into our waste network.
Industrial and Field Services
For the years ended December 31, | 2015 over 2014 | 2014 over 2013 | |||||||||||||||||||||||
2015 | 2014 | 2013 | $ Change | % Change | $ Change | % Change | |||||||||||||||||||
Cost of revenues | $ | 706,093 | $ | 499,423 | $ | 513,519 | $ | 206,670 | 41.4 | % | $ | (14,096 | ) | (2.7 | )% | ||||||||||
As a % of Direct Revenue | 76.5 | % | 78.1 | % | 77.4 | % | (1.6 | )% | 0.7 | % | |||||||||||||||
Industrial and Field Services cost of revenues for the year ended December 31, 2015 increased 41.4%, or $206.7 million, from the comparable period in 2014 primarily due to increased labor costs of $200.0 million and material costs of $13.3 million, partially offset by decreased fuel expense of $9.3 million. Increases in labor and materials in the year ended December 31, 2015 from the comparable period in 2014 were primarily due to the incremental revenue generated during that period from emergency response service projects. Costs of revenues as a percentage of direct revenue decreased 1.6% for the year ended December 31, 2015 from the comparable period in 2014 primarily due to the increased overall revenue levels experienced during 2015, which outpaced increases in cost structure as well as improved margin on emergency response and unplanned turnaround projects in our Industrial and Field Services business.
Cost of revenues for the year ended December 31, 2014 decreased 2.7%, or $14.1 million, from the comparable period in 2013 primarily due to approximately $14.5 million in decreased labor expense as a result of decreased activity in the markets in which the business operates.
Kleen Performance Products
For the years ended December 31, | 2015 over 2014 | 2014 over 2013 | |||||||||||||||||||||||
2015 | 2014 | 2013 | $ Change | % Change | $ Change | % Change | |||||||||||||||||||
Cost of revenues | $ | 258,653 | $ | 264,437 | $ | 259,905 | $ | (5,784 | ) | (2.2 | )% | $ | 4,532 | 1.7 | % | ||||||||||
As a % of Direct Revenue | 84.3 | % | 79.7 | % | 77.4 | % | 4.6 | % | 2.3 | % | |||||||||||||||
Kleen Performance Products cost of revenues for the year ended December 31, 2015 decreased 2.2%, or $5.8 million, from the comparable period in 2014. The decrease in costs was driven by savings associated with oil additives and other raw materials of $25.0 million, utility costs of $3.3 million and transportation costs of $6.2 million. These cost reductions were offset by adjustments to the value of higher priced used oil inventory on hand during the first half of the year of approximately $30.0 million. As a percentage of revenues, these costs increased 4.6% in the year ended December 31, 2015 from the comparable period in 2014 primarily as a result of the lower pricing realized in 2015 on base and blended oil products combined with the higher inventory cost that was realized during the periods shown.
35
Cost of revenues for the year ended December 31, 2014 increased 1.7%, or $4.5 million, from the comparable period in 2013 primarily due to increases of $9.0 million in rail transportation costs, $4.0 million in utilities cost, $5.2 million in materials and labor which are all associated with the acquisition of Evergreen. These increases were offset by cost savings related to transportation costs of $8.4 million and the reduced costs of oil additives and other raw materials of $8.2 million. As a percentage of revenues, these costs increased 2.3% as a result of the price declines seen in base and blended oil products primarily in the second half of 2014.
SK Environmental Services
For the years ended December 31, | 2015 over 2014 | 2014 over 2013 | |||||||||||||||||||||||
2015 | 2014 | 2013 | $ Change | % Change | $ Change | % Change | |||||||||||||||||||
Cost of revenues | $ | 390,664 | $ | 524,280 | $ | 551,129 | $ | (133,616 | ) | (25.5 | )% | $ | (26,849 | ) | (4.9 | )% | |||||||||
As a % of Direct Revenue | 61.5 | % | 70.1 | % | 71.4 | % | (8.6 | )% | (1.3 | )% | |||||||||||||||
SK Environmental Services cost of revenues for the year ended December 31, 2015 decreased 25.5%, or $133.6 million, from the comparable period in 2014 primarily due to decreases in costs attributable to used oil collections in the amounts of $151.9 million, partially offset by increases across various expense categories commensurate with the increases in parts washer services and other environmental services provided. As a percentage of revenue these costs decreased 8.6% in the year ended December 31, 2015 from the comparable period in 2014. The improved margins were most significantly impacted by the lower used oil collection costs implemented in 2015.
Cost of revenues for the year ended December 31, 2014 decreased 4.9%, or $26.8 million, from the comparable period in 2013 primarily due to decreases in costs attributable to used oil collections in the amounts of $16.2 million and solvent purchases of $10.2 million. As a percentage of revenue, these costs decreased 1.3% in the year ended December 31, 2014 from the comparable period in 2013. The improved margins were most significantly impacted by the lower used oil collection costs in 2014.
Lodging Services
For the years ended December 31, | 2015 over 2014 | 2014 over 2013 | |||||||||||||||||||||||
2015 | 2014 | 2013 | $ Change | % Change | $ Change | % Change | |||||||||||||||||||
Cost of revenues | $ | 70,331 | $ | 108,066 | $ | 127,259 | $ | (37,735 | ) | (34.9 | )% | $ | (19,193 | ) | (15.1 | )% | |||||||||
As a % of Direct Revenue | 76.7 | % | 61.8 | % | 59.9 | % | 14.9 | % | 1.9 | % | |||||||||||||||
Lodging Services cost of revenues for the year ended December 31, 2015 decreased 34.9%, or $37.7 million, from the comparable period in 2014. These changes were primarily due to decreases in production material costs associated with manufacturing of $6.9 million, catering costs of $14.2 million and labor costs of $12.0 million during the year ended December 31, 2015 from the comparable period in 2014. These decreases were the result of overall lower demand for lodging segment services as overall activity in the regions in which the business operates declined. As a percentage of direct revenues, these costs increased 14.9% in the year ended December 31, 2015 from the comparable period in 2014 as certain fixed costs incurred in the operations of our camps and lodges could not be reduced proportionate to the pricing and activity declines seen in the business.
Cost of revenues for the year ended December 31, 2014 decreased 15.1%, or $19.2 million, from the comparable period in 2013. These changes were primarily due to decreases in material costs associated with manufacturing of $9.0 million and catering costs of $9.0 million during the year ended December 31, 2014 from the comparable period in 2013. As a percentage of revenues, these costs increased 1.9% as certain fixed costs incurred in the operations of our camps and lodges could not be reduced proportionate to the pricing declines seen in the business.
Oil and Gas Field Services
For the years ended December 31, | 2015 over 2014 | 2014 over 2013 | |||||||||||||||||||||||
2015 | 2014 | 2013 | $ Change | % Change | $ Change | % Change | |||||||||||||||||||
Cost of revenues | $ | 160,840 | $ | 244,642 | $ | 295,659 | $ | (83,802 | ) | (34.3 | )% | $ | (51,017 | ) | (17.3 | )% | |||||||||
As a % of Direct Revenue | 88.5 | % | 79.4 | % | 75.7 | % | 9.1 | % | 3.7 | % | |||||||||||||||
Oil and Gas Field Services cost of revenues for the year ended December 31, 2015 decreased 34.3%, or $83.8 million, from the comparable period in 2014 primarily due to decreases in labor related costs of $35.5 million, costs associated with rental equipment of $22.6 million, fuel expense costs of $7.7 million, repairs and maintenance costs of $5.9 million and an
36
additional $12.1 million in cost reductions seen across various expense categories. As a percentage of direct revenues, these costs increased 9.1% in the year ended December 31, 2015 from the comparable period in 2014. These increases resulted from certain fixed costs incurred which could not be reduced proportionate to the overall lower revenue generated.
Cost of revenues for the year ended December 31, 2014 decreased 17.3%, or $51.0 million, from the comparable period in 2013 primarily due to decreases in labor related costs of approximately $21.3 million, costs associated with rental equipment of $11.8 million, equipment repair costs of approximately $8.6 million and fuel expense costs of $2.2 million in connection with overall lower business activity and revenues. As a percentage of revenues these costs increased 3.7% as fixed costs incurred by the business remained despite the downturn in demand for the segment’s services.
Corporate Items
For the years ended December 31, | 2015 over 2014 | 2014 over 2013 | |||||||||||||||||||||||
2015 | 2014 | 2013 | $ Change | % Change | $ Change | % Change | |||||||||||||||||||
Cost of revenues | $ | 600 | $ | 9,124 | $ | 15,690 | $ | (8,524 | ) | (93.4 | )% | $ | (6,566 | ) | (41.8 | )% | |||||||||
Corporate Items cost of revenues decreased $8.5 million for the year ended December 31, 2015 from the comparable period in 2014 primarily due to decreases in insurance related costs recorded within the corporate segment of $6.7 million.
Cost of revenues decreased $6.6 million for the year ended December 31, 2014 from the comparable period in 2013 primarily due to the impact on Safety-Kleen's non-cash acquisition inventory accounting adjustments at December 28, 2012.
Selling, General and Administrative Expenses
Selling, General and Administrative Expenses represent costs incurred in aspects of our business which are not directly attributable to the sale of our services and/or products. We strive to manage such costs commensurate with the overall performance of our segments and corresponding revenue levels. We believe that the ability to properly align these costs with overall business performance is reflective of our strong management of the businesses and further promotes our ability to remain competitive in the marketplace.
Technical Services
For the years ended December 31, | 2015 over 2014 | 2014 over 2013 | |||||||||||||||||||||||
2015 | 2014 | 2013 | $ Change | % Change | $ Change | % Change | |||||||||||||||||||
SG&A | $ | 77,718 | $ | 85,429 | $ | 82,823 | $ | (7,711 | ) | (9.0 | )% | $ | 2,606 | 3.1 | % | ||||||||||
As a % of Direct Revenue | 6.8 | % | 7.1 | % | 7.2 | % | (0.3 | )% | (0.1 | )% | |||||||||||||||
Technical Services selling, general and administrative expenses for the year ended December 31, 2015 decreased 9.0%, or $7.7 million, from the comparable period in 2014 primarily due to decreases in variable compensation of $2.7 million and changes in estimates for environmental liabilities of $3.6 million.
Selling, general and administrative expenses for the year ended December 31, 2014 increased 3.1%, or $2.6 million, from the comparable period in 2013 primarily due to increases in variable compensation of approximately $5.8 million, partially offset by cost saving initiatives of approximately $2.5 million across various expense categories.
Industrial and Field Services
For the years ended December 31, | 2015 over 2014 | 2014 over 2013 | |||||||||||||||||||||||
2015 | 2014 | 2013 | $ Change | % Change | $ Change | % Change | |||||||||||||||||||
SG&A | $ | 60,006 | $ | 52,355 | $ | 53,266 | $ | 7,651 | 14.6 | % | $ | (911 | ) | (1.7 | )% | ||||||||||
As a % of Direct Revenue | 6.5 | % | 8.2 | % | 8.0 | % | (1.7 | )% | 0.2 | % | |||||||||||||||
Industrial and Field Services selling, general and administrative expenses for the year ended December 31, 2015 increased 14.6%, or $7.7 million, from the comparable period in 2014 primarily due to increases in marketing costs of $2.5 million and professional fees of $1.4 million. As a percentage of direct revenues selling, general and administrative expense decreased 1.7% in the year ended December 31, 2015 from the comparable period in 2014 primarily due to the increased revenues attributable to this segment which were achieved without significant and incremental SG&A related costs.
37
Selling, general and administrative expenses for the year ended December 31, 2014 decreased 1.7%, or $0.9 million, from the comparable period in 2013 primarily due to cost saving initiatives across various expense categories of approximately $3.3 million partially offset by increased variable compensation of approximately $1.9 million.
Kleen Performance Products
For the years ended December 31, | 2015 over 2014 | 2014 over 2013 | |||||||||||||||||||||||
2015 | 2014 | 2013 | $ Change | % Change | $ Change | % Change | |||||||||||||||||||
SG&A | $ | 15,983 | $ | 15,725 | $ | 18,719 | $ | 258 | 1.6 | % | $ | (2,994 | ) | (16.0 | )% | ||||||||||
As a % of Direct Revenue | 5.2 | % | 4.7 | % | 5.6 | % | 0.5 | % | (0.9 | )% | |||||||||||||||
Kleen Performance Products selling, general and administrative expenses remained consistent for the year ended December 31, 2015 as compared to 2014.
Selling, general and administrative expenses for the year ended December 31, 2014 decreased 16.0%, or $3.0 million, from the comparable period in 2013 primarily due to cost saving initiatives of approximately $2.7 million across various expense categories and lower integration related professional fees of approximately $0.6 million.
SK Environmental Services
For the years ended December 31, | 2015 over 2014 | 2014 over 2013 | |||||||||||||||||||||||
2015 | 2014 | 2013 | $ Change | % Change | $ Change | % Change | |||||||||||||||||||
SG&A | $ | 104,127 | $ | 109,473 | $ | 108,248 | $ | (5,346 | ) | (4.9 | )% | $ | 1,225 | 1.1 | % | ||||||||||
As a % of Direct Revenue | 16.4 | % | 14.6 | % | 14.0 | % | 1.8 | % | 0.6 | % | |||||||||||||||
SK Environmental selling, general and administrative expenses for the year ended December 31, 2015 decreased 4.9%, or $5.3 million, from the comparable period in 2014 primarily due to decreases in marketing costs of $4.3 million and professional fees of $2.3 million. As a percentage of direct revenues, costs increased primarily due to the fact that the segment's direct revenues decreased as intersegment revenues from used oil sales were significantly reduced.
Selling, general and administrative expenses for the year ended December 31, 2014 increased 1.1%, or $1.2 million, from the comparable period in 2013 primarily due to an increase in variable compensation of approximately $4.7 million and marketing expenses of approximately $2.1 million partially offset by cost saving initiatives of approximately $6.6 million across various expense categories.
Lodging Services
For the years ended December 31, | 2015 over 2014 | 2014 over 2013 | |||||||||||||||||||||||
2015 | 2014 | 2013 | $ Change | % Change | $ Change | % Change | |||||||||||||||||||
SG&A | $ | 4,904 | $ | 5,228 | $ | 4,768 | $ | (324 | ) | (6.2 | )% | $ | 460 | 9.6 | % | ||||||||||
As a % of Direct Revenue | 5.3 | % | 3.0 | % | 2.2 | % | 2.3 | % | 0.8 | % | |||||||||||||||
Lodging Services selling, general and administrative expenses remained consistent over the year ended December 31, 2015 from the comparable period in 2014. As a percentage of direct revenues selling, general and administrative expense increased 2.3% in the year ended December 31, 2015 from the comparable period in 2014 as certain fixed costs incurred in the operations of our camps and lodges could not be reduced proportionate to the pricing declines seen in the business.
Selling, general and administrative expenses remained consistent for the year ended December 31, 2014 from the comparable period in 2013.
38
Oil and Gas Field Services
For the years ended December 31, | 2015 over 2014 | 2014 over 2013 | |||||||||||||||||||||||
2015 | 2014 | 2013 | $ Change | % Change | $ Change | % Change | |||||||||||||||||||
SG&A | $ | 21,767 | $ | 23,514 | $ | 26,991 | $ | (1,747 | ) | (7.4 | )% | $ | (3,477 | ) | (12.9 | )% | |||||||||
As a % of Direct Revenue | 12.0 | % | 7.6 | % | 6.9 | % | 4.4 | % | 0.7 | % | |||||||||||||||
Oil and Gas Field Services selling, general and administrative expenses for the year ended December 31, 2015 decreased 7.4%, or $1.7 million, from the comparable period in 2014 primarily due to decreases in salaries and benefits costs of $3.1 million partially offset by increased legal costs of $1.4 million. As a percentage of direct revenues selling, general and administrative expense increased 4.4% in the year ended December 31, 2015 from the comparable period in 2014 primarily because certain fixed costs incurred could not be reduced proportionate to the overall lower business activity.
Selling, general and administrative expenses for the year ended December 31, 2014 decreased 12.9%, or $3.5 million, from the comparable period in 2013 primarily due to decreases in labor related costs of $1.2 million and an additional $2.3 million decrease across various expense categories as a result of our cost saving initiatives.
Corporate Items
For the years ended December 31, | 2015 over 2014 | 2014 over 2013 | |||||||||||||||||||||||
2015 | 2014 | 2013 | $ Change | % Change | $ Change | % Change | |||||||||||||||||||
SG&A | $ | 129,659 | $ | 146,197 | $ | 175,662 | $ | (16,538 | ) | (11.3 | )% | $ | (29,465 | ) | (16.8 | )% | |||||||||
Corporate Items selling, general and administrative expenses for the year ended December 31, 2015 decreased 11.3%, or $16.5 million, from the comparable period in 2014 primarily due to decreases in variable compensation and related payroll taxes of $11.7 million and labor and benefit related costs of $3.0 million.
Selling, general and administrative expenses for the year ended December 31, 2014 decreased 16.8%, or $29.5 million, from the comparable period in 2013 primarily due to cost saving initiatives resulting in lower salaries and benefits expense of approximately $4.0 million, lower professional fees of approximately $14.7 million related primarily to acquisition and system integration related costs that did not reoccur in 2014 and a decrease of approximately $5.4 million of insurance related costs resulting from improved claims experience and integration synergies.
Adjusted EBITDA
Management considers Adjusted EBITDA to be a measurement of performance which provides useful information to both management and investors. Adjusted EBITDA should not be considered an alternative to net income or other measurements under generally accepted accounting principles ("GAAP"). Adjusted EBITDA is not calculated identically by all companies and, therefore our measurements of Adjusted EBITDA may not be comparable to similarly titled measures reported by other companies.
We use Adjusted EBITDA to enhance our understanding of our operating performance, which represents our views concerning our performance in the ordinary, ongoing and customary course of our operations. We historically have found it helpful, and believe that investors have found it helpful, to consider an operating measure that excludes certain expenses relating to transactions not reflective of our core operations.
The information about our operating performance provided by this financial measure is used by our management for a variety of purposes. We regularly communicate Adjusted EBITDA results to our lenders and to our board of directors and discuss with the board our interpretation of such results. We also compare our Adjusted EBITDA performance against internal targets as a key factor in determining cash bonus compensation for executives and other employees, largely because we believe that this measure is indicative of how the fundamental business is performing and is being managed.
We also provide information relating to our Adjusted EBITDA so that analysts, investors and other interested persons have the same data that we use to assess our core operating performance. We believe that Adjusted EBITDA should be viewed only as a supplement to the GAAP financial information. We also believe, however, that providing this information in addition to, and together with, GAAP financial information permits the foregoing persons to obtain a better understanding of our core operating performance and to evaluate the efficacy of the methodology and information used by management to evaluate and measure such performance on a standalone and a comparative basis.
39
The following is a reconciliation of net income to Adjusted EBITDA for the following periods (in thousands):
Year Ended December 31, | |||||||||||
2015 | 2014 | 2013 | |||||||||
Net income (loss) | $ | 44,102 | $ | (28,328 | ) | $ | 95,566 | ||||
Accretion of environmental liabilities | 10,402 | 10,612 | 11,541 | ||||||||
Depreciation and amortization | 274,194 | 276,083 | 264,449 | ||||||||
Goodwill impairment charge | 31,992 | 123,414 | — | ||||||||
Other expense (income) | 1,380 | (4,380 | ) | (1,705 | ) | ||||||
Interest expense, net | 76,553 | 77,668 | 78,376 | ||||||||
Pre-tax, non-cash acquisition accounting inventory adjustments | — | — | 13,559 | ||||||||
Provision for income taxes | 65,544 | 66,850 | 48,319 | ||||||||
Adjusted EBITDA | $ | 504,167 | $ | 521,919 | $ | 510,105 | |||||
Depreciation and Amortization
Year Ended December 31, | 2015 over 2014 | 2014 over 2013 | |||||||||||||||||||||||
(in thousands) | 2015 | 2014 | 2013 | $ Change | % Change | $ Change | % Change | ||||||||||||||||||
Depreciation of fixed assets and landfill amortization | $ | 233,998 | $ | 239,410 | $ | 229,392 | $ | (5,412 | ) | (2.3 | )% | $ | 10,018 | 4.4 | % | ||||||||||
Permits and other intangibles amortization | 40,196 | 36,673 | 35,057 | 3,523 | 9.6 | % | 1,616 | 4.6 | % | ||||||||||||||||
Total depreciation and amortization | $ | 274,194 | $ | 276,083 | $ | 264,449 | $ | (1,889 | ) | (0.7 | )% | $ | 11,634 | 4.4 | % | ||||||||||
Depreciation of fixed assets and landfill amortization decreased $5.4 million for the year ended December 31, 2015 compared to the comparable period in 2014 primarily due to lower landfill volumes generated in the year ended December 31, 2015 which resulted in $2.9 million of lower amortization in those periods. Permits and other intangibles amortization increased $3.5 million for the year ended December 31, 2015 compared to the comparable period in 2014 primarily due to an increased intangible base in 2015. The increased intangible base was attributable to intangible assets recognized in the acquisition of TFI which occurred in April of 2015.
Depreciation of fixed assets and landfill amortization increased $10.0 million for the year ended December 31, 2014 compared to the comparable period in 2013 primarily due to higher landfill volumes generated in the year ended December 31, 2014 which resulted in greater amortization in 2014. Permits and other intangibles amortization also increased $1.6 million for the year ended December 31, 2014 compared to the comparable period in 2014 primarily due to an increased intangible base in 2014. The increased intangible base was primarily attributable to intangible assets recognized in the two privately owned companies we acquired in 2014.
Goodwill impairment charge
Year Ended December 31, | 2015 over 2014 | 2014 over 2013 | |||||||||||||||||||||||
(in thousands) | 2015 | 2014 | 2013 | $ Change | % Change | $ Change | % Change | ||||||||||||||||||
Goodwill impairment charge | $ | 31,992 | $ | 123,414 | $ | — | $ | (91,422 | ) | 100.0 | % | $ | 123,414 | — | % | ||||||||||
During the year ended December 31, 2015, we recorded a $32.0 million goodwill impairment charge in our Oil and Gas Field Services reporting unit. During the year ended December 31, 2014, we recorded a $123.4 million goodwill impairment charge on our Kleen Performance Products reporting unit. For additional information regarding our 2015 and 2014 goodwill impairment charges, see the discussion under the goodwill heading within our "Critical Accounting Policies and Estimates" below.
Other (Expense) Income
Year Ended December 31, | 2015 over 2014 | 2014 over 2013 | |||||||||||||||||||||||
(in thousands) | 2015 | 2014 | 2013 | $ Change | % Change | $ Change | % Change | ||||||||||||||||||
Other (expense) income | $ | (1,380 | ) | $ | 4,380 | $ | 1,705 | $ | (5,760 | ) | (131.5 | )% | $ | 2,675 | (156.9 | )% | |||||||||
Other (expense) income decreased 131.5%, or $5.8 million, for the year ended December 31, 2015 as compared to 2014 primarily due to losses recognized on the sale of fixed assets which occurred in 2015 and 2014 gains on the sale of
40
investments which did not occur in 2015. For the year ended December 31, 2014, other (expense) income increased $2.7 million from the comparable period in 2013 primarily due to gains recognized from the sale of investments which occurred in 2014.
Provision for Income Taxes
Year Ended December 31, | 2015 over 2014 | 2014 over 2013 | |||||||||||||||||||||||
(in thousands) | 2015 | 2014 | 2013 | $ Change | % Change | $ Change | % Change | ||||||||||||||||||
Provision for income taxes | $ | 65,544 | $ | 66,850 | $ | 48,319 | $ | (1,306 | ) | (2.0 | )% | $ | 18,531 | 38.4 | % | ||||||||||
Income tax expense remained consistent over the year ended December 31, 2015 from the comparable period in 2014. Income tax expense increased $18.5 million for the year ended December 31, 2014 from the comparable period in 2013. The increase was a result of the increased earnings in the United States and the continued losses in Canada during 2014.
Effective tax rates for the years ended December 31, 2015, 2014 and 2013 were 59.8%, 173.5% and 33.6%, respectively. In 2015 and 2014, we recorded an income tax benefit of $2.0 million and $2.7 million, respectively, as a result of the goodwill impairment charge. Absent the impact of the impairment charge on pre-tax income from operations, the Company’s effective tax rate for 2015 and 2014 was 47.7% and 40.6%, respectively. The increase in the effective rates absent the impact of impairment charges for the year ended December 31, 2015 as compared to 2014 was primarily due to an increase in the proportionate share of our pre-tax income being generated by the United States operations combined with losses being generated in Canadian operations and benefiting us at a lower statutory tax rate and for an increase in the valuation allowance and true ups of deferred balances for rate increases. The increase in the effective rate absent the impact of the impairment charge for the year ended December 31, 2014 as compared to the 2013 effective rate is primarily due to an increase in the proportionate share of our pre-tax income being generated by the United States operations and the result of the release of unrecognized tax benefits in 2013.
Liquidity and Capital Resources
For the years ended December 31, | |||||||||||
(in thousands) | 2015 | 2014 | 2013 | ||||||||
Net cash from operating activities | $ | 396,383 | $ | 297,366 | $ | 415,839 | |||||
Net cash used in investing activities | (350,642 | ) | (258,294 | ) | (345,512 | ) | |||||
Net cash (used in) from financing activities | (90,179 | ) | (93,945 | ) | 13,126 | ||||||
Net cash from operating activities
Net cash from operating activities for the year ended December 31, 2015 was $396.4 million, an increase of 33.3%, or $99.0 million, compared with net cash from operating activities for the year ended December 31, 2014. The change was primarily the result of improved management of working capital in 2015, more specifically from the timing of accounts receivable collections and decreased levels of inventories and supplies as compared to the prior year. For the year ended December 31, 2014, net cash from operating activities was $297.4 million, a decrease of 28.5%, or $118.5 million, compared with cash from operating activities for the year ended December 31, 2013. The change was primarily the result of a net increase in working capital driven by the timing associated with payment of liabilities in 2014 as compared to the prior year.
Net cash used in investing activities
Net cash used in investing activities for the year ended December 31, 2015 was $350.6 million, an increase of 35.8%, or $92.3 million, compared with cash used in investing activities for the year ended December 31, 2014. The change was primarily driven by an increase in cash paid for acquisitions in 2015 and decrease in proceeds from investment sales that occurred in 2014 and did not reoccur in 2015. For the year ended December 31, 2014, net cash used in investing activities was $258.3 million, a decrease of 25.2%, or $87.2 million, compared with cash used in investing activities for the year ended December 31, 2013. The change was primarily the result of decreases in capital expenditures and cash paid for acquisitions as well as proceeds received from the sale of investments which did not occur in 2013.
41
Net cash (used in) from financing activities
Net cash used in financing activities for the year ended December 31, 2015 was $90.2 million, a decrease of 4.0%, or $3.8 million, compared with cash used in financing activities for the year ended December 31, 2014. The change in net cash used in financing activities during the year ended December 31, 2015 was primarily due to a decrease in repurchases of common stock and a reduction in payments on capital leases in 2015 as compared to 2014, offset by changes in and from the timing of uncashed checks. For the year ended December 31, 2014, net cash (used in) from financing activities was $93.9 million, a decrease of $107.1 million, compared to net cash (used in) from financing activities for the year ended December 31, 2013. The change in net cash (used in) from financing activities during the year ended December 31, 2014 was primarily due to repurchases of common stock and a $5.0 million payment of outstanding senior notes, neither of which occurred in 2013.
Working Capital
At December 31, 2015, cash and cash equivalents totaled $184.7 million, compared to $246.9 million at December 31, 2014. At December 31, 2015, cash and cash equivalents held by foreign subsidiaries totaled $90.2 million and were readily convertible into other foreign currencies including U.S. dollars. At December 31, 2015, the cash and cash equivalents balance for our U.S. operations was $94.5 million, and our U.S. operations had net operating cash flows of $324.1 million for the year ended December 31, 2015. Additionally, we have a $400.0 million revolving credit facility of which approximately $178.5 million was available to borrow at December 31, 2015. Based on the above and our current plans, we believe that our U.S. operations have adequate financial resources to satisfy their liquidity needs without being required to repatriate earnings from foreign subsidiaries. Accordingly, although repatriation to the U.S. of foreign earnings would generally be subject to U.S. income taxation, net of any available foreign tax credits, we have not recorded any deferred tax liability related to such repatriation since we intend to permanently reinvest foreign earnings outside the U.S.
We assess our liquidity in terms of our ability to generate cash to fund our operating, investing, and financing activities. Our primary ongoing cash requirements will be to fund operations, capital expenditures, interest payments and investments in line with our business strategy. We believe our future operating cash flows will be sufficient to meet our future operating and internal investing cash needs as well as any cash needs relating to our stock repurchase program. Furthermore, the existing cash balances and the availability of additional borrowings under our revolving credit facility provide additional potential sources of liquidity should they be required.
Financing Arrangements
The financing arrangements and principal terms of our $800.0 million principal amount of 5.25% senior unsecured notes due 2020 and $595.0 million principal amount of 5.125% senior unsecured notes due 2021 which were outstanding at December 31, 2015, and our $400.0 million revolving credit facility, are discussed further in Note 10, “Financing Arrangements,” to our consolidated financial statements included in Item 8 of this report.
As of December 31, 2015, we were in compliance with the covenants of all of our debt agreements, and we believe we will continue to meet such covenants.
Environmental Liabilities
As of December 31, | 2015 over 2014 | |||||||||||||
(in thousands) | 2015 | 2014 | $ Change | % Change | ||||||||||
Closure and post-closure liabilities | $ | 56,249 | $ | 50,701 | $ | 5,548 | 10.9 | % | ||||||
Remedial liabilities | 131,992 | 155,121 | (23,129 | ) | (14.9 | )% | ||||||||
Total environmental liabilities | $ | 188,241 | $ | 205,822 | $ | (17,581 | ) | (8.5 | )% | |||||
Total environmental liabilities as of December 31, 2015 were $188.2 million, a decrease of 8.5%, or $17.6 million, compared to the liabilities as of the comparable date in 2014 primarily due to expenditures and changes in estimates recorded to the statement of income partially offset by accretion.
We anticipate our environmental liabilities, substantially all of which we assumed in connection with our acquisitions, will be payable over many years and that cash flow from operations will generally be sufficient to fund the payment of such liabilities when required. However, events not anticipated (such as future changes in environmental laws and regulations) could require that such payments be made earlier or in greater amounts than currently anticipated, which could adversely affect our results of operations, cash flow and financial condition.
During each of 2015, 2014 and 2013, we benefited from reductions in our environmental liabilities due to changes in estimates recorded to the statement of income. The benefits over these years were primarily due to the successful introduction
42
of new technology for remedial activities, favorable results from environmental studies of the on-going remediation, including favorable regulatory approvals, and lower project costs realized by utilizing internal labor and equipment. The principal changes in estimates were from the following items:
In 2015, the net reduction in our environmental liabilities from changes in estimates recorded to the statement of income (loss) was $11.3 million and primarily related to reductions in the estimates for remedial activities at four locations. Events which occurred during 2015 and resulted in the changes in estimates were attributable to favorable outcomes from negotiations amongst potentially responsible parties (or “PRPs”) which we participate in of $3.8 million, the results of work performed by external third party consultants whom were engaged to aid us in estimating future remedial activity costs at certain sites of $4.7 million and the result of receiving Provincial approval for a planned expansion of one of our landfills in Canada which as a result will remediate our previously recognized obligations of $2.5 million.
In 2014, the net reduction in our environmental liabilities from changes in estimates recorded to the statement of income was $3.4 million and primarily related to reductions in the estimates associated with future monitoring costs of certain sites and favorable settlement with PRPs which we were part of.
In 2013, the net reduction in our environmental liabilities from changes in estimates recorded to the statement of income was $3.7 million and primarily related to two sites. One site received site closure approval, which resulted in reevaluating and removing certain compensation costs, and at the other site we received a favorable notification from the PRPs group which indicated that the Interim Remedial Measure work had been completed and was fully funded by a trust held by the regulatory agency and from funds collected from settling PRPs.
Contractual Obligations
The following table has been included to assist the reader in analyzing our debt and similar obligations as of December 31, 2015 and our ability to meet such obligations (in thousands):
Payments Due by Period | |||||||||||||||||||
Contractual Obligations | Total | Less than 1 year | 1-3 years | 4-5 years | After 5 years | ||||||||||||||
Closure, post-closure and remedial liabilities | $ | 457,791 | $ | 21,685 | $ | 47,973 | $ | 31,652 | $ | 356,481 | |||||||||
Long-term obligations, at par | 1,395,000 | — | — | 800,000 | 595,000 | ||||||||||||||
Interest on long-term obligations | 357,676 | 72,494 | 144,988 | 127,488 | 12,706 | ||||||||||||||
Operating leases | 142,978 | 37,064 | 51,124 | 30,403 | 24,387 | ||||||||||||||
Total contractual obligations | $ | 2,353,445 | $ | 131,243 | $ | 244,085 | $ | 989,543 | $ | 988,574 | |||||||||
The undiscounted value of closure, post closure and remedial liabilities of $457.8 million is equivalent to the present value of $188.2 million based on discounting of $182.3 million and the undiscounted remainder of $87.3 million to be accrued for closure and post-closure liabilities over the remaining site lives.
The following table has been included to assist the reader in understanding other contractual obligations we had as of December 31, 2015 and our ability to meet these obligations (in thousands):
Payments Due by Period | |||||||||||||||||||
Other Commercial Commitments | Total | Less than 1 year | 1-3 years | 4-5 years | After 5 years | ||||||||||||||
Standby letters of credit | $ | 144,573 | $ | 144,573 | $ | — | $ | — | $ | — | |||||||||
We obtained the standby letters of credit described in the above table primarily as security for financial assurances which we have been required to provide to regulatory bodies for our hazardous waste facilities and which would be called only in the event that we fail to satisfy closure, post-closure and other obligations under the permits issued by those regulatory bodies for such licensed facilities. See Note 10, "Financing Arrangements," to our consolidated financial statements included in Item 8 of this report for further discussion of our standby letters of credit and other financing arrangements.
Off-Balance Sheet Arrangements
Except for our obligations under operating leases and letters of credit described above under "Contractual Obligations" and performance obligations incurred in the ordinary course of business, we are not party to any off-balance sheet arrangements involving guarantee, contingency or similar obligations to entities whose financial statements are not consolidated with our results, and that have or are reasonably likely to have a current or future effect on our financial condition, changes in financial condition, revenues or expenses, results of operations, liquidity, capital expenditures or capital resources that would be material to investors in our securities.
43
Capital Expenditures
We anticipate that 2016 capital spending will be below $200 million. This excludes the construction of the new incinerator at our El Dorado, Arkansas facility, which will likely add $45-$50 million in 2016. However, changes in environmental regulations could require us to make significant capital expenditures for our facilities and adversely affect our results of operations and cash flow.
Stockholder Matters
On March 13, 2015, our board of directors authorized the repurchase of up to $300 million of our common stock. The repurchase program authorizes us to purchase our common stock on the open market from time to time. As of December 31, 2015, we repurchased and retired a total of approximately 3.4 million shares of our common stock for approximately $177.7 million under this program. As of December 31, 2015, an additional $122.3 million remained available for repurchase of shares under the current authorized program. We have funded and intend to fund future repurchases through available cash resources. The share repurchases have been and will be made in a manner that complies with applicable U.S. securities laws. The number of shares purchased and the timing of the purchases will depend on a number of factors, including share price, cash required for future business plans, trading volume and other conditions. We have no obligation to repurchase stock under this program and may suspend or terminate the repurchase program at any time.
Critical Accounting Policies and Estimates
The preparation of our financial statements requires us to make estimates and judgments that affect the reported amounts of our assets, liabilities, revenues and expenses, and related disclosures of contingent liabilities. The following are the areas that we believe require the greatest amount of judgments or estimates in the preparation of the financial statements: revenue allowance, allowance for doubtful accounts, accounting for landfills, non-landfill closure and post-closure liabilities, remedial liabilities, goodwill, permits and other intangible assets, insurance accruals, legal matters, and provision for income taxes. Our management reviews critical accounting estimates with the Audit Committee of our Board of Directors on an ongoing basis and as needed prior to the release of our annual financial statements. See also Note 2, "Significant Accounting Policies," to our consolidated financial statements included in Item 8 of this report, which discusses the significant assumptions used in applying our accounting policies.
Revenue Allowance. Due to the nature of our business and the invoices that result from the services we provide, customers may withhold payments and attempt to renegotiate amounts invoiced. In addition, for some of the services we provide, our invoices are based on quotes that can either generate credits or debits when the actual revenue amount is known. Accordingly, based on our industry knowledge and historical trends, we record a revenue allowance. Increases in overall sales volumes and the expansion of our customer base in recent years have also increased the volume of additions and deductions to the allowance during the year, as well as increased the amount of the allowance at the end of the year.
Our revenue allowance is intended to cover the net amount of revenue adjustments that may need to be credited to customers' accounts in future periods. We determine the appropriate total revenue allowance by evaluating the following factors on a customer-by-customer basis as well as on a consolidated level: historical collection trends, age of outstanding receivables, existing economic conditions and other information as deemed applicable. Revenue allowance estimates can differ materially from the actual adjustments, but historically our revenue allowance has been sufficient to cover the net amount of the reserve adjustments recorded in subsequent reporting periods.
Allowance for Doubtful Accounts. We establish an allowance for doubtful accounts to cover accounts receivable that may not be collectible. In establishing the allowance for doubtful accounts, we analyze the collectability of accounts that are large or past due. A considerable amount of judgment is required to make this assessment, based on detailed analysis of the aging of our receivables, the creditworthiness of our customers, our historical bad debts and other adjustments and current economic trends, for instance, seen in the oil and gas markets in Western Canada. Accounts receivable written off in subsequent periods can differ materially from the allowance for doubtful accounts provided, but historically our provision has been adequate.
Landfill Accounting. We amortize landfill improvements and certain landfill-related permits over their estimated useful lives. The units-of-consumption method is used to amortize land, landfill cell construction, asset retirement costs and remaining landfill cells and sites. We also utilize the units-of-consumption method to record closure and post-closure obligations for landfill cells and sites. Under the units-of-consumption method, we include future estimated construction and asset retirement costs, as well as costs incurred to date, in the amortization base of the landfill assets. Additionally, where appropriate, as discussed below, we include probable expansion airspace that has yet to be permitted in the calculation of the total remaining useful life of the landfill. If we determine that expansion capacity should no longer be considered in calculating the recoverability of a landfill asset, we may be required to recognize an asset impairment or incur significantly higher
44
amortization expense. If at any time we make the decision to abandon the expansion effort, the capitalized costs related to the expansion effort are expensed immediately.
Landfill Assets. Landfill assets include the costs of landfill site acquisition, permits and cell construction incurred to date. These amounts are amortized under the units-of-consumption method such that the asset is completely amortized when the landfill ceases accepting waste.
Landfill Capacity. Landfill capacity, which is the basis for the amortization of landfill assets and for the accrual of final closure and post-closure obligations, represents total permitted airspace plus unpermitted airspace that management believes is probable of ultimately being permitted based on established criteria. Our management applies the following criteria for evaluating the probability of obtaining a permit for future expansion airspace at existing sites, which provides management a basis to evaluate the likelihood of success of unpermitted expansions:
• | Personnel are actively working to obtain the permit or permit modifications (land use, state and federal) necessary for expansion of an existing landfill, and progress is being made on the project. |
• | Management expects to submit the application within the next year and to receive all necessary approvals to accept waste within the next five years. |
• | At the time the expansion is included in management's estimate of the landfill's useful economic life, it is probable that the required approvals will be received within the normal application and processing time periods for approvals in the jurisdiction in which the landfill is located. |
• | Our Company or other owner of the landfill has a legal right to use or obtain the right to use the land associated with the expansion plan. |
• | There are no significant known political, technical, legal or business restrictions or other issues that could impair the success of such expansion. |
• | A financial feasibility analysis has been completed and the results demonstrate that the expansion will have a positive financial and operational impact such that management is committed to pursuing the expansion. |
• | Additional airspace and related additional costs, including permitting, final closure and post-closure costs, have been estimated based on the conceptual design of the proposed expansion. |
As of December 31, 2015, there was one unpermitted expansion at one location included in management's landfill calculation, which represented 3.0% of our remaining airspace at that date. If actual expansion airspace is significantly different from management's estimate of expansion airspace, the amortization rates used for the units-of-consumption method would change, therefore impacting our profitability. If we determine that there is less actual expansion airspace at a landfill, this would increase amortization expense recorded and decrease profitability, while if we determine a landfill has more actual expansion airspace, amortization expense would decrease and profitability would increase.
Landfill Final Closure and Post-Closure Liabilities. The balance of landfill final closure and post-closure liabilities at December 31, 2015 and 2014 was $32.0 million and $29.9 million, respectively. We have material financial commitments for the costs associated with requirements of the EPA and the comparable regulatory agency in Canada for landfill final closure and post-closure activities. In the United States, the landfill final closure and post-closure requirements are established under the standards of the EPA, and are implemented and applied on a state-by-state basis. We develop estimates for the cost of these activities based on our evaluation of site-specific facts and circumstances, such as the existence of structures and other landfill improvements that would need to be dismantled, the amount of groundwater monitoring and leachate management expected to be performed, and the length of the post-closure period as determined by the applicable regulatory agency. Included in our cost estimates are our interpretation of current regulatory requirements and proposed regulatory changes. Such estimates may change in the future due to various circumstances including, but not limited to, permit modifications, changes in legislation or regulations, technological changes and results of environmental studies. We perform zero-based reviews of these estimated liabilities at least every five years or sooner if the occurrence of a significant event is likely to change the timing or amount of the currently estimated expenditures. We consider a significant event to be a new regulation or an amendment to an existing regulation, a new permit or modification to an existing permit, or a change in the market price of a significant cost item. Our cost estimates are calculated using internal sources as well as input from third party experts. These costs are measured at estimated fair value using present value techniques, and therefore changes in the estimated timing of closure and post-closure activities would affect the liability, the value of the related asset, and our results of operations.
Final closure costs are the costs incurred after the site ceases to accept waste, but before the landfill is certified as closed by the applicable state or provincial regulatory agency. These costs generally include the costs required to cap the final cell of the landfill (if not included in cell closure), to dismantle certain structures for landfills and other landfill improvements and regulation-mandated groundwater monitoring, and for leachate management. Post-closure costs involve the maintenance and
45
monitoring of a landfill site that has been certified closed by the applicable regulatory agency. These costs generally include groundwater monitoring and leachate management. Regulatory post-closure periods are generally 30 years after landfill closure. Final closure and post-closure obligations are accrued on a units-of-consumption basis, such that the present value of the final closure and post-closure obligations are fully accrued at the date the landfill discontinues accepting waste.
Non-Landfill Closure and Post-Closure Liabilities. The balance of our non-landfill closure and post-closure liabilities at December 31, 2015 and 2014 was $24.2 million and $20.8 million, respectively. We base estimates for non-landfill closure and post-closure liabilities on our interpretations of existing permit and regulatory requirements for closure and post-closure maintenance and monitoring. Our cost estimates are calculated using internal sources as well as input from third party experts. We use probability scenarios to estimate when future operations will cease and inflate the current cost of closing the non-landfill facility on a probability weighted basis using the appropriate inflation rate and then discounting the future value to arrive at an estimated present value of closure and post-closure costs. The estimates for non-landfill closure and post-closure liabilities are inherently uncertain due to the possibility that permit and regulatory requirements will change in the future, impacting the estimation of total costs and the timing of the expenditures. We review non-landfill closure and post-closure liabilities for changes to key assumptions that would impact the amount of the recorded liabilities. Changes that would prompt us to revise a liability estimate include changes in legal requirements that impact our expected closure plan or scope of work, in the market price of a significant cost item, in the probability scenarios as to when future operations at a location might cease, or in the expected timing of the cost expenditures. Changes in estimates for non-landfill closure and post-closure events immediately impact the required liability and the value of the corresponding asset. If a change is made to a fully-consumed asset, the adjustment is charged immediately to expense. When a change in estimate relates to an asset that has not been fully consumed, the adjustment to the asset is recognized in income prospectively as a component of amortization. Historically, material changes to non-landfill closure and post-closure estimates have been infrequent.
Remedial Liabilities. The balance of our remedial liabilities at December 31, 2015 and 2014 was $132.0 million and $155.1 million, respectively. See Note 9, "Remedial Liabilities," to our consolidated financial statements included in Item 8 of this report for the changes to the remedial liabilities during the years ended December 31, 2015 and 2014. Remedial liabilities are obligations to investigate, alleviate and/or eliminate the effects of a release (or threat of a release) of hazardous substances into the environment and may also include corrective action under RCRA. Our remediation obligations can be further characterized as Long-term Maintenance, One-Time Projects, Legal and Superfund. Legal liabilities are typically comprised of litigation matters that involve potential liability for certain aspects of environmental cleanup and can include third party claims for property damage or bodily injury allegedly arising from or caused by exposure to hazardous substances originating from our activities or operations or, in certain cases, from the actions or inactions of other persons or companies. Superfund liabilities are typically claims alleging that we are a potentially responsible party ("PRP") and/or are potentially liable for environmental response, removal, remediation and cleanup costs at/or from either a facility we own or a site owned by a third party. As described in Note 16, "Commitments and Contingencies," to our consolidated financial statements included in Item 8 of this report, Superfund liabilities also include certain liabilities payable to governmental entities for which we are potentially liable to reimburse the sellers in connection with our 2002 acquisition of substantially all of the assets of the Chemical Services Division (the "CSD assets") of Safety-Kleen Corp. Long-term Maintenance liabilities include the costs of groundwater monitoring, treatment system operations, permit fees and facility maintenance for inactive operations. One-Time Projects liabilities include the costs necessary to comply with regulatory requirements for the removal or treatment of contaminated materials.
Amounts recorded related to the costs required to remediate a location are determined by internal engineers and operational personnel and incorporate input from external third parties. The estimates consider such factors as the nature and extent of environmental contamination (if any); the terms of applicable permits and agreements with regulatory authorities as to cleanup procedures and whether modifications to such permits and agreements will likely need to be negotiated; the cost of performing anticipated cleanup activities based upon current technology; and in the case of Superfund and other sites where other parties will also be responsible for a portion of the cleanup costs, the likely allocation of such costs and the ability of such other parties to pay their share. Each quarter, our management discusses if any events have occurred or milestones have been met that would warrant the creation of a new remedial liability or the revision of an existing remedial liability. Such events or milestones include identification and verification as a PRP, receipt of a unilateral administrative order under Superfund or requirement for RCRA interim corrective measures, completion of the feasibility study under Superfund or the corrective measures study under RCRA, new or modifications to existing permits, changes in property use, or a change in the market price of a significant cost item. Remedial liabilities are inherently difficult to estimate and there is a risk that the actual quantities of contaminants could differ from the results of the site investigation, which could materially impact the amount of our liability. It is also possible that chosen methods of remedial solutions will not be successful and funds will be required for alternative solutions.
Remedial liabilities are discounted only when the timing of the payments is estimable and the amounts are determinable, with the exception of remedial liabilities assumed as part of an acquisition that are measured at fair value.
46
We establish reserves for estimated environmental liabilities based on acceptable technologies when we determine the liability is appropriate. Introductions of new technologies are subject to successful demonstration of the effectiveness of the alternative technology and regulatory approval. We routinely review and evaluate the sites for which we have established estimated environmental liabilities reserves to determine if there should be changes in the established reserves. The changes in estimates are reflected as adjustments in the ordinary course of business in the period when we determine that an adjustment is appropriate as new information becomes available. Upon demonstration of the effectiveness of the alternative technology and applicable regulatory approval, we update our estimated cost of remediating the affected sites.
Goodwill and Other Long-Lived Assets. Goodwill is not amortized but is reviewed for impairment annually as of December 31 or when events or changes in the business environment indicate the carrying value of the reporting unit may exceed its fair value. This review is performed by comparing the fair value of each reporting unit to its carrying value, including goodwill. If the fair value is less than the carrying amount, a Step II analysis of the fair value of all the elements of the reporting unit is performed to determine if and to what degree goodwill is impaired. The loss, if any, is measured as the excess of the carrying value of the goodwill over the value of the goodwill implied by the results of the Step II analysis.
We determine our reporting units by identifying the components of each operating segment, and then in some circumstances aggregate components having similar economic characteristics based on quantitative and/or qualitative factors. We have determined that we have seven reporting units. Our Technical Services, Kleen Performance Products, SK Environmental Services, Lodging Services and Oil and Gas Field Services segments each constitute a reporting unit. Our Industrial and Field Services segment includes two separate reporting units: Industrial Services and Field Services. As a result of impairment charges recognized in the second quarter of 2015 and discussed more fully below, no goodwill is recorded by the Oil and Gas Field Services segment as of December 31, 2015.
We conducted our annual impairment test of goodwill for all of our reporting units to which goodwill is allocated as of December 31, 2015 and determined that no adjustment to the carrying value of goodwill for any reporting unit was then necessary. In all cases except for our Kleen Performance Products reporting unit, the estimated fair values of each reporting unit significantly exceeded their carrying values. The annual impairment test fair value for all of our reporting units is determined using an income approach (a discounted cash flow analysis) which incorporates several underlying estimates and assumptions with varying degrees of uncertainty. The discounted cash flow analyses include estimated cash flows for a discrete five year future period and for a terminal period thereafter. In all instances, we corroborate our estimated fair values by also considering other factors such as the fair value of comparable companies to businesses contained in our reporting units. As part of the annual test we also perform a reconciliation of the total estimated fair values of all reporting units to our market capitalization.
As disclosed in our Annual Report on Form 10-K for the year ended December 31, 2014, goodwill attributable to the Oil and Gas Field Services reporting unit was at risk of impairment because of lower operating results caused by the depressed economic conditions and lower levels of activity in the oil and gas industry primarily in Western Canada. In consideration of the increased risk of impairment associated with this segment, management regularly evaluated whether any changes in events or circumstances arose which would indicate that the fair value of this reporting unit was less than its carrying value.
During the second quarter of 2015, certain events and changes in circumstances arose which led management to conclude that the fair values of the Oil and Gas Field Services reporting unit more likely than not had reduced to an amount less than its carrying value and therefore an interim impairment test was conducted relative to goodwill recorded by the Oil and Gas Field Services reporting unit. The primary events and changes in circumstances which led to this conclusion were:
• | The second quarter is the period of time where greater levels of communication with customers and the receipt of bids and proposals for project work take place and provide management with more clarity into levels of activity and other economic and business indicators for the latter half of the fiscal year and on into the first quarter of the following year. During the quarter ended June 30, 2015, it became apparent that oil and gas exploration and production activity would continue to be lower than historical periods and lower than previously anticipated by our Company. This was evidenced by reduced volume in bid and proposal requests from customers and communications indicating the reduction in customer budgets in these areas as well as lower than anticipated pricing for our services. |
• | Market and industry reports which management looks to in projecting business conditions and establishing forecast information evidenced more pessimistic views in the near term. The continued depressed price of oil without any upward momentum since December 2014, as well as declining and expected continued decline in rig count for the remainder of 2015, resulted in lower estimates of industry activity in the second half of 2015 and early 2016. |
47
• | In recognition of lower than anticipated business results and less optimistic market indicators, management significantly lowered its 2015 forecasts relative to the Oil and Gas Field Services reporting unit. |
Significant judgments and unobservable inputs categorized as Level III in the fair value hierarchy are inherent in the impairment tests performed and include assumptions about the amount and timing of expected future cash flows, growth rates, profit margins and the determination of appropriate discount rates. In performing the Step I test as of June 30, 2015 certain of these significant assumptions changed from those utilized in performing our annual goodwill impairment test as of December 31, 2014. Based upon information known as of June 30, 2015, we reduced the estimates and assumptions around FY2015 annual revenue growth from 1% of growth to a contraction in 2015 revenues of 24%. This decrease resulted largely from projects which were expected to occur in the second half of 2015 but had then been canceled or reduced as well as updated outlooks on pricing of our services. EBITDA margins relative to 2015 were also reduced from estimates of 13% utilized in the most recent annual test to 6%. Prior to the impairment we had assumed greater EBITDA margin expansion driven by more positive revenue growth which increased estimated future cash flows. The reduction in margin assumptions utilized in the June 30, 2015 Step I test was based upon the lower levels of revenue then forecasted for 2015, lower pricing of our services and less than anticipated cost savings from cost cutting measures which had been planned but had not fully materialized as of June 30, 2015. These lower revenue and margin estimates associated with 2015 resulted in lower expectations and cash flows in 2015 and also led to decreases in expected revenues and cash flows in future periods, thus lengthening our assumptions around the recovery from the current business downturn as compared to assumptions utilized in prior tests. The changes in these estimates and business assumptions had significant negative impact on our estimates of future anticipated cash flows used in our impairment test and therefore on our estimates of the fair value of the Oil and Gas Field Services reporting unit. Discount rate assumptions utilized in the June 30, 2015 test were consistent with those used in the December 31, 2014 annual test. The results of the Step I test conducted as of June 30, 2015 indicated that the estimated fair value of the reporting unit was less than its carrying value and therefore a Step II test was performed to determine if and in what amount goodwill recorded by the Oil and Gas Field Services segment was impaired. The results of the Step II test indicated that as of June 30, 2015, the total amount of goodwill recorded by the reporting unit was impaired and as such a $32.0 million impairment charge was recorded and is reflected in the 2015 operating results.
During the fiscal quarter ended September 30, 2014, we recorded a $123.4 million impairment charge related to goodwill recorded by the Kleen Performance Products reporting unit. Decreasing market prices associated with the reporting unit’s oil products which began to occur in the third quarter of 2014 was the predominant factor which led to the charge being recognized in the third quarter of 2014. The charge was recognized after developing an estimate of the reporting unit’s fair value as of September 30, 2014 and conducting Step I and Step II goodwill impairment tests. Significant judgments and estimates were utilized in estimating the fair value of the Kleen Performance Products reporting unit as of September 30, 2014 including the timing of expected future cash flows, pricing assumptions and related revenue growth rates, product mix, overall profit margins and the determination of appropriate discount rates. In performing the Step I test as of September 30, 2014, certain of these significant assumptions changed from those utilized in performing our annual goodwill impairment test as of December 31, 2013. Based upon information known as of September 30, 2014, assumptions surrounding the pricing of our products were significantly decreased resulting in FY2014 and 2015 growth rates being reduced from 13% and 4% respectively to -5% and 2%. These changes in revenue assumptions significantly impacted the estimated fair value of the reporting unit.
During the year ended December 31, 2015, we continued to evaluate the Kleen Performance Products reporting unit’s performance and monitor for events or changes in circumstances which might indicate that the estimated fair value of the Kleen Performance Products reporting unit was below its carrying value. Despite continued decreases in overall pricing and in turn, lower revenues generated by the business, cost reductions and in particular successful management of costs associated with used oil raw materials and other expenses led to conclusions that no further impairments existed in 2015.
Accordingly, in conducting our December 31, 2015 goodwill impairment test, we determined that the estimated fair value of the Kleen Performance Products reporting unit exceeded its carrying value by 19%. Significant assumptions included in the discounted cash flow model utilized to estimate the reporting unit’s fair value were a compounded annual revenue growth assumption of approximately 5% over the five year discrete period and 3% thereafter, EBITDA margins consistent with the historical performance of the business and a weighted average cost of capital assumption equal to 12% which was utilized to discount the estimated future cash flows of the business in order to estimate its current fair value.
See further information related to the goodwill impairment charges recorded in Note 6, "Goodwill and Other Intangible Assets," to our consolidated financial statements included in Item 8 of this report.
Indefinite-lived intangible assets are not amortized but are reviewed for impairment annually as of December 31, or when events or changes in the business environment indicate that the carrying value may be impaired. If the fair value of the asset is less than the carrying amount, we perform a quantitative test to determine the fair value. The impairment loss, if any, is
48
measured as the excess of the carrying value of the asset over its fair value. The fair value of the indefinite-lived intangibles exceeded their carrying values at December 31, 2015. We will continue to closely monitor the performance of our indefinite-lived intangible assets. There can be no assurance that future events will not result in an impairment of indefinite-lived intangible assets.
Our long-lived assets are carried on our financial statements based on their cost less accumulated depreciation or amortization. Long-lived assets with finite lives are reviewed for impairment whenever events or changes in circumstances indicate that their carrying value may not be entirely recoverable. When such factors and circumstances exist, management compares the projected undiscounted future cash flows associated with the related asset or group of assets over their estimated useful lives against their respective carrying amounts. The impairment loss, if any, is measured as the excess of the carrying amount over the fair value of the asset and is recorded in the period in which the determination is made. Any resulting impairment losses recorded by us could have an adverse impact on our results of operations.
In 2015 and in response to the same circumstances which triggered the goodwill impairment charges recognized relative to the Oil and Gas Field Services segment, we performed analyses to consider whether the carrying values of other long-lived assets held within the segment may not be entirely recoverable. As of December 31, 2015, the Oil and Gas Field Services segment had property, plant and equipment, net of $156.3 million, other intangible assets of $14.9 million consisting of customer and supplier relationships of $8.2 million and other intangible assets of $6.7 million. As a result of these analyses, we concluded that no impairment of intangible or other long lived assets existed as estimated cash flows generated from associated asset groups exceeded their carrying values.
We will continue to evaluate all of our goodwill and other long-lived assets impacted by economic downturns most predominantly in oil and energy related markets in which they operate. If further economic difficulties resulting from depressed oil and gas related pricing and lower overall activity levels, particularly in our Canadian operations, continue for a significant foreseeable period of time and thus future operating results are significantly less than current expectations additional impairment charges may be recognized. The market conditions which could lead to such future impairments are currently most prevalent in our Oil and Gas Field Services, Lodging Services and Industrial Services operations.
Legal Matters. As described in Note 16, "Commitments and Contingencies," to our consolidated financial statements included in Item 8 of this report, we are subject to legal proceedings which relate to our past acquisitions or which have arisen in the ordinary course of business. Accruals are established for legal matters when, in our opinion, it is probable that a liability exists and the liability can be reasonably estimated. As of December 31, 2015, we had reserves of $21.9 million consisting of (i) $18.9 million related to pending legal or administrative proceedings, including Superfund liabilities, which were included in the $188.2 million accrued environmental liabilities as of December 31, 2015 for closure, post-closure and remediation as described above, and (ii) $3.0 million primarily related to federal and state enforcement actions, which were included in accrued expenses on the consolidated balance sheets. We also estimate that it is "reasonably possible," as that term is defined ("more than remote but less than likely"), that the amount of such total liabilities could be as much as $1.9 million more. Actual expenses incurred in future periods could differ materially from accruals established.
Provision for Income Taxes. Our income tax expense, deferred tax assets and liabilities and reserves for unrecognized tax benefits reflect management's best estimate of future taxes to be paid. We are subject to income taxes in both the United States and in foreign jurisdictions. Significant judgments and estimates are required in determining the consolidated income tax expense. We do not accrue U.S. tax for foreign earnings that we consider to be permanently reinvested outside the United States. Consequently, we have not provided any U.S. tax on the unremitted earnings of our foreign subsidiaries. As of December 31, 2015, the amount of earnings for which no repatriation tax has been provided was $212.7 million. It is not practicable to estimate the amount of additional tax that might be payable on those earnings if repatriated.
Deferred income taxes arise from temporary differences between the tax and financial statement recognition of revenue and expense. In evaluating our ability to recover our deferred tax assets within the jurisdiction from which they arise, we consider all available positive and negative evidence. We establish a valuation allowance when, based on an evaluation of objective verifiable evidence, we believe it is more likely than not that some portion or all of deferred tax assets will not be realized.
A liability for uncertain tax positions is recorded to the extent a tax position taken or expected to be taken in a tax return does not meet certain recognition or measurement criteria. We record interest and penalties on these uncertain tax positions as applicable as a component of income tax expense.
49
ITEM 7A. QUANTITATIVE AND QUALITATIVE DISCLOSURES ABOUT MARKET RISK
In the normal course of business, we are exposed to market risks, including changes in interest rates and certain foreign currency rates, primarily the Canadian dollar. Our philosophy in managing interest rate risk is to borrow at fixed rates for longer time horizons to finance non-current assets and to borrow (to the extent, if any, required) at variable rates for working capital and other short-term needs. We therefore have not entered into derivative or hedging transactions relating to interest rate risk, nor have we entered into transactions to finance off-balance sheet debt. The following table provides information regarding our fixed rate borrowings at December 31, 2015 (in thousands):
Scheduled Maturity Dates | 2016 | 2017 | 2018 | 2019 | 2020 | Thereafter | Total | ||||||||||||||||||||
Senior unsecured notes due 2020 | $ | — | $ | — | $ | — | $ | — | $ | 800,000 | $ | — | $ | 800,000 | |||||||||||||
Senior unsecured notes due 2021 | — | — | — | — | — | 595,000 | 595,000 | ||||||||||||||||||||
Long term obligations, at par | $ | — | $ | — | $ | — | $ | — | $ | 800,000 | $ | 595,000 | $ | 1,395,000 | |||||||||||||
Weighted average interest rate on fixed rate borrowings | 5.2 | % | |||||||||||||||||||||||||
In addition to the fixed rate borrowings described in the above table, we had at December 31, 2015, variable rate instruments that included a revolving credit facility with maximum borrowings of up to $400.0 million (with a $325.0 million sub-limit for letters of credit). Interest payments are due in the amount of $21.0 million each related to the $800.0 million senior unsecured notes payable semi-annually on February 1 and August 1 of each year, and in the amount of $15.2 million each related to the $595.0 million senior unsecured notes payable semi-annually on June 1 and December 1 of each year.
We view our investment in our foreign subsidiaries as long-term; thus, we have not entered into any hedging transactions between any two foreign currencies or between any of the foreign currencies and the U.S. dollar. During 2015, the Canadian subsidiaries transacted approximately 10.8% of their business in U.S. dollars and at any period end have cash on deposit in U.S. dollars and outstanding U.S. dollar accounts receivable related to these transactions. These cash and receivable accounts are vulnerable to foreign currency transaction gains or losses. Exchange rate movements also affect the translation of Canadian generated profits and losses into U.S. dollars. Had the Canadian dollar been 10.0% stronger or weaker against the U.S. dollar, we would have reported increased or decreased net income of $6.5 million and $2.6 million for the year ended December 31, 2015 and 2014, respectively.
50
ITEM 8. FINANCIAL STATEMENTS AND SUPPLEMENTARY DATA
REPORT OF INDEPENDENT REGISTERED PUBLIC ACCOUNTING FIRM
To the Board of Directors and Stockholders of
Clean Harbors, Inc.
Norwell, Massachusetts
We have audited the accompanying consolidated balance sheets of Clean Harbors, Inc. and subsidiaries (the "Company") as of December 31, 2015 and 2014, and the related consolidated statements of income (loss), comprehensive (loss) income, cash flows and stockholders' equity for each of the three years in the period ended December 31, 2015. Our audits also included the financial statement schedule listed in the Index at Item 15. These financial statements and financial statement schedule are the responsibility of the Company's management. Our responsibility is to express an opinion on these financial statements and financial statement schedule based on our audits.
We conducted our audits in accordance with the standards of the Public Company Accounting Oversight Board (United States). Those standards require that we plan and perform the audit to obtain reasonable assurance about whether the financial statements are free of material misstatement. An audit includes examining, on a test basis, evidence supporting the amounts and disclosures in the financial statements. An audit also includes assessing the accounting principles used and significant estimates made by management, as well as evaluating the overall financial statement presentation. We believe that our audits provide a reasonable basis for our opinion.
In our opinion, such consolidated financial statements present fairly, in all material respects, the financial position of Clean Harbors, Inc. and subsidiaries as of December 31, 2015 and 2014, and the results of their operations and their cash flows for each of the three years in the period ended December 31, 2015, in conformity with accounting principles generally accepted in the United States of America. Also, in our opinion, the financial statement schedule, when considered in relation to the basic consolidated financial statements taken as a whole, presents fairly, in all material respects, the information set forth therein.
We have also audited, in accordance with the standards of the Public Company Accounting Oversight Board (United States), the Company's internal control over financial reporting as of December 31, 2015, based on the criteria established in Internal Control—Integrated Framework (2013) issued by the Committee of Sponsoring Organizations of the Treadway Commission and our report dated February 25, 2016 expressed an unqualified opinion on the Company's internal control over financial reporting.
/s/ Deloitte & Touche LLP
Boston, Massachusetts
February 25, 2016
51
CLEAN HARBORS, INC. AND SUBSIDIARIES
CONSOLIDATED BALANCE SHEETS
(dollars in thousands)
As of December 31, | |||||||
2015 | 2014 | ||||||
ASSETS | |||||||
Current assets: | |||||||
Cash and cash equivalents | $ | 184,708 | $ | 246,879 | |||
Accounts receivable, net of allowances aggregating $31,426 and $25,661, respectively | 496,004 | 557,131 | |||||
Unbilled accounts receivable | 25,940 | 40,775 | |||||
Deferred costs | 18,758 | 19,018 | |||||
Inventories and supplies | 149,521 | 168,663 | |||||
Prepaid expenses and other current assets | 46,265 | 57,435 | |||||
Deferred tax assets | — | 36,532 | |||||
Total current assets | 921,196 | 1,126,433 | |||||
Property, plant and equipment, net | 1,532,467 | 1,558,834 | |||||
Other assets: | |||||||
Deferred financing costs | 1,847 | 2,725 | |||||
Goodwill | 453,105 | 452,669 | |||||
Permits and other intangibles, net | 506,818 | 530,080 | |||||
Other | 15,995 | 18,682 | |||||
Total other assets | 977,765 | 1,004,156 | |||||
Total assets | $ | 3,431,428 | $ | 3,689,423 | |||
LIABILITIES AND STOCKHOLDERS' EQUITY | |||||||
Current liabilities: | |||||||
Current portion of capital lease obligations | $ | — | $ | 536 | |||
Accounts payable | 241,183 | 267,329 | |||||
Deferred revenue | 61,882 | 62,966 | |||||
Accrued expenses | 193,660 | 219,549 | |||||
Current portion of closure, post-closure and remedial liabilities | 20,395 | 22,091 | |||||
Total current liabilities | 517,120 | 572,471 | |||||
Other liabilities: | |||||||
Closure and post-closure liabilities, less current portion of $7,229 and $4,999, respectively | 49,020 | 45,702 | |||||
Remedial liabilities, less current portion of $13,166 and $17,092, respectively | 118,826 | 138,029 | |||||
Long-term obligations | 1,382,543 | 1,380,145 | |||||
Deferred taxes, unrecognized tax benefits and other long-term liabilities | 267,637 | 290,205 | |||||
Total other liabilities | 1,818,026 | 1,854,081 | |||||
Commitments and contingent liabilities (See Note 16) | |||||||
Stockholders' equity: | |||||||
Common stock, $.01 par value: | |||||||
Authorized 80,000,000 shares; issued and outstanding 57,593,201 and 58,903,482 shares, respectively | 576 | 589 | |||||
Shares held under employee participation plan | (469 | ) | (469 | ) | |||
Additional paid-in capital | 738,401 | 805,029 | |||||
Accumulated other comprehensive loss | (254,892 | ) | (110,842 | ) | |||
Accumulated earnings | 612,666 | 568,564 | |||||
Total stockholders' equity | 1,096,282 | 1,262,871 | |||||
Total liabilities and stockholders' equity | $ | 3,431,428 | $ | 3,689,423 | |||
The accompanying notes are an integral part of these consolidated financial statements.
52
CLEAN HARBORS, INC. AND SUBSIDIARIES
CONSOLIDATED STATEMENTS OF INCOME (LOSS)
(in thousands except per share amounts)
For the years ended December 31, | |||||||||||
2015 | 2014 | 2013 | |||||||||
Revenues: | |||||||||||
Service revenues | $ | 2,744,272 | $ | 2,639,796 | $ | 2,729,205 | |||||
Product revenues | 530,865 | 761,840 | 780,451 | ||||||||
Total revenues | 3,275,137 | 3,401,636 | 3,509,656 | ||||||||
Cost of revenues: (exclusive of items shown separately below) | |||||||||||
Service revenues | 1,898,907 | 1,790,377 | 1,874,448 | ||||||||
Product revenues | 457,899 | 651,419 | 668,185 | ||||||||
Total cost of revenues | 2,356,806 | 2,441,796 | 2,542,633 | ||||||||
Selling, general and administrative expenses | 414,164 | 437,921 | 470,477 | ||||||||
Accretion of environmental liabilities | 10,402 | 10,612 | 11,541 | ||||||||
Depreciation and amortization | 274,194 | 276,083 | 264,449 | ||||||||
Goodwill impairment charge | 31,992 | 123,414 | — | ||||||||
Income from operations | 187,579 | 111,810 | 220,556 | ||||||||
Other (expense) income | (1,380 | ) | 4,380 | 1,705 | |||||||
Interest expense, net of interest income of $626, $819, and $507, respectively | (76,553 | ) | (77,668 | ) | (78,376 | ) | |||||
Income before provision for income taxes | 109,646 | 38,522 | 143,885 | ||||||||
Provision for income taxes | 65,544 | 66,850 | 48,319 | ||||||||
Net income (loss) | $ | 44,102 | $ | (28,328 | ) | $ | 95,566 | ||||
Earnings (loss) per share: | |||||||||||
Basic | $ | 0.76 | $ | (0.47 | ) | $ | 1.58 | ||||
Diluted | $ | 0.76 | $ | (0.47 | ) | $ | 1.57 | ||||
Shares used to compute earnings (loss) per share — Basic | 58,324 | 60,311 | 60,574 | ||||||||
Shares used to compute earnings (loss) per share — Diluted | 58,434 | 60,311 | 60,728 | ||||||||
The accompanying notes are an integral part of these consolidated financial statements.
53
CLEAN HARBORS, INC. AND SUBSIDIARIES
CONSOLIDATED STATEMENTS OF COMPREHENSIVE (LOSS) INCOME
(in thousands)
For the years ended December 31, | |||||||||||
2015 | 2014 | 2013 | |||||||||
Net income (loss) | $ | 44,102 | $ | (28,328 | ) | $ | 95,566 | ||||
Other comprehensive loss: | |||||||||||
Unrealized gains on available-for-sale securities (net of taxes of $0, $183 and $208, respectively) | — | 976 | 1,244 | ||||||||
Reclassification adjustment for gains on available-for-sale securities included in net income (net of taxes of $508) | — | (2,880 | ) | — | |||||||
Foreign currency translation adjustments | (144,050 | ) | (88,725 | ) | (70,791 | ) | |||||
Unfunded pension liability (net of taxes of $7, $248 and $123, respectively) | — | (657 | ) | 359 | |||||||
Other comprehensive loss | (144,050 | ) | (91,286 | ) | (69,188 | ) | |||||
Comprehensive (loss) income | $ | (99,948 | ) | $ | (119,614 | ) | $ | 26,378 | |||
The accompanying notes are an integral part of these consolidated financial statements.
54
CLEAN HARBORS, INC. AND SUBSIDIARIES
CONSOLIDATED STATEMENTS OF CASH FLOWS
(in thousands)
For the years ended December 31, | |||||||||||
2015 | 2014 | 2013 | |||||||||
Cash flows from operating activities: | |||||||||||
Net income (loss) | $ | 44,102 | $ | (28,328 | ) | $ | 95,566 | ||||
Adjustments to reconcile net income to net cash from operating activities: | |||||||||||
Depreciation and amortization | 274,194 | 276,083 | 264,449 | ||||||||
Goodwill impairment charge | 31,992 | 123,414 | — | ||||||||
Pre-tax, non-cash acquisition accounting inventory adjustments | — | — | 13,559 | ||||||||
Allowance for doubtful accounts | 4,793 | 8,917 | 7,933 | ||||||||
Amortization of deferred financing costs and debt discount | 3,280 | 3,289 | 3,301 | ||||||||
Accretion of environmental liabilities | 10,402 | 10,612 | 11,541 | ||||||||
Changes in environmental liability estimates | (11,345 | ) | (3,367 | ) | (3,682 | ) | |||||
Deferred income taxes | 1,930 | 32,320 | 31,119 | ||||||||
Other expense (income) | 1,380 | (4,380 | ) | (1,705 | ) | ||||||
Stock-based compensation | 8,550 | 8,800 | 8,946 | ||||||||
Excess tax benefit of stock-based compensation | (71 | ) | (878 | ) | (1,409 | ) | |||||
Net tax benefit on stock-based awards | (82 | ) | 816 | 1,399 | |||||||
Environmental expenditures | (20,130 | ) | (20,245 | ) | (19,416 | ) | |||||
Changes in assets and liabilities: | |||||||||||
Accounts receivable and unbilled accounts receivables | 55,271 | (14,342 | ) | (54,213 | ) | ||||||
Inventories and supplies | 14,059 | (21,339 | ) | (1,144 | ) | ||||||
Other current assets | 48,760 | (19,030 | ) | 20,857 | |||||||
Accounts payable | (16,299 | ) | (52,026 | ) | 37,117 | ||||||
Other current and long-term liabilities | (54,403 | ) | (2,950 | ) | 1,621 | ||||||
Net cash from operating activities | 396,383 | 297,366 | 415,839 | ||||||||
Cash flows used in investing activities: | |||||||||||
Additions to property, plant and equipment | (257,196 | ) | (257,613 | ) | (280,207 | ) | |||||
Proceeds from sales of fixed assets | 6,195 | 8,164 | 4,699 | ||||||||
Acquisitions, net of cash acquired | (94,345 | ) | (16,187 | ) | (63,264 | ) | |||||
Additions to intangible assets including costs to obtain or renew permits | (5,296 | ) | (6,519 | ) | (6,740 | ) | |||||
Proceeds from sales of investments | — | 13,861 | — | ||||||||
Other | — | — | — | ||||||||
Net cash used in investing activities | (350,642 | ) | (258,294 | ) | (345,512 | ) | |||||
Cash flows (used in) from financing activities: | |||||||||||
Change in uncashed checks | (14,630 | ) | 15,069 | 12,268 | |||||||
Proceeds from exercise of stock options | 397 | — | 400 | ||||||||
Remittance of shares, net | (2,159 | ) | (2,793 | ) | (731 | ) | |||||
Repurchases of common stock | (73,347 | ) | (104,341 | ) | — | ||||||
Excess tax benefit of stock-based compensation | 71 | 878 | 1,409 | ||||||||
Deferred financing costs paid | — | — | (2,504 | ) | |||||||
Repayment of long-term obligations | — | (5,000 | ) | — | |||||||
Proceeds from employee stock purchase plan | — | 4,364 | 7,425 | ||||||||
Payments on capital leases | (511 | ) | (2,122 | ) | (4,891 | ) | |||||
Issuance costs related to issuances of common stock | — | — | (250 | ) | |||||||
Net cash (used in) from financing activities | (90,179 | ) | (93,945 | ) | 13,126 | ||||||
Effect of exchange rate change on cash | (17,733 | ) | (8,321 | ) | (3,216 | ) | |||||
(Decrease) increase in cash and cash equivalents | (62,171 | ) | (63,194 | ) | 80,237 | ||||||
Cash and cash equivalents, beginning of year | 246,879 | 310,073 | 229,836 | ||||||||
Cash and cash equivalents, end of year | $ | 184,708 | $ | 246,879 | $ | 310,073 | |||||
Supplemental information: | |||||||||||
Cash payments for interest and income taxes: | |||||||||||
Interest paid | $ | 73,926 | $ | 75,408 | $ | 75,627 | |||||
Income taxes paid (received) | 52,970 | 42,022 | (8,162 | ) | |||||||
Non-cash investing and financing activities: | |||||||||||
Property, plant and equipment accrued | 32,677 | 23,563 | 33,214 | ||||||||
Transfer of inventory to property, plant and equipment | — | 1,324 | 11,369 | ||||||||
Accrued business combination adjustments | — | 355 | — | ||||||||
Receivable for estimated purchase price adjustment | 1,000 | — | — | ||||||||
The accompanying notes are an integral part of these consolidated financial statements.
55
CLEAN HARBORS, INC. AND SUBSIDIARIES
CONSOLIDATED STATEMENTS OF STOCKHOLDERS' EQUITY
(in thousands)
Common Stock | Shares Held Under Employee Participation Plan | Additional Paid-in Capital | Accumulated Other Comprehensive Income (loss) | Total Stockholders' Equity | ||||||||||||||||||||||
Number of Shares | $0.01 Par Value | Accumulated Earnings | ||||||||||||||||||||||||
Balance at January 1, 2013 | 60,385 | $ | 604 | $ | (469 | ) | $ | 880,979 | $ | 49,632 | $ | 501,326 | $ | 1,432,072 | ||||||||||||
Net income | — | — | — | — | — | 95,566 | 95,566 | |||||||||||||||||||
Other comprehensive income | — | — | — | — | (69,188 | ) | — | (69,188 | ) | |||||||||||||||||
Stock-based compensation | 74 | — | — | 8,946 | — | — | 8,946 | |||||||||||||||||||
Issuance of restricted shares, net of shares remitted | (19 | ) | — | — | (731 | ) | — | — | (731 | ) | ||||||||||||||||
Issuance of common stock, net of issuance cost | — | — | — | (250 | ) | — | — | (250 | ) | |||||||||||||||||
Exercise of stock options | 61 | 3 | — | 397 | — | — | 400 | |||||||||||||||||||
Net tax benefit on stock-based awards | — | — | — | 1,399 | — | — | 1,399 | |||||||||||||||||||
Employee stock purchase plan | 171 | — | — | 7,425 | — | — | 7,425 | |||||||||||||||||||
Balance at December 31, 2013 | 60,672 | $ | 607 | $ | (469 | ) | $ | 898,165 | $ | (19,556 | ) | $ | 596,892 | $ | 1,475,639 | |||||||||||
Net loss | — | — | — | — | — | (28,328 | ) | (28,328 | ) | |||||||||||||||||
Other comprehensive loss | — | — | — | — | (91,286 | ) | — | (91,286 | ) | |||||||||||||||||
Stock-based compensation | — | — | — | 8,800 | — | — | 8,800 | |||||||||||||||||||
Issuance of restricted shares, net of shares remitted | 113 | 1 | — | (2,794 | ) | — | — | (2,793 | ) | |||||||||||||||||
Repurchases of common stock | (1,973 | ) | (20 | ) | — | (104,321 | ) | — | — | (104,341 | ) | |||||||||||||||
Net tax benefit on stock-based awards | — | — | — | 816 | — | — | 816 | |||||||||||||||||||
Employee stock purchase plan | 91 | 1 | — | 4,363 | — | — | 4,364 | |||||||||||||||||||
Balance at December 31, 2014 | 58,903 | $ | 589 | $ | (469 | ) | $ | 805,029 | $ | (110,842 | ) | $ | 568,564 | $ | 1,262,871 | |||||||||||
Net income | — | — | — | — | — | 44,102 | 44,102 | |||||||||||||||||||
Other comprehensive loss | — | — | — | — | (144,050 | ) | — | (144,050 | ) | |||||||||||||||||
Stock-based compensation | — | — | — | 8,550 | — | — | 8,550 | |||||||||||||||||||
Issuance of restricted shares, net of shares remitted | 100 | 1 | — | (2,160 | ) | — | — | (2,159 | ) | |||||||||||||||||
Exercise of stock options | 12 | — | — | 397 | — | — | 397 | |||||||||||||||||||
Repurchases of common stock | (1,422 | ) | (14 | ) | — | (73,333 | ) | — | — | (73,347 | ) | |||||||||||||||
Net tax benefit on stock-based awards | — | — | — | (82 | ) | — | — | (82 | ) | |||||||||||||||||
Balance at December 31, 2015 | 57,593 | $ | 576 | $ | (469 | ) | $ | 738,401 | $ | (254,892 | ) | $ | 612,666 | $ | 1,096,282 | |||||||||||
The accompanying notes are an integral part of these consolidated financial statements.
56
CLEAN HARBORS, INC. AND SUBSIDIARIES
NOTES TO CONSOLIDATED FINANCIAL STATEMENTS
(1) OPERATIONS
Clean Harbors, Inc., through its subsidiaries (collectively, the "Company"), is a leading provider of environmental, energy and industrial services throughout North America.
(2) SIGNIFICANT ACCOUNTING POLICIES
The accompanying consolidated financial statements of the Company reflect the application of certain significant accounting policies as described below:
Principles of Consolidation
The accompanying consolidated statements include the accounts of Clean Harbors, Inc. and its majority-owned subsidiaries. All intercompany accounts and transactions have been eliminated in consolidation.
Use of Estimates
The preparation of consolidated financial statements in conformity with accounting principles generally accepted in the United States of America requires management to make estimates and assumptions, which are evaluated on an ongoing basis, that affect the amounts reported in the Company's consolidated financial statements and accompanying notes. Management bases its estimates on historical experience and on various other assumptions it believes to be reasonable at the time under the circumstances, the results of which form the basis for making judgments about the carrying values of assets and liabilities and disclosure, if any, of contingent assets and liabilities and reported amounts of revenues and expenses. Actual results could differ from those estimates and judgments.
Reclassifications
As a result of the adoption of new accounting pronouncements issued in 2015 and discussed further in Note 2 under the heading Recent Accounting Pronouncements, certain balance sheets amounts previously reported in prior period financial statements have been reclassified in accordance with the implemented standards.
Fair Value Valuation Hierarchy
The Company defines fair value as the price that would be received to sell an asset or be paid to transfer a liability in an orderly transaction between market participants at the measurement date. The Company applies the following fair value hierarchy, which prioritizes the inputs used to measure fair value into three levels and bases the categorization within the hierarchy upon the lowest level of input that is available and significant to the fair value measurement. Level 1 inputs are quoted prices in active markets for identical assets or liabilities that the reporting entity has the ability to access at the measurement date. Level 2 utilizes quoted market prices in markets that are not active, broker or dealer quotations, or alternative pricing sources with reasonable levels of price transparency. Level 3 inputs are unobservable inputs for the asset or liability in which there is little, if any, market activity for the asset or liability at the measurement date.
The Company's financial instruments consist of cash and cash equivalents, accounts and unbilled receivable, accounts payable and accrued liabilities and long-term debt obligations. Due to the short-term nature of these instruments, with the exception of long-term debt obligations, their estimated fair value approximates carrying value. Senior unsecured notes are recorded at par.
Cash, Cash Equivalents and Uncashed Checks
Cash and cash equivalents consist primarily of cash on deposit, money market accounts or short-term investments with original maturities of three months or less. The fair value of our cash equivalents is considered a Level 1 measure according to the fair value hierarchy and is adjusted to fair value based on quoted market prices. The Company's cash management program with its revolving credit lender allows for the maintenance of a zero balance in the U.S. bank disbursement accounts that are used to issue vendor and payroll checks. The program can result in checks outstanding in excess of bank balances in the disbursement accounts. When checks are presented to the bank for payment, cash deposits in amounts sufficient to fund the
57
CLEAN HARBORS, INC. AND SUBSIDIARIES
NOTES TO CONSOLIDATED FINANCIAL STATEMENTS (Continued)
(2) SIGNIFICANT ACCOUNTING POLICIES (Continued)
checks are made, at the Company's discretion, either from funds provided by other accounts or under the terms of the Company's revolving credit facility. Therefore, until checks are presented for payment, there is no right of offset by the bank and the Company continues to have control over cash relating to both released as well as unreleased checks. Checks that have been written to vendors or employees but have not yet been presented for payment at the Company's bank are classified as uncashed checks as part of accounts payable and added back to cash balances.
Marketable Securities
The Company has classified its marketable securities as available-for-sale and, accordingly, carries such securities at fair value. Unrealized gains and losses are reported, net of tax, as a component of other comprehensive income.
Allowances for Doubtful Accounts
On a regular basis, the Company evaluates its accounts receivable and establishes the allowance for doubtful accounts based on an evaluation of historical collection trends, customer concentration, customer credit ratings, current economic trends and changes in customer payment patterns. Past-due receivable balances are written-off when the Company's internal collection efforts have been deemed unsuccessful in collecting the outstanding balance due.
Credit Concentration
Concentration of credit risks in accounts receivable is limited due to the large number of customers comprising the Company's customer base throughout North America. The Company maintains policies over credit extension that include credit evaluations, credit limits and collection monitoring procedures on a customer-by-customer basis. However, the Company generally does not require collateral before services are performed. As of December 31, 2015 and 2014, no individual customer accounted for more than 10% of accounts receivable. During each of the years ended December 31, 2015, 2014 and 2013, no individual customer accounted for more than 10% of total revenues.
Unbilled Receivables
The Company recognizes unbilled accounts receivable for service and disposal transactions rendered but not invoiced to the customer by the end of the period.
Deferred Costs Relating to Deferred Revenue
Commissions and other incremental direct costs, primarily costs of materials, relating to deferred revenue from the Company’s parts cleaning services, containerized waste services and vacuum services are capitalized and deferred. The deferred costs are included in current assets in the consolidated balance sheet and charged to expense when the related revenues are recognized.
Inventories and Supplies
Inventories are stated at the lower of cost or market. The cost of oil and oil products is principally determined on a first-in, first-out ("FIFO") basis. The cost of supplies and drums, solvent and solution and other inventories is determined on a FIFO or a weighted average cost basis. Costs for oil and oil products, solvent and repair parts include purchase costs, fleet and fuel costs, direct labor, transportation costs and production related costs. The Company continually reviews its inventories for obsolete or unsalable items and adjusts its carrying value to reflect estimated realizable values.
Prepaid Expenses and Other Current Assets
Prepaid expenses and other current assets consist primarily of prepayments for various services, refundable deposits, and income taxes receivable.
Property, Plant and Equipment (excluding landfill assets)
Property, plant and equipment are stated at cost and include amounts capitalized under capital lease obligations. Expenditures for major renewals and improvements which extend the life or usefulness of the asset are capitalized. Items of an ordinary repair or maintenance nature are charged directly to operating expense as incurred. During the construction and development period of an asset, the costs incurred, including applicable interest costs, are classified as construction-in-progress.
58
CLEAN HARBORS, INC. AND SUBSIDIARIES
NOTES TO CONSOLIDATED FINANCIAL STATEMENTS (Continued)
(2) SIGNIFICANT ACCOUNTING POLICIES (Continued)
The Company depreciates and amortizes the cost of these assets, using the straight-line method as follows:
Asset Classification | Estimated Useful Life | |
Buildings and building improvements | ||
Buildings | 30–40 years | |
Leasehold and building improvements | 2–40 years | |
Camp equipment | 8–15 years | |
Vehicles | 3–12 years | |
Equipment | ||
Capitalized software and computer equipment | 3–5 years | |
Solar equipment | 20 years | |
Containers and railcars | 15–20 years | |
All other equipment | 8–20 years | |
Furniture and fixtures | 5–8 years | |
Leasehold and building improvements have a weighted average life of 10.2 years.
Camp equipment consists of industrial lodging facilities that are utilized to provide lodging services to downstream oil and gas companies in Western Canada.
Solar equipment consists of a solar array that is used to provide electric power for a continuously operating groundwater decontamination pump and treatment system at a closed and capped landfill located in New Jersey.
The Company recognizes an impairment in the carrying value of long-lived assets when the expected future undiscounted cash flows derived from the assets, or group of assets, are less than their carrying value. For the years ended December 31, 2015, 2014 and 2013, the Company did not record impairment charges related to long-lived assets. The Company will continue to assess all of its long-lived assets for impairment as necessary.
Goodwill
Goodwill is comprised of the purchase price of business acquisitions in excess of the fair value assigned at acquisition to the net tangible and identifiable intangible assets acquired. Goodwill is not amortized but is reviewed for impairment annually as of December 31, or when events or changes in the business environment indicate that the carrying value of the reporting unit may exceed its fair value, by comparing the fair value of each reporting unit to its carrying value, including goodwill. If the fair value is less than the carrying amount, a Step II goodwill impairment test is performed to determine if goodwill is impaired. The loss, if any, is measured as the excess of the carrying value of the goodwill over the implied value of the goodwill. See Note 6, "Goodwill and Other Intangible Assets," for additional information related to the Company's goodwill impairment tests and the goodwill impairment charges recorded in 2015 and 2014.
Permits and other intangibles
Permits and intangible assets, such as legal fees, site surveys, engineering costs and other expenditures are recorded as cost. Other intangible assets consist primarily of customer and supplier relationships, trademarks and trade names, and non-compete agreements. Permits relating to landfills are amortized on a units-of-consumption basis. All other permits are amortized over periods ranging from 5 to 30 years on a straight-line basis. Other intangible assets are amortized on a straight-line basis over their respective useful lives, which range from 2 to 20 years.
Finite-lived intangible assets are reviewed for impairment whenever events or changes in circumstances indicate that their carrying value may not be entirely recoverable. When such factors and circumstances exist, management compares the projected undiscounted future cash flows associated with the related asset or group of assets over their estimated useful lives against their respective carrying amounts. The impairment loss, if any, is measured as the excess of the carrying amount over the fair value of the asset or group of assets.
59
CLEAN HARBORS, INC. AND SUBSIDIARIES
NOTES TO CONSOLIDATED FINANCIAL STATEMENTS (Continued)
(2) SIGNIFICANT ACCOUNTING POLICIES (Continued)
Indefinite-lived intangible assets are not amortized but are reviewed for impairment annually as of December 31, or when events or changes in the business environment indicate that the carrying value may be impaired. If the fair value of the asset is less than the carrying amount, the Company performs a quantitative test to determine the fair value. The impairment loss, if any,
is measured as the excess of the carrying value of the asset over its fair value. The fair value of the indefinite-lived intangible assets exceeded their carrying values at December 31, 2015 and 2014.
Leases
The Company leases rolling stock, rail cars, equipment, real estate and office equipment under operating leases. Certain real estate leases contain rent holidays and rent escalation clauses. Most of the Company's real estate lease agreements include renewal periods at the Company's option. For its operating leases, the Company recognizes rent holiday periods and scheduled rent increases on a straight-line basis over the lease term beginning with the date the Company takes possession of the leased assets.
Landfill Accounting
The Company amortizes landfill improvements, and certain landfill-related permits over their estimated useful lives. The units-of-consumption method is used to amortize land, landfill cell construction, asset retirement costs and remaining landfill cells and sites. The Company also utilizes the units-of-consumption method to record closure and post-closure obligations for landfill cells and sites. Under the units-of-consumption method, the Company includes future estimated construction and asset retirement costs, as well as costs incurred to date, in the amortization base of the landfill assets. Additionally, where appropriate, as described below, the Company includes probable expansion airspace that has yet to be permitted in the calculation of the total remaining useful life of the landfill. If it is determined that expansion capacity should no longer be considered in calculating the recoverability of a landfill asset, the Company may be required to recognize an asset impairment or incur significantly higher amortization expense. If at any time the Company makes the decision to abandon the expansion effort, the capitalized costs related to the expansion effort are expensed immediately.
Landfill assets—Landfill assets include the costs of landfill site acquisition, permits and cell construction incurred to date. These amounts are recorded at cost, which includes capitalized interest as applicable. Landfill assets, net of amortization, are combined with management's estimate of the costs required to complete construction of the landfill to determine the amount to be amortized over the remaining estimated useful economic life of a site. Amortization of landfill assets is recorded on a units-of-consumption basis, such that the landfill assets should be completely amortized at the date the landfill ceases accepting waste. Amortization totaled $11.2 million, $14.1 million and $16.8 million for the years ended December 31, 2015, 2014 and 2013, respectively. Changes in estimated costs to complete construction are applied prospectively to the amortization rate.
Landfill capacity—Landfill capacity, which is the basis for the amortization of landfill assets and for the accrual of final closure and post-closure obligations, represents total permitted airspace plus unpermitted airspace that management believes is probable of ultimately being permitted based on established criteria. The Company applies the following criteria for evaluating the probability of obtaining a permit for future expansion airspace at existing sites, which provides management a basis to evaluate the likelihood of success of unpermitted expansions:
• | Personnel are actively working to obtain the permit or permit modifications (land use, state, provincial and federal) necessary for expansion of an existing landfill, and progress is being made on the project. |
• | Management expects to submit the application within the next year and to receive all necessary approvals to accept waste within the next 5 years. |
• | At the time the expansion is included in the Company's estimate of the landfill's useful economic life, it is probable that the required approvals will be received within the normal application and processing time periods for approvals in the jurisdiction in which the landfill is located. |
• | The Company or other owner of the landfill has a legal right to use or obtain the right to use the land associated with the expansion plan. |
• | There are no significant known political, technical, legal or business restrictions or issues that could impair the success of such expansion. |
60
CLEAN HARBORS, INC. AND SUBSIDIARIES
NOTES TO CONSOLIDATED FINANCIAL STATEMENTS (Continued)
(2) SIGNIFICANT ACCOUNTING POLICIES (Continued)
• | A financial feasibility analysis has been completed and the results demonstrate that the expansion will have a positive financial and operational impact such that management is committed to pursuing the expansion. |
• | Additional airspace and related additional costs, including permitting, final closure and post-closure costs, have been estimated based on the conceptual design of the proposed expansion. |
As of December 31, 2015, there was one unpermitted expansion at one location included in the Company's landfill accounting model, which represented 3.0% of the Company's remaining airspace at that date. If actual expansion airspace is significantly different from the Company's estimate of expansion airspace, the amortization rates used for the units-of-consumption method would change, therefore impacting the Company's profitability. If the Company determines that there is less actual expansion airspace at a landfill, this would increase amortization expense recorded and decrease profitability, while if the Company determines a landfill has more actual expansion airspace, amortization expense would decrease and profitability would increase.
As of December 31, 2015, the Company had 11 active landfill sites (including the Company's two non-commercial landfills), which have estimated remaining lives (based on anticipated waste volumes and remaining highly probable airspace) as follows:
Remaining Lives (Years) | Remaining Highly Probable Airspace (cubic yards) (in thousands) | ||||||||||||
Facility Name | Location | Permitted | Unpermitted | Total | |||||||||
Altair | Texas | 6 | 686 | — | 686 | ||||||||
Buttonwillow | California | 20 | 7,023 | — | 7,023 | ||||||||
Deer Park | Texas | 7 | 268 | — | 268 | ||||||||
Deer Trail | Colorado | 28 | 1,932 | — | 1,932 | ||||||||
Grassy Mountain | Utah | 20 | 1,839 | — | 1,839 | ||||||||
Kimball | Nebraska | 9 | 243 | — | 243 | ||||||||
Lambton | Ontario | 37 | 5,062 | — | 5,062 | ||||||||
Lone Mountain | Oklahoma | 32 | 4,809 | — | 4,809 | ||||||||
Ryley | Alberta | 9 | 608 | 880 | 1,488 | ||||||||
Sawyer | North Dakota | 45 | 3,704 | — | 3,704 | ||||||||
Westmorland | California | 64 | 2,732 | — | 2,732 | ||||||||
28,906 | 880 | 29,786 | |||||||||||
At December 31, 2015 and 2014, the Company had no cubic yards of permitted, but not highly probable, airspace.
The following table presents the remaining highly probable airspace from January 1, 2013 through December 31, 2015 (in thousands of cubic yards):
2015 | 2014 | 2013 | ||||||
Remaining capacity at January 1, | 30,544 | 29,323 | 29,643 | |||||
Addition of highly probable airspace, net | 516 | 2,809 | 1,218 | |||||
Consumed | (1,274 | ) | (1,588 | ) | (1,538 | ) | ||
Remaining capacity at December 31, | 29,786 | 30,544 | 29,323 | |||||
Amortization of cell construction costs and accrual of cell closure obligations—Landfills are typically comprised of a number of cells, which are constructed within a defined acreage (or footprint). The cells are typically discrete units, which require both separate construction and separate capping and closure procedures. Cell construction costs are the costs required to excavate and construct the landfill cell. These costs are typically amortized on a units-of-consumption basis, such that they are completely amortized when the specific cell ceases accepting waste. In some instances, the Company has landfills that are engineered and constructed as "progressive trenches." In progressive trench landfills, a number of contiguous cells form a progressive trench. In those instances, the Company amortizes cell construction costs over the airspace within the entire trench, such that the cell construction costs will be fully amortized at the end of the trench useful life.
61
CLEAN HARBORS, INC. AND SUBSIDIARIES
NOTES TO CONSOLIDATED FINANCIAL STATEMENTS (Continued)
(2) SIGNIFICANT ACCOUNTING POLICIES (Continued)
The design and construction of a landfill does not create a landfill asset retirement obligation. Rather, the asset retirement obligation for cell closure (the cost associated with capping each cell) is incurred in relatively small increments as waste is placed in the landfill. Therefore, the cost required to construct the cell cap is capitalized as an asset retirement cost and a liability of an equal amount is established, based on the discounted cash flow associated with each capping event, as airspace is consumed. Spending for cell capping is reflected as environmental expenditures within operating activities in the statement of cash flows.
Landfill final closure and post-closure liabilities—The balance of landfill final closure and post-closure liabilities at December 31, 2015 and 2014 was $32.0 million and $29.9 million, respectively. The Company has material financial commitments for the costs associated with requirements of the Environmental Protection Agency ("EPA") and the comparable regulatory agency in Canada for landfill final closure and post-closure activities. In the United States, the landfill final closure and post-closure requirements are established under the standards of the EPA, and are implemented and applied on a state-by-state basis. The Company develops estimates for the cost of these activities based on an evaluation of site-specific facts and circumstances, including the Company's interpretation of current regulatory requirements and proposed regulatory changes. Such estimates may change in the future due to various circumstances including, but not limited to, permit modifications, changes in legislation or regulations, technological changes and results of environmental studies.
Final closure costs are the costs incurred after the site ceases to accept waste, but before the landfill is certified as closed by the applicable state regulatory agency. These costs generally include the costs required to cap the final cell of the landfill (if not included in cell closure), the costs required to dismantle certain structures for landfills and other landfill improvements, and regulation-mandated groundwater monitoring, and leachate management. Post-closure costs involve the maintenance and monitoring of a landfill site that has been certified closed by the applicable regulatory agency. These costs generally include groundwater monitoring and leachate management. Regulatory post-closure periods are generally 30 years after landfill closure. Final closure and post-closure obligations are accrued on a units-of-consumption basis, such that the present value of the final closure and post-closure obligations are fully accrued at the date the landfill discontinues accepting waste.
Cell closure, final closure and post closure costs (also referred to as "asset retirement obligations") are calculated by estimating the total obligation in current dollars, adjusted for inflation (1.02% during 2015 and 2014) and discounted at the Company's credit-adjusted risk-free interest rate (5.99% and 6.54% during 2015 and 2014, respectively.)
Non-Landfill Closure and Post-Closure Liabilities
Non-landfill closure costs include costs required to dismantle and decontaminate certain structures and other costs incurred during the closure process. Post-closure costs, if required, include associated maintenance and monitoring costs as required by the closure permit. Post-closure periods are performance-based and are not generally specified in terms of years in the closure permit, but generally range from 10 to 30 years or more.
The Company records its non-landfill closure and post-closure liability by: (i) estimating the current cost of closing a non-landfill facility and the post-closure care of that facility, if required, based upon the closure plan that the Company is required to follow under its operating permit, or in the event the facility operates with a permit that does not contain a closure plan, based upon legally enforceable closure commitments made by the Company to various governmental agencies; (ii) using probability scenarios as to when in the future operations may cease; (iii) inflating the current cost of closing the non-landfill facility on a probability weighted basis using the inflation rate to the time of closing under each probability scenario; and (iv) discounting the future value of each closing scenario back to the present using the credit-adjusted risk-free interest rate. Non-landfill closure and post-closure obligations arise when the Company commences operations.
The balance of non-landfill closure and post-closure liabilities at December 31, 2015 and 2014 was $24.2 million and $20.8 million, respectively. Management bases estimates for non-landfill closure and post-closure liabilities on its interpretation of existing permit and regulatory requirements for closure and post-closure maintenance and monitoring. The Company's cost estimates are calculated using internal sources as well as input from third party experts. Management uses probability scenarios to estimate when future operations will cease and inflates the current cost of closing the non-landfill facility on a probability weighted basis using the appropriate inflation rate and then discounting the future value to arrive at an estimated present value of closure and post-closure costs. The estimates for non-landfill closure and post-closure liabilities are inherently uncertain due to the possibility that permit and regulatory requirements will change in the future, impacting the estimation of total costs and the timing of the expenditures. Management reviews non-landfill closure and post-closure liabilities for changes to key assumptions that would impact the amount of the recorded liabilities. Changes that would prompt management to revise a liability estimate include changes in legal requirements that impact the Company's expected closure plan or scope of work, in
62
CLEAN HARBORS, INC. AND SUBSIDIARIES
NOTES TO CONSOLIDATED FINANCIAL STATEMENTS (Continued)
(2) SIGNIFICANT ACCOUNTING POLICIES (Continued)
the market price of a significant cost item, in the probability scenarios as to when future operations at a location might cease, or in the expected timing of the cost expenditures. Changes in estimates for non-landfill closure and post-closure events immediately impact the required liability and the value of the corresponding asset. If a change is made to a fully-consumed asset, the adjustment is charged immediately to expense. When a change in estimate relates to an asset that has not been fully consumed, the adjustment to the asset is recognized in income prospectively as a component of amortization. Historically, material changes to non-landfill closure and post-closure estimates have been infrequent.
Remedial Liabilities
The balance of remedial liabilities at December 31, 2015 and 2014 was $132.0 million and $155.1 million, respectively. Remedial liabilities, including Superfund liabilities, include the costs of removal or containment of contaminated material, treatment of potentially contaminated groundwater and maintenance and monitoring costs necessary to comply with regulatory requirements. Most of the Company's remedial liabilities relate to the active and inactive hazardous waste treatment and disposal facilities which the Company acquired in the last 14 years and 35 Superfund sites owned by third parties for which the Company agreed to indemnify certain remedial liabilities owed or potentially owed to governmental entities by the sellers of certain assets (the "CSD assets") which the Company acquired in 2002. The Company performed extensive due diligence to estimate accurately the aggregate liability for remedial liabilities to which the Company became potentially liable as a result of the acquisitions. The Company's estimate of remedial liabilities involved an analysis of such factors as: (i) the nature and extent of environmental contamination (if any); (ii) the terms of applicable permits and agreements with regulatory authorities as to cleanup procedures and whether modifications to such permits and agreements will likely need to be negotiated; (iii) the cost of performing anticipated cleanup activities based upon current technology; and (iv) in the case of Superfund and other sites where other parties will also be responsible for a portion of the cleanup costs, the likely allocation of such costs and the ability of such other parties to pay their share. Remedial liabilities and on-going operations are reviewed quarterly and adjustments are made as necessary.
The Company periodically evaluates potential remedial liabilities at sites that it owns or operates or to which the Company or the sellers of the CSD assets (or the respective predecessors of the Company or such sellers) transported or disposed of waste, including 128 Superfund sites as of December 31, 2015. The Company periodically reviews and evaluates sites requiring remediation, including Superfund sites, giving consideration to the nature (i.e., owner, operator, arranger, transporter or generator) and the extent (i.e., amount and nature of waste hauled to the location, number of years of site operations or other relevant factors) of the Company's (or such sellers') alleged connection with the site, the extent (if any) to which the Company believes it may have an obligation to indemnify cleanup costs in connection with the site, the regulatory context surrounding the site, the accuracy and strength of evidence connecting the Company (or such sellers) to the location, the number, connection and financial ability of other named and unnamed potentially responsible parties ("PRPs") and the nature and estimated cost of the likely remedy. Where the Company concludes that it is probable that a liability has been incurred and an amount can be estimated, a provision is made, based upon management's judgment and prior experience, of such estimated liability.
Remedial liabilities are inherently difficult to estimate. Estimating remedial liabilities requires that the existing environmental contamination be understood. There are risks that the actual quantities of contaminants differ from the results of the site investigation, and that contaminants exist that have not been identified by the site investigation. In addition, the amount of remedial liabilities recorded is dependent on the remedial method selected. There is a risk that funds will be expended on a remedial solution that is not successful, which could result in the additional incremental costs of an alternative solution. Such estimates, which are subject to change, are subsequently revised if and when additional or new information becomes available.
Remedial liabilities are discounted only when the timing of the payments is estimable and the amounts are determinable. Management's experience has been that the timing of payments for remedial liabilities is not usually estimable, and therefore the amounts of remedial liabilities are not generally discounted. In the case of remedial liabilities assumed in connection with acquisitions, acquired liabilities are recorded under purchase accounting at fair value. Accordingly, as of the respective acquisition dates, the Company recorded the remedial liabilities assumed as part of acquisitions at their fair value, which were calculated by inflating costs in current dollars using an estimate of future inflation rates as of the respective acquisition dates until the expected time of payment, and then discounting the amount of the payments to their present value using a risk-free discount rate as of the acquisition dates. Discounts were and will be applied to the environmental liabilities as follows:
63
CLEAN HARBORS, INC. AND SUBSIDIARIES
NOTES TO CONSOLIDATED FINANCIAL STATEMENTS (Continued)
(2) SIGNIFICANT ACCOUNTING POLICIES (Continued)
• | Remedial liabilities assumed relating to acquisitions are and will continue to be inflated using the inflation rates at the time of each acquisition (ranging from 1.01% to 2.57%) until the expected time of payment, then discounted at the risk-free interest rate at the time of such acquisition (ranging from 2.88% to 5.99%). |
• | Remedial liabilities incurred subsequent to the acquisitions and remedial liabilities of the Company that existed prior to the acquisitions have been and will continue to be recorded at the estimated current value of the liabilities, which is usually neither increased for inflation nor reduced for discounting. |
Foreign Currency
During the year ended December 31, 2015 and 2014, the Company had operations in Canada, and to a much lesser extent, Mexico and Trinidad. Assets and liabilities are translated to U.S. dollars at the exchange rate in effect at the balance sheet date and revenue and expenses at the average exchange rate for the period. Gains and losses from the translation of the consolidated financial statements of foreign subsidiaries into U.S. dollars are included in stockholders' equity as a component of accumulated other comprehensive income. Gains and losses resulting from foreign currency transactions are recognized in the consolidated statements of income. Recorded balances that are denominated in a currency other than the functional currency are remeasured to the functional currency using the exchange rate at the balance sheet date and gains or losses are recorded in the statements of income.
Revenue Recognition and Deferred Revenue
During 2015, the Company provided environmental, energy, lodging and industrial services through six segments: Technical Services, Industrial and Field Services, Kleen Performance Products, SK Environmental Services, Lodging Services, and Oil and Gas Field Services. The Company recognizes revenue when persuasive evidence of an arrangement exists, delivery has occurred or services have been rendered, the price is fixed or determinable, and collection is reasonably assured. Revenue is recognized net of estimated allowances. Revenue is generated by short-term projects, most of which are governed by master service agreements that are long-term in nature. The master service agreements are typically entered into with the Company's larger customers and outline the pricing and legal frameworks for such arrangements.
Due to the nature of the Company's business and the invoices that result from the services provided, customers may withhold payments and attempt to renegotiate amounts invoiced. Accordingly, management establishes a revenue allowance to cover the estimated amounts of revenue that may need to be credited to customers' accounts in future periods. The Company records a provision for revenue allowances based on specific review of particular customers, historical trends and other relevant information.
Technical Services revenue is generated from fees charged for hazardous material management and disposal services including onsite environmental management services, collection and transportation, packaging, recycling, treatment and disposal of hazardous and non-hazardous waste. Services are provided based on purchase orders or agreements with the customer and include prices based upon units of volume of waste, and transportation and other fees. Collection and transportation, and packaging revenues are recognized when the transported waste is received at the disposal facility. Revenues for treatment and disposal of hazardous waste are recognized upon completion of wastewater treatment, final disposition in a landfill or incineration of the waste, all at Company-owned sites, or when the waste is shipped to a third party for processing and disposal. Revenues from recycled oil and recycled catalyst are recognized upon shipment to the customer. Revenue for all other Technical Services is recognized when services are rendered. The Company, at the request of a customer, periodically enters into bundled arrangements for the collection and transportation and disposal of waste. The Company accounts for such arrangements as multiple-element arrangements with separate units of accounting. The Company measures and allocates the consideration from the arrangement to the separate units, based on evidence of the estimated selling price for each deliverable. Revenues from waste that is not yet completely processed and disposed and the related costs are deferred. The revenue is recognized and the deferred costs are expensed when the related services are completed.
Industrial Services provides industrial and specialty services, such as high-pressure and chemical cleaning, catalyst handling, decoking and pigging to refineries, chemical plants, oil sands facilities, pulp and paper mills, and other industrial facilities. These services are provided based on purchase orders or agreements with the customer and include prices based upon daily, hourly or job rates for equipment, materials and personnel. Revenues are recognized over the term of the agreements or as services are performed. Field Services provides cleanup services on customer sites or other locations on a scheduled or
64
CLEAN HARBORS, INC. AND SUBSIDIARIES
NOTES TO CONSOLIDATED FINANCIAL STATEMENTS (Continued)
(2) SIGNIFICANT ACCOUNTING POLICIES (Continued)
emergency response basis. The Company's services are provided based on purchase orders or agreements with the customer and include prices based upon daily, hourly or job rates for equipment, materials and personnel. Revenues are recorded as services are performed. Revenue is recognized on contracts with retainage when services have been rendered and collectability is reasonably assured.
Kleen Performance Products revenue is generated from re-refining used oil to produce high quality base and blended lubricating oils, and recycling used oil collected in excess of the Company's re-refining capacity into recycled fuel oil. The high quality base and blended lubricating oils are sold to third-party distributors, retailers, government agencies, fleets, railroads and industrial customers. The recycled fuel oil is sold to asphalt plants, industrial plants, blenders, pulp and paper companies, vacuum gas oil producers and marine diesel oil producers. Revenue is recognized upon the transfer of title.
SK Environmental Services revenue is generated from providing parts cleaning services, containerized waste services, oil collection services and other complementary products and services. Revenue is recognized when products are delivered and services are performed. Parts cleaning services generally consist of placing a specially designed parts washer at a customer's premises and then, on a recurring basis, delivering clean solvent or aqueous-based washing fluid, cleaning and servicing the parts washer and removing the used solvent or aqueous fluid. The Company also services customer-owned parts washers. Revenue from parts cleaning services is recognized over the service interval. Service intervals represent the actual amount of time between service visits to a particular parts cleaning customer. Average service intervals vary from seven to 14 weeks depending on several factors, such as customer accommodation, types of machines serviced and frequency of use. Containerized waste services consist of profiling, collecting, transporting and recycling or disposing of a wide variety of hazardous and non-hazardous wastes. Collection and transportation, and packaging revenues are recognized when the transported waste is received at the disposal facility. Revenues for treatment and disposal of the waste is recognized upon disposal, or when the waste is shipped to a third party for processing and disposal. Other complementary products and services include vacuum services, sale of allied supply products and other environmental services.
Lodging Services provides accommodation services, along with catering and hospitality primarily in remote areas of Western Canada. In addition, within Lodging Services is a manufacturing unit that provides construction of modular buildings including modular camp accommodations and wastewater solutions. Revenue for lodging and related services is recognized in the period each room is used by the customer based on the related lodging agreements. Revenue for manufacturing services is recognized based on contracted terms resulting in either a percentage of completion methodology or upon transfer of ownership of completed units.
Oil and Gas Field Services provides fluid handling, fluid hauling, production servicing, surface rentals, seismic services, and directional boring services to the energy sector serving oil and gas exploration and production and power generation. These services are provided based on purchase orders or agreements with the customer and include prices based upon daily, hourly or job rates for equipment, materials and personnel. Revenues for such services are recognized over the term of the agreements or as services are performed. Oil and Gas Field Services also provides equipment rentals to support drill sites. Revenue from rentals is recognized ratably over the rental period.
For all periods presented, amounts billed to customers related to shipping and handling are classified as revenue and the Company's shipping and handling costs are included in costs of revenues. In the course of the Company's operations, it collects sales tax from its customers and recognizes a current liability which is then relieved when the taxes are remitted to the appropriate governmental authorities. The Company excludes the sales tax collected from its revenues.
Advertising Expense
Advertising costs are expensed as incurred. Advertising expense was approximately $15.0 million in 2015, $11.3 million in 2014 and $10.8 million in 2013.
Stock-Based Compensation
Stock-based compensation cost is measured at the grant date based on the fair value of the award and is recognized as expense over the requisite service period, which generally represents the vesting period, and includes an estimate of awards that will be forfeited. In addition, the Company issues awards with performance targets which are recognized as expense over the requisite service period when management believes it is probable those targets will be achieved. The fair value of the
65
CLEAN HARBORS, INC. AND SUBSIDIARIES
NOTES TO CONSOLIDATED FINANCIAL STATEMENTS (Continued)
(2) SIGNIFICANT ACCOUNTING POLICIES (Continued)
Company's grants of restricted stock are based on the quoted market price for the Company's common stock on the respective dates of grant. The fair value of stock options is calculated using the Black-Scholes option-pricing model. Compensation
expense is based on the number of awards expected to vest. Forfeitures estimated when recognizing compensation expense are adjusted when actual forfeitures differ from the estimate.
Income Taxes
There are two major components of income tax expense, current and deferred. Current income tax expense approximates cash to be paid or refunded for taxes for the applicable period. Deferred tax expense or benefit is the result of changes between deferred tax assets and liabilities. Deferred tax assets and liabilities are determined based upon the temporary differences between the financial statement basis and tax basis of assets and liabilities as well as from net operating loss and tax credit carryforwards as measured by the enacted tax rates, which will be in effect when these differences reverse. The Company evaluates the recoverability of future tax deductions and credits and a valuation allowance is established by tax jurisdiction when, based on an evaluation of objective verifiable evidence, it is more likely than not that some portion or all of deferred tax assets will not be realized.
The Company recognizes and measures a tax benefit from uncertain tax positions when it is more likely than not that the tax position will be sustained on examination by the taxing authorities, based on the technical merits of the position. The Company recognizes a liability for unrecognized tax benefits resulting from uncertain tax positions taken or expected to be taken in a tax return. The Company adjusts these liabilities when its judgment changes as a result of the evaluation of new information not previously available. Due to the complexity of some of these uncertainties, the ultimate resolution may result in a payment that is materially different from the current estimate or future recognition of an unrecognized benefit. These differences will be reflected as increases or decreases to income tax expense in the period in which they are determined.
The Company recognizes interest and penalties related to unrecognized tax benefits within the income tax expense line in the consolidated statements of income. Accrued interest and penalties are included within deferred taxes, unrecognized tax benefits and other long-term liabilities line in the consolidated balance sheet.
Earnings (Loss) per Share ("EPS")
Basic EPS is calculated by dividing income available to common stockholders by the weighted average number of common shares outstanding during the period. Diluted EPS gives effect to all potentially dilutive common shares that were outstanding during the period.
Business Combinations
For all business combinations, the Company records 100% of all assets and liabilities of the acquired business, including goodwill, at their estimated fair values. Acquisition-related costs are expensed in the period in which the costs are incurred and the services are received.
Recent Accounting Pronouncements
Standards implemented
In April 2014, the Financial Accounting Standards Board (“FASB”) issued Accounting Standard Update (“ASU”)
2014-08, Presentation of Financial Statements (Topic 205) and Property, Plant, and Equipment (Topic 360). The amendments in ASU 2014-08 provide guidance for the recognition and disclosure of discontinued operations. The adoption of ASU 2014-08 did not have an impact on the Company's consolidated financial statements.
In April 2015, the FASB issued ASU 2015-03, Interest-Imputation of Interest (Subtopic 835-30): Simplifying the Presentation of Debt Issuance Costs (ASU 2015-03). ASU 2015-03 requires that debt issuance costs related to a recognized liability in the balance sheet be presented as a direct deduction to that liability rather than as an asset. Final guidance on this standard, issued as ASU 2015-15 in August 2015, includes an SEC staff announcement that the SEC staff will not object to an entity presenting the cost of securing a revolving line of credit as an asset, regardless of whether a balance is outstanding. The Company elected to early adopt this new standard beginning December 31, 2015 and retrospectively reclassified $14.9 million of debt issuance costs associated with the Company's long-term obligations as of December 31, 2014 from other assets to long-term obligations. This reclassification only affected presentation and therefore did not have an impact on the Company’s results
66
CLEAN HARBORS, INC. AND SUBSIDIARIES
NOTES TO CONSOLIDATED FINANCIAL STATEMENTS (Continued)
(2) SIGNIFICANT ACCOUNTING POLICIES (Continued)
of operations. Costs associated with securing the Company’s revolving credit facility remained presented as Deferred financing costs within the Other assets section of the consolidated balance sheets for all periods presented.
In November 2015, FASB issued ASU 2015-17, Income Taxes (Topic 740). The amendment provides guidance to simplify the presentation of deferred taxes by requiring that deferred liabilities and assets be classified as noncurrent in a classified balance sheet. The Company elected to early adopt this new standard beginning December 31, 2015 and prospectively applied ASU 2015-17, therefore deferred tax balances presented for periods prior to December 31, 2015 have not been recast in connection with the implementation of this standard. The adoption of this standard only affects the classification of deferred tax amounts and has no impact on the Company’s results of operations.
Standards to be implemented
In May 2014, FASB issued ASU 2014-09, Revenue from Contracts with Customers (Topic 606). ASU 2014-09 outlines a single comprehensive model for entities to use in accounting for revenue arising from contracts with customers and supersedes most current revenue recognition guidance, including industry-specific guidance. In August 2015, FASB issued ASU 2015-14 which deferred the effective date of ASU 2014-09 for all entities by one year. This new guidance is currently effective for annual reporting periods (including interim reporting periods within those periods) beginning after December 15, 2017.
In February 2015, the FASB issued ASU 2015-02, Consolidation (Topic 810). The amendment provides guidance regarding amendments to the consolidation analysis. The amendments in this update are currently effective for annual reporting periods (including interim reporting periods within those periods) beginning after December 15, 2015.
In January 2016, FASB issued ASU 2016-01, Financial Instruments - Overall (Subtopic 825-10). The amendment provides guidance to enhance the reporting model for financial instruments to provide users of financial statements with more decision-useful information. The amendment in this update is effective for fiscal years beginning after December 15, 2018, and interim periods within fiscal years beginning after December 15, 2019.
The Company is currently evaluating the impact that the above standards to be implemented will have on the Company's consolidated financial statements.
In July 2015, FASB issued ASU 2015-11, Inventory (Topic 330). The amendment provides guidance regarding the measurement of inventory. Entities should measure inventory within the scope of this update at the lower of cost and net realizable value. The amendments in this update are currently effective for annual reporting periods (including interim reporting periods within those periods) beginning after December 15, 2016. Adoption is not expected to have a material impact on the Company's consolidated financial statements.
In September 2015, FASB issued ASU 2015-16, Business Combinations (Topic 805). The amendment provides guidance to simplify the accounting for adjustments made to provisional amounts recognized in a business combination. This amendment eliminates the requirement to retrospectively account for those adjustments. The amendment in this update is currently effective for annual reporting periods (including interim reporting periods within those periods) beginning after December 15, 2015. Adoption is not expected to have a material impact on the Company's consolidated financial statements.
(3) BUSINESS COMBINATIONS
2015 Acquisitions
Thermo Fluids Inc.
On April 11, 2015, the Company completed the acquisition of Heckmann Environmental Services, Inc. (“HES”) and Thermo Fluids Inc. (“TFI”), a wholly-owned subsidiary of HES. The acquisition was accomplished through a purchase by Safety-Kleen, Inc., a wholly-owned subsidiary of the Company, of all of the issued and outstanding shares of HES from Nuverra Environmental Solutions, Inc. HES is a holding company that does not conduct any operations. TFI provides environmental services, including used oil recycling, used oil filter recycling, antifreeze products, parts washers and solvent recycling, and industrial waste management services, including vacuum services, remediation, lab pack and hazardous waste
67
CLEAN HARBORS, INC. AND SUBSIDIARIES
NOTES TO CONSOLIDATED FINANCIAL STATEMENTS (Continued)
(3) BUSINESS COMBINATIONS (Continued)
management. The Company acquired TFI for an estimated preliminary purchase price of $78.6 million inclusive of current estimates of and subject to certain closing and post-closing adjustments relating to working capital and other assumed liabilities. The acquisition was financed with cash on hand and expands the Company’s environmental services customer base while also complimenting the SK Environmental Services network and presence in the western United States. The amount of
revenue from TFI included in the Company's results of operations for the year ended December 31, 2015 was $33.8 million. During the year ended December 31, 2015, the Company incurred acquisition-related costs of approximately $0.6 million in connection with the transaction which are primarily included in selling, general and administrative expenses in the consolidated statements of income. Results of TFI since acquisition have been included within the SK Environmental Services segment.
The allocation of the purchase price was based on preliminary estimates of the fair value of assets acquired and liabilities assumed as of April 11, 2015, as the Company is continuing to obtain information to complete its valuation of these accounts and the associated tax accounting. The components and preliminary allocation of the purchase price consist of the following amounts (in thousands):
At acquisition date April 11, 2015 | Measurement Period Adjustments | At acquisition date as reported at December 31, 2015 | |||||||||
Accounts Receivable | $ | 7,109 | $ | 476 | $ | 7,585 | |||||
Inventories and supplies | 1,791 | — | 1,791 | ||||||||
Prepaid expenses and other current assets | 1,749 | (1,084 | ) | 665 | |||||||
Property, plant and equipment | 30,468 | (1,606 | ) | 28,862 | |||||||
Permits and other intangibles | 20,000 | (1,900 | ) | 18,100 | |||||||
Current liabilities | (5,859 | ) | 14 | (5,845 | ) | ||||||
Closure and post-closure liabilities | (1,676 | ) | — | (1,676 | ) | ||||||
Deferred taxes, unrecognized tax benefits and other long-term liabilities | (13,081 | ) | 3,051 | (10,030 | ) | ||||||
Total identifiable net assets | 40,501 | (1,049 | ) | 39,452 | |||||||
Goodwill | 36,591 | 2,543 | 39,134 | ||||||||
Total | $ | 77,092 | $ | 1,494 | $ | 78,586 | |||||
Pro forma revenue and earnings amounts on a combined basis as if TFI had been acquired on January 1, 2015 are immaterial to the consolidated financial statements of the Company since that date.
Other 2015 Acquisitions
In December 2015, the Company acquired certain assets and assumed certain defined liabilities of a privately owned company for approximately $14.7 million in cash. That company specializes in the collection and recycling of used oil filters and was a service provider to the SK Environmental Services segment prior to the acquisition. The acquired company has been integrated into the SK Environmental Services segment. In connection with this acquisition a preliminary goodwill amount of $7.4 million was recognized.
2014 Acquisitions
In 2014, the Company acquired the assets of two privately owned companies for approximately $16.1 million in cash, net of cash acquired. The acquired companies have been integrated into the Technical Services and Lodging Services segments.
2013 Acquisitions
Evergreen
On September 13, 2013, the Company acquired all of the outstanding shares of Evergreen Oil, Inc. (“Evergreen”) for a final purchase price of $56.3 million in cash, net of cash acquired. Evergreen, headquartered in Irvine, California, specializes in the recovery and re-refining of used oil. Evergreen owns and operates one of the only oil re-refining operations in the Western United States and also offers other ancillary environmental services, including parts cleaning and containerized waste services, vacuum services and hazardous waste management services. The acquisition of Evergreen enables the Company to further penetrate the small quantity waste generator market and further expand its oil re-refining, oil recycling and waste treatment capabilities. Financial information and results of Evergreen have been recorded in the Company's consolidated financial statements since acquisition and are primarily included in the Kleen Performance Products segment.
68
CLEAN HARBORS, INC. AND SUBSIDIARIES
NOTES TO CONSOLIDATED FINANCIAL STATEMENTS (Continued)
(3) BUSINESS COMBINATIONS (Continued)
Management determined the purchase price allocations based on estimates of the fair values of all tangible and intangible assets acquired and liabilities assumed. The Company believes that such information provides a reasonable basis for estimating the fair values of assets acquired and liabilities assumed. The Company finalized the purchase accounting for the acquisition of Evergreen. The impact of the purchase price measurement period adjustments and related tax impacts recorded in the current period was not material to the consolidated financial statements and accordingly the effects have not been retrospectively applied.
The following table summarizes the recognized amounts of assets acquired and liabilities assumed at September 13, 2013 (in thousands):
Preliminary Allocations | Measurement Period Adjustments | Final Allocations | |||||||||
Inventories and supplies | $ | 1,089 | $ | — | $ | 1,089 | |||||
Prepaid expense and other current assets | 1,291 | (273 | ) | 1,018 | |||||||
Property, plant and equipment | 40,563 | — | 40,563 | ||||||||
Permits and other intangibles | 17,100 | — | 17,100 | ||||||||
Deferred tax assets, less current portion | 2,368 | (2,368 | ) | — | |||||||
Other assets | 3,607 | (239 | ) | 3,368 | |||||||
Current liabilities | (6,198 | ) | (552 | ) | (6,750 | ) | |||||
Closure and post-closure liabilities | (659 | ) | — | (659 | ) | ||||||
Remedial liabilities, less current portion | (2,103 | ) | 463 | (1,640 | ) | ||||||
Other long-term liabilities | (1,139 | ) | (920 | ) | (2,059 | ) | |||||
Total identifiable net assets | 55,919 | (3,889 | ) | 52,030 | |||||||
Goodwill | — | 4,288 | 4,288 | ||||||||
Total | $ | 55,919 | $ | 399 | $ | 56,318 | |||||
(4) INVENTORIES AND SUPPLIES
Inventories and supplies consisted of the following (in thousands):
December 31, 2015 | December 31, 2014 | ||||||
Oil and oil products | $ | 33,603 | $ | 62,111 | |||
Supplies and drums | 78,132 | 68,547 | |||||
Solvent and solutions | 8,868 | 9,355 | |||||
Modular camp accommodations | 15,126 | 15,776 | |||||
Other | 13,792 | 12,874 | |||||
Total inventories and supplies | $ | 149,521 | $ | 168,663 | |||
As of December 31, 2015 and 2014, other inventories consisted primarily of cleaning fluids, such as absorbents and wipers, and automotive fluids, such as windshield washer fluid and antifreeze.
69
CLEAN HARBORS, INC. AND SUBSIDIARIES
NOTES TO CONSOLIDATED FINANCIAL STATEMENTS (Continued)
(5) PROPERTY, PLANT AND EQUIPMENT
Property, plant and equipment consisted of the following (in thousands):
December 31, 2015 | December 31, 2014 | ||||||
Land | $ | 100,582 | $ | 98,507 | |||
Asset retirement costs (non-landfill) | 12,434 | 10,871 | |||||
Landfill assets | 136,624 | 110,984 | |||||
Buildings and improvements | 344,209 | 338,242 | |||||
Camp equipment | 149,361 | 180,575 | |||||
Vehicles | 500,619 | 471,615 | |||||
Equipment | 1,328,915 | 1,302,424 | |||||
Furniture and fixtures | 5,337 | 5,517 | |||||
Construction in progress | 113,657 | 45,605 | |||||
2,691,738 | 2,564,340 | ||||||
Less - accumulated depreciation and amortization | 1,159,271 | 1,005,506 | |||||
Total property, plant and equipment, net | $ | 1,532,467 | $ | 1,558,834 | |||
Interest in the amount of $2.0 million, $0.5 million and $0.9 million was capitalized to fixed assets during the years ended December 31, 2015, 2014 and 2013, respectively. Depreciation expense, inclusive of landfill amortization was $234.0 million, $239.4 million and $229.4 million for the years ended December 31, 2015, 2014 and 2013, respectively.
(6) GOODWILL AND OTHER INTANGIBLE ASSETS
The changes in goodwill for the years ended December 31, 2015 and 2014 were as follows (in thousands):
Technical Services | Industrial and Field Services | Kleen Performance Products | SK Environmental Services | Lodging Services | Oil and Gas Field Services | Totals | |||||||||||||||||||||
Balance at January 1, 2014 | $ | 45,599 | $ | 109,873 | $ | 171,161 | $ | 172,309 | $ | 35,512 | $ | 36,506 | $ | 570,960 | |||||||||||||
Acquired from acquisitions | 5,018 | — | — | — | 2,383 | — | 7,401 | ||||||||||||||||||||
Measurement period adjustments | — | — | 4,288 | — | — | — | 4,288 | ||||||||||||||||||||
Goodwill impairment charge | — | — | (123,414 | ) | — | — | — | (123,414 | ) | ||||||||||||||||||
Foreign currency translation and other | (525 | ) | (659 | ) | (1,152 | ) | 1,564 | (3,032 | ) | (2,762 | ) | (6,566 | ) | ||||||||||||||
Balance at December 31, 2014 | $ | 50,092 | $ | 109,214 | $ | 50,883 | $ | 173,873 | $ | 34,863 | $ | 33,744 | $ | 452,669 | |||||||||||||
Acquired from acquisitions | — | — | — | 46,539 | — | — | 46,539 | ||||||||||||||||||||
Measurement period adjustments | — | — | — | — | 3,574 | — | 3,574 | ||||||||||||||||||||
Goodwill impairment charge | — | — | — | — | — | (31,992 | ) | (31,992 | ) | ||||||||||||||||||
Foreign currency translation and other | (825 | ) | (3,928 | ) | (1,128 | ) | (3,823 | ) | (6,229 | ) | (1,752 | ) | (17,685 | ) | |||||||||||||
Balance at December 31, 2015 | $ | 49,267 | $ | 105,286 | $ | 49,755 | $ | 216,589 | $ | 32,208 | $ | — | $ | 453,105 | |||||||||||||
The Company assesses goodwill for impairment on an annual basis as of December 31, or at an interim date when events or changes in the business environment would more likely than not reduce the fair value of a reporting unit below its carrying value.
During the second quarter of 2015, certain events and changes in circumstances arose which led management of the Company to conclude that the fair value of the Oil and Gas Field Services reporting unit may be less than its carrying value and therefore an interim impairment test was conducted relative to goodwill recorded by the Oil and Gas Field Services reporting unit. The primary events and changes in circumstances which led to this conclusion were:
70
CLEAN HARBORS, INC. AND SUBSIDIARIES
NOTES TO CONSOLIDATED FINANCIAL STATEMENTS (Continued)
(6) GOODWILL AND OTHER INTANGIBLE ASSETS (Continued)
• | The second quarter is the period of time where greater levels of communication with customers and the receipt of bids and proposals for project work take place and provide management with more clarity into levels of activity and other economic and business indicators for the latter half of the fiscal year and on into the first quarter of the following year. During the quarter ended June 30, 2015, it became apparent that oil and gas exploration and production activity would continue to be lower than historical periods and lower than previously anticipated by the Company. This was evidenced by reduced volume in bid and proposal requests from customers and communications indicating the reduction in customer budgets in these areas as well as lower than anticipated pricing for our services. |
• | Market and industry reports which management looks to in projecting business conditions and establishing forecast information evidenced more pessimistic views in the near term. The continued depressed price of oil without any upward momentum since December 2014, as well as declining and expected continued decline in rig count for the remainder of 2015, resulted in lower estimates of industry activity in the second half of 2015 and early 2016. |
• | In recognition of lower than anticipated business results and less optimistic market indicators, management significantly lowered its 2015 forecasts relative to the Oil and Gas Field Services reporting unit. |
In performing Step I of this interim goodwill impairment test, the estimated fair value of the Oil and Gas Field Services reporting unit was determined using an income approach based upon discounted cash flows and was compared to the reporting unit's carrying value as of June 30, 2015. Based on the results of that valuation, the carrying amount of the reporting unit, including $32.0 million of goodwill, exceeded its estimated fair value and as a result the Company performed Step II of the goodwill impairment test to determine the amount of goodwill impairment charge to be recorded.
Step II of the goodwill impairment test required the Company to perform a theoretical purchase price allocation for the reporting unit to determine the implied fair value of goodwill and to compare the implied fair value of goodwill to the recorded amount. The estimates of the fair values of intangible assets identified in performing this theoretical purchase price allocation and resulting implied fair value of goodwill required significant judgment. Based on the results of this goodwill impairment test the implied value of goodwill was $0 and as such the Company recognized a goodwill impairment charge equal to the recorded amount of goodwill of $32.0 million as of June 30, 2015.
The factors contributing to the $32.0 million goodwill impairment charge principally related to events and changes in circumstances discussed above which had negative impacts on the Company’s prospective financial information utilized in its discounted cash flow model prepared in connection with the interim impairment test. The projected lower levels of activity and pricing in the latter half of the year which became evident during the second quarter decreased the reporting unit’s anticipated future cash flows for 2015 as compared to those estimated previously. These factors also provided evidence of a longer than expected overall recovery from current industry lows which negatively impacted the estimated levels of cash flows in future periods that were assumed in the cash flow models utilized in the interim impairment test. These factors adversely affected the estimated fair value of the reporting unit as of June 30, 2015 and ultimately led to the recognition of the goodwill impairment charge.
During the third quarter of 2014 the Company recorded a goodwill impairment charge of $123.4 million related to goodwill associated with the Kleen Performance Products segment.
In performing Step I of this goodwill impairment test, the estimated fair value of the Oil Re-refining and Recycling reporting unit was determined using an income approach based upon discounted cash flows and was compared to the reporting unit's carrying value as of September 30, 2014. Based on the results of that valuation, the carrying amount of the reporting unit, including $174.3 million of goodwill, exceeded its estimated fair value and as a result the Company performed Step II of the goodwill impairment test to determine the amount of goodwill impairment charge to be recorded.
Step II of the goodwill impairment test required the Company to perform a theoretical purchase price allocation for the reporting unit to determine the implied fair value of goodwill and to compare the implied fair value of goodwill to the recorded amount. The estimates of the fair values of intangible assets identified in performing this theoretical purchase price allocation and resulting implied fair value of goodwill required significant judgment. Based on the results of this goodwill impairment
test, the Company recognized a goodwill impairment charge for the Oil Re-refining and Recycling segment of $123.4 million as of September 30, 2014.
71
CLEAN HARBORS, INC. AND SUBSIDIARIES
NOTES TO CONSOLIDATED FINANCIAL STATEMENTS (Continued)
(6) GOODWILL AND OTHER INTANGIBLE ASSETS (Continued)
The factors contributing to this goodwill impairment charge principally related to decreases in market prices of oil products sold by the Kleen Performance Products business which took place during the third quarter of 2014. These decreasing market prices negatively impacted the profitability of the Oil Re-refining and Recycling segment and further resulted in lower assumptions for future revenues and profits of the business. These factors adversely affected the estimated fair value of the reporting unit as of September 30, 2014 and ultimately led to the recognition of the goodwill impairment charge.
The Company conducted its annual impairment test of goodwill for all of the Company's reporting units as of December 31, 2015 and determined that no adjustment to the carrying value of goodwill for any reporting unit was necessary because the fair values of the reporting units exceeded their respective carrying values. The fair value of all reporting units was determined using an income approach based upon estimates of future discounted cash flows. The resulting estimates of fair value were validated through the consideration of other factors such as the fair value of comparable companies to the reporting units and a reconciliation of the sum of all estimated fair values of the reporting units to the Company’s overall market capitalization. In all cases except for the Company's Kleen Performance Products reporting unit, the estimated fair values of the reporting units significantly exceeded their carrying values.
Significant judgments and unobservable inputs categorized as Level III in the fair value hierarchy are inherent in the impairment tests performed and include assumptions about the amount and timing of expected future cash flows, growth rates, and the determination of appropriate discount rates. The Company believes that the assumptions used in its annual and any interim date impairment tests are reasonable, but variations in any of the assumptions may result in different calculations of fair values and impairment charges.
The impacts of any adverse business and market conditions which impact the overall performance of the Company's reporting units will continue to be monitored. If the Company's reporting units do not achieve the financial performance that the Company expects, it is possible that additional goodwill impairment charges may result. There can therefore be no assurance that future events will not result in an impairment of goodwill.
At December 31, 2015, the total accumulated goodwill impairment charge was $155.4 million, of which $32.0 million was recorded during the year ended December 31, 2015 within the Oil and Gas Field Services segment and $123.4 million was recorded in the Kleen Performance Products segment during the year ended December 31, 2014.
As of December 31, 2015 and 2014, the Company's finite-lived and indefinite lived intangible assets consisted of the following (in thousands):
December 31, 2015 | December 31, 2014 | ||||||||||||||||||||||||||
Cost | Accumulated Amortization | Net | Weighted Average Amortization Period (in years) | Cost | Accumulated Amortization | Net | Weighted Average Amortization Period (in years) | ||||||||||||||||||||
Permits | $ | 161,396 | $ | 61,142 | $ | 100,254 | 19.0 | $ | 156,692 | $ | 55,318 | $ | 101,374 | 19.0 | |||||||||||||
Customer and supplier relationships | 374,866 | 99,463 | 275,403 | 10.1 | 370,373 | 77,697 | 292,676 | 11.0 | |||||||||||||||||||
Other intangible assets | 31,416 | 22,581 | 8,835 | 1.5 | 31,540 | 19,074 | 12,466 | 3.2 | |||||||||||||||||||
Total amortizable permits and other intangible assets | 567,678 | 183,186 | 384,492 | 10.0 | 558,605 | 152,089 | 406,516 | 11.4 | |||||||||||||||||||
Trademarks and trade names | 122,326 | — | 122,326 | Indefinite | 123,564 | — | 123,564 | Indefinite | |||||||||||||||||||
Total permits and other intangible assets | $ | 690,004 | $ | 183,186 | $ | 506,818 | $ | 682,169 | $ | 152,089 | $ | 530,080 | |||||||||||||||
72
CLEAN HARBORS, INC. AND SUBSIDIARIES
NOTES TO CONSOLIDATED FINANCIAL STATEMENTS (Continued)
(6) GOODWILL AND OTHER INTANGIBLE ASSETS (Continued)
As of December 31, 2015, the Oil and Gas Field Services segment group had property, plant and equipment, net of $156.3 million, other intangible assets of $14.9 million consisting of customer and supplier relationships of $8.2 million and other intangible assets of $6.7 million. Based on analyses performed during 2015 which were conducted based upon the same circumstances which triggered the goodwill impairment charge recorded, sufficient undiscounted cash flows are expected to be generated over these assets' remaining lives to recover the carrying values and thus no impairment exists. If expectations of future cash flows were to decrease in the future as a result of worse than expected or prolonged periods of depressed activity in the Oil and Gas Field Services marketplace, future impairments may exist.
Amortization expense of permits and other intangible assets for the years ended December 31, 2015, 2014 and 2013 were $40.2 million, $36.7 million and $35.1 million, respectively.
The expected amortization of the net carrying amount of finite-lived intangible assets at December 31, 2015 is as follows(in thousands):
Years Ending December 31, | Expected Amortization | ||
2016 | $ | 37,902 | |
2017 | 33,081 | ||
2018 | 30,450 | ||
2019 | 27,926 | ||
2020 | 25,539 | ||
Thereafter | 229,594 | ||
$ | 384,492 | ||
(7) ACCRUED EXPENSES
Accrued expenses consisted of the following at December 31 (in thousands):
December 31, 2015 | December 31, 2014 | ||||||
Insurance | $ | 55,899 | $ | 58,931 | |||
Interest | 20,500 | 20,527 | |||||
Accrued compensation and benefits | 35,646 | 59,006 | |||||
Income, real estate, sales and other taxes | 37,095 | 38,297 | |||||
Other | 44,520 | 42,788 | |||||
$ | 193,660 | $ | 219,549 | ||||
73
CLEAN HARBORS, INC. AND SUBSIDIARIES
NOTES TO CONSOLIDATED FINANCIAL STATEMENTS (Continued)
(8) CLOSURE AND POST-CLOSURE LIABILITIES
The changes to closure and post-closure liabilities (also referred to as "asset retirement obligations") from January 1, 2014 through December 31, 2015 were as follows (in thousands):
Landfill Retirement Liability | Non-Landfill Retirement Liability | Total | |||||||||
Balance at January 1, 2014 | $ | 27,604 | $ | 19,481 | $ | 47,085 | |||||
New asset retirement obligations | 3,595 | — | 3,595 | ||||||||
Accretion | 2,583 | 1,875 | 4,458 | ||||||||
Changes in estimates recorded to statement of income | (722 | ) | 73 | (649 | ) | ||||||
Changes in estimates recorded to balance sheet | (1,304 | ) | — | (1,304 | ) | ||||||
Expenditures | (1,580 | ) | (546 | ) | (2,126 | ) | |||||
Currency translation and other | (244 | ) | (114 | ) | (358 | ) | |||||
Balance at December 31, 2014 | 29,932 | 20,769 | 50,701 | ||||||||
Liabilities assumed in TFI acquisition | — | 1,676 | 1,676 | ||||||||
New asset retirement obligations | 3,151 | — | 3,151 | ||||||||
Accretion | 2,516 | 2,122 | 4,638 | ||||||||
Changes in estimates recorded to statement of income (loss) | (162 | ) | 205 | 43 | |||||||
Changes in estimates recorded to balance sheet | 2,942 | — | 2,942 | ||||||||
Expenditures | (5,946 | ) | (177 | ) | (6,123 | ) | |||||
Currency translation and other | (410 | ) | (369 | ) | (779 | ) | |||||
Balance at December 31, 2015 | $ | 32,023 | $ | 24,226 | $ | 56,249 | |||||
All of the landfill facilities included in the above table were active as of December 31, 2015 and 2014. There were no significant charges (benefits) in 2015 and 2014 resulting from changes in estimates for closure and post-closure liabilities.
New asset retirement obligations incurred during 2015 and 2014 were discounted at the credit-adjusted risk-free rate of 5.99% and 6.54%, respectively.
Anticipated payments (based on current estimated costs and anticipated timing of necessary regulatory approvals to commence work on closure and post-closure activities) for each of the next five years and thereafter are as follows (in thousands):
Year ending December 31, | |||
2016 | $ | 8,160 | |
2017 | 9,061 | ||
2018 | 9,001 | ||
2019 | 7,621 | ||
2020 | 3,442 | ||
Thereafter | 262,365 | ||
Undiscounted closure and post-closure liabilities | 299,650 | ||
Less: Discount at credit-adjusted risk-free rate | (156,145 | ) | |
Less: Undiscounted estimated closure and post-closure liabilities relating to airspace not yet consumed | (87,256 | ) | |
Present value of closure and post-closure liabilities | $ | 56,249 | |
74
CLEAN HARBORS, INC. AND SUBSIDIARIES
NOTES TO CONSOLIDATED FINANCIAL STATEMENTS (Continued)
(9) REMEDIAL LIABILITIES
The changes to remedial liabilities from January 1, 2014 through December 31, 2015 were as follows (in thousands):
Remedial Liabilities for Landfill Sites | Remedial Liabilities for Inactive Sites | Remedial Liabilities (Including Superfund) for Non-Landfill Operations | Total | ||||||||||||
Balance at January 1, 2014 | $ | 5,624 | $ | 74,262 | $ | 92,612 | $ | 172,498 | |||||||
Adjustments during the measurement period related to Evergreen | — | — | (536 | ) | (536 | ) | |||||||||
Accretion | 266 | 2,975 | 2,913 | 6,154 | |||||||||||
Changes in estimates recorded to statement of income (loss) | (113 | ) | (2,645 | ) | 40 | (2,718 | ) | ||||||||
Expenditures | (109 | ) | (5,940 | ) | (12,070 | ) | (18,119 | ) | |||||||
Currency translation and other | (248 | ) | (124 | ) | (1,786 | ) | (2,158 | ) | |||||||
Balance at December 31, 2014 | 5,420 | 68,528 | 81,173 | 155,121 | |||||||||||
Accretion | 218 | 2,924 | 2,622 | 5,764 | |||||||||||
Changes in estimates recorded to statement of income (loss) | (2,841 | ) | (2,927 | ) | (5,620 | ) | (11,388 | ) | |||||||
Expenditures | (137 | ) | (4,779 | ) | (9,091 | ) | (14,007 | ) | |||||||
Currency translation and other | (333 | ) | (133 | ) | (3,032 | ) | (3,498 | ) | |||||||
Balance at December 31, 2015 | $ | 2,327 | $ | 63,613 | $ | 66,052 | $ | 131,992 | |||||||
In 2015, the net reduction in the Company's remedial liabilities from changes in estimates recorded to the statement of income (loss) was $11.4 million and primarily related to reductions in the estimates for remedial activities at four locations. Events which occurred during 2015 and resulted in the changes in estimates were attributable to favorable outcomes from negotiations amongst potentially responsible parties which the Company participates in of $3.8 million, the results of work performed by external third party consultants who were engaged to aid the Company in estimating future remedial activity costs at certain sites of $4.7 million and the result of receiving Provincial approval for a planned expansion of one of the Company's landfills in Canada which as a result will remediate the Company's previously recognized obligations of $2.5 million.
In 2014, the reduction in changes in estimates recorded to the statement of income (loss) was primarily related to estimated cost adjustments for remediation across various sites.
Anticipated payments at December 31, 2015 (based on current estimated costs and anticipated timing of necessary regulatory approvals to commence work on remedial activities) for each of the next five years and thereafter were as follows (in thousands):
Year ending December 31, | |||
2016 | $ | 13,525 | |
2017 | 14,004 | ||
2018 | 15,907 | ||
2019 | 10,626 | ||
2020 | 9,963 | ||
Thereafter | 94,116 | ||
Undiscounted remedial liabilities | 158,141 | ||
Less: Discount | (26,149 | ) | |
Total remedial liabilities | $ | 131,992 | |
Based on currently available facts and legal interpretations, existing technology, and presently enacted laws and regulations, the Company estimates that its aggregate liabilities as of December 31, 2015 for future remediation relating to all of its owned or leased facilities and the Superfund sites for which the Company has current or potential future liability is approximately $132.0 million. The Company also estimates that it is reasonably possible that the amount of such total liabilities could be as much as $23.6 million more. Future changes in either available technology or applicable laws or regulations could
75
CLEAN HARBORS, INC. AND SUBSIDIARIES
NOTES TO CONSOLIDATED FINANCIAL STATEMENTS (Continued)
(9) REMEDIAL LIABILITIES (Continued)
affect such estimates of remedial liabilities. Since the Company's satisfaction of the liabilities will occur over many years, the Company cannot now reasonably predict the nature or extent of future changes in either available technology or applicable laws or regulations and the impact that those changes, if any, might have on the current estimates of remedial liabilities.
The following tables show, respectively, (i) the amounts of such estimated liabilities associated with the types of facilities and sites involved and (ii) the amounts of such estimated liabilities associated with each facility or site which represents at least 5% of the total and with all other facilities and sites as a group and as of December 31, 2015.
Estimates Based on Type of Facility or Site (in thousands):
___________________________________
Type of Facility or Site | Remedial Liability | % of Total | Reasonably Possible Additional Liabilities(1) | |||||||
Facilities now used in active conduct of the Company's business (47 facilities) | $ | 59,022 | 44.7 | % | $ | 12,157 | ||||
Inactive facilities not now used in active conduct of the Company's business but most of which were acquired because the assumption of remedial liabilities for such facilities was part of the purchase price for the CSD assets (40 facilities) | 63,613 | 48.2 | 10,543 | |||||||
Superfund sites owned by third parties (17 sites) | 9,357 | 7.1 | 936 | |||||||
Total | $ | 131,992 | 100.0 | % | $ | 23,636 | ||||
(1) | Amounts represent the high end of the range of management's best estimate of the reasonably possible additional liabilities. |
Estimates Based on Amount of Potential Liability (in thousands):
_________________________________
Location | Type of Facility or Site | Remedial Liability | % of Total | Reasonably Possible Additional Liabilities(1) | ||||||||
Baton Rouge, LA(2) | Closed incinerator and landfill | $ | 23,572 | 17.9 | % | $ | 3,931 | |||||
Bridgeport, NJ | Closed incinerator | 18,623 | 14.1 | 2,568 | ||||||||
Mercier, Quebec(2) | Idled incinerator and legal proceedings | 9,012 | 6.8 | 947 | ||||||||
Linden, NJ | Operating solvent recycling center | 8,069 | 6.1 | 867 | ||||||||
Various(2) | All other incinerators, landfills, wastewater treatment facilities and service centers (83 facilities) | 63,359 | 48.0 | 14,387 | ||||||||
Various(2) | Superfund sites (each representing less than 5% of total liabilities) owned by third parties (17 sites) | 9,357 | 7.1 | 936 | ||||||||
Total | $ | 131,992 | 100.0 | % | $ | 23,636 | ||||||
(1) | Amounts represent the high end of the range of management's best estimate of the reasonably possible additional liabilities. |
(2) | $18.9 million of the $132.0 million remedial liabilities and $1.9 million of the $23.6 million reasonably possible additional liabilities include estimates of remediation liabilities related to the legal and administrative proceedings discussed in Note 16, "Commitments and Contingencies," as well as other such estimated remedial liabilities. |
Revisions to remediation reserve requirements may result in upward or downward adjustments to income from operations in any given period. The Company believes that its extensive experience in the environmental services business, as well as its involvement with a large number of sites, provides a reasonable basis for estimating its aggregate liability. It is possible, however, that technological, regulatory or enforcement developments, the results of environmental studies, or other factors could necessitate the recording of additional liabilities or the revision of currently recorded liabilities that could be material. The impact of such future events cannot be estimated at the current time.
76
CLEAN HARBORS, INC. AND SUBSIDIARIES
NOTES TO CONSOLIDATED FINANCIAL STATEMENTS (Continued)
(10) FINANCING ARRANGEMENTS
The following table is a summary of the Company's financing arrangements (in thousands):
December 31, 2015 | December 31, 2014 | ||||||
Senior unsecured notes, at 5.25%, due August 1, 2020 | $ | 800,000 | $ | 800,000 | |||
Senior unsecured notes, at 5.125%, due June 1, 2021 | 595,000 | 595,000 | |||||
Long-term obligations, at par | $ | 1,395,000 | $ | 1,395,000 | |||
Unamortized debt issuance costs | $ | (12,457 | ) | $ | (14,855 | ) | |
Long-term obligations, at carrying value | $ | 1,382,543 | $ | 1,380,145 | |||
Senior Unsecured Notes, at 5.25%, due August 1, 2020. On July 30, 2012, the Company issued through a private placement $800.0 million aggregate principal amount of 5.25% senior unsecured notes due August 1, 2020 ("2020 Notes") with semi-annually fixed interest payments on February 1 and August 1 of each year, which commenced on February 1, 2013. On November 16, 2012, the Company completed an exchange offer for the unregistered 2020 Notes originally issued in the private placement for an equivalent amount of 2020 Notes the Company had registered under the Securities Act of 1933, as amended (the "Securities Act"), pursuant to a registration statement which became effective in October 2012. At December 31, 2015 and December 31, 2014, the fair value of the Company's 2020 Notes was $812.0 million and $804.0 million, respectively, based on quoted market prices for the instrument. The fair value of the 2020 Notes is considered a Level 2 measure according to the fair value hierarchy.
The Company may redeem some or all of the 2020 Notes at any time on or after August 1, 2016 upon proper notice, at the following redemption prices plus unpaid interest:
Year | Percentage | ||
2016 | 102.625 | % | |
2017 | 101.313 | % | |
2018 and thereafter | 100.000 | % | |
At any time, or from time to time, prior to August 1, 2016, the Company may also redeem some or all of the 2020 Notes at a redemption price of 100% of the principal amount plus a make-whole premium and any accrued and unpaid interest.
The 2020 Notes and the related indenture contain various customary non-financial covenants and are guaranteed by substantially all of the Company's current and future domestic restricted subsidiaries. The 2020 Notes are the Company's and the guarantors' senior unsecured obligations ranking equally with the Company's and the guarantors' existing and future senior unsecured obligations and senior to any future indebtedness that is expressly subordinated to the 2020 Notes and the guarantees. The 2020 Notes and the guarantees rank effectively junior in right of payment to the Company's and the guarantors' secured indebtedness (including loans and reimbursement obligations in respect of outstanding letters of credit) under the Company's revolving credit facility and capital lease obligations to the extent of the value of the assets securing such secured indebtedness. The 2020 Notes are not guaranteed by the Company's Canadian or other foreign subsidiaries, and the 2020 Notes are structurally subordinated to all indebtedness and other liabilities, including trade payables, of the Company's subsidiaries that are not guarantors of the 2020 Notes.
Senior Unsecured Notes, at 5.125%, due June 1, 2021. On December 7, 2012, the Company issued through a private placement $600.0 million aggregate principal amount of 5.125% senior unsecured notes due 2021 ("2021 Notes"). The Company used the net proceeds from such private placement to fund a portion of the purchase price to acquire Safety-Kleen. On May 21, 2013, the Company completed an exchange offer for the unregistered 2021 Notes originally issued in the private placement for an equivalent amount of 2021 Notes the Company had registered under the Securities Act pursuant to a registration statement which became effective in April 2013. The Company repurchased $5.0 million principal amount of the 2021 Notes during 2014. At December 31, 2015 and 2014, the fair value of the Company's 2021 Notes was $599.5 million and $595.0 million, respectively, based on quoted market prices or other available market data. The fair value of the 2021 Notes is considered a Level 2 measure according to the fair value hierarchy.
77
CLEAN HARBORS, INC. AND SUBSIDIARIES
NOTES TO CONSOLIDATED FINANCIAL STATEMENTS (Continued)
(10) FINANCING ARRANGEMENTS (Continued)
The principal terms of the 2021 Notes are as follows:
The 2021 Notes will mature on June 1, 2021. The notes bear interest at a rate of 5.125% per annum. Interest is payable semi-annually on June 1 and December 1 of each year. The Company may redeem some or all of the 2021 Notes at any time on or after December 1, 2016 upon proper notice, at the following redemption prices plus unpaid interest: .
Year | Percentage | ||
2016 | 102.563 | % | |
2017 | 101.281 | % | |
2018 and thereafter | 100.000 | % | |
At any time, or from time to time, prior to December 1, 2016, the Company may redeem some or all of the 2021 Notes at a price equal to 100% of the principal amount plus a make-whole premium and accrued and unpaid interest.
The 2021 Notes and the related indenture contain various customary non-financial covenants and are guaranteed by substantially all the Company's current and future domestic restricted subsidiaries. The 2021 Notes are the Company's and the guarantors' senior unsecured obligations ranking equally with the Company's and the guarantors' existing and future senior unsecured obligations and senior to any future indebtedness that is expressly subordinated to the 2021 Notes and the guarantees. The 2021 Notes are effectively subordinated to all of the Company's and the Company's subsidiaries secured indebtedness under the Company's revolving credit facility and capital lease obligations to the extent of the value of the assets securing such secured indebtedness. The 2021 Notes are not guaranteed by the Company's existing and future Canadian or other foreign subsidiaries, and the 2021 Notes are structurally subordinated to all indebtedness and other liabilities, including trade payables, of the Company's subsidiaries that are not guarantors of the 2021 Notes.
Revolving Credit Facility. On January 17, 2013, the Company entered into an amendment and restatement of the previously existing revolving credit facility with Bank of America, N.A. (“BofA”), as agent for the lenders under the facility. The principal terms of the facility are:
(i) the maximum amount of borrowings and letters of credit which the Company may obtain under the facility is $400.0 million (with a $325.0 million sub-limit for letters of credit);
(ii) of such $400.0 million maximum amount, $300.0 million (with a $250.0 million sub-limit for letters of credit) is available for Clean Harbors, Inc. ("Parent") and its domestic subsidiaries and $100.0 million (with a $75.0 million sub-limit for letters of credit) is available for Parent's Canadian subsidiaries;
(iii) the interest rate on borrowings under the facility, in the case of LIBOR loans, is LIBOR plus an applicable margin ranging (depending primarily on the Company's fixed charge coverage ratio for the most recently completed four fiscal quarters) from 1.50% to 2.00% per annum, and, in the case of base rate loans, BofA's base rate plus an applicable margin ranging from 0.50% to 1.00% per annum, and with such reduced applicable margin for LIBOR loans also to be the annual fee for outstanding letters of credit; and
(iv) the term of the facility will expire on January 17, 2018.
The revolving credit facility is guaranteed by all of Parent’s domestic subsidiaries and secured by substantially all of Parent’s and its domestic subsidiaries’ assets. Available credit for Parent and its domestic subsidiaries is limited to 85% of their eligible accounts receivable and 100% of their cash deposited in a controlled account with the agent. Available credit for Parent’s Canadian subsidiaries is limited to 85% of their eligible accounts receivable and 100% of their cash deposited in a controlled account with the agent’s Canadian affiliate. The obligations of the Canadian subsidiaries under the revolving credit facility are guaranteed by all of Parent’s Canadian subsidiaries and secured by substantially all of the assets of the Canadian subsidiaries, but the Canadian subsidiaries do not guarantee and are not otherwise responsible for the obligations of Parent or its domestic subsidiaries.
The Company utilizes letters of credit primarily as security for financial assurance which it has been required to provide to regulatory bodies for its hazardous waste facilities and which would be called only in the event that the Company fails to satisfy closure, post-closure and other obligations under the permits issued by those regulatory bodies for such licensed facilities. At December 31, 2015 and 2014, the revolving credit facility had no outstanding loan balances, $178.5 million and
78
CLEAN HARBORS, INC. AND SUBSIDIARIES
NOTES TO CONSOLIDATED FINANCIAL STATEMENTS (Continued)
(10) FINANCING ARRANGEMENTS (Continued)
$238.4 million, respectively, available to borrow and $144.6 million and $134.5 million, respectively, of letters of credit outstanding.
(11) INCOME TAXES
The domestic and foreign components of income before provision for income taxes were as follows (in thousands):
For the Year Ended December 31, | |||||||||||
2015 | 2014 | 2013 | |||||||||
Domestic | $ | 164,105 | $ | 44,737 | $ | 85,775 | |||||
Foreign | (54,459 | ) | (6,215 | ) | 58,110 | ||||||
Total | $ | 109,646 | $ | 38,522 | $ | 143,885 | |||||
The provision for income taxes consisted of the following (in thousands):
For the Year Ended December 31, | |||||||||||
2015 | 2014 | 2013 | |||||||||
Current: | |||||||||||
Federal | $ | 46,775 | $ | 17,184 | $ | 5,264 | |||||
State | 11,120 | 6,918 | 5,006 | ||||||||
Foreign | 5,719 | 10,428 | 6,930 | ||||||||
63,614 | 34,530 | 17,200 | |||||||||
Deferred | |||||||||||
Federal | 12,254 | 33,858 | 20,574 | ||||||||
State | 2,766 | 1,840 | 2,074 | ||||||||
Foreign | (13,090 | ) | (3,378 | ) | 8,471 | ||||||
1,930 | 32,320 | 31,119 | |||||||||
Provision for income taxes | $ | 65,544 | $ | 66,850 | $ | 48,319 | |||||
The Company's effective tax rate for fiscal years 2015, 2014 and 2013 was 59.8%, 173.5% and 33.6%, respectively. The effective income tax rate varied from the amount computed using the statutory federal income tax rate as follows (in thousands):
For the Year Ended December 31, | |||||||||||
2015 | 2014 | 2013 | |||||||||
Tax expense at US statutory rate | $ | 38,376 | $ | 13,483 | $ | 50,360 | |||||
State income taxes, net of federal benefit | 8,449 | 7,429 | 4,052 | ||||||||
Foreign rate differential | 3,951 | (2,916 | ) | (10,478 | ) | ||||||
Non-deductible transaction costs | — | — | 657 | ||||||||
Uncertain tax position releases | — | — | (4,010 | ) | |||||||
Uncertain tax position interest and penalties | 32 | 2,217 | 457 | ||||||||
Goodwill impairment | 10,974 | 44,273 | — | ||||||||
Other | 3,762 | 2,364 | 7,281 | ||||||||
Provision for income taxes | $ | 65,544 | $ | 66,850 | $ | 48,319 | |||||
79
CLEAN HARBORS, INC. AND SUBSIDIARIES
NOTES TO CONSOLIDATED FINANCIAL STATEMENTS (Continued)
(11) INCOME TAXES (Continued)
The components of the total net deferred tax assets and liabilities at December 31, 2015 and 2014 were as follows (in thousands):
___________________________________
2015 | 2014 | ||||||
Deferred tax assets: | |||||||
Workers compensation and other claims related accruals | $ | 15,316 | $ | 15,904 | |||
Provision for doubtful accounts | 12,654 | 8,921 | |||||
Closure, post-closure and remedial liabilities | 37,407 | 43,640 | |||||
Accrued expenses | 12,455 | 13,451 | |||||
Accrued compensation | 5,425 | 12,094 | |||||
Net operating loss carryforwards(1) | 41,191 | 46,740 | |||||
Tax credit carryforwards(2) | 25,040 | 29,347 | |||||
Uncertain tax positions accrued interest and federal benefit | 1,219 | 1,953 | |||||
Stock-based compensation | 615 | 489 | |||||
Other | 7,421 | 3,622 | |||||
Total deferred tax assets | 158,743 | 176,161 | |||||
Deferred tax liabilities: | |||||||
Property, plant and equipment | (221,969 | ) | (232,106 | ) | |||
Permits and other intangible assets | (159,698 | ) | (155,326 | ) | |||
Total deferred tax liabilities | (381,667 | ) | (387,432 | ) | |||
Total net deferred tax liability before valuation allowance | (222,924 | ) | (211,271 | ) | |||
Less valuation allowance | (30,916 | ) | (29,061 | ) | |||
Net deferred tax liabilities | $ | (253,840 | ) | $ | (240,332 | ) | |
(1) | As of December 31, 2015, the net operating loss carryforwards included (i) state net operating loss carryovers of $63.1 million which will begin to expire in 2016, (ii) federal net operating loss carryforwards of $72.0 million which will begin to expire in 2025, and (iii) foreign net operating loss carryforwards of $49.7 million which will begin to expire in 2016. |
(2) | As of December 31, 2015, the foreign tax credit carryforwards of $25.0 million will expire between 2016 and 2024. |
The Company does not accrue U.S. tax for foreign earnings that it considers to be permanently reinvested outside the United States. Consequently, the Company has not provided any U.S. tax on the unremitted earnings of its foreign subsidiaries. As of December 31, 2015, the amount of earnings for which no repatriation tax has been provided was $212.7 million. It is not practicable to estimate the amount of additional tax that might be payable on those earnings if repatriated.
A valuation allowance is required to be established when, based on an evaluation of available evidence, it is more likely than not that some portion or all of the deferred tax assets will not be realized. Accordingly, as of December 31, 2015 and 2014, the Company had a valuation allowance of $30.9 million and $29.1 million, respectively. The total allowance as of December 31, 2015 consisted of $18.7 million of foreign tax credits, $4.1 million of state net operating loss carryforwards, $6.8 million of foreign net operating loss carryforwards and $1.3 million for the deferred tax assets of a Canadian subsidiary. The allowance as of December 31, 2014 consisted of $16.5 million of foreign tax credits, $3.9 million of state net operating loss carryforwards and $6.7 million of foreign net operating loss carryforwards and $2.0 million for the deferred tax assets of a Canadian subsidiary.
The Company's policy is to recognize interest and penalties related to income tax matters as a component of income tax expense. The liability for unrecognized tax benefits at December 31, 2015 included accrued interest of $0.4 million. Interest expense that is recorded as a tax expense against the liability for unrecognized tax benefits for the years ended December 31, 2015, 2014 and 2013 included interest and penalties of $0.1 million, $0.3 million and $0.3 million, respectively.
80
CLEAN HARBORS, INC. AND SUBSIDIARIES
NOTES TO CONSOLIDATED FINANCIAL STATEMENTS (Continued)
(11) INCOME TAXES (Continued)
The changes to unrecognized tax benefits (excluding related penalties and interest) from January 1, 2013 through December 31, 2015, were as follows (in thousands):
2015 | 2014 | 2013 | |||||||||
Unrecognized tax benefits as of January 1 | $ | 2,537 | $ | 1,304 | $ | 3,543 | |||||
Additions to current year tax positions | — | 904 | 210 | ||||||||
Additions to prior year tax positions | — | 419 | — | ||||||||
Settlements | (217 | ) | — | — | |||||||
Statute expiration | — | — | (2,843 | ) | |||||||
Foreign currency translation | (256 | ) | (90 | ) | 394 | ||||||
Unrecognized tax benefits as of December 31 | $ | 2,064 | $ | 2,537 | $ | 1,304 | |||||
At December 31, 2015, 2014 and 2013, the Company had recorded $2.1 million, $2.5 million and $1.3 million, respectively, of unrecognized tax benefits that if recognized would affect the annual effective tax rate.
The Company recognizes interest, and penalties if applicable, related to unrecognized tax benefits as a component of income tax expense. The Company had approximately $0.4 million, $0.4 million and $0.2 million for the payment of interest accrued at December 31, 2015, 2014 and 2013, respectively.
The Company files U.S. federal income tax returns as well as income tax returns in various states and foreign jurisdictions. The Company may be subject to examination by the Internal Revenue Service (the "IRS") for calendar years 2012 through 2014. Additionally, any net operating losses that were generated in prior years and utilized in these years may also be subject to examination by the IRS. The Company may also be subject to examinations by state and local revenue authorities for calendar years 2011 through 2014. The Company is currently not under examination by the IRS. The Company has ongoing U.S. state and local jurisdictional audits, as well as Canadian federal and provincial audits, all of which the Company believes will not result in material liabilities.
Due to expiring statute of limitation periods and the resolution of tax audits, the Company believes that total unrecognized tax benefits will decrease by approximately $0.5 million within the next 12 months.
(12) EARNINGS (LOSS) PER SHARE
The following are computations of basic and diluted earnings (loss) per share (in thousands except for per share amounts):
Years Ended December 31, | |||||||||||
2015 | 2014 | 2013 | |||||||||
Numerator for basic and diluted earnings (loss) per share: | |||||||||||
Net income (loss) | $ | 44,102 | $ | (28,328 | ) | $ | 95,566 | ||||
Denominator: | |||||||||||
Weighted basic shares outstanding | 58,324 | 60,311 | 60,574 | ||||||||
Dilutive effect of equity-based compensation awards | 110 | — | 154 | ||||||||
Weighted dilutive shares outstanding | 58,434 | 60,311 | 60,728 | ||||||||
Basic earnings (loss) per share | $ | 0.76 | $ | (0.47 | ) | $ | 1.58 | ||||
Diluted earnings (loss) per share | $ | 0.76 | $ | (0.47 | ) | $ | 1.57 | ||||
For the year ended December 31, 2015, the dilutive effect of all then outstanding stock options, restricted stock awards and performance awards is included in the EPS calculations above except for 154,577 of outstanding performance stock awards for which the performance criteria were not attained at that time and 31,656 restricted stock awards which were excluded from the calculation of diluted earnings per share as their inclusion would have an antidilutive effect. As a result of the net loss
81
CLEAN HARBORS, INC. AND SUBSIDIARIES
NOTES TO CONSOLIDATED FINANCIAL STATEMENTS (Continued)
(12) EARNINGS (LOSS) PER SHARE (Continued)
reported for the year ended December 31, 2014, all outstanding stock options, restricted stock awards and performance awards totaling 562,896 were excluded from the calculation of diluted earnings per share as their inclusion would have an antidilutive effect. For the year ended December 31, 2013, the dilutive effect of all then outstanding stock options, restricted stock awards and performance awards is included in the EPS calculations above except for 109,861 outstanding performance stock awards, respectively, for which the performance criteria were not attained at that time.
(13) STOCKHOLDERS' EQUITY
On March 13, 2015, the Company's board of directors increased the size of the Company’s current share repurchase program from $150 million to $300 million. The Company has funded and intends to continue to fund the repurchases through available cash resources. The repurchase program authorizes the Company to purchase the Company's common stock on the open market from time to time. The share repurchases have been and will be made in a manner that complies with applicable U.S. securities laws. The number of shares purchased and the timing of the purchases will depend on a number of factors, including share price, cash required for future business plans, trading volume and other conditions. The Company has no obligation to repurchase stock under this program and may suspend or terminate the repurchase program at any time. As of December 31, 2015, the Company had repurchased and retired a total of approximately 3.4 million shares of its common stock for approximately $177.7 million under this program. As of December 31, 2015, an additional $122.3 million remained available for repurchase of shares under this program.
(14) ACCUMULATED OTHER COMPREHENSIVE LOSS
The changes in accumulated other comprehensive loss by component and related tax effects for the years ended December 31, 2015, 2014 and 2013 were as follows (in thousands):
Foreign Currency Translation Adjustments | Unrealized Gains (Losses) on Available-for-Sale Securities | Unfunded Pension Liability | Total | ||||||||||||
Balance at January 1, 2013 | $ | 50,627 | $ | 660 | $ | (1,655 | ) | $ | 49,632 | ||||||
Other comprehensive (loss) income before reclassifications | (70,791 | ) | 1,452 | 482 | (68,857 | ) | |||||||||
Amounts reclassified out of accumulated other comprehensive loss | — | — | — | — | |||||||||||
Tax effects | — | (208 | ) | (123 | ) | (331 | ) | ||||||||
Other comprehensive (loss) income | (70,791 | ) | 1,244 | 359 | (69,188 | ) | |||||||||
Balance at December 31, 2013 | $ | (20,164 | ) | $ | 1,904 | $ | (1,296 | ) | $ | (19,556 | ) | ||||
Other comprehensive (loss) income before reclassifications | (88,725 | ) | 1,159 | (905 | ) | (88,471 | ) | ||||||||
Amounts reclassified out of accumulated other comprehensive loss | — | (3,388 | ) | — | (3,388 | ) | |||||||||
Tax effects | — | 325 | 248 | 573 | |||||||||||
Other comprehensive loss | (88,725 | ) | (1,904 | ) | (657 | ) | (91,286 | ) | |||||||
Balance at December 31, 2014 | $ | (108,889 | ) | $ | — | $ | (1,953 | ) | $ | (110,842 | ) | ||||
Other comprehensive loss before reclassifications | (144,050 | ) | — | (7 | ) | (144,057 | ) | ||||||||
Amounts reclassified out of accumulated other comprehensive loss | — | — | — | — | |||||||||||
Tax effects | — | — | 7 | 7 | |||||||||||
Other comprehensive loss | (144,050 | ) | — | — | (144,050 | ) | |||||||||
Balance at December 31, 2015 | $ | (252,939 | ) | $ | — | $ | (1,953 | ) | $ | (254,892 | ) | ||||
There were no reclassifications out of accumulated other comprehensive loss during the years ended December 31, 2013 and 2015. The amounts reclassified out of accumulated other comprehensive loss into the consolidated statement of income (loss), with presentation location, during the year ended December 31, 2014 were as follows (in thousands):
Comprehensive Loss Components | December 31, 2014 | Location | ||||
Unrealized holding gains on available-for-sale investments | $ | 3,388 | Other (expense) income | |||
82
CLEAN HARBORS, INC. AND SUBSIDIARIES
NOTES TO CONSOLIDATED FINANCIAL STATEMENTS (Continued)
(15) STOCK-BASED COMPENSATION AND EMPLOYEE BENEFIT PLANS
Stock-Based Compensation
In 2000, the Company adopted a stock incentive plan (the "2000 Plan"), which provided for awards in the form of incentive stock options, non-qualified stock options, restricted stock awards, performance stock awards and common stock awards. The 2000 Plan expired on April 15, 2010, but as of December 31, 2015, 24,000 options remained outstanding under this plan. These options are fully vested with a weighted average exercise price of $28.05 and will remain outstanding until they are either exercised or expire in accordance with their terms.
In 2010, the Company adopted an equity incentive plan (the "2010 Plan"), which provides for awards of up to 6,000,000 shares of common stock (subject to certain anti-dilution adjustments) in the form of (i) stock options, (ii) stock appreciation rights, (iii) restricted stock, (iv) restricted stock units, and (v) certain other stock-based awards. The Company ceased issuing stock options in 2008, and all awards issued to date under the 2010 Plan have been in the form of restricted stock awards and performance stock awards as described below.
As of December 31, 2015 and 2014, the Company had the following types of stock-based compensation awards outstanding under the 2000 Plan and the 2010 Plan (collectively, the "Plans"): stock options, restricted stock awards and performance stock awards. The stock options generally become exercisable up to five years from the date of grant, subject to certain employment requirements, and terminate 10 years from the date of grant. The restricted stock awards generally vest over three to five years subject to continued employment. The performance stock awards vest depending on the satisfaction of certain performance criteria and continued service conditions as described below.
Total stock-based compensation cost charged to selling, general and administrative expenses for the years ended December 31, 2015, 2014 and 2013 was $8.6 million, $8.8 million and $9.0 million, respectively. The total income tax benefit recognized in the consolidated statements of income from stock-based compensation was $2.3 million, $1.9 million and $3.2 million for the years ended December 31, 2015, 2014 and 2013, respectively. The expected per annum forfeiture rates used to calculate compensation expense were 6% for all employees.
Restricted Stock Awards
The following information relates to restricted stock awards that have been granted to employees and directors under the Company's Plans. The restricted stock awards are not transferable until vested and the restrictions generally lapse upon the achievement of continued employment over a three-to-five-year period or service as a director until the following annual meeting of shareholders. The fair value of each restricted stock grant is based on the closing price of the Company's common stock on the date of grant and is amortized to expense over its vesting period.
The following table summarizes information about restricted stock awards for the year ended December 31, 2015:
Restricted Stock | Number of Shares | Weighted Average Grant-Date Fair Value | ||||
Unvested at January 1, 2015 | 383,021 | $ | 56.51 | |||
Granted | 153,934 | 54.16 | ||||
Vested | (128,989 | ) | 55.75 | |||
Forfeited | (45,348 | ) | 56.46 | |||
Unvested at December 31, 2015 | 362,618 | $ | 55.79 | |||
As of December 31, 2015, there was $11.5 million of total unrecognized compensation cost arising from restricted stock awards under the Company's Plans. This cost is expected to be recognized over a weighted average period of 3.1 years. The total fair value of restricted stock vested during 2015, 2014 and 2013 was $6.9 million, $9.4 million and $4.4 million, respectively.
Performance Stock Awards
The following information relates to performance stock awards that have been granted to employees under the Company's Plans. The compensation committee of the Company's board of directors established two-year performance targets which could potentially be achieved in the year granted or one year thereafter. Performance stock awards are subject to performance criteria established by the compensation committee of the Company's board of directors prior to or at the date of grant. The vesting of
83
CLEAN HARBORS, INC. AND SUBSIDIARIES
NOTES TO CONSOLIDATED FINANCIAL STATEMENTS (Continued)
(15) STOCK-BASED COMPENSATION AND EMPLOYEE BENEFIT PLANS (Continued)
the performance stock awards is based on achieving such targets typically based on revenue, Adjusted EBITDA margin, Return on Invested Capital ("ROIC") percentage, and Total Recordable Incident Rate. In addition performance stock awards include continued service conditions.
The fair value of each performance stock award is based on the closing price of the Company's common stock on the date of grant and is amortized to expense over the service period if achievement of performance measures is then considered probable. The expected forfeiture rate used to calculate compensation expense was 6% for all employees.
As of December 31, 2015, management determined that none of the performance criteria were achieved with respect to the performance stock awards granted in 2015 and as a result no stock-based compensation expense was recorded. For the performance stock awards granted in 2014, management determined that one of the four performance criteria was achieved and as a result the Company recognized stock based compensation on 25% of the original award, or $1.0 million, within selling, general and administrative expenses. These awards will vest over the remaining requisite service condition.
The following table summarizes information about performance stock awards for the year ended December 31, 2015:
Performance Stock | Number of Shares | Weighted Average Grant-Date Fair Value | ||||
Unvested at January 1, 2015 | 143,875 | $ | 60.94 | |||
Granted | 168,186 | 56.40 | ||||
Vested | (11,656 | ) | 54.28 | |||
Forfeited | (113,131 | ) | 61.18 | |||
Unvested at December 31, 2015 | 187,274 | $ | 57.13 | |||
As of December 31, 2015, there was $0.6 million of total unrecognized compensation cost arising from non-vested compensation related to performance stock awards then deemed probable of vesting under the Company's Plans. The total fair value of performance awards vested during 2015 was $0.6 million. During 2014 and 2013 no performance awards vested.
Common Stock Awards
In the years ended December 31, 2015 and 2014, the Company did not issue any shares of common stock without restrictions under the Company's Plans.
Employee Benefit Plans
As of December 31, 2015, the Company has responsibility for a defined benefit plan that covered 15 active non-supervisory Canadian employees. For each of the years ended December 31, 2015, 2014 and 2013, net periodic pension cost was $0.3 million. At December 31, 2015, the fair value of the Company's plan assets was $8.4 million. The fair value of $6.6 million of these plan assets was considered a Level 1 measure and the fair value of $1.8 million of these plan assets was considered a Level 2 measure, according to the fair value hierarchy. At December 31, 2014, the fair value of the Company's plan assets was $9.4 million. The fair value of $7.5 million of these plan assets was considered a Level 1 measure and the fair value of $1.9 million of these plan assets was considered a Level 2 measure, according to the fair value hierarchy. As of December 31, 2015 and 2014, the projected benefit obligation was $10.0 million and $11.2 million, respectively.
The Company also has a profit-sharing plan under Section 401(k) of the Internal Revenue Code covering substantially all U.S. employees and a Canadian registered retired savings plan covering all Canadian employees. Both plans allow employees to make contributions up to a specified percentage of their compensation. The Company makes discretionary partial matching contributions established annually by the Board of Directors. The Company expensed $9.2 million, $12.0 million, and $8.9 million for the years ended December 31, 2015, 2014 and 2013, respectively, related to the U.S. plan and $3.0 million, $3.4 million and $3.1 million for the years ended December 31, 2015, 2014 and 2013, respectively, related to the Canadian plan.
84
CLEAN HARBORS, INC. AND SUBSIDIARIES
NOTES TO CONSOLIDATED FINANCIAL STATEMENTS (Continued)
(16) COMMITMENTS AND CONTINGENCIES
Legal and Administrative Proceedings
The Company and its subsidiaries are subject to legal proceedings and claims arising in the ordinary course of business. Actions filed against the Company arise from commercial and employment-related claims including alleged class actions related to sales practices and wage and hour claims. The plaintiffs in these actions may be seeking damages or injunctive relief
or both. These actions are in various jurisdictions and stages of proceedings, and some are covered in part by insurance. In addition, the Company’s waste management services operations are regulated by federal, state, provincial and local laws enacted to regulate discharge of materials into the environment, remediation of contaminated soil and groundwater or otherwise protect the environment. This ongoing regulation results in the Company frequently becoming a party to legal or administrative proceedings involving all levels of governmental authorities and other interested parties. The issues involved in such proceedings generally relate to alleged violations of existing permits and licenses or alleged responsibility under federal or state
Superfund laws to remediate contamination at properties owned either by the Company or by other parties (“third party sites”) to which either the Company or the prior owners of certain of the Company’s facilities shipped wastes.
At December 31, 2015 and December 31, 2014, the Company had recorded reserves of $21.9 million and $33.6 million, respectively, in the Company's financial statements for actual or probable liabilities related to the legal and administrative proceedings in which the Company was then involved, the principal of which are described below. At December 31, 2015 and December 31, 2014, the Company also believed that it was reasonably possible that the amount of these potential liabilities could be as much as $1.9 million and $2.9 million more, respectively. The Company periodically adjusts the aggregate amount of these reserves when actual or probable liabilities are paid or otherwise discharged, new claims arise, or additional relevant information about existing or probable claims becomes available. As of December 31, 2015 and December 31, 2014, the $21.9 million and $33.6 million, respectively, of reserves consisted of (i) $18.9 million and $27.7 million, respectively, related to pending legal or administrative proceedings, including Superfund liabilities, which were included in remedial liabilities on the consolidated balance sheets, and (ii) $3.0 million and $5.9 million, respectively, primarily related to federal, state and provincial enforcement actions, which were included in accrued expenses on the consolidated balance sheets.
As of December 31, 2015, the principal legal and administrative proceedings in which the Company was involved, or which had been terminated during 2015, were as follows:
Ville Mercier. In September 2002, the Company acquired the stock of a subsidiary (the "Mercier Subsidiary") which owns a hazardous waste incinerator in Ville Mercier, Quebec (the "Mercier Facility"). The property adjacent to the Mercier Facility, which is also owned by the Mercier Subsidiary, is now contaminated as a result of actions dating back to 1968, when the Government of Quebec issued to a company unrelated to the Mercier Subsidiary two permits to dump organic liquids into lagoons on the property. In 1999, Ville Mercier and three neighboring municipalities filed separate legal proceedings against the Mercier Subsidiary and the Government of Quebec. In 2012, the municipalities amended their existing statement of claim to seek $2.9 million (Cdn) in general damages and $10.0 million (Cdn) in punitive damages, plus interest and costs, as well as injunctive relief. Both the Government of Quebec and the Company have filed summary judgment motions against the municipalities. The parties are currently attempting to negotiate a resolution and hearings on the motions have been delayed. In September 2007, the Quebec Minister of Sustainable Development, Environment and Parks issued a Notice pursuant to Section 115.1 of the Environment Quality Act, superseding Notices issued in 1992, which are the subject of the pending litigation. The more recent Notice notifies the Mercier Subsidiary that, if the Mercier Subsidiary does not take certain remedial measures at the site, the Minister intends to undertake those measures at the site and claim direct and indirect costs related to such measures. The Company has accrued for costs expected to be incurred relative to the resolution of this matter and believes this matter will not have future material effect on its financial position or results of operations.
Refinery Incident. In September 2014, a customer filed suit against the Company and two other contractors and their respective insurers seeking to be named as an additional insured on the Company’s and the other contractors’ liability policies for an April 2013 industrial fire that occurred at the customer’s refining facility. As of December 31, 2015 the Company and its insurers have resolved the dispute relating to the customer’s additional insured status and the customer has agreed to indemnify the Company from any additional losses relating to the matter. The Company believes that this matter is currently resolved and will not have any future material effect on its financial position or results of operations.
Safety-Kleen Legal Proceedings. On December 28, 2012, the Company acquired Safety-Kleen, Inc. ("Safety-Kleen") and thereby became subject to the legal proceedings in which Safety-Kleen was a party on that date. In addition to certain Superfund proceedings in which Safety-Kleen has been named as a potentially responsible party as described below under
85
CLEAN HARBORS, INC. AND SUBSIDIARIES
NOTES TO CONSOLIDATED FINANCIAL STATEMENTS (Continued)
(16) COMMITMENTS AND CONTINGENCIES (Continued)
“Superfund Proceedings,” the principal such legal proceedings involving Safety-Kleen which were outstanding as of December 31, 2015 were as follows:
Product Liability Cases. Safety-Kleen is named as a defendant in various lawsuits that are currently pending in various courts and jurisdictions throughout the United States, including approximately 58 proceedings (excluding cases which have been settled but not formally dismissed) as of December 31, 2015, wherein persons claim personal injury resulting from the use of Safety-Kleen's parts cleaning equipment or cleaning products. These proceedings typically involve allegations that the solvent used in Safety-Kleen's parts cleaning equipment contains contaminants and/or that Safety-Kleen's recycling process does not effectively remove the contaminants that become entrained in the solvent during their use. In addition, certain claimants assert that Safety-Kleen failed to warn adequately the product user of potential risks, including an historic failure to warn that solvent contains trace amounts of toxic or hazardous substances such as benzene. Safety-Kleen maintains insurance that it believes will provide coverage for these claims (over amounts accrued for self-insured retentions and deductibles in certain limited cases), except for punitive damages to the extent not insurable under state law or excluded from insurance coverage. Safety-Kleen believes that these claims lack merit and has historically vigorously defended, and intends to continue to vigorously defend, itself and the safety of its products against all of these claims. Such matters are subject to many uncertainties and outcomes are not predictable with assurance. Consequently, Safety-Kleen is unable to ascertain the ultimate aggregate amount of monetary liability or financial impact with respect to these matters as of December 31, 2015. From January 1, 2015 to December 31, 2015, 30 product liability claims were settled or dismissed. Due to the nature of these claims and the related insurance, the Company did not incur any expense as Safety-Kleen's insurance provided coverage in full for all such claims. Safety-Kleen may be named in similar, additional lawsuits in the future, including claims for which insurance coverage may not be available.
Fee Class Action Claims. In October 2010, two customers filed a complaint, individually and on behalf of all similarly situated customers in the State of Alabama, alleging that Safety-Kleen improperly assessed fuel surcharges and extended area service fees. In 2012, similar lawsuits were filed by the same law firm in California and Missouri. On January 15, 2015, the Company reached a tentative settlement of the pending class action lawsuits, which were broadened to include similar claims on behalf of customers in Florida, West Virginia and Arkansas. The settlement was approved by the court in a fairness hearing in June 2015. The settlement amount paid to class claimants was not material. The matter has been dismissed.
Superfund Proceedings
The Company has been notified that either the Company (which, since December 28, 2012, includes Safety-Kleen) or the prior owners of certain of the Company's facilities for which the Company may have certain indemnification obligations have been identified as potentially responsible parties ("PRPs") or potential PRPs in connection with 128 sites which are subject to or
are proposed to become subject to proceedings under federal or state Superfund laws. Of the 128 sites, two (the Wichita Facility and the BR Facility described below) involve facilities that are now owned by the Company and 126 involve third party sites to which either the Company or the prior owners of certain of the Company’s facilities shipped wastes. Of the 126 third party sites, 32 are now settled, 16 are currently requiring expenditures on remediation and 78 are not currently requiring expenditures on remediation.
In connection with each site, the Company has estimated the extent, if any, to which it may be subject, either directly or as a result of any indemnification obligations, for cleanup and remediation costs, related legal and consulting costs associated with PRP investigations, settlements, and related legal and administrative proceedings. The amount of such actual and potential
liability is inherently difficult to estimate because of, among other relevant factors, uncertainties as to the legal liability (if any) of the Company or the prior owners of certain of the Company's facilities to contribute a portion of the cleanup costs, the assumptions that must be made in calculating the estimated cost and timing of remediation, the identification of other PRPs and their respective capability and obligation to contribute to remediation efforts, and the existence and legal standing of indemnification agreements (if any) with prior owners, which may either benefit the Company or subject the Company to potential indemnification obligations. In addition to the Wichita Property and the BR Facility, Clean Harbors believes its potential liability could exceed $100,000 at 10 of the 126 third party sites.
Wichita Property. The Company acquired in 2002 as part of the CSD assets a service center located in Wichita, Kansas (the "Wichita Property"). The Wichita Property is one of several properties located within the boundaries of a 1,400 acre state-designated Superfund site in an old industrial section of Wichita known as the North Industrial Corridor Site. Along with numerous other PRPs, the former owner executed a consent decree relating to such site with the U.S. Environmental Protection Agency (the "EPA"), and the Company is continuing an ongoing remediation program for the Wichita Property in accordance
86
CLEAN HARBORS, INC. AND SUBSIDIARIES
NOTES TO CONSOLIDATED FINANCIAL STATEMENTS (Continued)
(16) COMMITMENTS AND CONTINGENCIES (Continued)
with that consent decree. The Company also acquired rights under an indemnification agreement between the former owner and an earlier owner of the Wichita Property. The Company filed suit against the earlier owner in July of 2015 to recover costs incurred during the cleanup of the property.
BR Facility. The Company acquired in 2002 a former hazardous waste incinerator and landfill in Baton Rouge (the "BR Facility"), for which operations had been previously discontinued by the prior owner. In September 2007, the EPA issued a special notice letter to the Company related to the Devil's Swamp Lake Site ("Devil's Swamp") in East Baton Rouge Parish, Louisiana. Devil's Swamp includes a lake located downstream of an outfall ditch where wastewater and stormwater have been discharged, and Devil's Swamp is proposed to be included on the National Priorities List due to the presence of Contaminants of Concern ("COC") cited by the EPA. These COCs include substances of the kind found in wastewater and storm water discharged from the BR Facility in past operations. The EPA originally requested COC generators to submit a good faith offer to conduct a remedial investigation feasibility study directed towards the eventual remediation of the site. The Company is currently performing corrective actions at the BR Facility under an order issued by the Louisiana Department of Environmental Quality, and has begun conducting the remedial investigation and feasibility study under an order issued by the EPA. The Company cannot presently estimate the potential additional liability for the Devil's Swamp cleanup until a final remedy is selected by the EPA.
Third Party Sites. Of the 126 third party sites at which the Company has been notified it is a PRP or potential PRP or may have indemnification obligations, Clean Harbors has an indemnification agreement at 11 of these sites with ChemWaste, a former subsidiary of Waste Management, Inc., and at six additional of these third party sites, Safety-Kleen has a similar indemnification agreement with McKesson Corporation. These agreements indemnify the Company (which now includes Safety-Kleen) with respect to any liability at the 17 sites for waste disposed prior to the Company's (or Safety-Kleen's) acquisition of the former subsidiaries of Waste Management or McKesson which had shipped wastes to those sites. Accordingly, Waste Management or McKesson are paying all costs of defending those subsidiaries in those 17 cases, including legal fees and settlement costs. However, there can be no guarantee that the Company's ultimate liabilities for those sites will not exceed the amount recorded or that indemnities applicable to any of these sites will be available to pay all or a portion of related costs. Except for the indemnification agreements which the Company holds from ChemWaste and McKesson, the Company does not have an indemnity agreement with respect to any of the 126 third party sites discussed above.
Federal, State and Provincial Enforcement Actions
From time to time, the Company pays fines or penalties in regulatory proceedings relating primarily to waste treatment, storage or disposal facilities. As of December 31, 2015 and 2014, there were six and four proceedings, respectively, for which the Company reasonably believed that the sanctions could equal or exceed $100,000. The Company believes that the fines or other penalties in these or any of the other regulatory proceedings will, individually or in the aggregate, not have a material effect on its financial condition, results of operations or cash flows.
Leases
The Company leases facilities, service centers and personal property under certain operating leases. Some of these lease agreements contain an escalation clause for increased taxes and operating expenses and are renewable at the option of the Company. Lease terms range from 1 to 20 years. The following is a summary of future minimum payments under operating leases that have initial or remaining noncancelable lease terms in excess of one year at December 31, 2015 (in thousands):
Year | Total Operating Leases | ||
2016 | $ | 37,064 | |
2017 | 29,198 | ||
2018 | 21,926 | ||
2019 | 17,997 | ||
2020 | 12,406 | ||
Thereafter | 24,387 | ||
Total minimum lease payments | $ | 142,978 | |
During the years ended December 31, 2015, 2014 and 2013, rent expense including short-term rentals was approximately $135.5 million, $129.6 million, and $124.4 million, respectively.
87
CLEAN HARBORS, INC. AND SUBSIDIARIES
NOTES TO CONSOLIDATED FINANCIAL STATEMENTS (Continued)
(16) COMMITMENTS AND CONTINGENCIES (Continued)
Other Contingencies
Under the Company's insurance programs, coverage is obtained for catastrophic exposures, as well as those risks required to be insured by law or contract. The Company's policy is to retain a significant portion of certain expected losses related primarily to workers' compensation, health insurance, comprehensive general, environmental impairment and vehicle liability.
Provisions for losses expected under these programs are recorded based upon the Company's estimates of the aggregate liability for claims. The deductible per participant per year for the health insurance policy is $0.3 million. The deductible per occurrence for workers' compensation is $1.0 million, general liability is $2.0 million and vehicle liability is $2.0 million. The retention per claim for the environmental impairment policy is $1.0 million. At December 31, 2015 and 2014, the Company had accrued $34.8 million and $34.0 million, respectively, for its self-insurance liabilities (exclusive of health insurance) using a risk-free discount rate of 1.29% and 1.28%, respectively. Actual expenditures in future periods can differ materially from accruals based on estimates.
Anticipated payments at December 31, 2015 for each of the next five years and thereafter are as follows (in thousands):
Years ending December 31, | |||
2016 | $ | 14,735 | |
2017 | 7,383 | ||
2018 | 4,948 | ||
2019 | 3,539 | ||
2020 | 1,829 | ||
Thereafter | 3,109 | ||
Undiscounted self-insurance liabilities | 35,543 | ||
Less: Discount | 732 | ||
Total self-insurance liabilities (included in accrued expenses) | $ | 34,811 | |
(17) SEGMENT REPORTING
Segment reporting is prepared on the same basis that the Company's chief executive officer, who is the Company's chief operating decision maker, manages the business, makes operating decisions and assesses performance. The Company's operations are managed in six reportable segments based primarily upon the nature of the various operations and services provided: Technical Services, Industrial and Field Services which consists of the Industrial Services and Field Services operating segments, Kleen Performance Products, SK Environmental Services, Lodging Services and Oil and Gas Field Services.
Third party revenue is revenue billed to outside customers by a particular segment. Direct revenue is revenue allocated to the segment providing the product or service. Intersegment revenues represent the sharing of third party revenues among the segments based on products and services provided by each segment as if the products and services were sold directly to the third party. The intersegment revenues are shown net. The negative intersegment revenues are due to more transfers out of customer revenues to other segments than transfers in of customer revenues from other segments. The operations not managed through the Company’s six reportable segments are recorded as “Corporate Items.” Corporate Items revenues consist of two different operations for which the revenues are insignificant. Corporate Items cost of revenues represents certain central services that are not allocated to the six segments for internal reporting purposes. Corporate Items selling, general and administrative expenses include typical corporate items such as legal, accounting and other items of a general corporate nature that are not allocated to the Company’s six reportable segments. Performance of the segments is evaluated on several factors, of which the primary financial measure is “Adjusted EBITDA,” which consists of net income (loss) plus accretion of environmental liabilities, depreciation and amortization, net interest expense, provision for income taxes, other non-cash charges (including goodwill impairment charge) not deemed representative of fundamental segment results and excludes other expense (income). Transactions between the segments are accounted for at the Company’s best estimate based on similar transactions with outside customers.
88
CLEAN HARBORS, INC. AND SUBSIDIARIES
NOTES TO CONSOLIDATED FINANCIAL STATEMENTS (Continued)
(17) SEGMENT REPORTING (Continued)
The following table reconciles third party revenues to direct revenues for the years ended December 31, 2015, 2014 and 2013 (in thousands).
For the Year Ended December 31, 2015 | |||||||||||||||||||||||||||||||
Technical Services | Industrial and Field Services | Kleen Performance Products | SK Environmental Services | Lodging Services | Oil and Gas Field Services | Corporate Items | Totals | ||||||||||||||||||||||||
Third party revenues | $ | 991,410 | $ | 957,337 | $ | 386,824 | $ | 674,102 | $ | 89,060 | $ | 175,946 | $ | 458 | $ | 3,275,137 | |||||||||||||||
Intersegment revenues, net | 144,084 | (32,982 | ) | (79,991 | ) | (39,241 | ) | 2,496 | 5,634 | — | — | ||||||||||||||||||||
Corporate Items, net | 3,586 | (756 | ) | (8 | ) | 3 | 157 | 200 | (3,182 | ) | — | ||||||||||||||||||||
Direct revenues | $ | 1,139,080 | $ | 923,599 | $ | 306,825 | $ | 634,864 | $ | 91,713 | $ | 181,780 | $ | (2,724 | ) | $ | 3,275,137 | ||||||||||||||
For the Year Ended December 31, 2014 | |||||||||||||||||||||||||||||||
Technical Services | Industrial and Field Services | Kleen Performance Products | SK Environmental Services | Lodging Services | Oil and Gas Field Services | Corporate Items | Totals | ||||||||||||||||||||||||
Third party revenues | $ | 1,043,267 | $ | 681,779 | $ | 533,587 | $ | 667,320 | $ | 172,218 | $ | 303,189 | $ | 276 | $ | 3,401,636 | |||||||||||||||
Intersegment revenues, net | 156,543 | (42,681 | ) | (201,859 | ) | 80,477 | 2,434 | 5,086 | — | — | |||||||||||||||||||||
Corporate Items, net | 5,573 | 271 | (5 | ) | (58 | ) | 80 | (5 | ) | (5,856 | ) | — | |||||||||||||||||||
Direct revenues | $ | 1,205,383 | $ | 639,369 | $ | 331,723 | $ | 747,739 | $ | 174,732 | $ | 308,270 | $ | (5,580 | ) | $ | 3,401,636 | ||||||||||||||
For the Year Ended December 31, 2013 | |||||||||||||||||||||||||||||||
Technical Services | Industrial and Field Services | Kleen Performance Products | SK Environmental Services | Lodging Services | Oil and Gas Field Services | Corporate Items | Totals | ||||||||||||||||||||||||
Third party revenues | $ | 1,023,926 | $ | 708,523 | $ | 528,636 | $ | 665,008 | $ | 208,545 | $ | 383,959 | $ | (8,941 | ) | $ | 3,509,656 | ||||||||||||||
Intersegment revenues, net | 120,382 | (44,717 | ) | (193,009 | ) | 107,007 | 3,450 | 6,887 | — | — | |||||||||||||||||||||
Corporate Items, net | 3,507 | (217 | ) | — | 84 | 390 | (341 | ) | (3,423 | ) | — | ||||||||||||||||||||
Direct revenues | $ | 1,147,815 | $ | 663,589 | $ | 335,627 | $ | 772,099 | $ | 212,385 | $ | 390,505 | $ | (12,364 | ) | $ | 3,509,656 | ||||||||||||||
89
CLEAN HARBORS, INC. AND SUBSIDIARIES
NOTES TO CONSOLIDATED FINANCIAL STATEMENTS (Continued)
(17) SEGMENT REPORTING (Continued)
The following table presents Adjusted EBITDA information used by management by reported segment (in thousands). The Company does not allocate interest expense, income taxes, depreciation, amortization, accretion of environmental liabilities, other non-cash charges not deemed representative of fundamental segment results and other expense (income) to its segments.
For the Year Ended December 31, | |||||||||||
2015 | 2014 | 2013 | |||||||||
Adjusted EBITDA: | |||||||||||
Technical Services | $ | 291,737 | $ | 328,130 | $ | 285,520 | |||||
Industrial and Field Services | 157,500 | 87,591 | 96,804 | ||||||||
Kleen Performance Products | 32,189 | 51,561 | 57,003 | ||||||||
SK Environmental Services | 140,073 | 113,986 | 112,722 | ||||||||
Lodging Services | 16,478 | 61,438 | 80,358 | ||||||||
Oil and Gas Field Services | (827 | ) | 40,114 | 67,855 | |||||||
Corporate Items | (132,983 | ) | (160,901 | ) | (190,157 | ) | |||||
Total | 504,167 | 521,919 | 510,105 | ||||||||
Reconciliation to Consolidated Statements of Income (Loss): | |||||||||||
Pre-tax, non-cash acquisition accounting inventory adjustment | — | — | 13,559 | ||||||||
Accretion of environmental liabilities | 10,402 | 10,612 | 11,541 | ||||||||
Depreciation and amortization | 274,194 | 276,083 | 264,449 | ||||||||
Goodwill impairment charge | 31,992 | 123,414 | — | ||||||||
Income from operations | 187,579 | 111,810 | 220,556 | ||||||||
Other expense (income) | 1,380 | (4,380 | ) | (1,705 | ) | ||||||
Interest expense, net of interest income | 76,553 | 77,668 | 78,376 | ||||||||
Income from operations before provision for income taxes | $ | 109,646 | $ | 38,522 | $ | 143,885 | |||||
Revenue, property, plant and equipment and intangible assets outside of the United States
For the year ended December 31, 2015, the Company generated $2,576.2 million or 78.7% of revenues in the United States and Puerto Rico, $695.0 million or 21.2% of revenues in Canada, and less than 1.0% of revenues in other international locations. For the year ended December 31, 2014, the Company generated $2,414.6 million or 71.0% of revenues in the United States and Puerto Rico, $982.1 million or 28.9% of revenues in Canada, and less than 1.0% of revenues in other international locations. For the year ended December 31, 2013, the Company generated $2,376.2 million or 67.7% of revenues in the United States and Puerto Rico, $1,125.0 million or 32.1% of revenues in Canada, and less than 1.0% of revenues in other international locations.
As of December 31, 2015, the Company had property, plant and equipment, net of depreciation and amortization of $1,532.5 million, and permits and other intangible assets of $506.8 million. Of these totals, $449.3 million or 29.3% of property, plant and equipment and $71.7 million or 14.2% of permits and other intangible assets were in Canada, with the balance being in the United States and Puerto Rico (except for insignificant assets in other foreign countries). As of December 31, 2014, the Company had property, plant and equipment, net of depreciation and amortization of $1,558.8 million, and permits and other intangible assets of $530.1 million. Of these totals, $587.4 million or 37.7% of property, plant and equipment and $94.2 million or 17.8% of permits and other intangible assets were in Canada, with the balance being in the United States and Puerto Rico (except for insignificant assets in other foreign countries).
90
CLEAN HARBORS, INC. AND SUBSIDIARIES
NOTES TO CONSOLIDATED FINANCIAL STATEMENTS (Continued)
(17) SEGMENT REPORTING (Continued)
The following table presents assets by reported segment and in the aggregate (in thousands).
December 31, 2015 | December 31, 2014 | ||||||
Property, plant and equipment, net | |||||||
Technical Services | $ | 483,425 | $ | 412,323 | |||
Industrial and Field Services | 237,660 | 245,115 | |||||
Kleen Performance Products | 193,855 | 201,451 | |||||
SK Environmental Services | 264,539 | 240,078 | |||||
Lodging Services | 105,208 | 141,965 | |||||
Oil and Gas Field Services | 156,286 | 215,574 | |||||
Corporate Items | 91,494 | 102,328 | |||||
Total property, plant and equipment, net | $ | 1,532,467 | $ | 1,558,834 | |||
Goodwill and Permits and other intangibles, net | |||||||
Technical Services | |||||||
Goodwill | $ | 49,267 | $ | 50,092 | |||
Permits and other intangibles, net | 73,601 | 74,870 | |||||
Total Technical Services | 122,868 | 124,962 | |||||
Industrial and Field Services | |||||||
Goodwill | 105,286 | 109,214 | |||||
Permits and other intangibles, net | 14,649 | 17,801 | |||||
Total Industrial and Field Services | 119,935 | 127,015 | |||||
Kleen Performance Products | |||||||
Goodwill | 49,755 | 50,883 | |||||
Permits and other intangibles, net | 140,410 | 151,041 | |||||
Total Kleen Performance Products | 190,165 | 201,924 | |||||
SK Environmental Services | |||||||
Goodwill | 216,589 | 173,873 | |||||
Permits and other intangibles, net | 256,251 | 252,897 | |||||
Total SK Environmental Services | 472,840 | 426,770 | |||||
Lodging Services | |||||||
Goodwill | 32,208 | 34,863 | |||||
Permits and other intangibles, net | 7,045 | 10,744 | |||||
Total Lodging Services | 39,253 | 45,607 | |||||
Oil and Gas Field Services | |||||||
Goodwill | — | 33,744 | |||||
Permits and other intangibles, net | 14,862 | 22,727 | |||||
Total Oil and Gas Field Services | 14,862 | 56,471 | |||||
Total | $ | 959,923 | $ | 982,749 | |||
91
CLEAN HARBORS, INC. AND SUBSIDIARIES
NOTES TO CONSOLIDATED FINANCIAL STATEMENTS (Continued)
(17) SEGMENT REPORTING (Continued)
The following table presents the total assets by reported segment (in thousands).
December 31, 2015 | December 31, 2014 | December 31, 2013 | |||||||||
Technical Services | $ | 800,060 | $ | 756,169 | $ | 699,675 | |||||
Industrial and Field Services | 368,858 | 392,652 | 410,233 | ||||||||
Kleen Performance Products | 492,483 | 538,921 | 642,901 | ||||||||
SK Environmental Services | 805,488 | 731,072 | 774,756 | ||||||||
Lodging Services | 181,357 | 231,782 | 239,056 | ||||||||
Oil and Gas Field Services | 244,210 | 361,223 | 381,057 | ||||||||
Corporate Items | 538,972 | 677,604 | 788,752 | ||||||||
Total | $ | 3,431,428 | $ | 3,689,423 | $ | 3,936,430 | |||||
The following table presents the total assets by geographical area (in thousands).
December 31, 2015 | December 31, 2014 | December 31, 2013 | |||||||||
United States | $ | 2,575,746 | $ | 2,557,639 | $ | 2,667,438 | |||||
Canada | 851,949 | 1,128,458 | 1,266,505 | ||||||||
Other foreign | 3,733 | 3,326 | 2,487 | ||||||||
Total | $ | 3,431,428 | $ | 3,689,423 | $ | 3,936,430 | |||||
(18) GUARANTOR AND NON-GUARANTOR SUBSIDIARIES
The 2020 Notes and the 2021 Notes are guaranteed by substantially all of the Company’s subsidiaries organized in the United States. Each guarantor for the 2020 Notes and the 2021 Notes is a 100% owned subsidiary of Clean Harbors, Inc. and its guarantee is both full and unconditional and joint and several. The guarantees are, however, subject to customary release provisions under which, in particular, the guarantee of any of our domestic restricted subsidiaries will be released if we sell such subsidiary to an unrelated third party in accordance with the terms of the indenture which governs the notes. The 2020 Notes and the 2021 Notes are not guaranteed by the Company’s Canadian or other foreign subsidiaries. The following supplemental condensed consolidating financial information for the parent company, the guarantor subsidiaries and the non-guarantor subsidiaries respectively, is presented in conformity with the requirements of Rule 3-10 of SEC Regulation S-X (“Rule 3-10”).
92
CLEAN HARBORS, INC. AND SUBSIDIARIES
NOTES TO CONSOLIDATED FINANCIAL STATEMENTS (Continued)
(18) GUARANTOR AND NON-GUARANTOR SUBSIDIARIES (Continued)
Following is the condensed consolidating balance sheet at December 31, 2015 (in thousands):
Clean Harbors, Inc. | U.S. Guarantor Subsidiaries | Foreign Non-Guarantor Subsidiaries | Consolidating Adjustments | Total | |||||||||||||||
Assets: | |||||||||||||||||||
Cash and cash equivalents | $ | 11,017 | $ | 83,479 | $ | 90,212 | $ | — | $ | 184,708 | |||||||||
Intercompany receivables | 164,709 | 213,243 | 39,804 | (417,756 | ) | — | |||||||||||||
Accounts receivable, net | — | 404,580 | 91,424 | — | 496,004 | ||||||||||||||
Other current assets | — | 179,969 | 60,515 | — | 240,484 | ||||||||||||||
Property, plant and equipment, net | — | 1,082,466 | 450,001 | — | 1,532,467 | ||||||||||||||
Investments in subsidiaries | 2,547,307 | 522,067 | — | (3,069,374 | ) | — | |||||||||||||
Intercompany debt receivable | — | 260,957 | 3,701 | (264,658 | ) | — | |||||||||||||
Goodwill | — | 367,306 | 85,799 | — | 453,105 | ||||||||||||||
Permits and other intangibles, net | — | 435,080 | 71,738 | — | 506,818 | ||||||||||||||
Other long-term assets | 1,068 | 10,274 | 6,500 | — | 17,842 | ||||||||||||||
Total assets | $ | 2,724,101 | $ | 3,559,421 | $ | 899,694 | $ | (3,751,788 | ) | $ | 3,431,428 | ||||||||
Liabilities and Stockholders' Equity: | |||||||||||||||||||
Current liabilities | $ | 20,813 | $ | 424,588 | $ | 71,719 | $ | — | $ | 517,120 | |||||||||
Intercompany payables | 220,762 | 195,287 | 1,707 | (417,756 | ) | — | |||||||||||||
Closure, post-closure and remedial liabilities, net | — | 153,190 | 14,656 | — | 167,846 | ||||||||||||||
Long-term obligations | 1,382,543 | — | — | — | 1,382,543 | ||||||||||||||
Capital lease obligations, net | — | — | — | — | — | ||||||||||||||
Intercompany debt payable | 3,701 | — | 260,957 | (264,658 | ) | — | |||||||||||||
Other long-term liabilities | — | 239,049 | 28,588 | — | 267,637 | ||||||||||||||
Total liabilities | 1,627,819 | 1,012,114 | 377,627 | (682,414 | ) | 2,335,146 | |||||||||||||
Stockholders' equity | 1,096,282 | 2,547,307 | 522,067 | (3,069,374 | ) | 1,096,282 | |||||||||||||
Total liabilities and stockholders' equity | $ | 2,724,101 | $ | 3,559,421 | $ | 899,694 | $ | (3,751,788 | ) | $ | 3,431,428 | ||||||||
93
CLEAN HARBORS, INC. AND SUBSIDIARIES
NOTES TO CONSOLIDATED FINANCIAL STATEMENTS (Continued)
(18) GUARANTOR AND NON-GUARANTOR SUBSIDIARIES (Continued)
Following is the condensed consolidating balance sheet at December 31, 2014 (in thousands):
Clean Harbors, Inc. | U.S. Guarantor Subsidiaries | Foreign Non-Guarantor Subsidiaries | Consolidating Adjustments | Total | |||||||||||||||
Assets: | |||||||||||||||||||
Cash and cash equivalents | $ | 1,006 | $ | 154,147 | $ | 91,726 | $ | — | $ | 246,879 | |||||||||
Intercompany receivables | 133,219 | 156,920 | 39,724 | (329,863 | ) | — | |||||||||||||
Accounts receivable, net | — | 414,205 | 142,926 | — | 557,131 | ||||||||||||||
Other current assets | — | 241,232 | 81,191 | — | 322,423 | ||||||||||||||
Property, plant and equipment, net | — | 970,757 | 588,077 | — | 1,558,834 | ||||||||||||||
Investments in subsidiaries | 2,694,727 | 663,191 | — | (3,357,918 | ) | — | |||||||||||||
Intercompany debt receivable | — | 327,634 | 3,701 | (331,335 | ) | — | |||||||||||||
Goodwill | — | 324,930 | 127,739 | — | 452,669 | ||||||||||||||
Permits and other intangibles, net | — | 435,906 | 94,174 | — | 530,080 | ||||||||||||||
Other long-term assets | 1,946 | 12,959 | 6,502 | — | 21,407 | ||||||||||||||
Total assets | $ | 2,830,898 | $ | 3,701,881 | $ | 1,175,760 | $ | (4,019,116 | ) | $ | 3,689,423 | ||||||||
Liabilities and Stockholders' Equity: | |||||||||||||||||||
Current liabilities | $ | 20,820 | $ | 444,059 | $ | 107,592 | $ | — | $ | 572,471 | |||||||||
Intercompany payables | 163,361 | 164,231 | 2,271 | (329,863 | ) | — | |||||||||||||
Closure, post-closure and remedial liabilities, net | — | 158,622 | 25,109 | — | 183,731 | ||||||||||||||
Long-term obligations | 1,380,145 | — | — | — | 1,380,145 | ||||||||||||||
Capital lease obligations, net | — | — | — | — | — | ||||||||||||||
Intercompany debt payable | 3,701 | — | 327,634 | (331,335 | ) | — | |||||||||||||
Other long-term liabilities | — | 240,242 | 49,963 | — | 290,205 | ||||||||||||||
Total liabilities | 1,568,027 | 1,007,154 | 512,569 | (661,198 | ) | 2,426,552 | |||||||||||||
Stockholders' equity | 1,262,871 | 2,694,727 | 663,191 | (3,357,918 | ) | 1,262,871 | |||||||||||||
Total liabilities and stockholders' equity | $ | 2,830,898 | $ | 3,701,881 | $ | 1,175,760 | $ | (4,019,116 | ) | $ | 3,689,423 | ||||||||
94
CLEAN HARBORS, INC. AND SUBSIDIARIES
NOTES TO CONSOLIDATED FINANCIAL STATEMENTS (Continued)
(18) GUARANTOR AND NON-GUARANTOR SUBSIDIARIES (Continued)
Following is the consolidating statement of income (loss) for the year ended December 31, 2015 (in thousands):
Clean Harbors, Inc. | U.S. Guarantor Subsidiaries | Foreign Non-Guarantor Subsidiaries | Consolidating Adjustments | Total | |||||||||||||||
Revenues | |||||||||||||||||||
Service revenues | $ | — | $ | 2,111,086 | $ | 692,216 | $ | (59,030 | ) | $ | 2,744,272 | ||||||||
Product revenues | — | 458,314 | 83,970 | (11,419 | ) | 530,865 | |||||||||||||
Total revenues | — | 2,569,400 | 776,186 | (70,449 | ) | 3,275,137 | |||||||||||||
Cost of revenues (exclusive of items shown separately below) | |||||||||||||||||||
Service cost of revenues | 5 | 1,415,435 | 542,497 | (59,030 | ) | 1,898,907 | |||||||||||||
Product cost of revenues | — | 410,128 | 59,190 | (11,419 | ) | 457,899 | |||||||||||||
Total cost of revenues | 5 | 1,825,563 | 601,687 | (70,449 | ) | 2,356,806 | |||||||||||||
Selling, general and administrative expenses | 101 | 329,069 | 84,994 | — | 414,164 | ||||||||||||||
Accretion of environmental liabilities | — | 9,209 | 1,193 | — | 10,402 | ||||||||||||||
Depreciation and amortization | — | 184,017 | 90,177 | — | 274,194 | ||||||||||||||
Goodwill impairment charge | — | 4,164 | 27,828 | — | 31,992 | ||||||||||||||
(Loss) income from operations | (106 | ) | 217,378 | (29,693 | ) | — | 187,579 | ||||||||||||
Other income (loss) | — | 491 | (1,871 | ) | — | (1,380 | ) | ||||||||||||
Interest (expense) income, net | (78,621 | ) | 1,860 | 208 | — | (76,553 | ) | ||||||||||||
Equity in earnings of subsidiaries, net of tax | 91,339 | (47,141 | ) | — | (44,198 | ) | — | ||||||||||||
Intercompany interest income (expense) | — | 23,156 | (23,156 | ) | — | — | |||||||||||||
Income before (benefit) provision for income taxes | 12,612 | 195,744 | (54,512 | ) | (44,198 | ) | 109,646 | ||||||||||||
(Benefit) provision for income taxes | (31,490 | ) | 104,405 | (7,371 | ) | — | 65,544 | ||||||||||||
Net income (loss) | 44,102 | 91,339 | (47,141 | ) | (44,198 | ) | 44,102 | ||||||||||||
Other comprehensive loss | (144,050 | ) | (144,050 | ) | (93,983 | ) | 238,033 | (144,050 | ) | ||||||||||
Comprehensive loss | $ | (99,948 | ) | $ | (52,711 | ) | $ | (141,124 | ) | $ | 193,835 | $ | (99,948 | ) | |||||
95
CLEAN HARBORS, INC. AND SUBSIDIARIES
NOTES TO CONSOLIDATED FINANCIAL STATEMENTS (Continued)
(18) GUARANTOR AND NON-GUARANTOR SUBSIDIARIES (Continued)
Following is the consolidating statement of (loss) income for the year ended December 31, 2014 (in thousands):
Clean Harbors, Inc. | U.S. Guarantor Subsidiaries | Foreign Non-Guarantor Subsidiaries | Consolidating Adjustments | Total | |||||||||||||||
Revenues | |||||||||||||||||||
Service revenues | — | 1,786,695 | 876,085 | (22,984 | ) | 2,639,796 | |||||||||||||
Product revenues | — | 619,802 | 148,671 | (6,633 | ) | 761,840 | |||||||||||||
Total revenues | — | 2,406,497 | 1,024,756 | (29,617 | ) | 3,401,636 | |||||||||||||
Cost of revenues (exclusive of items shown separately below) | |||||||||||||||||||
Service cost of revenues | — | 1,172,181 | 641,180 | (22,984 | ) | 1,790,377 | |||||||||||||
Product cost of revenues | — | 538,671 | 119,381 | (6,633 | ) | 651,419 | |||||||||||||
Total cost of revenues | — | 1,710,852 | 760,561 | (29,617 | ) | 2,441,796 | |||||||||||||
Selling, general and administrative expenses | 114 | 321,069 | 116,738 | — | 437,921 | ||||||||||||||
Accretion of environmental liabilities | — | 9,240 | 1,372 | — | 10,612 | ||||||||||||||
Depreciation and amortization | — | 173,447 | 102,636 | — | 276,083 | ||||||||||||||
Goodwill impairment charge | — | 105,466 | 17,948 | — | 123,414 | ||||||||||||||
(Loss) income from operations | (114 | ) | 86,423 | 25,501 | — | 111,810 | |||||||||||||
Other income | — | 3,369 | 1,011 | — | 4,380 | ||||||||||||||
Interest (expense) income, net | (78,570 | ) | 800 | 102 | — | (77,668 | ) | ||||||||||||
Equity in earnings of subsidiaries, net of tax | 18,882 | (9,031 | ) | — | (9,851 | ) | — | ||||||||||||
Intercompany dividend income | — | — | 6,238 | (6,238 | ) | — | |||||||||||||
Intercompany interest income (expense) | — | 28,596 | (28,596 | ) | — | — | |||||||||||||
Income before (benefit) provision for income taxes | (59,802 | ) | 110,157 | 4,256 | (16,089 | ) | 38,522 | ||||||||||||
(Benefit) provision for income taxes | (31,474 | ) | 91,275 | 7,049 | — | 66,850 | |||||||||||||
Net (loss) income | (28,328 | ) | 18,882 | (2,793 | ) | (16,089 | ) | (28,328 | ) | ||||||||||
Other comprehensive loss | (91,286 | ) | (91,286 | ) | (37,157 | ) | 128,443 | (91,286 | ) | ||||||||||
Comprehensive loss | $ | (119,614 | ) | $ | (72,404 | ) | $ | (39,950 | ) | $ | 112,354 | $ | (119,614 | ) | |||||
96
CLEAN HARBORS, INC. AND SUBSIDIARIES
NOTES TO CONSOLIDATED FINANCIAL STATEMENTS (Continued)
(18) GUARANTOR AND NON-GUARANTOR SUBSIDIARIES (Continued)
Following is the consolidating statement of income for the year ended December 31, 2013 (in thousands):
Clean Harbors, Inc. | U.S. Guarantor Subsidiaries | Foreign Non-Guarantor Subsidiaries | Consolidating Adjustments | Total | |||||||||||||||
Revenues | |||||||||||||||||||
Service revenues | — | 1,757,663 | 984,122 | (12,580 | ) | 2,729,205 | |||||||||||||
Product revenues | — | 611,548 | 172,500 | (3,597 | ) | 780,451 | |||||||||||||
Total revenues | — | 2,369,211 | 1,156,622 | (16,177 | ) | 3,509,656 | |||||||||||||
Cost of revenues (exclusive of items shown separately below) | |||||||||||||||||||
Service cost of revenues | — | 1,190,419 | 696,609 | (12,580 | ) | 1,874,448 | |||||||||||||
Product cost of revenues | — | 524,318 | 147,464 | (3,597 | ) | 668,185 | |||||||||||||
Total cost of revenues | — | 1,714,737 | 844,073 | (16,177 | ) | 2,542,633 | |||||||||||||
Selling, general and administrative expenses | 109 | 353,215 | 117,153 | — | 470,477 | ||||||||||||||
Accretion of environmental liabilities | — | 9,935 | 1,606 | — | 11,541 | ||||||||||||||
Depreciation and amortization | — | 170,041 | 94,408 | — | 264,449 | ||||||||||||||
(Loss) income from operations | (109 | ) | 121,283 | 99,382 | — | 220,556 | |||||||||||||
Other income | — | 1,655 | 50 | — | 1,705 | ||||||||||||||
Loss on early extinguishment of debt | — | — | — | — | — | ||||||||||||||
Interest (expense) income, net | (79,017 | ) | 236 | 405 | — | (78,376 | ) | ||||||||||||
Equity in earnings of subsidiaries, net of tax | 143,042 | 42,741 | — | (185,783 | ) | — | |||||||||||||
Intercompany dividend income (expense) | — | — | 13,292 | (13,292 | ) | — | |||||||||||||
Intercompany interest income (expense) | — | 41,695 | (41,695 | ) | — | — | |||||||||||||
Income before (benefit) provision for income taxes | 63,916 | 207,610 | 71,434 | (199,075 | ) | 143,885 | |||||||||||||
(Benefit) provision for income taxes | (31,650 | ) | 64,568 | 15,401 | — | 48,319 | |||||||||||||
Net income | 95,566 | 143,042 | 56,033 | (199,075 | ) | 95,566 | |||||||||||||
Other comprehensive (loss) income | (69,188 | ) | (69,188 | ) | 39,519 | 29,669 | (69,188 | ) | |||||||||||
Comprehensive income | $ | 26,378 | $ | 73,854 | $ | 95,552 | $ | (169,406 | ) | $ | 26,378 | ||||||||
97
CLEAN HARBORS, INC. AND SUBSIDIARIES
NOTES TO CONSOLIDATED FINANCIAL STATEMENTS (Continued)
(18) GUARANTOR AND NON-GUARANTOR SUBSIDIARIES (Continued)
Following is the condensed consolidating statement of cash flows for the year ended December 31, 2015 (in thousands):
Clean Harbors, Inc. | U.S. Guarantor Subsidiaries | Foreign Non-Guarantor Subsidiaries | Consolidating Adjustments | Total | ||||||||||||||
Net cash from operating activities | $ | 9,543 | $ | 314,585 | $ | 72,255 | — | $ | 396,383 | |||||||||
Cash flows from investing activities: | ||||||||||||||||||
Additions to property, plant and equipment | — | (220,789 | ) | (36,407 | ) | — | (257,196 | ) | ||||||||||
Proceeds from sales of fixed assets | — | 1,447 | 4,748 | — | 6,195 | |||||||||||||
Acquisitions, net of cash acquired | — | (94,345 | ) | — | — | (94,345 | ) | |||||||||||
Additions to intangible assets including costs to obtain or renew permits | — | — | (5,296 | ) | — | (5,296 | ) | |||||||||||
Intercompany | — | (75,506 | ) | — | 75,506 | — | ||||||||||||
Intercompany debt | — | 14,272 | — | (14,272 | ) | — | ||||||||||||
Net cash used in investing activities | — | (374,921 | ) | (36,955 | ) | 61,234 | (350,642 | ) | ||||||||||
Cash flows from (used in) financing activities: | ||||||||||||||||||
Change in uncashed checks | — | (10,129 | ) | (4,501 | ) | — | (14,630 | ) | ||||||||||
Proceeds from exercise of stock options | 397 | — | — | — | 397 | |||||||||||||
Remittance of shares, net | (2,159 | ) | — | — | — | (2,159 | ) | |||||||||||
Excess tax benefit of stock-based compensation | 71 | — | — | — | 71 | |||||||||||||
Repurchases of common stock | (73,347 | ) | — | — | — | (73,347 | ) | |||||||||||
Payments on capital leases | — | (203 | ) | (308 | ) | — | (511 | ) | ||||||||||
Intercompany | 75,506 | — | — | (75,506 | ) | — | ||||||||||||
Intercompany debt | — | — | (14,272 | ) | 14,272 | — | ||||||||||||
Net cash from (used in) financing activities | 468 | (10,332 | ) | (19,081 | ) | (61,234 | ) | (90,179 | ) | |||||||||
Effect of exchange rate change on cash | — | — | (17,733 | ) | — | (17,733 | ) | |||||||||||
Increase (decrease) in cash and cash equivalents | 10,011 | (70,668 | ) | (1,514 | ) | — | (62,171 | ) | ||||||||||
Cash and cash equivalents, beginning of year | 1,006 | 154,147 | 91,726 | — | 246,879 | |||||||||||||
Cash and cash equivalents, end of year | $ | 11,017 | $ | 83,479 | $ | 90,212 | — | $ | 184,708 | |||||||||
98
CLEAN HARBORS, INC. AND SUBSIDIARIES
NOTES TO CONSOLIDATED FINANCIAL STATEMENTS (Continued)
(18) GUARANTOR AND NON-GUARANTOR SUBSIDIARIES (Continued)
Following is the condensed consolidating statement of cash flows for the year ended December 31, 2014 (in thousands):
Clean Harbors, Inc. | U.S. Guarantor Subsidiaries | Foreign Non-Guarantor Subsidiaries | Consolidating Adjustments | Total | |||||||||||||||
Net cash from operating activities | $ | (5,242 | ) | $ | 70,761 | $ | 250,433 | (18,586 | ) | $ | 297,366 | ||||||||
Cash flows from investing activities: | |||||||||||||||||||
Additions to property, plant and equipment | — | (172,525 | ) | (85,088 | ) | — | (257,613 | ) | |||||||||||
Proceeds from sales of fixed assets | — | 3,956 | 4,208 | — | 8,164 | ||||||||||||||
Acquisitions, net of cash acquired | — | (6,550 | ) | (9,637 | ) | — | (16,187 | ) | |||||||||||
Additions to intangible assets, including costs to obtain or renew permits | — | (623 | ) | (5,896 | ) | — | (6,519 | ) | |||||||||||
Intercompany | — | (112,134 | ) | — | 112,134 | — | |||||||||||||
Intercompany debt | — | 143,467 | — | (143,467 | ) | — | |||||||||||||
Proceeds from sale of long-term investments | — | — | 13,861 | — | 13,861 | ||||||||||||||
Net cash used in investing activities | — | (144,409 | ) | (82,552 | ) | (31,333 | ) | (258,294 | ) | ||||||||||
Cash flows from (used in) financing activities: | |||||||||||||||||||
Change in uncashed checks | — | 11,046 | 4,023 | — | 15,069 | ||||||||||||||
Remittance of shares, net | (2,793 | ) | — | — | — | (2,793 | ) | ||||||||||||
Repurchases of common stock | (104,341 | ) | — | — | — | (104,341 | ) | ||||||||||||
Proceeds from employee stock purchase plan | 4,364 | — | — | — | 4,364 | ||||||||||||||
Payments on capital leases | — | (170 | ) | (1,952 | ) | — | (2,122 | ) | |||||||||||
Repayments of long-term obligations | (5,000 | ) | — | — | — | (5,000 | ) | ||||||||||||
Excess tax benefit of stock-based compensation | 878 | — | — | — | 878 | ||||||||||||||
Dividends paid | — | (18,586 | ) | — | 18,586 | — | |||||||||||||
Intercompany | 112,134 | — | — | (112,134 | ) | — | |||||||||||||
Intercompany debt | — | — | (143,467 | ) | 143,467 | — | |||||||||||||
Net cash from (used in) financing activities | 5,242 | (7,710 | ) | (141,396 | ) | 49,919 | (93,945 | ) | |||||||||||
Effect of exchange rate change on cash | — | — | (8,321 | ) | — | (8,321 | ) | ||||||||||||
(Decrease) increase in cash and cash equivalents | — | (81,358 | ) | 18,164 | — | (63,194 | ) | ||||||||||||
Cash and cash equivalents, beginning of year | 1,006 | 235,505 | 73,562 | — | 310,073 | ||||||||||||||
Cash and cash equivalents, end of year | $ | 1,006 | $ | 154,147 | $ | 91,726 | $ | — | $ | 246,879 | |||||||||
99
CLEAN HARBORS, INC. AND SUBSIDIARIES
NOTES TO CONSOLIDATED FINANCIAL STATEMENTS (Continued)
(18) GUARANTOR AND NON-GUARANTOR SUBSIDIARIES (Continued)
Following is the condensed consolidating statement of cash flows for the year ended December 31, 2013 (in thousands):
Clean Harbors, Inc. | U.S. Guarantor Subsidiaries | Foreign Non-Guarantor Subsidiaries | Consolidating Adjustments | Total | |||||||||||||||
Net cash from operating activities | $ | (33,932 | ) | $ | 277,445 | $ | 185,686 | (13,360 | ) | $ | 415,839 | ||||||||
Cash flows from investing activities: | |||||||||||||||||||
Additions to property, plant and equipment | — | (145,075 | ) | (135,132 | ) | — | (280,207 | ) | |||||||||||
Proceeds from sales of fixed assets and assets held for sale | — | 1,078 | 3,621 | — | 4,699 | ||||||||||||||
Acquisitions, net of cash acquired | (6,025 | ) | (57,239 | ) | — | — | (63,264 | ) | |||||||||||
Additions to intangible assets including costs to obtain or renew permits | — | (5,247 | ) | (1,493 | ) | — | (6,740 | ) | |||||||||||
Intercompany debt | — | 27,525 | — | (27,525 | ) | — | |||||||||||||
Net cash used in investing activities | (6,025 | ) | (178,958 | ) | (133,004 | ) | (27,525 | ) | (345,512 | ) | |||||||||
Cash flows from (used in) financing activities: | |||||||||||||||||||
Change in uncashed checks | — | 9,922 | 2,346 | — | 12,268 | ||||||||||||||
Proceeds from employee stock purchase plan | 7,425 | — | — | — | 7,425 | ||||||||||||||
Proceeds from exercise of stock options | 400 | — | — | — | 400 | ||||||||||||||
Remittance of shares, net | (731 | ) | — | — | — | (731 | ) | ||||||||||||
Excess tax benefit of stock-based compensation | 1,409 | — | — | — | 1,409 | ||||||||||||||
Deferred financing costs paid | (2,504 | ) | — | — | — | (2,504 | ) | ||||||||||||
Payments of capital leases | — | (227 | ) | (4,664 | ) | — | (4,891 | ) | |||||||||||
Issuance costs related to issuance of common stock | (250 | ) | — | — | — | (250 | ) | ||||||||||||
Dividends paid | — | (13,360 | ) | — | 13,360 | — | |||||||||||||
Intercompany debt | — | — | (27,525 | ) | 27,525 | — | |||||||||||||
Net cash from (used in) financing activities | 5,749 | (3,665 | ) | (29,843 | ) | 40,885 | 13,126 | ||||||||||||
Effect of exchange rate change on cash | — | — | (3,216 | ) | — | (3,216 | ) | ||||||||||||
(Decrease) increase in cash and cash equivalents | (34,208 | ) | 94,822 | 19,623 | — | 80,237 | |||||||||||||
Cash and cash equivalents, beginning of year | 35,214 | 140,683 | 53,939 | — | 229,836 | ||||||||||||||
Cash and cash equivalents, end of year | $ | 1,006 | $ | 235,505 | $ | 73,562 | $ | — | $ | 310,073 | |||||||||
100
CLEAN HARBORS, INC. AND SUBSIDIARIES
NOTES TO CONSOLIDATED FINANCIAL STATEMENTS (Continued)
(19) QUARTERLY DATA (UNAUDITED)
First Quarter | Second Quarter | Third Quarter | Fourth Quarter | ||||||||||||
(in thousands except per share amounts) | |||||||||||||||
2015 | |||||||||||||||
Revenues | $ | 732,499 | $ | 936,228 | $ | 893,366 | $ | 713,044 | |||||||
Cost of revenues (1) | 546,507 | 652,688 | 634,646 | 522,965 | |||||||||||
Income from operations (4) | 7,302 | 60,758 | 93,970 | 25,549 | |||||||||||
Other income (expense) | 409 | (660 | ) | (139 | ) | (990 | ) | ||||||||
Net (loss) income | (7,089 | ) | 10,395 | 40,228 | 568 | ||||||||||
Basic (loss) earnings per share (2) | (0.12 | ) | 0.18 | 0.69 | 0.01 | ||||||||||
Diluted (loss) earnings per share (2) | (0.12 | ) | 0.18 | 0.69 | 0.01 | ||||||||||
First Quarter | Second Quarter | Third Quarter | Fourth Quarter(3) | ||||||||||||
(in thousands except per share amounts) | |||||||||||||||
2014 | |||||||||||||||
Revenues | $ | 846,667 | $ | 858,480 | $ | 851,465 | $ | 845,024 | |||||||
Cost of revenues (1) | 625,719 | 606,950 | 598,407 | 610,720 | |||||||||||
Income (loss) from operations (4) | 29,906 | 67,115 | (42,748 | ) | 57,537 | ||||||||||
Other income (expense) | 4,178 | (655 | ) | 613 | 244 | ||||||||||
Net income (loss) | 8,960 | 28,672 | (93,337 | ) | 27,377 | ||||||||||
Basic earnings (loss) per share (2) | 0.15 | 0.47 | (1.55 | ) | 0.46 | ||||||||||
Diluted earnings (loss) per share (2) | 0.15 | 0.47 | (1.55 | ) | 0.46 | ||||||||||
______________________________________
(1) | Items shown separately on the statements of income consist of (i) accretion of environmental liabilities and (ii) depreciation and amortization. |
(2) | (Loss) earnings per share are computed independently for each of the quarters presented. Accordingly, the quarterly basic and diluted (loss) earnings per share may not equal the total computed for the year. |
(3) | In the fourth quarter of 2014 an adjustment was recorded to correct income tax expense that was recorded in the third quarter of 2014 resulting in a benefit of approximately $5.4 million in the fourth quarter. |
(4) | The second quarter of 2015 results include a $32.0 million goodwill impairment charge in our Oil and Gas Field Services reporting unit and the third quarter of 2014 results include a $123.4 million goodwill impairment charge in our Kleen Performance Products reporting unit. |
(20) SUBSEQUENT EVENTS
On February 3, 2016, the Company purchased a re-refinery facility located in Nevada from Vertex Energy, Inc. for a purchase price of $35.0 million in cash, subject to customary post-closing adjustments. The acquired re-refinery facility further expands the Company's re-refinery network within its Kleen Performance Products segment.
101
CLEAN HARBORS, INC. AND SUBSIDIARIES
SCHEDULE II
VALUATION AND QUALIFYING ACCOUNTS
For the Three Years Ended December 31, 2015
(in thousands)
Allowance for Doubtful Accounts | Balance Beginning of Period | Additions Charged to Operating Expense | Deductions from Reserves(a) | Balance End of Period | |||||||||||
2013 | $ | 1,246 | $ | 7,933 | $ | 1,825 | $ | 7,354 | |||||||
2014 | $ | 7,354 | $ | 8,917 | $ | 2,795 | $ | 13,476 | |||||||
2015 | $ | 13,476 | $ | 4,793 | $ | 3,075 | $ | 15,194 | |||||||
________________________________________
(a) | Amounts deemed uncollectible, net of recoveries. |
Revenue Allowance(b) | Balance Beginning of Period | Additions Charged to Revenue | Deductions from Reserves | Balance End of Period | |||||||||||
2013 | $ | 9,879 | $ | 16,401 | $ | 15,528 | $ | 10,752 | |||||||
2014 | $ | 10,752 | $ | 20,237 | $ | 18,804 | $ | 12,185 | |||||||
2015 | $ | 12,185 | $ | 28,312 | $ | 24,265 | $ | 16,232 | |||||||
________________________________________
(b) | Due to the nature of the Company's business and the invoices that result from the services provided, customers may withhold payments and attempt to renegotiate amounts invoiced. In addition, for some of the services provided, the Company's invoices are based on quotes that can either generate credits or debits when the actual revenue amount is known. Based on industry knowledge and historical trends, the Company records a revenue allowance accordingly. This practice causes the volume of activity flowing through the revenue allowance during the year to be higher than the balance at the end of the year. Increases in overall sales volumes and the expansion of the customer base in recent years have also increased the volume of additions and deductions to the allowance during the year, as well as increased the amount of the allowance at the end of the year. The revenue allowance is intended to cover the net amount of revenue adjustments that may need to be credited to customers' accounts in future periods. Management determines the appropriate total revenue allowance by evaluating the following factors on a customer-by-customer basis as well as on a consolidated level: trends in adjustments to previously billed amounts, existing economic conditions and other information as deemed applicable. Revenue allowance estimates can differ materially from the actual adjustments, but historically the revenue allowance has been sufficient to cover the net amount of the reserve adjustments issued in subsequent reporting periods. |
Valuation Allowance on Deferred Tax Assets | Balance Beginning of Period | Additions (Deductions) Charged to (from) Income Tax Expense | Other Changes to Reserves | Balance End of Period | |||||||||||
2013 | $ | 26,325 | $ | (1,545 | ) | $ | 4,946 | $ | 29,726 | ||||||
2014 | $ | 29,726 | $ | (1,812 | ) | $ | 1,147 | $ | 29,061 | ||||||
2015 | $ | 29,061 | $ | 2,274 | $ | (419 | ) | $ | 30,916 | ||||||
102
ITEM 9. CHANGES IN AND DISAGREEMENTS WITH ACCOUNTANTS ON ACCOUNTING AND FINANCIAL DISCLOSURE
None.
ITEM 9A. CONTROLS AND PROCEDURES
Evaluation of Disclosure Controls and Procedures
Based on an evaluation under the supervision and with the participation of our Chief Executive Officer and Chief Financial Officer, as of the end of the period covered by this Annual Report on Form 10-K, our Chief Executive Officer and Chief Financial Officer have concluded that our disclosure controls and procedures (as defined under Rule 13a-15(e) and 15d-15(e) under the Securities Exchange Act of 1934, as amended (the “Exchange Act”)) were effective as of December 31, 2015 to ensure that information required to be disclosed by us in reports that we file or submit under the Exchange Act is recorded, processed, summarized and reported within the time periods specified in Securities and Exchange Commission rules and forms and is accumulated and communicated to our management, including our Chief Executive Officer and Chief Financial Officer, as appropriate to allow timely decisions regarding required disclosure.
Management's Annual Report on Internal Control Over Financial Reporting
The Company's management is responsible for establishing and maintaining adequate internal control over financial reporting, as that term is defined in Exchange Act Rule 13a-15(f). Under the supervision and with the participation of the Company's management, including the Chief Executive Officer and Chief Financial Officer, the Company conducted an evaluation of its internal control over financial reporting based on the framework in Internal Control—Integrated Framework (2013) issued by the Committee of Sponsoring Organizations of the Treadway Commission.
The Company's management evaluated the effectiveness of Clean Harbors internal control over financial reporting as of December 31, 2015. Based on their evaluation under the framework in Internal Control—Integrated Framework (2013), the Company's management concluded that the Company maintained effective internal control over financial reporting as of December 31, 2015 based on the criteria in the Internal Control—Integrated Framework (2013).
Deloitte & Touche LLP, the independent registered public accounting firm that audited the Company's consolidated financial statements, has issued an attestation report on the Company's internal control over financial reporting as of December 31, 2015, which is included below in this Item 9A of this annual report on Form 10-K.
Changes in Internal Control over Financial Reporting
There were no changes in the Company's internal control over financial reporting identified in connection with the evaluation required by paragraph (d) of Exchange Act Rules 13a-15 or 15d-15 that was conducted during the year ended December 31, 2015 that have materially affected, or are reasonably likely to materially affect, the Company’s internal control over financial reporting.
Limitations on the Effectiveness of Controls
The Company's management, including the Chief Executive Officer and Chief Financial Officer, does not expect that the Company's disclosure controls and procedures or the Company's internal control over financial reporting will prevent all errors and all fraud.
A company's internal control over financial reporting is a process designed to provide reasonable assurance regarding the reliability of financial reporting and the preparation of financial statements for external purposes in accordance with generally accepted accounting principles. A company's internal control over financial reporting includes those policies and procedures that (i) pertain to the maintenance of records that, in reasonable detail, accurately and fairly reflect the transactions and dispositions of the assets of the company; (ii) provide reasonable assurance that transactions are recorded as necessary to permit preparation of financial statements in accordance with generally accepted accounting principles, and that receipts and expenditures of the company are being made only in accordance with authorizations of management and directors of the company; and (iii) provide reasonable assurance regarding prevention or timely detection of unauthorized acquisition, use, or disposition of the company's assets that could have a material effect on the financial statements.
Because of its inherent limitations, internal control over financial reporting may not prevent or detect misstatements. Also, projections of any evaluation of effectiveness to future periods are subject to the risk that controls may become inadequate because of changes in conditions, or that the degree of compliance with the policies or procedures may deteriorate.
Further, the design of disclosure controls and procedures and internal control over financial reporting must reflect the fact that there are resource constraints, and the benefits of controls must be considered relative to their costs. Because of the inherent limitations of controls and procedures and internal control over financial reporting, no evaluation of controls can provide absolute assurance that all control issues and instances of fraud, if any, within the Company have been detected.
103
REPORT OF INDEPENDENT REGISTERED PUBLIC ACCOUNTING FIRM
To the Board of Directors and Stockholders
of Clean Harbors, Inc.
Norwell, Massachusetts
We have audited the internal control over financial reporting of Clean Harbors, Inc. and subsidiaries (the "Company") as of December 31, 2015, based on criteria established in Internal Control—Integrated Framework (2013) issued by the Committee of Sponsoring Organizations of the Treadway Commission. The Company's management is responsible for maintaining effective internal control over financial reporting and for its assessment of the effectiveness of internal control over financial reporting, included in the accompanying Management's Annual Report on Internal Control over Financial Reporting. Our responsibility is to express an opinion on the Company's internal control over financial reporting based on our audit.
We conducted our audit in accordance with the standards of the Public Company Accounting Oversight Board (United States). Those standards require that we plan and perform the audit to obtain reasonable assurance about whether effective internal control over financial reporting was maintained in all material respects. Our audit included obtaining an understanding of internal control over financial reporting, assessing the risk that a material weakness exists, testing and evaluating the design and operating effectiveness of internal control based on the assessed risk, and performing such other procedures as we considered necessary in the circumstances. We believe that our audit provides a reasonable basis for our opinion.
A company's internal control over financial reporting is a process designed by, or under the supervision of, the company's principal executive and principal financial officers, or persons performing similar functions, and effected by the company's board of directors, management, and other personnel to provide reasonable assurance regarding the reliability of financial reporting and the preparation of financial statements for external purposes in accordance with generally accepted accounting principles. A company's internal control over financial reporting includes those policies and procedures that (1) pertain to the maintenance of records that, in reasonable detail, accurately and fairly reflect the transactions and dispositions of the assets of the company; (2) provide reasonable assurance that transactions are recorded as necessary to permit preparation of financial statements in accordance with generally accepted accounting principles, and that receipts and expenditures of the company are being made only in accordance with authorizations of management and directors of the company; and (3) provide reasonable assurance regarding prevention or timely detection of unauthorized acquisition, use, or disposition of the company's assets that could have a material effect on the financial statements.
Because of the inherent limitations of internal control over financial reporting, including the possibility of collusion or improper management override of controls, material misstatements due to error or fraud may not be prevented or detected on a timely basis. Also, projections of any evaluation of the effectiveness of the internal control over financial reporting to future periods are subject to the risk that the controls may become inadequate because of changes in conditions, or that the degree of compliance with the policies or procedures may deteriorate.
In our opinion, the Company maintained, in all material respects, effective internal control over financial reporting as of December 31, 2015, based on the criteria established in Internal Control—Integrated Framework (2013) issued by the Committee of Sponsoring Organizations of the Treadway Commission.
We have also audited, in accordance with the standards of the Public Company Accounting Oversight Board (United States), the consolidated financial statements and financial statement schedule as of and for the year ended December 31, 2015 of the Company and our report dated February 25, 2016 expressed an unqualified opinion on those financial statements and financial statement schedule.
/s/ Deloitte & Touche LLP
Boston, Massachusetts
February 25, 2016
104
ITEM 9B. OTHER INFORMATION
Not applicable.
PART III
Except for the information set forth below under Item 12 with respect to securities authorized for issuance under the registrant's equity compensation plans, the information called for by Item 10 (Directors, Executive Officers and Corporate Governance), Item 11 (Executive Compensation), Item 12 (Security Ownership of Certain Beneficial Owners and Management and Related Stockholder Matters), Item 13 (Certain Relationships and Related Transactions, and Director Independence), and Item 14 (Principal Accountant Fees and Services) is incorporated herein by reference to the registrant's definitive proxy statement for its 2016 annual meeting of shareholders, which definitive proxy statement will be filed with the Securities and Exchange Commission by April 30, 2016.
For the purpose of calculating the aggregate market value of the voting stock of the registrant held by non-affiliates as shown on the cover page of this report, it has been assumed that the directors and executive officers of the registrant, as will be set forth in the Company's definitive proxy statement for its 2016 annual meeting of shareholders, are the only affiliates of the registrant. However, this should not be deemed to constitute an admission that all of such persons are, in fact, affiliates or that there are not other persons who may be deemed affiliates of the registrant.
ITEM 12. SECURITY OWNERSHIP OF CERTAIN BENEFICIAL OWNERS AND MANAGEMENT AND RELATED STOCKHOLDER MATTERS
In addition to the information about the security ownership of certain beneficial owners and management and related stockholder matters which is incorporated herein by reference to the Company's definitive proxy statement for the Company's 2016 annual meeting of shareholders, the following table includes information as of December 31, 2015 regarding shares of common stock authorized for issuance under the Company's equity compensation plans. The Company's shareholders previously approved each of the plans.
Plan Category | Number of securities to be issued upon exercise of outstanding options and rights(a) | Weighted average exercise price of outstanding options and rights(b) | Number of securities remaining available for future issuance under equity compensation plans (excluding securities reflected in column (a))(c) | ||||||
Equity compensation plans approved by security holders(1) | 24,000 | $ | 28.05 | 4,986,477 | |||||
___________________________________________
(1) | Includes: (i) the Company's 2000 Stock Incentive Plan which expired in 2010, but under which there were on December 31, 2015 outstanding options for an aggregate of 24,000 shares; and (ii) the Company's 2010 Stock Incentive Plan (the "2010 Plan") under which there were on December 31, 2015 no outstanding options but 4,986,477 shares were available for grant of future options, stock appreciation rights, restricted stock awards, restricted stock units and certain other forms of equity incentives. See Note 15, "Stock-Based Compensation and Employee Benefit Plans," to the Company's consolidated financial statements included in Item 8, "Financial Statements and Supplementary Data," in this report. |
105
PART IV
ITEM 15. EXHIBITS AND FINANCIAL STATEMENT SCHEDULES
(a) Documents Filed as a Part of this Report
Page | |||
1. | Financial Statements: | ||
2. | Financial Statement Schedule: | ||
All other schedules are omitted because they are not applicable, not required, or because the required information is included in the financial statements or notes thereto.
3. | Exhibits: | ||
The list of exhibits filed as part of this annual report on Form 10-K is set forth on the Exhibit Index immediately following the signature page to this report, and such Exhibit Index is incorporated herein by reference.
Exhibits to this annual report on Form 10-K have been included only with the copies of the Form 10-K filed with the Securities and Exchange Commission. Upon request to the Company and payment of a reasonable fee, copies of the individual exhibits will be furnished. The Company undertakes to furnish to the Commission upon request copies of instruments (in addition to the exhibits listed below) relating to the Company's acquisitions and long-term debt.
106
SIGNATURES
Pursuant to the requirements of Section 13 or 15(d) of the Securities Exchange Act of 1934, the registrant has duly caused this annual report to be signed on its behalf by the undersigned, thereunto duly authorized on February 25, 2016.
CLEAN HARBORS, INC. | |||
By: | /s/ ALAN S. MCKIM | ||
Alan S. McKim Chief Executive Officer | |||
Pursuant to the requirements of the Securities Exchange Act of 1934, this annual report has been signed below by the following persons on behalf of the registrant and in the capacities and on the dates indicated.
Signature | Title | Date | ||
/s/ ALAN S. MCKIM | Chairman of the Board of Directors and Chief Executive Officer | February 25, 2016 | ||
Alan S. McKim | ||||
/s/ MICHAEL L. BATTLES | Executive Vice President and Chief Financial Officer | February 25, 2016 | ||
Michael L. Battles | ||||
/s/ ERIC J. DUGAS | Vice President, Corporate Controller and Chief Accounting Officer | February 25, 2016 | ||
Eric J. Dugas | ||||
* | Vice Chairman of the Board of Directors and President | February 25, 2016 | ||
James M. Rutledge | ||||
* | Director | February 25, 2016 | ||
Gene Banucci | ||||
* | Director | February 25, 2016 | ||
John P. DeVillars | ||||
* | Director | February 25, 2016 | ||
Edward G. Galante | ||||
* | Director | February 25, 2016 | ||
Rod Marlin | ||||
* | Director | February 25, 2016 | ||
Daniel J. McCarthy | ||||
* | Director | February 25, 2016 | ||
John T. Preston | ||||
* | Director | February 25, 2016 | ||
Andrea Robertson | ||||
* | Director | February 25, 2016 | ||
Thomas J. Shields | ||||
* | Director | February 25, 2016 | ||
John R. Welch | ||||
*By: | /s/ ALAN S. MCKIM | ||
Alan S. McKim Attorney-in-Fact | |||
107
EXHIBIT INDEX
Item No. | Description | Location | ||||
2.1 | Acquisition Agreement by and between Safety-Kleen Services, Inc., as Seller, and Clean Harbors, Inc., as Purchaser, dated as of February 22, 2002 | (1 | ) | |||
2.2 | First Amendment to Acquisition Agreement by and between Safety-Kleen Services, Inc., as Seller, and Clean Harbors, Inc., as Purchaser, dated as of March 8, 2002 | (2 | ) | |||
2.3 | Second Amendment to Acquisition Agreement by and between Safety-Kleen Services, Inc. as Seller, and Clean Harbors, Inc. as Purchaser, dated as of April 30, 2002 | (3 | ) | |||
2.4 | Third Amendment to Acquisition Agreement by and between Safety-Kleen Services, Inc., as Seller, and Clean Harbors, Inc., as Purchaser, dated as of September 6, 2002 | (4 | ) | |||
2.5 | Fourth Amendment to Acquisition Agreement by and between Safety-Kleen Services, Inc., as Seller and Clean Harbors, Inc., as Purchaser, dated as of July 14, 2003 | (5 | ) | |||
2.6 | Agreement and Plan of Merger dated as of October 26, 2012 among Safety-Kleen, Inc., Clean Harbors, Inc., and CH Merger Sub, Inc. | (6 | ) | |||
3.1A | Restated Articles of Organization of Clean Harbors, Inc. | (7 | ) | |||
3.1B | Articles of Amendment [as filed on May 9, 2011] to Restated Articles of Organization of Clean Harbors | (8 | ) | |||
3.4D | Amended and Restated By-Laws of Clean Harbors, Inc. | (9 | ) | |||
4.33E-1 | Fourth Amended and Restated Credit Agreement dated as of January 17, 2013 among Clean Harbors, Inc., as the U.S. Borrower, Clean Harbors Industrial Services Canada, Inc., as the Canadian Borrower, Bank of America, N.A., as Administrative Agent, and the Lenders party thereto | (10 | ) | |||
4.33F | Guarantee (U.S. Domiciled Loan Parties-U.S. Facility Obligations) dated as of May 31, 2011 executed by the U.S. Domiciled Subsidiaries of Clean Harbors, Inc. named therein in favor of Bank of America, N.A., as Agent for itself and the other U.S. Facility Secured Parties | (11 | ) | |||
4.33G | Guarantee (Canadian Domiciled Loan Parties-Canadian Facility Obligations) dated as of May 31, 2011 executed by the Canadian Domiciled Subsidiaries of Clean Harbors, Inc. named therein in favor of Bank of America, N.A., as Agent for itself and the other Canadian Facility Secured Parties | (11 | ) | |||
4.33H | Guarantee (U.S. Domiciled Loan Parties-Canadian Facility Obligations) dated as of May 31, 2011 executed by Clean Harbors, Inc. and the U.S. Domiciled Subsidiaries of Clean Harbors, Inc. named therein in favor of Bank of America, N.A., as Agent for itself and the other Canadian Facility Secured Parties | (11 | ) | |||
4.33I | Security Agreement (U.S. Domiciled Loan Parties) dated as of January 17, 2013 among Clean Harbors, Inc. , as the U.S. Borrower and a Grantor, the subsidiaries of Clean Harbors, Inc. listed on Annex A thereto or that thereafter become a party thereto as Grantors, and Bank of America, N.A., as Agent | (10 | ) | |||
4.33J | Security Agreement (Canadian Domiciled Loan Parties) dated as of May 31, 2011 among Clean Harbors Industrial Services Canada, Inc., as the Canadian Borrower and a Grantor, the Canadian subsidiaries of Clean Harbors, Inc. listed on Annex A thereto or that thereafter become a party thereto as Grantors, and Bank of America, N.A., as Agent | (11 | ) | |||
4.40 | Indenture dated as of July 30, 2012, among Clean Harbors, Inc., as Issuer, the Guarantors listed on the signature pages thereto, and U.S. Bank National Association, as Trustee | (12 | ) | |||
4.42 | Indenture dated as of December 7, 2012, among Clean Harbors, Inc., as Issuer, the subsidiaries of Clean Harbors, Inc. named therein as Guarantors, and U.S. Bank National Association, as Trustee | (13 | ) | |||
10.43* | Key Employee Retention Plan | (14 | ) | |||
10.43A* | Form of Severance Agreement under Key Employee Retention Plan with Confidentiality and Non-Competition Agreement | (15 | ) | |||
10.45 | Bill of Sale and Assignment dated as of September 10, 2002 by Safety-Kleen Services, Inc. and its Subsidiaries named therein, as Sellers, and Clean Harbors, Inc., as Purchaser, and its Subsidiaries named therein, as Purchasing Subs | (4 | ) | |||
10.46 | Assumption Agreement made as of September 10, 2002 by Clean Harbors, Inc. in favor of Safety-Kleen Services, Inc. and its Subsidiaries named therein | (4 | ) | |||
10.50* | Accepted offer letter, severance agreement, and relocation package and agreement, effective August 1, 2005, between the Company and James M. Rutledge | (16 | ) | |||
108
Item No. | Description | Location | ||||
10.52B* | Clean Harbors, Inc. Management Incentive Plan [as amended and restated on March 5, 2012] | (17 | ) | |||
10.53* | Clean Harbors, Inc. Annual CEO Incentive Bonus Plan | (18 | ) | |||
10.54* | Clean Harbors, Inc. 2010 Stock Incentive Plan [as amended on May 10, 2010] | (19 | ) | |||
10.54A* | Revised form of Restricted Stock Award Agreement [Non-Employee Director] [for use under 2010 Stock Incentive Plan] | (15 | ) | |||
10.54B* | Revised form of Restricted Stock Award Agreement [Employee] [for use under Clean Harbors, Inc. 2010 Stock Incentive Plan] | (15 | ) | |||
10.54C* | Revised form of Performance-Based Restricted Stock Award Agreement [for use under Clean Harbors, Inc. 2010 Stock Incentive Plan] | (15 | ) | |||
10.54D* | Amendment to Section 8 and 10(i) of the Company’s 2010 Stock Incentive Plan | (20 | ) | |||
10.55* | Clean Harbors, Inc. 2014 CEO Annual Incentive Plan | (21 | ) | |||
10.55A* | Amendment to Section 6(m) of Clean Harbors, Inc. 2014 Annual CEO Incentive Plan | (22 | ) | |||
10.56* | Mike Battles accepted offer letter effective as of January 6, 2016 | (23 | ) | |||
21 | Subsidiaries | Filed herewith | ||||
23 | Consent of Independent Registered Public Accounting Firm | Filed herewith | ||||
24 | Power of Attorney | Filed herewith | ||||
31.1 | Rule 13a-14a/15d-14(a) Certification of the CEO Alan S. McKim | Filed herewith | ||||
31.2 | Rule 13a-14a/15d-14(a) Certification of the CFO Michael L. Battles | Filed herewith | ||||
32 | Section 1350 Certifications | Filed herewith | ||||
101 | The following materials from the Company's Annual Report on Form 10-K for the fiscal year ended December 31, 2015, formatted in XBRL (Extensible Business Reporting Language): (i) Consolidated Balance Sheets, (ii) Consolidated Statements of Income, (iii) Consolidated Statements of Comprehensive Income, (iv) Consolidated Statements of Cash Flows, (v) Consolidated Statements of Stockholders' Equity, and (vi) Notes to Consolidated Financial Statements, tagged as blocks of text | (24 | ) | |||
_______________________________________________
(*) | A “management contract or compensatory plan or arrangement” filed as an exhibit to this report pursuant to Item 15(f) of Form 10-K. |
(1) | Incorporated by reference to the similarly numbered exhibit to the Company's Form 8-K Report filed on February 28, 2002. |
(2) | Incorporated by reference to the similarly numbered exhibit to the Company's Form 10-K Annual Report for the Year ended December 31, 2001. |
(3) | Incorporated by reference to the similarly numbered exhibit to the Company's Form 10-Q Quarterly Report for the Quarterly Period ended March 31, 2002. |
(4) | Incorporated by reference to the similarly numbered exhibit to the Company's Form 8-K Report filed on September 25, 2002. |
(5) | Incorporated by reference to the similarly numbered exhibit to the Company's Form 10-Q Quarterly Report for the Quarterly Period ended June 30, 2003. |
(6) | Incorporated by reference to the similarly numbered exhibit to the Company's Form 8-K Report filed on October 31, 2012. |
(7) | Incorporated by reference to the similarly numbered exhibit to the Company's Form 8-K Report filed on May 19, 2005. |
(8) | Incorporated by reference to the similarly numbered exhibit to the Company's Form 8-K Report filed on May 12, 2011. |
(9) | Incorporated by reference to the similarly numbered exhibit to the Company's Form 8-K Report filed on December 22, 2014. |
109
(10) | Incorporated by reference to the similarly numbered exhibit to the Company's Form 8-K Report filed on January 18, 2013. |
(11) | Incorporated by reference to the similarly numbered exhibit to the Company's Form 8-K Report filed on June 3, 2011. |
(12) | Incorporated by reference to the similarly numbered exhibit to the Company's Report on Form 8-K filed on July 30, 2012. |
(13) | Incorporated by reference to the similarly numbered exhibit to the Company's Form 8-K Report filed on December 10, 2012. |
(14) | Incorporated by reference to the similarly numbered exhibit to the Company's Form 10-Q Quarterly Report for the Quarterly Period ended March 31, 1999. |
(15) | Incorporated by reference to the similarly numbered exhibit to the Company's Form 10-K Annual Report for the Year ended December 31, 2010. |
(16) | Incorporated by reference to the similarly numbered exhibit to the Company's Form 8-K Report filed on August 1, 2005. |
(17) | Incorporated by reference to Appendix A to the Company's definitive proxy statement for its 2012 annual meeting of shareholders filed on March 23, 2012. |
(18) | Incorporated by reference to the similarly numbered exhibit to the Company's Form 8-K Report filed on May 14, 2009. |
(19) | Incorporated by reference to the similarly numbered exhibit to the Company's Form 8-K Report filed on May 14, 2010. |
(20) | Incorporated by reference to Appendix B to the Company’s definitive Proxy Statement filed on March 22, 2013. |
(21) | Incorporated by reference by Appendix A to the Company’s definitive Proxy Statement filed on March 22, 2013. |
(22) | Incorporated by reference to Appendix A to the Company's definitive Proxy Statement for its 2014 annual meeting of shareholders filed on April 29, 2014. |
(23) | Incorporated by reference to the similarly numbered exhibit to the Company's Form 8-K Report filed on January 11, 2016. |
(24) | These interactive data files are furnished herewith and deemed not filed or part of a registration statement or prospectus for purposes of Sections 11 or 12 of the Securities Act of 1933, as amended, are deemed not filed for purposes of Section 18 of the Securities Exchange Act of 1934, as amended, and otherwise are not subject to liability under those sections. |
110