UNITED STATES
SECURITIES AND EXCHANGE COMMISSION
Washington, D.C. 20549
FORM 10-K
ý | ANNUAL REPORT PURSUANT TO SECTION 13 OR 15(d) OF THE SECURITIES EXCHANGE ACT OF 1934 |
For the fiscal year ended December 31, 2017
Commission file number 000-20557
THE ANDERSONS, INC.
(Exact name of the registrant as specified in its charter)
OHIO | 34-1562374 | |
(State of incorporation or organization) | (I.R.S. Employer Identification No.) | |
1947 Briarfield Boulevard, Maumee, Ohio | 43537 | |
(Address of principal executive offices) | (Zip Code) | |
Registrant's telephone number, including area code (419) 893-5050
Securities registered pursuant to Section 12(b) of the Act: Common Shares
Securities registered pursuant to Section 12(g) of the Act: None
Indicate by check mark if the registrant is a well-known seasoned issuer, as defined in Rule 405 of the Securities Act. Yes ý No ¨
Indicate by check mark if the registrant is not required to file reports pursuant to Section 13 or 15(d) of the Act. Yes ¨ No ý
Indicate by check mark whether the registrant (1) has filed all reports required to be filed by Section 13 or 15(d) of the Securities Exchange Act of 1934 during the preceding 12 months (or for such shorter period that the registrant was required to file such reports), and (2) has been subject to such filing requirements for the past 90 days. Yes ý No ¨
Indicate by check mark whether the registrant has submitted electronically and posted on its corporate Web site, if any, every Interactive Data File required to be submitted and posted pursuant to Rule 405 of Regulation S-T (232.405 of this chapter) during the preceding 12 months (or for such shorter period that the registrant was required to submit and post such files). Yes ý No ¨
Indicate by check mark if disclosure of delinquent filers pursuant to Item 405 of Regulation S-K is not contained herein, and will not be contained to the best of the registrant's knowledge, in definitive proxy or information statements incorporated by reference in Part III of this Form 10-K or any amendment to this Form 10-K. [ ]
Indicate by check mark whether the registrant is a large accelerated filer, an accelerated filer, a non-accelerated filer, or a smaller reporting company. See definitions of “large accelerated filer,” “accelerated filer” and “smaller reporting company” in Rule 12b-2 of the Exchange Act.
Large accelerated filer | ý | Accelerated Filer | ¨ |
Non-accelerated filer | ¨ | Smaller reporting company | ¨ |
If an emerging growth company, indicate by check mark if the registrant has elected not to use the extended transition period for complying with any new or revised financial accounting standards provided pursuant to Section 13(a) of the Exchange Act. Yes ¨ No ý
Indicate by check mark whether the registrant is a shell company (as defined in Rule 12b-2 of the Exchange Act). Yes ¨ No ý
The aggregate market value of the registrant's voting stock which may be voted by persons other than affiliates of the registrant was $918.1 million as of June 30, 2017, computed by reference to the last sales price for such stock on that date as reported on the Nasdaq Global Select Market.
The registrant had approximately 28.2 million common shares outstanding, no par value, at February 15, 2018.
DOCUMENTS INCORPORATED BY REFERENCE
Portions of the Proxy Statement for the Annual Meeting of Shareholders to be held on May 11, 2018, are incorporated by reference into Part III (Items 10, 11, 12, 13 and 14) of this Annual Report on Form 10-K. The Proxy Statement will be filed with the Commission on or about March 15, 2018.
THE ANDERSONS, INC.
Table of Contents
Page No. | |
PART I. | |
Item 1. Business | |
Item 1A. Risk Factors | |
Item 1B. Unresolved Staff Comments | |
Item 2. Properties | |
Item 3. Legal Proceedings | |
Item 4. Mine Safety | |
PART II. | |
Item 5. Market for the Registrant's Common Equity and Related Stockholder Matters | |
Item 6. Selected Financial Data | |
Item 7. Management's Discussion and Analysis of Financial Condition and Results of Operations | |
Item 7A. Quantitative and Qualitative Disclosures about Market Risk | |
Item 8. Financial Statements and Supplementary Data | |
Item 9. Changes in and Disagreements with Accountants on Accounting and Financial Disclosures | |
Item 9A. Controls and Procedures | |
PART III. | |
Item 10. Directors and Executive Officers of the Registrant | |
Item 11. Executive Compensation | |
Item 12. Security Ownership of Certain Beneficial Owners and Management | |
Item 13. Certain Relationships and Related Transactions | |
Item 14. Principal Accountant Fees and Services | |
PART IV. | |
Item 15. Exhibits, Financial Statement Schedules, and Reports on Form 8-K | |
Item 16. Form 10-K Summary | |
Exhibits | |
Signatures | |
2
Part I.
Item 1. Business
Company Overview
The Andersons, Inc. (the "Company") is a diversified company rooted in agriculture. Founded in Maumee, Ohio in 1947, the Company conducts business across North America in the grain, ethanol, plant nutrient and rail sectors.
Segment Descriptions
The Company's operations are classified into five reportable business segments: Grain, Ethanol, Rail, Plant Nutrient, and Retail. Each of these segments is organized based upon the nature of products and services offered. See Note 13 to the Consolidated Financial Statements in Item 8 for information regarding business segments.
Grain Group
The Grain business primarily operates grain elevators in various states in the U.S. Corn Belt. Income is earned on grain bought and sold or “put thru” the elevator, grain that is purchased and conditioned for resale, and space income. Space income consists of appreciation or depreciation in the basis value of grain held and represents the difference between the cash price of a commodity in one of the Company's facilities and an exchange traded futures price (“basis”); appreciation or depreciation between the future exchange contract months (“spread”); and grain stored for others upon which storage fees are earned. The Grain business also offers a number of unique grain marketing, risk management and corn origination services to its customers and affiliated ethanol facilities for which it collects fees.
The Company has a lease and marketing agreement with Cargill, Incorporated (“Cargill”) for Cargill's Maumee and Toledo, Ohio grain handling and storage facilities. As part of the agreement, Cargill holds marketing rights to grain in the Cargill-owned facilities as well as the adjacent Company-owned facilities in Maumee and Toledo. The lease of the Cargill-owned facilities covers approximately 6%, or 8.7 million bushels, of the Company's total storage space.
Grain prices are not predetermined, so sales are negotiated by the Company's merchandising staff. The principal grains sold by the Company are corn, soybeans and wheat. Approximately 92% of grain sales by the Company in 2017 were purchased by U.S. grain processors and feeders, and approximately 8% were exported. Most of the Company's exported grain sales are made through intermediaries while some grain is shipped directly to foreign countries, mainly Canada. The Company ships grain from its facilities by rail, truck, or boat. Rail shipments are made primarily to grain processors and feeders with some rail shipments made to exporters on the Gulf of Mexico or east coast. Boat shipments are from the Port of Toledo. In addition, grain is transported via truck for direct ship transactions in which producers sell grain to the Company but have it delivered directly to the end user.
The Company's grain operations rely principally on forward purchase contracts with producers, dealers and commercial elevators to ensure an adequate supply of grain to the Company's facilities throughout the year. The Company makes grain purchases at prices referenced to the Chicago Mercantile Exchange (“the CME”).
The Company competes in the sale of grain with other public and private grain brokers, elevator operators and farmer owned cooperative elevators. Some of the Company's competitors are also its customers. Competition is based primarily on price, service and reliability. Because the Company generally buys in smaller lots, its competition for the purchase of grain is generally local or regional in scope, although there are some large national and international companies that maintain regional grain purchase and storage facilities. Significant portions of grain bushels purchased and sold are made using forward contracts.
The grain handling business is seasonal in nature in that the largest portion of the principal grains are harvested and delivered from the farm and commercial elevators in July, October and November although a significant portion of the principal grains are bought, sold and handled throughout the year.
Fixed price purchase and sale commitments as well as grain held in inventory expose the Company to risks related to adverse changes in market prices. Grain prices are typically comprised of two components, futures prices on the CME and local basis adjustments. The Company manages the futures price risk by entering into exchange-traded futures and option contracts with the CME. The contracts are economic hedges of price risk, but are not designated or accounted for as hedging instruments.
3
The CME is a regulated commodity futures exchange that maintains futures markets for the grains merchandised by the Company. Futures prices are determined by worldwide supply and demand.
The Company's grain risk management practices are designed to reduce the risk of changing commodity prices. In that regard, such practices also limit potential gains from further changes in market prices. The Company has policies that provide key controls over its risk management practices. These policies include a description of the objectives of the programs and review of daily position limits by key management outside of the trading function along with other internal controls. The Company monitors current market conditions and may expand or reduce the purchasing program in response to changes in those conditions. In addition, the Company monitors its counterparties on a regular basis for credit worthiness, defaults and non-delivery.
Purchases of grain can be made the day the grain is delivered to a terminal or via a forward contract made prior to actual delivery. Sales of grain generally are made by contract for delivery in a future period. When the Company purchases grain at a fixed price or at a price where a component of the purchase price is fixed via reference to a futures price on the CME, it also enters into an offsetting sale of a futures contract on the CME. Similarly, when the Company sells grain at a fixed price, the sale is offset with the purchase of a futures contract on the CME. At the close of business each day, inventory and open purchase and sale contracts as well as open futures and option positions are marked-to-market. Gains and losses in the value of the Company's ownership positions due to changing market prices are netted with, and generally offset in the statement of operations by, losses and gains in the value of the Company's futures positions.
When a futures contract is entered into, an initial margin deposit must be sent to the CME. The amount of the margin deposit is set by the CME and varies by commodity. If the market price of a futures contract moves in a direction that is adverse to the Company's position, an additional margin deposit, called a maintenance margin, is required by the CME. Subsequent price changes could require additional maintenance margin deposits or result in the return of maintenance margin deposits by the CME. Significant increases in market prices, such as those that occur when grain supplies are affected by unfavorable weather conditions and/or when increases in demand occur, can have an effect on the Company's liquidity and, as a result, require it to maintain appropriate short-term lines of credit. The Company may utilize CME option contracts to limit its exposure to potential required margin deposits in the event of a rapidly rising market.
The Company owns 33% of the equity in Lansing Trade Group LLC (“LTG”). LTG is largely focused on the movement of physical commodities, including grain and ethanol, and is exposed to some of the same risks as the Company's grain and ethanol businesses. LTG also trades in commodities that the Company's grain and ethanol businesses do not trade in, some of which are not exchange traded. This investment provides the Company with further opportunity to diversify and complement its income through activity outside of its traditional product and geographic regions. This investment is accounted for under the equity method. The Company, along with LTG, also established joint ventures and purchased a grain and food-bean handler and agronomy input provider with 12 locations across Ontario, Canada and Minnesota. These investments are accounted for under the equity method. The Company periodically enters into transactions with these joint ventures as disclosed in Note 12 to the Consolidated Financial Statements in Item 8.
Ethanol Group
The Ethanol Group has ownership interests in four limited liability companies (“the ethanol LLCs” or “LLCs”). Each of the LLCs owns an ethanol plant that is operated by the Company's Ethanol Group. The plants are located in Iowa, Indiana, Michigan, and Ohio and have combined nameplate capacity of 385 million gallons of ethanol. The Group purchases and sells ethanol, offers facility operations, risk management, and ethanol and corn oil marketing services to the ethanol plants it invests in and operates.
The Company holds an 85% interest in The Andersons Denison Ethanol LLC ("TADE"), which is a consolidated entity. The Company holds a 55% interest in The Andersons Albion Ethanol LLC (“TAAE”) and a 39% interest in The Andersons Clymers Ethanol LLC (“TACE”). On January 1, 2017, The Andersons Ethanol Investment LLC (“TAEI”) was merged with and into The Andersons Marathon Ethanol LLC (“TAME”). The Company had owned (66)% of TAEI, which, in turn, had owned 50% of TAME. Pursuant to the merger, the Company’s ownership units in TAEI were canceled and converted into ownership units in TAME. As a result, the Company now directly owns 33% of the outstanding ownership units of TAME. All operating ethanol LLC investments, except TADE, are accounted for using the equity method of accounting.
The Company has a management agreement with each of the LLCs. As part of these agreements, the Ethanol Group runs the day-to-day operations of the plants and provides all administrative functions. The Company is compensated for these services based on a fixed cost plus an indexed annual increase determined by a consumer price index. Additionally, the Company has entered into agreements with each of the unconsolidated LLCs under which it has the exclusive right to act as supplier for
4
100% of the corn used by the LLCs in the production of ethanol. For this service, the Company receives a fee for each bushel of corn sold. The Company has entered into marketing agreements with each of the ethanol LLCs. Under the ethanol marketing agreements, the Company purchases most, if not all, of the ethanol produced by the LLCs at the same price it will resell the ethanol to external customers. The Ethanol Group receives a fee for each gallon of ethanol sold to external customers sourced from these LLCs. Under the distillers dried grains ("DDG") and corn oil marketing agreements, the Company markets the DDG and corn oil and receives a fee on units sold.
Plant Nutrient Group
The Plant Nutrient Group is a leading manufacturer, distributor and retailer of agricultural and related plant nutrients, corncob-based products, and pelleted lime and gypsum products in the U.S. Corn Belt and Puerto Rico. The Group provides warehousing, packaging and manufacturing services to basic nutrient producers and other distributors. The Group also manufactures and distributes a variety of industrial products throughout the U.S. and Puerto Rico including nitrogen reagents for air pollution control systems used in coal-fired power plants, and water treatment and dust abatement products.
In its plant nutrient businesses, the Company competes with regional and local cooperatives, wholesalers and retailers, predominantly publicly owned manufacturers and privately owned retailers, wholesalers and importers. Some of these competitors are also suppliers and have considerably larger resources than the Company. Competition in the nutrient business is based largely on depth of product offering, price, location and service. Sales and warehouse shipments of agricultural nutrients are heaviest in the spring and fall.
Wholesale Nutrients - The Wholesale Nutrients business manufactures, stores, and distributes dry and liquid agricultural nutrients, and pelleted lime and gypsum products annually. The major nutrient products sold by the business principally contain nitrogen, phosphate, potassium and sulfur. Product lines include base nutrients which are typically bought and sold as commodities and value added products which support more sustainable farming practices and command higher margins. The distribution and sales channels for both types of nutrients are shared within the Wholesale Nutrients business.
Farm Centers - The Farm Centers offer a variety of essential crop nutrients, crop protection chemicals and seed products in addition to application and agronomic services to commercial and family farmers. Soil and tissue sampling along with global satellite assisted services provide for pinpointing crop or soil deficiencies and prescriptive agronomic advice is provided to farmers.
Cob Products - Corncob-based products are manufactured for a variety of uses including laboratory animal bedding and private-label cat litter, as well as absorbents, blast cleaners, carriers and polishers. The products are distributed throughout the United States and Canada and into Europe and Asia. The principal sources for corncobs are seed corn producers.
Turf Products - Proprietary professional turf care products are produced for the golf course and professional turf care markets, serving both U.S. and international customers. These products are sold both directly and through distributors to golf courses and lawn service applicators. The Company also produces and sells fertilizer and control products to various markets.
Rail Group
The Company's Rail Group leases, repairs, and sells various types of railcars, locomotives and barges. In addition, the Rail Group offers fleet management services to private railcar owners.
The Company has a diversified fleet of car types (boxcars, gondolas, covered and open top hopper cars, tank cars and pressure differential cars), locomotives and barges serving a broad customer base. The Company operates in both the new and used car markets, allowing the Company to diversify its fleet both in terms of car types, industries and age of cars, as well as repairing and refurbishing used cars for specific markets and customers.
A significant portion of the railcars, locomotives and barges managed by the Company are included on the balance sheet as long-lived assets. The others are either in off-balance sheet operating leases (with the Company leasing assets from financial intermediaries and leasing those same assets to the end-users) or non-recourse arrangements (in which the Company is not subject to any lease arrangement related to the assets, but provides management services to the owner of the assets). The Company generally holds purchase options on most assets owned by financial intermediaries. We are under contract to provide maintenance services for many of the Rail Group assets that we own or manage. Refer to the Off-Balance Sheet Transactions section of Management's Discussion and Analysis for a breakdown of our railcar, locomotive and barge positions at December 31, 2017.
5
In the case of the Company's off-balance sheet Rail Group assets, the Company's risk management philosophy is to match-fund the lease commitments where possible. Match-funding (in relation to lease transactions) means matching the terms of the financial intermediary funding arrangement with the lease terms of the customer in which the Company is both lessee and sublessor. If the Company is unable to match-fund, it will attempt to negotiate an early buyout provision within the funding arrangement to match the underlying customer lease. The Company does not attempt to match-fund lease commitments for Rail Group assets that are on its balance sheet.
Competition for marketing and fleet maintenance services is based primarily on price, service ability, and access to both used equipment and third-party financing. Repair facility competition is based primarily on price, quality and location.
Retail Group
The Company's Retail Group included large retail stores operated as “The Andersons,” which were located in the Columbus and Toledo, Ohio markets. The stores focused on providing significant product breadth with offerings in home improvement and other mass merchandise categories as well as specialty foods, wine and indoor and outdoor garden centers.
In January 2017, the Company announced its decision to close all retail operations. As of December 31, 2017, the Retail Group has closed all stores, completed its liquidation efforts, and sold three of the four properties.
Employees
The Andersons offers a broad range of full-time and part-time career opportunities. Each position in the Company is important to its success, and the Company recognizes the worth and dignity of every individual. The Company strives to treat each person with respect and utilize his or her unique talents. At December 31, 2017, the Company had 1,795 full-time and 48 part-time or seasonal employees.
Government Regulation
Grain sold by the Company must conform to official grade standards imposed under a federal system of grain grading and inspection administered by the United States Department of Agriculture (“USDA”).
The production levels, markets and prices of the grains that the Company merchandises are affected by United States government programs, which include acreage control and price support programs of the USDA. In regards to our investments in ethanol production facilities, the U.S. government has mandated a ten percent blend for motor fuel gasoline sold.
The U.S. Food and Drug Administration (“FDA”) has developed bioterrorism prevention regulations for food facilities, which require that the Company registers its grain operations with the FDA, provide prior notice of any imports of food or other agricultural commodities coming into the United States and maintain records to be made available upon request that identifies the immediate previous sources and immediate subsequent recipients of its grain commodities.
The Company, like other companies engaged in similar businesses, is subject to a multitude of federal, state and local environmental protection laws and regulations including, but not limited to, laws and regulations relating to air quality, water quality, pesticides and hazardous materials. The provisions of these various regulations could require modifications of certain of the Company's existing facilities and could restrict the expansion of future facilities or significantly increase the cost of their operations. Compliance with environmental laws and regulations did not materially affect the Company's earnings or competitive position in 2017.
In addition, the Company continues to assess the Dodd-Frank Wall Street Reform and Consumer Protection Act (the “Dodd-Frank Act”) and has concluded that the Company is not a major swap dealer or major swap participant. The Company continues to monitor developments in the law, including the regulation of swaps and derivatives.
Available Information
The Company's Annual Report on Form 10-K, quarterly reports on Form 10-Q, current reports on Form 8-K and amendments to those reports are available on the Company's website soon after filing with the Securities and Exchange Commission. The Company's website address is http://www.andersonsinc.com. The public may read and copy any materials the Company files with the SEC at the SEC's Public Reference Room at 100 F Street, NE, Washington, DC 20549. The public may obtain information on the operation of the Public Reference Room by calling the SEC at 1-800-SEC-0330. These reports are also available at the SEC's website: http://www.sec.gov.
6
Item 1A. Risk Factors
Our operations are subject to risks and uncertainties that could cause actual results to differ materially from those discussed in this Form 10-K and could have a material adverse impact on our financial results. These risks can be impacted by factors beyond our control as well as by errors and omissions on our part. The following risk factors should be read carefully in connection with evaluating our business and the forward-looking statements contained elsewhere in this Form 10-K.
Certain of our business segments are affected by the supply and demand of commodities, and are sensitive to factors outside of our control. Adverse price movements could negatively affect our profitability and results of operations.
Our Grain, Ethanol and Plant Nutrient businesses buy, sell and hold inventories of agricultural input and output commodities, some of which are readily traded on commodity futures exchanges. Unfavorable weather conditions, both local and worldwide, as well as other factors beyond our control, can affect the supply and demand of these commodities and expose us to liquidity pressures to finance hedges in the grain business in rapidly rising markets. In our Plant Nutrient business, changes in the supply and demand of these commodities can also affect the value of inventories that we hold, as well as the price of raw materials as we are unable to effectively hedge these commodities. Increased costs of inventory and prices of raw material would decrease our profit margins and adversely affect our results of operations.
Corn - The principal raw material that the ethanol LLCs use to produce ethanol and coproducts is corn. As a result, an increase in the price of corn in the absence of a corresponding increase in petroleum based fuel prices will typically decrease ethanol margins thus adversely affecting financial results in the ethanol LLCs. At certain levels, corn prices may make ethanol uneconomical to produce for fuel markets. The price of corn is influenced by weather conditions and other factors affecting crop yields, shift in acreage allocated to corn versus other major crops and general economic and regulatory factors. These factors include government policies and subsidies with respect to agriculture and international trade, and global and local demand and supply. The significance and relative effect of these factors on the price of corn is difficult to predict. Any event that tends to negatively affect the supply of corn, such as adverse weather or crop disease, could increase corn prices and potentially harm the income generated from our investments in ethanol LLCs. In addition, we may also have difficulty, from time to time, in physically sourcing corn on economical terms due to supply shortages. High costs or shortages could require us to suspend ethanol operations until corn is available on economical terms, which would have an adverse effect on operating results.
Grains - While we attempt to manage the risk associated with commodity price changes for our grain inventory positions with derivative instruments, including purchase and sale contracts, we are unable to offset 100% of the price risk of each transaction due to timing, availability of futures and options contracts and third-party credit risk. Furthermore, there is a risk that the derivatives we employ will not be effective in offsetting all of the risks that we are trying to manage. This can happen when the derivative and the underlying value of grain inventories and purchase and sale contracts are not perfectly matched. Our grain derivatives, for example, do not perfectly correlate with the basis component of our grain inventory and contracts. (Basis is defined as the difference between the local cash price of a commodity and the corresponding exchange-traded futures price.) Differences can reflect time periods, locations or product forms. Although the basis component is smaller and generally less volatile than the futures component of our grain market price, basis moves on a large grain position can significantly impact the profitability of the Grain business.
Our futures, options and over-the-counter contracts are subject to margin calls. If there are large movements in the commodities market, we could be required to post significant levels of margin deposits, which would impact our liquidity. There is no assurance that the efforts we have taken to mitigate the impact of the volatility of the prices of commodities upon which we rely will be successful and any sudden change in the price of these commodities could have an adverse effect on our business and results of operations.
Natural gas - We rely on third parties for our supply of natural gas, which is consumed in the drying of wet grain, manufacturing of certain turf products, pelleted lime and gypsum, and manufacturing of ethanol within the LLCs. The prices for and availability of natural gas are subject to market conditions. These market conditions often are affected by factors beyond our control such as higher prices resulting from colder than average weather and overall economic conditions. Significant disruptions in the supply of natural gas could impair the operations of the ethanol facilities. Furthermore, increases in natural gas prices or changes in our natural gas costs relative to natural gas costs paid by competitors may adversely affect future results of operations and financial position.
Gasoline and oil - We market ethanol as a fuel additive to reduce vehicle emissions from gasoline, as an octane enhancer to improve the octane rating of gasoline with which it is blended and as a substitute for petroleum based gasoline. As a result,
7
ethanol prices will be influenced by the supply and demand for gasoline and oil and our future results of operations and financial position may be adversely affected if gasoline and oil demand or price changes.
Potash, phosphate and nitrogen - Raw materials used by the Plant Nutrient business include potash, phosphate and nitrogen, for which prices can be volatile and are driven by global and local supply and demand factors. Significant increases in the price of these commodities may result in lower customer demand and higher than optimal inventory levels. In contrast, reductions in the price of these commodities may create lower-of-cost-or-market adjustments to inventories.
Some of our business segments operate in highly regulated industries. Changes in government regulations or trade association policies could adversely affect our results of operations.
Many of our business segments are subject to government regulation and regulation by certain private sector associations, compliance with which can impose significant costs on our business. Other regulations are applicable generally to all our businesses and corporate functions, including, without limitation, those promulgated under the Internal Revenue Code, the Affordable Care Act, the Employee Retirement Income Security Act (ERISA) and other employment and health care related laws, federal and state securities laws, and the US Patriot Act. Failure to comply with such regulations can result in additional costs, fines or criminal action.
A significant part of our operations is regulated by environmental laws and regulations, including those governing the labeling, use, storage, discharge and disposal of hazardous materials. Because we use and handle hazardous substances in our businesses, changes in environmental requirements or an unanticipated significant adverse environmental event could have an adverse effect on our business. We cannot assure that we have been, or will at all times be, in compliance with all environmental requirements, or that we will not incur costs or liabilities in connection with these requirements. Private parties, including current and former employees, could bring personal injury or other claims against us due to the presence of, or exposure to, hazardous substances used, stored or disposed of by us, or contained in our products. We are also exposed to residual risk because some of the facilities and land which we have acquired may have environmental liabilities arising from their prior use. In addition, changes to environmental regulations may require us to modify our existing plant and processing facilities and could significantly increase the cost of those operations.
Grain and Ethanol businesses - In our Grain and Ethanol businesses, agricultural production and trade flows can be affected by government programs and legislation. Production levels, markets and prices of the grains we merchandise can be affected by U.S. government programs, which include acreage controls and price support programs administered by the USDA and required levels of ethanol in gasoline through the Renewable Fuel Standards as administered by the EPA. Other examples of government policies that can have an impact on our business include tariffs, duties, subsidies, import and export restrictions and outright embargoes. Because a portion of our grain sales are to exporters, the imposition of export restrictions and other foreign countries' regulations could limit our sales opportunities and create additional credit risk associated with export brokers if shipments are rejected at their destination.
The compliance burden and impact on our operations and profitability as a result of the enactment of the Dodd-Frank Wall Street Reform and Consumer Protection Act and related regulations have imposed additional regulatory tasks which took effect in 2014, although the full burden of the Act is not yet fully-known as some areas of regulatory rule making are not yet completed. These efforts to change the regulation of financial markets may subject users of derivatives to extensive oversight and regulation by the Commodity Futures Trading Commission (CFTC). Such initiatives could impose significant additional costs on us, including operating and compliance costs, and could materially affect the availability, as well as the cost and terms, of certain transactions. We will continue to monitor these developments. Any of these matters could have an adverse effect on our business, financial condition, liquidity, results of operations and prospects.
Rail - Our Rail business is subject to regulation by the American Association of Railroads and the Federal Railroad Administration. These agencies regulate rail operations with respect to health and safety matters. New regulatory rulings could negatively impact financial results through higher maintenance costs or reduced economic value of railcar assets.
The Rail business is also subject to risks associated with the demands and restrictions of the Class I railroads, a group of rail companies owning a high percentage of the existing rail lines. These companies exercise a high degree of control over whether private railcars can be allowed on their lines and may reject certain railcars or require maintenance or improvements to the railcars. This presents risk and uncertainty for our Rail business and it can increase maintenance costs. In addition, a shift in the railroads' strategy to investing in new rail cars and improvements to existing railcars, instead of investing in locomotives and infrastructure, could adversely impact our business by causing increased competition and creating an oversupply of railcars. Our rail fleet consists of a range of railcar types (boxcars, gondolas, covered and open top hoppers, tank cars and pressure differential cars) and locomotives. However, a large concentration of a particular type of railcar could expose us to risk if
8
demand were to decrease for that railcar type. Failure on our part to identify and assess risks and uncertainties such as these could negatively impact our business.
Similarly, our marine assets and operations are subject to rules and regulations relating to safety, citizenship, emissions, ballast discharges, and other environmental and operational matters enforced by various federal and state agencies, including the Maritime Administration of the U.S. Department of Transportation, the U.S. Coast Guard, and the U.S. Environmental Protection Agency (“EPA”). If we fail to comply with these rules and regulations, we could be prohibited from operating or leasing marine assets in the U.S. market, and under certain circumstances, could incur severe fines and penalties, including potential limitations on operations or forfeitures of assets.
Plant Nutrient - Our Plant Nutrient business manufactures certain agricultural nutrients and uses potentially hazardous materials. All products containing pesticides, fungicides and herbicides must be registered with the EPA and state regulatory bodies before they can be sold. The inability to obtain or the cancellation of such registrations could have an adverse impact on our business. In the past, regulations governing the use and registration of these materials have required us to adjust the raw material content of our products and make formulation changes. Future regulatory changes may have similar consequences. Regulatory agencies, such as the EPA, may at any time reassess the safety of our products based on new scientific knowledge or other factors. If it were determined that any of our products were no longer considered to be safe, it could result in the amendment or withdrawal of existing approvals, which, in turn, could result in a loss of revenue, cause our inventory to become obsolete or give rise to potential lawsuits against us. Consequently, changes in existing and future government or trade association polices may restrict our ability to do business and cause our financial results to suffer.
We are required to carry significant amounts of inventory across all of our businesses. If a substantial portion of our inventory becomes damaged or obsolete, its value would decrease and our profit margins would suffer.
We are exposed to the risk of a decrease in the value of our inventories due to a variety of circumstances in all of our businesses. For example, within our Grain and Ethanol businesses, there is the risk that the quality of our grain inventory could deteriorate due to damage, moisture, insects, disease or foreign material. If the quality of our grain were to deteriorate below an acceptable level, the value of our inventory could decrease significantly. In our Plant Nutrient business, planted acreage, and consequently the volume of fertilizer and crop protection products applied, is partially dependent upon government programs and the producer's perception of demand. Technological advances in agriculture, such as genetically engineered seeds that resist disease and insects, or that meet certain nutritional requirements, could also affect the demand for our crop nutrients and crop protection products. Either of these factors could render some of our inventory obsolete or reduce its value. Within our rail repair business, major design improvements to loading, unloading and transporting of certain products can render existing (especially old) equipment obsolete.
Our substantial indebtedness could negatively affect our financial condition, decrease our liquidity and impair our ability to operate the business.
If cash on hand is insufficient to pay our obligations or margin calls as they come due at a time when we are unable to draw on our credit facility, it could have an adverse affect on our ability to conduct our business. Our ability to make payments on and to refinance our indebtedness will depend on our ability to generate cash in the future. Our ability to generate cash is dependent on various factors. These factors include general economic, financial, competitive, legislative, regulatory and other factors that are beyond our control. Certain of our long-term borrowings include provisions that require minimum levels of working capital and equity, and impose limitations on additional debt. Our ability to satisfy these provisions can be affected by events beyond our control, such as the demand for and the fluctuating price of grain. Although we are and have been in compliance with these provisions, noncompliance could result in default and acceleration of long-term debt payments.
We face increasing competition and pricing pressure from other companies in our industries. If we are unable to compete effectively with these companies, our sales and profit margins would decrease, and our earnings and cash flows would be adversely affected.
The markets for our products in each of our business segments are highly competitive. While we have substantial operations in our region, some of our competitors are significantly larger, compete in wider markets, have greater purchasing power, and have considerably larger financial resources. We also may enter into new markets where our brand is not recognized and in which we do not have an established customer base. Competitive pressures in all of our businesses could affect the price of, and customer demand for, our products, thereby negatively impacting our profit margins and resulting in a loss of market share.
9
Our grain and ethanol businesses use derivative contracts to reduce volatility in the commodity markets. Non-performance by the counter-parties to those contracts could adversely affect our future results of operations and financial position.
A significant amount of our grain and ethanol purchases and sales are made through forward contracting. In addition, the Company uses exchange traded and to a lesser degree over-the-counter contracts to reduce volatility in changing commodity prices. A significant adverse change in commodity prices could cause a counter-party to one or more of our derivative contracts to not perform on its obligation.
A significant portion of the Company's assets are geographically concentrated in the Eastern Corn Belt. Localized weather and other market factors may have a disproportionate impact on our business compared to our competitors.
A significant portion of Company's the assets are exposed to conditions in the Eastern Corn Belt. In this region, adverse weather during the fertilizer application, planting, and harvest seasons can have negative impacts on our Grain and Plant Nutrient businesses. Higher basis levels in the Eastern Corn Belt can increase the input costs of our Ethanol facilities relative to other market participants that do not have the same geographic concentration.
We rely on a limited number of suppliers for certain of our raw materials and other products and the loss of one or several of these suppliers could increase our costs and have a material adverse effect on any one of our business segments.
We rely on a limited number of suppliers for certain of our raw materials and other products. If we were unable to obtain these raw materials and products from our current vendors, or if there were significant increases in our supplier's prices, it could significantly increase our costs and reduce our profit margins.
Our investments in unconsolidated entities accounted for under the equity method are subject to risks beyond our control.
We currently have investments in numerous limited liability companies and joint ventures. By operating a business through this arrangement, we do not have control over operating decisions as we would if we owned the business outright. Specifically, we cannot act on major business initiatives without the consent of the other investors, who may not always be in agreement with our ideas.
The Company may not be able to effectively integrate future businesses it acquires.
We continuously look for opportunities to enhance our existing businesses through strategic acquisitions. The process of integrating an acquired business into our existing business and operations may result in unforeseen operating difficulties and expenditures as well as require a significant amount of management resources. There is also the risk that our due diligence efforts may not uncover significant business flaws or hidden liabilities. In addition, we may not realize the anticipated benefits of an acquisition and they may not generate the anticipated financial results. Additional risks may include the inability to effectively integrate the operations, products, technologies and personnel of the acquired companies. The inability to maintain uniform standards, controls, procedures and policies would also negatively impact operations.
Our business involves considerable safety risks. Significant unexpected costs and liabilities would have an adverse effect on our profitability and overall financial position.
Due to the nature of some of the businesses in which we operate, we are exposed to significant operational hazards such as grain dust explosions, fires, malfunction of equipment, abnormal pressures, blowouts, pipeline and tank ruptures, chemical spills or run-off, transportation accidents and natural disasters. Some of these operational hazards may cause personal injury or loss of life, severe damage to or destruction of property and equipment or environmental damage, and may result in suspension of operations and the imposition of civil or criminal penalties. If grain dust were to explode at one of our elevators or if one of our pieces of equipment were to fail or malfunction due to an accident or improper maintenance, it could put our employees and others at serious risk.
The Company's information technology systems may impose limitations or failures, or may face external threats, which may affect the Company's ability to conduct its business.
The Company's information technology systems, some of which are dependent on services provided by third parties, provide critical data connectivity, information and services for internal and external users. These interactions include, but are not limited to, ordering and managing materials from suppliers, converting raw materials to finished products, inventory management, shipping products to customers, processing transactions, summarizing and reporting results of operations, complying with regulatory, legal or tax requirements, human resources and other processes necessary to manage the
10
business. The Company has put in place business continuity plans for its critical systems. However, if the Company's information technology systems are damaged, or cease to function properly due to any number of causes, such as catastrophic events or power outages, and the Company's business continuity plans do not allow it to effectively recover on a timely basis, the Company may suffer interruptions in the ability to manage its operations, which may adversely impact the Company's operating results. Our security measures may also be breached due to employee error, malfeasance, or otherwise. In addition, although the systems have been refreshed periodically, portions of the infrastructure are outdated and may not be adequate to support new business processes, accounting for new transactions, or implementation of new accounting standards if requirements are complex or materially different than what is currently in place.
Additionally, outside parties may attempt to destroy critical information, or fraudulently induce employees, third-party service providers, or users to disclose sensitive information in order to gain access to our data or our users' data. As a response, the Company requires user names and passwords in order to access its information technology systems. The Company also uses encryption and authentication technologies designed to secure the transmission and storage of data and prevent access to Company data or accounts. The Company also conducts annual tests and assessments using independent third parties. As with all companies, these security measures are subject to third-party security breaches, employee error, malfeasance, faulty password management, or other irregularities. We cannot assure our ability to prevent, repel or mitigate the effects of such an attack by outside parties. The Company relies on third parties to maintain and process certain information which could be subject to breach or unauthorized access to Company or employee information. Any such breach or unauthorized access could result in an inability to perform critical functions, significant legal and financial exposure, damage to our reputation, and a loss of confidence in the security of our services that could potentially have an adverse affect on our business.
The Company's design and implementation of a new Enterprise Resource Planning system could face significant difficulties.
In early 2012, the Company began the design and implementation of a new Enterprise Resource Planning ("ERP") system, requiring significant capital and human resources to deploy. The first wave of implementation was more expensive and took longer to fully implement than originally planned, including increased capital investment, higher fees and expenses of third parties, delayed deployment scheduling, and more on-going maintenance expense once implemented. Future releases would be subject to similar risks and, as such, the ultimate costs and schedules are not yet known. If for any reason portions of the implementation are not successful, the Company could be required to expense rather than capitalize related amounts. Beyond cost and scheduling, potential flaws in the implementation of an ERP system may pose risks to the Company's ability to operate successfully and efficiently. These risks include, without limitation, inefficient use of employees, distractions to the Company's core businesses, adverse customer reactions, loss of key information, delays in decision making, as well as unforeseen additional costs due to the inability to integrate vital information processes.
Unauthorized disclosure of sensitive or confidential customer information could harm the Company's business and standing with our customers.
The protection of our customer, employee and Company data is critical to us. The Company relies on commercially available systems, software, tools and monitoring to provide security for processing, transmission and storage of confidential customer information, such as payment card and personal information. The Company also conducts annual tests and assessments using independent third parties. Despite the security measures the Company has in place, its facilities and systems, and those of its third-party service providers, may be vulnerable to security breaches, acts of vandalism, computer viruses, misplaced or lost data, programming or human errors, or other similar events. Any security breach involving the misappropriation, loss or other unauthorized disclosure of confidential information, whether by the Company or its vendors, could damage our reputation, expose us to risk of litigation and liability, disrupt our operations and harm our business.
A change in tax laws or regulations of any federal, state or international jurisdiction in which we operate could increase our tax burden and otherwise adversely affect our financial position, results of operations, cash flows and liquidity.
We continue to assess the impact of various U.S. federal, state, local and international legislative proposals that could result in a material increase to our U.S. federal, state, local and/or international taxes. We cannot predict whether any specific legislation will be enacted or the terms of any such legislation. However, if such proposals were to be enacted, or if modifications were to be made to certain existing regulations, the consequences could have a material adverse impact on us, including increasing our tax burden, increasing our cost of tax compliance or otherwise adversely affecting our financial position, results of operations, cash flows and liquidity. Moreover, the full impact on the company, its suppliers or customers of the recently enacted Tax Cuts and Jobs Act of 2017 is not yet fully known. Such impact may also be affected positively or negatively by subsequent potential judicial interpretation or related regulation or legislation which cannot be predicted with certainty.
11
Item 1B. Unresolved Staff Comments
The Company has no unresolved staff comments.
Item 2. Properties
The Company's principal agriculture, rail, and other properties are described below.
Agriculture Facilities
Agricultural Fertilizer | |||||||||
(in thousands) | Grain Storage | Dry Storage | Liquid Storage | ||||||
Location | (bushels) | (tons) | (tons) | ||||||
Canada | 562 | — | — | ||||||
Illinois | 11,359 | 55 | 11 | ||||||
Indiana | 26,094 | 142 | 141 | ||||||
Iowa | 2,600 | — | 69 | ||||||
Michigan | 30,411 | 70 | 48 | ||||||
Minnesota | — | — | 47 | ||||||
Nebraska | 13,222 | — | 45 | ||||||
Ohio | 40,203 | 189 | 64 | ||||||
Puerto Rico | — | — | 10 | ||||||
Tennessee | 14,570 | — | — | ||||||
Texas | 1,386 | — | — | ||||||
Wisconsin | — | 24 | 77 | ||||||
140,407 | 480 | 512 | |||||||
The grain facilities are mostly concrete and steel tanks, with some flat storage buildings. The Company also owns grain inspection buildings and dryers, maintenance buildings and truck scales and dumps. Approximately 91% of the total storage capacity noted above, which excludes temporary pile storage, is owned, while the remaining 9% of the total capacity is leased from third parties.
The Plant Nutrient Group's wholesale nutrient and farm center properties consist mainly of fertilizer warehouse and formulation and packaging facilities for dry and liquid fertilizers. The Company owns approximately 99% of the dry and liquid storage capacity noted above.
Other Properties
The Company owns an ethanol facility in Denison, Iowa with a nameplate capacity of 55 million gallons. The Company owns lawn fertilizer production facilities in Maumee, Ohio, Bowling Green, Ohio, Montgomery, Alabama, and Mocksville, North Carolina. It also owns a corncob processing and storage facility in Delphi, Indiana. The Company leases 370,000 square feet of a lawn fertilizer warehouse facility in Toledo, Ohio and a 245,000 square foot distribution center in Maumee, Ohio. The Company operates 19 railcar repair facilities throughout the country.
In January 2017, the Company announced its decision to close all retail operations. The Retail Group closed all of its stores in 2017. The Toledo store, which consists of about 162,000 square feet, is the only remaining store that has not been sold and is currently included in Assets held for sale.
The Company's administrative office building is leased under a build-to-suit financing arrangement. The Company owns approximately 2,031 acres of land on which the above properties and facilities are located and approximately 412 acres of farmland and land held for future use.
The Company believes that its properties are adequate for its business, well maintained and utilized, suitable for their intended uses and adequately insured.
12
Item 3. Legal Proceedings
The Company is currently subject to various claims and suits arising in the ordinary course of business, which include environmental issues, employment claims, contractual disputes, and defensive counterclaims. The Company accrues liabilities in which litigation losses are deemed probable and estimable. The Company believes it is unlikely that the results of its current legal proceedings, even if unfavorable, will be materially different from what it currently has accrued. There can be no assurance, however, that any claims or suits arising in the future, whether taken individually or in the aggregate, will not have a material adverse effect on our financial condition or results of operations.
Item 4. Mine Safety
Not applicable.
Executive Officers of the Registrant
The information is furnished pursuant to Instruction 3 to Item 401(b) of Regulation S-K. The executive officers of The Andersons, Inc., their positions and ages (as of February 26, 2018) are presented in the table below.
Name | Position | Age | Year Assumed |
Jeffrey C. Blair | President, Plant Nutrient Group Vice President of Sales (Intrepid Potash, Inc) Director of Potash Sales (Intrepid Potash, Inc) Commercial Director - Sales and Account Management (Orica Mining Services) | 45 | 2017 2016 2013 2011 |
Valerie M. Blanchett | Vice President, Human Resources Vice President, Human Resources, Food Ingredients and Systems (Cargill) | 56 | 2016 2010 |
Patrick E. Bowe | President and Chief Executive Officer Corporate Vice President, Food Ingredients and Systems (Cargill) | 59 | 2015 2007 |
Naran U. Burchinow | Senior Vice President, General Counsel and Secretary | 64 | 2005 |
Srikanth R. Dasari | Vice President, Treasurer Treasurer (Westinghouse Electric Company) Head of Treasury Front Office (Dow Corning) | 47 | 2017 2016 2010 |
Tamara S. Goetz | Vice President, Financial Planning & Analysis Vice President, Corporate Business /Financial Analysis | 49 | 2015 2007 |
John J. Granato | Chief Financial Officer | 52 | 2012 |
Michael S. Irmen | President, Ethanol Group Vice President and General Manager, Ethanol Group Vice President, Commodities and Risk, Ethanol Group | 64 | 2016 2015 2012 |
Corbett J. Jorgenson | President, Grain Group Vice President, Americas, Corporate Transportation (Cargill) Vice President, Commercial Lead, AgHorizons USA (Cargill) | 43 | 2016 2015 2013 |
Anthony A. Lombardi | Chief Information Officer Vice President, Global Business Services and Chief Information Officer (Armstrong World Industries) | 59 | 2016 2010 |
Joseph E. McNeely | President, Rail Group President and Chief Executive Officer (FreightCar America, Inc.) Vice President Finance, Chief Financial Officer and Treasurer (FreightCar America, Inc.) | 53 | 2017 2013 2010 |
Anne G. Rex | Vice President, Corporate Controller | 53 | 2012 |
Rasesh H. Shah | Senior Director - Rail President, Rail Group | 63 | 2017 1999 |
13
Part II.
Item 5. Market for the Registrant's Common Equity and Related Stockholder Matters
The Common Shares of The Andersons, Inc. trade on the Nasdaq Global Select Market under the symbol “ANDE.” On February 18, 2014, the Company effected a three-for-two stock split to its outstanding shares as of January 21, 2014. All share, dividend and per share information set forth in this 10-K has been retroactively adjusted to reflect the stock split.
Shareholders
At February 15, 2018, there were approximately 28.2 million common shares outstanding, 1,131 shareholders of record and approximately 10,176 shareholders for whom security firms acted as nominees.
The following table sets forth the high and low bid prices for the Company's Common Shares for the four fiscal quarters in each of 2017 and 2016.
2017 | 2016 | ||||||
High | Low | High | Low | ||||
Quarter Ended | |||||||
March 31 | $43.30 | $36.75 | $32.24 | $24.01 | |||
June 30 | $38.80 | $32.20 | $36.46 | $25.94 | |||
September 30 | $34.65 | $31.00 | $38.30 | $34.40 | |||
December 31 | $37.45 | $29.85 | $44.80 | $34.50 | |||
The Company's transfer agent and registrar is Computershare Investor Services, LLC, 2 North LaSalle Street, Chicago, IL 60602. Telephone: 312-588-4991.
Dividends
The Company has declared and paid consecutive quarterly dividends since the end of 1996, its first year of trading on the Nasdaq market. Dividends paid from January 2016 to January 2018 are as follows:
Payment Date | Amount | |
1/25/2016 | $0.1550 | |
4/22/2016 | $0.1550 | |
7/22/2016 | $0.1550 | |
10/24/2016 | $0.1550 | |
1/24/2017 | $0.1600 | |
4/24/2017 | $0.1600 | |
7/24/2017 | $0.1600 | |
10/23/2017 | $0.1600 | |
1/23/2018 | $0.1650 | |
While the Company's objective is to pay a quarterly cash dividend, dividends are subject to Board of Director approval.
14
Equity Plans
The following table gives information as of December 31, 2017 about the Company's Common Shares that may be issued upon the exercise of options under all of its existing equity compensation plans.
Equity Compensation Plan Information | |||||||
Plan category | (a) Number of securities to be issued upon exercise of outstanding options, warrants and rights | Weighted-average exercise price of outstanding options, warrants and rights | Number of securities remaining available for future issuance under equity compensation plans (excluding securities reflected in column (a)) | ||||
Equity compensation plans approved by security holders | 1,010,984 (1) | $ | 34.93 | 668,213 (2) | |||
Equity compensation plans not approved by security holders | — | — | — | ||||
(1) | This number includes 325,000 Non-Qualified Stock Options (“Options”), 182,596 total shareholder return-based performance share units, 274,798 earnings per share-based performance share units, and 228,590 restricted shares outstanding under The Andersons, Inc. 2014 Long-Term Performance Compensation Plan. This number does not include any shares related to the Employee Share Purchase Plan. The Employee Share Purchase Plan allows employees to purchase common shares at the lower of the market value on the beginning or end of the calendar year through payroll withholdings. These purchases are completed as of December 31. |
(2) | This number includes 95,918 Common Shares available to be purchased under the Employee Share Purchase Plan and 572,295 shares available under equity compensation plans. |
Purchases of Equity Securities by the Issuer and Affiliated Purchasers
In October 2014, the Board approved the repurchase of shares at a value not to exceed $50.0 million. The Company repurchased approximately 1.2 million shares, exhausting the October 2014 authorization amount in 2015.
No shares were repurchased in 2017 or 2016.
15
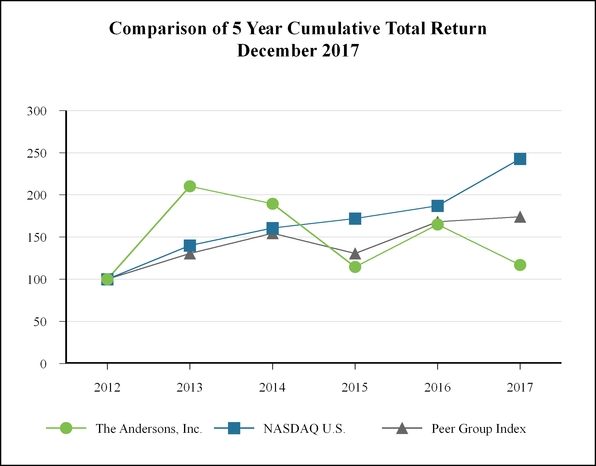
Performance Graph
The graph below compares the total shareholder return on the Corporation's Common Shares to the cumulative total return for the Nasdaq U.S. Index and a Peer Group Index. The indices reflect the year-end market value of an investment in the stock of each company in the index, including additional shares assumed to have been acquired with cash dividends, if any. The Peer Group Index, weighted for market capitalization, includes the following companies:
Agrium, Inc. | Ingredion Incorporated |
Archer-Daniels-Midland Co. | The Greenbrier Companies, Inc. |
GATX Corp. | The Scott's Miracle-Gro Company |
Green Plains, Inc. | |
This Peer Group Index was adjusted in 2017 to better reflect the Company’s business. We removed Lowe's Companies, Inc. as we closed the Retail business and we added Green Plains, Inc. to include additional representation of our Ethanol group.
The graph assumes a $100 investment in The Andersons, Inc. Common Shares on December 31, 2012 and also assumes investments of $100 in each of the Nasdaq U.S. and Peer Group indices, respectively, on December 31 of the first year of the graph. The value of these investments as of the following calendar year-ends is shown in the table below the graph.
16
Base Period | Cumulative Returns | |||||||||||||||||
December 31, 2012 | 2013 | 2014 | 2015 | 2016 | 2017 | |||||||||||||
The Andersons, Inc. | $ | 100.00 | $ | 210.05 | $ | 189.34 | $ | 114.54 | $ | 164.80 | $ | 117.05 | ||||||
NASDAQ U.S. | 100.00 | 140.12 | 160.78 | 171.97 | 187.22 | 242.71 | ||||||||||||
Peer Group Index | 100.00 | 130.57 | 154.68 | 130.65 | 168.04 | 174.20 | ||||||||||||
17
Item 6. Selected Financial Data
The following table sets forth selected consolidated financial data of the Company. The data for each of the five years in the period ended December 31, 2017 are derived from the Consolidated Financial Statements of the Company. The data presented below should be read in conjunction with “Management's Discussion and Analysis of Financial Condition and Results of Operations,” included in Item 7, and the Consolidated Financial Statements and notes thereto included in Item 8.
(in thousands, except for per share and ratios and other data) | For the years ended December 31, | ||||||||||||||||||
2017 | 2016 | 2015 | 2014 | 2013 | |||||||||||||||
Operating results | |||||||||||||||||||
Sales and merchandising revenues (a) | $ | 3,686,345 | $ | 3,924,790 | $ | 4,198,495 | $ | 4,540,071 | $ | 5,604,574 | |||||||||
Gross profit | 318,799 | 345,506 | 375,838 | 397,139 | 365,225 | ||||||||||||||
Equity in earnings of affiliates | 16,723 | 9,721 | 31,924 | 96,523 | 68,705 | ||||||||||||||
Other income, net (b) | 23,444 | 14,775 | 46,472 | 31,125 | 14,876 | ||||||||||||||
Net income (loss) | 42,609 | 14,470 | (11,322 | ) | 122,645 | 95,702 | |||||||||||||
Net income (loss) attributable to The Andersons, Inc. | 42,511 | 11,594 | (13,067 | ) | 109,726 | 89,939 | |||||||||||||
EBITDA (c) | 87,356 | 123,949 | 85,219 | 254,992 | 219,917 | ||||||||||||||
Financial position | ||||||||||||||
Total assets | 2,162,354 | 2,232,849 | 2,359,101 | 2,364,692 | 2,273,556 | |||||||||
Working capital | 260,495 | 258,350 | 241,485 | 226,741 | 229,451 | |||||||||
Long-term debt (d) | 418,339 | 397,065 | 436,208 | 298,638 | 371,150 | |||||||||
Long-term debt, non-recourse (d) | — | — | — | — | 4,063 | |||||||||
Total equity | 822,899 | 790,697 | 783,739 | 824,049 | 724,421 | |||||||||
Cash flows / liquidity | ||||||||||||||
Cash flows from (used in) operations | 75,285 | 39,585 | 154,134 | (10,071 | ) | 337,188 | ||||||||
Depreciation and amortization | 86,412 | 84,325 | 78,456 | 62,005 | 55,307 | |||||||||
Cash invested in acquisitions (e) | (3,507 | ) | — | (128,549 | ) | (20,037 | ) | (15,252 | ) | |||||
Purchase of investments (f) | (5,679 | ) | (2,523 | ) | (938 | ) | (238 | ) | (49,251 | ) | ||||
Investments in property, plant and equipment and capitalized software | (34,602 | ) | (77,740 | ) | (72,469 | ) | (59,675 | ) | (46,786 | ) | ||||
Net proceeds from (investment in) Rail Group assets (g) | (106,124 | ) | (28,579 | ) | (38,407 | ) | (57,968 | ) | 4,648 | |||||
Per share data (h) | ||||||||||||||
Net income (loss) - basic | 1.51 | 0.41 | (0.46 | ) | 3.85 | 3.20 | ||||||||
Net income (loss) - diluted | 1.50 | 0.41 | (0.46 | ) | 3.84 | 3.18 | ||||||||
Dividends declared | 0.6450 | 0.6250 | 0.5750 | 0.4700 | 0.4300 | |||||||||
Year-end market value | 31.15 | 44.70 | 31.63 | 53.14 | 59.45 | |||||||||
Ratios and other data | ||||||||||||||
Net income attributable to The Andersons, Inc. return on beginning equity attributable to The Andersons, Inc. | 5.5 | % | 1.5 | % | (1.6 | )% | 15.6 | % | 15.1 | % | ||||
Funded long-term debt to equity ratio (i) | 0.5-to-1 | 0.5-to-1 | 0.6-to-1 | 0.4-to-1 | 0.5-to-1 | |||||||||
Weighted average shares outstanding (000's) | 28,126 | 28,193 | 28,288 | 28,367 | 27,986 | |||||||||
Effective tax rate | 307.6 | % | 32.3 | % | 2.1 | % | 33.4 | % | 36.0 | % | ||||
(a) Includes sales of $1,089.7 million in 2017, $854.6 million in 2016, $872.1 million in 2015, $1,064.4 million in 2014, and $1,333.2 million in 2013 pursuant to marketing and origination agreements between the Company and the unconsolidated ethanol LLCs.
(b) Includes $23.1 million for the gain on dilution and partial share redemption of the LTG investment in 2015 and $17.1 million for the gain on partial share redemption of LTG in 2014.
(c) Earnings before interest, taxes, depreciation and amortization, or EBITDA, is a non-GAAP measure. The Company believes EBITDA provides additional information to investors and others about its operations allowing an evaluation of underlying operating performance and better period-to-period comparability. EBITDA does not and should not be considered as an alternative to net income or income before income taxes as determined by generally accepted accounting principles.
(d) Excludes current portion of long-term debt.
(e) During 2015, the Company acquired 100% of the stock of Kay Flo Industries, Inc.
(f) During 2013, the Company and LTG established 50/50 joint ventures to acquire 100% of the stock of Thompsons Limited and its related U.S. operating company.
(g) Represents the net of purchases of Rail Group assets offset by proceeds on sales of Rail Group assets.
18
(h) Earnings per share are calculated based on Income attributable to The Andersons, Inc.
(i) Calculated by dividing long-term debt by total year-end equity as stated under “Financial position.”
The following table sets forth our calculation of EBITDA.
For the years ended December 31, | |||||||||||||||||||
(in thousands) | 2017 | 2016 | 2015 | 2014 | 2013 | ||||||||||||||
Net income (loss) attributable to The Andersons, Inc. | $ | 42,511 | $ | 11,594 | $ | (13,067 | ) | $ | 109,726 | $ | 89,939 | ||||||||
Add: | |||||||||||||||||||
Provision (benefit) for income taxes | (63,134 | ) | 6,911 | (242 | ) | 61,501 | 53,811 | ||||||||||||
Interest expense | 21,567 | 21,119 | 20,072 | 21,760 | 20,860 | ||||||||||||||
Depreciation and amortization | 86,412 | 84,325 | 78,456 | 62,005 | 55,307 | ||||||||||||||
EBITDA | 87,356 | 123,949 | 85,219 | 254,992 | 219,917 | ||||||||||||||
The Company has included its Computation of Earnings to Fixed Charges in Item 15. Exhibits, Financial Statement Schedules, and Reports on Form 10-K as Exhibit 12.
19
Item 7. Management's Discussion and Analysis of Financial Condition and Results of Operations
Forward Looking Statements
The following “Management's Discussion and Analysis of Financial Condition and Results of Operations” contains forward-looking statements which relate to future events or future financial performance and involve known and unknown risks, uncertainties and other factors that may cause actual results, levels of activity, performance or achievements to be materially different from those expressed or implied by these forward-looking statements. The reader is urged to carefully consider these risks and factors, including those listed under Item 1A, “Risk Factors.” In some cases, the reader can identify forward-looking statements by terminology such as “may”, “anticipates”, “believes”, “estimates”, “predicts”, or the negative of these terms or other comparable terminology. These statements are only predictions. Actual events or results may differ materially. These forward-looking statements relate only to events as of the date on which the statements are made and the Company undertakes no obligation, other than any imposed by law, to publicly update or revise any forward-looking statements, whether as a result of new information, future events or otherwise. Although we believe that the expectations reflected in the forward-looking statements are reasonable, we cannot guarantee future results, levels of activity, performance or achievements.
Executive Overview
Our operations are organized, managed and classified into five reportable business segments: Grain, Ethanol, Plant Nutrient, Rail, and Retail. Each of these segments is based on the nature of products and services offered.
The agricultural commodity-based business is one in which changes in selling prices generally move in relationship to changes in purchase prices. Therefore, increases or decreases in prices of the agricultural commodities that the business deals in will have a relatively equal impact on sales and cost of sales and a much less significant impact on gross profit. As a result, changes in sales for the period may not necessarily be indicative of the overall performance of the business and more focus should be placed on changes to gross profit.
Grain Group
The Grain Group's performance reflects continued recovery from the prior year. Holding corn, beans, and wheat has led to higher space income. Additionally, our risk management services, trading income, and earnings from affiliates have improved. While the 2017 harvest quality and yield was good, a drawn out harvest prevented strong margins on bushels sold. The Group continues to refine its portfolio and signed an agreement in February 2018 to sell three of its Tennessee locations. Assets associated with these locations have been classified as Held for Sale, including approximately 3.4 million bushels of inventory.
Total grain storage capacity, including temporary pile storage, is approximately 150 million bushels as of December 31, 2017, similar to capacity at December 31, 2016. Grain inventories on hand at December 31, 2017 were 113.8 million bushels, of which 1.0 million bushels were stored for others. This compares to 108.4 million bushels on hand at December 31, 2016, of which 0.9 million bushels were stored for others.
The group estimates that growers will plant 87 to 90 million acres of corn in 2018, perhaps slightly below the 90 million acres planted in 2017. Soybean planted acres are expected to be 89 to 92 million, compared to 90 million acres planted last year. Total wheat acres planted have been reported to be approximately 46 million in 2017 compared to 50 million in 2016. Normal weather conditions during planting and growing seasons should create good storage and merchandising opportunities in the coming year.
Ethanol Group
The Ethanol Group's results reflect record industry production and excess supply in the market leading to lower margins on ethanol sold. Additionally, higher input costs negatively impacted margins. DDG margins were also impacted by vomitoxin issues remaining from the 2016 harvest. Weak ethanol and DDG margins were partially offset by high ethanol export demand and strong E-85 and corn oil sales. DDG margins rebounded at year-end, in part due to a lack of significant vomitoxin issues noted in the 2017 harvest. As we move into 2018, we expect margins to continue to be impacted by high industry production and inventory levels.
20
Volumes shipped for the years ended December 31, 2017 and 2016 were as follows:
Twelve months ended December 31, | |||||
(in thousands) | 2017 | 2016 | |||
Ethanol (gallons) | 411,087 | 295,573 | |||
E-85 (gallons) | 47,676 | 37,709 | |||
Corn Oil (pounds) | 17,959 | 14,794 | |||
DDG (tons) | 162 | 164 | |||
The above table shows only shipped volumes that flow through the Company's revenues. Total ethanol, DDG, and corn oil production by the unconsolidated LLCs is higher. However, the portion of this volume that is sold directly to their customers is excluded here.
Plant Nutrient Group
The Plant Nutrient Group's results reflect a continued, depressed nutrient market. The oversupply of base nutrients in the market has continued to put pressure on prices, which has compressed overall margins, while volumes remained steady.
Total storage capacity at our wholesale nutrient and farm center facilities was approximately 480 thousand tons for dry nutrients and approximately 512 thousand tons for liquid nutrients at December 31, 2017.
During the year, the Plant Nutrient Group recorded goodwill impairment losses related to the Wholesale reporting unit of $59.1 million. As a result, there is no remaining goodwill in the Wholesale reporting unit as of December 31, 2017.
Looking ahead, we expect low prices and oversupply conditions to persist, putting further pressure on margins into next year. The Group will remain focused on productivity, operational efficiency and sales force development.
Tons shipped by product line (including sales and service tons) for the years ended December 31, 2017 and 2016 were as follows:
(in thousands) | Twelve months ended December 31, | ||||
2017 | 2016 | ||||
Wholesale Nutrients - Base Nitrogen, Phosphorus, Potassium | 1,262 | 1,246 | |||
Wholesale Nutrients - Value added products | 489 | 491 | |||
Other (Includes Farm Center, Turf, and Cob) | 447 | 553 | |||
Total tons | 2,198 | 2,290 | |||
Other tons shipped decreased from 553 in 2016 to 447 in 2017 as a result of the sale of four farm center locations in Florida.
Rail Group
The Rail Group's results were lower than the prior year, primarily in its base leasing business. This was due to decreases in lease utilization and average lease rates. Rail Group assets under management (owned, leased or managed for financial institutions in non-recourse arrangements) at December 31, 2017 were 24,104 compared to 23,236 at December 31, 2016. The average utilization rate (Rail Group assets under management that are in lease service, exclusive of those managed for third-party investors) was 85.0% for the year ended December 31, 2017 which was 2.8 percent lower than the prior year.
For the year ended December 31, 2017, Rail recorded gains on sales of Rail Group assets and related leases in the amount of $11.0 million and a similar amount for the year ended December 31, 2016.
In 2018 the Group will continue to focus on ways to strategically grow the rail fleet while increasing the average remaining life of the fleet and continue to look for opportunities to open new repair facilities and other adjacent businesses. The Group expects an increase in 2018 tank car recertification expense. Additionally, sales will be impacted by changes in accounting standards as certain transactions the group has engaged in over time will not qualify for sale treatment under the new revenue recognition rules in 2018.
21
Retail Group
In January 2017, the Company announced its decision to close all remaining retail operations. The Retail Group closed all stores, completed its liquidation efforts, and has sold all but one the retail properties, which is currently being actively marketed for sale.
Other
Our “Other” represents corporate functions that provide support and services to the operating segments. The results contained within this group include expenses and benefits not allocated back to the operating segments, including a significant portion of our ERP project and the settlement charges from the termination of our defined benefit pension plan in 2015.
Operating Results
On February 14, 2018, we furnished a Current Report on Form 8-K to the SEC that included a press release issued that same day announcing the fourth quarter and full-year financial results for the period ended December 31, 2017, which was furnished as Exhibit 99.1 thereto (the Earnings Release). The Earnings Release reported: (a) net income attributable to The Andersons, Inc. of $68.4 million and $41.2 million; and (b) diluted earnings per common share attributable to The Andersons, Inc. shareholders of $2.42 and $1.46, each for the three and twelve months ended December 31, 2017. The Consolidated Statements of Operations and accompanying notes in this Annual Report on Form 10-K reports (a) net income attributable to The Andersons, Inc. of $69.7 million and $42.5 million; and (b) diluted earnings per common share attributable to The Andersons, Inc. shareholders of $2.47 and $1.50, each for the three and twelve months ended December 31, 2017. Subsequent to the Earnings Release, we recorded additional tax benefit of $1.3 million as we finalized our tax provision.
The following discussion focuses on the operating results as shown in the Consolidated Statements of Operations with a separate discussion by segment. Additional segment information is included in Note 13 to the Company's Consolidated Financial Statements in Item 8.
Year ended December 31, | |||||||||||
(in thousands) | 2017 | 2016 | 2015 | ||||||||
Sales and merchandising revenues | $ | 3,686,345 | $ | 3,924,790 | $ | 4,198,495 | |||||
Cost of sales and merchandising revenues | 3,367,546 | 3,579,284 | 3,822,657 | ||||||||
Gross profit | 318,799 | 345,506 | 375,838 | ||||||||
Operating, administrative and general expenses | 287,930 | 318,395 | 337,829 | ||||||||
Pension settlement | — | — | 51,446 | ||||||||
Asset impairment | 10,913 | 9,107 | 285 | ||||||||
Goodwill impairment | 59,081 | — | 56,166 | ||||||||
Interest expense | 21,567 | 21,119 | 20,072 | ||||||||
Equity in earnings of affiliates | 16,723 | 9,721 | 31,924 | ||||||||
Other income, net | 23,444 | 14,775 | 46,472 | ||||||||
Income (loss) before income taxes | (20,525 | ) | 21,381 | (11,564 | ) | ||||||
Income attributable to noncontrolling interests | 98 | 2,876 | 1,745 | ||||||||
Income (loss) before income taxes attributable to The Andersons, Inc. | $ | (20,623 | ) | $ | 18,505 | $ | (13,309 | ) | |||
22
Comparison of 2017 with 2016
Grain Group
Year ended December 31, | |||||||
(in thousands) | 2017 | 2016 | |||||
Sales and merchandising revenues | $ | 2,106,464 | $ | 2,357,171 | |||
Cost of sales and merchandising revenues | 1,975,076 | 2,249,089 | |||||
Gross profit | 131,388 | 108,082 | |||||
Operating, administrative and general expenses | 107,478 | 112,507 | |||||
Asset impairment | 10,913 | — | |||||
Interest expense | 8,320 | 7,955 | |||||
Equity in earnings of affiliates | 4,509 | (8,746 | ) | ||||
Other income, net | 3,658 | 5,472 | |||||
Income (loss) before income taxes | 12,844 | (15,654 | ) | ||||
Loss attributable to noncontrolling interests | — | (3 | ) | ||||
Income (loss) before income taxes attributable to The Andersons, Inc. | $ | 12,844 | $ | (15,651 | ) | ||
Operating results for the Grain Group improved $28.5 million compared to full year 2016 results. Sales and merchandising revenues decreased $250.7 million compared to 2016 due to a 24% decrease in bushels sold. This decrease was driven by two main factors. First, more bushels are being strategically stored due to strong space income opportunities in the market. Second, there was an intentional reduction in bushels sold directly from supplier to customer as the group continues to focus only on the most profitable markets to increase margins. Cost of sales and merchandising revenues decreased due to the same items above but to a lesser extent for a net favorable gross profit impact of approximately $23.3 million. The gross profit increase was driven by a $31.5 million increase in space income relating to corn, beans, and wheat as the value of storage capacity significantly improved, as well as a $7.8 million increase from risk management fees, trading income and other items compared to the prior year. These gains were partially offset by a $12.9 million decrease in drying and mixing income related to unusual wheat blending opportunities in 2016 that did not occur in 2017 and handling margins related to both harvest timing and grain storage decisions.
Operating, administrative and general expenses decreased $5.0 million compared to full year 2016 results. The decrease was primarily due to a reduction of $3.5 million in costs as a result of the disposition of the Iowa facilities in 2016 and a $3.6 million decrease due to reductions in labor and benefits at the remaining facilities as a result of productivity initiatives and lower employee costs. The decreases were partially offset by minor increases in 2017 depreciation, maintenance and other expenses.
The Grain Group recorded asset impairment charges of $10.9 million relating to its Western Tennessee assets.
Equity in earnings of affiliates improved $13.3 million primarily due to the improved operating results of LTG, which also continues to recover from under performance in its core markets in 2016.
Ethanol Group
Year ended December 31, | |||||||
(in thousands) | 2017 | 2016 | |||||
Sales and merchandising revenues | $ | 708,063 | $ | 544,556 | |||
Cost of sales and merchandising revenues | 688,206 | 524,252 | |||||
Gross profit | 19,857 | 20,304 | |||||
Operating, administrative and general expenses | 13,216 | 11,211 | |||||
Interest expense | (67 | ) | 35 | ||||
Equity in earnings of affiliates | 12,214 | 18,467 | |||||
Other income, net | 54 | 77 | |||||
Income before income taxes | 18,976 | 27,602 | |||||
Income attributable to noncontrolling interests | 98 | 2,879 | |||||
Income (loss) before income taxes attributable to The Andersons, Inc. | $ | 18,878 | $ | 24,723 | |||
23
Operating results attributable to the Company for the Ethanol Group declined $5.8 million from full year 2016 results. Sales and merchandising revenues increased $163.5 million. This was driven by a 39% increase in ethanol gallons sold, a portion of which is attributable to the Albion plant expansion. Cost of sales and merchandising revenues increased $164.0 million due to an increase in input cost and lower DDG values. Despite higher volumes, higher input costs caused gross profit to decrease $0.4 million.
Operating, administrative and general expenses increased $2.0 million compared to the same period in 2016, primarily as a result of the write-off of a potential capital project. Equity in earnings of affiliates decreased $6.3 million due to lower results from the unconsolidated ethanol LLCs. These results were primarily driven by low ethanol and DDG margins. The decrease is also driven by our merging TAEI with and into TAME in the first quarter. Prior to this transaction, the noncontrolling interest in TAEI was attributed 33% of the gains and losses of TAME recorded by the Company in its equity in earnings of affiliates. With a 33% direct ownership in TAME now, our share of gains and losses recorded in equity in earnings of affiliates will decrease, with a correlated decrease in income attributable to noncontrolling interests.
Plant Nutrient Group
Year ended December 31, | |||||||
(in thousands) | 2017 | 2016 | |||||
Sales and merchandising revenues | $ | 651,824 | $ | 725,176 | |||
Cost of sales and merchandising revenues | 547,179 | 603,045 | |||||
Gross profit | 104,645 | 122,131 | |||||
Operating, administrative and general expenses | 89,357 | 102,892 | |||||
Asset impairment | — | 2,331 | |||||
Goodwill impairment | 59,081 | — | |||||
Interest expense | 6,420 | 6,448 | |||||
Other income, net | 5,092 | 3,716 | |||||
Income (loss) before income taxes attributable to The Andersons, Inc. | $ | (45,121 | ) | $ | 14,176 | ||
Operating results for the Plant Nutrient Group declined $59.3 million compared to full year 2016 results. Sales and merchandising revenues decreased $73.4 million. Approximately 64% of the decrease is due to a 30% decrease in farm center tons sold as a result of the sales of our farm center locations in Florida in the first quarter of 2017 and Iowa in the first quarter of 2016 and a 6% decrease in average sales prices for all locations. A 6% decrease in average sale prices in the wholesale business accounts for the majority of the remaining decrease. Cost of sales and merchandising revenues decreased $55.9 million, for the same reasons. As such, gross profit decreased by $17.5 million. Margins remain tight due to competitive pressures, excess nutrient supply in the wholesale and farm center businesses, and lower crop prices.
Operating, administrative, and general expenses decreased $13.5 million from the prior year. The largest driver was a $8.1 million decrease in labor and benefits, much of it relating to the sale of farm center locations in Florida in the first quarter of 2017 and the sale of the farm center locations in Iowa in the first quarter of 2016. Smaller reductions were also realized in a number of other categories as part of our overall cost control efforts. The group recognized goodwill impairment charges of $59.1 million after experiencing several periods of compressed margins and lower sales volumes, as well as anticipated unfavorable operating conditions in the nutrient market for some time. The group recognized a $2.3 million asset impairment in 2016 associated with the closure of a cob facility.
Other income increased $1.4 million primarily as a result of a $4.7 million gain on the sale of farm center locations in Florida in the first quarter of 2017. This increase was partially offset by a $1.8 million legal settlement, net of insurance recoveries, in the third quarter of 2017.
24
Rail Group
Year ended December 31, | |||||||
(in thousands) | 2017 | 2016 | |||||
Sales and merchandising revenues | $ | 172,123 | $ | 163,658 | |||
Cost of sales and merchandising revenues | 119,664 | 107,729 | |||||
Gross profit | 52,459 | 55,929 | |||||
Operating, administrative and general expenses | 23,270 | 18,971 | |||||
Asset impairment | — | 287 | |||||
Interest expense | 7,023 | 6,461 | |||||
Other income, net | 2,632 | 2,218 | |||||
Income (loss) before income taxes attributable to The Andersons, Inc. | $ | 24,798 | $ | 32,428 | |||
Operating results for the Rail Group declined $7.6 million compared to the full year 2016 results. Sales and merchandising revenues increased $8.5 million. Revenue from car sales increased by $11.0 million due to a higher volume of car sales and repair and other revenue increased $2.0 million as a result of revenue generated by new shops. These increases were partially offset by a $4.5 million decrease in leasing revenues due to average utilization of 85.0% in the current year and 87.8% in the prior year, as well as a 2% decrease in lease rates compared to the prior year. Cost of sales and merchandising revenues increased $11.9 million due to an $11.0 million increases in car sales and $0.8 million related to leasing costs. As a result of these factors, Rail gross profit decreased $3.5 million compared to the prior year.
Operating expenses increased by $4.3 million, largely due to higher labor and benefit costs from opening new repair shops. Interest expense increased due to higher rates and more debt resulting from purchases in 2017.
Retail Group
Year ended December 31, | |||||||
(in thousands) | 2017 | 2016 | |||||
Sales and merchandising revenues | $ | 47,871 | $ | 134,229 | |||
Cost of sales and merchandising revenues | 37,421 | 95,169 | |||||
Gross profit | 10,450 | 39,060 | |||||
Operating, administrative and general expenses | 28,119 | 41,430 | |||||
Asset impairment | — | 6,489 | |||||
Interest expense | 324 | 496 | |||||
Other income, net | 10,684 | 507 | |||||
Income (loss) before income taxes attributable to The Andersons, Inc. | $ | (7,309 | ) | $ | (8,848 | ) | |
Operating results for the Retail Group improved $1.5 million compared to the prior year. Sales and merchandising revenues decreased $86.4 million while cost of sales and merchandising revenues decreased $57.7 million. These decreases were due to lower volumes as a result of the closure of the retail business during the second quarter of 2017. Additionally, inventory liquidation markdowns caused a significant decrease in margins leading to a $28.6 million decrease in gross profit.
Operating, administrative and general expenses decreased by $13.3 million as a result of the mid-year closure. This decrease was partially offset by one time exit charges of $11.5 million, most of which was for severance costs. Other income increased $10.2 million primarily from gains on the sale of three store properties and fixtures.
25
Other
Year ended December 31, | |||||||
(in thousands) | 2017 | 2016 | |||||
Sales and merchandising revenues | $ | — | $ | — | |||
Cost of sales and merchandising revenues | — | — | |||||
Gross profit | — | — | |||||
Operating, administrative and general expenses | 26,490 | 31,384 | |||||
Interest expense (income) | (453 | ) | (276 | ) | |||
Other income, net | 1,324 | 2,785 | |||||
Income (loss) before income taxes attributable to The Andersons, Inc. | $ | (24,713 | ) | $ | (28,323 | ) | |
The Other operating loss not allocated to business segments decreased $3.6 million compared to the prior year primarily due to a reduction in IT costs and higher severance costs in the prior year.
Income Taxes
Income tax benefit of $63.1 million was provided at 307.6%. In 2016, income tax expense of $6.9 million was provided at 32.3%. The higher effective tax rate in 2017 relative to the loss before income taxes was due primarily to the US enacted Tax Cuts and Jobs Act, also commonly referred to as “US tax reform” and non-deductible goodwill impairment charges.
26
Comparison of 2016 with 2015
Grain Group
Year ended December 31, | |||||||
(in thousands) | 2016 | 2015 | |||||
Sales and merchandising revenues | $ | 2,357,171 | $ | 2,483,643 | |||
Cost of sales and merchandising revenues | 2,249,089 | 2,359,998 | |||||
Gross profit | 108,082 | 123,645 | |||||
Operating, administrative and general expenses | 112,507 | 121,833 | |||||
Goodwill impairment | — | 46,422 | |||||
Interest expense | 7,955 | 5,778 | |||||
Equity in earnings of affiliates | (8,746 | ) | 14,703 | ||||
Other income, net | 5,472 | 26,229 | |||||
Income (loss) before income taxes | (15,654 | ) | (9,456 | ) | |||
Loss attributable to noncontrolling interests | (3 | ) | (10 | ) | |||
Income (loss) before income taxes attributable to The Andersons, Inc. | $ | (15,651 | ) | $ | (9,446 | ) | |
Operating results for the Grain Group decreased $6.2 million compared to full year 2015 results. Sales and merchandising revenues decreased $126.5 million compared to 2015. This was partially offset by a decrease of cost of sales and merchandising revenues of $110.9 million for a net unfavorable gross profit impact of approximately $15.6 million. The decrease was driven by $6.0 million in gross profit reduction from the 2016 sale of underperforming assets in Iowa as well as $4.4 million of decrease in margins on sale of grain. We also saw a significant decline in opportunities for basis appreciation compared to 2015 for a negative gross profit variance of $14.2 million compared to the prior year. This was caused by a poor harvest causing elevated basis levels in the fourth quarter of 2015. These items were partially offset by $4.5 million of increased income from blending operations, $3.9 million of increased earnings on risk management fees, and a $1.7 million favorable variance on trading income.
Operating, administrative and general expenses were $9.3 million lower than in 2015. The decrease was primarily due to $8.2 million in reduced costs from the sale of Iowa facilities with cost reductions in labor and benefits at remaining facilities accounting for an additional $1.7 million. The decreases were offset by $2.7 million of additional allocation charges, including amortization and support costs for the company's new Enterprise Resource Planning system.
The Grain Group recognized a goodwill impairment charge of $46.4 million in 2015 driven by compressed margins over the past several years and anticipated unfavorable operating conditions in domestic and global commodity markets, including oil and ethanol, as well as foreign currency exchange impacts.
Equity in earnings of affiliates decreased $23.4 million due to the reduced operating results of LTG and Thompsons Limited. The declines were largely driven by reduced performance at LTG caused by historically soft margins at grain handling facilities. Also included in our equity results is a charge of $1.5 million (our proportional share) related to an LTG debt refinancing completed in the fourth quarter of 2016. This refinancing should result in lower relative interest charges in future years.
Other income decreased $20.3 million, which is attributable to a prior year gain of $23.1 million from equity ownership transactions in LTG which reduced our ownership from 39 percent to 31 percent.
27
Ethanol Group
Year ended December 31, | |||||||
(in thousands) | 2016 | 2015 | |||||
Sales and merchandising revenues | $ | 544,556 | $ | 556,188 | |||
Cost of sales and merchandising revenues | 524,252 | 531,864 | |||||
Gross profit | 20,304 | 24,324 | |||||
Operating, administrative and general expenses | 11,211 | 11,594 | |||||
Interest expense | 35 | 70 | |||||
Equity in earnings of affiliates | 18,467 | 17,221 | |||||
Other income, net | 77 | 377 | |||||
Income (loss) before income taxes | 27,602 | 30,258 | |||||
Income attributable to noncontrolling interests | 2,879 | 1,755 | |||||
Income (loss) before income taxes attributable to The Andersons, Inc. | $ | 24,723 | $ | 28,503 | |||
Operating results for the Ethanol Group decreased $3.8 million from full year 2015 results. Sales and merchandising revenues decreased $11.6 million which was partially offset by a decrease in cost of sales and merchandising revenues of $7.6 million for a net gross profit impact of $4.0 million. The decline in revenues and associated cost of sales is largely driven by a three percent decline in average ethanol sales price and a fifteen percent decline in average DDG sales price compared to the prior year. While corn and natural gas costs declined during 2016, we also saw a nine percent decrease in DDG sales prices realized relative to the value of the corn feedstock. Marketing fees received from our joint venture due to a renegotiated operating agreement.
Equity in earnings of affiliates increased $1.2 million from 2015 and represents an increase in income from investments in three unconsolidated ethanol LLCs. Throughout 2016, the ethanol facilities' productivity and output remained strong, and the increase in earnings is primarily attributable to modest increases in average margins compared to the prior year.
Plant Nutrient Group
Year ended December 31, | |||||||
(in thousands) | 2016 | 2015 | |||||
Sales and merchandising revenues | $ | 725,176 | $ | 848,338 | |||
Cost of sales and merchandising revenues | 603,045 | 728,798 | |||||
Gross profit | 122,131 | 119,540 | |||||
Operating, administrative and general expenses | 102,892 | 105,478 | |||||
Asset impairment | 2,331 | — | |||||
Goodwill impairment | — | 9,744 | |||||
Interest expense | 6,448 | 7,243 | |||||
Other income, net | 3,716 | 3,046 | |||||
Income (loss) before income taxes attributable to The Andersons, Inc. | $ | 14,176 | $ | 121 | |||
Operating results for the Plant Nutrient Group increased $14.1 million compared to full year 2015 results. Sales and merchandising revenues decreased $123 million primarily due to lower base nutrient prices throughout the year. Volumes were up two percent, however the impact on revenues from that increase was minimal. Cost of sales and merchandising revenues decreased $126 million, in line with the decline in revenues. Margins did improve modestly due to the impact of 2015 Kay Flo inventory being stepped up to fair value at acquisition causing margin compression in the second half of 2015. Total gross profit increased by $2.8 million.
Operating, administrative, and general expenses decreased $2.6 million from 2015. This included a reduction in labor and benefits of $3.4 million and maintenance reductions of $1.2 million. Smaller reductions were realized in a number of other categories as part of our overall cost control efforts. These items were partially offset by a $3.4 million increase in depreciation and amortization, largely due to the full-year impact of the Kay Flo acquisition. The prior year included goodwill impairment charges of $9.7 million for our Farm Center and Cob businesses due to reduced volumes over the past several years while the current year included $2.3 million of asset impairments associated with the closure of a cob processing facility.
28
Rail Group
Year ended December 31, | |||||||
(in thousands) | 2016 | 2015 | |||||
Sales and merchandising revenues | $ | 163,658 | $ | 170,848 | |||
Cost of sales and merchandising revenues | 107,729 | 103,161 | |||||
Gross profit | 55,929 | 67,687 | |||||
Operating, administrative and general expenses | 18,971 | 25,650 | |||||
Asset impairment | 287 | 285 | |||||
Interest expense | 6,461 | 7,006 | |||||
Other income, net | 2,218 | 15,935 | |||||
Income (loss) before income taxes attributable to The Andersons, Inc. | $ | 32,428 | $ | 50,681 | |||
Operating results for the Rail Group decreased $18.3 million compared to the full year 2015 results. Sales and merchandising revenues decreased $7.2 million. The decrease was driven by a five percentage point decrease in average lease utilization rates during the year as well as a reduction in car sales compared to 2015. Cost of sales and merchandising revenues increased $4.6 million due to higher storage costs associated with our reduced utilization rates as well as a periodic revision to our repair overhead rates which increased the amount of cost absorption. As a result of these factors, Rail gross profit declined $11.8 million compared to 2015.
Operating expenses decreased by $6.7 million, largely due to the impact of higher overhead rates noted above. Other income decreased $13.7 million, primarily due to higher than normal lease settlement activity in 2015.
Retail Group
Year ended December 31, | |||||||
(in thousands) | 2016 | 2015 | |||||
Sales and merchandising revenues | $ | 134,229 | $ | 139,478 | |||
Cost of sales and merchandising revenues | 95,169 | 98,836 | |||||
Gross profit | 39,060 | 40,642 | |||||
Operating, administrative and general expenses | 41,430 | 41,298 | |||||
Asset impairment | 6,489 | — | |||||
Interest expense | 496 | 356 | |||||
Other income, net | 507 | 557 | |||||
Income (loss) before income taxes attributable to The Andersons, Inc. | $ | (8,848 | ) | $ | (455 | ) | |
Operating results for the Retail Group declined $8.4 million compared to 2015. The largest contributors to this decline were a $6.5 million impairment of long-lived assets as well as approximately $0.7 million of incremental cost associated with closing the segment's specialty food store in the fourth quarter of 2016. Customer count declined 4 percent compared 2015.
Other
Year ended December 31, | |||||||
(in thousands) | 2016 | 2015 | |||||
Sales and merchandising revenues | $ | — | $ | — | |||
Cost of sales and merchandising revenues | — | — | |||||
Gross profit | — | — | |||||
Operating, administrative and general expenses | 31,384 | 31,976 | |||||
Pension settlement | — | 51,446 | |||||
Interest income | (276 | ) | (381 | ) | |||
Other income, net | 2,785 | 328 | |||||
Income (loss) before income taxes attributable to The Andersons, Inc. | $ | (28,323 | ) | $ | (82,713 | ) | |
29
The net corporate operating loss (costs not allocated back to the business units) decreased $54.4 million to a loss of $28.3 million for 2016. The most significant decrease was due to the prior year $51.4 million settlement charge for the termination of the defined benefit pension plan.
Income Taxes
Income tax expense of $6.9 million was provided at 32.3%. In 2015, an income tax benefit of $0.2 million was provided at 2.1%. The lower effective tax rate in 2015 relative to the loss before income taxes was due primarily to a goodwill write-off that did not provide a corresponding tax benefit
Liquidity and Capital Resources
Working Capital
At December 31, 2017, the Company had working capital of $260.5 million, an increase of $2.1 million from the prior year. This increase was attributable to changes in the following components of current assets and current liabilities:
(in thousands) | December 31, 2017 | December 31, 2016 | Variance | ||||||||
Current Assets: | |||||||||||
Cash and cash equivalents | $ | 34,919 | $ | 62,630 | $ | (27,711 | ) | ||||
Restricted cash | — | 471 | (471 | ) | |||||||
Accounts receivables, net | 183,238 | 194,698 | (11,460 | ) | |||||||
Inventories | 648,703 | 682,747 | (34,044 | ) | |||||||
Commodity derivative assets – current | 30,702 | 45,447 | (14,745 | ) | |||||||
Other current assets | 63,790 | 72,133 | (8,343 | ) | |||||||
Assets held for sale | 37,859 | — | 37,859 | ||||||||
Total current assets | 999,211 | 1,058,126 | (58,915 | ) | |||||||
Current Liabilities: | |||||||||||
Short-term debt | 22,000 | 29,000 | (7,000 | ) | |||||||
Trade and other payables | 503,571 | 581,826 | (78,255 | ) | |||||||
Customer prepayments and deferred revenue | 59,710 | 48,590 | 11,120 | ||||||||
Commodity derivative liabilities – current | 29,651 | 23,167 | 6,484 | ||||||||
Accrued expenses and other current liabilities | 69,579 | 69,648 | (69 | ) | |||||||
Current maturities of long-term debt | 54,205 | 47,545 | 6,660 | ||||||||
Total current liabilities | 738,716 | 799,776 | (61,060 | ) | |||||||
Working capital | $ | 260,495 | $ | 258,350 | $ | 2,145 | |||||
In comparison to the prior year, current assets decreased primarily due to a decrease in cash, accounts receivable, inventory, commodity derivative assets, and other current assets. Accounts receivable decreased due to a decrease in Grain receivables as a result of lower sales and shipment activity. Inventory decreased for several reasons including the closure of the retail stores, an intentional reduction of inventory levels in the wholesale business, plus good sales volume immediately prior to year-end, and $11.4 million of grain inventory was moved to assets held for sale. Other current assets decreased primarily due to a decrease in the number of rail cars classified as a current asset. Assets held for sale increased as Retail assets, certain Grain assets, and a Plant Nutrient administrative office were moved to Assets held for sale. Current commodity derivative assets and liabilities, which reflect the customer net asset or liability based on the value of forward contracts as compared to market prices at the end of the period, have decreased. See the discussion below on additional sources and uses of cash for an understanding of the decrease in cash from prior year.
Current liabilities decreased primarily as a result of lower payables due to a significant decrease in hold pay amounts within the Grain businesses as well as a decrease in Accounts Payable related to the closed Retail business. This decrease was partially offset by an increase in customer prepayments and deferred revenue due to an increase in Grain sales that have been prepaid in December but not yet delivered.
30
Sources and Uses of Cash 2017 compared to 2016
Operating Activities and Liquidity
Our operating activities provided cash of $75.3 million in 2017 compared to cash provided by operations of $39.6 million in 2016. The increase in cash provided was due to several factors. Net income excluding the non-cash impact of impairments, gains on sale of assets and deferred tax change increased by $6.0 million compared to the prior year and the impact of operating asset and liability fluctuations resulted in a $50.0 million increase in operating cash flows. This was partially offset by a $25.3 million decrease due to improved operating results at our equity affiliates which were not fully distributed in the form of cash, as well as other individually small fluctuations in operating activities.
Net income tax refunds of $2.1 million and $10.6 million were received in 2017 and 2016, respectively. The Company makes quarterly estimated tax payments based on year to date annualized taxable income. The net refunds received in 2016 are primarily due to a $12.0 million refund of overpaid 2015 Federal income taxes.
Investing Activities
Investing activities used $113.5 million in 2017 compared to $28.2 million used in 2016. Purchases of Rail Group assets increased to $143.0 million in the current year compared to $85.3 million in 2016. This increase was partially offset by proceeds from the sale of Rail Group assets which were $36.9 million in 2017 and $56.7 million in 2016. As such, net spend on Rail assets increased $77.5 million compared to the prior year. Property, plant, and equipment and capitalized software decreased $43.1 million compared to the same period in 2016 with the largest decrease related to the corporate headquarter spend in the prior year. Capital spending for 2017 on property, plant and equipment includes: Grain - $10.9 million; Ethanol - $3.7 million; Plant Nutrient - $10.7 million; Rail - $3.5 million; and $5.8 million in corporate / enterprise resource planning project spending. Proceeds from the sale of assets decreased $36.0 million.
We expect to spend approximately $65 million in 2018 on conventional property, plant and equipment which includes estimated 2018 capital spending for the continuing project to replace current technology with an enterprise resource planning system. An additional $145 million is estimated to be spent on the purchase and capitalized modifications of railcars and barges with related sales or financings of approximately $120 million.
Financing Arrangements
Net cash provided by financing activities was $10.5 million in 2017, compared to $12.5 million used in 2016. The change in financing activity is primarily the result of a decrease in the pay down of long term debt compared to 2016 which was partially offset by an increase in cash being paid to reduce short term borrowings.
We have significant amounts of committed short-term lines of credit available to finance working capital, primarily inventories, margin calls on commodity contracts and accounts receivable. We are party to a borrowing arrangement with a syndicate of banks that provides a total of $815.0 million in borrowing capacity, including $15.0 million in non-recourse debt of The Andersons Denison Ethanol LLC. Of that total, we had $660.5 million remaining available for borrowing at December 31, 2017. Peak short-term borrowings were $367.0 million on February 15, 2017. Typically, the Company's highest borrowing occurs in the first half of the year due to seasonal inventory requirements in the fertilizer businesses.
We paid $18.2 million in dividends in 2017 compared to $17.4 million in 2016. We paid $0.16 per common share for the dividends paid in January, April, July and October 2017, and $0.155 per common share for the dividends paid in January, April, July and October 2016. On December 20, 2017, we declared a cash dividend of $0.165 per common share, payable on January 23, 2018 to shareholders of record on January 2, 2018.
Certain of our long-term borrowings include covenants that, among other things, impose minimum levels of equity and limitations on additional debt. We are in compliance with all such covenants as of December 31, 2017. In addition, certain of our long-term borrowings are collateralized by first mortgages on various facilities or are collateralized by railcar assets. Our non-recourse long-term debt is collateralized by ethanol plant assets.
Because we are a significant consumer of short-term debt in peak seasons and the majority of this is variable rate debt, increases in interest rates could have a significant impact on our profitability. In addition, periods of high grain prices and / or unfavorable market conditions could require us to make additional margin deposits on our exchange traded futures contracts. Conversely, in periods of declining prices, we receive a return of cash.
31
We believe our sources of liquidity will be adequate to fund our operations, capital expenditures and payments of dividends in the foreseeable future.
Sources and Uses of Cash 2016 compared to 2015
Operating Activities and Liquidity
Our operating activities provided cash of $39.6 million in 2016 compared to cash provided by operations of $154.1 million in 2015. The significant change in operating cash flows in 2016 relates primarily to the changes in working capital, particularly accounts receivable and accounts payable as discussed above, which were partly offset by reduced inventory balances. Additionally, while net income has improved compared to the prior year, our operating cash flows are down since the loss incurred in the prior year included significant non-cash charges related to goodwill impairment and the settlement of our defined benefit pension plan.
In 2016, the Company received refunds, net of taxes paid, of $10.6 million, compared to $4.9 million of taxes paid, net of refunds received, in 2015. The Company makes quarterly estimated tax payments based on year to date annualized taxable income. The net refunds received in 2016 are primarily due to a $12.0 million refund of overpaid 2015 Federal income taxes.
Investing Activities
Investing activities used $28.2 million in 2016 compared to $238.5 million used in 2015. The decrease in cash used for investing activities is primarily driven by the 2015 acquisition of Kay Flo Industries, Inc. for $128.5 million. In addition, a portion of 2016 spending relates to purchases of Rail Group assets in the amount of $85.3 million, which is lower than the prior year. These purchases of Rail Group assets were partially offset in the current year by proceeds from the sale of Rail Group assets in the amount of $56.7 million, however net spend on Rail assets is still down from the prior year. The current year results include cash received of $15.0 million primarily from the redemption of our investment in IANR as well as proceeds from the sale of facilities in Iowa totaling $54.3 million which reduce our net outflow from investing activities. Capital spending for 2016 on property, plant and equipment includes: Grain - $21.4 million; Ethanol - $2.3 million; Plant Nutrient - $15.2 million; Rail - $4.3 million; Retail - $0.4 million and $34.1 million in corporate / enterprise resource planning project spending.
Financing Arrangements
Net cash used in financing activities was $12.5 million in 2016, compared to $33.4 million provided in 2015. The change in financing activity is primarily the result of significant debt issuance in the prior year to fund the Kay Flo acquisition which was partly offset by the 2015 completion of our $50 million share repurchase program.
We have significant amounts of committed short-term lines of credit available to finance working capital, primarily inventories, margin calls on commodity contracts and accounts receivable. We are party to a borrowing arrangement with a syndicate of banks that provides a total of $871.3 million in borrowing capacity, including $21.3 million in non-recourse debt of The Andersons Denison Ethanol LLC. Of that total, we had $779.6 million remaining available for borrowing at December 31, 2016. Peak short-term borrowings were $412.0 million on January 6, 2016. Typically, the Company's highest borrowing occurs in the first half of the year due to seasonal inventory requirements in the fertilizer and retail businesses.
We paid $17.4 million in dividends in 2016 compared to $15.9 million in 2015. We paid $0.155 per common share for the dividends paid in January, April, July and October 2016, and $0.14 per common share for the dividends paid in January, April, July and October 2015. On December 16, 2016, we declared a cash dividend of $0.16 per common share, payable on January 24, 2017 to shareholders of record on January 3, 2017.
Certain of our long-term borrowings include covenants that, among other things, impose minimum levels of equity and limitations on additional debt. We were in compliance with all such covenants as of December 31, 2016. In addition, certain of our long-term borrowings are collateralized by first mortgages on various facilities or are collateralized by railcar assets. Our non-recourse long-term debt is collateralized by ethanol plant assets.
32
Contractual Obligations
Future payments due under contractual obligations at December 31, 2017 are as follows:
Payments Due by Period | |||||||||||||||||||
(in thousands) | Less than 1 year | 1-3 years | 3-5 years | After 5 years | Total | ||||||||||||||
Long-term debt | $ | 54,336 | $ | 32,400 | $ | 186,295 | $ | 202,357 | $ | 475,388 | |||||||||
Interest obligations (a) | 17,632 | 32,219 | 24,840 | 46,623 | 121,314 | ||||||||||||||
Operating leases (b) | 24,031 | 30,507 | 17,764 | 13,268 | 85,570 | ||||||||||||||
Purchase commitments (c) | 758,966 | 59,370 | — | — | 818,336 | ||||||||||||||
Other long-term liabilities (d) | 2,445 | 4,983 | 5,102 | 16,542 | 29,072 | ||||||||||||||
Total contractual cash obligations | $ | 857,410 | $ | 159,479 | $ | 234,001 | $ | 278,790 | $ | 1,529,680 | |||||||||
(a) Future interest obligations are calculated based on interest rates in effect as of December 31, 2017 for the Company's variable rate debt and do not include any assumptions on expected borrowings, if any, under the short-term line of credit.
(b) Approximately 48% of the operating lease commitments above relate to Rail Group assets that the Company leases from financial intermediaries. See “Off-Balance Sheet Transactions” below.
(c) Includes the amounts related to purchase obligations in the Company's operating units, including $588 million for the purchase of grain from producers and $160 million for the purchase of ethanol from the ethanol joint ventures. There are also forward grain and ethanol sales contracts to consumers and traders and the net of these forward contracts are offset by exchange-traded futures and options contracts or over-the-counter contracts. See the narrative description of businesses for the Grain and Ethanol Groups in Item 1 of this Annual Report on Form 10-K for further discussion.
(d) Other long-term liabilities include estimated obligations under our retiree healthcare programs and principal and interest payments for the financing arrangement on our headquarters. Obligations under the retiree healthcare programs are not fixed commitments and will vary depending on various factors, including the level of participant utilization and inflation. Our estimates of postretirement payments through 2021 have considered recent payment trends and actuarial assumptions.
At December 31, 2017, we had standby letters of credit outstanding of $32.5 million.
Off-Balance Sheet Transactions
Our Rail Group utilizes leasing arrangements that provide off-balance sheet financing for its activities. We lease assets from financial intermediaries through sale-leaseback transactions, the majority of which involve operating leases. Rail Group assets we own or lease from a financial intermediary are generally leased to a customer under an operating lease. We also arrange non-recourse lease transactions under which we sell assets to a financial intermediary, and assign the related operating lease to the financial intermediary on a non-recourse basis. In such arrangements, we generally provide ongoing maintenance and management services for the financial intermediary, and receive a fee for such services. On most of the assets, we hold an option to purchase the assets at the end of the lease.
The following table describes our Rail Group asset positions at December 31, 2017.
Method of Control | Financial Statement | Units | ||
Owned - railcars available for sale | On balance sheet – current | 533 | ||
Owned - railcar assets leased to others | On balance sheet – non-current | 17,025 | ||
Railcars leased from financial intermediaries | Off balance sheet | 3,375 | ||
Railcars in non-recourse arrangements | Off balance sheet | 2,556 | ||
Total Railcars | 23,489 | |||
Locomotive assets leased to others | On balance sheet – non-current | 32 | ||
Locomotive leased from financial intermediaries | Off balance sheet | 4 | ||
Total Locomotive Assets | 36 | |||
Barge assets leased to others | On balance sheet – non-current | — | ||
Barge assets leased from financial intermediaries | Off balance sheet | 65 | ||
Total Barges | 65 | |||
In addition, we manage approximately 514 railcars for third-party customers or owners for which we receive a fee.
We have future lease payment commitments aggregating $40.7 million for the Rail Group assets we lease from financial intermediaries under various operating leases. Remaining lease terms vary with none exceeding fifteen years. Where
33
appropriate, we utilize non-recourse arrangements in order to minimize credit risk. Refer to Note 14 to the Company's Consolidated Financial Statements in Item 8 for more information on our leasing activities.
Critical Accounting Estimates
The process of preparing financial statements requires management to make estimates and assumptions that affect the reported amounts of assets, liabilities, revenues and expenses, and the disclosure of contingent assets and liabilities. Management evaluates these estimates and assumptions on an ongoing basis. Estimates and assumptions are based on historical experience and management's knowledge and understanding of current facts and circumstances. Actual results, under conditions and circumstances different from those assumed, may change from these estimates.
Certain of our accounting estimates are considered critical, as they are important to the depiction of the Company's financial statements and / or require significant or complex judgment by management. There are other items within our financial statements that require estimation, however, they are not deemed critical as defined above. Note 1 to the Consolidated Financial Statements in Item 8 describes our significant accounting policies which should be read in conjunction with our critical accounting estimates.
Management believes that the accounting for grain inventories and commodity derivative contracts, including adjustments for counterparty risk, and impairment of long-lived assets, goodwill and equity method investments involve significant estimates and assumptions in the preparation of the Consolidated Financial Statements.
Grain Inventories and Commodity Derivative Contracts
Grain inventories are stated at their net realizable value, which approximates estimated selling prices in the ordinary course of business, less reasonably predictable costs of completion, disposal, and transportation. The Company marks to market all forward purchase and sale contracts for grain and ethanol, over-the-counter grain and ethanol contracts, and exchange-traded futures and options contracts. The overall market for grain inventories is very liquid and active; market value is determined by reference to prices for identical commodities on the CME (adjusted primarily for transportation costs); and the Company's grain inventories may be sold without significant additional processing. The Company uses forward purchase and sale contracts and both exchange traded and over-the-counter contracts (such as derivatives generally used by the International Swap Dealers Association). Management estimates fair value based on exchange-quoted prices, adjusted for differences in local markets, as well as counter-party non-performance risk in the case of forward and over-the-counter contracts. The amount of risk, and therefore the impact to the fair value of the contracts, varies by type of contract and type of counter-party. With the exception of specific customers thought to be at higher risk, the Company looks at the contracts in total, segregated by contract type, in its quarterly assessment of non-performance risk. For those customers that are thought to be at higher risk, the Company makes assumptions as to performance based on past history and facts about the current situation. Changes in fair value are recorded as a component of cost of sales and merchandising revenues in the statement of operations.
Impairment of Long-Lived Assets, Goodwill, and Equity Method Investments
The Company's business segments are each highly capital intensive and require significant investment. Fixed assets are tested for impairment whenever events or changes in circumstances indicate that the carrying amount of the assets may not be recoverable. This is done by evaluating the recoverability based on undiscounted projected cash flows, excluding interest. If an asset group is considered impaired, the impairment loss to be recognized is measured as the amount by which the asset group's carrying amount exceeds its fair value.
We also annually review the balance of goodwill for impairment in the fourth quarter, using quantitative analyses. Goodwill is tested for impairment at the reporting unit level, which is the operating segment or one level below the operating segment. The quantitative review for impairment takes into account our estimates of future cash flows. Our estimates of future cash flows are based upon a number of assumptions including lease rates, lease terms, operating costs, life of the assets, potential disposition proceeds, budgets and long-range plans. These factors are discussed in more detail in Note 4, Goodwill and Intangible Assets.
In addition, the Company holds investments in several companies that are accounted for using the equity method of accounting. The Company reviews its investments to determine whether there has been a decline in the estimated fair value of the investment that is below the Company's carrying value which is other than temporary. Other than consideration of past and current performance, these reviews take into account forecasted earnings which are based on management's estimates of future performance.
34
Item 7a. Quantitative and Qualitative Disclosures about Market Risk
The market risk inherent in the Company's market risk-sensitive instruments and positions is the potential loss arising from adverse changes in commodity prices and interest rates as discussed below.
Commodity Prices
The Company's daily net commodity position consists of inventories, related purchase and sale contracts, exchange-traded futures, and over-the-counter contracts. The fair value of the position is a summation of the fair values calculated for each commodity by valuing each net position at quoted futures market prices. The Company has established controls to manage and limit risk exposure, which consists of daily review of position limits and effects of potential market price moves on those positions.
A sensitivity analysis has been prepared to estimate the Company's exposure to market risk of its net commodity position. Market risk is estimated as the potential loss in fair value resulting from a hypothetical 10% adverse change in quoted market prices. The result of this analysis, which may differ from actual results, is as follows:
December 31, | |||||||
(in thousands) | 2017 | 2016 | |||||
Net commodity position | $ | (1,224 | ) | $ | (2,166 | ) | |
Market risk | (122 | ) | (217 | ) | |||
Interest Rates
The fair value of the Company's long-term debt is estimated using quoted market prices or discounted future cash flows based on the Company's current incremental borrowing rates and credit ratings for similar types of borrowing arrangements. Market risk, which is estimated as the potential increase in fair value resulting from a hypothetical one-half percent decrease in interest rates, is summarized below:
December 31, | |||||||
(in thousands) | 2017 | 2016 | |||||
Fair value of long-term debt, including current maturities | $ | 474,769 | $ | 450,940 | |||
Fair value in excess of carrying value | 1,451 | 3,116 | |||||
Market risk | 7,643 | 8,833 | |||||
Actual results may differ. The estimated fair value and market risk will vary from year to year depending on the total amount of long-term debt and the mix of variable and fixed rate debt.
35
Item 8. Financial Statements and Supplementary Data
The Andersons, Inc.
Index to Financial Statements
Report of Independent Registered Public Accounting Firms - Deloitte & Touche LLP / KPMG LLP / PricewaterhouseCoopers LLP - Canada / Crowe Chizek LLP | |
Consolidated Balance Sheets | |
Consolidated Statements of Operations | |
Consolidated Statements of Comprehensive Income | |
Consolidated Statements of Cash Flows | |
Consolidated Statements of Equity | |
Notes to Consolidated Financial Statements | |
Schedule II - Consolidated Valuation and Qualifying Accounts | |
36
Report of Independent Registered Public Accounting Firm
To the Shareholders and the Board of Directors of
The Andersons, Inc.
Opinion on the Financial Statements
We have audited the accompanying consolidated balance sheets of The Andersons, Inc. and subsidiaries (the "Company") as of December 31, 2017 and 2016, the related consolidated statements of operations, comprehensive income, equity, and cash flows, for each of the three years in the period ended December 31, 2017, and the related notes and the schedule listed in the Index at Item 15 (collectively referred to as the "financial statements"). In our opinion, based on our audits and the reports of the other auditors, the financial statements present fairly, in all material respects, the financial position of the Company as of December 31, 2017 and 2016, and the results of its operations and its cash flows for each of the three years in the period ended December 31, 2017, in conformity with accounting principles generally accepted in the United States of America.
We did not audit the financial statements of Lansing Trade Group, LLC as of and for the years ended December 31, 2017, 2016, and 2015, or Lux JV Treasury Holding Company S.à r.l. as of and for the years ended December 31, 2017 and 2016, the Company’s investments in which are accounted for by use of the equity method. The accompanying financial statements of the Company include its equity investment in Lansing Trade Group, LLC of $93 million and $89 million and Lux JV Treasury Holding Company S.à r.l. of $47 million and $46 million as of December 31, 2017 and 2016, respectively, and its equity in earnings (losses) in Lansing Trade Group, LLC of $4 million, ($9.9) million and $12 million for the years ended December 31, 2017, 2016, and 2015, respectively, and Lux JV Treasury Holding Company S.à r.l. of $.5 million and $1.2 million for the years ended December 31, 2017 and 2016, respectively. Those statements were audited by other auditors whose reports have been furnished to us, and our opinion, insofar as it relates to the amounts included for Lansing Trade Group, LLC and Lux JV Treasury Holding Company S.à r.l., is based solely on the reports of the other auditors.
We have also audited, in accordance with the standards of the Public Company Accounting Oversight Board (United States) (PCAOB), the Company's internal control over financial reporting as of December 31, 2017, based on the criteria established in Internal Control - Integrated Framework (2013) issued by the Committee of Sponsoring Organizations of the Treadway Commission and our report dated February 26, 2018, expressed an unqualified opinion on the Company's internal control over financial reporting based on our audit.
Basis for Opinion
These financial statements are the responsibility of the Company's management. Our responsibility is to express an opinion on the Company's financial statements based on our audits. We are a public accounting firm registered with the PCAOB and are required to be independent with respect to the Company in accordance with the U.S. federal securities laws and the applicable rules and regulations of the Securities and Exchange Commission and the PCAOB.
We conducted our audits in accordance with the standards of the PCAOB. Those standards require that we plan and perform the audit to obtain reasonable assurance about whether the financial statements are free of material misstatement, whether due to error or fraud. Our audits included performing procedures to assess the risks of material misstatement of the financial statements, whether due to error or fraud, and performing procedures that respond to those risks. Such procedures included examining, on a test basis, evidence regarding the amounts and disclosures in the financial statements. Our audits also included evaluating the accounting principles used and significant estimates made by management, as well as evaluating the overall presentation of the financial statements. We believe that our audits and the reports of the other auditors provide a reasonable basis for our opinion.
/s/ Deloitte & Touche LLP
Cleveland, Ohio
February 26, 2018
We have served as the Company's auditor since 2015.
37
Report of Independent Registered Public Accounting Firm
To the Members and Board of Managers
Lansing Trade Group, LLC:
Opinion on the Consolidated Financial Statements
We have audited the accompanying consolidated balance sheet of Lansing Trade Group, LLC and subsidiaries (the Company) as of December 31, 2017, the related consolidated statements of comprehensive income, equity, and cash flows for the year ended December 31, 2017, and the related notes (collectively, the consolidated financial statements). In our opinion, based on our audit and the report of the other auditors, the consolidated financial statements present fairly, in all material respects, the financial position of the Company as of December 31, 2017, and the results of its operations and its cash flows for year ended December 31, 2017, in conformity with U.S. generally accepted accounting principles.
We did not audit the consolidated financial statements of Lux JV Treasury Holding Company S.a.r.l. (a 50% percent owned investee company). The Company’s investment in Lux JV Treasury Holding Company S.a.r.l. at December 31, 2017 was $46.7 million and its equity in earnings of Lux JV Treasury Holding Company S.a.r.l. was $0.7 million for the year ended December 31, 2017. The consolidated financial statements of Lux JV Treasury Holding Company S.a.r.l. were audited by other auditors whose report has been furnished to us, and our opinion, insofar as it relates to the amounts included for Lux JV Treasury Holding Company S.a.r.l., is based solely on the report of the other auditors.
Basis for Opinion
These consolidated financial statements are the responsibility of the Company’s management. Our responsibility is to express an opinion on these consolidated financial statements based on our audit. We are a public accounting firm registered with the Public Company Accounting Oversight Board (United States) (PCAOB) and are required to be independent with respect to the Company in accordance with the U.S. federal securities law and the applicable rules and regulations of the Securities and Exchange Commission and the PCAOB.
We conducted our audit in accordance with the standards of the PCAOB and in accordance with auditing standards generally accepted in the United States of America. Those standards require that we plan and perform the audit to obtain reasonable assurance about whether the consolidated financial statements are free of material misstatement, whether due to error or fraud. Our audit included performing procedures to assess the risks of material misstatement of the consolidated financial statements, whether due to error or fraud, and performing procedures that respond to those risks. Such procedures included examining, on a test basis, evidence regarding the amounts and disclosures in the consolidated financial statements. Our audit also included evaluating the accounting principles used and significant estimates made by management, as well as evaluating the overall presentation of the consolidated financial statements. We believe that our audit and the report of the other auditors provide a reasonable basis for our opinion.
/s/ KPMG LLP
We have served as the Company’s auditor since 2017.
Kansas City, Missouri
February 26, 2018
38
Report of Independent Registered Public Accounting Firm
To the Board of Managers and Shareholders of
Lux JV Treasury Holding Company S.à r.l.
Opinion on the Consolidated Financial Statements
We have audited the accompanying consolidated balance sheet of Lux JV Treasury Holding Company
S.à r.l. and its subsidiaries, (together, the Company) as of December 31, 2017 and 2016, and the related consolidated statements of operations and retained earnings and cash flows for each of the three years in the period ended December 31, 2017, including the related notes (not included herein) (collectively referred to as the consolidated financial statements). In our opinion, the consolidated financial statements present fairly, in all material respects, the financial position of the Company as of December 31, 2017 and 2016, and the results of operations and their cash flows for each of the three years in the period ended
December 31, 2017 in conformity with accounting principles generally accepted in the United States of America.
Change in Accounting Principle
As discussed in note 1 to the consolidated financial statements, the Company changed its method of presentation of deferred tax liabilities in 2017.
Basis for Opinion
These consolidated financial statements are the responsibility of the Company’s management. Our responsibility is to express an opinion on the Company’s consolidated financial statements based on our audits. We are a public accounting firm registered with the Public Company Accounting Oversight Board (United States) (PCAOB) and are required to be independent with respect to the Company in accordance with the U.S. federal securities laws and the applicable rules and regulations of the Securities and Exchange Commission and the PCAOB.
We conducted our audits of these consolidated financial statements in accordance with the standards of the PCAOB. Those standards require that we plan and perform the audit to obtain reasonable assurance about whether the consolidated financial statements are free of material misstatement, whether due to error or fraud.
Our audits included performing procedures to assess the risks of material misstatement of the consolidated financial statements, whether due to error or fraud, and performing procedures that respond to those risks. Such procedures included examining, on a test basis, evidence regarding the amounts and disclosures in the consolidated financial statements. Our audits also included evaluating the accounting principles used and significant estimates made by management, as well as evaluating the overall presentation of the consolidated financial statements. We believe that our audits provide a reasonable basis for our opinion.
/s/ PricewaterhouseCoopers LLP
Chartered Professional Accountants
February 16, 2018
London, Canada
We have served as the Company's auditor since 2013.
39
REPORT OF INDEPENDENT REGISTERED PUBLIC ACCOUNTING FIRM
To the Board of Managers
Lansing Trade Group, LLC
Overland Park, Kansas
We have audited the accompanying consolidated balance sheet of Lansing Trade Group, LLC and Subsidiaries (the “Company”) as of December 31, 2016 and the related consolidated statements of comprehensive income, equity and cash flows for each of the years in the two-year period ended December 31, 2016. These consolidated financial statements are the responsibility of the Company's management. Our responsibility is to express an opinion on these consolidated financial statements based on our audits. We did not audit the consolidated financial statements of Lux JV Treasury Holding Company S.à.r.l., an entity in which Lansing Trade Group, LLC has an investment in and accounts for under the equity method of accounting, for which Lansing Trade Group, LLC reflects an investment of $42.9 million as of December 31, 2016, respectively, and equity in earnings of affiliates of $2.6 million and $2.9 million for each of the years in the two-year period ended December 31, 2016, respectively. The financial statements of Lux JV Treasury Holding Company S.à.r.l. were audited by other auditors whose report thereon has been furnished to us, and our opinion on the financial statements expressed herein, insofar as it relates to the amounts included for Lux JV Treasury Holding Company S.à.r.l., is based solely on the report of the other auditors.
We conducted our audits in accordance with standards of the Public Company Accounting Oversight Board (United States) and in accordance with auditing standards generally accepted in the United States of America. Those standards require that we plan and perform the audit to obtain reasonable assurance about whether the consolidated financial statements are free from material misstatement. The Company is not required to have, nor were we engaged to perform, an audit of its internal control over financial reporting. Our audits included consideration of internal control over financial reporting as a basis for designing audit procedures that are appropriate in the circumstances, but not for the purpose of expressing an opinion on the effectiveness of the Company’s internal control over financial reporting. Accordingly, we express no such opinion. An audit also includes examining, on a test basis, evidence supporting the amounts and disclosures in the consolidated financial statements, assessing the accounting principles used and significant estimates made by management, as well as evaluating the overall financial statement presentation. We believe that our audits provide a reasonable basis for our opinion.
In our opinion, based on our audits and the report of the other auditors, the consolidated financial statements referred to above present fairly, in all material respects, the consolidated financial position of the Company as of, December 31, 2016, and the results of its operations and its cash flows for each of the years in the two-year period ended December 31, 2016, in conformity with accounting principles generally accepted in the United States of America.
/s/ Crowe Chizek LLP
Elkhart, Indiana
February 27, 2017
40
The Andersons, Inc. Consolidated Balance Sheets (In thousands) | |||||||
December 31, 2017 | December 31, 2016 | ||||||
Assets | |||||||
Current assets: | |||||||
Cash and cash equivalents | $ | 34,919 | $ | 62,630 | |||
Restricted cash | — | 471 | |||||
Accounts receivable, less allowance for doubtful accounts of $9,156 in 2017; $7,706 in 2016 | 183,238 | 194,698 | |||||
Inventories (Note 2) | 648,703 | 682,747 | |||||
Commodity derivative assets – current (Note 6) | 30,702 | 45,447 | |||||
Other current assets | 63,790 | 72,133 | |||||
Assets held for sale | 37,859 | — | |||||
Total current assets | 999,211 | 1,058,126 | |||||
Other assets: | |||||||
Commodity derivative assets – noncurrent (Note 6) | 310 | 100 | |||||
Goodwill (Note 4) | 6,024 | 63,934 | |||||
Other intangible assets, net (Note 4) | 112,893 | 106,100 | |||||
Other assets | 12,557 | 10,411 | |||||
Equity method investments | 223,239 | 216,931 | |||||
355,023 | 397,476 | ||||||
Rail Group assets leased to others, net (Note 3) | 423,443 | 327,195 | |||||
Property, plant and equipment, net (Note 3) | 384,677 | 450,052 | |||||
Total assets | $ | 2,162,354 | $ | 2,232,849 | |||
41
The Andersons, Inc. Consolidated Balance Sheets (continued) (In thousands) | |||||||
December 31, 2017 | December 31, 2016 | ||||||
Liabilities and equity | |||||||
Current liabilities: | |||||||
Short-term debt (Note 5) | $ | 22,000 | $ | 29,000 | |||
Trade and other payables | 503,571 | 581,826 | |||||
Customer prepayments and deferred revenue | 59,710 | 48,590 | |||||
Commodity derivative liabilities – current (Note 6) | 29,651 | 23,167 | |||||
Accrued expenses and other current liabilities | 69,579 | 69,648 | |||||
Current maturities of long-term debt (Note 5) | 54,205 | 47,545 | |||||
Total current liabilities | 738,716 | 799,776 | |||||
Other long-term liabilities | 33,129 | 27,833 | |||||
Commodity derivative liabilities – noncurrent (Note 6) | 825 | 339 | |||||
Employee benefit plan obligations (Note 7) | 26,716 | 35,026 | |||||
Long-term debt, less current maturities (Note 5) | 418,339 | 397,065 | |||||
Deferred income taxes (Note 8) | 121,730 | 182,113 | |||||
Total liabilities | 1,339,455 | 1,442,152 | |||||
Commitments and contingencies (Note 14) | |||||||
Shareholders’ equity: | |||||||
Common shares, without par value (63,000 shares authorized; 29,430 shares issued in 2017 and 2016) | 96 | 96 | |||||
Preferred shares, without par value (1,000 shares authorized; none issued) | — | — | |||||
Additional paid-in-capital | 224,622 | 222,910 | |||||
Treasury shares, at cost (1,063 in 2017; 1,201 in 2016) | (40,312 | ) | (45,383 | ) | |||
Accumulated other comprehensive loss | (2,700 | ) | (12,468 | ) | |||
Retained earnings | 633,496 | 609,206 | |||||
Total shareholders’ equity of The Andersons, Inc. | 815,202 | 774,361 | |||||
Noncontrolling interests | 7,697 | 16,336 | |||||
Total equity | 822,899 | 790,697 | |||||
Total liabilities and equity | $ | 2,162,354 | $ | 2,232,849 | |||
The Notes to Consolidated Financial Statements are an integral part of these statements.
42
The Andersons, Inc.
Consolidated Statements of Operations
(In thousands, except per share data)
Year ended December 31, | |||||||||||
2017 | 2016 | 2015 | |||||||||
Sales and merchandising revenues | $ | 3,686,345 | $ | 3,924,790 | $ | 4,198,495 | |||||
Cost of sales and merchandising revenues | 3,367,546 | 3,579,284 | 3,822,657 | ||||||||
Gross profit | 318,799 | 345,506 | 375,838 | ||||||||
Operating, administrative and general expenses | 287,930 | 318,395 | 337,829 | ||||||||
Pension settlement | — | — | 51,446 | ||||||||
Asset impairment | 10,913 | 9,107 | 285 | ||||||||
Goodwill impairment | 59,081 | — | 56,166 | ||||||||
Interest expense | 21,567 | 21,119 | 20,072 | ||||||||
Other income: | |||||||||||
Equity in earnings of affiliates, net | 16,723 | 9,721 | 31,924 | ||||||||
Other income, net | 23,444 | 14,775 | 46,472 | ||||||||
Income (loss) before income taxes | (20,525 | ) | 21,381 | (11,564 | ) | ||||||
Income tax provision (benefit) | (63,134 | ) | 6,911 | (242 | ) | ||||||
Net income (loss) | 42,609 | 14,470 | (11,322 | ) | |||||||
Net income attributable to the noncontrolling interests | 98 | 2,876 | 1,745 | ||||||||
Net income (loss) attributable to The Andersons, Inc. | $ | 42,511 | $ | 11,594 | $ | (13,067 | ) | ||||
Per common share: | |||||||||||
Basic earnings (loss) attributable to The Andersons, Inc. common shareholders | $ | 1.51 | $ | 0.41 | $ | (0.46 | ) | ||||
Diluted earnings (loss) attributable to The Andersons, Inc. common shareholders | $ | 1.50 | $ | 0.41 | $ | (0.46 | ) | ||||
Dividends declared | $ | 0.6450 | $ | 0.6250 | $ | 0.5750 | |||||
The Notes to Consolidated Financial Statements are an integral part of these statements.
43
The Andersons, Inc.
Consolidated Statements of Comprehensive Income
(In thousands)
Year ended December 31, | |||||||||||
2017 | 2016 | 2015 | |||||||||
Net income (loss) | $ | 42,609 | $ | 14,470 | $ | (11,322 | ) | ||||
Other comprehensive income (loss), net of tax: | |||||||||||
Change in fair value of convertible preferred securities (net of income tax of $0, $74 and $0) | 344 | (126 | ) | — | |||||||
Change in unrecognized actuarial gain and prior service cost (net of income tax of $(1,809), $(4,355) and $(24,746)) | 6,138 | 7,447 | 40,736 | ||||||||
Foreign currency translation adjustments (net of income tax of $0, $0 and $82) | 3,286 | 1,039 | (7,333 | ) | |||||||
Cash flow hedge activity (net of income tax of $0, $(72) and $(154)) | — | 111 | 253 | ||||||||
Other comprehensive income (loss) | 9,768 | 8,471 | 33,656 | ||||||||
Comprehensive income | 52,377 | 22,941 | 22,334 | ||||||||
Comprehensive income attributable to the noncontrolling interests | 98 | 2,876 | 1,745 | ||||||||
Comprehensive income attributable to The Andersons, Inc. | $ | 52,279 | $ | 20,065 | $ | 20,589 | |||||
The Notes to Consolidated Financial Statements are an integral part of these statements.
44
The Andersons, Inc.
Consolidated Statements of Cash Flows
(In thousands)
Year ended December 31, | |||||||||||
2017 | 2016 | 2015 | |||||||||
Operating Activities | |||||||||||
Net income (loss) | $ | 42,609 | $ | 14,470 | (11,322 | ) | |||||
Adjustments to reconcile net income (loss) to cash provided by (used in) operating activities: | |||||||||||
Depreciation and amortization | 86,412 | 84,325 | 78,456 | ||||||||
Bad debt expense | 3,000 | 1,191 | 3,302 | ||||||||
Equity in (earnings) losses of affiliates, net of dividends | (10,494 | ) | 14,766 | (677 | ) | ||||||
Gain on sale of assets | (14,401 | ) | (667 | ) | (20,802 | ) | |||||
Gains on sales of Rail Group assets and related leases | (10,990 | ) | (11,019 | ) | (13,281 | ) | |||||
Deferred income taxes | (63,234 | ) | 6,030 | 27,279 | |||||||
Stock based compensation expense | 6,097 | 6,987 | 1,899 | ||||||||
Pension settlement charge, net of cash contributed | — | — | 48,344 | ||||||||
Goodwill impairment | 59,081 | — | 56,166 | ||||||||
Asset impairment charge | 10,913 | 9,107 | 285 | ||||||||
Other | (55 | ) | (2,070 | ) | (1,439 | ) | |||||
Changes in operating assets and liabilities: | |||||||||||
Accounts receivable | 9,781 | (26,429 | ) | 45,058 | |||||||
Inventories | 16,141 | 28,165 | 73,350 | ||||||||
Commodity derivatives | 20,285 | (9,990 | ) | 14,098 | |||||||
Other assets | (5,623 | ) | 19,407 | (26,315 | ) | ||||||
Accounts payable and accrued expenses | (74,237 | ) | (94,688 | ) | (120,267 | ) | |||||
Net cash provided by (used in) operating activities | 75,285 | 39,585 | 154,134 | ||||||||
Investing Activities | |||||||||||
Acquisition of businesses, net of cash acquired | (3,507 | ) | — | (128,549 | ) | ||||||
Purchases of Rail Group assets | (143,020 | ) | (85,268 | ) | (115,032 | ) | |||||
Proceeds from sale of Rail Group assets | 36,896 | 56,689 | 76,625 | ||||||||
Purchases of property, plant and equipment and capitalized software | (34,602 | ) | (77,740 | ) | (72,469 | ) | |||||
Proceeds from sale of assets | 33,879 | 69,904 | 284 | ||||||||
Proceeds from returns of investments in affiliates | 1,069 | 9,186 | 1,620 | ||||||||
Purchase of investments | (5,679 | ) | (2,523 | ) | (938 | ) | |||||
Other | 1,470 | 1,534 | (21 | ) | |||||||
Net cash provided by (used in) investing activities | (113,494 | ) | (28,218 | ) | (238,480 | ) | |||||
Financing Activities | |||||||||||
Net change in short-term borrowings | (8,059 | ) | 14,000 | 15,000 | |||||||
Proceeds from issuance of long-term debt | 85,175 | 81,760 | 181,767 | ||||||||
Payments of long-term debt | (57,189 | ) | (97,606 | ) | (92,474 | ) | |||||
Proceeds from long-term financing arrangements | 12,195 | 14,027 | — | ||||||||
Distributions to noncontrolling interest owner | (377 | ) | (5,853 | ) | (3,206 | ) | |||||
Payments of debt issuance costs | (2,024 | ) | (323 | ) | (296 | ) | |||||
Purchases of treasury stock | — | — | (49,089 | ) | |||||||
Dividends paid | (18,152 | ) | (17,362 | ) | (15,921 | ) | |||||
Other | (1,071 | ) | (1,130 | ) | (2,389 | ) | |||||
Net cash provided by (used in) financing activities | 10,498 | (12,487 | ) | 33,392 | |||||||
Increase (decrease) in cash and cash equivalents | (27,711 | ) | (1,120 | ) | (50,954 | ) | |||||
Cash and cash equivalents at beginning of year | 62,630 | 63,750 | 114,704 | ||||||||
Cash and cash equivalents at end of year | $ | 34,919 | $ | 62,630 | $ | 63,750 | |||||
The Notes to Consolidated Financial Statements are an integral part of these statements.
45
The Andersons, Inc.
Consolidated Statements of Equity
(In thousands, except per share data)
The Andersons, Inc. Shareholders’ Equity | |||||||||||||||||||||||||||
Common Shares | Additional Paid-in Capital | Treasury Shares | Accumulated Other Comprehensive Loss | Retained Earnings | Noncontrolling Interests | Total | |||||||||||||||||||||
Balance at January 1, 2015 | $ | 96 | $ | 222,789 | $ | (9,743 | ) | $ | (54,595 | ) | $ | 644,556 | $ | 20,946 | $ | 824,049 | |||||||||||
Net income | (13,067 | ) | 1,745 | (11,322 | ) | ||||||||||||||||||||||
Other comprehensive loss | 33,656 | 33,656 | |||||||||||||||||||||||||
Cash distributions to noncontrolling interest | (3,206 | ) | (3,206 | ) | |||||||||||||||||||||||
Stock awards, stock option exercises and other shares issued to employees and directors, net of income tax of $819 (187 shares) | (4,382 | ) | 5,930 | 1,548 | |||||||||||||||||||||||
Purchase of treasury shares (1,193 shares) | (49,089 | ) | (49,089 | ) | |||||||||||||||||||||||
Dividends declared ($0.575 per common share) | (16,200 | ) | (16,200 | ) | |||||||||||||||||||||||
Shares issued for acquisitions (77 shares) | 4,303 | 4,303 | |||||||||||||||||||||||||
Performance share unit dividends equivalents | 138 | (138 | ) | — | |||||||||||||||||||||||
Balance at December 31, 2015 | 96 | 222,848 | (52,902 | ) | (20,939 | ) | 615,151 | 19,485 | 783,739 | ||||||||||||||||||
Net income | 11,594 | 2,876 | 14,470 | ||||||||||||||||||||||||
Other comprehensive loss | 8,471 | 8,471 | |||||||||||||||||||||||||
Cash distributions to noncontrolling interest | (5,853 | ) | (5,853 | ) | |||||||||||||||||||||||
Other changes in noncontrolling interest | (172 | ) | (172 | ) | |||||||||||||||||||||||
Stock awards, stock option exercises and other shares issued to employees and directors, net of income tax of $458 (196 shares) | 67 | 7,489 | 7,556 | ||||||||||||||||||||||||
Dividends declared ($0.625 per common share) | (17,514 | ) | (17,514 | ) | |||||||||||||||||||||||
Performance share unit dividends equivalents | (5 | ) | 30 | (25 | ) | — | |||||||||||||||||||||
Balance at December 31, 2016 | 96 | 222,910 | (45,383 | ) | (12,468 | ) | 609,206 | 16,336 | 790,697 | ||||||||||||||||||
Net income | 42,511 | 98 | 42,609 | ||||||||||||||||||||||||
Other comprehensive income | 9,768 | 9,768 | |||||||||||||||||||||||||
Cash distributions to noncontrolling interest | (377 | ) | (377 | ) | |||||||||||||||||||||||
Other changes in noncontrolling interest | (8,360 | ) | (8,360 | ) | |||||||||||||||||||||||
Stock awards, stock option exercises and other shares issued to employees and directors, net of income tax of $(323) (138 shares) | 1,707 | 5,007 | 6,714 | ||||||||||||||||||||||||
Dividends declared ($0.645 per common share) | (18,152 | ) | (18,152 | ) | |||||||||||||||||||||||
Stock award dividend equivalents | 5 | 64 | (69 | ) | — | ||||||||||||||||||||||
Balance at December 31, 2017 | $ | 96 | $ | 224,622 | $ | (40,312 | ) | $ | (2,700 | ) | $ | 633,496 | $ | 7,697 | $ | 822,899 | |||||||||||
The Notes to Consolidated Financial Statements are an integral part of these statements.
46
The Andersons, Inc.
Notes to Consolidated Financial Statements
1. Summary of Significant Accounting Policies
Basis of Consolidation
These Consolidated Financial Statements include the accounts of The Andersons, Inc. and its wholly owned and controlled subsidiaries (the “Company”). All intercompany accounts and transactions are eliminated in consolidation. Investments in unconsolidated entities in which the Company has significant influence, but not control, are accounted for using the equity method of accounting.
In the opinion of management, all adjustments consisting of normal recurring items, considered necessary for a fair presentation of the results of operations for the periods indicated, have been made.
Use of Estimates and Assumptions
The preparation of financial statements in conformity with accounting principles generally accepted in the United States of America requires management to make estimates and assumptions that affect the reported amounts of assets and liabilities and disclosure of contingent assets and liabilities at the date of the financial statements and the reported amounts of revenues and expenses during the reporting period. Actual results could differ from those estimates.
Cash and Cash Equivalents
Cash and cash equivalents include cash and short-term investments with an initial maturity of three months or less. The carrying values of these assets approximate their fair values.
Accounts Receivable and Allowance for Doubtful Accounts
Trade accounts receivable are recorded at the invoiced amount and may bear interest if past due. The allowance for doubtful accounts is the best estimate of the amount of probable credit losses in existing accounts receivable. The allowance for doubtful accounts is reviewed quarterly. The allowance is based both on specific identification of potentially uncollectible accounts and the application of a consistent policy, based on historical experience, to estimate the allowance necessary for the remaining accounts receivable. For those customers that are thought to be at higher risk, the Company makes assumptions as to collectability based on past history and facts about the current situation. Account balances are charged off against the allowance when it becomes more certain that the receivable will not be recovered. The Company manages its exposure to counter-party credit risk through credit analysis and approvals, credit limits and monitoring procedures.
Commodity Derivatives and Inventories
The Company's operating results can be affected by changes to commodity prices. The Grain and Ethanol businesses have established “unhedged” position limits (the amount of a commodity, either owned or contracted for, that does not have an offsetting derivative contract to mitigate the price risk associated with those contracts and inventory). To reduce the exposure to market price risk on commodities owned and forward grain and ethanol purchase and sale contracts, the Company enters into exchange traded commodity futures and options contracts and over-the-counter forward and option contracts with various counterparties. The exchange traded contracts are primarily via the Chicago Mercantile Exchange ("CME".) The forward purchase and sale contracts are for physical delivery of the commodity in a future period. Contracts to purchase commodities from producers generally relate to the current or future crop years for delivery periods quoted by regulated commodity exchanges. Contracts for the sale of commodities to processors or other commercial consumers generally do not extend beyond one year.
The Company accounts for its commodity derivatives at fair value. The estimated fair value of the commodity derivative contracts that require the receipt or posting of cash collateral is recorded on a net basis (offset against cash collateral posted or received, also known as margin deposits) within commodity derivative assets or liabilities. Management determines fair value based on exchange-quoted prices and in the case of its forward purchase and sale contracts, fair value is adjusted for differences in local markets and non-performance risk. While the Company considers certain of its commodity contracts to be effective economic hedges, the Company does not designate or account for its commodity contracts as hedges.
47
Realized and unrealized gains and losses in the value of commodity contracts (whether due to changes in commodity prices, changes in performance or credit risk, or due to sale, maturity or extinguishment of the commodity contract) and grain inventories are included in cost of sales and merchandising revenues in the Consolidated Statements of Operations. Additional information about the fair value of the Company's commodity derivatives is presented in Notes 6 and 11 to the Consolidated Financial Statements.
Grain inventories, which are agricultural commodities and may be acquired under provisionally priced contracts, are stated at their net realizable value, which approximates estimated selling prices in the ordinary course of business, less reasonably predictable costs of completion, disposal and transportation.
All other inventories are stated at the lower of cost or net realizable value. Cost is determined by the average cost method. Additional information about inventories is presented in Note 2 to the Consolidated Financial Statements.
Derivatives - Master Netting Arrangements
Generally accepted accounting principles permit a party to a master netting arrangement to offset fair value amounts recognized for derivative instruments against the right to reclaim cash collateral or obligation to return cash collateral under the same master netting arrangement. The Company has master netting arrangements for its exchange traded futures and options contracts and certain over-the-counter contracts. When the Company enters into a futures, options or an over-the-counter contract, an initial margin deposit may be required by the counterparty. The amount of the margin deposit varies by commodity. If the market price of a futures, option or an over-the-counter contract moves in a direction that is adverse to the Company's position, an additional margin deposit, called a maintenance margin, is required. The Company nets, by counterparty, its futures and over-the-counter positions against the cash collateral provided or received. The margin deposit assets and liabilities are included in short-term commodity derivative assets or liabilities, as appropriate, in the Consolidated Balance Sheets. Additional information about the Company's master netting arrangements is presented in Note 6 to the Consolidated Financial Statements.
Derivatives - Interest Rate and Foreign Currency Contracts
The Company periodically enters into interest rate contracts to manage interest rate risk on borrowing or financing activities. The Company has interest rate contracts recorded in other assets that are not designated as hedges. While the Company considers all of its derivative positions to be effective economic hedges of specified risks, these interest rate contracts for which hedge accounting is not applied are recorded on the Consolidated Balance Sheets in either other current assets or liabilities (if short-term in nature) or in other assets or other long-term liabilities (if non-current in nature), and changes in fair value are recognized in income as interest expense. Upon termination of a derivative instrument or a change in the hedged item, any remaining fair value recorded on the balance sheet is recorded as interest expense consistent with the cash flows associated with the underlying hedged item. Information regarding the nature and terms of the Company's interest rate derivatives is presented in Note 6 to the Consolidated Financial Statements.
Marketing Agreement
The Company has a marketing agreement that covers certain of its grain facilities, some of which are leased from Cargill, Incorporated (“Cargill”). Under the five-year amended and restated agreement (renewed in December 2013 and ending May 2018), the Company sells grain from these facilities to Cargill at market prices. Income earned from operating the facilities (including buying, storing and selling grain and providing grain marketing services to its producer customers) over a specified threshold is shared equally with Cargill. Measurement of this threshold is made on a cumulative basis and cash is paid to Cargill on an annual basis. The Company recognizes its pro rata share of income every month and accrues for any payment owed to Cargill. The balance included in customer prepayments and deferred revenue was $3.3 million and $5.8 million as of December 31, 2017 and December 31, 2016, respectively.
Rail Group Assets Leased to Others
The Company's Rail Group purchases, leases, markets and manages railcars and barges for third parties and for internal use. Rail Group assets to which the Company holds title are shown on the balance sheet in one of two categories - other current assets (for those that are available for sale) or Rail Group assets leased to others. Rail Group assets leased to others, both on short and long-term leases, are classified as long-term assets and are depreciated over their estimated useful lives.
Railcars have statutory lives of either 40 or 50 years, measured from the date built. Barges have estimated lives of 30 to 40 years, measured from the date built. At the time of purchase, the remaining life is used in determining useful lives which are
48
depreciated on a straight-line basis. Repairs and maintenance costs are charged to expense as incurred. Additional information regarding Rail Group assets leased to others is presented in Note 3 to the Consolidated Financial Statements.
Property, Plant and Equipment
Property, plant and equipment is recorded at cost. Repairs and maintenance costs are charged to expense as incurred, while betterments that extend useful lives are capitalized. Depreciation is provided over the estimated useful lives of the individual assets, by the straight-line method. Estimated useful lives are generally as follows: land improvements - 16 years; leasehold improvements - the shorter of the lease term or the estimated useful life of the improvement, ranging from 3 to 20 years; buildings and storage facilities - 10 to 40 years; and machinery and equipment - 3 to 20 years. The cost of assets retired or otherwise disposed of and the accumulated depreciation thereon are removed from the accounts, with any gain or loss realized upon sale or disposal credited or charged to operations.
Additional information regarding the Company's property, plant and equipment is presented in Note 3 to the Consolidated Financial Statements.
Deferred Debt Issue Costs
Costs associated with the issuance of debt are deferred. These costs are amortized, as a component of interest expense, over the earlier of the stated term of the debt or the period from the issue date through the first early payoff date without penalty, or the expected payoff date if the loan does not contain a prepayment penalty. Deferred costs associated with the borrowing arrangement with a syndication of banks are amortized over the term of the agreement.
Goodwill and Intangible Assets
Goodwill is not amortized but is subject to annual impairment tests or more often when events or circumstances indicate that the carrying amount of goodwill may be impaired. A goodwill impairment loss is recognized to the extent the carrying amount of goodwill exceeds the implied fair value of goodwill. Additional information about the Company's goodwill and other intangible assets is presented in Note 4 to the Consolidated Financial Statements.
Acquired intangible assets are recorded at cost, less accumulated amortization, if not indefinite lived. In addition, we capitalize the salaries and payroll-related costs of employees and consultants who devote time to the development of internal-use software projects. If a project constitutes an enhancement to previously-developed software, we assess whether the enhancement is significant and creates additional functionality to the software, thus qualifying the work incurred for capitalization. Once a project is complete, we estimate the useful life of the internal-use software, and we periodically assess whether the software is impaired. Changes in our estimates related to internal-use software would increase or decrease operating expenses or amortization recorded during the period.
Amortization of intangible assets is provided over their estimated useful lives (generally 3 to 10 years) on the straight-line method.
Impairment of Long-lived Assets
Long-lived assets, including intangible assets, are reviewed for impairment whenever events or changes in circumstances indicate that the carrying value of an asset may not be recoverable. Recoverability of assets to be held and used is measured by comparing the carrying amount of the assets to the undiscounted future net cash flows the Company expects to generate with the assets. If such assets are considered to be impaired, the Company recognizes an impairment loss for the amount by which the carrying amount of the assets exceeds the fair value of the assets.
Provisionally Priced Grain Contracts
Accounts payable includes certain amounts related to grain purchases for which, even though the Company has taken ownership and possession of the grain, the final purchase price has not been fully established. If the futures and basis components are unpriced, it is referred to as a delayed price payable. If the futures component has not been established, but the basis has been set, it is referred to as a basis payable. The unpriced portion of these payables will be exposed to changes in the fair value of the underlying commodity based on quoted prices on commodity exchanges (or basis levels). Those payables that are fully priced are not considered derivative instruments.
49
The Company also enters into contracts with customers for risk management purposes that allow the customers to effectively unprice the futures component of their inventory for a period of time, subjecting the bushels to market fluctuations. The Company records an asset or liability for the market value changes of the commodities over the life of the contracts based on quoted Chicago Board of Trade ("CBOT") prices. See Note 11 for additional discussion on these instruments.
Stock-Based Compensation
Stock-based compensation expense for all stock-based compensation awards is based on the estimated grant-date fair value. The Company recognizes these compensation costs on a straight-line basis over the requisite service period of the award, adjusted for revisions to performance expectations. Additional information about the Company's stock compensation plans is presented in Note 16 to the Consolidated Financial Statements.
Deferred Compensation Liability
Included in accrued expenses are $9.6 million and $9.7 million at December 31, 2017 and 2016, respectively, of deferred compensation for certain employees who, due to Internal Revenue Service guidelines, may not take full advantage of the Company's qualified defined contribution plan. Assets funding this plan are recorded at fair value in other current assets and have been classified as trading securities with changes in the fair value recorded in earnings as a component of other income, net. Changes in the fair value of the deferred compensation liability are reflected in earnings as a component of operating, administrative, and general expenses.
Revenue Recognition
The Company follows a policy of recognizing sales revenue at the time of delivery of the product and when all of the following have occurred: a sales agreement is in place, pricing is fixed or determinable, and collection is reasonably assured.
Sales of grain and ethanol are primarily recognized at the time of shipment, which is when title and risk of loss transfers to the customer. There are certain transactions that allow for pricing to occur after title of the goods has passed to the customer. In these cases, the Company continues to report the goods in inventory until it recognizes the sales revenue once the price has been determined. Direct ship grain sales (where the Company never takes physical possession of the grain) are recognized when the grain arrives at the customer's facility. Revenues from other grain and ethanol merchandising activities are recognized as services are provided. Sales of other products are recognized at the time title and risk of loss transfers to the customer, which is generally at the time of shipment or, in the case of the retail store sales, when the customer takes possession of the goods. Revenues for all other services are recognized as the service is provided.
Certain of the Company's operations provide for customer billings, deposits or prepayments for product that is stored at the Company's facilities. The sales and gross profit related to these transactions are not recognized until the product is shipped in accordance with the previously stated revenue recognition policy and these amounts are classified as a current liability titled “Customer prepayments and deferred revenue”.
Rental revenues on operating leases are recognized on a straight-line basis over the term of the lease. Sales to financial intermediaries of owned railcars or other assets which are subject to an operating lease (with the Company being the lessor in such operating leases prior to the sale, referred to as a “non-recourse transaction”) are recognized as revenue on the date of sale if the Company does not maintain substantial risk of ownership in the sold assets. Revenue related to railcar or other asset servicing and maintenance contracts is recognized over the term of the lease or service contract.
Sales returns and allowances are provided for at the time sales are recorded based on historical experience. Shipping and handling charges are included in cost of sales. Sales taxes and motor fuel taxes on ethanol sales are presented on a net basis and are excluded from revenues.
Rail Lease Accounting
In addition to the sale of Rail Group assets that the Company makes to financial intermediaries on a non-recourse basis and records as revenue as discussed above, the Company also acts as the lessor and / or the lessee in various leasing arrangements as described below.
The Company's Rail Group leases assets to customers, manages assets for third parties and leases assets for internal use. The Company acts as the lessor in various operating leases of assets that are owned by the Company, or leased by the Company from financial intermediaries and, in turn, leased by the Company to end-users of the assets. The leases from financial
50
intermediaries are generally structured as sale-leaseback transactions, with the leaseback by the Company being treated as an operating lease.
Certain of the Company's leases include monthly lease fees that are contingent upon some measure of usage (“per diem” leases). This monthly usage is tracked, billed and collected by third-party service providers and funds are generally remitted to the Company along with usage data three months after they are earned. The Company records lease revenue for these per diem arrangements based on recent historical usage patterns and records a true-up adjustment when the actual data is received. Such true-up adjustments were not significant for any period presented.
The Company expenses operating lease payments on a straight-line basis over the lease term. Additional information about leasing activities is presented in Note 14 to the Consolidated Financial Statements.
Income Taxes
Income tax expense for each period includes current tax expense plus deferred expense, which is related to the change in deferred income tax assets and liabilities. Deferred income taxes are provided for temporary differences between the financial reporting basis and the tax basis of assets and liabilities and are measured using enacted tax rates and laws governing periods in which the differences are expected to reverse. The Company evaluates the realizability of deferred tax assets and provides a valuation allowance for amounts that management does not believe are more likely than not to be recoverable, as applicable.
The annual effective tax rate is determined by income tax expense, described above, from continuing operations, described above, as a percentage of pretax book income. Differences in the effective tax rate and the statutory tax rate may be due to permanent items, tax credits, foreign tax rates and state tax rates in jurisdictions in which the Company operates, or changes in valuation allowances.
The Company records reserves for uncertain tax positions when, despite the belief that tax return positions are fully supportable, it is anticipated that certain tax return positions are likely to be challenged and that the Company may not prevail. These reserves are adjusted in light of changing facts and circumstances, such as the progress of a tax audit or the lapse of statutes of limitations.
Additional information about the Company’s income taxes is presented in Note 8 to the Consolidated Financial Statements.
Employee Benefit Plans
The Company provides full-time employees hired before January 1, 2003 with postretirement health care benefits. In order to measure the expense and funded status of these employee benefit plans, management makes several estimates and assumptions, including employee turnover rates, anticipated mortality rates and anticipated future healthcare cost trends. These estimates and assumptions are based on the Company's historical experience combined with management's knowledge and understanding of current facts and circumstances. The selection of the discount rate is based on an index given projected plan payouts. Additional information about the Company's employee benefit plans is presented in Note 7 to the Consolidated Financial Statements.
Advertising
Advertising costs are expensed as incurred. Advertising expense of $2.5 million, $4.9 million and $5.2 million in 2017, 2016, and 2015, respectively, is included in operating, administrative and general expenses.
New Accounting Standards
Revenue Recognition
In May 2014, the Financial Accounting Standards Board ("FASB") issued Accounting Standards Update ("ASU") No. 2014-09, Revenue from Contracts with Customers (ASC 606). The FASB issued subsequent amendments to the initial guidance in August 2015, March 2016, April 2016, May 2016, and December 2016 within ASU 2015-14, ASU 2016-08, ASU 2016-10 ASU 2016-12 and ASU 2016-20, respectively. The core principle of the new revenue standard is that an entity recognizes revenue from the transfer of promised goods or services to customers in an amount that reflects the consideration to which the entity expects to be entitled in exchange for those goods or services. The new revenue standard is effective for annual and interim periods beginning after December 15, 2017 and early adoption is permitted. The Company adopted the standard on January 1, 2018, using the modified retrospective method. The adoption of this new guidance will require expanded disclosures
51
in the Company’s consolidated financial statements including separate quantitative disclosure of revenues within the scope of ASC 606 and revenues excluded from the scope of ASC 606.
The Company has assessed the impact of this standard by reviewing representative samples of customer contracts for each revenue stream, analyzing those contracts under the new revenue standard, and comparing the conclusions to the current accounting policies and practices to identify potential changes. As a result of this assessment, which was completed during the fourth quarter of 2017, the Company believes the following items will be impacted upon adoption:
- Revenues not in the Scope of ASC 606: Many of the Company's Grain and Ethanol sales contracts are derivatives under ASC 815, Derivatives and Hedging, and therefore will be outside the scope of ASC 606. In addition, the Rail Group's leasing revenue is accounting for under ASC 840, Leases, and will be outside the scope of ASC 606. While we do not believe that the timing or measurement of revenue will be impacted by this conclusion, we will be required to disclose this revenue separately from revenue that is earned from contracts with customers upon adoption of ASC 606. The Company expects approximately 70 percent to 80 percent of consolidated revenues will be accounted for outside the scope of ASC 606, including at least 95 percent of Grain’s revenues, 80 percent to 90 percent of Ethanol’s revenues and 50 percent to 60 percent of Rail's revenues;
- Corn Origination Agreements: While these sales contracts will be accounted for under ASC 815, as noted above, we are still required to evaluate the principal versus agent guidance in ASC 606 to determine whether realized gains or losses should be presented on a gross or net basis in the consolidated statements of operations upon physical settlement. Currently the Company presents these amounts on a gross basis as it has concluded, on the basis of risks and rewards, that it is the principal in the contract. However, ASC 606 requires an entity to evaluate whether it is a principal or agent on the basis of control, rather than risks and rewards. The Company has determined that it is the agent in certain origination arrangements within our Grain Group and therefore realized gains or losses will be presented on a net basis upon adoption of ASC 606. However, as this change relates only to presentation within our consolidated statement of income, there will be no impact on gross profit.
While the impact is dependent on commodity price levels, the Company expects consolidated revenues and cost of sales to each decrease by approximately 10 percent to 20 percent for the Company and 20 percent to 30 percent for the Grain segment, respectively;
- Certain Rail Financing Transactions: In its normal course of operations, the Rail Group enters into transactions with financial institutions in which it agrees to sell railcars to the financial institution in exchange for an upfront payment. Each of the railcars included in a transaction are subject to existing operating leases at the time of sale and the Rail Group assigns all of its rights and obligations pursuant to the underlying lease agreements to financial institution on a non-recourse basis. In such arrangements, the group typically also provides ongoing maintenance and management services related to the cars on behalf of the financial institution in exchange for a stated monthly fee. The group typically holds an option to repurchase the assets at the end of the underlying lease term.
Due to the fact that the group holds an option to repurchase the railcars at the end of the lease term, the group has concluded that it does not transfer control of those railcars to the financial institution and therefore such transactions will no longer be treated as sales upon adoption of ASC 606. Rather, these transactions will be accounted for as collateralized borrowings in which the cash received from the financial institution will be recorded as a financial liability and the railcars will remain recorded as assets within the “Rail Group assets leased to others, net” financial statement caption.
Upon adoption, the Company will recognize a cumulative catch-up transition adjustment in beginning retained earnings at January 1, 2018 for non-recourse financing transactions that are open and have not yet recognized substantially all of the revenue under the contract as of December 31, 2017. The effect of this transition adjustment will be to recognize the railcar assets at their net book value and a financial liability representing the remaining amount owed to the financial institution. This will result in $25 million increase in Rail Group net assets, $43 million increase in financing liabilities and deferred tax liabilities and $18 million decrease to retained earnings.
Leasing
In February 2016, the FASB issued ASU No. 2016-02, Leases (ASC 842). ASC 842 supersedes the current accounting for leases. The new standard, while retaining two distinct types of leases, finance and operating, (i) requires lessees to record a right of use asset and a related liability for the rights and obligations associated with a lease, regardless of lease classification, and recognize lease expense in a manner similar to current accounting, (ii) eliminates current real estate specific lease provisions, (iii) modifies the lease classification criteria and (iv) aligns many of the underlying lessor model principles with those in the new revenue standard. ASC 842 is effective for fiscal years beginning after December 15, 2018, and interim periods within. Early adoption is permitted, however the Company does not plan to early adopt. Entities are required to use a modified retrospective approach when transitioning to ASC 842 for leases that exist as of or are entered into after the beginning of the earliest comparative period presented in the financial statements.
52
The Company expects this standard to have the effect of bringing certain off balance-sheet rail assets noted in Item 7 of Form 10-K onto the balance sheet along with a corresponding liability for the associated obligations. Additionally, we have other arrangements currently classified as operating leases which will be recorded as a right of use asset and corresponding liability on the balance sheet. We are currently evaluating the impact these changes will have on the consolidated financial statements.
Other applicable standards
In August 2017, the FASB issued Accounting Standards Update No. 2017-12 Targeted Improvements to Accounting for Hedging Activities. This standard simplifies the recognition and presentation of changes in the fair value of hedging instruments. The ASU is effective for annual periods beginning December 15, 2018. The Company does not expect the impact from adoption of this standard to be material to its Consolidated Financial Statements and disclosures.
In May 2017, the FASB issued Accounting Standards Update No. 2017-09 Compensation-Stock Compensation (Topic 718): Scope of Modification Accounting. This standard states that if the vesting conditions, fair value, and classification of the awards are the same immediately before and after the modification an entity would not apply modification accounting. The ASU is effective for annual periods beginning after December 15, 2017. Early adoption is permitted, however the Company has not chosen to do so at this time. The Company does not expect the impact from adoption of this standard to be material.
In March 2017, the FASB issued Accounting Standards Update No. 2017-07 Compensation-Retirement Benefits (Topic 715): Improving the Presentation of Net Periodic Pension Cost and Net Periodic Postretirement Benefit Cost. This standard requires that the service cost component be reported in the same line item as other compensation costs arising from services rendered by the employees during the period. The other components of net benefit costs should be presented in the income statement separately from the service cost component and outside of income from operations if that subtotal is presented. The ASU is effective for annual periods beginning after December 15, 2017. The Company does not expect the impact from adoption of this standard to be material to its Consolidated Financial Statements and disclosures.
In January 2017, the FASB issued ASU No. 2017-04 Intangibles-Goodwill and Other (Topic 350): Simplifying the Test for Goodwill Impairment. This update removes the requirement to compare the implied fair value of goodwill with its carrying amount as part of step 2 of the goodwill impairment test. The ASU is effective prospectively for fiscal years beginning after December 15, 2019. Early adoption is permitted, and the Company elected to implement this standard in the second quarter of 2017.
In August 2016, the FASB issued ASU No. 2016-15, Statement of Cash Flows (Topic 230): Classification of Certain Cash Receipts and Cash Payments. This standard clarifies how companies present and classify certain cash receipts and payments in the statement of cash flows. The standard is effective for annual and interim periods beginning after December 15, 2017. At adoption, the Company will elect to continue classifying distributions from equity method investments using the cumulative earnings approach which is consistent with current practice.
In June 2016, the FASB issued ASU No. 2016-13, Measurement of Credit Losses on Financial Instruments. This update changes the accounting for credit losses on loans and held-to-maturity debt securities and requires a current expected credit loss (CECL) approach to determine the allowance for credit losses. This includes allowances for trade receivables. The Company has not historically incurred significant credit losses and does not currently anticipate circumstances that would lead to a CECL approach differing from the Company's existing allowance estimates in a material way. The guidance is effective for fiscal years beginning after December 15, 2019 with a cumulative-effect adjustment to retained earnings as of the beginning of the year of adoption. Early adoption is permitted, however the Company does not plan to do so.
In January, 2016, the FASB issued Accounting Standards Update No. 2016-01, Recognition and Measurement of Financial Assets and Financial Liabilities. This standard provides guidance for the recognition, measurement, presentation, and disclosure of financial instruments. This guidance is effective for annual and interim periods beginning after December 15, 2017, and early adoption is not permitted. The Company does not expect the impact from adoption of this standard to be material to currently held financial assets and liabilities.
53
2. Inventories
Major classes of inventories are as follows:
December 31, | |||||||
(in thousands) | 2017 | 2016 | |||||
Grain | $ | 505,217 | $ | 495,139 | |||
Ethanol and coproducts | 11,003 | 10,887 | |||||
Plant nutrients and cob products | 126,962 | 150,259 | |||||
Retail merchandise | — | 20,678 | |||||
Railcar repair parts | 5,521 | 5,784 | |||||
$ | 648,703 | $ | 682,747 | ||||
Inventories on the Consolidated Balance Sheets at December 31, 2017 and 2016 do not include 1.0 million and 0.9 million bushels of grain, respectively, held in storage for others. The Company does not have title to the grain and is only liable for any deficiencies in grade or shortage of quantity that may arise during the storage period. Management has not experienced historical losses on any deficiencies and does not anticipate material losses in the future.
3. Property, Plant and Equipment
The components of property, plant and equipment are as follows:
December 31, | |||||||
(in thousands) | 2017 | 2016 | |||||
Land | $ | 22,388 | $ | 30,672 | |||
Land improvements and leasehold improvements | 69,127 | 79,631 | |||||
Buildings and storage facilities | 284,820 | 322,856 | |||||
Machinery and equipment | 373,127 | 392,418 | |||||
Construction in progress | 7,502 | 12,784 | |||||
756,964 | 838,361 | ||||||
Less: accumulated depreciation | 372,287 | 388,309 | |||||
$ | 384,677 | $ | 450,052 | ||||
Depreciation expense on property, plant and equipment amounted to $48.3 million, $48.9 million and $46.4 million for the years ended 2017, 2016 and 2015, respectively.
In December 2017, the Company recorded charges totaling $10.9 million for impairment of property, plant and equipment in the Grain segment, of which $5.6 million relates to assets that are deemed held and used and $5.3 million related to assets that have been reclassed as assets held for sale at December 31, 2017. The Company wrote down the value of these assets to the extent their carrying amounts exceeded fair value. The Company classified the significant assumptions used to determine the fair value of the impaired assets as Level 3 inputs in the fair value hierarchy.
In December 2016, the Company recorded charges totaling $6.0 million for impairment of property, plant and equipment in the Retail segment. This does not include $0.5 million of impairment charges related to software. The Company also recorded charges totaling $2.3 million for impairment of property, plant and equipment in the Plant Nutrient segment due to the closing of a cob facility.
Rail Group Assets
The components of the Rail Group assets leased to others are as follows:
54
December 31, | |||||||
(in thousands) | 2017 | 2016 | |||||
Rail Group assets leased to others | $ | 531,391 | $ | 431,571 | |||
Less: accumulated depreciation | 107,948 | 104,376 | |||||
$ | 423,443 | $ | 327,195 | ||||
Depreciation expense on Rail Group assets leased to others amounted to $20.0 million, $18.6 million and $17.6 million for the years ended 2017, 2016 and 2015, respectively.
4. Goodwill and Other Intangible Assets
The changes in the carrying amount of goodwill by reportable segment for the years ended December 31, 2017, 2016 and 2015 are as follows:
(in thousands) | Grain | Plant Nutrient | Rail | Total | ||||||||||||
Balance at January 1, 2015 | $ | 46,422 | $ | 21,776 | $ | 4,167 | $ | 72,365 | ||||||||
Acquisitions | — | 47,735 | — | 47,735 | ||||||||||||
Impairments | (46,422 | ) | (9,744 | ) | — | (56,166 | ) | |||||||||
Balance at December 31, 2015 | — | 59,767 | 4,167 | 63,934 | ||||||||||||
Acquisitions | — | — | — | — | ||||||||||||
Balance at December 31, 2016 | — | 59,767 | 4,167 | 63,934 | ||||||||||||
Acquisitions | 1,171 | — | — | 1,171 | ||||||||||||
Impairments | — | (59,081 | ) | — | (59,081 | ) | ||||||||||
Balance at December 31, 2017 | $ | 1,171 | $ | 686 | $ | 4,167 | $ | 6,024 | ||||||||
Goodwill for the Grain segment is $1.2 million and net of accumulated impairment losses of $46.4 million as of December 31, 2017. Goodwill for the Plant Nutrient segment is $0.7 million and net of accumulated impairment losses of $68.9 million as of December 31, 2017.
Goodwill is tested for impairment annually as of October 1, or more frequently if impairment indicators arise. Upon early adoption of ASU No. 2017-04 during the second quarter of 2017, the Company now uses a one-step quantitative approach that compares the BEV of each reporting unit with its carrying value. The BEV was computed based on both an income approach (discounted cash flows) and a market approach. The income approach uses a reporting unit's estimated future cash flows, discounted at the weighted average cost of capital of a hypothetical third-party buyer. The market approach estimates fair value by applying cash flow multiples to the reporting unit's operating performance. The multiples are derived from comparable publicly traded companies with similar operating and investment characteristics to the reporting unit. Any excess of the carrying value of the goodwill over the BEV will be recorded as an impairment loss. The calculation of the BEV is based on significant unobservable inputs, such as price trends, customer demand, material costs and discount rates, and are classified as Level 3 in the fair value hierarchy.
While performing the annual assessment of goodwill impairment in 2017, the Company recorded an impairment loss related to the Wholesale reporting unit for $17.1 million. The discounted cash flow model used for the income approach assumed discrete period revenue growth through 2022 that was reflective of market opportunities, changes in product mix, and cyclical trends within the Wholesale reporting unit. In the terminal year, the Company assumed a long-term earnings growth rate of 2.0 percent that is believed to be appropriate given the current industry-specific expectations. As of the valuation date, the Company utilized a weighted-average cost of capital of 10.4 percent, which reflects the relative risk and time value of money. This is in addition to the $42.0 million of impairment recorded in the Wholesale reporting unit in the second quarter of this year. As a result, there is no remaining goodwill in the Wholesale reporting unit as of December 31, 2017. No other impairments were incurred in the remaining reporting units as a result of the annual assessment.
In 2016 and 2015, the Company performed a two-step quantitative assessment of goodwill. Step 1 compares the business enterprise value ("BEV") of each reporting unit with its carrying value, as described above. If the BEV is less than the carrying value for any reporting unit, then Step 2 must be performed. Step 2 compares the implied fair value of goodwill with the carrying amount of goodwill. Any excess of the carrying value of the goodwill over the implied fair value will be recorded as
55
an impairment loss. The calculations of the BEV in Step 1 and the implied fair value of goodwill in Step 2 are based on significant unobservable inputs, such as price trends, customer demand, material costs, discount rates and asset replacement costs, and are classified as Level 3 in the fair value hierarchy.
There is a certain degree of uncertainty associated with the key assumptions used. Potential events or changes in circumstances that could reasonably be expected to negatively affect the key assumptions include significant volatility in commodity prices or raw material prices and unanticipated changes in the economy or industries within which the businesses operate.
No goodwill impairment charges were incurred in 2016 as a result of our annual impairment testing.
While performing the annual assessment of goodwill impairment in 2015, the Company recorded impairment losses related to our Grain and Farm Center reporting units of $54.2 million due to compressed margins over the past several years and anticipated unfavorable operating conditions in domestic and global commodity markets, including oil and ethanol, as well as foreign exchange impacts. This is in addition to the $2.0 million of impairment related to our Cob business which was recognized in the third quarter of that year.
The Company's other intangible assets are as follows:
(in thousands) | Original Cost | Accumulated Amortization | Net Book Value | ||||||||
December 31, 2017 | |||||||||||
Intangible asset class | |||||||||||
Customer list | $ | 41,151 | $ | 18,437 | $ | 22,714 | |||||
Non-compete agreement | 4,665 | 3,563 | 1,102 | ||||||||
Supply agreement | 9,806 | 5,699 | 4,107 | ||||||||
Technology | 15,500 | 5,616 | 9,884 | ||||||||
Trademarks and patents | 18,185 | 5,882 | 12,303 | ||||||||
Lease intangible | 12,420 | 5,707 | 6,713 | ||||||||
Software | 84,339 | 28,372 | 55,967 | ||||||||
Other | 2,023 | 1,920 | 103 | ||||||||
$ | 188,089 | $ | 75,196 | $ | 112,893 | ||||||
December 31, 2016 | |||||||||||
Intangible asset class | |||||||||||
Customer list | $ | 41,477 | $ | 14,958 | $ | 26,519 | |||||
Non-compete agreement | 4,594 | 3,064 | 1,530 | ||||||||
Supply agreement | 9,806 | 4,827 | 4,979 | ||||||||
Technology | 15,500 | 4,243 | 11,257 | ||||||||
Trademarks and patents | 18,717 | 4,335 | 14,382 | ||||||||
Lease intangible | 5,514 | 4,969 | 545 | ||||||||
Software | 71,362 | 24,592 | 46,770 | ||||||||
Other | 1,953 | 1,835 | 118 | ||||||||
$ | 168,923 | $ | 62,823 | $ | 106,100 | ||||||
Amortization expense for intangible assets was $18.1 million, $16.8 million and $14.5 million for 2017, 2016 and 2015, respectively. Expected future annual amortization expense is as follows: 2018 -- $18.9 million; 2019 -- $18.0 million; 2020 -- $16.7 million; 2021 -- $15.7 million; and 2022 -- $14.0 million. In December 2016, the Company recorded a $0.5 million impairment related to software in the Retail Group.
5. Debt
Borrowing Arrangements
On April 13, 2017, the Company amended its line of credit agreement with a syndicate of banks. The amended agreement provides for a credit facility in the amount of $800 million. The Company can designate up to $400 million of borrowings as long-term when the debt is used for long-term purposes, such as replacing long-term debt that is maturing, funding the purchase of long-term assets, or increasing permanent working capital when needed. It also provides the Company with up to $90
56
million in letters of credit. Any amounts outstanding on letters of credit will reduce the amount available on the lines of credit. The Company had standby letters of credit outstanding of $32.5 million at December 31, 2017. As of December 31, 2017, the Company had $122.0 million of outstanding borrowings on the lines of credit of which $22.0 million is classified as short-term debt. Borrowings under the lines of credit bear interest at variable interest rates, which are based off LIBOR plus an applicable spread. The maturity date for the line of credit is April 2022. Draw downs and repayments that are less than 90 days are recorded on a net basis in the Consolidated Statements of Cash Flows.
The Company also has a line of credit related to The Andersons Denison Ethanol LLC ("TADE"), a consolidated subsidiary. TADE amended its borrowing arrangement with a syndicate of financial institutions in the fourth quarter of 2017 which provided a $15.0 million long-term line of credit. TADE had no outstanding borrowings under this line of credit as of December 31, 2017. Borrowings under the lines of credit and the term loan bear interest at variable interest rates, which are based off LIBOR plus an applicable spread. The maturity date is July 1, 2021 for the long-term line of credit. TADE was in compliance with all financial and non-financial covenants as of December 31, 2017, including but not limited to minimum working capital and net worth. TADE debt is collateralized by the mortgage on the ethanol facility and related equipment or other assets and is not guaranteed by the Company, therefore it is considered non-recourse debt.
The Company’s short-term and long-term debt at December 31, 2017 and 2016 consisted of the following:
December 31, | |||||||
(in thousands) | 2017 | 2016 | |||||
Short-term debt - non-recourse | $ | — | $ | — | |||
Short-term debt - recourse | 22,000 | 29,000 | |||||
Total short-term debt | $ | 22,000 | $ | 29,000 | |||
Current maturities of long-term debt – non-recourse | $ | — | $ | — | |||
Current maturities of long-term debt – recourse | 54,205 | 47,545 | |||||
Total current maturities of long-term debt | $ | 54,205 | $ | 47,545 | |||
Long-term debt, less current maturities – non-recourse | $ | — | $ | — | |||
Long-term debt, less current maturities – recourse | 418,339 | 397,065 | |||||
Total long-term debt, less current maturities | $ | 418,339 | $ | 397,065 | |||
The following information relates to short-term borrowings:
(in thousands, except percentages) | 2017 | 2016 | 2015 | ||||||||
Maximum amount borrowed | $ | 367,000 | $ | 412,000 | $ | 308,500 | |||||
Weighted average interest rate | 2.56 | % | 1.94 | % | 1.64 | % | |||||
57
Long-Term Debt
Recourse Debt
Long-term debt consists of the following:
December 31, | |||||||
(in thousands, except percentages) | 2017 | 2016 | |||||
Note payable, 4.07%, payable at maturity, due 2021 | $ | 26,000 | $ | 26,000 | |||
Notes payable, 3.72%, paid 2017 | — | 25,000 | |||||
Note payable, 4.55%, payable at maturity, due 2023 | 24,000 | 24,000 | |||||
Note payable, 4.85%, payable at maturity, due 2026 | 25,000 | 25,000 | |||||
Note payable, 6.78%, payable at maturity, due 2018 | 41,500 | 41,500 | |||||
Note payable, 4.92%, payable in increasing amounts ($2.2 million for 2017), plus interest, due 2021 (a) | 18,241 | 20,443 | |||||
Note payable, 4.76%, payable in increasing amounts ($2.1 million for 2017) plus interest, due 2028 (a) | 45,936 | 47,990 | |||||
Note payable, variable rate (3.86% at December 31, 2017), payable in increasing amounts ($1.4 million for 2017) plus interest, due 2023 (a) | 17,786 | 19,179 | |||||
Note payable, 3.29%, payable in increasing amounts ($1.3 million for 2017) plus interest, due 2022 (a) | 20,293 | 21,619 | |||||
Note payable, 4.23%, payable quarterly in varying amounts ($0.7 million for 2017) plus interest, due 2021 (a) | 10,479 | 11,136 | |||||
Notes payable, variable rate, paid 2017 | — | 8,790 | |||||
Note payable, variable rate (3.23% at December 31, 2017), payable in varying amounts ($0.3 million for 2017), plus interest, due 2026 (a) | 8,762 | 9,016 | |||||
Note payable, 4.76%, payable quarterly in varying amounts ($0.4 million for 2017) plus interest, due 2028 (a) | 8,581 | 8,956 | |||||
Note payable, 3.03%, payable at maturity, due 2022 | 100,000 | 30,000 | |||||
Note payable, 3.33%, payable in increasing amounts ($1.0 million for 2017) plus interest, due 2025 (a) | 25,960 | 27,000 | |||||
Note payable, 4.5%, payable at maturity, due 2030 | 16,000 | 16,000 | |||||
Note payable, 5.0%, payable at maturity, due 2040 | 14,000 | 14,000 | |||||
Industrial development revenue bonds: | |||||||
Note payable, variable rate, paid 2017 | — | 6,513 | |||||
Variable rate (2.97% at December 31, 2017), payable at maturity, due 2024 (a) | 14,500 | — | |||||
Variable rate (3.33% at December 31, 2017), payable at maturity, due 2019 (a) | 4,650 | 4,650 | |||||
Variable rate (3.33% at December 31, 2017), payable at maturity, due 2025 (a) | 3,100 | 3,100 | |||||
Variable rate (3.25% at December 31, 2017), payable at maturity, due 2036 | 21,000 | 21,000 | |||||
Debenture bonds, 2.65% to 5.00%, due 2018 through 2032 | 30,432 | 36,931 | |||||
$ | 476,220 | $ | 447,823 | ||||
Less: current maturities | 54,205 | 47,545 | |||||
Less: unamortized prepaid debt issuance costs | 3,676 | 3,213 | |||||
$ | 418,339 | $ | 397,065 | ||||
(a) Debt is collateralized by first mortgages on certain facilities and related equipment or other assets with a book value of $159.9 million
The Company's short-term and long-term borrowing agreements include both financial and non-financial covenants that, among other things, require the Company at a minimum to maintain:
• | tangible net worth of not less than $255 million; |
• | current ratio net of hedged inventory of not less than 1.25 to 1.00; |
• | long-term debt to capitalization of not more than 70%; |
58
• | working capital of not less than $150 million; and |
• | interest coverage ratio of not less than 2.65 to 1.00. |
The Company was in compliance with these financial covenants at and during the years ended December 31, 2017 and 2016.
The aggregate annual maturities of long-term debt are as follows: 2018 -- $54.6 million; 2019 -- $12.1 million; 2020 -- $20.8 million; 2021 -- $35.6 million; 2022 -- $150.8 million; and $202.3 million thereafter.
Non-Recourse Debt
The Company's non-recourse debt, including the lines of credit, held by TADE includes separate financial covenants relating solely to the collateralized TADE assets. The covenants require the following:
• | working capital not less than $14 million; and |
• | debt service coverage ratio of not less than 1.25 to 1.00. |
The Company was in compliance with these financial covenants at and during the years ended December 31, 2017 and 2016.
6. Derivatives
Commodity Contracts
The Company’s operating results are affected by changes to commodity prices. The Grain and Ethanol businesses have established “unhedged” position limits (the amount of a commodity, either owned or contracted for, that does not have an offsetting derivative contract to lock in the price). To reduce the exposure to market price risk on commodities owned and forward grain and ethanol purchase and sale contracts, the Company enters into exchange traded commodity futures and options contracts and over the counter forward and option contracts with various counterparties. These contracts are primarily traded via the regulated CME. The Company’s forward purchase and sales contracts are for physical delivery of the commodity in a future period. Contracts to purchase commodities from producers generally relate to the current or future crop years for delivery periods quoted by regulated commodity exchanges. Contracts for the sale of commodities to processors or other commercial consumers generally do not extend beyond one year.
All of these contracts meet the definition of derivatives. While the Company considers its commodity contracts to be effective economic hedges, the Company does not designate or account for its commodity contracts as hedges as defined under current accounting standards. The Company accounts for its commodity derivatives at estimated fair value. The estimated fair value of the commodity derivative contracts that require the receipt or posting of cash collateral is recorded on a net basis (offset against cash collateral posted or received, also known as margin deposits) within commodity derivative assets or liabilities. Management determines fair value based on exchange-quoted prices and in the case of its forward purchase and sale contracts, estimated fair value is adjusted for differences in local markets and non-performance risk. For contracts for which physical delivery occurs, balance sheet classification is based on estimated delivery date. For futures, options and over-the-counter contracts in which physical delivery is not expected to occur but, rather, the contract is expected to be net settled, the Company classifies these contracts as current or noncurrent assets or liabilities, as appropriate, based on the Company’s expectations as to when such contracts will be settled.
Realized and unrealized gains and losses in the value of commodity contracts (whether due to changes in commodity prices, changes in performance or credit risk, or due to sale, maturity or extinguishment of the commodity contract) and grain inventories are included in cost of sales and merchandising revenues.
Generally accepted accounting principles permit a party to a master netting arrangement to offset fair value amounts recognized for derivative instruments against the right to reclaim cash collateral or obligation to return cash collateral under the same master netting arrangement. The Company has master netting arrangements for its exchange traded futures and options contracts and certain over-the-counter contracts. When the Company enters into a future, option or an over-the-counter contract, an initial margin deposit may be required by the counterparty. The amount of the margin deposit varies by commodity. If the market price of a future, option or an over-the-counter contract moves in a direction that is adverse to the Company’s position, an additional margin deposit, called a maintenance margin, is required. The margin deposit assets and liabilities are included in short-term commodity derivative assets or liabilities, as appropriate, in the Consolidated Balance Sheets.
59
The following table presents at December 31, 2017 and 2016, a summary of the estimated fair value of the Company’s commodity derivative instruments that require cash collateral and the associated cash posted/received as collateral. The net asset or liability positions of these derivatives (net of their cash collateral) are determined on a counterparty-by-counterparty basis and are included within current or noncurrent commodity derivative assets (or liabilities) on the Consolidated Balance Sheets:
December 31, 2017 | December 31, 2016 | ||||||||||||||
(in thousands) | Net Derivative Asset Position | Net Derivative Liability Position | Net Derivative Asset Position | Net Derivative Liability Position | |||||||||||
Collateral paid | $ | 1,351 | $ | — | $ | 28,273 | $ | — | |||||||
Fair value of derivatives | 17,252 | — | 1,599 | — | |||||||||||
Balance at end of period | $ | 18,603 | $ | — | $ | 29,872 | $ | — | |||||||
The following table presents, on a gross basis, current and noncurrent commodity derivative assets and liabilities:
December 31, 2017 | |||||||||||||||||||
(in thousands) | Commodity Derivative Assets - Current | Commodity Derivative Assets - Noncurrent | Commodity Derivative Liabilities - Current | Commodity Derivative Liabilities - Noncurrent | Total | ||||||||||||||
Commodity derivative assets | $ | 36,929 | $ | 311 | $ | 489 | $ | 1 | $ | 37,730 | |||||||||
Commodity derivative liabilities | (7,578 | ) | (1 | ) | (30,140 | ) | (826 | ) | (38,545 | ) | |||||||||
Cash collateral | 1,351 | — | — | — | 1,351 | ||||||||||||||
Balance sheet line item totals | $ | 30,702 | $ | 310 | $ | (29,651 | ) | $ | (825 | ) | $ | 536 | |||||||
December 31, 2016 | |||||||||||||||||||
(in thousands) | Commodity Derivative Assets - Current | Commodity Derivative Assets - Noncurrent | Commodity Derivative Liabilities - Current | Commodity Derivative Liabilities - Noncurrent | Total | ||||||||||||||
Commodity derivative assets | $ | 36,146 | $ | 140 | $ | 1,447 | $ | 6 | $ | 37,739 | |||||||||
Commodity derivative liabilities | (18,972 | ) | (40 | ) | (24,614 | ) | (345 | ) | (43,971 | ) | |||||||||
Cash collateral | 28,273 | — | — | — | 28,273 | ||||||||||||||
Balance sheet line item totals | $ | 45,447 | $ | 100 | $ | (23,167 | ) | $ | (339 | ) | $ | 22,041 | |||||||
The net pre-tax gains on commodity derivatives not designated as hedging instruments included in the Company’s Consolidated Statements of Operations and the line items in which they are located for the years ended December 31, 2017, 2016, and 2015 are as follows:
Year Ended December 31, | |||||||||
(in thousands) | 2017 | 2016 | 2015 | ||||||
Gains (Losses) on commodity derivatives included in cost of sales and merchandising revenues | $ | 5,417 | (15,012 | ) | 62,541 | ||||
60
The Company had the following volume of commodity derivative contracts outstanding (on a gross basis) as of December 31, 2017 and 2016:
December 31, 2017 | |||||||||||
Commodity (in thousands) | Number of Bushels | Number of Gallons | Number of Pounds | Number of Tons | |||||||
Non-exchange traded: | |||||||||||
Corn | 218,391 | — | |||||||||
Soybeans | 18,127 | — | — | — | |||||||
Wheat | 14,577 | — | — | — | |||||||
Oats | 25,953 | — | — | — | |||||||
Ethanol | — | 197,607 | — | — | |||||||
Corn oil | — | — | 6,074 | — | |||||||
Other | 47 | — | — | 97 | |||||||
Subtotal | 277,095 | 197,607 | 6,074 | 97 | |||||||
Exchange traded: | |||||||||||
Corn | 82,835 | — | — | — | |||||||
Soybeans | 37,170 | — | — | — | |||||||
Wheat | 65,640 | — | — | — | |||||||
Oats | 1,345 | — | — | — | |||||||
Ethanol | — | 39,438 | — | — | |||||||
Other | — | 840 | — | — | |||||||
Subtotal | 186,990 | 40,278 | — | — | |||||||
Total | 464,085 | 237,885 | 6,074 | 97 | |||||||
December 31, 2016 | |||||||||||
Commodity (in thousands) | Number of Bushels | Number of Gallons | Number of Pounds | Number of Tons | |||||||
Non-exchange traded: | |||||||||||
Corn | 175,549 | — | — | — | |||||||
Soybeans | 20,592 | — | — | — | |||||||
Wheat | 7,177 | — | — | — | |||||||
Oats | 36,025 | — | — | — | |||||||
Ethanol | — | 215,081 | — | — | |||||||
Corn oil | — | — | 9,358 | — | |||||||
Other | 108 | 1,144 | — | 110 | |||||||
Subtotal | 239,451 | 216,225 | 9,358 | 110 | |||||||
Exchange traded: | |||||||||||
Corn | 63,225 | — | — | — | |||||||
Soybeans | 39,005 | — | — | — | |||||||
Wheat | 45,360 | — | — | — | |||||||
Oats | 4,120 | — | — | — | |||||||
Ethanol | — | 78,120 | — | — | |||||||
Subtotal | 151,710 | 78,120 | — | — | |||||||
Total | 391,161 | 294,345 | 9,358 | 110 | |||||||
61
Interest Rate and Other Derivatives
The Company periodically enters into interest rate contracts to manage interest rate risk on borrowing or financing activities. While the Company considers all of its interest rate derivative positions to be effective economic hedges of specified risks, these interest rate contracts are recorded on the balance sheet in other current assets or liabilities (if short-term in nature) or in other assets or other long-term liabilities (if non-current in nature) and changes in fair value are recognized currently in earnings as a component of interest expense. The Company also has foreign currency derivatives which are considered effective economic hedges of specified economic risks.
The following table presents the open interest rate contracts at December 31, 2017:
Interest Rate Hedging Instrument | Year Entered | Year of Maturity | Initial Notional Amount (in millions) | Hedged Item | Interest Rate | |||||||
Long-term | ||||||||||||
Swap | 2012 | 2023 | $ | 23.0 | Interest rate component of debt - not accounted for as a hedge | 1.9% | ||||||
Collar | 2013 | 2021 | 40.0 | Interest rate component of debt - not accounted for as a hedge | 2.9% to 4.8% | |||||||
Total | $ | 63.0 | ||||||||||
At December 31, 2017 and 2016, the Company had recorded the following amounts for the fair value of the Company's other derivatives not designated as hedging instruments:
December 31, | |||||||
(in thousands) | 2017 | 2016 | |||||
Interest rate contracts included in Other long term liabilities | $ | (1,244 | ) | $ | (2,530 | ) | |
Foreign currency contracts included in Other current assets (Accrued expenses and other current liabilities) | $ | 426 | $ | (112 | ) | ||
The gains and losses included in the Company's Consolidated Statements of Operations and the line item in which they are located for derivatives not designated as hedging instruments are as follows:
Year ended December 31, | |||||||
(in thousands) | 2017 | 2016 | |||||
Interest rate derivative gains (losses) included in Interest expense | $ | 1,286 | $ | 603 | |||
Foreign currency contracts included in Other income | $ | 539 | $ | (112 | ) | ||
7. Employee Benefit Plans
The Company provides certain full-time employees with pension benefits under defined benefit and defined contribution plans. The measurement date for all plans is December 31. The Company's expense for its defined contribution plans amounted to $7.3 million in 2017, $7.8 million in 2016 and $8.7 million in 2015. The Company also provides health insurance benefits to certain employees and retirees.
The Company has an unfunded noncontributory defined benefit pension plan. The plan provides defined benefits based on years of service and average monthly compensation using a career average formula. Pension benefits were frozen at July 1, 2010. The Company also had a funded defined benefit plan which was terminated in 2015.
Effective December 2015, the funded defined benefit plan (the "Plan") was amended to include a lump-sum pension benefit payout option for certain plan participants. In addition, in December 2015, the Plan completed the purchase of group annuity contracts that transferred the liability for the remaining retirees and active employees who did not elect a lump sum option to an insurance company. As a result of these changes, we recognized pension settlement charges of $31.9 million after tax ($51.4 million pre-tax) during the twelve months ended December 31, 2015.
The Company also has postretirement health care benefit plans covering substantially all of its full time employees hired prior to January 1, 2003. These plans are generally contributory and include a cap on the Company's share of the related costs.
62
Obligation and Funded Status
Following are the details of the obligation and funded status of the pension and postretirement benefit plans:
(in thousands) | Pension Benefits | Postretirement Benefits | |||||||||||||
Change in benefit obligation | 2017 | 2016 | 2017 | 2016 | |||||||||||
Benefit obligation at beginning of year | $ | 7,112 | $ | 8,677 | $ | 29,757 | $ | 39,152 | |||||||
Service cost | — | — | 391 | 760 | |||||||||||
Interest cost | 155 | 194 | 985 | 1,549 | |||||||||||
Actuarial (gains) losses | (245 | ) | (421 | ) | (7,903 | ) | (10,823 | ) | |||||||
Participant contributions | — | — | 463 | 653 | |||||||||||
Retiree drug subsidy received | — | — | 184 | 5 | |||||||||||
Benefits paid | (1,190 | ) | (1,338 | ) | (1,275 | ) | (1,539 | ) | |||||||
Benefit obligation at end of year | $ | 5,832 | $ | 7,112 | $ | 22,602 | $ | 29,757 | |||||||
(in thousands) | Pension Benefits | Postretirement Benefits | |||||||||||||
Change in plan assets | 2017 | 2016 | 2017 | 2016 | |||||||||||
Fair value of plan assets at beginning of year | $ | — | $ | 285 | $ | — | $ | — | |||||||
Actual gains on plan assets | — | — | — | — | |||||||||||
Company contributions | 1,190 | 1,053 | 812 | 886 | |||||||||||
Participant contributions | — | — | 463 | 653 | |||||||||||
Benefits paid | (1,190 | ) | (1,338 | ) | (1,275 | ) | (1,539 | ) | |||||||
Fair value of plan assets at end of year | $ | — | $ | — | $ | — | $ | — | |||||||
Under funded status of plans at end of year | $ | (5,832 | ) | $ | (7,112 | ) | $ | (22,602 | ) | $ | (29,757 | ) | |||
Amounts recognized in the Consolidated Balance Sheets at December 31, 2017 and 2016 consist of:
Pension Benefits | Postretirement Benefits | ||||||||||||||
(in thousands) | 2017 | 2016 | 2017 | 2016 | |||||||||||
Accrued expenses | $ | (1,232 | ) | $ | (1,295 | ) | $ | (1,098 | ) | $ | (1,148 | ) | |||
Employee benefit plan obligations | (4,600 | ) | (5,817 | ) | (21,504 | ) | (28,609 | ) | |||||||
Net amount recognized | $ | (5,832 | ) | $ | (7,112 | ) | $ | (22,602 | ) | $ | (29,757 | ) | |||
Following are the details of the pre-tax amounts recognized in accumulated other comprehensive loss at December 31, 2017:
Pension Benefits | Postretirement Benefits | ||||||||||||||
(in thousands) | Unamortized Actuarial Net Losses | Unamortized Prior Service Costs | Unamortized Actuarial Net Losses | Unamortized Prior Service Costs | |||||||||||
Balance at beginning of year | $ | 4,244 | $ | — | $ | 397 | $ | — | |||||||
Amounts arising during the period | (245 | ) | — | (7,903 | ) | — | |||||||||
Amounts recognized as a component of net periodic benefit cost | (252 | ) | — | — | 455 | ||||||||||
Balance at end of year | $ | 3,747 | $ | — | $ | (7,506 | ) | $ | 455 | ||||||
The amounts in accumulated other comprehensive loss that are expected to be recognized as components of net periodic benefit cost during the next fiscal year, excluding the impact of the pension termination, are as follows:
(in thousands) | Pension | Postretirement | Total | ||||||||
Prior service cost | $ | — | $ | (455 | ) | $ | (455 | ) | |||
Net actuarial loss | 252 | — | 252 | ||||||||
63
Amounts applicable to the Company's defined benefit plans with accumulated benefit obligations in excess of plan assets are as follows:
December 31, | |||||||
(in thousands) | 2017 | 2016 | |||||
Projected benefit obligation | $ | 5,832 | $ | 7,112 | |||
Accumulated benefit obligation | $ | 5,832 | $ | 7,112 | |||
The combined benefits expected to be paid for all Company defined benefit plans over the next ten years (in thousands) are as follows:
Year | Expected Pension Benefit Payout | Expected Postretirement Benefit Payout | ||||||
2018 | $ | 1,232 | $ | 1,098 | ||||
2019 | 1,316 | 1,125 | ||||||
2020 | 1,255 | 1,146 | ||||||
2021 | 1,168 | 1,173 | ||||||
2022 | 311 | 1,204 | ||||||
2023-2027 | 957 | 6,262 | ||||||
Following are components of the net periodic benefit cost for each year:
Pension Benefits | Postretirement Benefits | ||||||||||||||||||||||
December 31, | December 31, | ||||||||||||||||||||||
(in thousands) | 2017 | 2016 | 2015 | 2017 | 2016 | 2015 | |||||||||||||||||
Service cost | $ | — | $ | — | $ | 236 | $ | 391 | $ | 760 | $ | 900 | |||||||||||
Interest cost | 155 | 194 | 182 | 985 | 1,549 | 1,584 | |||||||||||||||||
Expected return on plan assets | — | — | — | (455 | ) | (355 | ) | (543 | ) | ||||||||||||||
Recognized net actuarial loss | 252 | 146 | 1,516 | — | 768 | 1,517 | |||||||||||||||||
Benefit cost (income) | $ | 407 | $ | 340 | $ | 1,934 | $ | 921 | $ | 2,722 | $ | 3,458 | |||||||||||
Following are weighted average assumptions of pension and postretirement benefits for each year:
Pension Benefits | Postretirement Benefits | ||||||||||||||
2017 | 2016 | 2015 | 2017 | 2016 | 2015 | ||||||||||
Used to Determine Benefit Obligations at Measurement Date | |||||||||||||||
Discount rate (a) | N/A | N/A | N/A | 3.4 | % | 4.0 | % | 4.2 | % | ||||||
Used to Determine Net Periodic Benefit Cost for Years ended December 31 | |||||||||||||||
Discount rate (b) | N/A | N/A | 0.65 | % | 3.7 | % | 4.2 | % | 3.9 | % | |||||
Expected long-term return on plan assets | N/A | N/A | N/A | — | — | — | |||||||||
Rate of compensation increases | N/A | N/A | N/A | — | — | — | |||||||||
(a) | The calculated rate for the unfunded employee retirement plan was 2.50%, 2.40% and 2.60% in 2017, 2016 and 2015, respectively. Since it was terminated in 2015, the defined benefit pension plan did not have a discount rate in 2015, 2016 or 2017. |
(b) | The calculated rate for the unfunded employee retirement plan was 2.40%, 2.60% and 2.40% in 2017, 2016 and 2015, respectively. Since it was terminated in 2015, the defined benefit pension plan did not have a discount rate in 2015, 2016 or 2017. |
Assumed Health Care Cost Trend Rates at Beginning of Year | |||||
2017 | 2016 | ||||
Health care cost trend rate assumed for next year | 3.0 | % | 5.0 | % | |
Rate to which the cost trend rate is assumed to decline (the ultimate trend rate) (a) | N/A | 5.0 | % | ||
Year that the rate reaches the ultimate trend rate (a) | N/A | 2017 | |||
(a) | In 2017, the Company's remaining uncapped participants were converted to a Medicare Exchange Health Reimbursement Arrangement, which put a 2% cap on the Company's share of the related costs. |
64
8. Income Taxes
Income tax provision (benefit) applicable to continuing operations consists of the following:
Year ended December 31, | |||||||||||
(in thousands) | 2017 | 2016 | 2015 | ||||||||
Current: | |||||||||||
Federal | $ | (1,668 | ) | $ | (702 | ) | $ | (3,237 | ) | ||
State and local | 643 | 199 | (762 | ) | |||||||
Foreign | 1,125 | 1,385 | 1,224 | ||||||||
$ | 100 | $ | 882 | $ | (2,775 | ) | |||||
Deferred: | |||||||||||
Federal | $ | (61,655 | ) | $ | 3,523 | $ | 1,756 | ||||
State and local | (2,107 | ) | 1,696 | 519 | |||||||
Foreign | 528 | 810 | 258 | ||||||||
$ | (63,234 | ) | $ | 6,029 | $ | 2,533 | |||||
Total: | |||||||||||
Federal | $ | (63,323 | ) | $ | 2,821 | $ | (1,481 | ) | |||
State and local | (1,464 | ) | 1,895 | (243 | ) | ||||||
Foreign | 1,653 | 2,195 | 1,482 | ||||||||
$ | (63,134 | ) | $ | 6,911 | $ | (242 | ) | ||||
Income (loss) before income taxes from continuing operations consists of the following:
Year ended December 31, | |||||||||||
(in thousands) | 2017 | 2016 | 2015 | ||||||||
U.S. | $ | (25,645 | ) | $ | 11,526 | $ | (18,867 | ) | |||
Foreign | 5,120 | 9,855 | 7,303 | ||||||||
$ | (20,525 | ) | $ | 21,381 | $ | (11,564 | ) | ||||
65
A reconciliation from the statutory U.S. federal tax rate to the effective tax rate follows:
Year ended December 31, | ||||||||
2017 | 2016 | 2015 | ||||||
Statutory U.S. federal tax rate | 35.0 | % | 35.0 | % | 35.0 | % | ||
Increase (decrease) in rate resulting from: | ||||||||
Effect of noncontrolling interest | 0.2 | (4.7 | ) | 5.3 | ||||
State and local income taxes, net of related federal taxes | (4.2 | ) | 5.8 | 1.4 | ||||
Income taxes on foreign earnings | (2.2 | ) | (1.3 | ) | 9.4 | |||
Change in federal and state tax rates | 374.8 | — | — | |||||
Goodwill impairment | (93.5 | ) | — | (35.6 | ) | |||
Equity Method Investments | (0.4 | ) | 0.3 | 1.9 | ||||
Tax effect of one-time transition tax | (7.1 | ) | — | — | ||||
Release of unrecognized tax benefts | 3.0 | 0.1 | 0.5 | |||||
Nondeductible compensation | (2.5 | ) | 2.0 | (5.0 | ) | |||
Tax associated with accrued and unpaid dividends | 0.1 | 3.2 | (13.6 | ) | ||||
Federal income tax credits | — | (7.3 | ) | — | ||||
Change in pre-acquisition tax liability and other costs | — | — | 3.5 | |||||
Other, net | 4.4 | (0.8 | ) | (0.7 | ) | |||
Effective tax rate | 307.6 | % | 32.3 | % | 2.1 | % | ||
Net income tax payments of $2.1 million were paid in 2017. Net income refunds of $10.6 million were received in 2016. Net income taxes of $4.9 million were paid in 2015.
Significant components of the Company's deferred tax liabilities and assets are as follows:
December 31, | |||||||
(in thousands) | 2017 | 2016 | |||||
Deferred tax liabilities: | |||||||
Property, plant and equipment and Rail Group assets leased to others | $ | (129,876 | ) | $ | (179,250 | ) | |
Equity method investments | (31,223 | ) | (45,244 | ) | |||
Other | (8,754 | ) | (22,286 | ) | |||
(169,853 | ) | (246,780 | ) | ||||
Deferred tax assets: | |||||||
Employee benefits | 15,229 | 25,403 | |||||
Accounts and notes receivable | 2,317 | 2,964 | |||||
Inventory | 6,100 | 9,979 | |||||
Federal income tax credits | 10,225 | 7,150 | |||||
Net operating loss carryforwards | 5,753 | 3,322 | |||||
Other | 9,674 | 16,224 | |||||
Total deferred tax assets | 49,298 | 65,042 | |||||
Valuation allowance | (1,024 | ) | (310 | ) | |||
48,274 | 64,732 | ||||||
Net deferred tax liabilities | $ | (121,579 | ) | $ | (182,048 | ) | |
On December 22, 2017, the US enacted the Tax Cuts and Jobs Act (the “Act”). The Act, which is also commonly referred to as “US tax reform”, significantly changes US corporate income tax laws by, among other things, reducing the US corporate income tax rate to 21% starting in 2018 and creating a territorial tax system with a one-time mandatory tax on previously deferred foreign earnings of US subsidiaries. As a result, the Company recorded a net benefit of $73.5 million during the fourth quarter of 2017. This amount, which is included in tax expense (benefit) in the Consolidated Statement of Income (Loss), consists of two components: (i) a $1.4 million net charge relating to the one-time mandatory tax on previously deferred earnings of certain non-US subsidiaries
66
that are owned either wholly or partially by a US subsidiary of the Company, and (ii) a $74.9 million credit resulting from the remeasurement of the Company's net deferred tax liabilities in the US based on the new lower corporate income tax rate.
Although the $73.5 million net benefit represents what the Company believes is a reasonable estimate of the impact of the income tax effects of the Act on the Company's Consolidated Financial Statements as of December 31, 2017, it should be considered provisional. Once the Company finalizes certain tax positions when it files its 2017 US tax return, it will be able to conclude whether any further adjustments are required to its net deferred tax liability balance in the US of $122 million as of December 31, 2017, as well as to the liability associated with the one-time mandatory tax. Any adjustments to these provisional amounts will be reported as a component of Tax expense (benefit) in the reporting period in which any such adjustments are determined, which will be no later than the fourth quarter of 2018.
On December 31, 2017, the Company had $15.7 million, $81.9 million and $0.1 million of U.S. Federal, state and non-U.S. net operating loss carryforwards that begin to expire in 2034, 2018 and 2035, respectively. The Company also has $7.1 million of general business credits that expire after 2036 and $3.1 million of foreign tax credits that begin to expire after 2025.
During 2016, the Company entered into agreements with several unrelated third-parties to fund qualified railroad track maintenance expenditures. In return, railroad track miles were assigned to the Company which enabled the Company to claim railroad track maintenance credits pursuant to section 45G of the Internal Revenue Code of 1986. $2.6 million of tax benefit was realized as a result of the agreements for the year ended December 31, 2016, resulting in a $0.9 million current tax provision benefit. As of December 31, 2016, $6.0 million of credits have been deferred to future periods which, upon realization, will result in a $1.8 million current tax provision benefit. The railroad track maintenance credits are general business credits included in federal income tax credits above. The current year impact for the tax period ending December 31, 2017 was immaterial to the overall provision.
Deferred income tax assets and liabilities are recognized for the future tax consequences attributable to differences between financial statement carrying amounts of existing assets and liabilities and their respective tax bases and operating loss and tax credit carryforwards. Deferred tax assets and liabilities are measured using enacted tax rates expected to apply to taxable income in the years in which those temporary differences are expected to be recovered or settled. If it is more-likely-than-not that the deferred tax asset will be realized, no valuation allowance is recorded. Management's judgment is required in determining the provision for income taxes, deferred tax assets and liabilities and the valuation allowance recorded against the net deferred tax assets. The valuation allowance would need to be adjusted in the event future taxable income is materially different than amounts estimated. Significant judgments, estimates and factors considered by management in its determination of the probability of the realization of deferred tax assets include:
• | Historical operating results |
• | Expectations of future earnings |
• | Tax planning strategies; and |
• | The extended period of time over which retirement, medical, and pension liabilities will be paid. |
During the fourth quarter of fiscal year 2017, due to a three-year cumulative loss and future economic uncertainty, we concluded that a valuation allowance was required related to additional State net operating losses. This resulted in a non-cash charge to income tax expense of $0.6 million.
The Company or one of its subsidiaries files income tax returns in the U.S., various foreign jurisdictions and various state and local jurisdictions. The Company is no longer subject to examinations by foreign jurisdictions for years before 2012 and is no longer subject to examinations by U.S. tax authorities for years before 2014. The Company is no longer subject to examination by state tax authorities in most states for tax years before 2014.
67
A reconciliation of the January 1, 2015 to December 31, 2017 amount of unrecognized tax benefits is as follows:
(in thousands) | |||
Balance at January 1, 2015 | $ | 1,487 | |
Additions based on tax positions related to the current year | 55 | ||
Additions based on tax positions related to prior years | 691 | ||
Reductions based on tax positions related to prior years | (518 | ) | |
Reductions as a result of a lapse in statute of limitations | (284 | ) | |
Balance at December 31, 2015 | 1,431 | ||
Additions based on tax positions related to the current year | 113 | ||
Reductions based on tax positions related to prior years | (40 | ) | |
Reductions as a result of a lapse in statute of limitations | (52 | ) | |
Balance at December 31, 2016 | 1,452 | ||
Additions based on tax positions related to the current year | — | ||
Additions based on tax positions related to prior years | — | ||
Reductions based on tax positions related to prior years | (92 | ) | |
Reductions as a result of a lapse in statute of limitations | (573 | ) | |
Balance at December 31, 2017 | $ | 787 | |
The Company anticipates $0.2 million decrease in the reserve during the next 12 months due to the settling of state tax appeals and a lapse in statute of limitations. Dependent upon the lapse in statute of limitations and the outcome of the state tax appeals, the total liability for unrecognized tax benefits as of December 31, 2017 could impact the effective tax rate.
The Company has elected to classify interest and penalties as interest expense and penalty expense, respectively, rather than as income tax expense. The Company has $0.3 million accrued for the payment of interest and penalties at December 31, 2017. The net interest and penalties benefit for 2017 is $0.1 million, due to decreased uncertain tax positions. The Company had $0.4 million accrued for the payment of interest and penalties at December 31, 2016. The net interest and penalties expense for 2016 was $0.2 million.
9. Accumulated Other Comprehensive Loss
The following tables summarize the after-tax components of accumulated other comprehensive income (loss) attributable to the Company for the years ended December 31, 2017, 2016, and 2015:
Changes in Accumulated Other Comprehensive Income (Loss) by Component (a) | |||||||||||||||||
(in thousands) | Foreign Currency Translation Adjustments | Investment in Convertible Preferred Securities | Defined Benefit Plan Items | Total | |||||||||||||
Beginning Balance | $ | (11,002 | ) | $ | — | $ | (1,466 | ) | $ | (12,468 | ) | ||||||
Other comprehensive income before reclassifications | 3,286 | 344 | 6,485 | 10,115 | |||||||||||||
Amounts reclassified from accumulated other comprehensive loss | — | — | (347 | ) | (347 | ) | |||||||||||
Net current-period other comprehensive income | 3,286 | 344 | 6,138 | 9,768 | |||||||||||||
Ending balance | $ | (7,716 | ) | $ | 344 | $ | 4,672 | $ | (2,700 | ) | |||||||
68
Changes in Accumulated Other Comprehensive Income (Loss) by Component (a) | |||||||||||||||||||||
For the Year Ended December 31, 2016 | |||||||||||||||||||||
(in thousands) | Losses on Cash Flow Hedges | Foreign Currency Translation Adjustments | Investment in Debt Securities | Defined Benefit Plan Items | Total | ||||||||||||||||
Beginning Balance | $ | (111 | ) | $ | (12,041 | ) | $ | 126 | $ | (8,913 | ) | $ | (20,939 | ) | |||||||
Other comprehensive income before reclassifications | 111 | 1,039 | — | 7,668 | $ | 8,818 | |||||||||||||||
Amounts reclassified from accumulated other comprehensive loss | — | — | (126 | ) | (221 | ) | $ | (347 | ) | ||||||||||||
Net current-period other comprehensive income | 111 | 1,039 | (126 | ) | 7,447 | 8,471 | |||||||||||||||
Ending balance | $ | — | $ | (11,002 | ) | $ | — | $ | (1,466 | ) | $ | (12,468 | ) | ||||||||
Changes in Accumulated Other Comprehensive Income (Loss) by Component (a) | |||||||||||||||||||||
For the Year Ended December 31, 2015 | |||||||||||||||||||||
(in thousands) | Losses on Cash Flow Hedges | Foreign Currency Translation Adjustments | Investment in Debt Securities | Defined Benefit Plan Items | Total | ||||||||||||||||
Beginning Balance | $ | (364 | ) | $ | (4,709 | ) | $ | 126 | $ | (49,648 | ) | $ | (54,595 | ) | |||||||
Other comprehensive income before reclassifications | 253 | (7,332 | ) | — | (24,746 | ) | $ | (31,825 | ) | ||||||||||||
Amounts reclassified from accumulated other comprehensive loss | — | — | — | 65,481 | $ | 65,481 | |||||||||||||||
Net current-period other comprehensive income | 253 | (7,332 | ) | — | 40,735 | 33,656 | |||||||||||||||
Ending balance | $ | (111 | ) | $ | (12,041 | ) | $ | 126 | $ | (8,913 | ) | $ | (20,939 | ) | |||||||
(a) All amounts are net of tax. Amounts in parentheses indicate debits
The Following tables show the reclassification adjustments from accumulated other comprehensive income to net income for the years ended December 31, 2017, 2016, and 2015:
Reclassifications Out of Accumulated Other Comprehensive Income (a) | ||||||
(in thousands) | For the Year Ended December 31, 2017 | |||||
Details about Accumulated Other Comprehensive Income Components | Amount Reclassified from Accumulated Other Comprehensive Income | Affected Line Item in the Statement Where Net Income Is Presented | ||||
Defined Benefit Plan Items | ||||||
Amortization of prior-service cost | $ | (455 | ) | (b) | ||
(455 | ) | Income (loss) before income taxes | ||||
108 | Income tax benefit | |||||
$ | (347 | ) | Net income (loss) | |||
Total reclassifications for the period | $ | (347 | ) | Net income (loss) | ||
69
Reclassifications Out of Accumulated Other Comprehensive Income (a) | ||||||
(in thousands) | For the Year Ended December 31, 2016 | |||||
Details about Accumulated Other Comprehensive Income Components | Amount Reclassified from Accumulated Other Comprehensive Income | Affected Line Item in the Statement Where Net Income Is Presented | ||||
Defined Benefit Plan Items | ||||||
Amortization of prior-service cost | $ | (354 | ) | (b) | ||
(354 | ) | Income (loss) before income taxes | ||||
133 | Income tax benefit | |||||
$ | (221 | ) | Net income (loss) | |||
Other Items | ||||||
Recognition of gain on sale of investment | (200 | ) | (b) | |||
(200 | ) | Income before income taxes | ||||
74 | Income tax benefit | |||||
(126 | ) | Net income (loss) | ||||
Total reclassifications for the period | $ | (347 | ) | Net income (loss) | ||
Reclassifications Out of Accumulated Other Comprehensive Income (a) | ||||||
(in thousands) | For the Year Ended December 31, 2015 | |||||
Details about Accumulated Other Comprehensive Income Components | Amount Reclassified from Accumulated Other Comprehensive Income | Affected Line Item in the Statement Where Net Income Is Presented | ||||
Defined Benefit Plan Items | ||||||
Amortization of prior-service cost | $ | (543 | ) | (b) | ||
(543 | ) | Income (loss) before income taxes | ||||
204 | Income tax benefit | |||||
$ | (339 | ) | Net income (loss) | |||
Other Items | ||||||
Settlement of defined benefit plan | (64,939 | ) | ||||
(64,939 | ) | Income (loss) before income taxes | ||||
24,746 | Income tax benefit | |||||
(40,193 | ) | Net income (loss) | ||||
Total reclassifications for the period | $ | (40,532 | ) | Net income (loss) | ||
(a) Amounts in parentheses indicate debits to profit/loss
(b) This accumulated other comprehensive income component is included in the computation of net periodic benefit cost (see Note 7. Employee Benefit Plans footnote for additional details)
70
10. Earnings Per Share
Unvested share-based payment awards that contain non-forfeitable rights to dividends are participating securities and are included in the computation of earnings per share pursuant to the two-class method. The two-class method of computing earnings per share is an earnings allocation formula that determines earnings per share for common stock and any participating securities according to dividends declared (whether paid or unpaid) and participation rights in undistributed earnings. The Company’s non-vested restricted stock granted is considered a participating security since the share-based awards contain a non-forfeitable right to dividends irrespective of whether the awards ultimately vest.
The computation of basic and diluted earnings per share is as follows:
(in thousands except per common share data) | Year ended December 31, | ||||||||||
2017 | 2016 | 2015 | |||||||||
Net income (loss) attributable to The Andersons, Inc. | $ | 42,511 | $ | 11,594 | $ | (13,067 | ) | ||||
Less: Distributed and undistributed earnings allocated to non-vested restricted stock | 1 | 9 | 29 | ||||||||
Earnings (losses) available to common shareholders | $ | 42,510 | $ | 11,585 | $ | (13,096 | ) | ||||
Earnings per share – basic: | |||||||||||
Weighted average shares outstanding – basic | 28,126 | 28,193 | 28,288 | ||||||||
Earnings (losses) per common share – basic | $ | 1.51 | $ | 0.41 | $ | (0.46 | ) | ||||
Earnings per share – diluted: | |||||||||||
Weighted average shares outstanding – basic | 28,126 | 28,193 | 28,288 | ||||||||
Effect of dilutive awards | 170 | 238 | — | ||||||||
Weighted average shares outstanding – diluted | 28,296 | 28,431 | 28,288 | ||||||||
Earnings (losses) per common share – diluted | $ | 1.50 | $ | 0.41 | $ | (0.46 | ) | ||||
There were 22 thousand antidilutive share-based awards outstanding at December 31, 2017. No antidilutive share-based awards were outstanding at December 31, 2016. All outstanding share-based awards were antidilutive in 2015 as the Company experienced a net loss.
11. Fair Value Measurements
Generally accepted accounting principles define fair value as an exit price and also establish a framework for measuring fair value. An exit price represents the amount that would be received upon the sale of an asset or paid to transfer a liability in an orderly transaction between market participants. Fair value should be determined based on the assumptions that market participants would use in pricing the asset or liability. As a basis for considering such assumptions, a three-tier fair value hierarchy is used, which prioritizes the inputs used in measuring fair value as follows:
• | Level 1 inputs: Quoted prices (unadjusted) for identical assets or liabilities in active markets; |
• | Level 2 inputs: Inputs other than quoted prices included in Level 1 that are observable for the asset or liability either directly or indirectly; and |
• | Level 3 inputs: Unobservable inputs (e.g., a reporting entity's own data). |
In many cases, a valuation technique used to measure fair value includes inputs from multiple levels of the fair value hierarchy. The lowest level of significant input determines the placement of the entire fair value measurement in the hierarchy.
The following tables present the Company's assets and liabilities that are measured at fair value on a nonrecurring basis at December 31, 2017:
(in thousands) | December 31, 2017 | ||||||||||||||
Assets (liabilities) | Level 1 | Level 2 | Level 3 | Total | |||||||||||
Property, plant and equipment (a) | $ | — | $ | — | $ | 29,347 | $ | 29,347 | |||||||
Total | $ | — | $ | — | $ | 29,347 | $ | 29,347 | |||||||
(a) | The Company recognized impairment charges on certain grain assets during 2017 and measured the fair value using Level 3 inputs on a nonrecurring basis. The fair value of the grain assets was determined using prior transactions, prior third-party appraisals and a pending sale of grain assets held by the Company. |
71
72
The following table presents the Company's assets and liabilities that are measured at fair value on a recurring basis at December 31, 2017 and 2016:
(in thousands) | December 31, 2017 | ||||||||||||||
Assets (liabilities) | Level 1 | Level 2 | Level 3 | Total | |||||||||||
Commodity derivatives, net (a) | 18,603 | (18,067 | ) | — | 536 | ||||||||||
Provisionally priced contracts (b) | (98,190 | ) | (67,094 | ) | — | (165,284 | ) | ||||||||
Convertible preferred securities (c) | — | — | 7,388 | 7,388 | |||||||||||
Other assets and liabilities (d) | 9,705 | (1,244 | ) | — | 8,461 | ||||||||||
Total | $ | (69,882 | ) | $ | (86,405 | ) | $ | 7,388 | $ | (148,899 | ) | ||||
(in thousands) | December 31, 2016 | ||||||||||||||
Assets (liabilities) | Level 1 | Level 2 | Level 3 | Total | |||||||||||
Restricted cash | 471 | — | — | 471 | |||||||||||
Commodity derivatives, net (a) | 29,872 | (7,831 | ) | — | 22,041 | ||||||||||
Provisionally priced contracts (b) | (105,321 | ) | (64,876 | ) | — | (170,197 | ) | ||||||||
Convertible preferred securities (c) | — | — | 3,294 | 3,294 | |||||||||||
Other assets and liabilities (d) | 9,391 | (2,530 | ) | — | 6,861 | ||||||||||
Total | $ | (65,587 | ) | $ | (75,237 | ) | $ | 3,294 | $ | (137,530 | ) | ||||
(a) | Includes associated cash posted/received as collateral |
(b) | Included in "Provisionally priced contracts" are those instruments based only on underlying futures values (Level 1) and delayed price contracts (Level 2) |
(c) | Recorded in “Other noncurrent assets” on the Company’s Consolidated Balance Sheets related to certain available for sale securities. |
(d) | Included in other assets and liabilities are assets held by the Company to fund deferred compensation plans, ethanol risk management contracts, and foreign exchange derivative contracts (Level 1) and interest rate derivatives (Level 2). |
Level 1 commodity derivatives reflect the fair value of the exchanged-traded futures and options contracts that the Company holds, net of the cash collateral that the Company has in its margin account.
The majority of the Company’s assets and liabilities measured at fair value are based on the market approach valuation technique. With the market approach, fair value is derived using prices and other relevant information generated by market transactions involving identical or comparable assets or liabilities.
The Company’s net commodity derivatives primarily consist of futures or options contracts via regulated exchanges and contracts with producers or customers under which the future settlement date and bushels (or gallons in the case of ethanol contracts) of commodities to be delivered (primarily wheat, corn, soybeans and ethanol) are fixed and under which the price may or may not be fixed. Depending on the specifics of the individual contracts, the fair value is derived from the futures or options prices on the CME or the New York Mercantile Exchange for similar commodities and delivery dates as well as observable quotes for local basis adjustments (the difference, which is attributable to local market conditions, between the quoted futures price and the local cash price). Because “basis” for a particular commodity and location typically has multiple quoted prices from other agribusinesses in the same geographical vicinity and is used as a common pricing mechanism in the Agribusiness industry, we have concluded that “basis” is typically a Level 2 fair value input for purposes of the fair value disclosure requirements related to our commodity derivatives, depending on the specific commodity. Although nonperformance risk, both of the Company and the counterparty, is present in each of these commodity contracts and is a component of the estimated fair values, based on the Company’s historical experience with its producers and customers and the Company’s knowledge of their businesses, the Company does not view nonperformance risk to be a significant input to fair value for these commodity contracts.
These fair value disclosures exclude physical grain inventories measured at net realizable value. The net realizable value used to measure the Company’s agricultural commodity inventories is the fair value (spot price of the commodity in an exchange), less cost of disposal and transportation based on the local market. This valuation would generally be considered Level 2. The amount is disclosed in Note 2 Inventories. Changes in the net realizable value of commodity inventories are recognized as a component of cost of sales and merchandising revenues.
Provisionally priced contract liabilities are those for which the Company has taken ownership and possession of grain but the final purchase price has not been established. In the case of payables where the unpriced portion of the contract is limited to the futures price of the underlying commodity or we have delivered provisionally priced grain and a subsequent payable or receivable is set up for any future changes in the grain price, quoted CBOT prices are used and the liability is deemed to be Level 1 in the fair value hierarchy. For all other unpriced contracts which include variable futures and basis components, the
73
amounts recorded for delayed price contracts are determined on the basis of local grain market prices at the balance sheet date and, as such, are deemed to be Level 2 in the fair value hierarchy.
The risk management contract liability allows related ethanol customers to effectively unprice the futures component of their inventory for a period of time, subjecting the bushels to market fluctuations. The Company records an asset or liability for the market value changes of the commodities over the life of the contracts based on quoted CBOT prices and as such, the balance is deemed to be Level 1 in the fair value hierarchy.
The Company’s stake in the Iowa Northern Railway Company ("IANR") was redeemed in the first quarter of 2016. The remaining convertible preferred securities are interests in several early-stage enterprises in the form of convertible debt and preferred equity securities.
A reconciliation of beginning and ending balances for the Company’s recurring fair value measurements using Level 3 inputs is as follows:
Convertible Preferred Securities | Contingent Consideration | ||||||||||||||
(in thousands) | 2017 | 2016 | 2017 | 2016 | |||||||||||
Assets (liabilities) at January 1, | $ | 3,294 | $ | 13,550 | $ | — | $ | (350 | ) | ||||||
New investments | 3,750 | 2,500 | — | — | |||||||||||
Sales proceeds | — | (13,485 | ) | — | — | ||||||||||
Gains (losses) included in earnings | — | 729 | — | 350 | |||||||||||
Unrealized gains (losses) included in other comprehensive income | 344 | — | — | — | |||||||||||
Assets (liabilities) at December 31, | $ | 7,388 | $ | 3,294 | $ | — | $ | — | |||||||
The following tables summarize information about the Company's Level 3 fair value measurements as of December 31, 2017 and 2016:
Quantitative Information about Level 3 Fair Value Measurements | |||||||||
(in thousands) | Fair Value as of 12/31/17 | Valuation Method | Unobservable Input | Weighted Average | |||||
Convertible preferred securities (a) | $ | 7,388 | Implied based on market prices | Various | N/A | ||||
Real Property (b) | $ | 29,347 | Third-Party Appraisal | N/A | N/A | ||||
(in thousands) | Fair Value as of 12/31/16 | Valuation Method | Unobservable Input | Weighted Average | |||||
Convertible preferred (a) | $ | 3,294 | Cost Basis, Plus Interest | N/A | N/A | ||||
(a) | Due to early stages of business and timing of investments, cost basis, plus interest was deemed to approximate fair value in prior periods. As the underlying enterprises have evolved additional data is available to consider in order to estimate fair value, including additional capital raising, internal valuation models, progress towards key business milestones and other relevant market data points. |
(b) | The Company recognized impairment charges on certain grain assets during 2017 and measured the fair value using Level 3 inputs on a nonrecurring basis. The fair value of the grain assets was determined using prior transactions, prior third-party appraisals and a pending sale of grain assets held by the Company. |
74
Fair Value of Debt Instruments
Certain long-term notes payable and the Company’s debenture bonds bear fixed rates of interest and terms of up to 15 years. Based upon the Company’s credit standing and current interest rates offered by the Company on similar bonds and rates currently available to the Company for long-term borrowings with similar terms and remaining maturities, the Company estimates the fair values of its fixed rate long-term debt instruments outstanding at December 31, 2017 and 2016, as follows:
(in thousands) | Carrying Amount | Fair Value | Fair Value Hierarchy Level | ||||||
2017 | |||||||||
Fixed rate long-term notes payable | $ | 275,989 | $ | 275,340 | Level 2 | ||||
Debenture bonds | 30,432 | 29,452 | Level 2 | ||||||
$ | 306,421 | $ | 304,792 | ||||||
2016 | |||||||||
Fixed rate long-term notes payable | $ | 308,645 | $ | 310,338 | Level 2 | ||||
Debenture bonds | 36,931 | 37,883 | Level 2 | ||||||
$ | 345,576 | $ | 348,221 | ||||||
The fair value of the Company’s cash equivalents, accounts receivable and accounts payable approximate their carrying value as they are close to maturity.
12. Related Party Transactions
Equity Method Investments
The Company, directly or indirectly, holds investments in companies that are accounted for under the equity method. The Company’s equity in these entities is presented at cost plus its accumulated proportional share of income or loss, less any distributions it has received.
In January 2003, the Company became a minority investor in LTG, which focuses on grain merchandising as well as trading related to the energy and biofuels industry. The Company accounts for this investment under the equity method. The Company sells and purchases both grain and ethanol with LTG in the ordinary course of business on terms similar to sales and purchases with unrelated customers.
On December 4, 2015, LTG agreed to the sale of equity to New Hope Liuhe Investment (USA), Inc., a U.S. subsidiary of the Chinese company, New Hope Liuhe Co. Ltd. New Hope paid cash for a 20 percent equity interest in LTG. The impact of this transaction to the Company is a reduction in total ownership share of LTG from approximately 38.5 percent to 31.0 percent which includes dilution from newly issued shares as well as a redemption of shares that occurred on a pro rata basis between the Company and the other existing owners of LTG. The Company recognized a total gain of $23.1 million on these transactions. Cash of $8.2 million was received of which $1.3 million was a return of capital and $6.7 million was a return on capital. The remainder was a book gain on cash received in excess of basis in the shares redeemed.
In 2005, the Company became an investor in The Andersons Albion Ethanol LLC. TAAE is a producer of ethanol and its coproducts DDG and corn oil at its 110 million gallon-per-year ethanol production facility in Albion, Michigan. The Company operates the facility under a management contract and provides corn origination, ethanol, corn oil and DDG marketing and risk management services. The Company is separately compensated for all such services except corn oil marketing. The Company also leases its Albion, Michigan grain facility to TAAE. While the Company now holds 55% of the outstanding units of TAAE, a super-majority vote is required for all major operating decisions of TAAE based on the terms of the Operating Agreement. The Company has concluded that the super-majority vote requirement gives the minority shareholders substantive participating rights and therefore consolidation for book purposes is not appropriate. The Company accounts for its investment in TAAE under the equity method of accounting.
In 2006, the Company became a minority investor in The Andersons Clymers Ethanol LLC. TACE is also a producer of ethanol and its coproducts DDG and corn oil at a 110 million gallon-per-year ethanol production facility in Clymers, Indiana. The
75
Company operates the facility under a management contract and provides corn origination, ethanol, corn oil and DDG marketing and risk management services for which it is separately compensated. The Company also leases its Clymers, Indiana grain facility to TACE.
In 2006, the Company became a minority investor in The Andersons Marathon Ethanol LLC. TAME is also a producer of ethanol and its coproducts DDG and corn oil at a 110 million gallon-per-year ethanol production facility in Greenville, Ohio. In January 2007, the Company transferred its 50% share in TAME to The Andersons Ethanol Investment LLC, a consolidated subsidiary of the Company, of which a third party owned 34% of the shares. The Company operates the facility under a management contract and provides corn origination, ethanol, corn oil and DDG marketing and risk management services for which it is separately compensated. In 2009, TAEI invested an additional $1.1 million in TAME, retaining a 50% ownership interest. On January 1, 2017, TAEI was merged with and into TAME. The Company had owned (66%) of TAEI. Pursuant to the merger, the Company’s ownership units in TAEI were canceled and converted into ownership units in TAME. As a result, the Company now directly owns 33% of the outstanding ownership units of TAME.
The Company has marketing agreements with TAAE, TACE, and TAME ("the three unconsolidated ethanol LLCs") under which the Company purchases and markets the ethanol produced to external customers. As compensation for these marketing services, the Company earns a fee on each gallon of ethanol sold. The Company has entered into marketing agreements with each of the ethanol LLCs. Under the ethanol marketing agreements, the Company purchases most, if not all, of the ethanol produced by the LLCs at the same price it will resell the ethanol to external customers. The Company acts as the principal in these ethanol sales transactions to external parties as the Company has ultimate responsibility of performance to the external parties. Substantially all of these purchases and subsequent sales are executed through forward contracts on matching terms and, outside of the fee the Company earns for each gallon sold, the Company does not recognize any gross profit on the sales transactions. For the years ended December 31, 2017, 2016 and 2015, revenues recognized for the sale of ethanol purchased from related parties were $590.9 million, $427.8 million and $428.2 million, respectively. In addition to the ethanol marketing agreements, the Company holds corn origination agreements, under which the Company originates all of the corn used in production for each unconsolidated ethanol LLC. For this service, the Company receives a unit based fee. Similar to the ethanol sales described above, the Company acts as a principal in these transactions, and accordingly, records revenues on a gross basis. See discussion of the impact that ASC 606 will have on these origination transactions in Note 1. For the years ended December 31, 2017, 2016 and 2015, revenues recognized for the sale of corn under these agreements were $498.8 million, $426.8 million and $443.9 million, respectively. As part of the corn origination agreements, the Company also markets the DDG produced by the entities. For this service the Company receives a unit based fee. The Company does not purchase any of the DDG from the ethanol entities; however, as part of the agreement, the Company guarantees payment by the buyer for DDG sales. At December 31, 2017 and 2016, the three unconsolidated ethanol entities had a combined receivable balance for DDG of $5.9 million and $4.1 million, respectively, of which $132.3 thousand and $9.4 thousand, respectively, was more than thirty days past due. As the Company has not experienced historical losses and the DDG receivable balances greater than thirty days past due is immaterial, the Company has concluded that the fair value of this guarantee is inconsequential.
On July 31, 2013, the Company, along with Lansing Trade Group, LLC established joint ventures that acquired 100% of the stock of Thompsons Limited, including its investment in a related U.S. operating company. Each Company owns 50% of the investment. Thompsons Limited is a grain and food-grade bean handler and agronomy input provider, headquartered in Blenheim, Ontario, and operates 12 locations across Ontario and Minnesota. The Company does not hold a majority of the outstanding shares of Thompsons Limited joint ventures. All major operating decisions of these joint ventures are made by their Board of Directors and the Company does not have a majority of the board seats. Due to these factors, the Company does not have control over these joint ventures and therefore accounts for these investments under the equity method of accounting.
76
The following table presents aggregate summarized financial information of LTG, TAAE, TACE, TAME, Thompsons Limited, and other various investments as they qualified as significant equity method investees in the aggregate. No individual equity investments qualified as significant for the years ended December 31, 2017, 2016 and 2015.
December 31, | |||||||||||
(in thousands) | 2017 | 2016 | 2015 | ||||||||
Sales | $ | 6,080,795 | $ | 6,579,413 | $ | 6,868,257 | |||||
Gross profit | 217,629 | 188,350 | 250,847 | ||||||||
Income from continuing operations | 50,937 | 12,288 | 85,220 | ||||||||
Net income | 42,970 | 6,445 | 81,368 | ||||||||
Current assets | 1,045,124 | 898,081 | 1,236,171 | ||||||||
Non-current assets | 538,671 | 565,416 | 500,637 | ||||||||
Current liabilities | 802,161 | 665,387 | 796,816 | ||||||||
Non-current liabilities | 309,649 | 359,816 | 342,075 | ||||||||
Noncontrolling interests | — | 3,628 | 11,716 | ||||||||
The following table presents the Company’s investment balance in each of its equity method investees by entity:
December 31, | |||||||
(in thousands) | 2017 | 2016 | |||||
The Andersons Albion Ethanol LLC | $ | 45,024 | $ | 38,972 | |||
The Andersons Clymers Ethanol LLC | 19,830 | 19,739 | |||||
The Andersons Marathon Ethanol LLC | 12,660 | 22,069 | |||||
Lansing Trade Group, LLC | 93,088 | 89,050 | |||||
Thompsons Limited (a) | 50,198 | 46,184 | |||||
Other | 2,439 | 917 | |||||
Total | $ | 223,239 | $ | 216,931 | |||
(a) | Thompsons Limited and related U.S. operating company held by joint ventures |
The following table summarizes income (losses) earned from the Company’s equity method investments by entity:
% ownership at December 31, 2017 | December 31, | ||||||||||||
(in thousands) | 2017 | 2016 | 2015 | ||||||||||
The Andersons Albion Ethanol LLC | 55% | $ | 6,052 | $ | 6,167 | $ | 5,636 | ||||||
The Andersons Clymers Ethanol LLC | 39% | 4,591 | 6,486 | 6,866 | |||||||||
The Andersons Marathon Ethanol LLC | 33% | 1,571 | 5,814 | 4,718 | |||||||||
Lansing Trade Group, LLC | 33% (a) | 4,038 | (9,935 | ) | 11,880 | ||||||||
Thompsons Limited (b) | 50% | 696 | 1,189 | 2,735 | |||||||||
Other | 5% - 50% | (225 | ) | — | 89 | ||||||||
Total | $ | 16,723 | $ | 9,721 | $ | 31,924 | |||||||
(a) | This does not consider restricted management units which, once vested, will reduce the ownership percentage by approximately 0.7%. |
(b) | Thompsons Limited and related U.S. operating company held by joint ventures |
Total distributions received from unconsolidated affiliates were $7.1 million for the year ended December 31, 2017. The balance at December 31, 2017 that represents the undistributed earnings of the Company's equity method investments is $83.2 million.
Investment in Debt Securities
The Company previously owned 100% of the cumulative convertible preferred shares of Iowa Northern Railway Company (“IANR”), which operates a short-line railroad in Iowa. In the first quarter of 2016, these shares were redeemed and the Company no longer has an ownership stake in this entity.
77
Related Party Transactions
In the ordinary course of business and on an arms-length basis, the Company will enter into related party transactions with each of the investments described above, along with other related parties.
The following table sets forth the related party transactions entered into for the time periods presented:
December 31, | |||||||||||
(in thousands) | 2017 | 2016 | 2015 | ||||||||
Sales revenues | $ | 893,950 | $ | 749,746 | $ | 825,220 | |||||
Service fee revenues (a) | 24,357 | 17,957 | 20,393 | ||||||||
Purchases of product | 615,739 | 463,832 | — | ||||||||
Lease income (b) | 6,175 | 5,966 | 6,664 | ||||||||
Labor and benefits reimbursement (c) | 13,894 | 12,809 | 11,567 | ||||||||
Other expenses (d) | — | 149 | 1,059 | ||||||||
(a) | Service fee revenues include management fee, corn origination fee, ethanol and DDG marketing fees, and other commissions. |
(b) | Lease income includes the lease of the Company’s Albion, Michigan and Clymers, Indiana grain facilities as well as certain railcars to the unconsolidated ethanol LLCs and IANR. |
(c) | The Company provides all operational labor to the unconsolidated ethanol LLCs and charges them an amount equal to the Company’s costs of the related services. |
(d) | Other expenses include payments to IANR for repair facility rent and use of their railroad reporting mark, payment to LTG for the lease of railcars and other various expense. |
December 31, | |||||
(in thousands) | 2017 | 2016 | |||
Accounts receivable (e) | 30,252 | 26,254 | |||
Accounts payable (f) | 27,866 | 23,961 | |||
(e) | Accounts receivable represents amounts due from related parties for sales of corn, leasing revenue and service fees. |
(f) | Accounts payable represents amounts due to related parties for purchases of ethanol and other various items. |
From time to time, the Company enters into derivative contracts with certain of its related parties, including the unconsolidated ethanol LLCs, LTG, and the Thompsons Limited joint ventures, for the purchase and sale of grain and ethanol, for similar price risk mitigation purposes and on similar terms as the purchase and sale derivative contracts it enters into with unrelated parties. The fair value of derivative contracts with related parties in a gross asset position as of December 31, 2017 and 2016 was $0.2 million and $4.1 million, respectively. The fair value of derivative contracts with related parties in a gross liability position as of December 31, 2017 and 2016 was $2.5 million and $0.1 million, respectively.
13. Segment Information
The Company’s operations include five reportable business segments that are distinguished primarily on the basis of products and services offered. The Grain business includes grain merchandising, the operation of terminal grain elevator facilities and the investments in LTG and Thompsons Limited. The Ethanol business purchases and sells ethanol and also manages the ethanol production facilities organized as limited liability companies, one is consolidated and three are investments accounted for under the equity method. There are various service contracts for these investments. Rail operations include the leasing, marketing and fleet management of railcars and other assets, railcar repair and metal fabrication. The Plant Nutrient business manufactures and distributes agricultural inputs, primarily base nutrient and value added fertilizers, to dealers and farmers, along with turf care and corncob-based products. The Retail business operated large retail stores, a distribution center, and a lawn and garden equipment sales and service facility. In January 2017, the Company announced its decision to close all retail operations. As of December 31, 2017, the Retail Group has closed all stores, completed its liquidation efforts, and sold three of the four properties. Included in “Other” are the corporate level costs not attributed to an operating segment.
78
The segment information below includes the allocation of expenses shared by one or more operating segments. Although management believes such allocations are reasonable, the operating information does not necessarily reflect how such data might appear if the segments were operated as separate businesses. Inter-segment sales are made at prices comparable to normal, unaffiliated customer sales. The Company does not have any customers who represent 10 percent, or more, of total revenues.
Year ended December 31, | |||||||||||
(in thousands) | 2017 | 2016 | 2015 | ||||||||
Revenues from external customers | |||||||||||
Grain | $ | 2,106,464 | $ | 2,357,171 | $ | 2,483,643 | |||||
Ethanol | 708,063 | 544,556 | 556,188 | ||||||||
Plant Nutrient | 651,824 | 725,176 | 848,338 | ||||||||
Rail | 172,123 | 163,658 | 170,848 | ||||||||
Retail | 47,871 | 134,229 | 139,478 | ||||||||
Total | $ | 3,686,345 | $ | 3,924,790 | $ | 4,198,495 | |||||
Year ended December 31, | |||||||||||
(in thousands) | 2017 | 2016 | 2015 | ||||||||
Inter-segment sales | |||||||||||
Grain | $ | 761 | $ | 1,638 | $ | 3,573 | |||||
Plant Nutrient | 241 | 470 | 682 | ||||||||
Rail | 1,213 | 1,399 | 1,192 | ||||||||
Total | $ | 2,215 | $ | 3,507 | $ | 5,447 | |||||
Year ended December 31, | |||||||||||
(in thousands) | 2017 | 2016 | 2015 | ||||||||
Interest expense (income) | |||||||||||
Grain | $ | 8,320 | $ | 7,955 | $ | 5,778 | |||||
Ethanol | (67 | ) | 35 | 70 | |||||||
Plant Nutrient | 6,420 | 6,448 | 7,243 | ||||||||
Rail | 7,023 | 6,461 | 7,006 | ||||||||
Retail | 324 | 496 | 356 | ||||||||
Other | (453 | ) | (276 | ) | (381 | ) | |||||
Total | $ | 21,567 | $ | 21,119 | $ | 20,072 | |||||
Year ended December 31, | |||||||||||
(in thousands) | 2017 | 2016 | 2015 | ||||||||
Equity in earnings of affiliates | |||||||||||
Grain | $ | 4,509 | $ | (8,746 | ) | $ | 14,703 | ||||
Ethanol | 12,214 | 18,467 | 17,221 | ||||||||
Total | $ | 16,723 | $ | 9,721 | $ | 31,924 | |||||
79
Year ended December 31, | |||||||||||
(in thousands) | 2017 | 2016 | 2015 | ||||||||
Other income, net | |||||||||||
Grain | $ | 3,658 | $ | 5,472 | $ | 26,229 | |||||
Ethanol | 54 | 77 | 377 | ||||||||
Plant Nutrient | 5,092 | 3,716 | 3,046 | ||||||||
Rail | 2,632 | 2,218 | 15,935 | ||||||||
Retail | 10,684 | 507 | 557 | ||||||||
Other | 1,324 | 2,785 | 328 | ||||||||
Total | $ | 23,444 | $ | 14,775 | $ | 46,472 | |||||
Year ended December 31, | |||||||||||
(in thousands) | 2017 | 2016 | 2015 | ||||||||
Income (loss) before income taxes | |||||||||||
Grain | $ | 12,844 | $ | (15,651 | ) | $ | (9,446 | ) | |||
Ethanol | 18,878 | 24,723 | 28,503 | ||||||||
Plant Nutrient | (45,121 | ) | 14,176 | 121 | |||||||
Rail | 24,798 | 32,428 | 50,681 | ||||||||
Retail | (7,309 | ) | (8,848 | ) | (455 | ) | |||||
Other (a) | (24,713 | ) | (28,323 | ) | (82,713 | ) | |||||
Non-controlling interests | 98 | 2,876 | 1,745 | ||||||||
Total | $ | (20,525 | ) | $ | 21,381 | $ | (11,564 | ) | |||
(a) | Includes pension settlement charges in 2015 |
Year ended December 31, | |||||||
(in thousands) | 2017 | 2016 | |||||
Identifiable assets | |||||||
Grain | $ | 948,871 | $ | 961,114 | |||
Ethanol | 180,173 | 171,115 | |||||
Plant Nutrient | 379,309 | 484,455 | |||||
Rail | 490,448 | 398,446 | |||||
Retail | 4,349 | 31,257 | |||||
Other | 159,204 | 186,462 | |||||
Total | $ | 2,162,354 | $ | 2,232,849 | |||
Year ended December 31, | |||||||||||
(in thousands) | 2017 | 2016 | 2015 | ||||||||
Capital expenditures | |||||||||||
Grain | $ | 10,899 | $ | 21,428 | $ | 26,862 | |||||
Ethanol | 3,690 | 2,301 | 7,223 | ||||||||
Plant Nutrient | 10,735 | 15,153 | 14,384 | ||||||||
Rail | 3,478 | 4,345 | 2,990 | ||||||||
Retail | — | 436 | 1,005 | ||||||||
Other | 5,800 | 34,077 | 20,005 | ||||||||
Total | $ | 34,602 | $ | 77,740 | $ | 72,469 | |||||
80
Year ended December 31, | |||||||||||
(in thousands) | 2017 | 2016 | 2015 | ||||||||
Acquisition of businesses, net of cash acquired and other investments | |||||||||||
Grain | $ | 5,436 | $ | — | $ | — | |||||
Plant Nutrient | — | — | 128,549 | ||||||||
Other | 3,750 | 2,500 | 750 | ||||||||
Total | $ | 9,186 | $ | 2,500 | $ | 129,299 | |||||
Year ended December 31, | |||||||||||
(in thousands) | 2017 | 2016 | 2015 | ||||||||
Depreciation and amortization | |||||||||||
Grain | $ | 18,757 | $ | 18,232 | $ | 19,240 | |||||
Ethanol | 5,970 | 5,925 | 5,865 | ||||||||
Plant Nutrient | 26,628 | 28,663 | 25,179 | ||||||||
Rail | 23,081 | 20,082 | 18,450 | ||||||||
Retail | 70 | 2,452 | 2,510 | ||||||||
Other | 11,906 | 8,971 | 7,212 | ||||||||
Total | $ | 86,412 | $ | 84,325 | $ | 78,456 | |||||
Grain sales for export to foreign markets amounted to $166.2 million, $78.3 million and $195.6 million in 2017, 2016 and 2015, respectively - the majority of which were sales to Canadian customers. Revenues from leased railcars in Canada totaled $13.3 million, $13.2 million and $11.0 million in 2017, 2016 and 2015, respectively. The net book value of the leased railcars in Canada as of December 31, 2017 and 2016 was $21.2 million and $26.8 million, respectively.
14. Commitments and Contingencies
Litigation activities
The Company is party to litigation, or threats thereof, both as defendant and plaintiff with some regularity, although individual cases that are material in size occur infrequently. As a defendant, the Company establishes reserves for claimed amounts that are considered probable, and capable of estimation. If those cases are resolved for lesser amounts, the excess reserves are taken into income and, conversely, if those cases are resolved for larger than the amount the Company has accrued, the Company records a charge to income. The Company believes it is unlikely that the results of its current legal proceedings for which it is the defendant, even if unfavorable, will be material. As a plaintiff, amounts that are collected can also result in sudden, non-recurring income. Litigation results depend upon a variety of factors, including the availability of evidence, the credibility of witnesses, the performance of counsel, the state of the law, and the impressions of judges and jurors, any of which can be critical in importance, yet difficult, if not impossible, to predict. Consequently, cases currently pending, or future matters, may result in unexpected, and non-recurring losses, or income, from time to time. Finally, litigation results are often subject to judicial reconsideration, appeal and further negotiation by the parties, and as a result, the final impact of a particular judicial decision may be unknown for some time, or may result in continued reserves to account for the potential of such post-verdict actions.
In the third quarter of 2017, the Company’s Plant Nutrient business recorded a $2.2 million reserve for settlement of a 2015 legal claim. The case regarded allegations that the Plant Nutrient business had improperly acquired another company’s confidential and proprietary intellectual property in connection with hiring a former employee of the plaintiff. In the fourth quarter of 2017, the settlement was finalized at the reserve amount and a nominal insurance recovery was received.
Prior to the settlement, substantially all the Company’s legal expenses were paid by a liability insurance carrier.
Railcar leasing activities
The Company's Rail Group is a lessor of transportation assets. The majority are leased to customers under operating leases that may be either net leases (in which the customer pays for all maintenance) or full service leases (where the Company provides maintenance and fleet management services). The Company also provides such services to financial intermediaries to whom it has sold assets in non-recourse lease transactions. Fleet management services generally include maintenance, escrow, tax filings and car tracking services.
81
Many of the Company's leases provide for renewals. The Company also generally holds purchase options for assets it has sold and leased-back from a financial intermediary, and assets sold in non-recourse lease transactions. These purchase options are for stated amounts which are determined at the inception of the lease and are intended to approximate the estimated fair value of the applicable assets at the date for which such purchase options can be exercised.
82
Lease income from operating leases (with the Company as lessor) to customers (including month-to-month and per diem leases) and rental expense for the Rail Group operating leases (with the Company as lessee) were as follows:
Year ended December 31, | |||||||||||
(in thousands) | 2017 | 2016 | 2015 | ||||||||
Rental and service income - operating leases | $ | 90,333 | $ | 95,254 | $ | 97,059 | |||||
Rental expense | $ | 16,459 | $ | 16,723 | $ | 15,214 | |||||
Lease income recognized under per diem arrangements (described in Note 1) totaled $5.6 million, $4.9 million, and 5.0 million in 2017, 2016 and 2015, respectively, and is included in the amounts above.
Future minimum rentals and service income for all noncancellable Rail operating leases on transportation assets are as follows:
(in thousands) | Future Rental and Service Income - Operating Leases | Future Minimum Rental Payments | |||||
Year ended December 31, | |||||||
2018 | $ | 67,716 | $ | 11,390 | |||
2019 | 47,005 | 6,952 | |||||
2020 | 29,875 | 5,100 | |||||
2021 | 19,739 | 4,461 | |||||
2022 | 11,901 | 3,073 | |||||
Future years | 20,784 | 9,768 | |||||
$ | 197,020 | $ | 40,744 | ||||
The Company also arranges non-recourse lease transactions under which it sells assets to financial intermediaries and assigns the related operating lease on a non-recourse basis. The Company generally provides ongoing maintenance and management services for the financial intermediaries, and receives a fee for such services when earned. Management and service fees earned in 2017, 2016 and 2015 were $5.9 million, $5.7 million and $7.0 million, respectively.
Build-to-Suit Lease
In August, 2015, the Company entered into a lease agreement with an initial term of 15 years for a build-to-suit facility to be used as the new corporate headquarters which was completed in the third quarter of 2016. We have recognized an asset and a financing obligation.
The Company has recorded a build-to-suit financing obligation in other long-term liabilities of $24.3 million and $14.0 million at December 31, 2017 and December 31, 2016, respectively. The Company has recorded a build-to-suit financing obligation in other current liabilities of $1.4 million and $0.9 million at December 31, 2017 and December 31, 2016, respectively.
Other leasing activities
The Company, as a lessee, leases real property, vehicles and other equipment under operating leases. Certain of these agreements contain lease renewal and purchase options. Rental expense under these agreements was $5.4 million, $12.3 million and $10.9 million in 2017, 2016 and 2015, respectively. Future minimum lease payments under agreements in effect at December 31, 2017 are as follows: 2018 -- $5.4 million; 2019 -- $4.6 million; 2020 -- $4.1 million; 2021 -- $3.8 million; 2022 -- $1.4 million; and $0.5 million thereafter.
In addition to the above, the Company leases its Albion, Michigan and Clymers, Indiana grain elevators under operating leases to two of its ethanol investees. The Albion, Michigan grain elevator lease expires in 2056. The initial term of the Clymers, Indiana grain elevator lease ended in 2014 and was renewed through 2022. The agreement provides for several renewals of 7.5 years each. Lease income for the years ended December 31, 2017, 2016 and 2015 was $2.0 million, $2.0 million and $2.0 million, respectively.
83
15. Supplemental Cash Flow Information
Certain supplemental cash flow information, including noncash investing and financing activities for the years ended December 31, 2017, 2016, and 2015 are as follows:
Year ended December 31, | |||||||||||
2017 | 2016 | 2015 | |||||||||
Supplemental disclosure of cash flow information | |||||||||||
Interest paid | $ | 23,958 | $ | 21,407 | $ | 19,292 | |||||
Income taxes paid, net of refunds | 2,065 | (10,587 | ) | 4,909 | |||||||
Noncash investing and financing activity | |||||||||||
Capital projects incurred but not yet paid | 6,840 | 3,092 | 7,507 | ||||||||
Purchase of a productive asset through seller-financing | — | — | 1,010 | ||||||||
Shares issued for acquisition of business | — | — | 4,303 | ||||||||
Investment merger (decreasing equity method investments and non-controlling interest) | 8,360 | — | — | ||||||||
Dividends declared not yet paid | 4,650 | 4,493 | 4,338 | ||||||||
See Footnote 17 for the fair value of assets acquired and liabilities assumed as part of business acquisitions.
16. Stock Compensation Plans
The Company's 2014 Long-Term Incentive Compensation Plan, dated February 28, 2014 and subsequently approved by Shareholders on May 2, 2014 (the "2014 LT Plan") is authorized to issue up to 1.75 million shares of common stock as options, share appreciation rights, restricted shares and units, performance shares and units and other stock or cash-based awards. Approximately 572 thousand shares remain available for issuance at December 31, 2017.
Stock-based compensation expense for all stock-based compensation awards are based on the grant-date fair value. The Company recognizes these compensation costs on a straight-line basis over the requisite service period of the award. Total compensation expense recognized in the Consolidated Statement of Income for all stock compensation programs was $6.1 million, $7.0 million, and $1.9 million in 2017, 2016 and 2015, respectively.
Non-Qualified Stock Options ("Options")
The Company granted non-qualified stock options during 2015 under the 2014 LT Plan, upon the hiring of our new Chief Executive Officer. The options have a term of seven years and have three year annual graded vesting. The fair value of the options was estimated at the date of grant under the Black-Scholes option pricing model with the following assumptions. Expected volatility was estimated based on the historical volatility of the Company's common shares over the 5.5 years prior to the grant date. The average expected life was based on the contractual term of the plan. The risk-free rate is based on the U.S. Treasury Strips available with maturity period consistent with the expected life. Forfeitures are estimated at the date of grant based on historical experience. The weighted average assumptions used in the determination of fair value for stock option awards were as follows:
2015 | ||
Risk free interest rate | 1.80 | % |
Dividend yield | 1.58 | % |
Volatility factor of the expected market price of the common shares | 0.35 | |
Expected life for the options (in years) | 5.50 | |
84
A reconciliation of the number of Options outstanding and exercisable under the 2014 LT Plan as of December 31, 2017, and changes during the period then ended, is as follows:
Shares (in thousands) | Weighted- Average Exercise Price | Weighted- Average Remaining Contractual Term | Aggregate Intrinsic Value (000's) | |||||||||
Options outstanding at January 1, 2017 | 325 | $ | 35.40 | |||||||||
Options granted | — | — | ||||||||||
Options exercised | — | — | ||||||||||
Options cancelled / forfeited | — | — | ||||||||||
Options outstanding at December 31, 2017 | 325 | $ | 35.40 | 0.84 | $ | — | ||||||
Vested and expected to vest at December 31, 2017 | 325 | $ | 35.40 | 0.84 | $ | — | ||||||
Options exercisable at December 31, 2017 | 217 | $ | 35.40 | 0.84 | $ | — | ||||||
Year ended December 31, | |||
(in thousands) | 2017 | ||
Total intrinsic value of Options exercised | $ | — | |
Total fair value of shares vested | $ | 1,123 | |
Weighted average fair value of Options granted | $ | — | |
As of December 31, 2017, there was $0.3 million unrecognized compensation cost related to Options granted under the 2014 LT Plan. That cost is expected to be fully amortized by October 2018.
Restricted Stock Awards
The LT Plans permit awards of restricted stock. These shares carry voting and dividend equivalent rights upon vesting; however, sale of the shares is restricted prior to vesting. Restricted shares vest over a period of 3 years, with one-third vesting each January 1 of the following first, second, and third years. Total restricted stock expense is equal to the market value of the Company's common shares on the date of the award and is recognized over the service period on a straight line basis. In 2017, there were 133.8 thousand shares issued to members of management and directors.
A summary of the status of the Company's non-vested restricted shares as of December 31, 2017, and changes during the period then ended, is presented below:
Shares (in thousands) | Weighted-Average Grant-Date Fair Value | |||||
Non-vested restricted shares at January 1, 2017 | 223 | $ | 31.93 | |||
Granted | 134 | 37.13 | ||||
Vested | (113 | ) | 33.12 | |||
Forfeited | (15 | ) | 34.49 | |||
Non-vested restricted shares at December 31, 2017 | 229 | $ | 34.22 | |||
Year ended December 31, | |||||
2017 | 2016 | 2015 | |||
Total fair value of shares vested (000's) | $3,751 | $4,038 | $4,918 | ||
Weighted average fair value of restricted shares granted | $37.13 | $27.20 | $42.32 | ||
As of December 31, 2017, there was $2.5 million of total unrecognized compensation cost related to non-vested restricted shares granted under the LT Plans. That cost is expected to be fully amortized by November 2021.
EPS-Based Performance Share Units (“EPS PSUs”)
The LT Plans also allow for the award of EPS PSUs. Each EPS PSU gives the participant the right to receive common shares dependent on the achievement of specified performance results over a 3 year performance period. At the end of the
85
performance period, the number of shares of stock issued will be determined by adjusting the award upward or downward from a target award. Fair value of EPS PSUs issued is based on the market value of the Company's common shares on the date of the award. The related compensation expense is recognized over the performance period when achievement of the award is probable and is adjusted for changes in the number of shares expected to be issued if changes in performance are expected. In 2017, there were 84.3 thousand PSUs issued to members of management. Currently, the Company is accounting for the awards granted in 2015, 2016 and 2017 at 0%, 0% and 30% of the maximum amount available for issuance, respectively.
EPS PSUs Activity
A summary of the status of the Company's EPS PSUs as of December 31, 2017, and changes during the period then ended, is presented below:
Shares (in thousands) | Weighted-Average Grant-Date Fair Value | |||||
Non-vested at January 1, 2017 | 304 | $ | 40.76 | |||
Granted | 84 | 39.20 | ||||
Vested | — | — | ||||
Forfeited | (113 | ) | 49.67 | |||
Non-vested at December 31, 2017 | 275 | $ | 36.61 | |||
Year ended December 31, | |||||
2017 | 2016 | 2015 | |||
Weighted average fair value of PSUs granted | $39.20 | $27.54 | $44.76 | ||
As of December 31, 2017, there was $0.6 million unrecognized compensation cost related to non-vested EPS PSUs granted under the LT Plans. That cost is expected to be fully amortized by December 2019.
TSR-Based Performance Share Units (“TSR PSUs”)
Beginning in 2016, the Company began granting Total Shareholder Return-Based PSUs ("TSR PSUs"). Each PSU gives the participant the right to receive common shares dependent on total shareholder return over a 3 year period. At the end of the period, the number of shares of stock issued will be determined by adjusting the award upward or downward from a target award. Fair value of TSR PSUs was estimated at the date of grant using a Monte Carlo Simulation with the following assumptions. Expected volatility was estimated based on the historical volatility of the Company's common shares over the 2.83 year period prior to the grant date. The average expected life was based on the contractual term of the plan. The risk-free rate is based on the U.S. Treasury Strips available with maturity period consistent with the expected life. Forfeitures are estimated at the date of grant based on historical experience. In 2017, there were 84.3 thousand TSR PSUs issued to members of management.
2017 | ||
Risk free interest rate | 1.55 | % |
Dividend yield | — | % |
Volatility factor of the expected market price of the common shares | 0.41 | |
Expected term (in years) | 2.83 | |
Correlation coefficient | 0.40 | |
86
TSR PSUs Activity
A summary of the status of the Company's PSUs as of December 31, 2017, and changes during the period then ended, is presented below:
Shares (in thousands) | Weighted-Average Grant-Date Fair Value | |||||
Non-vested at January 1, 2017 | 118 | $ | 26.43 | |||
Granted | 84 | 42.53 | ||||
Vested | — | — | ||||
Forfeited | (19 | ) | 32.04 | |||
Non-vested at December 31, 2017 | 183 | $ | 33.26 | |||
Year ended December 31, | |||||||||||
2017 | 2016 | 2015 | |||||||||
Weighted average fair value of PSUs granted | $ | 42.53 | $ | 26.43 | $ | — | |||||
As of December 31, 2017, there was approximately $1.6 million unrecognized compensation cost related to non-vested TSR PSUs granted under the LT Plans. That cost is expected to be fully amortized by December 2019.
Employee Share Purchase Plan (the “ESP Plan”)
The Company's 2004 ESP Plan allows employees to purchase common shares through payroll withholdings. The Company has approximately 96 thousand common shares remaining available for issuance to and purchase by employees under this plan. The ESP Plan also contains an option component. The purchase price per share under the ESP Plan is the lower of the market price at the beginning or end of the year. The Company records a liability for withholdings not yet applied towards the purchase of common stock.
The fair value of the option component of the ESP Plan is estimated at the date of grant under the Black-Scholes option pricing model with the following assumptions at the grant date. Expected volatility was estimated based on the historical volatility of the Company's common shares over the past year. The average expected life was based on the contractual term of the plan. The risk-free rate is based on the U.S. Treasury yield curve rate with a one year term. Forfeitures are estimated at the date of grant based on historical experience.
2017 | 2016 | 2015 | ||||||
Risk free interest rate | 1.76 | % | 0.61 | % | 0.25 | % | ||
Dividend yield | 2.06 | % | 1.96 | % | 1.05 | % | ||
Volatility factor of the expected market price of the common shares | 0.28 | 0.36 | 0.41 | |||||
Expected life for the options (in years) | 1.00 | 1.00 | 1.00 | |||||
17. Business Acquisitions
The Company's acquisitions are accounted for as purchases in accordance with ASC Topic 805, Business Combinations. Tangible assets and liabilities and identifiable intangible assets were adjusted to fair values at the acquisition date with the remainder of the purchase price, if any, recorded as goodwill. Operating results of these acquisitions are included in the Company's Consolidated Financial Statements from the date of acquisition and are not significant to the Company's consolidated operating results such that pro-forma disclosures are required.
2017 Business Acquisitions
The Company's Grain Group completed an insignificant acquisition in 2017 for a purchase price of $3.5 million,
87
Prior Years Business Acquisitions
On May 18, 2015, the Company purchased Kay Flo Industries, Inc. and certain subsidiaries. The Company acquired 100% of the outstanding shares of Kay Flo Industries, Inc. In connection with the acquisition, the Company agreed to pay contingent consideration based on the achievement of specified objectives, including reaching targeted gross profit thresholds. The range of undiscounted amounts the Company could be required to pay under the contingent consideration arrangement is between $0 and $24 million.
The total fair value of consideration for the acquisitions was $129.4 million, including working capital and $0.4 million in estimated fair value of the contingent consideration arrangement. The current estimated fair value of the contingent consideration arrangement is $0. The Company funded this transaction with long-term debt, short-term debt, and cash on hand.
The purchase price allocation is summarized below:
(in thousands) | |||
Cash | $ | 880 | |
Accounts receivable | 14,699 | ||
Inventory | 25,094 | ||
Other assets | 6,155 | ||
Intangibles | 53,091 | ||
Goodwill | 47,735 | ||
Property, plant, and equipment | 27,478 | ||
Accounts payable | (12,131 | ) | |
Other current liabilities | (4,866 | ) | |
Other non-current liabilities | (28,706 | ) | |
Total purchase price | $ | 129,429 | |
The goodwill recognized as a result of the Kay Flo Industries, Inc. acquisition was $47.7 million and was allocated to the Plant Nutrient segment. The goodwill is not deductible for tax purposes. The goodwill recognized is primarily attributable to expansion of the segment's geographic range and the ability to realize synergies from the combination of product lines and marketing efforts.
Details of the intangible assets acquired are as follows:
(in thousands) | Fair Value | Useful Life | |||
Unpatented technology | $ | 13,400 | 10 years | ||
Customer relationships | 22,800 | 10 years | |||
Trade names | 15,500 | 7 to 10 years | |||
Noncompete agreement | 1,342 | 5 years | |||
Favorable leasehold interest | 49 | 5 years | |||
Total identifiable intangible assets | $ | 53,091 | 10 years * | ||
*weighted average number of years
18. Sale of Assets
During 2017, the Company sold three of its retail properties for $14.7 million and recorded a $8.6 million gain in Other income, net. Additionally, the Company recorded a $1.2 million gain in Other income, net for the sales of fixtures.
On March 31, 2017 the Company sold four farm center locations in Florida for $17.4 million and recorded a $4.7 million gain, net of transaction costs in Other income, net. The sale price included a working capital adjustment of $3.6 million.
On May 2, 2016 the Company sold eight grain and agronomy locations in Iowa for $54.3 million and recorded a nominal gain.
88
19. Exit Costs and Assets Held for Sale
The Retail business closed during the second quarter of 2017, and inventory and fixtures liquidation efforts are complete. The Company incurred exit charges of $11.5 million, consisting primarily of employee severance and related benefits.
The Company classified $37.9 million of Property, plant and equipment, net as Assets held for sale on the Consolidated Balance Sheet at December 31, 2017. This includes $19.5 million of Property, plant and equipment, net, $11.4 million of Inventories, and $1.2 million of Commodity derivative assets related to certain Western Tennessee locations in the Grain group. The Company classified $4.2 million and $1.6 million of additional Property, plant and equipment, net as Assets held for sale related to the remaining Retail store assets and administrative offices at an outlying location in the Plant Nutrient Group, respectively.
20. Quarterly Consolidated Financial Information (Unaudited)
The following is a summary of the unaudited quarterly results of operations for 2017 and 2016:
(in thousands, except for per common share data) | Sales and merchandising revenues | Gross profit | Net income (loss) attributable to The Andersons, Inc. | Earnings (losses) per share-basic | Earnings per share-diluted | ||||||||||||||
Quarter ended 2017 | |||||||||||||||||||
March 31 | $ | 852,016 | $ | 76,458 | $ | (3,089 | ) | $ | (0.11 | ) | $ | (0.11 | ) | ||||||
June 30 | 993,662 | 87,834 | (26,653 | ) | (0.94 | ) | (0.94 | ) | |||||||||||
September 30 | 836,595 | 69,671 | 2,533 | 0.09 | 0.09 | ||||||||||||||
December 31 | 1,004,072 | 84,836 | 69,720 | 2.48 | 2.47 | ||||||||||||||
Year ended 2017 | $ | 3,686,345 | $ | 318,799 | $ | 42,511 | 1.51 | 1.50 | |||||||||||
Quarter ended 2016 | |||||||||||||||||||
March 31 | $ | 887,879 | $ | 67,755 | $ | (14,696 | ) | $ | (0.52 | ) | $ | (0.52 | ) | ||||||
June 30 | 1,064,244 | 97,042 | 14,423 | 0.51 | 0.51 | ||||||||||||||
September 30 | 859,612 | 77,015 | 1,722 | 0.06 | 0.06 | ||||||||||||||
December 31 | 1,113,055 | 103,694 | 10,145 | 0.36 | 0.36 | ||||||||||||||
Year ended 2016 | $ | 3,924,790 | $ | 345,506 | $ | 11,594 | 0.41 | 0.41 | |||||||||||
Net income (loss) per share is computed independently for each of the quarters presented. As such, the summation of the quarterly amounts may not equal the total net income per share reported for the year.
21. Subsequent Events
On February 13, 2018, the Company signed an agreement to sell three of its Tennessee grain locations. These assets were written down to estimated selling price less costs to sell in the fourth quarter of 2017 and classified as assets held for sale at December 31, 2017.
89
Item 9. Changes in and Disagreements With Accountants on Accounting and Financial Disclosure
None.
Item 9A. Controls and Procedures
Evaluation of Disclosure Controls and Procedures
The Company has established disclosure controls and procedures to ensure that the information required to be disclosed by the Company in the reports that it files or submits under the Exchange Act is recorded, processed, summarized and reported within the time periods specified in SEC rules and forms and that such information is accumulated and communicated to management of the Company, with the participation of its Chief Executive Officer and Chief Financial Officer (its "certifying officers"), as appropriate, to allow timely decisions regarding required disclosure.
Management of the Company, with the participation of its certifying officers, evaluated the effectiveness of the Company's disclosure controls and procedures as defined in Rules 13a-15(e) and 15d-15(e) under the Exchange Act. Based on the evaluation as of December 31, 2017, the certifying officers have concluded that the Company's disclosure controls and procedures were effective.
Management's Report on Internal Control over Financial Reporting
Management is responsible for establishing and maintaining adequate internal control over financial reporting, as such term is defined in Exchange Act Rules 13a-15(f) and 15d-15(f). Internal control over financial reporting is designed to provide reasonable assurance regarding the reliability of financial reporting and the preparation of financial statements for external purposes in accordance with generally accepted accounting principles and includes those policies and procedures that (i) pertain to the maintenance of records that, in reasonable detail, accurately and fairly reflect the transactions and dispositions of the assets of the Company; (ii) provide reasonable assurance that transactions are recorded as necessary to permit preparation of financial statements in accordance with generally accepted accounting principles, and that receipts and expenditures of the Company are being made only in accordance with authorizations of management and directors of the Company; and (iii) provide reasonable assurance regarding prevention or timely detection of unauthorized acquisition, use, or disposition of the Company's assets that could have a material effect on the financial statements. Because of its inherent limitations, internal control over financial reporting may not prevent or detect misstatements. Also, projections of any evaluation of effectiveness to future periods are subject to the risk that controls may become inadequate because of changes in conditions, or that the degree of compliance with the policies or procedures may deteriorate.
Under the supervision and with the participation of management, including the certifying officers, the Company conducted an evaluation of the effectiveness of its internal control over financial reporting based on the criteria established in the Internal Control - Integrated Framework (2013) issued by the Committee of Sponsoring Organizations of the Treadway Commission. Based on the results of this evaluation, management concluded that, as of December 31, 2017, the Company's internal control over financial reporting was effective.
The effectiveness of the Company's internal control over financial reporting as of December 31, 2017 has been audited by Deloitte & Touche LLP, an independent registered public accounting firm, as stated in their report, which is included under Item 8 of this Annual Report on Form 10-K.
Changes in Internal Control over Financial Reporting
There have been no changes in the Company's internal controls over financial reporting during the Company's most recent fiscal quarter that have materially affected, or are reasonably likely to materially affect, the Company's internal controls over financial reporting.
90
Report of Independent Registered Public Accounting Firm
To the Shareholders and the Board of Directors of
The Andersons, Inc.
Opinion on Internal Control over Financial Reporting
We have audited the internal control over financial reporting of The Andersons, Inc. and subsidiaries (the "Company") as of December 31, 2017, based on criteria established in Internal Control - Integrated Framework (2013) issued by the Committee of Sponsoring Organizations of the Treadway Commission (COSO). In our opinion, the Company maintained, in all material respects, effective internal control over financial reporting as of December 31, 2017, based on criteria established in Internal Control - Integrated Framework (2013) issued by COSO.
We have also audited, in accordance with the standards of the Public Company Accounting Oversight Board (United States) (PCAOB), the consolidated financial statements as of and for the year ended December 31, 2017, of the Company and our report dated February 26, 2018, expressed an unqualified opinion on those financial statements based on our audit and the reports of other auditors.
Basis for Opinion
The Company’s management is responsible for maintaining effective internal control over financial reporting and for its assessment of the effectiveness of internal control over financial reporting, included in the accompanying Management’s Report on Internal Control over Financial Reporting. Our responsibility is to express an opinion on the Company’s internal control over financial reporting based on our audit. We are a public accounting firm registered with the PCAOB and are required to be independent with respect to the Company in accordance with the U.S. federal securities laws and the applicable rules and regulations of the Securities and Exchange Commission and the PCAOB.
We conducted our audit in accordance with the standards of the PCAOB. Those standards require that we plan and perform the audit to obtain reasonable assurance about whether effective internal control over financial reporting was maintained in all material respects. Our audit included obtaining an understanding of internal control over financial reporting, assessing the risk that a material weakness exists, testing and evaluating the design and operating effectiveness of internal control based on the assessed risk, and performing such other procedures as we considered necessary in the circumstances. We believe that our audit provides a reasonable basis for our opinion.
Definition and Limitations of Internal Control over Financial Reporting
A company’s internal control over financial reporting is a process designed to provide reasonable assurance regarding the reliability of financial reporting and the preparation of financial statements for external purposes in accordance with generally accepted accounting principles. A company’s internal control over financial reporting includes those policies and procedures that (1) pertain to the maintenance of records that, in reasonable detail, accurately and fairly reflect the transactions and dispositions of the assets of the company; (2) provide reasonable assurance that transactions are recorded as necessary to permit preparation of financial statements in accordance with generally accepted accounting principles, and that receipts and expenditures of the company are being made only in accordance with authorizations of management and directors of the company; and (3) provide reasonable assurance regarding prevention or timely detection of unauthorized acquisition, use, or disposition of the company’s assets that could have a material effect on the financial statements.
Because of its inherent limitations, internal control over financial reporting may not prevent or detect misstatements. Also, projections of any evaluation of effectiveness to future periods are subject to the risk that controls may become inadequate because of changes in conditions, or that the degree of compliance with the policies or procedures may deteriorate.
/s/ Deloitte & Touche LLP
Cleveland, Ohio
February 26, 2018
91
Part III.
Item 10. Directors and Executive Officers of the Registrant
For information with respect to the executive officers of the registrant, see “Executive Officers of the Registrant” included in Part I of this report. For information with respect to the Directors of the registrant, see “Election of Directors” in the Proxy Statement for the Annual Meeting of the Shareholders to be held on May 11, 2018 (the “Proxy Statement”), which is incorporated herein by reference; for information concerning 1934 Securities and Exchange Act Section 16(a) Compliance, see such section in the Proxy Statement, incorporated herein by reference.
Item 11. Executive Compensation
The information set forth under the caption “Executive Compensation” in the Proxy Statement is incorporated herein by reference.
Item 12. Security Ownership of Certain Beneficial Owners and Management
The information set forth under the caption “Share Ownership” and “Executive Compensation - Equity Compensation Plan Information” in the Proxy Statement is incorporated herein by reference.
Item 13. Certain Relationships and Related Transactions
The information set forth under the caption “Review, Approval or Ratification of Transactions with Related Persons” in the Proxy Statement is incorporated herein by reference.
Item 14. Principal Accountant Fees and Services
The information set forth under “Appointment of Independent Registered Public Accounting Firm” in the Proxy Statement is incorporated herein by reference.
92
Part IV.
Item 15. Exhibits, Financial Statement Schedules, and Reports on Form 8-K
(a) (1) | The Consolidated Financial Statements of the Company are set forth under Item 8 of this report on Form 10-K. | |||
(2 | ) | The following consolidated financial statement schedule is included in Item 15(d): | Page | |
II. | Consolidated Valuation and Qualifying Accounts - years ended December 31, 2017, 2016 and 2015 | |||
All other schedules for which provisions are made in the applicable accounting regulation of the Securities and Exchange Commission are not required under the related instructions or are not applicable, and therefore have been omitted.
(3 | ) | Exhibits: | ||||
3.1 | Articles of Incorporation. (Incorporated by reference to Exhibit 3(d) to Registration Statement No. 33-16936). | |||||
3.2 | Code of Regulations of The Andersons, Inc. (Incorporated by reference to Exhibit 3.4 to Registration Statement No. 33-58963). | |||||
3.3 | Amended Article Fourth (a) of the Amended and Restated Articles of Incorporation of the Corporation (Incorporated by reference to DEF 14A filed March 15, 2016). | |||||
3.4 | Amendments to Articles of Incorporation or Bylaws (Incorporated by reference to Form 8-K filed July 19, 2017). | |||||
4.1 | Form of Indenture dated as of October 1, 1985, between The Andersons, Inc. and Ohio Citizens Bank, as Trustee (Incorporated by reference to Exhibit 4 (a) in Registration Statement No. 33-819). | |||||
4.2 | Specimen Common Share Certificate. (Incorporated by reference to Exhibit 4.1 to Registration Statement No. 33-58963). | |||||
4.3 | Form of Indenture dated June 28, 2012, between The Andersons, Inc. and Huntington National Bank, as Trustee (Incorporated by reference to Exhibit 4.1 in Registration Statement No. 333-182428). | |||||
10.10 | The Andersons, Inc. 2004 Employee Share Purchase Plan * (Incorporated by reference to Appendix B to the Proxy Statement for the May 13, 2004 Annual Meeting). | |||||
10.11 | Note Purchase Agreement, dated March 27, 2008, between The Andersons, Inc., as borrowers, and several purchases with Wells Fargo Capital Markets acting as agent (Incorporated by reference from Form 8-K filed March 27, 2008). | |||||
10.12 | Amended and Restated Note Purchase Agreement, dated February 26, 2010, between The Andersons, Inc., as borrower, and Co-Bank, one of the lenders to the original agreement (Incorporated by reference from Form 8-K filed March 5, 2010). | |||||
10.13 | Second Amended and Restated Marketing Agreement between The Andersons, Inc. and Cargill, Incorporated dated June 1, 2013. (The exhibits to the Marketing Agreement have been omitted. The Company will furnish such exhibits to the SEC upon request.) | |||||
10.14 | First Amendment to Lease and Sublease between Cargill, Incorporated and The Andersons, Inc. dated June 1, 2013. (Incorporated by reference to Form 10-K filed February 28, 2014). | |||||
10.15 | Form of Performance Share Unit Agreement. (Incorporated by reference to Form 10-K filed March 2, 2015). | |||||
10.16 | Form of Restricted Share Award Agreement. (Incorporated by reference to Form 10-K filed March 2, 2015). | |||||
93
10.17 | Fifth Amended and Restated Loan Agreement, dated March 4, 2014, between The Andersons, Inc., as borrower, and several banks with U.S. Bank National Association acting as agent and lender. (Incorporated by reference to Form 10-Q filed May 9, 2014). | |||||
10.19 | The Andersons, Inc. 2014 Long-Term Incentive Compensation Plan effective May 2, 2014 * (Incorporated by reference to Appendix C to the Proxy Statement for the May 2, 2014 Annual Meeting). | |||||
10.20 | Form of Performance Share Unit Agreement. (Incorporated by reference to Form 10-Q filed May 8, 2015). | |||||
10.21 | Form of Restricted Share Award Agreement. (Incorporated by reference to Form 10-Q filed May 8, 2015). | |||||
10.22 | Form of Restricted Share Award - Cliff Vesting Agreement. (Incorporated by reference to Form 10-Q filed May 8, 2015). | |||||
10.23 | Employment Agreement between The Andersons, Inc. and Patrick E. Bowe (Incorporated by reference to Form 8-K filed November 5, 2015). | |||||
10.24 | Form of Performance Share Unit Agreement - Total Shareholder Return. (Incorporated by reference to Form 10-Q filed May 10, 2016). | |||||
10.25 | Form of Performance Share Unit Agreement - Earnings Per Share. (Incorporated by reference to Form 10-Q filed May 10, 2016). | |||||
10.26 | Form of Restricted Share Award Agreement. (Incorporated by reference to Form 10-Q filed May 10, 2016). | |||||
10.27 | Form of Restricted Share Award - Non-Employee Directors Agreement. (Incorporated by reference to Form 10-Q filed May 10, 2016). | |||||
10.28 | Sixth Amended and Restated Loan Agreement, dated April 13, 2017, between The Andersons, Inc., as borrower, and several banks with U.S. Bank National Association acting as agent and lender. (Incorporated by reference to Form 8-K filed April 17, 2017). | |||||
10.29 | Form of Performance Share Unit Agreement - Total Shareholder Return. (Incorporated by reference to Form 10-Q filed May 5, 2017). | |||||
10.30 | Form of Performance Share Unit Agreement - Earnings Per Share. (Incorporated by reference to Form 10-Q filed May 5, 2017). | |||||
10.31 | Form of Restricted Share Award Agreement. (Incorporated by reference to Form 10-Q filed May 5, 2017). | |||||
10.32 | Form of Restricted Share Award - Non-Employee Directors Agreement. (Incorporated by reference to Form 10-Q filed May 5, 2017). | |||||
10.33 | Management Performance Program. (filed herewith). | |||||
10.34 | Form of Change in Control and Severance Participation Agreement (filed herewith). | |||||
10.35 | Change in Control and Severance Policy (filed herewith). | |||||
12 | Computation of Ratio of Earnings to Fixed Charges (filed herewith). | |||||
21 | Consolidated Subsidiaries of The Andersons, Inc (filed herewith). | |||||
23.1 | Consent of Independent Registered Public Accounting Firm - Deloitte & Touche LLP (filed herewith). | |||||
23.2 | Consent of Independent Registered Public Accounting Firm - KPMG LLP (filed herewith). | |||||
23.3 | Consent of Independent Registered Public Accounting Firm - PricewaterhouseCoopers LLP - Canada (filed herewith). | |||||
23.4 | Consent of Independent Registered Public Accounting Firm - Crowe Chizek LLP (filed herewith). | |||||
94
31.1 | Certification of the Chief Executive Officer under Rule 13(a)-14(a)/15d-14(a) (filed herewith). | |||||
31.2 | Certification of the Chief Financial Officer under Rule 13(a)-14(a)/15d-14(a) (filed herewith). | |||||
32.1 | Certifications Pursuant to 18 U.S.C. Section 1350 (filed herewith). | |||||
101 | Financial statements from the annual report on Form 10-K of The Andersons, Inc. for the year ended December 31, 2017, formatted in XBRL: (i) the Consolidated Statements of Operations, (ii) the Consolidated Statements of Comprehensive Income, (iii) the Consolidated Balance Sheets, (iv) the Consolidated Statements of Equity, (v) the Consolidated Statement of Cash Flows and (vi) the Notes to Consolidated Financial Statements. | |||||
* Management contract or compensatory plan.
(b) | Exhibits: | ||
The exhibits listed in Item 15(a)(3) of this report, and not incorporated by reference, follow "Financial Statement Schedule" referred to in (c) below. | |||
(c) | Financial Statement Schedule | ||
The financial statement schedule listed in 15(a)(2) follows "Signatures." | |||
Item 16. Form 10-K Summary
Not applicable
95
THE ANDERSONS, INC.
SCHEDULE II - CONSOLIDATED VALUATION AND QUALIFYING ACCOUNTS
(in thousands) | Additions | ||||||||||||||
Allowance for doubtful accounts receivable - Year ended December 31, | Balance at beginning of period | Charged to costs and expenses | Transferred from (to) allowance for accounts / notes receivable | (1) Deductions | Balance at end of period | ||||||||||
2017 | $ | 7,706 | $ | 3,000 | $ | — | $ | (1,550 | ) | $ | 9,156 | ||||
2016 | 6,938 | 1,191 | — | (423 | ) | 7,706 | |||||||||
2015 | 4,644 | 3,302 | — | (1,008 | ) | 6,938 | |||||||||
(1) Uncollectible accounts written off, net of recoveries and adjustments to estimates for the allowance accounts.
96
THE ANDERSONS, INC.
EXHIBIT INDEX
No. | Description | |
10.33 | ||
10.34 | ||
10.35 | ||
12 | ||
21 | ||
23.1 | ||
23.2 | ||
23.3 | ||
23.4 | ||
31.1 | ||
31.2 | ||
32.1 | ||
101 | Financial Statements from the annual report on Form 10-K of The Andersons, Inc. for the year ended December 31, 2017, formatted in XBRL: (i) the Consolidated Statements of Operations, (ii) the Consolidated Statements of Comprehensive Income, (iii) the Consolidated Balance Sheets, (iv) the Consolidated Statements of Equity, (v) the Consolidated Statement of Cash Flows and (vi) the Notes to Consolidated Financial Statements. | |
SIGNATURES
Pursuant to the requirements of Section 13 or 15(d) of the Securities Exchange Act of 1934, the Registrant has duly caused this report to be signed on its behalf by the undersigned, thereunto duly authorized.
THE ANDERSONS, INC. (Registrant) | ||
Date: February 26, 2018 | By /s/ Patrick E. Bowe | |
Patrick E. Bowe | ||
Chief Executive Officer (Principal Executive Officer) | ||
Pursuant to the requirements of the Securities Exchange Act of 1934, this report has been signed below by the following persons on behalf of the Registrant and in the capacities and on the dates indicated.
97
Signature | Title | Date | Signature | Title | Date | |
/s/ Patrick E. Bowe | Chief Executive Officer | 2/26/2018 | /s/ Ross W. Manire | Director | 2/26/2018 | |
Patrick E. Bowe | (Principal Executive Officer) | Ross W. Manire | ||||
/s/ John J. Granato | Chief Financial Officer | 2/26/2018 | /s/ Donald L. Mennel | Director | 2/26/2018 | |
John J. Granato | (Principal Financial Officer) | Donald L. Mennel | ||||
/s/ Anne G. Rex | Vice President, Corporate Controller | 2/26/2018 | /s/ Patrick S. Mullin | Director | 2/26/2018 | |
Anne G. Rex | (Principal Accounting Officer) | Patrick S. Mullin | ||||
/s/ Michael J. Anderson | Chairman | 2/26/2018 | /s/ John T. Stout, Jr. | Director | 2/26/2018 | |
Michael J. Anderson | John T. Stout, Jr. | |||||
/s/ Gerard M. Anderson | Director | 2/26/2018 | /s/ Jacqueline F. Woods | Director | 2/26/2018 | |
Gerard M. Anderson | Jacqueline F. Woods | |||||
/s/ Catherine M. Kilbane | Director | 2/26/2018 | /s/ Robert J. King, Jr. | Director | 2/26/2018 | |
Catherine M. Kilbane | Robert J. King, Jr. | |||||
98