Nuveen Investment Funds, Inc.
UNITED STATES
SECURITIES AND EXCHANGE COMMISSION
Washington, D.C. 20549
FORM N-CSR
CERTIFIED SHAREHOLDER REPORT OF REGISTERED MANAGEMENT
INVESTMENT COMPANIES
Investment Company Act file number 811-05309
Nuveen Investment Funds, Inc.
(Exact name of registrant as specified in charter)
Nuveen Investments
333 West Wacker Drive, Chicago, IL 60606
(Address of principal executive offices) (Zip code)
Christopher M. Rohrbacher
Vice President and Secretary
333 West Wacker Drive,
Chicago, IL 60606
(Name and address of agent for service)
Registrant’s telephone number, including area code: (312) 917-7700
Date of fiscal year end: October 31
Date of reporting period: October 31, 2019
Form N-CSR is to be used by management investment companies to file reports
with the Commission not later than 10 days after the transmission to stockholders of any report that is required to be transmitted to stockholders under Rule 30e-1 under the Investment Company Act of 1940 (17
CFR 270.30e-1). The Commission may use the information provided on Form N-CSR in its regulatory, disclosure review, inspection, and policy making roles.
A registrant is required to disclose the information specified by Form
N-CSR, and the Commission will make this information public. A registrant is not required to respond to the collection of information contained in Form N-CSR unless the
Form displays a currently valid Office of Management and Budget (“OMB”) control number. Please direct comments concerning the accuracy of the information collection burden estimate and any suggestions for reducing the burden to Secretary,
Securities and Exchange Commission, 450 Fifth Street, NW, Washington, DC 20549-0609. The OMB has reviewed this collection of information under the clearance requirements of 44 U.S.C. ss.3507.
ITEM 1. REPORTS TO STOCKHOLDERS.
Nuveen Equity Funds
| Fund
Name |
Class
A |
Class
C |
Class
R3 |
Class
R6 |
Class
I |
| Nuveen
Dividend Value Fund |
FFEIX
|
FFECX
|
FEISX
|
FFEFX
|
FAQIX
|
| Nuveen
Mid Cap Value Fund |
FASEX
|
FACSX
|
FMVSX
|
FMVQX
|
FSEIX
|
| Nuveen
Small Cap Value Fund |
FSCAX
|
FSCVX
|
FSVSX
|
FSCWX
|
FSCCX
|
Beginning on January 1, 2021, as permitted by regulations
adopted by the Securities and Exchange Commission, paper copies of the Funds' annual and semi-annual shareholder reports will no longer be sent by mail, unless you specifically request paper copies of the reports. Instead, the reports will be made
available on the Funds' website (www.nuveen.com), and you will be notified by mail each time a report is posted and provided with a website link to access the report.
If you have already elected to receive shareholder reports
electronically, you will not be affected by this change and you need not take any action. You may elect to receive shareholder reports and other communications from the Funds electronically anytime by contacting the financial intermediary (such as a
broker-dealer or bank) through which you hold your Fund shares or, if you are a direct investor, by enrolling at www.nuveen.com/e-reports.
You may elect to receive all future shareholder reports in
paper free of charge at any time by contacting your financial intermediary or, if you are a direct investor, by calling 800-257-8787 and selecting option #1. Your election to receive reports in paper will apply to all funds held in your account with
your financial intermediary or, if you are a direct investor, to all your directly held Nuveen Funds and any other directly held funds within the same group of related investment companies.
Life is Complex.
Nuveen makes things e-simple.
It only takes a minute to sign up for
e-Reports. Once enrolled, you’ll receive an e-mail as soon as your Nuveen Fund information is ready. No more waiting for delivery by regular mail. Just click on the link within the e-mail to see the report and save it on your computer if you
wish.
Free e-Reports right to your
e-mail!
www.investordelivery.com
If you receive your Nuveen Fund
distributions and statements from your financial advisor or brokerage account.
or
www.nuveen.com/client-access
If you receive your Nuveen Fund
distributions and statements directly from Nuveen.
Must be preceded by or accompanied by a
prospectus.
NOT FDIC INSURED MAY
LOSE VALUE NO BANK GUARANTEE
Chair’s Letter to Shareholders
Dear Shareholders,
Financial markets have been receiving mixed messages over the
past year. The global economy has bifurcated, split between a slumping manufacturing sector and a resilient consumer. Confidence has been weakened among corporate managements, who are wary of trade frictions and moderating global growth, but has
remained elevated among consumers, who have benefited from tight labor markets and growing wages. As the economic cycle advances toward its later stage, corporate profits are shrinking and earnings forecasts are being downgraded. A waning growth
outlook has held interest rates near historically low levels, while stock market indexes have overcome periodic volatility to touch historical highs.
While we continue to anticipate slower economic growth and
increased market volatility, we note that recession fears have receded from earlier in the year. The U.S. economy held steady in the third quarter, and nearer-term economic indicators have provided upside surprises. Consumer confidence remains
underpinned by low unemployment and modest wage growth. Looser financial conditions, in part driven by the Federal Reserve’s three interest rate cuts in 2019, have revived momentum in the housing market and should continue to encourage
borrowing by consumers and businesses. Outside the U.S., Germany avoided a recession in the second half of 2019 and other eurozone economic indicators are pointing to stabilization and improving sentiment. Consumers in Europe and Japan, like those
in the U.S., have remained supported by jobs growth and rising wages. Although the outcomes of trade, Brexit and other geopolitical concerns continue to be uncertain, some clarity on these issues could be a potential source of upside.
At Nuveen, we still see investment opportunities in the
maturing economic environment, but we are taking a selective approach. If you’re concerned about where the markets are headed from here, we encourage you to work with your financial advisor to review your time horizon, risk tolerance and
investment goals. On behalf of the other members of the Nuveen Fund Board, we look forward to continuing to earn your trust in the months and years ahead.
Sincerely,
Terence J. Toth
Chair of the Board
December 23, 2019
Portfolio Managers’
Comments
Nuveen Dividend Value
Fund
Nuveen Mid Cap Value Fund
Nuveen Small Cap Value Fund
These Funds feature portfolio management by Nuveen Asset
Management, LLC (NAM), an affiliate of Nuveen, LLC.
Throughout the reporting period, David A. Chalupnik, CFA, was
the portfolio manager for the Nuveen Dividend Value Fund. He joined the portfolio management team for the Fund in 2015. Effective March 19, 2019, Derek Sadowsky, CFA, is no longer a portfolio manager of the Nuveen Dividend Value Fund and Evan F.
Staples, CFA, was added as a portfolio manager.
Karen L.
Bowie, CFA, is the portfolio manager for the Nuveen Mid Cap Value Fund and the Nuveen Small Cap Value Fund. Karen assumed portfolio management responsibilities for the Nuveen Mid Cap Value Fund in 2012 and the Nuveen Small Cap Value Fund in 2006.
David F. Johnson, CFA, and Andrew O. Rem, CFA, joined the portfolio management team for the Nuveen Small Cap Value Fund in 2017.
On the following pages, the portfolio management teams for the
Funds discuss the economy and financial markets, key investment strategies and the Funds’ performance for the twelve-month reporting period ended October 31, 2019.
What factors affected the U.S. economy and financial markets
during the twelve-month reporting period ended October 31, 2019?
The U.S. economy reached the tenth year of expansion since the
previous recession ended in June 2009, marking the longest expansion in U.S. history. In the third quarter of 2019, gross domestic product (GDP) grew at an annualized rate of 2.1%, according to the “second” estimate by the Bureau of
Economic Analysis. GDP measures the value of goods and services produced by the nation’s economy less the value of the goods and services used up in production, adjusted for price changes. Growth in consumer spending and the housing sector
helped offset a decline in business investment during the July to September 2019 period. By comparison, annualized GDP growth was 2.0% in the second quarter and 3.1% in the first quarter.
Consumer spending, the largest driver of the economy, remained
well supported by low unemployment, wage gains and tax cuts. As reported by the Bureau of Labor Statistics, the unemployment rate fell to 3.6% in October 2019 from 3.8% in October 2018 and job gains averaged around 174,000 per month for the past
twelve months. As the jobs market has tightened, average hourly earnings grew at an annualized rate of 3.0% in October 2019. However, falling energy prices dampened inflation over the past twelve months. The Bureau of Labor Statistics said the
Consumer Price Index (CPI) increased 1.8% over the twelve-month reporting period ended October 31, 2019 before seasonal adjustment.
Low mortgage rates and low inventory drove home prices
moderately higher in this reporting period, despite declining new home sales and housing starts. The S&P CoreLogic Case-Shiller U.S. National Home Price Index, which covers all nine U.S. census divisions, was up 3.2% year-over-year in September
2019 (most recent data available at the time this report was prepared). The 10-City and 20-City Composites reported year-over-year increases of 1.5% and 2.1%, respectively.
This material is not intended to be a recommendation or investment advice,
does not constitute a solicitation to buy, sell or hold a security or an investment strategy, and is not provided in a fiduciary capacity. The information provided does not take into account the specific objectives or circumstances of any particular
investor, or suggest any specific course of action. Investment decisions should be made based on an investor’s objectives and circumstances and in consultation with his or her advisors.
Certain statements in this report are forward-looking
statements. Discussions of specific investments are for illustration only and are not intended as recommendations of individual investments. The forward-looking statements and other views expressed herein are those of the portfolio managers as of
the date of this report. Actual future results or occurrences may differ significantly from those anticipated in any forward-looking statements and the views expressed herein are subject to change at any time, due to numerous market and other
factors. The Funds disclaim any obligation to update publicly or revise any forward-looking statements or views expressed herein.
Refer to the Glossary of Terms Used in this Report for further
definition of the terms used within this section.
Portfolio Managers’ Comments (continued)
As data pointed to slower momentum in the overall economy, the
Federal Reserve (Fed) notably shifted its stance. Although the Fed had indicated in December 2018 that there could be two more rate hikes in 2019, global growth concerns kept the central bank on the sidelines. As expected by the markets, the Fed
left rates unchanged throughout the first half of 2019 while speculation increased that the Fed’s next move would be a rate cut. At the July 2019, September 2019 and October 2019 policy committee meetings, the Fed announced a 0.25% cut to its
main policy rate. Markets registered disappointment with the Fed’s explanation that the rate cuts were a “mid-cycle adjustment,” rather than a prolonged easing period, and its signal that there would be no additional rate cuts in
2019. Also in the latter half of 2019, the Fed announced it would stop shrinking its bond portfolio sooner than scheduled, as well as began buying short-term Treasury bills to help money markets operate smoothly and maintain short-term borrowing
rates at low levels. Fed Chairman Powell emphasized that the Treasury bill purchases were not a form of quantitative easing.
During the twelve-month reporting period, geopolitical news
remained a prominent market driver. Tariff and trade policy topped the list of concerns, most prominently the U.S.-China relations. After several rounds of talks and a series of tariff increases, President Trump and President Xi agreed to another
temporary trade truce in late June 2019 that halted additional tariff increases. Tensions increased markedly after the July 2019 negotiations ended without an agreement, with both China and the U.S. increasing import duties. After setting new trade
meetings in September and October 2019, tariff waivers were announced on a selected group of U.S. and Chinese goods and the two sides signaled progress toward a partial trade deal. The U.S., Mexico and Canada Agreement (USMCA) trade deal replacing
the North American Free Trade Agreement had yet to be ratified by the national congresses (subsequent to the close of the reporting period, the trade deal was passed by the House of Representatives), while President Trump rescinded the threat to
impose tariffs on Mexico if the country didn’t take more action to curb illegal immigration. With the U.S. House of Representatives opening an impeachment inquiry into President Trump, ratification of the USMCA deal was expected to be delayed.
The Trump administration delayed imposing auto tariffs on the European Union (EU), as it continued to focus more on the China trade negotiations, but duties on $7.5 billion worth of EU goods including wine and cheese went into effect in October 2019
in retaliation for a dispute over aircraft subsidies. Global manufacturing and export data continued to show evidence of trade-related slumps, which increased worries that the slowdown would spread into other segments of the global economy.
In the U.K., Prime Minister Theresa May was unable to secure a
Brexit deal before the original March 29, 2019 deadline and resigned as of June 7, 2019. The EU extended the deadline to October 31, 2019, which Prime Minister May’s successor, Boris Johnson, was unable to meet after a series of political
maneuvers failed to secure an approval for his exit plan. In October 2019, the EU approved a “flextension” to January 31, 2020 and a U.K. general election was scheduled for December (subsequent to the close of the reporting period, on
December 19, 2019, the British Parliament passed the Brexit Bill). In Italy, investors worried about another potential budget clash between the eurosceptic coalition government and the EU. However, following the unexpected resignation of the prime
minister in August 2019, the newly formed coalition government appeared to take a less antagonistic stance. Europe also contended with the “yellow vest” protests in France, immigration policy concerns, Russian sanctions and political
risk in Turkey.
Elections around the world also remained
a source of uncertainty. Markets continued to closely monitor the new administrations in Brazil and Mexico, as well as Argentina’s presidential election. Incumbent candidate President Macri, seen as market-friendly, suffered a surprising
defeat in the August 2019 primary, and the Peronist ticket of Alberto Fernandez/Cristina Fernandez de Kirchner won as expected in the October 2019 election. Europe’s traditional centrist parties lost seats in the Parliamentary elections and
populist parties saw marginal gains. The ruling parties in India and South Africa maintained their majorities, where slower economic growth could complicate their respective reform mandates.
In the U.S., the longest bull market on record continued, but
not without significant bouts of volatility. Stocks sold off sharply in December 2018, leading the bellwether S&P 500® to record its lowest
monthly return since 1931. Although economic data was mostly positive and corporate earnings growth continued to far exceed expectations, a broad array of issues weighed on investor sentiment at the end of 2018, sparking extreme stock market
volatility. Investors were concerned about ongoing political discord, trade friction with China, the path and pace of Fed rate increases and the partial U.S. government shutdown. Fueled by better-than-expected fourth-quarter 2018 earnings, equities
rebounded sharply in the beginning of 2019 through April. However, markets continued to be quite volatile, selling off in May due to changing expectations regarding trade and Fed policy, as well as concerns about slowing economic growth. During the
summer months, stock markets advanced strongly again with the S&P 500® hitting an all-time high above 3000 in late July before falling in
August. Markets remained choppy and continued to struggle for footing amid escalating trade ten-
sions, weaker Chinese economic data, protests in Hong Kong, increasing
recession fears and the growing prevalence of negative interest rates worldwide. In the final month of the reporting period, however, the S&P 500 hit new all-time highs as investors celebrated better-than-expected corporate earnings, some signs
of clarity regarding Brexit, broad monetary easing across the globe and optimism surrounding progress on the U.S./China trade front.
U.S. large-cap companies produced strong gains during the
reporting period and handily outpaced smaller-sized companies by nearly 10%, with the S&P 500 advancing 14.33%. Ten of the eleven sectors within the index ended the twelve-month reporting period in positive territory, led by more than 20% gains
in two “bond-proxy” sectors (real estate and utilities) as well as in the information technology sector. Energy was the only S&P 500 sector in the red during the reporting period, pressured lower by falling energy prices due to
slowing growth and oversupply. Small-cap equities underperformed larger-cap stocks during the reporting period, likely weighed down more by trade tensions, increasing evidence of economic deceleration and rising political uncertainty stemming from
mounting impeachment rhetoric in Washington D.C. The segment gained 4.90% over the reporting period as measured by the Russell 2000 Index. From a style perspective, growth-oriented stocks continued their long-running trend of outperforming value
stocks across the capitalization spectrum, benefiting on a relative basis from slowing corporate profit growth.
In developed markets outside the U.S., geopolitical issues in
Europe including the chaos surrounding Brexit, markedly slower economic growth across Europe and in particular Germany, and the negative impact of the trade war at times created headwinds for stocks. However, by the end of the reporting period,
markets still advanced fairly strongly as optimism increased regarding both trade negotiations and Brexit, recording an 11.04% according to the MSCI EAFE Index. The same issues also produced headwinds for emerging markets, especially China’s
slowdown since these regions tend to be more reliant on that economy, and the rising U.S. dollar. But these markets also gained footing, producing an 11.86% return in U.S. dollar terms during the reporting period, as measured by the MSCI Emerging
Markets Index.
Nuveen Dividend Value Fund
How did the Fund perform during the twelve-month reporting period
ended October 31, 2019?
The tables in the Fund
Performance and Expense Ratios section of this report provide total returns for the Fund for the one-year, five-year, ten-year and since inception periods ended October 31, 2019. Comparative performance information is provided for the Fund’s
Class A Shares at net asset value (NAV) only. The Fund’s Class A Shares at NAV underperformed the Russell 1000® Value Index and the Lipper
Equity Income Funds Classification Average during the twelve-month reporting period.
What strategies were used to manage the Fund during the reporting
period and how did these strategies influence performance?
The Fund’s investment objective is long-term growth of
capital and income.
During the reporting period, we
continued to implement the Fund’s disciplined investment strategy. We seek to achieve consistent, long-term outperformance with lower volatility by building and managing a diversified portfolio of stocks with a focus on what we believe are
attractively valued companies with above average current income or dividend growth. We use an integrated, multi-perspective research and analysis approach that involves a team of portfolio managers, fundamental research analysts and quantitative
analysts. The Fund’s holdings exhibit attractive valuations and identifiable catalysts that we believe will offer the potential for future stock appreciation. The Fund is also actively managed in an effort to minimize distributed capital gains
and maximize after-tax returns using a typical investment horizon of at least two to three years. We adhere to portfolio guidelines to manage volatility and maintain diversification, generally selling a security if it no longer is expected to meet
our dividend growth or price appreciation expectations or if we find a better alternative in the marketplace.
The Fund’s underperformance versus the Russell 1000® Value benchmark and Lipper peers was primarily the result of stock selection issues in the health care, financials, energy and consumer staples
sectors. Health care was the Fund’s main source of weakness during the reporting period. Shares of pharmacy benefit management (PBM) company CVS Health Corporation traded lower despite the firm posting a solid fourth-quarter earnings report.
Investors focused on the company’s 2019 guidance, which came in well below analysts’
Portfolio Managers’ Comments (continued)
estimates. Management indicated that earnings from the retail segment were
expected to be down double digits. Following the release, the stock was down and while the valuation has become more attractive, growth visibility and confidence in management has fallen. Given a lack of near-term catalysts for the stock, we exited
the Fund’s position in CVS Health.
We also saw
disappointing results from Cigna Corporation, a managed care company with PBM exposure via its acquisition of Express Scripts. The company reported strong earnings in its most recent quarterly release, but the stock struggled as investors focused on
lower membership growth guidance. However, management is confident in the synergy opportunity resulting from the integration of Express Scripts, therefore, we continued to hold the position.
In the financial area, we saw weak results from a position in
E*TRADE Financial Corporation, the provider of online brokerage, banking and other related products to individual retail investors. The company reported results that were better than expectations across the board, with strong revenue and expense
control driving strong operating leverage and earnings upside. However, E*TRADE Financial was negatively impacted at times as macroeconomic concerns drove a weaker and more volatile stock market. Because sentiment toward the company is driven by
trading volume, its shares underperformed. We exited our position after pricing competition increased.
In the energy sector, refiners such as HollyFrontier Corp
experienced a pullback given falling oil prices earlier in the reporting period, global slowdown concerns and an increase in global refining capacity, which narrowed crude differentials. And despite a slight improvement in the outlook given tight
domestic fuel inventories, we exited the position given the stock’s persistent weakness.
Also, a position in Marathon Petroleum Corp weighed heavily on
performance. The company reported below consensus on earnings per share (EPS), driven by weaker refining performance and retail operating income. Given this and other reasons, we sold out of Marathon Petroleum during the reporting period.
In the consumer staples area, the Fund saw weak results from
Altria Group Inc., a holding company engaged in the production and marketing of tobacco and smokeless products. Altria missed on several metrics including revenue, operating profit and EPS. Combustible volumes declined and the operating profit miss
was attributed to lower shipment volume, which was offset somewhat by pricing and lower promotion costs. In addition, although management did not lower guidance, it decreased estimates for cigarette industry volumes. We no longer hold Altria.
On the positive side of the equation, the Fund benefited from
stock selection in the consumer discretionary, information technology and communication services sectors. Security selection was particularly strong in consumer discretionary led by a position in Target Corporation. The company posted strong
performance reporting a quarterly beat across the board on revenues, margins and EPS. Despite ongoing spending for digital initiatives, store remodels and new merchandising launches, gross and operating margins expanded ahead of consensus
expectations. Target has demonstrated strong execution of digital and omni-channel initiatives, which has been aided by its merchandising expertise in private label categories and utilization of its stores as distribution centers. For these and
other reasons, we continued to hold Target in the Fund.
Also in discretionary, Newell Brands Inc. is a worldwide
marketer of consumer and commercial products including more than 200 brands such as Rubbermaid, Graco, Paper Mate, Sunbeam and Coleman. The company reported revenue that was in line with expectations, but an earnings beat driven by execution on cost
reduction initiatives and expense discipline. We maintained the Fund’s position in Newell Brands during the reporting period.
The information technology sector was a source of strength
with Qualcomm Inc. showing solid performance in the semiconductor group. We initiated a position in late February 2019 after poor sentiment presented an attractive buying opportunity. Shares jumped following the announcement of a settlement with
Apple to dismiss all litigation as well as a six-year licensing deal with Apple. Later in the reporting period, a U.S. district judge ruled in favor of the Federal Trade Commission in its antitrust suit against Qualcomm and the stock pared gains
from the Apple announcements. Ultimately, the pullback was not enough to offset the strength earlier in the reporting period and we no longer hold Qualcomm in the Fund.
Also in technology, the Fund benefited from a position in
Microsoft Corporation, the world’s largest software maker and a leading provider of operating systems and productivity suites for personal computers. Quarterly results were strong across the board with much of the upside driven by the
company’s highest gross margin segments (Windows and Server Products). Microsoft’s multi-year growth engines, Office 365 and Azure, continued to show fundamental strength, while margin expansion across Commercial Cloud is continuing with
scale and execution. We remain bullish regarding this stock because of the confidence by which the company is executing and remain shareholders.
In addition, the Fund saw favorable results from Lam Research
Corporation, the designer and manufacturer of advanced wafer fab equipment (WFE) to the largest chip and memory companies in the world. The shares rose following the company’s quarterly earnings call where management indicated that the 2019
WFE market was still weak, leading to an expected revenue decline, but that the company generated profits with the help of operational efficiency initiatives. The Fund no longer holds Lam Research Corporation.
On the other hand, our position in IT consulting firm DXC
Technology Co. was a major source of weakness in information technology. The company posted several disappointing quarters with the latest showing organic revenue trends slowing sequentially, specifically in its global infrastructure services
segment. Margins also missed on lower revenue and cost-cutting delays and management lowered fiscal-year 2020 revenue and EPS guidance. Given the stock’s persistent weakness and deteriorating outlook, we exited the Fund’s position in DXC
Technology.
AT&T Inc. was the Fund’s top
performer from the communications services sector. AT&T’s earnings release was in line with expectations after the company saw losses in video offset by better margins and improving wireless trends. However, the shares were up during the
reporting period after activist investor Elliot Management sent a letter to AT&T’s board of directors. The letter highlighted Elliot Management’s large position in the name, included a list of suggested changes the firm would like to
see and outlined its belief in the company’s return potential. The stock reacted positively to the news and we continued to hold AT&T in the Fund.
While the overall contribution from the industrials sector was
basically flat during the reporting period, shares of defense company L3 Harris Technologies Inc. benefited the Fund’s performance. The company was formed from the merger of L3 Technologies and Harris Corp. that was completed in July 2019. The
stock initially rallied as the company approached the planned merger date with Harris. As a combined entity, management believes the company can generate $3 billion in free cash flow as well as improve working capital. We continued to hold our
shares in L3 Harris Technologies, but reduced the Fund’s exposure to the stock given the strong run during the reporting period.
Finally, an underweight position in the poorly performing
energy sector, including no exposure to Exxon Mobil Corporation, also proved helpful. Shares dropped sharply in late April 2019 as investors questioned the oil giant’s comeback from a disastrous first half in 2018. Exxon, which typically
relies on its refining business to offset more volatile units, reported its worst refining performance in almost two decades with an average loss of $3 million per day during the quarter after large stockpiles of gasoline squeezed margins and
repairs slowed output. Additionally, the company’s chemicals business saw a nearly 50% decrease in profits. These results overshadowed a nearly 140% increase in the company’s Permian Basin output.
Nuveen Mid Cap Value Fund
How did the Fund perform during the twelve-month reporting period
ended October 31, 2019?
The tables in the Fund
Performance and Expense Ratios section of this report provide total returns for the Fund for the one-year, five-year, ten-year and since inception periods ended October 31, 2019. Comparative performance information is provided for the Fund’s
Class A Shares at net asset value (NAV). The Fund’s Class A Shares at NAV outperformed both the Russell Midcap® Value Index and the Lipper
Mid-Cap Value Funds Classification Average during the twelve-month reporting period.
What strategies were used to manage the Fund during the reporting
period and how did these strategies influence performance?
The Fund seeks to provide long-term capital appreciation by
investing primarily in the common stocks of companies with market capitalizations at the time of purchase between approximately $1 billion and $38 billion, which is based on the June 28, 2019 reconstitution of the Russell Midcap® Index. During the reporting period, we continued to implement the Fund’s investment process of selecting
Portfolio Managers’ Comments (continued)
mid-cap companies that we believed were undervalued relative to other
companies in the same industry or market. These companies demonstrated or are expected to demonstrate improving fundamentals and have an identifiable catalyst that could close the gap between market value and our perception of fair value. We look
for companies that generate strong free cash flow, which allows them to pay down debt, increase dividends, repurchase shares or engage in merger and acquisition (M& A) activities. At the same time, we identify a short- or long-term catalyst we
can track and monitor over time that could potentially propel each stock to realize its value. Generally, we sell a holding if the stock price reaches its target, the company’s fundamentals or competitive position significantly deteriorate or
if a better alternative exists in the marketplace.
The
Fund’s outperformance versus the Russell benchmark and Lipper peers was primarily due to stock selection in the consumer discretionary and materials sectors. An underweight in consumer staples was also beneficial. The consumer discretionary
sector was a significant source of strength during the reporting period led by a position in off-price retailer Dollar General Corporation. Shares performed well after the company continued to benefit from operational momentum and reported a
favorable second-quarter earnings result. Revenue, earnings per share (EPS), margins and same-store sales all beat consensus estimates, driven by strength in the company’s Seasonal and Home segments. Additionally, Dollar General raised
guidance for the year, which included minimal impacts from existing and newly announced tariffs. We continued to hold our position in Dollar General.
Also in discretionary, a position in national single-family
homebuilder DR Horton Inc. provided favorable results. The housing industry backdrop improved with the spring selling season evolving better than feared, driven by lower rates and stable consumers. DR Horton has recently been making tuck-in
acquisitions of small, mid-U.S. regional builders, which are creating new markets and greater share. The acquisitions should also boost the company’s operating results as the year progresses. We remained invested because we believe DR Horton
is well positioned in terms of product trends and geographic diversification with its lower-than-average exposure to some of the housing market’s biggest problem areas such as the California Coast, New York, New Jersey and Connecticut.
For Newell Brands Inc., the household durables company
reported revenue that was in line with expectations, but an earnings beat driven by execution on cost reduction initiatives and expense discipline. We continued to hold our position in Newell Brands.
In the materials sector, a position in Celanese Corp performed
well despite the difficult market environment marked by inventory destocking in the first half of 2019. This global chemical and specialty materials company creates products that are critical to the chemical, paint and coating industries. Despite
uncertainty surrounding trade and a weaker automotive end market, Celanese’s more flexible business model has allowed the company to report more stable operating results and keep guidance intact, while peers have decreased guidance.
Additionally, Celanese has brought in a new CEO while the old CEO is staying on as chairman in a more strategic role. We continue to maintain our position given the stock’s attractive valuation coupled with the company’s consistent
operating progress.
While the industrials sector
didn’t contribute favorably overall to relative results, shares of defense company L3 Harris Technologies Inc. benefited performance in the Fund. The company was formed from the merger of L3 Technologies and Harris Corp. that was completed in
July 2019. The stock initially rallied as the company approached the planned merger date with Harris. As a combined entity, management believes the company can generate $3 billion in free cash flow as well as improve working capital. The merger
comes at a time of a good defense end market backdrop for the company. We continued to hold our shares in L3 Harris Technologies, but reduced the Fund’s exposure to the stock given the strong run during the reporting period.
Although the real estate sector was also a detractor, the
Fund’s position in First Industrial Realty Trust Inc. aided results. First Industrial reported an in-line quarter with a good development pipeline across key markets. The firm also continued to see strong e-commerce tenant demand and balanced
supply-demand in the U.S. industrial space. We maintained a position in First Industrial during the reporting period.
The information technology sector modestly benefited
performance overall and was home to several of the Fund’s top contributors including First Data Corp. The company is a provider of electronic commerce and payment solutions for merchants, financial institutions and card issuers globally. In
January 2019, Fiserv announced an all-stock acquisition of First Data in a $22 billion deal that equated to an approximately 30% premium to the prior close. The company also reported favorable revenue and EPS results that beat expectations and
favorable 2019 earnings growth guidance. The Fund no longer held First Data Corp at the end of the reporting period.
The Fund also benefited from its position in Cypress
Semiconductor Corp, a manufacturer of a broad range of semiconductors and high-performance solutions for automotive, industrial, wireless networking and consumer electronics markets. Shares began to rally in late May on potential interest from
Germany-based Infineon Technologies. Cypress and Infineon reached a deal in early June 2019 in which Infineon would acquire Cypress in an all-cash deal. Given the stock had little upside, we decided to sell the Fund’s position in Cypress
Semiconductor.
Also in technology, shares of Synopsys
Inc. continued to outperform based on higher revenue growth and margin expansion from new growth areas in semiconductor design. In its fiscal year 2019 first-quarter earnings report, Synopsys gave its first-ever backlog figure of $4.3 billion, and a
year-over-year growth rate of more than 8%, which is 2% more than its current revenue growth rate. The backlog is a good indicator of growth in software for new areas. Also, the company announced a strategic partnership with Samsung, who will be
ordering software from Synopsys for the first time. We maintained the Fund’s position in Synopsys at the end of the reporting period.
On the other hand, stock selection detracted in the financial
and consumer staples sectors. In the financial area, we saw weak results from a position in E*TRADE Financial Corp, the provider of online brokerage, banking and other related products to individual retail investors. The company reported results
that were better than expectations across the board, with strong revenue and expense control driving strong operating leverage and earnings upside. However, E*TRADE Financial was negatively impacted at times as macroeconomic concerns drove a weaker
and more volatile stock market. Because sentiment toward the company is driven by trading volume, its shares underperformed. We exited our position after pricing competition increased.
Also in financials, East West Bancorp Inc. underperformed
largely due to the fact that East West is more rate sensitive compared to peers. Net interest margin has come under pressure with the Federal Reserve’s rate cuts in 2019, which have put downward pressure on East West’s earnings.
Additionally, given the company’s underlying exposure to China, its shares have been negatively impacted by the ongoing trade war. However, we still own the name given its attractive valuation and operational opportunities because the trade
tone has improved. East West will likely benefit if any progress is made on the trade front.
In the consumer staples sector, the Fund experienced weak
results from a position in packaged and processed food manufacturer Conagra Brands Inc. Although the company’s legacy Conagra business fared relatively well, the performance of its Pinnacle Foods segment was below expectations both in terms of
revenues and profit, with key leadership brands experiencing declines. Issues arose in the Pinnacle Foods segment including a recall, inefficient promotions and pricing, a lack of innovation and increased innovation from competitors, which weighed
on Conagra’s stock. With a large amount of debt leverage, we believed the company’s balance sheet would likely weaken, therefore, we exited the position.
While energy contributed favorably to performance, the sector
was home to one significant laggard, Marathon Oil Corp. The sector was out of favor given that global demand was slowing, while supply levels have yet to be rationalized. For Marathon Oil specifically, investors were concerned with
management’s ability to maintain capital discipline and slow capital expenditure growth. However, we continued to hold shares given the company’s premium assets in attractive basins and its lowest well costs in the industry.
In communication services, Lions Gate Entertainment Corp
weighed on results in the sector. The company is one of the few remaining media firms and the larger firms like CBS, Time and Disney are looking for offerings for their platforms. Lions Gate lacks the financial strength to create a stronger platform
on its own, given its debt level and volatile cash flow because of the hit or miss tendencies of production companies. Due to the continued lack of interest in Lions Gate offerings and its weaker financial position, the stock has come under
pressure. We exited the position in May 2019 after CBS/Viacom showed potential interest in Starz.
In health care, we were disappointed with results from Centene
Corp, a managed care insurer focused on government programs like Medicaid and Medicare. The company reported results that beat expectations during its most recent quarter with revenue up 29% and earnings up 49% driven by strong membership gains and
the acquisition of Fidelis. However, Centene’s stock declined rather sharply due to the loss of the Louisiana Medicaid contract and delayed contract awards from Texas. We remained invested in Centene because of its strong fundamentals and our
belief that the outcome of the election will not likely have a significant impact on government insurance programs.
Portfolio Managers’ Comments (continued)
In the information technology sector, our position in IT
consulting firm DXC Technology Co. was a major source of weakness. The company posted several disappointing quarters with the latest showing organic revenue trends slowing sequentially, specifically in its global infrastructure services segment.
Margins also missed on lower revenue and cost-cutting delays and management lowered fiscal-year 2020 revenue and EPS guidance. Given the stock’s persistent weakness and deteriorating outlook, we exited our position in DXC Technology.
Finally, the industrial sector was home to one detractor of
note, XPO Logistics Inc., the provider of a range of logistics services across North America and Europe including an asset-light logistics business and a transportation business. During the company’s fourth quarter, its largest customer,
believed to be Amazon although XPO Logistics wouldn’t confirm, pulled $600 million of its total $900 million of business. This incident was the latest in a string of issues including the loss of key executives, a reduction in guidance and the
bankruptcy of a key European customer that resulted in the company missing third-quarter 2018 expectations. Consequently, we exited our position.
Nuveen Small Cap Value Fund
How did the Fund perform during the twelve-month reporting period
ended October 31, 2019?
The tables in the Fund
Performance and Expense Ratios section of this report provide total returns for the Fund for the one-year, five-year, ten-year and since inception periods ended October 31, 2019. Comparative performance information is provided for the Fund’s
Class A Shares at net asset value (NAV). The Fund’s Class A Shares at NAV underperformed both the Russell 2000® Value Index and the Lipper
Small-Cap Value Funds Classification Average during the twelve-month reporting period.
What strategies were used to manage the Fund during the reporting
period and how did these strategies influence performance?
The Fund seeks to provide long-term capital appreciation by
investing primarily in the common stocks of companies within the Russell 2000® Index, which has a market capitalization range of $40.0 million to
$10.3 billion based on the June 28, 2019 reconstitution. During the reporting period, we continued to focus on building a well-diversified portfolio of small-cap stocks from companies with strengthening balance sheets and free cash flow
characteristics. We also continued to target companies with sound business models and strong competitive advantages that we believe can gain market share opportunistically in the current environment. We remained committed to our approach of
investing in quality companies that are trading at a discount to both intrinsic and relative value metrics.
The Fund’s underperformance versus the Russell benchmark
and Lipper peers was primarily due security selection in the information technology, materials, communication services and financial sectors. In the technology area, communications equipment provider Poly (formerly known as Plantronics until March)
retreated after advancing earlier in the reporting period. The company is the leading provider of a full range of commercial grade hardware enabling next-generation Unified Communication solutions. Shares underperformed later in the reporting period
due to the anticipated continuation of channel disruption after Poly consolidated channel partners in Europe to cut costs. Also, trade concerns with Mexico weighed on shares during the summer months since the company manufactures a significant
percentage of its product in that country. Although we owned Poly at the end of the reporting period, we exited our position in early November based on disappointing fiscal second-quarter 2020 results. Poly reported lower-than-expected revenue for
the quarter as the company continued to work through the sales channel consolidation in Europe, materially lower guidance for the coming quarter and changes to its sales and marketing leadership, all of which will likely push out the timing of the
company’s debt reduction.
Also, a position in TiVo
Corp. detracted during the reporting period. The company is the leading global provider of both interactive program guides and Internet protocol licenses to the larger service providers who design their own software for digital program guides.
Shares came under pressure during the reporting period after the long-awaited outcome of the company’s strategic review, which will result in a separation and spin-off of its lower margin Product Segment versus consummating an asset sale.
Given our catalyst for owning the stock was pushed out until early 2020 in order to unlock shareholder value, we sold the Fund’s position in TiVo.
In materials, SunCoke Energy Inc., a leading provider of
merchant coking material to steel manufacturers, came under pressure despite reporting a solid second quarter in tough weather conditions. The market focused on the potential impact weaker coal export pricing may have on the firm’s logistics
fee-for-service business. We remain invested given the ongoing strength in SunCoke’s coking material segment. We believe the firm’s improved balance sheet allows for multiple value creation opportunities.
Stock selection was also weak in the communication services
area including automotive classified website provider Cars.com Inc. Shares came under pressure following the board’s announcement that it concluded a strategic review with no actionable bids for the company. Despite this, Cars.com continued to
deliver improving metrics toward its goal of net dealer growth by third quarter 2019, while also setting the company up for a better cash flow growth profile in 2020. Although we were disappointed in the outcome of the activist-driven strategic
review, we maintained a small position given the positive momentum toward dealer retention goals that we do not believe is reflected in the stock price.
In the financial sector, the Fund saw poor results from
Wintrust Financial Corporation, a Chicago-based regional bank. The shares displayed weak relative results as worries regarding the sensitivity of the company’s loan portfolio to lower short-term rates increased concerns regarding its net
interest margin (NIM). We are factoring in NIM compression, but expect this to be offset by loan growth strength in Wintrust’s commercial lending portfolio, along with strength in its mortgage-related lines. Fee revenue is 27% of operating
revenue with more than one-third of it generated from mortgage banking. We believe Wintrust Financial remains attractive given the strength of its lending and fee pipelines in this low rate environment and are maintaining our position.
Although the energy sector contributed favorably overall to
the Fund’s performance, we saw weak results from Callon Petroleum Company, an independent oil and natural gas exploration and production company. We have a small active weight in this company, primarily due to the improving fundamentals we
have witnessed from its core Permian Basin acreage in terms of improved production, cost efficiencies and cash flow from larger pad developments. Although accretive from an income standpoint, the company’s proposed acquisition of Carizzo loads
up its balance sheet with more debt. Callon Petroleum is facing opposition against the proposed deal; therefore, we believe the outcome of this shareholder vote could be a catalyst for the stock. Historically, the company has been very acquisitive,
but the market would rather management continue to deliver above-mentioned upside from its current core acreage. We have maintained our position for now.
Also, ProPetro Holding Corp., the leading provider of
completion services within the Permian Basin, came under pressure after delaying its second-quarter 10-Q filing due to ongoing review of its internal controls surrounding both discretionary expense oversight and the capital spending approval process
with the board. However, the company has maintained a “best-in-class” margin profile through its pursuit of a differentiated strategy of delivering solid outcomes for its larger exploration and production customer base at reasonable
pricing. We reduced our position as we await the finalization of this review process that will hopefully clear this “fallen angel” stock that is trading below liquidation value with a solid balance sheet.
In the industrials sector, the Fund experienced weak results
from a position in Quad/Graphics Inc., the provider of print, media and logistic services to a broad array of end markets. The company walked away from its announced acquisition of LSC Communications because of a Department of Justice lawsuit and
took additional cost-out initiatives announced in the second quarter 2019. We believed both moves were reasonable steps and eliminated some ongoing overhang from the stock. However, we were negatively surprised when Quad/Graphics reported its
third-quarter results, which included lowering full-year guidance and cutting the dividend in half, while only increasing cost-reduction initiatives slightly. The Fund continues to hold its position in Quad/Graphics.
In consumer staples, we saw weak results from Primo Water
Corporation, the leading provider of bulk water in the U.S. The company had the highest market share in both water refill and exchange, which results in high recurring revenue streams. Primo’s performance has been choppy over the past year as
the company’s Exchange and Dispenser businesses have been very strong, while its Refill business has struggled. While initial Refill issues seemed to have been resolved over the past six months, we are watching for improved volume trends in
Refill and better cost controls in both Refill and Exchange.
On the positive side of the equation, the Fund experienced
favorable stock selection in the consumer discretionary, energy and industrials sectors. Underweight positions in energy and health care were also beneficial. In consumer discretionary, our position in M/I Homes Inc., a Midwest and Southeast focused
home builder, benefited from an attractive housing environment. With 30-year mortgage rates falling, new home sales have lifted to year-over-year growth rates in the high teens. M/I Homes has experienced improved
Portfolio Managers’ Comments (continued)
order demand and rising absorption trends within its communities. We believe
that strong employment trends and consumer confidence, coupled with lower rates, continue to support housing-related stocks and remain invested.
The Fund also saw strong results from lease-to-own retailer
Aaron’s. Through its Progressive segment, the firm contracts with other key retailers to provide customer financing arrangements. Aaron’s continued to execute well on its sales and earnings per share (EPS) goals largely driven by
successful partnerships for its Progressive financing arm. In addition, Aaron’s core stores are displaying good sales comps as strong employment trends aid the company’s key clientele. We remained investors in Aaron’s given its
attractive valuation coupled with continued top-line momentum opportunities from announcements with companies such as Best Buy and Wayfair.
Also in discretionary, the Fund experienced favorable results
from furniture wholesaler and retailer LaZBoy Inc., which continued to execute on its strategy to improve margins and position the franchise for long-term growth. The company displayed strong operating trends as its Joybird acquisition, an
e-commerce retailer, enhanced the firm’s sales traction. Although China tariffs remain an area of uncertainty, investors are giving LaZBoy credit for its strong fundamental results and debt-free balance sheet. We are no longer invested in
LaZBoy.
Several holdings were standouts in the
industrials sector led by Gibraltar Industries Inc., a leading provider of building products to the industrial, infrastructure and residential markets. The stock gained in recent months after earnings met and more recently in the third quarter, beat
expectations. Also, full-year profit guidance drifted higher supported by strong backlog gains in renewables, better residential prospects with a stronger housing market and improved weather and acquisition upside. We see further earnings upside
into 2020 and continue to view potential strategic mergers and acquisitions as a key catalyst for the company going forward. Although we trimmed our weight based on valuation, we maintained a position in Gibraltar Industries due to solid execution
and good fundamentals.
We also saw strength from
Brink’s Corp., the global armed security services company focused primarily on cash-in-transit, highly valuable precious gemstones and high-value merchandise. The company continued to improve its U.S. and Mexican operations, demonstrating
solid progress toward its margin target for both geographies. Simultaneously, Brink’s has been able to undertake accretive acquisitions. The end result has been solid growth and operational execution, driving strong stock performance. In 2018,
Brink’s fought an ongoing headwind of foreign currency translation and was also negatively impacted by high inflation in one of the countries it operates in, Argentina. We expected both would normalize in 2019, which was initially true, but
hasn’t played out over the balance of the year. As a result, we have trimmed our position in Brink’s based on stock strength.
The Fund also benefited from a position in industrial firm SP
Plus Corp, which provides parking management, ground transportation and other ancillary services to commercial, institutional and municipal clients. SP Plus has executed well in its core business, driving operating performance and increasing
margins. This has been bolstered by the company’s Bags acquisition completed in fourth quarter 2018, which has provided upside to estimates. Given that we continue to see additional opportunities for both growth and margin improvement, we
remain invested.
In information technology, we saw
favorable results from SYNNEX Corp, a leading distributor of technology solutions to small- and mid-sized businesses in North America and a business process outsourcing (BPO) provider to clients globally. The firm delivered a strong fiscal
third-quarter 2019 with both segments demonstrating continued margin expansion, organic growth and strong cash flow from operations. SYNNEX continues to deliver quarterly milestones that validate its ability to integrate and grow its recent
acquisition of Convergys in the BPO segment. Because of that and its attractive valuation, we remain invested.
The Fund also benefited from its position in Cypress
Semiconductor Corp, a manufacturer of a broad range of semiconductors and high-performance solutions for automotive, industrial, wireless networking and consumer electronics markets. Shares began to rally in late May 2019 on potential interest from
Germany-based Infineon Technologies. Cypress and Infineon reached a deal in early June 2019 in which Infineon would acquire Cypress in an all-cash deal. Cypress Semiconductor has been a long-term holding for the Fund since the second quarter of
2013. It is nice to see the company being recognized for its strength in next-generation automotive and high-throughput wireless connectivity solutions. Given the stock had little upside, we decided to sell the Fund’s position in Cypress
Semiconductor.
Nuveen
Dividend Value Fund
Mutual fund investing involves risk;
principal loss is possible. There is no guarantee the Fund’s investment objectives will be achieved. Dividends are not guaranteed. Prices of equity securities may decline significantly over short or
extended periods of time. Non-U.S. investments involve risks such as currency fluctuation, political and economic instability, lack of liquidity and differing legal and accounting standards. These risks are
magnified in emerging markets. These and other risk considerations, such as credit, derivatives, high yield securities, and interest rate risks, are described in detail in the Fund’s prospectus.
Nuveen Mid Cap Value Fund
Mutual fund investing involves risk; principal loss is
possible. There is no guarantee the Fund’s investment objectives will be achieved. Prices of equity securities may decline significantly over short or extended periods of time. Investments in mid-cap companies are subject to greater volatility than those of larger companies, but may be less volatile than investments in smaller companies. Non-U.S. investments involve
risks such as currency fluctuation, political and economic instability, lack of liquidity and differing legal and accounting standards. These risks are magnified in emerging markets. These and other risk
considerations, such as derivatives risk, are described in detail in the Fund’s prospectus.
Nuveen Small Cap Value Fund
Mutual fund investing involves risk; principal loss is
possible. There is no guarantee the Fund’s investment objectives will be achieved. Prices of equity securities may decline significantly over short or extended periods of time. Investments in smaller companies are subject to greater volatility than those of larger companies. Non-U.S. investments involve risks such as currency fluctuation, political and economic
instability, lack of liquidity and differing legal and accounting standards. These risks are magnified in emerging markets. These and other risk considerations, such as derivatives risk, are described in detail
in the Fund’s prospectus.
THIS PAGE INTENTIONALLY LEFT BLANK
Fund Performance and Expense Ratios
The Fund
Performance and Expense Ratios for each Fund are shown within this section of the report.
Returns quoted represent past performance, which is no guarantee
of future results. Investment returns and principal value will fluctuate so that when shares are redeemed, they may be worth more or less than their original cost. Current performance may be higher or lower than the
performance shown. Total returns for a period of less than one year are not annualized. Returns at net asset value (NAV) would be lower if the sales charge were included. Returns assume reinvestment of dividends and capital gains. For performance,
current to the most recent month-end visit nuveen.com or call (800) 257-8787.
Returns do not reflect the deduction of taxes that a
shareholder would pay on Fund distributions or the redemption of Fund Shares.
Returns may reflect fee waivers and/or expense reimbursements
by the investment adviser during the periods presented. If any such waivers and/or reimbursements had not been in place, returns would have been reduced. See Notes to Financial Statements, Note 7—Management Fees and Other Transactions with
Affiliates for more information.
Returns reflect
differences in sales charges and expenses, which are primarily differences in distribution and service fees, and assume reinvestment of dividends and capital gains.
Comparative index and Lipper return information is provided
for Class A Shares at NAV only.
The expense ratios shown
reflect total operating expenses (before fee waivers and/or expense reimbursements, if any) as shown in the most recent prospectus. The expense ratios include management fees and other fees and expenses.
Fund Performance and Expense Ratios (continued)
Nuveen Dividend Value Fund
Refer
to the first page of this Fund Performance and Expense Ratios section for further explanation of the information included within this section. Refer to the Glossary of Terms Used in this Report for definitions of terms used within this
section.
Fund Performance
Average Annual Total Returns as of October 31, 2019
| |
Average
Annual |
| |
1-Year
|
5-Year
|
10-Year
|
| Class
A Shares at NAV |
9.81%
|
7.54%
|
11.45%
|
| Class
A Shares at maximum Offering Price |
3.52%
|
6.28%
|
10.79%
|
| Russell
1000® Value Index |
11.21%
|
7.61%
|
11.96%
|
| S&P
500® Index |
14.33%
|
10.78%
|
13.70%
|
| Lipper
Equity Income Funds Classification Average |
10.90%
|
7.33%
|
11.01%
|
| Class
C Shares |
8.98%
|
6.74%
|
10.62%
|
| Class
R3 Shares |
9.50%
|
7.27%
|
11.17%
|
| Class
I Shares |
10.14%
|
7.82%
|
11.74%
|
| |
Average
Annual |
| |
1-Year
|
5-Year
|
Since
Inception |
| Class
R6 Shares |
10.29%
|
7.94%
|
10.37%
|
Average Annual Total Returns as of
September 30, 2019 (Most Recent Calendar Quarter)
| |
Average
Annual |
| |
1-Year
|
5-Year
|
10-Year
|
| Class
A Shares at NAV |
(0.05)%
|
7.50%
|
11.05%
|
| Class
A Shares at maximum Offering Price |
(5.83)%
|
6.24%
|
10.39%
|
| Class
C Shares |
(0.85)%
|
6.70%
|
10.21%
|
| Class
R3 Shares |
(0.32)%
|
7.23%
|
10.76%
|
| Class
I Shares |
0.23%
|
7.78%
|
11.33%
|
| |
Average
Annual |
| |
1-Year
|
5-Year
|
Since
Inception |
| Class
R6 Shares |
0.30%
|
7.90%
|
10.24%
|
Since inception return for Class R6
Shares 2/28/13. Indexes and Lipper averages are not available for direct investment.
Class A Shares have a maximum 5.75% sales charge (Offering
Price). Class A Share purchases of $1 million or more are sold at net asset value without an up-front sales charge but may be subject to a contingent deferred sales charge (CDSC) of 1% if redeemed within eighteen months of purchase. Class C Shares
have a 1% CDSC for redemptions within less than twelve months, which is not reflected in the total returns. Class C Shares automatically convert to Class A Shares ten years after purchase. Class R3 Shares have no sales charge and are only available
for purchase by eligible retirement plans. Class R6 Shares have no sales charge and are available only to certain limited categories of investors as described in the prospectus. Class I Shares have no sales charge and may be purchased under limited
circumstances or by specified classes of investors.
Expense Ratios as of Most Recent Prospectus
| |
Share
Class |
| |
Class
A |
Class
C |
Class
R3 |
Class
R6 |
Class
I |
| Expense
Ratios |
1.08%
|
1.83%
|
1.33%
|
0.72%
|
0.83%
|
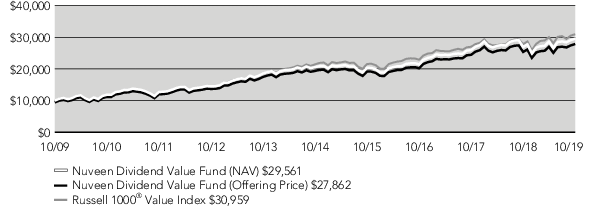
Growth of an
Assumed $10,000 Investment as of October 31, 2019 – Class A Shares
The graphs do not reflect
the deduction of taxes that a shareholder may pay on Fund distributions or the redemption of Fund shares.
Fund Performance and Expense Ratios (continued)
Nuveen Mid Cap Value Fund
Refer
to the first page of this Fund Performance and Expense Ratios section for further explanation of the information included within this section. Refer to the Glossary of Terms Used in this Report for definitions of terms used within this
section.
Fund Performance
Average Annual Total Returns as of October 31, 2019
| |
Average
Annual |
| |
1-Year
|
5-Year
|
10-Year
|
| Class
A Shares at NAV |
10.19%
|
7.22%
|
11.08%
|
| Class
A Shares at maximum Offering Price |
3.86%
|
5.96%
|
10.42%
|
| Russell
Midcap® Value Index |
10.08%
|
6.95%
|
12.90%
|
| Lipper
Mid-Cap Value Funds Classification Average |
6.88%
|
5.20%
|
11.09%
|
| Class
C Shares |
9.39%
|
6.42%
|
10.25%
|
| Class
R3 Shares |
9.92%
|
6.96%
|
10.80%
|
| Class
I Shares |
10.48%
|
7.49%
|
11.35%
|
| |
Average
Annual |
| |
1-Year
|
Since
Inception |
| Class
R6 Shares |
10.63%
|
0.68%
|
Average Annual Total Returns as of
September 30, 2019 (Most Recent Calendar Quarter)
| |
Average
Annual |
| |
1-Year
|
5-Year
|
10-Year
|
| Class
A Shares at NAV |
(1.74)%
|
7.75%
|
10.61%
|
| Class
A Shares at maximum Offering Price |
(7.39)%
|
6.49%
|
9.96%
|
| Class
C Shares |
(2.49)%
|
6.94%
|
9.78%
|
| Class
R3 Shares |
(1.99)%
|
7.49%
|
10.34%
|
| Class
I Shares |
(1.50)%
|
8.02%
|
10.89%
|
| |
Average
Annual |
| |
1-Year
|
Since
Inception |
| Class
R6 Shares |
(1.36)%
|
0.27%
|
Since inception returns for Class R6
Shares are from 6/20/18. Since inception returns for Class R6 Shares are cumulative. Indexes and Lipper averages are not available for direct investment.
Class A Shares have a maximum 5.75% sales charge (Offering
Price). Class A Share purchases of $1 million or more are sold at net asset value without an up-front sales charge but may be subject to a contingent deferred sales charge (CDSC) of 1%, if redeemed within eighteen months of purchase. Class C Shares
have a 1% CDSC for redemptions within less than twelve months, which is not reflected in the total returns. Class C Shares automatically convert to Class A Shares ten years after purchase. Class R3 Shares have no sales charge and are only available
for purchase by eligible retirement plans. Class R6 Shares have no sales charge and are available only to certain limited categories of investors as described in the prospectus. Class I Shares have no sales charge and may be purchased under limited
circumstances or by specified classes of investors.
Expense Ratios as of Most Recent Prospectus
| |
Share
Class |
| |
Class
A |
Class
C |
Class
R3 |
Class
R6 |
Class
I |
| Gross
Expense Ratios |
1.31%
|
2.06%
|
1.56%
|
0.98%
|
1.07%
|
| Net
Expense Ratios |
1.17%
|
1.92%
|
1.42%
|
0.83%
|
0.92%
|
The Fund’s investment adviser
has contractually agreed to waive fees and/or reimburse other Fund expenses through July 31, 2021, so that the total annual Fund operating expenses (excluding 12b-1 distribution and/or service fees, interest expenses, taxes, acquired fund fees and
expenses, fees incurred in acquiring and disposing of portfolio securities and extraordinary expenses) do not exceed 0.92% of the average daily net assets of any class of Fund shares. However, because Class R6 shares are not subject to sub-transfer
agent and similar fees, the total annual Fund operating expenses for the Class R6 shares will be less than the expense limitation. This expense limitation may be terminated or modified prior to that date only with the approval of the Board of
Directors of the Fund.
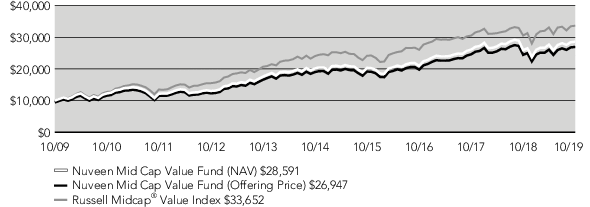
Growth of an
Assumed $10,000 Investment as of October 31, 2019 – Class A Shares
The graphs do not reflect
the deduction of taxes that a shareholder may pay on Fund distributions or the redemption of Fund shares.
Fund Performance and Expense Ratios (continued)
Nuveen Small Cap Value Fund
Refer
to the first page of this Fund Performance and Expense Ratios section for further explanation of the information included within this section. Refer to the Glossary of Terms Used in this Report for definitions of terms used within this
section.
Fund Performance
Average Annual Total Returns as of October 31, 2019
| |
Average
Annual |
| |
1-Year
|
5-Year
|
10-Year
|
| Class
A Shares at NAV |
0.44%
|
5.55%
|
11.56%
|
| Class
A Shares at maximum Offering Price |
(5.33)%
|
4.31%
|
10.90%
|
| Russell
2000® Value Index |
3.22%
|
6.24%
|
11.08%
|
| Lipper
Small-Cap Value Funds Classification Average |
0.87%
|
4.50%
|
10.27%
|
| Class
C Shares |
(0.28)%
|
4.76%
|
10.74%
|
| Class
R3 Shares |
0.21%
|
5.28%
|
11.29%
|
| Class
I Shares |
0.69%
|
5.81%
|
11.84%
|
| |
Average
Annual |
| |
1-Year
|
Since
Inception |
| Class
R6 Shares |
0.90%
|
5.17%
|
Average Annual Total Returns as of
September 30, 2019 (Most Recent Calendar Quarter)
| |
Average
Annual |
| |
1-Year
|
5-Year
|
10-Year
|
| Class
A Shares at NAV |
(11.28)%
|
6.38%
|
10.66%
|
| Class
A Shares at maximum Offering Price |
(16.37)%
|
5.13%
|
10.00%
|
| Class
C Shares |
(11.93)%
|
5.58%
|
9.83%
|
| Class
R3 Shares |
(11.48)%
|
6.11%
|
10.38%
|
| Class
I Shares |
(11.07)%
|
6.63%
|
10.92%
|
| |
Average
Annual |
| |
1-Year
|
Since
Inception |
| Class
R6 Shares |
(10.82)%
|
4.86%
|
Since inception return for Class R6
Shares are from 6/30/16. Indexes and Lipper averages are not available for direct investment.
Class A Shares have a maximum 5.75% sales charge (Offering
Price). Class A Share purchases of $1 million or more are sold at net asset value without an up-front sales charge but may be subject to a contingent deferred sales charge (CDSC) of 1% if redeemed within eighteen months of purchase. Class C Shares
have a 1% CDSC for redemptions within less than twelve months, which is not reflected in the total returns. Class C Shares automatically convert to Class A Shares ten years after purchase. Class R3 Shares have no sales charge and are only available
for purchase by eligible retirement plans. Class R6 Shares have no sales charge and are available only to certain limited categories of investors as described in the prospectus. Class I Shares have no sales charge and may be purchased under limited
circumstances or by specified classes of investors.
Expense Ratios as of Most Recent Prospectus
| |
Share
Class |
| |
Class
A |
Class
C |
Class
R3 |
Class
R6 |
Class
I |
| Gross
Expense Ratios |
1.24%
|
1.99%
|
1.49%
|
0.82%
|
0.99%
|
| Net
Expense Ratios |
1.20%
|
1.95%
|
1.45%
|
0.78%
|
0.95%
|
The Fund’s investment adviser
has contractually agreed to waive fees and/or reimburse other Fund expenses through July 31, 2021, so that the total annual Fund operating expenses (excluding 12b-1 distribution and/or service fees, interest expenses, taxes, acquired fund fees and
expenses, fees incurred in acquiring and disposing of portfolio securities and extraordinary expenses) do not exceed 0.99% of the average daily net assets of any class of Fund shares. However, because Class R6 shares are not subject to sub-transfer
agent and similar fees, the total annual Fund operating expenses for the Class R6 shares will be less than the expense limitation. This expense limitation may be terminated or modified prior to that date only with the approval of the Board of
Directors of the Fund.
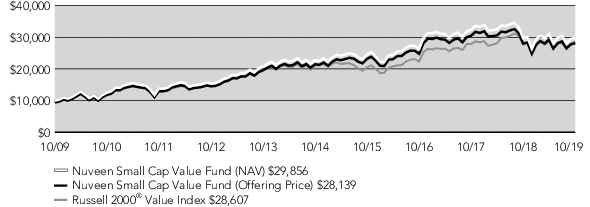
Growth of an
Assumed $10,000 Investment as of October 31, 2019 – Class A Shares
The graphs do not reflect
the deduction of taxes that a shareholder may pay on Fund distributions or the redemption of Fund shares.
Holding Summaries as of October 31, 2019
This data relates to the securities held in each Fund's
portfolio of investments as of the end of this reporting period. It should not be construed as a measure of performance for the Fund itself. Holdings are subject to change.
Nuveen Dividend Value Fund
Fund
Allocation
(% of net assets) |
|
| Common
Stocks |
99.7%
|
| Investments
Purchased with Collateral from Securities Lending |
0.4%
|
| Money
Market Funds |
1.3%
|
| Other
Assets Less Liabilities |
(1.4)%
|
| Net
Assets |
100%
|
Portfolio
Composition
(% of net assets) |
|
| Banks
|
10.1%
|
| Health
Care Providers & Services |
6.3%
|
| Consumer
Finance |
5.6%
|
| Multi-Utilities
|
5.4%
|
| Electric
Utilities |
4.5%
|
| Diversified
Telecommunication Services |
4.3%
|
| Pharmaceuticals
|
4.3%
|
| Insurance
|
4.2%
|
| Semiconductors
& Semiconductor Equipment |
3.9%
|
| Machinery
|
3.4%
|
| Mortgage
Real Estate Investment Trust |
3.3%
|
| Aerospace
& Defense |
3.2%
|
| Biotechnology
|
3.1%
|
| Oil,
Gas & Consumable Fuels |
3.0%
|
| Equity
Real Estate Investment Trust |
2.8%
|
| Entertainment
|
2.8%
|
| Chemicals
|
2.6%
|
| Household
Durables |
2.5%
|
| Media
|
2.3%
|
| Multiline
Retail |
2.3%
|
| Other
|
19.8%
|
| Investments
Purchased with Collateral from Securities Lending |
0.4%
|
| Money
Market Funds |
1.3%
|
| Other
Assets Less Liabilities |
(1.4)%
|
| Net
Assets |
100%
|
Top
Five Common Stock Holdings
(% of net assets) |
|
| AT&T
Inc. |
4.4%
|
| JPMorgan
Chase & Co |
3.3%
|
| Chevron
Corp |
3.0%
|
| Citigroup
Inc. |
3.0%
|
| FirstEnergy
Corp |
2.8%
|
Nuveen Mid Cap Value Fund
Fund
Allocation
(% of net assets) |
|
| Common
Stocks |
98.9%
|
| Money
Market Funds |
1.5%
|
| Other
Assets Less Liabilities |
(0.4)%
|
| Net
Assets |
100%
|
Portfolio
Composition
(% of net assets) |
|
| Equity
Real Estate Investment Trust |
12.8%
|
| Electric
Utilities |
6.1%
|
| Banks
|
5.8%
|
| Insurance
|
5.5%
|
| Multi-Utilities
|
4.8%
|
| Oil,
Gas & Consumable Fuels |
4.4%
|
| Capital
Markets |
3.7%
|
| Hotels,
Restaurants & Leisure |
3.4%
|
| Household
Durables |
3.2%
|
| Machinery
|
3.1%
|
| IT
Services |
3.1%
|
| Airlines
|
3.0%
|
| Health
Care Equipment & Supplies |
2.7%
|
| Chemicals
|
2.6%
|
| Aerospace
& Defense |
2.3%
|
| Mortgage
Real Estate Investment Trust |
2.3%
|
| Road
& Rail |
2.2%
|
| Health
Care Providers & Services |
2.0%
|
| Software
|
2.0%
|
| Food
Products |
1.9%
|
| Electrical
Equipment |
1.9%
|
| Diversified
Financial Services |
1.8%
|
| Other
|
18.3%
|
| Money
Market Funds |
1.5%
|
| Other
Assets Less Liabilities |
(0.4)%
|
| Net
Assets |
100%
|
Top
Five Common Stock Holdings
(% of net assets) |
|
| FirstEnergy
Corp |
2.6%
|
| L3Harris
Technologies Inc. |
2.3%
|
| Starwood
Property Trust Inc. |
2.3%
|
| Hartford
Financial Services Group Inc. |
2.2%
|
| Entergy
Corp |
2.0%
|
Holding Summaries as of October 31, 2019 (continued)
Nuveen Small Cap Value Fund
Fund
Allocation
(% of net assets) |
|
| Common
Stocks |
99.5%
|
| Investments
Purchased with Collateral from Securities Lending |
0.3%
|
| Money
Market Funds |
1.1%
|
| Other
Assets Less Liabilities |
(0.9)%
|
| Net
Assets |
100%
|
Portfolio
Composition
(% of net assets) |
|
| Banks
|
17.3%
|
| Equity
Real Estate Investment Trust |
11.6%
|
| Insurance
|
4.5%
|
| Thrifts
& Mortgage Finance |
4.4%
|
| Communications
Equipment |
3.7%
|
| Electronic
Equipment, Instruments & Components |
3.7%
|
| Household
Durables |
3.4%
|
| Mortgage
Real Estate Investment Trust |
3.2%
|
| Commercial
Services & Supplies |
3.1%
|
| Capital
Markets |
2.9%
|
| Gas
Utilities |
2.8%
|
| Oil,
Gas & Consumable Fuels |
2.8%
|
| Professional
Services |
2.5%
|
| Software
|
2.2%
|
| Construction
& Engineering |
2.2%
|
| Auto
Components |
2.1%
|
| Metals
& Mining |
1.9%
|
| Specialty
Retail |
1.9%
|
| Building
Products |
1.8%
|
| Multi-Utilities
|
1.7%
|
| Other
|
19.8%
|
| Investments
Purchased with Collateral from Securities Lending |
0.3%
|
| Money
Market Funds |
1.1%
|
| Other
Assets Less Liabilities |
(0.9)%
|
| Net
Assets |
100%
|
Top
Five Common Stock Holdings
(% of net assets) |
|
| SYNNEX
Corp |
1.9%
|
| Radian
Group Inc. |
1.9%
|
| IBERIABANK
Corp |
1.9%
|
| Aaron's
Inc. |
1.9%
|
| Cathay
General Bancorp |
1.8%
|
As a
shareholder of one or more of the Funds, you incur two types of costs: (1) transaction costs, including up-front and back-end sales charges (loads) or redemption fees, where applicable; and (2) ongoing costs, including management fees; distribution
and service (12b-1) fees, where applicable; and other Fund expenses. The Examples below are intended to help you understand your ongoing costs (in dollars) of investing in the Funds and to compare these costs with the ongoing costs of investing in
other mutual funds.
The Examples below are based on an
investment of $1,000 invested at the beginning of the period and held through the period ended October 31, 2019.
The beginning of the period is May 1, 2019.
The information under “Actual Performance,”
together with the amount you invested, allows you to estimate actual expenses incurred over the reporting period. Simply divide your account value by $1,000 (for example, an $8,600 account value divided by $1,000 = 8.60) and multiply the result by
the cost shown for your share class, in the row entitled “Expenses Incurred During Period” to estimate the expenses incurred on your account during this period.
The information under “Hypothetical Performance,”
provides information about hypothetical account values and hypothetical expenses based on each Fund’s actual expense ratios and an assumed rate of return of 5% per year before expenses, which is not the Fund’s actual return. The
hypothetical account values and expenses may not be used to estimate the actual ending account balance or expense you incurred for the period. You may use this information to compare the ongoing costs of investing in the Fund and other funds. To do
so, compare this 5% hypothetical example with the 5% hypothetical examples that appear in the shareholder reports of the other funds.
Please note that the expenses shown in the following tables
are meant to highlight your ongoing costs only and do not reflect any transaction costs. Therefore, the hypothetical information is useful in comparing ongoing costs only, and will not help you determine the relative total costs of owning different
funds or share classes. In addition, if these transaction costs were included, your costs would have been higher.
Nuveen Dividend Value Fund
| |
Share
Class |
| |
Class
A |
Class
C |
Class
R3 |
Class
R6 |
Class
I |
| Actual
Performance |
|
|
|
|
|
| Beginning
Account Value |
$1,000.00
|
$1,000.00
|
$1,000.00
|
$1,000.00
|
$1,000.00
|
| Ending
Account Value |
$1,032.02
|
$1,028.69
|
$1,030.87
|
$1,034.71
|
$1,034.41
|
| Expenses
Incurred During the Period |
$
5.74 |
$
9.56 |
$
7.01 |
$
3.69 |
$
4.46 |
Hypothetical
Performance
(5% annualized return before expenses) |
|
|
|
|
|
| Beginning
Account Value |
$1,000.00
|
$1,000.00
|
$1,000.00
|
$1,000.00
|
$1,000.00
|
| Ending
Account Value |
$1,019.56
|
$1,015.78
|
$1,018.30
|
$1,021.58
|
$1,020.82
|
| Expenses
Incurred During the Period |
$
5.70 |
$
9.50 |
$
6.97 |
$
3.67 |
$
4.43 |
For each class of the Fund, expenses are equal to the
Fund’s annualized net expense ratio of 1.12%, 1.87%, 1.37%, 0.72% and 0.87% for Classes A, C, R3, R6 and I, respectively, multiplied by the average account value over the period, multiplied by 184/365 (to reflect the one-half year
period).
Expense Examples (continued)
Nuveen Mid Cap Value Fund
| |
Share
Class |
| |
Class
A |
Class
C |
Class
R3 |
Class
R6 |
Class
I |
| Actual
Performance |
|
|
|
|
|
| Beginning
Account Value |
$1,000.00
|
$1,000.00
|
$1,000.00
|
$1,000.00
|
$1,000.00
|
| Ending
Account Value |
$1,032.69
|
$1,028.87
|
$1,031.45
|
$1,034.81
|
$1,034.10
|
| Expenses
Incurred During the Period |
$
5.99 |
$
9.82 |
$
7.27 |
$
3.95 |
$
4.72 |
Hypothetical
Performance
(5% annualized return before expenses) |
|
|
|
|
|
| Beginning
Account Value |
$1,000.00
|
$1,000.00
|
$1,000.00
|
$1,000.00
|
$1,000.00
|
| Ending
Account Value |
$1,019.31
|
$1,015.53
|
$1,018.05
|
$1,021.32
|
$1,020.57
|
| Expenses
Incurred During the Period |
$
5.96 |
$
9.75 |
$
7.22 |
$
3.92 |
$
4.69 |
For each class of the Fund, expenses are equal to the
Fund’s annualized net expense ratio of 1.17%, 1.92%, 1.42%, 0.77% and 0.92% for Classes A, C, R3, R6 and I, respectively, multiplied by the average account value over the period, multiplied by 184/365 (to reflect the one-half year
period).
Nuveen Small Cap Value Fund
| |
Share
Class |
| |
Class
A |
Class
C |
Class
R3 |
Class
R6 |
Class
I |
| Actual
Performance |
|
|
|
|
|
| Beginning
Account Value |
$1,000.00
|
$1,000.00
|
$1,000.00
|
$1,000.00
|
$1,000.00
|
| Ending
Account Value |
$
961.44 |
$
958.31 |
$
960.57 |
$
963.69 |
$
962.75 |
| Expenses
Incurred During the Period |
$
5.93 |
$
9.63 |
$
7.17 |
$
3.96 |
$
4.70 |
Hypothetical
Performance
(5% annualized return before expenses) |
|
|
|
|
|
| Beginning
Account Value |
$1,000.00
|
$1,000.00
|
$1,000.00
|
$1,000.00
|
$1,000.00
|
| Ending
Account Value |
$1,019.16
|
$1,015.38
|
$1,017.90
|
$1,021.17
|
$1,020.42
|
| Expenses
Incurred During the Period |
$
6.11 |
$
9.91 |
$
7.38 |
$
4.08 |
$
4.84 |
For each class of the Fund, expenses are equal to the
Fund’s annualized net expense ratio of 1.20%, 1.95%, 1.45%, 0.80% and 0.95% for Classes A, C, R3, R6 and I, respectively, multiplied by the average account value over the period, multiplied by 184/365 (to reflect the one-half year
period).
Report of Independent Registered Public Accounting
Firm
To the Board of Directors of Nuveen Investment Funds, Inc. and Shareholders
of
Nuveen Dividend Value Fund
Nuveen Mid Cap Value Fund
Nuveen Small Cap Value Fund
Opinions on the Financial Statements
We have audited the accompanying statements of assets and
liabilities, including the portfolios of investments, of Nuveen Dividend Value Fund, Nuveen Mid Cap Value Fund, and Nuveen Small Cap Value Fund (three of the funds constituting Nuveen Investment Funds, Inc., hereafter collectively referred to as the
"Funds") as of October 31, 2019, the related statements of operations for the year ended October 31, 2019, the statements of changes in net assets for each of the two years in the period ended October 31, 2019, including the related notes, and the
financial highlights for each of the five years in the period ended October 31, 2019 (collectively referred to as the “financial statements”). In our opinion, the financial statements present fairly, in all material respects, the
financial position of each of the Funds as of October 31, 2019, the results of each of their operations for the year then ended, the changes in each of their net assets for each of the two years in the period ended October 31, 2019 and each of the
financial highlights for each of the five years in the period ended October 31, 2019 in conformity with accounting principles generally accepted in the United States of America.
Basis for Opinions
These financial statements are the responsibility of the
Funds’ management. Our responsibility is to express an opinion on the Funds’ financial statements based on our audits. We are a public accounting firm registered with the Public Company Accounting Oversight Board (United States) (PCAOB)
and are required to be independent with respect to the Funds in accordance with the U.S. federal securities laws and the applicable rules and regulations of the Securities and Exchange Commission and the PCAOB.
We conducted our audits of these financial statements in
accordance with the standards of the PCAOB. Those standards require that we plan and perform the audit to obtain reasonable assurance about whether the financial statements are free of material misstatement, whether due to error or fraud.
Our audits included performing procedures to assess the risks
of material misstatement of the financial statements, whether due to error or fraud, and performing procedures that respond to those risks. Such procedures included examining, on a test basis, evidence regarding the amounts and disclosures in the
financial statements. Our audits also included evaluating the accounting principles used and significant estimates made by management, as well as evaluating the overall presentation of the financial statements. Our procedures included confirmation
of securities owned as of October 31, 2019 by correspondence with the custodian and brokers; when replies were not received from brokers, we performed other auditing procedures. We believe that our audits provide a reasonable basis for our
opinions.
PricewaterhouseCoopers LLP
Chicago, Illinois
December 27, 2019
We have served as the auditor of one or more investment companies in Nuveen
Funds since 2002.
Nuveen Dividend Value Fund
Portfolio of Investments October 31, 2019
| Shares
|
|
Description
(1) |
|
|
|
Value
|
| |
|
LONG-TERM
INVESTMENTS – 99.7% |
|
|
|
|
| |
|
COMMON
STOCKS – 99.7% |
|
|
|
|
| |
|
Aerospace
& Defense – 3.2% |
|
|
|
|
| 39,331
|
|
Boeing
Co |
|
|
|
$13,369,000 |
| 85,777
|
|
L3Harris
Technologies Inc. |
|
|
|
17,696,653
|
| |
|
Total
Aerospace & Defense |
|
|
|
31,065,653
|
| |
|
Banks – 10.1%
|
|
|
|
|
| 406,894
|
|
Citigroup
Inc. |
|
|
|
29,239,403
|
| 298,429
|
|
East
West Bancorp Inc. |
|
|
|
12,808,573
|
| 256,729
|
|
JPMorgan
Chase & Co |
|
|
|
32,070,587
|
| 629,388
|
|
KeyCorp
|
|
|
|
11,310,102
|
| 336,162
|
|
TCF
Financial Corp |
|
|
|
13,308,653
|
| |
|
Total
Banks |
|
|
|
98,737,318
|
| |
|
Biotechnology – 3.1%
|
|
|
|
|
| 204,369
|
|
AbbVie
Inc. |
|
|
|
16,257,554
|
| 218,351
|
|
Gilead
Sciences Inc. |
|
|
|
13,911,142
|
| |
|
Total
Biotechnology |
|
|
|
30,168,696
|
| |
|
Capital
Markets – 2.1% |
|
|
|
|
| 448,271
|
|
Morgan
Stanley |
|
|
|
20,642,879
|
| |
|
Chemicals – 2.6%
|
|
|
|
|
| 111,903
|
|
Celanese
Corp |
|
|
|
13,557,049
|
| 269,729
|
|
CF
Industries Holdings Inc. |
|
|
|
12,232,210
|
| |
|
Total
Chemicals |
|
|
|
25,789,259
|
| |
|
Communications
Equipment – 1.7% |
|
|
|
|
| 100,108
|
|
Motorola
Solutions Inc. |
|
|
|
16,649,963
|
| |
|
Consumer
Finance – 5.6% |
|
|
|
|
| 177,453
|
|
American
Express Co |
|
|
|
20,811,688
|
| 196,370
|
|
Capital
One Financial Corp |
|
|
|
18,311,502
|
| 189,089
|
|
Discover
Financial Services |
|
|
|
15,176,283
|
| |
|
Total
Consumer Finance |
|
|
|
54,299,473
|
| |
|
Diversified
Telecommunication Services – 4.3% |
|
|
|
|
| 1,104,143
|
|
AT&T
Inc. |
|
|
|
42,498,464
|
| |
|
Electric
Utilities – 4.5% |
|
|
|
|
| 257,736
|
|
Evergy
Inc. |
|
|
|
16,471,908
|
| 575,631
|
|
FirstEnergy
Corp |
|
|
|
27,814,490
|
| |
|
Total
Electric Utilities |
|
|
|
44,286,398
|
| Shares
|
|
Description
(1) |
|
|
|
Value
|
| |
|
Electrical
Equipment – 1.1% |
|
|
|
|
| 73,090
|
|
Hubbell
Inc. |
|
|
|
$
10,356,853 |
| |
|
Entertainment – 2.8%
|
|
|
|
|
| 208,291
|
|
Walt
Disney Co |
|
|
|
27,061,167
|
| |
|
Equity
Real Estate Investment Trust – 2.8% |
|
|
|
|
| 108,563
|
|
Crown
Castle International Corp |
|
|
|
15,067,459
|
| 99,378
|
|
Digital
Realty Trust Inc. |
|
|
|
12,624,981
|
| |
|
Total
Equity Real Estate Investment Trust |
|
|
|
27,692,440
|
| |
|
Food
Products – 1.9% |
|
|
|
|
| 221,298
|
|
Tyson
Foods Inc., Class A |
|
|
|
18,321,261
|
| |
|
Health
Care Providers & Services – 6.3% |
|
|
|
|
| 114,819
|
|
Cigna
Corp |
|
|
|
20,490,599
|
| 49,105
|
|
Humana
Inc. |
|
|
|
14,446,691
|
| 105,327
|
|
UnitedHealth
Group Inc. |
|
|
|
26,616,133
|
| |
|
Total
Health Care Providers & Services |
|
|
|
61,553,423
|
| |
|
Hotels,
Restaurants & Leisure – 1.2% |
|
|
|
|
| 426,999
|
|
MGM
Resorts International |
|
|
|
12,169,471
|
| |
|
Household
Durables – 2.5% |
|
|
|
|
| 1,285,917
|
|
Newell
Brands Inc. |
|
|
|
24,393,845
|
| |
|
Insurance – 4.2%
|
|
|
|
|
| 291,247
|
|
Hartford
Financial Services Group Inc. |
|
|
|
16,624,379
|
| 101,684
|
|
Marsh
& McLennan Cos Inc. |
|
|
|
10,536,496
|
| 604,798
|
|
Old
Republic International Corp |
|
|
|
13,511,187
|
| |
|
Total
Insurance |
|
|
|
40,672,062
|
| |
|
Internet
& Direct Marketing Retail – 1.3% |
|
|
|
|
| 90,039
|
|
Expedia
Group Inc. |
|
|
|
12,304,730
|
| |
|
IT
Services – 2.0% |
|
|
|
|
| 148,554
|
|
Fidelity
National Information Services Inc. |
|
|
|
19,573,475
|
| |
|
Machinery – 3.4%
|
|
|
|
|
| 132,668
|
|
Caterpillar
Inc. |
|
|
|
18,281,650
|
| 96,617
|
|
Stanley
Black & Decker Inc. |
|
|
|
14,621,051
|
| |
|
Total
Machinery |
|
|
|
32,902,701
|
| |
|
Media – 2.3%
|
|
|
|
|
| 498,507
|
|
Comcast
Corp., Class A |
|
|
|
22,343,084
|
| |
|
Mortgage
Real Estate Investment Trust – 3.3% |
|
|
|
|
| 900,502
|
|
AGNC
Investment Corp |
|
|
|
15,353,559
|
Nuveen Dividend Value Fund (continued)
Portfolio of Investments October 31, 2019
| Shares
|
|
Description
(1) |
|
|
|
Value
|
| |
|
Mortgage
Real Estate Investment Trust (continued) |
|
|
|
|
| 686,747
|
|
Starwood
Property Trust Inc. |
|
|
|
$
16,893,976 |
| |
|
Total
Mortgage Real Estate Investment Trust |
|
|
|
32,247,535
|
| |
|
Multiline
Retail – 2.3% |
|
|
|
|
| 206,424
|
|
Target
Corp |
|
|
|
22,068,790
|
| |
|
Multi-Utilities – 5.4%
|
|
|
|
|
| 160,666
|
|
Ameren
Corp |
|
|
|
12,483,748
|
| 224,351
|
|
Dominion
Energy Inc. |
|
|
|
18,520,175
|
| 348,336
|
|
Public
Service Enterprise Group Inc. |
|
|
|
22,053,152
|
| |
|
Total
Multi-Utilities |
|
|
|
53,057,075
|
| |
|
Oil,
Gas & Consumable Fuels – 3.0% |
|
|
|
|
| 253,912
|
|
Chevron
Corp |
|
|
|
29,489,340
|
| |
|
Personal
Products – 1.4% |
|
|
|
|
| 233,844
|
|
Unilever
NV |
|
|
|
13,852,919
|
| |
|
Pharmaceuticals – 4.3%
|
|
|
|
|
| 143,195
|
|
Allergan
PLC |
|
|
|
25,218,072
|
| 333,869
|
|
AstraZeneca
PLC, Sponsored ADR, (2) |
|
|
|
16,369,597
|
| |
|
Total
Pharmaceuticals |
|
|
|
41,587,669
|
| |
|
Road
& Rail – 1.1% |
|
|
|
|
| 80,000
|
|
Kansas
City Southern |
|
|
|
11,262,400
|
| |
|
Semiconductors
& Semiconductor Equipment – 3.9% |
|
|
|
|
| 32,667
|
|
Broadcom
Inc. |
|
|
|
9,566,531
|
| 442,901
|
|
Marvell
Technology Group Ltd |
|
|
|
10,802,355
|
| 89,917
|
|
NXP
Semiconductors NV |
|
|
|
10,221,765
|
| 81,545
|
|
Xilinx
Inc. |
|
|
|
7,399,393
|
| |
|
Total
Semiconductors & Semiconductor Equipment |
|
|
|
37,990,044
|
| |
|
Software – 1.5%
|
|
|
|
|
| 102,705
|
|
Microsoft
Corp |
|
|
|
14,724,816
|
| |
|
Specialty
Retail – 1.3% |
|
|
|
|
| 174,039
|
|
Best
Buy Co Inc. |
|
|
|
12,501,221
|
| |
|
Tobacco – 2.1%
|
|
|
|
|
| 257,013
|
|
Philip
Morris International Inc. |
|
|
|
20,931,139
|
| |
|
Trading
Companies & Distributors – 1.1% |
|
|
|
|
| 59,224
|
|
Watsco
Inc. |
|
|
|
10,441,191
|
| |
|
Total
Long-Term Investments (cost $809,889,932) |
|
|
|
973,636,754
|
| Shares
|
|
Description
(1) |
Coupon
|
|
|
Value
|
| |
|
INVESTMENTS
PURCHASED WITH COLLATERAL FROM SECURITIES LENDING – 0.4% |
|
|
|
| |
|
MONEY
MARKET FUNDS – 0.4% |
|
|
|
|
| 3,758,147
|
|
First
American Government Obligations Fund, Class X, (3) |
1.743%
(4) |
|
|
$
3,758,147 |
| |
|
Total
Investments Purchased with Collateral from Securities Lending (cost $3,758,147) |
|
|
3,758,147
|
| Shares
|
|
Description
(1) |
Coupon
|
|
|
Value
|
| |
|
SHORT-TERM
INVESTMENTS – 1.3% |
|
|
|
|
| |
|
MONEY
MARKET FUNDS – 1.3% |
|
|
|
|
| 12,555,067
|
|
First
American Treasury Obligation Fund, Class Z |
1.693%
(4) |
|
|
$
12,555,067 |
| |
|
Total
Short-Term Investments (cost $12,555,067) |
|
|
|
12,555,067
|
| |
|
Total
Investments (cost $826,203,146) – 101.4% |
|
|
|
989,949,968
|
| |
|
Other
Assets Less Liabilities – (1.4)% |
|
|
|
(13,851,804)
|
| |
|
Net
Assets – 100% |
|
|
|
$
976,098,164 |
| |
For
Fund portfolio compliance purposes, the Fund’s industry classifications refer to any one or more of the industry sub-classifications used by one or more widely recognized market indexes or ratings group indexes, and/or as defined by Fund
management. This definition may not apply for purposes of this report, which may combine industry sub-classifications into sectors for reporting ease. |
|
| (1)
|
All
percentages shown in the Portfolio of Investments are based on net assets. |
|
| (2)
|
Investment,
or a portion of investment, is out on loan for securities lending. The total value of the securities out on loan as of the end of the reporting period was $3,666,905. |
|
| (3)
|
The
Fund may loan securities representing up to one third of the fair value of its total assets (which includes collateral for securities on loan) to broker dealers, banks, and other institutions. The Fund maintains collateral equal to at least 100% of
the fair value of the securities loaned. The cash collateral received by the Fund is invested in this money market fund. See Notes to Financial Statements, Note 4- Portfolio Securities and Investments in Derivatives, Securities Lending for more
information. |
|
| (4)
|
The
rate shown is the annualized seven-day subsidized yield as of the end of the reporting period. |
|
| ADR
|
American
Depositary Receipt |
|
See accompanying notes to financial statements.
Nuveen Mid Cap Value Fund
Portfolio of Investments October 31, 2019
| Shares
|
|
Description
(1) |
|
|
|
Value
|
| |
|
LONG-TERM
INVESTMENTS – 98.9% |
|
|
|
|
| |
|
COMMON
STOCKS – 98.9% |
|
|
|
|
| |
|
Aerospace
& Defense – 2.3% |
|
|
|
|
| 38,522
|
|
L3Harris
Technologies Inc. |
|
|
|
$
7,947,474 |
| |
|
Airlines – 3.0%
|
|
|
|
|
| 69,053
|
|
Alaska
Air Group Inc. |
|
|
|
4,794,350
|
| 59,248
|
|
United
Airlines Holdings Inc., (2) |
|
|
|
5,382,088
|
| |
|
Total
Airlines |
|
|
|
10,176,438
|
| |
|
Auto
Components – 1.0% |
|
|
|
|
| 80,560
|
|
BorgWarner
Inc |
|
|
|
3,357,741
|
| |
|
Banks – 5.8%
|
|
|
|
|
| 137,731
|
|
East
West Bancorp Inc. |
|
|
|
5,911,415
|
| 368,593
|
|
KeyCorp
|
|
|
|
6,623,616
|
| 10,702
|
|
SVB
Financial Group, (2) |
|
|
|
2,370,279
|
| 100,727
|
|
Western
Alliance Bancorp |
|
|
|
4,968,863
|
| |
|
Total
Banks |
|
|
|
19,874,173
|
| |
|
Biotechnology – 1.2%
|
|
|
|
|
| 44,907
|
|
United
Therapeutics Corp, (2) |
|
|
|
4,034,445
|
| |
|
Building
Products – 1.6% |
|
|
|
|
| 119,361
|
|
Masco
Corp |
|
|
|
5,520,446
|
| |
|
Capital
Markets – 3.7% |
|
|
|
|
| 41,471
|
|
Evercore
Inc., Class A |
|
|
|
3,053,924
|
| 52,782
|
|
Nasdaq
Inc. |
|
|
|
5,266,060
|
| 52,006
|
|
Raymond
James Financial Inc. |
|
|
|
4,341,981
|
| |
|
Total
Capital Markets |
|
|
|
12,661,965
|
| |
|
Chemicals – 2.6%
|
|
|
|
|
| 37,440
|
|
Celanese
Corp |
|
|
|
4,535,856
|
| 97,584
|
|
CF
Industries Holdings Inc. |
|
|
|
4,425,434
|
| |
|
Total
Chemicals |
|
|
|
8,961,290
|
| |
|
Communications
Equipment – 1.0% |
|
|
|
|
| 20,956
|
|
Motorola
Solutions Inc. |
|
|
|
3,485,402
|
| |
|
Consumer
Finance – 1.7% |
|
|
|
|
| 72,007
|
|
Discover
Financial Services |
|
|
|
5,779,282
|
| |
|
Diversified
Financial Services – 1.8% |
|
|
|
|
| 112,312
|
|
Voya
Financial Inc. |
|
|
|
6,060,355
|
| Shares
|
|
Description
(1) |
|
|
|
Value
|
| |
|
Electric
Utilities – 6.1% |
|
|
|
|
| 96,890
|
|
Alliant
Energy Corp |
|
|
|
$5,168,113 |
| 57,738
|
|
Entergy
Corp |
|
|
|
7,014,012
|
| 184,421
|
|
FirstEnergy
Corp |
|
|
|
8,911,223
|
| |
|
Total
Electric Utilities |
|
|
|
21,093,348
|
| |
|
Electrical
Equipment – 1.9% |
|
|
|
|
| 42,626
|
|
AMETEK
Inc. |
|
|
|
3,906,673
|
| 17,718
|
|
Hubbell
Inc. |
|
|
|
2,510,640
|
| |
|
Total
Electrical Equipment |
|
|
|
6,417,313
|
| |
|
Entertainment – 1.6%
|
|
|
|
|
| 44,495
|
|
Take-Two
Interactive Software Inc., (2) |
|
|
|
5,354,973
|
| |
|
Equity
Real Estate Investment Trust – 12.8% |
|
|
|
|
| 306,731
|
|
Brandywine
Realty Trust |
|
|
|
4,686,850
|
| 50,720
|
|
Digital
Realty Trust Inc. |
|
|
|
6,443,469
|
| 15,044
|
|
Essex
Property Trust Inc. |
|
|
|
4,921,344
|
| 164,313
|
|
First
Industrial Realty Trust Inc. |
|
|
|
6,919,220
|
| 39,989
|
|
Mid-America
Apartment Communities Inc. |
|
|
|
5,558,071
|
| 136,647
|
|
Park
Hotels & Resorts Inc. |
|
|
|
3,177,043
|
| 78,155
|
|
SL
Green Realty Corp |
|
|
|
6,533,758
|
| 180,560
|
|
Washington
Real Estate Investment Trust |
|
|
|
5,600,971
|
| |
|
Total
Equity Real Estate Investment Trust |
|
|
|
43,840,726
|
| |
|
Food
Products – 1.9% |
|
|
|
|
| 78,707
|
|
Tyson
Foods Inc., Class A |
|
|
|
6,516,153
|
| |
|
Health
Care Equipment & Supplies – 2.7% |
|
|
|
|
| 6,783
|
|
Teleflex
Inc. |
|
|
|
2,356,482
|
| 49,498
|
|
Zimmer
Biomet Holdings Inc. |
|
|
|
6,842,109
|
| |
|
Total
Health Care Equipment & Supplies |
|
|
|
9,198,591
|
| |
|
Health
Care Providers & Services – 2.0% |
|
|
|
|
| 81,192
|
|
Centene
Corp, (2) |
|
|
|
4,309,671
|
| 14,364
|
|
Cigna
Corp |
|
|
|
2,563,400
|
| |
|
Total
Health Care Providers & Services |
|
|
|
6,873,071
|
| |
|
Hotels,
Restaurants & Leisure – 3.4% |
|
|
|
|
| 23,015
|
|
Hyatt
Hotels Corp, Class A |
|
|
|
1,720,141
|
| 179,783
|
|
MGM
Resorts International |
|
|
|
5,123,816
|
| 45,074
|
|
Royal
Caribbean Cruises Ltd |
|
|
|
4,905,403
|
| |
|
Total
Hotels, Restaurants & Leisure |
|
|
|
11,749,360
|
| |
|
Household
Durables – 3.2% |
|
|
|
|
| 91,967
|
|
DR
Horton Inc. |
|
|
|
4,816,312
|
| 320,716
|
|
Newell
Brands Inc. |
|
|
|
6,083,982
|
| |
|
Total
Household Durables |
|
|
|
10,900,294
|
Nuveen Mid Cap Value Fund (continued)
Portfolio of Investments October 31, 2019
| Shares
|
|
Description
(1) |
|
|
|
Value
|
| |
|
Insurance – 5.5%
|
|
|
|
|
| 132,896
|
|
Hartford
Financial Services Group Inc. |
|
|
|
$7,585,704 |
| 299,598
|
|
Old
Republic International Corp |
|
|
|
6,693,019
|
| 25,533
|
|
Willis
Towers Watson PLC |
|
|
|
4,772,118
|
| |
|
Total
Insurance |
|
|
|
19,050,841
|
| |
|
IT
Services – 3.1% |
|
|
|
|
| 16,369
|
|
Fiserv
Inc., (2) |
|
|
|
1,737,406
|
| 204,886
|
|
Perspecta
Inc. |
|
|
|
5,437,674
|
| 18,499
|
|
VeriSign
Inc., (2) |
|
|
|
3,515,180
|
| |
|
Total
IT Services |
|
|
|
10,690,260
|
| |
|
Leisure
Products – 1.7% |
|
|
|
|
| 102,887
|
|
Brunswick
Corp/DE |
|
|
|
5,992,139
|
| |
|
Machinery – 3.1%
|
|
|
|
|
| 47,267
|
|
Crane
Co |
|
|
|
3,616,871
|
| 36,612
|
|
Ingersoll-Rand
PLC |
|
|
|
4,645,696
|
| 17,060
|
|
Stanley
Black & Decker Inc. |
|
|
|
2,581,690
|
| |
|
Total
Machinery |
|
|
|
10,844,257
|
| |
|
Media – 1.1%
|
|
|
|
|
| 245,777
|
|
TEGNA
Inc. |
|
|
|
3,694,028
|
| |
|
Metals
& Mining – 1.0% |
|
|
|
|
| 111,863
|
|
Steel
Dynamics Inc. |
|
|
|
3,396,161
|
| |
|
Mortgage
Real Estate Investment Trust – 2.3% |
|
|
|
|
| 317,263
|
|
Starwood
Property Trust Inc. |
|
|
|
7,804,670
|
| |
|
Multiline
Retail – 1.7% |
|
|
|
|
| 37,049
|
|
Dollar
General Corp |
|
|
|
5,940,437
|
| |
|
Multi-Utilities – 4.8%
|
|
|
|
|
| 73,849
|
|
Ameren
Corp |
|
|
|
5,738,067
|
| 150,547
|
|
NiSource
Inc. |
|
|
|
4,221,338
|
| 102,806
|
|
Public
Service Enterprise Group Inc. |
|
|
|
6,508,648
|
| |
|
Total
Multi-Utilities |
|
|
|
16,468,053
|
| |
|
Oil,
Gas & Consumable Fuels – 4.4% |
|
|
|
|
| 99,982
|
|
Devon
Energy Corp |
|
|
|
2,027,635
|
| 82,860
|
|
HollyFrontier
Corp |
|
|
|
4,552,328
|
| 379,709
|
|
Marathon
Oil Corp |
|
|
|
4,378,045
|
| 190,714
|
|
Williams
Cos Inc. |
|
|
|
4,254,829
|
| |
|
Total
Oil, Gas & Consumable Fuels |
|
|
|
15,212,837
|
| |
|
Real
Estate Management & Development – 1.1% |
|
|
|
|
| 25,434
|
|
Jones
Lang LaSalle Inc. |
|
|
|
3,726,590
|
| Shares
|
|
Description
(1) |
|
|
|
Value
|
| |
|
Road
& Rail – 2.2% |
|
|
|
|
| 23,434
|
|
Genesee
& Wyoming Inc., Class A, (2) |
|
|
|
$2,601,877 |
| 35,779
|
|
Kansas
City Southern |
|
|
|
5,036,968
|
| |
|
Total
Road & Rail |
|
|
|
7,638,845
|
| |
|
Semiconductors
& Semiconductor Equipment – 1.3% |
|
|
|
|
| 180,065
|
|
Marvell
Technology Group Ltd |
|
|
|
4,391,785
|
| |
|
Software – 2.0%
|
|
|
|
|
| 17,184
|
|
Autodesk
Inc., (2) |
|
|
|
2,532,234
|
| 31,651
|
|
Synopsys
Inc., (2) |
|
|
|
4,296,623
|
| |
|
Total
Software |
|
|
|
6,828,857
|
| |
|
Specialty
Retail – 1.4% |
|
|
|
|
| 66,465
|
|
Best
Buy Co Inc. |
|
|
|
4,774,181
|
| |
|
Water
Utilities – 0.9% |
|
|
|
|
| 26,416
|
|
American
Water Works Co Inc. |
|
|
|
3,256,300
|
| |
|
Total
Long-Term Investments (cost $302,762,693) |
|
|
|
339,513,081
|
| Shares
|
|
Description
(1) |
Coupon
|
|
|
Value
|
| |
|
SHORT-TERM
INVESTMENTS – 1.5% |
|
|
|
|
| |
|
MONEY
MARKET FUNDS – 1.5% |
|
|
|
|
| 5,251,171
|
|
First
American Treasury Obligation Fund, Class Z |
1.693%
(3) |
|
|
$
5,251,171 |
| |
|
Total
Short-Term Investments (cost $5,251,171) |
|
|
|
5,251,171
|
| |
|
Total
Investments (cost $308,013,864) – 100.4% |
|
|
|
344,764,252
|
| |
|
Other
Assets Less Liabilities – (0.4)% |
|
|
|
(1,237,965)
|
| |
|
Net
Assets – 100% |
|
|
|
$
343,526,287 |
| |
For
Fund portfolio compliance purposes, the Fund’s industry classifications refer to any one or more of the industry sub-classifications used by one or more widely recognized market indexes or ratings group indexes, and/or as defined by Fund
management. This definition may not apply for purposes of this report, which may combine industry sub-classifications into sectors for reporting ease. |
|
| (1)
|
All
percentages shown in the Portfolio of Investments are based on net assets. |
|
| (2)
|
Non-income
producing; issuer has not declared a dividend within the past twelve months. |
|
| (3)
|
The
rate shown is the annualized seven-day subsidized yield as of the end of the reporting period. |
|
See accompanying notes to financial statements.
Nuveen Small Cap Value Fund
Portfolio of Investments October 31, 2019
| Shares
|
|
Description
(1) |
|
|
|
Value
|
| |
|
LONG-TERM
INVESTMENTS – 99.5% |
|
|
|
|
| |
|
COMMON
STOCKS – 99.5% |
|
|
|
|
| |
|
Aerospace
& Defense – 0.6% |
|
|
|
|
| 295,541
|
|
Parsons
Corp, (2) |
|
|
|
$
10,521,260 |
| |
|
Air
Freight & Logistics – 1.3% |
|
|
|
|
| 1,004,980
|
|
Air
Transport Services Group Inc., (2) |
|
|
|
21,014,132
|
| |
|
Auto
Components – 2.1% |
|
|
|
|
| 418,940
|
|
Cooper
Tire & Rubber Co |
|
|
|
11,830,865
|
| 1,379,812
|
|
Dana
Inc. |
|
|
|
22,394,349
|
| |
|
Total
Auto Components |
|
|
|
34,225,214
|
| |
|
Banks – 17.3%
|
|
|
|
|
| 570,207
|
|
Banner
Corp |
|
|
|
30,779,774
|
| 542,727
|
|
Berkshire
Hills Bancorp Inc. |
|
|
|
16,840,819
|
| 869,542
|
|
Cathay
General Bancorp |
|
|
|
30,929,609
|
| 967,102
|
|
First
Busey Corp |
|
|
|
25,502,480
|
| 552,922
|
|
Heartland
Financial USA Inc. |
|
|
|
25,865,691
|
| 426,827
|
|
IBERIABANK
Corp |
|
|
|
31,324,833
|
| 500,498
|
|
Pinnacle
Financial Partners Inc., Class A |
|
|
|
29,439,292
|
| 542,558
|
|
Preferred
Bank |
|
|
|
28,923,767
|
| 693,658
|
|
Renasant
Corp |
|
|
|
24,069,933
|
| 412,349
|
|
Western
Alliance Bancorp |
|
|
|
20,341,176
|
| 356,385
|
|
Wintrust
Financial Corp |
|
|
|
22,744,491
|
| |
|
Total
Banks |
|
|
|
286,761,865
|
| |
|
Beverages – 1.1%
|
|
|
|
|
| 1,551,132
|
|
Primo
Water Corp, (2) |
|
|
|
18,760,942
|
| |
|
Biotechnology – 0.7%
|
|
|
|
|
| 134,823
|
|
United
Therapeutics Corp, (2) |
|
|
|
12,112,498
|
| |
|
Building
Products – 1.8% |
|
|
|
|
| 558,492
|
|
Gibraltar
Industries Inc. |
|
|
|
29,728,529
|
| |
|
Capital
Markets – 2.9% |
|
|
|
|
| 292,089
|
|
Evercore
Inc., Class A |
|
|
|
21,509,434
|
| 329,291
|
|
Piper
Jaffray Companies |
|
|
|
25,862,515
|
| |
|
Total
Capital Markets |
|
|
|
47,371,949
|
| |
|
Chemicals – 1.2%
|
|
|
|
|
| 416,381
|
|
Minerals
Technologies Inc. |
|
|
|
20,590,040
|
| Shares
|
|
Description
(1) |
|
|
|
Value
|
| |
|
Commercial
Services & Supplies – 3.1% |
|
|
|
|
| 221,634
|
|
Brink's
Co |
|
|
|
$18,830,025 |
| 593,065
|
|
Quad/Graphics
Inc. |
|
|
|
2,686,584
|
| 686,502
|
|
SP
Plus Corp, (2) |
|
|
|
30,322,793
|
| |
|
Total
Commercial Services & Supplies |
|
|
|
51,839,402
|
| |
|
Communications
Equipment – 3.7% |
|
|
|
|
| 338,554
|
|
NETGEAR
Inc., (2) |
|
|
|
9,198,512
|
| 618,459
|
|
Plantronics
Inc. |
|
|
|
24,379,654
|
| 1,234,288
|
|
Radware
Ltd, (2) |
|
|
|
27,845,537
|
| |
|
Total
Communications Equipment |
|
|
|
61,423,703
|
| |
|
Construction
& Engineering – 2.2% |
|
|
|
|
| 523,586
|
|
Aegion
Corp, (2) |
|
|
|
11,346,109
|
| 278,100
|
|
EMCOR
Group Inc. |
|
|
|
24,392,151
|
| |
|
Total
Construction & Engineering |
|
|
|
35,738,260
|
| |
|
Diversified
Telecommunication Services – 0.7% |
|
|
|
|
| 1,163,108
|
|
Vonage
Holdings Corp, (2) |
|
|
|
11,363,565
|
| |
|
Electronic
Equipment, Instruments & Components – 3.7% |
|
|
|
|
| 418,436
|
|
Avnet
Inc. |
|
|
|
16,553,328
|
| 269,797
|
|
SYNNEX
Corp |
|
|
|
31,765,899
|
| 1,080,871
|
|
TTM
Technologies Inc., (2) |
|
|
|
12,656,999
|
| |
|
Total
Electronic Equipment, Instruments & Components |
|
|
|
60,976,226
|
| |
|
Energy
Equipment & Services – 1.2% |
|
|
|
|
| 1,357,207
|
|
Helix
Energy Solutions Group Inc., (2) |
|
|
|
11,658,408
|
| 1,065,809
|
|
ProPetro
Holding Corp, (2) |
|
|
|
8,260,020
|
| |
|
Total
Energy Equipment & Services |
|
|
|
19,918,428
|
| |
|
Equity
Real Estate Investment Trust – 11.6% |
|
|
|
|
| 1,707,652
|
|
Brandywine
Realty Trust |
|
|
|
26,092,923
|
| 877,143
|
|
Kite
Realty Group Trust |
|
|
|
15,630,688
|
| 1,231,650
|
|
Lexington
Realty Trust |
|
|
|
13,400,352
|
| 1,221,286
|
|
Preferred
Apartment Communities Inc. |
|
|
|
17,488,816
|
| 664,564
|
|
Retail
Opportunity Investments Corp |
|
|
|
12,404,087
|
| 1,665,822
|
|
RLJ
Lodging Trust |
|
|
|
27,336,139
|
| 788,394
|
|
STAG
Industrial Inc. |
|
|
|
24,471,750
|
| 2,138,313
|
|
Summit
Hotel Properties Inc. |
|
|
|
26,215,717
|
| 967,572
|
|
Washington
Real Estate Investment Trust |
|
|
|
30,014,083
|
| |
|
Total
Equity Real Estate Investment Trust |
|
|
|
193,054,555
|
| |
|
Food
Products – 1.5% |
|
|
|
|
| 1,903,900
|
|
Hostess
Brands Inc., (2) |
|
|
|
24,331,842
|
| |
|
Gas
Utilities – 2.8% |
|
|
|
|
| 620,826
|
|
South
Jersey Industries Inc. |
|
|
|
19,965,764
|
Nuveen Small Cap Value Fund (continued)
Portfolio of Investments October 31, 2019
| Shares
|
|
Description
(1) |
|
|
|
Value
|
| |
|
Gas
Utilities (continued) |
|
|
|
|
| 316,341
|
|
Spire
Inc. |
|
|
|
$
26,591,625 |
| |
|
Total
Gas Utilities |
|
|
|
46,557,389
|
| |
|
Health
Care Equipment & Supplies – 1.3% |
|
|
|
|
| 650,029
|
|
Natus
Medical Inc., (2) |
|
|
|
21,892,977
|
| |
|
Health
Care Providers & Services – 1.0% |
|
|
|
|
| 278,696
|
|
AMN
Healthcare Services Inc., (2) |
|
|
|
16,376,177
|
| |
|
Hotels,
Restaurants & Leisure – 1.4% |
|
|
|
|
| 273,796
|
|
Jack
in the Box Inc. |
|
|
|
23,004,340
|
| |
|
Household
Durables – 3.4% |
|
|
|
|
| 756,296
|
|
La-Z-Boy
Inc. |
|
|
|
26,856,071
|
| 678,058
|
|
M/I
Homes Inc. |
|
|
|
29,956,602
|
| |
|
Total
Household Durables |
|
|
|
56,812,673
|
| |
|
Insurance – 4.5%
|
|
|
|
|
| 238,297
|
|
AMERISAFE
Inc. |
|
|
|
15,139,008
|
| 292,261
|
|
Argo
Group International Holdings Ltd |
|
|
|
18,082,188
|
| 340,716
|
|
BRP
Group Inc., (2) |
|
|
|
5,519,599
|
| 1,494,432
|
|
CNO
Financial Group Inc. |
|
|
|
23,387,861
|
| 285,730
|
|
Horace
Mann Educators Corp |
|
|
|
12,446,399
|
| |
|
Total
Insurance |
|
|
|
74,575,055
|
| |
|
Interactive
Media & Services – 0.6% |
|
|
|
|
| 902,512
|
|
Carscom
Inc., (2) |
|
|
|
10,207,411
|
| |
|
Leisure
Products – 0.9% |
|
|
|
|
| 255,624
|
|
Brunswick
Corp/DE |
|
|
|
14,887,542
|
| |
|
Machinery – 0.7%
|
|
|
|
|
| 743,721
|
|
Milacron
Holdings Corp, (2) |
|
|
|
12,435,015
|
| |
|
Media – 0.8%
|
|
|
|
|
| 337,745
|
|
Meredith
Corp |
|
|
|
12,732,986
|
| |
|
Metals
& Mining – 1.9% |
|
|
|
|
| 832,242
|
|
Allegheny
Technologies Inc. |
|
|
|
17,485,404
|
| 2,643,519
|
|
SunCoke
Energy Inc. |
|
|
|
13,984,216
|
| |
|
Total
Metals & Mining |
|
|
|
31,469,620
|
| |
|
Mortgage
Real Estate Investment Trust – 3.2% |
|
|
|
|
| 1,585,301
|
|
Invesco
Mortgage Capital Inc. |
|
|
|
24,952,638
|
| 1,620,029
|
|
Ladder
Capital Corp |
|
|
|
27,977,901
|
| |
|
Total
Mortgage Real Estate Investment Trust |
|
|
|
52,930,539
|
| |
|
Multi-Utilities – 1.7%
|
|
|
|
|
| 359,066
|
|
Black
Hills Corp |
|
|
|
28,305,173
|
| Shares
|
|
Description
(1) |
|
|
|
Value
|
| |
|
Oil,
Gas & Consumable Fuels – 2.8% |
|
|
|
|
| 506,649
|
|
Brigham
Minerals Inc., Class A |
|
|
|
$9,671,930 |
| 1,866,616
|
|
Callon
Petroleum Co, (2), (3) |
|
|
|
7,093,141
|
| 461,032
|
|
Delek
US Holdings Inc. |
|
|
|
18,418,228
|
| 1,132,710
|
|
Magnolia
Oil & Gas Corp, (2), (3) |
|
|
|
11,123,212
|
| |
|
Total
Oil, Gas & Consumable Fuels |
|
|
|
46,306,511
|
| |
|
Pharmaceuticals – 1.2%
|
|
|
|
|
| 559,732
|
|
Prestige
Consumer Healthcare Inc., (2) |
|
|
|
19,848,097
|
| |
|
Professional
Services – 2.5% |
|
|
|
|
| 700,971
|
|
CBIZ
Inc., (2) |
|
|
|
19,185,576
|
| 596,988
|
|
Korn
Ferry |
|
|
|
21,903,490
|
| |
|
Total
Professional Services |
|
|
|
41,089,066
|
| |
|
Semiconductors
& Semiconductor Equipment – 1.2% |
|
|
|
|
| 105,376
|
|
MKS
Instruments Inc. |
|
|
|
11,403,791
|
| 179,485
|
|
Semtech
Corp, (2) |
|
|
|
9,056,813
|
| |
|
Total
Semiconductors & Semiconductor Equipment |
|
|
|
20,460,604
|
| |
|
Software – 2.2%
|
|
|
|
|
| 294,912
|
|
Alarmcom
Holdings Inc., (2) |
|
|
|
14,568,653
|
| 233,108
|
|
j2
Global Inc. |
|
|
|
22,135,935
|
| |
|
Total
Software |
|
|
|
36,704,588
|
| |
|
Specialty
Retail – 1.9% |
|
|
|
|
| 415,052
|
|
Aaron's
Inc. |
|
|
|
31,099,846
|
| |
|
Textiles,
Apparel & Luxury Goods – 1.4% |
|
|
|
|
| 301,173
|
|
Culp
Inc. |
|
|
|
4,659,146
|
| 733,959
|
|
G-III
Apparel Group Ltd, (2) |
|
|
|
18,429,711
|
| |
|
Total
Textiles, Apparel & Luxury Goods |
|
|
|
23,088,857
|
| |
|
Thrifts
& Mortgage Finance – 4.4% |
|
|
|
|
| 600,484
|
|
Flagstar
Bancorp Inc. |
|
|
|
21,821,589
|
| 1,254,328
|
|
Radian
Group Inc. |
|
|
|
31,483,633
|
| 466,732
|
|
WSFS
Financial Corp |
|
|
|
19,682,088
|
| |
|
Total
Thrifts & Mortgage Finance |
|
|
|
72,987,310
|
| |
|
Water
Utilities – 1.0% |
|
|
|
|
| 311,238
|
|
California
Water Service Group |
|
|
|
17,419,991
|
| |
|
Total
Long-Term Investments (cost $1,597,111,212) |
|
|
|
1,650,924,177
|
| Shares
|
|
Description
(1) |
Coupon
|
|
|
Value
|
| |
|
INVESTMENTS
PURCHASED WITH COLLATERAL FROM SECURITIES LENDING – 0.3% |
|
|
|
| |
|
MONEY
MARKET FUNDS – 0.3% |
|
|
|
|
| 5,652,479
|
|
First
American Government Obligations Fund, Class X, (4) |
1.743%
(5) |
|
|
$
5,652,479 |
| |
|
Total
Investments Purchased with Collateral from Securities Lending (cost $5,652,479) |
|
|
5,652,479
|
Nuveen Small Cap Value Fund (continued)
Portfolio of Investments October 31, 2019
| Shares
|
|
Description
(1) |
Coupon
|
|
|
Value
|
| |
|
SHORT-TERM
INVESTMENTS – 1.1% |
|
|
|
|
| |
|
MONEY
MARKET FUNDS – 1.1% |
|
|
|
|
| 17,886,097
|
|
First
American Treasury Obligation Fund, Class Z |
1.693%
(5) |
|
|
$
17,886,097 |
| |
|
Total
Short-Term Investments (cost $17,886,097) |
|
|
|
17,886,097
|
| |
|
Total
Investments (cost $1,620,649,788) – 100.9% |
|
|
|
1,674,462,753
|
| |
|
Other
Assets Less Liabilities – (0.9)% |
|
|
|
(15,444,892)
|
| |
|
Net
Assets – 100% |
|
|
|
$
1,659,017,861 |
| |
For
Fund portfolio compliance purposes, the Fund’s industry classifications refer to any one or more of the industry sub-classifications used by one or more widely recognized market indexes or ratings group indexes, and/or as defined by Fund
management. This definition may not apply for purposes of this report, which may combine industry sub-classifications into sectors for reporting ease. |
|
| (1)
|
All
percentages shown in the Portfolio of Investments are based on net assets. |
|
| (2)
|
Non-income
producing; issuer has not declared a dividend within the past twelve months. |
|
| (3)
|
Investment,
or a portion of investment, is out on loan for securities lending. The total value of the securities out on loan as of the end of the reporting period was $5,365,517. |
|
| (4)
|
The
Fund may loan securities representing up to one third of the fair value of its total assets (which includes collateral for securities on loan) to broker dealers, banks, and other institutions. The Fund maintains collateral equal to at least 100% of
the fair value of the securities loaned. The cash collateral received by the Fund is invested in this money market fund. See Notes to Financial Statements, Note 4- Portfolio Securities and Investments in Derivatives, Securities Lending for more
information. |
|
| (5)
|
The
rate shown is the annualized seven-day subsidized yield as of the end of the reporting period. |
|
See accompanying notes to financial statements.
Statement of Assets and Liabilities
October 31, 2019
| |
Dividend
Value |
Mid
Cap
Value |
Small
Cap
Value |
| Assets
|
|
|
|
| Long-term
investments, at value (cost $809,889,932, $302,762,693 and $1,597,111,212, respectively) |
$973,636,754
|
$339,513,081
|
$1,650,924,177
|
| Investment
purchased with collateral from securities lending, at value (cost approximates value) |
3,758,147
|
—
|
5,652,479
|
| Short-term
investments, at value (cost approximates value) |
12,555,067
|
5,251,171
|
17,886,097
|
| Receivable
for: |
|
|
|
| Dividends
|
1,915,459
|
147,990
|
174,030
|
| Due
from broker |
34
|
—
|
852
|
| Interest
|
5,041
|
8,016
|
24,002
|
| Investments
sold |
—
|
—
|
6,663,144
|
| Shares
sold |
2,840,453
|
433,424
|
3,551,275
|
| Other
assets |
106,791
|
34,935
|
76,061
|
| Total
assets |
994,817,746
|
345,388,617
|
1,684,952,117
|
| Liabilities
|
|
|
|
| Payable
for: |
|
|
|
| Collateral
from securities lending program |
3,758,147
|
—
|
5,652,479
|
| Investments
purchased |
12,727,063
|
864,472
|
13,720,339
|
| Shares
redeemed |
972,540
|
565,159
|
3,242,143
|
| Accrued
expenses: |
|
|
|
| Directors
fees |
91,925
|
12,861
|
60,139
|
| Management
fees |
552,994
|
201,072
|
1,984,572
|
| Shareholder
servicing agent fees |
412,844
|
133,936
|
832,902
|
| 12b-1
distribution and service fees |
74,670
|
22,375
|
99,945
|
| Other
|
129,399
|
62,455
|
341,737
|
| Total
liabilities |
18,719,582
|
1,862,330
|
25,934,256
|
| Net
assets |
$976,098,164
|
$343,526,287
|
$1,659,017,861
|
| |
|
|
|
See accompanying notes to financial statements.
Statement of Assets and Liabilities (continued)
| |
Dividend
Value |
Mid
Cap
Value |
Small
Cap
Value |
| Class
A Shares |
|
|
|
| Net
assets |
$215,710,053
|
$
55,467,383 |
$
213,818,759 |
| Shares
outstanding |
15,174,988
|
1,350,393
|
9,634,660
|
| Net
asset value ("NAV") per share |
$
14.21 |
$
41.07 |
$
22.19 |
| Offering
price per share (NAV per share plus maximum sales charge of 5.75% of offering price) |
$
15.08 |
$
43.58 |
$
23.54 |
| Class
C Shares |
|
|
|
| Net
assets |
$
23,083,320 |
$
7,631,308 |
$
45,920,048 |
| Shares
outstanding |
1,656,989
|
198,285
|
2,466,737
|
| NAV
and offering price per share |
$
13.93 |
$
38.49 |
$
18.62 |
| Class
R3 Shares |
|
|
|
| Net
assets |
$
23,090,781 |
$
10,229,914 |
$
37,296,179 |
| Shares
outstanding |
1,632,532
|
251,505
|
1,720,613
|
| NAV
and offering price per share |
$
14.14 |
$
40.67 |
$
21.68 |
| Class
R6 Shares |
|
|
|
| Net
assets |
$
52,824,240 |
$
19,481,138 |
$
133,070,731 |
| Shares
outstanding |
3,634,192
|
471,475
|
5,763,308
|
| NAV
and offering price per share |
$
14.54 |
$
41.32 |
$
23.09 |
| Class
I Shares |
|
|
|
| Net
assets |
$661,389,770
|
$250,716,544
|
$1,228,912,144
|
| Shares
outstanding |
45,881,070
|
6,079,621
|
53,424,839
|
| NAV
and offering price per share |
$
14.42 |
$
41.24 |
$
23.00 |
| Fund
level net assets consist of: |
|
|
|
| Capital
paid-in |
$695,151,907
|
$308,247,850
|
$1,794,279,315
|
| Total
distributable earnings |
280,946,257
|
35,278,437
|
(135,261,454)
|
| Fund
level net assets |
$976,098,164
|
$343,526,287
|
$1,659,017,861
|
| Authorized
shares - per class |
2
billion |
2
billion |
2
billion |
| Par
value per share |
$
0.0001 |
$
0.0001 |
$
0.0001 |
See accompanying notes to financial statements.
Statement of Operations
Year Ended October 31, 2019
| |
Dividend
Value |
Mid
Cap
Value |
Small
Cap
Value |
| Investment
Income |
|
|
|
| Dividends
|
$
32,704,781 |
$
6,821,453 |
$
37,262,204 |
| Interest
|
152,198
|
87,005
|
1,174,738
|
| Securities
lending income |
547
|
1,014
|
64,210
|
| Foreign
tax withheld on dividend income |
(89,116)
|
(1,342)
|
—
|
| Total
investment income |
32,768,410
|
6,908,130
|
38,501,152
|
| Expenses
|
|
|
|
| Management
fees |
7,226,627
|
2,453,043
|
14,757,965
|
| 12b-1
service fees - Class A Shares |
551,047
|
136,666
|
611,231
|
| 12b-1
distibution and service fees - Class C Shares |
263,785
|
76,112
|
556,998
|
| 12b-1
distibution and service fees - Class R3 Shares |
126,102
|
46,164
|
209,500
|
| Shareholder
servicing agent fees |
1,371,453
|
440,905
|
3,666,020
|
| Custodian
fees |
113,082
|
37,703
|
201,941
|
| Professional
fees |
78,004
|
42,364
|
125,279
|
| Directors
fees |
32,113
|
9,119
|
55,988
|
| Shareholder
reporting expenses |
106,079
|
66,317
|
419,828
|
| Federal
and state registration fees |
103,156
|
105,289
|
147,868
|
| Other
|
18,506
|
4,391
|
36,075
|
| Total
expenses before fee waiver/expense reimbursement |
9,989,954
|
3,418,073
|
20,788,693
|
| Fee
waiver/expense reimbursement |
—
|
(314,047)
|
(1,474,212)
|
| Net
expenses |
9,989,954
|
3,104,026
|
19,314,481
|
| Net
investment income (loss) |
22,778,456
|
3,804,104
|
19,186,671
|
| Realized
and Unrealized Gain (Loss) |
|
|
|
| Net
realized gain (loss) from investments and foreign currency |
136,560,082
|
(4,962,182)
|
(195,896,872)
|
| Change
in net unrealized appreciation (depreciation) of investments and foreign currency |
(57,720,876)
|
36,915,276
|
168,775,638
|
| Net
realized and unrealized gain (loss) |
78,839,206
|
31,953,094
|
(27,121,234)
|
| Net
increase (decrease) in net assets from operations |
$101,617,662
|
$35,757,198
|
$
(7,934,563) |
See accompanying notes to financial statements.
Statement of Changes in Net Assets
| |
Dividend
Value |
|
Mid
Cap Value |
|
Small
Cap Value |
| |
Year
Ended
10/31/19 |
Year
Ended
10/31/18 |
|
Year
Ended
10/31/19 |
Year
Ended
10/31/18 |
|
Year
Ended
10/31/19 |
Year
Ended
10/31/18 |
| Operations
|
|
|
|
|
|
|
|
|
| Net
investment income (loss) |
$
22,778,456 |
$
21,243,012 |
|
$
3,804,104 |
$
1,095,201 |
|
$
19,186,671 |
$
15,230,890 |
| Net
realized gain (loss) from investments and foreign currency |
136,560,082
|
89,289,516
|
|
(4,962,182)
|
10,169,487
|
|
(195,896,872)
|
69,259,453
|
| Change
in net unrealized appreciation (depreciation) of investments and foreign currency |
(57,720,876)
|
(66,520,545)
|
|
36,915,276
|
(20,528,631)
|
|
168,775,638
|
(307,403,692)
|
| Net
increase (decrease) in net assets from operations |
101,617,662
|
44,011,983
|
|
35,757,198
|
(9,263,943)
|
|
(7,934,563)
|
(222,913,349)
|
| Distributions
to Shareholders |
|
|
|
|
|
|
|
|
| Dividends:
|
|
|
|
|
|
|
|
|
| Class
A Shares |
(21,478,363)
|
(34,728,444)
|
|
(2,090,136)
|
(2,999,640)
|
|
(9,218,363)
|
(2,578,153)
|
| Class
C Shares |
(2,571,787)
|
(4,635,415)
|
|
(269,609)
|
(562,327)
|
|
(2,213,805)
|
(346,671)
|
| Class
R3 Shares |
(2,421,158)
|
(4,035,422)
|
|
(305,976)
|
(390,060)
|
|
(1,486,198)
|
(248,991)
|
| Class
R6 Shares(1) |
(15,749,024)
|
(23,647,109)
|
|
(150,144)
|
—
|
|
(4,532,713)
|
(610,197)
|
| Class
I Shares |
(59,923,827)
|
(73,268,294)
|
|
(7,324,416)
|
(4,709,016)
|
|
(59,648,995)
|
(16,222,943)
|
| Class
T Shares(2) |
—
|
(3,267)
|
|
—
|
—
|
|
—
|
(218)
|
| Decrease
in net assets from distributions to shareholders |
(102,144,159)
|
(140,317,951)
|
|
(10,140,281)
|
(8,661,043)
|
|
(77,100,074)
|
(20,007,173)
|
| Fund
Share Transactions |
|
|
|
|
|
|
|
|
| Proceeds
from sale of shares |
181,700,330
|
323,024,720
|
|
195,139,508
|
144,755,470
|
|
725,770,948
|
1,445,452,753
|
| Proceeds
from shares issued to shareholders due to reinvestment of distributions |
89,885,116
|
116,630,287
|
|
9,082,541
|
6,501,180
|
|
61,854,103
|
15,787,250
|
| |
271,585,446
|
439,655,007
|
|
204,222,049
|
151,256,650
|
|
787,625,051
|
1,461,240,003
|
| Cost
of shares redeemed |
(407,594,403)
|
(322,670,588)
|
|
(92,882,064)
|
(37,204,641)
|
|
(1,386,388,541)
|
(813,996,405)
|
| Net
increase (decrease) in net assets from Fund share transactions |
(136,008,957)
|
116,984,419
|
|
111,339,985
|
114,052,009
|
|
(598,763,490)
|
647,243,598
|
| Net
increase (decrease) in net assets |
(136,535,454)
|
20,678,451
|
|
136,956,902
|
96,127,023
|
|
(683,798,127)
|
404,323,076
|
| Net
assets at the beginning of period |
1,112,633,618
|
1,091,955,167
|
|
206,569,385
|
110,442,362
|
|
2,342,815,988
|
1,938,492,912
|
| Net
assets at the end of period |
$
976,098,164 |
$1,112,633,618
|
|
$343,526,287
|
$206,569,385
|
|
$
1,659,017,861 |
$2,342,815,988
|
| (1)
|
Mid Cap
Value’s Class R6 Shares were established on June 20, 2018. |
| (2)
|
Class T
Shares were not available for public offering. |
See accompanying notes to financial statements.
THIS PAGE INTENTIONALLY LEFT BLANK
Dividend
Value
Selected data for a share outstanding throughout each period:
| |
|
|
|
|
|
|
|
|
| |
|
|
|
|
|
|
|
|
| |
|
Investment
Operations |
|
Less
Distributions |
|
| Class
(Commencement Date) Year Ended October 31, |
Beginning
NAV |
Net
Investment
Income
(Loss)(a) |
Net
Realized/
Unrealized
Gain (Loss) |
Total
|
|
From
Net
Investment
Income |
From
Accumulated
Net Realized
Gains |
Total
|
Ending
NAV |
| Class
A (12/92) |
|
|
|
|
|
|
|
|
|
| 2019
|
$14.32
|
$0.26
|
$
0.96 |
$
1.22 |
|
$(0.28)
|
$(1.05)
|
$(1.33)
|
$14.21
|
| 2018
|
15.67
|
0.25
|
0.35
|
0.60
|
|
(0.24)
|
(1.71)
|
(1.95)
|
14.32
|
| 2017
|
15.12
|
0.22
|
2.72
|
2.94
|
|
(0.22)
|
(2.17)
|
(2.39)
|
15.67
|
| 2016
|
15.81
|
0.25
|
0.48
|
0.73
|
|
(0.30)
|
(1.12)
|
(1.42)
|
15.12
|
| 2015
|
17.44
|
0.28
|
(0.44)
|
(0.16)
|
|
(0.34)
|
(1.13)
|
(1.47)
|
15.81
|
| Class
C (02/99) |
|
|
|
|
|
|
|
|
|
| 2019
|
14.06
|
0.16
|
0.93
|
1.09
|
|
(0.17)
|
(1.05)
|
(1.22)
|
13.93
|
| 2018
|
15.41
|
0.14
|
0.35
|
0.49
|
|
(0.13)
|
(1.71)
|
(1.84)
|
14.06
|
| 2017
|
14.90
|
0.11
|
2.68
|
2.79
|
|
(0.11)
|
(2.17)
|
(2.28)
|
15.41
|
| 2016
|
15.60
|
0.14
|
0.47
|
0.61
|
|
(0.19)
|
(1.12)
|
(1.31)
|
14.90
|
| 2015
|
17.23
|
0.16
|
(0.44)
|
(0.28)
|
|
(0.22)
|
(1.13)
|
(1.35)
|
15.60
|
| Class
R3 (09/01) |
|
|
|
|
|
|
|
|
|
| 2019
|
14.26
|
0.23
|
0.94
|
1.17
|
|
(0.24)
|
(1.05)
|
(1.29)
|
14.14
|
| 2018
|
15.60
|
0.22
|
0.36
|
0.58
|
|
(0.21)
|
(1.71)
|
(1.92)
|
14.26
|
| 2017
|
15.08
|
0.18
|
2.71
|
2.89
|
|
(0.20)
|
(2.17)
|
(2.37)
|
15.60
|
| 2016
|
15.77
|
0.22
|
0.47
|
0.69
|
|
(0.26)
|
(1.12)
|
(1.38)
|
15.08
|
| 2015
|
17.41
|
0.24
|
(0.45)
|
(0.21)
|
|
(0.30)
|
(1.13)
|
(1.43)
|
15.77
|
| Class
R6 (02/13) |
|
|
|
|
|
|
|
|
|
| 2019
|
14.61
|
0.32
|
0.99
|
1.31
|
|
(0.33)
|
(1.05)
|
(1.38)
|
14.54
|
| 2018
|
15.93
|
0.32
|
0.36
|
0.68
|
|
(0.29)
|
(1.71)
|
(2.00)
|
14.61
|
| 2017
|
15.32
|
0.25
|
2.79
|
3.04
|
|
(0.26)
|
(2.17)
|
(2.43)
|
15.93
|
| 2016
|
15.99
|
0.30
|
0.49
|
0.79
|
|
(0.34)
|
(1.12)
|
(1.46)
|
15.32
|
| 2015
|
17.62
|
0.34
|
(0.45)
|
(0.11)
|
|
(0.39)
|
(1.13)
|
(1.52)
|
15.99
|
| Class
I (08/94) |
|
|
|
|
|
|
|
|
|
| 2019
|
14.51
|
0.30
|
0.98
|
1.28
|
|
(0.32)
|
(1.05)
|
(1.37)
|
14.42
|
| 2018
|
15.85
|
0.30
|
0.36
|
0.66
|
|
(0.29)
|
(1.71)
|
(2.00)
|
14.51
|
| 2017
|
15.27
|
0.26
|
2.75
|
3.01
|
|
(0.26)
|
(2.17)
|
(2.43)
|
15.85
|
| 2016
|
15.95
|
0.29
|
0.49
|
0.78
|
|
(0.34)
|
(1.12)
|
(1.46)
|
15.27
|
| 2015
|
17.60
|
0.33
|
(0.46)
|
(0.13)
|
|
(0.39)
|
(1.13)
|
(1.52)
|
15.95
|
| |
|
|
|
|
| |
Ratios/Supplemental
Data |
| |
|
Ratios
to Average
Net Assets |
|
Total
Return(b) |
Ending
Net
Assets
(000) |
Expenses
|
Net
Investment
Income
(Loss) |
Portfolio
Turnover
Rate(c) |
| |
|
|
|
|
| 9.81%
|
$215,710
|
1.11%
|
1.94%
|
93%
|
| 3.72
|
264,271
|
1.08
|
1.68
|
68
|
| 20.95
|
269,063
|
1.08
|
1.46
|
56
|
| 5.33
|
259,457
|
1.14
|
1.69
|
67
|
| (0.87)
|
310,055
|
1.15
|
1.72
|
53
|
| |
|
|
|
|
| 8.98
|
23,083
|
1.86
|
1.19
|
93
|
| 2.98
|
31,111
|
1.83
|
0.95
|
68
|
| 20.09
|
39,825
|
1.83
|
0.72
|
56
|
| 4.46
|
43,097
|
1.89
|
0.94
|
67
|
| (1.59)
|
53,507
|
1.90
|
0.98
|
53
|
| |
|
|
|
|
| 9.50
|
23,091
|
1.36
|
1.68
|
93
|
| 3.53
|
27,927
|
1.33
|
1.44
|
68
|
| 20.64
|
33,639
|
1.33
|
1.21
|
56
|
| 5.01
|
31,758
|
1.39
|
1.49
|
67
|
| (1.12)
|
42,618
|
1.40
|
1.45
|
53
|
| |
|
|
|
|
| 10.29
|
52,824
|
0.72
|
2.30
|
93
|
| 4.15
|
172,215
|
0.72
|
2.05
|
68
|
| 21.40
|
188,356
|
0.73
|
1.63
|
56
|
| 5.63
|
50,588
|
0.79
|
2.04
|
67
|
| (0.51)
|
56,123
|
0.81
|
2.03
|
53
|
| |
|
|
|
|
| 10.14
|
661,390
|
0.86
|
2.18
|
93
|
| 4.02
|
617,086
|
0.83
|
1.94
|
68
|
| 21.25
|
561,047
|
0.83
|
1.73
|
56
|
| 5.56
|
654,967
|
0.89
|
1.95
|
67
|
| (0.64)
|
930,850
|
0.90
|
1.99
|
53
|
| (a)
|
Per share Net
Investment Income (Loss) is calculated using the average daily shares method. |
| (b)
|
Total
return is the combination of changes in NAV without any sales charge, reinvested dividend income at NAV and reinvested capital gains distributions at NAV, if any. Total returns are not annualized. |
| (c)
|
Portfolio
Turnover Rate is calculated based on the lesser of long-term purchases or sales (as disclosed in Note 4 – Portfolio Securities and Investment in Derivatives, Investment Transactions) divided by the average long-term market value
during the period. |
See accompanying notes to financial statements.
Financial Highlights (continued)
Mid Cap Value
Selected data for a share
outstanding throughout each period:
| |
|
|
|
|
|
|
|
|
| |
|
|
|
|
|
|
|
|
| |
|
Investment
Operations |
|
Less
Distributions |
|
| Class
(Commencement Date) Year Ended October 31, |
Beginning
NAV |
Net
Investment
Income
(Loss)(a) |
Net
Realized/
Unrealized
Gain (Loss) |
Total
|
|
From
Net
Investment
Income |
From
Accumulated
Net Realized
Gains |
Total
|
Ending
NAV |
| Class
A (12/87) |
|
|
|
|
|
|
|
|
|
| 2019
|
$38.91
|
$
0.40 |
$
3.29 |
$
3.69 |
|
$(0.09)
|
$(1.44)
|
$(1.53)
|
$41.07
|
| 2018
|
42.32
|
0.29
|
(0.46)
|
(0.17)
|
|
(0.26)
|
(2.98)
|
(3.24)
|
38.91
|
| 2017
|
35.23
|
0.26
|
8.17
|
8.43
|
|
(0.32)
|
(1.02)
|
(1.34)
|
42.32
|
| 2016
|
35.39
|
0.30
|
0.72
|
1.02
|
|
(0.09)
|
(1.09)
|
(1.18)
|
35.23
|
| 2015
|
35.37
|
0.10
|
0.22
|
0.32
|
|
(0.30)
|
—
|
(0.30)
|
35.39
|
| Class
C (02/99) |
|
|
|
|
|
|
|
|
|
| 2019
|
36.73
|
0.11
|
3.09
|
3.20
|
|
—
|
(1.44)
|
(1.44)
|
38.49
|
| 2018
|
40.17
|
—* |
(0.46)
|
(0.46)
|
|
—
|
(2.98)
|
(2.98)
|
36.73
|
| 2017
|
33.50
|
(0.03)
|
7.78
|
7.75
|
|
(0.06)
|
(1.02)
|
(1.08)
|
40.17
|
| 2016
|
33.86
|
0.04
|
0.69
|
0.73
|
|
—
|
(1.09)
|
(1.09)
|
33.50
|
| 2015
|
33.86
|
(0.16)
|
0.20
|
0.04
|
|
(0.04)
|
—
|
(0.04)
|
33.86
|
| Class
R3 (09/01) |
|
|
|
|
|
|
|
|
|
| 2019
|
38.55
|
0.31
|
3.25
|
3.56
|
|
—
|
(1.44)
|
(1.44)
|
40.67
|
| 2018
|
41.95
|
0.18
|
(0.44)
|
(0.26)
|
|
(0.16)
|
(2.98)
|
(3.14)
|
38.55
|
| 2017
|
34.94
|
0.17
|
8.09
|
8.26
|
|
(0.23)
|
(1.02)
|
(1.25)
|
41.95
|
| 2016
|
35.17
|
0.21
|
0.65
|
0.86
|
|
—
|
(1.09)
|
(1.09)
|
34.94
|
| 2015
|
35.15
|
0.02
|
0.21
|
0.23
|
|
(0.21)
|
—
|
(0.21)
|
35.17
|
| Class
R6 (06/18) |
|
|
|
|
|
|
|
|
|
| 2019
|
39.10
|
0.55
|
3.30
|
3.85
|
|
(0.19)
|
(1.44)
|
(1.63)
|
41.32
|
| 2018(e)
|
42.86
|
0.11
|
(3.87)
|
(3.76)
|
|
—
|
—
|
—
|
39.10
|
| Class
I (02/94) |
|
|
|
|
|
|
|
|
|
| 2019
|
39.08
|
0.51
|
3.28
|
3.79
|
|
(0.19)
|
(1.44)
|
(1.63)
|
41.24
|
| 2018
|
42.49
|
0.40
|
(0.47)
|
(0.07)
|
|
(0.36)
|
(2.98)
|
(3.34)
|
39.08
|
| 2017
|
35.36
|
0.36
|
8.20
|
8.56
|
|
(0.41)
|
(1.02)
|
(1.43)
|
42.49
|
| 2016
|
35.52
|
0.38
|
0.73
|
1.11
|
|
(0.18)
|
(1.09)
|
(1.27)
|
35.36
|
| 2015
|
35.50
|
0.20
|
0.20
|
0.40
|
|
(0.38)
|
—
|
(0.38)
|
35.52
|
| |
|
|
|
|
|
|
| |
Ratios/Supplemental
Data |
| |
|
Ratios
to Average
Net Assets Before
Waiver/Reimbursement |
|
Ratios
to Average
Net Assets After
Waiver/Reimbursement(c) |
|
Total
Return(b) |
Ending
Net
Assets
(000) |
Expenses
|
Net
Investment
Income
(Loss) |
|
Expenses
|
Net
Investment
Income
(Loss) |
Portfolio
Turnover
Rate(d) |
| |
|
|
|
|
|
|
|
| 10.19%
|
$
55,467 |
1.27%
|
0.94%
|
|
1.17%
|
1.04%
|
46%
|
| (0.65)
|
51,202
|
1.31
|
0.55
|
|
1.17
|
0.69
|
49
|
| 24.43
|
40,319
|
1.32
|
0.52
|
|
1.17
|
0.67
|
43
|
| 3.12
|
34,230
|
1.39
|
0.73
|
|
1.26
|
0.86
|
44
|
| 0.89
|
36,378
|
1.41
|
0.20
|
|
1.32
|
0.29
|
111
|
| |
|
|
|
|
|
|
|
| 9.39
|
7,631
|
2.02
|
0.20
|
|
1.92
|
0.30
|
46
|
| (1.41)
|
6,899
|
2.06
|
(0.14)
|
|
1.92
|
—**
|
49
|
| 23.52
|
7,474
|
2.07
|
(0.23)
|
|
1.92
|
(0.08)
|
43
|
| 2.32
|
6,529
|
2.14
|
(0.02)
|
|
2.01
|
0.11
|
44
|
| 0.15
|
7,379
|
2.16
|
(0.55)
|
|
2.07
|
(0.46)
|
111
|
| |
|
|
|
|
|
|
|
| 9.92
|
10,230
|
1.52
|
0.70
|
|
1.42
|
0.81
|
46
|
| (0.90)
|
7,670
|
1.56
|
0.30
|
|
1.42
|
0.44
|
49
|
| 24.11
|
5,284
|
1.57
|
0.28
|
|
1.42
|
0.43
|
43
|
| 2.86
|
5,206
|
1.64
|
0.48
|
|
1.51
|
0.61
|
44
|
| 0.65
|
6,942
|
1.66
|
(0.04)
|
|
1.57
|
0.05
|
111
|
| |
|
|
|
|
|
|
|
| 10.63
|
19,481
|
0.87
|
1.29
|
|
0.77
|
1.39
|
46
|
| (8.77)
|
958
|
0.93***
|
0.56***
|
|
0.79***
|
0.71***
|
49
|
| |
|
|
|
|
|
|
|
| 10.48
|
250,717
|
1.02
|
1.20
|
|
0.92
|
1.30
|
46
|
| (0.40)
|
139,841
|
1.07
|
0.80
|
|
0.92
|
0.95
|
49
|
| 24.75
|
57,365
|
1.07
|
0.77
|
|
0.92
|
0.92
|
43
|
| 3.38
|
53,631
|
1.14
|
0.98
|
|
1.01
|
1.11
|
44
|
| 1.12
|
67,834
|
1.16
|
0.46
|
|
1.07
|
0.55
|
111
|
| (a)
|
Per share Net
Investment Income (Loss) is calculated using the average daily shares method. |
| (b)
|
Total
return is the combination of changes in NAV without any sales charge, reinvested dividend income at NAV and reinvested capital gains distributions at NAV, if any. Total returns are not annualized. |
| (c)
|
After fee
waiver and/or expense reimbursement from the Adviser, where applicable. See Note 7 – Management Fees and Other Transactions with Affiliates, Management Fees for more information. |
| (d)
|
Portfolio
Turnover Rate is calculated based on the lesser of long-term purchases or sales (as disclosed in Note 4 – Portfolio Securities and Investment in Derivatives, Investment Transactions) divided by the average long-term market value
during the period. |
| (e)
|
For the
period June 20, 2018 (commencement of operations) through October 31, 2018. |
| *
|
Rounds to
less than $(0.01). |
| **
|
Rounds to
less than 0.01%. |
| ***
|
Annualized.
|
See
accompanying notes to financial statements.
Financial Highlights (continued)
Small Cap Value
Selected data for a share
outstanding throughout each period:
| |
|
|
|
|
|
|
|
|
| |
|
|
|
|
|
|
|
|
| |
|
Investment
Operations |
|
Less
Distributions |
|
| Class
(Commencement Date) Year Ended October 31, |
Beginning
NAV |
Net
Investment
Income
(Loss)(a) |
Net
Realized/
Unrealized
Gain (Loss) |
Total
|
|
From
Net
Investment
Income |
From
Accumulated
Net Realized
Gains |
Total
|
Ending
NAV |
| Class
A (08/94) |
|
|
|
|
|
|
|
|
|
| 2019
|
$22.96
|
$
0.18 |
$(0.17)
|
$
0.01 |
|
$(0.13)
|
$(0.65)
|
$(0.78)
|
$22.19
|
| 2018
|
25.19
|
0.12
|
(2.15)
|
(2.03)
|
|
(0.10)
|
(0.10)
|
(0.20)
|
22.96
|
| 2017
|
20.98
|
0.11
|
4.70
|
4.81
|
|
(0.09)
|
(0.51)
|
(0.60)
|
25.19
|
| 2016
|
19.95
|
0.14
|
1.20
|
1.34
|
|
(0.01)
|
(0.30)
|
(0.31)
|
20.98
|
| 2015
|
18.55
|
0.07
|
1.40
|
1.47
|
|
(0.07)
|
—
|
(0.07)
|
19.95
|
| Class
C (02/99) |
|
|
|
|
|
|
|
|
|
| 2019
|
19.39
|
0.01
|
(0.13)
|
(0.12)
|
|
—
|
(0.65)
|
(0.65)
|
18.62
|
| 2018
|
21.36
|
(0.06)
|
(1.81)
|
(1.87)
|
|
—
|
(0.10)
|
(0.10)
|
19.39
|
| 2017
|
17.92
|
(0.06)
|
4.01
|
3.95
|
|
—
|
(0.51)
|
(0.51)
|
21.36
|
| 2016
|
17.20
|
(0.01)
|
1.03
|
1.02
|
|
—
|
(0.30)
|
(0.30)
|
17.92
|
| 2015
|
16.06
|
(0.07)
|
1.21
|
1.14
|
|
—
|
—
|
—
|
17.20
|
| Class
R3 (09/01) |
|
|
|
|
|
|
|
|
|
| 2019
|
22.43
|
0.12
|
(0.15)
|
(0.03)
|
|
(0.07)
|
(0.65)
|
(0.72)
|
21.68
|
| 2018
|
24.61
|
0.05
|
(2.09)
|
(2.04)
|
|
(0.04)
|
(0.10)
|
(0.14)
|
22.43
|
| 2017
|
20.51
|
0.05
|
4.60
|
4.65
|
|
(0.04)
|
(0.51)
|
(0.55)
|
24.61
|
| 2016
|
19.56
|
0.09
|
1.16
|
1.25
|
|
—
|
(0.30)
|
(0.30)
|
20.51
|
| 2015
|
18.19
|
0.02
|
1.38
|
1.40
|
|
(0.03)
|
—
|
(0.03)
|
19.56
|
| Class
R6 (06/16) |
|
|
|
|
|
|
|
|
|
| 2019
|
23.83
|
0.29
|
(0.18)
|
0.11
|
|
(0.20)
|
(0.65)
|
(0.85)
|
23.09
|
| 2018
|
26.09
|
0.23
|
(2.22)
|
(1.99)
|
|
(0.17)
|
(0.10)
|
(0.27)
|
23.83
|
| 2017
|
21.71
|
0.21
|
4.84
|
5.05
|
|
(0.16)
|
(0.51)
|
(0.67)
|
26.09
|
| 2016(e)
|
21.08
|
0.07
|
0.56
|
0.63
|
|
—
|
—*
|
—*
|
21.71
|
| Class
I (08/94) |
|
|
|
|
|
|
|
|
|
| 2019
|
23.79
|
0.24
|
(0.18)
|
0.06
|
|
(0.20)
|
(0.65)
|
(0.85)
|
23.00
|
| 2018
|
26.09
|
0.19
|
(2.22)
|
(2.03)
|
|
(0.17)
|
(0.10)
|
(0.27)
|
23.79
|
| 2017
|
21.70
|
0.17
|
4.88
|
5.05
|
|
(0.15)
|
(0.51)
|
(0.66)
|
26.09
|
| 2016
|
20.63
|
0.19
|
1.24
|
1.43
|
|
(0.06)
|
(0.30)
|
(0.36)
|
21.70
|
| 2015
|
19.18
|
0.12
|
1.45
|
1.57
|
|
(0.12)
|
—
|
(0.12)
|
20.63
|
| |
|
|
|
|
|
|
| |
Ratios/Supplemental
Data |
| |
|
Ratios
to Average
Net Assets Before
Waiver/Reimbursement |
|
Ratios
to Average
Net Assets After
Waiver/Reimbursement(c) |
|
Total
Return(b) |
Ending
Net
Assets
(000) |
Expenses
|
Net
Investment
Income
(Loss) |
|
Expenses
|
Net
Investment
Income
(Loss) |
Portfolio
Turnover
Rate(d) |
| |
|
|
|
|
|
|
|
| 0.44%
|
$
213,819 |
1.28%
|
0.73%
|
|
1.20%
|
0.81%
|
31%
|
| (8.12)
|
291,122
|
1.24
|
0.43
|
|
1.20
|
0.47
|
35
|
| 23.06
|
326,495
|
1.26
|
0.43
|
|
1.22
|
0.46
|
29
|
| 6.85
|
167,840
|
1.34
|
0.65
|
|
1.30
|
0.68
|
40
|
| 7.95
|
48,656
|
1.40
|
0.32
|
|
1.39
|
0.34
|
49
|
| |
|
|
|
|
|
|
|
| (0.28)
|
45,920
|
2.03
|
(0.01)
|
|
1.95
|
0.07
|
31
|
| (8.80)
|
70,077
|
1.99
|
(0.32)
|
|
1.95
|
(0.28)
|
35
|
| 22.14
|
71,902
|
2.01
|
(0.33)
|
|
1.97
|
(0.29)
|
29
|
| 6.08
|
26,815
|
2.09
|
(0.11)
|
|
2.05
|
(0.08)
|
40
|
| 7.10
|
4,507
|
2.15
|
(0.44)
|
|
2.14
|
(0.42)
|
49
|
| |
|
|
|
|
|
|
|
| 0.21
|
37,296
|
1.53
|
0.48
|
|
1.45
|
0.56
|
31
|
| (8.34)
|
47,205
|
1.49
|
0.17
|
|
1.45
|
0.21
|
35
|
| 22.79
|
42,975
|
1.51
|
0.18
|
|
1.47
|
0.22
|
29
|
| 6.58
|
26,510
|
1.59
|
0.43
|
|
1.56
|
0.46
|
40
|
| 7.62
|
14,516
|
1.65
|
0.07
|
|
1.64
|
0.09
|
49
|
| |
|
|
|
|
|
|
|
| 0.90
|
133,071
|
0.83
|
1.18
|
|
0.75
|
1.26
|
31
|
| (7.73)
|
121,943
|
0.82
|
0.82
|
|
0.78
|
0.86
|
35
|
| 23.40
|
52,508
|
0.85
|
0.82
|
|
0.81
|
0.86
|
29
|
| 3.00
|
19,967
|
0.89**
|
0.85**
|
|
0.83**
|
0.91**
|
40
|
| |
|
|
|
|
|
|
|
| 0.69
|
1,228,912
|
1.03
|
0.99
|
|
0.95
|
1.06
|
31
|
| (7.88)
|
1,812,444
|
0.99
|
0.67
|
|
0.95
|
0.71
|
35
|
| 23.40
|
1,444,587
|
1.01
|
0.66
|
|
0.97
|
0.70
|
29
|
| 7.09
|
369,016
|
1.09
|
0.90
|
|
1.05
|
0.93
|
40
|
| 8.22
|
91,044
|
1.15
|
0.58
|
|
1.14
|
0.59
|
49
|
| (a)
|
Per share Net
Investment Income (Loss) is calculated using the average daily shares method. |
| (b)
|
Total
return is the combination of changes in NAV without any sales charge, reinvested dividend income at NAV and reinvested capital gains distributions at NAV, if any. Total returns are not annualized. |
| (c)
|
After fee
waiver and/or expense reimbursement from the Adviser, where applicable. See Note 7 – Management Fees and Other Transactions with Affiliates, Management Fees for more information. |
| (d)
|
Portfolio
Turnover Rate is calculated based on the lesser of long-term purchases or sales (as disclosed in Note 4 – Portfolio Securities and Investment in Derivatives, Investment Transactions) divided by the average long-term market value
during the period. |
| (e)
|
For the
period June 30, 2016 (commencement of operations) through October 31, 2016. |
| *
|
Rounds to
less than $(0.01). |
| **
|
Annualized
|
See accompanying notes to financial statements.
Notes to Financial Statements
1. General Information
Trust and Fund Information
Nuveen Investment Funds, Inc. (the “Trust”), is an
open-end management investment company registered under the Investment Company Act of 1940 (the "1940 Act"), as amended. The Trust is comprised of Nuveen Dividend Value Fund (“Dividend Value”), Nuveen Mid Cap Value Fund (“Mid Cap
Value”) and Nuveen Small Cap Value Fund (“Small Cap Value”), (each a “Fund” and collectively, the “Funds”), as diversified funds, among others. The Trust was incorporated in the State of Maryland on August
20, 1987.
The end of the reporting period for the Funds
is October 31, 2019, and the period covered by these Notes to Financial Statements is the fiscal year ended October 31, 2019 (the “current fiscal period”).
Investment Adviser
The Funds’ investment adviser is Nuveen Fund Advisors,
LLC (the “Adviser”), a subsidiary of Nuveen, LLC (“Nuveen”). Nuveen is the investment management arm of Teachers Insurance and Annuity Association of America (TIAA). The Adviser has overall responsibility for management of
the Funds, oversees the management of the Funds’ portfolios, manages the Funds’ business affairs and provides certain clerical, bookkeeping and other administrative services, and, if necessary, asset allocation decisions. The Adviser has
entered into sub-advisory agreements with Nuveen Asset Management, LLC (the "Sub-Adviser"), a subsidiary of the Adviser, under which the Sub-Adviser manages the investment portfolios of the Funds.
Share Classes and Sales Charges
Class A Shares are generally sold with an up-front sales charge
and incur a 0.25% annual 12b-1 service fee. Class A Share purchases of $1 million or more are sold at net asset value (“NAV”) without an up-front sales charge but may be subject to a contingent deferred sales charge (“CDSC”)
of 1% if redeemed within eighteen months of purchase. Class C Shares are sold without an up-front sales charge but incur a 0.75% annual 12b-1 distribution fee and a 0.25% annual 12b-1 service fee. Class C Shares are subject to a CDSC of 1% if
redeemed within twelve months of purchase. Class C Shares automatically convert to Class A Shares ten years after purchase. Class R3 Shares are sold without an up-front sales charge but incur a 0.25% annual 12b-1 distribution fee and a 0.25% annual
12b-1 service fee. Class R6 Shares and Class I Shares are not subject to any sales charge or 12b-1 distribution or service fees.
2. Significant Accounting Policies
The accompanying financial statements were prepared in
accordance with accounting principles generally accepted in the United States of America (“U.S. GAAP”), which may require the use of estimates made by management and the evaluation of subsequent events. Actual results may differ from
those estimates. Each Fund is an investment company and follows accounting guidance in the Financial Accounting Standards Board (“FASB”) Accounting Standards Codification 946, Financial Services—Investment Companies. The NAV for
financial reporting purposes may differ from the NAV for processing security and shareholder transactions. The NAV for financial reporting purposes includes security and shareholder transactions through the date of the report. Total return is
computed based on the NAV used for processing security and shareholder transactions. The following is a summary of the significant accounting policies consistently followed by the Funds.
Compensation
The Trust pays no compensation directly to those of its
directors who are affiliated with the Adviser or to its officers, all of whom receive remuneration for their services to the Trust from the Adviser or its affiliates. The Funds' Board of Directors (the "Board") has adopted a deferred compensation
plan for independent directors that enables directors to elect to defer receipt of all or a portion of the annual compensation they are entitled to receive from certain Nuveen-advised funds. Under the plan, deferred amounts are treated as though
equal dollar amounts had been invested in shares of select Nuveen-advised funds.
Distributions to Shareholders
Distributions to shareholders are recorded on the ex-dividend
date. The amount, character and timing of distributions are determined in accordance with federal income tax regulations, which may differ from U.S. GAAP.
Foreign currency transactions and translation
The books and records of the Funds are maintained in U.S.
dollars. Assets, including investments, and liabilities denominated in foreign currencies are translated into U.S. dollars at the end of each day. Purchases and sales of securities, income and expenses are translated into U.S. dollars at each
prevailing exchange rate on the respective dates of the transactions.
Net realized foreign currency gains and losses resulting from changes in
exchange rates associated with (i) foreign currency, (ii) investments and (iii) derivatives include foreign currency gains and losses between trade date and settlement date of the transactions, foreign currency transactions, and the difference
between the amounts of interest and dividends recorded on the books of the Funds and the amounts actually received are recognized as a component of "Net realized gain (loss) from investments and foreign currency" on the Statement of Operations, when
applicable.
The unrealized gains and losses resulting
from changes in foreign currency exchange rates and changes in foreign exchange rates associated with (i) investments and (ii) other assets and liabilities are recognized as a component of “Change in net unrealized appreciation (depreciation)
of investments and foreign currency” on the Statement of Operations, when applicable. The unrealized gains and losses resulting from changes in foreign exchange rates associated with investments in derivatives are recognized as a component of
the respective derivative’s related “Change in net unrealized appreciation (depreciation)” on the Statement of Operations, when applicable.
Indemnifications
Under the Trust’s organizational documents, its officers
and trustees are indemnified against certain liabilities arising out of the performance of their duties to the Trust. In addition, in the normal course of business, the Trust enters into contracts that provide general indemnifications to other
parties. The Trust's maximum exposure under these arrangements is unknown as this would involve future claims that may be made against the Trust that have not yet occurred. However, the Trust has not had prior claims or losses pursuant to these
contracts and expects the risk of loss to be remote.
Investments and Investment Income
Securities transactions are accounted for as of the trade date
for financial reporting purposes. Realized gains and losses on securities transactions are based upon the specific identification method. Dividend income is recorded on the ex-dividend date or, for foreign securities, when information is available.
Non-cash dividends received in the form of stock, if any, are recognized on the ex-dividend date and recorded at fair value. Interest income is recorded on an accrual basis. Securities lending income is comprised of fees earned from borrowers and
income earned on cash collateral investments.
Multiclass
Operations and Allocations
Income and expenses of the
Funds that are not directly attributable to a specific class of shares are prorated among the classes based on the relative net assets of each class. Expenses directly attributable to a class of shares are recorded to the specific class. Currently,
the only expenses that are allocated on a class-specific basis are 12b-1 distribution and service fees.
Sub-transfer agent fees and similar fees, which are recognized
as a component of “Shareholder servicing agent fees” on the Statement of Operations, are not charged to Class R6 Shares and are prorated among the other classes based on their relative net assets.
Realized and unrealized capital gains and losses of the Funds
are prorated among the classes based on the relative net assets of each class.
Netting Agreements
In the ordinary course of business, the Funds may enter into
transactions subject to enforceable master repurchase agreements, International Swaps and Derivative Association, Inc. (ISDA) master agreements or other similar arrangements (“netting agreements”). Generally, the right to offset in
netting agreements allows each Fund to offset certain securities and derivatives with a specific counterparty, when applicable, as well as any collateral received or delivered to that counterparty based on the terms of the agreements. Generally,
each Fund manages its cash collateral and securities collateral on a counterparty basis.
The Funds' investments subject to netting agreements as of the
end of the reporting period, if any, are further described in Note 4 – Portfolio Securities and Investments in Derivatives.
New Accounting Pronouncements and Rule Issuances
Fair Value Measurement: Disclosure Framework
During August 2018, the FASB issued Accounting Standards Update
("ASU") 2018-13 (“ASU 2018-13”), Fair Value Measurement: Disclosure Framework – Changes to the Disclosure Requirements for Fair Value Measurements. ASU 2018-13 modifies the
disclosures required by Topic 820, Fair Value Measurements. The amendments in ASU 2018-13 are effective for all entities for fiscal years, and interim periods within those fiscal years, beginning after
December 15, 2019. Management has early implemented this guidance and it did not have a material impact on the Funds' financial statements.
3. Investment Valuation and Fair Value
Measurements
The fair valuation input levels as described
below are for fair value measurement purposes.
The Funds'
investments in securities are recorded at their estimated fair value. Fair value is defined as the price that would be received upon selling an investment or transferring a liability in an orderly transaction to an independent buyer in the principal
or most advantageous market for the investment. A three-tier hierarchy is used to maximize the use of observable market data and minimize the use of unobservable inputs and to establish classification of fair value measurements for disclosure
purposes. Observable inputs reflect the assumptions market participants would use in pricing the asset or liability. Observable inputs are based on market data obtained from sources independent of the reporting entity. Unobservable inputs reflect
the report-
Notes to Financial Statements (continued)
ing entity’s own assumptions about the assumptions market participants
would use in pricing the asset or liability. Unobservable inputs are based on the best information available in the circumstances. The following is a summary of the three-tiered hierarchy of valuation input levels.
Level 1
– Inputs are unadjusted and prices are determined using quoted prices in active markets for identical securities.
Level 2
– Prices are determined using other significant observable inputs (including quoted prices for similar securities, interest rates, credit spreads, etc.).
Level 3
– Prices are determined using significant unobservable inputs (including management’s assumptions in determining the fair value of investments).
Common stocks and other equity-type securities are valued at
the last sales price on the securities exchange on which such securities are primarily traded and are generally classified as Level 1. Securities primarily traded on the Nasdaq National Market (“Nasdaq”) are valued at the Nasdaq Official
Closing Price and are generally classified as Level 1. However, securities traded on a securities exchange or Nasdaq for which there were no transactions on a given day or securities not listed on a securities exchange or Nasdaq are valued at the
quoted bid price and are generally classified as Level 2. Prices of certain American Depositary Receipts (“ADR”) held by the Funds that trade in the United States are valued based on the last traded price, official closing price or the
most recent bid price of the underlying non-U.S.-traded stock, adjusted as appropriate for the underlying-to-ADR conversion ratio and foreign exchange rate, and from time-to-time may also be adjusted further to take into account material events that
may take place after the close of the local non-U.S. market but before the close of the New York Stock Exchange (“NYSE”), which may represent a transfer from a Level 1 to a Level 2 security.
Investments in investment companies are valued at their
respective NAVs on the valuation date and are generally classified as Level 1.
Investments initially valued in currencies other than the U.S.
dollar are converted to the U.S. dollar using exchange rates obtained from independent pricing services (“pricing service”). As a result, the NAV of the Fund's shares may be affected by changes in the value of currencies in relation to
the U.S. dollar. The value of securities traded in markets outside the United States or denominated in currencies other than the U.S. dollar may be affected significantly on a day that the NYSE is closed and an investor is not able to purchase,
redeem or exchange shares. If significant market events occur between the time of determination of the closing price of a foreign security on an exchange and the time that the Fund's NAV is determined, or if under the Fund's procedures, the closing
price of a foreign security is not deemed to be reliable, the security would be valued at fair value as determined in accordance with procedures established in good faith by the Board. These securities are generally classified as Level 2 or Level 3
depending on the observability of the significant inputs.
Certain securities may not be able to be priced by the
pre-established pricing methods as described above. Such securities may be valued by the Board and/or its appointee at fair value. These securities generally include, but are not limited to, restricted securities (securities which may not be
publicly sold without registration under the Securities Act of 1933, as amended) for which a pricing service is unable to provide a market price; securities whose trading has been formally suspended; debt securities that have gone into default and
for which there is no current market quotation; a security whose market price is not available from a pre-established pricing source; a security with respect to which an event has occurred that is likely to materially affect the value of the
security after the market has closed but before the calculation of a Fund’s NAV (as may be the case in non-U.S. markets on which the security is primarily traded) or make it difficult or impossible to obtain a reliable market quotation; and a
security whose price, as provided by the pricing service, is not deemed to reflect the security’s fair value. As a general principle, the fair value of a security would appear to be the amount that the owner might reasonably expect to receive
for it in a current sale. A variety of factors may be considered in determining the fair value of such securities, which may include consideration of the following: yields or prices of investments of comparable quality, type of issue, coupon,
maturity and rating, market quotes or indications of value from security dealers, evaluations of anticipated cash flows or collateral, general market conditions and other information and analysis, including the obligor’s credit characteristics
considered relevant. These securities are generally classified as Level 2 or Level 3 depending on the observability of the significant inputs. Regardless of the method employed to value a particular security, all valuations are subject to review by
the Board and/or its appointee.
The inputs or
methodologies used for valuing securities are not an indication of the risks associated with investing in those securities. The following is a summary of each Fund’s fair value measurements as of the end of the reporting period:
| Dividend
Value |
Level
1 |
Level
2 |
Level
3 |
Total
|
| Long-Term
Investments*: |
|
|
|
|
| Common
Stocks |
$973,636,754
|
$ —
|
$ —
|
$973,636,754
|
| Investments
Purchased with Collateral from Securities Lending |
3,758,147
|
—
|
—
|
3,758,147
|
| Short-Term
Investments: |
|
|
|
|
| Money
Market Funds |
12,555,067
|
—
|
—
|
12,555,067
|
| Total
|
$989,949,968
|
$ —
|
$ —
|
$989,949,968
|
| Mid
Cap Value |
Level
1 |
Level
2 |
Level
3 |
Total
|
| Long-Term
Investments*: |
|
|
|
|
| Common
Stocks |
$339,513,081
|
$ —
|
$ —
|
$339,513,081
|
| Short-Term
Investments: |
|
|
|
|
| Money
Market Funds |
5,251,171
|
—
|
—
|
5,251,171
|
| Total
|
$344,764,252
|
$ —
|
$ —
|
$344,764,252
|
| Small
Cap Value |
Level
1 |
Level
2 |
Level
3 |
Total
|
| Long-Term
Investments*: |
|
|
|
|
| Common
Stocks |
$1,650,924,177
|
$ —
|
$ —
|
$1,650,924,177
|
| Investments
Purchased with Collateral from Securities Lending |
5,652,479
|
—
|
—
|
5,652,479
|
| Short-Term
Investments: |
|
|
|
|
| Money
Market Funds |
17,886,097
|
—
|
—
|
17,886,097
|
| Total
|
$1,674,462,753
|
$ —
|
$ —
|
$1,674,462,753
|
| *
|
Refer
to the Fund's Portfolio of Investments for industry classifications. |
4. Portfolio Securities and Investments in
Derivatives
Securities Lending
In order to generate additional income, the Funds may lend
securities representing up to one-third of the value of its total assets (which includes collateral for securities on loan) to broker-dealers, banks or other institutions. When loaning securities, each Fund retains the benefits of owning the
securities, including the economic equivalent of dividends or interest generated by the security. The Funds also have the ability to recall the securities on loan at any time.
Each Fund’s policy is to receive, at the inception of a
loan, cash collateral equal to at least 102% of the value of securities loaned, which is recognized as “Payable for collateral from securities lending program” on the Statement of Assets and Liabilities. Collateral for securities on loan
is invested in a money market fund, which is recognized as “Investments purchased with collateral from securities lending, at value” on the Statement of Assets and Liabilities. The market value of the securities loaned is determined at
the close of each business day in order to determine the adequacy of the collateral. If the value of the securities on loan increases such that the level of collateralization falls below 100%, additional collateral is received from the borrower on
the next business day, which is recognized as “Due from broker” on the Statement of Assets and Liabilities.
Securities out on loan are subject to termination at any time
at the option of the borrower or the Fund. Upon termination, the borrower is required to return to the Fund securities identical to the securities loaned. Generally, in the event the borrower defaults on its obligation to return the loaned
securities, the Fund has the right to use the collateral to acquire identical securities. In the event the Fund is delayed or prevented from exercising its right to dispose of the collateral, there may be a loss to the Fund. Under the Funds’
securities lending agreement, however, the securities lending agent has indemnified the Fund against losses resulting from borrower default, except to the extent that those losses result from a decrease in the value of the collateral due to its
investment by the Funds. The Funds bear the risk of loss with respect to the investment of collateral.
The Funds’ custodian, U.S. Bank National Association,
serves as their securities lending agent. Income earned from the securities lending program is paid to the Funds. Income from securities lending, is recognized as “Securities lending income” on the Statement of Operations.
The following table presents the securities out on loan for the
following Funds, and the collateral delivered related to those securities, as of the end of the reporting period.
| Fund
|
Asset
Class out on Loan |
Long-Term
Investments, at Value |
Collateral
Pledged (From)
Counterparty* |
Net
Exposure |
| Dividend
Value |
Common
Stocks |
$3,666,905
|
$(3,666,905)
|
$ –
|
| Small
Cap Value |
Common
Stocks |
5,365,517
|
(5,365,517)
|
–
|
* As of the end of the reporting
period, the value of the collateral pledged from the counterparty exceeded the value of the securities out on loan. Refer to the Fund’s Portfolio of Investments for details on the securities out on loan.
Investment Transactions
Long-term purchases and sales (excluding investments purchased
with collateral from securities lending, where applicable) during the current fiscal period were as follows:
Notes to Financial Statements (continued)
| |
Dividend
Value |
Mid
Cap
Value |
Small
Cap
Value |
| Purchases
|
$
988,113,690 |
$245,907,344
|
$
588,324,573 |
| Sales
|
1,192,839,736
|
140,801,029
|
1,232,885,554
|
Investments purchased on a
when-issued/delayed delivery basis may have extended settlement periods. Any investments so purchased are subject to market fluctuation during this period. The Funds have earmarked securities in their portfolios with a current value at least equal
to the amount of the when-issued/delayed delivery purchase commitments.
As of the end of the reporting period, the Funds did not have
any outstanding when-issued/delayed delivery purchase commitments.
Investments in Derivatives
Each Fund is authorized to invest in certain derivative
instruments. The Funds record derivative instruments at fair value, with changes in fair value recognized on the Statement of Operations, when applicable. Even though the Funds’ investments in derivatives may represent economic hedges, they
are not considered to be hedge transactions for financial reporting purposes.
Although the Funds are authorized to invest in derivative
instruments, and may do so in the future, they did not make any such investments during the current fiscal period.
Market and Counterparty Credit Risk
In the normal course of business each Fund may invest in
financial instruments and enter into financial transactions where risk of potential loss exists due to changes in the market (market risk) or failure of the other party to the transaction to perform (counterparty credit risk). The potential loss
could exceed the value of the financial assets recorded on the financial statements. Financial assets, which potentially expose each Fund to counterparty credit risk, consist principally of cash due from counterparties on forward, option and swap
transactions, when applicable. The extent of each Fund’s exposure to counterparty credit risk in respect to these financial assets approximates their carrying value as recorded on the Statement of Assets and Liabilities.
Each Fund helps manage counterparty credit risk by entering
into agreements only with counterparties the Adviser believes have the financial resources to honor their obligations and by having the Adviser monitor the financial stability of the counterparties. Additionally, counterparties may be required to
pledge collateral daily (based on the daily valuation of the financial asset) on behalf of each Fund with a value approximately equal to the amount of any unrealized gain above a pre-determined threshold. Reciprocally, when each Fund has an
unrealized loss, the Funds have instructed the custodian to pledge assets of the Funds as collateral with a value approximately equal to the amount of the unrealized loss above a pre-determined threshold. Collateral pledges are monitored and
subsequently adjusted if and when the valuations fluctuate, either up or down, by at least the pre-determined threshold amount.
5. Fund Shares
On December 12, 2018, Class T Shares were liquidated.
Transactions in Fund shares during the current and prior fiscal
period were as follows:
| |
Year
Ended
10/31/19 |
|
Year
Ended
10/31/18 |
| Dividend
Value |
Shares
|
Amount
|
|
Shares
|
Amount
|
| Shares
sold: |
|
|
|
|
|
| Class
A |
1,677,446
|
$
22,337,847 |
|
5,789,126
|
$
86,271,698 |
| Class
A – automatic conversion of Class C Shares |
73
|
957
|
|
29,018
|
427,811
|
| Class
C |
282,093
|
3,628,341
|
|
253,170
|
3,702,096
|
| Class
R3 |
94,117
|
1,238,755
|
|
155,234
|
2,316,358
|
| Class
R6 |
1,213,050
|
16,346,121
|
|
794,027
|
12,158,135
|
| Class
I |
10,166,912
|
138,148,309
|
|
14,229,038
|
218,148,622
|
| Shares
issued to shareholders due to reinvestment of distributions: |
|
|
|
|
|
| Class
A |
1,576,032
|
19,941,966
|
|
2,163,746
|
31,854,985
|
| Class
C |
190,846
|
2,353,410
|
|
288,294
|
4,159,311
|
| Class
R3 |
183,244
|
2,302,765
|
|
246,914
|
3,617,734
|
| Class
R6 |
1,204,312
|
15,528,414
|
|
1,569,413
|
23,552,126
|
| Class
I |
3,866,297
|
49,758,561
|
|
3,579,638
|
53,446,131
|
| |
20,454,422
|
271,585,446
|
|
29,097,618
|
439,655,007
|
| Shares
redeemed: |
|
|
|
|
|
| Class
A |
(6,531,277)
|
(90,310,449)
|
|
(6,701,785)
|
(100,566,373)
|
| Class
C |
(1,029,242)
|
(13,485,277)
|
|
(883,400)
|
(13,014,741)
|
| Class
C – automatic conversion to Class A Shares |
(75)
|
(957)
|
|
(29,560)
|
(427,811)
|
| Class
R3 |
(603,862)
|
(8,169,371)
|
|
(599,099)
|
(9,023,109)
|
| Class
R6 |
(10,573,604)
|
(150,778,977)
|
|
(2,395,873)
|
(36,553,415)
|
| Class
I |
(10,684,542)
|
(144,825,589)
|
|
(10,671,696)
|
(163,085,139)
|
| Class
T(1) |
(1,667)
|
(23,783)
|
|
—
|
—
|
| |
(29,424,269)
|
(407,594,403)
|
|
(21,281,413)
|
(322,670,588)
|
| Net
increase (decrease) |
(8,969,847)
|
$(136,008,957)
|
|
7,816,205
|
$
116,984,419 |
| (1)
|
Class T
Shares were not available for public offering. |
| |
Year
Ended
10/31/19 |
|
Year
Ended
10/31/18 |
| Mid
Cap Value |
Shares
|
Amount
|
|
Shares
|
Amount
|
| Shares
sold: |
|
|
|
|
|
| Class
A |
497,321
|
$
18,815,351 |
|
504,154
|
$
21,150,656 |
| Class
A – automatic conversion of Class C Shares |
355
|
13,927
|
|
3,862
|
162,100
|
| Class
C |
59,705
|
2,084,825
|
|
131,905
|
5,251,382
|
| Class
R3 |
87,365
|
3,251,223
|
|
111,702
|
4,715,378
|
| Class
R6 |
523,102
|
20,076,145
|
|
24,807
|
1,070,916
|
| Class
I |
4,015,539
|
150,898,037
|
|
2,648,894
|
112,405,038
|
| Shares
issued to shareholders due to reinvestment of distributions: |
|
|
|
|
|
| Class
A |
57,804
|
2,013,596
|
|
73,053
|
2,956,152
|
| Class
C |
8,113
|
266,263
|
|
14,507
|
553,571
|
| Class
R3 |
8,859
|
305,976
|
|
9,739
|
390,060
|
| Class
R6 |
4,274
|
149,193
|
|
—
|
—
|
| Class
I |
181,850
|
6,347,513
|
|
64,012
|
2,601,397
|
| |
5,444,287
|
204,222,049
|
|
3,586,635
|
151,256,650
|
| Shares
redeemed: |
|
|
|
|
|
| Class
A |
(520,883)
|
(20,059,388)
|
|
(217,896)
|
(9,165,758)
|
| Class
C |
(56,974)
|
(2,072,802)
|
|
(140,592)
|
(5,586,483)
|
| Class
C – automatic conversion to Class A Shares |
(378)
|
(13,927)
|
|
(4,081)
|
(162,100)
|
| Class
R3 |
(43,711)
|
(1,650,505)
|
|
(48,404)
|
(2,017,859)
|
| Class
R6 |
(80,400)
|
(3,177,406)
|
|
(308)
|
(13,342)
|
| Class
I |
(1,695,877)
|
(65,908,036)
|
|
(484,850)
|
(20,259,099)
|
| |
(2,398,223)
|
(92,882,064)
|
|
(896,131)
|
(37,204,641)
|
| Net
increase (decrease) |
3,046,064
|
$111,339,985
|
|
2,690,504
|
$114,052,009
|
Notes to Financial Statements (continued)
| |
Year
Ended
10/31/19 |
|
Year
Ended
10/31/18 |
| Small
Cap Value |
Shares
|
Amount
|
|
Shares
|
Amount
|
| Shares
sold: |
|
|
|
|
|
| Class
A |
2,967,618
|
$
64,293,133 |
|
5,230,243
|
$
134,186,274 |
| Class
A – automatic conversion of Class C Shares |
13
|
286
|
|
35
|
911
|
| Class
C |
288,301
|
5,290,745
|
|
1,117,851
|
24,391,147
|
| Class
R3 |
362,916
|
7,727,713
|
|
1,165,064
|
29,195,083
|
| Class
R6 |
3,301,739
|
75,508,622
|
|
4,035,887
|
108,067,191
|
| Class
I |
25,415,266
|
572,950,449
|
|
43,274,349
|
1,149,612,147
|
| Shares
issued to shareholders due to reinvestment of distributions: |
|
|
|
|
|
| Class
A |
369,605
|
7,401,118
|
|
81,794
|
2,113,652
|
| Class
C |
119,856
|
2,024,376
|
|
14,332
|
312,864
|
| Class
R3 |
69,740
|
1,366,231
|
|
8,226
|
207,560
|
| Class
R6 |
193,478
|
4,015,160
|
|
22,803
|
610,196
|
| Class
I |
2,270,710
|
47,047,218
|
|
468,758
|
12,542,978
|
| |
35,359,242
|
787,625,051
|
|
55,419,342
|
1,461,240,003
|
| Shares
redeemed: |
|
|
|
|
|
| Class
A |
(6,381,541)
|
(139,034,945)
|
|
(5,595,699)
|
(143,396,780)
|
| Class
C |
(1,555,408)
|
(28,497,743)
|
|
(884,376)
|
(19,196,642)
|
| Class
C – automatic conversion to Class A Shares |
(15)
|
(286)
|
|
(41)
|
(911)
|
| Class
R3 |
(816,795)
|
(17,524,715)
|
|
(814,893)
|
(20,471,841)
|
| Class
R6 |
(2,849,621)
|
(64,694,141)
|
|
(953,783)
|
(25,396,792)
|
| Class
I |
(50,448,584)
|
(1,136,613,380)
|
|
(22,927,932)
|
(605,533,439)
|
| Class
T(1) |
(1,036)
|
(23,331)
|
|
—
|
—
|
| |
(62,053,000)
|
(1,386,388,541)
|
|
(31,176,724)
|
(813,996,405)
|
| Net
increase (decrease) |
(26,693,758)
|
$
(598,763,490) |
|
24,242,618
|
$
647,243,598 |
| (1)
|
Class T
Shares were not available for public offering. |
6. Income Tax Information
Each Fund is a separate taxpayer for federal income tax
purposes. Each Fund intends to distribute substantially all of its net investment income and net capital gains to shareholders and to otherwise comply with the requirements of Subchapter M of the Internal Revenue Code applicable to regulated
investment companies. Therefore, no federal income tax provision is required.
For all open tax years and all major taxing jurisdictions,
management of the Funds has concluded that there are no significant uncertain tax positions that would require recognition in the financial statements. Open tax years are those that are open for examination by taxing authorities (i.e., generally the
last four tax year ends and the interim tax period since then). Furthermore, management of the Funds is also not aware of any tax positions for which it is reasonably possible that the total amounts of unrecognized tax benefits will significantly
change in the next twelve months.
The following
information is presented on an income tax basis. Differences between amounts for financial statement and federal income tax purposes are primarily due to timing differences in recognizing certain gains and losses on investment transactions. To the
extent that differences arise that are permanent in nature, such amounts are reclassified within the capital accounts as detailed below. Temporary differences do not require reclassification. Temporary and permanent differences do not impact the
NAVs of the Funds.
The table below presents the cost and
unrealized appreciation (depreciation) of each Fund’s investment portfolio, as determined on a federal income tax basis, as of October 31, 2019.
| |
Dividend
Value |
Mid
Cap
Value |
Small
Cap
Value |
| Tax
cost of investments |
$827,789,480
|
$308,548,472
|
$1,638,013,365
|
| Gross
unrealized: |
|
|
|
| Appreciation
|
$169,005,408
|
$
43,766,449 |
$
190,350,208 |
| Depreciation
|
(6,844,920)
|
(7,550,669)
|
(153,900,820)
|
| Net
unrealized appreciation (depreciation) of investments |
$162,160,488
|
$
36,215,780 |
$
36,449,388 |
Permanent differences, primarily due to federal taxes paid and
tax equalization, resulted in reclassifications among the Funds’ components of net assets as of October 31, 2019, the Funds’ tax year end.
The tax components of undistributed net ordinary income and net
long-term capital gains as of October 31, 2019, the Funds' tax year end, were as follows:
| |
Dividend
Value |
Mid
Cap
Value |
Small
Cap
Value |
| Undistributed
net ordinary income1 |
$
3,019,511 |
$3,801,327
|
$11,967,251
|
| Undistributed
net long-term capital gains |
115,850,017
|
—
|
—
|
|
1 |
Net ordinary
income consists of net taxable income derived from dividends, interest, and net short-term capital gains, if any. |
The tax character of distributions paid during the
Funds’ tax years ended October 31, 2019 and October 31, 2018 was designated for purposes of the dividends paid deduction as follows:
| 2019
|
Dividend
Value |
Mid
Cap
Value |
Small
Cap
Value |
| Distributions
from net ordinary income1 |
$23,543,456
|
$1,112,194
|
$25,173,480
|
| Distributions
from net long-term capital gains |
78,600,703
|
9,028,087
|
51,926,594
|
| 2018
|
Dividend
Value |
Mid
Cap
Value |
Small
Cap
Value |
| Distributions
from net ordinary income1 |
$43,461,880
|
$1,864,112
|
$12,080,019
|
| Distributions
from net long-term capital gains |
96,856,071
|
6,796,931
|
7,927,154
|
|
1 |
Net
ordinary income consists of net taxable income derived from dividends, interest, and net short-term capital gains, if any. |
As of October 31, 2019, the Funds’ tax year end, the
following Funds had unused capital losses carrying forward available for federal income tax purposes to be applied against future capital gains, if any. The capital losses are not subject to expiration.
| |
Mid
Cap
Value |
Small
Cap
Value |
| Not
subject to expiration: |
|
|
| Short-term
|
$4,728,314
|
$
79,696,445 |
| Long-term
|
—
|
103,933,776
|
| Total
|
$4,728,314
|
$183,630,221
|
7. Management Fees and
Other Transactions with Affiliates
Management Fees
Each Fund’s management fee compensates the Adviser for
the overall investment advisory and administrative services and general office facilities. The Sub-Adviser is compensated for its services to the Funds from the management fees paid to the Adviser.
Each Fund’s management fee consists of two components
– a fund-level fee, based only on the amount of assets within each individual Fund, and a complex-level fee, based on the aggregate amount of all eligible fund assets managed by the Adviser. This pricing structure enables each
Fund’s shareholders to benefit from growth in the assets within their respective Fund as well as from growth in the amount of complex-wide assets managed by the Adviser.
The annual fund-level fee, payable monthly, for each Fund is
calculated according to the following schedule:
| Average
Daily Net Assets |
Dividend
Value |
Mid
Cap
Value |
Small
Cap
Value |
| For
the first $125 million |
0.5000%
|
0.6000%
|
0.6500%
|
| For
the next $125 million |
0.4875
|
0.5875
|
0.6375
|
| For
the next $250 million |
0.4750
|
0.5750
|
0.6250
|
| For
the next $500 million |
0.4625
|
0.5625
|
0.6125
|
| For
the next $1 billion |
0.4500
|
0.5500
|
0.6000
|
| For
the next $3 billion |
0.4250
|
0.5250
|
0.5750
|
| For
the next $2.5 billion |
0.4000
|
0.5000
|
0.5500
|
| For
the next $2.5 billion |
0.3875
|
0.4875
|
0.5375
|
| For
net assets over $10 billion |
0.3750
|
0.4750
|
0.5250
|
Notes to Financial Statements (continued)
The annual complex-level fee, payable monthly, for each Fund is determined by
taking the complex-level free rate, which is based on the aggregate amount of “eligible assets” of all Nuveen funds as set forth in the schedule below, and making, as appropriate, an upward adjustment to that rate based upon the
percentage of the particular fund’s assets that are not “eligible assets”. The complex-level fee schedule for each Fund is as follows:
| Complex-Level
Eligible Asset Breakpoint Level* |
Effective
Complex-Level Fee Rate at Breakpoint Level |
| $55
billion |
0.2000%
|
| $56
billion |
0.1996
|
| $57
billion |
0.1989
|
| $60
billion |
0.1961
|
| $63
billion |
0.1931
|
| $66
billion |
0.1900
|
| $71
billion |
0.1851
|
| $76
billion |
0.1806
|
| $80
billion |
0.1773
|
| $91
billion |
0.1691
|
| $125
billion |
0.1599
|
| $200
billion |
0.1505
|
| $250
billion |
0.1469
|
| $300
billion |
0.1445
|
*
The complex-level fee is calculated based upon the aggregate daily “eligible assets” of all Nuveen open-end and closed-end funds. Eligible assets do not include assets attributable to investments in other Nuveen funds or
assets in excess of a determined amount (originally $2 billion) added to the Nuveen fund complex in connection with the Adviser’s assumption of the management of the former First American Funds effective January 1, 2011, but do include certain
assets of certain Nuveen funds that were reorganized into funds advised by an affiliate of the Adviser during the 2019 calendar year. Eligible assets include closed-end fund assets managed by the Adviser that are attributable to certain types of
leverage. For these purposes, leverage includes the closed-end funds’ use of preferred stock and borrowings and certain investments in the residual interest certificates (also called inverse floating rate securities) in tender option bond
(TOB) trusts, including the portion of assets held by the TOB trust that has been effectively financed by the trust’s issuance of floating rate securities, subject to an agreement by the Adviser as to certain funds to limit the amount of such
assets for determining eligible assets in certain circumstances. As of October 31, 2019, the complex-level fee rate for each Fund was as follows:
| Fund
|
Complex-Level
Fee |
| Dividend
Value |
0.2000%
|
| Mid
Cap Value |
0.1945%
|
| Small
Cap Value |
0.1591%
|
The Adviser has agreed to waive
fees and/or reimburse expenses (“Expense Cap”) of the following Funds so that total annual Fund operating expenses (excluding 12b-1 distribution and/or service fees, interest expenses, taxes, acquired fund fees and expenses, fees
incurred in acquiring and disposing of portfolio securities and extraordinary expenses) do not exceed the percentages of the average daily net assets of any class of Fund shares in the amounts and for the time period stated in the following table.
However, because Class R6 Shares are not subject to sub-transfer agent and similar fees, the total annual Fund operating expense for the Class R6 Shares will be less than the expense limitation. The expense limitation in effect thereafter may be
terminated or modified only with the approval of shareholders of the Board.
| Fund
|
Expense
Cap |
Expense
Cap
Expiration Date |
| Mid
Cap Value |
0.92%
|
July
31, 2021 |
| Small
Cap Value |
0.99
|
July
31, 2021 |
Other Transactions with
Affiliates
During the current fiscal period, Nuveen
Securities, LLC, (the “Distributor”), a wholly-owned subsidiary of Nuveen, collected sales charges on purchases of Class A Shares, the majority of which were paid out as concessions to financial intermediaries as follows:
| |
Dividend
Value |
Mid
Cap
Value |
Small
Cap
Value |
| Sales
charges collected (Unaudited) |
$104,655
|
$59,817
|
$149,692
|
| Paid
to financial intermediaries (Unaudited) |
93,574
|
53,378
|
132,815
|
The Distributor also received 12b-1 service fees on Class A Shares,
substantially all of which were paid to compensate financial intermediaries for providing services to shareholders relating to their investments.
During the current fiscal period, the Distributor compensated
financial intermediaries directly with commission advances at the time of purchase as follows:
| |
Dividend
Value |
Mid
Cap
Value |
Small
Cap
Value |
| Commission
advances (Unaudited) |
$32,351
|
$22,352
|
$54,324
|
To compensate for commissions
advanced to financial intermediaries, all 12b-1 service and distribution fees collected on Class C Shares during the first year following a purchase are retained by the Distributor. During the current fiscal period, the Distributor retained such
12b-1 fees as follows:
| |
Dividend
Value |
Mid
Cap
Value |
Small
Cap
Value |
| 12b-1
fees retained (Unaudited) |
$17,875
|
$32,816
|
$92,740
|
The remaining 12b-1 fees charged to
each Fund were paid to compensate financial intermediaries for providing services to shareholders relating to their investments.
The Distributor also collected and retained CDSC on share
redemptions during the current fiscal period, as follows:
| |
Dividend
Value |
Mid
Cap
Value |
Small
Cap
Value |
| CDSC
retained (Unaudited) |
$3,451
|
$2,135
|
$25,207
|
8. Borrowing
Arrangements
Committed Line of Credit
The Funds, along with certain other funds managed by the
Adviser (“Participating Funds”), have established a 364-day, $2.65 billion standby credit facility with a group of lenders, under which the Participating Funds may borrow for various purposes other than leveraging for investment
purposes. Each Participating Fund is allocated a designated proportion of the facility’s capacity (and its associated costs, as described below) based upon a multi-factor assessment of the likelihood and frequency of its need to draw on the
facility, the size of the Fund and its anticipated draws, and the potential importance of such draws to the operations and well-being of the Fund, relative to those of the other Funds. A Fund may effect draws on the facility in excess of its
designated capacity if and to the extent that other Participating Funds have undrawn capacity. The credit facility expires in June 2020 unless extended or renewed.
The credit facility has the following terms: a fee of 0.15% per
annum on unused commitment amounts, and interest at a rate equal to the higher of (a) one-month LIBOR (London Inter-Bank Offered Rate) plus 1.00% per annum or (b) the Fed Funds rate plus 1.00% per annum on amounts borrowed. Participating Funds paid
administration, legal and arrangement fees, which are recognized as a component of “other expenses” on the Statement of Operations, and along with commitment fees, have been allocated among such Participating Funds based upon the
relative proportions of the facility’s aggregate capacity reserved for them and other factors deemed relevant by the Adviser and the Board of each Participating Fund.
During the current fiscal period, the following Funds utilized
the facility. Each Fund's maximum outstanding balance during the utilization period was as follows:
| |
Dividend
Value |
Small
Cap
Value |
| Maximum
outstanding balance |
$1,828,444
|
$5,500,000
|
During each Fund's utilization
periods during the current fiscal period, the average daily balance outstanding and average annual interest rate on the Borrowings were as follows:
| |
Dividend
Value |
Small
Cap
Value |
| Utilization
period (days outstanding) |
2
|
4
|
| Average
daily balance outstanding |
$1,828,444
|
$5,400,000
|
| Average
annual interest rate |
3.50%
|
3.41%
|
Additional Fund Information
(Unaudited)
Fund Manager
Nuveen Fund Advisors, LLC
333 West Wacker Drive
Chicago, IL 60606
Sub-Adviser
Nuveen Asset Management, LLC
333 West Wacker Drive
Chicago, IL 60606
Independent Registered
Public Accounting Firm
PricewaterhouseCoopers LLP
One North Wacker Drive
Chicago, IL 60606
Custodian
U.S. Bank National Association
1555 North RiverCenter Drive
Suite 302
Milwaukee, WI 53212
Legal Counsel
Chapman and Cutler LLP
Chicago, IL 60603
Transfer Agent and
Shareholder Services
DST Asset Manager
Solutions, Inc. (DST)
P.O. Box 219140
Kansas City, MO 64121-9140
(800) 257-8787
Long-Term Capital Gain Distributions: The Funds hereby designate as long-term capital gain dividends, pursuant to Internal Revenue Code Section 852(b)(3), the amount shown in the accompanying table or, if greater, the amount necessary to reduce earnings and
profits of the Funds related to net capital gain to zero for the tax year ended October 31, 2019:
| |
Dividend
Value |
Mid
Cap
Value |
Small
Cap
Value |
| Long-term
capital gain dividends |
$98,381,447
|
$9,028,087
|
$51,926,594
|
Distribution Information: The Funds hereby designate their percentages of dividends paid from net ordinary income as dividends qualifying for the dividends received deduction (“DRD”) for corporations and their percentage as qualified
dividend income (“QDI”) for individuals under Section 1(h)(11) of the Internal Revenue Code as shown in the accompanying table. The actual qualified dividend income distributions will be reported to shareholders on Form 1099-DIV which
will be sent to shareholders shortly after calendar year end.
| |
Dividend
Value |
Mid
Cap
Value |
Small
Cap
Value |
| %
of DRD |
100.0%
|
100.0%
|
100.0%
|
| %
of QDI |
100.0%
|
100.0%
|
100.0%
|
Portfolio of Investments
Information: Each Fund is required to file its complete schedule of portfolio holdings with the Securities and Exchange Commission (SEC) for the first and third quarters of each fiscal year as an exhibit to its
report on Form N-PORT. You may obtain this information on the SEC's website at http://www.sec.gov.
Nuveen Funds’ Proxy Voting Information: You may obtain (i) information regarding how each fund voted proxies relating to portfolio securities held during the most recent twelve-month period ended June 30, without charge, upon request, by calling Nuveen
toll-free at (800) 257-8787 or on Nuveen’s website at www.nuveen.com and (ii) a description of the policies and procedures that each fund used to determine how to vote proxies relating to portfolio securities without charge, upon request, by
calling Nuveen toll-free at (800) 257-8787. You may also obtain this information directly from the SEC. Visit the SEC on-line at http://www.sec.gov.
FINRA BrokerCheck:
The Financial Industry Regulatory Authority (FINRA) provides information regarding the disciplinary history of FINRA member firms and associated investment professionals. This information as well as an investor brochure describing FINRA BrokerCheck
is available to the public by calling the FINRA BrokerCheck Hotline number at (800) 289-9999 or by visiting www.FINRA.org.
Glossary of Terms Used in this Report
(Unaudited)
Average
Annual Total Return: This is a commonly used method to express an investment’s performance over a particular, usually multi-year time period. It expresses the return that would have been necessary each year to
equal the investment’s actual cumulative performance (including change in NAV or offer price and reinvested distributions and capital gains, if any) over the time period being considered.
Dow Jones Industrial Average Index: A price-weighted index of the 30 largest, most widely held stocks traded on the New York Stock Exchange. The index returns assume reinvestment of distributions, but do not reflect any applicable sales charges or
management fees.
Gross Domestic Product (GDP): The total market value of all final goods and services produced in a country/region in a given year, equal to total consumer, investment and government spending, plus the value of exports, minus the value of
imports.
Lipper Equity Income Funds Classification
Average: Represents the average annualized total return for all reporting funds in the Lipper Equity Income Funds Classification. Lipper returns account for the effects of management fees and assume reinvestment of
distributions but do not reflect any applicable sales charges.
Lipper Mid-Cap Value Funds Classification Average: Represents the average annualized total return for all reporting funds in the Lipper Mid-Cap Value Funds Classification. Lipper returns account for the effects of management fees and assume reinvestment of distributions
but do not reflect any applicable sales charges.
Lipper Small-Cap Value Funds Classification Average: Represents the average annualized total return for all reporting funds in the Lipper Small-Cap Value Funds Classification. Lipper returns account for the effects of management fees and assume reinvestment of
distributions but do not reflect any applicable sales charges.
MSCI EAFE Index: The MSCI
(Morgan Stanley Capital International) EAFE (Europe, Australasia, Far East) Index is a free float-adjusted market capitalization weighted index designed to measure developed market equity performance, excluding the U.S. and Canada. The index returns
assume reinvestment of distributions, but do not reflect any applicable sales charges or management fees.
MSCI Emerging Markets Index:
The MSCI (Morgan Stanley Capital International) Emerging Markets Index is an unmanaged index considered representative of stocks of developing countries. The index returns assume reinvestment of distributions, but
do not reflect any applicable sales charges or management fees.
Market Capitalization: The
market capitalization of a company is equal to the number of the company’s common shares outstanding multiplied by the current price of the company’s stock.
Net Asset Value (NAV) Per Share: A fund’s Net Assets is equal to its total assets (securities, cash and accrued earnings) less its total liabilities. For funds with multiple classes, Net Assets are determined separately for each share class. NAV
per share is equal to the fund’s (or share class’) Net Assets divided by its number of shares outstanding.
Russell 2000® Index: An index that measures the performance of the small-cap segment of the U.S. equity universe. The Russell 2000® Index is a subset of the Russell 3000® Index
representing approximately 10% of the total market capitalization of that index. It includes approximately 2,000 of the smallest securities based on a combination of their market cap
Glossary of Terms Used in this Report (Unaudited) (continued)
and current index membership. The index returns assume reinvestment of
distributions, but do not reflect any applicable sales charges or management fees.
Russell 1000® Value Index: An index that measures the performance of those Russell 1000® companies with lower price to- book ratios and lower forecasted growth values. The index returns assume reinvestment of distributions, but do not
reflect any applicable sales charges or management fees.
Russell 2000® Value Index: An index that measures the performance of those Russell 2000® companies with lower price-to-book ratios and lower forecasted growth values. The index returns assume reinvestment of distributions, but do not
reflect any applicable sales charges or management fees.
Russell Midcap® Value Index: An index that measures the performance of the mid-cap value segment of the U.S. equity universe. It
includes those Russell Midcap Index companies with lower price-to-book ratios and lower forecasted growth values. The index returns assume reinvestment of distributions, but do not reflect any applicable sales charges or management
fees.
S&P 500®: An unmanaged index generally considered representative of the U.S. stock market. Index returns assume reinvestment
of distributions, but do not include the effects of any applicable sales charges or management fees.
Tax Equalization: The
practice of treating a portion of the distribution made to a redeeming shareholder, which represents his proportionate part of undistributed net investment income and capital gain as a distribution for tax purposes. Such amounts are referred to as
the equalization debits (or payments) and will be considered a distribution to the shareholder of net investment income and capital gain for calculation of the fund’s dividends paid deduction.
Annual Investment Management Agreement Approval
Process
(Unaudited)
At a
meeting held on May 21-23, 2019 (the “May Meeting”), the Board of Directors (the “Board” and each Director, a “Board Member”) of the Funds, including the Board Members who are not “interested persons”
(as defined under the Investment Company Act of 1940 (the “1940 Act”)) (the “Independent Board Members”), approved, for each Fund, the renewal of the management agreement (each, an “Investment Management
Agreement”) with Nuveen Fund Advisors, LLC (the “Adviser”) pursuant to which the Adviser serves as investment adviser to such Fund and the sub-advisory agreement (each, a “Sub-Advisory Agreement”) with Nuveen Asset
Management, LLC (the “Sub-Adviser”) pursuant to which the Sub- Adviser serves as the sub-adviser to such Fund. Following an initial two-year period, the Board, including the Independent Board Members, is required under the 1940 Act to
review and approve each Investment Management Agreement and Sub-Advisory Agreement on behalf of the applicable Fund on an annual basis. The Investment Management Agreements and Sub-Advisory Agreements are collectively referred to as the
“Advisory Agreements” and the Adviser and the Sub-Adviser are collectively, the “Fund Advisers” and each, a “Fund Adviser.”
In response to a request on behalf of the Independent Board
Members by independent legal counsel, the Board received and reviewed prior to the May Meeting extensive materials specifically prepared for the annual review of Advisory Agreements by the Adviser as well as by Broadridge Financial Solutions, Inc.
(“Broadridge”), an independent provider of investment company data. The materials provided in connection with the annual review covered a breadth of subject matter including, but not limited to, a description of the nature, extent and
quality of services provided by the Fund Advisers; a review of the Sub-Adviser and investment team; an analysis of fund performance in absolute terms and as compared to the performance of certain peer funds and benchmarks with a focus on any
performance outliers; an analysis of the fees and expense ratios of the Nuveen funds in absolute terms and as compared to those of certain peer funds with a focus on any expense outliers; a description of portfolio manager compensation; a review of
the performance of various service providers; a description of various initiatives Nuveen had undertaken or continued during the year for the benefit of particular fund(s) and/or the complex; a description of the profitability or financial data of
Nuveen and the Sub-Adviser; and a description of indirect benefits received by the Fund Advisers as a result of their relationships with the Nuveen funds. The Board Members held an in-person meeting on April 17-18, 2019 (the “April
Meeting”), in part, to review and discuss the performance of the Nuveen funds and the Adviser’s evaluation of the various sub-advisers to the Nuveen funds. The Independent Board Members asked questions and requested additional
information that was provided for the May Meeting.
The
information prepared specifically for the annual review of the Advisory Agreements supplemented the information provided to the Board and its committees throughout the year. The Board and its committees met regularly during the year and the
information provided and topics discussed were relevant to the review of the Advisory Agreements. Some of these reports and other data included, among other things, materials that outlined the investment performance of the Nuveen funds; strategic
plans of the Adviser which may impact the services it provides to the Nuveen funds; the review of the Nuveen funds and applicable investment teams; compliance, regulatory and risk management matters; the trading practices of the various
sub-advisers; valuation of securities; fund expenses; payments to financial intermediaries, including 12b-1 fees and sub-transfer agency fees; and overall market and regulatory developments. The Board further continued its practice of seeking to
meet periodically with the various sub-advisers to the Nuveen funds and their investment teams, when feasible. The Independent Board Members considered the review of the Advisory Agreements to be an ongoing process and employed the accumulated
information, knowledge, and experience the Board Members had gained during their tenure on the boards governing the Nuveen funds and working with the Fund Advisers in their review of the Advisory Agreements. The contractual arrangements are a result
of multiple years of review, negotiation and information provided in connection with the boards’ annual review of the Nuveen funds’ advisory arrangements and oversight of the Nuveen funds.
The Independent Board Members were advised by independent legal
counsel during the annual review process as well as throughout the year, including meeting in executive sessions with such counsel at which no representatives from the Adviser or the Sub-Adviser were present. In connection with their annual review,
the Independent Board Members also received a memorandum from independent legal counsel outlining their fiduciary duties and legal standards in reviewing the Advisory Agreements.
Annual Investment Management Agreement Approval Process (Unaudited) (continued)
In deciding to renew the Advisory Agreements, the Independent
Board Members did not identify a particular factor or information as determinative or controlling, but rather the decision reflected the comprehensive consideration of all the information provided, and each Board Member may have attributed different
levels of importance to the various factors and information considered in connection with the approval process. The following summarizes the principal factors and information, but not all the factors, the Board considered in deciding to renew the
Advisory Agreements and its conclusions.
A. Nature,
Extent and Quality of Services
In evaluating the renewal
of the Advisory Agreements, the Independent Board Members received and considered information regarding the nature, extent and quality of the applicable Fund Adviser’s services provided to the respective Fund with particular focus on the
services and enhancements to such services provided during the last year. The Board recognized that the Adviser provides a comprehensive set of services necessary to operate the Nuveen funds in a highly regulated industry and noted that the scope of
such services has expanded over the years as a result of regulatory, market and other developments, such as the development of the liquidity management program and expanded compliance programs. Some of the functions the Adviser is responsible for
include, but are not limited to: product management (such as analyzing a fund’s position in the marketplace, setting dividends, preparing shareholder and intermediary communications and other due diligence support); investment oversight (such
as analyzing fund performance, sub-advisers and investment teams and analyzing trade executions of portfolio transactions, soft dollar practices and securities lending activities); securities valuation services (such as executing the daily valuation
process for portfolio securities and developing and recommending changes to valuation policies and procedures); risk management (such as overseeing operational and investment risks, including stress testing); fund administration (such as preparing
fund tax returns and other tax compliance services, overseeing the Nuveen funds’ independent public accountants and other service providers; managing fund budgets and expenses; and helping to fulfill the funds’ regulatory filing
requirements); oversight of shareholder services and transfer agency functions (such as oversight and liaison of transfer agent service providers which include registered shareholder customer service and transaction processing); Board relations
services (such as organizing and administering Board and committee meetings, preparing various reports to the Board and committees and providing other support services); compliance and regulatory oversight services (such as developing and
maintaining a compliance program to ensure compliance with applicable laws and regulations, monitoring compliance with applicable fund policies and procedures and adherence to investment restrictions, and evaluating the compliance programs of the
Nuveen fund sub-advisers and certain other service providers); and legal support and oversight of outside law firms (such as with respect to filing and updating registration statements; maintaining various regulatory registrations; and providing
legal interpretations regarding fund activities, applicable regulations and implementation of policies and procedures). In reviewing the scope and quality of services, the Board recognized the continued efforts and resources the Adviser and its
affiliates have employed to continue to enhance their services for the benefit of the complex as well as particular Nuveen funds over recent years. Such service enhancements have included, but are not limited to:
| •
|
Fund
Improvements and Product Management Initiatives – continuing to proactively manage the Nuveen fund complex as a whole and at the individual fund level with an aim to enhance the shareholder outcomes through, among other things,
repositioning funds, merging funds, introducing additional share classes, reviewing and updating investment policies and benchmarks, modifying the composition of certain portfolio management teams and analyzing various data to help devise such
improvements; |
| •
|
Capital
Initiatives – continuing to invest capital to support new funds with initial capital as well as to facilitate modifications to the strategies or structure of existing funds; |
| •
|
Compliance
Program Initiatives – continuing efforts to enhance the compliance program through, among other things, internally integrating various portfolio management teams and aligning compliance support accordingly, completing a
comprehensive review of existing policies and procedures and revising such policies and procedures as appropriate, enhancing compliance-related technologies and workflows, and optimizing compliance shared services across the organization and
affiliates; |
| •
|
Risk
Management and Valuation Services - continuing efforts to strengthen the risk management functions, including through, among other things, enhancing the interaction and reporting between the investment risk management team and various affiliates,
increasing the efficiency of risk monitoring performed on the Nuveen funds through improved reporting, continuing to implement risk programs designed to provide a more disciplined and consistent approach to identifying and mitigating operational
risks, continuing progress on implementing a liquidity program that complies with the new liquidity regulatory requirements and continuing to oversee the daily valuation process; |
| •
|
Additional
Compliance Services – continuing investment of time and resources necessary to develop the compliance policies and procedures and other related tools necessary to meet the various new regulatory requirements affecting the Nuveen
funds that have been adopted over recent years; |
| •
|
Government
Relations – continuing efforts of various Nuveen teams and affiliates to advocate and communicate their positions with lawmakers and other regulatory bodies on issues that will impact the Nuveen funds; |
| •
|
Business
Continuity, Disaster Recovery and Information Services – establishing an information security program to help identify and manage information security risks, periodically testing disaster recovery plans, maintaining and updating
business continuity plans and providing reports to the Board, at least annually, addressing, among other things, management’s security risk assessment, cyber risk profile, incident tracking and other relevant information technology
risk-related reports; and |
| •
|
Expanded
Dividend Management Services – continuing to expand the services necessary to manage the dividends among the varying types of Nuveen funds that have developed as the Nuveen complex has grown in size and scope. |
In addition to the services provided by the Adviser, the
Board also considered the risks borne by the Adviser and its affiliates in managing the Nuveen funds, including entrepreneurial, operational, reputational, regulatory and litigation risks.
The Board further considered the division of responsibilities
between the Adviser and the Sub-Adviser and recognized that the Sub-Adviser and its investment personnel generally are responsible for the management of each Fund’s portfolio. The Board noted that the Adviser oversees the Sub-Adviser and
considered an analysis of the Sub-Adviser provided by the Adviser which included, among other things, the Sub-Adviser’s assets under management and changes thereto, a summary of the investment team and changes thereto, the investment approach
of the team and the performance of the funds sub-advised by the Sub-Adviser over various periods. The Board further considered at the May Meeting or prior meetings evaluations of the Sub-Adviser’s compliance program and trade execution. The
Board noted that the Adviser recommended the renewal of the Sub-Advisory Agreements.
Based on its review, the Board determined, in the exercise of
its reasonable business judgment, that it was satisfied with the nature, extent and quality of services provided to the respective Funds under each applicable Advisory Agreement.
B. The Investment Performance of the Funds and Fund
Advisers
In evaluating the quality of the services
provided by the Fund Advisers, the Board also received and considered the investment performance of the Nuveen funds they advise. In this regard, the Board reviewed Fund performance over the quarter, one- , three- and five- year periods ending
December 31, 2018 as well as performance data for the first quarter of 2019 ending March 29, 2019. The performance data was based on Class A shares; however, the performance of other classes should be substantially similar as they invest in the same
portfolio of securities and differences in performance among the classes would be principally attributed to the variations in the expense structures of the classes. Unless otherwise indicated, the performance data referenced below reflects the
periods ended December 31, 2018. The Board considered the Adviser’s analysis of each fund’s performance, with particular focus on funds that were considered performance outliers and the factors contributing to their performance. The
Board also noted that it received performance data of the Nuveen funds during its quarterly meetings throughout the year and took into account the discussions that occurred at these Board meetings regarding fund performance. In this regard, in its
evaluation of Nuveen fund performance at meetings throughout the year, the Board considered performance information for the funds for different time periods, both absolute and relative to appropriate benchmarks and peers, with particular attention
to information indicating underperformance of the respective funds and discussed with the Adviser the reasons for such underperformance.
The Board reviewed both absolute and relative fund performance
during the annual review. With respect to the latter, the Board considered fund performance in comparison to the performance of peer funds (the “Performance Peer Group”) and recognized and/or customized benchmarks (i.e., generally
benchmarks derived from multiple recognized benchmarks). In considering performance data, the Board is aware of certain inherent limitations with such data, including that differences between the objective(s), strategies and other characteristics of
the Nuveen funds compared to the respective Performance Peer Group and/or benchmark(s) (such as differences in the use of leverage) will necessarily contribute to differences in performance results and limit the value of the comparative information.
To assist the Board in its review of the comparability of the relative performance, the Adviser has ranked the relevancy of the peer group to the funds as low, medium or high. Depending on the facts and circumstances, however, the Board may be
satisfied with a fund’s performance notwithstanding that its performance may be below its benchmark or peer group for certain periods. In addition, the performance data may vary significantly depending on the end date selected, and
shareholders may evaluate fund performance based on their own holding period which may differ from the performance periods reviewed by the Board leading to different results. Further, the Board considered a fund’s performance in light of the
overall financial market conditions during the respective periods. As noted above, the Board reviewed, among other things, Nuveen fund performance over various periods ended December 31, 2018, and the Board was aware of the market decline in the
fourth quarter of 2018 and considered performance from the first quarter of 2019 as well. The Board also noted that a shorter period of underperformance may significantly impact longer term performance.
In their review of performance, the Independent Board Members
focused, in particular, on the Adviser’s analysis of Nuveen funds determined to be underperforming performance outliers. The Board recognized that some periods of underperformance may only be temporary while other periods of underperformance
may indicate a broader issue that may require a corrective action. Accordingly, with respect to any Nuveen funds for which the Board had identified performance issues, the Board monitors such funds closely until performance improves, discusses with
the Adviser the reasons for such results, considers whether any steps are necessary or appropriate to address such issues, and reviews the results of any efforts undertaken.
The Board’s determinations with respect to each Fund are
summarized below.
Annual Investment Management Agreement Approval Process (Unaudited) (continued)
For Nuveen Dividend Value Fund, the Board noted that the Fund
ranked in the third quartile of its Performance Peer Group in the one- and five-year periods and second quartile in the three-year period. Although the Fund’s performance was below the performance of its benchmark in the one- and five-year
periods, the Fund outperformed its benchmark in the three-year period. The Board was satisfied with the overall performance of the Fund.
For Nuveen Mid Cap Value Fund (the “Mid Cap Fund”),
the Board noted that the Fund ranked in the second quartile of its Performance Peer Group in the one-year period and first quartile in the three- and five-year periods. Although the Fund’s performance was below the performance of its benchmark
in the one- and five-year periods, the Fund outperformed its benchmark in the three-year period. The Board was satisfied with the overall performance of the Fund.
For Nuveen Small Cap Value Fund (the “Small Cap
Fund”), the Board noted that although the Fund ranked in the fourth quartile of its Performance Peer Group in the one-year period and its performance was below the performance of its benchmark in the one- , three- and five-year periods, the
Fund ranked in the third quartile in the three-year period and first quartile in the five-year period. The Board considered the Adviser’s explanation of the factors that detracted from the Fund’s performance and was satisfied with the
explanation. The Board further considered the modifications to the portfolio taken in seeking to address performance issues.
C. Fees, Expenses and Profitability
1. Fees and Expenses
In its annual review, the Board considered
the fees paid to the Fund Advisers and the total operating expense ratio of each Nuveen fund, before and after any undertaking by Nuveen to limit the fund’s total annual operating expenses to certain levels. More specifically, the Independent
Board Members reviewed, among other things, each fund’s gross and net management fee rates (i.e., before and after expense reimbursements and/or fee waivers, if any) and net total expense ratio in relation to those of a comparable universe of
funds (the “Peer Universe”) and to a more focused subset of comparable funds (the “Peer Group”) established by Broadridge. The Independent Board Members reviewed the methodology Broadridge employed to establish its Peer
Universe and Peer Group and recognized that differences between the applicable fund and its respective Peer Universe and/or Peer Group as well as changes to the composition of the Peer Group and/or Peer Universe from year to year may limit some of
the value of the comparative data. The Independent Board Members also considered a fund’s operating expense ratio as it more directly reflected the shareholder’s costs in investing in the respective fund.
In their review, the Independent Board
Members considered, in particular, each fund with a net expense ratio of six basis points or higher compared to that of its peer average (each, an “Expense Outlier Fund”) and an analysis as to the factors contributing to each such
fund’s higher relative net expense ratio. Accordingly, in reviewing the comparative data between a fund and its peers, the Board generally considered the fund’s net expense ratio and fees to be higher if they were over 10 basis points
higher, slightly higher if they were 6 to 10 basis points higher, in line if they were within approximately 5 basis points higher than the peer average and below if they were below the peer average of the Peer Group. The Independent Board Members
also considered, in relevant part, a fund’s net management fee and net total expense ratio in light of its performance history.
In their review of the fee arrangements for
the Nuveen funds, the Independent Board Members considered the management fee schedules, including the complex-wide and fund-level breakpoint schedules, and the expense reimbursements and/or fee waivers provided by Nuveen for each fund, as
applicable. The Board noted that across the Nuveen fund complex, the complex-wide fee breakpoints reduced fees by $51.5 million and fund-level breakpoints reduced fees by $55.1 million in 2018. Further, fee caps and waivers for all applicable Nuveen
funds saved an additional $15 million in fees for shareholders in 2018.
With respect to the Sub-Adviser, the Board
considered the sub-advisory fee paid to the Sub-Adviser, including any breakpoint schedule, and, as described below, comparative data of the fees the Sub-Adviser charges to other clients, if any.
The Independent Board Members noted that the
Funds had net management fees and net expense ratios below the average of their Peer Group. Based on its review of the information provided, the Board determined that each Fund’s management fees (as applicable) to a Fund Adviser were
reasonable in light of the nature, extent and quality of services provided to the Fund.
2. Comparisons with the Fees of Other
Clients
In determining the
appropriateness of fees, the Board also reviewed information regarding the fee rates the respective Fund Advisers charged to certain other types of clients and the type of services provided to these other clients. For the Adviser and/or the
Sub-Adviser, such other clients may include retail and institutional managed accounts; sub-advised funds outside the Nuveen family; foreign investment companies offered by Nuveen; and collective investment trusts. The Board further noted that the
Adviser also advised certain exchange-traded funds (“ETFs”) sponsored by Nuveen.
The Board recognized that each Fund had an
affiliated sub-adviser and, with respect to affiliated sub-advisers, reviewed, among other things, the range of fees assessed for managed accounts and foreign investment companies offered by Nuveen. The Board also reviewed the fee range and average
fee rate of certain selected investment strategies offered in retail and institutional managed accounts by the Sub-Adviser and of the non-Nuveen investment companies sub-advised by affiliated sub-advisers.
In addition to the comparative fee data, the
Board also reviewed, among other things, a description of the different levels of services provided to certain other clients compared to the services provided to the Nuveen funds as well as the differences in portfolio investment policies, investor
profiles, account sizes and regulatory requirements, all of which contribute to the variations in the fee schedules. The Board noted, among other things, the wide range of services in addition to investment management services provided to the Nuveen
funds when the Adviser is principally responsible for all aspects of operating the funds, including the increased regulatory requirements that must be met in managing the funds, the larger account sizes of managed accounts and the increased
entrepreneurial, legal and regulatory risks that the Adviser incurs in sponsoring and managing the funds. Further, with respect to ETFs, the Board considered that Nuveen ETFs are passively managed compared to the active management of other Nuveen
funds which contributed to the differences in fee levels between the Nuveen ETFs and other Nuveen funds. In general, higher fee levels reflect higher levels of service provided by the Adviser, increased investment management complexity, greater
product management requirements, and higher levels of business risk or some combination of these factors. The Board further considered that the Sub-Adviser’s fee is essentially for portfolio management services and therefore more comparable to
the fees it receives for retail wrap accounts and other external sub-advisory mandates. The Board concluded the varying levels of fees were justified given, among other things, the inherent differences in the products and the level of services
provided to the Nuveen funds versus other clients, the differing regulatory requirements and legal liabilities and the entrepreneurial, legal and regulatory risks incurred in sponsoring and advising a registered investment company.
3. Profitability of Fund Advisers
In conjunction with their review of fees,
the Independent Board Members considered information regarding Nuveen’s level of profitability for its advisory services to the Nuveen funds for the calendar years 2018 and 2017. The Board reviewed, among other things, Nuveen’s net
margins (pre-tax) (both including and excluding distribution expenses); gross and net revenue margins (pre- and post-tax); revenues, expenses, and net income (pre- tax and after-tax and before distribution) of Nuveen for fund advisory services; and
comparative profitability data comparing the adjusted margins of Nuveen compared to the adjusted margins of certain peers with publicly available data and with the most comparable assets under management (based on asset size and asset composition)
for each of the last two calendar years. The Board also reviewed the revenues and expenses the Adviser derived from its ETF product line that was launched in 2016. The Independent Board Members noted that Nuveen’s net margins were higher in
2018 than the previous year and considered the key drivers behind the revenue and expense changes that impacted Nuveen’s net margins between the years. The Board considered the costs of investments in the Nuveen business, including the
investment of seed capital in certain Nuveen funds and additional investments in infrastructure and technology. The Independent Board Members also noted that Nuveen’s adjusted margins from its relationships with the Nuveen funds were on the
low range compared to the adjusted margins of the peers; however, the Independent Board Members recognized the inherent limitations of the comparative data of other publicly traded peers given that the calculation of profitability is rather
subjective and numerous factors (such as types of funds, business mix, cost of capital, methodology to allocate expenses and other factors) can have a significant impact on the results.
The Independent Board Members also reviewed
a description of the expense allocation methodology employed to develop the financial information and a summary of the history of changes to the methodology over the ten-year period from 2008 to 2018, and recognized that other reasonable allocation
methodologies could be employed and lead to significantly different results. The Board noted that two Independent Board Members, along with independent counsel, serve as the Board’s liaisons to review profitability and discuss any proposed
changes to the methodology prior to the full Board’s review.
Aside from Nuveen’s profitability, the
Board recognized that the Adviser is a subsidiary of Nuveen, LLC, the investment management arm of Teachers Insurance and Annuity Association of America (“TIAA”). As such, the Board also reviewed a balance sheet for TIAA reflecting its
assets, liabilities and capital and contingency reserves for the 2018 and 2017 calendar years to consider the financial strength of TIAA having recognized the importance of having an adviser with significant resources.
In addition to Nuveen, the Independent Board
Members also considered the profitability of the Sub-Adviser from its relationships with the Nuveen funds. In this regard, the Independent Board Members reviewed the Sub-Adviser’s revenues, expenses and revenue margins (pre- and post-tax) for
its advisory activities for the calendar year ended December 31, 2018. The Independent Board Members also reviewed a profitability analysis reflecting the revenues, expenses and revenue margin (pre- and post-tax) by asset type for the Sub-Adviser
for the calendar year ending December 31, 2018 and the pre- and post-tax revenue margin from 2018 and 2017.
In evaluating the reasonableness of the
compensation, the Independent Board Members also considered any other ancillary benefits derived by the respective Fund Adviser from its relationship with the Nuveen funds as discussed in further detail below.
Based on a consideration of all the
information provided, the Board noted that Nuveen’s and the Sub-Adviser’s level of profitability was acceptable and not unreasonable in light of the services provided.
D. Economies of Scale and Whether Fee Levels Reflect These
Economies of Scale
With respect to economies of scale,
the Independent Board Members noted that although economies of scale are difficult to measure, the Adviser shares the benefits of economies of scale in various ways including breakpoints in the management fee schedule (subject to limited
exceptions), fee waivers and/or expense limitations, the pricing of Nuveen funds at scale at inception and investments in its business which can enhance the services
Annual Investment Management Agreement Approval Process (Unaudited) (continued)
provided to the funds for the fees paid. With respect to breakpoint schedules,
because the Board had previously recognized that economies of scale may occur not only when the assets of a particular Nuveen fund grow but also when the assets in the complex grow, the Nuveen funds generally pay the Adviser a management fee
comprised of a fund-level component and a complex-level component each with its own breakpoint schedule, subject to certain exceptions. In general terms, the breakpoint schedule at the fund level reduces fees as assets in the particular fund pass
certain thresholds and the breakpoint schedule at the complex level reduces fees on the Nuveen funds as the eligible assets in the complex pass certain thresholds. The Independent Board Members reviewed, among other things, the fund-level and
complex-level fee schedules and the temporary and/or permanent expense caps applicable to certain Nuveen funds (including the amounts of fees waived or amounts reimbursed to the respective funds in 2017 and 2018), including the temporary expense
caps applicable to the Mid Cap Fund and the Small Cap Fund. The Independent Board Members noted that as a result of fund-level management fee changes implemented in June 2017, none of the Nuveen open-end funds were above their top level fee
breakpoint.
In addition, the Independent Board Members
recognized the Adviser’s continued reinvestment in its business through, among other things, investments in its business infrastructure and information technology, portfolio accounting system as well as other systems and platforms that will,
among other things, support growth, simplify and enhance information sharing, and enhance the investment process to the benefit of all of the Nuveen funds.
Based on its review, the Board concluded that the current fee
arrangements together with the Adviser’s reinvestment in its business appropriately shared any economies of scale with shareholders.
E. Indirect Benefits
The Independent Board Members received and considered
information regarding other benefits the respective Fund Adviser or its affiliates may receive as a result of their relationship with the Nuveen funds. The Independent Board Members recognized that an affiliate of the Adviser serves as principal
underwriter providing distribution and/or shareholder services to the open-end funds. The Independent Board Members further noted that the Nuveen open-end funds pay 12b-1 fees and while a majority of such fees were paid to third party
broker-dealers, the Board reviewed the amount retained by the Adviser’s affiliate as a result of serving as principal underwriter. In addition, the Independent Board Members also noted that the Sub-Adviser engages in soft dollar transactions
pursuant to which it may receive the benefit of research products and other services provided by broker-dealers executing portfolio transactions on behalf of the applicable Nuveen funds.
The Board, however, noted that the benefits for the Sub-Adviser
when transacting in fixed-income securities may be more limited as such securities generally trade on a principal basis and therefore do not generate brokerage commissions. Further, the Board noted that although the Sub-Adviser may benefit from the
receipt of research and other services that it may otherwise have to pay for out of its own resources, the research may also benefit the Nuveen funds to the extent it enhances the ability of the Sub-Adviser to manage such funds or is acquired
through the commissions paid on portfolio transactions of other clients.
Based on their review, the Board concluded that any indirect
benefits received by a Fund Adviser as a result of its relationship with the Funds were reasonable and within acceptable parameters.
F. Other Considerations
The Board Members did not identify any single factor discussed
previously as all-important or controlling. The Board Members, including the Independent Board Members, concluded that the terms of each Advisory Agreement were fair and reasonable, that the respective Fund Adviser’s fees were reasonable in
light of the services provided to each Fund and that the Advisory Agreements be renewed.
Directors and Officers
(Unaudited)
The
management of the Funds, including general supervision of the duties performed for the Funds by the Adviser, is the responsibility of the Board of Directors of the Funds. The number of Directors of the Funds is currently set at ten. None of the
Directors who are not “interested” persons of the Funds (referred to herein as “Independent Directors”) has ever been a Director or employee of, or consultant to, Nuveen or its affiliates. The names and business addresses of
the Directors and officers of the Funds, their principal occupations and other affiliations during the past five years, the number of portfolios each Director oversees and other directorships they hold are set forth below.
The Funds’ Statement of Additional Information
(“SAI”) includes more information about the Directors. To request a free copy, call Nuveen Investments at (800) 257-8787 or visit the Funds’ website at www.nuveen.com.
Name,
Year of Birth
& Address |
Position(s)
Held with
the Funds |
Year
First
Elected or
Appointed (1) |
Principal
Occupation(s)
Including other Directorships
During Past 5 Years |
Number
of
Portfolios in
Fund Complex
Overseen by
Director |
| Independent
Directors: |
|
|
|
Terence
J. Toth
1959
333 W. Wacker Drive
Chicago, IL 60606 |
Chairman
and
Director |
2008
|
Formerly,
a Co-Founding Partner, Promus Capital (2008-2017); Director, Quality Control Corporation (since 2012); member: Catalyst Schools of Chicago Board (since 2008) and Mather Foundation Board (since 2012), and chair of its investment committee; formerly,
Director, Fulcrum IT Services LLC (2010-2019); formerly, Director, Legal & General Investment Management America, Inc. (2008-2013); formerly, CEO and President, Northern Trust Global Investments (2004-2007); Executive Vice President,
Quantitative Management & Securities Lending (2000-2004); prior thereto, various positions with Northern Trust Company (since 1994); formerly, Member, Northern Trust Mutual Funds Board (2005-2007), Northern Trust Global Investments Board
(2004-2007), Northern Trust Japan Board (2004-2007), Northern Trust Securities Inc. Board (2003- 2007) and Northern Trust Hong Kong Board (1997-2004). |
159
|
Jack
B. Evans
1948
333 W. Wacker Drive
Chicago, IL 60606 |
Director
|
1999
|
Chairman
(since 2019), formerly, President (1996-2019), The Hall-Perrine Foundation, a private philanthropic corporation; Director and Chairman, United Fire Group, a publicly held company; Director, Public member, American Board of Orthopaedic Surgery
(since 2015); Life Trustee of Coe College and the Iowa College Foundation; formerly, President Pro-Tem of the Board of Regents for the State of Iowa University System; formerly, Director, Alliant Energy and The Gazette Company; formerly, Director,
Federal Reserve Bank of Chicago; formerly, President and Chief Operating Officer, SCI Financial Group, Inc., a regional financial services firm. |
159
|
Directors and Officers (Unaudited) (continued)
Name,
Year of Birth
& Address |
Position(s)
Held with
the Funds |
Year
First
Elected or
Appointed (1) |
Principal
Occupation(s)
Including other Directorships
During Past 5 Years |
Number
of
Portfolios in
Fund Complex
Overseen by
Director |
William
C. Hunter
1948
333 W. Wacker Drive
Chicago, IL 60606 |
Director
|
2003
|
Dean
Emeritus, formerly, Dean, Tippie College of Business, University of Iowa (2006-2012); Director of Wellmark, Inc. (since 2009); past Director (2005-2015), and past President (2010- 2014) Beta Gamma Sigma, Inc., The International Business Honor
Society; formerly, Director (2004-2018) of Xerox Corporation; Dean and Distinguished Professor of Finance, School of Business at the University of Connecticut (2003-2006); previously, Senior Vice President and Director of Research at the Federal
Reserve Bank of Chicago (1995-2003); formerly, Director (1997-2007), Credit Research Center at Georgetown University. |
159
|
Albin
F. Moschner
1952
333 W. Wacker Drive
Chicago, IL 60606 |
Director
|
2016
|
Founder
and Chief Executive Officer, Northcroft Partners, LLC, a management consulting firm (since 2012); formerly, Chairman (2019), and Director (2012-2019), USA Technologies, Inc., a provider of solutions and services to facilitate electronic payment
transactions; formerly, Director, Wintrust Financial Corporation (1996-2016); previously, held positions at Leap Wireless International, Inc., including Consultant (2011-2012), Chief Operating Officer (2008-2011), and Chief Marketing Officer
(2004-2008); formerly, President, Verizon Card Services division of Verizon Communications, Inc. (2000-2003); formerly, President, One Point Services at One Point Communications (1999-2000); formerly, Vice Chairman of the Board, Diba, Incorporated
(1996-1997); formerly, various executive positions (1991-1996) and Chief Executive Officer (1995-1996) of Zenith Electronics Corporation. |
159
|
John
K. Nelson
1962
333 W. Wacker Drive
Chicago, IL 60606 |
Director
|
2013
|
Member
of Board of Directors of Core12 LLC (since 2008), a private firm which develops branding, marketing and communications strategies for clients; served on The President's Council, Fordham University (2010-2018); and previously was a Director of The
Curran Center for Catholic American Studies (2009-2018); formerly, senior external advisor to the financial services practice of Deloitte Consulting LLP (2012-2014); formerly, Chairman of the Board of Trustees of Marian University (2010 as trustee,
2011- 2014 as Chairman); formerly, Chief Executive Officer of ABN AMRO N.V. North America, and Global Head of its Financial Markets Division (2007-2008); prior senior positions held at ABN AMRO include Corporate Executive Vice President and Head of
Global Markets-the Americas (2006-2007), CEO of Wholesale Banking-North America and Global Head of Foreign Exchange and Futures Markets (2001-2006), and Regional Commercial Treasurer and Senior Vice President Trading-North America (1996-2001);
formerly, Trustee at St. Edmund Preparatory School in New York City. |
159
|
Judith
M. Stockdale
1947
333 W. Wacker Drive
Chicago, IL 60606 |
Director
|
1997
|
Board
Member, Land Trust Alliance (since 2013) and U.S. Endowment for Forestry and Communities (since 2013); formerly, Executive Director (1994-2012), Gaylord and Dorothy Donnelley Foundation; prior thereto, Executive Director, Great Lakes Protection
Fund (1990-1994). |
159
|
Carole
E. Stone
1947
333 W. Wacker Drive
Chicago, IL 60606 |
Director
|
2007
|
Former
Director, Chicago Board Options Exchange (2006-2017), and C2 Options Exchange, Incorporated (2009-2017); Director, Cboe Global Markets, Inc., formerly, CBOE Holdings, Inc. (since 2010); formerly, Commissioner, New York State Commission on Public
Authority Reform (2005-2010). |
159
|
Name,
Year of Birth
& Address |
Position(s)
Held with
the Funds |
Year
First
Elected or
Appointed (1) |
Principal
Occupation(s)
Including other Directorships
During Past 5 Years |
Number
of
Portfolios in
Fund Complex
Overseen by
Director |
Margaret
L. Wolff
1955
333 W. Wacker Drive
Chicago, IL 60606 |
Director
|
2016
|
Formerly,
member of the Board of Directors (2013-2017) of Travelers Insurance Company of Canada and The Dominion of Canada General Insurance Company (each, a part of Travelers Canada, the Canadian operation of The Travelers Companies, Inc.); formerly, Of
Counsel, Skadden, Arps, Slate, Meagher & Flom LLP (Mergers & Acquisitions Group) (2005-2014); Member of the Board of Trustees of New York-Presbyterian Hospital (since 2005); Member (since 2004) and Chair (since 2015) of the Board of Trustees
of The John A. Hartford Foundation (a philanthropy dedicated to improving the care of older adults); formerly, Member (2005-2015) and Vice Chair (2011-2015) of the Board of Trustees of Mt. Holyoke College. |
159
|
Robert
L. Young(2)
1963
333 W. Wacker Drive
Chicago, IL 60606 |
Director
|
2017
|
Formerly,
Chief Operating Officer and Director, J.P. Morgan Investment Management Inc. (2010-2016); formerly, President and Principal Executive Officer (2013-2016), and Senior Vice President and Chief Operating Officer (2005-2010), of J.P. Morgan Funds;
formerly, Director and various officer positions for J.P. Morgan Investment Management Inc. (formerly, JPMorgan Funds Management, Inc. and formerly, One Group Administrative Services) and JPMorgan Distribution Services, Inc. (formerly, One Group
Dealer Services, Inc.) (1999-2017). |
157
|
Name,
Year of Birth
& Address |
Position(s)
Held with
the Funds |
Year
First
Elected or
Appointed (1) |
Principal
Occupation(s)
Including other Directorships
During Past 5 Years |
Number
of
Portfolios in
Fund Complex
Overseen by
Director |
| Interested
Director: |
|
|
|
Margo
L. Cook(3)
1964
333 W. Wacker Drive
Chicago, IL 60606 |
Director
|
2016
|
President
(since 2017), formerly, Co-Chief Executive Officer and Co-President (2016-2017), formerly, Senior Executive Vice President of Nuveen Investments, Inc; Executive Vice President (since 2017) of Nuveen, LLC; President, Global Products and Solutions
(since 2017), and Co-Chief Executive Officer (since 2015), formerly, Executive Vice President (2013-2015) of Nuveen Securities, LLC; President (since 2017), formerly, Co-President (2016-2017), formerly Senior Executive Vice President (2015-2016) of
Nuveen Fund Advisors, LLC (Executive Vice President 2011-2015); President (since 2017), Nuveen Alternative Investments, LLC; Chartered Financial Analyst. |
159
|
Name,
Year of Birth
& Address |
Position(s)
Held with
the Funds |
Year
First
Elected or
Appointed (4) |
Principal
Occupation(s)
During Past 5 Years |
|
| Officers
of the Funds: |
|
|
|
|
Greg
A. Bottjer
1971
333 W. Wacker Drive
Chicago, IL 60606 |
Chief
Administrative
Officer |
2016
|
Senior
(since 2017) Managing Director (since 2011), formerly, Senior Vice President (2007-2010) of Nuveen; Senior (since 2017) Managing Director (since 2016) of Nuveen Fund Advisors, LLC; Chartered Financial Analyst. |
|
Mark
J. Czarniecki
1979
901 Marquette Avenue
Minneapolis, MN 55402 |
Vice
President
and Assistant
Secretary |
2013
|
Vice
President and Assistant Secretary of Nuveen Securities, LLC (since 2016) and Nuveen Fund Advisors (since 2017); Vice President and Associate General Counsel of Nuveen (since 2013) and Vice President, Assistant Secretary and Associate General
Counsel of Nuveen Asset Management (since 2018). |
|
Directors and Officers (Unaudited) (continued)
Name,
Year of Birth
& Address |
Position(s)
Held with
the Funds |
Year
First
Elected or
Appointed (4) |
Principal
Occupation(s)
During Past 5 Years |
|
Diana
R. Gonzalez
1978
333 W. Wacker Drive
Chicago, IL 60606 |
Vice
President
and Assistant
Secretary |
2017
|
Vice
President and Assistant Secretary of Nuveen Fund Advisors, LLC (since 2017); Vice President and Associate General Counsel of Nuveen (since 2017); Associate General Counsel of Jackson National Asset Management (2012-2017). |
|
Nathaniel
T. Jones
1979
333 W. Wacker Drive
Chicago, IL 60606 |
Vice
President
and Treasurer |
2016
|
Managing
Director (since 2017), formerly, Senior Vice President (2016-2017), formerly, Vice President (2011- 2016) of Nuveen; Managing Director (since 2015) of Nuveen Fund Advisors, LLC; Chartered Financial Analyst. |
|
Walter
M. Kelly
1970
333 W. Wacker Drive
Chicago, IL 60606 |
Chief
Compliance
Officer and Vice
President |
2003
|
Managing
Director (since 2017), formerly, Senior Vice President (2008-2017) of Nuveen Investments Holdings, Inc. |
|
Tina
M. Lazar
1961
333 W. Wacker Drive
Chicago, IL 60606 |
Vice
President |
2002
|
Managing
Director (since 2017), formerly, Senior Vice President (2014-2017) of Nuveen Securities, LLC. |
|
Brian
J. Lockhart
1974
333 W. Wacker Drive
Chicago, IL 60606 |
Vice
President |
2019
|
Managing
Director (since 2019) of Nuveen Fund Advisors, LLC; Managing Director (since 2017), formerly, Vice President (2010-2017) of Nuveen; Head of Investment Oversight (since 2017), formerly, Team Leader of Manager Oversight (2015-2017); Chartered
Financial Analyst and Certified Financial Risk Manager. |
|
Jacques
M. Longerstaey
1963
8500 Andrew Carnegie Blvd.
Charlotte, NC 28262 |
Vice
President |
2019
|
Senior
Managing Director, Chief Risk Officer, Nuveen, LLC (since May 2019); Senior Managing Director (since May 2019) of Nuveen Fund Advisors, LLC; formerly, Chief Investment and Model Risk Officer, Wealth & Investment Management Division, Wells Fargo
Bank (NA) (from 2013-2019). |
|
Kevin
J. McCarthy
1966
333 W. Wacker Drive
Chicago, IL 60606 |
Vice
President
and Assistant Secretary |
2007
|
Senior
Managing Director (since 2017) and Secretary and General Counsel (since 2016) of Nuveen Investments, Inc., formerly, Executive Vice President (2016-2017) and Managing Director and Assistant Secretary (2008-2016); Senior Managing Director (since
2017) and Assistant Secretary (since 2008) of Nuveen Securities, LLC, formerly Executive Vice President (2016-2017) and Managing Director (2008-2016); Senior Managing Director (since 2017), Secretary (since 2016) and Co-General Counsel (since 2011)
of Nuveen Fund Advisors, LLC, formerly, Executive Vice President (2016-2017), Managing Director (2008-2016) and Assistant Secretary (2007-2016); Senior Managing Director (since 2017), Secretary (since 2016) and Associate General Counsel (since 2011)
of Nuveen Asset Management, LLC, formerly Executive Vice President (2016-2017) and Managing Director and Assistant Secretary (2011-2016); Senior Managing Director (since 2017) and Secretary (since 2016) of Nuveen Investments Advisers, LLC, formerly
Executive Vice President (2016-2017); Vice President (since 2007) and Secretary (since 2016), formerly, Assistant Secretary, of NWQ Investment Management Company, LLC, Symphony Asset Management, LLC, Santa Barbara Asset Management, LLC and Winslow
Capital Management, LLC (since 2010). Senior Managing Director (since 2017) and Secretary (since 2016) of Nuveen Alternative Investments, LLC. |
|
Jon
Scott Meissner
1973
8500 Andrew Carnegie Blvd.
Charlotte, NC 28262 |
Vice
President |
2019
|
Managing
Director of Mutual Fund Tax and Financial Reporting groups at Nuveen (since 2017); Managing Director of Nuveen Fund Advisors, LLC (since 2019); Senior Director of Teachers Advisors, LLC and TIAA-CREF Investment Management, LLC (since 2016); Senior
Director (since 2015) Mutual Fund Taxation to the TIAA-CREF Funds, the TIAA-CREF Life Funds, the TIAA Separate Account VA-1 and the CREF Accounts; has held various positions with TIAA since 2004. |
|
Name,
Year of Birth
& Address |
Position(s)
Held with
the Funds |
Year
First
Elected or
Appointed (4) |
Principal
Occupation(s)
During Past 5 Years |
|
Christopher
M. Rohrbacher
1971
333 W. Wacker Drive
Chicago, IL 60606 |
Vice
President
and
Secretary |
2008
|
Managing
Director (since 2017) and Assistant Secretary of Nuveen Securities, LLC; Managing Director (since 2017), formerly, Senior Vice President (2016-2017), Co-General Counsel (since 2019) and Assistant Secretary (since 2016) of Nuveen Fund Advisors, LLC;
Managing Director (since 2017), formerly, Senior Vice President (2012-2017) and Associate General Counsel (since 2016), formerly, Assistant General Counsel (2008-2016) of Nuveen. |
|
William
A. Siffermann
1975
333 W. Wacker Drive
Chicago, IL 60606 |
Vice
President |
2017
|
Managing
Director (since 2017), formerly Senior Vice President (2016-2017) and Vice President (2011-2016) of Nuveen. |
|
E.
Scott Wickerham
1973
TIAA
730 Third Avenue
New York, NY 10017 |
Vice
President
and Controller |
2019
|
Senior
Managing Director, Head of Fund Administration at Nuveen, LLC (since 2019), formerly, Managing Director; Senior Managing Director (since 2019), Nuveen Fund Advisors, LLC; Principal Financial Officer, Principal Accounting Officer and Treasurer
(since 2017) to the TIAA-CREF Funds, the TIAA-CREF Life Funds, the TIAA Separate Account VA-1 and the Treasurer (since 2017) to the CREF Accounts; Senior Director, TIAA-CREF Fund Administration (2014-2015); has held various positions with TIAA since
2006. |
|
Gifford
R. Zimmerman
1956
333 W. Wacker Drive
Chicago, IL 60606
|
Vice
President
and Assistant
Secretary |
1988
|
Managing
Director (since 2002), and Assistant Secretary of Nuveen Securities, LLC; Managing Director (since 2004) and Assistant Secretary (since 1994) of Nuveen Investments, Inc.; Managing Director (since 2002), Assistant Secretary (since 1997) and
Co-General Counsel (since 2011) of Nuveen Fund Advisors, LLC; Managing Director, Assistant Secretary and Associate General Counsel of Nuveen Asset Management, LLC (since 2011); Vice President (since 2017), formerly, Managing Director (2003-2017) and
Assistant Secretary (since 2003) of Symphony Asset Management LLC ; Managing Director and Assistant Secretary (since 2002) of Nuveen Investments Advisers, LLC; Vice President and Assistant Secretary of NWQ Investment Management Company, LLC (since
2002), Santa Barbara Asset Management, LLC (since 2006) and of Winslow Capital Management, LLC, (since 2010); Chartered Financial Analyst. |
|
(1)
Directors serve an indefinite term until his/her successor is elected or appointed. The year first elected or appointed represents the year in which the director was first elected or appointed to any
fund in the Nuveen fund complex.
(2)
Mr. Young was appointed as a Board Member of each of the Nuveen Funds except Nuveen Diversified Dividend and Income Fund and Nuveen Real Estate Income Fund.
(3)
“Interested person” of the Trust, as defined in the 1940 Act, by reason of her position with Nuveen, LLC. and certain of its subsidiaries.
(4)
Officers serve one year terms through August of each year. The year first elected or appointed represents the year in which the officer was first elected or appointed to any fund in the Nuveen fund
complex.
Nuveen:
Serving Investors for Generations
Since 1898, financial advisors and their clients have relied
on Nuveen to provide dependable investment solutions through continued adherence to proven, long-term investing principles. Today, we offer a range of high quality solutions designed to be integral components of a well-diversified core
portfolio.
Focused on meeting investor needs.
Nuveen is the investment manager of TIAA. We have grown into
one of the world’s premier global asset managers, with specialist knowledge across all major asset classes and particular strength in solutions that provide income for investors and that draw on our expertise in alternatives and responsible
investing. Nuveen is driven not only by the independent investment processes across the firm, but also the insights, risk management, analytics and other tools and resources that a truly world-class platform provides. As a global asset manager, our
mission is to work in partnership with our clients to create solutions which help them secure their financial future.
Find out how we can help you.
To learn more about how the products and services of Nuveen
may be able to help you meet your financial goals, talk to your financial advisor, or call us at (800) 257-8787. Please read the information provided carefully before you invest. Investors should consider the investment objective and policies, risk
considerations, charges and expenses of any investment carefully. Where applicable, be sure to obtain a prospectus, which contains this and other relevant information. To obtain a prospectus, please contact your securities representative or Nuveen,
333 W. Wacker Dr., Chicago, IL 60606. Please read the prospectus carefully before you invest or send money.
Learn more about Nuveen Funds at: www.nuveen.com/mutual-funds
Nuveen Securities, LLC, member FINRA and SIPC | 333 West Wacker Drive |
Chicago, IL 60606 | www.nuveen.com MAN-FSTK-1019P1032026-INV-Y-12/20
Nuveen Equity Funds
| Fund
Name |
Class
A |
Class
C |
Class
R3 |
Class
R6 |
Class
I |
| Nuveen
Mid Cap Growth Opportunities Fund |
FRSLX
|
FMECX
|
FMEYX
|
FMEFX
|
FISGX
|
| Nuveen
Small Cap Growth Opportunities Fund |
FRMPX
|
FMPCX
|
FMPYX
|
FMPFX
|
FIMPX
|
Beginning on January 1, 2021, as permitted by regulations
adopted by the Securities and Exchange Commission, paper copies of the Funds' annual and semi-annual shareholder reports will no longer be sent by mail, unless you specifically request paper copies of the reports. Instead, the reports will be made
available on the Funds' website (www.nuveen.com), and you will be notified by mail each time a report is posted and provided with a website link to access the report.
If you have already elected to receive shareholder reports
electronically, you will not be affected by this change and you need not take any action. You may elect to receive shareholder reports and other communications from the Funds electronically anytime by contacting the financial intermediary (such as a
broker-dealer or bank) through which you hold your Fund shares or, if you are a direct investor, by enrolling at www.nuveen.com/e-reports.
You may elect to receive all future shareholder reports in
paper free of charge at any time by contacting your financial intermediary or, if you are a direct investor, by calling 800-257-8787 and selecting option #1. Your election to receive reports in paper will apply to all funds held in your account with
your financial intermediary or, if you are a direct investor, to all your directly held Nuveen Funds and any other directly held funds within the same group of related investment companies.
Life is Complex.
Nuveen makes things e-simple.
It only takes a minute to sign up for
e-Reports. Once enrolled, you’ll receive an e-mail as soon as your Nuveen Fund information is ready. No more waiting for delivery by regular mail. Just click on the link within the e-mail to see the report and save it on your computer if you
wish.
Free e-Reports right to your
e-mail!
www.investordelivery.com
If you receive your Nuveen Fund
distributions and statements from your financial advisor or brokerage account.
or
www.nuveen.com/client-access
If you receive your Nuveen Fund
distributions and statements directly from Nuveen.
Must be preceded by or accompanied by a
prospectus.
NOT FDIC INSURED MAY
LOSE VALUE NO BANK GUARANTEE
Chair’s Letter to Shareholders
Dear Shareholders,
Financial markets have been receiving mixed messages over the
past year. The global economy has bifurcated, split between a slumping manufacturing sector and a resilient consumer. Confidence has been weakened among corporate managements, who are wary of trade frictions and moderating global growth, but has
remained elevated among consumers, who have benefited from tight labor markets and growing wages. As the economic cycle advances toward its later stage, corporate profits are shrinking and earnings forecasts are being downgraded. A waning growth
outlook has held interest rates near historically low levels, while stock market indexes have overcome periodic volatility to touch historical highs.
While we continue to anticipate slower economic growth and
increased market volatility, we note that recession fears have receded from earlier in the year. The U.S. economy held steady in the third quarter, and nearer-term economic indicators have provided upside surprises. Consumer confidence remains
underpinned by low unemployment and modest wage growth. Looser financial conditions, in part driven by the Federal Reserve’s three interest rate cuts in 2019, have revived momentum in the housing market and should continue to encourage
borrowing by consumers and businesses. Outside the U.S., Germany avoided a recession in the second half of 2019 and other eurozone economic indicators are pointing to stabilization and improving sentiment. Consumers in Europe and Japan, like those
in the U.S., have remained supported by jobs growth and rising wages. Although the outcomes of trade, Brexit and other geopolitical concerns continue to be uncertain, some clarity on these issues could be a potential source of upside.
At Nuveen, we still see investment opportunities in the
maturing economic environment, but we are taking a selective approach. If you’re concerned about where the markets are headed from here, we encourage you to work with your financial advisor to review your time horizon, risk tolerance and
investment goals. On behalf of the other members of the Nuveen Fund Board, we look forward to continuing to earn your trust in the months and years ahead.
Sincerely,
Terence J. Toth
Chair of the Board
December 23, 2019
Portfolio Managers’
Comments
Nuveen Mid Cap Growth
Opportunities Fund
Nuveen Small Cap Growth Opportunities
Fund
These Funds feature portfolio management by Nuveen
Asset Management, LLC (NAM), an affiliate of Nuveen, LLC.
Gregory J. Ryan, CFA, has been a portfolio manager of the
Nuveen Mid Cap Growth Opportunities Fund since March 2019.
Jon A. Loth, CFA, has been a portfolio manager for the Nuveen
Small Cap Growth Opportunities Fund since 2007.
Effective March 19, 2019, James Diedrich, CFA, and Harold
Goldstein are no longer portfolio managers of the Nuveen Mid Cap Growth Opportunities Fund, and Gregory J. Ryan was added as a portfolio manager for the Fund.
On the following pages, the portfolio management teams for the
Funds discuss the economy and financial markets, key investment strategies and the Funds’ performance for the twelve-month reporting period ended October 31, 2019.
What factors affected the U.S. economy and the U.S. stock market
during the twelve-month annual reporting period ended October 31, 2019?
The U.S. economy reached the tenth year of expansion since the
previous recession ended in June 2009, marking the longest expansion in U.S. history. In the third quarter of 2019, gross domestic product (GDP) grew at an annualized rate of 2.1%, according to the “second” estimate by the Bureau of
Economic Analysis. GDP measures the value of goods and services produced by the nation’s economy less the value of the goods and services used up in production, adjusted for price changes. Growth in consumer spending and the housing sector
helped offset a decline in business investment during the July to September 2019 period. By comparison, annualized GDP growth was 2.0% in the second quarter and 3.1% in the first quarter.
Consumer spending, the largest driver of the economy, remained
well supported by low unemployment, wage gains and tax cuts. As reported by the Bureau of Labor Statistics, the unemployment rate fell to 3.6% in October 2019 from 3.8% in October 2018 and job gains averaged around 174,000 per month for the past
twelve months. As the jobs market has tightened, average hourly earnings grew at an annualized rate of 3.0% in October 2019. However, falling energy prices dampened inflation over the past twelve months. The Bureau of Labor Statistics said the
Consumer Price Index (CPI) increased 1.8% over the twelve-month reporting period ended October 31, 2019 before seasonal adjustment.
Low mortgage rates and low inventory drove home prices
moderately higher in this reporting period, despite declining new home sales and housing starts. The S&P CoreLogic Case-Shiller U.S. National Home Price Index, which covers all nine U.S. census divisions, was up 3.2% year-over-year in September
2019 (most recent data available at the time this report was prepared). The 10-City and 20-City Composites reported year-over-year increases of 1.5% and 2.1%, respectively.
As data pointed to slower momentum in the overall economy, the
Federal Reserve (Fed) notably shifted its stance. Although the Fed had indicated in December 2018 that there could be two more rate hikes in 2019, global growth concerns kept the central bank on the sidelines. As expected by the markets, the Fed
left rates unchanged throughout the first half of 2019 while speculation increased that the Fed’s next move would be a rate cut. At the July 2019, September 2019 and October 2019 policy committee meetings, the Fed announced a 0.25% cut to its
main policy rate. Markets registered disappointment with the Fed’s explanation that the rate cuts
This material is not intended to be a recommendation or investment advice,
does not constitute a solicitation to buy, sell or hold a security or an investment strategy, and is not provided in a fiduciary capacity. The information provided does not take into account the specific objectives or circumstances of any particular
investor, or suggest any specific course of action. Investment decisions should be made based on an investor’s objectives and circumstances and in consultation with his or her advisors.
Certain statements in this report are forward-looking
statements. Discussions of specific investments are for illustration only and are not intended as recommendations of individual investments. The forward-looking statements and other views expressed herein are those of the portfolio managers as of
the date of this report. Actual future results or occurrences may differ significantly from those anticipated in any forward-looking statements and the views expressed herein are subject to change at any time, due to numerous market and other
factors. The Funds disclaim any obligation to update publicly or revise any forward-looking statements or views expressed herein.
Refer to the Glossary of Terms Used in this Report for further
definition of the terms used within this section.
Portfolio Managers’ Comments (continued)
were a “mid-cycle adjustment,” rather than a prolonged easing
period, and its signal that there would be no additional rate cuts in 2019. Also in the latter half of 2019, the Fed announced it would stop shrinking its bond portfolio sooner than scheduled, as well as began buying short-term Treasury bills to
help money markets operate smoothly and maintain short-term borrowing rates at low levels. Fed Chairman Powell emphasized that the Treasury bill purchases were not a form of quantitative easing.
During the twelve-month reporting period, geopolitical news
remained a prominent market driver. Tariff and trade policy topped the list of concerns, most prominently the U.S.-China relations. After several rounds of talks and a series of tariff increases, President Trump and President Xi agreed to another
temporary trade truce in late June 2019 that halted additional tariff increases. Tensions increased markedly after the July 2019 negotiations ended without an agreement, with both China and the U.S. increasing import duties. After setting new trade
meetings in September and October 2019, tariff waivers were announced on a selected group of U.S. and Chinese goods and the two sides signaled progress toward a partial trade deal. The U.S., Mexico and Canada Agreement (USMCA) trade deal replacing
the North American Free Trade Agreement had yet to be ratified by the national congresses (subsequent to the close of the reporting period, the trade deal was passed by the House of Representatives), while President Trump rescinded the threat to
impose tariffs on Mexico if the country didn’t take more action to curb illegal immigration. With the U.S. House of Representatives opening an impeachment inquiry into President Trump, ratification of the USMCA deal was expected to be delayed.
The Trump administration delayed imposing auto tariffs on the European Union (EU), as it continued to focus more on the China trade negotiations, but duties on $7.5 billion worth of EU goods including wine and cheese went into effect in October 2019
in retaliation for a dispute over aircraft subsidies. Global manufacturing and export data continued to show evidence of trade-related slumps, which increased worries that the slowdown would spread into other segments of the global economy.
In the U.K., Prime Minister Theresa May was unable to secure a
Brexit deal before the original March 29, 2019 deadline and resigned as of June 7, 2019. The EU extended the deadline to October 31, 2019, which Prime Minister May’s successor, Boris Johnson, was unable to meet after a series of political
maneuvers failed to secure an approval for his exit plan. In October 2019, the EU approved a “flextension” to January 31, 2020 and a U.K. general election was scheduled for December (subsequent to the close of the reporting period, on
December 19, 2019, the British Parliament passed the Brexit Bill). In Italy, investors worried about another potential budget clash between the eurosceptic coalition government and the EU. However, following the unexpected resignation of the prime
minister in August 2019, the newly formed coalition government appeared to take a less antagonistic stance. Europe also contended with the “yellow vest” protests in France, immigration policy concerns, Russian sanctions and political
risk in Turkey.
Elections around the world also remained
a source of uncertainty. Markets continued to closely monitor the new administrations in Brazil and Mexico, as well as Argentina’s presidential election. Incumbent candidate President Macri, seen as market-friendly, suffered a surprising
defeat in the August 2019 primary, and the Peronist ticket of Alberto Fernandez/Cristina Fernandez de Kirchner won as expected in the October 2019 election. Europe’s traditional centrist parties lost seats in the Parliamentary elections and
populist parties saw marginal gains. The ruling parties in India and South Africa maintained their majorities, where slower economic growth could complicate their respective reform mandates.
In the U.S., the longest bull market on record continued, but
not without significant bouts of volatility. Stocks sold off sharply in December 2018, leading the bellwether S&P 500® to record its lowest
monthly return since 1931. Although economic data was mostly positive and corporate earnings growth continued to far exceed expectations, a broad array of issues weighed on investor sentiment at the end of 2018, sparking extreme stock market
volatility. Investors were concerned about ongoing political discord, trade friction with China, the path and pace of Fed rate increases and the partial U.S. government shutdown. Fueled by better-than-expected fourth-quarter 2018 earnings, equities
rebounded sharply in the beginning of 2019 through April. However, markets continued to be quite volatile, selling off in May due to changing expectations regarding trade and Fed policy, as well as concerns about slowing economic growth. During the
summer months, stock markets advanced strongly again with the S&P 500® hitting an all-time high above 3000 in late July before falling in
August. Markets remained choppy and continued to struggle for footing amid escalating trade tensions, weaker Chinese economic data, protests in Hong Kong, increasing recession fears and the growing prevalence of negative interest rates worldwide. In
the final month of the reporting period, however, the S&P 500 hit new all-time highs as investors celebrated better-than-expected corporate earnings, some signs of clarity regarding Brexit, broad monetary easing across the globe and optimism
surrounding progress on the U.S./China trade front.
U.S. large-cap companies produced strong gains during the
reporting period and handily outpaced smaller-sized companies by nearly 10%, with the S&P 500 advancing 14.33%. Ten of the eleven sectors within the index ended the twelve-month reporting period in positive territory, led by more than 20% gains
in two sectors (real estate and utilities) as well as in the information technology sector. Energy was the only S&P 500 sector in the red during the reporting period, pressured lower by falling energy prices due to slowing growth and oversupply.
Small-cap equities underperformed larger-cap stocks during the reporting period, likely weighed down more by trade tensions, increasing evidence of economic deceleration and rising political uncertainty stemming from mounting impeachment rhetoric in
Washington D.C. The segment gained 4.90% over the reporting period as measured by the Russell 2000 Index. From a style perspective, growth-oriented stocks continued their long-running trend of outperforming value stocks across the capitalization
spectrum, benefiting on a relative basis from slowing corporate profit growth.
In developed markets outside the U.S., geopolitical issues in
Europe including the chaos surrounding Brexit, markedly slower economic growth across Europe and in particular Germany, and the negative impact of the trade war at times created headwinds for stocks. However, by the end of the reporting period,
markets still advanced fairly strongly as optimism increased regarding both trade negotiations and Brexit, recording an 11.04% according to the MSCI EAFE Index. The same issues also produced headwinds for emerging markets, especially China’s
slowdown since these regions tend to be more reliant on that economy, and the rising U.S. dollar. But these markets also gained footing, producing an 11.86% return in U.S. dollar terms during the reporting period, as measured by the MSCI Emerging
Markets Index.
Nuveen Mid Cap Growth Opportunities
How did the Fund perform during the twelve-month reporting period
ended October 31, 2019?
The tables in the Fund
Performance and Expense Ratios section of this report provide total returns for the Fund for the one-year, five-year, ten-year and/or since inception periods ended October 31, 2019. Comparative performance information is provided for the
Fund’s Class A Shares at net asset value (NAV). The Fund’s Class A Shares at NAV underperformed both the Russell Midcap® Growth Index
and the Lipper Mid-Cap Growth Funds Classification Average during the twelve-month reporting period.
What strategies were used to manage the Fund during the
reporting period and how did these strategies influence performance?
The Fund pursues a long-term capital appreciation strategy by
investing primarily in the common stocks of companies with market capitalizations at the time of purchase between approximately $1 billion and $38 billion, which is based on the June 28, 2019 reconstitution of the Russell Midcap® Index. We continue to focus on building a well-diversified portfolio of high quality, mid-cap growth companies. We target companies with sound
business models, strong competitive advantages, and where our expectations for earnings growth exceed consensus expectations. For each holding, we develop a proprietary growth thesis. We revisit the thesis on a quarterly basis to ensure that both
our short-term and long-term catalysts remain intact. When the growth thesis is validated, we hold or buy more; however, when our growth thesis is not validated, we sell the holding. Although we made individual position changes during the reporting
period, our underlying investment strategy remained consistent.
The Fund’s underperformance versus the Russell benchmark
and Lipper peers was primarily due to stock selection in the consumer discretionary, financial, information technology and energy sectors. Results were also hampered by an underweight position in the real estate sector, the strongest performing area
in the index during the reporting period. On the other hand, the Fund benefited from strong security selection in the industrials sector.
In the consumer discretionary sector, the Fund saw weak
results from a position in Grand Canyon Education Inc., an education services company that offers undergraduate and graduate degree program services to universities, including its largest client Grand Canyon University. The company has reported
strong results with both revenue and earnings topping expectations over the past year. Unfortunately, Grand Canyon has been impacted by regulatory and political concerns, which included the U.S. Department of Education issuing guidance on the 2016
State Authorization Regulations. We exited our position.
Portfolio Managers’ Comments (continued)
We also saw disappointing results from Ralph Lauren Corp, a
leading lifestyle brand that offers apparel, accessories and home furnishings across its namesake brand. The company reported better-than-expected results during its May 2019 quarterly report and provided an outlook that was slightly better than
expectations. However, concerns about the North American wholesale business, which was down 10% during the quarter, caused the stock to underperform. We continued to hold the name because we believed stabilization within its North American wholesale
business would be a catalyst going forward.
In the
financial area, we saw weak results from a position in E*TRADE Financial Corporation, the provider of online brokerage, banking and other related products to individual retail investors. The company reported results that were better than
expectations across the board, with strong revenue and expense control driving strong operating leverage and earnings upside. However, E*TRADE Financial was negatively impacted at times as macroeconomic concerns drove a weaker and more volatile
stock market. Because sentiment toward the company is driven by trading volume, its shares underperformed. We exited our position after pricing competition increased.
In the information technology sector, our position in IT
consulting firm DXC Technology Co. was a major source of weakness. The company posted several disappointing quarter, specifically in its global infrastructure services segment. Margins also missed on lower revenue and cost-cutting delays and
management lowered fiscal-year 2020 revenue and earnings per share (EPS) guidance. Given the stock’s persistent weakness and deteriorating outlook, we exited the Fund’s position in DXC Technology.
On the other hand, the information technology sector was also
home to several strong performers, including First Data Corp. The company is a provider of electronic commerce and payment solutions for merchants, financial institutions and card issuers globally. In January 2019, Fiserv announced an all-stock
acquisition of First Data in a $22 billion deal that equated to an approximately 30% premium to the prior close. The company also reported favorable revenue and EPS results that beat expectations and favorable 2019 earnings growth guidance. We
continued to hold our position because we believe the combined entity will benefit from synergy upside and revenue cross-sell opportunities that will drive upside estimates.
Also in the technology sector, the Fund saw strong results
from a position in Shopify Inc., the leading multi-channel commerce platform that offers small, mid-sized and, increasingly, larger merchants the capabilities to develop and manage their businesses. Shopify reported results above expectations with
revenue and gross merchandise volume both coming in well above consensus. Company management also raised the revenue and operating outlook for the full year. We exited our position after our growth thesis played out and we were unable to identify
additional catalysts.
Shares of CDW Corp., a provider of
technology solutions to business, government, education and health care, also performed well. The company’s products range from hardware and software to integrated IT solutions such as security, cloud, data center and networking. CDW has had a
successful year with strong topline growth as it benefits from better-than-expected contribution from the U.S census device-as-a-service engagement. We continued to hold CDW because potential new use cases and device-as-a-service potential keep us
bullish on the company into 2020.
Finally, we saw
favorable results from Cadence Design Systems Inc., the leading supplier of automation tools for designing semiconductor chips and electronic systems. The company continued to benefit from positive industry tailwinds including increasing silicon
content in autos, autonomous driving, artificial intelligence/machine learning designs and increasing chip complexity. These drivers resulted in strong execution with results exceeding expectations. More importantly, Cadence Design’s outlook
for 2019 is favorable with revenue, EPS and free cash flow all coming in above expectations. We have maintained our position.
In the energy sector, a position in exploration and production
company Marathon Oil Corp detracted from performance. The company has assets located in the Eagle Ford, Williston Basin, Oklahoma and Northern Delaware. Although Marathon Oil reported results in line with expectations with revenue and earnings in
line with consensus, production came in below expectations as the company remains focused on free cash flow generation. During the reporting period, we decided to exit our position because we believed that free cash flow generation would be slower
to materialize and could cause the shares to underperform.
In the health care sector, a position in Cigna Corp weighed on
the Fund’s performance. The company reported strong earnings in its most recent quarterly release, but the stock struggled as investors focused on lower membership growth guidance. Given the political uncertainty surrounding universal health
care, we exited our position.
The Fund also experienced weak results from a position in
Sarepta Therapeutics Inc., a commercial stage biotechnology company that develops and markets products for treatment of patients with Duchenne Muscular Dystrophy (DMD). The company has one product on the market (eteplirsen), a second that has been
filed with the FDA (golodirsen) and a third product (casimersen) to be filed this year. Sarepta Therapeutics also has a promising gene therapy platform with an advanced program for DMD. Despite reporting strong quarterly results with sales up 29%,
the stock was down significantly because the Food and Drug Administration (FDA) issued a complete response letter instead of the expected approval for golodirsen. We believe the FDA’s issues are addressable and that the company’s
advancing gene therapy program for DMD is the largest driver for the stock long term. Therefore, we continued to hold Sarepta Therapeutics in the portfolio.
We were also disappointed with results from Centene Corp, a
managed care insurer focused on government programs like Medicaid and Medicare. The company reported results that beat expectations during its most recent quarter with revenue up 29% and earnings up 49% driven by strong membership gains and the
acquisition of Fidelis. However, Centene’s stock declined rather sharply due to the loss of the Louisiana Medicaid contract and delayed contract awards from Texas. We remained invested in Centene because of its strong fundamentals and our
belief that the outcome of the election will not likely have a significant impact on government insurance programs.
On the other hand, the health care sector held several
standouts performers, including Novocure Limited. The company has developed a unique device, Optune, which uses electrical fields to disrupt cancer cell division in the treatment of solid tumors. Data from clinical trials in glioblastoma patients
with two years on Optune therapy in addition to chemotherapy showed an improvement in the five-year survival rate of 29% versus 5% using chemotherapy alone. Novocure has growing evidence that Optune should work in many other solid tumors and is
currently seeking FDA approval to treat mesothelioma. Shares outperformed after the company received positive backing from a Medicare reimbursement panel in March 2019 for covering glioblastoma treatment. We decided to sell our position in Novocure
because it reached our price target and we couldn’t identify further short-term catalysts to push our target higher.
Also, shares of Insulet Corp, manufacturer of the Omnipod
tubeless insulin pump for diabetes, performed strongly. In the most recent quarter, the company reported strong results with sales up 43%, beating expectations by 8%, combined with a 4% guidance raise. The company also reiterated intact timelines
for its Horizon closed-loop diabetes management technology, which is set to launch in the second half of 2020. Insulet also continued to grow successfully through the pharmacy channel, which is considerably more attractive from a patient
perspective. Given the strong secular growth fundamentals, we continue to hold the name.
Stock selection was favorable in the industrials sector where
the Fund benefited from TransDigm Group Inc. The company is a leading global designer, producer and supplier of highly engineered aircraft components for commercial and military aircraft. TransDigm has executed very well over the past six months as
strong end-market demand within Defense and Commercial Original Equipment has driven double-digit topline organic growth. We have maintained the Fund’s position in TransDigm.
Trex Co Inc, a leading manufacturer of composite lumber
products used primarily in residential and commercial decking, also performed well. The company reported top-line results that exceeded expectations, driven by strong customer demand for its lower-cost Enhance product that is sold through the mass
channel. Trex continues to benefit from the secular growth story of customers transitioning from wood to composite in the opening and middle price points. We are beginning to see these trends accelerate as evidenced by the company expecting 25% plus
growth in its fiscal third quarter. We continue to hold Trex because we expect double-digit top-line growth over the next year as customers continue to migrate to maintenance-free decking options.
Finally, in the communication services sector, shares of the
pay-per-view provider World Wrestling Entertainment Inc. dropped after the company announced disappointing first-quarter results. The company reported lower live event ticket revenue and merchandise sales and also a temporary dislocation in
available talent. World Wrestling also noted a delay in completing its MENA (Middle East North Africa) rights deal and increased content investments. We continued to own the position in the Fund’s portfolio because we believe the company is a
secular media story that can continue to generate strong revenue growth on content rights.
Portfolio Managers’ Comments (continued)
Nuveen Small Cap Growth Opportunities Fund
How did the Fund perform during the twelve-month reporting period
ended October 31, 2019?
The tables in the Fund
Performance and Expense Ratios section of this report provide total returns for the Fund for the one-year, five-year, ten-year and/or since inception periods ended October 31, 2019. Comparative performance information is provided for the
Fund’s Class A Shares at net asset value (NAV). The Fund’s Class A Shares at NAV underperformed both the Russell 2000® Growth Index and
the Lipper Small-Cap Growth Funds Classification Average during the twelve-month reporting period.
What strategies were used to manage the Fund during the reporting
period and how did these strategies influence performance?
The Fund pursues a long-term capital growth strategy by
investing primarily in equity securities of smaller-sized companies with market capitalizations within the market capitalization range of approximately $40 million to $10.3 billion at the time of purchase, which is based on the most recent
reconstitution of the Russell 2000® Index that occurred on June 28, 2019. The investment process employed in the management of the Fund seeks to
exploit secular growth trends that we believe will provide an investment tailwind to above-average growth that should transcend the business cycle over the longer term. Importantly, our process also emphasizes a valuation discipline designed to find
attractive investment opportunities that should benefit from multiple expansion when particular investment catalysts become evident in the marketplace. The Fund’s portfolio typically features investments in high quality companies with
attractive or improving margin profiles, generally healthy balance sheets and prospects for above-average revenue and earnings growth.
Small-cap equities underperformed larger-cap stocks during the
reporting period amid escalating trade tensions with China, increasing evidence of economic deceleration and rising political uncertainty stemming from mounting impeachment rhetoric in Washington. The segment saw a significant divergence in
performance among sectors, with the utilities and real estate “bond proxy” sectors as well as information technology stocks producing exceptionally strong returns during the reporting period. Meanwhile, small-cap energy producers were
poor performers throughout the reporting period, but most notably during the final months of 2018 as investors grappled with falling oil prices, an inverted Treasury yield curve and heightened concerns about recession.
The Fund’s underperformance versus the Russell benchmark
and Lipper peers was primarily due to stock selection in the financial and energy sectors. Results were also hampered by underweight positions in utilities and real estate, and a slight overweight in energy. On the other hand, security selection was
strong in the information technology, health care and consumer discretionary sectors. Also, the Fund’s performance benefited from our largest sector overweight versus the Russell benchmark in the information technology sector and an
underweight to communication services.
Although the
Fund’s positioning in regional banks and insurance was positive in financial services, it was outweighed to the downside by the performance of Green Dot Corp in the consumer finance category. Green Dot reported second-quarter financial results
that showed continued deterioration in its non-direct deposit card business. These results did not calm investor concerns over a major customer contract renewal and highlighted rising competition from other payment service providers. Therefore, we
exited our position.
On the other hand, continued
healthy credit conditions offset some of the pressure from falling interest rates and concerns over narrowing net interest margins in the financial sector. Kinsale Capital Group Inc., a high-growth provider of excess and surplus insurance, saw its
shares propelled higher. The firm reported first-quarter results that featured higher-than-expected gross written premiums coupled with a lower loss ratio, lower tax rate and room for pricing growth. We continued to own Kinsale Capital at the end of
the reporting period based on the favorable pricing dynamic in this niche insurance category.
As noted, small-cap energy producers were poor performers and
two independent oil and natural gas exploration and production companies, Callon Petroleum Co and Matador Resources Company, were no exceptions. Despite the companies achieving their production targets and outlining paths toward cash flow
neutrality, their shares were negatively impacted by the broader backdrop. We eliminated these positions based on what appears to be persistent negative sentiment for North American-based energy producers, most likely stemming from peak market
productivity, coupled with the significant reduction in the sector’s weight within the Russell 2000® Growth Index.
In the communication services sector, shares of the
pay-per-view provider World Wrestling Entertainment Inc. dropped after the company announced soft first-quarter results. The company reported lower live event ticket revenue and merchandise sales and also a temporary dislocation in available talent.
However, management believed it could make up for these shortfalls in the second half of 2019. We continue to own World Wrestling Entertainment in the Fund’s portfolio based on a significant step up in profitability that we expect from the
formalization of major international contracts.
Results
were strong in information technology where the Fund benefited from merger and acquisition activity in the sector. The Fund’s leading contribution came from a position in Carbon Black Inc., a provider of endpoint security solutions that
include antivirus, malware and response. Earlier in the reporting period, the company reported solid first-quarter results with improved revenues, stabilized annual recurring revenue and 17% growth in billings that sent shares higher. Then in August
2019, shares surged on news that VMware had agreed to acquire the company for $26 per share. The deal represented a premium to the previous close, although the stock had already rallied well in advance of the announcement. Given the transaction was
an all-cash deal and we didn’t expect another bidder to step in, we exited our position.
The Fund also benefited from a position in SendGrid Inc., a
leading provider of cloud-based systems to assist companies with mass e-mail delivery. Shares surged ahead based on news that the company would be acquired by Twilio, a leading messaging application programming interface (API) company, in an
all-stock deal valued at around $2 billion. Following shareholder approval of the deal, we decided to take profits and exited the Fund’s position in SendGrid.
The Fund also saw strong results from InterXion Holding NV, a
pure-play European datacenter services provider. The company benefited from strong capacity demand from enterprise customers for cloud services, which resulted in a steady improvement in operating margins. At the end of the reporting period, San
Francisco-based Digital Realty Trust announced the acquisition of InterXion in a stock deal valued at $8.4 billion, making it Europe’s second largest data center provider. We are currently in the process of seeking alternatives among
information technology services candidates as a replacement.
On the other hand, the information technology sector was home
to one significant detractor during the reporting period. Shares of communications equipment provider Poly (formerly known as Plantronics until March 2019) retreated after advancing earlier in the reporting period. The company is the leading
provider of a full range of commercial grade hardware enabling next-generation Unified Communication solutions. Poly reported disappointing results later in the reporting period as revenue came in below expectations due to the trade tensions with
China and Microsoft accelerating the transition to Teams from Skype for Business. The company currently doesn’t have a product to serve Teams and as a result, revenue from Microsoft was negatively impacted. Given our belief that the Microsoft
and China issues will linger through fiscal 2020, we exited the Fund’s position in Poly.
The health care sector was under pressure during the reporting
period and recorded negative returns partially as a result of the House of Representatives’ move on impeachment discussions, which led investors to believe that a more progressive stance on health care policy is a higher probability. However,
the Fund was able to overcome some of the broader-based issues with favorable stock selection in the sector. Insulet Corp, the manufacturer of the Omnipod insulin pump for diabetes, reiterated intact timelines for its Horizon closed-loop diabetes
management technology, which is set to launch in the second half of 2020. Insulet accelerated its penetration into the Type II market and continued to grow successfully through the pharmacy channel, which is considerably more attractive from a
patient perspective. With the shares having achieved our valuation objective and with its market capitalization exceeding our parameters, we closed the position later in the reporting period.
On the other hand, Merit Medical Systems Inc., a manufacturer
of a wide range of medical products for diagnostic and therapeutic uses, reported a shortfall in organic growth resulting from order timing and product delays. Unfortunately, the update was accompanied by gross margin weakness that we believed would
present ongoing challenges for the company, which led us to exit the position.
We also saw weakness early on from Cambrex Corp., a
pharmaceutical contract manufacturing and development organization. Shares suffered after the company announced underwhelming third-quarter results that were obscured by a change in accounting regulations and a partial-period contribution from a
recently closed acquisition that provided investors with an underwhelming account of organic growth. This led us to question management’s timeframe for earnings accretion and we exited the position.
Portfolio Managers’ Comments (continued)
Results were also favorable overall in the consumer
discretionary sector during the reporting period. Despite a sluggish start to the spring homebuilders selling season due to weather, shares of LGI Homes Inc., a company that specializes in the starter home segment, performed well. The company
experienced 15% growth in home sales revenues aided by mortgage rates falling below 4.50% and the company’s lower-end price point. Given the stock’s strong performance coupled with its valuation relative to others in the homebuilding
group, we took profits in the position during the reporting period.
On the other hand, the Fund experienced weak results from a
position in Children’s Place Inc., a specialty retailer of clothing for children and toddlers. Shares lagged over the past year as the company dealt with a challenging transition toward increased online sales that was beset by supply issues.
Also, the bankruptcies of two of the company’s larger competitors created a highly promotional environment in the category, while the ongoing issues associated with the onset of Chinese tariffs weighed on shares. Given multiple headwinds to
our thesis, we exited Children’s Place in favor of more growth-oriented alternatives away from specialty retail.
The industrial sector was also home to several standouts
during the reporting period. In the aerospace and defense group, Mercury Systems Inc., a manufacturer of best-of-breed sensor and systems technologies for prime defense contractors that allows customers to upgrade existing technologies without the
need for entirely new systems, continued to benefit from defense prime contractors. This resulted in healthy order rates, which drove backlog gains and aided forward visibility. We maintained our position in Mercury Systems at the end of the
reporting period.
The Fund also saw strong results from
a position in CSW Industrials Inc. in the sector. The company reported another quarterly surprise to the upside in its fiscal fourth quarter ended March 2019. Estimates have risen following a few quarterly beats as conditions remain favorable in key
end markets including HVAC, plumbing and specialty chemicals. CSW Industrials also announced a capital deployment plan, including some accretive niche acquisitions, share repurchases and initiation of a nominal dividend, which was well received.
This highlighted what we view as a continuing attractive free cash flow profile and we maintained our position.
Shares of MasTec Inc., a leading engineering contractor
focused on communications and energy-related projects, performed strongly. The company posted another healthy quarterly update that featured positive commentary on the anticipated 5G/fiber ramp in communications that should lead to improved
utilization and margins. Oil and gas execution remained impressive, with margins staying ahead of target and order opportunities continuing, both for smaller-scale gathering work and continued larger opportunities. Electrical transmission work also
appeared to be recovering as well. We believed all of these factors portend a continued healthy runway for MasTec’s fundamentals and maintained our position.
The Fund also benefited from a position in Gibraltar
Industries Inc., a leading provider of building products to the industrial, infrastructure and residential markets. The stock gained in recent months after earnings were met and more recently in the third quarter, beat expectations. Also, full-year
profit guidance drifted higher supported by strong backlog gains in renewables, better residential prospects with a stronger housing market and improved weather and acquisition upside. We see further earnings upside into 2020 and continue to view
potential strategic mergers and acquisitions as a key catalyst for the company going forward. Although we trimmed our weight based on valuation, we maintained a position in Gibraltar Industries due to solid execution and good fundamentals.
Two holdings also detracted in the industrial sector,
including SiteOne Landscape Supply Inc., one of the largest suppliers of outdoor lighting, fertilizers, grass seeds, turf care equipment and golf course accessories in the U.S. and Canada. The company’s shares were pressured during the year by
issues related to the China trade dispute as well as negative weather impacts. Additionally, the cadence of acquisition opportunities slowed, which created investor uncertainties around the pace of deal closures and helped to compress the
share’s valuation. This led us to move away from the name in favor of more growth-oriented industrials.
Also in the industrial sector, Welbilt Inc., a global provider
of commercial food service equipment, saw its shares slump earlier in the reporting period. The company issued a guidance reduction to its fourth quarter driven by mix issues, supply chain problems, cost overruns and continued demand spottiness.
Therefore, we exited our position in Welbilt in November 2018 given the lack of near-term catalysts, the challenging backdrop in the category and a CEO transition, which may extend the time needed to regain lost business momentum.
Nuveen Mid
Cap Growth Opportunities Fund
Mutual fund investing
involves risk; principal loss is possible. There is no guarantee that the Fund’s investment objectives will be achieved. Prices of equity securities may decline significantly over short or extended
periods of time. Investments in mid-cap companies are subject to greater volatility than those of larger companies, but may be less volatile than investments in smaller companies. These and other risk
considerations, such as derivatives, investment focus (growth style), and non-U.S./emerging markets risks, are described in detail in the Fund’s prospectus.
Nuveen Small Cap Growth Opportunities Fund
Mutual fund investing involves risk; principal loss is
possible. There is no guarantee that the Fund’s investment objectives will be achieved. Prices of equity securities may decline significantly over short or extended periods of time. Investments in smaller companies are subject to greater volatility than those of larger companies. These and other risk considerations, such as derivatives, investment focus (growth style), and non-U.S./emerging markets risks, are
described in detail in the Fund’s prospectus.
THIS PAGE INTENTIONALLY LEFT BLANK
Fund Performance and Expense Ratios
The Fund
Performance and Expense Ratios for each Fund are shown within this section of the report.
Returns quoted represent past performance, which is no guarantee
of future results. Investment returns and principal value will fluctuate so that when shares are redeemed, they may be worth more or less than their original cost. Current performance may be higher or lower than the
performance shown. Total returns for a period of less than one year are not annualized. Returns at net asset value (NAV) would be lower if the sales charge were included. Returns assume reinvestment of dividends and capital gains. For performance,
current to the most recent month-end visit nuveen.com or call (800) 257-8787.
Returns do not reflect the deduction of taxes that a
shareholder would pay on Fund distributions or the redemption of Fund Shares.
Returns may reflect fee waivers and/or expense reimbursements
by the investment adviser during the periods presented. If any such waivers and/or reimbursements had not been in place, returns would have been reduced. See Notes to Financial Statements, Note 7—Management Fees and Other Transactions with
Affiliates for more information.
Returns reflect
differences in sales charges and expenses, which are primarily differences in distribution and service fees, and assume reinvestment of dividends and capital gains.
Comparative index and Lipper return information is provided
for Class A Shares at NAV only.
The expense ratios shown
reflect total operating expenses (before fee waivers and/or expense reimbursements, if any) as shown in the most recent prospectus. The expense ratios include management fees and other fees and expenses.
Fund Performance and Expense Ratios (continued)
Nuveen Mid Cap Growth Opportunities Fund
Refer
to the first page of this Fund Performance and Expense Ratios section for further explanation of the information included within this section. Refer to the Glossary of Terms Used in this Report for definitions of terms used within this
section.
Fund Performance
Average Annual Total Returns as of October 31, 2019
| |
Average
Annual |
| |
1-Year
|
5-Year
|
10-Year
|
| Class
A Shares at NAV |
13.43%
|
7.83%
|
12.64%
|
| Class
A Shares at maximum Offering Price |
6.92%
|
6.56%
|
11.97%
|
| Russell
Midcap® Growth Index |
18.93%
|
10.92%
|
14.76%
|
| Lipper
Mid-Cap Growth Funds Classification Average |
15.91%
|
10.17%
|
13.52%
|
| Class
C Shares |
12.58%
|
7.03%
|
11.80%
|
| Class
R3 Shares |
13.15%
|
7.56%
|
12.36%
|
| Class
I Shares |
13.73%
|
8.11%
|
12.92%
|
| |
Average
Annual |
| |
1-Year
|
5-Year
|
Since
Inception |
| Class
R6 Shares |
13.85%
|
8.25%
|
11.14%
|
Average Annual Total Returns as of
September 30, 2019 (Most Recent Calendar Quarter)
| |
Average
Annual |
| |
1-Year
|
5-Year
|
10-Year
|
| Class
A Shares at NAV |
0.50%
|
8.22%
|
12.12%
|
| Class
A Shares at maximum Offering Price |
(5.28)%
|
6.94%
|
11.46%
|
| Class
C Shares |
(0.23)%
|
7.41%
|
11.28%
|
| Class
R3 Shares |
0.27%
|
7.95%
|
11.84%
|
| Class
I Shares |
0.77%
|
8.49%
|
12.40%
|
| |
Average
Annual |
| |
1-Year
|
5-Year
|
Since
Inception |
| Class
R6 Shares |
0.90%
|
8.64%
|
11.21%
|
Since inception returns for Class R6
Shares are from 2/28/13. Indexes and Lipper averages are not available for direct investment.
Class A Shares have a maximum 5.75% sales charge (Offering
Price). Class A Share purchases of $1 million or more are sold at net asset value without an up-front sales charge but may be subject to a contingent deferred sales charge (CDSC) of 1% if redeemed within eighteen months of purchase. Class C Shares
have a 1% CDSC for redemptions within less than twelve months, which is not reflected in the total returns. Class C Shares automatically convert to Class A Shares ten years after purchase. Class R3 Shares have no sales charge and are only available
for purchase by eligible retirement plans. Class R6 Shares have no sales charge and are available only to certain limited categories of investors as described in the prospectus. Class I Shares have no sales charge and may be purchased under limited
circumstances or by specified classes of investors.
Expense Ratios as of Most Recent Prospectus
| |
Share
Class |
| |
Class
A |
Class
C |
Class
R3 |
Class
R6 |
Class
I |
| Gross
Expense Ratios |
1.24%
|
1.99%
|
1.49%
|
0.85%
|
0.99%
|
| Net
Expense Ratios |
1.18%
|
1.93%
|
1.43%
|
0.79%
|
0.93%
|
The Fund's investment adviser has
contractually agreed to waive fees and/or reimburse other Fund expenses through July 31, 2021, so that total annual fund operating expenses (excluding 12b-1 distribution and/or service fees, interest expenses, taxes, acquired fund fees and expenses,
fees incurred in acquiring and disposing or portfolio securities and extraordinary expenses) do not exceed 0.92% of the average daily net assets of any class of Fund shares. However, because Class R6 Shares are not subject to sub-transfer agent and
similar fees, the total annual Fund operating expenses for the Class R6 Shares will be less than the expense limitation. This expense limitation may be terminated or modified prior to that time without the approval of the Board of Directors of the
Fund.
Growth of an Assumed $10,000 Investment as of
October 31, 2019 – Class A Shares
The graphs do not reflect
the deduction of taxes that a shareholder may pay on Fund distributions or the redemption of Fund shares.
Fund Performance and Expense Ratios (continued)
Nuveen Small Cap Growth Opportunities Fund
Refer
to the first page of this Fund Performance and Expense Ratios section for further explanation of the information included within this section. Refer to the Glossary of Terms Used in this Report for definitions of terms used within this
section.
Fund Performance
Average Annual Total Returns as of October 31, 2019
| |
Average
Annual |
| |
1-Year
|
5-Year
|
10-Year
|
| Class
A Shares at NAV |
5.47%
|
7.87%
|
12.64%
|
| Class
A Shares at maximum Offering Price |
(0.61)%
|
6.60%
|
11.98%
|
| Russel
2000® Growth Index |
6.40%
|
8.38%
|
13.38%
|
| Lipper
Small-Cap Growth Funds Classification Average |
7.83%
|
8.98%
|
13.31%
|
| Class
C Shares |
4.74%
|
7.08%
|
11.81%
|
| Class
R3 Shares |
5.23%
|
7.61%
|
12.36%
|
| Class
I Shares |
5.78%
|
8.15%
|
12.93%
|
| |
Average
Annual |
| |
1-Year
|
Since
Inception |
| Class
R6 Shares |
6.13%
|
13.62%
|
Average Annual Total Returns as of
September 30, 2019 (Most Recent Calendar Quarter)
| |
Average
Annual |
| |
1-Year
|
5-Year
|
10-Year
|
| Class
A Shares at NAV |
(10.84)%
|
8.20%
|
11.59%
|
| Class
A Shares at maximum Offering Price |
(15.97)%
|
6.92%
|
10.94%
|
| Class
C Shares |
(11.49)%
|
7.40%
|
10.76%
|
| Class
R3 Shares |
(11.03)%
|
7.93%
|
11.32%
|
| Class
I Shares |
(10.61)%
|
8.47%
|
11.87%
|
| |
Average
Annual |
| |
1-Year
|
Since
Inception |
| Class
R6 Shares |
(10.47)%
|
12.70%
|
Since inception returns for Class R6
Shares are from 6/30/16. Indexes and Lipper averages are not available for direct investment.
Class A Shares have a maximum 5.75% sales charge (Offering
Price). Class A Share purchases of $1 million or more are sold at net asset value without an up-front sales charge but may be subject to a contingent deferred sales charge (CDSC) of 1% if redeemed within eighteen months of purchase. Class C Shares
have a 1% CDSC for redemptions within less than twelve months, which is not reflected in the total returns. Class C Shares automatically convert to Class A Shares ten years after purchase. Class R3 Shares have no sales charge and are only available
for purchase by eligible retirement plans. Class R6 Shares have no sales charge and are available only to certain limited categories of investors as described in the prospectus. Class I Shares have no sales charge and may be purchased under limited
circumstances or by specified classes of investors.
Expense Ratios as of Most Recent Prospectus
| |
Share
Class |
| |
Class
A |
Class
C |
Class
R3 |
Class
R6 |
Class
I |
| Gross
Expense Ratios |
1.39%
|
2.14%
|
1.64%
|
1.04%
|
1.14%
|
| Net
Expense Ratios |
1.25%
|
2.00%
|
1.50%
|
0.89%
|
1.00%
|
The Fund’s investment adviser
has contractually agreed to waive fees and/or reimburse other Fund expenses through July 31, 2021, so that total annual Fund operating expenses (excluding 12b-1 distribution and/or service fees, interest expenses, taxes, acquired fund fees and
expenses, fees incurred in acquiring and disposing of portfolio securities and extraordinary expenses) do not exceed 0.99% of the average daily net assets of any class of Fund shares. However, because Class R6 Shares are not subject to sub-transfer
agent and similar fees, the total annual Fund operating expenses for the Class R6 Shares will be less than the expense limitation. This expense limitation may be terminated or modified prior to that date only with the approval of the Board of
Directors of the Fund.
Growth of an Assumed $10,000
Investment as of October 31, 2019 – Class A Shares
The graphs do not reflect
the deduction of taxes that a shareholder may pay on Fund distributions or the redemption of Fund shares.
Holding Summaries as of October 31, 2019
This data relates to the securities held in each Fund's
portfolio of investments as of the end of this reporting period. It should not be construed as a measure of performance for the Fund itself. Holdings are subject to change.
Nuveen Mid Cap Growth Opportunities Fund
Fund
Allocation
(% of net assets) |
|
| Common
Stocks |
99.3%
|
| Investments
Purchased with Collateral from Securities Lending |
3.4%
|
| Money
Market Funds |
0.7%
|
| Other
Assets Less Liabilities |
(3.4)%
|
| Net
Assets |
100%
|
Portfolio
Composition
(% of net assets) |
|
| IT
Services |
12.6%
|
| Software
|
12.0%
|
| Specialty
Retail |
7.4%
|
| Health
Care Equipment & Supplies |
5.8%
|
| Semiconductors
& Semiconductor Equipment |
5.2%
|
| Aerospace
& Defense |
4.0%
|
| Hotels,
Restaurants & Leisure |
3.9%
|
| Machinery
|
3.8%
|
| Biotechnology
|
3.7%
|
| Electronic
Equipment, Instruments & Components |
3.3%
|
| Equity
Real Estate Investment Trust |
3.2%
|
| Capital
Markets |
3.1%
|
| Entertainment
|
3.0%
|
| Multiline
Retail |
2.7%
|
| Food
Products |
2.5%
|
| Chemicals
|
2.3%
|
| Professional
Services |
1.8%
|
| Other
|
19.0%
|
| Investments
Purchased with Collateral from Securities Lending |
3.4%
|
| Money
Market Funds |
0.7%
|
| Other
Assets Less Liabilities |
(3.4)%
|
| Net
Assets |
100%
|
Top
Five Common Stock Holdings
(% of net assets) |
|
| Fiserv
Inc. |
3.9%
|
| Dollar
General Corp |
2.7%
|
| FleetCor
Technologies Inc |
2.4%
|
| O'Reilly
Automotive Inc |
2.4%
|
| Ingersoll-Rand
PLC |
2.3%
|
Nuveen Small Cap Growth Opportunities Fund
Fund
Allocation
(% of net assets) |
|
| Common
Stocks |
98.2%
|
| Exchange-Traded
Funds |
1.5%
|
| Investments
Purchased with Collateral from Securities Lending |
5.3%
|
| Money
Market Funds |
0.4%
|
| Other
Assets Less Liabilities |
(5.4)%
|
| Net
Assets |
100%
|
Portfolio
Composition
(% of net assets) |
|
| Software
|
10.4%
|
| Health
Care Equipment & Supplies |
6.8%
|
| Semiconductors
& Semiconductor Equipment |
6.1%
|
| Biotechnology
|
6.0%
|
| Machinery
|
5.1%
|
| Hotels,
Restaurants & Leisure |
4.9%
|
| Building
Products |
4.6%
|
| Equity
Real Estate Investment Trust |
4.6%
|
| Aerospace
& Defense |
4.1%
|
| IT
Services |
3.9%
|
| Health
Care Providers & Services |
3.6%
|
| Pharmaceuticals
|
3.3%
|
| Banks
|
3.2%
|
| Food
Products |
3.1%
|
| Commercial
Services & Supplies |
3.0%
|
| Chemicals
|
2.7%
|
| Leisure
Products |
2.7%
|
| Insurance
|
2.6%
|
| Other
|
19.0%
|
| Investments
Purchased with Collateral from Securities Lending |
5.3%
|
| Money
Market Funds |
0.4%
|
| Other
Assets Less Liabilities |
(5.4)%
|
| Net
Assets |
100%
|
Top
Five Common Stock Holdings
(% of net assets) |
|
| Trex
Co Inc |
1.9%
|
| Ingevity
Corporation |
1.9%
|
| MAXIMUS
Inc |
1.9%
|
| Horizon
Therapeutics Plc |
1.8%
|
| Tetra
Tech Inc |
1.8%
|
As a
shareholder of one or more of the Funds, you incur two types of costs: (1) transaction costs, including up-front and back-end sales charges (loads) or redemption fees, where applicable; and (2) ongoing costs, including management fees; distribution
and service (12b-1) fees, where applicable; and other Fund expenses. The Examples below are intended to help you understand your ongoing costs (in dollars) of investing in the Funds and to compare these costs with the ongoing costs of investing in
other mutual funds.
The Examples below are based on an
investment of $1,000 invested at the beginning of the period and held through the period ended October 31, 2019.
The beginning of the period is May 1, 2019.
The information under “Actual Performance,”
together with the amount you invested, allows you to estimate actual expenses incurred over the reporting period. Simply divide your account value by $1,000 (for example, an $8,600 account value divided by $1,000 = 8.60) and multiply the result by
the cost shown for your share class, in the row entitled “Expenses Incurred During Period” to estimate the expenses incurred on your account during this period.
The information under “Hypothetical Performance,”
provides information about hypothetical account values and hypothetical expenses based on each Fund’s actual expense ratios and an assumed rate of return of 5% per year before expenses, which is not the Fund’s actual return. The
hypothetical account values and expenses may not be used to estimate the actual ending account balance or expense you incurred for the period. You may use this information to compare the ongoing costs of investing in the Fund and other funds. To do
so, compare this 5% hypothetical example with the 5% hypothetical examples that appear in the shareholder reports of the other funds.
Please note that the expenses shown in the following tables
are meant to highlight your ongoing costs only and do not reflect any transaction costs. Therefore, the hypothetical information is useful in comparing ongoing costs only, and will not help you determine the relative total costs of owning different
funds or share classes. In addition, if these transaction costs were included, your costs would have been higher.
Nuveen Mid Cap Growth Opportunities Fund
| |
Share
Class |
| |
Class
A |
Class
C |
Class
R3 |
Class
R6 |
Class
I |
| Actual
Performance |
|
|
|
|
|
| Beginning
Account Value |
$1,000.00
|
$1,000.00
|
$1,000.00
|
$1,000.00
|
$1,000.00
|
| Ending
Account Value |
$
992.92 |
$
989.31 |
$
991.87 |
$
994.92 |
$
994.39 |
| Expenses
Incurred During the Period |
$
5.88 |
$
9.63 |
$
7.13 |
$
4.02 |
$
4.62 |
Hypothetical
Performance
(5% annualized return before expenses) |
|
|
|
|
|
| Beginning
Account Value |
$1,000.00
|
$1,000.00
|
$1,000.00
|
$1,000.00
|
$1,000.00
|
| Ending
Account Value |
$1,019.31
|
$1,015.53
|
$1,018.05
|
$1,021.17
|
$1,020.57
|
| Expenses
Incurred During the Period |
$
5.96 |
$
9.75 |
$
7.22 |
$
4.08 |
$
4.69 |
For each class of the Fund, expenses are equal to the
Fund’s annualized net expense ratio of 1.17%, 1.92%, 1.42%, 0.80% and 0.92% for Classes A, C, R3, R6 and I, respectively, multiplied by the average account value over the period, multiplied by 184/365 (to reflect the one-half year
period).
Nuveen Small Cap Growth Opportunities Fund
| |
Share
Class |
| |
Class
A |
Class
C |
Class
R3 |
Class
R6 |
Class
I |
| Actual
Performance |
|
|
|
|
|
| Beginning
Account Value |
$1,000.00
|
$1,000.00
|
$1,000.00
|
$1,000.00
|
$1,000.00
|
| Ending
Account Value |
$
986.35 |
$
982.97 |
$
985.31 |
$
990.75 |
$
987.99 |
| Expenses
Incurred During the Period |
$
6.16 |
$
9.85 |
$
7.41 |
$
3.96 |
$
4.91 |
Hypothetical
Performance
(5% annualized return before expenses) |
|
|
|
|
|
| Beginning
Account Value |
$1,000.00
|
$1,000.00
|
$1,000.00
|
$1,000.00
|
$1,000.00
|
| Ending
Account Value |
$1,019.00
|
$1,015.27
|
$1,017.74
|
$1,021.22
|
$1,020.27
|
| Expenses
Incurred During the Period |
$
6.26 |
$
10.01 |
$
7.53 |
$
4.02 |
$
4.99 |
For each class of the Fund, expenses are equal to the
Fund’s annualized net expense ratio of 1.23%, 1.97%, 1.48%, 0.79% and 0.98% for Classes A, C, R3, R6 and I, respectively, multiplied by the average account value over the period, multiplied by 184/365 (to reflect the one-half year
period).
Report of Independent Registered Public Accounting
Firm
To the Board of Directors of Nuveen Investment Funds, Inc. and Shareholders
of
Nuveen Mid Cap Growth Opportunities Fund
Nuveen Small Cap Growth Opportunities Fund
Opinions on the Financial Statements
We have audited the accompanying statements of assets and
liabilities, including the portfolios of investments, of Nuveen Mid Cap Growth Opportunities Fund and Nuveen Small Cap Growth Opportunities Fund (two of the funds constituting Nuveen Investment Funds, Inc., hereafter collectively referred to as the
"Funds") as of October 31, 2019, the related statements of operations for the year ended October 31, 2019, the statements of changes in net assets for each of the two years in the period ended October 31, 2019, including the related notes, and the
financial highlights for each of the five years in the period ended October 31, 2019 (collectively referred to as the “financial statements”). In our opinion, the financial statements present fairly, in all material respects, the
financial position of each of the Funds as of October 31, 2019, the results of each of their operations for the year then ended, the changes in each of their net assets for each of the two years in the period ended October 31, 2019 and each of the
financial highlights for each of the five years in the period ended October 31, 2019 in conformity with accounting principles generally accepted in the United States of America.
Basis for Opinions
These financial statements are the responsibility of the
Funds’ management. Our responsibility is to express an opinion on the Funds’ financial statements based on our audits. We are a public accounting firm registered with the Public Company Accounting Oversight Board (United States) (PCAOB)
and are required to be independent with respect to the Funds in accordance with the U.S. federal securities laws and the applicable rules and regulations of the Securities and Exchange Commission and the PCAOB.
We conducted our audits of these financial statements in
accordance with the standards of the PCAOB. Those standards require that we plan and perform the audit to obtain reasonable assurance about whether the financial statements are free of material misstatement, whether due to error or fraud.
Our audits included performing procedures to assess the risks
of material misstatement of the financial statements, whether due to error or fraud, and performing procedures that respond to those risks. Such procedures included examining, on a test basis, evidence regarding the amounts and disclosures in the
financial statements. Our audits also included evaluating the accounting principles used and significant estimates made by management, as well as evaluating the overall presentation of the financial statements. Our procedures included confirmation
of securities owned as of October 31, 2019 by correspondence with the custodian and brokers; when replies were not received from brokers, we performed other auditing procedures. We believe that our audits provide a reasonable basis for our
opinions.
PricewaterhouseCoopers LLP
Chicago, Illinois
December 27, 2019
We have served as the auditor of one or more investment companies in Nuveen
Funds since 2002.
Nuveen Mid Cap Growth Opportunities Fund
Portfolio of Investments October 31, 2019
| Shares
|
|
Description
(1) |
|
|
|
Value
|
| |
|
LONG-TERM
INVESTMENTS – 99.3% |
|
|
|
|
| |
|
COMMON
STOCKS – 99.3% |
|
|
|
|
| |
|
Aerospace
& Defense – 4.0% |
|
|
|
|
| 41,050
|
|
L3Harris
Technologies Inc. |
|
|
|
$8,469,025 |
| 13,745
|
|
TransDigm
Group Inc, (2) |
|
|
|
7,233,719
|
| |
|
Total
Aerospace & Defense |
|
|
|
15,702,744
|
| |
|
Biotechnology – 3.7%
|
|
|
|
|
| 67,764
|
|
BioMarin
Pharmaceutical Inc, (2) |
|
|
|
4,961,003
|
| 38,648
|
|
Exact
Sciences Corp, (2), (3) |
|
|
|
3,362,376
|
| 19,879
|
|
Sage
Therapeutics Inc, (2) |
|
|
|
2,696,586
|
| 22,216
|
|
Sarepta
Therapeutics Inc, (2) |
|
|
|
1,845,261
|
| 19,264
|
|
United
Therapeutics Corp, (2) |
|
|
|
1,730,678
|
| |
|
Total
Biotechnology |
|
|
|
14,595,904
|
| |
|
Building
Products – 1.4% |
|
|
|
|
| 62,933
|
|
Trex
Co Inc, (2) |
|
|
|
5,531,181
|
| |
|
Capital
Markets – 3.1% |
|
|
|
|
| 57,487
|
|
Evercore
Inc., Class A |
|
|
|
4,233,343
|
| 34,018
|
|
MSCI
Inc |
|
|
|
7,979,262
|
| |
|
Total
Capital Markets |
|
|
|
12,212,605
|
| |
|
Chemicals – 2.3%
|
|
|
|
|
| 92,667
|
|
CF
Industries Holdings Inc. |
|
|
|
4,202,449
|
| 58,211
|
|
Ingevity
Corporation, (2) |
|
|
|
4,901,948
|
| |
|
Total
Chemicals |
|
|
|
9,104,397
|
| |
|
Communications
Equipment – 1.2% |
|
|
|
|
| 72,367
|
|
Lumentum
Holdings Inc, (2) |
|
|
|
4,534,516
|
| |
|
Consumer
Finance – 1.4% |
|
|
|
|
| 68,794
|
|
Discover
Financial Services |
|
|
|
5,521,406
|
| |
|
Electrical
Equipment – 1.8% |
|
|
|
|
| 76,258
|
|
AMETEK
Inc. |
|
|
|
6,989,046
|
| |
|
Electronic
Equipment, Instruments & Components – 3.3% |
|
|
|
|
| 55,271
|
|
CDW
Corp |
|
|
|
7,069,714
|
| 59,877
|
|
Keysight
Technologies Inc, (2) |
|
|
|
6,042,188
|
| |
|
Total
Electronic Equipment, Instruments & Components |
|
|
|
13,111,902
|
| |
|
Entertainment – 3.0%
|
|
|
|
|
| 55,300
|
|
Take-Two
Interactive Software Inc., (2) |
|
|
|
6,655,355
|
Nuveen Mid Cap Growth Opportunities Fund (continued)
Portfolio of Investments October 31, 2019
| Shares
|
|
Description
(1) |
|
|
|
Value
|
| |
|
Entertainment
(continued) |
|
|
|
|
| 88,053
|
|
World
Wrestling Entertainment Inc, Class A, (3) |
|
|
|
$
4,934,490 |
| |
|
Total
Entertainment |
|
|
|
11,589,845
|
| |
|
Equity
Real Estate Investment Trust – 3.2% |
|
|
|
|
| 47,628
|
|
CoreSite
Realty Corp |
|
|
|
5,596,290
|
| 29,550
|
|
SBA
Communications Corp |
|
|
|
7,111,207
|
| |
|
Total
Equity Real Estate Investment Trust |
|
|
|
12,707,497
|
| |
|
Food
Products – 2.5% |
|
|
|
|
| 30,881
|
|
McCormick
& Co Inc |
|
|
|
4,962,268
|
| 59,811
|
|
Tyson
Foods Inc., Class A |
|
|
|
4,951,753
|
| |
|
Total
Food Products |
|
|
|
9,914,021
|
| |
|
Health
Care Equipment & Supplies – 5.8% |
|
|
|
|
| 35,028
|
|
DexCom
Inc, (2) |
|
|
|
5,402,719
|
| 27,531
|
|
Insulet
Corp, (2) |
|
|
|
4,000,805
|
| 21,415
|
|
Teleflex
Inc. |
|
|
|
7,439,785
|
| 42,413
|
|
Zimmer
Biomet Holdings Inc. |
|
|
|
5,862,749
|
| |
|
Total
Health Care Equipment & Supplies |
|
|
|
22,706,058
|
| |
|
Health
Care Providers & Services – 1.8% |
|
|
|
|
| 131,266
|
|
Centene
Corp, (2) |
|
|
|
6,967,599
|
| |
|
Health
Care Technology – 1.0% |
|
|
|
|
| 50,168
|
|
Teladoc
Health Inc, (2) |
|
|
|
3,842,869
|
| |
|
Hotels,
Restaurants & Leisure – 3.9% |
|
|
|
|
| 6,021
|
|
Chipotle
Mexican Grill Inc, (2) |
|
|
|
4,685,301
|
| 183,396
|
|
MGM
Resorts International |
|
|
|
5,226,786
|
| 22,507
|
|
Vail
Resorts Inc |
|
|
|
5,229,952
|
| |
|
Total
Hotels, Restaurants & Leisure |
|
|
|
15,142,039
|
| |
|
Interactive
Media & Services – 1.2% |
|
|
|
|
| 20,010
|
|
IAC/InterActiveCorp
|
|
|
|
4,547,272
|
| |
|
Internet
& Direct Marketing Retail – 1.0% |
|
|
|
|
| 28,967
|
|
Expedia
Group Inc. |
|
|
|
3,958,630
|
| |
|
IT
Services – 12.6% |
|
|
|
|
| 143,475
|
|
Fiserv
Inc., (2) |
|
|
|
15,228,437
|
| 31,993
|
|
FleetCor
Technologies Inc, (2) |
|
|
|
9,412,980
|
| 60,438
|
|
MAXIMUS
Inc |
|
|
|
4,638,012
|
| 46,403
|
|
Okta
Inc, (2) |
|
|
|
5,061,175
|
| 32,084
|
|
VeriSign
Inc., (2) |
|
|
|
6,096,602
|
| 315,092
|
|
Verra
Mobility Corp, (2) |
|
|
|
4,521,570
|
| 37,928
|
|
Wixcom
Ltd, (2) |
|
|
|
4,629,871
|
| |
|
Total
IT Services |
|
|
|
49,588,647
|
| Shares
|
|
Description
(1) |
|
|
|
Value
|
| |
|
Leisure
Products – 1.2% |
|
|
|
|
| 147,348
|
|
YETI
Holdings Inc, (2), (3) |
|
|
|
$
4,908,162 |
| |
|
Life
Sciences Tools & Services – 0.7% |
|
|
|
|
| 191,204
|
|
Accelerate
Diagnostics Inc, (2) |
|
|
|
2,944,542
|
| |
|
Machinery – 3.8%
|
|
|
|
|
| 71,639
|
|
Ingersoll-Rand
PLC |
|
|
|
9,090,273
|
| 31,927
|
|
Parker-Hannifin
Corp |
|
|
|
5,858,285
|
| |
|
Total
Machinery |
|
|
|
14,948,558
|
| |
|
Multiline
Retail – 2.7% |
|
|
|
|
| 66,829
|
|
Dollar
General Corp |
|
|
|
10,715,362
|
| |
|
Oil,
Gas & Consumable Fuels – 1.2% |
|
|
|
|
| 286,756
|
|
Parsley
Energy Inc |
|
|
|
4,533,612
|
| |
|
Pharmaceuticals – 1.0%
|
|
|
|
|
| 142,444
|
|
Horizon
Therapeutics Plc, (2) |
|
|
|
4,118,056
|
| |
|
Professional
Services – 1.8% |
|
|
|
|
| 102,077
|
|
IHS
Markit Ltd, (2) |
|
|
|
7,147,432
|
| |
|
Road
& Rail – 1.6% |
|
|
|
|
| 43,455
|
|
Kansas
City Southern |
|
|
|
6,117,595
|
| |
|
Semiconductors
& Semiconductor Equipment – 5.2% |
|
|
|
|
| 16,551
|
|
Lam
Research Corp |
|
|
|
4,485,983
|
| 233,073
|
|
Marvell
Technology Group Ltd |
|
|
|
5,684,650
|
| 27,577
|
|
Monolithic
Power Systems Inc |
|
|
|
4,134,344
|
| 67,912
|
|
Xilinx
Inc. |
|
|
|
6,162,335
|
| |
|
Total
Semiconductors & Semiconductor Equipment |
|
|
|
20,467,312
|
| |
|
Software – 12.0%
|
|
|
|
|
| 86,553
|
|
Anaplan
Inc, (2) |
|
|
|
4,085,302
|
| 26,225
|
|
ANSYS
Inc, (2) |
|
|
|
5,773,434
|
| 35,677
|
|
Aspen
Technology Inc, (2) |
|
|
|
4,106,780
|
| 36,921
|
|
Atlassian
Corp PLC, (2) |
|
|
|
4,459,688
|
| 94,255
|
|
Cadence
Design Systems Inc, (2) |
|
|
|
6,159,564
|
| 57,388
|
|
Everbridge
Inc, (2) |
|
|
|
3,989,040
|
| 27,051
|
|
HubSpot
Inc, (2) |
|
|
|
4,195,610
|
| 40,639
|
|
Proofpoint
Inc, (2) |
|
|
|
4,688,521
|
| 84,273
|
|
RealPage
Inc, (2) |
|
|
|
5,102,730
|
| 23,383
|
|
Trade
Desk Inc, (2) |
|
|
|
4,695,306
|
| |
|
Total
Software |
|
|
|
47,255,975
|
| |
|
Specialty
Retail – 7.4% |
|
|
|
|
| 58,035
|
|
Best
Buy Co Inc. |
|
|
|
4,168,654
|
Nuveen Mid Cap Growth Opportunities Fund (continued)
Portfolio of Investments October 31, 2019
| Shares
|
|
Description
(1) |
|
|
|
Value
|
| |
|
Specialty
Retail (continued) |
|
|
|
|
| 40,233
|
|
Five
Below Inc, (2) |
|
|
|
$5,033,551 |
| 21,547
|
|
O'Reilly
Automotive Inc, (2) |
|
|
|
9,383,934
|
| 50,494
|
|
Tractor
Supply Co |
|
|
|
4,797,940
|
| 24,815
|
|
Ulta
Beauty Inc, (2) |
|
|
|
5,785,617
|
| |
|
Total
Specialty Retail |
|
|
|
29,169,696
|
| |
|
Textiles,
Apparel & Luxury Goods – 1.2% |
|
|
|
|
| 47,525
|
|
Ralph
Lauren Corp |
|
|
|
4,565,251
|
| |
|
Trading
Companies & Distributors – 1.3% |
|
|
|
|
| 27,911
|
|
Watsco
Inc. |
|
|
|
4,920,709
|
| |
|
Total
Long-Term Investments (cost $335,912,489) |
|
|
|
390,080,440
|
| Shares
|
|
Description
(1) |
Coupon
|
|
|
Value
|
| |
|
INVESTMENTS
PURCHASED WITH COLLATERAL FROM SECURITIES LENDING – 3.4% |
|
|
|
| |
|
MONEY
MARKET FUNDS – 3.4% |
|
|
|
|
| 13,487,328
|
|
First
American Government Obligations Fund, Class X, (4) |
1.743%
(5) |
|
|
$
13,487,328 |
| |
|
Total
Investments Purchased with Collateral from Securities Lending (cost $13,487,328) |
|
|
13,487,328
|
| Shares
|
|
Description
(1) |
Coupon
|
|
|
Value
|
| |
|
SHORT-TERM
INVESTMENTS – 0.7% |
|
|
|
|
| |
|
MONEY
MARKET FUNDS – 0.7% |
|
|
|
|
| 2,526,404
|
|
First
American Treasury Obligation Fund, Class Z |
1.693%
(5) |
|
|
$
2,526,404 |
| |
|
Total
Short-Term Investments (cost $2,526,404) |
|
|
|
2,526,404
|
| |
|
Total
Investments (cost $351,926,221) – 103.4% |
|
|
|
406,094,172
|
| |
|
Other
Assets Less Liabilities – (3.4)% |
|
|
|
(13,390,221)
|
| |
|
Net
Assets – 100% |
|
|
|
$
392,703,951 |
| |
For
Fund portfolio compliance purposes, the Fund’s industry classifications refer to any one or more of the industry sub-classifications used by one or more widely recognized market indexes or ratings group indexes, and/or as defined by Fund
management. This definition may not apply for purposes of this report, which may combine industry sub-classifications into sectors for reporting ease. |
|
| (1)
|
All
percentages shown in the Portfolio of Investments are based on net assets. |
|
| (2)
|
Non-income
producing; issuer has not declared a dividend within the past twelve months. |
|
| (3)
|
Investment,
or a portion of investment, is out on loan for securities lending. The total value of the securities out on loan as of the end of the reporting period was $12,331,368. |
|
| (4)
|
The
Fund may loan securities representing up to one third of the fair value of its total assets (which includes collateral for securities on loan) to broker dealers, banks, and other institutions. The Fund maintains collateral equal to at least 100% of
the fair value of the securities loaned. The cash collateral received by the Fund is invested in this money market fund. See Notes to Financial Statements, Note 4- Portfolio Securities and Investments in Derivatives, Securities Lending for more
information. |
|
| (5)
|
The
rate shown is the annualized seven-day subsidized yield as of the end of the reporting period. |
|
See accompanying notes to financial statements.
Nuveen Small Cap Growth Opportunities Fund
Portfolio of Investments October 31, 2019
| Shares
|
|
Description
(1) |
|
|
|
Value
|
| |
|
LONG-TERM
INVESTMENTS – 99.7% |
|
|
|
|
| |
|
COMMON
STOCKS – 98.2% |
|
|
|
|
| |
|
Aerospace
& Defense – 4.1% |
|
|
|
|
| 45,319
|
|
Axon
Enterprise Inc, (2) |
|
|
|
$2,317,160 |
| 138,444
|
|
Kratos
Defense & Security Solutions Inc, (2) |
|
|
|
2,613,823
|
| 50,994
|
|
Mercury
Systems Inc, (2) |
|
|
|
3,756,218
|
| |
|
Total
Aerospace & Defense |
|
|
|
8,687,201
|
| |
|
Banks – 3.2%
|
|
|
|
|
| 64,645
|
|
Cathay
General Bancorp |
|
|
|
2,299,423
|
| 38,508
|
|
Pinnacle
Financial Partners Inc., Class A |
|
|
|
2,265,040
|
| 39,680
|
|
Preferred
Bank |
|
|
|
2,115,341
|
| |
|
Total
Banks |
|
|
|
6,679,804
|
| |
|
Biotechnology – 6.0%
|
|
|
|
|
| 7,980
|
|
Argenx
SE ADR, (2) |
|
|
|
977,231
|
| 9,011
|
|
Ascendis
Pharma A/S ADR, (2) |
|
|
|
996,437
|
| 18,424
|
|
Blueprint
Medicines Corp, (2) |
|
|
|
1,268,308
|
| 72,649
|
|
CareDx
Inc, (2) |
|
|
|
1,904,130
|
| 101,757
|
|
Coherus
Biosciences Inc, (2) |
|
|
|
1,767,519
|
| 74,015
|
|
Fate
Therapeutics Inc, (2) |
|
|
|
1,106,524
|
| 52,106
|
|
Halozyme
Therapeutics Inc, (2) |
|
|
|
798,264
|
| 77,349
|
|
Iovance
Biotherapeutics Inc, (2) |
|
|
|
1,634,384
|
| 26,245
|
|
Repligen
Corp, (2) |
|
|
|
2,086,215
|
| |
|
Total
Biotechnology |
|
|
|
12,539,012
|
| |
|
Building
Products – 4.6% |
|
|
|
|
| 44,004
|
|
CSW
Industrials Inc |
|
|
|
3,045,957
|
| 50,171
|
|
Gibraltar
Industries Inc. |
|
|
|
2,670,602
|
| 45,324
|
|
Trex
Co Inc, (2) |
|
|
|
3,983,527
|
| |
|
Total
Building Products |
|
|
|
9,700,086
|
| |
|
Capital
Markets – 1.2% |
|
|
|
|
| 34,630
|
|
Evercore
Inc., Class A |
|
|
|
2,550,153
|
| |
|
Chemicals – 2.7%
|
|
|
|
|
| 84,471
|
|
GCP
Applied Technologies Inc, (2) |
|
|
|
1,745,171
|
| 47,061
|
|
Ingevity
Corporation, (2) |
|
|
|
3,963,007
|
| |
|
Total
Chemicals |
|
|
|
5,708,178
|
| |
|
Commercial
Services & Supplies – 3.0% |
|
|
|
|
| 19,881
|
|
MSA
Safety Inc |
|
|
|
2,387,112
|
Nuveen Small Cap Growth Opportunities Fund (continued)
Portfolio of Investments October 31, 2019
| Shares
|
|
Description
(1) |
|
|
|
Value
|
| |
|
Commercial
Services & Supplies (continued) |
|
|
|
|
| 43,429
|
|
Tetra
Tech Inc |
|
|
|
$
3,798,734 |
| |
|
Total
Commercial Services & Supplies |
|
|
|
6,185,846
|
| |
|
Communications
Equipment – 1.3% |
|
|
|
|
| 42,433
|
|
Lumentum
Holdings Inc, (2) |
|
|
|
2,658,852
|
| |
|
Construction
& Engineering – 2.3% |
|
|
|
|
| 37,373
|
|
MasTec
Inc, (2) |
|
|
|
2,352,257
|
| 74,090
|
|
MYR
Group Inc, (2) |
|
|
|
2,549,437
|
| |
|
Total
Construction & Engineering |
|
|
|
4,901,694
|
| |
|
Diversified
Consumer Services – 1.1% |
|
|
|
|
| 75,867
|
|
Chegg
Inc, (2) |
|
|
|
2,326,082
|
| |
|
Electrical
Equipment – 1.3% |
|
|
|
|
| 35,743
|
|
Regal
Beloit Corp |
|
|
|
2,646,769
|
| |
|
Entertainment – 1.2%
|
|
|
|
|
| 43,534
|
|
World
Wrestling Entertainment Inc, Class A, (3) |
|
|
|
2,439,645
|
| |
|
Equity
Real Estate Investment Trust – 4.6% |
|
|
|
|
| 43,496
|
|
American
Assets Trust Inc |
|
|
|
2,129,564
|
| 64,306
|
|
Healthcare
Realty Trust Inc |
|
|
|
2,235,920
|
| 48,251
|
|
QTS
Realty Trust Inc, Class A |
|
|
|
2,585,771
|
| 87,188
|
|
STAG
Industrial Inc. |
|
|
|
2,706,315
|
| |
|
Total
Equity Real Estate Investment Trust |
|
|
|
9,657,570
|
| |
|
Food
Products – 3.1% |
|
|
|
|
| 153,852
|
|
Nomad
Foods Ltd |
|
|
|
3,001,653
|
| 22,542
|
|
Sanderson
Farms Inc |
|
|
|
3,489,727
|
| |
|
Total
Food Products |
|
|
|
6,491,380
|
| |
|
Health
Care Equipment & Supplies – 6.8% |
|
|
|
|
| 77,014
|
|
AtriCure
Inc, (2) |
|
|
|
2,047,802
|
| 33,121
|
|
iRhythm
Technologies Inc, (2) |
|
|
|
2,213,145
|
| 17,261
|
|
Penumbra
Inc, (2) |
|
|
|
2,692,198
|
| 44,546
|
|
Quidel
Corp, (2) |
|
|
|
2,534,668
|
| 70,731
|
|
STAAR
Surgical Co, (2) |
|
|
|
2,318,562
|
| 52,362
|
|
Tactile
Systems Technology Inc, (2) |
|
|
|
2,378,282
|
| |
|
Total
Health Care Equipment & Supplies |
|
|
|
14,184,657
|
| |
|
Health
Care Providers & Services – 3.6% |
|
|
|
|
| 20,275
|
|
Amedisys
Inc, (2) |
|
|
|
2,605,743
|
| 44,242
|
|
AMN
Healthcare Services Inc., (2) |
|
|
|
2,599,660
|
| 20,511
|
|
LHC
Group Inc, (2) |
|
|
|
2,276,106
|
| |
|
Total
Health Care Providers & Services |
|
|
|
7,481,509
|
| Shares
|
|
Description
(1) |
|
|
|
Value
|
| |
|
Health
Care Technology – 2.6% |
|
|
|
|
| 37,449
|
|
Omnicell
Inc, (2) |
|
|
|
$2,636,035 |
| 36,113
|
|
Teladoc
Health Inc, (2) |
|
|
|
2,766,256
|
| |
|
Total
Health Care Technology |
|
|
|
5,402,291
|
| |
|
Hotels,
Restaurants & Leisure – 4.9% |
|
|
|
|
| 32,628
|
|
Jack
in the Box Inc. |
|
|
|
2,741,404
|
| 40,534
|
|
Papa
John's International Inc, (3) |
|
|
|
2,373,266
|
| 101,180
|
|
Penn
National Gaming Inc, (2) |
|
|
|
2,156,652
|
| 34,848
|
|
Wingstop
Inc |
|
|
|
2,907,369
|
| |
|
Total
Hotels, Restaurants & Leisure |
|
|
|
10,178,691
|
| |
|
Household
Durables – 1.0% |
|
|
|
|
| 20,736
|
|
TopBuild
Corp, (2) |
|
|
|
2,155,093
|
| |
|
Insurance – 2.6%
|
|
|
|
|
| 40,341
|
|
eHealth
Inc, (2) |
|
|
|
2,785,143
|
| 24,764
|
|
Kinsale
Capital Group Inc |
|
|
|
2,618,050
|
| |
|
Total
Insurance |
|
|
|
5,403,193
|
| |
|
Internet
& Direct Marketing Retail – 0.5% |
|
|
|
|
| 22,925
|
|
Etsy
Inc, (2) |
|
|
|
1,019,933
|
| |
|
IT
Services – 3.9% |
|
|
|
|
| 24,214
|
|
InterXion
Holding NV, (2) |
|
|
|
2,136,159
|
| 51,117
|
|
MAXIMUS
Inc |
|
|
|
3,922,719
|
| 146,050
|
|
Verra
Mobility Corp, (2) |
|
|
|
2,095,817
|
| |
|
Total
IT Services |
|
|
|
8,154,695
|
| |
|
Leisure
Products – 2.7% |
|
|
|
|
| 141,637
|
|
Callaway
Golf Co |
|
|
|
2,863,900
|
| 82,566
|
|
YETI
Holdings Inc, (2), (3) |
|
|
|
2,750,274
|
| |
|
Total
Leisure Products |
|
|
|
5,614,174
|
| |
|
Life
Sciences Tools & Services – 1.2% |
|
|
|
|
| 112,989
|
|
NeoGenomics
Inc, (2) |
|
|
|
2,590,838
|
| |
|
Machinery – 5.1%
|
|
|
|
|
| 100,638
|
|
Altra
Industrial Motion Corp |
|
|
|
3,099,650
|
| 46,365
|
|
Chart
Industries Inc, (2) |
|
|
|
2,718,380
|
| 24,806
|
|
John
Bean Technologies Corp |
|
|
|
2,549,313
|
| 49,475
|
|
SPX
Corp |
|
|
|
2,253,092
|
| |
|
Total
Machinery |
|
|
|
10,620,435
|
| |
|
Oil,
Gas & Consumable Fuels – 0.6% |
|
|
|
|
| 71,411
|
|
Brigham
Minerals Inc., Class A |
|
|
|
1,363,236
|
| |
|
Pharmaceuticals – 3.3%
|
|
|
|
|
| 132,353
|
|
Horizon
Therapeutics Plc, (2) |
|
|
|
3,826,325
|
Nuveen Small Cap Growth Opportunities Fund (continued)
Portfolio of Investments October 31, 2019
| Shares
|
|
Description
(1) |
|
|
|
Value
|
| |
|
Pharmaceuticals
(continued) |
|
|
|
|
| 18,985
|
|
MyoKardia
Inc, (2) |
|
|
|
$1,088,410 |
| 9,712
|
|
Reata
Pharmaceuticals Inc., Class A, (2) |
|
|
|
2,001,449
|
| |
|
Total
Pharmaceuticals |
|
|
|
6,916,184
|
| |
|
Semiconductors
& Semiconductor Equipment – 6.1% |
|
|
|
|
| 56,022
|
|
Brooks
Automation Inc |
|
|
|
2,379,254
|
| 35,238
|
|
Inphi
Corp, (2) |
|
|
|
2,532,908
|
| 128,177
|
|
Lattice
Semiconductor Corp, (2) |
|
|
|
2,510,987
|
| 129,261
|
|
MACOM
Technology Solutions Holdings Inc, (2) |
|
|
|
2,939,395
|
| 16,701
|
|
Monolithic
Power Systems Inc |
|
|
|
2,503,814
|
| |
|
Total
Semiconductors & Semiconductor Equipment |
|
|
|
12,866,358
|
| |
|
Software – 10.4%
|
|
|
|
|
| 42,631
|
|
Everbridge
Inc, (2) |
|
|
|
2,963,281
|
| 35,743
|
|
j2
Global Inc. |
|
|
|
3,394,155
|
| 53,443
|
|
Mimecast
Ltd, (2) |
|
|
|
2,122,222
|
| 27,958
|
|
Q2
Holdings Inc, (2) |
|
|
|
1,998,717
|
| 57,521
|
|
Rapid7
Inc, (2) |
|
|
|
2,881,227
|
| 48,266
|
|
RealPage
Inc, (2) |
|
|
|
2,922,506
|
| 151,594
|
|
SailPoint
Technologies Holding Inc, (2) |
|
|
|
2,934,860
|
| 36,430
|
|
Varonis
Systems Inc, (2) |
|
|
|
2,606,566
|
| 591,081
|
|
Videopropulsion
Inc, (2), (4) |
|
|
|
1
|
| |
|
Total
Software |
|
|
|
21,823,535
|
| |
|
Specialty
Retail – 2.1% |
|
|
|
|
| 32,014
|
|
Aaron's
Inc. |
|
|
|
2,398,809
|
| 58,768
|
|
Boot
Barn Holdings Inc, (2) |
|
|
|
2,059,818
|
| |
|
Total
Specialty Retail |
|
|
|
4,458,627
|
| |
|
Textiles,
Apparel & Luxury Goods – 1.1% |
|
|
|
|
| 56,545
|
|
Steven
Madden Ltd |
|
|
|
2,328,523
|
| |
|
Total
Common Stocks (cost $187,509,639) |
|
|
|
205,734,244
|
| Shares
|
|
Description
(1), (5) |
|
|
|
Value
|
| |
|
EXCHANGE-TRADED
FUNDS – 1.5% |
|
|
|
|
| 39,551
|
|
SPDR
S&P Biotech ETF, (3) |
|
|
|
$
3,228,548 |
| |
|
Total
Exchange-Traded Funds (cost $3,152,467) |
|
|
|
3,228,548
|
| |
|
Total
Long-Term Investments (cost $190,662,106) |
|
|
|
208,962,792
|
| Shares
|
|
Description
(1) |
Coupon
|
|
|
Value
|
| |
|
INVESTMENTS
PURCHASED WITH COLLATERAL FROM SECURITIES LENDING – 5.3% |
|
|
|
| |
|
MONEY
MARKET FUNDS – 5.3% |
|
|
|
|
| 11,100,658
|
|
First
American Government Obligations Fund, Class X, (6) |
1.743%
(7) |
|
|
$
11,100,658 |
| |
|
Total
Investments Purchased with Collateral from Securities Lending (cost $11,100,658) |
|
|
11,100,658
|
| Shares
|
|
Description
(1) |
Coupon
|
|
|
Value
|
| |
|
SHORT-TERM
INVESTMENTS – 0.4% |
|
|
|
|
| |
|
MONEY
MARKET FUNDS – 0.4% |
|
|
|
|
| 791,738
|
|
First
American Treasury Obligation Fund, Class Z |
1.693%
(7) |
|
|
$
791,738 |
| |
|
Total
Short-Term Investments (cost $791,738) |
|
|
|
791,738
|
| |
|
Total
Investments (cost $202,554,502) – 105.4% |
|
|
|
220,855,188
|
| |
|
Other
Assets Less Liabilities – (5.4)% |
|
|
|
(11,336,288)
|
| |
|
Net
Assets – 100% |
|
|
|
$
209,518,900 |
| |
For
Fund portfolio compliance purposes, the Fund’s industry classifications refer to any one or more of the industry sub-classifications used by one or more widely recognized market indexes or ratings group indexes, and/or as defined by Fund
management. This definition may not apply for purposes of this report, which may combine industry sub-classifications into sectors for reporting ease. |
|
| (1)
|
All
percentages shown in the Portfolio of Investments are based on net assets. |
|
| (2)
|
Non-income
producing; issuer has not declared a dividend within the past twelve months. |
|
| (3)
|
Investment,
or a portion of investment, is out on loan for securities lending. The total value of the securities out on loan as of the end of the reporting period was $10,321,062. |
|
| (4)
|
Investment
valued at fair value using methods determined in good faith by, or at the discretion of, the Board. For fair value measurement disclosure purposes, investment classified as Level 3. See Notes to Financial Statements, Note 3 - Investment Valuation
and Fair Value Measurements for more information. |
|
| (5)
|
A
copy of the most recent financial statements for the exchange-traded funds in which the Fund invests can be obtained directly from the Securities and Exchange Commission on its website at http://www.sec.gov. |
|
| (6)
|
The
Fund may loan securities representing up to one third of the fair value of its total assets (which includes collateral for securities on loan) to broker dealers, banks, and other institutions. The Fund maintains collateral equal to at least 100% of
the fair value of the securities loaned. The cash collateral received by the Fund is invested in this money market fund. See Notes to Financial Statements, Note 4- Portfolio Securities and Investments in Derivatives, Securities Lending for more
information. |
|
| (7)
|
The
rate shown is the annualized seven-day subsidized yield as of the end of the reporting period. |
|
| ADR
|
American
Depositary Receipt |
|
| ETF
|
Exchange-Traded
Fund |
|
| SPDR
|
Standard
& Poor's Depositary Receipt |
|
See accompanying notes to financial statements.
Statement of Assets and Liabilities
October 31, 2019
| |
Mid
Cap
Growth
Opportunities |
Small
Cap
Growth
Opportunities |
| Assets
|
|
|
| Long-term
investments, at value (cost $335,912,489 and $190,662,106, respectively) |
$390,080,440
|
$208,962,792
|
| Investment
purchased with collateral from securities lending, at value (cost approximates value) |
13,487,328
|
11,100,658
|
| Short-term
investments, at value (cost approximates value) |
2,526,404
|
791,738
|
| Receivable
for: |
|
|
| Dividends
|
—
|
22,492
|
| Due
from broker |
22,293
|
13,499
|
| Interest
|
5,792
|
3,429
|
| Investments
sold |
1,693,042
|
2,231,198
|
| Shares
sold |
132,398
|
453,273
|
| Other
assets |
85,528
|
29,331
|
| Total
assets |
408,033,225
|
223,608,410
|
| Liabilities
|
|
|
| Payable
for: |
|
|
| Collateral
from securities lending program |
13,487,328
|
11,100,658
|
| Investments
purchased |
717,348
|
2,340,089
|
| Shares
redeemed |
519,880
|
181,760
|
| Accrued
expenses: |
|
|
| Directors
fees |
68,157
|
1,826
|
| Management
fees |
244,057
|
307,804
|
| 12b-1
distribution and service fees |
50,900
|
8,951
|
| Other
|
241,604
|
148,422
|
| Total
liabilities |
15,329,274
|
14,089,510
|
| Net
assets |
$392,703,951
|
$209,518,900
|
| |
|
|
See accompanying notes to financial statements.
Statement of Assets and Liabilities (continued)
| |
Mid
Cap
Growth
Opportunities |
Small
Cap
Growth
Opportunities |
| Class
A Shares |
|
|
| Net
assets |
$172,912,415
|
$
34,249,448 |
| Shares
outstanding |
5,137,760
|
1,634,400
|
| Net
asset value ("NAV") per share |
$
33.66 |
$
20.96 |
| Offering
price per share (NAV per share plus maximum sales charge of 5.75% of offering price) |
$
35.71 |
$
22.24 |
| Class
C Shares |
|
|
| Net
assets |
$
5,664,394 |
$
1,630,848 |
| Shares
outstanding |
255,144
|
108,673
|
| NAV
and offering price per share |
$
22.20 |
$
15.01 |
| Class
R3 Shares |
|
|
| Net
assets |
$
22,134,778 |
$
1,253,328 |
| Shares
outstanding |
725,345
|
64,432
|
| NAV
and offering price per share |
$
30.52 |
$
19.45 |
| Class
R6 Shares |
|
|
| Net
assets |
$
26,329,117 |
$
143,726 |
| Shares
outstanding |
611,352
|
5,594
|
| NAV
and offering price per share |
$
43.07 |
$
25.69 |
| Class
I Shares |
|
|
| Net
assets |
$165,663,247
|
$172,241,550
|
| Shares
outstanding |
3,898,705
|
6,751,785
|
| NAV
and offering price per share |
$
42.49 |
$
25.51 |
| Fund
level net assets consist of: |
|
|
| Capital
paid-in |
$268,012,708
|
$192,854,115
|
| Total
distributable earnings |
124,691,243
|
16,664,785
|
| Fund
level net assets |
$392,703,951
|
$209,518,900
|
| Authorized
shares - per class |
2
billion |
2
billion |
| Par
value per share |
$
0.0001 |
$
0.0001 |
See accompanying notes to financial statements.
Statement of Operations
Year Ended October 31, 2019
| |
Mid
Cap
Growth
Opportunities |
Small
Cap
Growth
Opportunities |
| Investment
Income |
|
|
| Dividends
|
$
3,726,839 |
$
722,684 |
| Interest
|
55,932
|
58,739
|
| Securities
lending income |
60,695
|
70,518
|
| Total
investment income |
3,843,466
|
851,941
|
| Expenses
|
|
|
| Management
fees |
3,718,557
|
1,253,055
|
| 12b-1
service fees - Class A Shares |
470,295
|
87,585
|
| 12b-1
distibution and service fees - Class C Shares |
67,843
|
18,848
|
| 12b-1
distibution and service fees - Class R3 Shares |
122,904
|
6,222
|
| Shareholder
servicing agent fees |
674,526
|
227,413
|
| Custodian
fees |
53,169
|
20,863
|
| Professional
fees |
47,816
|
28,363
|
| Directors
fees |
13,996
|
4,372
|
| Shareholder
reporting expenses |
47,554
|
67,548
|
| Federal
and state registration fees |
88,671
|
89,146
|
| Other
|
24,884
|
5,026
|
| Total
expenses before fee waiver/expense reimbursement |
5,330,215
|
1,808,441
|
| Fee
waiver/expense reimbursement |
(338,810)
|
(228,475)
|
| Net
expenses |
4,991,405
|
1,579,966
|
| Net
investment income (loss) |
(1,147,939)
|
(728,025)
|
| Realized
and Unrealized Gain (Loss) |
|
|
| Net
realized gain (loss) from investments |
84,972,569
|
(842,975)
|
| Change
in net unrealized appreciation (depreciation) of investments |
(27,405,591)
|
7,571,292
|
| Net
realized and unrealized gain (loss) |
57,566,978
|
6,728,317
|
| Net
increase (decrease) in net assets from operations |
$
56,419,039 |
$6,000,292
|
See accompanying notes to financial statements.
Statement of Changes in Net Assets
| |
Mid
Cap Growth Opportunities |
|
Small
Cap Growth Opportunities |
| |
Year
Ended
10/31/19 |
Year
Ended
10/31/18 |
|
Year
Ended
10/31/19 |
Year
Ended
10/31/18 |
| Operations
|
|
|
|
|
|
| Net
investment income (loss) |
$
(1,147,939) |
$
(2,749,990) |
|
$
(728,025) |
$
(612,442) |
| Net
realized gain (loss) from investments |
84,972,569
|
105,271,433
|
|
(842,975)
|
15,615,021
|
| Change
in net unrealized appreciation (depreciation) of investments |
(27,405,591)
|
(71,584,251)
|
|
7,571,292
|
(7,650,523)
|
| Net
increase (decrease) in net assets from operations |
56,419,039
|
30,937,192
|
|
6,000,292
|
7,352,056
|
| Distributions
to Shareholders |
|
|
|
|
|
| Dividends:
|
|
|
|
|
|
| Class
A Shares |
(33,688,438)
|
(42,671,318)
|
|
(5,069,832)
|
(4,209,121)
|
| Class
C Shares |
(1,845,779)
|
(3,566,386)
|
|
(375,076)
|
(324,846)
|
| Class
R3 Shares |
(4,617,499)
|
(6,636,934)
|
|
(170,130)
|
(201,526)
|
| Class
R6 Shares |
(7,948,731)
|
(10,590,712)
|
|
(1,183,722)
|
(2,000,545)
|
| Class
I Shares |
(42,429,100)
|
(63,162,628)
|
|
(6,735,701)
|
(4,579,909)
|
| Decrease
in net assets from distributions to shareholders |
(90,529,547)
|
(126,627,978)
|
|
(13,534,461)
|
(11,315,947)
|
| Fund
Share Transactions |
|
|
|
|
|
| Proceeds
from sale of shares |
45,420,126
|
74,478,107
|
|
141,918,570
|
31,341,482
|
| Proceeds
from shares issued to shareholders due to reinvestment of distributions |
82,717,140
|
118,019,725
|
|
10,691,877
|
9,469,803
|
| |
128,137,266
|
192,497,832
|
|
152,610,447
|
40,811,285
|
| Cost
of shares redeemed |
(319,546,880)
|
(279,032,792)
|
|
(46,024,192)
|
(27,769,950)
|
| Net
increase (decrease) in net assets from Fund share transactions |
(191,409,614)
|
(86,534,960)
|
|
106,586,255
|
13,041,335
|
| Net
increase (decrease) in net assets |
(225,520,122)
|
(182,225,746)
|
|
99,052,086
|
9,077,444
|
| Net
assets at the beginning of period |
618,224,073
|
800,449,819
|
|
110,466,814
|
101,389,370
|
| Net
assets at the end of period |
$
392,703,951 |
$
618,224,073 |
|
$209,518,900
|
$110,466,814
|
See accompanying notes to financial statements.
Mid Cap
Growth Opportunities
Selected data for a share outstanding throughout each period:
| |
|
|
|
|
|
|
|
|
| |
|
|
|
|
|
|
|
|
| |
|
Investment
Operations |
|
Less
Distributions |
|
| Class
(Commencement Date) Year Ended October 31, |
Beginning
NAV |
Net
Investment
Income
(Loss)(a) |
Net
Realized/
Unrealized
Gain (Loss) |
Total
|
|
From
Net
Investment
Income |
From
Accumulated
Net Realized
Gains |
Total
|
Ending
NAV |
| Class
A (01/95) |
|
|
|
|
|
|
|
|
|
| 2019
|
$36.79
|
$(0.12)
|
$
3.48 |
$
3.36 |
|
$ —
|
$(6.49)
|
$(6.49)
|
$33.66
|
| 2018
|
43.45
|
(0.20)
|
1.16
|
0.96
|
|
—
|
(7.62)
|
(7.62)
|
36.79
|
| 2017
|
36.09
|
(0.17)
|
9.20
|
9.03
|
|
—
|
(1.67)
|
(1.67)
|
43.45
|
| 2016
|
40.91
|
(0.12)
|
(1.36)
|
(1.48)
|
|
—
|
(3.34)
|
(3.34)
|
36.09
|
| 2015
|
47.67
|
(0.31)
|
1.72
|
1.41
|
|
—
|
(8.17)
|
(8.17)
|
40.91
|
| Class
C (09/01) |
|
|
|
|
|
|
|
|
|
| 2019
|
26.85
|
(0.24)
|
2.08
|
1.84
|
|
—
|
(6.49)
|
(6.49)
|
22.20
|
| 2018
|
33.94
|
(0.36)
|
0.89
|
0.53
|
|
—
|
(7.62)
|
(7.62)
|
26.85
|
| 2017
|
28.74
|
(0.36)
|
7.23
|
6.87
|
|
—
|
(1.67)
|
(1.67)
|
33.94
|
| 2016
|
33.50
|
(0.31)
|
(1.11)
|
(1.42)
|
|
—
|
(3.34)
|
(3.34)
|
28.74
|
| 2015
|
40.77
|
(0.52)
|
1.42
|
0.90
|
|
—
|
(8.17)
|
(8.17)
|
33.50
|
| Class
R3 (12/00) |
|
|
|
|
|
|
|
|
|
| 2019
|
34.10
|
(0.18)
|
3.09
|
2.91
|
|
—
|
(6.49)
|
(6.49)
|
30.52
|
| 2018
|
40.90
|
(0.28)
|
1.10
|
0.82
|
|
—
|
(7.62)
|
(7.62)
|
34.10
|
| 2017
|
34.14
|
(0.25)
|
8.68
|
8.43
|
|
—
|
(1.67)
|
(1.67)
|
40.90
|
| 2016
|
38.98
|
(0.20)
|
(1.30)
|
(1.50)
|
|
—
|
(3.34)
|
(3.34)
|
34.14
|
| 2015
|
45.90
|
(0.40)
|
1.65
|
1.25
|
|
—
|
(8.17)
|
(8.17)
|
38.98
|
| Class
R6 (02/13) |
|
|
|
|
|
|
|
|
|
| 2019
|
44.94
|
0.01
|
4.61
|
4.62
|
|
—
|
(6.49)
|
(6.49)
|
43.07
|
| 2018
|
51.24
|
(0.05)
|
1.37
|
1.32
|
|
—
|
(7.62)
|
(7.62)
|
44.94
|
| 2017
|
42.11
|
(0.02)
|
10.82
|
10.80
|
|
—
|
(1.67)
|
(1.67)
|
51.24
|
| 2016
|
47.00
|
0.06
|
(1.61)
|
(1.55)
|
|
—
|
(3.34)
|
(3.34)
|
42.11
|
| 2015
|
53.36
|
(0.16)
|
1.97
|
1.81
|
|
—
|
(8.17)
|
(8.17)
|
47.00
|
| Class
I (12/89) |
|
|
|
|
|
|
|
|
|
| 2019
|
44.49
|
(0.05)
|
4.54
|
4.49
|
|
—
|
(6.49)
|
(6.49)
|
42.49
|
| 2018
|
50.85
|
(0.12)
|
1.38
|
1.26
|
|
—
|
(7.62)
|
(7.62)
|
44.49
|
| 2017
|
41.87
|
(0.08)
|
10.73
|
10.65
|
|
—
|
(1.67)
|
(1.67)
|
50.85
|
| 2016
|
46.81
|
(0.04)
|
(1.56)
|
(1.60)
|
|
—
|
(3.34)
|
(3.34)
|
41.87
|
| 2015
|
53.24
|
(0.23)
|
1.97
|
1.74
|
|
—
|
(8.17)
|
(8.17)
|
46.81
|
| |
|
|
|
|
|
|
| |
Ratios/Supplemental
Data |
| |
|
Ratios
to Average
Net Assets Before
Waiver/Reimbursement |
|
Ratios
to Average
Net Assets After
Waiver/Reimbursement(c) |
|
Total
Return(b) |
Ending
Net
Assets
(000) |
Expenses
|
Net
Investment
Income
(Loss) |
|
Expenses
|
Net
Investment
Income
(Loss) |
Portfolio
Turnover
Rate(d) |
| |
|
|
|
|
|
|
|
| 13.43%
|
$172,912
|
1.24%
|
(0.42)%
|
|
1.17%
|
(0.35)%
|
90%
|
| 2.35
|
196,212
|
1.23
|
(0.56)
|
|
1.17
|
(0.51)
|
106
|
| 25.89
|
250,908
|
1.23
|
(0.48)
|
|
1.17
|
(0.43)
|
136
|
| (3.78)
|
280,681
|
1.29
|
(0.35)
|
|
1.27
|
(0.33)
|
89
|
| 3.68
|
365,394
|
1.30
|
(0.72)
|
|
1.30
|
(0.72)
|
118
|
| |
|
|
|
|
|
|
|
| 12.58
|
5,664
|
2.00
|
(1.18)
|
|
1.92
|
(1.11)
|
90
|
| 1.60
|
7,936
|
1.98
|
(1.30)
|
|
1.92
|
(1.25)
|
106
|
| 24.95
|
16,278
|
1.98
|
(1.23)
|
|
1.92
|
(1.18)
|
136
|
| (4.50)
|
16,956
|
2.04
|
(1.10)
|
|
2.02
|
(1.08)
|
89
|
| 2.91
|
22,284
|
2.05
|
(1.47)
|
|
2.05
|
(1.47)
|
118
|
| |
|
|
|
|
|
|
|
| 13.15
|
22,135
|
1.50
|
(0.68)
|
|
1.42
|
(0.61)
|
90
|
| 2.09
|
26,098
|
1.48
|
(0.81)
|
|
1.42
|
(0.76)
|
106
|
| 25.60
|
35,402
|
1.48
|
(0.72)
|
|
1.42
|
(0.66)
|
136
|
| (4.04)
|
55,093
|
1.54
|
(0.59)
|
|
1.52
|
(0.57)
|
89
|
| 3.43
|
54,866
|
1.55
|
(0.98)
|
|
1.55
|
(0.98)
|
118
|
| |
|
|
|
|
|
|
|
| 13.85
|
26,329
|
0.86
|
(0.05)
|
|
0.79
|
0.02
|
90
|
| 2.75
|
56,250
|
0.84
|
(0.17)
|
|
0.78
|
(0.11)
|
106
|
| 26.41
|
72,703
|
0.84
|
(0.09)
|
|
0.78
|
(0.03)
|
136
|
| (3.41)
|
50,677
|
0.89
|
0.12
|
|
0.86
|
0.14
|
89
|
| 4.09
|
31,167
|
0.92
|
(0.33)
|
|
0.92
|
(0.33)
|
118
|
| |
|
|
|
|
|
|
|
| 13.73
|
165,663
|
1.00
|
(0.19)
|
|
0.92
|
(0.12)
|
90
|
| 2.61
|
331,728
|
0.98
|
(0.31)
|
|
0.92
|
(0.26)
|
106
|
| 26.20
|
425,158
|
0.98
|
(0.23)
|
|
0.92
|
(0.18)
|
136
|
| (3.54)
|
491,747
|
1.04
|
(0.10)
|
|
1.02
|
(0.08)
|
89
|
| 3.95
|
730,560
|
1.05
|
(0.47)
|
|
1.05
|
(0.47)
|
118
|
| (a)
|
Per share Net
Investment Income (Loss) is calculated using the average daily shares method. |
| (b)
|
Total
return is the combination of changes in NAV without any sales charge, reinvested dividend income at NAV and reinvested capital gains distributions at NAV, if any. Total returns are not annualized. |
| (c)
|
After fee
waiver and/or expense reimbursement from the Adviser, where applicable. See Note 7 – Management Fees and Other Transactions with Affiliates, Management Fees for more information. |
| (d)
|
Portfolio
Turnover Rate is calculated based on the lesser of long-term purchases or sales (as disclosed in Note 4 – Portfolio Securities and Investment in Derivatives, Investment Transactions) divided by the average long-term market value
during the period. |
See accompanying notes to financial statements.
Financial Highlights (continued)
Small Cap Growth Opportunities
Selected
data for a share outstanding throughout each period:
| |
|
|
|
|
|
|
|
|
| |
|
|
|
|
|
|
|
|
| |
|
Investment
Operations |
|
Less
Distributions |
|
| Class
(Commencement Date) Year Ended October 31, |
Beginning
NAV |
Net
Investment
Income
(Loss)(a) |
Net
Realized/
Unrealized
Gain (Loss) |
Total
|
|
From
Net
Investment
Income |
From
Accumulated
Net Realized
Gains |
Total
|
Ending
NAV |
| Class
A (08/95) |
|
|
|
|
|
|
|
|
|
| 2019
|
$23.54
|
$(0.14)
|
$0.84
|
$
0.70 |
|
$ —
|
$(3.28)
|
$(3.28)
|
$20.96
|
| 2018
|
24.78
|
(0.17)
|
1.94
|
1.77
|
|
—
|
(3.01)
|
(3.01)
|
23.54
|
| 2017
|
19.90
|
(0.16)
|
5.14
|
4.98
|
|
—
|
(0.10)
|
(0.10)
|
24.78
|
| 2016
|
21.57
|
(0.10)
|
0.45
|
0.35
|
|
—
|
(2.02)
|
(2.02)
|
19.90
|
| 2015
|
24.41
|
(0.22)
|
0.33
|
0.11
|
|
—
|
(2.95)
|
(2.95)
|
21.57
|
| Class
C (09/01) |
|
|
|
|
|
|
|
|
|
| 2019
|
18.01
|
(0.21)
|
0.49
|
0.28
|
|
—
|
(3.28)
|
(3.28)
|
15.01
|
| 2018
|
19.79
|
(0.27)
|
1.50
|
1.23
|
|
—
|
(3.01)
|
(3.01)
|
18.01
|
| 2017
|
16.02
|
(0.26)
|
4.13
|
3.87
|
|
—
|
(0.10)
|
(0.10)
|
19.79
|
| 2016
|
17.89
|
(0.20)
|
0.35
|
0.15
|
|
—
|
(2.02)
|
(2.02)
|
16.02
|
| 2015
|
20.89
|
(0.33)
|
0.28
|
(0.05)
|
|
—
|
(2.95)
|
(2.95)
|
17.89
|
| Class
R3 (12/00) |
|
|
|
|
|
|
|
|
|
| 2019
|
22.16
|
(0.18)
|
0.75
|
0.57
|
|
—
|
(3.28)
|
(3.28)
|
19.45
|
| 2018
|
23.56
|
(0.22)
|
1.83
|
1.61
|
|
—
|
(3.01)
|
(3.01)
|
22.16
|
| 2017
|
18.97
|
(0.21)
|
4.90
|
4.69
|
|
—
|
(0.10)
|
(0.10)
|
23.56
|
| 2016
|
20.71
|
(0.14)
|
0.42
|
0.28
|
|
—
|
(2.02)
|
(2.02)
|
18.97
|
| 2015
|
23.60
|
(0.27)
|
0.33
|
0.06
|
|
—
|
(2.95)
|
(2.95)
|
20.71
|
| Class
R6 (06/16) |
|
|
|
|
|
|
|
|
|
| 2019
|
27.88
|
(0.05)
|
1.14
|
1.09
|
|
—
|
(3.28)
|
(3.28)
|
25.69
|
| 2018
|
28.72
|
(0.10)
|
2.27
|
2.17
|
|
—
|
(3.01)
|
(3.01)
|
27.88
|
| 2017
|
22.96
|
(0.08)
|
5.94
|
5.86
|
|
—
|
(0.10)
|
(0.10)
|
28.72
|
| 2016(e)
|
21.63
|
(0.02)
|
1.35
|
1.33
|
|
—
|
—
|
—
|
22.96
|
| Class
I (08/95) |
|
|
|
|
|
|
|
|
|
| 2019
|
27.79
|
(0.10)
|
1.10
|
1.00
|
|
—
|
(3.28)
|
(3.28)
|
25.51
|
| 2018
|
28.66
|
(0.13)
|
2.27
|
2.14
|
|
—
|
(3.01)
|
(3.01)
|
27.79
|
| 2017
|
22.94
|
(0.12)
|
5.94
|
5.82
|
|
—
|
(0.10)
|
(0.10)
|
28.66
|
| 2016
|
24.51
|
(0.06)
|
0.51
|
0.45
|
|
—
|
(2.02)
|
(2.02)
|
22.94
|
| 2015
|
27.26
|
(0.19)
|
0.39
|
0.20
|
|
—
|
(2.95)
|
(2.95)
|
24.51
|
| |
|
|
|
|
|
|
| |
Ratios/Supplemental
Data |
| |
|
Ratios
to Average
Net Assets Before
Waiver/Reimbursement |
|
Ratios
to Average
Net Assets After
Waiver/Reimbursement(c) |
|
Total
Return(b) |
Ending
Net
Assets
(000) |
Expenses
|
Net
Investment
Income
(Loss) |
|
Expenses
|
Net
Investment
Income
(Loss) |
Portfolio
Turnover
Rate(d) |
| |
|
|
|
|
|
|
|
| 5.47%
|
$
34,249 |
1.39%
|
(0.84)%
|
|
1.23%
|
(0.68)%
|
104%
|
| 7.89
|
36,452
|
1.38
|
(0.86)
|
|
1.24
|
(0.72)
|
139
|
| 25.07
|
34,934
|
1.41
|
(0.80)
|
|
1.30
|
(0.69)
|
95
|
| 1.90
|
31,255
|
1.48
|
(0.58)
|
|
1.42
|
(0.52)
|
106
|
| 0.72
|
33,922
|
1.50
|
(1.00)
|
|
1.47
|
(0.97)
|
128
|
| |
|
|
|
|
|
|
|
| 4.74
|
1,631
|
2.14
|
(1.59)
|
|
1.98
|
(1.43)
|
104
|
| 7.05
|
2,141
|
2.13
|
(1.60)
|
|
1.99
|
(1.46)
|
139
|
| 24.21
|
2,181
|
2.16
|
(1.55)
|
|
2.05
|
(1.44)
|
95
|
| 1.10
|
1,971
|
2.23
|
(1.32)
|
|
2.18
|
(1.27)
|
106
|
| (0.03)
|
2,278
|
2.25
|
(1.75)
|
|
2.22
|
(1.72)
|
128
|
| |
|
|
|
|
|
|
|
| 5.23
|
1,253
|
1.64
|
(1.10)
|
|
1.48
|
(0.94)
|
104
|
| 7.60
|
1,206
|
1.63
|
(1.11)
|
|
1.49
|
(0.97)
|
139
|
| 24.77
|
1,608
|
1.66
|
(1.05)
|
|
1.55
|
(0.94)
|
95
|
| 1.62
|
1,631
|
1.73
|
(0.83)
|
|
1.67
|
(0.78)
|
106
|
| 0.50
|
1,439
|
1.75
|
(1.26)
|
|
1.72
|
(1.23)
|
128
|
| |
|
|
|
|
|
|
|
| 6.13
|
144
|
1.01
|
(0.35)
|
|
0.85
|
(0.19)
|
104
|
| 8.24
|
14,475
|
1.03
|
(0.50)
|
|
0.88
|
(0.35)
|
139
|
| 25.56
|
19,108
|
1.04
|
(0.43)
|
|
0.93
|
(0.32)
|
95
|
| 6.15
|
19,524
|
1.02*
|
(0.29)*
|
|
0.96*
|
(0.23)*
|
106
|
| |
|
|
|
|
|
|
|
| 5.78
|
172,242
|
1.13
|
(0.56)
|
|
0.98
|
(0.41)
|
104
|
| 8.14
|
56,194
|
1.13
|
(0.60)
|
|
0.99
|
(0.46)
|
139
|
| 25.41
|
43,557
|
1.16
|
(0.56)
|
|
1.05
|
(0.44)
|
95
|
| 2.10
|
34,468
|
1.24
|
(0.32)
|
|
1.19
|
(0.26)
|
106
|
| 1.00
|
62,403
|
1.25
|
(0.75)
|
|
1.22
|
(0.71)
|
128
|
| (a)
|
Per share Net
Investment Income (Loss) is calculated using the average daily shares method. |
| (b)
|
Total
return is the combination of changes in NAV without any sales charge, reinvested dividend income at NAV and reinvested capital gains distributions at NAV, if any. Total returns are not annualized. |
| (c)
|
After fee
waiver and/or expense reimbursement from the Adviser, where applicable. See Note 7 – Management Fees and Other Transactions with Affiliates, Management Fees for more information. |
| (d)
|
Portfolio
Turnover Rate is calculated based on the lesser of long-term purchases or sales (as disclosed in Note 4 – Portfolio Securities and Investment in Derivatives, Investment Transactions) divided by the average long-term market value
during the period. |
| (e)
|
For the
period June 30, 2016 (commencement of operations) through October 31, 2016. |
| *
|
Annualized.
|
See accompanying notes to financial statements.
Notes to Financial Statements
1. General Information
Trust and Fund Information
Nuveen Investment Funds, Inc. (the “Trust”), is an
open-end management investment company registered under the Investment Company Act of 1940, as amended (the "1940 Act"). The Trust is comprised of Nuveen Mid Cap Growth Opportunities Fund (“Mid Cap Growth Opportunities”) and Nuveen Small
Cap Growth Opportunities Fund (“Small Cap Growth Opportunities”), (each a “Fund” and collectively, the “Funds”), as diversified funds, among others. The Trust was incorporated in the State of Maryland on August
20, 1987.
The end of the reporting period for the Funds
is October 31, 2019 , and the period covered by these Notes to Financial Statements is the fiscal year ended October 31, 2019 (the “current fiscal period”).
Investment Adviser
The Funds' investment adviser is Nuveen Fund Advisors, LLC (the
“Adviser”), a subsidiary of Nuveen, LLC (“Nuveen”). Nuveen is the investment management arm of Teachers Insurance and Annuity Association of America (TIAA). The Adviser has overall responsibility for management of the Funds,
oversees the management of the Funds' portfolios, manages the Funds' business affairs and provides certain clerical, bookkeeping and other administrative services, and, if necessary, asset allocation decisions. The Adviser has entered into
sub-advisory agreements with Nuveen Asset Management, LLC, (the “Sub-Adviser”), a subsidiary of the Adviser, under which the Sub-Adviser manages the investment portfolios of the Funds.
Share Classes and Sales Charges
Class A Shares are generally sold with an up-front sales charge
and incur a 0.25% annual 12b-1 service fee. Class A Share purchases of $1 million or more are sold at net asset value (“NAV”) without an up-front sales charge but may be subject to a contingent deferred sales charge (“CDSC”)
of 1% if redeemed within eighteen months of purchase. Class C Shares are sold without an up-front sales charge but incur a 0.75% annual 12b-1 distribution fee and a 0.25% annual 12b-1 service fee. Class C Shares are subject to a CDSC of 1% if
redeemed within twelve months of purchase. Class C Shares automatically convert to Class A Shares ten years after purchase. Class R3 Shares are sold without an up-front sales charge but incur a 0.25% annual 12b-1 distribution fee and a 0.25% annual
12b-1 service fee. Class R6 Shares and Class I Shares are not subject to any sales charge or 12b-1 distribution or service fees.
2. Significant Accounting Policies
The accompanying financial statements were prepared in
accordance with accounting principles generally accepted in the United States of America (“U.S. GAAP”), which may require the use of estimates made by management and the evaluation of subsequent events. Actual results may differ from
those estimates. Each Fund is an investment company and follows accounting guidance in the Financial Accounting Standards Board (“FASB”) Accounting Standards Codification 946, Financial Services—Investment Companies. The NAV for
financial reporting purposes may differ from the NAV for processing security and shareholder transactions. The NAV for financial reporting purposes includes security and shareholder transactions through the date of the report. Total return is
computed based on the NAV used for processing security and shareholder transactions. The following is a summary of the significant accounting policies consistently followed by the Funds.
Compensation
The Trust pays no compensation directly to those of its
directors who are affiliated with the Adviser or to its officers, all of whom receive remuneration for their services to the Trust from the Adviser or its affiliates. The Funds' Board of Directors (the "Board") has adopted a deferred compensation
plan for independent directors that enables directors to elect to defer receipt of all or a portion of the annual compensation they are entitled to receive from certain Nuveen-advised funds. Under the plan, deferred amounts are treated as though
equal dollar amounts had been invested in shares of select Nuveen-advised funds.
Distributions to Shareholders
Distributions to shareholders are recorded on the ex-dividend
date. The amount, character and timing of distributions are determined in accordance with federal income tax regulations, which may differ from U.S. GAAP.
Indemnifications
Under the Trust’s organizational documents, its officers
and directors are indemnified against certain liabilities arising out of the performance of their duties to the Trust. In addition, in the normal course of business, the Trust enters into contracts that provide general indemnifications to other
parties. The Trust's maximum exposure under these arrangements is unknown as this would involve future claims that may be made against the Trust that have not yet occurred. However, the Trust has not had prior claims or losses pursuant to these
contracts and expects the risk of loss to be remote.
Investments and Investment Income
Securities transactions are accounted for as of the trade date
for financial reporting purposes. Realized gains and losses on securities transactions are based upon the specific identification method. Dividend income is recorded on the ex-dividend date or, for certain foreign securities, when information is
available. Non-cash dividends received in the form of stock, if any, are recognized on the ex-dividend date and recorded at fair value. Interest income reflects the amortization of premiums and accretion of discounts for financial reporting purposes
and is recorded on an accrual basis. Interest income also reflects payment-in-kind ("PIK") interest and paydown gains and losses, if any. PIK interest represents income received in the form of securities in lieu of cash. Securities lending income is
comprised of fees earned from borrowers and income earned on cash collateral investments.
Multiclass Operations and Allocations
Income and expenses of the Funds that are not directly
attributable to a specific class of shares are prorated among the classes based on the relative net assets of each class. Expenses directly attributable to a class of shares are recorded to the specific class. Currently, the only expenses that are
allocated on a class-specific basis are 12b-1 distribution and service fees.
Sub-transfer agent fees and similar fees, which are recognized
as a component of “Shareholder servicing agent fees” on the Statement of Operations, are not charged to Class R6 Shares and are prorated among the other classes based on their relative net assets.
Realized and unrealized capital gains and losses of the Funds
are prorated among the classes based on the relative net assets of each class.
Netting Agreements
In the ordinary course of business, the Funds may enter into
transactions subject to enforceable International Swaps and Derivatives Association, Inc. (ISDA) master agreements or other similar arrangements (“netting agreements”). Generally, the right to offset in netting agreements allows each
Fund to offset certain securities and derivatives with a specific counterparty, when applicable, as well as any collateral received or delivered to that counterparty based on the terms of the agreements. Generally, each Fund manages its cash
collateral and securities collateral on a counterparty basis.
The Funds' investments subject to netting agreements as of the
end of the reporting period, if any, are further described in Note 4 - Portfolio Securities and Investments in Derivatives.
New Accounting Pronouncements and Rule Issuances
Fair Value Measurement: Disclosure Framework
During August 2018, the FASB issued Accounting Standards Update
("ASU") 2018-13 (“ASU 2018-13”), Fair Value Measurement: Disclosure Framework – Changes to the Disclosure Requirements for Fair Value Measurements. ASU 2018-13 modifies the
disclosures required by Topic 820, Fair Value Measurements. The amendments in ASU 2018-13 are effective for all entities for fiscal years, and interim periods within those fiscal years, beginning after
December 15, 2019. Management has early implemented this guidance and it did not have a material impact on the Funds' financial statements.
3. Investment Valuation and Fair Value
Measurements
The fair valuation input levels as described
below are for fair value measurement purposes.
The Funds'
investments in securities are recorded at their estimated fair value. Fair value is defined as the price that would be received upon selling an investment or transferring a liability in an orderly transaction to an independent buyer in the principal
or most advantageous market for the investment. A three-tier hierarchy is used to maximize the use of observable market data and minimize the use of unobservable inputs and to establish classification of fair value measurements for disclosure
purposes. Observable inputs reflect the assumptions market participants would use in pricing the asset or liability. Observable inputs are based on market data obtained from sources independent of the reporting entity. Unobservable inputs reflect
the reporting entity’s own assumptions about the assumptions market participants would use in pricing the asset or liability. Unobservable inputs are based on the best information available in the circumstances. The following is a summary of
the three-tiered hierarchy of valuation input levels.
Level 1
– Inputs are unadjusted and prices are determined using quoted prices in active markets for identical securities.
Level 2
– Prices are determined using other significant observable inputs (including quoted prices for similar securities, interest rates, credit spreads, etc.).
Level 3
– Prices are determined using significant unobservable inputs (including management’s assumptions in determining the fair value of investments).
Common stocks and other equity-type securities are valued at
the last sales price on the securities exchange on which such securities are primarily traded and are generally classified as Level 1. Securities primarily traded on the Nasdaq National Market ("Nasdaq") are valued at the Nasdaq Official
Notes to Financial Statements (continued)
Closing Price and are generally classified as Level 1. However, securities
traded on a securities exchange or Nasdaq for which there were no transactions on a given day or securities not listed on a securities exchange or Nasdaq are valued at the quoted bid price and are generally classified as Level 2.
Exchange-traded funds are valued at the last sales price on the
securities exchange on which such securities are primarily traded and are generally classified as Level 1.
Investments in investment companies are valued at their
respective NAVs on the valuation date and are generally classified as Level 1.
Certain securities may not be able to be priced by the
pre-established pricing methods as described above. Such securities may be valued by the Board and/or its appointee at fair value. These securities generally include, but are not limited to, restricted securities (securities which may not be
publicly sold without registration under the Securities Act of 1933, as amended) for which an independent pricing service ("pricing service") is unable to provide a market price; securities whose trading has been formally suspended; debt securities
that have gone into default and for which there is no current market quotation; a security whose market price is not available from a pre-established pricing source; a security with respect to which an event has occurred that is likely to materially
affect the value of the security after the market has closed but before the calculation of a Fund’s NAV (as may be the case in non-U.S. markets on which the security is primarily traded) or make it difficult or impossible to obtain a reliable
market quotation; and a security whose price, as provided by the pricing service, is not deemed to reflect the security’s fair value. As a general principle, the fair value of a security would appear to be the amount that the owner might
reasonably expect to receive for it in a current sale. A variety of factors may be considered in determining the fair value of such securities, which may include consideration of the following: yields or prices of investments of comparable quality,
type of issue, coupon, maturity and rating, market quotes or indications of value from security dealers, evaluations of anticipated cash flows or collateral, general market conditions and other information and analysis, including the obligor’s
credit characteristics considered relevant. These securities are generally classified as Level 2 or Level 3 depending on the observability of the significant inputs. Regardless of the method employed to value a particular security, all valuations
are subject to review by the Board and/or its appointee.
The inputs or methodologies used for valuing securities are not
an indication of the risks associated with investing in those securities. The following is a summary of each Fund’s fair value measurements as of the end of the reporting period:
| Mid
Cap Growth Opportunities |
Level
1 |
Level
2 |
Level
3 |
Total
|
| Long-Term
Investments*: |
|
|
|
|
| Common
Stocks |
$390,080,440
|
$ —
|
$ —
|
$390,080,440
|
| Investments
Purchased with Collateral from Securities Lending |
13,487,328
|
—
|
—
|
13,487,328
|
| Short-Term
Investments: |
|
|
|
|
| Money
Market Funds |
2,526,404
|
—
|
—
|
2,526,404
|
| Total
|
$406,094,172
|
$ —
|
$ —
|
$406,094,172
|
| Small
Cap Growth Opportunities |
Level
1 |
Level
2 |
Level
3 |
Total
|
| Long-Term
Investments*: |
|
|
|
|
| Common
Stocks |
$205,734,243
|
$ —
|
$
1** |
$205,734,244
|
| Exchange-Traded
Funds |
3,228,548
|
—
|
—
|
3,228,548
|
| Investments
Purchased with Collateral from Securities Lending |
11,100,658
|
—
|
—
|
11,100,658
|
| Short-Term
Investments: |
|
|
|
|
| Money
Market Funds |
791,738
|
—
|
—
|
791,738
|
| Total
|
$220,855,187
|
$ —
|
$
1 |
$220,855,188
|
| *
|
Refer to the
Fund's Portfolio of Investments for industry classifications. |
| **
|
Refer
to the Fund's Portfolio of Investments for securities classified as Level 3. |
4. Portfolio Securities and Investments in
Derivatives
Securities Lending
In order to generate additional income, the Funds may lend
securities representing up to one-third of the value of its total assets (which includes collateral for securities on loan) to broker-dealers, banks or other institutions. When loaning securities, each Fund retains the benefits of owning the
securities, including the economic equivalent of dividends or interest generated by the security. The Funds also have the ability to recall the securities on loan at any time.
Each Fund’s policy is to receive, at the inception of a
loan, cash collateral equal to at least 102% of the value of securities loaned, which is recognized as “Payable for collateral from securities lending program” on the Statement of Assets and Liabilities. Collateral for securities on loan
is invested in a money market fund, which is recognized as “Investments purchased with collateral from securities lending, at value” on the Statement of Assets and Liabilities. The market value of the securities loaned is determined at
the close of each business day in order to determine the adequacy of the collat-
eral. If the value of the securities on loan increases such that the level of
collateralization falls below 100%, additional collateral is received from the borrower on the next business day, which is recognized as “Due from broker” on the Statement of Assets and Liabilities.
Securities out on loan are subject to termination at any time
at the option of the borrower or the Fund. Upon termination, the borrower is required to return to the Fund securities identical to the securities loaned. Generally, in the event the borrower defaults on its obligation to return the loaned
securities, the Fund has the right to use the collateral to acquire identical securities. In the event the Fund is delayed or prevented from exercising its right to dispose of the collateral, there may be a loss to the Fund. Under the Funds’
securities lending agreement, however, the securities lending agent has indemnified the Fund against losses resulting from borrower default, except to the extent that those losses result from a decrease in the value of the collateral due to its
investment by the Funds. The Funds bear the risk of loss with respect to the investment of collateral.
The Funds’ custodian, U.S. Bank National Association,
serves as their securities lending agent. Income earned from the securities lending program is paid to the Funds. Income from securities lending, is recognized as “Securities lending income” on the Statement of Operations.
The following table presents the securities out on loan for the
Funds, and the collateral delivered related to those securities, as of the end of the reporting period.
| Fund
|
Asset
Class out on Loan |
Long-Term
Investments, at Value |
Collateral
Pledged (From)
Counterparty* |
Net
Exposure |
| Mid
Cap Growth Opportunities |
Common
Stocks |
$12,331,368
|
$(12,331,368)
|
$ —
|
| Small
Cap Growth Opportunities |
|
|
|
|
| |
Common
Stocks |
$
7,219,122 |
$
(7,219,122) |
$ —
|
| |
Exchange-Traded
Funds |
3,101,940
|
(3,101,940)
|
—
|
| Total
|
|
$10,321,062
|
$(10,321,062)
|
$ —
|
* As of the end of the reporting
period, the value of the collateral pledged from the counterparty exceeded the value of the securities out on loan. Refer to the Fund’s Portfolio of Investments for details on the securities out on loan.
Long-term purchases and sales (excluding investments purchased
with collateral from securities lending) during the current fiscal period were as follows:
| |
Mid
Cap
Growth
Opportunities |
Small
Cap
Growth
Opportunities |
| Purchases
|
$429,154,475
|
$250,125,090
|
| Sales
|
709,570,504
|
155,785,448
|
Investments in Derivatives
Each Fund is authorized to invest in certain derivative
instruments. The Funds record derivative instruments at fair value, with changes in fair value recognized on the Statement of Operations, when applicable. Even though the Funds’ investments in derivatives may represent economic hedges, they
are not considered to be hedge transactions for financial reporting purposes.
Although the Funds are authorized to invest in derivative
instruments, and may do so in the future, they did not make any such investments during the current fiscal period.
Market and Counterparty Credit Risk
In the normal course of business each Fund may invest in
financial instruments and enter into financial transactions where risk of potential loss exists due to changes in the market (market risk) or failure of the other party to the transaction to perform (counterparty credit risk). The potential loss
could exceed the value of the financial assets recorded on the financial statements. Financial assets, which potentially expose each Fund to counterparty credit risk, consist principally of cash due from counterparties on forward, option and swap
transactions, when applicable. The extent of each Fund’s exposure to counterparty credit risk in respect to these financial assets approximates their carrying value as recorded on the Statement of Assets and Liabilities.
Each Fund helps manage counterparty credit risk by entering
into agreements only with counterparties the Adviser believes have the financial resources to honor their obligations and by having the Adviser monitor the financial stability of the counterparties. Additionally, counterparties may be required to
pledge collateral daily (based on the daily valuation of the financial asset) on behalf of each Fund with a value approximately equal to the amount of any unrealized gain above a pre-determined threshold. Reciprocally, when each Fund has an
unrealized loss, the Funds have instructed the custodian to pledge assets of the Funds as collateral with a value approximately equal to the amount of the unrealized loss above a pre-determined threshold. Collateral pledges are monitored and
subsequently adjusted if and when the valuations fluctuate, either up or down, by at least the pre-determined threshold amount.
Notes to Financial Statements (continued)
5. Fund Shares
Transactions in Fund shares during the current and prior fiscal
period were as follows:
| |
Year
Ended
10/31/19 |
|
Year
Ended
10/31/18 |
| Mid
Cap Growth Opportunities |
Shares
|
Amount
|
|
Shares
|
Amount
|
| Shares
sold: |
|
|
|
|
|
| Class
A |
381,375
|
$
12,098,040 |
|
532,312
|
$
20,896,061 |
| Class
A – automatic conversion of Class C Shares |
998
|
34,101
|
|
5,815
|
227,664
|
| Class
C |
47,996
|
973,428
|
|
39,840
|
1,128,803
|
| Class
R3 |
161,505
|
4,630,162
|
|
152,474
|
5,555,412
|
| Class
R6 |
75,575
|
3,119,375
|
|
139,147
|
6,652,732
|
| Class
I |
606,951
|
24,565,020
|
|
841,306
|
40,017,435
|
| Shares
issued to shareholders due to reinvestment of distributions: |
|
|
|
|
|
| Class
A |
1,226,272
|
33,170,652
|
|
1,152,716
|
42,051,063
|
| Class
C |
99,901
|
1,794,220
|
|
127,561
|
3,418,634
|
| Class
R3 |
184,336
|
4,530,984
|
|
192,865
|
6,534,257
|
| Class
R6 |
230,398
|
7,948,731
|
|
238,476
|
10,590,712
|
| Class
I |
1,034,993
|
35,272,553
|
|
1,259,374
|
55,425,059
|
| |
4,050,300
|
128,137,266
|
|
4,681,886
|
192,497,832
|
| Shares
redeemed: |
|
|
|
|
|
| Class
A |
(1,803,821)
|
(58,701,202)
|
|
(2,133,046)
|
(84,523,328)
|
| Class
C |
(186,840)
|
(3,953,792)
|
|
(343,445)
|
(9,877,658)
|
| Class
C – automatic conversion to Class A Shares |
(1,478)
|
(34,101)
|
|
(7,948)
|
(227,664)
|
| Class
R3 |
(385,941)
|
(11,739,558)
|
|
(445,516)
|
(16,156,519)
|
| Class
R6 |
(946,169)
|
(35,233,404)
|
|
(545,088)
|
(25,796,215)
|
| Class
I |
(5,199,942)
|
(209,884,823)
|
|
(3,004,604)
|
(142,451,408)
|
| |
(8,524,191)
|
(319,546,880)
|
|
(6,479,647)
|
(279,032,792)
|
| Net
increase (decrease) |
(4,473,891)
|
$(191,409,614)
|
|
(1,797,761)
|
$
(86,534,960) |
| |
Year
Ended
10/31/19 |
|
Year
Ended
10/31/18 |
| Small
Cap Growth Opportunities |
Shares
|
Amount
|
|
Shares
|
Amount
|
| Shares
sold: |
|
|
|
|
|
| Class
A |
86,241
|
$
1,757,412 |
|
137,003
|
$
3,379,320 |
| Class
A – automatic conversion of Class C Shares |
86
|
1,959
|
|
35
|
897
|
| Class
C |
25,260
|
374,828
|
|
43,035
|
814,308
|
| Class
R3 |
68,017
|
1,198,396
|
|
38,662
|
861,790
|
| Class
R6 |
397
|
10,095
|
|
5,382
|
169,074
|
| Class
I |
5,485,979
|
138,575,880
|
|
894,685
|
26,116,093
|
| Shares
issued to shareholders due to reinvestment of distributions: |
|
|
|
|
|
| Class
A |
278,640
|
4,940,279
|
|
183,808
|
4,069,501
|
| Class
C |
29,198
|
373,153
|
|
18,965
|
323,348
|
| Class
R3 |
10,176
|
167,910
|
|
9,604
|
200,538
|
| Class
R6 |
54,751
|
1,183,722
|
|
76,532
|
2,000,545
|
| Class
I |
186,946
|
4,026,813
|
|
110,271
|
2,875,871
|
| |
6,225,691
|
152,610,447
|
|
1,517,982
|
40,811,285
|
| Shares
redeemed: |
|
|
|
|
|
| Class
A |
(279,297)
|
(5,605,855)
|
|
(181,677)
|
(4,419,661)
|
| Class
C |
(64,540)
|
(982,334)
|
|
(53,326)
|
(1,002,662)
|
| Class
C – automatic conversion to Class A Shares |
(113)
|
(1,959)
|
|
(46)
|
(897)
|
| Class
R3 |
(68,171)
|
(1,262,093)
|
|
(62,133)
|
(1,375,752)
|
| Class
R6 |
(568,741)
|
(14,947,424)
|
|
(228,134)
|
(6,741,215)
|
| Class
I |
(943,081)
|
(23,224,527)
|
|
(502,646)
|
(14,229,763)
|
| |
(1,923,943)
|
(46,024,192)
|
|
(1,027,962)
|
(27,769,950)
|
| Net
increase (decrease) |
4,301,748
|
$106,586,255
|
|
490,020
|
$
13,041,335 |
6. Income Tax Information
Each Fund is a separate taxpayer for federal income tax
purposes. Each Fund intends to distribute substantially all of its net investment income and net capital gains to shareholders and to otherwise comply with the requirements of Subchapter M of the Internal Revenue Code applicable to regulated
investment companies. Therefore, no federal income tax provision is required.
For all open tax years and all major taxing jurisdictions, management of the
Funds has concluded that there are no significant uncertain tax positions that would require recognition in the financial statements. Open tax years are those that are open for examination by taxing authorities (i.e., generally the last four tax
year ends and the interim tax period since then). Furthermore, management of the Funds is also not aware of any tax positions for which it is reasonably possible that the total amounts of unrecognized tax benefits will significantly change in the
next twelve months.
The following information is
presented on an income tax basis. Differences between amounts for financial statement and federal income tax purposes are primarily due to timing differences in recognizing certain gains and losses on investment transactions. To the extent that
differences arise that are permanent in nature, such amounts are reclassified within the capital accounts as detailed below. Temporary differences do not require reclassification. Temporary and permanent differences do not impact the NAVs of the
Funds.
The table below presents the cost and unrealized
appreciation (depreciation) of each Fund's investment portfolio, as determined on a federal income tax basis, as of October 31, 2019.
| |
Mid
Cap
Growth
Opportunities |
Small
Cap
Growth
Opportunities |
| Tax
cost of investments |
$354,171,009
|
$202,899,467
|
| Gross
unrealized: |
|
|
| Appreciation
|
$
66,446,712 |
$
24,872,771 |
| Depreciation
|
(14,523,549)
|
(6,917,050)
|
| Net
unrealized appreciation (depreciation) of investments |
$
51,923,163 |
$
17,955,721 |
Permanent differences, primarily due to net operating losses,
tax equalization and federal taxes paid, resulted in reclassifications among the Funds' components of net assets as of October 31, 2019, the Funds' tax year end.
The tax components of undistributed net ordinary income and net
long-term capital gains as of October 31, 2019, the Funds' tax year end, were as follows:
| |
Mid
Cap
Growth
Opportunities |
Small
Cap
Growth
Opportunities |
| Undistributed
net ordinary income1 |
$
— |
$ —
|
| Undistributed
net long-term capital gains |
73,785,007
|
—
|
|
1 |
Net ordinary
income consists of net taxable income derived from dividends, interest, and net short-term capital gains, if any. |
The tax character of distributions paid during the
Funds’ tax years ended October 31, 2019 and October 31, 2018 was designated for purposes of the dividends paid deduction as follows:
| 2019
|
Mid
Cap
Growth
Opportunities |
Small
Cap
Growth
Opportunities |
| Distributions
from net ordinary income1 |
$14,130,332
|
$
2,671,096 |
| Distributions
from net long-term capital gains |
76,399,215
|
10,863,365
|
| 2018
|
Mid
Cap
Growth
Opportunities |
Small
Cap
Growth
Opportunities |
| Distributions
from net ordinary income1 |
$
24,962,249 |
$5,294,904
|
| Distributions
from net long-term capital gains |
101,665,729
|
6,021,043
|
|
1 |
Net
ordinary income consists of net taxable income derived from dividends, interest, and net short-term capital gains, if any. |
Notes to Financial Statements (continued)
As of October 31, 2019, the Funds' tax year end, the following Fund had unused
capital losses carrying forward available for federal income tax purposes to be applied against future capital gains, if any. The capital losses are not subject to expiration.
| |
Small
Cap
Growth
Opportunities |
| Not
subject to expiration: |
|
| Short-term
|
$674,567
|
| Long-term
|
—
|
| Total
|
$674,567
|
The Funds have elected to defer
late-year losses in accordance with federal income tax rules. These losses are treated as having arisen on the first day of the following fiscal year. The Funds have elected to defer losses as follows:
| |
Mid
Cap
Growth
Opportunities |
Small
Cap
Growth
Opportunities |
| Post-October
capital losses2 |
$
— |
$
— |
| Late-year
ordinary losses3 |
951,826
|
616,369
|
|
2 |
Capital
losses incurred from November 1, 2018 through October 31, 2019, the Funds' tax year end. |
|
3 |
Ordinary
losses incurred from January 1, 2019 through October 31, 2019 and/or specified losses incurred from November 1, 2018 through October 31, 2019. |
7. Management Fees and Other Transactions with
Affiliates
Management Fees
Each Fund’s management fee compensates the Adviser for
the overall investment advisory and administrative services and general office facilities. The Sub-Adviser is compensated for its services to the Funds from the management fees paid to the Adviser.
Each Fund’s management fee consists of two components
– a fund-level fee, based only on the amount of assets within each individual Fund, and a complex-level fee, based on the aggregate amount of all eligible fund assets managed by the Adviser. This pricing structure enables each
Fund’s shareholders to benefit from growth in the assets within their respective Fund as well as from growth in the amount of complex-wide assets managed by the Adviser.
The annual fund-level fee, payable monthly, for each Fund is
calculated according to the following schedule:
| Average
Daily Net Assets |
Mid
Cap
Growth
Opportunities |
Small
Cap
Growth
Opportunities |
| For
the first $125 million |
0.6000%
|
0.6500%
|
| For
the next $125 million |
0.5875
|
0.6375
|
| For
the next $250 million |
0.5750
|
0.6250
|
| For
the next $500 million |
0.5625
|
0.6125
|
| For
the next $1 billion |
0.5500
|
0.6000
|
| For
the next $3 billion |
0.5250
|
0.5750
|
| For
the next $2.5 billion |
0.5000
|
0.5500
|
| For
the next $2.5 billion |
0.4875
|
0.5375
|
| For
net assets over $10 billion |
0.4750
|
0.5250
|
The annual complex-level fee,
payable monthly, for each Fund is determined by taking the complex-level fee rate, which is based on the aggregate amount of "eligible assets" of all Nuveen funds as set forth in the schedule below, and making, as appropriate, an upward adjustment
to that rate based upon the percentage of the particular fund's assets that are not "eligible assets". The complex-level fee schedule for each Fund is as follows:
| Complex-Level
Eligible Asset Breakpoint Level* |
Effective
Complex-Level Fee Rate at Breakpoint Level |
| $55
billion |
0.2000%
|
| $56
billion |
0.1996
|
| $57
billion |
0.1989
|
| $60
billion |
0.1961
|
| $63
billion |
0.1931
|
| $66
billion |
0.1900
|
| $71
billion |
0.1851
|
| $76
billion |
0.1806
|
| $80
billion |
0.1773
|
| $91
billion |
0.1691
|
| $125
billion |
0.1599
|
| $200
billion |
0.1505
|
| $250
billion |
0.1469
|
| $300
billion |
0.1445
|
*
The complex-level fee is calculated based upon the aggregate daily “eligible assets” of all Nuveen open-end and closed-end funds. Eligible assets do not include assets attributable to investments in other Nuveen
funds or assets in excess of a determined amount (originally $2 billion) added to the Nuveen fund complex in connection with the Adviser’s assumption of the management of the former First American Funds effective January 1, 2011, but do
include certain assets of certain Nuveen funds that were reorganized into funds advised by an affiliate of the Adviser during the 2019 calendar year. Eligible assets include closed-end fund assets managed by the Adviser that are attributable to
certain types of leverage. For these purposes, leverage includes the closed-end funds’ use of preferred stock and borrowings and certain investments in the residual interest certificates (also called inverse floating rate securities) in tender
option bond (TOB) trusts, including the portion of assets held by a TOB trust that has been effectively financed by the trust’s issuance of floating rate securities, subject to an agreement by the Adviser as to certain funds to limit the
amount of such assets for determining eligible assets in certain circumstances. As of October 31, 2019, the complex-level fee for each Fund was as follows:
| Fund
|
Complex-Level
Fee |
| Mid
Cap Growth Opportunities |
0.2000%
|
| Small
Cap Growth Opportunities |
0.1821%
|
The Adviser has agreed to waive
fees and/or reimburse expenses (“Expense Cap”) of the Funds so that total annual Fund operating expenses, (excluding 12b-1 distribution and/or service fees, interest expenses, taxes, acquired fund fees and expenses, fees incurred in
acquiring and disposing of portfolio securities and extraordinary expenses) do not exceed the percentages of the average daily net assets of any class of Fund shares in the amounts and for the time period stated in the following table. However,
because Class R6 Shares are not subject to sub-transfer agent and similar fees, the total annual Fund operating expenses for the Class R6 Shares will be less than the expense limitation. The expense limitation in effect thereafter may be terminated
or modified only with the approval of the Board.
| Fund
|
Expense
Cap |
Expense
Cap
Expiration Date |
| Mid
Cap Growth Opportunities |
0.92%
|
July
31, 2021 |
| Small
Cap Growth Opportunities |
0.99%
|
July
31, 2021 |
Other Transactions with
Affiliates
During the current fiscal period, Nuveen
Securities, LLC, (the “Distributor”), a wholly-owned subsidiary of Nuveen, collected sales charges on purchases of Class A Shares, the majority of which were paid out as concessions to financial intermediaries as follows:
| |
Mid
Cap
Growth
Opportunities |
Small
Cap
Growth
Opportunities |
| Sales
charges collected (Unaudited) |
$41,326
|
$25,381
|
| Paid
to financial intermediaries (Unaudited) |
36,257
|
22,409
|
The Distributor also received 12b-1
service fees on Class A Shares, substantially all of which were paid to compensate financial intermediaries for providing services to shareholders relating to their investments.
During the current fiscal period, the Distributor compensated
financial intermediaries directly with commission advances at the time of purchase as follows:
| |
Mid
Cap
Growth
Opportunities |
Small
Cap
Growth
Opportunities |
| Commission
advances (Unaudited) |
$3,743
|
$3,490
|
Notes to Financial Statements (continued)
To compensate for commissions advanced to financial intermediaries, all 12b-1
service and distribution fees collected on Class C Shares during the first year following a purchase are retained by the Distributor. During the current fiscal period, the Distributor retained such 12b-1 fees as follows:
| |
Mid
Cap
Growth
Opportunities |
Small
Cap
Growth
Opportunities |
| 12b-1
fees retained (Unaudited) |
$3,328
|
$2,115
|
The remaining 12b-1 fees charged to
each Fund were paid to compensate financial intermediaries for providing services to shareholders relating to their investments.
The Distributor also collected and retained CDSC on share
redemptions during the current fiscal period, as follows:
| |
Mid
Cap
Growth
Opportunities |
Small
Cap
Growth
Opportunities |
| CDSC
retained (Unaudited) |
$ —
|
$799
|
8. Borrowing
Arrangements
Committed Line of Credit
The Fund, along with certain other funds managed by the Adviser
(“Participating Funds”), have established a 364-day, $2.65 billion standby credit facility with a group of lenders, under which the Participating Funds may borrow for various purposes other than leveraging for investment purposes. Each
Participating Fund is allocated a designated proportion of the facility’s capacity (and its associated costs, as described below) based upon a multi-factor assessment of the likelihood and frequency of its need to draw on the facility, the
size of the Fund and its anticipated draws, and the potential importance of such draws to the operations and well-being of the Fund, relative to those of the other Funds. A Fund may effect draws on the facility in excess of its designated capacity
if and to the extent that other Participating Funds have undrawn capacity. The credit facility expires in June 2020 unless extended or renewed.
The credit facility has the following terms: a fee of 0.15% per
annum on unused commitment amounts, and interest at a rate equal to the higher of (a) one-month LIBOR (London Inter-Bank Offered Rate) plus 1.00% per annum or (b) the Fed Funds rate plus 1.00% per annum on amounts borrowed. Participating Funds paid
administration, legal and arrangement fees, which are recognized as a component of “Other expenses” on the Statement of Operations, and along with commitment fees, have been allocated among such Participating Funds based upon the
relative proportions of the facility’s aggregate capacity reserved for them and other factors deemed relevant by the Adviser and the Board of each Participating Fund.
During the current fiscal period, Mid Cap Growth Opportunities
utilized this facility for nineteen days. The Fund’s average daily balance outstanding and average annual interest rate during the utilization period(s) was $4,682,644 and 3.51%, respectively. The Fund’s maximum outstanding daily balance
during the utilization period was $10,300,000. Borrowings outstanding as of the end of the reporting period, if any, are recognized as "Borrowings" on the Statement of Assets and Liabilities.
During the current fiscal period, Small Cap Growth
Opportunities did not utilize this facility.
Additional Fund Information
(Unaudited)
Fund Manager
Nuveen Fund Advisors, LLC
333 West Wacker Drive
Chicago, IL 60606
Sub-Adviser
Nuveen Asset Management, LLC
333 West Wacker Drive
Chicago, IL 60606
Independent Registered
Public Accounting Firm
PricewaterhouseCoopers LLP
One North Wacker Drive
Chicago, IL 60606
Custodian
U.S. Bank National Association
1555 North RiverCenter Drive
Suite 302
Milwaukee, WI 53212
Legal Counsel
Chapman and Cutler LLP
Chicago, IL 60603
Transfer Agent and
Shareholder Services
DST Asset Manager
Solutions, Inc. (DST)
P.O. Box 219140
Kansas City, MO 64121-9140
(800) 257-8787
Long-Term Capital Gain Distributions: The Funds hereby designate as long-term capital gain dividends, pursuant to Internal Revenue Code Section 852(b)(3), the amount shown in the accompanying table or, if greater, the amount necessary to reduce earnings and
profits of the Funds related to net capital gain to zero for the tax year ended October 31, 2019.
| |
Mid
Cap
Growth
Opportunities |
Small
Cap
Growth
Opportunities |
| Long-term
capital gain dividends |
$83,977,835
|
$10,863,365
|
Distribution Information: The Funds hereby designate their percentages of dividends paid from net ordinary income as dividends qualifying for the dividends received deduction (“DRD”) for corporations and their percentages as
qualified dividend income (“QDI”) for individuals under Section 1(h)(11) of the Internal Revenue Code as shown in the accompanying table. The actual qualified dividend income distributions will be reported to shareholders on Form
1099-DIV which will be sent to shareholders shortly after calendar year end.
| |
Mid
Cap
Growth
Opportunities |
Small
Cap
Growth
Opportunities |
| %
of DRD |
31.4%
|
21.3%
|
| %
of QDI |
30.9%
|
21.3%
|
Portfolio of Investments
Information: Each Fund is required to file its complete schedule of portfolio holdings with the Securities and Exchange Commission (SEC) for the first and third quarters of each fiscal year as an exhibit to its
report on Form N-PORT. You may obtain this information on the SEC's website at http://www.sec.gov.
Nuveen Funds’ Proxy Voting Information: You may obtain (i) information regarding how each fund voted proxies relating to portfolio securities held during the most recent twelve-month period ended June 30, without charge, upon request, by calling Nuveen
toll-free at (800) 257-8787 or on Nuveen’s website at www.nuveen.com and (ii) a description of the policies and procedures that each fund used to determine how to vote proxies relating to portfolio securities without charge, upon request, by
calling Nuveen toll-free at (800) 257-8787. You may also obtain this information directly from the SEC. Visit the SEC on-line at http://www.sec.gov.
FINRA BrokerCheck:
The Financial Industry Regulatory Authority (FINRA) provides information regarding the disciplinary history of FINRA member firms and associated investment professionals. This information as well as an investor brochure describing FINRA BrokerCheck
is available to the public by calling the FINRA BrokerCheck Hotline number at (800) 289-9999 or by visiting www.FINRA.org.
Glossary of Terms Used in this Report
(Unaudited)
Average
Annual Total Return: This is a commonly used method to express an investment’s performance over a particular, usually multi-year time period. It expresses the return that would have been necessary each year to
equal the investment’s actual cumulative performance (including change in NAV or market price and reinvested dividends and capital gains distributions, if any) over the time period being considered.
Gross Domestic Product (GDP):
The total market value of all final goods and services produced in a country/region in a given year, equal to total consumer, investment and government spending, plus the value of exports, minus the value of
imports.
Lipper Mid-Cap Growth Funds
Classification Average: Represents the average annualized total return for all reporting funds in the Lipper Mid-Cap Growth Funds Classification. Lipper returns account for the effects of management fees and assume
reinvestment of distributions but do not reflect any applicable sales charges.
Lipper Small-Cap Growth Funds Classification Average: Represents the average annualized total return for all reporting funds in the Lipper Small-Cap Growth Funds Classification. Lipper returns account for the effects of management fees and assume reinvestment of
distributions but do not reflect any applicable sales charges.
Market Capitalization: The
market capitalization of a company is equal to the number of the company’s common shares outstanding multiplied by the current price of the company’s stock.
MSCI EAFE Index: The MSCI
(Morgan Stanley Capital International) EAFE (Europe, Australasia, Far East) Index is a free float-adjusted market capitalization weighted index designed to measure developed market equity performance, excluding the U.S. and Canada. The index returns
assume reinvestment of distributions, but do not reflect any applicable sales charges or management fees.
MSCI Emerging Markets Index:
The MSCI (Morgan Stanley Capital International) Emerging Markets Index is an unmanaged index considered representative of stocks of developing countries. The index returns assume reinvestment of distributions, but
do not reflect any applicable sales charges or management fees.
Net Asset Value (NAV) Per Share: A fund’s Net Assets is equal to its total assets (securities, cash and accrued earnings) less its total liabilities. For funds with multiple classes, Net Assets are determined separately for each share class. NAV
per share is equal to the fund’s (or share class’) Net Assets divided by its number of shares outstanding.
Russell 2000® Growth Index: An index that measures the performance of those Russell 2000 companies with higher price-to-book
ratios and higher forecasted growth values. The index returns assume reinvestment of distributions, but do not reflect any applicable sales charges or management fees.
Russell 2000® Index: An index that measures the performance of the small-cap segment of the U.S. equity universe. The Russell 2000® Index is a subset of the Russell 3000® Index
representing approximately 10% of the total market capitalization of that index. It includes approximately 2,000 of the smallest securities based on a combination of their market cap and current index membership. The index returns assume
reinvestment of distributions, but do not reflect any applicable sales charges or management fees.
Russell Midcap® Index: An index that measures the performance of the mid-cap segment of the U.S. equity universe. The Russell Midcap
Index measures the performance of the smallest 800 companies in the Russell 1000® Index. The index returns assume reinvestment of distributions, but
do not reflect any applicable sales charges or management fees.
Russell Midcap® Growth Index: An index that measures the performance of the mid-cap growth segment of the U.S. equity universe. It
includes those Russell Midcap Index companies with higher price-to-book ratios and higher forecasted growth values. The index returns assume reinvestment of distributions, but do not reflect any applicable sales charges or management
fees.
S&P 500®: An unmanaged index generally considered representative of the U.S. stock market. Index returns assume reinvestment
of distributions, but do not include the effects of any applicable sales charges or management fees.
Tax Equalization: The
practice of treating a portion of the distribution made to a redeeming shareholder, which represents his proportionate part of undistributed net investment income and capital gain as a distribution for tax purposes. Such amounts are referred to as
the equalization debits (or payments) and will be considered a distribution to the shareholder of net investment income and capital gain for calculation of the fund’s dividends paid deduction.
Annual Investment Management Agreement Approval
Process
(Unaudited)
At a
meeting held on May 21-23, 2019 (the “May Meeting”), the Board of Directors (the “Board” and each Director, a “Board Member”) of the Funds, including the Board Members who are not “interested persons”
(as defined under the Investment Company Act of 1940 (the “1940 Act”)) (the “Independent Board Members”), approved, for each Fund, the renewal of the management agreement (each, an “Investment Management
Agreement”) with Nuveen Fund Advisors, LLC (the “Adviser”) pursuant to which the Adviser serves as investment adviser to such Fund and the sub-advisory agreement (each, a “Sub-Advisory Agreement”) with Nuveen Asset
Management, LLC (the “Sub-Adviser”) pursuant to which the Sub-Adviser serves as the sub-adviser to such Fund. Following an initial two-year period, the Board, including the Independent Board Members, is required under the 1940 Act to
review and approve each Investment Management Agreement and Sub-Advisory Agreement on behalf of the applicable Fund on an annual basis. The Investment Management Agreements and Sub-Advisory Agreements are collectively referred to as the
“Advisory Agreements” and the Adviser and the Sub-Adviser are collectively, the “Fund Advisers” and each, a “Fund Adviser.”
In response to a request on behalf of the Independent Board
Members by independent legal counsel, the Board received and reviewed prior to the May Meeting extensive materials specifically prepared for the annual review of Advisory Agreements by the Adviser as well as by Broadridge Financial Solutions, Inc.
(“Broadridge”), an independent provider of investment company data. The materials provided in connection with the annual review covered a breadth of subject matter including, but not limited to, a description of the nature, extent and
quality of services provided by the Fund Advisers; a review of the Sub-Adviser and investment team; an analysis of fund performance in absolute terms and as compared to the performance of certain peer funds and benchmarks with a focus on any
performance outliers; an analysis of the fees and expense ratios of the Nuveen funds in absolute terms and as compared to those of certain peer funds with a focus on any expense outliers; a description of portfolio manager compensation; a review of
the performance of various service providers; a description of various initiatives Nuveen had undertaken or continued during the year for the benefit of particular fund(s) and/or the complex; a description of the profitability or financial data of
Nuveen and the Sub-Adviser; and a description of indirect benefits received by the Fund Advisers as a result of their relationships with the Nuveen funds. The Board Members held an in-person meeting on April 17-18, 2019 (the “April
Meeting”), in part, to review and discuss the performance of the Nuveen funds and the Adviser’s evaluation of the various sub-advisers to the Nuveen funds. The Independent Board Members asked questions and requested additional
information that was provided for the May Meeting.
The
information prepared specifically for the annual review of the Advisory Agreements supplemented the information provided to the Board and its committees throughout the year. The Board and its committees met regularly during the year and the
information provided and topics discussed were relevant to the review of the Advisory Agreements. Some of these reports and other data included, among other things, materials that outlined the investment performance of the Nuveen funds; strategic
plans of the Adviser which may impact the services it provides to the Nuveen funds; the review of the Nuveen funds and applicable investment teams; compliance, regulatory and risk management matters; the trading practices of the various
sub-advisers; valuation of securities; fund expenses; payments to financial intermediaries, including 12b-1 fees and sub-transfer agency fees; and overall market and regulatory developments. The Board further continued its practice of seeking to
meet periodically with the various sub-advisers to the Nuveen funds and their investment teams, when feasible. The Independent Board Members considered the review of the Advisory Agreements to be an ongoing process and employed the accumulated
information, knowledge, and experience the Board Members had gained during their tenure on the boards governing the Nuveen funds and working with the Fund Advisers in their review of the Advisory Agreements. The contractual arrangements are a result
of multiple years of review, negotiation and information provided in connection with the boards’ annual review of the Nuveen funds’ advisory arrangements and oversight of the Nuveen funds.
The Independent Board Members were advised by independent legal
counsel during the annual review process as well as throughout the year, including meeting in executive sessions with such counsel at which no representatives from the Adviser or the Sub-Adviser were present. In connection with their annual review,
the Independent Board Members also received a memorandum from independent legal counsel outlining their fiduciary duties and legal standards in reviewing the Advisory Agreements.
In deciding to renew the Advisory Agreements, the Independent
Board Members did not identify a particular factor or information as determinative or controlling, but rather the decision reflected the comprehensive consideration of all the information provided, and each Board Member may have attributed different
levels of importance to the various factors and information considered in connection with the approval process. The following summarizes the principal factors and information, but not all the factors, the Board considered in deciding to renew the
Advisory Agreements and its conclusions.
A. Nature,
Extent and Quality of Services
In evaluating the renewal
of the Advisory Agreements, the Independent Board Members received and considered information regarding the nature, extent and quality of the applicable Fund Adviser’s services provided to the respective Fund with particular focus on the
services and enhancements to such services provided during the last year. The Board recognized that the Adviser provides a comprehensive set of services necessary to operate the Nuveen funds in a highly regulated industry and noted that the scope of
such services has expanded over the years as a result of regulatory, market and other developments, such as the development of the liquidity management program and expanded compliance programs. Some of the functions the Adviser is responsible for
include, but are not limited to: product management (such as analyzing a fund’s position in the marketplace, setting dividends, preparing shareholder and intermediary communications and other due diligence support); investment oversight (such
as analyzing fund performance, sub-advisers and investment teams and analyzing trade executions of portfolio transactions, soft dollar practices and securities lending activities); securities valuation services (such as executing the daily valuation
process for portfolio securities and developing and recommending changes to valuation policies and procedures); risk management (such as overseeing operational and investment risks, including stress testing); fund administration (such as preparing
fund tax returns and other tax compliance services, overseeing the Nuveen funds’ independent public accountants and other service providers; managing fund budgets and expenses; and helping to fulfill the funds’ regulatory filing
requirements); oversight of shareholder services and transfer agency functions (such as oversight and liaison of transfer agent service providers which include registered shareholder customer service and transaction processing); Board relations
services (such as organizing and administering Board and committee meetings, preparing various reports to the Board and committees and providing other support services); compliance and regulatory oversight services (such as developing and
maintaining a compliance program to ensure compliance with applicable laws and regulations, monitoring compliance with applicable fund policies and procedures and adherence to investment restrictions, and evaluating the compliance programs of the
Nuveen fund sub-advisers and certain other service providers); and legal support and oversight of outside law firms (such as with respect to filing and updating registration statements; maintaining various regulatory registrations; and providing
legal interpretations regarding fund activities, applicable regulations and implementation of policies and procedures). In reviewing the scope and quality of services, the Board recognized the continued efforts and resources the Adviser and its
affiliates have employed to continue to enhance their services for the benefit of the complex as well as particular Nuveen funds over recent years. Such service enhancements have included, but are not limited to:
| •
|
Fund
Improvements and Product Management Initiatives – continuing to proactively manage the Nuveen fund complex as a whole and at the individual fund level with an aim to enhance the shareholder outcomes through, among other things,
repositioning funds, merging funds, introducing additional share classes, reviewing and updating investment policies and benchmarks, modifying the composition of certain portfolio management teams and analyzing various data to help devise such
improvements; |
| •
|
Capital
Initiatives – continuing to invest capital to support new funds with initial capital as well as to facilitate modifications to the strategies or structure of existing funds; |
| •
|
Compliance
Program Initiatives – continuing efforts to enhance the compliance program through, among other things, internally integrating various portfolio management teams and aligning compliance support accordingly, completing a
comprehensive review of existing policies and procedures and revising such policies and procedures as appropriate, enhancing compliance-related technologies and workflows, and optimizing compliance shared services across the organization and
affiliates; |
| •
|
Risk
Management and Valuation Services - continuing efforts to strengthen the risk management functions, including through, among other things, enhancing the interaction and reporting between the investment risk management team and various affiliates,
increasing the efficiency of risk monitoring performed on the Nuveen funds through improved reporting, continuing to implement risk programs designed to provide a more disciplined and consistent approach to identifying and mitigating operational
risks, continuing progress on implementing a liquidity program that complies with the new liquidity regulatory requirements and continuing to oversee the daily valuation process; |
| •
|
Additional
Compliance Services – continuing investment of time and resources necessary to develop the compliance policies and procedures and other related tools necessary to meet the various new regulatory requirements affecting the Nuveen
funds that have been adopted over recent years; |
| •
|
Government
Relations – continuing efforts of various Nuveen teams and affiliates to advocate and communicate their positions with lawmakers and other regulatory bodies on issues that will impact the Nuveen funds; |
Annual Investment Management Agreement Approval Process (Unaudited) (continued)
| •
|
Business
Continuity, Disaster Recovery and Information Services – establishing an information security program to help identify and manage information security risks, periodically testing disaster recovery plans, maintaining and updating
business continuity plans and providing reports to the Board, at least annually, addressing, among other things, management’s security risk assessment, cyber risk profile, incident tracking and other relevant information technology
risk-related reports; and |
| •
|
Expanded
Dividend Management Services – continuing to expand the services necessary to manage the dividends among the varying types of Nuveen funds that have developed as the Nuveen complex has grown in size and scope. |
In addition to the services provided by the Adviser, the
Board also considered the risks borne by the Adviser and its affiliates in managing the Nuveen funds, including entrepreneurial, operational, reputational, regulatory and litigation risks.
The Board further considered the division of responsibilities
between the Adviser and the Sub-Adviser and recognized that the Sub-Adviser and its investment personnel generally are responsible for the management of each Fund’s portfolio. The Board noted that the Adviser oversees the Sub-Adviser and
considered an analysis of the Sub-Adviser provided by the Adviser which included, among other things, the Sub-Adviser’s assets under management and changes thereto, a summary of the investment team and changes thereto, the investment approach
of the team and the performance of the funds sub-advised by the Sub-Adviser over various periods. The Board further considered at the May Meeting or prior meetings evaluations of the Sub-Adviser’s compliance program and trade execution. The
Board noted that the Adviser recommended the renewal of the Sub-Advisory Agreements.
Based on its review, the Board determined, in the exercise of
its reasonable business judgment, that it was satisfied with the nature, extent and quality of services provided to the respective Funds under each applicable Advisory Agreement.
B. The Investment Performance of the Funds and Fund
Advisers
In evaluating the quality of the services
provided by the Fund Advisers, the Board also received and considered the investment performance of the Nuveen funds they advise. In this regard, the Board reviewed Fund performance over the quarter, one-, three- and five-year periods ending
December 31, 2018 as well as performance data for the first quarter of 2019 ending March 29, 2019. The performance data was based on Class A shares; however, the performance of other classes should be substantially similar as they invest in the same
portfolio of securities and differences in performance among the classes would be principally attributed to the variations in the expense structures of the classes. Unless otherwise indicated, the performance data referenced below reflects the
periods ended December 31, 2018. The Board considered the Adviser’s analysis of each fund’s performance, with particular focus on funds that were considered performance outliers and the factors contributing to their performance. The
Board also noted that it received performance data of the Nuveen funds during its quarterly meetings throughout the year and took into account the discussions that occurred at these Board meetings regarding fund performance. In this regard, in its
evaluation of Nuveen fund performance at meetings throughout the year, the Board considered performance information for the funds for different time periods, both absolute and relative to appropriate benchmarks and peers, with particular attention
to information indicating underperformance of the respective funds and discussed with the Adviser the reasons for such underperformance.
The Board reviewed both absolute and relative fund performance
during the annual review. With respect to the latter, the Board considered fund performance in comparison to the performance of peer funds (the “Performance Peer Group”) and recognized and/or customized benchmarks (i.e., generally
benchmarks derived from multiple recognized benchmarks). In considering performance data, the Board is aware of certain inherent limitations with such data, including that differences between the objective(s), strategies and other characteristics of
the Nuveen funds compared to the respective Performance Peer Group and/or benchmark(s) (such as differences in the use of leverage) will necessarily contribute to differences in performance results and limit the value of the comparative information.
To assist the Board in its review of the comparability of the relative performance, the Adviser has ranked the relevancy of the peer group to the funds as low, medium or high. Depending on the facts and circumstances, however, the Board may be
satisfied with a fund’s performance notwithstanding that its performance may be below its benchmark or peer group for certain periods. In addition, the performance data may vary significantly depending on the end date selected, and
shareholders may evaluate fund performance based on their own holding period which may differ from the performance periods reviewed by the Board leading to different results. Further, the Board considered a fund’s performance in light of the
overall financial market conditions during the respective periods. As noted above, the Board reviewed, among other things, Nuveen fund performance over various periods ended December 31, 2018, and the Board was aware of the market decline in the
fourth quarter of 2018 and considered performance from the first quarter of 2019 as well. The Board also noted that a shorter period of underperformance may significantly impact longer term performance.
In their review of performance, the Independent Board Members
focused, in particular, on the Adviser’s analysis of Nuveen funds determined to be underperforming performance outliers. The Board recognized that some periods of underperformance may only be temporary while other periods of underperformance
may indicate a broader issue that may require a corrective action. Accordingly, with respect to any Nuveen funds for which the Board had identified performance issues, the Board monitors such funds closely until performance improves, discusses with
the Adviser the reasons for such results, considers whether any steps are necessary or appropriate to address such issues, and reviews the results of any efforts undertaken.
The Board’s determinations with respect to each Fund are
summarized below.
For Nuveen Mid Cap Growth Opportunities Fund, the Board noted
that the Fund ranked in the fourth quartile of its Performance Peer Group and the Fund’s performance was below the performance of its benchmark in the one-, three- and five-year periods. The Board considered the Adviser’s explanation of
the various factors that detracted from the Fund’s performance and considered the steps taken in seeking to enhance performance.
For Nuveen Small Cap Growth Opportunities Fund, the Board noted
that the Fund ranked in the third quartile of its Performance Peer Group in the one-, three- and five-year periods. Although the Fund’s performance was below the performance of its benchmark in the three- and five-year periods, the Fund
outperformed its benchmark in the one-year period. The Board was satisfied with the Fund’s overall performance.
C. Fees, Expenses and Profitability
1. Fees and Expenses
In its annual review, the Board considered
the fees paid to the Fund Advisers and the total operating expense ratio of each Nuveen fund, before and after any undertaking by Nuveen to limit the fund’s total annual operating expenses to certain levels. More specifically, the Independent
Board Members reviewed, among other things, each fund’s gross and net management fee rates (i.e., before and after expense reimbursements and/or fee waivers, if any) and net total expense ratio in relation to those of a comparable universe of
funds (the “Peer Universe”) and to a more focused subset of comparable funds (the “Peer Group”) established by Broadridge. The Independent Board Members reviewed the methodology Broadridge employed to establish its Peer
Universe and Peer Group and recognized that differences between the applicable fund and its respective Peer Universe and/or Peer Group as well as changes to the composition of the Peer Group and/or Peer Universe from year to year may limit some of
the value of the comparative data. The Independent Board Members also considered a fund’s operating expense ratio as it more directly reflected the shareholder’s costs in investing in the respective fund.
In their review, the Independent Board
Members considered, in particular, each fund with a net expense ratio of six basis points or higher compared to that of its peer average (each, an “Expense Outlier Fund”) and an analysis as to the factors contributing to each such
fund’s higher relative net expense ratio. Accordingly, in reviewing the comparative data between a fund and its peers, the Board generally considered the fund’s net expense ratio and fees to be higher if they were over 10 basis points
higher, slightly higher if they were 6 to 10 basis points higher, in line if they were within approximately 5 basis points higher than the peer average and below if they were below the peer average of the Peer Group. The Independent Board Members
also considered, in relevant part, a fund’s net management fee and net total expense ratio in light of its performance history.
In their review of the fee arrangements for
the Nuveen funds, the Independent Board Members considered the management fee schedules, including the complex-wide and fund-level breakpoint schedules, and the expense reimbursements and/or fee waivers provided by Nuveen for each fund, as
applicable. The Board noted that across the Nuveen fund complex, the complex-wide fee breakpoints reduced fees by $51.5 million and fund-level breakpoints reduced fees by $55.1 million in 2018. Further, fee caps and waivers for all applicable Nuveen
funds saved an additional $15 million in fees for shareholders in 2018.
With respect to the Sub-Adviser, the Board
considered the sub-advisory fee paid to the Sub-Adviser, including any breakpoint schedule, and, as described below, comparative data of the fees the Sub-Adviser charges to other clients, if any.
The Independent Board Members noted that the Funds had net
management fees and net expense ratios below the average of their Peer Group. Based on its review of the information provided, the Board determined that each Fund’s management fees (as applicable) to a Fund Adviser were reasonable in light of
the nature, extent and quality of services provided to the Fund.
2. Comparisons with the Fees of Other
Clients
In determining the
appropriateness of fees, the Board also reviewed information regarding the fee rates the respective Fund Advisers charged to certain other types of clients and the type of services provided to these other clients. For the Adviser and/or the
Sub-Adviser, such other clients may include retail and institutional managed accounts; sub-advised funds outside the Nuveen family; foreign investment companies offered by Nuveen; and collective investment trusts. The Board further noted that the
Adviser also advised certain exchange-traded funds (“ETFs”) sponsored by Nuveen.
The Board recognized that each Fund had an
affiliated sub-adviser and, with respect to affiliated sub-advisers, reviewed, among other things, the range of fees assessed for managed accounts and foreign investment companies offered by Nuveen. The Board also reviewed the fee range and average
fee rate of certain selected investment strategies offered in retail and institutional managed accounts by the Sub-Adviser and of the non-Nuveen investment companies sub-advised by affiliated sub-advisers.
In addition to the comparative fee data, the
Board also reviewed, among other things, a description of the different levels of services provided to certain other clients compared to the services provided to the Nuveen funds as well as the differences in portfolio investment policies, investor
profiles, account sizes and regulatory requirements, all of which contribute to the variations in the fee schedules. The Board noted, among other things, the wide range of services in addition to investment management services provided to the Nuveen
funds when the Adviser is principally responsible for all aspects of operating the funds, including the increased regulatory requirements that must be met in managing the funds, the larger account sizes of managed accounts and the increased
entrepreneurial, legal and regulatory risks that the Adviser incurs in sponsoring and managing the funds. Further, with respect to ETFs, the Board considered that Nuveen ETFs are passively managed compared to the active man-
Annual Investment Management Agreement Approval Process (Unaudited) (continued)
agement of other Nuveen funds which contributed to the
differences in fee levels between the Nuveen ETFs and other Nuveen funds. In general, higher fee levels reflect higher levels of service provided by the Adviser, increased investment management complexity, greater product management requirements,
and higher levels of business risk or some combination of these factors. The Board further considered that the Sub-Adviser’s fee is essentially for portfolio management services and therefore more comparable to the fees it receives for retail
wrap accounts and other external sub-advisory mandates. The Board concluded the varying levels of fees were justified given, among other things, the inherent differences in the products and the level of services provided to the Nuveen funds versus
other clients, the differing regulatory requirements and legal liabilities and the entrepreneurial, legal and regulatory risks incurred in sponsoring and advising a registered investment company.
3. Profitability of Fund Advisers
In conjunction with their review of fees,
the Independent Board Members considered information regarding Nuveen’s level of profitability for its advisory services to the Nuveen funds for the calendar years 2018 and 2017. The Board reviewed, among other things, Nuveen’s net
margins (pre-tax) (both including and excluding distribution expenses); gross and net revenue margins (pre- and post-tax); revenues, expenses, and net income (pre-tax and after-tax and before distribution) of Nuveen for fund advisory services; and
comparative profitability data comparing the adjusted margins of Nuveen compared to the adjusted margins of certain peers with publicly available data and with the most comparable assets under management (based on asset size and asset composition)
for each of the last two calendar years. The Board also reviewed the revenues and expenses the Adviser derived from its ETF product line that was launched in 2016. The Independent Board Members noted that Nuveen’s net margins were higher in
2018 than the previous year and considered the key drivers behind the revenue and expense changes that impacted Nuveen’s net margins between the years. The Board considered the costs of investments in the Nuveen business, including the
investment of seed capital in certain Nuveen funds and additional investments in infrastructure and technology. The Independent Board Members also noted that Nuveen’s adjusted margins from its relationships with the Nuveen funds were on the
low range compared to the adjusted margins of the peers; however, the Independent Board Members recognized the inherent limitations of the comparative data of other publicly traded peers given that the calculation of profitability is rather
subjective and numerous factors (such as types of funds, business mix, cost of capital, methodology to allocate expenses and other factors) can have a significant impact on the results.
The Independent Board Members also reviewed
a description of the expense allocation methodology employed to develop the financial information and a summary of the history of changes to the methodology over the ten-year period from 2008 to 2018, and recognized that other reasonable allocation
methodologies could be employed and lead to significantly different results. The Board noted that two Independent Board Members, along with independent counsel, serve as the Board’s liaisons to review profitability and discuss any proposed
changes to the methodology prior to the full Board’s review.
Aside from Nuveen’s profitability, the
Board recognized that the Adviser is a subsidiary of Nuveen, LLC, the investment management arm of Teachers Insurance and Annuity Association of America (“TIAA”). As such, the Board also reviewed a balance sheet for TIAA reflecting its
assets, liabilities and capital and contingency reserves for the 2018 and 2017 calendar years to consider the financial strength of TIAA having recognized the importance of having an adviser with significant resources.
In addition to Nuveen, the Independent Board
Members also considered the profitability of the Sub-Adviser from its relationships with the Nuveen funds. In this regard, the Independent Board Members reviewed the Sub-Adviser’s revenues, expenses and revenue margins (pre- and post-tax) for
its advisory activities for the calendar year ended December 31, 2018. The Independent Board Members also reviewed a profitability analysis reflecting the revenues, expenses and revenue margin (pre- and post-tax) by asset type for the Sub-Adviser
for the calendar year ending December 31, 2018 and the pre- and post-tax revenue margin from 2018 and 2017.
In evaluating the reasonableness of the
compensation, the Independent Board Members also considered any other ancillary benefits derived by the respective Fund Adviser from its relationship with the Nuveen funds as discussed in further detail below.
Based on a consideration of all the
information provided, the Board noted that Nuveen’s and the Sub-Adviser’s level of profitability was acceptable and not unreasonable in light of the services provided.
D. Economies of Scale and Whether Fee Levels Reflect These
Economies of Scale
With respect to economies of scale,
the Independent Board Members noted that although economies of scale are difficult to measure, the Adviser shares the benefits of economies of scale in various ways including breakpoints in the management fee schedule (subject to limited
exceptions), fee waivers and/or expense limitations, the pricing of Nuveen funds at scale at inception and investments in its business which can enhance the services provided to the funds for the fees paid. With respect to breakpoint schedules,
because the Board had previously recognized that economies of scale may occur not only when the assets of a particular Nuveen fund grow but also when the assets in the complex grow, the Nuveen funds generally pay the Adviser a management fee
comprised of a fund-level component and a complex-level component each with its own breakpoint schedule, subject to certain exceptions. In general terms, the breakpoint schedule at the fund level reduces fees as assets in the particular fund pass
certain thresholds and the breakpoint schedule at the complex level reduces fees on the Nuveen funds as the eligible assets in the complex pass certain thresholds. The Independent Board Members reviewed, among other things, the fund-level and
complex-level fee schedules and the temporary and/or permanent expense caps applicable to certain Nuveen funds (including the amounts of fees waived or amounts reimbursed to the respective funds in 2017 and
2018), including the temporary expense caps applicable to the Funds. The
Independent Board Members noted that as a result of fund-level management fee changes implemented in June 2017, none of the Nuveen open-end funds were above their top level fee breakpoint.
In addition, the Independent Board Members recognized the
Adviser’s continued reinvestment in its business through, among other things, investments in its business infrastructure and information technology, portfolio accounting system as well as other systems and platforms that will, among other
things, support growth, simplify and enhance information sharing, and enhance the investment process to the benefit of all of the Nuveen funds.
Based on its review, the Board concluded that the current fee
arrangements together with the Adviser’s reinvestment in its business appropriately shared any economies of scale with shareholders.
E. Indirect Benefits
The Independent Board Members received and considered
information regarding other benefits the respective Fund Adviser or its affiliates may receive as a result of their relationship with the Nuveen funds. The Independent Board Members recognized that an affiliate of the Adviser serves as principal
underwriter providing distribution and/or shareholder services to the open-end funds. The Independent Board Members further noted that the Nuveen open-end funds pay 12b-1 fees and while a majority of such fees were paid to third party
broker-dealers, the Board reviewed the amount retained by the Adviser’s affiliate as a result of serving as principal underwriter. In addition, the Independent Board Members also noted that the Sub-Adviser engages in soft dollar transactions
pursuant to which it may receive the benefit of research products and other services provided by broker-dealers executing portfolio transactions on behalf of the applicable Nuveen funds.
The Board, however, noted that the benefits for the Sub-Adviser
when transacting in fixed-income securities may be more limited as such securities generally trade on a principal basis and therefore do not generate brokerage commissions. Further, the Board noted that although the Sub-Adviser may benefit from the
receipt of research and other services that it may otherwise have to pay for out of its own resources, the research may also benefit the Nuveen funds to the extent it enhances the ability of the Sub-Adviser to manage such funds or is acquired
through the commissions paid on portfolio transactions of other clients.
Based on their review, the Board concluded that any indirect
benefits received by a Fund Adviser as a result of its relationship with the Funds were reasonable and within acceptable parameters.
F. Other Considerations
The Board Members did not identify any single factor discussed
previously as all-important or controlling. The Board Members, including the Independent Board Members, concluded that the terms of each Advisory Agreement were fair and reasonable, that the respective Fund Adviser’s fees were reasonable in
light of the services provided to each Fund and that the Advisory Agreements be renewed.
Directors and Officers
(Unaudited)
The
management of the Funds, including general supervision of the duties performed for the Funds by the Adviser, is the responsibility of the Board of Directors of the Funds. The number of Directors of the Funds is currently set at ten. None of the
Directors who are not “interested” persons of the Funds (referred to herein as “Independent Directors”) has ever been a Director or employee of, or consultant to, Nuveen or its affiliates. The names and business addresses of
the Directors and officers of the Funds, their principal occupations and other affiliations during the past five years, the number of portfolios each Director oversees and other directorships they hold are set forth below.
The Funds’ Statement of Additional Information
(“SAI”) includes more information about the Directors. To request a free copy, call Nuveen Investments at (800) 257-8787 or visit the Funds’ website at www.nuveen.com.
Name,
Year of Birth
& Address |
Position(s)
Held with
the Funds |
Year
First
Elected or
Appointed (1) |
Principal
Occupation(s)
Including other Directorships
During Past 5 Years |
Number
of
Portfolios in
Fund Complex
Overseen by
Director |
| Independent
Directors: |
|
|
|
Terence
J. Toth
1959
333 W. Wacker Drive
Chicago, IL 60606 |
Chairman
and
Director |
2008
|
Formerly,
a Co-Founding Partner, Promus Capital (2008-2017); Director, Quality Control Corporation (since 2012); member: Catalyst Schools of Chicago Board (since 2008) and Mather Foundation Board (since 2012), and chair of its investment committee; formerly,
Director, Fulcrum IT Services LLC (2010-2019); formerly, Director, Legal & General Investment Management America, Inc. (2008-2013); formerly, CEO and President, Northern Trust Global Investments (2004-2007); Executive Vice President,
Quantitative Management & Securities Lending (2000-2004); prior thereto, various positions with Northern Trust Company (since 1994); formerly, Member, Northern Trust Mutual Funds Board (2005-2007), Northern Trust Global Investments Board
(2004-2007), Northern Trust Japan Board (2004-2007), Northern Trust Securities Inc. Board (2003- 2007) and Northern Trust Hong Kong Board (1997-2004). |
159
|
Jack
B. Evans
1948
333 W. Wacker Drive
Chicago, IL 60606 |
Director
|
1999
|
Chairman
(since 2019), formerly, President (1996-2019), The Hall-Perrine Foundation, a private philanthropic corporation; Director and Chairman, United Fire Group, a publicly held company; Director, Public member, American Board of Orthopaedic Surgery
(since 2015); Life Trustee of Coe College and the Iowa College Foundation; formerly, President Pro-Tem of the Board of Regents for the State of Iowa University System; formerly, Director, Alliant Energy and The Gazette Company; formerly, Director,
Federal Reserve Bank of Chicago; formerly, President and Chief Operating Officer, SCI Financial Group, Inc., a regional financial services firm. |
159
|
Name,
Year of Birth
& Address |
Position(s)
Held with
the Funds |
Year
First
Elected or
Appointed (1) |
Principal
Occupation(s)
Including other Directorships
During Past 5 Years |
Number
of
Portfolios in
Fund Complex
Overseen by
Director |
William
C. Hunter
1948
333 W. Wacker Drive
Chicago, IL 60606 |
Director
|
2003
|
Dean
Emeritus, formerly, Dean, Tippie College of Business, University of Iowa (2006-2012); Director of Wellmark, Inc. (since 2009); past Director (2005-2015), and past President (2010- 2014) Beta Gamma Sigma, Inc., The International Business Honor
Society; formerly, Director (2004-2018) of Xerox Corporation; Dean and Distinguished Professor of Finance, School of Business at the University of Connecticut (2003-2006); previously, Senior Vice President and Director of Research at the Federal
Reserve Bank of Chicago (1995-2003); formerly, Director (1997-2007), Credit Research Center at Georgetown University. |
159
|
Albin
F. Moschner
1952
333 W. Wacker Drive
Chicago, IL 60606 |
Director
|
2016
|
Founder
and Chief Executive Officer, Northcroft Partners, LLC, a management consulting firm (since 2012); formerly, Chairman (2019), and Director (2012-2019), USA Technologies, Inc., a provider of solutions and services to facilitate electronic payment
transactions; formerly, Director, Wintrust Financial Corporation (1996-2016); previously, held positions at Leap Wireless International, Inc., including Consultant (2011-2012), Chief Operating Officer (2008-2011), and Chief Marketing Officer
(2004-2008); formerly, President, Verizon Card Services division of Verizon Communications, Inc. (2000-2003); formerly, President, One Point Services at One Point Communications (1999-2000); formerly, Vice Chairman of the Board, Diba, Incorporated
(1996-1997); formerly, various executive positions (1991-1996) and Chief Executive Officer (1995-1996) of Zenith Electronics Corporation. |
159
|
John
K. Nelson
1962
333 W. Wacker Drive
Chicago, IL 60606 |
Director
|
2013
|
Member
of Board of Directors of Core12 LLC (since 2008), a private firm which develops branding, marketing and communications strategies for clients; served on The President's Council, Fordham University (2010-2018); and previously was a Director of The
Curran Center for Catholic American Studies (2009-2018); formerly, senior external advisor to the financial services practice of Deloitte Consulting LLP (2012-2014); formerly, Chairman of the Board of Trustees of Marian University (2010 as trustee,
2011- 2014 as Chairman); formerly, Chief Executive Officer of ABN AMRO N.V. North America, and Global Head of its Financial Markets Division (2007-2008); prior senior positions held at ABN AMRO include Corporate Executive Vice President and Head of
Global Markets-the Americas (2006-2007), CEO of Wholesale Banking-North America and Global Head of Foreign Exchange and Futures Markets (2001-2006), and Regional Commercial Treasurer and Senior Vice President Trading-North America (1996-2001);
formerly, Trustee at St. Edmund Preparatory School in New York City. |
159
|
Judith
M. Stockdale
1947
333 W. Wacker Drive
Chicago, IL 60606 |
Director
|
1997
|
Board
Member, Land Trust Alliance (since 2013) and U.S. Endowment for Forestry and Communities (since 2013); formerly, Executive Director (1994-2012), Gaylord and Dorothy Donnelley Foundation; prior thereto, Executive Director, Great Lakes Protection
Fund (1990-1994). |
159
|
Carole
E. Stone
1947
333 W. Wacker Drive
Chicago, IL 60606 |
Director
|
2007
|
Former
Director, Chicago Board Options Exchange (2006-2017), and C2 Options Exchange, Incorporated (2009-2017); Director, Cboe Global Markets, Inc., formerly, CBOE Holdings, Inc. (since 2010); formerly, Commissioner, New York State Commission on Public
Authority Reform (2005-2010). |
159
|
Directors and Officers (Unaudited) (continued)
Name,
Year of Birth
& Address |
Position(s)
Held with
the Funds |
Year
First
Elected or
Appointed (1) |
Principal
Occupation(s)
Including other Directorships
During Past 5 Years |
Number
of
Portfolios in
Fund Complex
Overseen by
Director |
Margaret
L. Wolff
1955
333 W. Wacker Drive
Chicago, IL 60606 |
Director
|
2016
|
Formerly,
member of the Board of Directors (2013-2017) of Travelers Insurance Company of Canada and The Dominion of Canada General Insurance Company (each, a part of Travelers Canada, the Canadian operation of The Travelers Companies, Inc.); formerly, Of
Counsel, Skadden, Arps, Slate, Meagher & Flom LLP (Mergers & Acquisitions Group) (2005-2014); Member of the Board of Trustees of New York-Presbyterian Hospital (since 2005); Member (since 2004) and Chair (since 2015) of the Board of Trustees
of The John A. Hartford Foundation (a philanthropy dedicated to improving the care of older adults); formerly, Member (2005-2015) and Vice Chair (2011-2015) of the Board of Trustees of Mt. Holyoke College. |
159
|
Robert
L. Young(2)
1963
333 W. Wacker Drive
Chicago, IL 60606 |
Director
|
2017
|
Formerly,
Chief Operating Officer and Director, J.P. Morgan Investment Management Inc. (2010-2016); formerly, President and Principal Executive Officer (2013-2016), and Senior Vice President and Chief Operating Officer (2005-2010), of J.P. Morgan Funds;
formerly, Director and various officer positions for J.P. Morgan Investment Management Inc. (formerly, JPMorgan Funds Management, Inc. and formerly, One Group Administrative Services) and JPMorgan Distribution Services, Inc. (formerly, One Group
Dealer Services, Inc.) (1999-2017). |
157
|
Name,
Year of Birth
& Address |
Position(s)
Held with
the Funds |
Year
First
Elected or
Appointed (1) |
Principal
Occupation(s)
Including other Directorships
During Past 5 Years |
Number
of
Portfolios in
Fund Complex
Overseen by
Director |
| Interested
Director: |
|
|
|
Margo
L. Cook(3)
1964
333 W. Wacker Drive
Chicago, IL 60606 |
Director
|
2016
|
President
(since 2017), formerly, Co-Chief Executive Officer and Co-President (2016-2017), formerly, Senior Executive Vice President of Nuveen Investments, Inc; Executive Vice President (since 2017) of Nuveen, LLC; President, Global Products and Solutions
(since 2017), and Co-Chief Executive Officer (since 2015), formerly, Executive Vice President (2013-2015) of Nuveen Securities, LLC; President (since 2017), formerly, Co-President (2016-2017), formerly Senior Executive Vice President (2015-2016) of
Nuveen Fund Advisors, LLC (Executive Vice President 2011-2015); President (since 2017), Nuveen Alternative Investments, LLC; Chartered Financial Analyst. |
159
|
Name,
Year of Birth
& Address |
Position(s)
Held with
the Funds |
Year
First
Elected or
Appointed (4) |
Principal
Occupation(s)
During Past 5 Years |
|
| Officers
of the Funds: |
|
|
|
|
Greg
A. Bottjer
1971
333 W. Wacker Drive
Chicago, IL 60606 |
Chief
Administrative
Officer |
2016
|
Senior
(since 2017) Managing Director (since 2011), formerly, Senior Vice President (2007-2010) of Nuveen; Senior (since 2017) Managing Director (since 2016) of Nuveen Fund Advisors, LLC; Chartered Financial Analyst. |
|
Mark
J. Czarniecki
1979
901 Marquette Avenue
Minneapolis, MN 55402 |
Vice
President
and Assistant
Secretary |
2013
|
Vice
President and Assistant Secretary of Nuveen Securities, LLC (since 2016) and Nuveen Fund Advisors (since 2017); Vice President and Associate General Counsel of Nuveen (since 2013) and Vice President, Assistant Secretary and Associate General
Counsel of Nuveen Asset Management (since 2018). |
|
Name,
Year of Birth
& Address |
Position(s)
Held with
the Funds |
Year
First
Elected or
Appointed (4) |
Principal
Occupation(s)
During Past 5 Years |
|
Diana
R. Gonzalez
1978
333 W. Wacker Drive
Chicago, IL 60606 |
Vice
President
and Assistant
Secretary |
2017
|
Vice
President and Assistant Secretary of Nuveen Fund Advisors, LLC (since 2017); Vice President and Associate General Counsel of Nuveen (since 2017); Associate General Counsel of Jackson National Asset Management (2012-2017). |
|
Nathaniel
T. Jones
1979
333 W. Wacker Drive
Chicago, IL 60606 |
Vice
President
and Treasurer |
2016
|
Managing
Director (since 2017), formerly, Senior Vice President (2016-2017), formerly, Vice President (2011- 2016) of Nuveen; Managing Director (since 2015) of Nuveen Fund Advisors, LLC; Chartered Financial Analyst. |
|
Walter
M. Kelly
1970
333 W. Wacker Drive
Chicago, IL 60606 |
Chief
Compliance
Officer and Vice
President |
2003
|
Managing
Director (since 2017), formerly, Senior Vice President (2008-2017) of Nuveen Investments Holdings, Inc. |
|
Tina
M. Lazar
1961
333 W. Wacker Drive
Chicago, IL 60606 |
Vice
President |
2002
|
Managing
Director (since 2017), formerly, Senior Vice President (2014-2017) of Nuveen Securities, LLC. |
|
Brian
J. Lockhart
1974
333 W. Wacker Drive
Chicago, IL 60606 |
Vice
President |
2019
|
Managing
Director (since 2019) of Nuveen Fund Advisors, LLC; Managing Director (since 2017), formerly, Vice President (2010-2017) of Nuveen; Head of Investment Oversight (since 2017), formerly, Team Leader of Manager Oversight (2015-2017); Chartered
Financial Analyst and Certified Financial Risk Manager. |
|
Jacques
M. Longerstaey
1963
8500 Andrew Carnegie Blvd.
Charlotte, NC 28262 |
Vice
President |
2019
|
Senior
Managing Director, Chief Risk Officer, Nuveen, LLC (since May 2019); Senior Managing Director (since May 2019) of Nuveen Fund Advisors, LLC; formerly, Chief Investment and Model Risk Officer, Wealth & Investment Management Division, Wells Fargo
Bank (NA) (from 2013-2019). |
|
Kevin
J. McCarthy
1966
333 W. Wacker Drive
Chicago, IL 60606 |
Vice
President
and Assistant Secretary |
2007
|
Senior
Managing Director (since 2017) and Secretary and General Counsel (since 2016) of Nuveen Investments, Inc., formerly, Executive Vice President (2016-2017) and Managing Director and Assistant Secretary (2008-2016); Senior Managing Director (since
2017) and Assistant Secretary (since 2008) of Nuveen Securities, LLC, formerly Executive Vice President (2016-2017) and Managing Director (2008-2016); Senior Managing Director (since 2017), Secretary (since 2016) and Co-General Counsel (since 2011)
of Nuveen Fund Advisors, LLC, formerly, Executive Vice President (2016-2017), Managing Director (2008-2016) and Assistant Secretary (2007-2016); Senior Managing Director (since 2017), Secretary (since 2016) and Associate General Counsel (since 2011)
of Nuveen Asset Management, LLC, formerly Executive Vice President (2016-2017) and Managing Director and Assistant Secretary (2011-2016); Senior Managing Director (since 2017) and Secretary (since 2016) of Nuveen Investments Advisers, LLC, formerly
Executive Vice President (2016-2017); Vice President (since 2007) and Secretary (since 2016), formerly, Assistant Secretary, of NWQ Investment Management Company, LLC, Symphony Asset Management, LLC, Santa Barbara Asset Management, LLC and Winslow
Capital Management, LLC (since 2010). Senior Managing Director (since 2017) and Secretary (since 2016) of Nuveen Alternative Investments, LLC. |
|
Jon
Scott Meissner
1973
8500 Andrew Carnegie Blvd.
Charlotte, NC 28262 |
Vice
President |
2019
|
Managing
Director of Mutual Fund Tax and Financial Reporting groups at Nuveen (since 2017); Managing Director of Nuveen Fund Advisors, LLC (since 2019); Senior Director of Teachers Advisors, LLC and TIAA-CREF Investment Management, LLC (since 2016); Senior
Director (since 2015) Mutual Fund Taxation to the TIAA-CREF Funds, the TIAA-CREF Life Funds, the TIAA Separate Account VA-1 and the CREF Accounts; has held various positions with TIAA since 2004. |
|
Directors and Officers (Unaudited) (continued)
Name,
Year of Birth
& Address |
Position(s)
Held with
the Funds |
Year
First
Elected or
Appointed (4) |
Principal
Occupation(s)
During Past 5 Years |
|
Christopher
M. Rohrbacher
1971
333 W. Wacker Drive
Chicago, IL 60606 |
Vice
President
and
Secretary |
2008
|
Managing
Director (since 2017) and Assistant Secretary of Nuveen Securities, LLC; Managing Director (since 2017), formerly, Senior Vice President (2016-2017), Co-General Counsel (since 2019) and Assistant Secretary (since 2016) of Nuveen Fund Advisors, LLC;
Managing Director (since 2017), formerly, Senior Vice President (2012-2017) and Associate General Counsel (since 2016), formerly, Assistant General Counsel (2008-2016) of Nuveen. |
|
William
A. Siffermann
1975
333 W. Wacker Drive
Chicago, IL 60606 |
Vice
President |
2017
|
Managing
Director (since 2017), formerly Senior Vice President (2016-2017) and Vice President (2011-2016) of Nuveen. |
|
E.
Scott Wickerham
1973
TIAA
730 Third Avenue
New York, NY 10017 |
Vice
President
and Controller |
2019
|
Senior
Managing Director, Head of Fund Administration at Nuveen, LLC (since 2019), formerly, Managing Director; Senior Managing Director (since 2019), Nuveen Fund Advisors, LLC; Principal Financial Officer, Principal Accounting Officer and Treasurer
(since 2017) to the TIAA-CREF Funds, the TIAA-CREF Life Funds, the TIAA Separate Account VA-1 and the Treasurer (since 2017) to the CREF Accounts; Senior Director, TIAA-CREF Fund Administration (2014-2015); has held various positions with TIAA since
2006. |
|
Gifford
R. Zimmerman
1956
333 W. Wacker Drive
Chicago, IL 60606
|
Vice
President
and Assistant
Secretary |
1988
|
Managing
Director (since 2002), and Assistant Secretary of Nuveen Securities, LLC; Managing Director (since 2004) and Assistant Secretary (since 1994) of Nuveen Investments, Inc.; Managing Director (since 2002), Assistant Secretary (since 1997) and
Co-General Counsel (since 2011) of Nuveen Fund Advisors, LLC; Managing Director, Assistant Secretary and Associate General Counsel of Nuveen Asset Management, LLC (since 2011); Vice President (since 2017), formerly, Managing Director (2003-2017) and
Assistant Secretary (since 2003) of Symphony Asset Management LLC ; Managing Director and Assistant Secretary (since 2002) of Nuveen Investments Advisers, LLC; Vice President and Assistant Secretary of NWQ Investment Management Company, LLC (since
2002), Santa Barbara Asset Management, LLC (since 2006) and of Winslow Capital Management, LLC, (since 2010); Chartered Financial Analyst. |
|
(1)
Directors serve an indefinite term until his/her successor is elected or appointed. The year first elected or appointed represents the year in which the director was first elected or appointed to any
fund in the Nuveen fund complex.
(2)
Mr. Young was appointed as a Board Member of each of the Nuveen Funds except Nuveen Diversified Dividend and Income Fund and Nuveen Real Estate Income Fund.
(3)
“Interested person” of the Trust, as defined in the 1940 Act, by reason of her position with Nuveen, LLC. and certain of its subsidiaries.
(4)
Officers serve one year terms through August of each year. The year first elected or appointed represents the year in which the officer was first elected or appointed to any fund in the Nuveen fund
complex.
Nuveen:
Serving Investors for Generations
Since 1898, financial advisors and their clients have relied
on Nuveen to provide dependable investment solutions through continued adherence to proven, long-term investing principles. Today, we offer a range of high quality solutions designed to be integral components of a well-diversified core
portfolio.
Focused on meeting investor needs.
Nuveen is the investment manager of TIAA. We have grown into
one of the world’s premier global asset managers, with specialist knowledge across all major asset classes and particular strength in solutions that provide income for investors and that draw on our expertise in alternatives and responsible
investing. Nuveen is driven not only by the independent investment processes across the firm, but also the insights, risk management, analytics and other tools and resources that a truly world-class platform provides. As a global asset manager, our
mission is to work in partnership with our clients to create solutions which help them secure their financial future.
Find out how we can help you.
To learn more about how the products and services of Nuveen
may be able to help you meet your financial goals, talk to your financial advisor, or call us at (800) 257-8787. Please read the information provided carefully before you invest. Investors should consider the investment objective and policies, risk
considerations, charges and expenses of any investment carefully. Where applicable, be sure to obtain a prospectus, which contains this and other relevant information. To obtain a prospectus, please contact your securities representative or Nuveen,
333 W. Wacker Dr., Chicago, IL 60606. Please read the prospectus carefully before you invest or send money.
Learn more about Nuveen Funds at: www.nuveen.com/mutual-funds
Nuveen Securities, LLC, member FINRA and SIPC | 333 West Wacker Drive |
Chicago, IL 60606 | www.nuveen.com MAN-FCGO-1019P1032029-INV-Y-12/20
Nuveen Equity Funds
| Fund
Name |
Class
A |
Class
C |
Class
R3 |
Class
R6 |
Class
I |
| Nuveen
Large Cap Select Fund |
FLRAX
|
FLYCX
|
—
|
—
|
FLRYX
|
| Nuveen
Small Cap Select Fund |
EMGRX
|
FHMCX
|
ASEIX
|
ASEFX
|
ARSTX
|
Beginning on January 1, 2021, as permitted by regulations
adopted by the Securities and Exchange Commission, paper copies of the Funds' annual and semi-annual shareholder reports will no longer be sent by mail, unless you specifically request paper copies of the reports. Instead, the reports will be made
available on the Funds' website (www.nuveen.com), and you will be notified by mail each time a report is posted and provided with a website link to access the report.
If you have already elected to receive shareholder reports
electronically, you will not be affected by this change and you need not take any action. You may elect to receive shareholder reports and other communications from the Funds electronically anytime by contacting the financial intermediary (such as a
broker-dealer or bank) through which you hold your Fund shares or, if you are a direct investor, by enrolling at www.nuveen.com/e-reports.
You may elect to receive all future shareholder reports in
paper free of charge at any time by contacting your financial intermediary or, if you are a direct investor, by calling 800-257-8787 and selecting option #1. Your election to receive reports in paper will apply to all funds held in your account with
your financial intermediary or, if you are a direct investor, to all your directly held Nuveen Funds and any other directly held funds within the same group of related investment companies.
Life is Complex.
Nuveen makes things e-simple.
It only takes a minute to sign up for
e-Reports. Once enrolled, you’ll receive an e-mail as soon as your Nuveen Fund information is ready. No more waiting for delivery by regular mail. Just click on the link within the e-mail to see the report and save it on your computer if you
wish.
Free e-Reports right to your
e-mail!
www.investordelivery.com
If you receive your Nuveen Fund
distributions and statements from your financial advisor or brokerage account.
or
www.nuveen.com/client-access
If you receive your Nuveen Fund
distributions and statements directly from Nuveen.
Must be preceded by or accompanied by a
prospectus.
NOT FDIC INSURED MAY
LOSE VALUE NO BANK GUARANTEE
Chair’s Letter to Shareholders
Dear Shareholders,
Financial markets have been receiving mixed messages over the
past year. The global economy has bifurcated, split between a slumping manufacturing sector and a resilient consumer. Confidence has been weakened among corporate managements, who are wary of trade frictions and moderating global growth, but has
remained elevated among consumers, who have benefited from tight labor markets and growing wages. As the economic cycle advances toward its later stage, corporate profits are shrinking and earnings forecasts are being downgraded. A waning growth
outlook has held interest rates near historically low levels, while stock market indexes have overcome periodic volatility to touch historical highs.
While we continue to anticipate slower economic growth and
increased market volatility, we note that recession fears have receded from earlier in the year. The U.S. economy held steady in the third quarter, and nearer-term economic indicators have provided upside surprises. Consumer confidence remains
underpinned by low unemployment and modest wage growth. Looser financial conditions, in part driven by the Federal Reserve’s three interest rate cuts in 2019, have revived momentum in the housing market and should continue to encourage
borrowing by consumers and businesses. Outside the U.S., Germany avoided a recession in the second half of 2019 and other eurozone economic indicators are pointing to stabilization and improving sentiment. Consumers in Europe and Japan, like those
in the U.S., have remained supported by jobs growth and rising wages. Although the outcomes of trade, Brexit and other geopolitical concerns continue to be uncertain, some clarity on these issues could be a potential source of upside.
At Nuveen, we still see investment opportunities in the
maturing economic environment, but we are taking a selective approach. If you’re concerned about where the markets are headed from here, we encourage you to work with your financial advisor to review your time horizon, risk tolerance and
investment goals. On behalf of the other members of the Nuveen Fund Board, we look forward to continuing to earn your trust in the months and years ahead.
Sincerely,
Terence J. Toth
Chair of the Board
December 23, 2019
Portfolio Managers’
Comments
Nuveen Large Cap Select
Fund
Nuveen Small Cap Select Fund
These Funds feature portfolio management by Nuveen Asset
Management, LLC (NAM), an affiliate of Nuveen, LLC.
David Chalupnik, CFA, and Evan Staples, CFA, are the portfolio
managers for the Nuveen Large Cap Select Fund. David assumed portfolio management responsibilities in 2003 and Evan joined the portfolio management team for the Fund in 2017.
Jon A. Loth, CFA, and Gregory J. Ryan, CFA, are the portfolio
managers for the Nuveen Small Cap Select Fund. Gregory joined the portfolio management team for the Fund in 2013 and Jon Loth, CFA, was added as a portfolio manager in March 2019. Effective March 19, 2019, Mark Traster is no longer a portfolio
manager of the Nuveen Small Cap Select Fund.
On the
following pages, the portfolio management teams for the Funds discuss the economy and financial markets, key investment strategies and the Funds’ performance for the twelve-month reporting period ended October 31, 2019.
What factors affected the U.S. economy and financial markets
during the twelve-month reporting period ended October 31, 2019?
The U.S. economy reached the tenth year of expansion since the
previous recession ended in June 2009, marking the longest expansion in U.S. history. In the third quarter of 2019, gross domestic product (GDP) grew at an annualized rate of 2.1%, according to the “second” estimate by the Bureau of
Economic Analysis. GDP measures the value of goods and services produced by the nation’s economy less the value of the goods and services used up in production, adjusted for price changes. Growth in consumer spending and the housing sector
helped offset a decline in business investment during the July to September 2019 period. By comparison, annualized GDP growth was 2.0% in the second quarter and 3.1% in the first quarter.
Consumer spending, the largest driver of the economy, remained
well supported by low unemployment, wage gains and tax cuts. As reported by the Bureau of Labor Statistics, the unemployment rate fell to 3.6% in October 2019 from 3.8% in October 2018 and job gains averaged around 174,000 per month for the past
twelve months. As the jobs market has tightened, average hourly earnings grew at an annualized rate of 3.0% in October 2019. However, falling energy prices dampened inflation over the past twelve months. The Bureau of Labor Statistics said the
Consumer Price Index (CPI) increased 1.8% over the twelve-month reporting period ended October 31, 2019 before seasonal adjustment.
Low mortgage rates and low inventory drove home prices
moderately higher in this reporting period, despite declining new home sales and housing starts. The S&P CoreLogic Case-Shiller U.S. National Home Price Index, which covers all nine U.S. census divisions, was up 3.2% year-over-year in September
2019 (most recent data available at the time this report was prepared). The 10-City and 20-City Composites reported year-over-year increases of 1.5% and 2.1%, respectively.
As data pointed to slower momentum in the overall economy, the
Federal Reserve (Fed) notably shifted its stance. Although the Fed had indicated in December 2018 that there could be two more rate hikes in 2019, global growth concerns kept the central bank on the sidelines. As expected by the markets, the Fed
left rates unchanged throughout the first half of 2019 while speculation increased that the Fed’s next move would be a rate cut. At the July 2019, September 2019 and October 2019 policy committee meetings, the
This material is not intended to be a recommendation or investment advice,
does not constitute a solicitation to buy, sell or hold a security or an investment strategy, and is not provided in a fiduciary capacity. The information provided does not take into account the specific objectives or circumstances of any particular
investor, or suggest any specific course of action. Investment decisions should be made based on an investor’s objectives and circumstances and in consultation with his or her advisors.
Certain statements in this report are forward-looking
statements. Discussions of specific investments are for illustration only and are not intended as recommendations of individual investments. The forward-looking statements and other views expressed herein are those of the portfolio managers as of
the date of this report. Actual future results or occurrences may differ significantly from those anticipated in any forward-looking statements and the views expressed herein are subject to change at any time, due to numerous market and other
factors. The Funds disclaim any obligation to update publicly or revise any forward-looking statements or views expressed herein.
Refer to the Glossary of Terms Used in this Report for further
definition of the terms used within this section.
Portfolio Managers’ Comments (continued)
Fed announced a 0.25% cut to its main policy rate. Markets registered
disappointment with the Fed’s explanation that the rate cuts were a “mid-cycle adjustment,” rather than a prolonged easing period, and its signal that there would be no additional rate cuts in 2019. Also in the latter half of 2019,
the Fed announced it would stop shrinking its bond portfolio sooner than scheduled, as well as began buying short-term Treasury bills to help money markets operate smoothly and maintain short-term borrowing rates at low levels. Fed Chairman Powell
emphasized that the Treasury bill purchases were not a form of quantitative easing.
During the twelve-month reporting period, geopolitical news
remained a prominent market driver. Tariff and trade policy topped the list of concerns, most prominently the U.S.-China relations. After several rounds of talks and a series of tariff increases, President Trump and President Xi agreed to another
temporary trade truce in late June 2019 that halted additional tariff increases. Tensions increased markedly after the July 2019 negotiations ended without an agreement, with both China and the U.S. increasing import duties. After setting new trade
meetings in September and October 2019, tariff waivers were announced on a selected group of U.S. and Chinese goods and the two sides signaled progress toward a partial trade deal. The U.S., Mexico and Canada Agreement (USMCA) trade deal replacing
the North American Free Trade Agreement had yet to be ratified by the national congresses (subsequent to the close of the reporting period, the trade deal was passed by the House of Representatives), while President Trump rescinded the threat to
impose tariffs on Mexico if the country didn’t take more action to curb illegal immigration. With the U.S. House of Representatives opening an impeachment inquiry into President Trump, ratification of the USMCA deal was expected to be delayed.
The Trump administration delayed imposing auto tariffs on the European Union (EU), as it continued to focus more on the China trade negotiations, but duties on $7.5 billion worth of EU goods including wine and cheese went into effect in October 2019
in retaliation for a dispute over aircraft subsidies. Global manufacturing and export data continued to show evidence of trade-related slumps, which increased worries that the slowdown would spread into other segments of the global economy.
In the U.K., Prime Minister Theresa May was unable to secure a
Brexit deal before the original March 29, 2019 deadline and resigned as of June 7, 2019. The EU extended the deadline to October 31, 2019, which Prime Minister May’s successor, Boris Johnson, was unable to meet after a series of political
maneuvers failed to secure an approval for his exit plan. In October 2019, the EU approved a “flextension” to January 31, 2020 and a U.K. general election was scheduled for December (subsequent to the close of the reporting period, on
December 19, 2019, the British Parliament passed the Brexit Bill). In Italy, investors worried about another potential budget clash between the eurosceptic coalition government and the EU. However, following the unexpected resignation of the prime
minister in August 2019, the newly formed coalition government appeared to take a less antagonistic stance. Europe also contended with the “yellow vest” protests in France, immigration policy concerns, Russian sanctions and political
risk in Turkey.
Elections around the world also remained
a source of uncertainty. Markets continued to closely monitor the new administrations in Brazil and Mexico, as well as Argentina’s presidential election. Incumbent candidate President Macri, seen as market-friendly, suffered a surprising
defeat in the August 2019 primary, and the Peronist ticket of Alberto Fernandez/Cristina Fernandez de Kirchner won as expected in the October 2019 election. Europe’s traditional centrist parties lost seats in the Parliamentary elections and
populist parties saw marginal gains. The ruling parties in India and South Africa maintained their majorities, where slower economic growth could complicate their respective reform mandates.
In the U.S., the longest bull market on record continued, but
not without significant bouts of volatility. Stocks sold off sharply in December 2018, leading the bellwether S&P 500® to record its lowest
monthly return since 1931. Although economic data was mostly positive and corporate earnings growth continued to far exceed expectations, a broad array of issues weighed on investor sentiment at the end of 2018, sparking extreme stock market
volatility. Investors were concerned about ongoing political discord, trade friction with China, the path and pace of Fed rate increases and the partial U.S. government shutdown. Fueled by better-than-expected fourth-quarter 2018 earnings, equities
rebounded sharply in the beginning of 2019 through April. However, markets continued to be quite volatile, selling off in May due to changing expectations regarding trade and Fed policy, as well as concerns about slowing economic growth. During the
summer months, stock markets advanced strongly again with the S&P 500® hitting an all-time high above 3000 in late July before falling in
August. Markets remained choppy and continued to struggle for footing amid escalating trade tensions, weaker Chinese economic data, protests in Hong Kong, increasing recession fears and the growing prevalence of negative interest rates worldwide. In
the final month of the reporting period, however, the S&P 500® hit new all-time highs as investors celebrated better-than-expected corporate
earnings, some signs of clarity regarding Brexit, broad monetary easing across the globe and optimism surrounding progress on the U.S./China trade front.
U.S. large-cap companies produced strong gains during the
reporting period and handily outpaced smaller-sized companies by nearly 10%, with the S&P 500® advancing 14.33%. Ten of the eleven sectors
within the index ended the twelve-month reporting period in positive territory, led by more than 20% gains in two “bond-proxy” sectors (real estate and utilities) as well as in the information technology sector. Energy was the only
S&P 500® sector in the red during the reporting period, pressured lower by falling energy prices due to slowing growth and oversupply. Small-cap
equities underperformed larger-cap stocks during the reporting period, likely weighed down more by trade tensions, increasing evidence of economic deceleration and rising political uncertainty stemming from mounting impeachment rhetoric in
Washington D.C. The segment gained 4.90% over the reporting period as measured by the Russell 2000® Index. From a style perspective, growth-oriented
stocks continued their long-running trend of outperforming value stocks across the capitalization spectrum, benefiting on a relative basis from slowing corporate profit growth.
In developed markets outside the U.S., geopolitical issues in
Europe including the chaos surrounding Brexit, markedly slower economic growth across Europe and in particular Germany, and the negative impact of the trade war at times created headwinds for stocks. However, by the end of the reporting period,
markets still advanced fairly strongly as optimism increased regarding both trade negotiations and Brexit, recording an 11.04% according to the MSCI EAFE Index. The same issues also produced headwinds for emerging markets, especially China’s
slowdown since these regions tend to be more reliant on that economy, and the rising U.S. dollar. But these markets also gained footing, producing an 11.86% return in U.S. dollar terms during the reporting period, as measured by the MSCI Emerging
Markets Index.
Nuveen Large Cap Select Fund
How did the Fund perform during the twelve-month reporting
period ended October 31, 2019?
The tables in the Fund
Performance and Expense Ratios section of this report provide total returns for the Fund for the one-year, five-year and ten-year periods ended October 31, 2019. Comparative performance information is provided for the Fund’s Class A Shares at
net asset value (NAV) only. The Fund’s Class A Shares at NAV underperformed the S&P 500® and the Lipper Large-Cap Core Funds
Classification Average during the twelve-month reporting period.
What strategies were used to manage the Fund during the reporting
period and how did these strategies influence performance?
The Fund pursues long-term capital appreciation by investing
primarily in the common stocks of companies that have market capitalizations of $5 billion or greater at the time of purchase. During the reporting period, we continued to employ our deep, rigorous research approach to find and invest in stocks that
we believed had strong and/or improving fundamentals, attractive valuations and a catalyst to drive future performance. Our process focuses on constructing a portfolio that we believe offers the best opportunity to achieve superior, risk-adjusted
returns over the long term. During the reporting period, we reduced the Fund’s cyclical exposure and ended the year with a slightly defensive stance, driven by an approximately 8% decrease in its energy weighting. We also decreased the
Fund’s financial allocation by about 3.5%, ending the reporting period at a slight underweight. Conversely, we increased allocations to communication services by approximately 7% and consumer staples by about 3%. At the end of the reporting
period, the Fund’s largest overweights versus the S&P 500® benchmark were in the health care and communication services sectors, while its
largest underweights were in energy and industrials.
The
Fund’s underperformance versus the S&P 500® benchmark and Lipper peer was primarily the result of stock selection issues in the health
care, financials, energy and industrials sectors. On the other hand, the Fund saw strong results from stock selection in the information technology, consumer discretionary and real estate sectors. An underweight in the energy sector, including no
position in Exxon Mobil Corporation, and an overweight in the information technology sector were also beneficial to performance.
Health care was the Fund’s main source of weakness
during the reporting period where the Fund experienced disappointing results from Cigna Corp, a managed care company with pharmacy benefit management (PBM) exposure via its acquisition of Express Scripts. The company reported strong earnings in its
most recent quarterly release, but the stock struggled as investors focused on lower membership growth guidance. However, management is confident in the synergy opportunity resulting from the integration of Express Scripts, therefore, we continued
to hold the position.
Portfolio Managers’ Comments (continued)
Shares of PBM company CVS Health Corporation traded lower
despite the firm posting solid fourth-quarter earnings reports. Investors focused on the company’s 2019 guidance, which came in well below analysts’ estimates. Management indicated that earnings from the retail segment were expected to
be down double digits. Following the release, the stock was down and while the valuation has become more attractive, growth visibility and confidence in management has fallen. Given a lack of near-term catalysts for the stock, we exited the
Fund’s position in CVS Health.
Also, Mylan NV, a
generic and specialty pharmaceutical company, reported a miss on first quarter 2019 revenue, primarily due to weaker sales from Europe. While management indicated that some of the Europe headwinds are behind them, investors were increasingly
concerned that the company would not achieve its guidance. Given uncertainty around additional revenue contribution from new launches, increased expense guidance and management’s strategic review, we exited Mylan to seek out other
opportunities.
Finally, Humana Inc. was a drag on
performance during the reporting period despite a solid fourth-quarter earnings report. The primary issues for Humana revolved around headlines from Washington D.C. regarding proposed rebates for Medicare Part D, as well as rhetoric around the
proposed “Medicare for All” plan. However, given the lack of fundamental weakness, we continued to hold Humana in the Fund.
In the financial area, we saw weak results from a position in
E*TRADE Financial Corporation, the provider of online brokerage, banking and other related products to individual retail investors. The company reported results that were better than expectations across the board, with strong revenue and expense
control driving strong operating leverage and earnings upside. However, E*TRADE Financial was negatively impacted at times as macroeconomic concerns drove a weaker and more volatile stock market. Because sentiment toward the company is driven by
trading volume, its shares underperformed. We exited our position after pricing competition increased.
The energy sector was a drag on performance during the
reporting period with a position in refiner Marathon Petroleum Corp detracting the most from performance. Generally speaking, falling oil prices weighed on energy sector sentiment and resulted in negative performance for Marathon Petroleum earlier
in the reporting period. Also, management gave additional detail and guidance regarding expected synergies around the Andeavor acquisition, which made Marathon Petroleum the largest North American refiner. The company also reported quarterly results
that were below consensus on earnings per share (EPS), driven by weaker refining performance and retail operating income. Given these and other reasons, we eliminated the Fund’s position in Marathon Petroleum during the reporting period.
The most significant detractor in the industrials sector was
XPO Logistics Inc., the provider of a range of logistics services across North America and Europe including an asset-light logistics business and a transportation business. During the company’s fourth quarter, its largest customer, believed to
be Amazon although XPO Logistics wouldn’t confirm, pulled $600 million of its total $900 million of business. This incident was the latest in a string of issues including the loss of key executives, a reduction in guidance and the bankruptcy
of a key European customer that resulted in the company missing third-quarter 2018 expectations. We believed XPO Logistics was facing challenging headwinds including replacing the lost business on a profitable basis near term, a soft European market
and cycle duration of its less-than-truckload business, which represents 40-45% of company profits. Consequently, we exited our position.
The information technology sector was the top performing
sector for Fund and was led by a position in First Data Corp. The company is a provider of electronic commerce and payment solutions for merchants, financial institutions and card issuers globally. In January 2019, Fiserv announced an all-stock
acquisition of First Data in a $22 billion deal that equated to an approximately 30% premium to the prior close. The company also reported favorable revenue and EPS results that beat expectations and favorable 2019 earnings growth guidance. We
continued to hold our position because we believe the combined entity will benefit from significant accretion and will be a good strategic fit.
Also, QUALCOMM Inc. showed strong performance in the
semiconductor group. We initiated a position in late February after poor sentiment presented an attractive buying opportunity. Shares jumped during the reporting period following the announcement of a settlement with Apple to dismiss all litigation
as well as a six-year licensing deal with Apple. Later in the reporting period, a U.S. district judge ruled in favor of the Federal Trade Commission in its antitrust suit against QUALCOMM and the stock pared gains from the Apple announcements.
Although the pullback was not enough to offset the strength earlier in the reporting period, we did eliminate the Fund’s position.
Payment technology company Mastercard Inc. also benefited the
Fund’s results. Investors were encouraged by the company persistently beating quarterly results as well as its encouraging guidance. Importantly, management’s three-year guidance included low-teens revenue growth and high-teens EPS
growth, which were not only better than feared, but also highlighted recent share gains and the sustainability of the company’s growth profile. Mastercard’s competitive advantage also remains strong and defensible amid new technologies
such as mobile payments, while we see additional opportunities in new payment segments such as business-to-business (B2B) and business-to-consumer (B2C). We continued to hold Mastercard in the Fund.
Another top performer in the sector was ServiceNow Inc., an
enterprise information technology management software company. The company has been able to string together three quarters of better-than-expected sales results after a weaker fourth-quarter 2018. Additionally, ServiceNow has been reporting
consistently strong earnings, driven by strong billings growth and a continued trend higher in the company’s margin profile. Current expectations for 2020 remain strong with continued growth in sales and billings as well as continued margin
expansion. Despite some share price weakness since mid-July, ServiceNow has been a positive contributor to the Fund’s results and we continue to hold the stock.
Although a number of holdings in information technology were
standout performers, our position in IT consulting firm DXC Technology Co. was a major source of weakness. The company posted several disappointing quarters with the latest showing organic revenue trends slowing sequentially, specifically in its
global infrastructure services segment. Margins also missed on lower revenue and cost-cutting delays and management lowered fiscal-year 2020 revenue and EPS guidance. Given the stock’s persistent weakness and deteriorating outlook, we exited
the Fund’s position in DXC Technology.
In consumer
discretionary, Target Corporation posted strong performance after the company reported a quarterly beat across the board on revenues, margins and EPS. Despite ongoing spending for digital initiatives, store remodels and new merchandising launches,
gross and operating margins expanded ahead of consensus expectations. The company has demonstrated strong execution of digital initiatives, which has been aided by its merchandising expertise in private label categories and utilization of its stores
as distribution centers. For these and other reasons, we continued to hold Target in the Fund.
The real estate sector was also a positive contributor for the
Fund during the reporting period led by a position in Equinix Inc. The data center operator posted another strong quarter and raised revenue forecasts again for 2019. The company continues to hold contracts with some of the largest data companies
including Amazon, Microsoft, Salesforce and Bloomberg, which gives it a strong foundation for recurring revenues. Continued strength in bookings should remain a key revenue driver. We believe the company remains an attractive investment and
continued to hold Equinix in the portfolio.
American
Tower Corp was a strong performer within the communications real estate operator posting solid organic growth throughout the reporting period. However, management indicated that U.S. new orders have slowed and highlighted uncertainty around the
business in India looking into 2020. For these and other reasons, we traded the Fund’s position in American Tower for better near-term opportunities with more attractive valuations.
AT&T Inc. was the Fund’s top performer from the
communications services sector. AT&T’s earnings release was in line with expectations after the company saw losses in video offset by better margins and improving wireless trends. However, the shares were up after activist investor Elliot
Management sent a letter to AT&T’s board of directors. The letter highlighted Elliot Management’s large position in the name, included a list of suggested changes the firm would like to see and outlined its belief in the
company’s return potential. The stock reacted positively to the news and we continued to hold AT&T in the Fund.
Nuveen Small Cap Select Fund
How did the Fund perform during the twelve-month reporting period
ended October 31, 2019?
The tables in the Fund
Performance and Expense Ratios section of this report provide total returns for the Fund for the one-year, five-year, ten-year and/or since periods ended October 31, 2019. Comparative performance information is provided for the Fund’s Class A
Shares at net asset value (NAV) only. The Fund’s Class A Shares at NAV outperformed both the Russell 2000® Index and the Lipper Small-Cap Core
Funds Classification Average during the twelve-month reporting period.
Portfolio Managers’ Comments (continued)
What strategies were used to manage the Fund during the reporting
period and how did these strategies influence performance?
The Fund seeks to provide long-term capital appreciation by
investing primarily in the common stocks of companies with market capitalizations of $40.0 million to $10.3 billion at the time of purchase, which is based on the most recent reconstitution of the Russell 2000® Index that occurred on June 28, 2019. During the reporting period, we continued to focus on building a well-diversified portfolio of small-cap stocks
from companies with strengthening balance sheets and free cash flow characteristics. We also continued to target companies with sound business models and strong competitive advantages that we believe can gain market share opportunistically in the
current environment. We remained committed to our approach of investing in quality companies that are trading at a discount to both intrinsic and relative value metrics.
Small-cap equities underperformed larger-cap stocks during the
reporting period amid escalating trade tensions with China, increasing evidence of economic deceleration and rising political uncertainty stemming from mounting impeachment rhetoric in Washington. The segment saw a significant divergence in
performance among sectors, with information technology stocks as well as two “bond proxy” sectors, utilities and real estate, producing exceptionally strong returns during the reporting period. Meanwhile, small-cap energy producers were
poor performers throughout the reporting period, but most notably during the final months of 2018 as investors grappled with falling oil prices, an inverted Treasury yield curve and heightened concerns about recession.
The Fund’s outperformance versus the Russell benchmark
and Lipper peers was primarily due to stock selection in the industrials, health care and communication services sectors. An underweight in the poorly performing communication services sector also proved helpful. Several holdings were standouts in
the industrials sector led by Gibraltar Industries Inc., a leading provider of building products to the industrial, infrastructure and residential markets. The stock gained in recent months after earnings met and more recently in the third quarter,
beat expectations. Also, full-year profit guidance drifted higher supported by strong backlog gains in renewables, better residential prospects with a stronger housing market and improved weather and acquisition upside. We see further earnings
upside into 2020 and continue to view potential strategic mergers and acquisitions as a key catalyst for the company going forward. Although we trimmed our weight based on valuation, we maintained a position in Gibraltar Industries due to solid
execution and good fundamentals.
The Fund also saw
strong results from a position in CSW Industrials Inc. The company reported another quarterly surprise to the upside in its fiscal fourth quarter ended March 2019. Estimates have risen following a few quarterly beats as conditions remain favorable
in key end markets including HVAC, plumbing and specialty chemicals. CSW Industrials also announced a capital deployment plan, including some accretive niche acquisitions, share repurchases and initiation of a nominal dividend, which was well
received. This highlighted what we view as a continuing attractive free cash flow profile and we maintained the Fund’s position.
Shares of MasTec Inc., a leading engineering contractor
focused on communications and energy-related projects, performed strongly. The company posted another healthy quarterly update that featured positive commentary on the anticipated 5G/fiber ramp in communications that should lead to improved
utilization and margins. Oil and gas execution remained impressive, with margins staying ahead of target and order opportunities continuing, both for smaller-scale gathering work and continued larger opportunities. Electrical transmission work also
appeared to be recovering as well. We believed all of these factors portend a continued healthy runway for MasTec’s fundamentals and maintained our position.
A pair of the Fund’s health care holdings contributed
meaningfully to performance. Horizon Therapeutics Plc, a specialty pharmaceutical company was a solid performer. The company reported second- and third-quarter financial results that handily exceeded expectations. We continued to hold Horizon as a
bellwether position in the portfolio. Additionally, shares of Cambrex Corp, a pharmaceutical contract manufacturing and development organization, surged on news that the company would be acquired by the private equity firm Permira Advisors in a $2
billion cash deal, representing a significant premium to its current share price. We exited the position since the valuation paid likely precludes a competing offer.
In the communication services sector, the Fund saw favorable
results from a position in The New York Times Co., a media organization that engages in distributing news through print and digital subscriptions. The company represents a digital transformation play as it moves away from print and toward an on-line
subscription model. New York Times now generates more than 25% of its revenue from digital subscriptions with 4.5 million subscribers and a goal to achieve 10 million subscribers by 2025. The company has posted strong results with the conversion to
digital taking hold. Given the strong results and return in the year, we exited the position as we were unable to push our price target higher.
In the financials sector, pressure from falling rates and
concerns over narrowing net interest margins were somewhat offset by continued healthy credit conditions. Kinsale Capital Group Inc., a high-growth provider of excess and surplus insurance, saw its shares propelled higher. The firm reported
first-quarter results that featured higher-than-expected gross written premiums coupled with a lower loss ratio, lower tax rate and room for pricing growth. We reduced our position in Kinsale Capital because it was pushing up against our price
target, but continue to own Kinsale Capital at the end of the reporting period based on the favorable pricing dynamic in this niche insurance category.
Results were strong in information technology where the Fund
benefited from merger and acquisition activity in the sector. The Fund’s leading contribution came from a position in Carbon Black Inc., a provider of endpoint security solutions that include antivirus, malware and response. Earlier in the
reporting period, the company reported solid first-quarter results with improved revenues, stabilized annual recurring revenue and 17% growth in billings that sent shares higher. Then in August 2019, shares surged on news that VMware had agreed to
acquire the company for $26 per share. The deal represented a premium to the previous close, although the stock had already rallied well in advance of the announcement. Given the transaction was an all-cash deal and we didn’t expect another
bidder to step in, we exited our position.
Also in the
sector, Lattice Semiconductor Corp aided results. The company remains positioned to benefit as the addressable market for its specialized chips, driven by secular growth tailwinds in 5G, edge artificial intelligence and security. Recent fundamental
momentum also remained intact, after Lattice delivered another beat and raise earnings report for the second quarter. Forward quarter guidance reflected momentum in computing and communication markets and higher gross margin expectations. While some
volatility may be expected around macro and China trade war developments, Lattice appears well positioned for further sales and margin expansion. Therefore, we maintained the Fund’s position.
In the consumer discretionary sector, the Fund’s top
contributor was lease-to-own retailer Aaron’s Inc. The firm contracts with other key retailers to provide customer financing arrangements. Aaron’s continued to execute well on its sales and earnings per share (EPS) goals largely driven
by successful partnerships for its Progressive financing arm. In addition, Aaron’s core stores are displaying good sales comps as strong employment trends aid the company’s key clientele. We remained investors in Aaron’s given its
attractive valuation coupled with continued top-line momentum opportunities from announcements with companies such as Best Buy and Wayfair.
Also, residential property developer Meritage Homes Corp
performed well, largely driven by the company’s second-quarter earnings results. The company’s shift into entry-level homes is being validated as orders rose 22% during the quarter, which drove upside to guidance for the remainder of the
year. From a macro standpoint, we are seeing household formation increase, interest rates at low levels and new starts reaching levels last seen in 2007. All of these factors led us to continue liking the housing industry and specifically Meritage
Homes.
In the information technology sector, three names
detracted from results. Shares of communications equipment provider Poly (formerly known as Plantronics Inc. until March 2019) retreated after advancing earlier in the reporting period. The company is the leading provider of a full range of
commercial grade hardware enabling next-generation Unified Communication solutions. Poly reported disappointing results later in the reporting period as revenue came in below expectations due to the trade tensions. We exited the Fund’s
position in Poly.
The Fund also experienced weakness
from a position in New Relic Inc., a cloud software provider targeting the Application Performance Management industry. The company reported a strong quarter with revenue coming in above expectations. However, billings growth came in below
expectations at 24% and New Relic guided to a further deceleration in billings through the rest of the year. The slowdown in billings growth will make revenue growth more difficult. Given the potential for slowing growth, we exited the
position.
Portfolio Managers’ Comments (continued)
NETGEAR Inc. is a leading supplier of networking and computing
equipment to consumers and small businesses. The company’s main product offerings consist of wifi networking solutions, 4G/5G networking gear and wireless LAN solutions. During the reporting period, NETGEAR reported results that came in above
expectations with revenue, margins and EPS all better than expected. However, the company’s second-quarter outlook included an unexpected slowdown in revenue and higher marketing spend, causing guidance to be well below expectations. As a
result, shares sold off earlier in the reporting period, although they recovered somewhat before the end of the reporting period. Given the pushout in margin expansion until the back half of 2020, one of our key catalysts had been violated and we
exited the position.
Small-cap energy producers were
poor performers during the reporting period, most notably during the final months of 2018 as investors grappled with falling oil prices, an inverted Treasury yield curve and heightened concerns over recession. Callon Petroleum Co, an independent oil
and natural gas exploration and production company, was no exception. Despite the company achieving its production targets and outlining a path toward cash flow neutrality this year, Callon’s shares were negatively impacted by the broader
backdrop. Given the challenges we continue to see in the energy complex, we exited the Fund’s position in Callon.
In the industrial sector, Welbilt Inc., a global provider of
commercial food service equipment, saw its shares slump earlier in the reporting period. The company issued a guidance reduction to its fourth quarter driven by mix issues, supply chain problems, cost overruns and continued demand spottiness.
Therefore, we exited our position in Welbilt given the lack of near-term catalysts, the challenging backdrop in the category and a CEO transition, which may extend the time needed to regain lost business momentum.
In the health care sector, several of the Fund’s
holdings experienced company-specific issues that compounded the sector’s underperformance during the reporting period. We saw poor results from Tivity Health Inc., a provider of fitness and health improvement programs primarily focused on the
elderly within the Medicare Advantage program. In December 2018, Tivity Health announced it would enter the diet and nutrition segment with a $1.3 billion acquisition of Nutrisystem Inc. We exited our position because of the significant leverage the
company was taking on and because we did not believe the acquisition made strategic sense.
Also, Natera Inc., a developer of prenatal, transplant health
and oncology diagnostics, saw its shares negatively impacted by poor financial results for the third quarter of 2018 that resulted from service complications in noninvasive prenatal testing as well as increased guidance for development spending. The
share reaction was amplified by significant insider selling in the previous months and increased competitive pressure on the transplant side. As a result, we sold the Fund’s position in Natera to seek out other opportunities within the
group.
In the consumer discretionary sector, the Fund
experienced weak results from a position in Children’s Place Inc., a specialty retailer of clothing for children and toddlers. Shares lagged over the past year as the company dealt with a challenging transition toward increased online sales
that was beset by supply issues. Also, the bankruptcies of two of the company’s larger competitors created a highly promotional environment in the category, while the ongoing issues associated with the onset of Chinese tariffs weighed on
shares. Given multiple headwinds to our thesis, we exited Children’s Place in favor of more growth-oriented alternatives.
We also saw disappointing results from Dave &
Buster’s Entertainment Inc., which offers a full array of entertainment options including casual dining, beverages and various attractions. The stock underperformed after the company missed expectations with its first-quarter sales and profits
while lowering its full-year sales forecast. Comparable store sales decreased 0.3% in the first-quarter 2019, driven by a decline in the food and beverage segment and walk-in sales. Given the lack of growth visibility, increased competition and
deteriorating store-level returns, we exited the position.
Nuveen
Large Cap Select Fund
Mutual fund investing involves
risk; principal loss is possible. Equity investments, such as those held by the Fund, are subject to market risk, derivatives risk, and common stock risk. Foreign investments involve additional risks including currency fluctuations, political and
economic instability, and lack of liquidity. These risks are magnified in emerging markets.
Nuveen Small Cap Select Fund
Mutual fund investing involves risk; principal loss is
possible. There is no guarantee the Fund’s investment objectives will be achieved. Prices of equity securities may decline significantly over short or extended periods of time. Investments in smaller companies are subject to greater volatility than those of larger companies. Non-U.S. investments involve risks such as currency fluctuation, political and economic
instability, lack of liquidity and differing legal and accounting standards. These risks are magnified in emerging markets. These and other risk considerations, such as derivatives and growth stock risks, are
described in the Fund’s prospectus.
THIS PAGE INTENTIONALLY LEFT BLANK
Fund Performance and Expense Ratios
The Fund
Performance and Expense Ratios for each Fund are shown within this section of the report.
Returns quoted represent past performance, which is no guarantee
of future results. Investment returns and principal value will fluctuate so that when shares are redeemed, they may be worth more or less than their original cost. Current performance may be higher or lower than the
performance shown. Total returns for a period of less than one year are not annualized. Returns at net asset value (NAV) would be lower if the sales charge were included. Returns assume reinvestment of dividends and capital gains. For performance,
current to the most recent month-end visit nuveen.com or call (800) 257-8787.
Returns do not reflect the deduction of taxes that a
shareholder would pay on Fund distributions or the redemption of Fund Shares.
Returns may reflect fee waivers and/or expense reimbursements
by the investment adviser during the periods presented. If any such waivers and/or reimbursements had not been in place, returns would have been reduced. See Notes to Financial Statements, Note 7—Management Fees and Other Transactions with
Affiliates for more information.
Returns reflect
differences in sales charges and expenses, which are primarily differences in distribution and service fees, and assume reinvestment of dividends and capital gains.
Comparative index and Lipper return information is provided
for Class A Shares at NAV only.
The expense ratios shown
reflect total operating expenses (before fee waivers and/or expense reimbursements, if any) as shown in the most recent prospectus. The expense ratios include management fees and other fees and expenses.
Fund Performance and Expense Ratios (continued)
Nuveen Large Cap Select Fund
Refer
to the first page of this Fund Performance and Expense Ratios section for further explanation of the information included within this section. Refer to the Glossary of Terms Used in this Report for definitions of terms used within this
section.
Fund Performance
Average Annual Total Returns as of October 31, 2019
| |
Average
Annual |
| |
1-Year
|
5-Year
|
10-Year
|
| Class
A Shares at NAV |
10.86%
|
10.04%
|
12.87%
|
| Class
A Shares at maximum Offering Price |
4.49%
|
8.74%
|
12.20%
|
| S&P
500® Index |
14.33%
|
10.78%
|
13.70%
|
| Lipper
Large-Cap Core Funds Classification Average |
13.08%
|
9.33%
|
12.26%
|
| Class
C Shares |
10.02%
|
9.21%
|
12.03%
|
| Class
I Shares |
11.13%
|
10.31%
|
13.15%
|
Average Annual Total Returns as of
September 30, 2019 (Most Recent Calendar Quarter)
| |
Average
Annual |
| |
1-Year
|
5-Year
|
10-Year
|
| Class
A Shares at NAV |
(2.30)%
|
10.09%
|
12.25%
|
| Class
A Shares at maximum Offering Price |
(7.91)%
|
8.79%
|
11.58%
|
| Class
C Shares |
(3.02)%
|
9.26%
|
11.41%
|
| Class
I Shares |
(2.05)%
|
10.36%
|
12.53%
|
Indexes and Lipper averages are not
available for direct investment.
Class A Shares have a
maximum 5.75% sales charge (Offering Price). Class A Share purchases of $1 million or more are sold at net asset value without an up-front sales charge but may be subject to a contingent deferred sales charge (CDSC) of 1% if redeemed within eighteen
months of purchase. Class C Shares have a 1% CDSC for redemptions within less than twelve months, which is not reflected in the total returns. Class C Shares automatically convert to Class A Shares ten years after purchase. Class I Shares have no
sales charge and may be purchased under limited circumstances or by specified classes of investors.
Expense Ratios as of Most Recent Prospectus
| |
Share
Class |
| |
Class
A |
Class
C |
Class
I |
| Gross
Expense Ratios |
1.16%
|
1.91%
|
0.91%
|
| Net
Expense Ratios |
1.14%
|
1.89%
|
0.89%
|
The Fund’s investment adviser
has contractually agreed to waive fees and/or reimburse other Fund expenses through July 31, 2021, so that total annual Fund operating expenses (excluding 12b-1 distribution and/or service fees, interest expenses, taxes, acquired fund fees and
expenses, fees incurred in acquiring and disposing of portfolio securities and extraordinary expenses) do not exceed 0.89% of the average daily net assets of any class of Fund shares. This expense limitation may be terminated or modified prior to
that date only with the approval of the Board of Directors of the Fund.
Growth of an Assumed $10,000 Investment as of October 31, 2019
– Class A Shares
The graphs do not reflect
the deduction of taxes that a shareholder may pay on Fund distributions or the redemption of Fund shares.
Fund Performance and Expense Ratios (continued)
Nuveen Small Cap Select Fund
Refer
to the first page of this Fund Performance and Expense Ratios section for further explanation of the information included within this section. Refer to the Glossary of Terms Used in this Report for definitions of terms used within this
section.
Fund Performance
Average Annual Total Returns as of October 31, 2019
| |
Average
Annual |
| |
1-Year
|
5-Year
|
10-Year
|
| Class
A Shares at NAV |
6.95%
|
7.85%
|
11.50%
|
| Class
A Shares at maximum Offering Price |
0.85%
|
6.59%
|
10.84%
|
| Russell
2000® Index |
4.90%
|
7.37%
|
12.27%
|
| Lipper
Small-Cap Core Funds Classification Average |
4.69%
|
6.09%
|
11.22%
|
| Class
C Shares |
6.09%
|
7.03%
|
10.65%
|
| Class
R3 Shares |
6.65%
|
7.57%
|
11.22%
|
| Class
I Shares |
7.13%
|
8.10%
|
11.76%
|
| |
Average
Annual |
| |
1-Year
|
Since
Inception |
| Class
R6 Shares |
7.22%
|
4.52%
|
Average Annual Total Returns as of
September 30, 2019 (Most Recent Calendar Quarter)
| |
Average
Annual |
| |
1-Year
|
5-Year
|
10-Year
|
| Class
A Shares at NAV |
(8.14)%
|
8.49%
|
10.39%
|
| Class
A Shares at maximum Offering Price |
(13.39)%
|
7.21%
|
9.73%
|
| Class
C Shares |
(8.94)%
|
7.68%
|
9.56%
|
| Class
R3 Shares |
(8.32)%
|
8.23%
|
10.11%
|
| Class
I Shares |
(7.92)%
|
8.78%
|
10.66%
|
| |
Average
Annual |
| |
1-Year
|
Since
Inception |
| Class
R6 Shares |
(7.68)%
|
2.43%
|
Since inception returns for Class R6
Shares are from 2/28/18. Indexes and Lipper averages are not available for direct investment.
Class A Shares have a maximum 5.75% sales charge (Offering
Price). Class A Share purchases of $1 million or more are sold at net asset value without an up-front sales charge but may be subject to a contingent deferred sales charge (CDSC) of 1% if redeemed within eighteen months of purchase. Class C Shares
have a 1% CDSC for redemptions within less than twelve months, which is not reflected in the total returns. Class C Shares automatically convert to Class A Shares ten years after purchase. Class R3 Shares have no sales charge and are only available
for purchase by eligible retirement plans. Class R6 Shares have no sales charge and are available only to certain limited categories of investors as described in the prospectus. Class I Shares have no sales charge and may be purchased under limited
circumstances or by specified classes of investors.
Expense Ratios as of Most Recent Prospectus
| |
Share
Class |
| |
Class
A |
Class
C |
Class
R3 |
Class
R6 |
Class
I |
| Gross
Expense Ratios |
1.43%
|
2.18%
|
1.68%
|
1.03%
|
1.18%
|
| Net
Expense Ratios |
1.24%
|
1.99%
|
1.49%
|
0.85%
|
0.99%
|
The Fund’s investment adviser
has contractually agreed to waive fees and/or reimburse other Fund expenses through July 31, 2021, so that total annual Fund operating expenses (excluding 12b-1 distribution and/or service fees, interest expenses, taxes, acquired fund fees and
expenses, fees incurred in acquiring and disposing of portfolio securities and extraordinary expenses) do not exceed 0.99% of the average daily net assets of any class of Fund shares. However, because Class R6 Shares are not subject to sub-transfer
agent and similar fees, the total annual Fund operating expenses for the Class R6 Shares will be less than the expense limitation. This expense limitation may be terminated or modified prior to that date only with the approval of the Board of
Directors of the Fund.
Growth of an Assumed $10,000
Investment as of October 31, 2019 – Class A Shares
The graphs do not reflect
the deduction of taxes that a shareholder may pay on Fund distributions or the redemption of Fund shares.
Holding Summaries as of October 31, 2019
This data relates to the securities held in each Fund's
portfolio of investments as of the end of this reporting period. It should not be construed as a measure of performance for the Fund itself. Holdings are subject to change.
Nuveen Large Cap Select Fund
Fund
Allocation
(% of net assets) |
|
| Common
Stocks |
100.1%
|
| Money
Market Funds |
0.2%
|
| Other
Assets Less Liabilities |
(0.3)%
|
| Net
Assets |
100%
|
Portfolio
Composition
(% of net assets) |
|
| Software
|
11.0%
|
| Health
Care Providers & Services |
8.0%
|
| Interactive
Media & Services |
6.9%
|
| IT
Services |
6.7%
|
| Biotechnology
|
6.1%
|
| Banks
|
5.1%
|
| Semiconductors
& Semiconductor Equipment |
4.8%
|
| Pharmaceuticals
|
4.1%
|
| Aerospace
& Defense |
4.1%
|
| Equity
Real Estate Investment Trust |
3.4%
|
| Insurance
|
3.3%
|
| Diversified
Telecommunication Services |
3.1%
|
| Household
Durables |
2.5%
|
| Media
|
2.4%
|
| Chemicals
|
2.3%
|
| Consumer
Finance |
2.2%
|
| Electric
Utilities |
2.2%
|
| Multiline
Retail |
2.2%
|
| Other
|
19.7%
|
| Money
Market Funds |
0.2%
|
| Other
Assets Less Liabilities |
(0.3)%
|
| Net
Assets |
100%
|
Top
Five Common Stock Holdings
(% of net assets) |
|
| Microsoft
Corp |
5.4%
|
| Mastercard
Inc, Class A |
3.7%
|
| Facebook
Inc., Class A |
3.4%
|
| Citigroup
Inc. |
3.1%
|
| Cigna
Corp |
3.1%
|
Nuveen Small Cap Select Fund
Fund
Allocation
(% of net assets) |
|
| Common
Stocks |
98.5%
|
| Investments
Purchased with Collateral from Securities Lending |
2.7%
|
| Money
Market Funds |
1.3%
|
| Other
Assets Less Liabilities |
(2.5)%
|
| Net
Assets |
100%
|
Portfolio
Composition
(% of net assets) |
|
| Banks
|
11.6%
|
| Equity
Real Estate Investment Trust |
8.4%
|
| Software
|
6.2%
|
| Biotechnology
|
4.5%
|
| Hotels,
Restaurants & Leisure |
4.3%
|
| Machinery
|
4.2%
|
| Health
Care Equipment & Supplies |
3.8%
|
| Pharmaceuticals
|
3.6%
|
| IT
Services |
3.3%
|
| Food
Products |
3.2%
|
| Semiconductors
& Semiconductor Equipment |
3.2%
|
| Leisure
Products |
3.0%
|
| Chemicals
|
2.8%
|
| Oil,
Gas & Consumable Fuels |
2.8%
|
| Building
Products |
2.8%
|
| Commercial
Services & Supplies |
2.5%
|
| Health
Care Providers & Services |
2.4%
|
| Capital
Markets |
2.3%
|
| Construction
& Engineering |
2.3%
|
| Insurance
|
2.2%
|
| Other
|
19.1%
|
| Investments
Purchased with Collateral from Securities Lending |
2.7%
|
| Money
Market Funds |
1.3%
|
| Other
Assets Less Liabilities |
(2.5)%
|
| Net
Assets |
100%
|
Top
Five Common Stock Holdings
(% of net assets) |
|
| Horizon
Therapeutics Plc |
2.0%
|
| Delek
US Holdings Inc. |
1.8%
|
| Altra
Industrial Motion Corp |
1.8%
|
| Louisiana-Pacific
Corp |
1.8%
|
| MAXIMUS
Inc |
1.7%
|
As a
shareholder of one or more of the Funds, you incur two types of costs: (1) transaction costs, including up-front and back-end sales charges (loads) or redemption fees, where applicable; and (2) ongoing costs, including management fees; distribution
and service (12b-1) fees, where applicable; and other Fund expenses. The Examples below are intended to help you understand your ongoing costs (in dollars) of investing in the Funds and to compare these costs with the ongoing costs of investing in
other mutual funds.
The Examples below are based on an
investment of $1,000 invested at the beginning of the period and held through the period ended October 31, 2019.
The beginning of the period is May 1, 2019.
The information under “Actual Performance,”
together with the amount you invested, allows you to estimate actual expenses incurred over the reporting period. Simply divide your account value by $1,000 (for example, an $8,600 account value divided by $1,000 = 8.60) and multiply the result by
the cost shown for your share class, in the row entitled “Expenses Incurred During Period” to estimate the expenses incurred on your account during this period.
The information under “Hypothetical Performance,”
provides information about hypothetical account values and hypothetical expenses based on each Fund’s actual expense ratios and an assumed rate of return of 5% per year before expenses, which is not the Fund’s actual return. The
hypothetical account values and expenses may not be used to estimate the actual ending account balance or expense you incurred for the period. You may use this information to compare the ongoing costs of investing in the Fund and other funds. To do
so, compare this 5% hypothetical example with the 5% hypothetical examples that appear in the shareholder reports of the other funds.
Please note that the expenses shown in the following tables
are meant to highlight your ongoing costs only and do not reflect any transaction costs. Therefore, the hypothetical information is useful in comparing ongoing costs only, and will not help you determine the relative total costs of owning different
funds or share classes. In addition, if these transaction costs were included, your costs would have been higher.
Nuveen Large Cap Select Fund
| |
Share
Class |
| |
Class
A |
Class
C |
Class
I |
| Actual
Performance |
|
|
|
| Beginning
Account Value |
$1,000.00
|
$1,000.00
|
$1,000.00
|
| Ending
Account Value |
$1,024.01
|
$1,019.83
|
$1,025.15
|
| Expenses
Incurred During the Period |
$
5.87 |
$
9.67 |
$
4.59 |
Hypothetical
Performance
(5% annualized return before expenses) |
|
|
|
| Beginning
Account Value |
$1,000.00
|
$1,000.00
|
$1,000.00
|
| Ending
Account Value |
$1,019.41
|
$1,015.63
|
$1,020.67
|
| Expenses
Incurred During the Period |
$
5.85 |
$
9.65 |
$
4.58 |
For each class of the Fund, expenses are equal to the Fund's
annualized net expense ratio of 1.15%, 1.90%, and 0.90% for Classes A, C and I, respectively, multiplied by the average account value over the period, multiplied by 184/365 (to reflect the one-half year period).
Nuveen Small Cap Select Fund
| |
Share
Class |
| |
Class
A |
Class
C |
Class
R3 |
Class
R6 |
Class
I |
| Actual
Performance |
|
|
|
|
|
| Beginning
Account Value |
$1,000.00
|
$1,000.00
|
$1,000.00
|
$1,000.00
|
$1,000.00
|
| Ending
Account Value |
$1,003.91
|
$1,000.00
|
$1,001.49
|
$1,004.79
|
$1,003.84
|
| Expenses
Incurred During the Period |
$
6.26 |
$
10.03 |
$
7.52 |
$
4.24 |
$
5.00 |
Hypothetical
Performance
(5% annualized return before expenses) |
|
|
|
|
|
| Beginning
Account Value |
$1,000.00
|
$1,000.00
|
$1,000.00
|
$1,000.00
|
$1,000.00
|
| Ending
Account Value |
$1,018.95
|
$1,015.17
|
$1,017.69
|
$1,020.97
|
$1,020.21
|
| Expenses
Incurred During the Period |
$
6.31 |
$
10.11 |
$
7.58 |
$
4.28 |
$
5.04 |
For each class of the Fund, expenses are equal to the
Fund’s annualized net expense ratio of 1.24%, 1.99%, 1.49%, 0.84% and 0.99% for Classes A, C, R3, R6 and I, respectively, multiplied by the average account value over the period, multiplied by 184/365 (to reflect the one-half year
period).
Report of Independent Registered Public Accounting
Firm
To the Board of Directors of Nuveen Investment Funds, Inc. and Shareholders
of
Nuveen Large Cap Select Fund
Nuveen Small Cap Select Fund
Opinions on the Financial Statements
We have audited the accompanying statements of assets and
liabilities, including the portfolios of investments, of Nuveen Large Cap Select Fund and Nuveen Small Cap Select Fund (two of the funds constituting Nuveen Investment Funds, Inc., hereafter collectively referred to as the "Funds") as of October 31,
2019, the related statements of operations for the year ended October 31, 2019, the statements of changes in net assets for each of the two years in the period ended October 31, 2019, including the related notes, and the financial highlights for
each of the five years in the period ended October 31, 2019 (collectively referred to as the “financial statements”). In our opinion, the financial statements present fairly, in all material respects, the financial position of each of
the Funds as of October 31, 2019, the results of each of their operations for the year then ended, the changes in each of their net assets for each of the two years in the period ended October 31, 2019 and each of the financial highlights for each
of the five years in the period ended October 31, 2019 in conformity with accounting principles generally accepted in the United States of America.
Basis for Opinions
These financial statements are the responsibility of the
Funds’ management. Our responsibility is to express an opinion on the Funds’ financial statements based on our audits. We are a public accounting firm registered with the Public Company Accounting Oversight Board (United States) (PCAOB)
and are required to be independent with respect to the Funds in accordance with the U.S. federal securities laws and the applicable rules and regulations of the Securities and Exchange Commission and the PCAOB.
We conducted our audits of these financial statements in
accordance with the standards of the PCAOB. Those standards require that we plan and perform the audit to obtain reasonable assurance about whether the financial statements are free of material misstatement, whether due to error or fraud.
Our audits included performing procedures to assess the risks
of material misstatement of the financial statements, whether due to error or fraud, and performing procedures that respond to those risks. Such procedures included examining, on a test basis, evidence regarding the amounts and disclosures in the
financial statements. Our audits also included evaluating the accounting principles used and significant estimates made by management, as well as evaluating the overall presentation of the financial statements. Our procedures included confirmation
of securities owned as of October 31, 2019 by correspondence with the custodian and brokers. We believe that our audits provide a reasonable basis for our opinions.
PricewaterhouseCoopers LLP
Chicago, Illinois
December 27, 2019
We have served as the auditor of one or more investment companies in Nuveen
Funds since 2002.
Nuveen Large Cap Select Fund
Portfolio of Investments October 31, 2019
| Shares
|
|
Description
(1) |
|
|
|
Value
|
| |
|
LONG-TERM
INVESTMENTS – 100.1% |
|
|
|
|
| |
|
COMMON
STOCKS – 100.1% |
|
|
|
|
| |
|
Aerospace
& Defense – 4.1% |
|
|
|
|
| 2,762
|
|
Boeing
Co |
|
|
|
$938,831 |
| 4,377
|
|
L3Harris
Technologies Inc. |
|
|
|
903,019
|
| |
|
Total
Aerospace & Defense |
|
|
|
1,841,850
|
| |
|
Banks – 5.1%
|
|
|
|
|
| 19,617
|
|
Citigroup
Inc. |
|
|
|
1,409,678
|
| 1,994
|
|
SVB
Financial Group, (2) |
|
|
|
441,631
|
| 11,510
|
|
TCF
Financial Corp |
|
|
|
455,681
|
| |
|
Total
Banks |
|
|
|
2,306,990
|
| |
|
Beverages – 1.8%
|
|
|
|
|
| 14,918
|
|
Coca-Cola
Co |
|
|
|
811,987
|
| |
|
Biotechnology – 6.1%
|
|
|
|
|
| 12,307
|
|
AbbVie
Inc. |
|
|
|
979,022
|
| 1,582
|
|
Biogen
Inc, (2) |
|
|
|
472,559
|
| 9,648
|
|
Gilead
Sciences Inc. |
|
|
|
614,674
|
| 3,473
|
|
Vertex
Pharmaceuticals Inc, (2) |
|
|
|
678,902
|
| |
|
Total
Biotechnology |
|
|
|
2,745,157
|
| |
|
Capital
Markets – 1.8% |
|
|
|
|
| 17,353
|
|
Morgan
Stanley |
|
|
|
799,106
|
| |
|
Chemicals – 2.3%
|
|
|
|
|
| 4,072
|
|
Celanese
Corp |
|
|
|
493,323
|
| 12,117
|
|
CF
Industries Holdings Inc. |
|
|
|
549,506
|
| |
|
Total
Chemicals |
|
|
|
1,042,829
|
| |
|
Communications
Equipment – 1.9% |
|
|
|
|
| 5,075
|
|
Motorola
Solutions Inc. |
|
|
|
844,074
|
| |
|
Consumer
Finance – 2.2% |
|
|
|
|
| 10,685
|
|
Capital
One Financial Corp |
|
|
|
996,376
|
| |
|
Diversified
Telecommunication Services – 3.1% |
|
|
|
|
| 35,682
|
|
AT&T
Inc. |
|
|
|
1,373,400
|
| |
|
Electric
Utilities – 2.2% |
|
|
|
|
| 17,495
|
|
Exelon
Corp |
|
|
|
795,847
|
| 3,696
|
|
FirstEnergy
Corp |
|
|
|
178,591
|
| |
|
Total
Electric Utilities |
|
|
|
974,438
|
Nuveen Large Cap Select Fund (continued)
Portfolio of Investments October 31, 2019
| Shares
|
|
Description
(1) |
|
|
|
Value
|
| |
|
Entertainment – 2.1%
|
|
|
|
|
| 7,165
|
|
Walt
Disney Co |
|
|
|
$
930,877 |
| |
|
Equity
Real Estate Investment Trust – 3.4% |
|
|
|
|
| 5,299
|
|
Crown
Castle International Corp |
|
|
|
735,448
|
| 1,399
|
|
Equinix
Inc |
|
|
|
792,925
|
| |
|
Total
Equity Real Estate Investment Trust |
|
|
|
1,528,373
|
| |
|
Food
Products – 1.9% |
|
|
|
|
| 10,222
|
|
Tyson
Foods Inc., Class A |
|
|
|
846,279
|
| |
|
Health
Care Providers & Services – 8.0% |
|
|
|
|
| 7,876
|
|
Cigna
Corp |
|
|
|
1,405,551
|
| 4,456
|
|
Humana
Inc. |
|
|
|
1,310,955
|
| 3,523
|
|
UnitedHealth
Group Inc. |
|
|
|
890,262
|
| |
|
Total
Health Care Providers & Services |
|
|
|
3,606,768
|
| |
|
Hotels,
Restaurants & Leisure – 1.5% |
|
|
|
|
| 24,316
|
|
MGM
Resorts International |
|
|
|
693,006
|
| |
|
Household
Durables – 2.5% |
|
|
|
|
| 59,276
|
|
Newell
Brands Inc. |
|
|
|
1,124,466
|
| |
|
Insurance – 3.3%
|
|
|
|
|
| 12,677
|
|
Hartford
Financial Services Group Inc. |
|
|
|
723,603
|
| 7,478
|
|
Marsh
& McLennan Cos Inc. |
|
|
|
774,871
|
| |
|
Total
Insurance |
|
|
|
1,498,474
|
| |
|
Interactive
Media & Services – 6.9% |
|
|
|
|
| 1,006
|
|
Alphabet
Inc., Class A, (2) |
|
|
|
1,266,353
|
| 7,887
|
|
Facebook
Inc., Class A, (2) |
|
|
|
1,511,543
|
| 7,484
|
|
Tencent
Holdings Ltd., ADR |
|
|
|
303,102
|
| |
|
Total
Interactive Media & Services |
|
|
|
3,080,998
|
| |
|
Internet
& Direct Marketing Retail – 1.8% |
|
|
|
|
| 1,904
|
|
Alibaba
Group Holding Ltd, Sponsored ADR, (2) |
|
|
|
336,380
|
| 3,456
|
|
Expedia
Group Inc. |
|
|
|
472,297
|
| |
|
Total
Internet & Direct Marketing Retail |
|
|
|
808,677
|
| |
|
IT
Services – 6.7% |
|
|
|
|
| 12,939
|
|
Fiserv
Inc., (2) |
|
|
|
1,373,345
|
| 5,942
|
|
Mastercard
Inc, Class A |
|
|
|
1,644,805
|
| |
|
Total
IT Services |
|
|
|
3,018,150
|
| |
|
Machinery – 1.2%
|
|
|
|
|
| 3,846
|
|
Caterpillar
Inc. |
|
|
|
529,979
|
| |
|
Media – 2.4%
|
|
|
|
|
| 23,553
|
|
Comcast
Corp., Class A |
|
|
|
1,055,645
|
| Shares
|
|
Description
(1) |
|
|
|
Value
|
| |
|
Multiline
Retail – 2.2% |
|
|
|
|
| 9,101
|
|
Target
Corp |
|
|
|
$
972,988 |
| |
|
Multi-Utilities – 1.6%
|
|
|
|
|
| 10,958
|
|
Public
Service Enterprise Group Inc. |
|
|
|
693,751
|
| |
|
Pharmaceuticals – 4.1%
|
|
|
|
|
| 6,371
|
|
Allergan
PLC |
|
|
|
1,121,997
|
| 14,708
|
|
AstraZeneca
PLC, Sponsored ADR |
|
|
|
721,133
|
| |
|
Total
Pharmaceuticals |
|
|
|
1,843,130
|
| |
|
Road
& Rail – 1.3% |
|
|
|
|
| 4,074
|
|
Kansas
City Southern |
|
|
|
573,538
|
| |
|
Semiconductors
& Semiconductor Equipment – 4.8% |
|
|
|
|
| 27,151
|
|
Marvell
Technology Group Ltd |
|
|
|
662,213
|
| 4,026
|
|
NVIDIA
Corp |
|
|
|
809,306
|
| 6,098
|
|
NXP
Semiconductors NV |
|
|
|
693,221
|
| |
|
Total
Semiconductors & Semiconductor Equipment |
|
|
|
2,164,740
|
| |
|
Software – 11.0%
|
|
|
|
|
| 1,934
|
|
Adobe
Inc, (2) |
|
|
|
537,517
|
| 2,321
|
|
Autodesk
Inc., (2) |
|
|
|
342,023
|
| 2,153
|
|
Intuit
Inc |
|
|
|
554,397
|
| 16,894
|
|
Microsoft
Corp |
|
|
|
2,422,093
|
| 4,406
|
|
salesforce.com
Inc, (2) |
|
|
|
689,495
|
| 1,620
|
|
ServiceNow
Inc, (2) |
|
|
|
400,561
|
| |
|
Total
Software |
|
|
|
4,946,086
|
| |
|
Specialty
Retail – 1.2% |
|
|
|
|
| 7,618
|
|
Best
Buy Co Inc. |
|
|
|
547,201
|
| |
|
Tobacco – 1.6%
|
|
|
|
|
| 8,720
|
|
Philip
Morris International Inc. |
|
|
|
710,157
|
| |
|
Total
Long-Term Investments (cost $38,856,413) |
|
|
|
44,909,490
|
| Shares
|
|
Description
(1) |
Coupon
|
|
|
Value
|
| |
|
SHORT-TERM
INVESTMENTS – 0.2% |
|
|
|
|
| |
|
MONEY
MARKET FUNDS – 0.2% |
|
|
|
|
| 90,718
|
|
First
American Treasury Obligation Fund, Class Z |
1.693%
(3) |
|
|
$
90,718 |
| |
|
Total
Short-Term Investments (cost $90,718) |
|
|
|
90,718
|
| |
|
Total
Investments (cost $38,947,131) – 100.3% |
|
|
|
45,000,208
|
| |
|
Other
Assets Less Liabilities – (0.3)% |
|
|
|
(113,138)
|
| |
|
Net
Assets – 100% |
|
|
|
$
44,887,070 |
Nuveen Large Cap Select Fund (continued)
Portfolio of Investments October 31, 2019
| |
For
Fund portfolio compliance purposes, the Fund’s industry classifications refer to any one or more of the industry sub-classifications used by one or more widely recognized market indexes or ratings group indexes, and/or as defined by Fund
management. This definition may not apply for purposes of this report, which may combine industry sub-classifications into sectors for reporting ease. |
|
| (1)
|
All
percentages shown in the Portfolio of Investments are based on net assets. |
|
| (2)
|
Non-income
producing; issuer has not declared a dividend within the past twelve months. |
|
| (3)
|
The
rate shown is the annualized seven-day subsidized yield as of the end of the reporting period. |
|
| ADR
|
American
Depositary Receipt |
|
See accompanying notes to financial statements.
Nuveen Small Cap Select Fund
Portfolio of Investments October 31, 2019
| Shares
|
|
Description
(1) |
|
|
|
Value
|
| |
|
LONG-TERM
INVESTMENTS – 98.5% |
|
|
|
|
| |
|
COMMON
STOCKS – 98.5% |
|
|
|
|
| |
|
Aerospace
& Defense – 1.4% |
|
|
|
|
| 15,710
|
|
Moog
Inc., Class A |
|
|
|
$
1,315,084 |
| |
|
Auto
Components – 1.3% |
|
|
|
|
| 43,002
|
|
Cooper
Tire & Rubber Co |
|
|
|
1,214,376
|
| |
|
Banks – 11.6%
|
|
|
|
|
| 22,994
|
|
Banner
Corp |
|
|
|
1,241,216
|
| 36,289
|
|
Cathay
General Bancorp |
|
|
|
1,290,800
|
| 20,762
|
|
IBERIABANK
Corp |
|
|
|
1,523,723
|
| 18,352
|
|
Pinnacle
Financial Partners Inc., Class A |
|
|
|
1,079,465
|
| 25,873
|
|
Preferred
Bank |
|
|
|
1,379,290
|
| 35,401
|
|
Renasant
Corp |
|
|
|
1,228,415
|
| 52,850
|
|
Sterling
Bancorp |
|
|
|
1,038,502
|
| 23,967
|
|
Western
Alliance Bancorp |
|
|
|
1,182,292
|
| 14,341
|
|
Wintrust
Financial Corp |
|
|
|
915,242
|
| |
|
Total
Banks |
|
|
|
10,878,945
|
| |
|
Biotechnology – 4.5%
|
|
|
|
|
| 6,015
|
|
Arena
Pharmaceuticals Inc, (2) |
|
|
|
293,021
|
| 2,914
|
|
Argenx
SE ADR, (2) |
|
|
|
356,848
|
| 3,670
|
|
Ascendis
Pharma A/S ADR, (2) |
|
|
|
405,828
|
| 4,943
|
|
Blueprint
Medicines Corp, (2) |
|
|
|
340,276
|
| 18,380
|
|
CareDx
Inc, (2) |
|
|
|
481,740
|
| 42,118
|
|
Coherus
Biosciences Inc, (2) |
|
|
|
731,590
|
| 21,002
|
|
Fate
Therapeutics Inc, (2) |
|
|
|
313,980
|
| 24,016
|
|
Halozyme
Therapeutics Inc, (2) |
|
|
|
367,925
|
| 17,401
|
|
Iovance
Biotherapeutics Inc, (2) |
|
|
|
367,683
|
| 6,665
|
|
Repligen
Corp, (2) |
|
|
|
529,801
|
| |
|
Total
Biotechnology |
|
|
|
4,188,692
|
| |
|
Building
Products – 2.8% |
|
|
|
|
| 20,245
|
|
CSW
Industrials Inc |
|
|
|
1,401,359
|
| 22,965
|
|
Gibraltar
Industries Inc. |
|
|
|
1,222,427
|
| |
|
Total
Building Products |
|
|
|
2,623,786
|
| |
|
Capital
Markets – 2.3% |
|
|
|
|
| 17,050
|
|
Evercore
Inc., Class A |
|
|
|
1,255,562
|
| 11,793
|
|
Piper
Jaffray Companies |
|
|
|
926,222
|
| |
|
Total
Capital Markets |
|
|
|
2,181,784
|
Nuveen Small Cap Select Fund (continued)
Portfolio of Investments October 31, 2019
| Shares
|
|
Description
(1) |
|
|
|
Value
|
| |
|
Chemicals – 2.8%
|
|
|
|
|
| 17,271
|
|
Ingevity
Corporation, (2) |
|
|
|
$1,454,391 |
| 37,794
|
|
PolyOne
Corp |
|
|
|
1,211,298
|
| |
|
Total
Chemicals |
|
|
|
2,665,689
|
| |
|
Commercial
Services & Supplies – 2.5% |
|
|
|
|
| 7,431
|
|
MSA
Safety Inc |
|
|
|
892,240
|
| 16,911
|
|
Tetra
Tech Inc |
|
|
|
1,479,205
|
| |
|
Total
Commercial Services & Supplies |
|
|
|
2,371,445
|
| |
|
Communications
Equipment – 1.4% |
|
|
|
|
| 21,063
|
|
Lumentum
Holdings Inc, (2) |
|
|
|
1,319,808
|
| |
|
Construction
& Engineering – 2.3% |
|
|
|
|
| 14,166
|
|
MasTec
Inc, (2) |
|
|
|
891,608
|
| 35,743
|
|
MYR
Group Inc, (2) |
|
|
|
1,229,917
|
| |
|
Total
Construction & Engineering |
|
|
|
2,121,525
|
| |
|
Electrical
Equipment – 1.2% |
|
|
|
|
| 15,673
|
|
Regal
Beloit Corp |
|
|
|
1,160,586
|
| |
|
Electronic
Equipment, Instruments & Components – 0.8% |
|
|
|
|
| 20,597
|
|
Methode
Electronics Inc |
|
|
|
708,537
|
| |
|
Equity
Real Estate Investment Trust – 8.4% |
|
|
|
|
| 25,063
|
|
American
Assets Trust Inc |
|
|
|
1,227,085
|
| 91,430
|
|
Brandywine
Realty Trust |
|
|
|
1,397,050
|
| 43,251
|
|
CareTrust
REIT Inc |
|
|
|
1,048,404
|
| 47,792
|
|
Industrial
Logistics Properties Trust |
|
|
|
1,015,102
|
| 52,596
|
|
STAG
Industrial Inc. |
|
|
|
1,632,580
|
| 131,689
|
|
Summit
Hotel Properties Inc. |
|
|
|
1,614,507
|
| |
|
Total
Equity Real Estate Investment Trust |
|
|
|
7,934,728
|
| |
|
Food
Products – 3.2% |
|
|
|
|
| 80,516
|
|
Nomad
Foods Ltd |
|
|
|
1,570,867
|
| 9,193
|
|
Sanderson
Farms Inc |
|
|
|
1,423,168
|
| |
|
Total
Food Products |
|
|
|
2,994,035
|
| |
|
Gas
Utilities – 1.6% |
|
|
|
|
| 17,627
|
|
Southwest
Gas Holdings Inc |
|
|
|
1,538,837
|
| |
|
Health
Care Equipment & Supplies – 3.8% |
|
|
|
|
| 35,326
|
|
AtriCure
Inc, (2) |
|
|
|
939,318
|
| 7,176
|
|
Penumbra
Inc, (2) |
|
|
|
1,119,241
|
| 16,939
|
|
Tactile
Systems Technology Inc, (2) |
|
|
|
769,370
|
| 34,514
|
|
Wright
Medical Group NV, (2) |
|
|
|
717,891
|
| |
|
Total
Health Care Equipment & Supplies |
|
|
|
3,545,820
|
| Shares
|
|
Description
(1) |
|
|
|
Value
|
| |
|
Health
Care Providers & Services – 2.4% |
|
|
|
|
| 18,345
|
|
AMN
Healthcare Services Inc., (2) |
|
|
|
$1,077,952 |
| 10,447
|
|
LHC
Group Inc, (2) |
|
|
|
1,159,304
|
| |
|
Total
Health Care Providers & Services |
|
|
|
2,237,256
|
| |
|
Hotels,
Restaurants & Leisure – 4.3% |
|
|
|
|
| 16,295
|
|
Jack
in the Box Inc. |
|
|
|
1,369,106
|
| 20,388
|
|
Papa
John's International Inc, (3) |
|
|
|
1,193,717
|
| 70,749
|
|
Penn
National Gaming Inc, (2) |
|
|
|
1,508,015
|
| |
|
Total
Hotels, Restaurants & Leisure |
|
|
|
4,070,838
|
| |
|
Household
Durables – 2.2% |
|
|
|
|
| 32,266
|
|
La-Z-Boy
Inc. |
|
|
|
1,145,766
|
| 12,990
|
|
Meritage
Homes Corp, (2) |
|
|
|
936,449
|
| |
|
Total
Household Durables |
|
|
|
2,082,215
|
| |
|
Insurance – 2.2%
|
|
|
|
|
| 15,376
|
|
eHealth
Inc, (2) |
|
|
|
1,061,559
|
| 9,816
|
|
Kinsale
Capital Group Inc |
|
|
|
1,037,748
|
| |
|
Total
Insurance |
|
|
|
2,099,307
|
| |
|
IT
Services – 3.3% |
|
|
|
|
| 5,311
|
|
InterXion
Holding NV, (2) |
|
|
|
468,536
|
| 21,392
|
|
MAXIMUS
Inc |
|
|
|
1,641,622
|
| 69,665
|
|
Verra
Mobility Corp, (2) |
|
|
|
999,693
|
| |
|
Total
IT Services |
|
|
|
3,109,851
|
| |
|
Leisure
Products – 3.0% |
|
|
|
|
| 79,126
|
|
Callaway
Golf Co |
|
|
|
1,599,928
|
| 36,840
|
|
YETI
Holdings Inc, (2), (3) |
|
|
|
1,227,140
|
| |
|
Total
Leisure Products |
|
|
|
2,827,068
|
| |
|
Machinery – 4.2%
|
|
|
|
|
| 55,293
|
|
Altra
Industrial Motion Corp |
|
|
|
1,703,025
|
| 62,667
|
|
Harsco
Corp |
|
|
|
1,270,260
|
| 22,293
|
|
SPX
Corp |
|
|
|
1,015,223
|
| |
|
Total
Machinery |
|
|
|
3,988,508
|
| |
|
Mortgage
Real Estate Investment Trust – 1.3% |
|
|
|
|
| 162,468
|
|
MFA
Financial Inc |
|
|
|
1,233,132
|
| |
|
Multi-Utilities – 1.7%
|
|
|
|
|
| 20,326
|
|
Black
Hills Corp |
|
|
|
1,602,298
|
| |
|
Oil,
Gas & Consumable Fuels – 2.8% |
|
|
|
|
| 48,687
|
|
Brigham
Minerals Inc., Class A |
|
|
|
929,435
|
| 42,726
|
|
Delek
US Holdings Inc. |
|
|
|
1,706,903
|
| |
|
Total
Oil, Gas & Consumable Fuels |
|
|
|
2,636,338
|
Nuveen Small Cap Select Fund (continued)
Portfolio of Investments October 31, 2019
| Shares
|
|
Description
(1) |
|
|
|
Value
|
| |
|
Paper
& Forest Products – 1.8% |
|
|
|
|
| 58,217
|
|
Louisiana-Pacific
Corp |
|
|
|
$
1,701,683 |
| |
|
Pharmaceuticals – 3.6%
|
|
|
|
|
| 63,681
|
|
Horizon
Therapeutics Plc, (2) |
|
|
|
1,841,018
|
| 3,276
|
|
MyoKardia
Inc, (2) |
|
|
|
187,813
|
| 32,681
|
|
Prestige
Consumer Healthcare Inc., (2) |
|
|
|
1,158,868
|
| 1,173
|
|
Reata
Pharmaceuticals Inc., Class A, (2) |
|
|
|
241,732
|
| |
|
Total
Pharmaceuticals |
|
|
|
3,429,431
|
| |
|
Road
& Rail – 1.2% |
|
|
|
|
| 31,781
|
|
Knight-Swift
Transportation Holdings Inc., Class A |
|
|
|
1,158,735
|
| |
|
Semiconductors
& Semiconductor Equipment – 3.2% |
|
|
|
|
| 69,592
|
|
Lattice
Semiconductor Corp, (2) |
|
|
|
1,363,307
|
| 71,521
|
|
MACOM
Technology Solutions Holdings Inc, (2) |
|
|
|
1,626,388
|
| |
|
Total
Semiconductors & Semiconductor Equipment |
|
|
|
2,989,695
|
| |
|
Software – 6.2%
|
|
|
|
|
| 16,596
|
|
Everbridge
Inc, (2) |
|
|
|
1,153,588
|
| 16,033
|
|
j2
Global Inc. |
|
|
|
1,522,494
|
| 22,097
|
|
Rapid7
Inc, (2) |
|
|
|
1,106,839
|
| 18,717
|
|
RealPage
Inc, (2) |
|
|
|
1,133,314
|
| 49,174
|
|
SailPoint
Technologies Holding Inc, (2) |
|
|
|
952,008
|
| |
|
Total
Software |
|
|
|
5,868,243
|
| |
|
Specialty
Retail – 1.6% |
|
|
|
|
| 20,200
|
|
Aaron's
Inc. |
|
|
|
1,513,586
|
| |
|
Thrifts
& Mortgage Finance – 1.6% |
|
|
|
|
| 61,577
|
|
Radian
Group Inc. |
|
|
|
1,545,583
|
| |
|
Total
Long-Term Investments (cost $81,144,397) |
|
|
|
92,857,444
|
| Shares
|
|
Description
(1) |
Coupon
|
|
|
Value
|
| |
|
INVESTMENTS
PURCHASED WITH COLLATERAL FROM SECURITIES LENDING – 2.7% |
|
|
|
| |
|
MONEY
MARKET FUNDS – 2.7% |
|
|
|
|
| 2,510,807
|
|
First
American Government Obligations Fund, Class X, (4) |
1.743%
(5) |
|
|
$
2,510,807 |
| |
|
Total
Investments Purchased with Collateral from Securities Lending (cost $2,510,807) |
|
|
2,510,807
|
| Shares
|
|
Description
(1) |
Coupon
|
|
|
Value
|
| |
|
SHORT-TERM
INVESTMENTS – 1.3% |
|
|
|
|
| |
|
MONEY
MARKET FUNDS – 1.3% |
|
|
|
|
| 1,219,897
|
|
First
American Treasury Obligation Fund, Class Z |
1.693%
(5) |
|
|
$
1,219,897 |
| |
|
Total
Short-Term Investments (cost $1,219,897) |
|
|
|
1,219,897
|
| |
|
Total
Investments (cost $84,875,101) – 102.5% |
|
|
|
96,588,148
|
| |
|
Other
Assets Less Liabilities – (2.5)% |
|
|
|
(2,337,262)
|
| |
|
Net
Assets – 100% |
|
|
|
$
94,250,886 |
| |
For
Fund portfolio compliance purposes, the Fund’s industry classifications refer to any one or more of the industry sub-classifications used by one or more widely recognized market indexes or ratings group indexes, and/or as defined by Fund
management. This definition may not apply for purposes of this report, which may combine industry sub-classifications into sectors for reporting ease. |
|
| (1)
|
All
percentages shown in the Portfolio of Investments are based on net assets. |
|
| (2)
|
Non-income
producing; issuer has not declared a dividend within the past twelve months. |
|
| (3)
|
Investment,
or a portion of investment, is out on loan for securities lending. The total value of the securities out on loan as of the end of the reporting period was $2,396,622. |
|
| (4)
|
The
Fund may loan securities representing up to one third of the fair value of its total assets (which includes collateral for securities on loan) to broker dealers, banks, and other institutions. The Fund maintains collateral equal to at least 100% of
the fair value of the securities loaned. The cash collateral received by the Fund is invested in this money market fund. See Notes to Financial Statements, Note 4- Portfolio Securities and Investments in Derivatives, Securities Lending for more
information. |
|
| (5)
|
The
rate shown is the annualized seven-day subsidized yield as of the end of the reporting period. |
|
| ADR
|
American
Depositary Receipt |
|
| REIT
|
Real
Estate Investment Trust |
|
See accompanying notes to financial statements.
Statement of Assets and Liabilities
October 31, 2019
| |
Large
Cap
Select |
Small
Cap
Select |
| Assets
|
|
|
| Long-term
investments, at value (cost $38,856,413 and $81,144,397, respectively) |
$44,909,490
|
$92,857,444
|
| Investment
purchased with collateral from securities lending, at value (cost approximates value) |
—
|
2,510,807
|
| Short-term
investments, at value (cost approximates value) |
90,718
|
1,219,897
|
| Receivable
for: |
|
|
| Dividends
|
57,009
|
27,708
|
| Due
from broker |
—
|
5,461
|
| Interest
|
423
|
1,249
|
| Investments
sold |
—
|
1,415,409
|
| Shares
sold |
3,686
|
25,231
|
| Other
assets |
14,250
|
36,873
|
| Total
assets |
45,075,576
|
98,100,079
|
| Liabilities
|
|
|
| Payable
for: |
|
|
| Collateral
from securities lending program |
—
|
2,510,807
|
| Investments
purchased |
—
|
998,147
|
| Shares
redeemed |
119,520
|
172,735
|
| Accrued
expenses: |
|
|
| Directors
fees |
562
|
18,563
|
| Management
fees |
23,864
|
52,232
|
| Professional
fees |
15,928
|
16,807
|
| Shareholder
servicing agent fees |
10,583
|
44,135
|
| 12b-1
distribution and service fees |
6,850
|
14,587
|
| Other
|
11,199
|
21,180
|
| Total
liabilities |
188,506
|
3,849,193
|
| Net
assets |
$44,887,070
|
$94,250,886
|
| |
|
|
See accompanying notes to financial statements.
Statement of Assets and Liabilities (continued)
| |
Large
Cap
Select |
Small
Cap
Select |
| Class
A Shares |
|
|
| Net
assets |
$24,223,574
|
$55,848,663
|
| Shares
outstanding |
788,805
|
7,247,492
|
| Net
asset value ("NAV") per share |
$
30.71 |
$
7.71 |
| Offering
price per share (NAV per share plus maximum sales charge of 5.75% of offering price) |
$
32.58 |
$
8.18 |
| Class
C Shares |
|
|
| Net
assets |
$
2,096,613 |
$
1,028,911 |
| Shares
outstanding |
74,133
|
245,592
|
| NAV
and offering price per share |
$
28.28 |
$
4.19 |
| Class
R3 Shares |
|
|
| Net
assets |
$
— |
$
5,194,202 |
| Shares
outstanding |
—
|
770,924
|
| NAV
and offering price per share |
$
— |
$
6.74 |
| Class
R6 Shares |
|
|
| Net
assets |
$
— |
$
2,069,639 |
| Shares
outstanding |
—
|
197,273
|
| NAV
and offering price per share |
$
— |
$
10.49 |
| Class
I Shares |
|
|
| Net
assets |
$18,566,883
|
$30,109,471
|
| Shares
outstanding |
599,294
|
2,877,877
|
| NAV
and offering price per share |
$
30.98 |
$
10.46 |
| Fund
level net assets consist of: |
|
|
| Capital
paid-in |
$39,406,295
|
$83,490,452
|
| Total
distributable earnings |
5,480,775
|
10,760,434
|
| Fund
level net assets |
$44,887,070
|
$94,250,886
|
| Authorized
shares - per class |
2
billion |
2
billion |
| Par
value per share |
$
0.0001 |
$
0.0001 |
See accompanying notes to financial statements.
Statement of Operations
Year Ended October 31, 2019
| |
Large
Cap
Select |
Small
Cap
Select |
| Investment
Income |
|
|
| Dividends
|
$
1,224,379 |
$1,161,213
|
| Interest
|
5,674
|
24,970
|
| Securities
lending income |
1,717
|
72,373
|
| Total
investment income |
1,231,770
|
1,258,556
|
| Expenses
|
|
|
| Management
fees |
459,364
|
856,763
|
| 12b-1
service fees - Class A Shares |
60,401
|
143,627
|
| 12b-1
distibution and service fees - Class C Shares |
21,968
|
12,035
|
| 12b-1
distibution and service fees - Class R3 Shares |
—
|
27,167
|
| Shareholder
servicing agent fees |
41,530
|
175,740
|
| Custodian
fees |
11,489
|
18,284
|
| Professional
fees |
25,771
|
29,526
|
| Trustees
fees |
1,955
|
2,955
|
| Shareholder
reporting expenses |
17,400
|
5,906
|
| Federal
and state registration fees |
58,932
|
82,159
|
| Other
|
6,832
|
3,325
|
| Total
expenses before fee waiver/expense reimbursement |
705,642
|
1,357,487
|
| Fee
waiver/expense reimbursement |
(34,975)
|
(183,740)
|
| Net
expenses |
670,667
|
1,173,747
|
| Net
investment income (loss) |
561,103
|
84,809
|
| Realized
and Unrealized Gain (Loss) |
|
|
| Net
realized gain (loss) from investments |
(1,025,607)
|
(209,980)
|
| Change
in net unrealized appreciation (depreciation) of investments |
6,416,434
|
6,331,612
|
| Net
realized and unrealized gain (loss) |
5,390,827
|
6,121,632
|
| Net
increase (decrease) in net assets from operations |
$
5,951,930 |
$6,206,441
|
See accompanying notes to financial statements.
Statement of Changes in Net Assets
| |
Large
Cap Select |
|
Small
Cap Select |
| |
Year
Ended
10/31/19 |
Year
Ended
10/31/18 |
|
Year
Ended
10/31/19 |
Year
Ended
10/31/18 |
| Operations
|
|
|
|
|
|
| Net
investment income (loss) |
$
561,103 |
$
393,830 |
|
$
84,809 |
$
17,169 |
| Net
realized gain (loss) from investments |
(1,025,607)
|
2,534,718
|
|
(209,980)
|
23,382,920
|
| Change
in net unrealized appreciation (depreciation) of investments |
6,416,434
|
468,841
|
|
6,331,612
|
(17,991,909)
|
| Net
increase (decrease) in net assets from operations |
5,951,930
|
3,397,389
|
|
6,206,441
|
5,408,180
|
| Distributions
to Shareholders |
|
|
|
|
|
| Dividends:
|
|
|
|
|
|
| Class
A Shares |
(894,093)
|
(77,536)
|
|
(11,801,893)
|
(7,904,269)
|
| Class
C Shares |
(80,595)
|
—
|
|
(422,601)
|
(820,325)
|
| Class
R3 Shares |
—
|
—
|
|
(1,142,174)
|
(706,127)
|
| Class
R6 Shares |
—
|
—
|
|
(1,031,249)
|
—
|
| Class
I Shares |
(1,910,495)
|
(329,524)
|
|
(5,461,767)
|
(4,631,487)
|
| Decrease
in net assets from distributions to shareholders |
(2,885,183)
|
(407,060)
|
|
(19,859,684)
|
(14,062,208)
|
| Fund
Share Transactions |
|
|
|
|
|
| Proceeds
from sale of shares |
8,928,213
|
29,873,879
|
|
15,825,165
|
24,737,441
|
| Proceeds
from shares issued to shareholders due to reinvestment of distributions |
2,490,169
|
323,123
|
|
19,068,666
|
13,429,298
|
| |
11,418,382
|
30,197,002
|
|
34,893,831
|
38,166,739
|
| Cost
of shares redeemed |
(43,341,723)
|
(21,209,894)
|
|
(38,571,414)
|
(44,779,473)
|
| Net
increase (decrease) in net assets from Fund share transactions |
(31,923,341)
|
8,987,108
|
|
(3,677,583)
|
(6,612,734)
|
| Net
increase (decrease) in net assets |
(28,856,594)
|
11,977,437
|
|
(17,330,826)
|
(15,266,762)
|
| Net
assets at the beginning of period |
73,743,664
|
61,766,227
|
|
111,581,712
|
126,848,474
|
| Net
assets at the end of period |
$
44,887,070 |
$
73,743,664 |
|
$
94,250,886 |
$111,581,712
|
See accompanying notes to financial statements.
Large
Cap Select
Selected data for a share outstanding throughout each period:
| |
|
|
|
|
|
|
|
|
| |
|
|
|
|
|
|
|
|
| |
|
Investment
Operations |
|
Less
Distributions |
|
| Class
(Commencement Date) Year Ended October 31, |
Beginning
NAV |
Net
Investment
Income
(Loss)(a) |
Net
Realized/
Unrealized
Gain (Loss) |
Total
|
|
From
Net
Investment
Income |
From
Accumulated
Net Realized
Gains |
Total
|
Ending
NAV |
| Class
A (01/03) |
|
|
|
|
|
|
|
|
|
| 2019
|
$28.87
|
$
0.21 |
$2.72
|
$2.93
|
|
$(0.10)
|
$(0.99)
|
$(1.09)
|
$30.71
|
| 2018
|
27.50
|
0.12
|
1.38
|
1.50
|
|
(0.13)
|
—
|
(0.13)
|
28.87
|
| 2017
|
21.24
|
0.10
|
6.25
|
6.35
|
|
(0.09)
|
—
|
(0.09)
|
27.50
|
| 2016
|
20.59
|
0.09
|
0.61
|
0.70
|
|
(0.05)
|
—
|
(0.05)
|
21.24
|
| 2015
|
20.13
|
0.08
|
0.46
|
0.54
|
|
(0.08)
|
—
|
(0.08)
|
20.59
|
| Class
C (01/03) |
|
|
|
|
|
|
|
|
|
| 2019
|
26.77
|
—* |
2.50
|
2.50
|
|
—
|
(0.99)
|
(0.99)
|
28.28
|
| 2018
|
25.57
|
(0.10)
|
1.30
|
1.20
|
|
—
|
—
|
—
|
26.77
|
| 2017
|
19.82
|
(0.08)
|
5.83
|
5.75
|
|
—
|
—
|
—
|
25.57
|
| 2016
|
19.31
|
(0.06)
|
0.57
|
0.51
|
|
—
|
—
|
—
|
19.82
|
| 2015
|
18.96
|
(0.07)
|
0.42
|
0.35
|
|
—
|
—
|
—
|
19.31
|
| Class
I (01/03) |
|
|
|
|
|
|
|
|
|
| 2019
|
29.13
|
0.28
|
2.73
|
3.01
|
|
(0.17)
|
(0.99)
|
(1.16)
|
30.98
|
| 2018
|
27.74
|
0.19
|
1.40
|
1.59
|
|
(0.20)
|
—
|
(0.20)
|
29.13
|
| 2017
|
21.42
|
0.16
|
6.30
|
6.46
|
|
(0.14)
|
—
|
(0.14)
|
27.74
|
| 2016
|
20.76
|
0.14
|
0.62
|
0.76
|
|
(0.10)
|
—
|
(0.10)
|
21.42
|
| 2015
|
20.30
|
0.13
|
0.46
|
0.59
|
|
(0.13)
|
—
|
(0.13)
|
20.76
|
| |
|
|
|
|
|
|
| |
Ratios/Supplemental
Data |
| |
|
Ratios
to Average
Net Assets Before
Waiver/Reimbursement |
|
Ratios
to Average
Net Assets After
Waiver/Reimbursement(c) |
|
Total
Return(b) |
Ending
Net
Assets
(000) |
Expenses
|
Net
Investment
Income
(Loss) |
|
Expenses
|
Net
Investment
Income
(Loss) |
Portfolio
Turnover
Rate(d) |
| |
|
|
|
|
|
|
|
| 10.86%
|
$24,224
|
1.20%
|
0.68%
|
|
1.15%
|
0.73%
|
108%
|
| 5.47
|
23,030
|
1.16
|
0.37
|
|
1.14
|
0.39
|
101
|
| 29.99
|
14,778
|
1.19
|
0.36
|
|
1.14
|
0.40
|
276
|
| 3.40
|
7,983
|
1.22
|
0.44
|
|
1.21
|
0.45
|
116
|
| 2.66
|
7,383
|
1.25
|
0.36
|
|
1.25
|
0.36
|
124
|
| |
|
|
|
|
|
|
|
| 10.02
|
2,097
|
1.95
|
(0.07)
|
|
1.90
|
(0.02)
|
108
|
| 4.65
|
2,145
|
1.91
|
(0.39)
|
|
1.89
|
(0.37)
|
101
|
| 29.06
|
1,389
|
1.94
|
(0.39)
|
|
1.89
|
(0.34)
|
276
|
| 2.64
|
1,074
|
1.97
|
(0.32)
|
|
1.96
|
(0.31)
|
116
|
| 1.85
|
684
|
2.00
|
(0.38)
|
|
2.00
|
(0.38)
|
124
|
| |
|
|
|
|
|
|
|
| 11.13
|
18,567
|
0.95
|
0.93
|
|
0.90
|
0.98
|
108
|
| 5.74
|
48,569
|
0.91
|
0.63
|
|
0.89
|
0.65
|
101
|
| 30.31
|
45,599
|
0.94
|
0.61
|
|
0.89
|
0.66
|
276
|
| 3.69
|
37,597
|
0.97
|
0.69
|
|
0.96
|
0.70
|
116
|
| 2.88
|
34,615
|
1.00
|
0.63
|
|
1.00
|
0.63
|
124
|
| (a)
|
Per share Net
Investment Income (Loss) is calculated using the average daily shares method. |
| (b)
|
Total
return is the combination of changes in NAV without any sales charge, reinvested dividend income at NAV and reinvested capital gains distributions at NAV, if any. Total returns are not annualized. |
| (c)
|
After fee
waiver and/or expense reimbursement from the Adviser, where applicable. See Note 7 – Management Fees and Other Transactions with Affiliates, Management Fees for more information. |
| (d)
|
Portfolio
Turnover Rate is calculated based on the lesser of long-term purchases or sales (as disclosed in Note 4 – Portfolio Securities and Investment in Derivatives, Investment Transactions) divided by the average long-term market value
during the period. |
| *
|
Rounds to
less than $.01 per share. |
See accompanying notes to financial statements.
Financial Highlights (continued)
Small Cap Select
Selected data for a
share outstanding throughout each period:
| |
|
|
|
|
|
|
|
|
| |
|
|
|
|
|
|
|
|
| |
|
Investment
Operations |
|
Less
Distributions |
|
| Class
(Commencement Date) Year Ended October 31, |
Beginning
NAV |
Net
Investment
Income
(Loss)(a) |
Net
Realized/
Unrealized
Gain (Loss) |
Total
|
|
From
Net
Investment
Income |
From
Accumulated
Net Realized
Gains |
Total
|
Ending
NAV |
| Class
A (05/92) |
|
|
|
|
|
|
|
|
|
| 2019
|
$
9.26 |
$
—** |
$0.28
|
$0.28
|
|
$( —)***
|
$(1.83)
|
$(1.83)
|
$
7.71 |
| 2018
|
10.13
|
(0.01)
|
0.35
|
0.34
|
|
—
|
(1.21)
|
(1.21)
|
9.26
|
| 2017
|
9.21
|
(0.02)
|
1.97
|
1.95
|
|
(0.01)
|
(1.02)
|
(1.03)
|
10.13
|
| 2016
|
11.01
|
0.01
|
0.30
|
0.31
|
|
—
|
(2.11)
|
(2.11)
|
9.21
|
| 2015
|
14.48
|
(0.02)
|
0.37
|
0.35
|
|
—
|
(3.82)
|
(3.82)
|
11.01
|
| Class
C (09/01) |
|
|
|
|
|
|
|
|
|
| 2019
|
6.00
|
(0.03)
|
0.05
|
0.02
|
|
—
|
(1.83)
|
(1.83)
|
4.19
|
| 2018
|
7.02
|
(0.05)
|
0.24
|
0.19
|
|
—
|
(1.21)
|
(1.21)
|
6.00
|
| 2017
|
6.70
|
(0.06)
|
1.40
|
1.34
|
|
—
|
(1.02)
|
(1.02)
|
7.02
|
| 2016
|
8.64
|
(0.04)
|
0.21
|
0.17
|
|
—
|
(2.11)
|
(2.11)
|
6.70
|
| 2015
|
12.28
|
(0.08)
|
0.26
|
0.18
|
|
—
|
(3.82)
|
(3.82)
|
8.64
|
| Class
R3 (01/94) |
|
|
|
|
|
|
|
|
|
| 2019
|
8.37
|
(0.02)
|
0.22
|
0.20
|
|
—
|
(1.83)
|
(1.83)
|
6.74
|
| 2018
|
9.28
|
(0.03)
|
0.33
|
0.30
|
|
—
|
(1.21)
|
(1.21)
|
8.37
|
| 2017
|
8.53
|
(0.04)
|
1.81
|
1.77
|
|
—
|
(1.02)
|
(1.02)
|
9.28
|
| 2016
|
10.38
|
(0.01)
|
0.27
|
0.26
|
|
—
|
(2.11)
|
(2.11)
|
8.53
|
| 2015
|
13.91
|
(0.04)
|
0.33
|
0.29
|
|
—
|
(3.82)
|
(3.82)
|
10.38
|
| Class
R6 (02/18) |
|
|
|
|
|
|
|
|
|
| 2019
|
11.87
|
0.04
|
0.44
|
0.48
|
|
(0.03)
|
(1.83)
|
(1.86)
|
10.49
|
| 2018(e)
|
11.82
|
0.02
|
0.03
|
0.05
|
|
—
|
—
|
—
|
11.87
|
| Class
I (05/92) |
|
|
|
|
|
|
|
|
|
| 2019
|
11.85
|
0.03
|
0.44
|
0.47
|
|
(0.03)
|
(1.83)
|
(1.86)
|
10.46
|
| 2018
|
12.60
|
0.03
|
0.43
|
0.46
|
|
—
|
(1.21)
|
(1.21)
|
11.85
|
| 2017
|
11.24
|
0.01
|
2.40
|
2.41
|
|
(0.03)
|
(1.02)
|
(1.05)
|
12.60
|
| 2016
|
12.93
|
0.04
|
0.38
|
0.42
|
|
—
|
(2.11)
|
(2.11)
|
11.24
|
| 2015
|
16.30
|
0.02
|
0.43
|
0.45
|
|
—
|
(3.82)
|
(3.82)
|
12.93
|
| |
|
|
|
|
|
|
| |
Ratios/Supplemental
Data |
| |
|
Ratios
to Average
Net Assets Before
Waiver/Reimbursement |
|
Ratios
to Average
Net Assets After
Waiver/Reimbursement(c) |
|
Total
Return(b) |
Ending
Net
Assets
(000) |
Expenses
|
Net
Investment
Income
(Loss) |
|
Expenses
|
Net
Investment
Income
(Loss) |
Portfolio
Turnover
Rate(d) |
| |
|
|
|
|
|
|
|
| 6.95%
|
$55,849
|
1.42%
|
(0.17)%
|
|
1.24%
|
0.01%
|
70%
|
| 3.48
|
60,930
|
1.43
|
(0.24)
|
|
1.24
|
(0.06)
|
95
|
| 21.76
|
67,405
|
1.41
|
(0.24)
|
|
1.33
|
(0.16)
|
66
|
| 4.05
|
67,428
|
1.44
|
0.10
|
|
1.44
|
0.10
|
66
|
| 4.08
|
82,080
|
1.42
|
(0.14)
|
|
1.42
|
(0.14)
|
75
|
| |
|
|
|
|
|
|
|
| 6.09
|
1,029
|
2.17
|
(0.92)
|
|
1.99
|
(0.74)
|
70
|
| 2.78
|
1,436
|
2.18
|
(1.00)
|
|
1.99
|
(0.81)
|
95
|
| 20.75
|
4,913
|
2.16
|
(0.99)
|
|
2.09
|
(0.91)
|
66
|
| 3.37
|
5,625
|
2.19
|
(0.65)
|
|
2.19
|
(0.65)
|
66
|
| 3.19
|
8,036
|
2.17
|
(0.88)
|
|
2.17
|
(0.88)
|
75
|
| |
|
|
|
|
|
|
|
| 6.65
|
5,194
|
1.68
|
(0.42)
|
|
1.49
|
(0.24)
|
70
|
| 3.34
|
5,264
|
1.68
|
(0.50)
|
|
1.49
|
(0.31)
|
95
|
| 21.40
|
5,381
|
1.66
|
(0.49)
|
|
1.59
|
(0.41)
|
66
|
| 3.76
|
5,310
|
1.69
|
(0.12)
|
|
1.69
|
(0.12)
|
66
|
| 3.75
|
7,794
|
1.67
|
(0.38)
|
|
1.67
|
(0.38)
|
75
|
| |
|
|
|
|
|
|
|
| 7.22
|
2,070
|
1.03
|
0.17
|
|
0.85
|
0.36
|
70
|
| 0.42
|
6,532
|
1.03*
|
0.06*
|
|
0.85*
|
0.24*
|
95
|
| |
|
|
|
|
|
|
|
| 7.13
|
30,109
|
1.17
|
0.08
|
|
0.99
|
0.26
|
70
|
| 3.77
|
37,420
|
1.18
|
0.02
|
|
0.99
|
0.21
|
95
|
| 22.03
|
49,150
|
1.16
|
0.01
|
|
1.08
|
0.09
|
66
|
| 4.33
|
45,574
|
1.19
|
0.36
|
|
1.19
|
0.36
|
66
|
| 4.29
|
96,071
|
1.17
|
0.11
|
|
1.17
|
0.11
|
75
|
| (a)
|
Per share Net
Investment Income (Loss) is calculated using the average daily shares method. |
| (b)
|
Total
return is the combination of changes in NAV without any sales charge, reinvested dividend income at NAV and reinvested capital gains distributions at NAV, if any. Total returns are not annualized. |
| (c)
|
After fee
waiver and/or expense reimbursement from the Adviser, where applicable. See Note 7 – Management Fees and Other Transactions with Affiliates, Management Fees for more information. |
| (d)
|
Portfolio
Turnover Rate is calculated based on the lesser of long-term purchases or sales (as disclosed in Note 4 – Portfolio Securities and Investment in Derivatives, Investment Transactions) divided by the average long-term market value
during the period. |
| (e)
|
For the
period February 28, 2018 (commencement of operations) through October 31, 2018. |
| *
|
Annualized.
|
| **
|
Rounds to
less than $.01 per share. |
| ***
|
Rounds to
more than $(.01) per share. |
See accompanying notes to financial statements.
Notes to Financial Statements
1. General Information
Trust and Fund Information
Nuveen Investment Funds, Inc. (the “Trust”), is an
open-end management investment company registered under the Investment Company Act of 1940, as amended (the "1940 Act"). The Trust is comprised of Nuveen Large Cap Select Fund (“Large Cap Select”) and Nuveen Small Cap Select Fund
(“Small Cap Select”), (each a “Fund” and collectively, the “Funds”), as diversified funds, among others. The Trust was incorporated in the State of Maryland on August 20, 1987.
The end of the reporting period for the Funds is October 31,
2019, and the period covered by these Notes to Financial Statements is the fiscal year ended October 31, 2019 (the “current fiscal period”).
Investment Adviser
The Funds' investment adviser is Nuveen Fund Advisors, LLC (the
“Adviser”), a subsidiary of Nuveen, LLC (“Nuveen”). Nuveen is the investment management arm of Teachers Insurance and Annuity Association of America (TIAA). The Adviser has overall responsibility for management of the Funds,
oversees the management of the Funds' portfolios, manages the Funds' business affairs and provides certain clerical, bookkeeping and other administrative services, and, if necessary, asset allocation decisions. The Adviser has entered into
sub-advisory agreements with Nuveen Asset Management, LLC, (the “Sub-Adviser”), a subsidiary of the Adviser, under which the Sub-Adviser manages the investment portfolios of the Funds.
Share Classes and Sales Charges
Class A Shares are generally sold with an up-front sales charge
and incur a 0.25% annual 12b-1 service fee. Class A Share purchases of $1 million or more are sold at net asset value (“NAV”) without an up-front sales charge but may be subject to a contingent deferred sales charge (“CDSC”)
of 1% if redeemed within eighteen months of purchase. Class C Shares are sold without an up-front sales charge but incur a 0.75% annual 12b-1 distribution fee and a 0.25% annual 12b-1 service fee. Class C Shares are subject to a CDSC of 1% if
redeemed within twelve months of purchase. Class C Shares automatically convert to Class A Shares ten years after purchase. Class R3 Shares are sold without an up-front sales charge but incur a 0.25% annual 12b-1 distribution fee and a 0.25% annual
12b-1 service fee. Class R6 Shares and Class I Shares are not subject to any sales charge or 12b-1 distribution or service fees.
2. Significant Accounting Policies
The accompanying financial statements were prepared in
accordance with accounting principles generally accepted in the United States of America (“U.S. GAAP”), which may require the use of estimates made by management and the evaluation of subsequent events. Actual results may differ from
those estimates. Each Fund is an investment company and follows accounting guidance in the Financial Accounting Standards Board (“FASB”) Accounting Standards Codification 946, Financial Services—Investment Companies. The NAV for
financial reporting purposes may differ from the NAV for processing security and shareholder transactions. The NAV for financial reporting purposes includes security and shareholder transactions through the date of the report. Total return is
computed based on the NAV used for processing security and shareholder transactions. The following is a summary of the significant accounting policies consistently followed by the Funds.
Compensation
The Trust pays no compensation directly to those of its
directors who are affiliated with the Adviser or to its officers, all of whom receive remuneration for their services to the Trust from the Adviser or its affiliates. The Funds' Board of Directors (the "Board") has adopted a deferred compensation
plan for independent directors that enables directors to elect to defer receipt of all or a portion of the annual compensation they are entitled to receive from certain Nuveen-advised funds. Under the plan, deferred amounts are treated as though
equal dollar amounts had been invested in shares of select Nuveen-advised funds.
Distributions to Shareholders
Distributions to shareholders are recorded on the ex-dividend
date. The amount, character and timing of distributions are determined in accordance with federal income tax regulations, which may differ from U.S. GAAP.
Indemnifications
Under the Trust’s organizational documents, its officers
and trustees are indemnified against certain liabilities arising out of the performance of their duties to the Trust. In addition, in the normal course of business, the Trust enters into contracts that provide general indemnifications to other
parties. The Trust's maximum exposure under these arrangements is unknown as this would involve future claims that may be made against the Trust that have not yet occurred. However, the Trust has not had prior claims or losses pursuant to these
contracts and expects the risk of loss to be remote.
Investments and investment Income
Securities transactions are accounted for as of the trade date
for financial reporting purposes. Realized gains and losses on securities transactions are based upon the specific identification method. Dividend income is recorded on the ex-dividend date or, for certain foreign securities, when information is
available. Non-cash dividends received in the form of stock, if any, are recognized on the ex-dividend date and recorded at fair value. Interest income, which reflects the amortization of premiums and accretion of discounts for financial reporting
purposes and is recorded on an accrual basis. Interest income also reflects payment-in-kind ("PIK") interest and paydown gains and losses, if any. PIK interest represents income received in the form of securities in lieu of cash. Securities lending
income is comprised of fees earned from borrowers and income earned on cash collateral investments.
Multiclass Operations and Allocations
Income and expenses of the Funds that are not directly
attributable to a specific class of shares are prorated among the classes based on the relative net assets of each class. Expenses directly attributable to a class of shares are recorded to the specific class. Currently, the only expenses that are
allocated on a class-specific basis are 12b-1 distribution and service fees.
Sub-transfer agent fees and similar fees, which are recognized
as a component of "Shareholder servicing agent fees" on the Statement of Operations, are not charged to Class R6 Shares and are prorated among the other classes based on their relative net assets.
Realized and unrealized capital gains and losses of the Funds
are prorated among the classes based on the relative net assets of each class.
Netting Agreements
In the ordinary course of business, the Funds may enter into
transactions subject to enforceable International Swaps and Derivatives Association, Inc. (ISDA) master agreements or other similar arrangements (“netting agreements”). Generally, the right to offset in netting agreements allows each
Fund to offset certain securities and derivatives with a specific counterparty, when applicable, as well as any collateral received or delivered to that counterparty based on the terms of the agreements. Generally, each Fund manages its cash
collateral and securities collateral on a counterparty basis.
The Funds' investments subject to netting agreements as of the
end of the reporting period, if any, are further described in Note 4 - Portfolio Securities and Investments in Derivatives.
New Accounting Pronouncements and Rule Issuances
Fair Value Measurement: Disclosure Framework
During August 2018, the FASB issued Accounting Standards Update
("ASU") 2018-13 (“ASU 2018-13”), Fair Value Measurement: Disclosure Framework – Changes to the Disclosure Requirements for Fair Value Measurements. ASU 2018-13 modifies the
disclosures required by Topic 820, Fair Value Measurements. The amendments in ASU 2018-13 are effective for all entities for fiscal years, and interim periods within those fiscal years, beginning after
December 15, 2019. Management has early implemented this guidance and it did not have a material impact on the Funds' financial statements.
3. Investment Valuation and Fair Value
Measurements
The fair valuation input levels as described
below are for fair value measurement purposes.
The Funds'
investments in securities are recorded at their estimated fair value. Fair value is defined as the price that would be received upon selling an investment or transferring a liability in an orderly transaction to an independent buyer in the principal
or most advantageous market for the investment. A three-tier hierarchy is used to maximize the use of observable market data and minimize the use of unobservable inputs and to establish classification of fair value measurements for disclosure
purposes. Observable inputs reflect the assumptions market participants would use in pricing the asset or liability. Observable inputs are based on market data obtained from sources independent of the reporting entity. Unobservable inputs reflect
the reporting entity’s own assumptions about the assumptions market participants would use in pricing the asset or liability. Unobservable inputs are based on the best information available in the circumstances. The following is a summary of
the three-tiered hierarchy of valuation input levels.
Level 1
– Inputs are unadjusted and prices are determined using quoted prices in active markets for identical securities.
Level 2
– Prices are determined using other significant observable inputs (including quoted prices for similar securities, interest rates, credit spreads, etc.).
Level 3
– Prices are determined using significant unobservable inputs (including management’s assumptions in determining the fair value of investments).
Common stocks and other equity-type securities are valued at
the last sales price on the securities exchange on which such securities are primarily traded and are generally classified as Level 1. Securities primarily traded on the Nasdaq National Market ("Nasdaq") are valued at the Nasdaq Official Closing
Price and are generally classified as Level 1. However, securities traded on a securities exchange or Nasdaq for which there were no transac-
Notes to Financial Statements (continued)
tions on a given day or securities not listed on a securities exchange or
Nasdaq are valued at the quoted bid price and are generally classified as Level 2. Prices of certain American Depositary Receipts (“ADR”) held by the Funds that trade in the United States are valued based on the last traded price,
official closing price, or the most recent bid price of the underlying non-U.S.-traded stock, adjusted as appropriate for the underlying-to-ADR conversion ratio and foreign exchange rate, and from time-to-time may also be adjusted further to take
into account material events that may take place after the close of the local non-U.S. market but before the close of the New York Stock Exchange, which may represent a transfer from a Level 1 to a Level 2 security.
Investments in investment companies are valued at their
respective NAVs on the valuation date and are generally classified as Level 1
Certain securities may not be able to be priced by the
pre-established pricing methods as described above. Such securities may be valued by the Board and/or its appointee at fair value. These securities generally include, but are not limited to, restricted securities (securities which may not be
publicly sold without registration under the Securities Act of 1933, as amended) for which an independent pricing service ("pricing service") is unable to provide a market price; securities whose trading has been formally suspended; debt securities
that have gone into default and for which there is no current market quotation; a security whose market price is not available from a pre-established pricing source; a security with respect to which an event has occurred that is likely to materially
affect the value of the security after the market has closed but before the calculation of a Fund’s NAV (as may be the case in non-U.S. markets on which the security is primarily traded) or make it difficult or impossible to obtain a reliable
market quotation; and a security whose price, as provided by the pricing service, is not deemed to reflect the security’s fair value. As a general principle, the fair value of a security would appear to be the amount that the owner might
reasonably expect to receive for it in a current sale. A variety of factors may be considered in determining the fair value of such securities, which may include consideration of the following: yields or prices of investments of comparable quality,
type of issue, coupon, maturity and rating, market quotes or indications of value from security dealers, evaluations of anticipated cash flows or collateral, general market conditions and other information and analysis, including the obligor’s
credit characteristics considered relevant. These securities are generally classified as Level 2 or Level 3 depending on the observability of the significant inputs. Regardless of the method employed to value a particular security, all valuations
are subject to review by the Board and/or its appointee.
The inputs or methodologies used for valuing securities are not
an indication of the risks associated with investing in those securities. The following is a summary of each Fund’s fair value measurements as of the end of the reporting period:
| Large
Cap Select |
Level
1 |
Level
2 |
Level
3 |
Total
|
| Long-Term
Investments*: |
|
|
|
|
| Common
Stocks |
$44,909,490
|
$ —
|
$ —
|
$44,909,490
|
| Short-Term
Investments: |
|
|
|
|
| Money
Market Funds |
90,718
|
—
|
—
|
90,718
|
| Total
|
$45,000,208
|
$ —
|
$ —
|
$45,000,208
|
| Small
Cap Select |
Level
1 |
Level
2 |
Level
3 |
Total
|
| Long-Term
Investments*: |
|
|
|
|
| Common
Stocks |
$92,857,444
|
$ —
|
$ —
|
$92,857,444
|
| Investments
Purchased with Collateral from Securities Lending |
2,510,807
|
—
|
—
|
2,510,807
|
| Short-Term
Investments: |
|
|
|
|
| Money
Market Funds |
1,219,897
|
—
|
—
|
1,219,897
|
| Total
|
$96,588,148
|
$ —
|
$ —
|
$96,588,148
|
| *
|
Refer
to the Fund's Portfolio of Investments for industry classifications. |
4. Portfolio Securities and Investments in
Derivatives
Securities Lending
In order to generate additional income, the Funds may lend
securities representing up to one-third of the value of its total assets (which includes collateral for securities on loan) to broker-dealers, banks or other institutions. When loaning securities, each Fund retains the benefits of owning the
securities, including the economic equivalent of dividends or interest generated by the security. The Funds also have the ability to recall the securities on loan at any time.
Each Fund’s policy is to receive, at the inception of a
loan, cash collateral equal to at least 102% of the value of securities loaned, which is recognized as “Payable for collateral from securities lending program” on the Statement of Assets and Liabilities. Collateral for securities on loan
is invested in a money market fund, which is recognized as “Investments purchased with collateral from securities lending, at value” on the Statement of Assets and Liabilities. The market value of the securities loaned is determined at
the close of each business day in order to determine the adequacy of the collateral. If the value of the securities on loan increases such that the level of collateralization falls below 100%, additional collateral is received from the borrower on
the next business day, which is recognized as “Due from broker” on the Statement of Assets and Liabilities.
Securities out on loan are subject to termination at any time at the option of
the borrower or the Fund. Upon termination, the borrower is required to return to the Fund securities identical to the securities loaned. Generally, in the event the borrower defaults on its obligation to return the loaned securities, the Fund has
the right to use the collateral to acquire identical securities. In the event the Fund is delayed or prevented from exercising its right to dispose of the collateral, there may be a loss to the Fund. Under the Funds’ securities lending
agreement, however, the securities lending agent has indemnified the Fund against losses resulting from borrower default, except to the extent that those losses result from a decrease in the value of the collateral due to its investment by the
Funds. The Funds bear the risk of loss with respect to the investment of collateral.
The Funds’ custodian, U.S. Bank National Association,
serves as their securities lending agent. Income earned from the securities lending program is paid to the Funds. Income from securities lending, is recognized as “Securities lending income” on the Statement of Operations.
The following table presents the securities out on loan for the
following Fund, and the collateral delivered related to those securities, as of the end of the reporting period.
| Fund
|
Asset
Class out on Loan |
Long-Term
Investments, at Value |
Collateral
Pledged (From)
Counterparty* |
Net
Exposure |
| Small
Cap Select |
Common
Stocks |
$2,396,622
|
$(2,396,622)
|
$ —
|
* As of the end of the reporting
period, the value of the collateral pledged from the counterparty exceeded the value of the securities out on loan. Refer to the Fund’s Portfolio of Investments for details on the securities out on loan.
Investment Transactions
Long-term purchases and sales (excluding investments purchased
with collateral from securities lending, where applicable) during the current fiscal period were as follows:
| |
Large
Cap
Select |
Small
Cap
Select |
| Purchases
|
$
70,457,279 |
$69,985,312
|
| Sales
|
103,649,936
|
93,185,575
|
Investments in Derivatives
Each Fund is authorized to invest in certain derivative
instruments. The Funds record derivative instruments at fair value, with changes in fair value recognized on the Statement of Operations, when applicable. Even though the Funds’ investments in derivatives may represent economic hedges, they
are not considered to be hedge transactions for financial reporting purposes.
Although the Funds are authorized to invest in derivative
instruments, and may do so in the future, they did not make any such investments during the current fiscal period.
Market and Counterparty Credit Risk
In the normal course of business each Fund may invest in
financial instruments and enter into financial transactions where risk of potential loss exists due to changes in the market (market risk) or failure of the other party to the transaction to perform (counterparty credit risk). The potential loss
could exceed the value of the financial assets recorded on the financial statements. Financial assets, which potentially expose each Fund to counterparty credit risk, consist principally of cash due from counterparties on forward, option and swap
transactions, when applicable. The extent of each Fund’s exposure to counterparty credit risk in respect to these financial assets approximates their carrying value as recorded on the Statement of Assets and Liabilities.
Each Fund helps manage counterparty credit risk by entering
into agreements only with counterparties the Adviser believes have the financial resources to honor their obligations and by having the Adviser monitor the financial stability of the counterparties. Additionally, counterparties may be required to
pledge collateral daily (based on the daily valuation of the financial asset) on behalf of each Fund with a value approximately equal to the amount of any unrealized gain above a pre-determined threshold. Reciprocally, when each Fund has an
unrealized loss, the Funds have instructed the custodian to pledge assets of the Funds as collateral with a value approximately equal to the amount of the unrealized loss above a pre-determined threshold. Collateral pledges are monitored and
subsequently adjusted if and when the valuations fluctuate, either up or down, by at least the pre-determined threshold amount.
Notes to Financial Statements (continued)
5. Fund Shares
Transactions in Fund shares during the current and prior fiscal
period were as follows:
| |
Year
Ended
10/31/19 |
|
Year
Ended
10/31/18 |
| Large
Cap Select |
Shares
|
Amount
|
|
Shares
|
Amount
|
| Shares
sold: |
|
|
|
|
|
| Class
A |
177,515
|
$
4,930,221 |
|
490,873
|
$
14,638,432 |
| Class
A – automatic conversion of Class C Shares |
486
|
13,884
|
|
3,810
|
113,047
|
| Class
C |
24,930
|
643,351
|
|
44,357
|
1,217,285
|
| Class
I |
120,055
|
3,340,757
|
|
458,551
|
13,905,115
|
| Shares
issued to shareholders due to reinvestment of distributions: |
|
|
|
|
|
| Class
A |
32,369
|
835,988
|
|
2,430
|
70,008
|
| Class
C |
3,148
|
75,284
|
|
—
|
—
|
| Class
I |
60,673
|
1,578,897
|
|
8,728
|
253,115
|
| |
419,176
|
11,418,382
|
|
1,008,749
|
30,197,002
|
| Shares
redeemed: |
|
|
|
|
|
| Class
A |
(219,203)
|
(6,275,373)
|
|
(236,809)
|
(7,146,287)
|
| Class
C |
(33,536)
|
(894,697)
|
|
(14,469)
|
(406,612)
|
| Class
C – automatic conversion to Class A Shares |
(526)
|
(13,884)
|
|
(4,099)
|
(113,047)
|
| Class
I |
(1,248,745)
|
(36,157,769)
|
|
(443,753)
|
(13,543,948)
|
| |
(1,502,010)
|
(43,341,723)
|
|
(699,130)
|
(21,209,894)
|
| Net
increase (decrease) |
(1,082,834)
|
$(31,923,341)
|
|
309,619
|
$
8,987,108 |
| |
Year
Ended
10/31/19 |
|
Year
Ended
10/31/18 |
| Small
Cap Select |
Shares
|
Amount
|
|
Shares
|
Amount
|
| Shares
sold: |
|
|
|
|
|
| Class
A |
482,537
|
$
3,499,928 |
|
730,822
|
$
7,286,992 |
| Class
A – automatic conversion of Class C Shares |
1,287
|
10,280
|
|
13,328
|
135,169
|
| Class
C |
43,704
|
181,629
|
|
102,695
|
653,752
|
| Class
R3 |
256,759
|
1,677,173
|
|
136,209
|
1,201,053
|
| Class
R6(1) |
202,682
|
2,051,384
|
|
672,638
|
7,950,581
|
| Class
I |
843,491
|
8,404,771
|
|
587,441
|
7,509,894
|
| Shares
issued to shareholders due to reinvestment of distributions: |
|
|
|
|
|
| Class
A |
1,813,633
|
11,697,567
|
|
853,337
|
7,825,098
|
| Class
C |
119,270
|
421,025
|
|
136,617
|
816,971
|
| Class
R3 |
201,838
|
1,140,383
|
|
84,805
|
704,732
|
| Class
R6(1) |
117,392
|
1,031,249
|
|
—
|
—
|
| Class
I |
545,179
|
4,778,442
|
|
348,633
|
4,082,497
|
| |
4,627,772
|
34,893,831
|
|
3,666,525
|
38,166,739
|
| Shares
redeemed: |
|
|
|
|
|
| Class
A |
(1,629,812)
|
(12,135,488)
|
|
(1,674,637)
|
(16,498,345)
|
| Class
C |
(154,537)
|
(622,536)
|
|
(679,246)
|
(4,428,929)
|
| Class
C – automatic conversion to Class A Shares |
(2,231)
|
(10,280)
|
|
(20,540)
|
(135,169)
|
| Class
R3 |
(316,677)
|
(2,085,951)
|
|
(171,553)
|
(1,526,690)
|
| Class
R6(1) |
(673,304)
|
(6,773,557)
|
|
(122,135)
|
(1,595,000)
|
| Class
I |
(1,668,575)
|
(16,943,602)
|
|
(1,006,854)
|
(12,644,759)
|
| Class
I – exchanges |
—
|
—
|
|
(672,638)
|
(7,950,581)
|
| |
(4,445,136)
|
(38,571,414)
|
|
(4,347,603)
|
(44,779,473)
|
| Net
increase (decrease) |
182,636
|
$
(3,677,583) |
|
(681,078)
|
$
(6,612,734) |
| (1)
|
Class R6
Shares were established on February 28, 2018. |
6. Income Tax Information
Each Fund is a separate taxpayer for federal income tax
purposes. Each Fund intends to distribute substantially all of its net investment income and net capital gains to shareholders and to otherwise comply with the requirements of Subchapter M of the Internal Revenue Code applicable to regulated
investment companies. Therefore, no federal income tax provision is required.
For all open tax years and all major taxing jurisdictions,
management of the Funds has concluded that there are no significant uncertain tax positions that would require recognition in the financial statements. Open tax years are those that are open for examination by taxing authorities (i.e., generally the
last four tax year ends and the interim tax period since then). Furthermore, management of the Funds is also not aware of any tax positions for which it is reasonably possible that the total amounts of unrecognized tax benefits will significantly
change in the next twelve months.
The following information is presented on an income tax basis. Differences
between amounts for financial statement and federal income tax purposes are primarily due to timing differences in recognizing certain gains and losses on investment transactions. To the extent that differences arise that are permanent in nature,
such amounts are reclassified within the capital accounts as detailed below. Temporary differences do not require reclassification. Temporary and permanent differences do not impact the NAVs of the Funds.
The table below presents the cost and unrealized appreciation
(depreciation) of each Fund's investment portfolio, as determined on a federal income tax basis, as of October 31, 2019.
| |
Large
Cap
Select |
Small
Cap
Select |
| Tax
cost of investments |
$39,175,713
|
$85,189,281
|
| Gross
unrealized: |
|
|
| Appreciation
|
$
6,225,135 |
$13,974,394
|
| Depreciation
|
(400,640)
|
(2,575,527)
|
| Net
unrealized appreciation (depreciation) of investments |
$
5,824,495 |
$11,398,867
|
Permanent differences, primarily
due to federal taxes paid and distribution reallocations, resulted in reclassifications among the Funds' components of net assets as of October 31, 2019, the Funds' tax year end.
The tax components of undistributed net ordinary income and net
long-term capital gains as of October 31, 2019, the Funds' tax year end, were as follows:
| |
Large
Cap
Select |
Small
Cap
Select |
| Undistributed
net ordinary income1 |
$512,223
|
$62,715
|
| Undistributed
net long-term capital gains |
—
|
—
|
|
1 |
Net ordinary
income consists of net taxable income derived from dividends, interest, and net short-term capital gains, if any. |
The tax character of distributions paid during the
Funds’ tax years ended October 31, 2019 and October 31, 2018 was designated for purposes of the dividends paid deduction as follows:
| 2019
|
Large
Cap
Select |
Small
Cap
Select |
| Distributions
from net ordinary income1 |
$2,753,146
|
$
5,582,744 |
| Distributions
from net long-term capital gains2 |
132,037
|
14,276,940
|
| 2018
|
Large
Cap
Select |
Small
Cap
Select |
| Distributions
from net ordinary income1 |
$407,060
|
$6,542,236
|
| Distributions
from net long-term capital gains |
—
|
7,519,972
|
|
1 |
Net ordinary
income consists of net taxable income derived from dividends, interest, and net short-term capital gains, if any. |
|
2 |
The
Funds designate as long-term capital gain dividend, pursuant to the Internal Revenue Code 852(b)(3), the amount necessary to reduce earnings and profits of the Funds related to net capital gain to zero for the tax year ended October 31, 2019.
|
As of October 31, 2019, the Funds'
tax year end, the Funds had unused capital losses carrying forward available for federal income tax purposes to be applied against future capital gains, if any. The capital losses are not subject to expiration.
| |
Large
Cap
Select |
Small
Cap
Select |
| Not
subject to expiration: |
|
|
| Short-term
|
$328,832
|
$263,821
|
| Long-term
|
527,111
|
419,464
|
| Total
|
$855,943
|
$683,285
|
7. Management Fees and
Other Transactions with Affiliates
Management Fees
Each Fund’s management fee compensates the Adviser for
the overall investment advisory and administrative services and general office facilities. The Sub-Adviser is compensated for its services to the Funds from the management fees paid to the Adviser.
Notes to Financial Statements (continued)
Each Fund’s management fee consists of two components
– a fund-level fee, based only on the amount of assets within each individual Fund, and a complex-level fee, based on the aggregate amount of all eligible fund assets managed by the Adviser. This pricing structure enables each
Fund’s shareholders to benefit from growth in the assets within their respective Fund as well as from growth in the amount of complex-wide assets managed by the Adviser.
The annual fund-level fee, payable monthly, for each Fund is
calculated according to the following schedule:
| Average
Daily Net Assets |
Large
Cap
Select |
Small
Cap
Select |
| For
the first $125 million |
0.5000%
|
0.6500%
|
| For
the next $125 million |
0.4875
|
0.6375
|
| For
the next $250 million |
0.4750
|
0.6250
|
| For
the next $500 million |
0.4625
|
0.6125
|
| For
the next $1 billion |
0.4500
|
0.6000
|
| For
the next $3 billion |
0.4250
|
0.5750
|
| For
the next $2.5 billion |
0.4000
|
0.5500
|
| For
the next $2.5 billion |
0.3875
|
0.5375
|
| For
net assets over $10 billion |
0.3750
|
0.5250
|
The annual complex-level fee,
payable monthly, for each Fund is determined by taking the complex-level fee rate, which is based on the aggregate amount of "eligible assets" of all Nuveen funds as set forth in the schedule below, and making, as appropriate, an upward adjustment
to that rate based upon the percentage of the particular fund's assets that are not "eligible assets". The complex-level fee schedule for each Fund is as follows:
| Complex-Level
Eligible Asset Breakpoint Level* |
Effective
Complex-Level Fee Rate at Breakpoint Level |
| $55
billion |
0.2000%
|
| $56
billion |
0.1996
|
| $57
billion |
0.1989
|
| $60
billion |
0.1961
|
| $63
billion |
0.1931
|
| $66
billion |
0.1900
|
| $71
billion |
0.1851
|
| $76
billion |
0.1806
|
| $80
billion |
0.1773
|
| $91
billion |
0.1691
|
| $125
billion |
0.1599
|
| $200
billion |
0.1505
|
| $250
billion |
0.1469
|
| $300
billion |
0.1445
|
*
The complex-level fee is calculated based upon the aggregate daily “eligible assets” of all Nuveen open-end and closed-end funds. Eligible assets do not include assets attributable to investments in other Nuveen
funds or assets in excess of a determined amount (originally $2 billion) added to the Nuveen fund complex in connection with the Adviser’s assumption of the management of the former First American Funds effective January 1, 2011, but do
include certain assets of certain Nuveen funds that were reorganized into funds advised by an affiliate of the Adviser during the 2019 calendar year. Eligible assets include closed-end fund assets managed by the Adviser that are attributable to
certain types of leverage. For these purposes, leverage includes the closed-end funds’ use of preferred stock and borrowings and certain investments in the residual interest certificates (also called inverse floating rate securities) in tender
option bond (TOB) trusts, including the portion of assets held by a TOB trust that has been effectively financed by the trust’s issuance of floating rate securities, subject to an agreement by the Adviser as to certain funds to limit the
amount of such assets for determining eligible assets in certain circumstances. As of October 31, 2019, the complex-level fee rate for each Fund was 0.2000%.
The Adviser has agreed to waive fees and/or reimburse expenses
(“Expense Cap”) of each Fund so that total annual Fund operating expenses (excluding 12b-1 distribution and/or service fees, interest expenses, taxes, acquired fund fees and expenses, fees incurred in acquiring and disposing of portfolio
securities and extraordinary expenses) do not exceed the average daily net assets of any class of Fund shares in the amounts and for the time period stated in the following table. However, because Class R6 Shares are not subject to sub-transfer
agent and similar fees, the total annual fund operating expenses for the Class R6 Shares will not be less than the expense limitation. The expense limitation in effect thereafter may be terminated or modified only with the approval of the
Board.
| Fund
|
Expense
Cap |
Expense
Cap
Expiration Date |
| Large
Cap Select |
0.89%
|
July
31, 2021 |
| Small
Cap Select |
0.99
|
July
31, 2021 |
Other Transactions with Affiliates
During the current fiscal period, Nuveen Securities, LLC, (the
“Distributor”), a wholly-owned subsidiary of Nuveen, collected sales charges on purchases of Class A Shares, the majority of which were paid out as concessions to financial intermediaries as follows:
| |
Large
Cap
Select |
Small
Cap
Select |
| Sales
charges collected (Unaudited) |
$12,783
|
$14,749
|
| Paid
to financial intermediaries (Unaudited) |
11,666
|
13,072
|
The Distributor also received 12b-1
service fees on Class A Shares, substantially all of which were paid to compensate financial intermediaries for providing services to shareholders relating to their investments.
During the current fiscal period, the Distributor compensated
financial intermediaries directly with commission advances at the time of purchase as follows:
| |
Large
Cap
Select |
Small
Cap
Select |
| Commission
advances (Unaudited) |
$7,263
|
$1,768
|
To compensate for commissions
advanced to financial intermediaries, all 12b-1 service and distribution fees collected on Class C Shares during the first year following a purchase are retained by the Distributor. During the current fiscal period, the Distributor retained such
12b-1 fees as follows:
| |
Large
Cap
Select |
Small
Cap
Select |
| 12b-1
fees retained (Unaudited) |
$7,442
|
$1,504
|
The remaining 12b-1 fees charged to
each Fund were paid to compensate financial intermediaries for providing services to shareholders relating to their investments.
The Distributor also collected and retained CDSC on share
redemptions during the current fiscal period, as follows:
| |
Large
Cap
Select |
Small
Cap
Select |
| CDSC
retained (Unaudited) |
$ —
|
$1,743
|
8. Borrowing
Arrangements
Committed Line of Credit
The Funds, along with certain other funds managed by the
Adviser (“Participating Funds”), have established a 364-day, $2.65 billion standby credit facility with a group of lenders, under which the Participating Funds may borrow for various purposes other than leveraging for investment
purposes. Each Participating Fund is allocated a designated proportion of the facility’s capacity (and its associated costs, as described below) based upon a multi-factor assessment of the likelihood and frequency of its need to draw on the
facility, the size of the Fund and its anticipated draws, and the potential importance of such draws to the operations and well-being of the Fund, relative to those of the other Funds. A Fund may effect draws on the facility in excess of its
designated capacity if and to the extent that other Participating Funds have undrawn capacity. The credit facility expires in June 2020 unless extended or renewed.
The credit facility has the following terms: a fee of 0.15% per
annum on unused commitment amounts, and interest at a rate equal to the higher of (a) one-month LIBOR (London Inter-Bank Offered Rate) plus 1.00% per annum or (b) the Fed Funds rate plus 1.00% per annum on amounts borrowed. Participating Funds paid
administration, legal and arrangement fees, which are recognized as a component of “Other expenses” on the Statement of Operations, and along with commitment fees, have been allocated among such Participating Funds based upon the
relative proportions of the facility’s aggregate capacity reserved for them and other factors deemed relevant by the Adviser and the Board of each Participating Fund.
During the current fiscal period, none of the Funds utilized
this facility.
Additional Fund Information
(Unaudited)
Fund Manager
Nuveen Fund Advisors, LLC
333 West Wacker Drive
Chicago, IL 60606
Sub-Adviser
Nuveen Asset Management, LLC
333 West Wacker Drive
Chicago, IL 60606
Independent Registered
Public Accounting Firm
PricewaterhouseCoopers LLP
One North Wacker Drive
Chicago, IL 60606
Custodian
U.S. Bank National Association
1555 North RiverCenter Drive
Suite 302
Milwaukee, WI 53212
Legal Counsel
Chapman and Cutler LLP
Chicago, IL 60603
Transfer Agent and
Shareholder Services
DST Asset Manager
Solutions, Inc. (DST)
P.O. Box 219140
Kansas City, MO 64121-9140
(800) 257-8787
Distribution Information: The Funds hereby designate their percentages of dividends paid from net ordinary income as dividends qualifying for the dividends received deduction (“DRD”) for corporations and their percentages as
qualified dividend income (“QDI”) for individuals under Section 1(h)(11) of the Internal Revenue Code as shown in the accompanying table. The actual qualified dividend income distributions will be reported to shareholders on Form
1099-DIV which will be sent to shareholders shortly after calendar year end.
| |
Large
Cap
Select |
Small
Cap
Select |
| %
of DRD |
39.1%
|
16.3%
|
| %
of QDI |
39.0%
|
16.2%
|
Portfolio of Investments
Information: Each Fund is required to file its complete schedule of portfolio holdings with the Securities and Exchange Commission (SEC) for the first and third quarters of each fiscal year as an exhibit to its
report on Form N-PORT. You may obtain this information on the SEC's website at http://www.sec.gov.
Nuveen Funds’ Proxy Voting Information: You may obtain (i) information regarding how each Fund voted proxies relating to portfolio securities held during the most recent twelve-month period ended June 30, without charge, upon request by calling Nuveen
toll-free at (800) 257-8787 or Nuveen's website at www.nuveen.com and (ii) a description of the policies and procedures that each Fund used to determine how to vote proxies relating to portfolio securities without charge, upon request, by calling
Nuveen toll-free at (800) 257-8787. You may also obtain this information directly from the SEC. Visit the SEC on-line at http://www.sec.gov.
FINRA BrokerCheck:
The Financial Industry Regulatory Authority (FINRA) provides information regarding the disciplinary history of FINRA member firms and associated investment professionals. This information as well as an investor brochure describing FINRA BrokerCheck
is available to the public by calling the FINRA BrokerCheck Hotline number at (800) 289-9999 or by visiting www.FINRA.org.
Glossary of Terms Used in this Report
(Unaudited)
Average
Annual Total Return: This is a commonly used method to express an investment’s performance over a particular, usually multi-year time period. It expresses the return that would have been necessary each year to
equal the investment’s actual cumulative performance (including change in NAV or offer price and reinvested distributions and capital gains, if any) over the time period being considered.
Gross Domestic Product (GDP):
The total market value of all final goods and services produced in a country/region in a given year, equal to total consumer, investment and government spending, plus the value of exports, minus the value of
imports.
Lipper Large-Cap Core Funds
Classification Average: Represents the average annualized total return for all reporting funds in the Lipper Large-Cap Core Funds Classification. Lipper returns account for the effects of management fees and assume
reinvestment of distributions but do not reflect any applicable sales charges.
Lipper Small-Cap Core Funds Classification Average: Represents the average annualized total return for all reporting funds in the Lipper Small-Cap Core Funds Classification. Lipper returns account for the effects of management fees and assume reinvestment of
distributions but do not reflect any applicable sales charges.
Market Capitalization: The
market capitalization of a company is equal to the number of the company’s common shares outstanding multiplied by the current price of the company’s stock.
MSCI EAFE Index: The MSCI
(Morgan Stanley Capital International) EAFE (Europe, Australasia, Far East) Index is a free float-adjusted market capitalization weighted index designed to measure developed market equity performance, excluding the U.S. and Canada. The index returns
assume reinvestment of distributions, but do not reflect any applicable sales charges or management fees.
MSCI Emerging Markets Index:
The MSCI (Morgan Stanley Capital International) Emerging Markets Index is an unmanaged index considered representative of stocks of developing countries. The index returns assume reinvestment of distributions, but
do not reflect any applicable sales charges or management fees.
Net Asset Value (NAV) Per Share: A fund’s Net Assets is equal to its total assets (securities, cash and accrued earnings) less its total liabilities. For funds with multiple classes, Net Assets are determined separately for each share class. NAV
per share is equal to the fund’s (or share class’) Net Assets divided by its number of shares outstanding.
Russell 2000® Index: An index that measures the performance of the small-cap segment of the U.S. equity universe. The Russell 2000
Index is a subset of the Russell 3000® Index representing approximately 10% of the total market capitalization of that index. It includes
approximately 2,000 of the smallest securities based on a combination of their market cap and current index membership. The Russell 3000® Index
measures the performance of the 3,000 largest companies based on total market capitalization, which represents approximately 98% of the investable U.S. equity market. The index returns assume reinvestment of distributions, but do not reflect any
applicable sales charges or management fees.
S&P 500®: An unmanaged index generally considered representative of the U.S. stock market. The index returns assume
reinvestment of distributions, but do not reflect any applicable sales charges or management fees.
Glossary of Terms Used in this Report (Unaudited) (continued)
Tax Equalization: The
practice of treating a portion of the distribution made to a redeeming shareholder, which represents his proportionate part of undistributed net investment income and capital gain as a distribution for tax purposes. Such amounts are referred to as
the equalization debits (or payments) and will be considered a distribution to the shareholder of net investment income and capital gain for calculation of the fund’s dividends paid deduction.
Annual Investment Management Agreement Approval
Process
(Unaudited)
At a
meeting held on May 21-23, 2019 (the “May Meeting”), the Board of Directors (the “Board” and each Director, a “Board Member”) of the Funds, including the Board Members who are not “interested persons”
(as defined under the Investment Company Act of 1940 (the “1940 Act”)) (the “Independent Board Members”), approved, for each Fund, the renewal of the management agreement (each, an “Investment Management
Agreement”) with Nuveen Fund Advisors, LLC (the “Adviser”) pursuant to which the Adviser serves as investment adviser to such Fund and the sub-advisory agreement (each, a “Sub-Advisory Agreement”) with Nuveen Asset
Management, LLC (the “Sub-Adviser”) pursuant to which the Sub- Adviser serves as the sub-adviser to such Fund. Following an initial two-year period, the Board, including the Independent Board Members, is required under the 1940 Act to
review and approve each Investment Management Agreement and Sub-Advisory Agreement on behalf of the applicable Fund on an annual basis. The Investment Management Agreements and Sub-Advisory Agreements are collectively referred to as the
“Advisory Agreements” and the Adviser and the Sub-Adviser are collectively, the “Fund Advisers” and each, a “Fund Adviser.”
In response to a request on behalf of the Independent Board
Members by independent legal counsel, the Board received and reviewed prior to the May Meeting extensive materials specifically prepared for the annual review of Advisory Agreements by the Adviser as well as by Broadridge Financial Solutions, Inc.
(“Broadridge”), an independent provider of investment company data. The materials provided in connection with the annual review covered a breadth of subject matter including, but not limited to, a description of the nature, extent and
quality of services provided by the Fund Advisers; a review of the Sub-Adviser and investment team; an analysis of fund performance in absolute terms and as compared to the performance of certain peer funds and benchmarks with a focus on any
performance outliers; an analysis of the fees and expense ratios of the Nuveen funds in absolute terms and as compared to those of certain peer funds with a focus on any expense outliers; a description of portfolio manager compensation; a review of
the performance of various service providers; a description of various initiatives Nuveen had undertaken or continued during the year for the benefit of particular fund(s) and/or the complex; a description of the profitability or financial data of
Nuveen and the Sub-Adviser; and a description of indirect benefits received by the Fund Advisers as a result of their relationships with the Nuveen funds. The Board Members held an in-person meeting on April 17-18, 2019 (the “April
Meeting”), in part, to review and discuss the performance of the Nuveen funds and the Adviser’s evaluation of the various sub-advisers to the Nuveen funds. The Independent Board Members asked questions and requested additional
information that was provided for the May Meeting.
The
information prepared specifically for the annual review of the Advisory Agreements supplemented the information provided to the Board and its committees throughout the year. The Board and its committees met regularly during the year and the
information provided and topics discussed were relevant to the review of the Advisory Agreements. Some of these reports and other data included, among other things, materials that outlined the investment performance of the Nuveen funds; strategic
plans of the Adviser which may impact the services it provides to the Nuveen funds; the review of the Nuveen funds and applicable investment teams; compliance, regulatory and risk management matters; the trading practices of the various
sub-advisers; valuation of securities; fund expenses; payments to financial intermediaries, including 12b-1 fees and sub-transfer agency fees; and overall market and regulatory developments. The Board further continued its practice of seeking to
meet periodically with the various sub-advisers to the Nuveen funds and their investment teams, when feasible. The Independent Board Members considered the review of the Advisory Agreements to be an ongoing process and employed the accumulated
information, knowledge, and experience the Board Members had gained during their tenure on the boards governing the Nuveen funds and working with the Fund Advisers in their review of the Advisory Agreements. The contractual arrangements are a result
of multiple years of review, negotiation and information provided in connection with the boards’ annual review of the Nuveen funds’ advisory arrangements and oversight of the Nuveen funds.
The Independent Board Members were advised by independent legal
counsel during the annual review process as well as throughout the year, including meeting in executive sessions with such counsel at which no representatives from the Adviser or the Sub-Adviser were present. In connection with their annual review,
the Independent Board Members also received a memorandum from independent legal counsel outlining their fiduciary duties and legal standards in reviewing the Advisory Agreements.
Annual Investment Management Agreement Approval Process (Unaudited) (continued)
In deciding to renew the Advisory Agreements, the Independent
Board Members did not identify a particular factor or information as determinative or controlling, but rather the decision reflected the comprehensive consideration of all the information provided, and each Board Member may have attributed different
levels of importance to the various factors and information considered in connection with the approval process. The following summarizes the principal factors and information, but not all the factors, the Board considered in deciding to renew the
Advisory Agreements and its conclusions.
A. Nature,
Extent and Quality of Services
In evaluating the renewal
of the Advisory Agreements, the Independent Board Members received and considered information regarding the nature, extent and quality of the applicable Fund Adviser’s services provided to the respective Fund with particular focus on the
services and enhancements to such services provided during the last year. The Board recognized that the Adviser provides a comprehensive set of services necessary to operate the Nuveen funds in a highly regulated industry and noted that the scope of
such services has expanded over the years as a result of regulatory, market and other developments, such as the development of the liquidity management program and expanded compliance programs. Some of the functions the Adviser is responsible for
include, but are not limited to: product management (such as analyzing a fund’s position in the marketplace, setting dividends, preparing shareholder and intermediary communications and other due diligence support); investment oversight (such
as analyzing fund performance, sub-advisers and investment teams and analyzing trade executions of portfolio transactions, soft dollar practices and securities lending activities); securities valuation services (such as executing the daily valuation
process for portfolio securities and developing and recommending changes to valuation policies and procedures); risk management (such as overseeing operational and investment risks, including stress testing); fund administration (such as preparing
fund tax returns and other tax compliance services, overseeing the Nuveen funds’ independent public accountants and other service providers; managing fund budgets and expenses; and helping to fulfill the funds’ regulatory filing
requirements); oversight of shareholder services and transfer agency functions (such as oversight and liaison of transfer agent service providers which include registered shareholder customer service and transaction processing); Board relations
services (such as organizing and administering Board and committee meetings, preparing various reports to the Board and committees and providing other support services); compliance and regulatory oversight services (such as developing and
maintaining a compliance program to ensure compliance with applicable laws and regulations, monitoring compliance with applicable fund policies and procedures and adherence to investment restrictions, and evaluating the compliance programs of the
Nuveen fund sub-advisers and certain other service providers); and legal support and oversight of outside law firms (such as with respect to filing and updating registration statements; maintaining various regulatory registrations; and providing
legal interpretations regarding fund activities, applicable regulations and implementation of policies and procedures). In reviewing the scope and quality of services, the Board recognized the continued efforts and resources the Adviser and its
affiliates have employed to continue to enhance their services for the benefit of the complex as well as particular Nuveen funds over recent years. Such service enhancements have included, but are not limited to:
| •
|
Fund
Improvements and Product Management Initiatives – continuing to proactively manage the Nuveen fund complex as a whole and at the individual fund level with an aim to enhance the shareholder outcomes through, among other things,
repositioning funds, merging funds, introducing additional share classes, reviewing and updating investment policies and benchmarks, modifying the composition of certain portfolio management teams and analyzing various data to help devise such
improvements; |
| •
|
Capital
Initiatives – continuing to invest capital to support new funds with initial capital as well as to facilitate modifications to the strategies or structure of existing funds; |
| •
|
Compliance
Program Initiatives – continuing efforts to enhance the compliance program through, among other things, internally integrating various portfolio management teams and aligning compliance support accordingly, completing a
comprehensive review of existing policies and procedures and revising such policies and procedures as appropriate, enhancing compliance-related technologies and workflows, and optimizing compliance shared services across the organization and
affiliates; |
| •
|
Risk
Management and Valuation Services - continuing efforts to strengthen the risk management functions, including through, among other things, enhancing the interaction and reporting between the investment risk management team and various affiliates,
increasing the efficiency of risk monitoring performed on the Nuveen funds through improved reporting, continuing to implement risk programs designed to provide a more disciplined and consistent approach to identifying and mitigating operational
risks, continuing progress on implementing a liquidity program that complies with the new liquidity regulatory requirements and continuing to oversee the daily valuation process; |
| •
|
Additional
Compliance Services – continuing investment of time and resources necessary to develop the compliance policies and procedures and other related tools necessary to meet the various new regulatory requirements affecting the Nuveen
funds that have been adopted over recent years; |
| •
|
Government
Relations – continuing efforts of various Nuveen teams and affiliates to advocate and communicate their positions with lawmakers and other regulatory bodies on issues that will impact the Nuveen funds; |
| •
|
Business
Continuity, Disaster Recovery and Information Services – establishing an information security program to help identify and manage information security risks, periodically testing disaster recovery plans, maintaining and updating
business continuity plans and providing reports to the Board, at least annually, addressing, among other things, management’s security risk assessment, cyber risk profile, incident tracking and other relevant information technology
risk-related reports; and |
| •
|
Expanded
Dividend Management Services – continuing to expand the services necessary to manage the dividends among the varying types of Nuveen funds that have developed as the Nuveen complex has grown in size and scope. |
In addition to the services provided by the Adviser, the
Board also considered the risks borne by the Adviser and its affiliates in managing the Nuveen funds, including entrepreneurial, operational, reputational, regulatory and litigation risks.
The Board further considered the division of responsibilities
between the Adviser and the Sub-Adviser and recognized that the Sub-Adviser and its investment personnel generally are responsible for the management of each Fund’s portfolio. The Board noted that the Adviser oversees the Sub-Adviser and
considered an analysis of the Sub-Adviser provided by the Adviser which included, among other things, the Sub-Adviser’s assets under management and changes thereto, a summary of the investment team and changes thereto, the investment approach
of the team and the performance of the funds sub-advised by the Sub-Adviser over various periods. The Board further considered at the May Meeting or prior meetings evaluations of the Sub-Adviser’s compliance program and trade execution. The
Board noted that the Adviser recommended the renewal of the Sub-Advisory Agreements.
Based on its review, the Board determined, in the exercise of
its reasonable business judgment, that it was satisfied with the nature, extent and quality of services provided to the respective Funds under each applicable Advisory Agreement.
B. The Investment Performance of the Funds and Fund
Advisers
In evaluating the quality of the services
provided by the Fund Advisers, the Board also received and considered the investment performance of the Nuveen funds they advise. In this regard, the Board reviewed Fund performance over the quarter, one- , three- and five-year periods ending
December 31, 2018 as well as performance data for the first quarter of 2019 ending March 29, 2019. The performance data was based on Class A shares; however, the performance of other classes should be substantially similar as they invest in the same
portfolio of securities and differences in performance among the classes would be principally attributed to the variations in the expense structures of the classes. Unless otherwise indicated, the performance data referenced below reflects the
periods ended December 31, 2018. The Board considered the Adviser’s analysis of each fund’s performance, with particular focus on funds that were considered performance outliers and the factors contributing to their performance. The
Board also noted that it received performance data of the Nuveen funds during its quarterly meetings throughout the year and took into account the discussions that occurred at these Board meetings regarding fund performance. In this regard, in its
evaluation of Nuveen fund performance at meetings throughout the year, the Board considered performance information for the funds for different time periods, both absolute and relative to appropriate benchmarks and peers, with particular attention
to information indicating underperformance of the respective funds and discussed with the Adviser the reasons for such underperformance.
The Board reviewed both absolute and relative fund performance
during the annual review. With respect to the latter, the Board considered fund performance in comparison to the performance of peer funds (the “Performance Peer Group”) and recognized and/or customized benchmarks (i.e., generally
benchmarks derived from multiple recognized benchmarks). In considering performance data, the Board is aware of certain inherent limitations with such data, including that differences between the objective(s), strategies and other characteristics of
the Nuveen funds compared to the respective Performance Peer Group and/or benchmark(s) (such as differences in the use of leverage) will necessarily contribute to differences in performance results and limit the value of the comparative information.
To assist the Board in its review of the comparability of the relative performance, the Adviser has ranked the relevancy of the peer group to the funds as low, medium or high. Depending on the facts and circumstances, however, the Board may be
satisfied with a fund’s performance notwithstanding that its performance may be below its benchmark or peer group for certain periods. In addition, the performance data may vary significantly depending on the end date selected, and
shareholders may evaluate fund performance based on their own holding period which may differ from the performance periods reviewed by the Board leading to different results. Further, the Board considered a fund’s performance in light of the
overall financial market conditions during the respective periods. As noted above, the Board reviewed, among other things, Nuveen fund performance over various periods ended December 31, 2018, and the Board was aware of the market decline in the
fourth quarter of 2018 and considered performance from the first quarter of 2019 as well. The Board also noted that a shorter period of underperformance may significantly impact longer term performance.
In their review of performance, the Independent Board Members
focused, in particular, on the Adviser’s analysis of Nuveen funds determined to be underperforming performance outliers. The Board recognized that some periods of underperformance may only be temporary while other periods of underperformance
may indicate a broader issue that may require a corrective action. Accordingly, with respect to any Nuveen funds for which the Board had identified performance issues, the Board monitors such funds closely until performance improves, discusses with
the Adviser the reasons for such results, considers whether any steps are necessary or appropriate to address such issues, and reviews the results of any efforts undertaken.
The Board’s determinations with respect to each Fund are
summarized below.
Annual Investment Management Agreement Approval Process (Unaudited) (continued)
For Nuveen Large Cap Select Fund, the Board noted that although
the Fund ranked in the fourth quartile of its Performance Peer Group in the one-year period, the Fund ranked in the first quartile in the three-year period and second quartile in the five-year period. Although the Fund’s performance was below
the performance of its benchmark in the one- and five-year periods, the Fund outperformed its benchmark in the three-year period. The Board was satisfied with the overall performance of the Fund.
For Nuveen Small Cap Select Fund, the Board noted that although
the Fund’s performance was below the performance of its benchmark in the one-, three- and five-year periods, the Fund ranked in the second quartile of its Performance Peer Group in such periods. The Board was satisfied with the overall
performance of the Fund.
C. Fees, Expenses and
Profitability
1. Fees and
Expenses
In its annual review, the
Board considered the fees paid to the Fund Advisers and the total operating expense ratio of each Nuveen fund, before and after any undertaking by Nuveen to limit the fund’s total annual operating expenses to certain levels. More specifically,
the Independent Board Members reviewed, among other things, each fund’s gross and net management fee rates (i.e., before and after expense reimbursements and/or fee waivers, if any) and net total expense ratio in relation to those of a
comparable universe of funds (the “Peer Universe”) and to a more focused subset of comparable funds (the “Peer Group”) established by Broadridge. The Independent Board Members reviewed the methodology Broadridge employed to
establish its Peer Universe and Peer Group and recognized that differences between the applicable fund and its respective Peer Universe and/or Peer Group as well as changes to the composition of the Peer Group and/or Peer Universe from year to year
may limit some of the value of the comparative data. The Independent Board Members also considered a fund’s operating expense ratio as it more directly reflected the shareholder’s costs in investing in the respective fund.
In their review, the Independent Board
Members considered, in particular, each fund with a net expense ratio of six basis points or higher compared to that of its peer average (each, an “Expense Outlier Fund”) and an analysis as to the factors contributing to each such
fund’s higher relative net expense ratio. Accordingly, in reviewing the comparative data between a fund and its peers, the Board generally considered the fund’s net expense ratio and fees to be higher if they were over 10 basis points
higher, slightly higher if they were 6 to 10 basis points higher, in line if they were within approximately 5 basis points higher than the peer average and below if they were below the peer average of the Peer Group. The Independent Board Members
also considered, in relevant part, a fund’s net management fee and net total expense ratio in light of its performance history.
In their review of the fee arrangements for
the Nuveen funds, the Independent Board Members considered the management fee schedules, including the complex-wide and fund-level breakpoint schedules, and the expense reimbursements and/or fee waivers provided by Nuveen for each fund, as
applicable. The Board noted that across the Nuveen fund complex, the complex-wide fee breakpoints reduced fees by $51.5 million and fund-level breakpoints reduced fees by $55.1 million in 2018. Further, fee caps and waivers for all applicable Nuveen
funds saved an additional $15 million in fees for shareholders in 2018.
With respect to the Sub-Adviser, the Board
considered the sub-advisory fee paid to the Sub-Adviser, including any breakpoint schedule, and, as described below, comparative data of the fees the Sub-Adviser charges to other clients, if any.
The Independent Board Members noted that the
Funds had net management fees and net expense ratios below the average of their Peer Group. Based on its review of the information provided, the Board determined that each Fund’s management fees (as applicable) to a Fund Adviser were
reasonable in light of the nature, extent and quality of services provided to the Fund.
2. Comparisons with the Fees of Other
Clients
In determining the
appropriateness of fees, the Board also reviewed information regarding the fee rates the respective Fund Advisers charged to certain other types of clients and the type of services provided to these other clients. For the Adviser and/or the
Sub-Adviser, such other clients may include retail and institutional managed accounts; sub-advised funds outside the Nuveen family; foreign investment companies offered by Nuveen; and collective investment trusts. The Board further noted that the
Adviser also advised certain exchange-traded funds (“ETFs”) sponsored by Nuveen.
The Board recognized that each Fund had an
affiliated sub-adviser and, with respect to affiliated sub-advisers, reviewed, among other things, the range of fees assessed for managed accounts and foreign investment companies offered by Nuveen. The Board also reviewed the fee range and average
fee rate of certain selected investment strategies offered in retail and institutional managed accounts by the Sub-Adviser and of the non-Nuveen investment companies sub-advised by affiliated sub-advisers.
In addition to the comparative fee data, the
Board also reviewed, among other things, a description of the different levels of services provided to certain other clients compared to the services provided to the Nuveen funds as well as the differences in portfolio investment policies, investor
profiles, account sizes and regulatory requirements, all of which contribute to the variations in the fee schedules. The Board noted, among other things, the wide range of services in addition to investment management services provided to the Nuveen
funds when the Adviser is principally responsible for all aspects of operating the funds, including the increased regulatory requirements that must be met in managing the funds, the larger account sizes of managed accounts and the increased
entrepreneurial, legal and regulatory risks that the Adviser incurs in sponsoring and
managing the funds. Further, with respect to ETFs, the
Board considered that Nuveen ETFs are passively managed compared to the active management of other Nuveen funds which contributed to the differences in fee levels between the Nuveen ETFs and other Nuveen funds. In general, higher fee levels reflect
higher levels of service provided by the Adviser, increased investment management complexity, greater product management requirements, and higher levels of business risk or some combination of these factors. The Board further considered that the
Sub-Adviser’s fee is essentially for portfolio management services and therefore more comparable to the fees it receives for retail wrap accounts and other external sub-advisory mandates. The Board concluded the varying levels of fees were
justified given, among other things, the inherent differences in the products and the level of services provided to the Nuveen funds versus other clients, the differing regulatory requirements and legal liabilities and the entrepreneurial, legal and
regulatory risks incurred in sponsoring and advising a registered investment company.
3. Profitability of Fund Advisers
In conjunction with their review of fees,
the Independent Board Members considered information regarding Nuveen’s level of profitability for its advisory services to the Nuveen funds for the calendar years 2018 and 2017. The Board reviewed, among other things, Nuveen’s net
margins (pre-tax) (both including and excluding distribution expenses); gross and net revenue margins (pre- and post-tax); revenues, expenses, and net income (pre-tax and after-tax and before distribution) of Nuveen for fund advisory services; and
comparative profitability data comparing the adjusted margins of Nuveen compared to the adjusted margins of certain peers with publicly available data and with the most comparable assets under management (based on asset size and asset composition)
for each of the last two calendar years. The Board also reviewed the revenues and expenses the Adviser derived from its ETF product line that was launched in 2016. The Independent Board Members noted that Nuveen’s net margins were higher in
2018 than the previous year and considered the key drivers behind the revenue and expense changes that impacted Nuveen’s net margins between the years. The Board considered the costs of investments in the Nuveen business, including the
investment of seed capital in certain Nuveen funds and additional investments in infrastructure and technology. The Independent Board Members also noted that Nuveen’s adjusted margins from its relationships with the Nuveen funds were on the
low range compared to the adjusted margins of the peers; however, the Independent Board Members recognized the inherent limitations of the comparative data of other publicly traded peers given that the calculation of profitability is rather
subjective and numerous factors (such as types of funds, business mix, cost of capital, methodology to allocate expenses and other factors) can have a significant impact on the results.
The Independent Board Members also reviewed
a description of the expense allocation methodology employed to develop the financial information and a summary of the history of changes to the methodology over the ten-year period from 2008 to 2018, and recognized that other reasonable allocation
methodologies could be employed and lead to significantly different results. The Board noted that two Independent Board Members, along with independent counsel, serve as the Board’s liaisons to review profitability and discuss any proposed
changes to the methodology prior to the full Board’s review.
Aside from Nuveen’s profitability, the
Board recognized that the Adviser is a subsidiary of Nuveen, LLC, the investment management arm of Teachers Insurance and Annuity Association of America (“TIAA”). As such, the Board also reviewed a balance sheet for TIAA reflecting its
assets, liabilities and capital and contingency reserves for the 2018 and 2017 calendar years to consider the financial strength of TIAA having recognized the importance of having an adviser with significant resources.
In addition to Nuveen, the Independent Board
Members also considered the profitability of the Sub-Adviser from its relationships with the Nuveen funds. In this regard, the Independent Board Members reviewed the Sub-Adviser’s revenues, expenses and revenue margins (pre- and post-tax) for
its advisory activities for the calendar year ended December 31, 2018. The Independent Board Members also reviewed a profitability analysis reflecting the revenues, expenses and revenue margin (pre- and post-tax) by asset type for the Sub-Adviser
for the calendar year ending December 31, 2018 and the pre- and post-tax revenue margin from 2018 and 2017.
In evaluating the reasonableness of the
compensation, the Independent Board Members also considered any other ancillary benefits derived by the respective Fund Adviser from its relationship with the Nuveen funds as discussed in further detail below.
Based on a consideration of all the
information provided, the Board noted that Nuveen’s and the Sub-Adviser’s level of profitability was acceptable and not unreasonable in light of the services provided.
D. Economies of Scale and Whether Fee Levels Reflect These
Economies of Scale
With respect to economies of scale,
the Independent Board Members noted that although economies of scale are difficult to measure, the Adviser shares the benefits of economies of scale in various ways including breakpoints in the management fee schedule (subject to limited
exceptions), fee waivers and/or expense limitations, the pricing of Nuveen funds at scale at inception and investments in its business which can enhance the services provided to the funds for the fees paid. With respect to breakpoint schedules,
because the Board had previously recognized that economies of scale may occur not only when the assets of a particular Nuveen fund grow but also when the assets in the complex grow, the Nuveen funds generally pay the Adviser a management fee
comprised of a fund-level component and a complex-level component each with its own breakpoint schedule, subject to certain exceptions. In general terms, the breakpoint schedule at the fund level reduces fees as assets in the particular fund pass
certain thresholds and the breakpoint schedule at the complex level reduces fees on the Nuveen funds as the eligible assets in the complex pass certain thresholds. The Independent Board Members reviewed, among other things, the fund-level and
complex-level fee schedules and the temporary and/or permanent ex-
Annual Investment Management Agreement Approval Process (Unaudited) (continued)
pense caps applicable to certain Nuveen funds (including the amounts of fees
waived or amounts reimbursed to the respective funds in 2017 and 2018), including the temporary expense caps applicable to the Funds. The Independent Board Members noted that as a result of fund-level management fee changes implemented in June 2017,
none of the Nuveen open-end funds were above their top level fee breakpoint.
In addition, the Independent Board Members recognized the
Adviser’s continued reinvestment in its business through, among other things, investments in its business infrastructure and information technology, portfolio accounting system as well as other systems and platforms that will, among other
things, support growth, simplify and enhance information sharing, and enhance the investment process to the benefit of all of the Nuveen funds.
Based on its review, the Board concluded that the current fee
arrangements together with the Adviser’s reinvestment in its business appropriately shared any economies of scale with shareholders.
E. Indirect Benefits
The Independent Board Members received and considered
information regarding other benefits the respective Fund Adviser or its affiliates may receive as a result of their relationship with the Nuveen funds. The Independent Board Members recognized that an affiliate of the Adviser serves as principal
underwriter providing distribution and/or shareholder services to the open-end funds. The Independent Board Members further noted that the Nuveen open-end funds pay 12b-1 fees and while a majority of such fees were paid to third party
broker-dealers, the Board reviewed the amount retained by the Adviser’s affiliate as a result of serving as principal underwriter. In addition, the Independent Board Members also noted that the Sub-Adviser engages in soft dollar transactions
pursuant to which it may receive the benefit of research products and other services provided by broker-dealers executing portfolio transactions on behalf of the applicable Nuveen funds.
The Board, however, noted that the benefits for the Sub-Adviser
when transacting in fixed-income securities may be more limited as such securities generally trade on a principal basis and therefore do not generate brokerage commissions. Further, the Board noted that although the Sub-Adviser may benefit from the
receipt of research and other services that it may otherwise have to pay for out of its own resources, the research may also benefit the Nuveen funds to the extent it enhances the ability of the Sub-Adviser to manage such funds or is acquired
through the commissions paid on portfolio transactions of other clients.
Based on their review, the Board concluded that any indirect
benefits received by a Fund Adviser as a result of its relationship with the Funds were reasonable and within acceptable parameters.
F. Other Considerations
The Board Members did not identify any single factor discussed
previously as all-important or controlling. The Board Members, including the Independent Board Members, concluded that the terms of each Advisory Agreement were fair and reasonable, that the respective Fund Adviser’s fees were reasonable in
light of the services provided to each Fund and that the Advisory Agreements be renewed.
Directors and Officers
(Unaudited)
The
management of the Funds, including general supervision of the duties performed for the Funds by the Adviser, is the responsibility of the Board of Directors of the Funds. The number of Directors of the Funds is currently set at ten. None of the
Directors who are not “interested” persons of the Funds (referred to herein as “Independent Directors”) has ever been a Director or employee of, or consultant to, Nuveen or its affiliates. The names and business addresses of
the Directors and officers of the Funds, their principal occupations and other affiliations during the past five years, the number of portfolios each Director oversees and other directorships they hold are set forth below.
The Funds’ Statement of Additional Information
(“SAI”) includes more information about the Directors. To request a free copy, call Nuveen Investments at (800) 257-8787 or visit the Funds’ website at www.nuveen.com.
Name,
Year of Birth
& Address |
Position(s)
Held with
the Funds |
Year
First
Elected or
Appointed (1) |
Principal
Occupation(s)
Including other Directorships
During Past 5 Years |
Number
of
Portfolios in
Fund Complex
Overseen by
Director |
| Independent
Directors: |
|
|
|
Terence
J. Toth
1959
333 W. Wacker Drive
Chicago, IL 60606 |
Chairman
and
Director |
2008
|
Formerly,
a Co-Founding Partner, Promus Capital (2008-2017); Director, Quality Control Corporation (since 2012); member: Catalyst Schools of Chicago Board (since 2008) and Mather Foundation Board (since 2012), and chair of its investment committee; formerly,
Director, Fulcrum IT Services LLC (2010-2019); formerly, Director, Legal & General Investment Management America, Inc. (2008-2013); formerly, CEO and President, Northern Trust Global Investments (2004-2007); Executive Vice President,
Quantitative Management & Securities Lending (2000-2004); prior thereto, various positions with Northern Trust Company (since 1994); formerly, Member, Northern Trust Mutual Funds Board (2005-2007), Northern Trust Global Investments Board
(2004-2007), Northern Trust Japan Board (2004-2007), Northern Trust Securities Inc. Board (2003- 2007) and Northern Trust Hong Kong Board (1997-2004). |
159
|
Jack
B. Evans
1948
333 W. Wacker Drive
Chicago, IL 60606 |
Director
|
1999
|
Chairman
(since 2019), formerly, President (1996-2019), The Hall-Perrine Foundation, a private philanthropic corporation; Director and Chairman, United Fire Group, a publicly held company; Director, Public member, American Board of Orthopaedic Surgery
(since 2015); Life Trustee of Coe College and the Iowa College Foundation; formerly, President Pro-Tem of the Board of Regents for the State of Iowa University System; formerly, Director, Alliant Energy and The Gazette Company; formerly, Director,
Federal Reserve Bank of Chicago; formerly, President and Chief Operating Officer, SCI Financial Group, Inc., a regional financial services firm. |
159
|
Directors and Officers (Unaudited) (continued)
Name,
Year of Birth
& Address |
Position(s)
Held with
the Funds |
Year
First
Elected or
Appointed (1) |
Principal
Occupation(s)
Including other Directorships
During Past 5 Years |
Number
of
Portfolios in
Fund Complex
Overseen by
Director |
William
C. Hunter
1948
333 W. Wacker Drive
Chicago, IL 60606 |
Director
|
2003
|
Dean
Emeritus, formerly, Dean, Tippie College of Business, University of Iowa (2006-2012); Director of Wellmark, Inc. (since 2009); past Director (2005-2015), and past President (2010- 2014) Beta Gamma Sigma, Inc., The International Business Honor
Society; formerly, Director (2004-2018) of Xerox Corporation; Dean and Distinguished Professor of Finance, School of Business at the University of Connecticut (2003-2006); previously, Senior Vice President and Director of Research at the Federal
Reserve Bank of Chicago (1995-2003); formerly, Director (1997-2007), Credit Research Center at Georgetown University. |
159
|
Albin
F. Moschner
1952
333 W. Wacker Drive
Chicago, IL 60606 |
Director
|
2016
|
Founder
and Chief Executive Officer, Northcroft Partners, LLC, a management consulting firm (since 2012); formerly, Chairman (2019), and Director (2012-2019), USA Technologies, Inc., a provider of solutions and services to facilitate electronic payment
transactions; formerly, Director, Wintrust Financial Corporation (1996-2016); previously, held positions at Leap Wireless International, Inc., including Consultant (2011-2012), Chief Operating Officer (2008-2011), and Chief Marketing Officer
(2004-2008); formerly, President, Verizon Card Services division of Verizon Communications, Inc. (2000-2003); formerly, President, One Point Services at One Point Communications (1999-2000); formerly, Vice Chairman of the Board, Diba, Incorporated
(1996-1997); formerly, various executive positions (1991-1996) and Chief Executive Officer (1995-1996) of Zenith Electronics Corporation. |
159
|
John
K. Nelson
1962
333 W. Wacker Drive
Chicago, IL 60606 |
Director
|
2013
|
Member
of Board of Directors of Core12 LLC (since 2008), a private firm which develops branding, marketing and communications strategies for clients; served on The President's Council, Fordham University (2010-2018); and previously was a Director of The
Curran Center for Catholic American Studies (2009-2018); formerly, senior external advisor to the financial services practice of Deloitte Consulting LLP (2012-2014); formerly, Chairman of the Board of Trustees of Marian University (2010 as trustee,
2011- 2014 as Chairman); formerly, Chief Executive Officer of ABN AMRO N.V. North America, and Global Head of its Financial Markets Division (2007-2008); prior senior positions held at ABN AMRO include Corporate Executive Vice President and Head of
Global Markets-the Americas (2006-2007), CEO of Wholesale Banking-North America and Global Head of Foreign Exchange and Futures Markets (2001-2006), and Regional Commercial Treasurer and Senior Vice President Trading-North America (1996-2001);
formerly, Trustee at St. Edmund Preparatory School in New York City. |
159
|
Judith
M. Stockdale
1947
333 W. Wacker Drive
Chicago, IL 60606 |
Director
|
1997
|
Board
Member, Land Trust Alliance (since 2013) and U.S. Endowment for Forestry and Communities (since 2013); formerly, Executive Director (1994-2012), Gaylord and Dorothy Donnelley Foundation; prior thereto, Executive Director, Great Lakes Protection
Fund (1990-1994). |
159
|
Carole
E. Stone
1947
333 W. Wacker Drive
Chicago, IL 60606 |
Director
|
2007
|
Former
Director, Chicago Board Options Exchange (2006-2017), and C2 Options Exchange, Incorporated (2009-2017); Director, Cboe Global Markets, Inc., formerly, CBOE Holdings, Inc. (since 2010); formerly, Commissioner, New York State Commission on Public
Authority Reform (2005-2010). |
159
|
Name,
Year of Birth
& Address |
Position(s)
Held with
the Funds |
Year
First
Elected or
Appointed (1) |
Principal
Occupation(s)
Including other Directorships
During Past 5 Years |
Number
of
Portfolios in
Fund Complex
Overseen by
Director |
Margaret
L. Wolff
1955
333 W. Wacker Drive
Chicago, IL 60606 |
Director
|
2016
|
Formerly,
member of the Board of Directors (2013-2017) of Travelers Insurance Company of Canada and The Dominion of Canada General Insurance Company (each, a part of Travelers Canada, the Canadian operation of The Travelers Companies, Inc.); formerly, Of
Counsel, Skadden, Arps, Slate, Meagher & Flom LLP (Mergers & Acquisitions Group) (2005-2014); Member of the Board of Trustees of New York-Presbyterian Hospital (since 2005); Member (since 2004) and Chair (since 2015) of the Board of Trustees
of The John A. Hartford Foundation (a philanthropy dedicated to improving the care of older adults); formerly, Member (2005-2015) and Vice Chair (2011-2015) of the Board of Trustees of Mt. Holyoke College. |
159
|
Robert
L. Young(2)
1963
333 W. Wacker Drive
Chicago, IL 60606 |
Director
|
2017
|
Formerly,
Chief Operating Officer and Director, J.P. Morgan Investment Management Inc. (2010-2016); formerly, President and Principal Executive Officer (2013-2016), and Senior Vice President and Chief Operating Officer (2005-2010), of J.P. Morgan Funds;
formerly, Director and various officer positions for J.P. Morgan Investment Management Inc. (formerly, JPMorgan Funds Management, Inc. and formerly, One Group Administrative Services) and JPMorgan Distribution Services, Inc. (formerly, One Group
Dealer Services, Inc.) (1999-2017). |
157
|
Name,
Year of Birth
& Address |
Position(s)
Held with
the Funds |
Year
First
Elected or
Appointed (1) |
Principal
Occupation(s)
Including other Directorships
During Past 5 Years |
Number
of
Portfolios in
Fund Complex
Overseen by
Director |
| Interested
Director: |
|
|
|
Margo
L. Cook(3)
1964
333 W. Wacker Drive
Chicago, IL 60606 |
Director
|
2016
|
President
(since 2017), formerly, Co-Chief Executive Officer and Co-President (2016-2017), formerly, Senior Executive Vice President of Nuveen Investments, Inc; Executive Vice President (since 2017) of Nuveen, LLC; President, Global Products and Solutions
(since 2017), and Co-Chief Executive Officer (since 2015), formerly, Executive Vice President (2013-2015) of Nuveen Securities, LLC; President (since 2017), formerly, Co-President (2016-2017), formerly Senior Executive Vice President (2015-2016) of
Nuveen Fund Advisors, LLC (Executive Vice President 2011-2015); President (since 2017), Nuveen Alternative Investments, LLC; Chartered Financial Analyst. |
159
|
Name,
Year of Birth
& Address |
Position(s)
Held with
the Funds |
Year
First
Elected or
Appointed (4) |
Principal
Occupation(s)
During Past 5 Years |
|
| Officers
of the Funds: |
|
|
|
|
Greg
A. Bottjer
1971
333 W. Wacker Drive
Chicago, IL 60606 |
Chief
Administrative
Officer |
2016
|
Senior
(since 2017) Managing Director (since 2011), formerly, Senior Vice President (2007-2010) of Nuveen; Senior (since 2017) Managing Director (since 2016) of Nuveen Fund Advisors, LLC; Chartered Financial Analyst. |
|
Mark
J. Czarniecki
1979
901 Marquette Avenue
Minneapolis, MN 55402 |
Vice
President
and Assistant
Secretary |
2013
|
Vice
President and Assistant Secretary of Nuveen Securities, LLC (since 2016) and Nuveen Fund Advisors (since 2017); Vice President and Associate General Counsel of Nuveen (since 2013) and Vice President, Assistant Secretary and Associate General
Counsel of Nuveen Asset Management (since 2018). |
|
Directors and Officers (Unaudited) (continued)
Name,
Year of Birth
& Address |
Position(s)
Held with
the Funds |
Year
First
Elected or
Appointed (4) |
Principal
Occupation(s)
During Past 5 Years |
|
Diana
R. Gonzalez
1978
333 W. Wacker Drive
Chicago, IL 60606 |
Vice
President
and Assistant
Secretary |
2017
|
Vice
President and Assistant Secretary of Nuveen Fund Advisors, LLC (since 2017); Vice President and Associate General Counsel of Nuveen (since 2017); Associate General Counsel of Jackson National Asset Management (2012-2017). |
|
Nathaniel
T. Jones
1979
333 W. Wacker Drive
Chicago, IL 60606 |
Vice
President
and Treasurer |
2016
|
Managing
Director (since 2017), formerly, Senior Vice President (2016-2017), formerly, Vice President (2011- 2016) of Nuveen; Managing Director (since 2015) of Nuveen Fund Advisors, LLC; Chartered Financial Analyst. |
|
Walter
M. Kelly
1970
333 W. Wacker Drive
Chicago, IL 60606 |
Chief
Compliance
Officer and Vice
President |
2003
|
Managing
Director (since 2017), formerly, Senior Vice President (2008-2017) of Nuveen Investments Holdings, Inc. |
|
Tina
M. Lazar
1961
333 W. Wacker Drive
Chicago, IL 60606 |
Vice
President |
2002
|
Managing
Director (since 2017), formerly, Senior Vice President (2014-2017) of Nuveen Securities, LLC. |
|
Brian
J. Lockhart
1974
333 W. Wacker Drive
Chicago, IL 60606 |
Vice
President |
2019
|
Managing
Director (since 2019) of Nuveen Fund Advisors, LLC; Managing Director (since 2017), formerly, Vice President (2010-2017) of Nuveen; Head of Investment Oversight (since 2017), formerly, Team Leader of Manager Oversight (2015-2017); Chartered
Financial Analyst and Certified Financial Risk Manager. |
|
Jacques
M. Longerstaey
1963
8500 Andrew Carnegie Blvd.
Charlotte, NC 28262 |
Vice
President |
2019
|
Senior
Managing Director, Chief Risk Officer, Nuveen, LLC (since May 2019); Senior Managing Director (since May 2019) of Nuveen Fund Advisors, LLC; formerly, Chief Investment and Model Risk Officer, Wealth & Investment Management Division, Wells Fargo
Bank (NA) (from 2013-2019). |
|
Kevin
J. McCarthy
1966
333 W. Wacker Drive
Chicago, IL 60606 |
Vice
President
and Assistant Secretary |
2007
|
Senior
Managing Director (since 2017) and Secretary and General Counsel (since 2016) of Nuveen Investments, Inc., formerly, Executive Vice President (2016-2017) and Managing Director and Assistant Secretary (2008-2016); Senior Managing Director (since
2017) and Assistant Secretary (since 2008) of Nuveen Securities, LLC, formerly Executive Vice President (2016-2017) and Managing Director (2008-2016); Senior Managing Director (since 2017), Secretary (since 2016) and Co-General Counsel (since 2011)
of Nuveen Fund Advisors, LLC, formerly, Executive Vice President (2016-2017), Managing Director (2008-2016) and Assistant Secretary (2007-2016); Senior Managing Director (since 2017), Secretary (since 2016) and Associate General Counsel (since 2011)
of Nuveen Asset Management, LLC, formerly Executive Vice President (2016-2017) and Managing Director and Assistant Secretary (2011-2016); Senior Managing Director (since 2017) and Secretary (since 2016) of Nuveen Investments Advisers, LLC, formerly
Executive Vice President (2016-2017); Vice President (since 2007) and Secretary (since 2016), formerly, Assistant Secretary, of NWQ Investment Management Company, LLC, Symphony Asset Management, LLC, Santa Barbara Asset Management, LLC and Winslow
Capital Management, LLC (since 2010). Senior Managing Director (since 2017) and Secretary (since 2016) of Nuveen Alternative Investments, LLC. |
|
Jon
Scott Meissner
1973
8500 Andrew Carnegie Blvd.
Charlotte, NC 28262 |
Vice
President |
2019
|
Managing
Director of Mutual Fund Tax and Financial Reporting groups at Nuveen (since 2017); Managing Director of Nuveen Fund Advisors, LLC (since 2019); Senior Director of Teachers Advisors, LLC and TIAA-CREF Investment Management, LLC (since 2016); Senior
Director (since 2015) Mutual Fund Taxation to the TIAA-CREF Funds, the TIAA-CREF Life Funds, the TIAA Separate Account VA-1 and the CREF Accounts; has held various positions with TIAA since 2004. |
|
Name,
Year of Birth
& Address |
Position(s)
Held with
the Funds |
Year
First
Elected or
Appointed (4) |
Principal
Occupation(s)
During Past 5 Years |
|
Christopher
M. Rohrbacher
1971
333 W. Wacker Drive
Chicago, IL 60606 |
Vice
President
and
Secretary |
2008
|
Managing
Director (since 2017) and Assistant Secretary of Nuveen Securities, LLC; Managing Director (since 2017), formerly, Senior Vice President (2016-2017), Co-General Counsel (since 2019) and Assistant Secretary (since 2016) of Nuveen Fund Advisors, LLC;
Managing Director (since 2017), formerly, Senior Vice President (2012-2017) and Associate General Counsel (since 2016), formerly, Assistant General Counsel (2008-2016) of Nuveen. |
|
William
A. Siffermann
1975
333 W. Wacker Drive
Chicago, IL 60606 |
Vice
President |
2017
|
Managing
Director (since 2017), formerly Senior Vice President (2016-2017) and Vice President (2011-2016) of Nuveen. |
|
E.
Scott Wickerham
1973
TIAA
730 Third Avenue
New York, NY 10017 |
Vice
President
and Controller |
2019
|
Senior
Managing Director, Head of Fund Administration at Nuveen, LLC (since 2019), formerly, Managing Director; Senior Managing Director (since 2019), Nuveen Fund Advisors, LLC; Principal Financial Officer, Principal Accounting Officer and Treasurer
(since 2017) to the TIAA-CREF Funds, the TIAA-CREF Life Funds, the TIAA Separate Account VA-1 and the Treasurer (since 2017) to the CREF Accounts; Senior Director, TIAA-CREF Fund Administration (2014-2015); has held various positions with TIAA since
2006. |
|
Gifford
R. Zimmerman
1956
333 W. Wacker Drive
Chicago, IL 60606
|
Vice
President
and Assistant
Secretary |
1988
|
Managing
Director (since 2002), and Assistant Secretary of Nuveen Securities, LLC; Managing Director (since 2004) and Assistant Secretary (since 1994) of Nuveen Investments, Inc.; Managing Director (since 2002), Assistant Secretary (since 1997) and
Co-General Counsel (since 2011) of Nuveen Fund Advisors, LLC; Managing Director, Assistant Secretary and Associate General Counsel of Nuveen Asset Management, LLC (since 2011); Vice President (since 2017), formerly, Managing Director (2003-2017) and
Assistant Secretary (since 2003) of Symphony Asset Management LLC ; Managing Director and Assistant Secretary (since 2002) of Nuveen Investments Advisers, LLC; Vice President and Assistant Secretary of NWQ Investment Management Company, LLC (since
2002), Santa Barbara Asset Management, LLC (since 2006) and of Winslow Capital Management, LLC, (since 2010); Chartered Financial Analyst. |
|
(1)
Directors serve an indefinite term until his/her successor is elected or appointed. The year first elected or appointed represents the year in which the director was first elected or appointed to any
fund in the Nuveen fund complex.
(2)
Mr. Young was appointed as a Board Member of each of the Nuveen Funds except Nuveen Diversified Dividend and Income Fund and Nuveen Real Estate Income Fund.
(3)
“Interested person” of the Trust, as defined in the 1940 Act, by reason of her position with Nuveen, LLC. and certain of its subsidiaries.
(4)
Officers serve one year terms through August of each year. The year first elected or appointed represents the year in which the officer was first elected or appointed to any fund in the Nuveen fund
complex.
Nuveen:
Serving Investors for Generations
Since 1898, financial advisors and their clients have relied
on Nuveen to provide dependable investment solutions through continued adherence to proven, long-term investing principles. Today, we offer a range of high quality solutions designed to be integral components of a well-diversified core
portfolio.
Focused on meeting investor needs.
Nuveen is the investment manager of TIAA. We have grown into
one of the world’s premier global asset managers, with specialist knowledge across all major asset classes and particular strength in solutions that provide income for investors and that draw on our expertise in alternatives and responsible
investing. Nuveen is driven not only by the independent investment processes across the firm, but also the insights, risk management, analytics and other tools and resources that a truly world-class platform provides. As a global asset manager, our
mission is to work in partnership with our clients to create solutions which help them secure their financial future.
Find out how we can help you.
To learn more about how the products and services of Nuveen
may be able to help you meet your financial goals, talk to your financial advisor, or call us at (800) 257-8787. Please read the information provided carefully before you invest. Investors should consider the investment objective and policies, risk
considerations, charges and expenses of any investment carefully. Where applicable, be sure to obtain a prospectus, which contains this and other relevant information. To obtain a prospectus, please contact your securities representative or Nuveen,
333 W. Wacker Dr., Chicago, IL 60606. Please read the prospectus carefully before you invest or send money.
Learn more about Nuveen Funds at: www.nuveen.com/mutual-funds
Nuveen Securities, LLC, member FINRA and SIPC | 333 West Wacker Drive |
Chicago, IL 60606 | www.nuveen.com MAN-FSLCT-1019P1032030-INV-Y-12/20
ITEM 2. CODE OF ETHICS.
As of the end of the period covered by this report, the registrant has adopted a code of ethics that applies to the
registrant’s principal executive officer, principal financial officer, principal accounting officer or controller, or persons performing similar functions. There were no amendments to or waivers from the code during the period covered by this
report. The registrant has posted the code of ethics on its website at www.nuveen.com/fund-governance. (To view the code, click on Code of Conduct.)
ITEM 3. AUDIT COMMITTEE FINANCIAL EXPERT.
As of the end of the period
covered by this report, the registrant’s Board of Directors or Trustees (“Board”) determined that the registrant has at least one “audit committee financial expert” (as defined in Item 3 of Form N-CSR) serving on its Audit
Committee. The registrant’s audit committee financial experts are Carole E. Stone, Jack B. Evans and William C. Hunter, who are “independent” for purposes of Item 3 of Form N-CSR.
Ms. Stone served for five years as Director of the New York State Division of the Budget. As part of her role as Director, Ms. Stone was
actively involved in overseeing the development of the State’s operating, local assistance and capital budgets, its financial plan and related documents; overseeing the development of the State’s bond-related disclosure documents and
certifying that they fairly presented the State’s financial position; reviewing audits of various State and local agencies and programs; and coordinating the State’s system of internal audit and control. Prior to serving as Director, Ms.
Stone worked as a budget analyst/examiner with increasing levels of responsibility over a 30 year period, including approximately five years as Deputy Budget Director. Ms. Stone has also served as Chair of the New York State Racing Association
Oversight Board, as Chair of the Public Authorities Control Board, as a Commissioner on the New York State Commission on Public Authority Reform and as a member of the Boards of Directors of several New York State public authorities. These positions
have involved overseeing operations and finances of certain entities and assessing the adequacy of project/entity financing and financial reporting. Currently, Ms. Stone is on the Board of Directors of CBOE Holdings, Inc., of the Chicago Board
Options Exchange, and of C2 Options Exchange. Ms. Stone’s position on the boards of these entities and as a member of both CBOE Holdings’ Audit Committee and its Finance Committee has involved, among other things, the oversight of audits,
audit plans and preparation of financial statements.
Mr. Evans was formerly President and Chief Operating Officer of SCI
Financial Group, Inc., a full service registered broker-dealer and registered investment adviser (“SCI”). As part of his role as President and Chief Operating Officer, Mr. Evans actively supervised the Chief Financial Officer (the
“CFO”) and actively supervised the CFO’s preparation of financial statements and other filings with various regulatory authorities. In such capacity, Mr. Evans was actively involved in the preparation of SCI’s financial
statements and the resolution of issues raised in connection therewith. Mr. Evans has also served on the audit committee of various reporting companies. At such companies, Mr. Evans was involved in the oversight of audits, audit plans, and the
preparation of financial statements. Mr. Evans also formerly chaired the audit committee of the Federal Reserve Bank of Chicago.
Mr. Hunter was formerly a Senior Vice President at the Federal Reserve Bank of Chicago. As part of his role as Senior Vice President, Mr. Hunter was the senior officer responsible for all operations of
each of the Economic Research, Statistics, and Community and Consumer Affairs units at the Federal Reserve Bank of Chicago. In such capacity, Mr. Hunter oversaw the subunits of the Statistics and Community and Consumer Affairs divisions responsible
for the analysis and evaluation of bank and bank holding company financial statements and financial filings. Prior to serving as Senior Vice President at the Federal Reserve Bank of Chicago, Mr. Hunter was the Vice President of the Financial Markets
unit at the Federal Reserve Bank of Atlanta where he supervised financial staff and bank holding company analysts who analyzed and evaluated bank and bank holding company financial statements. Mr. Hunter also currently serves on the Boards of
Directors of Xerox Corporation and Wellmark, Inc. as well as on the Audit Committees of such Boards. As an Audit Committee member, Mr. Hunter’s responsibilities include, among other things, reviewing financial statements, internal audits and
internal controls over financial reporting. Mr. Hunter also formerly was a Professor of Finance at the University of Connecticut School of Business and has authored numerous scholarly articles on the topics of finance, accounting and economics.
ITEM 4. PRINCIPAL ACCOUNTANT FEES AND SERVICES.
The following tables show the amount of fees that PricewaterhouseCoopers LLP, the Funds’ auditor, billed to the Funds’ during the Funds’ last two full fiscal years. The Audit Committee
approved in advance all audit services and non-audit services that PricewaterhouseCoopers LLP, provided to the Funds, except for those non-audit services that were subject to the pre-approval exception under Rule 2-01 of Regulation S-X (the
“pre-approval exception”). The preapproval exception for services provided directly to the Funds waives the pre-approval requirement for services other than audit, review or attest services if: (A) the aggregate amount of all such services
provided constitutes no more than 5% of the total amount of revenues paid by the Funds during the fiscal year in which the services are provided; (B) the Funds did not recognize the services as non-audit services at the time of the engagement; and
(C) the services are promptly brought to the Audit Committee’s attention, and the Committee (or its delegate) approves the services before the audit is completed.
The Audit Committee has delegated certain pre-approval responsibilities to its Chair (or, in her absence, any other member of the Audit Committee).
|
|
|
|
|
|
|
|
|
|
|
|
|
|
|
|
|
| Fiscal Year Ended October 31, 2019 |
|
Audit Fees Billed
to Funds
1 |
|
|
Audit-Related Fees
Billed to Funds 2 |
|
|
Tax Fees Billed
to
Funds 3 |
|
|
All Other Fees
Billed to Funds 4 |
|
| Fund Name |
|
|
|
|
|
|
|
|
|
|
|
|
|
|
|
|
| Nuveen Dividend Value Fund |
|
|
18,740 |
|
|
|
0 |
|
|
|
3,020 |
|
|
|
0 |
|
| Nuveen Large Cap Select Fund |
|
|
14,615 |
|
|
|
0 |
|
|
|
3,020 |
|
|
|
0 |
|
| Nuveen Mid Cap Growth Opportunities Fund |
|
|
16,370 |
|
|
|
0 |
|
|
|
3,020 |
|
|
|
0 |
|
| Nuveen Mid Cap Value Fund |
|
|
15,660 |
|
|
|
0 |
|
|
|
3,020 |
|
|
|
0 |
|
| Nuveen Small Cap Growth Opportunities Fund |
|
|
14,745 |
|
|
|
0 |
|
|
|
3,020 |
|
|
|
0 |
|
| Nuveen Small Cap Select Fund |
|
|
14,775 |
|
|
|
0 |
|
|
|
3,020 |
|
|
|
0 |
|
| Nuveen Small Cap Value Fund |
|
|
22,920 |
|
|
|
0 |
|
|
|
3,020 |
|
|
|
0 |
|
|
|
|
|
|
|
|
|
|
|
|
|
|
|
|
|
|
| Total |
|
$ |
117,825 |
|
|
$ |
0 |
|
|
$ |
21,140 |
|
|
$ |
0 |
|
| 1 |
|
“Audit Fees” are the aggregate fees billed for professional services for the audit of the Fund’s annual financial statements and
services provided in connection with statutory and regulatory filings or engagements. |
| 2 |
|
“Audit-Related Fees” are the aggregate fees billed for assurance and related services reasonably related to the performance of the audit or
review of financial statements that are not reported under “Audit Fees”. These fees include offerings related to the Fund’s common shares and leverage. |
| 3 |
|
“Tax Fees” are the aggregate fees billed for professional services for tax advice, tax compliance, and tax planning. These fees include: all
global withholding tax services; excise and state tax reviews; capital gain, tax equalization and taxable basis calculations performed by the principal accountant. |
| 4 |
|
“All Other Fees” are the aggregate fees billed for products and services other than “Audit Fees”, “Audit-Related Fees”
and “Tax Fees”. These fees represent all “Agreed-Upon Procedures” engagements pertaining to the Fund’s use of leverage. |
|
|
|
|
|
|
|
|
|
|
|
|
|
|
|
|
|
| |
|
Percentage Approved Pursuant to Pre-approval Exception |
|
| |
|
Audit Fees Billed
to Funds |
|
|
Audit-Related Fees
Billed to Funds |
|
|
Tax Fees
Billed to Funds |
|
|
All Other Fees
Billed to Funds |
|
| Fund Name |
|
|
|
|
|
|
|
|
|
|
|
|
|
|
|
|
| Nuveen Dividend Value Fund |
|
|
0 |
% |
|
|
0 |
% |
|
|
0 |
% |
|
|
0 |
% |
| Nuveen Large Cap Select Fund |
|
|
0 |
% |
|
|
0 |
% |
|
|
0 |
% |
|
|
0 |
% |
| Nuveen Mid Cap Growth Opportunities Fund |
|
|
0 |
% |
|
|
0 |
% |
|
|
0 |
% |
|
|
0 |
% |
| Nuveen Mid Cap Value Fund |
|
|
0 |
% |
|
|
0 |
% |
|
|
0 |
% |
|
|
0 |
% |
| Nuveen Small Cap Growth Opportunities Fund |
|
|
0 |
% |
|
|
0 |
% |
|
|
0 |
% |
|
|
0 |
% |
| Nuveen Small Cap Select Fund |
|
|
0 |
% |
|
|
0 |
% |
|
|
0 |
% |
|
|
0 |
% |
| Nuveen Small Cap Value Fund |
|
|
0 |
% |
|
|
0 |
% |
|
|
0 |
% |
|
|
0 |
% |
|
|
|
|
|
| Fiscal Year Ended October 31, 2018 |
|
Audit Fees Billed
to Funds
1 |
|
|
Audit-Related Fees
Billed to Funds 2 |
|
|
Tax Fees
Billed to
Funds 3 |
|
|
All Other Fees
Billed to Funds 4 |
|
| Fund Name |
|
|
|
|
|
|
|
|
|
|
|
|
|
|
|
|
| Nuveen Dividend Value Fund |
|
|
19,071 |
|
|
|
0 |
|
|
|
2,979 |
|
|
|
0 |
|
| Nuveen Large Cap Select Fund |
|
|
14,523 |
|
|
|
0 |
|
|
|
0 |
|
|
|
0 |
|
| Nuveen Mid Cap Growth Opportunities Fund |
|
|
17,520 |
|
|
|
0 |
|
|
|
2,979 |
|
|
|
0 |
|
| Nuveen Mid Cap Value Fund |
|
|
14,712 |
|
|
|
3,500 |
|
|
|
2,979 |
|
|
|
0 |
|
| Nuveen Small Cap Growth Opportunities Fund |
|
|
14,647 |
|
|
|
0 |
|
|
|
2,979 |
|
|
|
0 |
|
| Nuveen Small Cap Select Fund |
|
|
14,752 |
|
|
|
3,500 |
|
|
|
2,979 |
|
|
|
0 |
|
| Nuveen Small Cap Value Fund |
|
|
23,593 |
|
|
|
0 |
|
|
|
2,169 |
|
|
|
0 |
|
|
|
|
|
|
|
|
|
|
|
|
|
|
|
|
|
|
| Total |
|
$ |
118,818 |
|
|
$ |
7,000 |
|
|
$ |
17,064 |
|
|
$ |
0 |
|
| 1 |
|
“Audit Fees” are the aggregate fees billed for professional services for the audit of the Fund’s annual financial statements and
services provided in connection with statutory and regulatory filings or engagements. |
| 2 |
|
“Audit-Related Fees” are the aggregate fees billed for assurance and related services reasonably related to the performance of the audit or
review of financial statements that are not reported under “Audit Fees”. These fees include offerings related to the Fund’s common shares and leverage. |
| 3 |
|
“Tax Fees” are the aggregate fees billed for professional services for tax advice, tax compliance, and tax planning. These fees include: all
global withholding tax services; excise and state tax reviews; capital gain, tax equalization and taxable basis calculations performed by the principal accountant. |
| 4 |
|
“All Other Fees” are the aggregate fees billed for products and services other than “Audit Fees”, “Audit-Related Fees”
and “Tax Fees”. These fees represent all “Agreed-Upon Procedures” engagements pertaining to the Fund’s use of leverage. |
|
|
|
|
|
|
|
|
|
|
|
|
|
|
|
|
|
| |
|
Percentage Approved Pursuant to Pre-approval Exception |
|
| |
|
Audit Fees Billed
to Funds |
|
|
Audit-Related Fees
Billed to Funds |
|
|
Tax Fees
Billed to
Funds |
|
|
All Other Fees
Billed
to Funds |
|
| Fund Name |
|
|
|
|
|
|
|
|
|
|
|
|
|
|
|
|
| Nuveen Dividend Value Fund |
|
|
0 |
% |
|
|
0 |
% |
|
|
0 |
% |
|
|
0 |
% |
| Nuveen Large Cap Select Fund |
|
|
0 |
% |
|
|
0 |
% |
|
|
0 |
% |
|
|
0 |
% |
| Nuveen Mid Cap Growth Opportunities Fund |
|
|
0 |
% |
|
|
0 |
% |
|
|
0 |
% |
|
|
0 |
% |
| Nuveen Mid Cap Value Fund |
|
|
0 |
% |
|
|
0 |
% |
|
|
0 |
% |
|
|
0 |
% |
| Nuveen Small Cap Growth Opportunities Fund |
|
|
0 |
% |
|
|
0 |
% |
|
|
0 |
% |
|
|
0 |
% |
| Nuveen Small Cap Select Fund |
|
|
0 |
% |
|
|
0 |
% |
|
|
0 |
% |
|
|
0 |
% |
| Nuveen Small Cap Value Fund |
|
|
0 |
% |
|
|
0 |
% |
|
|
0 |
% |
|
|
0 |
% |
|
|
|
|
|
|
|
|
|
|
|
|
|
|
|
|
|
| Fiscal Year Ended October 31, 2019 |
|
Audit-Related Fees
Billed to Adviser
and
Affiliated Fund
Service Providers |
|
|
Tax Fees Billed to
Adviser and
Affiliated Fund
Service Providers |
|
|
All Other Fees
Billed to Adviser
and Affiliated Fund
Service
Providers |
|
| Nuveen Investment Funds, Inc. |
|
$ |
0 |
|
|
$ |
0 |
|
|
$ |
0 |
|
|
|
| |
|
Percentage Approved Pursuant to Pre-approval Exception |
|
| |
|
Audit-Related Fees
Billed to Adviser and
Affiliated Fund
Service Providers |
|
|
Tax Fees Billed to
Adviser and
Affiliated Fund
Service Providers |
|
|
All Other Fees
Billed to Adviser
and Affiliated Fund
Service Providers |
|
|
|
|
0 |
% |
|
|
0 |
% |
|
|
0 |
% |
|
|
|
|
| Fiscal Year Ended October 31, 2018 |
|
Audit-Related Fees
Billed to Adviser and
Affiliated Fund
Service Providers |
|
|
Tax Fees Billed to
Adviser and
Affiliated Fund
Service Providers |
|
|
All Other Fees
Billed to Adviser
and Affiliated Fund
Service Providers |
|
| Nuveen Investment Funds, Inc. |
|
$ |
0 |
|
|
$ |
0 |
|
|
$ |
0 |
|
|
|
| |
|
Percentage Approved Pursuant to Pre-approval Exception |
|
| |
|
Audit-Related Fees
Billed to Adviser and
Affiliated Fund
Service Providers |
|
|
Tax Fees Billed to
Adviser and
Affiliated Fund
Service Providers |
|
|
All Other Fees
Billed to Adviser
and Affiliated Fund
Service Providers |
|
|
|
|
0 |
% |
|
|
0 |
% |
|
|
0 |
% |
|
|
|
|
|
|
|
|
|
|
|
|
|
|
|
|
|
| Fiscal Year Ended October 31, 2019 |
|
Total Non-Audit Fees
Billed to Funds |
|
|
Total Non-Audit Fees
billed to Adviser
and
Affiliated Fund Service
Providers (engagements
related directly to the
operations and financial
reporting of the Funds) |
|
|
Total Non-Audit Fees
billed to Adviser
and
Affiliated Fund Service
Providers (all other
engagements) |
|
|
Total |
|
| Fund Name |
|
|
|
|
|
|
|
|
|
|
|
|
|
|
|
|
| Nuveen Dividend Value Fund |
|
|
3,020 |
|
|
|
0 |
|
|
|
0 |
|
|
|
3,020 |
|
| Nuveen Large Cap Select Fund |
|
|
3,020 |
|
|
|
0 |
|
|
|
0 |
|
|
|
3,020 |
|
| Nuveen Mid Cap Growth Opportunities Fund |
|
|
3,020 |
|
|
|
0 |
|
|
|
0 |
|
|
|
3,020 |
|
| Nuveen Mid Cap Value Fund |
|
|
3,020 |
|
|
|
0 |
|
|
|
0 |
|
|
|
3,020 |
|
| Nuveen Small Cap Growth Opportunities Fund |
|
|
3,020 |
|
|
|
0 |
|
|
|
0 |
|
|
|
3,020 |
|
| Nuveen Small Cap Select Fund |
|
|
3,020 |
|
|
|
0 |
|
|
|
0 |
|
|
|
3,020 |
|
| Nuveen Small Cap Value Fund |
|
|
3,020 |
|
|
|
0 |
|
|
|
0 |
|
|
|
3,020 |
|
|
|
|
|
|
|
|
|
|
|
|
|
|
|
|
|
|
| Total |
|
$ |
21,140 |
|
|
$ |
0 |
|
|
$ |
0 |
|
|
$ |
21,140 |
|
“Non-Audit Fees billed to Fund” for both fiscal year ends represent “Tax Fees” and
“All Other Fees” billed to Fund in their respective amounts from the previous table.
Less than 50 percent of the
hours expended on the principal accountant’s engagement to audit the registrant’s financial statements for the most recent fiscal year were attributed to work performed by persons other than the principal accountant’s full-time,
permanent employees.
|
|
|
|
|
|
|
|
|
|
|
|
|
|
|
|
|
| Fiscal Year Ended October 31, 2018 |
|
Total Non-Audit Fees
Billed to Funds |
|
|
Total Non-Audit Fees
billed to Adviser
and
Affiliated Fund Service
Providers (engagements
related directly to the
operations and financial
reporting of the Funds) |
|
|
Total Non-Audit Fees
billed to Adviser
and
Affiliated Fund Service
Providers (all other
engagements) |
|
|
Total |
|
| Fund Name |
|
|
|
|
|
|
|
|
|
|
|
|
|
|
|
|
| Nuveen Dividend Value Fund |
|
|
2,979 |
|
|
|
0 |
|
|
|
0 |
|
|
|
2,979 |
|
| Nuveen Large Cap Select Fund |
|
|
0 |
|
|
|
0 |
|
|
|
0 |
|
|
|
0 |
|
| Nuveen Mid Cap Growth Opportunities Fund |
|
|
2,979 |
|
|
|
0 |
|
|
|
0 |
|
|
|
2,979 |
|
| Nuveen Mid Cap Value Fund |
|
|
2,979 |
|
|
|
0 |
|
|
|
0 |
|
|
|
2,979 |
|
| Nuveen Small Cap Growth Opportunities Fund |
|
|
2,979 |
|
|
|
0 |
|
|
|
0 |
|
|
|
2,979 |
|
| Nuveen Small Cap Select Fund |
|
|
2,979 |
|
|
|
0 |
|
|
|
0 |
|
|
|
2,979 |
|
| Nuveen Small Cap Value Fund |
|
|
2,169 |
|
|
|
0 |
|
|
|
0 |
|
|
|
2,169 |
|
|
|
|
|
|
|
|
|
|
|
|
|
|
|
|
|
|
| Total |
|
$ |
17,064 |
|
|
$ |
0 |
|
|
$ |
0 |
|
|
$ |
17,064 |
|
“Non-Audit Fees billed to Fund” for both fiscal year ends represent “Tax Fees” and
“All Other Fees” billed to Fund in their respective amounts from the previous table.
Audit Committee
Pre-Approval Policies and Procedures. Generally, the Audit Committee must approve (i) all non-audit services to be performed for the Funds by the Funds’ independent accountant and (ii) all audit and non-audit services to be
performed by the Funds’ independent accountant for the Affiliated Fund Service Providers with respect to the operations and financial reporting of the Funds. Regarding tax and research projects conducted by the independent accountant for the
Funds and Affiliated Fund Service Providers (with respect to operations and financial reports of the Trust), such engagements will be (i) pre-approved by the Audit Committee if they are expected to be for amounts greater than $10,000;
(ii) reported to the Audit Committee Chair for her verbal approval prior to engagement if they are expected to be for amounts under $10,000 but greater than $5,000; and (iii) reported to the Audit Committee at the next Audit Committee
meeting if they are expected to be for an amount under $5,000.
ITEM 5. AUDIT COMMITTEE OF LISTED REGISTRANTS.
Not applicable to this registrant.
ITEM 6. SCHEDULE OF INVESTMENTS.
| a) |
|
See Portfolio of Investments in Item 1. |
ITEM 7. DISCLOSURE OF PROXY VOTING POLICIES AND PROCEDURES FOR CLOSED-END
MANAGEMENT INVESTMENT COMPANIES.
Not applicable to this registrant.
ITEM 8. PORTFOLIO MANAGERS OF CLOSED-END MANAGEMENT INVESTMENT COMPANIES.
Not applicable to this registrant.
ITEM 9. PURCHASES OF EQUITY SECURITIES BY CLOSED-END MANAGEMENT
INVESTMENT COMPANY AND AFFILIATED PURCHASERS.
Not applicable to this registrant.
ITEM 10. SUBMISSION OF MATTERS TO A VOTE OF SECURITY HOLDERS.
There have been no material changes to the procedures by which shareholders may recommend nominees to the
registrant’s Board of Trustees implemented after the registrant last provided disclosure in response to this Item.
ITEM 11.
CONTROLS AND PROCEDURES.
| |
(a) |
|
The registrant’s principal executive and principal financial officers, or persons performing similar functions, have concluded that the
registrant’s disclosure controls and procedures (as defined in Rule 30a-3(c) under the Investment Company Act of 1940, as amended (the “1940 Act”) (17 CFR 270.30a-3(c))) are effective, as of a
date within 90 days of the filing date of this report that includes the disclosure required by this paragraph, based on their evaluation of the controls and procedures required by Rule 30a-3(b) under the 1940
Act (17 CFR 270.30a-3(b)) and Rules 13a-15(b) or 15d-15(b) under the Securities Exchange Act of 1934, as amended (the “Exchange Act”) (17 CFR 240.13a-15(b) or
240.15d-15(b)). |
| |
(b) |
|
There were no changes in the registrant’s internal control over financial reporting (as defined in Rule
30a-3(d) under the 1940 Act (17 CFR 270.30a-3(d)) that occurred during the period covered by this report that has materially affected, or is reasonably likely to materially affect, the registrant’s
internal control over financial reporting. |
ITEM 12. DISCLOSURE OF SECURITIES LENDING ACTIVITIES FOR CLOSED-END
MANAGEMENT INVESTMENT COMPANIES.
Not applicable.
ITEM 13. EXHIBITS.
File the exhibits listed below as part of this
Form.
|
|
|
| (a)(1) |
|
Any code of ethics, or amendment thereto, that is the subject of the disclosure required by Item 2, to the extent that the registrant intends to satisfy the Item 2
requirements through filing of an exhibit: Not applicable because the code is posted on registrant’s website at www.nuveen.com/fund-governance and there were no amendments during the period covered by this report. (To view the code, click on
Code of Conduct.) |
|
|
| (a)(2) |
|
A separate certification for each principal executive officer and principal financial officer of the registrant as required by
Rule 30a-2(a) under the 1940 Act (17 CFR 270.30a-2(a)) in the exact form set forth below: See EX-99.CERT attached hereto. |
|
|
| (a)(3) |
|
Any written solicitation to purchase securities under Rule 23c-1 under the 1940 Act (17 CFR
270.23c-1) sent or given during the period covered by the report by or on behalf of the registrant to 10 or more persons: Not applicable to this registrant. |
|
|
| (a)(4) |
|
Change in the registrant’s independent public accountant. Not applicable. |
|
|
| (b) |
|
If the report is filed under Section 13(a) or 15(d) of the Exchange Act, provide the certifications required by Rule 30a-2(b) under the
1940 Act (17 CFR 270.30a-2(b)), Rule 13a-14(b) or Rule 15d-14(b) under the Exchange Act (17 CFR 240.13a-14(b) or 240.15d-14(b)), and Section 1350 of Chapter 63 of
Title 18 of the United States Code (18 U.S.C. 1350) as an Exhibit. A certification furnished pursuant to this paragraph will not be deemed “filed” for purposes of Section 18 of the Exchange Act (15 U.S.C. 78r), or otherwise subject to
the liability of that section. Such certification will not be deemed to be incorporated by reference into any filing under the Securities Act of 1933 or the Exchange Act, except to the extent that the registration specifically incorporates it by
reference: See EX-99.906 CERT attached hereto. |
SIGNATURES
Pursuant to the requirements of the Securities Exchange Act of 1934 and the Investment Company Act of 1940, the
registrant has duly caused this report to be signed on its behalf by the undersigned, thereunto duly authorized.
(Registrant) Nuveen Investment Funds, Inc.
|
|
|
|
|
| By (Signature and Title) |
|
/s/ Christopher M. Rohrbacher |
|
|
Christopher M. Rohrbacher |
|
|
Vice President and Secretary |
Date: January 8, 2020
Pursuant to the requirements of the Securities Exchange Act of 1934 and the Investment Company Act of 1940, this
report has been signed below by the following persons on behalf of the registrant and in the capacities and on the dates indicated.
|
|
|
|
|
| By (Signature and Title) |
|
/s/ Greg A. Bottjer |
|
|
Greg A. Bottjer |
|
|
Chief Administrative Officer |
|
|
(principal executive officer) |
Date: January 8, 2020
|
|
|
|
|
| By (Signature and Title) |
|
/s/ E. Scott Wickerham |
|
|
E. Scott Wickerham |
|
|
Vice President and Controller |
|
|
(principal financial officer) |
Date: January 8, 2020