UNITED STATES
SECURITIES AND EXCHANGE COMMISSION
Washington, D.C. 20549
FORM N-CSR
CERTIFIED SHAREHOLDER REPORT OF REGISTERED MANAGEMENT
INVESTMENT COMPANIES
Investment Company Act file number 811-05309
Nuveen Investment Funds, Inc.
(Exact name of registrant as specified in charter)
Nuveen Investments
333 West Wacker Drive Chicago, IL 60606
(Address of principal executive offices) (Zip code)
Kevin J. McCarthy
Nuveen Investments
333 West Wacker Drive Chicago, IL 60606
(Name and address of agent for service)
Registrant’s telephone number, including area code: (312) 917-7700
Date of fiscal year end: October 31
Date of reporting period: April 30, 2012
Form N-CSR is to be used by management investment companies to file reports with the Commission not later than 10 days after the transmission to stockholders of any report that is required to be transmitted to stockholders under Rule 30e-1 under the Investment Company Act of 1940 (17 CFR 270.30e-1). The Commission may use the information provided on Form N-CSR in its regulatory, disclosure review, inspection, and policy making roles.
A registrant is required to disclose the information specified by Form N-CSR, and the Commission will make this information public. A registrant is not required to respond to the collection of information contained in Form N-CSR unless the Form displays a currently valid Office of Management and Budget (“OMB”) control number. Please direct comments concerning the accuracy of the information collection burden estimate and any suggestions for reducing the burden to Secretary, Securities and Exchange Commission, 450 Fifth Street, NW, Washington, DC 20549-0609. The OMB has reviewed this collection of information under the clearance requirements of 44 U.S.C. ss.3507.
Item 1. Reports to Stockholders.

Mutual Funds
Nuveen Index Funds
For investors seeking the potential for long-term capital appreciation.
Semi-Annual Report
April 30, 2012
| Share Class / Ticker Symbol | ||||||||||
| Fund Name | Class A | Class B | Class C | Class R3 | Class I | |||||
| Nuveen Equity Index Fund |
FAEIX | FAEQX | FCEIX | FADSX | FEIIX | |||||
| Nuveen Mid Cap Index Fund |
FDXAX | — | FDXCX | FMCYX | FIMEX | |||||
| Nuveen Small Cap Index Fund |
FMDAX | — | FPXCX | ARSCX | ASETX | |||||
LIFE IS COMPLEX.
Nuveen makes things e-simple.
It only takes a minute to sign up for e-Reports. Once enrolled, you’ll receive an e-mail as soon as your Nuveen Fund information is ready. No more waiting for delivery by regular mail. Just click on the link within the e-mail to see the report and save it on your computer if you wish.
Free e-Reports right to your e-mail!
www.investordelivery.com
If you receive your Nuveen Fund distributions and statements from your financial advisor or brokerage account.
OR
www.nuveen.com/accountaccess
If you receive your Nuveen Fund distributions and statements directly from Nuveen.
| Must be preceded by or accompanied by a prospectus. | NOT FDIC INSURED | MAY LOSE VALUE | NO BANK GUARANTEE |
| 4 | ||||
| 5 | ||||
| 8 | ||||
| 12 | ||||
| 13 | ||||
| 14 | ||||
| 83 | ||||
| 84 | ||||
| 85 | ||||
| 86 | ||||
| 92 | ||||
| 106 | ||||
| 107 | ||||
Letter to Shareholders


| 4 | Nuveen Investments |
Certain statements in this report are forward-looking statements. Discussions of specific investments are for illustration only and are not intended as recommendations of individual investments. The forward-looking statements and other views expressed herein are those of the portfolio managers as of the date of this report. Actual future results or occurrences may differ significantly from those anticipated in any forward-looking statements and the views expressed herein are subject to change at any time, due to numerous market and other factors. The Funds disclaim any obligation to update publicly or revise any forward-looking statements or views expressed herein.
These Funds feature portfolio management by Nuveen Asset Management, LLC, an affiliate of Nuveen Investments. Walt French and David Friar are the portfolio managers for the Funds. Walt has 38 years of investment experience and has managed the Nuveen Equity Index Fund since 1999. David has 14 years of investment experience and has managed the Nuveen Equity Index Fund since 2000. Walt and Dave have managed the Nuveen Mid Cap Index Fund and the Nuveen Small Cap Index Fund since 2001. On the following pages, the portfolio management team examines the Funds’ performance for the six-month period ended April 30, 2012.
Nuveen Equity Index Fund
How did the Fund perform during the six-month period ended April 30, 2012?
The tables in the Fund Performance and Expense Ratios section of this report provide Class A Share total returns for the Fund for the six-month, one-year, five-year and ten-year periods ended April 30, 2012. The Fund’s Class A Shares at net asset value (NAV) underperformed the S&P 500® Index, but performed in-line with the Lipper S&P 500® Index Objective Funds Classification Average over the six-month period.
What strategies were used to manage the Fund during the reporting period? How did these strategies influence performance?
The Fund is invested to replicate the return of the S&P 500® Index as closely as possible, with consideration given to turnover costs and fees. We believe the Fund’s objective can best be achieved by investing in approximately 90% to 100% of the issues included in the S&P 500® Index, depending on the size of the Fund. During this reporting period, we held essentially all of the issues found in the index. In addition, we aggressively tracked and implemented the occasional changes to index member names, as well as changes to the relative weights in the index.
The Fund performed very similarly to the index during the reporting period. The three best performing sectors in the index were consumer discretionary, information technology and financials. The three lowest performing sectors were energy, utilities and materials. Also during the period, we continued to invest in S&P 500® Index futures to convert cash into the equivalent of an S&P 500® Index holding in order to manage cash flow activity and minimize tracking error to the Fund’s benchmark index.
| Nuveen Investments | 5 |
Nuveen Mid Cap Index Fund
How did the Fund perform during the six-month period ended April 30, 2012?
The tables in the Fund Performance and Expense Ratios section of this report provide Class A Share total returns for the Fund for the six-month, one-year, five-year and ten-year periods ended April 30, 2012. The Fund’s Class A Shares at net asset value (NAV) underperformed the S&P MidCap 400® Index, but outperformed the Lipper Mid-Cap Core Funds Classification Average over the six-month period.
What strategies were used to manage the Fund during the reporting period? How did these strategies influence performance?
The Fund is invested to replicate the return of the S&P MidCap 400® Index as closely as possible, with consideration given to turnover costs and fees. We believe the Fund’s objective can best be achieved by investing in approximately 90% to 100% of the issues included in the S&P MidCap 400® Index, depending on the size of the Fund. During this reporting period, we held essentially all of the issues found in the index. In addition, we aggressively tracked and implemented the occasional changes to index member names, as well as changes to the relative weights in the index.
The Fund performed very similarly to the index during the reporting period. The three best performing sectors in the index were industrials, telecommunications and materials. The three lowest performing sectors were energy, utilities and consumer staples. Also during the period, we continued to invest in S&P MidCap 400® Index futures to convert cash into the equivalent of an S&P MidCap 400® Index holding in order to manage cash flow activity and minimize tracking error to the Fund’s benchmark index.
Nuveen Small Cap Index Fund
How did the Fund perform during the six-month period ended April 30, 2012?
The tables in the Fund Performance and Expense Ratios section of this report provide Class A Share total returns for the Fund for the six-month, one-year, five-year and ten-year periods ended April 30, 2012. The Fund’s Class A Shares at net asset value (NAV) underperformed the Russell 2000® Index, but outperformed the Lipper Small-Cap Core Funds Classification Average over the six-month period.
What strategies were used to manage the Fund during the reporting period? How did these strategies influence performance?
The Fund is invested to replicate the return of the Russell 2000® Index as closely as possible, with consideration given to turnover costs and fees. We believe the Fund’s objective can best be achieved by investing in approximately 90% to 100% of the issues included in the Russell 2000® Index, depending on the size of the Fund. During this reporting period, we held essentially all of the issues found in the index. In addition, we aggressively tracked and implemented the occasional changes to index member names,
| 6 | Nuveen Investments |
as well as changes to the relative weights in the index. Russell’s practice is to withhold major changes for a mid-summer rebalancing, which did not take place during this reporting period.
The Fund performed very similarly to the index during the reporting period. The three best performing sectors in the index were financials, consumer discretionary and health care. The three lowest performing sectors were utilities, energy and telecommunications. Also during the period, we continued to invest in Russell 2000® Index futures to convert cash into the equivalent of a Russell 2000® Index holding in order to manage cash flow activity and minimize tracking error to the Fund’s benchmark index.
Risk Considerations
Mutual fund investing involves risk; principal loss is possible. The Funds’ investment in common stocks involves the risk of decline due to adverse company or industry news or a general economic decline. The use of derivatives involves substantial financial risk and transaction costs. In addition, each Fund may fail to match index performance. Small- and mid-cap stocks are subject to greater price volatility and liquidity risks.
| Nuveen Investments | 7 |
Fund Performance and Expense Ratios
The Fund Performance and Expense Ratios for each Fund are shown on the following three pages.
Returns quoted represent past performance, which is no guarantee of future results. Current performance may be higher or lower than the performance shown. Investment returns and principal value will fluctuate so that when shares are redeemed, they may be worth more or less than their original cost. Returns without sales charges would be lower if the sales charge were included. Returns do not reflect the deduction of taxes that a shareholder would pay on Fund distributions or the redemption of Fund shares.
Returns may reflect a contractual agreement between certain Funds and the investment adviser to waive certain fees and expenses; see Notes to Financial Statements, Footnote 7 — Management Fees and Other Transactions with Affiliates for more information. In addition, returns may reflect a voluntary expense limitation by the Funds’ investment adviser that may be modified or discontinued at any time without notice. For the most recent month-end performance visit www.nuveen.com or call (800) 257-8787.
Returns reflect differences in sales charges and expenses, which are primarily differences in distribution and service fees. Fund returns assume reinvestment of dividends and capital gains.
Comparative index and Lipper return information is provided for the Funds’ Class A Shares at net asset value (NAV) only.
The expense ratios shown reflect the Funds’ total operating expenses (before fee waivers or expense reimbursements, if any) as shown in the Funds’ most recent prospectus. The expense ratios include management fees and other fees and expenses.
| 8 | Nuveen Investments |
Nuveen Equity Index Fund
Refer to the first page of this Fund Performance and Expense Ratios Section for further explanation of the information included within this page.
Fund Performance
Average Annual Total Returns as of April 30, 2012*
| Cumulative | Average Annual | |||||||||||||||||
| 6-Month | 1-Year | 5-Year | 10-Year | |||||||||||||||
| Class A Shares |
12.42% | 4.15% | 0.53% | 4.18% | ||||||||||||||
| S&P 500® Index** |
12.77% | 4.76% | 1.01% | 4.71% | ||||||||||||||
| Lipper S&P 500® Index Objective Funds Classification Average** |
12.43% | 4.13% | 0.47% | 4.17% | ||||||||||||||
| Class B Shares w/o CDSC*** |
12.00% | 3.36% | -0.22% | 3.40% | ||||||||||||||
| Class B Shares w/CDSC*** |
7.00% | -1.38% | -0.38% | 3.40% | ||||||||||||||
| Class C Shares |
12.02% | 3.34% | -0.22% | 3.40% | ||||||||||||||
| Class R3 Shares |
12.26% | 3.85% | 0.28% | 3.97% | ||||||||||||||
| Class I Shares |
12.56% | 4.37% | 0.78% | 4.44% | ||||||||||||||
Average Annual Total Returns as of March 31, 2012 (Most Recent Calendar Quarter)*
| Cumulative | Average Annual | |||||||||||||||||
| 6-Month | 1-Year | 5-Year | 10-Year | |||||||||||||||
| Class A Shares |
25.54% | 7.87% | 1.54% | 3.59% | ||||||||||||||
| Class B Shares w/o CDSC*** |
25.04% | 7.07% | 0.77% | 2.82% | ||||||||||||||
| Class B Shares w/CDSC*** |
20.04% | 2.16% | 0.61% | 2.82% | ||||||||||||||
| Class C Shares |
25.03% | 7.07% | 0.77% | 2.82% | ||||||||||||||
| Class R3 Shares |
25.37% | 7.66% | 1.29% | 3.39% | ||||||||||||||
| Class I Shares |
25.70% | 8.19% | 1.79% | 3.86% | ||||||||||||||
Class A Shares have no sales charge and are available only through fee-based programs and certain retirement plans. Class B Shares have a CDSC that begins at 5% for redemptions during the first year and declines periodically until after six years when the charge becomes 0%. Class B Shares automatically convert to Class A Shares eight years after purchase. Class C Shares have a 1% CDSC for redemptions within less than twelve months, which is not reflected in the one-year total return. Class R3 Shares have no sales charge and are available to only certain retirement plans. Class I Shares have no sales charge and may be purchased under limited circumstances or by specified classes of investors.
Expense Ratios as of Most Recent Prospectus
| Gross Expense Ratios |
Net Expense Ratios |
|||||||
| Class A Shares |
0.68% | 0.61% | ||||||
| Class B Shares |
1.43% | 1.36% | ||||||
| Class C Shares |
1.43% | 1.36% | ||||||
| Class R3 Shares |
0.93% | 0.86% | ||||||
| Class I Shares |
0.43% | 0.36% | ||||||
The Fund’s adviser has contractually agreed to waive fees and/or reimburse other Fund expenses through February 28, 2013, so that total annual Fund operating expenses, after fee waivers and/or expense reimbursements and excluding acquired Fund fees and expenses, do not exceed 0.62%, 1.37%, 1.37%, 0.87% and 0.37% for Class A, Class B, Class C, Class R3 and Class I Shares, respectively. Fee waivers and/or expense reimbursements will not be terminated prior to that time without with approval of the Fund’s Board of Directors.
| * | Six-month returns are cumulative; all other returns are annualized. |
| ** | Refer to the Glossary of Terms Used in this Report for definitions. Indexes and Lipper averages are not available for direct investment. |
| *** | Class B Shares are available only upon the exchange of Class B Shares from another Nuveen mutual fund or for purposes of dividend reinvestment, but Class B Shares are not available for new accounts or for additional investment into existing accounts. |
| Nuveen Investments | 9 |
Fund Performance and Expense Ratios (continued)
Nuveen Mid Cap Index Fund
Refer to the first page of this Fund Performance and Expense Ratios Section for further explanation of the information included within this page.
Fund Performance
Average Annual Total Returns as of April 30, 2012*
| Cumulative | Average Annual | |||||||||||||||||
| 6-Month | 1-Year | 5-Year | 10-Year | |||||||||||||||
| Class A Shares |
12.13% | -1.43% | 3.64% | 7.11% | ||||||||||||||
| S&P MidCap 400® Index** |
12.48% | -0.94% | 4.11% | 7.72% | ||||||||||||||
| Lipper Mid-Cap Core Funds Classification Average** |
11.18% | -2.71% | 1.83% | 6.28% | ||||||||||||||
| Class C Shares |
11.68% | -2.16% | 2.85% | 6.30% | ||||||||||||||
| Class R3 Shares |
11.96% | -1.64% | 3.38% | 6.89% | ||||||||||||||
| Class I Shares |
12.30% | -1.16% | 3.90% | 7.37% | ||||||||||||||
Average Annual Total Returns as of March 31, 2012 (Most Recent Calendar Quarter)*
| Cumulative | Average Annual | |||||||||||||||||
| 6-Month | 1-Year | 5-Year | 10-Year | |||||||||||||||
| Class A Shares |
27.85% | 1.64% | 4.31% | 7.09% | ||||||||||||||
| Class C Shares |
27.37% | 0.81% | 3.54% | 6.28% | ||||||||||||||
| Class R3 Shares |
27.63% | 1.38% | 4.05% | 6.86% | ||||||||||||||
| Class I Shares |
27.88% | 1.82% | 4.56% | 7.34% | ||||||||||||||
Class A Shares have no sales charge and are available only through fee-based programs and certain retirement plans. Class C Shares have a 1% CDSC for redemptions within less than twelve months, which is not reflected in the one-year total return. Class R3 Shares have no sales charge and are available to only certain retirement plans. Class I Shares have no sales charge and may be purchased under limited circumstances or by specified classes of investors.
Expense Ratios as of Most Recent Prospectus
| Gross Expense Ratios |
Net Expense Ratios |
|||||||
| Class A Shares |
0.93% | 0.76% | ||||||
| Class C Shares |
1.68% | 1.51% | ||||||
| Class R3 Shares |
1.18% | 1.01% | ||||||
| Class I Shares |
0.68% | 0.51% | ||||||
The Fund’s adviser has contractually agreed to waive fees and/or reimburse other Fund expenses through February 28, 2013, so that total annual Fund operating expenses, after fee waivers and/or expense reimbursements and excluding acquired Fund fees and expenses, do not exceed 0.75%, 1.50%, 1.00% and 0.50% for Class A, Class C, Class R3 and Class I Shares, respectively. Fee waivers and/or expense reimbursements will not be terminated prior to that time without with approval of the Fund’s Board of Directors.
| * | Six-month returns are cumulative; all other returns are annualized. |
| ** | Refer to the Glossary of Terms Used in this Report for definitions. Indexes and Lipper averages are not available for direct investment. |
| 10 | Nuveen Investments |
Nuveen Small Cap Index Fund
Refer to the first page of this Fund Performance and Expense Ratios Section for further explanation of the information included within this page.
Fund Performance
| Average Annual Total Returns as of April 30, 2012* | ||||||||||||||||||
| Cumulative | Average Annual | |||||||||||||||||
| 6-Month | 1-Year | 5-Year | 10-Year | |||||||||||||||
| Class A Shares |
10.76% | -4.76% | 1.10% | 5.44% | ||||||||||||||
| Russell 2000® Index** |
11.02% | -4.25% | 1.45% | 6.19% | ||||||||||||||
| Lipper Small-Cap Core Funds Classification Average** |
10.58% | -3.64% | 1.46% | 6.43% | ||||||||||||||
| Class C Shares |
10.28% | -5.47% | 0.33% | 4.62% | ||||||||||||||
| Class R3 Shares |
10.54% | -5.04% | 0.82% | 5.18% | ||||||||||||||
| Class I Shares |
10.83% | -4.59% | 1.33% | 5.68% | ||||||||||||||
Average Annual Total Returns as of March 31, 2012 (Most Recent Calendar Quarter)*
| Cumulative | Average Annual | |||||||||||||||||
| 6-Month | 1-Year | 5-Year | 10-Year | |||||||||||||||
| Class A Shares |
29.50% | -0.74% | 1.76% | 5.65% | ||||||||||||||
| Class C Shares |
29.05% | -1.49% | 1.01% | 4.84% | ||||||||||||||
| Class R3 Shares |
29.30% | -1.01% | 1.50% | 5.40% | ||||||||||||||
| Class I Shares |
29.63% | -0.48% | 2.01% | 5.89% | ||||||||||||||
Class A Shares have no sales charge and are available only through fee-based programs and certain retirement plans. Class C Shares have a 1% CDSC for redemptions within less than twelve months, which is not reflected in the one-year total return. Class R3 Shares have no sales charge and are available to only certain retirement plans. Class I Shares have no sales charge and may be purchased under limited circumstances or by specified classes of investors.
Expense Ratios as of Most Recent Prospectus
| Gross Expense Ratios |
Net Expense Ratios |
|||||||
| Class A Shares |
1.14% | 0.89% | ||||||
| Class C Shares |
1.89% | 1.64% | ||||||
| Class R3 Shares |
1.39% | 1.14% | ||||||
| Class I Shares |
0.89% | 0.64% | ||||||
The Fund’s adviser has contractually agreed to waive fees and/or reimburse other Fund expenses through February 28, 2013, so that total annual Fund operating expenses, after fee waivers and/or expense reimbursements and excluding acquired Fund fees and expenses, do not exceed 0.83%, 1.58%, 1.08% and 0.58% for Class A, Class C, Class R3 and Class I Shares, respectively. Fee waivers and/or expense reimbursements will not be terminated prior to that time without with approval of the Fund’s Board of Directors.
| * | Six-month returns are cumulative; all other returns are annualized. |
| ** | Refer to the Glossary of Terms Used in this Report for definitions. Indexes and Lipper averages are not available for direct investment. |
| Nuveen Investments | 11 |
Holding Summaries as of April 30, 2012
This data relates to the securities held in each Fund’s portfolio of investments. It should not be construed as a measure of performance for the Fund itself.

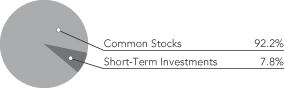
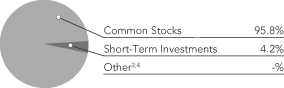
| 1 | As a percentage of total investments (excluding investments in derivatives and investments purchased with collateral from securities lending) as of April 30, 2012. Holdings are subject to change. |
| 2 | As a percentage of total common stocks as of April 30, 2012. Holdings are subject to change. |
| 3 | The percentage of “Other” includes rights and warrants held as of the end of the reporting period. Holdings are subject to change. |
| 4 | Rounds to less than 0.1%. |
| 12 | Nuveen Investments |
As a shareholder of one or more of the Funds, you incur two types of costs: (1) transaction costs, including up-front and back-end sales charges (loads) or redemption fees, where applicable; and (2) ongoing costs, including management fees; distribution and service (12b-1) fees, where applicable; and other Fund expenses. The Examples below are intended to help you understand your ongoing costs (in dollars) of investing in the Funds and to compare these costs with the ongoing costs of investing in other mutual funds.
The Examples below are based on an investment of $1,000 invested at the beginning of the period and held for the period.
The information under “Actual Performance,” together with the amount you invested, allows you to estimate actual expenses incurred over the reporting period. Simply divide your account value by $1,000 (for example, an $8,600 account value divided by $1,000 = 8.60) and multiply the result by the cost shown for your share class, in the row entitled “Expenses Incurred During Period” to estimate the expenses incurred on your account during this period.
The information under “Hypothetical Performance,” provides information about hypothetical account values and hypothetical expenses based on the respective Fund’s actual expense ratio and an assumed rate of return of 5% per year before expenses, which is not the Fund’s actual return. The hypothetical account values and expenses may not be used to estimate the actual ending account balance or expense you incurred for the period. You may use this information to compare the ongoing costs of investing in the Fund and other Funds. To do so, compare this 5% hypothetical example with the 5% hypothetical examples that appear in the shareholder reports of the other funds.
Please note that the expenses shown in the table are meant to highlight your ongoing costs only and do not reflect any transaction costs. Therefore, the hypothetical information is useful in comparing ongoing costs only, and will not help you determine the relative total costs of owning different funds or share classes. In addition, if these transaction costs were included, your costs would have been higher.
Nuveen Equity Index Fund
| Hypothetical Performance | ||||||||||||||||||||||||||||||||||||||||||
| Actual Performance | (5% annualized return before expenses) | |||||||||||||||||||||||||||||||||||||||||
| A Shares | B Shares | C Shares | R3 Shares | I Shares | A Shares | B Shares | C Shares | R3 Shares | I Shares | |||||||||||||||||||||||||||||||||
| Beginning Account Value (11/01/11) | $ | 1,000.00 | $ | 1,000.00 | $ | 1,000.00 | $ | 1,000.00 | $ | 1,000.00 | $ | 1,000.00 | $ | 1,000.00 | $ | 1,000.00 | $ | 1,000.00 | $ | 1,000.00 | ||||||||||||||||||||||
| Ending Account Value (4/30/12) | $ | 1,124.20 | $ | 1,120.00 | $ | 1,120.20 | $ | 1,122.60 | $ | 1,125.60 | $ | 1,021.78 | $ | 1,018.05 | $ | 1,018.05 | $ | 1,020.54 | $ | 1,023.02 | ||||||||||||||||||||||
| Expenses Incurred During Period | $ | 3.27 | $ | 7.22 | $ | 7.22 | $ | 4.59 | $ | 1.96 | $ | 3.12 | $ | 6.87 | $ | 6.87 | $ | 4.37 | $ | 1.86 | ||||||||||||||||||||||
For each class of the Fund, expenses are equal to the Fund’s annualized net expense ratio of .62%, 1.37%, 1.37%, .87% and ..37% for Classes A, B, C, R3 and I, respectively, multiplied by the average account value over the period, multiplied by 182/366 (to reflect the one-half year period).
Nuveen Mid Cap Index Fund
| Hypothetical Performance | ||||||||||||||||||||||||||||||||||
| Actual Performance | (5% annualized return before expenses) | |||||||||||||||||||||||||||||||||
| A Shares | C Shares | R3 Shares | I Shares | A Shares | C Shares | R3 Shares | I Shares | |||||||||||||||||||||||||||
| Beginning Account Value (11/01/11) | $ | 1,000.00 | $ | 1,000.00 | $ | 1,000.00 | $ | 1,000.00 | $ | 1,000.00 | $ | 1,000.00 | $ | 1,000.00 | $ | 1,000.00 | ||||||||||||||||||
| Ending Account Value (4/30/12) | $ | 1,121.30 | $ | 1,116.80 | $ | 1,119.60 | $ | 1,123.00 | $ | 1,021.18 | $ | 1,017.45 | $ | 1,019.94 | $ | 1,022.43 | ||||||||||||||||||
| Expenses Incurred During Period | $ | 3.90 | $ | 7.84 | $ | 5.22 | $ | 2.59 | $ | 3.72 | $ | 7.47 | $ | 4.97 | $ | 2.46 | ||||||||||||||||||
For each class of the Fund, expenses are equal to the Fund’s annualized net expense ratio of .74%, 1.49%, .99% and .49% for Classes A, C, R3 and I, respectively, multiplied by the average account value over the period, multiplied by 182/366 (to reflect the one-half year period).
Nuveen Small Cap Index Fund
| Hypothetical Performance | ||||||||||||||||||||||||||||||||||
| Actual Performance | (5% annualized return before expenses) | |||||||||||||||||||||||||||||||||
| A Shares | C Shares | R3 Shares | I Shares | A Shares | C Shares | R3 Shares | I Shares | |||||||||||||||||||||||||||
| Beginning Account Value (11/01/11) | $ | 1,000.00 | $ | 1,000.00 | $ | 1,000.00 | $ | 1,000.00 | $ | 1,000.00 | $ | 1,000.00 | $ | 1,000.00 | $ | 1,000.00 | ||||||||||||||||||
| Ending Account Value (4/30/12) | $ | 1,107.60 | $ | 1,102.80 | $ | 1,105.40 | $ | 1,108.30 | $ | 1,020.74 | $ | 1,017.01 | $ | 1,019.49 | $ | 1,021.98 | ||||||||||||||||||
| Expenses Incurred During Period | $ | 4.35 | $ | 8.26 | $ | 5.65 | $ | 3.04 | $ | 4.17 | $ | 7.92 | $ | 5.42 | $ | 2.92 | ||||||||||||||||||
For each class of the Fund, expenses are equal to the Fund’s annualized net expense ratio of .83%, 1.58%, 1.08% and .58% for Classes A, C, R3 and I, respectively, multiplied by the average account value over the period, multiplied by 182/366 (to reflect the one-half year period).
| Nuveen Investments | 13 |
Portfolio of Investments (Unaudited)
Nuveen Equity Index Fund
April 30, 2012
| Shares | Description (1) | Value | ||||||||||||
| COMMON STOCKS – 96.9% |
||||||||||||||
| Consumer Discretionary – 10.9% |
||||||||||||||
| 5,053 | Abercrombie & Fitch Co., Class A |
$ | 253,509 | |||||||||||
| 21,386 | Amazon.com, Inc., (2) |
4,959,413 | ||||||||||||
| 7,443 | Apollo Group, Inc., (2) |
262,142 | ||||||||||||
| 3,009 | AutoNation Inc., (2), (3) |
104,051 | ||||||||||||
| 1,622 | AutoZone, Inc., (2) |
642,572 | ||||||||||||
| 14,855 | Bed Bath and Beyond Inc., (2), (3) |
1,045,643 | ||||||||||||
| 17,252 | Best Buy Co., Inc. |
380,752 | ||||||||||||
| 3,980 | Big Lots, Inc., (2) |
145,827 | ||||||||||||
| 3,759 | BorgWarner Inc., (2), (3) |
297,111 | ||||||||||||
| 10,913 | Cablevision Systems Corporation |
161,731 | ||||||||||||
| 13,737 | CarMax, Inc., (2) |
424,061 | ||||||||||||
| 26,602 | Carnival, ADR, (3) |
864,299 | ||||||||||||
| 40,662 | CBS Corporation, Class B |
1,356,078 | ||||||||||||
| 1,361 | Chipotle Mexican Grill, (2), (3) |
563,658 | ||||||||||||
| 17,156 | Coach, Inc. |
1,255,133 | ||||||||||||
| 160,182 | Comcast Corporation, Class A |
4,858,320 | ||||||||||||
| 15,418 | D.R. Horton, Inc. |
252,084 | ||||||||||||
| 7,749 | Darden Restaurants, (3) |
388,070 | ||||||||||||
| 3,739 | Devry, Inc. |
120,209 | ||||||||||||
| 41,478 | DIRECTV Group, Inc., (2) |
2,043,621 | ||||||||||||
| 15,536 | Discovery Communications, Class A, (2), (3) |
845,469 | ||||||||||||
| 3,657 | Dollar Tree Stores Inc., (2) |
371,771 | ||||||||||||
| 5,573 | Expedia, Inc., (3) |
237,577 | ||||||||||||
| 7,300 | Family Dollar Stores, Inc. |
493,115 | ||||||||||||
| 228,455 | Ford Motor |
2,576,972 | ||||||||||||
| 2,605 | Fossil Inc., (3) |
340,395 | ||||||||||||
| 8,444 | GameStop, Class A, (2), (3) |
192,185 | ||||||||||||
| 14,604 | Gannett Company Inc. |
201,827 | ||||||||||||
| 20,395 | Gap, Inc. |
581,258 | ||||||||||||
| 9,518 | Genuine Parts Company |
616,576 | ||||||||||||
| 14,980 | Goodyear Tire & Rubber, (2) |
164,480 | ||||||||||||
| 17,219 | H & R Block, (3) |
253,119 | ||||||||||||
| 13,660 | Harley-Davidson, (3) |
714,828 | ||||||||||||
| 4,239 | Harman International Industries Inc. |
210,170 | ||||||||||||
| 6,824 | Hasbro, Inc. |
250,714 | ||||||||||||
| 90,621 | Home Depot, Inc. |
4,693,262 | ||||||||||||
| 17,927 | International Game Technology |
279,303 | ||||||||||||
| 27,110 | Interpublic Group Companies, Inc. |
320,169 | ||||||||||||
| 8,401 | J.C. Penney, (3) |
302,940 | ||||||||||||
| 41,261 | Johnson Controls, Inc. |
1,319,114 | ||||||||||||
| 14,898 | Kohl’s, (3) |
746,837 | ||||||||||||
| 8,970 | Leggett and Platt, (3) |
195,277 | ||||||||||||
| 9,454 | Lennar Corporation, Class A |
262,254 | ||||||||||||
| 14,561 | Limited Brands, (3) |
723,682 | ||||||||||||
| 14 | Nuveen Investments |
| Shares | Description (1) | Value | ||||||||||||
| Consumer Discretionary (continued) |
||||||||||||||
| 74,240 | Lowe’s Companies, Inc. |
$ | 2,336,333 | |||||||||||
| 24,679 | Macy’s, Inc. |
1,012,333 | ||||||||||||
| 15,760 | Marriott International, Class A, (3) |
616,058 | ||||||||||||
| 19,907 | Mattel, Inc. |
668,875 | ||||||||||||
| 60,150 | McDonald’s Corporation |
5,861,618 | ||||||||||||
| 18,288 | McGraw-Hill, (3) |
899,221 | ||||||||||||
| 2,853 | NetFlix, (2), (3) |
228,639 | ||||||||||||
| 17,018 | Newell Rubbermaid Inc. |
309,728 | ||||||||||||
| 128,914 | News Corporation, Class A |
2,526,714 | ||||||||||||
| 21,805 | Nike, Inc., Class B |
2,439,325 | ||||||||||||
| 9,510 | Nordstrom, Inc. |
531,229 | ||||||||||||
| 16,217 | Omnicom Group, (3) |
832,094 | ||||||||||||
| 8,253 | O’Reilly Automotive Inc., (2) |
870,361 | ||||||||||||
| 2,979 | Priceline.com, (2), (3) |
2,266,483 | ||||||||||||
| 19,801 | Pulte Group, (2), (3) |
194,842 | ||||||||||||
| 3,791 | Ralph Lauren, (3) |
653,076 | ||||||||||||
| 13,857 | Ross Stores, Inc. |
853,453 | ||||||||||||
| 5,718 | Scripps Networks Interactive, Class A, (3) |
287,158 | ||||||||||||
| 2,262 | Sears Holdings, (2), (3) |
121,650 | ||||||||||||
| 43,040 | Staples, (3) |
662,816 | ||||||||||||
| 45,501 | Starbucks |
2,610,847 | ||||||||||||
| 11,296 | Starwood Hotels & Resorts Worldwide |
668,723 | ||||||||||||
| 39,481 | Target Corporation |
2,287,529 | ||||||||||||
| 8,027 | Tiffany & Co. |
549,528 | ||||||||||||
| 18,760 | Time Warner Cable, Class A |
1,509,242 | ||||||||||||
| 58,836 | Time Warner Inc. |
2,204,024 | ||||||||||||
| 44,340 | TJX Companies, Inc. |
1,849,421 | ||||||||||||
| 5,911 | TripAdvisor, (3) |
221,722 | ||||||||||||
| 6,527 | Urban Outfitters, (2), (3) |
189,022 | ||||||||||||
| 5,262 | VF Corporation |
800,087 | ||||||||||||
| 32,463 | Viacom Inc., Class B |
1,505,959 | ||||||||||||
| 105,610 | Walt Disney, (3) |
4,552,847 | ||||||||||||
| 110 | Washington Post, Class B, (3) |
41,599 | ||||||||||||
| 4,638 | Whirlpool Corporation |
296,925 | ||||||||||||
| 8,972 | Wyndham Worldwide Corporation |
451,650 | ||||||||||||
| 4,656 | Wynn Resorts Ltd |
621,110 | ||||||||||||
| 28,190 | YUM! Brands, Inc. |
2,050,259 | ||||||||||||
| Total Consumer Discretionary |
83,854,078 | |||||||||||||
| Consumer Staples – 10.5% |
||||||||||||||
| 120,437 | Altria Group, Inc. |
3,879,276 | ||||||||||||
| 39,268 | Archer-Daniels-Midland Company |
1,210,632 | ||||||||||||
| 25,324 | Avon Products, Inc. |
546,998 | ||||||||||||
| 9,139 | Beam Inc. |
518,912 | ||||||||||||
| 5,860 | Brown-Forman Corporation |
506,011 | ||||||||||||
| 10,543 | Campbell Soup, (3) |
356,670 | ||||||||||||
| Nuveen Investments | 15 |
Portfolio of Investments (Unaudited)
Nuveen Equity Index Fund (continued)
April 30, 2012
| Shares | Description (1) | Value | ||||||||||||
| Consumer Staples (continued) |
||||||||||||||
| 7,755 | Clorox Company |
$ | 543,626 | |||||||||||
| 18,343 | Coca Cola Enterprises Inc. |
552,491 | ||||||||||||
| 133,516 | Coca-Cola Company |
10,189,941 | ||||||||||||
| 28,453 | Colgate-Palmolive Company |
2,815,140 | ||||||||||||
| 24,367 | ConAgra Foods, Inc. |
629,156 | ||||||||||||
| 10,235 | Constellation Brands, Inc., Class A, (2) |
221,076 | ||||||||||||
| 25,502 | Costco Wholesale Corporation |
2,248,511 | ||||||||||||
| 76,517 | CVS Caremark Corporation |
3,414,189 | ||||||||||||
| 10,798 | Dean Foods Company, (2) |
132,599 | ||||||||||||
| 12,603 | Dr. Pepper Snapple Group |
511,430 | ||||||||||||
| 13,132 | Estee Lauder Companies Inc., Class A |
858,176 | ||||||||||||
| 37,825 | General Mills, Inc. |
1,471,014 | ||||||||||||
| 18,825 | H.J. Heinz Company |
1,003,561 | ||||||||||||
| 8,998 | Hershey Foods Corporation |
602,956 | ||||||||||||
| 8,107 | Hormel Foods Corporation |
235,589 | ||||||||||||
| 6,692 | JM Smucker Company |
532,884 | ||||||||||||
| 14,567 | Kellogg, (3) |
736,653 | ||||||||||||
| 23,167 | Kimberly-Clark Corporation |
1,817,914 | ||||||||||||
| 103,859 | Kraft Foods Inc. |
4,140,858 | ||||||||||||
| 36,291 | Kroger Co. |
844,492 | ||||||||||||
| 7,936 | Lorillard Inc. |
1,073,661 | ||||||||||||
| 7,799 | McCormick, (3) |
436,042 | ||||||||||||
| 11,967 | Mead Johnson Nutrition Company, Class A Shares |
1,023,897 | ||||||||||||
| 9,261 | Molson Coors Brewing Company, Class B |
385,072 | ||||||||||||
| 91,889 | PepsiCo |
6,064,674 | ||||||||||||
| 101,375 | Philip Morris International |
9,074,076 | ||||||||||||
| 161,737 | Procter & Gamble Company |
10,292,943 | ||||||||||||
| 19,674 | Reynolds American, (3) |
803,289 | ||||||||||||
| 19,981 | Safeway, (3) |
406,214 | ||||||||||||
| 34,728 | Sara Lee Corporation |
765,405 | ||||||||||||
| 34,678 | Sysco, (3) |
1,002,194 | ||||||||||||
| 17,173 | Tyson Foods, Inc., Class A |
313,407 | ||||||||||||
| 52,277 | Walgreen, (3) |
1,832,832 | ||||||||||||
| 102,674 | Wal-Mart Stores, Inc. |
6,048,525 | ||||||||||||
| 9,573 | Whole Foods Market, (3) |
795,229 | ||||||||||||
| Total Consumer Staples |
80,838,215 | |||||||||||||
| Energy – 10.9% |
||||||||||||||
| 12,922 | Alpha Natural Resources, (2), (3) |
208,432 | ||||||||||||
| 29,274 | Anadarko Petroleum Corporation |
2,143,150 | ||||||||||||
| 22,578 | Apache Corporation |
2,166,133 | ||||||||||||
| 25,658 | Baker Hughes Incorporated |
1,131,774 | ||||||||||||
| 12,682 | Cabot Oil & Gas Corporation |
445,645 | ||||||||||||
| 38,755 | Chesapeake Energy Corporation |
714,642 | ||||||||||||
| 117,071 | Chevron, (3) |
12,475,086 | ||||||||||||
| 75,383 | ConocoPhillips |
5,399,684 | ||||||||||||
| 16 | Nuveen Investments |
| Shares | Description (1) | Value | ||||||||||||
| Energy (continued) |
||||||||||||||
| 13,334 | CONSOL Energy Inc. |
$ | 443,222 | |||||||||||
| 14,414 | Cameron International, (2), (3) |
738,718 | ||||||||||||
| 23,353 | Denbury Resources Inc., (2) |
444,641 | ||||||||||||
| 23,744 | Devon Energy Corporation |
1,658,518 | ||||||||||||
| 4,086 | Diamond Offshore Drilling, Inc. |
280,095 | ||||||||||||
| 45,335 | El Paso Corporation |
1,345,089 | ||||||||||||
| 15,805 | EOG Resources, Inc. |
1,735,547 | ||||||||||||
| 9,071 | EQT Corporation |
451,917 | ||||||||||||
| 277,489 | Exxon Mobil Corporation |
23,958,400 | ||||||||||||
| 14,008 | FMC Technologies, (2), (3) |
658,376 | ||||||||||||
| 54,092 | Halliburton Company |
1,851,028 | ||||||||||||
| 6,298 | Helmerich & Payne Inc. |
323,654 | ||||||||||||
| 17,519 | Hess Corporation |
913,441 | ||||||||||||
| 41,368 | Marathon Oil Corporation |
1,213,737 | ||||||||||||
| 21,636 | Marathon Petroleum Corporation |
900,274 | ||||||||||||
| 11,376 | Murphy Oil Corporation |
625,339 | ||||||||||||
| 16,905 | Nabors Industries, (2) |
281,468 | ||||||||||||
| 24,915 | National-Oilwell Varco Inc. |
1,887,560 | ||||||||||||
| 7,788 | Newfield Exploration Company, (2) |
279,589 | ||||||||||||
| 14,708 | Noble Corporation, (2) |
559,786 | ||||||||||||
| 10,320 | Noble Energy, Inc. |
1,024,982 | ||||||||||||
| 47,721 | Occidental Petroleum Corporation |
4,353,110 | ||||||||||||
| 15,924 | Peabody Energy Corporation |
495,396 | ||||||||||||
| 7,086 | Pioneer Natural Resources, (3) |
820,701 | ||||||||||||
| 10,402 | QEP Resources, (3) |
320,486 | ||||||||||||
| 9,195 | Range Resources Corporation |
612,939 | ||||||||||||
| 7,360 | Rowan Companies Inc. |
254,141 | ||||||||||||
| 78,897 | Schlumberger Limited |
5,849,424 | ||||||||||||
| 20,420 | Southwestern Energy, (2), (3) |
644,864 | ||||||||||||
| 38,231 | Spectra Energy Corporation |
1,175,221 | ||||||||||||
| 6,275 | Sunoco, Inc. |
309,295 | ||||||||||||
| 8,414 | Tesoro Corporation, (2) |
195,626 | ||||||||||||
| 32,903 | Valero Energy Corporation |
812,704 | ||||||||||||
| 34,648 | Williams Companies, Inc. |
1,179,071 | ||||||||||||
| 11,549 | WPX Energy, (2), (3) |
202,916 | ||||||||||||
| Total Energy |
83,485,821 | |||||||||||||
| Financials – 14.1% |
||||||||||||||
| 19,800 | Ace Limited |
1,504,206 | ||||||||||||
| 27,441 | AFLAC Incorporated |
1,235,943 | ||||||||||||
| 29,707 | Allstate Corporation |
990,134 | ||||||||||||
| 59,403 | American Express Company |
3,576,655 | ||||||||||||
| 31,676 | American International Group, (2) |
1,077,934 | ||||||||||||
| 24,026 | American Tower – REIT |
1,575,625 | ||||||||||||
| 13,301 | Ameriprise Financial, Inc. |
721,047 | ||||||||||||
| 19,005 | AON PLC |
984,459 | ||||||||||||
| Nuveen Investments | 17 |
Portfolio of Investments (Unaudited)
Nuveen Equity Index Fund (continued)
April 30, 2012
| Shares | Description (1) | Value | ||||||||||||
| Financials (continued) |
||||||||||||||
| 7,519 | Apartment Investment & Management, Class A – REIT |
$ | 204,141 | |||||||||||
| 5,736 | Assurant, (3) |
231,390 | ||||||||||||
| 5,886 | AvalonBay Communities – REIT, (3) |
855,824 | ||||||||||||
| 631,863 | Bank of America |
5,124,409 | ||||||||||||
| 71,286 | Bank of New York Mellon |
1,685,914 | ||||||||||||
| 40,980 | BB&T, (3) |
1,312,999 | ||||||||||||
| 103,349 | Berkshire Hathaway, Class B, (2) |
8,314,427 | ||||||||||||
| 5,612 | BlackRock Inc. |
1,075,147 | ||||||||||||
| 9,151 | Boston Properties – REIT, (3) |
990,596 | ||||||||||||
| 27,022 | Capital One Financial |
1,499,181 | ||||||||||||
| 18,699 | CBRE Group Inc., (2) |
351,728 | ||||||||||||
| 63,458 | Charles Schwab |
907,449 | ||||||||||||
| 16,445 | Chubb Corporation |
1,201,636 | ||||||||||||
| 9,899 | Cincinnati Financial, (3) |
352,602 | ||||||||||||
| 171,871 | Citigroup Inc. |
5,678,618 | ||||||||||||
| 3,903 | CME Group, Inc. |
1,037,495 | ||||||||||||
| 11,334 | Comerica Incorporated |
362,915 | ||||||||||||
| 32,311 | Discover Financial Services |
1,095,343 | ||||||||||||
| 14,925 | E*Trade Group Inc., (2) |
158,653 | ||||||||||||
| 17,437 | Equity Residential Properties Trust – REIT, (3) |
1,071,329 | ||||||||||||
| 5,428 | Federated Investors Inc. |
119,850 | ||||||||||||
| 54,069 | Fifth Third Bancorp. |
769,402 | ||||||||||||
| 15,496 | First Horizon National, (3) |
142,253 | ||||||||||||
| 8,556 | Franklin Resources, Inc. |
1,073,864 | ||||||||||||
| 28,860 | Genworth Financial, Class A, (2) |
173,449 | ||||||||||||
| 28,941 | Goldman Sachs Group |
3,332,556 | ||||||||||||
| 26,203 | Hartford Financial Services Group, (3) |
538,472 | ||||||||||||
| 26,633 | HCP – REIT |
1,103,938 | ||||||||||||
| 8,504 | Health Care – REIT, (3) |
481,837 | ||||||||||||
| 41,517 | Host Hotels & Resorts – REIT, (3) |
690,843 | ||||||||||||
| 31,009 | Hudson City Bancorp, Inc. |
218,924 | ||||||||||||
| 50,795 | Huntington Bancshares, (3) |
339,819 | ||||||||||||
| 4,271 | Intercontinental Exchange, (2) |
568,214 | ||||||||||||
| 27,362 | Invesco LTD |
679,672 | ||||||||||||
| 223,372 | JP Morgan Chase & Co. |
9,600,529 | ||||||||||||
| 56,016 | KeyCorp. |
450,369 | ||||||||||||
| 24,856 | Kimco Realty – REIT, (3) |
482,455 | ||||||||||||
| 7,312 | Legg Mason |
190,624 | ||||||||||||
| 11,646 | Leucadia National, (3) |
289,520 | ||||||||||||
| 17,733 | Lincoln National Corporation |
439,246 | ||||||||||||
| 17,950 | Loews Corporation |
738,284 | ||||||||||||
| 6,704 | M&T Bank, (3) |
578,354 | ||||||||||||
| 31,624 | Marsh & McLennan Companies, Inc. |
1,057,823 | ||||||||||||
| 62,174 | MetLife, Inc. |
2,240,129 | ||||||||||||
| 11,484 | Moody’s, (3) |
470,270 | ||||||||||||
| 18 | Nuveen Investments |
| Shares | Description (1) | Value | ||||||||||||
| Financials (continued) |
||||||||||||||
| 87,243 | Morgan Stanley |
$ | 1,507,559 | |||||||||||
| 7,741 | NASDAQ Stock Market, Inc., (2) |
190,196 | ||||||||||||
| 15,402 | New York Stock Exchange Euronext |
396,602 | ||||||||||||
| 14,167 | Northern Trust Corporation |
674,208 | ||||||||||||
| 21,268 | People’s United Financial, Inc. |
262,447 | ||||||||||||
| 10,382 | Plum Creek Timber – REIT, (3) |
436,459 | ||||||||||||
| 30,927 | PNC Financial Services Group, (3) |
2,051,079 | ||||||||||||
| 18,452 | Principal Financial Group, Inc. |
510,567 | ||||||||||||
| 36,253 | Progressive, (3) |
772,189 | ||||||||||||
| 26,938 | ProLogis – REIT, (3) |
963,842 | ||||||||||||
| 27,747 | Prudential Financial, Inc. |
1,679,803 | ||||||||||||
| 8,976 | Public Storage – REIT, (3) |
1,285,902 | ||||||||||||
| 83,191 | Regions Financial Corporation |
560,707 | ||||||||||||
| 17,270 | Simon Property Group – REIT, (3) |
2,687,212 | ||||||||||||
| 29,906 | SLM Corporation |
443,506 | ||||||||||||
| 28,919 | State Street Corporation |
1,336,636 | ||||||||||||
| 31,567 | SunTrust Banks, Inc. |
766,447 | ||||||||||||
| 15,560 | T. Rowe Price Group, (3) |
982,069 | ||||||||||||
| 6,210 | Torchmark Corporation |
302,489 | ||||||||||||
| 24,265 | Travelers Companies, Inc. |
1,560,725 | ||||||||||||
| 112,186 | U.S. Bancorp |
3,609,024 | ||||||||||||
| 17,353 | Unum Group |
411,960 | ||||||||||||
| 11,838 | Ventas – REIT, (3) |
695,956 | ||||||||||||
| 10,519 | Vornado Realty Trust – REIT, (3) |
902,951 | ||||||||||||
| 310,007 | Wells Fargo & Company |
10,363,534 | ||||||||||||
| 32,030 | Weyerhaeuser – REIT |
652,131 | ||||||||||||
| 18,841 | XL Capital Ltd, Class A |
405,270 | ||||||||||||
| 10,833 | Zions Bancorporation, (3) |
220,885 | ||||||||||||
| Total Financials |
108,580,850 | |||||||||||||
| Health Care – 11.0% |
||||||||||||||
| 91,576 | Abbott Laboratories, (3) |
5,683,207 | ||||||||||||
| 21,299 | Aetna Inc. |
938,008 | ||||||||||||
| 20,412 | Agilent Technologies, Inc., (2) |
860,978 | ||||||||||||
| 18,561 | Allergan, Inc. |
1,781,856 | ||||||||||||
| 16,346 | AmerisourceBergen, (3) |
608,235 | ||||||||||||
| 42,878 | Amgen Inc. |
3,049,055 | ||||||||||||
| 33,148 | Baxter International, Inc. |
1,836,731 | ||||||||||||
| 12,633 | Becton, Dickinson and Company |
991,059 | ||||||||||||
| 14,726 | Biogen Idec Inc., (2) |
1,973,431 | ||||||||||||
| 87,091 | Boston Scientific Corporation, (2) |
545,190 | ||||||||||||
| 99,615 | Bristol-Myers Squibb Company |
3,324,153 | ||||||||||||
| 5,043 | C. R. Bard, Inc. |
499,055 | ||||||||||||
| 21,285 | Cardinal Health, Inc. |
899,717 | ||||||||||||
| 13,576 | CareFusion Corporation, (2) |
351,754 | ||||||||||||
| 26,291 | Celgene, (2), (3) |
1,917,140 | ||||||||||||
| Nuveen Investments | 19 |
Portfolio of Investments (Unaudited)
Nuveen Equity Index Fund (continued)
April 30, 2012
| Shares | Description (1) | Value | ||||||||||||
| Health Care (continued) |
||||||||||||||
| 5,616 | Cerner, (2), (3) |
$ | 455,401 | |||||||||||
| 16,403 | CIGNA Corporation |
758,311 | ||||||||||||
| 9,083 | Coventry Health Care, Inc., (2) |
272,399 | ||||||||||||
| 28,360 | Covidien PLC |
1,566,323 | ||||||||||||
| 5,496 | DaVita Inc., (2) |
486,836 | ||||||||||||
| 8,581 | DENTSPLY International, (3) |
352,336 | ||||||||||||
| 3,721 | Edwards Lifesciences, (2) |
308,731 | ||||||||||||
| 59,892 | Eli Lilly |
2,478,930 | ||||||||||||
| 47,034 | Express Scripts |
2,624,027 | ||||||||||||
| 16,662 | Forest Laboratories, Inc., (2) |
580,337 | ||||||||||||
| 46,829 | Gilead Sciences, Inc., (2) |
2,435,576 | ||||||||||||
| 9,683 | Hospira, (2), (3) |
340,067 | ||||||||||||
| 9,970 | Humana Inc. |
804,380 | ||||||||||||
| 2,377 | Intuitive Surgical, Inc., (2) |
1,374,381 | ||||||||||||
| 160,534 | Johnson & Johnson |
10,449,158 | ||||||||||||
| 5,723 | Laboratory Corporation of America, (2), (3) |
502,994 | ||||||||||||
| 11,128 | Life Technologies, (2) |
515,894 | ||||||||||||
| 14,953 | McKesson HBOC Inc. |
1,366,854 | ||||||||||||
| 62,038 | Medtronic, Inc. |
2,369,852 | ||||||||||||
| 179,173 | Merck & Company Inc. |
7,030,749 | ||||||||||||
| 24,596 | Mylan Laboratories Inc., (2) |
533,979 | ||||||||||||
| 5,674 | Patterson Companies, Inc. |
193,427 | ||||||||||||
| 7,178 | Perkinelmer Inc. |
198,113 | ||||||||||||
| 3,056 | Perrigo, (3) |
320,574 | ||||||||||||
| 451,882 | Pfizer Inc. |
10,361,654 | ||||||||||||
| 9,273 | Quest Diagnostics Incorporated |
534,959 | ||||||||||||
| 18,751 | Saint Jude Medical Inc. |
726,039 | ||||||||||||
| 19,121 | Stryker Corporation |
1,043,433 | ||||||||||||
| 26,506 | Tenet Healthcare, (2), (3) |
137,566 | ||||||||||||
| 22,237 | Thermo Fisher Scientific, Inc., (2) |
1,237,489 | ||||||||||||
| 62,666 | UnitedHealth Group Incorporated |
3,518,696 | ||||||||||||
| 6,616 | Varian Medical Systems, (2), (3) |
419,587 | ||||||||||||
| 5,875 | Waters Corporation, (2) |
494,146 | ||||||||||||
| 7,486 | Watson Pharmaceuticals Inc., (2) |
564,145 | ||||||||||||
| 19,709 | Wellpoint Inc. |
1,336,664 | ||||||||||||
| 10,534 | Zimmer Holdings, Inc., (2) |
662,905 | ||||||||||||
| Total Health Care |
84,616,481 | |||||||||||||
| Industrials – 10.3% |
||||||||||||||
| 41,199 | 3M Co. |
3,681,543 | ||||||||||||
| 6,184 | Avery Dennison Corporation |
197,764 | ||||||||||||
| 43,692 | Boeing Company |
3,355,546 | ||||||||||||
| 9,651 | C.H. Robinson Worldwide, (3) |
576,551 | ||||||||||||
| 38,012 | Caterpillar, (3) |
3,906,493 | ||||||||||||
| 6,771 | Cintas Corporation |
265,220 | ||||||||||||
| 4,679 | Cooper Industries Inc. |
292,765 | ||||||||||||
| 20 | Nuveen Investments |
| Shares | Description (1) | Value | ||||||||||||
| Industrials (continued) |
||||||||||||||
| 61,723 | CSX Corporation |
$ | 1,377,040 | |||||||||||
| 11,821 | Cummins Inc. |
1,369,226 | ||||||||||||
| 33,489 | Danaher, (3) |
1,815,774 | ||||||||||||
| 24,333 | Deere & Company |
2,004,066 | ||||||||||||
| 11,291 | Dover Corporation |
707,494 | ||||||||||||
| 2,987 | Dun and Bradstreet, (3) |
232,329 | ||||||||||||
| 20,709 | Eaton Corporation |
997,760 | ||||||||||||
| 45,208 | Emerson Electric, (3) |
2,375,228 | ||||||||||||
| 7,432 | Equifax Inc. |
340,534 | ||||||||||||
| 12,465 | Expeditors International of Washington, Inc. |
498,600 | ||||||||||||
| 17,918 | Fastenal Company |
838,921 | ||||||||||||
| 18,647 | FedEx Corporation |
1,645,411 | ||||||||||||
| 3,384 | Flowserve Corporation |
388,923 | ||||||||||||
| 9,973 | Fluor Corporation |
575,941 | ||||||||||||
| 20,934 | General Dynamics Corporation |
1,413,045 | ||||||||||||
| 620,619 | General Electric, (3) |
12,151,720 | ||||||||||||
| 7,361 | Goodrich Corporation |
923,511 | ||||||||||||
| 45,471 | Honeywell International Inc. |
2,758,271 | ||||||||||||
| 28,404 | Illinois Tool Works, Inc. |
1,629,822 | ||||||||||||
| 18,351 | Ingersoll Rand Company Limited, Class A |
780,285 | ||||||||||||
| 12,916 | Iron Mountain Inc. |
392,259 | ||||||||||||
| 7,546 | Jacobs Engineering Group, Inc. |
330,741 | ||||||||||||
| 6,752 | Joy Global Inc. |
477,839 | ||||||||||||
| 5,870 | L-3 Communications Holdings, Inc. |
431,680 | ||||||||||||
| 15,597 | Lockheed Martin Corporation |
1,412,152 | ||||||||||||
| 21,033 | Masco, (3) |
277,215 | ||||||||||||
| 20,664 | Norfolk Southern Corporation |
1,507,026 | ||||||||||||
| 15,359 | Northrop Grumman Corporation |
971,918 | ||||||||||||
| 22,190 | PACCAR Inc. |
953,282 | ||||||||||||
| 7,061 | Pall Corporation |
420,906 | ||||||||||||
| 9,113 | Parker Hannifin Corporation |
799,119 | ||||||||||||
| 11,735 | Pitney Bowes Inc. |
201,021 | ||||||||||||
| 8,476 | Precision Castparts Corporation |
1,494,912 | ||||||||||||
| 12,874 | Quanta Services Incorporated, (2) |
284,773 | ||||||||||||
| 11,086 | R.R. Donnelley & Sons, (3) |
138,686 | ||||||||||||
| 19,616 | Raytheon Company |
1,062,010 | ||||||||||||
| 18,506 | Republic Services, Inc. |
506,509 | ||||||||||||
| 8,795 | Robert Half International Inc. |
262,091 | ||||||||||||
| 8,694 | Rockwell Automation, (3) |
672,394 | ||||||||||||
| 8,896 | Rockwell Collins, Inc. |
497,197 | ||||||||||||
| 6,149 | Roper Industries Inc. |
626,583 | ||||||||||||
| 3,104 | Ryder System, Inc. |
151,227 | ||||||||||||
| 3,532 | Snap-on Incorporated |
220,891 | ||||||||||||
| 45,765 | Southwest Airlines, (3) |
378,934 | ||||||||||||
| 10,221 | Stanley Black & Decker, (3) |
747,768 | ||||||||||||
| Nuveen Investments | 21 |
Portfolio of Investments (Unaudited)
Nuveen Equity Index Fund (continued)
April 30, 2012
| Shares | Description (1) | Value | ||||||||||||
| Industrials (continued) |
||||||||||||||
| 5,076 | Stericycle, (2) |
$ | 439,582 | |||||||||||
| 16,352 | Textron |
435,617 | ||||||||||||
| 27,158 | Tyco International Ltd. |
1,524,379 | ||||||||||||
| 28,397 | Union Pacific Corporation |
3,192,959 | ||||||||||||
| 56,728 | United Parcel Service, Inc., Class B |
4,432,726 | ||||||||||||
| 53,264 | United Technologies Corporation |
4,348,473 | ||||||||||||
| 3,732 | W.W. Grainger, Inc. |
775,584 | ||||||||||||
| 27,060 | Waste Management, (3) |
925,452 | ||||||||||||
| 10,850 | Xylem Inc. |
302,498 | ||||||||||||
| Total Industrials |
78,696,186 | |||||||||||||
| Information Technology – 19.7% |
||||||||||||||
| 35,562 | Accenture, Class A, (3) |
2,309,752 | ||||||||||||
| 28,858 | Adobe Systems Incorporated, (2) |
968,474 | ||||||||||||
| 34,414 | Advanced Micro Devices, (2), (3) |
253,287 | ||||||||||||
| 10,548 | Akamai Technologies, Inc., (2) |
343,865 | ||||||||||||
| 18,863 | Altera Corporation |
670,957 | ||||||||||||
| 10,051 | Amphenol, Class A, (3) |
584,365 | ||||||||||||
| 17,516 | Analog Devices, Inc. |
682,774 | ||||||||||||
| 54,636 | Apple, Inc., (2) |
31,920,537 | ||||||||||||
| 76,753 | Applied Materials, Inc. |
920,268 | ||||||||||||
| 13,333 | Autodesk, Inc., (2) |
524,920 | ||||||||||||
| 29,610 | Automatic Data Processing, Inc. |
1,646,908 | ||||||||||||
| 10,006 | BMC Software, Inc., (2) |
412,848 | ||||||||||||
| 28,516 | Broadcom Corporation, Class A, (2) |
1,043,686 | ||||||||||||
| 21,754 | CA, (3) |
574,741 | ||||||||||||
| 316,024 | Cisco Systems, Inc. |
6,367,884 | ||||||||||||
| 10,963 | Citrix Systems, (2) |
938,542 | ||||||||||||
| 17,760 | Cognizant Technology Solutions Corporation, Class A, (2) |
1,302,163 | ||||||||||||
| 9,116 | Computer Sciences Corporation |
255,795 | ||||||||||||
| 92,387 | Corning Incorporated |
1,325,753 | ||||||||||||
| 89,768 | Dell, (2) |
1,469,502 | ||||||||||||
| 67,541 | eBay Inc., (2) |
2,772,558 | ||||||||||||
| 21,319 | Electronic Arts Inc. (EA), (2) |
327,886 | ||||||||||||
| 119,921 | EMC, (2), (3) |
3,382,971 | ||||||||||||
| 4,673 | F5 Networks, Inc., (2) |
625,855 | ||||||||||||
| 10,191 | Fidelity National Information Services |
343,131 | ||||||||||||
| 3,482 | First Solar, (2), (3) |
64,069 | ||||||||||||
| 8,594 | Fiserv, Inc., (2) |
604,072 | ||||||||||||
| 10,235 | FLIR Systems Inc. |
229,878 | ||||||||||||
| 14,852 | Google Inc., Class A, (2) |
8,988,876 | ||||||||||||
| 6,807 | Harris, (3) |
309,991 | ||||||||||||
| 116,804 | Hewlett-Packard, (3) |
2,892,067 | ||||||||||||
| 299,336 | Intel Corporation |
8,501,142 | ||||||||||||
| 69,285 | International Business Machines Corporation (IBM) |
14,347,538 | ||||||||||||
| 17,551 | Intuit, Inc. |
1,017,431 | ||||||||||||
| 22 | Nuveen Investments |
| Shares | Description (1) | Value | ||||||||||||
| Information Technology (continued) |
||||||||||||||
| 10,769 | Jabil Circuit |
$ | 252,533 | |||||||||||
| 14,541 | JDS Uniphase, (2) |
176,673 | ||||||||||||
| 30,922 | Juniper Networks, (2) |
662,658 | ||||||||||||
| 9,797 | KLA-Tencor, (3) |
510,914 | ||||||||||||
| 4,144 | Lexmark International, Class A, (3) |
124,734 | ||||||||||||
| 13,389 | Linear Technology Corporation |
437,954 | ||||||||||||
| 33,125 | LSI Logic Corporation, (2) |
266,325 | ||||||||||||
| 6,268 | MasterCard, Inc. |
2,834,828 | ||||||||||||
| 11,235 | Microchip Technology, (3) |
397,045 | ||||||||||||
| 55,251 | Micron Technology, Inc., (2) |
364,104 | ||||||||||||
| 440,118 | Microsoft Corporation |
14,092,578 | ||||||||||||
| 8,304 | Molex, (3) |
229,107 | ||||||||||||
| 15,495 | Motorola Mobility Holdings Inc., (2) |
601,516 | ||||||||||||
| 16,840 | Motorola Solutions Inc. |
859,345 | ||||||||||||
| 21,080 | NetApp, (2), (3) |
818,536 | ||||||||||||
| 4,085 | Novellus Systems, Inc., (2) |
190,974 | ||||||||||||
| 35,898 | NVIDIA Corporation, (2) |
466,674 | ||||||||||||
| 231,308 | Oracle Corporation |
6,798,142 | ||||||||||||
| 18,959 | Paychex, (3) |
587,350 | ||||||||||||
| 98,814 | QUALCOMM, Inc. |
6,308,286 | ||||||||||||
| 12,282 | Red Hat, Inc., (2) |
732,130 | ||||||||||||
| 16,753 | SAIC, (2) |
203,716 | ||||||||||||
| 7,995 | Salesforce.com, (2), (3) |
1,245,061 | ||||||||||||
| 14,125 | SanDisk, (2) |
522,766 | ||||||||||||
| 43,334 | Symantec Corporation |
715,878 | ||||||||||||
| 20,585 | TE Connectivity Limited |
750,529 | ||||||||||||
| 9,841 | Teradata Corporation, (2) |
686,705 | ||||||||||||
| 10,819 | Teradyne Inc., (2) |
186,195 | ||||||||||||
| 67,171 | Texas Instruments Incorporated |
2,145,442 | ||||||||||||
| 10,682 | Total System Services Inc. |
251,241 | ||||||||||||
| 9,350 | VeriSign, Inc., (2) |
384,379 | ||||||||||||
| 29,898 | Visa, Class A, (3) |
3,676,856 | ||||||||||||
| 13,743 | Western Digital Corporation, (2) |
533,366 | ||||||||||||
| 36,397 | Western Union, (3) |
668,977 | ||||||||||||
| 81,538 | Xerox Corporation |
634,366 | ||||||||||||
| 15,428 | Xilinx, (3) |
561,271 | ||||||||||||
| 72,911 | Yahoo! Inc., (2) |
1,133,037 | ||||||||||||
| Total Information Technology |
150,936,677 | |||||||||||||
| Materials – 3.3% |
||||||||||||||
| 12,373 | Air Products & Chemicals Inc. |
1,057,768 | ||||||||||||
| 4,409 | Airgas, Inc. |
404,041 | ||||||||||||
| 62,566 | Alcoa Inc. |
608,767 | ||||||||||||
| 6,253 | Allegheny Technologies, (3) |
268,504 | ||||||||||||
| 9,925 | Ball Corporation |
414,468 | ||||||||||||
| 5,930 | Bemis Company, Inc. |
192,073 | ||||||||||||
| Nuveen Investments | 23 |
Portfolio of Investments (Unaudited)
Nuveen Equity Index Fund (continued)
April 30, 2012
| Shares | Description (1) | Value | ||||||||||||
| Materials (continued) |
||||||||||||||
| 3,844 | CF Industries Holdings, Inc. |
$ | 742,123 | |||||||||||
| 8,408 | Cliffs Natural Resources Inc. |
523,482 | ||||||||||||
| 69,474 | Dow Chemical, (3) |
2,353,779 | ||||||||||||
| 54,314 | E.I. Du Pont de Nemours, (3) |
2,903,626 | ||||||||||||
| 8,523 | Eastman Chemical Company |
459,986 | ||||||||||||
| 14,082 | Ecolab Inc. |
896,883 | ||||||||||||
| 4,601 | FMC, (3) |
508,180 | ||||||||||||
| 55,723 | Freeport-McMoRan Copper & Gold, Inc. |
2,134,191 | ||||||||||||
| 5,157 | International Flavors & Fragrances Inc. |
310,503 | ||||||||||||
| 25,927 | International Paper Company |
863,628 | ||||||||||||
| 10,362 | MeadWestvaco Corporation |
329,719 | ||||||||||||
| 32,463 | Monsanto Company |
2,473,031 | ||||||||||||
| 14,691 | Mosaic Company |
775,979 | ||||||||||||
| 29,107 | Newmont Mining Corporation |
1,386,949 | ||||||||||||
| 18,617 | Nucor Corporation |
729,973 | ||||||||||||
| 9,655 | Owens-Illinois, Inc., (2) |
224,479 | ||||||||||||
| 9,077 | PPG Industries, Inc. |
955,263 | ||||||||||||
| 17,621 | Praxair, Inc. |
2,038,750 | ||||||||||||
| 9,788 | Sealed Air Corporation |
187,734 | ||||||||||||
| 5,355 | Sherwin-Williams Company |
644,099 | ||||||||||||
| 7,411 | Sigma-Aldrich, (3) |
525,440 | ||||||||||||
| 4,840 | Titanium Metals Corporation |
71,487 | ||||||||||||
| 8,465 | United States Steel Corporation |
239,813 | ||||||||||||
| 7,597 | Vulcan Materials Company |
325,228 | ||||||||||||
| Total Materials |
25,549,946 | |||||||||||||
| Telecommunication Services – 2.8% |
||||||||||||||
| 348,363 | AT&T Inc. |
11,464,626 | ||||||||||||
| 37,765 | CenturyLink, (3) |
1,456,218 | ||||||||||||
| 10,780 | Crown Castle International Corporation, (2) |
610,256 | ||||||||||||
| 58,500 | Frontier Communications, (3) |
236,340 | ||||||||||||
| 17,652 | Metropcs Communications Inc. |
128,860 | ||||||||||||
| 176,110 | Sprint Nextel Corporation, (2) |
436,753 | ||||||||||||
| 166,428 | Verizon Communications, (3) |
6,720,363 | ||||||||||||
| 30,961 | Windstream, (3) |
348,000 | ||||||||||||
| Total Telecommunication Services |
21,401,416 | |||||||||||||
| Utilities – 3.4% |
||||||||||||||
| 37,902 | AES Corporation, (2) |
474,533 | ||||||||||||
| 2,317 | AGL Resources Inc. |
91,359 | ||||||||||||
| 14,240 | Ameren Corporation |
466,930 | ||||||||||||
| 28,389 | American Electric Power Company, Inc. |
1,102,629 | ||||||||||||
| 27,733 | CenterPoint Energy, Inc. |
560,484 | ||||||||||||
| 14,814 | CMS Energy Corporation |
340,574 | ||||||||||||
| 17,219 | Consolidated Edison, (3) |
1,023,670 | ||||||||||||
| 34,529 | Dominion Resources, Inc. |
1,802,069 | ||||||||||||
| 10,281 | DTE Energy, (3) |
579,643 | ||||||||||||
| 24 | Nuveen Investments |
| Shares | Description (1) | Value | ||||||||||||||||||
| Utilities (continued) |
||||||||||||||||||||
| 78,346 | Duke Energy, (3) |
$ | 1,678,955 | |||||||||||||||||
| 19,152 | Edison International |
842,880 | ||||||||||||||||||
| 10,354 | Entergy Corporation |
678,808 | ||||||||||||||||||
| 50,854 | Exelon Corporation |
1,983,815 | ||||||||||||||||||
| 24,585 | FirstEnergy Corp. |
1,151,070 | ||||||||||||||||||
| 4,730 | Integrys Energy Group, (3) |
258,447 | ||||||||||||||||||
| 24,840 | NextEra Energy, (3) |
1,598,454 | ||||||||||||||||||
| 17,036 | NiSource Inc. |
419,937 | ||||||||||||||||||
| 14,739 | Northeast Utilities |
541,953 | ||||||||||||||||||
| 14,636 | NRG Energy, (2), (3) |
248,812 | ||||||||||||||||||
| 3,934 | ONEOK, Inc. |
337,891 | ||||||||||||||||||
| 13,744 | Pepco Holdings, Inc., (3) |
260,036 | ||||||||||||||||||
| 23,860 | PG&E Corporation |
1,054,135 | ||||||||||||||||||
| 6,619 | Pinnacle West Capital Corporation |
320,029 | ||||||||||||||||||
| 32,629 | PPL, (3) |
892,403 | ||||||||||||||||||
| 17,343 | Progress Energy, Inc. |
922,994 | ||||||||||||||||||
| 29,739 | Public Service Enterprise Group Incorporated |
926,370 | ||||||||||||||||||
| 6,971 | SCANA, (3) |
321,503 | ||||||||||||||||||
| 14,539 | Sempra Energy, (3) |
941,255 | ||||||||||||||||||
| 50,668 | Southern Company |
2,327,688 | ||||||||||||||||||
| 13,096 | TECO Energy, Inc. |
235,990 | ||||||||||||||||||
| 14,184 | Wisconsin Energy, (3) |
522,537 | ||||||||||||||||||
| 29,409 | Xcel Energy, Inc. |
795,806 | ||||||||||||||||||
| Total Utilities |
25,703,659 | |||||||||||||||||||
| Total Common Stocks (cost $398,202,300) |
743,663,329 | |||||||||||||||||||
| Shares | Description (1) | Value | ||||||||||||||||||
| INVESTMENTS PURCHASED WITH COLLATERAL FROM SECURITIES LENDING – 11.9% |
|
|||||||||||||||||||
| Money Market Fund – 11.9% |
||||||||||||||||||||
| 91,559,442 | Mount Vernon Securities Lending Prime Portfolio, 0.276%, (4), (5) |
91,559,442 | ||||||||||||||||||
| Total Investments Purchased with Collateral from Securities Lending (cost $91,559,442) |
|
91,559,442 | ||||||||||||||||||
| Shares/ Principal Amount (000) |
Description (1) | Coupon | Maturity |
Ratings (6) |
Value | |||||||||||||||
| SHORT-TERM INVESTMENTS – 3.2% |
||||||||||||||||||||
| Money Market Funds – 2.4% |
||||||||||||||||||||
| 18,203,383 | First American Treasury Obligations Fund, Class Z |
0.000% | (4) | N/A | N/A | $ | 18,203,383 | |||||||||||||
| U.S. Government and Agency Obligations – 0.8% |
||||||||||||||||||||
| $ | 6,400 | U.S. Treasury Bill, (7) |
0.022% | 9/20/12 | Aaa | 6,396,781 | ||||||||||||||
| Total Short-Term Investments (cost $24,601,237) |
24,600,164 | |||||||||||||||||||
| Total Investments (cost $514,362,979) – 112.0% |
859,822,935 | |||||||||||||||||||
| Other Assets Less Liabilities – (12.0)% (8) |
(91,955,629) | |||||||||||||||||||
| Net Assets – 100% |
$ | 767,867,306 | ||||||||||||||||||
| Nuveen Investments | 25 |
Portfolio of Investments (Unaudited)
Nuveen Equity Index Fund (continued)
April 30, 2012
Investments in Derivatives at April 30, 2012:
Futures Contracts outstanding:
| Type | Contract Position |
Number of Contracts |
Contract Expiration |
Value | Unrealized Appreciation (Depreciation) |
|||||||||||||||
| S&P 500 Index |
Long | 66 | 6/12 | $ | 22,994,400 | $ | 343,649 | |||||||||||||
| For Fund portfolio compliance purposes, the Fund’s industry classifications refer to any one or more of the industry sub-classifications used by one or more widely recognized market indexes or ratings group indexes, and/or as defined by the Fund management. This definition may not apply for purposes of this report which may combine industry sub-classifications into sectors for reporting ease. |
| (1) | All percentages shown in the Portfolio of Investments are based on net assets. |
| (2) | Non-income producing; issuer has not declared a dividend within the past twelve months. |
| (3) | Investment, or a portion of investment, is out on loan for securities lending. |
| (4) | The rate shown is the annualized seven-day effective yield as of April 30, 2012. |
| (5) | The Fund may loan securities representing up to one third of the fair value of its total assets (which includes collateral for securities on loan) to broker dealers, banks, and other institutions. The Fund maintains collateral equal to at least 102% of the fair value of the securities loaned. The cash collateral received by the Fund is invested in this money market fund. See Notes to Financial Statements, Footnote 1 - General Information and Significant Accounting Policies, Securities Lending for more information. |
| (6) | Ratings: Using the highest of Standard & Poor’s Group (“Standard & Poor’s”), Moody’s Investors Service, Inc. (“Moody’s”) or Fitch, Inc. (“Fitch”) rating. Ratings below BBB by Standard & Poor’s, Baa by Moody’s or BBB by Fitch are considered to be below investment grade. Holdings designated N/R are not rated by any of these national rating agencies. |
| (7) | Investment, or portion of investment, segregated as collateral for investments in derivatives. |
| (8) | Other Assets Less Liabilities includes the Net Unrealized Appreciation (Depreciation) of derivative instruments as noted within Investments in Derivatives at April 30, 2012. |
| N/A | Not applicable |
| ADR | American Depositary Receipt |
| REIT | Real Estate Investment Trust |
See accompanying notes to financial statements.
| 26 | Nuveen Investments |
Portfolio of Investments (Unaudited)
Nuveen Mid Cap Index Fund
April 30, 2012
| Shares | Description (1) | Value | ||||||||||||
| COMMON STOCKS – 92.6% |
||||||||||||||
| Consumer Discretionary – 12.2% |
||||||||||||||
| 22,054 | Aaron’s, (2) |
$ | 599,207 | |||||||||||
| 21,153 | Advance Auto Parts, (3) |
1,941,845 | ||||||||||||
| 23,422 | Aeropostale, (3) |
519,500 | ||||||||||||
| 16,674 | AMC Networks, Class A Shares, (2), (3) |
708,645 | ||||||||||||
| 56,197 | American Eagle Outfitters |
1,012,108 | ||||||||||||
| 11,115 | American Greetings, Class A, (3) |
177,840 | ||||||||||||
| 14,739 | Ann, (2), (3) |
408,123 | ||||||||||||
| 38,235 | Ascena Retail Group, (2), (3) |
783,053 | ||||||||||||
| 12,446 | Bally Technologies, (2), (3) |
604,253 | ||||||||||||
| 11,868 | Barnes & Noble, (3) |
246,261 | ||||||||||||
| 8,425 | Bob Evans Farms, (3) |
322,172 | ||||||||||||
| 22,780 | Brinker International, (3) |
716,887 | ||||||||||||
| 14,814 | Carter’s, (3) |
804,400 | ||||||||||||
| 15,847 | Cheesecake Factory, (3) |
499,181 | ||||||||||||
| 48,637 | Chico’s FAS, Inc. |
747,064 | ||||||||||||
| 28,949 | Cinemark, (3) |
664,669 | ||||||||||||
| 17,570 | Collective Brands, (2), (3) |
364,929 | ||||||||||||
| 11,223 | Deckers Outdoor, (2), (3) |
572,485 | ||||||||||||
| 28,013 | Dick’s Sporting Goods, (3) |
1,417,458 | ||||||||||||
| 20,719 | DreamWorks Animation, Class A, (2), (3) |
373,149 | ||||||||||||
| 43,865 | Foot Locker |
1,341,830 | ||||||||||||
| 41,792 | Gentex, (3) |
918,170 | ||||||||||||
| 19,375 | Guess? |
567,300 | ||||||||||||
| 28,296 | Hanesbrands, (3) |
798,513 | ||||||||||||
| 11,418 | Hosting Site Network |
441,877 | ||||||||||||
| 8,103 | International Speedway, Class A |
216,269 | ||||||||||||
| 5,693 | ITT Educational Services, (2), (3) |
375,852 | ||||||||||||
| 13,607 | John Wiley and Sons, Class A |
614,900 | ||||||||||||
| 20,920 | KB HOME, (3) |
181,586 | ||||||||||||
| 17,005 | Lamar Advertising, (2), (3) |
541,099 | ||||||||||||
| 12,329 | Life Time Fitness, (2), (3) |
574,038 | ||||||||||||
| 42,608 | LKQ |
1,425,238 | ||||||||||||
| 8,228 | Matthews International, Class A, (3) |
246,840 | ||||||||||||
| 10,989 | M.D.C. Holdings, (3) |
308,901 | ||||||||||||
| 10,782 | Meredith, (3) |
310,845 | ||||||||||||
| 16,567 | Mohawk Industries, (3) |
1,110,320 | ||||||||||||
| 35,170 | New York Times, Class A, (2), (3) |
221,923 | ||||||||||||
| 1,461 | NVR, (2), (3) |
1,145,336 | ||||||||||||
| 81,463 | Office Depot, (3) |
247,648 | ||||||||||||
| 8,621 | Panera Bread, Class A, (3) |
1,361,428 | ||||||||||||
| 32,377 | PetSmart, (3) |
1,886,284 | ||||||||||||
| 19,856 | Polaris Industries |
1,577,361 | ||||||||||||
| 19,610 | PVH, (3) |
1,741,368 | ||||||||||||
| 28,809 | RadioShack, (3) |
149,231 | ||||||||||||
| Nuveen Investments | 27 |
Portfolio of Investments (Unaudited)
Nuveen Mid Cap Index Fund (continued)
April 30, 2012
| Shares | Description (1) | Value | ||||||||||||
| Consumer Discretionary (continued) |
||||||||||||||
| 16,429 | Regis, (3) |
$ | 301,472 | |||||||||||
| 17,200 | Rent-A-Center, (3) |
588,412 | ||||||||||||
| 45,209 | Saks, (2), (3) |
495,491 | ||||||||||||
| 7,295 | Scholastic, (3) |
222,862 | ||||||||||||
| 16,910 | Scientific Games, Class A, (3) |
171,806 | ||||||||||||
| 64,254 | Service Corporation International |
744,061 | ||||||||||||
| 24,990 | Signet Jewelers, (3) |
1,218,762 | ||||||||||||
| 19,579 | Sothebys Holdings Inc. |
769,846 | ||||||||||||
| 3,310 | Strayer Education, (3) |
326,631 | ||||||||||||
| 12,725 | Thor Industries, (3) |
430,487 | ||||||||||||
| 42,530 | Toll Brothers, (3) |
1,080,262 | ||||||||||||
| 20,685 | Tractor Supply, (3) |
2,035,611 | ||||||||||||
| 16,281 | Tupperware Corporation |
1,014,143 | ||||||||||||
| 10,661 | Under Armour, Class A, (3) |
1,044,032 | ||||||||||||
| 12,677 | Vallassis Communications, (3) |
253,540 | ||||||||||||
| 11,716 | Warnaco Group, (3) |
620,479 | ||||||||||||
| 85,962 | Wendy’s/Arby’s Group, Class A |
418,635 | ||||||||||||
| 29,838 | Williams-Sonoma, (3) |
1,154,432 | ||||||||||||
| 16,044 | WMS Industries Inc. |
393,238 | ||||||||||||
| Total Consumer Discretionary |
45,071,588 | |||||||||||||
| Consumer Staples – 3.8% |
||||||||||||||
| 41,304 | Church & Dwight, (3) |
2,098,243 | ||||||||||||
| 22,101 | Corn Products International, Inc. |
1,261,083 | ||||||||||||
| 19,129 | Energizer Holdings, (3) |
1,364,472 | ||||||||||||
| 31,790 | Flowers Foods, (3) |
681,896 | ||||||||||||
| 37,729 | Green Mountain Coffee, (3) |
1,839,289 | ||||||||||||
| 14,173 | Harris Teeter Supermarket, (3) |
538,149 | ||||||||||||
| 5,771 | Lancaster Colony, (3) |
376,327 | ||||||||||||
| 43,987 | Monster Beverage, (3) |
2,857,396 | ||||||||||||
| 8,005 | Post Holdings |
238,149 | ||||||||||||
| 16,014 | Ralcorp Holdings |
1,165,979 | ||||||||||||
| 46,686 | Smithfield Foods, (3) |
978,539 | ||||||||||||
| 7,323 | Tootsie Roll Industries, (3) |
174,361 | ||||||||||||
| 6,731 | Universal, (3) |
308,482 | ||||||||||||
| Total Consumer Staples |
13,882,365 | |||||||||||||
| Energy – 5.4% |
||||||||||||||
| 61,867 | Arch Coal, (2) |
603,822 | ||||||||||||
| 16,449 | Atwood Oceanics |
729,184 | ||||||||||||
| 13,626 | Bill Barrett, (2), (3) |
326,751 | ||||||||||||
| 5,758 | CARBO Ceramics, (3) |
484,190 | ||||||||||||
| 24,859 | Cimarex Energy, (3) |
1,718,005 | ||||||||||||
| 21,919 | Dresser-Rand Group, (3) |
1,067,017 | ||||||||||||
| 10,038 | Dril-Quip, (3) |
676,461 | ||||||||||||
| 20,916 | Energen |
1,095,580 | ||||||||||||
| 32,502 | Forest Oil |
432,927 | ||||||||||||
| 28 | Nuveen Investments |
| Shares | Description (1) | Value | ||||||||||||
| Energy (continued) |
||||||||||||||
| 30,637 | Helix Energy Solutions Group, (3) |
$ | 625,301 | |||||||||||
| 60,401 | HollyFrontier |
1,861,559 | ||||||||||||
| 18,414 | Northern Oil & Gas, (3) |
357,784 | ||||||||||||
| 31,336 | Oceaneering International, (3) |
1,617,878 | ||||||||||||
| 14,893 | Oil States International, (3) |
1,185,185 | ||||||||||||
| 26,954 | Patriot Coal, (2), (3) |
157,142 | ||||||||||||
| 44,840 | Patterson-UTI Energy |
725,063 | ||||||||||||
| 37,186 | Plains Exploration & Production |
1,519,048 | ||||||||||||
| 34,322 | Quicksilver Resources, (2), (3) |
161,313 | ||||||||||||
| 18,596 | SM Energy |
1,229,382 | ||||||||||||
| 45,710 | Superior Energy Services, (3) |
1,230,513 | ||||||||||||
| 14,873 | Tidewater |
818,461 | ||||||||||||
| 12,035 | Unit, (3) |
508,479 | ||||||||||||
| 20,123 | World Fuel Services, (3) |
886,619 | ||||||||||||
| Total Energy |
20,017,664 | |||||||||||||
| Financials – 19.9% |
||||||||||||||
| 15,533 | Affiliated Managers Group, (3) |
1,764,859 | ||||||||||||
| 17,992 | Alexandria Real Estate Equities – REIT |
1,347,961 | ||||||||||||
| 4,212 | Alleghany Corporation, Term Loan, (3) |
1,444,295 | ||||||||||||
| 21,628 | American Campus Communities – REIT, (3) |
961,365 | ||||||||||||
| 22,148 | American Financial Group |
862,000 | ||||||||||||
| 56,744 | Apollo Investments |
411,394 | ||||||||||||
| 33,051 | Arthur J. Gallagher & Co. |
1,241,396 | ||||||||||||
| 20,527 | Aspen Insurance Holdings, (3) |
581,325 | ||||||||||||
| 50,466 | Associated Banc, (3) |
672,712 | ||||||||||||
| 24,295 | Astoria Financial, (3) |
235,419 | ||||||||||||
| 23,831 | BancorpSouth, (3) |
321,004 | ||||||||||||
| 13,316 | Bank of Hawaii, (3) |
651,019 | ||||||||||||
| 44,734 | BioMed Realty Trust – REIT, (3) |
886,628 | ||||||||||||
| 21,968 | BRE Properties – REIT, (3) |
1,153,320 | ||||||||||||
| 33,679 | Brown & Brown Inc. |
908,323 | ||||||||||||
| 22,857 | Camden Property Trust – REIT, (3) |
1,546,733 | ||||||||||||
| 22,816 | Cathay General Bancorp, (3) |
392,892 | ||||||||||||
| 25,748 | CBOE Holdings, (3) |
680,777 | ||||||||||||
| 13,582 | City National Corporation |
723,377 | ||||||||||||
| 22,695 | Commerce Bancshares Inc. |
910,070 | ||||||||||||
| 20,889 | Corporate Office Properties Trust – REIT, (3) |
491,936 | ||||||||||||
| 17,776 | Cullen/Frost Bankers, (3) |
1,048,073 | ||||||||||||
| 75,138 | Duke Realty – REIT, (3) |
1,113,545 | ||||||||||||
| 43,125 | East West Bancorp Inc. |
981,956 | ||||||||||||
| 33,538 | Eaton Vance, (3) |
882,049 | ||||||||||||
| 17,309 | Equity One – REIT, (3) |
359,681 | ||||||||||||
| 10,096 | Essex Property Trust – REIT, (3) |
1,594,865 | ||||||||||||
| 15,405 | Everest Reinsurance Group Ltd |
1,526,636 | ||||||||||||
| 18,469 | Federal Realty Investment Trust – REIT, (3) |
1,859,090 | ||||||||||||
| 64,269 | Fidelity National Title Group Inc., Class A |
1,238,464 | ||||||||||||
| Nuveen Investments | 29 |
Portfolio of Investments (Unaudited)
Nuveen Mid Cap Index Fund (continued)
April 30, 2012
| Shares | Description (1) | Value | ||||||||||||
| Financials (continued) |
||||||||||||||
| 30,585 | First American Corporation |
$ | 512,299 | |||||||||||
| 102,054 | First Niagara Financial Group Inc. |
912,363 | ||||||||||||
| 31,679 | FirstMerit, (3) |
532,208 | ||||||||||||
| 58,100 | Fulton Financial, (3) |
609,469 | ||||||||||||
| 8,387 | Greenhill & Company, (3) |
325,835 | ||||||||||||
| 24,581 | Hancock Holding, (3) |
791,017 | ||||||||||||
| 13,054 | Hanover Insurance Group Inc. |
526,859 | ||||||||||||
| 30,195 | HCC Insurance Holdings Inc. |
965,032 | ||||||||||||
| 21,077 | Highwoods Properties – REIT, (3) |
732,004 | ||||||||||||
| 14,030 | Home Properties – REIT, (3) |
856,532 | ||||||||||||
| 35,828 | Hospitality Properties Trust – REIT, (3) |
988,136 | ||||||||||||
| 15,416 | International Bancshares Corporation – REIT |
304,158 | ||||||||||||
| 54,646 | Janus Capital Group, (3) |
414,217 | ||||||||||||
| 43,610 | Jefferies Group, (3) |
694,707 | ||||||||||||
| 12,653 | Jones Lang LaSalle Inc. |
1,011,481 | ||||||||||||
| 14,533 | Kemper Corporation |
435,845 | ||||||||||||
| 33,808 | Liberty Property Trust – REIT, (3) |
1,232,302 | ||||||||||||
| 38,285 | Macerich – REIT, (3) |
2,357,207 | ||||||||||||
| 25,466 | Mack-Cali Realty – REIT |
731,384 | ||||||||||||
| 10,506 | Mercury General, (3) |
474,766 | ||||||||||||
| 35,229 | MSCI Inc., Class A Shares, (3) |
1,289,029 | ||||||||||||
| 30,681 | National Retail Properties – REIT, (3) |
840,046 | ||||||||||||
| 126,737 | New York Community Bancorp, (3) |
1,709,682 | ||||||||||||
| 75,219 | Old Republic International Corporation |
748,429 | ||||||||||||
| 30,136 | OMEGA Healthcare Investors – REIT |
645,212 | ||||||||||||
| 11,660 | Potlatch – REIT |
364,958 | ||||||||||||
| 13,701 | Prosperity Bancshares, (3) |
639,152 | ||||||||||||
| 23,692 | Protective Life, (3) |
693,228 | ||||||||||||
| 32,342 | Raymond James Financial Inc. |
1,184,364 | ||||||||||||
| 35,513 | Rayonier – REIT, (3) |
1,610,515 | ||||||||||||
| 38,689 | Realty Income – REIT, (3) |
1,522,025 | ||||||||||||
| 26,082 | Regency Centers – REIT, (3) |
1,172,647 | ||||||||||||
| 21,282 | Reinsurance Group of America, (3) |
1,237,335 | ||||||||||||
| 42,001 | SEI Investments Company |
848,000 | ||||||||||||
| 47,177 | Senior Housing Properties Trust – REIT, (3) |
1,041,668 | ||||||||||||
| 13,393 | Signature Bank, (2), (3) |
879,786 | ||||||||||||
| 25,051 | SL Green Realty – REIT, (3) |
2,065,204 | ||||||||||||
| 12,867 | StanCorp Financial Group Inc. |
493,835 | ||||||||||||
| 12,656 | SVB Financial Group, (2), (3) |
811,123 | ||||||||||||
| 229,798 | Synovus Financial, (2) |
482,576 | ||||||||||||
| 16,840 | Taubman Centers – REIT, (3) |
1,299,711 | ||||||||||||
| 45,840 | TCF Financial, (3) |
525,785 | ||||||||||||
| 18,621 | Trustmark, (3) |
473,904 | ||||||||||||
| 64,781 | UDR – REIT |
1,705,684 | ||||||||||||
| 54,410 | Valley National Bancorp, (3) |
685,566 | ||||||||||||
| 30 | Nuveen Investments |
| Shares | Description (1) | Value | ||||||||||||
| Financials (continued) |
||||||||||||||
| 24,824 | Waddell & Reed Financial, Class A, (2) |
$ | 793,872 | |||||||||||
| 31,175 | Washington Federal Inc. |
546,810 | ||||||||||||
| 21,326 | Webster Financial, (2) |
484,740 | ||||||||||||
| 35,052 | Weingarten Realty Trust – REIT, (2) |
930,981 | ||||||||||||
| 8,145 | Westamerica Bancorporation, (2) |
373,611 | ||||||||||||
| 32,395 | W.R. Berkley, (3) |
1,219,996 | ||||||||||||
| Total Financials |
73,520,459 | |||||||||||||
| Health Care – 9.6% |
||||||||||||||
| 55,260 | Allscripts Healthcare Solutions Inc., (3) |
612,281 | ||||||||||||
| 13,957 | AmericGroup Corporation, (3) |
861,984 | ||||||||||||
| 5,726 | Bio-Rad Laboratories Inc., (3) |
618,351 | ||||||||||||
| 14,574 | Catalyst Health Solutions, (2), (3) |
1,258,756 | ||||||||||||
| 14,180 | Charles River Laboratories International, Inc. |
503,815 | ||||||||||||
| 25,631 | Community Health Systems, Inc. |
623,859 | ||||||||||||
| 13,831 | Cooper Companies, Inc. |
1,219,479 | ||||||||||||
| 16,970 | Covance, Inc., (2) |
793,517 | ||||||||||||
| 33,853 | Endo Pharmaceuticals Holdings, (2) |
1,189,594 | ||||||||||||
| 13,119 | Gen-Probe, Inc., (2) |
1,069,854 | ||||||||||||
| 73,801 | Health Management Associates Inc., (2) |
531,367 | ||||||||||||
| 24,027 | Health Net Inc., (2) |
855,601 | ||||||||||||
| 26,030 | Henry Schein, (2), (3) |
1,997,542 | ||||||||||||
| 17,962 | Hill Rom Holdings, (3) |
582,867 | ||||||||||||
| 24,941 | HMS Holdings, (2), (3) |
600,080 | ||||||||||||
| 76,511 | Hologic, (2), (3) |
1,462,890 | ||||||||||||
| 15,969 | Idexx Labs, (2), (3) |
1,404,154 | ||||||||||||
| 14,027 | Lifepoint Hospitals Inc., (2) |
547,334 | ||||||||||||
| 25,238 | Lincare Holdings, (3) |
615,807 | ||||||||||||
| 16,897 | Masimo, (3) |
373,931 | ||||||||||||
| 14,241 | MEDNAX, (2), (3) |
1,000,288 | ||||||||||||
| 16,947 | Medicis Pharmaceutical, Class A, (3) |
651,951 | ||||||||||||
| 9,120 | Mettler-Toledo International Inc. |
1,635,398 | ||||||||||||
| 32,951 | Omnicare, (3) |
1,148,013 | ||||||||||||
| 18,431 | Owens & Minor Inc., (3) |
538,922 | ||||||||||||
| 22,087 | Regeneron Pharmaceuticals, (2), (3) |
2,987,488 | ||||||||||||
| 41,821 | ResMed, (3) |
1,422,332 | ||||||||||||
| 16,718 | STERIS, (3) |
525,112 | ||||||||||||
| 10,590 | Techne |
708,895 | ||||||||||||
| 11,820 | Teleflex |
740,759 | ||||||||||||
| 16,948 | Thoratec |
589,960 | ||||||||||||
| 15,555 | United Therapeutics, (2) |
680,531 | ||||||||||||
| 28,057 | Universal Health Services, Class B |
1,198,314 | ||||||||||||
| 25,330 | VCA Antech |
599,308 | ||||||||||||
| 61,009 | Vertex Pharmaceuticals, (2) |
2,347,626 | ||||||||||||
| 12,429 | Wellcare Health Plans, (2) |
760,406 | ||||||||||||
| Total Health Care |
35,258,366 | |||||||||||||
| Nuveen Investments | 31 |
Portfolio of Investments (Unaudited)
Nuveen Mid Cap Index Fund (continued)
April 30, 2012
| Shares | Description (1) | Value | ||||||||||||
| Industrials – 15.8% |
||||||||||||||
| 12,214 | Acuity Brands, (3) |
$ | 678,732 | |||||||||||
| 33,973 | AECOM Technology, (2) |
749,784 | ||||||||||||
| 28,079 | AGCO, (2), (3) |
1,307,639 | ||||||||||||
| 20,567 | Alaska Air Group, (3) |
695,165 | ||||||||||||
| 12,146 | Alexander and Bald, Inc. |
621,389 | ||||||||||||
| 9,576 | Alliant Techsystems |
510,401 | ||||||||||||
| 46,347 | Ametek Inc. |
2,332,645 | ||||||||||||
| 30,145 | BE Aerospace Inc., (2) |
1,417,719 | ||||||||||||
| 13,595 | Brinks Company |
345,313 | ||||||||||||
| 17,923 | Carlisle Companies Inc. |
986,840 | ||||||||||||
| 14,580 | CLARCOR, Inc. |
700,132 | ||||||||||||
| 13,739 | Clean Harbors, (2), (3) |
937,549 | ||||||||||||
| 16,180 | Con-Way, Inc., (3) |
525,850 | ||||||||||||
| 30,965 | Copart Inc. |
817,786 | ||||||||||||
| 9,665 | Corporate Executive Board Company |
399,841 | ||||||||||||
| 28,872 | Corrections Corporation of America |
834,112 | ||||||||||||
| 13,982 | Crane Company |
617,026 | ||||||||||||
| 14,774 | Deluxe, (3) |
351,769 | ||||||||||||
| 43,197 | Donaldson Company, Inc. |
1,497,208 | ||||||||||||
| 8,891 | Esterline Technologies Corporation, (2) |
608,945 | ||||||||||||
| 53,593 | Exelis Inc. |
617,927 | ||||||||||||
| 45,790 | Fortune Brands Home & Security, (2) |
1,041,265 | ||||||||||||
| 12,067 | FTI Consulting, (3) |
438,515 | ||||||||||||
| 14,695 | Gardner Denver |
957,232 | ||||||||||||
| 13,546 | GATX Corporation |
580,717 | ||||||||||||
| 14,434 | General Cable, (3) |
424,937 | ||||||||||||
| 17,360 | Graco Inc. |
925,462 | ||||||||||||
| 9,975 | Granite Construction Inc. |
277,704 | ||||||||||||
| 23,359 | Harsco Corporation |
520,906 | ||||||||||||
| 13,018 | HNI Corporation |
313,994 | ||||||||||||
| 17,290 | Hubbell Incorporated, Class B |
1,387,350 | ||||||||||||
| 14,158 | Huntington Ingalls Industries Inc., (2) |
558,533 | ||||||||||||
| 24,309 | IDEX Corporation |
1,052,823 | ||||||||||||
| 27,526 | ITT Industries, (3) |
618,234 | ||||||||||||
| 26,142 | J.B. Hunt Transports Serives, (3) |
1,446,437 | ||||||||||||
| 59,622 | JetBlue Airways, (3) |
283,205 | ||||||||||||
| 31,887 | Kansas City Southern, (2), (3) |
2,455,937 | ||||||||||||
| 42,937 | KBR Inc. |
1,453,847 | ||||||||||||
| 23,132 | Kennametal, (3) |
976,864 | ||||||||||||
| 16,198 | Kirby Corporation |
1,075,061 | ||||||||||||
| 13,855 | Korn Ferry International |
223,758 | ||||||||||||
| 13,551 | Landstar System, (3) |
725,927 | ||||||||||||
| 14,752 | Lennox International, (3) |
640,237 | ||||||||||||
| 24,294 | Lincoln Electric Holdings Inc. |
1,190,649 | ||||||||||||
| 32 | Nuveen Investments |
| Shares | Description (1) | Value | ||||||||||||
| Industrials (continued) |
||||||||||||||
| 23,244 | Manpower Inc. |
$ | 990,194 | |||||||||||
| 16,816 | Miller (Herman) Inc. |
328,416 | ||||||||||||
| 8,940 | Mine Safety Appliances Company |
379,592 | ||||||||||||
| 13,315 | MSC Industrial Direct Inc., Class A |
981,449 | ||||||||||||
| 17,174 | Nordson, (3) |
925,679 | ||||||||||||
| 26,553 | Oshkosh Truck Corporation |
606,205 | ||||||||||||
| 28,606 | Pentair, (3) |
1,239,784 | ||||||||||||
| 12,073 | Regal-Beloit Corporation |
816,618 | ||||||||||||
| 18,743 | Rollins Inc. |
398,289 | ||||||||||||
| 18,899 | Shaw Group, (2) |
572,073 | ||||||||||||
| 14,862 | SPX, (3) |
1,141,104 | ||||||||||||
| 31,848 | Terex, (3) |
721,039 | ||||||||||||
| 15,141 | Thomas & Betts Corporation |
1,088,789 | ||||||||||||
| 24,381 | Timken, (2) |
1,377,770 | ||||||||||||
| 14,682 | Towers Watson & Company, Class A Shares |
960,203 | ||||||||||||
| 23,263 | Trinity Industries Inc. |
688,585 | ||||||||||||
| 12,516 | Triumph Group, (2) |
786,255 | ||||||||||||
| 21,996 | United Rentals, (2), (3) |
1,026,773 | ||||||||||||
| 23,090 | URS Corporation, (2) |
953,848 | ||||||||||||
| 29,817 | UTI Worldwide, Inc. |
497,049 | ||||||||||||
| 6,530 | Valmont Industries, Inc. |
809,263 | ||||||||||||
| 13,863 | Wabtec Corporation |
1,078,264 | ||||||||||||
| 35,546 | Waste Connections, (3) |
1,145,648 | ||||||||||||
| 7,992 | Watsco, (3) |
575,024 | ||||||||||||
| 12,890 | Werner Enterprises, (3) |
304,462 | ||||||||||||
| 17,421 | Woodward Governor, (3) |
724,539 | ||||||||||||
| Total Industrials |
58,240,280 | |||||||||||||
| Information Technology – 15.1% |
||||||||||||||
| 11,363 | ACI Worldwide, Inc. |
452,929 | ||||||||||||
| 22,679 | Acxiom Corporation |
311,383 | ||||||||||||
| 18,511 | ADTRAN, (3) |
564,956 | ||||||||||||
| 9,321 | Advent Software, (2), (3) |
251,574 | ||||||||||||
| 14,516 | Alliance Data Systems, (2), (3) |
1,865,161 | ||||||||||||
| 26,911 | ANSYS, (2), (3) |
1,804,921 | ||||||||||||
| 27,458 | AOL, (2), (3) |
687,548 | ||||||||||||
| 32,457 | Arrow Electronics, (2), (3) |
1,364,817 | ||||||||||||
| 130,798 | Atmel, (2), (3) |
1,160,178 | ||||||||||||
| 42,073 | Avnet, (2) |
1,517,994 | ||||||||||||
| 35,978 | Broadridge Financial Solutions, Inc. |
835,049 | ||||||||||||
| 79,468 | Cadence Design Systems, (2), (3) |
927,392 | ||||||||||||
| 28,613 | Ciena, (2), (3) |
424,045 | ||||||||||||
| 63,397 | Compuware Corporation, (2) |
552,822 | ||||||||||||
| 13,600 | Concur Technologies, (3) |
769,216 | ||||||||||||
| 33,606 | Convergys, (2), (3) |
449,312 | ||||||||||||
| 30,904 | CoreLogic Inc., (2) |
516,097 | ||||||||||||
| Nuveen Investments | 33 |
Portfolio of Investments (Unaudited)
Nuveen Mid Cap Index Fund (continued)
April 30, 2012
| Shares | Description (1) | Value | ||||||||||||
| Information Technology (continued) |
||||||||||||||
| 33,520 | Cree, (2), (3) |
$ | 1,035,768 | |||||||||||
| 44,915 | Cypress Semiconductor Corporation, (2) |
696,183 | ||||||||||||
| 18,133 | Diebold Inc. |
715,347 | ||||||||||||
| 9,739 | DST Systems Inc. |
545,189 | ||||||||||||
| 13,534 | Equinix, (2), (3) |
2,222,283 | ||||||||||||
| 13,085 | FactSet Research Systems, (3) |
1,372,093 | ||||||||||||
| 10,452 | Fair Isaac Corporation |
448,391 | ||||||||||||
| 36,535 | Fairchild Semiconductor International Inc., Class A, (2) |
517,701 | ||||||||||||
| 27,082 | Gartner, Class A, (3) |
1,186,192 | ||||||||||||
| 22,729 | Global Payments Inc. |
1,055,307 | ||||||||||||
| 31,144 | Informatica, (2), (3) |
1,433,247 | ||||||||||||
| 43,536 | Ingram Micro, Class A, (2) |
847,211 | ||||||||||||
| 41,012 | Integrated Device Technology, (2), (3) |
277,651 | ||||||||||||
| 20,034 | International Rectifier Corporation, (2) |
437,342 | ||||||||||||
| 36,724 | Intersil Holding Corporation, Class A |
377,155 | ||||||||||||
| 11,552 | Itron, (2), (3) |
471,322 | ||||||||||||
| 24,422 | Jack Henry & Associates, (3) |
829,371 | ||||||||||||
| 34,773 | Lam Research, (2), (3) |
1,448,295 | ||||||||||||
| 24,486 | Lender Processing Services Inc. |
650,103 | ||||||||||||
| 6,540 | ManTech International, Class A, (3) |
205,487 | ||||||||||||
| 66,632 | MEMC Electronic Materials, (2), (3) |
239,209 | ||||||||||||
| 27,611 | Mentor Graphics Corporation, (2) |
398,979 | ||||||||||||
| 23,099 | Micros Systems, Inc., (2) |
1,312,716 | ||||||||||||
| 35,703 | Monster Worldwide, (3) |
308,117 | ||||||||||||
| 26,952 | National Instruments, (3) |
733,094 | ||||||||||||
| 45,915 | NCR Corporation, (2) |
1,079,003 | ||||||||||||
| 19,551 | NeuStar, Inc., (2) |
710,679 | ||||||||||||
| 34,382 | Parametric Technology, (3) |
741,964 | ||||||||||||
| 12,303 | Plantronics Inc. |
471,451 | ||||||||||||
| 51,475 | Polycom, (2), (3) |
683,073 | ||||||||||||
| 28,619 | QLogic Corporation, (2) |
493,678 | ||||||||||||
| 16,457 | Quest Software Inc., (2) |
382,954 | ||||||||||||
| 30,239 | Rackspace Hosting, (2), (3) |
1,756,584 | ||||||||||||
| 80,122 | RF Micro Devices, (3) |
346,928 | ||||||||||||
| 45,690 | Riverbed Technology, (3) |
901,464 | ||||||||||||
| 31,116 | Rovi Corporation |
889,918 | ||||||||||||
| 18,875 | Semtech, (3) |
514,533 | ||||||||||||
| 12,251 | Silicon Laboratories, (3) |
434,788 | ||||||||||||
| 54,652 | Skyworks Solutions, (2) |
1,483,255 | ||||||||||||
| 20,320 | Solera Holdings Inc. |
913,181 | ||||||||||||
| 42,288 | Synopsys Inc., (2) |
1,269,063 | ||||||||||||
| 11,936 | Tech Data, (2), (3) |
642,037 | ||||||||||||
| 105,046 | Tellabs, (3) |
396,023 | ||||||||||||
| 48,333 | Tibco Software, (2) |
1,590,156 | ||||||||||||
| 36,085 | Trimble Navigation |
1,953,642 | ||||||||||||
| 34 | Nuveen Investments |
| Shares | Description (1) | Value | ||||||||||||
| Information Technology (continued) |
||||||||||||||
| 22,825 | ValueClick, (2), (3) |
$ | 483,434 | |||||||||||
| 30,735 | VeriFone Holdings, (2), (3) |
1,464,215 | ||||||||||||
| 45,599 | Vishay Intertechnology, (3) |
511,621 | ||||||||||||
| 11,223 | Wright Express, (2) |
716,252 | ||||||||||||
| 15,081 | Zebra Technologies, Class A, (2) |
584,992 | ||||||||||||
| Total Information Technology |
55,634,035 | |||||||||||||
| Materials – 6.0% |
||||||||||||||
| 25,796 | Albemarle Corporation |
1,684,479 | ||||||||||||
| 19,099 | AptarGroup Inc. |
1,041,086 | ||||||||||||
| 22,714 | Ashland, (3) |
1,496,171 | ||||||||||||
| 18,290 | Cabot Corporation |
788,848 | ||||||||||||
| 12,752 | Carpenter Technology, (3) |
709,776 | ||||||||||||
| 33,529 | Commercial Metals, (3) |
495,559 | ||||||||||||
| 9,579 | Compass Minerals International, (3) |
732,985 | ||||||||||||
| 13,343 | Cytec Industries, Inc. |
848,215 | ||||||||||||
| 10,661 | Domtar Corporation |
932,624 | ||||||||||||
| 8,908 | Greif Inc. |
477,825 | ||||||||||||
| 15,271 | Intrepid Potash, (2), (3) |
379,484 | ||||||||||||
| 39,778 | Louisiana-Pacific, (3) |
359,991 | ||||||||||||
| 13,233 | Martin Marietta Materials, (3) |
1,096,751 | ||||||||||||
| 5,142 | Minerals Technologies, (3) |
345,028 | ||||||||||||
| 3,072 | NewMarket, (3) |
685,732 | ||||||||||||
| 23,221 | Olin Corporation |
486,712 | ||||||||||||
| 27,992 | Packaging Corp. of America |
817,086 | ||||||||||||
| 21,766 | Reliance Steel & Aluminum Company |
1,216,502 | ||||||||||||
| 20,476 | Rock-Tenn Company |
1,276,269 | ||||||||||||
| 38,072 | RPM International, Inc. |
1,011,573 | ||||||||||||
| 12,526 | Scotts Miracle-Gro, Class A, (2) |
656,362 | ||||||||||||
| 14,585 | Sensient Technologies Corporation |
541,833 | ||||||||||||
| 14,157 | Silgan Holdings, Inc. |
621,068 | ||||||||||||
| 29,163 | Sonoco Products Company |
966,170 | ||||||||||||
| 63,532 | Steel Dynamics Inc. |
811,304 | ||||||||||||
| 27,072 | Valspar, (3) |
1,384,733 | ||||||||||||
| 15,196 | Worthington Industries, (3) |
271,097 | ||||||||||||
| Total Materials |
22,135,263 | |||||||||||||
| Telecommunication Services – 0.4% |
||||||||||||||
| 27,998 | Telephone & Data Systems |
680,071 | ||||||||||||
| 43,291 | TW Telecom, (2) |
942,878 | ||||||||||||
| Total Telecommunication Services |
1,622,949 | |||||||||||||
| Utilities – 4.4% |
||||||||||||||
| 32,201 | Alliant Energy |
1,456,773 | ||||||||||||
| 40,282 | Aqua America, (3) |
914,804 | ||||||||||||
| 26,169 | Atmos Energy |
852,586 | ||||||||||||
| 12,742 | Black Hills |
420,613 | ||||||||||||
| 17,643 | Cleco, (3) |
719,834 | ||||||||||||
| Nuveen Investments | 35 |
Portfolio of Investments (Unaudited)
Nuveen Mid Cap Index Fund (continued)
April 30, 2012
| Shares | Description (1) | Value | ||||||||||||||||||
| Utilities (continued) |
||||||||||||||||||||
| 39,495 | Great Plains Energy, (3) |
$ | 806,488 | |||||||||||||||||
| 27,878 | Hawaiian Electric Industries |
739,882 | ||||||||||||||||||
| 14,488 | IDACORP, (3) |
590,241 | ||||||||||||||||||
| 54,635 | MDU Resources Group Inc. |
1,253,327 | ||||||||||||||||||
| 24,095 | National Fuel Gas, (3) |
1,140,175 | ||||||||||||||||||
| 68,454 | NV Energy Inc. |
1,139,759 | ||||||||||||||||||
| 28,150 | OGE Energy Corp. |
1,518,974 | ||||||||||||||||||
| 23,324 | PNM Resources Inc. |
437,558 | ||||||||||||||||||
| 51,610 | Questar Corporation |
1,019,298 | ||||||||||||||||||
| 32,522 | UGI Corporation |
948,992 | ||||||||||||||||||
| 23,766 | Vectren Corporation |
699,909 | ||||||||||||||||||
| 36,558 | Westar Energy, (3) |
1,048,847 | ||||||||||||||||||
| 14,937 | WGL Holdings Inc. |
599,121 | ||||||||||||||||||
| Total Utilities |
16,307,181 | |||||||||||||||||||
| Total Common Stocks (cost $280,972,155) |
341,690,150 | |||||||||||||||||||
| Shares | Description (1) | Value | ||||||||||||||||||
| INVESTMENTS PURCHASED WITH COLLATERAL FROM SECURITIES LENDING – 35.7% |
|
|||||||||||||||||||
| Money Market Fund – 35.7% |
||||||||||||||||||||
| 131,577,685 | Mount Vernon Securities Lending Prime Portfolio, 0.276%, (4), (5) |
$ | 131,577,685 | |||||||||||||||||
| Total Investments Purchased with Collateral from Securities Lending (cost $131,577,685) |
|
131,577,685 | ||||||||||||||||||
| Shares/ Principal Amount (000) |
Description (1) | Coupon | Maturity |
Ratings (6) |
Value | |||||||||||||||
| SHORT-TERM INVESTMENTS – 7.8% |
||||||||||||||||||||
| Money Market Funds – 7.2% |
||||||||||||||||||||
| 26,578,634 | First American Treasury Obligations Fund, Class Z |
0.000% | (4) | N/A | N/A | $ | 26,578,634 | |||||||||||||
| U.S. Government and Agency Obligations – 0.6% |
||||||||||||||||||||
| $ | 2,350 | U.S. Treasury Bill, (7) |
0.022% | 9/20/12 | Aaa | 2,348,818 | ||||||||||||||
| Total Short-Term Investments (cost $28,927,835) |
28,927,452 | |||||||||||||||||||
| Total Investments (cost $441,477,675) – 136.1% |
502,195,287 | |||||||||||||||||||
| Other Assets Less Liabilities – (36.1)% (8) |
(133,187,444) | |||||||||||||||||||
| Net Assets – 100% |
$ | 369,007,843 | ||||||||||||||||||
Investments in Derivatives at April 30, 2012:
Futures Contracts outstanding:
| Type | Contract Position |
Number of Contracts |
Contract Expiration |
Value | Unrealized Appreciation (Depreciation) |
|||||||||||||||
| S&P Mid Cap 400 E-Mini Index |
Long | 277 | 6/12 | $ | 27,411,920 | $ | 521,631 | |||||||||||||
| 36 | Nuveen Investments |
| For Fund portfolio compliance purposes, the Fund’s industry classifications refer to any one or more of the industry sub-classifications used by one or more widely recognized market indexes or ratings group indexes, and/or as defined by the Fund management. This definition may not apply for purposes of this report which may combine industry sub-classifications into sectors for reporting ease. |
| (1) | All percentages shown in the Portfolio of Investments are based on net assets. |
| (2) | Non-income producing; issuer has not declared a dividend within the past twelve months. |
| (3) | Investment, or a portion of investment, is out on loan for securities lending. |
| (4) | The rate shown is the annualized seven-day effective yield as of April 30, 2012. |
| (5) | The Fund may loan securities representing up to one third of the fair value of its total assets (which includes collateral for securities on loan) to broker dealers, banks, and other institutions. The Fund maintains collateral equal to at least 102% of the fair value of the securities loaned. The cash collateral received by the Fund is invested in this money market fund. See Notes to Financial Statements, Footnote 1 - General Information and Significant Accounting Policies, Securities Lending for more information. |
| (6) | Ratings: Using the highest of Standard & Poor’s Group (“Standard & Poor’s”), Moody’s Investors Service, Inc. (“Moody’s”) or Fitch, Inc. (“Fitch”) rating. Ratings below BBB by Standard & Poor’s, Baa by Moody’s or BBB by Fitch are considered to be below investment grade. Holdings designated N/R are not rated by any of these national rating agencies. |
| (7) | Investment, or portion of investment, segregated as collateral for investments in derivatives. |
| (8) | Other Assets Less Liabilities includes the Net Unrealized Appreciation (Depreciation) of derivative instruments as noted within Investments in Derivatives at April 30, 2012. |
| N/A | Not applicable |
| REIT | Real Estate Investment Trust |
See accompanying notes to financial statements.
| Nuveen Investments | 37 |
Portfolio of Investments (Unaudited)
Nuveen Small Cap Index Fund
April 30, 2012
| Shares | Description (1) | Value | ||||||||||||
| COMMON STOCKS – 96.2% |
||||||||||||||
| Consumer Discretionary – 13.3% |
||||||||||||||
| 1,670 | 1-800-Flowers.com, Class A, (2) |
$ | 4,977 | |||||||||||
| 1,199 | A.H. Belo, Class A Shares |
5,288 | ||||||||||||
| 5,187 | Aeropostale, Inc. |
115,048 | ||||||||||||
| 1,591 | AFC Enterprises, (3) |
27,174 | ||||||||||||
| 1,138 | Ambassadors Group, (3) |
6,134 | ||||||||||||
| 4,290 | American Axle and Manufacturing Holdings Inc., (2) |
41,570 | ||||||||||||
| 2,462 | American Greetings, Class A, (3) |
39,392 | ||||||||||||
| 1,149 | American Public Education, (2), (3) |
39,893 | ||||||||||||
| 550 | America’s Car-Mart, Inc., (2) |
25,267 | ||||||||||||
| 1,856 | Amerigon, (2), (3) |
26,541 | ||||||||||||
| 2,070 | Ameristar Casinos, Inc. |
37,219 | ||||||||||||
| 3,103 | Ann, (2), (3) |
85,922 | ||||||||||||
| 1,744 | Arbitron Inc. |
66,359 | ||||||||||||
| 840 | Archipelago Learning Inc., (2) |
9,299 | ||||||||||||
| 780 | Arctic Cat, Inc. |
34,507 | ||||||||||||
| 1,876 | Asbury Automotive Group, (3) |
52,378 | ||||||||||||
| 8,072 | Ascena Retail Group, (2), (3) |
165,315 | ||||||||||||
| 926 | Ascent Media Corporation, (2) |
47,689 | ||||||||||||
| 1,865 | Barnes & Noble, (3) |
38,699 | ||||||||||||
| 4,895 | Beazer Homes USA, (2), (3) |
15,175 | ||||||||||||
| 2,448 | bebe stores, inc. |
20,074 | ||||||||||||
| 5,949 | Belo, Class A, (3) |
40,096 | ||||||||||||
| 928 | Benihana, Inc. |
12,797 | ||||||||||||
| 1,413 | Big 5 Sporting Goods Corporation |
11,827 | ||||||||||||
| 71 | Biglari Holdings Inc., (2) |
28,849 | ||||||||||||
| 1,545 | BJ’s Restaurants, (2), (3) |
66,729 | ||||||||||||
| 1,200 | Black Diamond Group Inc., (2) |
11,916 | ||||||||||||
| 766 | Blue Nile, (2), (3) |
23,194 | ||||||||||||
| 333 | Blyth, (3) |
29,294 | ||||||||||||
| 1,948 | Bob Evans Farms, (3) |
74,492 | ||||||||||||
| 756 | Body Central, (2), (3) |
22,960 | ||||||||||||
| 794 | Bon-Ton Stores, (3) |
4,923 | ||||||||||||
| 3,519 | Boyd Gaming, (3) |
27,061 | ||||||||||||
| 1,237 | Bravo Brio Restaurant Group, (2), (3) |
24,987 | ||||||||||||
| 1,148 | Bridgepoint Education, (2) |
24,751 | ||||||||||||
| 2,697 | Brown Shoe, (3) |
24,570 | ||||||||||||
| 5,721 | Brunswick Corporation |
150,405 | ||||||||||||
| 1,730 | Buckle, (3) |
79,891 | ||||||||||||
| 1,178 | Buffalo Wild Wings, Inc. |
98,775 | ||||||||||||
| 963 | Build-A-Bear-Workshop, Inc. |
4,343 | ||||||||||||
| 2,780 | Cabela’s, (3) |
105,112 | ||||||||||||
| 2,362 | Caesar’s Entertainment, (3) |
34,580 | ||||||||||||
| 4,138 | Callaway Golf, (3) |
25,366 | ||||||||||||
| 1,061 | Cambium Learning Group, (2) |
2,408 | ||||||||||||
| 38 | Nuveen Investments |
| Shares | Description (1) | Value | ||||||||||||
| Consumer Discretionary (continued) |
||||||||||||||
| 929 | Capella Education Company |
$ | 30,388 | |||||||||||
| 830 | Caribou Coffee, (3) |
13,620 | ||||||||||||
| 810 | Carrols Restaurant Group, (2) |
12,215 | ||||||||||||
| 3,159 | Carter’s, (3) |
171,534 | ||||||||||||
| 2,708 | Casual Male Retail Group Inc. |
8,503 | ||||||||||||
| 1,660 | Cato Corporation |
46,198 | ||||||||||||
| 439 | Cavco Industries, Inc. |
22,652 | ||||||||||||
| 1,475 | CBRL Group, (3) |
84,842 | ||||||||||||
| 1,275 | CEC Entertainment Inc. |
48,731 | ||||||||||||
| 2,353 | Central European Media Enterprises, (2), (3) |
18,612 | ||||||||||||
| 7,469 | Charming Shoppes, (3) |
44,067 | ||||||||||||
| 3,710 | Cheesecake Factory, (3) |
116,865 | ||||||||||||
| 546 | Cherokee Inc. |
7,087 | ||||||||||||
| 1,676 | Childrens Place Retail Stores, (3) |
77,062 | ||||||||||||
| 2,299 | Christopher & Banks Corporation |
4,299 | ||||||||||||
| 807 | Churchill Downs Inc. |
47,904 | ||||||||||||
| 5,972 | Cinemark Holdings, (3) |
137,117 | ||||||||||||
| 963 | Citi Trends, Inc., (2) |
10,728 | ||||||||||||
| 2,014 | Coinstar, (2), (3) |
126,459 | ||||||||||||
| 4,677 | Coldwater Creek Inc. |
4,630 | ||||||||||||
| 3,954 | Collective Brands, (2), (3) |
82,125 | ||||||||||||
| 779 | Columbia Sportswear, (3) |
36,691 | ||||||||||||
| 931 | Conn’s, (3) |
15,222 | ||||||||||||
| 3,990 | Cooper Tire & Rubber, (3) |
59,651 | ||||||||||||
| 732 | Core-Mark Holding Company, Inc. |
28,255 | ||||||||||||
| 5,007 | Corinthian Colleges Inc. |
19,227 | ||||||||||||
| 5,800 | Crocs, (3) |
117,160 | ||||||||||||
| 2,242 | Crown Media Holdings, (3) |
3,385 | ||||||||||||
| 521 | CSS Industries Inc. |
9,977 | ||||||||||||
| 2,421 | Cumulus Media, (3) |
8,788 | ||||||||||||
| 9,538 | Dana Holding, (2), (3) |
139,446 | ||||||||||||
| 1,220 | Delete Accumulation File |
23,631 | ||||||||||||
| 456 | Delta Apparel, (3) |
6,525 | ||||||||||||
| 6,355 | Denny’s, (2), (3) |
26,310 | ||||||||||||
| 689 | Destination Maternity Corporation |
13,670 | ||||||||||||
| 323 | Dial Global Inc., (2) |
730 | ||||||||||||
| 237 | Digital Domain Media Group I, (3) |
2,015 | ||||||||||||
| 1,761 | Digital Generation Inc |
16,342 | ||||||||||||
| 994 | DineEquity, (3) |
48,289 | ||||||||||||
| 3,740 | Dominos Pizza, (2), (3) |
141,409 | ||||||||||||
| 694 | Dorman Products, Inc. |
33,159 | ||||||||||||
| 1,228 | Drew Industries Inc., (2) |
36,570 | ||||||||||||
| 2,025 | E.W. Scripps Company, Class A |
18,549 | ||||||||||||
| 382 | Einstein Noah Restaurant Group |
5,405 | ||||||||||||
| 1,555 | Entercom Communications, (3) |
9,625 | ||||||||||||
| Nuveen Investments | 39 |
Portfolio of Investments (Unaudited)
Nuveen Small Cap Index Fund (continued)
April 30, 2012
| Shares | Description (1) | Value | ||||||||||||
| Consumer Discretionary (continued) |
||||||||||||||
| 7,957 | Entravision Communications Corporation |
$ | 12,492 | |||||||||||
| 1,551 | Ethan Allen Interiors, (3) |
35,983 | ||||||||||||
| 4,973 | Exide Technologies |
14,322 | ||||||||||||
| 3,551 | Express, (2) |
83,875 | ||||||||||||
| 3,330 | Finish Line, Inc. |
74,126 | ||||||||||||
| 566 | Fisher Communications, Inc. |
18,559 | ||||||||||||
| 644 | Francescas Holdings, (3) |
20,189 | ||||||||||||
| 2,379 | Freds Inc. |
34,067 | ||||||||||||
| 1,070 | Fuel Systems Solutions, Inc., (2) |
25,092 | ||||||||||||
| 2,695 | Furniture Brands International, Inc. |
4,258 | ||||||||||||
| 1,061 | G-iii Apparel Group, (2), (3) |
28,488 | ||||||||||||
| 2,289 | Gaylord Entertainment, (3) |
72,058 | ||||||||||||
| 282 | Geeknet, (2) |
4,103 | ||||||||||||
| 1,523 | Genesco |
114,225 | ||||||||||||
| 733 | Global Sources |
4,515 | ||||||||||||
| 1,468 | GNC Holdings Inc A |
57,340 | ||||||||||||
| 343 | Gordmans Stores Inc. |
7,285 | ||||||||||||
| 1,842 | Grand Canyon Education Inc., (2) |
32,032 | ||||||||||||
| 5,470 | Gray Television, (3) |
9,846 | ||||||||||||
| 1,460 | Group 1 Automotive, (3) |
84,505 | ||||||||||||
| 2,843 | Harte-Hanks, (3) |
23,881 | ||||||||||||
| 1,207 | Haverty Furniture Companies Inc. |
14,484 | ||||||||||||
| 1,984 | Helen of Troy Limited, (2) |
68,646 | ||||||||||||
| 1,083 | hhgregg, (2), (3) |
11,328 | ||||||||||||
| 1,760 | Hibbett Sporting Goods, (3) |
105,107 | ||||||||||||
| 4,028 | Hillenbrand Inc. |
84,346 | ||||||||||||
| 2,569 | Hosting Site Network, Inc. |
99,420 | ||||||||||||
| 2,714 | Hot Topic, Inc. |
26,597 | ||||||||||||
| 3,936 | Hovnanian Enterprises, Class A, (3) |
7,872 | ||||||||||||
| 4,686 | Iconix Brand Group, Inc. |
71,883 | ||||||||||||
| 2,585 | Interval Leisure Group, (2) |
44,669 | ||||||||||||
| 1,893 | International Speedway, Class A |
50,524 | ||||||||||||
| 1,527 | iRobot, (3) |
36,052 | ||||||||||||
| 1,900 | Isle of Capri Casinos |
11,875 | ||||||||||||
| 2,826 | Jack in the Box Inc., Term Loan |
64,207 | ||||||||||||
| 1,748 | JAKKS Pacific, (3) |
33,334 | ||||||||||||
| 4,235 | Jamba, Inc., (2) |
7,877 | ||||||||||||
| 310 | Johnson Outdoors, Inc. |
5,726 | ||||||||||||
| 5,196 | Jones Apparel Group Inc. |
58,299 | ||||||||||||
| 1,774 | Jos. A. Bank Clothiers, Class A, (3) |
84,354 | ||||||||||||
| 2,776 | Journal Communications Inc. |
11,631 | ||||||||||||
| 1,682 | K Swiss, Inc. |
6,190 | ||||||||||||
| 1,671 | K12, (2), (3) |
42,611 | ||||||||||||
| 4,944 | KB Home, (3) |
42,914 | ||||||||||||
| 484 | Kenneth Cole Productions |
7,710 | ||||||||||||
| 40 | Nuveen Investments |
| Shares | Description (1) | Value | ||||||||||||
| Consumer Discretionary (continued) |
||||||||||||||
| 1,077 | Kirkland’s, (3) |
$ | 15,767 | |||||||||||
| 1,931 | Knology, (3) |
37,558 | ||||||||||||
| 3,758 | Krispy Kreme Doughnuts |
27,546 | ||||||||||||
| 3,332 | La-Z Boy |
50,213 | ||||||||||||
| 2,663 | LeapFrog Enterprises, (2), (3) |
24,872 | ||||||||||||
| 1,274 | Libbey Inc. |
18,180 | ||||||||||||
| 2,718 | Life Time Fitness, (2), (3) |
126,550 | ||||||||||||
| 596 | Lifetime Brands, Inc. |
6,943 | ||||||||||||
| 1,905 | LIN TV Corporation |
7,525 | ||||||||||||
| 1,451 | Lincoln Educational Services Corporation |
10,650 | ||||||||||||
| 2,896 | Lions Gate Entertainment, (3) |
35,418 | ||||||||||||
| 1,417 | Lithia Motors, (3) |
38,018 | ||||||||||||
| 9,068 | Live Nation, (3) |
82,156 | ||||||||||||
| 6,077 | Liz Claiborne, Inc. |
81,432 | ||||||||||||
| 1,209 | Luby’s Inc. |
7,399 | ||||||||||||
| 1,487 | Lumber Liquidators, (2), (3) |
43,019 | ||||||||||||
| 1,202 | M/I Homes, Inc., (2) |
15,987 | ||||||||||||
| 764 | Mac-Gray Corporation |
11,384 | ||||||||||||
| 1,504 | Maidenform Brands Inc., (2) |
34,336 | ||||||||||||
| 1,310 | Marcus Corporation |
16,388 | ||||||||||||
| 704 | Marine Products Corporation |
4,203 | ||||||||||||
| 1,492 | Marinemax Inc. |
15,905 | ||||||||||||
| 1,749 | Martha Stewart Living Omnimedia Inc. |
6,244 | ||||||||||||
| 1,896 | Matthews International, (3) |
56,880 | ||||||||||||
| 367 | Mattress Firm Holding, (3) |
14,695 | ||||||||||||
| 3,707 | McClatchy, (3) |
10,083 | ||||||||||||
| 2,409 | MDC Holdings, (3) |
67,717 | ||||||||||||
| 1,610 | MDC Partners, Inc. |
16,615 | ||||||||||||
| 3,307 | Mens Wearhouse Inc. |
122,491 | ||||||||||||
| 2,334 | Meredith, (3) |
67,289 | ||||||||||||
| 1,796 | Meritage, (2), (3) |
50,988 | ||||||||||||
| 2,989 | Modine Manufacturing Company |
23,613 | ||||||||||||
| 572 | Monarch Casino & Resort, Inc. |
5,537 | ||||||||||||
| 1,958 | Monro Muffler Brake, (3) |
80,787 | ||||||||||||
| 1,523 | Morgans Hotel Group Company, (2) |
7,554 | ||||||||||||
| 775 | Motorcar Parts of America, Inc. |
5,859 | ||||||||||||
| 1,111 | Movado Group Inc. |
31,497 | ||||||||||||
| 1,728 | Multimedia Games, Inc. |
19,630 | ||||||||||||
| 570 | National American University Holdings Inc. |
2,981 | ||||||||||||
| 3,543 | National CineMedia, Inc. |
50,629 | ||||||||||||
| 1,748 | New York & Company Inc. |
6,905 | ||||||||||||
| 8,813 | New York Times, Class A, (2), (3) |
55,610 | ||||||||||||
| 704 | Nexstar Broadcasting Group, Inc., (2) |
5,456 | ||||||||||||
| 1,667 | Nutri System, (3) |
19,304 | ||||||||||||
| 17,834 | Office Depot, Inc., (2) |
54,215 | ||||||||||||
| Nuveen Investments | 41 |
Portfolio of Investments (Unaudited)
Nuveen Small Cap Index Fund (continued)
April 30, 2012
| Shares | Description (1) | Value | ||||||||||||
| Consumer Discretionary (continued) |
||||||||||||||
| 5,524 | OfficeMax Inc., (2) |
$ | 25,687 | |||||||||||
| 1,345 | Orbitz Worldwide Inc., (2) |
4,909 | ||||||||||||
| 6,123 | Orient Express Hotels Limited, (2) |
65,455 | ||||||||||||
| 886 | Outdoor Channel Holdings, Inc. |
6,556 | ||||||||||||
| 744 | Overstock.com, (3) |
4,486 | ||||||||||||
| 824 | Oxford Industries Inc. |
39,544 | ||||||||||||
| 1,363 | P.F. Changs China Bistro, Inc. |
54,097 | ||||||||||||
| 3,047 | Pacific Sunwear of California, (3) |
4,479 | ||||||||||||
| 1,199 | Papa John’s International, Inc. |
48,296 | ||||||||||||
| 824 | Peets Coffee and Tea, (3) |
63,300 | ||||||||||||
| 2,868 | Penske Auto Group, (3) |
75,830 | ||||||||||||
| 3,382 | Pep Boys, (3) |
50,493 | ||||||||||||
| 783 | Perry Ellis International, (3) |
14,650 | ||||||||||||
| 1,220 | PetMed Express, (3) |
16,433 | ||||||||||||
| 6,303 | Pier 1 Imports, Inc. |
108,286 | ||||||||||||
| 3,979 | Pinnacle Entertainment Inc. |
44,167 | ||||||||||||
| 3,095 | Pool, (3) |
114,236 | ||||||||||||
| 8,336 | Quicksilver, (2), (3) |
28,843 | ||||||||||||
| 553 | R.G. Barry Corporation |
7,045 | ||||||||||||
| 641 | ReachLocal Inc., (2) |
4,846 | ||||||||||||
| 942 | Red Lions Hotels Corporation |
7,856 | ||||||||||||
| 834 | Red Robin Gourmet Burgers, (2), (3) |
29,740 | ||||||||||||
| 3,711 | Regis, (3) |
68,097 | ||||||||||||
| 3,775 | Rent-A-Center, (3) |
129,143 | ||||||||||||
| 610 | Rentrak Corporation |
11,541 | ||||||||||||
| 4,182 | Ruby Tuesday, (3) |
28,438 | ||||||||||||
| 963 | Rue21, (3) |
29,227 | ||||||||||||
| 2,261 | Ruth’s Chris Steak House, Inc. |
15,646 | ||||||||||||
| 2,851 | Ryland Group, (3) |
64,176 | ||||||||||||
| 231 | Saga Communications Inc |
8,699 | ||||||||||||
| 7,409 | Saks, (2), (3) |
81,203 | ||||||||||||
| 1,707 | Scholastic, (3) |
52,149 | ||||||||||||
| 1,034 | School Specialty Inc. |
3,381 | ||||||||||||
| 3,738 | Scientific Games, (2) |
37,978 | ||||||||||||
| 3,178 | Sealy, (3) |
6,547 | ||||||||||||
| 3,750 | Select Comfort, (2), (3) |
108,300 | ||||||||||||
| 345 | Shiloh Industries, Inc. |
3,171 | ||||||||||||
| 882 | Shoe Carnival, Inc. |
17,146 | ||||||||||||
| 3,471 | Shuffle Master, (3) |
61,333 | ||||||||||||
| 1,915 | Shutterfly, (2), (3) |
59,595 | ||||||||||||
| 3,240 | Sinclair Broadcast Group, Series A |
33,307 | ||||||||||||
| 2,490 | Six Flags Entertainment, (3) |
119,296 | ||||||||||||
| 2,406 | Skechers USA, Class A, (3) |
44,920 | ||||||||||||
| 618 | Skullcandy, (2), (3) |
9,962 | ||||||||||||
| 440 | Skyline Corporation |
2,416 | ||||||||||||
| 42 | Nuveen Investments |
| Shares | Description (1) | Value | ||||||||||||
| Consumer Discretionary (continued) |
||||||||||||||
| 3,872 | Smith & Wesson Holding Corporation |
$ | 31,944 | |||||||||||
| 2,585 | Sonic Automotive, (3) |
43,480 | ||||||||||||
| 3,970 | Sonic Corporation |
28,663 | ||||||||||||
| 4,340 | Sothebys Holdings, (3) |
170,649 | ||||||||||||
| 2,142 | Spartan Motors, Inc. |
9,318 | ||||||||||||
| 758 | Speedway Motorsports Inc. |
12,931 | ||||||||||||
| 1,998 | Stage Stores Inc. |
30,509 | ||||||||||||
| 1,264 | Standard Motor Products Inc. |
19,048 | ||||||||||||
| 6,824 | Standard Pacific, (2), (3) |
34,529 | ||||||||||||
| 1,764 | Stein Mart, Inc. |
11,325 | ||||||||||||
| 965 | Steiner Leisure Limited, (2) |
45,316 | ||||||||||||
| 423 | Steinway Musical Instrument Inc. |
10,664 | ||||||||||||
| 2,430 | Steven Madden, (3) |
105,000 | ||||||||||||
| 5,062 | Stewart Enterprises, Class A, (3) |
31,992 | ||||||||||||
| 1,699 | Stoneridge Inc., (2) |
14,645 | ||||||||||||
| 786 | Strayer Education, (3) |
77,562 | ||||||||||||
| 1,212 | Sturm, Ruger & Company, (3) |
69,169 | ||||||||||||
| 857 | Summer Infant Inc. |
4,585 | ||||||||||||
| 1,503 | Superior Industries International Inc. |
25,716 | ||||||||||||
| 694 | Systemax, (3) |
11,916 | ||||||||||||
| 4,491 | Talbots, (3) |
13,293 | ||||||||||||
| 458 | Teavana, (3) |
9,568 | ||||||||||||
| 3,901 | Tenneco, (2), (3) |
120,268 | ||||||||||||
| 4,043 | Texas Roadhouse, (3) |
69,742 | ||||||||||||
| 423 | Tower International Inc |
4,501 | ||||||||||||
| 1,317 | Town Sports International, (2) |
16,884 | ||||||||||||
| 1,657 | True Religion Apparel, (2) |
45,004 | ||||||||||||
| 2,769 | Tuesday Morning Corporation |
11,187 | ||||||||||||
| 894 | Unifi Inc. |
9,941 | ||||||||||||
| 965 | Univeral Electronics Inc. |
16,328 | ||||||||||||
| 1,447 | Universal Technical Institute Inc. |
17,364 | ||||||||||||
| 950 | U.S. Auto Parts Network, Inc., (2) |
3,439 | ||||||||||||
| 2,313 | Vail Resorts, (3) |
94,324 | ||||||||||||
| 2,875 | Vallassis Communications, (3) |
57,500 | ||||||||||||
| 86 | Value Line, (3) |
1,047 | ||||||||||||
| 2,629 | ValueVision Media, (2), (3) |
4,259 | ||||||||||||
| 1,272 | Vera Bradley , (2), (3) |
33,047 | ||||||||||||
| 1,595 | Vitamin Shoppe, (2), (3) |
75,077 | ||||||||||||
| 1,160 | VOXX International Corp |
14,720 | ||||||||||||
| 2,600 | Warnaco Group, (3) |
137,696 | ||||||||||||
| 950 | West Marine, Inc. |
11,125 | ||||||||||||
| 5,815 | Wet Seal Inc. |
19,131 | ||||||||||||
| 460 | Weyco Group, Inc. |
11,219 | ||||||||||||
| 142 | Winmark Corporation |
8,142 | ||||||||||||
| 1,871 | Winnebago Industries, (3) |
18,242 | ||||||||||||
| Nuveen Investments | 43 |
Portfolio of Investments (Unaudited)
Nuveen Small Cap Index Fund (continued)
April 30, 2012
| Shares | Description (1) | Value | ||||||||||||
| Consumer Discretionary (continued) |
||||||||||||||
| 3,188 | Wolverine World Wide Inc. |
$ | 133,737 | |||||||||||
| 1,600 | World Wrestling Entertainment, (3) |
12,608 | ||||||||||||
| 1,425 | Zagg, (2), (3) |
18,568 | ||||||||||||
| 2,064 | Zale Corporation |
5,655 | ||||||||||||
| 1,365 | Zumiez, Inc. |
50,041 | ||||||||||||
| Total Consumer Discretionary |
10,669,363 | |||||||||||||
| Consumer Staples – 3.4% |
||||||||||||||
| 205 | Alico Inc. |
4,662 | ||||||||||||
| 5,595 | Alliance One International, (3) |
19,806 | ||||||||||||
| 1,195 | Andersons, (3) |
60,228 | ||||||||||||
| 6 | Arden Group, Inc. |
531 | ||||||||||||
| 3,078 | B&G Foods, (3) |
68,455 | ||||||||||||
| 527 | Boston Beer, (3) |
54,450 | ||||||||||||
| 761 | Calavo Growers, (3) |
21,825 | ||||||||||||
| 851 | Cal-Maine Foods, (3) |
30,662 | ||||||||||||
| 2,439 | Casey’s General Stores, (3) |
137,438 | ||||||||||||
| 4,672 | Central European Distribution, (3) |
22,799 | ||||||||||||
| 2,693 | Central Garden & Pet, (3) |
28,788 | ||||||||||||
| 2,917 | Chiquita Brands International Inc. |
24,795 | ||||||||||||
| 265 | Coca-Cola Bottling Company Consolidated |
17,000 | ||||||||||||
| 668 | Craft Brewers Alliance Inc. |
5,144 | ||||||||||||
| 7,517 | Darling International Inc. |
123,128 | ||||||||||||
| 1,415 | Diamond Foods, (3) |
29,574 | ||||||||||||
| 2,305 | Dole Food Company, (3) |
19,546 | ||||||||||||
| 1,570 | Elizabeth Arden, (2), (3) |
61,199 | ||||||||||||
| 436 | Farmer Brothers Company |
3,968 | ||||||||||||
| 1,186 | Female Health Company |
7,128 | ||||||||||||
| 2,345 | Fresh Del Monte Produce Inc. |
54,334 | ||||||||||||
| 1,731 | Fresh Market, (2), (3) |
88,575 | ||||||||||||
| 160 | Griffin Land & Nurseries, Inc. |
3,853 | ||||||||||||
| 2,300 | Hain Celestial Group, (2), (3) |
108,790 | ||||||||||||
| 581 | Harbinger Group |
2,998 | ||||||||||||
| 3,157 | Harris Teeter Supermarket, (3) |
119,871 | ||||||||||||
| 787 | Imperial Sugar Company |
3,187 | ||||||||||||
| 810 | Ingles Markets |
14,086 | ||||||||||||
| 1,034 | Inter Parfums |
16,286 | ||||||||||||
| 857 | J&K Snack Foods Corporation |
48,043 | ||||||||||||
| 1,137 | Lancaster Colony, (3) |
74,144 | ||||||||||||
| 294 | Lifeway Foods, Inc. |
2,452 | ||||||||||||
| 502 | Limoneira, (3) |
8,439 | ||||||||||||
| 885 | Medifast, (2), (3) |
17,010 | ||||||||||||
| 772 | MGP Ingredients Inc |
3,590 | ||||||||||||
| 778 | Nash Finch Company |
19,528 | ||||||||||||
| 666 | National Beverage Corporation |
9,897 | ||||||||||||
| 718 | Nature’s Sunshine Products, (3) |
11,115 | ||||||||||||
| 44 | Nuveen Investments |
| Shares | Description (1) | Value | ||||||||||||
| Consumer Staples (continued) |
||||||||||||||
| 3,520 | Nu Skin Enterprises, Inc., Class A |
$ | 187,616 | |||||||||||
| 591 | Nutraceutical International Corporation, (2) |
9,060 | ||||||||||||
| 320 | Oil Dri Corporation |
6,771 | ||||||||||||
| 1,243 | Omega Protein Corporation, (2) |
8,900 | ||||||||||||
| 1,477 | Pantry, Inc. |
18,847 | ||||||||||||
| 3,841 | Pilgrim’s Pride Corporation, (2) |
27,425 | ||||||||||||
| 3,231 | Prestige Brands Holdings, (2) |
54,895 | ||||||||||||
| 1,142 | PriceSmart, Inc. |
94,261 | ||||||||||||
| 944 | Primo Water, (2), (3) |
1,416 | ||||||||||||
| 697 | Revlon, Class A, (3) |
11,905 | ||||||||||||
| 37,864 | Rite Aid Corporation |
54,903 | ||||||||||||
| 574 | Roundys Inc. |
7,106 | ||||||||||||
| 1,328 | Sanderson Farms, (3) |
68,538 | ||||||||||||
| 716 | Schiff Nutrition International Inc. |
11,778 | ||||||||||||
| 593 | Seneca Foods Corporation |
13,811 | ||||||||||||
| 3,823 | Smart Balance, (2), (3) |
22,556 | ||||||||||||
| 3,035 | Snyders-Lance, (3) |
78,546 | ||||||||||||
| 1,419 | Spartan Stores, Inc. |
25,868 | ||||||||||||
| 1,074 | Spectrum Brands, (2), (3) |
37,064 | ||||||||||||
| 6,879 | Star Scientific, (2), (3) |
24,420 | ||||||||||||
| 604 | Susser Holdings Corporation |
16,121 | ||||||||||||
| 1,112 | Synutra International, (2), (3) |
6,394 | ||||||||||||
| 665 | The Chef’s Warehouse Inc. |
16,080 | ||||||||||||
| 1,614 | Tootsie Roll Industries, (3) |
38,429 | ||||||||||||
| 2,282 | Treehouse Foods, (2), (3) |
131,238 | ||||||||||||
| 3,107 | United Natural Foods |
153,144 | ||||||||||||
| 1,375 | Universal, (3) |
63,016 | ||||||||||||
| 387 | USANA Health Sciences, (2), (3) |
16,138 | ||||||||||||
| 2,530 | Vector Group, (3) |
43,896 | ||||||||||||
| 371 | Village Super Market, Inc. |
10,240 | ||||||||||||
| 962 | WD-40 Company |
43,367 | ||||||||||||
| 618 | Weis Markets, (3) |
27,563 | ||||||||||||
| Total Consumer Staples |
2,678,636 | |||||||||||||
| Energy – 6.3% |
||||||||||||||
| 5,287 | Abraxas Petroleum, (3) |
15,755 | ||||||||||||
| 666 | Alon USA Energy, Inc. |
6,021 | ||||||||||||
| 1,134 | Amyris, (2), (3) |
3,549 | ||||||||||||
| 587 | Apco Oil and Gas International, (3) |
24,625 | ||||||||||||
| 1,673 | Approach Resources, (2), (3) |
60,027 | ||||||||||||
| 2,861 | ATP Oil & Gas, (2), (3) |
21,629 | ||||||||||||
| 1,549 | Basic Energy Services, Inc., (2) |
22,306 | ||||||||||||
| 3,312 | Berry Petroleum, (3) |
150,862 | ||||||||||||
| 3,033 | Bill Barrett, (2), (3) |
72,731 | ||||||||||||
| 626 | Bonanza Creek Energy, (3) |
13,753 | ||||||||||||
| 6,559 | BPZ Resources, (3) |
26,564 | ||||||||||||
| Nuveen Investments | 45 |
Portfolio of Investments (Unaudited)
Nuveen Small Cap Index Fund (continued)
April 30, 2012
| Shares | Description (1) | Value | ||||||||||||
| Energy (continued) |
||||||||||||||
| 2,333 | Bristow Group, (3) |
$ | 113,967 | |||||||||||
| 766 | C&J Energy Services, (3) |
14,439 | ||||||||||||
| 6,130 | Cal Dive International Inc., (2) |
23,723 | ||||||||||||
| 2,513 | Callon Petroleum Company Del, (2) |
14,601 | ||||||||||||
| 3,768 | CAMAC Energy, (3) |
2,939 | ||||||||||||
| 2,501 | Carrizo Oil & Gas, (2), (3) |
70,128 | ||||||||||||
| 369 | Ceres |
4,974 | ||||||||||||
| 9,869 | Cheniere Energy, (2) |
180,701 | ||||||||||||
| 379 | Clayton Williams Energy, (3) |
27,872 | ||||||||||||
| 3,185 | Clean Energy Fuels, (2), (3) |
61,279 | ||||||||||||
| 3,917 | Cloud Peak Energy, (2) |
60,283 | ||||||||||||
| 3,060 | Comstock Resources, (3) |
53,764 | ||||||||||||
| 784 | Contango Oil & Gas, (2), (3) |
42,540 | ||||||||||||
| 1,402 | Crimson Exploration, (2), (3) |
7,641 | ||||||||||||
| 2,436 | Crosstex Energy, (3) |
36,296 | ||||||||||||
| 5,641 | CVTR Energy Inc., (2) |
171,261 | ||||||||||||
| 509 | Dawson Geophysical Company |
13,667 | ||||||||||||
| 879 | Delek U.S. Holdings, (3) |
14,328 | ||||||||||||
| 4,141 | DHT Maritime, (3) |
3,313 | ||||||||||||
| 2,208 | Dril Quip, (3) . |
148,797 | ||||||||||||
| 2,386 | Endeavor International, (2), (3) |
29,777 | ||||||||||||
| 1,860 | Energy Partners, (2), (3) |
30,281 | ||||||||||||
| 4,839 | Energy XXI, (2), (3) |
182,334 | ||||||||||||
| 1,032 | Evolution Petroleum Corporation, (2) |
9,123 | ||||||||||||
| 4,107 | Exterran Holdings, Inc., (2) |
55,486 | ||||||||||||
| 3,311 | Frontline, (3) |
21,687 | ||||||||||||
| 3,361 | FX Energy, (3) |
19,090 | ||||||||||||
| 3,730 | Gastar Exploration, Limited |
10,481 | ||||||||||||
| 1,537 | Geokinetics, (3) |
2,720 | ||||||||||||
| 1,289 | GeoResources, Inc. |
48,608 | ||||||||||||
| 382 | Gevo, (3) |
3,702 | ||||||||||||
| 1,164 | Global Geophysical Services, (2), (3) |
11,139 | ||||||||||||
| 4,134 | GMX Resources, (2), (3) |
5,664 | ||||||||||||
| 2,563 | Golar LNG, (3) |
94,780 | ||||||||||||
| 1,664 | Goodrich Petroleum, (2), (3) |
27,905 | ||||||||||||
| 1,203 | Great Plains Renewable Energy, Inc. |
9,612 | ||||||||||||
| 1,094 | Gulf Island Fabrication, (3) . |
30,654 | ||||||||||||
| 1,525 | Gulfmark Offshore Inc. |
73,459 | ||||||||||||
| 2,929 | Gulfport Energy Corporation |
76,769 | ||||||||||||
| 288 | Hallador Energy Company |
2,324 | ||||||||||||
| 2,183 | Harvest Natural Resources Inc., (2) |
15,019 | ||||||||||||
| 6,451 | Heckmann, (3) |
24,514 | ||||||||||||
| 6,811 | Helix Energy Solutions Group, (2) |
139,013 | ||||||||||||
| 8,507 | Hercules Offshore, (3) |
43,216 | ||||||||||||
| 1,985 | Hornbeck Offshore Services Inc., (2) |
82,636 | ||||||||||||
| 46 | Nuveen Investments |
| Shares | Description (1) | Value | ||||||||||||
| Energy (continued) |
||||||||||||||
| 1,062 | Houston American Energy, (3) |
$ | 2,453 | |||||||||||
| 10,718 | Hyperdynamics, (3) |
10,005 | ||||||||||||
| 8,441 | ION Geophysical Corporation |
52,587 | ||||||||||||
| 69 | Isramco, Inc. |
6,403 | ||||||||||||
| 2,283 | James River Coal, (3) |
11,324 | ||||||||||||
| 8,016 | Key Energy Services Inc. |
101,483 | ||||||||||||
| 694 | Kior, Class A, (3) |
6,801 | ||||||||||||
| 1,412 | Knightsbridge Tankers Limited |
17,876 | ||||||||||||
| 16,554 | Kodiak Oil & Gas Corporation, (2) |
146,503 | ||||||||||||
| 1,433 | L&L Energy Inc., (2) |
3,224 | ||||||||||||
| 2,011 | Lufkin Industries, (3) |
154,525 | ||||||||||||
| 7,155 | Magnum Hunter Resources, (2), (3) |
44,433 | ||||||||||||
| 888 | Matador Resources, (3) |
10,283 | ||||||||||||
| 1,698 | Matrix Service Company |
23,178 | ||||||||||||
| 6,312 | McMoran Exploration, (3) |
55,546 | ||||||||||||
| 1,995 | Miller Energy Resources, (3) |
10,833 | ||||||||||||
| 772 | Mitcham Industries, Inc. |
18,343 | ||||||||||||
| 785 | Natural Gas Services Group, (2) |
10,236 | ||||||||||||
| 5,807 | Newpark Resources, (3) |
36,933 | ||||||||||||
| 3,399 | Nordic American Tanker Shipping, (3) |
49,353 | ||||||||||||
| 4,057 | Northern Oil and Gas, (3) |
78,828 | ||||||||||||
| 3,825 | Oasis Petroleum, (3) |
126,493 | ||||||||||||
| 1,710 | Overseas Shipholding Group, (3) |
20,007 | ||||||||||||
| 278 | OYO Geospace Corporation |
32,031 | ||||||||||||
| 451 | Panhandle Oil and Gas Inc. |
12,425 | ||||||||||||
| 7,496 | Parker Drilling, (2) |
38,754 | ||||||||||||
| 5,866 | Patriot Coal, (2), (3) |
34,199 | ||||||||||||
| 2,934 | Penn Virginia, (3) |
15,022 | ||||||||||||
| 1,509 | Pertoleum Development, (3) |
51,895 | ||||||||||||
| 3,599 | Petroquest Energy, (2), (3) |
21,738 | ||||||||||||
| 838 | PHI Inc Non-Voting, (2) |
22,316 | ||||||||||||
| 3,958 | Pioneer Drilling Company |
31,189 | ||||||||||||
| 211 | Renewable Energy Group Inc. |
1,914 | ||||||||||||
| 14,318 | Rentech, Inc. |
33,075 | ||||||||||||
| 2,966 | Resolute Energy, (2), (3) |
31,469 | ||||||||||||
| 2,676 | Rex Energy, (3) |
28,125 | ||||||||||||
| 396 | Rex Stores Corporation |
10,985 | ||||||||||||
| 376 | RigNet, Inc. |
6,422 | ||||||||||||
| 3,405 | Rosetta Resources, (3) |
171,169 | ||||||||||||
| 643 | Sanchez Energy, (3) |
15,586 | ||||||||||||
| 1,924 | Scorpio Tankers, (2), (3) |
13,025 | ||||||||||||
| 2,401 | SemGroup Corporation, A Shares, (2) |
76,352 | ||||||||||||
| 2,893 | Ship Financial International Limited |
40,068 | ||||||||||||
| 643 | Solazyme, (2), (3) |
7,073 | ||||||||||||
| 3,148 | Stone Energy, (2), (3) |
88,301 | ||||||||||||
| Nuveen Investments | 47 |
Portfolio of Investments (Unaudited)
Nuveen Small Cap Index Fund (continued)
April 30, 2012
| Shares | Description (1) | Value | ||||||||||||
| Energy (continued) |
||||||||||||||
| 2,725 | Swift Energy Company |
$ | 82,431 | |||||||||||
| 5,672 | Syntroleum, (3) |
5,332 | ||||||||||||
| 1,056 | Targa Resources, (3) |
50,783 | ||||||||||||
| 3,384 | Teekay Tankers, Class A, (3) |
17,461 | ||||||||||||
| 1,938 | Tesco Corporation, (2) |
31,648 | ||||||||||||
| 4,935 | TETRA Technologies, (2), (3) |
42,984 | ||||||||||||
| 2,760 | Triangle Petroleum, (3) |
17,968 | ||||||||||||
| 973 | Union Drilling, Inc., (2) |
5,420 | ||||||||||||
| 4,149 | Uranerz Energy, (2), (3) |
7,261 | ||||||||||||
| 4,836 | Uranium Energy, (3) |
14,266 | ||||||||||||
| 6,000 | Uranium Resources, (3) |
5,220 | ||||||||||||
| 6,649 | UR-Energy Inc |
7,247 | ||||||||||||
| 7,456 | USEC, (2), (3) |
6,275 | ||||||||||||
| 3,286 | Vaalco Energy Inc., (2) |
29,804 | ||||||||||||
| 11,223 | Vantage Drilling, (2), (3) |
17,732 | ||||||||||||
| 1,900 | Venoco Inc., (2) |
21,109 | ||||||||||||
| 3,018 | Voyager Oil & Gas, (3) |
7,666 | ||||||||||||
| 2,240 | W&T Offshore, (3) |
44,285 | ||||||||||||
| 4,589 | Warren Resources Inc., (2) |
14,180 | ||||||||||||
| 3,146 | Western Refining Inc. |
59,931 | ||||||||||||
| 635 | Westmoreland Coal Company |
6,407 | ||||||||||||
| 2,509 | Willbros Group, (3) |
13,549 | ||||||||||||
| 4,390 | World Fuel Services, (3) |
193,423 | ||||||||||||
| 1,952 | Zion Oil & Gas, (3) |
4,841 | ||||||||||||
| Total Energy |
5,022,334 | |||||||||||||
| Financials – 22.1% |
||||||||||||||
| 978 | 1st Source, (3) |
22,191 | ||||||||||||
| 1,750 | 1st United Bancorp, (2), (3) |
10,605 | ||||||||||||
| 2,736 | Acadia Realty Trust – REIT, (3) |
63,420 | ||||||||||||
| 604 | AG Mortgage Investment Trust |
11,959 | ||||||||||||
| 729 | Agree Realty – REIT |
16,621 | ||||||||||||
| 132 | Alexander’s – REIT |
51,431 | ||||||||||||
| 304 | Alliance Financial Corporation |
9,275 | ||||||||||||
| 5,830 | Alterra Capital Holdings, (3) |
139,512 | ||||||||||||
| 1,956 | American Assets Trust Inc |
45,986 | ||||||||||||
| 4,754 | American Campus Communities – REIT, (3) |
211,315 | ||||||||||||
| 1,130 | American Capital Mortgage Investment, (3) |
25,685 | ||||||||||||
| 3,823 | American Equity Investment Life Holding, (3) |
46,870 | ||||||||||||
| 671 | American Safety Insurance Holdings, (2) |
12,702 | ||||||||||||
| 1,526 | Ameris Bancorp, (2), (3) |
18,922 | ||||||||||||
| 1,181 | Amerisafe, Inc., (2) |
31,556 | ||||||||||||
| 532 | Ames National, (3) |
11,747 | ||||||||||||
| 1,549 | Amtrust Financial Services, (3) |
42,195 | ||||||||||||
| 8,607 | Anworth Mortgage Asset – REIT |
58,011 | ||||||||||||
| 1,322 | Apollo Commercial Real Estate Finance – REIT |
21,324 | ||||||||||||
| 12,588 | Apollo Investment |
91,263 | ||||||||||||
| 48 | Nuveen Investments |
| Shares | Description (1) | Value | ||||||||||||
| Financials (continued) |
||||||||||||||
| 1,396 | Apollo Residential Mortgage – REIT |
$ | 25,337 | |||||||||||
| 1,763 | Argo Group International Holdings Inc. |
50,880 | ||||||||||||
| 413 | Arlington Asset Investment Corporation |
9,710 | ||||||||||||
| 11,401 | Armour Residential – REIT, (3) |
79,579 | ||||||||||||
| 652 | Arrow Financial Corporation |
15,609 | ||||||||||||
| 2,010 | Artio Global Investors, (3) |
7,276 | ||||||||||||
| 3,354 | Ashford Hospitality Trust – REIT |
28,643 | ||||||||||||
| 2,663 | Associated Estates Realty – REIT |
45,085 | ||||||||||||
| 5,587 | Astoria Financial, (3) |
54,138 | ||||||||||||
| 574 | AV Homes Inc. |
7,158 | ||||||||||||
| 538 | Baldwin & Lyons, Class B, (3) |
11,712 | ||||||||||||
| 411 | BancFirst Corporation |
17,139 | ||||||||||||
| 1,787 | Banco Latinoamericano de Exportaciones S.A, (3) |
37,259 | ||||||||||||
| 1,880 | Bancorp, Inc., (2) |
19,308 | ||||||||||||
| 6,068 | BancorpSouth, (3) |
81,736 | ||||||||||||
| 2,955 | Bank Mutual Corporation |
11,525 | ||||||||||||
| 370 | Bank of Kentucky Financial Corporation |
9,328 | ||||||||||||
| 341 | Bank of Marin Bancorp California |
12,641 | ||||||||||||
| 1,803 | Bank of the Ozarks, (3) |
55,713 | ||||||||||||
| 1,303 | BankFinancial Corporation |
8,678 | ||||||||||||
| 1,127 | Banner Corporation |
24,738 | ||||||||||||
| 4,768 | BBCN Bancorp Inc. |
52,353 | ||||||||||||
| 2,137 | Beneficial Mutual Bancorp Inc., (2) |
18,528 | ||||||||||||
| 1,333 | Berkshire Hills Bancorp, Inc. |
30,246 | ||||||||||||
| 4,857 | BGC Partners Inc., Class A |
33,853 | ||||||||||||
| 9,884 | BioMed Realty Trust – REIT, (3) |
195,901 | ||||||||||||
| 4,692 | BlackRock Kelso Capital, (3) |
45,278 | ||||||||||||
| 528 | BofI Holdings, Inc., (2) |
9,383 | ||||||||||||
| 4,947 | Boston Private Financial Holdings, (3) |
46,106 | ||||||||||||
| 432 | Bridge Bancorp, (3) |
8,415 | ||||||||||||
| 588 | Bridge Capital Holdings, (3) |
8,991 | ||||||||||||
| 4,147 | Brookline Bancorp, (3) |
37,240 | ||||||||||||
| 733 | Bryn Mawr Bank |
15,752 | ||||||||||||
| 1,219 | Calamos Asset Management, Class A, (3) |
15,749 | ||||||||||||
| 131 | California First National Bancorp. |
2,083 | ||||||||||||
| 493 | Camden National, (3) |
16,032 | ||||||||||||
| 1,804 | Campus Crest Communities – REIT, (3) |
21,017 | ||||||||||||
| 738 | Cape Bancorp Inc. |
6,007 | ||||||||||||
| 898 | Capital Bank Corporation |
2,065 | ||||||||||||
| 733 | Capital City Bank |
6,121 | ||||||||||||
| 189 | Capital Southwest Corporation |
18,091 | ||||||||||||
| 4,373 | CapLease – REIT |
18,148 | ||||||||||||
| 5,423 | Capstead Mortgage – REIT |
74,458 | ||||||||||||
| 1,858 | Cardinal Financial, (3) |
22,426 | ||||||||||||
| 385 | Cascade Bancorp |
2,191 | ||||||||||||
| Nuveen Investments | 49 |
Portfolio of Investments (Unaudited)
Nuveen Small Cap Index Fund (continued)
April 30, 2012
| Shares | Description (1) | Value | ||||||||||||
| Financials (continued) |
||||||||||||||
| 1,889 | Cash America International, (3) |
$ | 88,311 | |||||||||||
| 5,053 | Cathay General Bancorp. |
87,013 | ||||||||||||
| 9,532 | CBL & Associates Properties – REIT, (3) |
177,581 | ||||||||||||
| 3,603 | Cedar Shopping Centers – REIT, (3) |
18,808 | ||||||||||||
| 776 | Center Bancorp, Inc. |
8,202 | ||||||||||||
| 1,930 | Centerstate Banks of Florida, Inc. |
15,517 | ||||||||||||
| 986 | Central Pacific Financial Corporation, (2) |
14,021 | ||||||||||||
| 222 | Century Bancorp, Inc. |
6,098 | ||||||||||||
| 399 | Charter Financial Corporation |
3,591 | ||||||||||||
| 889 | Chatham Lodging Trust – REIT |
11,557 | ||||||||||||
| 1,763 | Chemical Financial Corporation |
38,909 | ||||||||||||
| 2,067 | Chesapeake Lodging Trust – REIT, (3) |
37,413 | ||||||||||||
| 2,251 | CIF, (3) |
13,461 | ||||||||||||
| 782 | Citizens & Northern, (3) |
14,811 | ||||||||||||
| 2,436 | Citizens, (3) |
23,410 | ||||||||||||
| 979 | City Holding, (3) |
32,650 | ||||||||||||
| 550 | Clifton Savings Bancorp, Inc. |
5,621 | ||||||||||||
| 789 | CNB Financial Corporation |
12,971 | ||||||||||||
| 15,930 | CNO Financial Group, (2), (3) |
115,811 | ||||||||||||
| 2,089 | Cobiz, (3) |
13,056 | ||||||||||||
| 1,142 | Cohen & Steers Inc. |
40,244 | ||||||||||||
| 5,363 | Colonial Properties Trust – REIT, (3) |
119,970 | ||||||||||||
| 2,115 | Colony Financial – REIT |
35,934 | ||||||||||||
| 2,536 | Columbia Banking Systems, (3) |
51,963 | ||||||||||||
| 2,500 | Community Bank System, (3) |
70,300 | ||||||||||||
| 830 | Community Trust Bancorp, (3) |
26,519 | ||||||||||||
| 2,594 | Compass Diversified Trust, (3) |
38,080 | ||||||||||||
| 270 | Consolidated Tomoka Land, (3) |
7,938 | ||||||||||||
| 1,236 | Coresite Realty, (3) |
30,789 | ||||||||||||
| 5,860 | Cousins Properties – REIT, (3) |
46,060 | ||||||||||||
| 4,297 | Cowen Group, Class A, (3) |
10,828 | ||||||||||||
| 1,657 | Crawford & Co |
7,904 | ||||||||||||
| 410 | Credit Acceptance Corporation |
38,552 | ||||||||||||
| 3,430 | Crexus Investment – REIT |
35,981 | ||||||||||||
| 7,875 | CubeSmart – REIT, (3) |
98,910 | ||||||||||||
| 5,739 | CVB Financial |
66,400 | ||||||||||||
| 7,177 | CYS Investments – REIT, (3) |
98,540 | ||||||||||||
| 15,785 | DCT Industrial Trust – REIT, (3) |
93,605 | ||||||||||||
| 3,102 | Delphi Financial Group, Inc. |
140,893 | ||||||||||||
| 2,793 | DFC Global, (3) |
48,822 | ||||||||||||
| 164 | Diamond Hill Investment Group, Inc. |
12,446 | ||||||||||||
| 10,754 | DiamondRock Hospitality – REIT, (3) |
114,315 | ||||||||||||
| 1,999 | Dime Community Bancshares, Inc. |
27,706 | ||||||||||||
| 498 | Donegal Group, Inc., B |
6,783 | ||||||||||||
| 8,179 | Doral Financial Group, (2) |
14,968 | ||||||||||||
| 50 | Nuveen Investments |
| Shares | Description (1) | Value | ||||||||||||
| Financials (continued) |
||||||||||||||
| 1,952 | Duff & Phelps Corporation, Class A, (3) |
$ | 31,037 | |||||||||||
| 3,780 | Dupont Fabros Technology – REIT, (3) |
102,627 | ||||||||||||
| 3,476 | Dynex Capital – REIT, (3) |
32,779 | ||||||||||||
| 1,076 | Eagle Bancorp, Inc. |
19,142 | ||||||||||||
| 1,738 | EastGroup Properties – REIT, (3) |
87,421 | ||||||||||||
| 1,302 | Edelman Finacnial Group Inc. |
11,497 | ||||||||||||
| 5,911 | Education Realty Trust – REIT, (3) |
66,617 | ||||||||||||
| 1,288 | eHealth, (2), (3) |
22,823 | ||||||||||||
| 296 | EMC Insurance Group Inc. |
5,852 | ||||||||||||
| 2,241 | Employers Holdings, Inc. |
38,814 | ||||||||||||
| 543 | Encore Bancshares, (2), (3) |
11,137 | ||||||||||||
| 443 | Enstar Group, Limited, (2) |
41,717 | ||||||||||||
| 375 | Enterprise Bancorp, Inc. |
6,034 | ||||||||||||
| 1,022 | Enterprise Financial Services Corporation |
12,356 | ||||||||||||
| 2,996 | Entertainment Properties Trust – REIT |
143,778 | ||||||||||||
| 948 | Epoch Holding Corporation |
25,596 | ||||||||||||
| 2,085 | Equity Lifestyles Properties – REIT, (3) |
145,825 | ||||||||||||
| 3,447 | Equity One – REIT, (3) |
71,629 | ||||||||||||
| 801 | ESB Financial, (3) |
10,757 | ||||||||||||
| 656 | ESSA Bancorp Inc. |
6,396 | ||||||||||||
| 1,350 | Evercore Partners, (3) |
35,681 | ||||||||||||
| 1,989 | Excel Trust – REIT |
23,848 | ||||||||||||
| 6,611 | Extra Space Storage – REIT, (3) |
200,644 | ||||||||||||
| 3,016 | EZCORP, Inc. |
80,799 | ||||||||||||
| 8,732 | F.N.B., (3) |
99,108 | ||||||||||||
| 902 | FBL Financial Group Inc. |
26,266 | ||||||||||||
| 3,120 | FBR Capital Markets Corporation, (2) |
8,268 | ||||||||||||
| 632 | Federal Agricultural Mortgage, (3) |
14,448 | ||||||||||||
| 7,997 | FelCor Lodging Trust – REIT, (2), (3) |
33,747 | ||||||||||||
| 346 | Fidus Investment, (3) |
4,692 | ||||||||||||
| 5,293 | Fifth Street Finance, (3) |
51,977 | ||||||||||||
| 2,461 | Financial Engines, (3) |
56,209 | ||||||||||||
| 887 | Financial Institutions, (3) |
15,008 | ||||||||||||
| 6,758 | First American Corporation |
113,197 | ||||||||||||
| 564 | First Bancorp Maine |
8,184 | ||||||||||||
| 971 | First Bancorp of North Carolina, Inc. |
9,729 | ||||||||||||
| 4,951 | First Busey, (3) |
22,973 | ||||||||||||
| 2,012 | First Cash Financial Services, Inc., (2) |
82,412 | ||||||||||||
| 6,740 | First Commonwealth Financial, (3) |
43,338 | ||||||||||||
| 1,021 | First Community Bancshares, Inc. |
13,671 | ||||||||||||
| 1,149 | First Connecticut Bancorp, (3) |
15,155 | ||||||||||||
| 624 | First Defiance Financial Corporation |
10,720 | ||||||||||||
| 3,743 | First Financial Bancorp. |
62,920 | ||||||||||||
| 2,019 | First Financial Bankshares, (3) |
68,323 | ||||||||||||
| 715 | First Financial Corporation |
21,450 | ||||||||||||
| Nuveen Investments | 51 |
Portfolio of Investments (Unaudited)
Nuveen Small Cap Index Fund (continued)
April 30, 2012
| Shares | Description (1) | Value | ||||||||||||
| Financials (continued) |
||||||||||||||
| 1,062 | First Financial Holdings, Inc. |
$ | 12,255 | |||||||||||
| 5,564 | First Industrial Realty Trust – REIT, (2) |
68,660 | ||||||||||||
| 1,013 | First Interstate BancSystem Inc., Montana |
14,273 | ||||||||||||
| 3,543 | First Marblehead Corporation |
3,756 | ||||||||||||
| 1,648 | First Merchants Corporation |
20,320 | ||||||||||||
| 4,790 | First Midwest Bancorp, Inc. |
51,014 | ||||||||||||
| 491 | First of Long Island Corporation |
13,517 | ||||||||||||
| 651 | First Pactrust Bancorp, Inc. |
7,154 | ||||||||||||
| 3,215 | First Potomac Realty Trust – REIT |
39,995 | ||||||||||||
| 7,020 | FirstMerit, (3) |
117,936 | ||||||||||||
| 12,562 | Flagstar Bancorp Inc. |
10,934 | ||||||||||||
| 3,367 | Flagstone Reinsurance Holdings SA |
25,253 | ||||||||||||
| 2,016 | Flushing Financial, (3) |
26,268 | ||||||||||||
| 2,276 | Forestar Real Estate Group, (2), (3) |
35,005 | ||||||||||||
| 376 | Fortegra Financial Corp |
3,121 | ||||||||||||
| 879 | Fox Chase Bancorp. |
11,181 | ||||||||||||
| 803 | Franklin Financial Corporation, (2), (3) |
11,547 | ||||||||||||
| 4,537 | Franklin Street Properties – REIT |
45,688 | ||||||||||||
| 383 | FX Alliance, (3) |
6,645 | ||||||||||||
| 1,113 | FXCM INC-A |
12,889 | ||||||||||||
| 432 | Gain Capital Holdings Inc |
2,216 | ||||||||||||
| 441 | GAMCO Investors Inc. |
19,871 | ||||||||||||
| 809 | German American Bancorp, (3) |
15,403 | ||||||||||||
| 1,659 | Getty Realty – REIT, (3) |
26,245 | ||||||||||||
| 4,540 | GFI Group, Inc. |
14,982 | ||||||||||||
| 4,621 | Glacier Bancorp, Inc. |
68,853 | ||||||||||||
| 1,352 | Gladstone Capital – REIT |
10,830 | ||||||||||||
| 704 | Gladstone Commercial – REIT |
11,961 | ||||||||||||
| 1,419 | Gladstone Investment Corporation |
10,529 | ||||||||||||
| 4,724 | Gleacher & Company Inc. |
4,913 | ||||||||||||
| 8,947 | Glimcher Realty Trust |
88,486 | ||||||||||||
| 826 | Global Indemnity PLC, (2) |
14,876 | ||||||||||||
| 766 | Golub Capital BDC, (3) |
11,383 | ||||||||||||
| 2,275 | Government Properties Income Trust – REIT |
52,826 | ||||||||||||
| 653 | Great Southern Bancorp, (3) |
15,698 | ||||||||||||
| 1,801 | Greenlight Capital Re, Ltd, (2) |
44,845 | ||||||||||||
| 776 | Hallmark Financial Services, Inc., (2) |
5,836 | ||||||||||||
| 631 | Hampton Roads Bankshares Inc. |
1,994 | ||||||||||||
| 4,902 | Hancock Holding, (3) |
157,746 | ||||||||||||
| 2,023 | Hanmi Financial Corporation |
21,100 | ||||||||||||
| 753 | Harleysville Group, (3) |
45,135 | ||||||||||||
| 1,992 | Harris & Harris Group, Inc. |
8,028 | ||||||||||||
| 6,101 | Hatteras Financial – REIT |
177,722 | ||||||||||||
| 5,000 | Healthcare Realty Trust – REIT, (3) |
107,400 | ||||||||||||
| 855 | Heartland Financial USA, (3) |
15,835 | ||||||||||||
| 52 | Nuveen Investments |
| Shares | Description (1) | Value | ||||||||||||
| Financials (continued) |
||||||||||||||
| 3,143 | Hercules Technology Growth Capital, Inc. |
$ | 35,862 | |||||||||||
| 1,339 | Heritage Commerce Corporation |
9,025 | ||||||||||||
| 1,005 | Heritage Financial Corporation |
13,166 | ||||||||||||
| 9,044 | Hersha Hospitality Trust – REIT |
52,003 | ||||||||||||
| 1,866 | HFF, Class A, (2), (3) |
30,490 | ||||||||||||
| 4,633 | Highwoods Properties – REIT, (3) |
160,904 | ||||||||||||
| 2,560 | Hilltop Holdings |
20,301 | ||||||||||||
| 1,337 | Home Bancshares |
38,960 | ||||||||||||
| 1,024 | Home Federal Bancorp |
10,025 | ||||||||||||
| 856 | Home Loan Servicing Solutions, (3) |
11,864 | ||||||||||||
| 3,086 | Home Properties – REIT, (3) |
188,400 | ||||||||||||
| 111 | HomeStreet Inc. |
3,876 | ||||||||||||
| 2,563 | Horace Mann Educators Corporation |
44,981 | ||||||||||||
| 1,417 | Hudson Pacific Properties – REIT |
22,431 | ||||||||||||
| 1,002 | Hudson Valley Holding Corporation |
18,367 | ||||||||||||
| 1,897 | IberiaBank, (3) |
96,880 | ||||||||||||
| 2,383 | ICG Group Inc., (2) |
22,591 | ||||||||||||
| 1,131 | Imperial Holdings Inc |
4,332 | ||||||||||||
| 521 | Independence Holding Company |
5,538 | ||||||||||||
| 1,378 | Independent Bank, (3) |
38,680 | ||||||||||||
| 797 | Infinity Property and Casualty Corporation |
42,568 | ||||||||||||
| 4,955 | Inland Real Estate – REIT |
42,613 | ||||||||||||
| 3,405 | International Bancshares Corporation |
67,181 | ||||||||||||
| 852 | INTL FCStone Inc., (2) |
18,318 | ||||||||||||
| 7,414 | Invesco Mortgage Capital – REIT, (3) |
130,783 | ||||||||||||
| 2,650 | Investment Technology Group, (2) |
27,030 | ||||||||||||
| 2,974 | Investors Bancorp, Inc., (2) |
45,919 | ||||||||||||
| 5,157 | Investors Real Estate Trust – REIT |
37,234 | ||||||||||||
| 5,264 | iStar Financial – REIT, (2), (3) |
36,427 | ||||||||||||
| 974 | JMP Group Inc. |
7,217 | ||||||||||||
| 274 | Kansas City Life Insurance Company |
8,916 | ||||||||||||
| 2,122 | KBW, (3) |
36,159 | ||||||||||||
| 771 | Kearny Financial Corporation |
7,479 | ||||||||||||
| 1,731 | Kennedy-Wilson Holdings, (3) |
24,338 | ||||||||||||
| 4,388 | Kilroy Realty – REIT, (3) |
208,211 | ||||||||||||
| 3,578 | Kite Realty Group Trust – REIT |
18,284 | ||||||||||||
| 6,448 | Knight Trading Group, (3) |
84,727 | ||||||||||||
| 1,229 | Kohlberg Capital Corporation |
7,583 | ||||||||||||
| 6,838 | Ladenburg Thalmann Financial Services, (2), (3) |
11,283 | ||||||||||||
| 1,462 | Lakeland Bancorp, Inc. |
13,363 | ||||||||||||
| 1,040 | Lakeland Financial Corporation |
27,082 | ||||||||||||
| 5,466 | LaSalle Hotel Properties – REIT, (3) |
160,755 | ||||||||||||
| 7,692 | Lexington Corporate Properties Trust – REIT, (3) |
68,459 | ||||||||||||
| 1,949 | LTC Properties – REIT |
64,863 | ||||||||||||
| 3,248 | Maiden Holdings, Ltd |
26,958 | ||||||||||||
| Nuveen Investments | 53 |
Portfolio of Investments (Unaudited)
Nuveen Small Cap Index Fund (continued)
April 30, 2012
| Shares | Description (1) | Value | ||||||||||||
| Financials (continued) |
||||||||||||||
| 1,473 | Main Street Capital, (3) |
$ | 37,724 | |||||||||||
| 1,293 | Mainsource Financial Group |
15,115 | ||||||||||||
| 804 | Manning and Napier Inc. |
11,658 | ||||||||||||
| 1,844 | Marketaxess |
63,268 | ||||||||||||
| 557 | Marlin Business Services Corporation |
8,177 | ||||||||||||
| 3,497 | MB Financial, Inc. |
72,283 | ||||||||||||
| 4,952 | MCG Capital Corporation |
20,749 | ||||||||||||
| 3,422 | Meadowbrook Insurance Group, Inc. |
30,216 | ||||||||||||
| 909 | Medallion Financial Corporation |
9,935 | ||||||||||||
| 8,633 | Medical Properties Trust – REIT, (3) |
80,978 | ||||||||||||
| 715 | Medley Capital Corp |
8,072 | ||||||||||||
| 308 | Merchants Bancshares, Inc. |
8,279 | ||||||||||||
| 509 | Meridian Interstate Bancorp, (2), (3) |
6,821 | ||||||||||||
| 890 | Metro Bancorp, Inc., (2) |
10,297 | ||||||||||||
| 22,877 | MFA Mortgage Investments – REIT, (3) |
168,832 | ||||||||||||
| 12,057 | MGIC Investment, (2), (3) |
41,717 | ||||||||||||
| 2,357 | Mid-America Apartment Communities – REIT, (3) |
160,441 | ||||||||||||
| 491 | Midsouth Bancorp Inc. |
6,923 | ||||||||||||
| 1,137 | Mission West Properties – REIT |
9,983 | ||||||||||||
| 2,522 | Monmouth Real Estate Investment – REIT |
25,876 | ||||||||||||
| 4,007 | Montpelier Re Holdings Limited |
82,224 | ||||||||||||
| 3,152 | MPG Office Trust – REIT, (3) |
6,651 | ||||||||||||
| 1,542 | MVC Capital Inc. |
20,354 | ||||||||||||
| 445 | National Bankshares, (3) |
13,221 | ||||||||||||
| 2,659 | National Financial Partners, (2), (3) |
39,220 | ||||||||||||
| 1,566 | National Health Investors – REIT, (3) |
77,470 | ||||||||||||
| 443 | National Interstate Corporation |
10,632 | ||||||||||||
| 7,949 | National Penn Bancshares, Inc. |
73,290 | ||||||||||||
| 6,711 | National Retail Properties – REIT, (3) |
183,747 | ||||||||||||
| 141 | National Western Life Insurance Company |
19,184 | ||||||||||||
| 693 | Navigators Group, Inc. |
32,918 | ||||||||||||
| 2,212 | NBT Bancorp, Inc. |
45,457 | ||||||||||||
| 1,657 | Nelnet Inc. |
42,784 | ||||||||||||
| 1,697 | Netspend Holdings, Inc., (2) |
12,948 | ||||||||||||
| 468 | New Mountain Finance Corp |
6,323 | ||||||||||||
| 7,962 | Newcastle Investment – REIT, (3) |
56,291 | ||||||||||||
| 1,753 | Newstar Financial, Inc., (2) |
20,808 | ||||||||||||
| 1,390 | NGP Capital Resources Company |
8,465 | ||||||||||||
| 624 | Nicholas Financial, Inc. |
8,256 | ||||||||||||
| 987 | Northfield Bancorp, (3) |
13,779 | ||||||||||||
| 7,274 | Northstar Realty Finance – REIT |
41,462 | ||||||||||||
| 5,849 | Northwest Bancshares, (3) |
72,060 | ||||||||||||
| 858 | OceanFirst Financial Corporation |
12,501 | ||||||||||||
| 6,156 | Ocwen Financial, (2), (3) |
91,786 | ||||||||||||
| 6,086 | Old National Bancorp. |
78,023 | ||||||||||||
| 54 | Nuveen Investments |
| Shares | Description (1) | Value | ||||||||||||
| Financials (continued) |
||||||||||||||
| 6,528 | Omega Healthcare Investors – REIT, (3) |
$ | 139,764 | |||||||||||
| 720 | OmniAmerican Bancorp Inc., (2) |
14,436 | ||||||||||||
| 712 | One Liberty Properties – REIT |
13,464 | ||||||||||||
| 1,426 | OneBeacon Insurance Group Limited, Class A |
20,292 | ||||||||||||
| 662 | Oppenheimer Holdings Inc., Class A |
11,294 | ||||||||||||
| 2,716 | Oriental Financial Group Inc. |
32,103 | ||||||||||||
| 2,749 | Oritani Financial Corporation |
40,740 | ||||||||||||
| 448 | Orrstown Financial Services Inc. |
3,463 | ||||||||||||
| 246 | Pacific Capital Bancorp |
11,205 | ||||||||||||
| 1,183 | Pacific Continental Corporation |
10,517 | ||||||||||||
| 1,944 | Pacwest Bancorp. |
46,306 | ||||||||||||
| 829 | Park National, (3) |
55,750 | ||||||||||||
| 2,059 | Park Sterling Bank Inc., (2) |
9,698 | ||||||||||||
| 1,411 | Parkway Properties – REIT |
13,955 | ||||||||||||
| 3,270 | Pebblebrook Hotel Trust – REIT, (3) |
78,742 | ||||||||||||
| 3,575 | Penn Real Estate Investment Trust – REIT, (3) |
50,372 | ||||||||||||
| 3,525 | Pennantpark Investment Corporation |
36,836 | ||||||||||||
| 233 | Penns Woods Bancorp, Inc. |
9,190 | ||||||||||||
| 1,928 | PennyMac Mortgage Investment Trust – REIT |
39,119 | ||||||||||||
| 678 | Peoples Bancorp, (3) |
12,468 | ||||||||||||
| 3,614 | PHH, (3) |
56,017 | ||||||||||||
| 7,473 | Phoenix Companies, (2), (3) |
15,693 | ||||||||||||
| 1,459 | PICO Holdings, Inc. |
35,031 | ||||||||||||
| 2,194 | Pinnacle Financial Partners, Inc., (2) |
40,150 | ||||||||||||
| 1,016 | Piper Jaffray Companies |
24,638 | ||||||||||||
| 2,237 | Platinum Underwriters Holdings, (3) |
81,919 | ||||||||||||
| 3,404 | Post Properties – REIT, (3) |
165,775 | ||||||||||||
| 2,579 | Potlatch – REIT |
80,723 | ||||||||||||
| 1,519 | Presidential Life Corporation |
17,590 | ||||||||||||
| 2,103 | Primerica Inc. |
55,162 | ||||||||||||
| 3,858 | Privatebancorp, Inc. |
60,686 | ||||||||||||
| 1,964 | ProAssurance Corporation |
173,009 | ||||||||||||
| 7,005 | Prospect Capital, (3) |
76,495 | ||||||||||||
| 3,013 | Prosperity Bancshares, (3) |
140,556 | ||||||||||||
| 3,885 | Provident Financial Services Inc. |
57,110 | ||||||||||||
| 2,444 | Provident New York Bancorp. |
20,627 | ||||||||||||
| 1,195 | PS Business Parks – REIT, (3) |
81,559 | ||||||||||||
| 624 | Pzena Investments Management, Inc. |
3,675 | ||||||||||||
| 8,552 | Radian Group, (3) |
26,682 | ||||||||||||
| 3,201 | RAIT Financial Trust – REIT, (3) |
15,493 | ||||||||||||
| 2,475 | Ramco-Gershenson Properties Trust – REIT, (3) |
29,799 | ||||||||||||
| 5,046 | Redwood Trust – REIT, (3) |
58,937 | ||||||||||||
| 1,609 | Renasant Corporation |
25,744 | ||||||||||||
| 636 | Republic Bancorp, Inc. |
14,965 | ||||||||||||
| 5,339 | Resource Capital – REIT |
28,831 | ||||||||||||
| Nuveen Investments | 55 |
Portfolio of Investments (Unaudited)
Nuveen Small Cap Index Fund (continued)
April 30, 2012
| Shares | Description (1) | Value | ||||||||||||
| Financials (continued) |
||||||||||||||
| 2,781 | Retail Opportunity Investments, (3) |
$ | 33,789 | |||||||||||
| 1,171 | RLI Corporation |
80,658 | ||||||||||||
| 1,770 | RLJ Lodging Trust – REIT |
33,241 | ||||||||||||
| 1,799 | Rockville Financial Inc. |
21,066 | ||||||||||||
| 483 | Roma Financial Corporation |
4,560 | ||||||||||||
| 1,802 | S&T Bancorp, (3) |
33,733 | ||||||||||||
| 2,368 | Sabra Health Care Real Estate Investment Trust – REIT |
39,640 | ||||||||||||
| 1,328 | Safeguard Scientifics Inc. |
21,726 | ||||||||||||
| 731 | Safety Insurance Group, Inc. |
29,130 | ||||||||||||
| 1,547 | Sandy Spring Bancorp, Inc. |
27,861 | ||||||||||||
| 471 | Saul Centers – REIT |
18,845 | ||||||||||||
| 897 | SCBT Financial, (3) |
30,848 | ||||||||||||
| 1,286 | Seabright Insurance Holdings, (3) |
11,561 | ||||||||||||
| 4,656 | Seacoast Banking Corporation of Florida |
7,543 | ||||||||||||
| 3,470 | Selective Insurance Group Inc. |
60,690 | ||||||||||||
| 763 | Sierra Bancorp. |
6,989 | ||||||||||||
| 2,961 | Signature Bank, (2), (3) |
194,508 | ||||||||||||
| 1,113 | Simmons First National, (3) |
27,090 | ||||||||||||
| 2,344 | Solar Capital Limited |
48,661 | ||||||||||||
| 499 | Solar Senior Capital Ltd |
8,089 | ||||||||||||
| 1,108 | Southside Bancshares, (3) |
22,620 | ||||||||||||
| 1,248 | Southwest Bancorp, Inc. |
11,344 | ||||||||||||
| 1,778 | Sovran Self Storage – REIT, (3) |
93,701 | ||||||||||||
| 1,020 | STAG Industrial Inc. |
14,198 | ||||||||||||
| 5,989 | Starwood Property Trust – REIT |
124,990 | ||||||||||||
| 940 | State Auto Financial Corporation |
13,470 | ||||||||||||
| 2,031 | State Bank Financial, (2), (3) |
35,035 | ||||||||||||
| 1,476 | StellarOne Corporation |
18,465 | ||||||||||||
| 1,987 | Sterling Bancorp. |
18,896 | ||||||||||||
| 1,723 | Sterling Financial, (3) |
33,461 | ||||||||||||
| 1,168 | Stewart Information Services, (3) |
17,193 | ||||||||||||
| 3,451 | Stifel Financial, (3) |
125,685 | ||||||||||||
| 12,084 | Strategic Hotels & Resorts – REIT, (2) |
82,292 | ||||||||||||
| 629 | Suffolk Bancorp. |
7,473 | ||||||||||||
| 1,754 | Summit Hotel Properties – REIT |
14,663 | ||||||||||||
| 2,556 | Sun Bancorp, Inc., (2) |
7,387 | ||||||||||||
| 1,699 | Sun Communities – REIT |
74,331 | ||||||||||||
| 7,594 | Sunstone Hotel Investors – REIT |
77,459 | ||||||||||||
| 11,792 | Susquehanna Bancshs Inc. |
122,283 | ||||||||||||
| 2,755 | SVB Financial, (2), (3) |
176,568 | ||||||||||||
| 1,872 | SWS Group Inc. |
10,558 | ||||||||||||
| 722 | SY Bancorp, (3) |
16,750 | ||||||||||||
| 4,342 | Symetra Financial Corporation |
52,799 | ||||||||||||
| 5,520 | Tanger Factory Outlet Centers – REIT, (3) |
172,886 | ||||||||||||
| 977 | Taylor Capital Group, (3) |
13,600 | ||||||||||||
| 56 | Nuveen Investments |
| Shares | Description (1) | Value | ||||||||||||
| Financials (continued) |
||||||||||||||
| 2,073 | Technology Investment Capital Corporation |
$ | 19,092 | |||||||||||
| 835 | Tejon Ranch Company |
24,933 | ||||||||||||
| 856 | Terreno Realty – REIT |
12,241 | ||||||||||||
| 710 | Territorial Bancorp Inc. |
15,421 | ||||||||||||
| 2,392 | Texas Capital BancShares, (2), (3) |
90,202 | ||||||||||||
| 595 | THL Credit Inc. |
7,497 | ||||||||||||
| 501 | Tompkins Financial, (3) |
18,963 | ||||||||||||
| 2,369 | Tower Group, (3) |
51,123 | ||||||||||||
| 1,565 | Towne Bank, (3) |
20,376 | ||||||||||||
| 1,737 | Triangle Capital, (3) |
35,105 | ||||||||||||
| 903 | Trico Bancshares |
14,845 | ||||||||||||
| 5,975 | TrustCo Bank, (3) |
32,683 | ||||||||||||
| 4,111 | Trustmark, (3) |
104,625 | ||||||||||||
| 13,474 | Two Harbors Investment – REIT |
140,938 | ||||||||||||
| 2,056 | UMB Financial Corporation |
98,791 | ||||||||||||
| 777 | UMH Properties – REIT |
9,161 | ||||||||||||
| 7,365 | Umpqua Holdings, (3) |
97,513 | ||||||||||||
| 1,301 | Union First Market Bankshares Corporation |
18,162 | ||||||||||||
| 3,224 | United Bankshares, (3) |
85,210 | ||||||||||||
| 2,671 | United Community Banks, (2), (3) |
25,134 | ||||||||||||
| 932 | United Financial Bancorp. |
14,949 | ||||||||||||
| 1,383 | United Fire Group Inc |
23,815 | ||||||||||||
| 762 | Universal Health Realty Income Trust – REIT |
30,815 | ||||||||||||
| 1,204 | Universal Insurance Holdings Inc. |
4,985 | ||||||||||||
| 1,077 | Univest Corporation of Pennsylvania |
17,340 | ||||||||||||
| 1,481 | Urstadt Biddle Properties – REIT |
28,494 | ||||||||||||
| 2,016 | ViewPoint Financial Group |
32,075 | ||||||||||||
| 1,504 | Virginia Commerce Bancorp, Inc., (2) |
11,776 | ||||||||||||
| 424 | Virtus Investment Partners Inc., (2) |
35,786 | ||||||||||||
| 621 | Walker & Dunlop Inc |
8,104 | ||||||||||||
| 1,658 | Walter Investment Management Corporation |
33,541 | ||||||||||||
| 985 | Washington Banking, (3) |
13,731 | ||||||||||||
| 4,236 | Washington Real Estate Investment Trust – REIT, (3) |
125,174 | ||||||||||||
| 915 | Washington Trust Bancorp, (3) |
21,658 | ||||||||||||
| 4,628 | Webster Financial, (3) |
105,194 | ||||||||||||
| 1,484 | WesBanco, Inc. |
30,392 | ||||||||||||
| 999 | West Bancorp, Inc. |
9,590 | ||||||||||||
| 1,238 | West Coast Bancorp. |
24,191 | ||||||||||||
| 1,730 | Westamerica Bancorp, (3) |
79,355 | ||||||||||||
| 4,455 | Western Alliance Bancorporation, (2), (3) |
39,115 | ||||||||||||
| 1,623 | Westfield Financial Inc. |
12,124 | ||||||||||||
| 401 | Westwood Holding Group Inc. |
14,749 | ||||||||||||
| 482 | Whitestone – REIT |
6,661 | ||||||||||||
| 3,952 | Wilshire Bancorp, Inc., (2) |
21,183 | ||||||||||||
| 1,844 | Winthrop Realty Trust – REIT |
19,675 | ||||||||||||
| Nuveen Investments | 57 |
Portfolio of Investments (Unaudited)
Nuveen Small Cap Index Fund (continued)
April 30, 2012
| Shares | Description (1) | Value | ||||||||||||
| Financials (continued) |
||||||||||||||
| 2,246 | Wintrust Financial, (3) |
$ | 81,148 | |||||||||||
| 966 | World Acceptance, (3) |
64,249 | ||||||||||||
| 412 | WSFS Financial Corporation |
16,443 | ||||||||||||
| Total Financials |
17,697,069 | |||||||||||||
| Health Care – 12.0% |
||||||||||||||
| 1,446 | Abaxis, Inc. |
51,507 | ||||||||||||
| 2,036 | Abiomed, (3) |
49,536 | ||||||||||||
| 2,571 | Accretive Health (2), (3) |
25,864 | ||||||||||||
| 4,394 | Accuray, (3) |
33,834 | ||||||||||||
| 3,048 | Achillion Pharmaceuticals, Inc., (2), (3) |
20,269 | ||||||||||||
| 2,536 | Acorda Therapeutics, Inc., (2) |
64,009 | ||||||||||||
| 692 | Acura Pharmaceutical Inc., (2) |
2,235 | ||||||||||||
| 588 | Aegerion Pharmaceuticals Inc., (2) |
7,321 | ||||||||||||
| 2,274 | Affymax, (2), (3) |
29,812 | ||||||||||||
| 4,529 | Affymetrix, Inc., (2) |
20,018 | ||||||||||||
| 728 | Air Methods Corporation, (2) |
61,232 | ||||||||||||
| 3,603 | Akorn, Inc. |
43,704 | ||||||||||||
| 1,421 | Albany Molecular Research, (3) |
4,533 | ||||||||||||
| 3,940 | Align Technology, (2), (3) |
124,937 | ||||||||||||
| 722 | Alimera Sciences, Inc. |
2,231 | ||||||||||||
| 6,127 | Alkermes, (2), (3) |
105,997 | ||||||||||||
| 1,573 | Alliance Imaging Inc. |
2,155 | ||||||||||||
| 5,063 | Allos Therapeutics, Inc. |
9,215 | ||||||||||||
| 528 | Almost Family, Inc. |
12,873 | ||||||||||||
| 2,891 | Alnylam Pharmaceuticals, (2), (3) |
32,928 | ||||||||||||
| 3,465 | Alphatec Holdings, Inc., (2) |
7,554 | ||||||||||||
| 1,360 | AMAG Pharmaceuticals, (2), (3) |
21,298 | ||||||||||||
| 1,893 | Amedisys, (3) |
27,884 | ||||||||||||
| 1,354 | Amicus Therapeutics, Inc., (2) |
6,608 | ||||||||||||
| 2,544 | AMN Healthcare Services Inc. |
17,070 | ||||||||||||
| 1,381 | Ampio Pharmaceuticals Inc., (2) |
4,267 | ||||||||||||
| 2,008 | AmSurg, (2), (3) |
57,750 | ||||||||||||
| 784 | Anacor Pharmaceuticals, (3) |
4,351 | ||||||||||||
| 807 | Analogic Corporation |
55,045 | ||||||||||||
| 1,605 | AngioDynamics, Inc., (2) |
19,870 | ||||||||||||
| 5,634 | Antares Pharma, (3) |
17,747 | ||||||||||||
| 1,353 | Anthera Pharmaceuticals Inc., (2) |
2,111 | ||||||||||||
| 1,483 | Ardea Biosciences Inc., (2) |
47,248 | ||||||||||||
| 10,827 | Arena Pharmaceuticals, (3) |
26,418 | ||||||||||||
| 10,122 | Ariad Pharmaceuticals, (2), (3) |
164,989 | ||||||||||||
| 3,429 | ArQule Inc., (2) |
24,174 | ||||||||||||
| 5,433 | Array Biopharma, Inc., (2) |
18,961 | ||||||||||||
| 1,754 | Arthrocare Corporation |
43,780 | ||||||||||||
| 1,256 | Assisted Living Concepts, (3) |
22,495 | ||||||||||||
| 3,623 | Astex Pharmaceuticals Inc., (2) |
6,376 | ||||||||||||
| 58 | Nuveen Investments |
| Shares | Description (1) | Value | ||||||||||||
| Health Care (continued) |
||||||||||||||
| 2,241 | AthenaHealth, (2), (3) |
$ | 162,360 | |||||||||||
| 903 | AtriCure, Inc., (2) |
7,405 | ||||||||||||
| 102 | ATRION, (3) |
23,525 | ||||||||||||
| 3,074 | Auxilium Pharmaceuticals, Inc., (2) |
55,086 | ||||||||||||
| 8,511 | Avanir Pharmaceuticals, (2), (3) |
25,959 | ||||||||||||
| 2,014 | Aveo Pharmaceuticals, (2), (3) |
23,161 | ||||||||||||
| 8,710 | AVI Biopharma, (3) |
7,267 | ||||||||||||
| 1,529 | Bacterin International Holdings, (3) |
3,134 | ||||||||||||
| 494 | BG Medicine, (2), (3) |
3,275 | ||||||||||||
| 1,857 | BioCryst Pharaceuticals, Inc., (2) |
6,722 | ||||||||||||
| 1,976 | Biolase Technology, (3) |
5,138 | ||||||||||||
| 1,234 | Biomimetic Therapeutics, Inc., (2) |
3,295 | ||||||||||||
| 1,579 | Bio-Reference Laboratories, (2), (3) |
33,664 | ||||||||||||
| 7,040 | BioSante Pharmaceuticals, (2), (3) |
3,872 | ||||||||||||
| 2,615 | Bioscrip, Inc., (2) |
19,377 | ||||||||||||
| 318 | BioSpecifics Technologies, (3) |
4,691 | ||||||||||||
| 1,586 | BioTime Inc., (2) |
6,011 | ||||||||||||
| 3,185 | Cadence Pharmaceuticals, (2), (3) |
11,753 | ||||||||||||
| 1,891 | Cambrex Corporation |
12,254 | ||||||||||||
| 1,272 | Cantel Medical Corporation |
29,867 | ||||||||||||
| 1,769 | Capital Senior Living, (3) |
17,142 | ||||||||||||
| 1,566 | CardioNet Inc., (2) |
4,416 | ||||||||||||
| 931 | Cardiovascular Systems, Inc. |
9,180 | ||||||||||||
| 14,544 | Cell Therapeutics, (3) |
16,144 | ||||||||||||
| 3,668 | Celldex Therapeutics, Inc., (2) |
16,726 | ||||||||||||
| 271 | Cempra Inc. |
1,897 | ||||||||||||
| 3,211 | Centene, (2), (3) |
127,123 | ||||||||||||
| 4,188 | Cepheid, (2), (3) |
160,861 | ||||||||||||
| 3,479 | Cerus, (3) |
13,707 | ||||||||||||
| 3,719 | Chelsea Therapeutics International, (3) |
7,884 | ||||||||||||
| 1,278 | Chemed, (3) |
77,115 | ||||||||||||
| 333 | ChemoCentryx, (3) |
5,728 | ||||||||||||
| 729 | Chindex International, Inc. |
7,122 | ||||||||||||
| 1,821 | Cleveland Biolabs, (3) |
3,533 | ||||||||||||
| 687 | Clovis Oncology, (3) |
12,318 | ||||||||||||
| 1,578 | Codexis Inc. |
5,712 | ||||||||||||
| 4,713 | Columbia Laboratories, (3) |
3,440 | ||||||||||||
| 672 | Complete Genomics, (2), (3) |
1,814 | ||||||||||||
| 711 | Computer Programs and Systems, (3) |
42,368 | ||||||||||||
| 2,003 | Conceptus, (3) |
37,596 | ||||||||||||
| 1,819 | Conmed Corporation |
52,005 | ||||||||||||
| 2,639 | Corcept Therapeutics, (3) |
9,870 | ||||||||||||
| 517 | Cornerstone Therapeutics, (2), (3) |
3,050 | ||||||||||||
| 358 | Corvel Corporation |
15,569 | ||||||||||||
| 1,784 | Cross Country Healthcare, Inc. |
8,224 | ||||||||||||
| Nuveen Investments | 59 |
Portfolio of Investments (Unaudited)
Nuveen Small Cap Index Fund (continued)
April 30, 2012
| Shares | Description (1) | Value | ||||||||||||
| Health Care (continued) |
||||||||||||||
| 1,794 | CryoLife Inc. |
$ | 9,490 | |||||||||||
| 3,851 | Cubist Pharmaceuticals, (3) |
162,820 | ||||||||||||
| 4,906 | Curis, (3) |
23,500 | ||||||||||||
| 1,821 | Cyberonics, (2) |
69,744 | ||||||||||||
| 622 | Cynosure, Inc. |
12,857 | ||||||||||||
| 3,282 | Cytori Therapeutics, (2), (3) |
7,778 | ||||||||||||
| 3,088 | Delcath Systems, (2), (3) |
8,677 | ||||||||||||
| 3,448 | DepoMed, Inc. |
20,998 | ||||||||||||
| 4,310 | DexCom, (3) |
42,195 | ||||||||||||
| 5,185 | Durect Corporation |
3,630 | ||||||||||||
| 1,569 | DUSA Pharmaceuticals, Inc. |
9,194 | ||||||||||||
| 6,342 | Dyax Corporation, (2) |
10,337 | ||||||||||||
| 9,844 | Dynavax Technologies, (3) |
49,318 | ||||||||||||
| 604 | DynaVox Inc., Class A Shares, (2) |
1,486 | ||||||||||||
| 1,452 | Emergent BioSolutions, Inc., (2) |
20,415 | ||||||||||||
| 1,963 | Emeritus Corporation |
33,764 | ||||||||||||
| 1,107 | Endocyte Inc., (2) |
7,904 | ||||||||||||
| 3,143 | Endologix, (2), (3) |
47,082 | ||||||||||||
| 1,048 | Ensign Group Inc. |
27,992 | ||||||||||||
| 2,459 | Enzo Biochem Inc. |
6,738 | ||||||||||||
| 2,419 | Enzon Inc. |
15,070 | ||||||||||||
| 405 | Epocrates Inc., (2) |
3,297 | ||||||||||||
| 3,152 | eResearch Technology, Inc., (2) |
24,901 | ||||||||||||
| 3,631 | EXACT Sciences Corporation, (2) |
39,106 | ||||||||||||
| 546 | Exactech, Inc., (2) |
8,463 | ||||||||||||
| 1,739 | Examworks Group, (3) |
20,242 | ||||||||||||
| 9,537 | Exelixis, (2), (3) |
45,778 | ||||||||||||
| 2,696 | Five Star Quality Care Inc., (2) |
9,247 | ||||||||||||
| 415 | Fluidigm Corporation, (2) |
6,478 | ||||||||||||
| 635 | Furiex Pharmaceuticals Inc., (2) |
9,125 | ||||||||||||
| 1,093 | Genomic Health, (2), (3) |
31,325 | ||||||||||||
| 1,965 | Gentiva Health Services, (2), (3) |
16,270 | ||||||||||||
| 8,287 | Geron, (3) |
13,922 | ||||||||||||
| 1,498 | Greatbatch, Inc., (2) |
34,888 | ||||||||||||
| 492 | Greenway Medical Tech. |
7,577 | ||||||||||||
| 1,407 | GTX, (2), (3) |
4,404 | ||||||||||||
| 1,651 | Haemonetics Corporation |
118,162 | ||||||||||||
| 5,716 | Halozyme Therapeutics, (2), (3) |
46,242 | ||||||||||||
| 2,153 | Hanger Orthopedic Group Inc., (2) |
50,703 | ||||||||||||
| 3,011 | Hansen Medical, (3) |
9,515 | ||||||||||||
| 1,480 | Harvard Bioscience, Inc. |
5,905 | ||||||||||||
| 6,112 | HealthSouth, (3) |
136,848 | ||||||||||||
| 1,164 | Healthstream, Inc., (2) |
26,679 | ||||||||||||
| 2,183 | Healthways Inc. |
14,561 | ||||||||||||
| 772 | Heartware International, (3) |
60,185 | ||||||||||||
| 60 | Nuveen Investments |
| Shares | Description (1) | Value | ||||||||||||
| Health Care (continued) |
||||||||||||||
| 665 | Hi Tech Pharmacal Company, Inc., (2) |
$ | 21,672 | |||||||||||
| 5,446 | HMS Holdings, (2), (3) |
131,031 | ||||||||||||
| 354 | Horizon Pharma, (2), (3) |
1,487 | ||||||||||||
| 772 | ICU Medical, Inc., (2) |
40,522 | ||||||||||||
| 3,873 | Idenix Pharmaceuticals Inc., (2) |
33,966 | ||||||||||||
| 4,827 | Immunogen, (2), (3) |
61,544 | ||||||||||||
| 4,226 | Immunomedics, (3) |
15,171 | ||||||||||||
| 4,194 | Impax Laboratories, (2), (3) |
103,298 | ||||||||||||
| 5,683 | Incyte Pharmaceuticals, (2), (3) |
128,890 | ||||||||||||
| 4,270 | Indevus Pharmaceuticals Inc., (4) |
— | ||||||||||||
| 1,229 | Infinity Pharmaceuticals, (2), (3) |
16,592 | ||||||||||||
| 1,596 | Insmed Inc. |
4,612 | ||||||||||||
| 2,954 | Insulet Corporation, (2) |
52,758 | ||||||||||||
| 1,257 | Integra Lifesciences Holdings, (3) |
46,798 | ||||||||||||
| 3,474 | Intermune, (2), (3) |
36,269 | ||||||||||||
| 1,843 | Invacare Corporation |
29,212 | ||||||||||||
| 1,052 | IPC The Hospitalist Company, Inc., (2) |
40,407 | ||||||||||||
| 1,144 | IRIS International, Inc., (2) |
14,964 | ||||||||||||
| 3,461 | Ironwood Pharmacauticals, (2), (3) |
45,720 | ||||||||||||
| 6,399 | ISIS Pharmaceuticals, (3) |
51,192 | ||||||||||||
| 2,061 | ISTA Pharmaceuticals, (2), (3) |
18,652 | ||||||||||||
| 1,419 | Jazz Pharmaceuticals, (2), (3) |
72,412 | ||||||||||||
| 548 | Kensey Nash Corporation |
15,580 | ||||||||||||
| 4,439 | Keryx Biopharmaceuticals, (3) |
7,014 | ||||||||||||
| 3,340 | Kindred Healthcare Inc., (2) |
32,198 | ||||||||||||
| 3,308 | KV Pharmaceutical, Class A, (3) |
3,804 | ||||||||||||
| 605 | Landauer Inc. |
31,896 | ||||||||||||
| 1,043 | Lannett Company Inc. |
4,109 | ||||||||||||
| 11,847 | Lexicon Genetics, (3) |
19,192 | ||||||||||||
| 1,014 | LHC Group, Inc., (2) |
17,958 | ||||||||||||
| 1,261 | Ligand Pharmceuticals, Inc., (2) |
17,036 | ||||||||||||
| 2,429 | Luminex, (2), (3) |
60,822 | ||||||||||||
| 1,830 | Magellan Health Services, Inc. |
81,032 | ||||||||||||
| 2,056 | Mako Surgical, (3) |
84,933 | ||||||||||||
| 6,352 | MannKind, (2), (3) |
14,292 | ||||||||||||
| 1,405 | MAP Pharmaceuticals, (2), (3) |
18,012 | ||||||||||||
| 3,375 | Masimo, (3) |
74,689 | ||||||||||||
| 1,806 | Maxygen, Inc. |
10,204 | ||||||||||||
| 3,062 | MedAssets Inc. |
38,612 | ||||||||||||
| 1,052 | Medical Action Industries, Inc., (2) |
5,807 | ||||||||||||
| 3,463 | Medicines Company |
76,498 | ||||||||||||
| 3,966 | Medicis Pharmaceutical, (3) |
152,572 | ||||||||||||
| 1,352 | Medidata Solutions, Inc., (2) |
35,030 | ||||||||||||
| 2,013 | Medivation, Inc., (2) |
162,811 | ||||||||||||
| 487 | Medtox Scientific, Inc. |
10,763 | ||||||||||||
| Nuveen Investments | 61 |
Portfolio of Investments (Unaudited)
Nuveen Small Cap Index Fund (continued)
April 30, 2012
| Shares | Description (1) | Value | ||||||||||||
| Health Care (continued) |
||||||||||||||
| 3,581 | Merge Healthcare, (3) |
$ | 15,398 | |||||||||||
| 2,634 | Meridian Bioscience, (3) |
54,129 | ||||||||||||
| 2,691 | Merit Medical Systems, (3) |
35,575 | ||||||||||||
| 2,188 | Metabolix, (3) |
5,929 | ||||||||||||
| 2,719 | Metropolitan Health Networks Inc. |
20,338 | ||||||||||||
| 2,151 | Mmodal Inc. |
27,447 | ||||||||||||
| 1,804 | Molina Healthcare, (2) |
46,273 | ||||||||||||
| 2,964 | Momenta Pharmaceuticals, (2), (3) |
47,068 | ||||||||||||
| 784 | MWI Veterinary Supply, Inc., (2) |
74,010 | ||||||||||||
| 2,749 | Nabi Biopharmaceuticals, (2) |
4,591 | ||||||||||||
| 657 | National Healthcare Corporation |
29,959 | ||||||||||||
| 117 | National Research Corporation |
5,656 | ||||||||||||
| 1,864 | Natus Medical, Inc. |
22,815 | ||||||||||||
| 6,079 | Navidea Biopharmaceuticals, (3) |
18,966 | ||||||||||||
| 7,329 | Nektar Therapautics, (3) |
55,847 | ||||||||||||
| 1,489 | Neogen Corporation, (3) |
58,056 | ||||||||||||
| 3,255 | NeoStem, (3) |
1,172 | ||||||||||||
| 3,715 | Neurocrine Biosciences Inc., (2) |
27,602 | ||||||||||||
| 448 | NewLink Genetics Corporation |
5,215 | ||||||||||||
| 6,172 | Novavax, (3) |
8,394 | ||||||||||||
| 5,525 | NPS Pharmaceuticals, (2), (3) |
39,559 | ||||||||||||
| 2,715 | NuVasive, Inc. |
44,988 | ||||||||||||
| 2,868 | Nxstage Medical, (2), (3) |
48,756 | ||||||||||||
| 1,246 | Nymox Pharmaceutical, (2), (3) |
10,155 | ||||||||||||
| 1,191 | Obagi Medical Products, Inc., (2) |
15,626 | ||||||||||||
| 2,128 | Omnicell, Inc., (2) |
30,367 | ||||||||||||
| 933 | OncoGenex Pharmacuetical, (2), (3) |
12,129 | ||||||||||||
| 3,664 | Oncothyreon, (3) |
15,719 | ||||||||||||
| 4,070 | Onyx Pharmaceuticals, (3) |
185,226 | ||||||||||||
| 6,996 | Opko Health, (2), (3) |
33,231 | ||||||||||||
| 2,979 | Optimer Pharmaceuticals, (2), (3) |
44,089 | ||||||||||||
| 3,000 | OraSure Technologies, Inc., (2) |
34,410 | ||||||||||||
| 2,913 | Orexigen Therapeutics, (3) |
10,196 | ||||||||||||
| 1,160 | Orthofix International NV, (2) |
47,815 | ||||||||||||
| 1,072 | Osiris Therapeutics, (2), (3) |
5,692 | ||||||||||||
| 4,095 | Owens and Minor, (3) |
119,738 | ||||||||||||
| 2,180 | Pacific Biosciences of California Inc., (2) |
5,886 | ||||||||||||
| 571 | Pacira Pharmaceuticals, Inc. |
6,401 | ||||||||||||
| 2,370 | Pain Therapeutics, (2), (3) |
9,599 | ||||||||||||
| 1,221 | Palomar Medical Technologies, Inc. |
10,623 | ||||||||||||
| 2,326 | Par Pharmaceuticals Inc., (2) |
98,483 | ||||||||||||
| 3,782 | Parexel International Corporation |
101,887 | ||||||||||||
| 8,898 | PDL Biopahrma, (3) |
55,968 | ||||||||||||
| 5,576 | Peregrine Pharmaceuticals, Inc., Reg S |
2,621 | ||||||||||||
| 239 | Pernix Therapeutics Holdings |
2,055 | ||||||||||||
| 62 | Nuveen Investments |
| Shares | Description (1) | Value | ||||||||||||
| Health Care (continued) |
||||||||||||||
| 2,950 | Pharmacyclics, (3) |
$ | 81,302 | |||||||||||
| 2,291 | Pharmathene, (3) |
3,711 | ||||||||||||
| 1,887 | Pharmerica Corporation, (2) |
22,399 | ||||||||||||
| 1,701 | Pozen, (2), (3) |
11,329 | ||||||||||||
| 1,885 | Progenics Pharmaceuticals, Inc. |
20,716 | ||||||||||||
| 833 | Providence Service Corporation |
11,712 | ||||||||||||
| 3,328 | PSS World Medical, (2), (3) |
79,639 | ||||||||||||
| 2,489 | Quality Systems Inc. |
93,089 | ||||||||||||
| 3,411 | Questcor Pharmaceuticals, (2), (3) |
153,154 | ||||||||||||
| 1,830 | Quidel, (2), (3) |
30,232 | ||||||||||||
| 1,960 | RadNet, Inc. |
6,056 | ||||||||||||
| 3,024 | Raptor Pharmaceuticals Corporation, (2) |
17,721 | ||||||||||||
| 4,407 | Rigel Pharmaceuticals, Inc. |
34,066 | ||||||||||||
| 1,030 | Rockwell Medical Technologies, (3) |
9,528 | ||||||||||||
| 3,544 | RTI Biologics, (2), (3) |
12,404 | ||||||||||||
| 427 | Sagent Pharmaceuticals, (3) |
7,682 | ||||||||||||
| 3,753 | Salix Pharmaceuticals Limited, (2), (3) |
185,398 | ||||||||||||
| 3,362 | Sangamo Biosciences, Inc. |
15,633 | ||||||||||||
| 3,424 | Santarus, Inc. |
21,811 | ||||||||||||
| 4,565 | Savient Pharmaceuticals, (2), (3) |
10,819 | ||||||||||||
| 2,220 | SciClone Pharmaceuticals, Inc., (2) |
13,298 | ||||||||||||
| 6,200 | Seattle Genetics, (3) |
122,574 | ||||||||||||
| 2,875 | Select Medical Corporation, (2) |
24,639 | ||||||||||||
| 7,344 | Sequenom, (3) |
37,601 | ||||||||||||
| 2,209 | SIGA Technologies, (3) |
7,290 | ||||||||||||
| 1,244 | Skilled Healthcare Group Inc., (2) |
9,541 | ||||||||||||
| 3,894 | Solta Medical Inc., (2) |
12,656 | ||||||||||||
| 2,142 | Spectranetics Corporation, (2) |
22,470 | ||||||||||||
| 3,688 | Spectrum Pharmaceuticals, Inc., (2) |
39,203 | ||||||||||||
| 2,283 | STAAR Surgical Company |
25,045 | ||||||||||||
| 2,834 | Stereotaxis, (2), (3) |
1,160 | ||||||||||||
| 3,804 | Steris, (3) |
119,484 | ||||||||||||
| 815 | Sucampo Pharmaceuticals, Inc. |
6,781 | ||||||||||||
| 1,613 | Sun Healthcare Group Inc., (2) |
11,662 | ||||||||||||
| 1,828 | Sunesis Pharmaceuticals, (3) |
5,027 | ||||||||||||
| 3,687 | Sunrise Assisted Living, (2), (3) |
23,154 | ||||||||||||
| 980 | Surmodics Inc. |
14,494 | ||||||||||||
| 2,337 | Symmetry Medical, Inc. |
16,616 | ||||||||||||
| 1,429 | Synergetics USA, Inc., (2) |
9,317 | ||||||||||||
| 1,710 | Synta Pharmaceuticals Corporation, (2) |
7,439 | ||||||||||||
| 1,771 | Targacept, Inc., (2) |
8,412 | ||||||||||||
| 1,713 | Team Health Holdings Inc., (2) |
36,898 | ||||||||||||
| 4,431 | Theravance, (2), (3) |
95,887 | ||||||||||||
| 678 | Tornier N.V, (2) |
16,096 | ||||||||||||
| 332 | Transcept Pharmaceuticals, (2), (3) |
2,985 | ||||||||||||
| Nuveen Investments | 63 |
Portfolio of Investments (Unaudited)
Nuveen Small Cap Index Fund (continued)
April 30, 2012
| Shares | Description (1) | Value | ||||||||||||
| Health Care (continued) |
||||||||||||||
| 1,270 | Triple-S Management Corporation, Class B Shares |
$ | 26,746 | |||||||||||
| 665 | Trius Therapeutics, (2), (3) |
3,571 | ||||||||||||
| 4,148 | Unilife, (2), (3) |
17,753 | ||||||||||||
| 2,074 | Universal American, (3) |
19,039 | ||||||||||||
| 1,327 | Uroplasty Inc. |
4,034 | ||||||||||||
| 758 | U.S. Physical Therapy, Inc. |
18,480 | ||||||||||||
| 1,806 | Vanda Pharmaceuticals, Inc. |
8,001 | ||||||||||||
| 1,961 | Vanguard Health Systems Inc |
17,414 | ||||||||||||
| 1,089 | Vascular Solutions, Inc., (2) |
12,360 | ||||||||||||
| 404 | Verastem Inc. |
4,194 | ||||||||||||
| 5,473 | Vical, (3) |
17,076 | ||||||||||||
| 4,545 | ViroPharma, (3) |
98,854 | ||||||||||||
| 6,288 | Vivus, (3) |
152,295 | ||||||||||||
| 3,351 | Volcano Corporation |
90,980 | ||||||||||||
| 2,735 | Wellcare Health Plans Inc., (2) |
167,327 | ||||||||||||
| 2,151 | West Pharmaceutical Services, (3) |
96,580 | ||||||||||||
| 2,508 | Wright Medical Group, (2), (3) |
46,724 | ||||||||||||
| 2,272 | Xenoport, (2), (3) |
10,383 | ||||||||||||
| 362 | Young Innovations, Inc. |
12,308 | ||||||||||||
| 4,778 | Zalicus, (2), (3) |
5,017 | ||||||||||||
| 474 | Zeltiq Aesthetics, (3) |
2,948 | ||||||||||||
| 4,306 | ZIOPHARM Oncology, (2), (3) |
20,497 | ||||||||||||
| 1,359 | Zogenix Inc., (2) |
2,487 | ||||||||||||
| Total Health Care |
9,614,268 | |||||||||||||
| Industrials – 15.0% |
||||||||||||||
| 5,674 | A123 Systems, (2), (3) |
5,787 | ||||||||||||
| 1,207 | Aaon, (3) |
24,623 | ||||||||||||
| 2,554 | AAR Corporation |
39,459 | ||||||||||||
| 3,407 | ABM Industries, (3) |
79,315 | ||||||||||||
| 2,748 | Acacia Research, (2), (3) |
112,668 | ||||||||||||
| 3,544 | Acco Brands, (2), (3) |
37,389 | ||||||||||||
| 2,599 | Accuride Corp |
18,843 | ||||||||||||
| 1,711 | Aceto Corporation |
15,399 | ||||||||||||
| 5,140 | Active Power, (2), (3) |
4,549 | ||||||||||||
| 4,408 | Actuant, (3) |
120,206 | ||||||||||||
| 2,783 | Acuity Brands, (3) |
154,651 | ||||||||||||
| 2,538 | Aegion Corporation, (2) |
46,319 | ||||||||||||
| 1,087 | Aerovironment, (3) |
26,436 | ||||||||||||
| 3,529 | Aircastle LTD |
42,877 | ||||||||||||
| 3,459 | Ait Transport Servcies Group Inc., (2) |
18,333 | ||||||||||||
| 429 | Alamo Group Inc. |
14,449 | ||||||||||||
| 4,604 | Alaska Air Group, (3) |
155,615 | ||||||||||||
| 1,777 | Albany International, Class A |
42,826 | ||||||||||||
| 856 | Allegiant Travel, (2), (3) |
50,299 | ||||||||||||
| 1,727 | Altra Industrial Motion, (2), (3) |
31,570 | ||||||||||||
| 64 | Nuveen Investments |
| Shares | Description (1) | Value | ||||||||||||
| Industrials (continued) |
||||||||||||||
| 556 | AMERCO |
$ | 55,845 | |||||||||||
| 1,135 | Ameresco Inc., Class A Shares, (2) |
13,836 | ||||||||||||
| 1,177 | American Ecology Corporation |
25,517 | ||||||||||||
| 626 | American Railcar Industries, (2) |
16,889 | ||||||||||||
| 2,380 | American Reprographics Co |
12,995 | ||||||||||||
| 552 | American Science & Engineering Inc. |
36,051 | ||||||||||||
| 2,869 | American Superconductor, (3) |
11,849 | ||||||||||||
| 603 | American Woodmark, (3) |
10,824 | ||||||||||||
| 548 | Ampco-Pittsburgh Corporation |
10,182 | ||||||||||||
| 1,805 | Apogee Enterprises, (3) |
27,725 | ||||||||||||
| 2,723 | Applied Industrial Technologies Inc. |
107,014 | ||||||||||||
| 505 | Argan, Inc. |
7,363 | ||||||||||||
| 1,633 | Arkansas Best Corporation |
25,050 | ||||||||||||
| 1,282 | Astecx Industries Inc., (2) |
40,114 | ||||||||||||
| 661 | Astronics Corporation |
20,987 | ||||||||||||
| 616 | AT Cross Company, Class A Shares |
7,072 | ||||||||||||
| 1,687 | Atlas Air Worldwide Holdings, (2), (3) |
77,686 | ||||||||||||
| 6,746 | Avis Budget Group Inc. |
88,777 | ||||||||||||
| 806 | AZZ, (3) |
41,678 | ||||||||||||
| 1,047 | Baltic Trading Limited |
4,869 | ||||||||||||
| 3,499 | Barnes Group, (3) |
92,374 | ||||||||||||
| 488 | Barrett Business Services, Inc. |
9,662 | ||||||||||||
| 2,954 | Beacon Roofing Supply, (3) |
78,842 | ||||||||||||
| 3,043 | Belden Inc. |
105,836 | ||||||||||||
| 3,126 | Blount International Inc. |
50,547 | ||||||||||||
| 3,052 | Brady Corporation |
94,704 | ||||||||||||
| 3,241 | Briggs & Stratton, (3) |
58,662 | ||||||||||||
| 2,998 | Brinks Company |
76,149 | ||||||||||||
| 8,977 | Broadwind Energy, (2), (3) |
3,052 | ||||||||||||
| 2,923 | Builders FirstSource, Inc., (2) |
12,189 | ||||||||||||
| 778 | CAI International, (2), (3) |
16,073 | ||||||||||||
| 15,805 | Capstone Turbine, (2), (3) |
17,227 | ||||||||||||
| 589 | Cascade Corporation |
27,724 | ||||||||||||
| 1,626 | Casella Waste Systems, Inc. |
9,805 | ||||||||||||
| 2,532 | CBIZ, (2), (3) |
15,369 | ||||||||||||
| 818 | CDI Corporation |
14,511 | ||||||||||||
| 1,288 | Celadon Group, Inc. |
20,131 | ||||||||||||
| 3,537 | Cenveo, (2), (3) |
10,116 | ||||||||||||
| 1,600 | Ceradyne Inc. |
40,512 | ||||||||||||
| 1,887 | Chart Industries, (2), (3) |
144,223 | ||||||||||||
| 1,108 | CIRCOR International Inc. |
34,481 | ||||||||||||
| 3,240 | CLARCOR, Inc. |
155,585 | ||||||||||||
| 3,011 | Clean Harbors, (2), (3) |
205,471 | ||||||||||||
| 538 | Coleman Cable Inc. |
4,573 | ||||||||||||
| 2,912 | Colfax, (3) |
98,688 | ||||||||||||
| Nuveen Investments | 65 |
Portfolio of Investments (Unaudited)
Nuveen Small Cap Index Fund (continued)
April 30, 2012
| Shares | Description (1) | Value | ||||||||||||
| Industrials (continued) |
||||||||||||||
| 1,236 | Columbus McKinnon Corporation NY |
$ | 18,330 | |||||||||||
| 2,435 | Comfort Systems USA Inc. |
25,762 | ||||||||||||
| 1,850 | Commercial Vehicle Group Inc. |
19,684 | ||||||||||||
| 73 | CompX International Inc. |
980 | ||||||||||||
| 542 | Consolidated Graphics Inc. |
21,675 | ||||||||||||
| 2,218 | Corporate Executive Board Company |
91,759 | ||||||||||||
| 662 | Courier Corporation |
6,799 | ||||||||||||
| 537 | Covenant Transport, Inc., (2) |
1,777 | ||||||||||||
| 696 | CRA International, Inc., (2) |
14,233 | ||||||||||||
| 1,016 | Cubic Corporation |
46,970 | ||||||||||||
| 2,983 | Curtiss Wright Corporation |
105,270 | ||||||||||||
| 1,138 | Delete Accumulation File |
7,488 | ||||||||||||
| 3,304 | Deluxe, (3) |
78,668 | ||||||||||||
| 2,265 | DigitalGlobe, (2), (3) |
27,792 | ||||||||||||
| 1,952 | Dolan Media Company, (2) |
15,636 | ||||||||||||
| 1,858 | Dollas Thrifty Automotive Group Inc., (2) |
150,238 | ||||||||||||
| 1,198 | Douglas Dynamics, (3) |
16,928 | ||||||||||||
| 677 | Ducommon Inc. |
7,989 | ||||||||||||
| 558 | DXP Enterprises, Inc. |
24,200 | ||||||||||||
| 2,263 | Dycom Industries, (3) |
52,932 | ||||||||||||
| 857 | Dynamic Material Corporation |
15,666 | ||||||||||||
| 4,020 | Eagle Bulk Shipping, (2), (3) |
6,593 | ||||||||||||
| 724 | Echo Global Logistics, (2), (3) |
12,330 | ||||||||||||
| 4,294 | Emcor Group Inc. |
125,900 | ||||||||||||
| 1,037 | Encore Capital Group, Inc. |
24,577 | ||||||||||||
| 1,192 | Encore Wire |
30,384 | ||||||||||||
| 2,941 | Energy Recovery, (2), (3) |
6,176 | ||||||||||||
| 5,128 | EnergySolutions, (3) |
21,589 | ||||||||||||
| 1,495 | EnerNOC, Inc. |
8,985 | ||||||||||||
| 3,065 | EnerSys, (2) |
107,122 | ||||||||||||
| 1,674 | Ennis, (3) |
26,382 | ||||||||||||
| 1,329 | EnPro Industries Inc., (2) |
55,034 | ||||||||||||
| 1,710 | ESCO Technologies, (3) |
58,824 | ||||||||||||
| 1,101 | Essex Rental Corporation |
4,327 | ||||||||||||
| 1,959 | Esterline Technologies Corporation, (2) |
134,172 | ||||||||||||
| 2,938 | Excel Maritime Carriers, (2), (3) |
5,494 | ||||||||||||
| 795 | Exponent, Inc., (2) |
38,001 | ||||||||||||
| 3,992 | Federal Signal Corporation |
20,599 | ||||||||||||
| 3,042 | Flow International Corporation |
12,503 | ||||||||||||
| 1,887 | Forward Air Corporation |
63,743 | ||||||||||||
| 857 | Franklin Covey Company |
7,962 | ||||||||||||
| 1,495 | Franklin Electric, (3) |
74,974 | ||||||||||||
| 768 | Freightcar America Inc. |
16,589 | ||||||||||||
| 2,702 | FTI Consulting, (3) |
98,191 | ||||||||||||
| 10,337 | Fuelcell Energy Inc., (2) |
12,818 | ||||||||||||
| 66 | Nuveen Investments |
| Shares | Description (1) | Value | ||||||||||||
| Industrials (continued) |
||||||||||||||
| 1,171 | Fuel-Tech, Inc. |
$ | 5,422 | |||||||||||
| 2,373 | Furmanite Corporation |
14,855 | ||||||||||||
| 1,203 | G&K Services, Inc. |
39,531 | ||||||||||||
| 1,899 | Genco Shipping and Trading Limited, (2) |
10,160 | ||||||||||||
| 3,772 | GenCorp, (3) |
25,914 | ||||||||||||
| 1,602 | Generac Holdings, (3) |
38,576 | ||||||||||||
| 2,545 | Genesee & Wyoming, (2), (3) |
137,201 | ||||||||||||
| 4,168 | Geo Group Inc., (2) |
86,319 | ||||||||||||
| 1,425 | GeoEye, Inc., (2) |
32,661 | ||||||||||||
| 1,953 | Gibraltar Industries Inc. |
26,405 | ||||||||||||
| 1,013 | Global Power Equipment Group, (2), (3) |
25,335 | ||||||||||||
| 978 | Gorman-Rupp, (3) |
28,166 | ||||||||||||
| 953 | GP Strategies Corporation, (2) |
15,991 | ||||||||||||
| 633 | Graham, (3) |
13,977 | ||||||||||||
| 2,483 | Granite Construction Inc. |
69,127 | ||||||||||||
| 3,779 | Great Lakes Dredge & Dock, (3) |
28,002 | ||||||||||||
| 1,267 | Greenbrier Companies Inc. |
21,856 | ||||||||||||
| 3,064 | Griffon Corporation |
30,364 | ||||||||||||
| 1,837 | H&E Equipment Services, (3) |
35,454 | ||||||||||||
| 3,238 | Hawaian Holdings, (3) |
18,327 | ||||||||||||
| 4,265 | Healthcare Services Group, (3) |
90,503 | ||||||||||||
| 3,240 | Heartland Express, (3) |
44,809 | ||||||||||||
| 3,351 | Heico, (3) |
135,122 | ||||||||||||
| 1,143 | Heidrick & Struggles International, (3) |
22,289 | ||||||||||||
| 305 | Heritage-Crystal Clean, Inc., (2) |
6,451 | ||||||||||||
| 6,293 | Hexcel, (2), (3) |
172,302 | ||||||||||||
| 1,611 | Hill International, Inc. |
5,735 | ||||||||||||
| 2,874 | HNI Corporation |
69,321 | ||||||||||||
| 1,142 | Houston Wire & Cable Company |
14,035 | ||||||||||||
| 2,365 | Hub Group, Inc. |
82,775 | ||||||||||||
| 2,107 | Hudson Global Inc. |
11,462 | ||||||||||||
| 414 | Hurco Companies, (3) |
10,901 | ||||||||||||
| 1,427 | Huron Consulting Group, (3) |
50,287 | ||||||||||||
| 1,264 | ICF International, Inc., (2) |
31,524 | ||||||||||||
| 3,324 | II VI Inc. |
67,843 | ||||||||||||
| 1,657 | Innerworkings, (2), (3) |
19,072 | ||||||||||||
| 1,471 | Insperity Inc. |
40,114 | ||||||||||||
| 1,132 | Insteel Industries, Inc. |
12,871 | ||||||||||||
| 3,385 | Interface, (3) |
47,932 | ||||||||||||
| 2,144 | Interline Brands Inc. |
45,110 | ||||||||||||
| 349 | International Shipholding, (3) |
7,385 | ||||||||||||
| 622 | Intersections, Inc. |
7,483 | ||||||||||||
| 15,834 | JetBlue Airways, (3) |
75,212 | ||||||||||||
| 1,841 | John Bean Technologies Corporation |
29,438 | ||||||||||||
| 790 | Kadant Inc., (2) |
20,437 | ||||||||||||
| Nuveen Investments | 67 |
Portfolio of Investments (Unaudited)
Nuveen Small Cap Index Fund (continued)
April 30, 2012
| Shares | Description (1) | Value | ||||||||||||
| Industrials (continued) |
||||||||||||||
| 1,687 | Kaman, (3) |
$ | 57,999 | |||||||||||
| 2,094 | Kaydon Corporation |
51,366 | ||||||||||||
| 1,712 | Kelly Services, (3) |
23,951 | ||||||||||||
| 1,214 | Keyw Holding, (3) |
11,412 | ||||||||||||
| 1,907 | KForce Inc. |
27,594 | ||||||||||||
| 2,013 | Kimball International Inc., Class B |
13,749 | ||||||||||||
| 3,919 | Knight Transportation Inc. |
64,350 | ||||||||||||
| 3,073 | Knoll Inc. |
45,450 | ||||||||||||
| 3,018 | Korn Ferry International |
48,741 | ||||||||||||
| 2,128 | Kratos Defence & Security Solutions, (2), (3) |
11,810 | ||||||||||||
| 224 | Lawson Products, Inc. |
3,261 | ||||||||||||
| 1,261 | Layne Christensen Company, (2) |
25,914 | ||||||||||||
| 579 | LB Foster Company |
15,523 | ||||||||||||
| 806 | Lindsay Manufacturing Company |
53,833 | ||||||||||||
| 588 | LMI Aerospace, Inc. |
10,755 | ||||||||||||
| 1,251 | LSI Industries, Inc. |
8,569 | ||||||||||||
| 1,102 | Lydall Inc. |
11,626 | ||||||||||||
| 998 | Marten Transport, Ltd. |
21,028 | ||||||||||||
| 3,639 | MasTec, (2), (3) |
63,282 | ||||||||||||
| 1,561 | McGrath Rentcorp. |
45,925 | ||||||||||||
| 6,069 | Meritor, (2), (3) |
39,509 | ||||||||||||
| 2,579 | Metalico Inc. |
8,356 | ||||||||||||
| 941 | Met-Pro Corp. |
9,372 | ||||||||||||
| 538 | Michael Baker Corporation |
12,121 | ||||||||||||
| 1,204 | Middleby, (2), (3) |
122,170 | ||||||||||||
| 720 | Midwest Air Group Inc. |
11,808 | ||||||||||||
| 3,680 | Miller (Herman) Inc. |
71,870 | ||||||||||||
| 1,744 | Mine Safety Appliances Company |
74,050 | ||||||||||||
| 946 | Mistras Group, (2) |
22,203 | ||||||||||||
| 2,361 | Mobile Mini, (2), (3) |
44,528 | ||||||||||||
| 2,917 | Moog Inc., Class A Shares |
123,302 | ||||||||||||
| 2,432 | Mueller Industries Inc. |
111,167 | ||||||||||||
| 9,990 | Mueller Water Products Inc. |
35,864 | ||||||||||||
| 732 | Multi Color Corporation |
15,606 | ||||||||||||
| 1,294 | MYR Group, (2), (3) |
21,636 | ||||||||||||
| 374 | Nacco Industries Inc. |
42,438 | ||||||||||||
| 308 | National Presto Industries, (3) |
22,706 | ||||||||||||
| 3,313 | Navigant Consulting Inc., (2) |
46,117 | ||||||||||||
| 1,268 | NCI Building Systems Inc. |
15,203 | ||||||||||||
| 428 | NL Industries Inc. |
6,022 | ||||||||||||
| 1,079 | NN, Incorporated |
8,535 | ||||||||||||
| 598 | Northwest Pipe Company |
12,444 | ||||||||||||
| 4,677 | Odyssey Marine Exploration, (3) |
14,218 | ||||||||||||
| 3,048 | Old Dominion Frght Line, (3) |
135,545 | ||||||||||||
| 178 | OmegaFlex, Inc. |
2,394 | ||||||||||||
| 68 | Nuveen Investments |
| Shares | Description (1) | Value | ||||||||||||
| Industrials (continued) |
||||||||||||||
| 2,375 | On Assignment, Inc. |
$ | 44,436 | |||||||||||
| 3,753 | Orbital Sciences, (2), (3) |
47,138 | ||||||||||||
| 1,736 | Orion Marine Group Inc., (2) |
12,013 | ||||||||||||
| 2,249 | Pacer International, Inc., (2) |
13,516 | ||||||||||||
| 535 | Park Ohio Holdings Corporation |
11,551 | ||||||||||||
| 397 | Patriot Transportation Holding, Inc., (2) |
8,722 | ||||||||||||
| 1,328 | Peerless Manufacturing, (2), (3) |
17,941 | ||||||||||||
| 9,713 | Pendrell Corporation, (2) |
13,113 | ||||||||||||
| 1,045 | Pike Electric Corporation |
8,590 | ||||||||||||
| 1,100 | Portfolio Recovery Associates, Inc., (2) |
75,702 | ||||||||||||
| 566 | Powell Industries Inc. |
18,457 | ||||||||||||
| 1,210 | PowerSecure International, Inc., (2) |
6,280 | ||||||||||||
| 156 | Preformed Line Products, (3) |
9,006 | ||||||||||||
| 1,716 | Primoris Services Corporation |
24,745 | ||||||||||||
| 317 | Proto Labs, (3) |
11,761 | ||||||||||||
| 1,622 | Quad Graphics, (3) |
21,800 | ||||||||||||
| 961 | Quality Distribution, Inc., (2) |
10,734 | ||||||||||||
| 2,436 | Quanex Building Products, (3) |
44,895 | ||||||||||||
| 1,372 | RailAmerica, Inc. |
31,803 | ||||||||||||
| 1,161 | Raven Industries, Inc. |
69,904 | ||||||||||||
| 1,409 | RBC Bearings Inc., (2) |
66,054 | ||||||||||||
| 3,097 | Republic Airways Holdings, (3) |
15,764 | ||||||||||||
| 2,782 | Resources Connection, Inc. |
36,110 | ||||||||||||
| 585 | Roadrunner Transportation System Inc., (2) |
10,150 | ||||||||||||
| 2,533 | Robbins & Myers, Inc. |
123,382 | ||||||||||||
| 4,082 | Rollins Inc. |
86,743 | ||||||||||||
| 646 | RPX Corporation, (2) |
11,163 | ||||||||||||
| 4,353 | RSC Holdings, Inc., (2) |
103,253 | ||||||||||||
| 2,081 | Rush Enterprises, Class A |
37,624 | ||||||||||||
| 1,024 | Saia, Inc., (2) |
19,231 | ||||||||||||
| 5,828 | SatCon Technology, (3) |
2,448 | ||||||||||||
| 743 | Sauer-Danfoss, Inc. |
32,179 | ||||||||||||
| 758 | Schawk Inc. |
10,210 | ||||||||||||
| 20 | Seaboard Corporation |
39,808 | ||||||||||||
| 709 | SeaCube Container Leasing Limited |
13,152 | ||||||||||||
| 2,672 | Simpson Manufacturing Company Inc. |
82,912 | ||||||||||||
| 3,397 | Skywest Inc. |
30,539 | ||||||||||||
| 2,442 | Smith AO, (3) |
116,239 | ||||||||||||
| 972 | Spirit Airline Holdings, (3) |
23,347 | ||||||||||||
| 1,017 | Standard Parking, (3) |
19,384 | ||||||||||||
| 802 | Standex International Corporation |
35,336 | ||||||||||||
| 5,110 | Steelcase Inc. |
44,150 | ||||||||||||
| 1,058 | Sterling Construction Company, Inc. |
10,358 | ||||||||||||
| 1,287 | Sun Hydraulics Corporation |
32,214 | ||||||||||||
| 5,091 | Swift Transportation Company, (2) |
53,405 | ||||||||||||
| Nuveen Investments | 69 |
Portfolio of Investments (Unaudited)
Nuveen Small Cap Index Fund (continued)
April 30, 2012
| Shares | Description (1) | Value | ||||||||||||
| Industrials (continued) |
||||||||||||||
| 5,437 | Swisher Hygiene, (3) |
$ | 12,233 | |||||||||||
| 2,549 | Sykes Enterprises Inc. |
40,402 | ||||||||||||
| 1,412 | TAL International Group, (3) |
58,330 | ||||||||||||
| 3,572 | Taser International, Inc., (2) |
16,431 | ||||||||||||
| 1,250 | Team, Inc. |
37,038 | ||||||||||||
| 1,690 | Tecumseh Products Company, Class A |
6,456 | ||||||||||||
| 2,360 | Teledyne Technologies Inc. |
152,503 | ||||||||||||
| 1,229 | Tennant, (3) |
54,445 | ||||||||||||
| 4,005 | Tetra Tech, (2), (3) |
106,934 | ||||||||||||
| 732 | Textainer Group Holdings, (3) |
25,671 | ||||||||||||
| 1,072 | The Advisory Board, (2), (3) |
97,724 | ||||||||||||
| 643 | Thermon Group Holdings, (3) |
14,287 | ||||||||||||
| 2,703 | Titan International, (3) |
78,090 | ||||||||||||
| 1,154 | Titan Machinery, (2), (3) |
41,117 | ||||||||||||
| 827 | TMS International, Class A, (2) |
9,990 | ||||||||||||
| 1,000 | Trex Company Inc., (2) |
32,000 | ||||||||||||
| 1,642 | TriMas Corporation, (2) |
36,140 | ||||||||||||
| 2,416 | Triumph Group, (3) |
151,773 | ||||||||||||
| 2,576 | TrueBlue, (2), (3) |
44,462 | ||||||||||||
| 2,004 | Tutor Perini Corporation |
30,481 | ||||||||||||
| 543 | Twin Disc, (3) |
11,908 | ||||||||||||
| 1,411 | Ultrapetrol, (2), (3) |
2,695 | ||||||||||||
| 910 | UniFirst Corporation |
55,292 | ||||||||||||
| 4,015 | United Rentals, (2), (3) |
187,420 | ||||||||||||
| 2,741 | United Stationers, (3) |
77,735 | ||||||||||||
| 705 | UniTek Global Services, Inc., (2) |
2,291 | ||||||||||||
| 1,254 | Universal Forest Products, (3) |
46,900 | ||||||||||||
| 353 | Universal Truckload Services, Inc. |
5,507 | ||||||||||||
| 10,409 | U.S. Airways Group, (2), (3) |
106,796 | ||||||||||||
| 4,588 | USG, (3) |
82,813 | ||||||||||||
| 4,640 | Valence Technology, (3) |
3,387 | ||||||||||||
| 1,310 | Viad Corporation |
23,685 | ||||||||||||
| 1,258 | Vicor Corporation |
8,768 | ||||||||||||
| 265 | VSE Corporation |
5,830 | ||||||||||||
| 4,400 | Wabash National Corporation |
36,828 | ||||||||||||
| 1,806 | Watsco, (3) |
129,942 | ||||||||||||
| 1,933 | Watts Water Technologies, Inc. |
71,173 | ||||||||||||
| 2,815 | Werner Enterprises, (3) |
66,490 | ||||||||||||
| 1,349 | Wesco Aircraft Holdings Inc |
21,301 | ||||||||||||
| 3,950 | Woodward Governor, (3) |
164,281 | ||||||||||||
| 708 | Xerium Technologies, (2) |
3,327 | ||||||||||||
| 658 | Zipcar, (2), (3) |
7,927 | ||||||||||||
| Total Industrials |
11,999,930 | |||||||||||||
| Information Technology – 15.9% |
||||||||||||||
| 2,692 | 3D Systems, (2), (3) |
79,387 | ||||||||||||
| 3,558 | Accelrys, (2), (3) |
29,282 | ||||||||||||
| 70 | Nuveen Investments |
| Shares | Description (1) | Value | ||||||||||||
| Information Technology (continued) |
||||||||||||||
| 2,512 | ACI Worldwide, Inc. |
$ | 100,128 | |||||||||||
| 789 | Active Network, (3) |
13,255 | ||||||||||||
| 2,443 | Actuate Corporation, (2) |
17,345 | ||||||||||||
| 5,214 | Acxiom Corporation |
71,588 | ||||||||||||
| 4,155 | ADTRAN, (3) |
126,811 | ||||||||||||
| 2,798 | Advanced Energy Industriess, (3) |
33,408 | ||||||||||||
| 2,108 | Advent Software, (2), (3) |
56,895 | ||||||||||||
| 1,275 | Aeroflex Holding, (3) |
14,280 | ||||||||||||
| 1,105 | Agilysys Inc., (2) |
9,680 | ||||||||||||
| 943 | Alpha & Omega Semiconductor Limited, (2) |
9,326 | ||||||||||||
| 1,460 | American Software, Inc. |
12,089 | ||||||||||||
| 6,215 | Amkor Technology, (3) |
32,132 | ||||||||||||
| 616 | Amtech Systems, Inc. |
4,300 | ||||||||||||
| 4,332 | Anadigics Inc. |
9,574 | ||||||||||||
| 972 | Anaren Microwave Inc. |
17,535 | ||||||||||||
| 2,035 | Ancestry.com, (3) |
54,335 | ||||||||||||
| 653 | Angie’s List |
9,109 | ||||||||||||
| 1,862 | Anixter International Inc. |
127,696 | ||||||||||||
| 4,070 | Applied Micro Circuits Corporation, (2) |
22,711 | ||||||||||||
| 7,952 | Arris Group Inc., (2) |
102,819 | ||||||||||||
| 5,769 | Aruba Networks, (3) |
121,841 | ||||||||||||
| 5,436 | Aspen Technology Inc. |
107,524 | ||||||||||||
| 2,033 | ATMI, (2), (3) |
42,713 | ||||||||||||
| 3,895 | Aviat Networks, (2) |
9,932 | ||||||||||||
| 1,903 | Avid Technology Inc., (2) |
16,537 | ||||||||||||
| 6,817 | Axcelis Technologies Inc. |
9,271 | ||||||||||||
| 2,054 | AXT, (2), (3) |
10,455 | ||||||||||||
| 968 | Badger Meter, (3) |
35,758 | ||||||||||||
| 1,478 | Bankrate, (3) |
34,615 | ||||||||||||
| 516 | Bazaarvoice, (3) |
10,222 | ||||||||||||
| 676 | Bel Fuse, Inc., Class B |
12,026 | ||||||||||||
| 3,902 | Benchmark Electronics Inc., (2) |
61,964 | ||||||||||||
| 1,154 | Black Box Corporation |
26,092 | ||||||||||||
| 2,860 | Blackbaud, (3) |
88,603 | ||||||||||||
| 2,308 | Bottomline Technologies, Inc. |
54,307 | ||||||||||||
| 369 | Brightcove |
6,919 | ||||||||||||
| 4,381 | Brightpoint Inc. |
26,812 | ||||||||||||
| 1,449 | Broadsoft, (2), (3) |
62,032 | ||||||||||||
| 4,249 | Brooks Automation Inc. |
49,968 | ||||||||||||
| 1,402 | Cabot Microelectronics, (3) |
48,201 | ||||||||||||
| 1,686 | CACI International, (3) |
103,065 | ||||||||||||
| 2,418 | Calix, (2), (3) |
19,247 | ||||||||||||
| 1,927 | Callidus Software, (2), (3) |
15,262 | ||||||||||||
| 461 | Carbonite Inc. |
3,683 | ||||||||||||
| 2,768 | Cardtronics, (2), (3) |
72,964 | ||||||||||||
| Nuveen Investments | 71 |
Portfolio of Investments (Unaudited)
Nuveen Small Cap Index Fund (continued)
April 30, 2012
| Shares | Description (1) | Value | ||||||||||||
| Information Technology (continued) |
||||||||||||||
| 595 | Cass Information Systems, Inc. |
$ | 24,365 | |||||||||||
| 3,112 | Cavium Networks, (2), (3) |
91,057 | ||||||||||||
| 1,481 | CEVA, Inc. |
32,715 | ||||||||||||
| 2,576 | Checkpoint Systems, (3) |
28,233 | ||||||||||||
| 4,108 | Ciber, (2), (3) |
17,089 | ||||||||||||
| 4,255 | Cirrus Logic, (3) |
116,502 | ||||||||||||
| 2,664 | Cognex, (3) |
107,226 | ||||||||||||
| 1,516 | Coherent Inc., (2) |
79,742 | ||||||||||||
| 1,545 | Cohu Inc. |
16,964 | ||||||||||||
| 428 | Communication Systems Inc. |
5,568 | ||||||||||||
| 2,830 | CommVault Systems, Inc., (2) |
147,358 | ||||||||||||
| 972 | Computer Task Group, (3) |
14,016 | ||||||||||||
| 2,049 | ComScore Inc., (2) |
40,816 | ||||||||||||
| 1,308 | Comtech Telecom Corporation |
40,443 | ||||||||||||
| 2,869 | Concur Technologies, (3) |
162,271 | ||||||||||||
| 1,894 | Constant Contact Inc. |
45,778 | ||||||||||||
| 6,759 | Convergys, (2), (3) |
90,368 | ||||||||||||
| 778 | Convio Inc., (2) |
12,448 | ||||||||||||
| 734 | Cornerstone OnDemand, (2), (3) |
15,253 | ||||||||||||
| 1,624 | CoStar Group, (2), (3) |
118,373 | ||||||||||||
| 2,324 | Cray, Inc. |
25,913 | ||||||||||||
| 2,223 | CSG Systems International Inc., (2) |
32,011 | ||||||||||||
| 425 | CSR PLC, (2) |
6,171 | ||||||||||||
| 2,206 | CTS Corporation |
23,670 | ||||||||||||
| 1,960 | Cymer, (2), (3) |
101,606 | ||||||||||||
| 2,224 | Daktronics, (3) |
18,103 | ||||||||||||
| 970 | DDI Corporation |
12,591 | ||||||||||||
| 2,642 | DealerTrack Holdings, (3) |
78,811 | ||||||||||||
| 1,426 | Deltek Inc., (2) |
14,887 | ||||||||||||
| 507 | Demand Media Inc |
4,213 | ||||||||||||
| 993 | Dialogic Inc., (2) |
973 | ||||||||||||
| 3,112 | Dice Holdings, (3) |
33,547 | ||||||||||||
| 1,629 | Digi International, Inc. |
15,117 | ||||||||||||
| 403 | Digimarc Corporation, (2) |
10,538 | ||||||||||||
| 2,398 | Digital River, Inc., (2) |
45,106 | ||||||||||||
| 2,270 | Diodes Inc. |
50,598 | ||||||||||||
| 3,629 | Dot Hill Systems Corporation, (2) |
4,536 | ||||||||||||
| 1,504 | DSP Group Inc., (2) |
9,836 | ||||||||||||
| 1,119 | DTS, Inc., (2) |
34,913 | ||||||||||||
| 575 | Dynamics Research Corporation |
4,134 | ||||||||||||
| 7,068 | Earthlink, Inc. |
57,392 | ||||||||||||
| 1,852 | Ebix, (3) |
37,873 | ||||||||||||
| 2,255 | Echelon Corporation, (2) |
9,832 | ||||||||||||
| 1,207 | Electro Rent Corporation |
18,805 | ||||||||||||
| 1,451 | Electro Scientific Industries Inc. |
20,691 | ||||||||||||
| 72 | Nuveen Investments |
| Shares | Description (1) | Value | ||||||||||||
| Information Technology (continued) |
||||||||||||||
| 2,999 | Electronics For Imaging |
$ | 53,532 | |||||||||||
| 543 | Ellie Mae Inc |
7,037 | ||||||||||||
| 1,198 | eMagin Corporation |
3,726 | ||||||||||||
| 1,418 | Emcore, (3) |
6,409 | ||||||||||||
| 5,639 | Emulex Corporation |
48,947 | ||||||||||||
| 8,632 | Entegris, (2) |
76,393 | ||||||||||||
| 5,505 | Entropic Communications, (2), (3) |
23,286 | ||||||||||||
| 1,231 | Envestnet Inc., (2) |
15,400 | ||||||||||||
| 235 | Epam Systems Inc |
4,850 | ||||||||||||
| 2,017 | EPIQ Systems, (3) |
22,913 | ||||||||||||
| 234 | ePlus, Inc. |
6,940 | ||||||||||||
| 3,290 | Euronet Worldwide, (3) |
71,163 | ||||||||||||
| 2,107 | Exar Corporation |
16,687 | ||||||||||||
| 1,039 | Exlservice Holdings, (3) |
28,760 | ||||||||||||
| 5,917 | Extreme Networks Inc., (2) |
22,662 | ||||||||||||
| 1,310 | Fabrinet, (2) |
22,034 | ||||||||||||
| 2,294 | Fair Isaac Corporation |
98,413 | ||||||||||||
| 1,972 | Falconstore Software, Inc. |
6,488 | ||||||||||||
| 1,049 | FARO Technologies, (3) |
58,723 | ||||||||||||
| 2,486 | FEI, (2), (3) |
124,723 | ||||||||||||
| 5,759 | Finisar, (2), (3) |
95,139 | ||||||||||||
| 3,255 | FormFactor Inc. |
18,228 | ||||||||||||
| 851 | Forrester Research, (3) |
30,168 | ||||||||||||
| 374 | FriendFinder Networks, (3) |
408 | ||||||||||||
| 2,487 | FSI International, (3) |
12,609 | ||||||||||||
| 4,145 | Global Cash Access Holdings, (3) |
35,025 | ||||||||||||
| 1,440 | Globecom Systems, Inc., (2) |
20,419 | ||||||||||||
| 3,049 | Glu Mobile, (3) |
13,873 | ||||||||||||
| 1,661 | GSI Group, (3) |
20,048 | ||||||||||||
| 1,296 | GSI Technology Inc., (2) |
5,482 | ||||||||||||
| 8,089 | GT Advanced Technologies, (2), (3) |
52,659 | ||||||||||||
| 832 | Guidance Software, Inc. |
7,896 | ||||||||||||
| 568 | Guidewire Software Inc. |
15,461 | ||||||||||||
| 1,013 | Hackett Group, Inc. |
5,784 | ||||||||||||
| 7,375 | Harmonic Inc. |
34,810 | ||||||||||||
| 2,477 | Heartland Payment Systems, (3) |
75,474 | ||||||||||||
| 5,547 | Jack Henry Associates, (3) |
188,376 | ||||||||||||
| 1,967 | Higher One Holdings, (2), (3) |
31,020 | ||||||||||||
| 2,014 | Hittite Microwave Corporation, (2) |
107,830 | ||||||||||||
| 2,486 | Identive Group Inc., (2) |
5,121 | ||||||||||||
| 1,987 | IGATE, (3) |
38,667 | ||||||||||||
| 1,930 | Imation Corporation, (2) |
11,194 | ||||||||||||
| 1,833 | Immersion Corporation |
9,990 | ||||||||||||
| 354 | Imperva, (3) |
12,309 | ||||||||||||
| 6,717 | Infinera, (2), (3) |
48,094 | ||||||||||||
| Nuveen Investments | 73 |
Portfolio of Investments (Unaudited)
Nuveen Small Cap Index Fund (continued)
April 30, 2012
| Shares | Description (1) | Value | ||||||||||||
| Information Technology (continued) |
||||||||||||||
| 2,534 | InfoSpace, Inc., (2) |
$ | 28,203 | |||||||||||
| 1,388 | Inphi, (2), (3) |
14,088 | ||||||||||||
| 2,819 | Insight Enterprises, (2), (3) |
57,254 | ||||||||||||
| 9,521 | Integrated Device Technology, (2), (3) |
64,457 | ||||||||||||
| 1,719 | Integrated Silicon Solution, (2) |
18,256 | ||||||||||||
| 916 | Interactive Intelligence Group, (2) |
27,169 | ||||||||||||
| 2,915 | Interdigital, (3) |
80,804 | ||||||||||||
| 3,815 | Intermec Inc |
20,296 | ||||||||||||
| 621 | Intermolecular Inc, (2) |
4,142 | ||||||||||||
| 3,358 | Internap Network Services Corporation, (2) |
23,640 | ||||||||||||
| 1,467 | Intevac, Inc. |
11,824 | ||||||||||||
| 2,054 | Intralinks Holdings INc., (2) |
9,572 | ||||||||||||
| 643 | Invensense, (3) |
10,339 | ||||||||||||
| 2,481 | IXIA, (2), (3) |
31,261 | ||||||||||||
| 1,552 | IXYS, (2), (3) |
19,338 | ||||||||||||
| 2,778 | J2 Global, (3) |
71,756 | ||||||||||||
| 2,718 | JDA Software Group, (2) |
78,496 | ||||||||||||
| 993 | Jive Software Inc. |
23,643 | ||||||||||||
| 2,836 | Kemet Corp |
24,134 | ||||||||||||
| 1,697 | Kenexa Corporation |
55,441 | ||||||||||||
| 942 | Keynote Systems, (3) |
17,333 | ||||||||||||
| 2,471 | KIT Digital, (3) |
16,753 | ||||||||||||
| 4,359 | Kopin Corporation |
15,562 | ||||||||||||
| 4,625 | Kulicke & Soffa Industries Inc., (2) |
60,588 | ||||||||||||
| 955 | KVH Industries, Inc. |
9,531 | ||||||||||||
| 7,568 | Lattice Semiconductor Corporation |
41,321 | ||||||||||||
| 1,053 | Lecroy Corporation, (2) |
10,888 | ||||||||||||
| 4,072 | Limelight Networks Inc., (2) |
11,157 | ||||||||||||
| 3,958 | Lionbridge Technologies, Inc. |
10,885 | ||||||||||||
| 1,207 | Liquidity Services, Inc., (2) |
64,369 | ||||||||||||
| 1,384 | Littelfuse Inc. |
86,735 | ||||||||||||
| 3,385 | Liveperson, Inc. |
53,754 | ||||||||||||
| 1,309 | LogMeIn Inc., (2) |
47,137 | ||||||||||||
| 960 | LoopNet, Inc. |
18,403 | ||||||||||||
| 702 | Loral Space & Communications, Inc. |
43,559 | ||||||||||||
| 3,178 | LTX_Credence Corporation |
21,928 | ||||||||||||
| 1,312 | Manhattan Associates Inc., (2) |
65,797 | ||||||||||||
| 1,498 | ManTech International, Class A, (3) |
47,067 | ||||||||||||
| 1,373 | Marchex, Inc. |
4,778 | ||||||||||||
| 2,229 | Maximus Inc. |
98,633 | ||||||||||||
| 1,028 | Maxlinear Inc., (2) |
4,986 | ||||||||||||
| 1,795 | Maxwell Technologies, (3) |
17,070 | ||||||||||||
| 960 | Measurement Specialties, Inc. |
34,301 | ||||||||||||
| 6,186 | Mentor Graphics Corporation, (2) |
89,388 | ||||||||||||
| 1,939 | Mercury Computer Systems, (3) |
25,595 | ||||||||||||
| 74 | Nuveen Investments |
| Shares | Description (1) | Value | ||||||||||||
| Information Technology (continued) |
||||||||||||||
| 693 | Meru Networks Inc., (2) |
$ | 1,968 | |||||||||||
| 2,373 | Methode Electronics, Inc. |
20,052 | ||||||||||||
| 3,239 | Micrel, Incorporated |
35,273 | ||||||||||||
| 5,550 | Microsemi, (3) |
119,436 | ||||||||||||
| 513 | Microstrategy Inc. |
71,707 | ||||||||||||
| 988 | Microvision, (3) |
1,838 | ||||||||||||
| 2,152 | Mindspeed Technologies, (3) |
10,782 | ||||||||||||
| 3,375 | MIPS Technologies, Inc. |
22,073 | ||||||||||||
| 3,358 | MKS Instruments, (3) |
92,849 | ||||||||||||
| 2,813 | ModusLink Global Solutions Inc. |
13,924 | ||||||||||||
| 672 | Moneygram Intl Inc |
11,316 | ||||||||||||
| 1,925 | Monolithic Power Systems, Inc. |
39,886 | ||||||||||||
| 2,298 | Monotype Imaging Holdings Inc., (2) |
32,609 | ||||||||||||
| 2,097 | MoSys, Inc. |
7,549 | ||||||||||||
| 4,681 | Motricity, (3) |
4,821 | ||||||||||||
| 2,550 | Move, (3) |
22,185 | ||||||||||||
| 1,002 | MTS Systems Corporation |
48,066 | ||||||||||||
| 581 | Multi Fineline Electronix, Inc., (2) |
15,391 | ||||||||||||
| 1,293 | Nanometrics Inc. |
20,054 | ||||||||||||
| 429 | Nci, Inc., (2) |
2,128 | ||||||||||||
| 556 | Neophotonics Corp |
2,630 | ||||||||||||
| 2,352 | Netgear, Inc., (2) |
90,552 | ||||||||||||
| 2,400 | NetScout Systems, Inc., (2) |
49,656 | ||||||||||||
| 1,749 | NetSuite Inc., (2) |
77,621 | ||||||||||||
| 2,407 | Newport, (3) |
41,087 | ||||||||||||
| 4,111 | NIC, Incorporated |
46,002 | ||||||||||||
| 2,060 | Novatel Wireless, (2) |
5,953 | ||||||||||||
| 613 | Numerex, (2), (3) |
5,811 | ||||||||||||
| 306 | NVE, (3) |
15,508 | ||||||||||||
| 3,243 | Oclaro, (2), (3) |
9,307 | ||||||||||||
| 4,225 | OCZ Technology Group, (2), (3) |
24,928 | ||||||||||||
| 3,359 | Omnivision Technologies, (3) |
61,873 | ||||||||||||
| 1,513 | Open Solutions, (2), (3) |
67,676 | ||||||||||||
| 5,476 | Openwave Systems Inc. |
14,128 | ||||||||||||
| 1,255 | Oplink Communications, Inc., (2) |
19,879 | ||||||||||||
| 925 | OPNET Technologies, Inc. |
21,423 | ||||||||||||
| 2,807 | Opnext, Inc., (2) |
3,340 | ||||||||||||
| 1,224 | OSI Systems Inc. |
81,837 | ||||||||||||
| 7,652 | Parametric Technology Corporation |
165,130 | ||||||||||||
| 1,331 | Park Electrochemical Corporation |
38,399 | ||||||||||||
| 597 | PC Connection, Inc. |
4,788 | ||||||||||||
| 1,505 | PDF Solutions, Inc. |
13,274 | ||||||||||||
| 1,068 | Pegasystems, (3) |
39,719 | ||||||||||||
| 1,553 | Perficient, Inc., (2) |
18,652 | ||||||||||||
| 1,608 | Pericom Semiconductor Corporation |
12,639 | ||||||||||||
| Nuveen Investments | 75 |
Portfolio of Investments (Unaudited)
Nuveen Small Cap Index Fund (continued)
April 30, 2012
| Shares | Description (1) | Value | ||||||||||||
| Information Technology (continued) |
||||||||||||||
| 3,776 | Photronics Inc., (2) |
$ | 23,373 | |||||||||||
| 2,795 | Plantronics, (3) |
107,104 | ||||||||||||
| 2,284 | Plexus, (3) |
73,933 | ||||||||||||
| 2,861 | PLX Technologies Inc. |
11,387 | ||||||||||||
| 1,778 | Power Integrations Inc. |
67,351 | ||||||||||||
| 4,374 | Power One Inc, (2) |
18,721 | ||||||||||||
| 2,034 | Powerwave Technologies, (3) |
2,298 | ||||||||||||
| 1,254 | PRG-Schultz International Inc., (2) |
7,925 | ||||||||||||
| 1,231 | Procera Networks Inc., (2) |
25,556 | ||||||||||||
| 4,021 | Progress Software, (3) |
93,046 | ||||||||||||
| 1,382 | PROS Holdings, Inc., (2) |
27,212 | ||||||||||||
| 2,672 | Pulse Electronics, (3) |
5,478 | ||||||||||||
| 422 | QAD Inc A, (2) |
5,212 | ||||||||||||
| 4,523 | QLIK Technologies, (2), (3) |
130,308 | ||||||||||||
| 14,482 | Quantum Corporation |
34,467 | ||||||||||||
| 439 | Quepasa, (3) |
1,668 | ||||||||||||
| 3,646 | Quest Software, (2), (3) |
84,842 | ||||||||||||
| 1,771 | QuinStreet, Inc., (2) |
18,613 | ||||||||||||
| 1,247 | Radisys Corporation |
7,918 | ||||||||||||
| 6,308 | Rambus, (3) |
32,108 | ||||||||||||
| 2,639 | RealD Inc., (2) |
31,879 | ||||||||||||
| 1,355 | RealNetworks Inc. |
12,967 | ||||||||||||
| 1,949 | RealPage, (2), (3) |
35,374 | ||||||||||||
| 608 | Responsys Inc. |
7,770 | ||||||||||||
| 17,740 | RF Micro Devices, (3) |
76,814 | ||||||||||||
| 858 | Richardson Electronics Limited |
10,819 | ||||||||||||
| 610 | Rimage Corporation |
5,545 | ||||||||||||
| 1,827 | Rofin Sinar Technologies Inc. |
46,040 | ||||||||||||
| 1,026 | Rogers Corporation |
39,286 | ||||||||||||
| 705 | Rosetta Stone Inc. |
7,374 | ||||||||||||
| 1,127 | Rubicon Technology Inc., (2) |
10,650 | ||||||||||||
| 2,034 | Rudolph Technologies |
21,967 | ||||||||||||
| 1,914 | Saba Software, (3) |
18,604 | ||||||||||||
| 5,173 | Sanmina-SCI Corporation |
46,040 | ||||||||||||
| 7,018 | Sapient, (3) |
84,005 | ||||||||||||
| 1,735 | ScanSource, Inc. |
57,186 | ||||||||||||
| 793 | SciQuest Inc., (2) |
11,776 | ||||||||||||
| 1,698 | SeaChange International, Inc. |
13,958 | ||||||||||||
| 4,192 | Semtech, (3) |
114,274 | ||||||||||||
| 676 | ServiceSource International Inc., (2) |
11,208 | ||||||||||||
| 3,031 | ShoreTel, (3) |
14,518 | ||||||||||||
| 2,043 | Sigma Designs, (3) |
11,257 | ||||||||||||
| 1,991 | Silicon Graphics International, (2), (3) |
18,795 | ||||||||||||
| 5,108 | Silicon Image, (2) |
30,648 | ||||||||||||
| 2,304 | Smith Micro Software, Inc. |
4,631 | ||||||||||||
| 76 | Nuveen Investments |
| Shares | Description (1) | Value | ||||||||||||
| Information Technology (continued) |
||||||||||||||
| 3,661 | Solarwinds, Inc., (2) |
$ | 171,738 | |||||||||||
| 13,558 | Sonus Networks, Inc. |
38,369 | ||||||||||||
| 1,827 | Sourcefire, (2), (3) |
93,159 | ||||||||||||
| 3,233 | Spansion Inc., Class A, (2), (3) |
38,990 | ||||||||||||
| 542 | SPS Commerce, (2), (3) |
15,078 | ||||||||||||
| 774 | SRS Labs, (3) |
7,376 | ||||||||||||
| 1,621 | SS&C Technologies Holdings Inc., (2) |
38,531 | ||||||||||||
| 681 | Stamps.com, (3) |
19,769 | ||||||||||||
| 1,371 | Standard Microsystems Corporation, (2) |
36,304 | ||||||||||||
| 2,363 | STEC Inc. |
19,589 | ||||||||||||
| 1,942 | STR Holdings Inc., (2) |
7,418 | ||||||||||||
| 1,357 | Stratasys, Inc. |
69,492 | ||||||||||||
| 1,819 | Super Micro Computer Inc., (2) |
32,105 | ||||||||||||
| 616 | Supertex Inc. |
12,610 | ||||||||||||
| 3,116 | support.com, Inc., (2) |
11,311 | ||||||||||||
| 1,284 | Sycamore Networks, Inc. |
20,018 | ||||||||||||
| 2,779 | Symmetricom Inc. |
15,451 | ||||||||||||
| 2,067 | Synaptics, Inc., (2) |
63,478 | ||||||||||||
| 1,698 | Synchronoss Technologies, (2), (3) |
53,147 | ||||||||||||
| 1,616 | SYNNEX Corporation, (2) |
61,553 | ||||||||||||
| 989 | Syntel Inc. |
59,231 | ||||||||||||
| 4,722 | Take-Two Interactive Software, (3) |
66,580 | ||||||||||||
| 659 | Tangoe Inc., (2) |
13,496 | ||||||||||||
| 938 | TechTarget Inc., (2) |
6,979 | ||||||||||||
| 2,981 | TeleCommunication Systems, (2) |
5,753 | ||||||||||||
| 1,059 | TeleNav, (2), (3) |
7,169 | ||||||||||||
| 1,629 | TeleTech Holdings, Inc. |
24,679 | ||||||||||||
| 3,285 | Tessera Technologies Inc. |
51,377 | ||||||||||||
| 4,371 | THQ, (3) |
2,961 | ||||||||||||
| 7,660 | TiVo, Inc., (2) |
82,651 | ||||||||||||
| 1,637 | TNS Inc. |
33,395 | ||||||||||||
| 356 | Travelzoo, (2), (3) |
9,242 | ||||||||||||
| 10,550 | TriQuint Semiconductor, Inc., (2) |
51,484 | ||||||||||||
| 3,339 | TTM Technologies, (2), (3) |
34,492 | ||||||||||||
| 1,909 | Tyler Technologies Inc. |
76,265 | ||||||||||||
| 560 | Ubiquiti Networks, (2), (3) |
18,491 | ||||||||||||
| 1,660 | Ultimate Software Group, (2), (3) |
128,086 | ||||||||||||
| 1,462 | Ultra Clean Holdings, Inc., (2) |
10,015 | ||||||||||||
| 1,615 | Ultratech Stepper Inc. |
51,583 | ||||||||||||
| 2,765 | Unisys, (3) |
51,595 | ||||||||||||
| 5,696 | United Online, Inc. |
26,999 | ||||||||||||
| 2,471 | Universal Display, (2), (3) |
111,121 | ||||||||||||
| 5,056 | ValueClick, Inc., (2) |
107,086 | ||||||||||||
| 1,736 | Vasco Data Security International, Inc., (2) |
13,523 | ||||||||||||
| 2,617 | Veeco Instruments, (3) |
79,007 | ||||||||||||
| Nuveen Investments | 77 |
Portfolio of Investments (Unaudited)
Nuveen Small Cap Index Fund (continued)
April 30, 2012
| Shares | Description (1) | Value | ||||||||||||
| Information Technology (continued) |
||||||||||||||
| 1,361 | Verint Systems Inc., (2) |
$ | 41,157 | |||||||||||
| 2,330 | ViaSat, (2), (3) |
112,539 | ||||||||||||
| 184 | Viasystems Group Inc., (2) |
4,101 | ||||||||||||
| 2,616 | VirnetX Holding, (2), (3) |
64,981 | ||||||||||||
| 972 | Virtusa Corporation, (2) |
14,667 | ||||||||||||
| 791 | Vishay Precision Group, (2), (3) |
11,454 | ||||||||||||
| 1,132 | Vocus, (2), (3) |
14,637 | ||||||||||||
| 1,578 | Volterra Semiconductor, (3) |
51,900 | ||||||||||||
| 5,323 | Wave Systems, (3) |
7,612 | ||||||||||||
| 1,868 | Web.com, Inc., (2) |
24,191 | ||||||||||||
| 2,422 | Websense Inc. |
50,232 | ||||||||||||
| 3,411 | Westell Technologies Inc., Class A |
7,777 | ||||||||||||
| 2,482 | Wright Express, (2), (3) |
158,401 | ||||||||||||
| 1,841 | XO Group Inc. |
17,066 | ||||||||||||
| 1,695 | X-Rite, Inc. |
9,390 | ||||||||||||
| 1,820 | Xyratex Limited |
26,426 | ||||||||||||
| 244 | Zilow Inc, (2) |
8,508 | ||||||||||||
| 4,266 | Zix Corporation, (2) |
12,071 | ||||||||||||
| 1,021 | Zygo Corporation |
20,204 | ||||||||||||
| Total Information Technology |
12,742,635 | |||||||||||||
| Materials – 4.4% |
||||||||||||||
| 1,982 | A Schulman, Inc. |
48,777 | ||||||||||||
| 276 | AEP Industries, Inc. |
9,624 | ||||||||||||
| 1,074 | AM Castle & Company, (3) |
14,381 | ||||||||||||
| 1,566 | AMCOL International, (3) |
51,615 | ||||||||||||
| 1,436 | American Vanguard, (3) |
35,900 | ||||||||||||
| 1,792 | Apex Silver Mines, (3) |
13,386 | ||||||||||||
| 1,854 | Balchem Corporation |
53,581 | ||||||||||||
| 5,874 | Boise, (3) |
44,877 | ||||||||||||
| 2,563 | Buckeye Technologies, (3) |
83,067 | ||||||||||||
| 3,629 | Calgon Carbon Corporation |
50,225 | ||||||||||||
| 3,313 | Century Aluminum, (3) |
30,480 | ||||||||||||
| 412 | Chase Corporation, Common Stock |
6,118 | ||||||||||||
| 6,188 | Chemtura Corporation |
105,320 | ||||||||||||
| 1,481 | Clearwater Paper, (2), (3) |
48,829 | ||||||||||||
| 5,752 | Coeur d’Alene Mines, (3) |
123,956 | ||||||||||||
| 693 | Deltic Timber, (3) |
42,328 | ||||||||||||
| 2,858 | Eagle Materials Inc. |
100,659 | ||||||||||||
| 5,562 | Ferro |
28,867 | ||||||||||||
| 3,209 | Flotek Industries, (3) |
43,771 | ||||||||||||
| 1,199 | FutureFuel, (3) |
11,798 | ||||||||||||
| 4,332 | General Moly, (3) |
14,036 | ||||||||||||
| 2,183 | Georgia Gulf, (3) |
77,387 | ||||||||||||
| 2,803 | Glatfelter, (3) |
43,671 | ||||||||||||
| 4,050 | Globe Specialty Metals Inc. |
54,027 | ||||||||||||
| 78 | Nuveen Investments |
| Shares | Description (1) | Value | ||||||||||||
| Materials (continued) |
||||||||||||||
| 1,826 | Gold Resource, (3) |
$ | 49,521 | |||||||||||
| 16,612 | Golden Star Resources, (2), (3) |
25,416 | ||||||||||||
| 10,269 | Graphic Packaging Holding, (3) |
54,939 | ||||||||||||
| 517 | GSE Holdings Inc. |
6,540 | ||||||||||||
| 3,176 | H.B. Fuller, (3) |
104,490 | ||||||||||||
| 376 | Handy & Harman Limited |
5,441 | ||||||||||||
| 559 | Hawkins Inc |
19,414 | ||||||||||||
| 784 | Haynes International Inc. |
48,898 | ||||||||||||
| 3,907 | Headwater, (2), (3) |
16,956 | ||||||||||||
| 17,939 | Hecla Mining, (3) |
76,779 | ||||||||||||
| 2,807 | Horsehead Holding, (3) |
31,523 | ||||||||||||
| 1,395 | Innophos Holdings, Inc. |
68,592 | ||||||||||||
| 1,523 | Innospec, Inc., (2) |
46,040 | ||||||||||||
| 5,422 | Jaguar Mining, (2), (3) |
14,694 | ||||||||||||
| 1,046 | Kaiser Aluminum, (3) |
54,988 | ||||||||||||
| 2,511 | KapStone Paper and Packaging Corp., (2) |
45,349 | ||||||||||||
| 460 | KMG Chemicals, Inc. |
7,930 | ||||||||||||
| 1,324 | Koppers Holdings, (3) |
51,477 | ||||||||||||
| 2,050 | Kraton Performance Polymers, (2), (3) |
53,300 | ||||||||||||
| 1,695 | Landec Corporation |
10,916 | ||||||||||||
| 8,490 | Louisiana-Pacific Corporation |
76,835 | ||||||||||||
| 1,179 | LSB Industries Inc. |
39,992 | ||||||||||||
| 1,312 | Materion Corporation |
32,420 | ||||||||||||
| 6,773 | Mcewen Mining inc |
25,670 | ||||||||||||
| 745 | Metals USA Holdings Corporation, (2) |
11,235 | ||||||||||||
| 5,509 | Midway Gold, (3) |
7,933 | ||||||||||||
| 1,173 | Minerals Technologies, (3) |
78,708 | ||||||||||||
| 1,923 | Myers Industries, Inc. |
31,787 | ||||||||||||
| 959 | Neenah Paper, Inc. |
27,389 | ||||||||||||
| 580 | NewMarket, (3) |
129,468 | ||||||||||||
| 1,460 | Noranda Aluminum Hodlings Corporation |
15,505 | ||||||||||||
| 5,120 | Olin Corporation |
107,315 | ||||||||||||
| 587 | Olympic Steel Inc. |
12,403 | ||||||||||||
| 1,991 | OM Group Inc., (2) |
48,023 | ||||||||||||
| 2,907 | OMNOVA Solutions Inc. |
22,791 | ||||||||||||
| 7,526 | Paramount Gold and Silver, (2), (3) |
18,363 | ||||||||||||
| 6,001 | PolyOne Corporation |
83,174 | ||||||||||||
| 822 | Quaker Chemical Corporation |
35,675 | ||||||||||||
| 1,609 | Revett Minerals Inc |
6,388 | ||||||||||||
| 1,939 | RTI International Metals, Inc., (2) |
47,602 | ||||||||||||
| 1,035 | Schweitzer-Mauduit International Inc. |
70,194 | ||||||||||||
| 2,543 | Senomyx, Inc., (2) |
5,569 | ||||||||||||
| 3,216 | Sensient Technologies Corporation |
119,474 | ||||||||||||
| 1,983 | Sparetech Corporation |
9,677 | ||||||||||||
| 520 | Stepan, (3) |
47,247 | ||||||||||||
| Nuveen Investments | 79 |
Portfolio of Investments (Unaudited)
Nuveen Small Cap Index Fund (continued)
April 30, 2012
| Shares | Description (1) | Value | ||||||||||||
| Materials (continued) |
||||||||||||||
| 7,405 | Stillwater Mining Company, (2) |
$ | 79,456 | |||||||||||
| 4,539 | SunCoke Energy, (2), (3) |
69,084 | ||||||||||||
| 1,463 | Texas Industries, (3) |
49,171 | ||||||||||||
| 9,814 | Thompson Creek Metals Company Inc., (2) |
58,197 | ||||||||||||
| 853 | TPC Group Inc., (2) |
35,809 | ||||||||||||
| 1,533 | Tredegar Corporation |
26,598 | ||||||||||||
| 166 | United States Lime & Minerals, Inc. |
7,963 | ||||||||||||
| 456 | Universal Stainless & Alloy Products, Inc. |
21,158 | ||||||||||||
| 1,586 | U.S. Energy Corporation |
4,155 | ||||||||||||
| 756 | U.S. Silca Holdings, (3) |
13,699 | ||||||||||||
| 961 | Verso Paper Corporation, (2) |
1,586 | ||||||||||||
| 4,565 | Vista Gold, (3) |
13,786 | ||||||||||||
| 3,159 | Wausau Paper Corp. |
28,621 | ||||||||||||
| 3,453 | Worthington Industries, Inc. |
61,602 | ||||||||||||
| 1,410 | Zep Inc. |
20,091 | ||||||||||||
| 1,784 | Zoltek Companies, (2), (3) |
19,676 | ||||||||||||
| Total Materials |
3,551,372 | |||||||||||||
| Telecommunication Services – 0.7% |
||||||||||||||
| 3,990 | 8X8, Inc. |
16,479 | ||||||||||||
| 1,406 | Abovenet Communications, (2) |
116,937 | ||||||||||||
| 2,903 | Alaska Communications Systems Group Inc. |
7,432 | ||||||||||||
| 603 | Atlantic Tele-Network, Inc. |
20,538 | ||||||||||||
| 370 | Boingo Wireless Inc. |
3,896 | ||||||||||||
| 1,795 | Cbeyond Inc. |
11,542 | ||||||||||||
| 12,773 | Cincinnati Bell, (3) |
48,537 | ||||||||||||
| 2,954 | Cogent Communications Group, Inc., (2) |
55,328 | ||||||||||||
| 1,559 | Consolidated Communications Holdings, Inc. |
30,167 | ||||||||||||
| 1,386 | FairPoint Communications, (3) |
6,417 | ||||||||||||
| 2,663 | General Communication, Inc. |
20,239 | ||||||||||||
| 6,571 | Globalstar, (3) |
3,483 | ||||||||||||
| 858 | Hickory Tech Corporation |
8,520 | ||||||||||||
| 892 | IDT Corporation |
7,511 | ||||||||||||
| 1,971 | inContact, (2), (3) |
10,742 | ||||||||||||
| 2,800 | Iridium Communications, (2), (3) |
24,612 | ||||||||||||
| 3,924 | Leap Wireless International, (3) |
22,014 | ||||||||||||
| 966 | Lumos Networks Corporation |
8,733 | ||||||||||||
| 2,019 | Neutral Tandem Inc., (2) |
23,461 | ||||||||||||
| 966 | NTELOS Holdings Corp |
19,533 | ||||||||||||
| 2,226 | Orbcomm, Inc., (2) |
7,257 | ||||||||||||
| 3,356 | Premiere Global Services, Inc. |
30,036 | ||||||||||||
| 1,527 | Shenandoah Telecommunications Company |
17,026 | ||||||||||||
| 903 | SureWest Communications |
20,390 | ||||||||||||
| 2,720 | TowerStream, (3) |
12,485 | ||||||||||||
| 1,420 | USA Mobility Inc. |
18,344 | ||||||||||||
| 8,906 | Vonage Holdings Corporation, (2) |
18,166 | ||||||||||||
| Total Telecommunication Services |
589,825 | |||||||||||||
| 80 | Nuveen Investments |
| Shares | Description (1) | Value | ||||||||||||
| Utilities – 3.1% |
||||||||||||||
| 2,048 | ALLETE Inc |
$ | 84,398 | |||||||||||
| 1,079 | American States Water Co |
39,319 | ||||||||||||
| 468 | Artesian Resources Corporation |
8,934 | ||||||||||||
| 7,180 | Atlantic Power Corporation |
102,530 | ||||||||||||
| 3,702 | Avista Corporation |
97,881 | ||||||||||||
| 2,533 | Black Hills Corporation |
83,614 | ||||||||||||
| 774 | Cadiz, (3) |
6,525 | ||||||||||||
| 2,683 | California Water Service Group |
48,589 | ||||||||||||
| 829 | Central Vermont Public Service, (3) |
29,222 | ||||||||||||
| 999 | CH Energy Group, (3) |
65,554 | ||||||||||||
| 614 | Chesapeake Utilities Corporation |
25,800 | ||||||||||||
| 3,854 | Cleco, (3) |
157,243 | ||||||||||||
| 552 | Connecticut Water Service, Inc. |
15,318 | ||||||||||||
| 935 | Consolidated Water Company, Limited |
6,704 | ||||||||||||
| 6,616 | Dynegy Inc., (2) |
2,713 | ||||||||||||
| 2,706 | El Paso Electric, (3) |
82,912 | ||||||||||||
| 2,685 | Empire District Electric Company |
55,096 | ||||||||||||
| 892 | Genie Energy Ltd Cl B |
7,421 | ||||||||||||
| 3,185 | IDACORP, INC |
129,757 | ||||||||||||
| 1,296 | Laclede Group Inc. |
51,036 | ||||||||||||
| 1,485 | MGE Energy, Inc. |
67,924 | ||||||||||||
| 1,001 | Middlesex Water Company |
18,579 | ||||||||||||
| 2,623 | New Jersey Resources Corporation |
113,419 | ||||||||||||
| 1,713 | Northwest Natural Gas Company |
78,284 | ||||||||||||
| 2,329 | Northwestern, (3) |
82,726 | ||||||||||||
| 1,153 | Ormat Technologies, (3) |
22,795 | ||||||||||||
| 2,316 | Otter Tail Power, (3) |
50,859 | ||||||||||||
| 4,612 | Piedmont Natural Gas, (3) |
140,574 | ||||||||||||
| 5,117 | PNM Resources Inc. |
95,995 | ||||||||||||
| 4,839 | Portland General Electric, (3) |
124,991 | ||||||||||||
| 905 | SJW, (3) |
21,811 | ||||||||||||
| 1,924 | South Jersey Industries, (3) |
94,757 | ||||||||||||
| 2,945 | Southwest Gas, (3) |
123,749 | ||||||||||||
| 3,246 | UIL Holdings, (3) |
111,565 | ||||||||||||
| 2,358 | Unisource Energy Corporation |
85,831 | ||||||||||||
| 702 | Unitil Corp. |
18,575 | ||||||||||||
| 3,291 | WGL Holdings Inc. |
132,000 | ||||||||||||
| 817 | York Water Company |
14,272 | ||||||||||||
| Total Utilities |
2,499,272 | |||||||||||||
| Total Common Stocks (cost $62,200,646) |
77,064,704 | |||||||||||||
| Shares | Description (1) | Value | ||||||||||||
| RIGHTS – 0.0% |
||||||||||||||
| 692 | Clinical Data, Inc., (4) |
$ | — | |||||||||||
| 1,493 | Gerber Scientific, (4) |
— | ||||||||||||
| Total Rights (cost $0) |
— | |||||||||||||
| Nuveen Investments | 81 |
Portfolio of Investments (Unaudited)
Nuveen Small Cap Index Fund (continued)
April 30, 2012
| Shares | Description (1) | Value | ||||||||||||||||||
| WARRANTS – 0.0% |
||||||||||||||||||||
| 644 | Magnum Hunter Resources Warrants, (4) |
$ | 473 | |||||||||||||||||
| Total Warrants (cost $0) |
473 | |||||||||||||||||||
| Shares | Description (1) | Value | ||||||||||||||||||
| INVESTMENTS PURCHASED WITH COLLATERAL FROM SECURITIES LENDING – 47.0% |
|
|||||||||||||||||||
| Money Market Funds – 47.0% |
||||||||||||||||||||
| 37,587,463 | Mount Vernon Securities Lending Prime Portfolio, 0.276%, (5), (6) |
$ | 37,587,463 | |||||||||||||||||
| Total Investments Purchased with Collateral From Securities Lending (cost $37,587,463) |
|
37,587,463 | ||||||||||||||||||
| Shares/ Principal Amount (000) |
Description (1) | Coupon | Maturity |
Ratings (7) | Value | |||||||||||||||
| SHORT-TERM INVESTMENTS – 4.2% |
||||||||||||||||||||
| Money Market Funds – 3.4% |
||||||||||||||||||||
| 2,725,729 | First American Treasury Obligations Fund |
0.000% | (5) | N/A | N/A | $ | 2,725,729 | |||||||||||||
| U.S. Government and Agency Obligations – 0.8% |
||||||||||||||||||||
| $ | 620 | U.S. Treasury Bill, (8) |
0.022% | 9/20/12 | Aaa | 619,688 | ||||||||||||||
| Total Short-Term Investments (cost $3,345,557) |
3,345,417 | |||||||||||||||||||
| Total Investments (cost $103,133,666) – 147.4% |
117,998,057 | |||||||||||||||||||
| Other Assets Less Liabilities – (47.4)% (9) |
(37,970,433) | |||||||||||||||||||
| Net Assets – 100% |
$ | 80,027,624 | ||||||||||||||||||
Investments in Derivatives at April 30, 2012
Futures Contracts outstanding:
| Type | Contract Position |
Number of Contracts |
Contract Expiration |
Value | Unrealized Appreciation (Depreciation) |
|||||||||||||||
| Russell 2000 Mini Index |
Long | 37 | 6/12 | $ | 3,015,130 | $ | 31,361 | |||||||||||||
| For Fund portfolio compliance purposes, the Fund’s industry classifications refer to any one or more of the industry sub-classifications used by one or more widely recognized market indexes or ratings group indexes, and/or as defined by the Fund management. This definition may not apply for purposes of this report which may combine industry sub-classifications into sectors for reporting ease. |
| (1) | All percentages shown in the Portfolio of Investments are based on net assets. |
| (2) | Non-income producing; issuer has not declared a dividend within the past twelve months. |
| (3) | Investment, or portion of investment, is out on loan for securities lending. |
| (4) | Investment valued at fair value using methods determined in good faith by, or at the discretion of, the Board of Directors. For fair value measurement disclosure purposes, investment categorized as Level 3. See Notes to Financial Statements Footnote 1 – General Information and Significant Accounting Policies, Investment Valuation for more information. |
| (5) | The rate shown is the annualized seven-day effective yield as of April 30, 2012. |
| (6) | The Fund may loan securities representing up to one third of the fair value of its total assets (which includes collateral for securities on loan) to broker dealers, banks, and other institutions. The Fund maintains collateral equal to at least 102% of the fair value of the securities loaned. The cash collateral received by the Fund is invested in this money market fund. See Notes to Financial Statements, Footnote 1 - General Information and Significant Accounting Policies, Securities Lending for more information. |
| (7) | Ratings: Using the highest of Standard & Poor’s Group (“Standard & Poor’s”), Moody’s Investors Service, Inc. (“Moody’s”) or Fitch, Inc. (“Fitch”) rating. Ratings below BBB by Standard & Poor’s, Baa by Moody’s or BBB by Fitch are considered to be below investment grade. Holdings designated N/R are not rated by any of these national rating agencies. |
| (8) | Investment, or portion of investment, segregated as collateral for investments in derivatives. |
| (9) | Other Assets Less Liabilities includes the Net Unrealized Appreciation (Depreciation) of derivative instruments as noted within Investments in Derivatives at April 30, 2012. |
| N/A | Not applicable |
See accompanying notes to financial statements.
| 82 | Nuveen Investments |
Statement of Assets & Liabilities (Unaudited)
April 30, 2012
| Equity Index |
Mid Cap Index |
Small Cap Index |
||||||||||
| Assets |
||||||||||||
| Investments, at value (cost $422,803,537, $309,899,990, |
$ | 768,263,493 | $ | 370,617,602 | $ | 80,410,594 | ||||||
| Investments purchased with collateral from securities lending (at cost, which approximates value) |
91,559,442 | 131,577,685 | 37,587,463 | |||||||||
| Cash |
2,687 | — | 141 | |||||||||
| Receivables: |
||||||||||||
| Dividends |
742,692 | 154,872 | 31,001 | |||||||||
| Due from broker |
19,803 | 26,823 | 16,875 | |||||||||
| From Adviser |
— | — | 45,604 | |||||||||
| Investments sold |
— | — | 1,914 | |||||||||
| Shares sold |
651,798 | 520,072 | 61,902 | |||||||||
| Other assets |
7,522 | 3,050 | 101 | |||||||||
| Total assets |
861,247,437 | 502,900,104 | 118,155,595 | |||||||||
| Liabilities |
||||||||||||
| Payables: |
||||||||||||
| Collateral from securities lending program |
91,559,442 | 131,577,685 | 37,587,463 | |||||||||
| Investments purchased |
— | — | 99,961 | |||||||||
| Shares redeemed |
1,181,913 | 1,770,751 | 283,747 | |||||||||
| Variation margin on futures contracts |
80,850 | 223,517 | 32,930 | |||||||||
| Accrued expenses: |
||||||||||||
| Management fees |
124,559 | 60,117 | — | |||||||||
| 12b-1 distribution and service fees |
47,931 | 61,725 | 13,431 | |||||||||
| Other |
385,436 | 198,466 | 110,439 | |||||||||
| Total liabilities |
93,380,131 | 133,892,261 | 38,127,971 | |||||||||
| Net assets |
$ | 767,867,306 | $ | 369,007,843 | $ | 80,027,624 | ||||||
| Class A Shares |
||||||||||||
| Net assets |
$ | 134,802,264 | $ | 95,171,414 | $ | 25,383,019 | ||||||
| Shares outstanding |
6,096,582 | 6,878,012 | 2,204,219 | |||||||||
| Net asset value and offering price per share |
$ | 22.11 | $ | 13.84 | $ | 11.52 | ||||||
| Class B Shares |
||||||||||||
| Net assets |
$ | 3,309,618 | N/A | N/A | ||||||||
| Shares outstanding |
152,311 | N/A | N/A | |||||||||
| Net asset value and offering price per share |
$ | 21.73 | N/A | N/A | ||||||||
| Class C Shares |
||||||||||||
| Net assets |
$ | 8,529,876 | $ | 3,434,650 | $ | 1,219,333 | ||||||
| Shares outstanding |
389,649 | 256,111 | 110,346 | |||||||||
| Net asset value and offering price per share |
$ | 21.89 | $ | 13.41 | $ | 11.05 | ||||||
| Class R3 Shares |
||||||||||||
| Net assets |
$ | 27,428,964 | $ | 99,527,329 | $ | 17,802,728 | ||||||
| Shares outstanding |
1,243,113 | 7,271,959 | 1,582,188 | |||||||||
| Net asset value and offering price per share |
$ | 22.06 | $ | 13.69 | $ | 11.25 | ||||||
| Class I Shares |
||||||||||||
| Net assets |
$ | 593,796,584 | $ | 170,874,450 | $ | 35,622,544 | ||||||
| Shares outstanding |
26,864,295 | 12,313,767 | 3,088,466 | |||||||||
| Net asset value and offering price per share |
$ | 22.10 | $ | 13.88 | $ | 11.53 | ||||||
| Net assets consist of: |
||||||||||||
| Capital paid-in |
$ | 425,532,163 | $ | 300,203,257 | $ | 63,850,543 | ||||||
| Undistributed (Over-distribution of) net investment income |
1,732,028 | 1,248,144 | 408,776 | |||||||||
| Accumulated net realized gain (loss) |
(5,200,490 | ) | 6,317,199 | 872,553 | ||||||||
| Net unrealized appreciation (depreciation) |
345,803,605 | 61,239,243 | 14,895,752 | |||||||||
| Net assets |
$ | 767,867,306 | $ | 369,007,843 | $ | 80,027,624 | ||||||
| Authorized shares |
$ | 2 billion | $ | 2 billion | $ | 2 billion | ||||||
| Par value per share |
$ | 0.0001 | $ | 0.0001 | $ | 0.0001 | ||||||
| N/A | - Mid Cap Index and Small Cap Index do not offer Class B Shares. |
See accompanying notes to financial statements.
| Nuveen Investments | 83 |
Statement of Operations (Unaudited)
Six Months Ended April 30, 2012
| Equity Index |
Mid Cap Index |
Small Cap Index |
||||||||||
| Investment Income |
||||||||||||
| Dividend and interest income |
$ | 7,846,099 | $ | 2,268,481 | $ | 610,625 | ||||||
| Securities lending income |
136,174 | 113,422 | 93,432 | |||||||||
| Total investment income |
7,982,273 | 2,381,903 | 704,057 | |||||||||
| Expenses |
||||||||||||
| Management fees |
1,015,809 | 542,697 | 130,282 | |||||||||
| 12b-1 service fees – Class A |
157,513 | 101,288 | 28,147 | |||||||||
| 12b-1 distribution and service fees – Class B |
18,610 | N/A | N/A | |||||||||
| 12b-1 distribution and service fees – Class C |
41,479 | 16,945 | 6,655 | |||||||||
| 12b-1 distribution and service fees – Class R3 |
49,315 | 200,362 | 36,834 | |||||||||
| Shareholders’ servicing agent fees and expenses |
456,660 | 243,766 | 71,237 | |||||||||
| Custodian’s fees and expenses |
75,960 | 39,917 | 69,444 | |||||||||
| Directors’ fees and expenses |
10,415 | 4,809 | 1,237 | |||||||||
| Professional fees |
33,268 | 11,127 | 2,909 | |||||||||
| Shareholders’ reports – printing and mailing expenses |
33,245 | 33,702 | 15,291 | |||||||||
| Federal and state registration fees |
33,387 | 29,857 | 26,646 | |||||||||
| Other expenses |
20,724 | 15,848 | 57,832 | |||||||||
| Total expenses before expense reimbursement |
1,946,385 | 1,240,318 | 446,514 | |||||||||
| Expense reimbursement |
(325,071 | ) | (115,857 | ) | (158,066 | ) | ||||||
| Net expenses |
1,621,314 | 1,124,461 | 288,448 | |||||||||
| Net investment income (loss) |
6,360,959 | 1,257,442 | 415,609 | |||||||||
| Realized and Unrealized Gain (Loss) |
||||||||||||
| Net realized gain (loss) from: |
||||||||||||
| Investments |
7,071,942 | 5,844,098 | 1,514,050 | |||||||||
| Futures contracts |
3,435,676 | 2,801,870 | 779,219 | |||||||||
| Change in net unrealized appreciation (depreciation) of: |
||||||||||||
| Investments |
70,066,542 | 28,313,397 | 5,313,967 | |||||||||
| Futures contracts |
(916,544 | ) | (984,639 | ) | (396,814 | ) | ||||||
| Net realized and unrealized gain (loss) |
79,657,616 | 35,974,726 | 7,210,422 | |||||||||
| Net increase (decrease) in net assets from operations |
$ | 86,018,575 | $ | 37,232,168 | $ | 7,626,031 | ||||||
| N/A | - Mid Cap Index and Small Cap Index do not offer Class B Shares. |
See accompanying notes to financial statements.
| 84 | Nuveen Investments |
Statement of Changes in Net Assets (Unaudited)
| Equity Index | Mid Cap Index | Small Cap Index | ||||||||||||||||||||||
| Six Months Ended 4/30/12 |
Year Ended 10/31/11 |
Six Months Ended 4/30/12 |
Year Ended 10/31/11 |
Six Months Ended 4/30/12 |
Year Ended 10/31/11 |
|||||||||||||||||||
| Operations |
||||||||||||||||||||||||
| Net investment income (loss) |
$ | 6,360,959 | $ | 13,093,288 | $ | 1,257,442 | $ | 1,434,382 | $ | 415,609 | $ | 447,200 | ||||||||||||
| Net realized gain (loss) from: |
||||||||||||||||||||||||
| Investments |
7,071,942 | 58,398,975 | 5,844,098 | 13,741,841 | 1,514,050 | 4,825,288 | ||||||||||||||||||
| Redemptions in-kind |
— | — | — | 12,782,287 | — | — | ||||||||||||||||||
| Futures contracts |
3,435,676 | 5,310,055 | 2,801,870 | (64,670 | ) | 779,219 | 122,307 | |||||||||||||||||
| Change in net unrealized appreciation (depreciation) of: |
||||||||||||||||||||||||
| Investments |
70,066,542 | (3,757,384 | ) | 28,313,397 | (7,925,562 | ) | 5,313,967 | (1,255,772 | ) | |||||||||||||||
| Futures contracts |
(916,544 | ) | (1,852,673 | ) | (984,639 | ) | 652,897 | (396,814 | ) | 142,782 | ||||||||||||||
| Net increase (decrease) in net assets from operations |
86,018,575 | 71,192,261 | 37,232,168 | 20,621,175 | 7,626,031 | 4,281,805 | ||||||||||||||||||
| Distributions to Shareholders |
||||||||||||||||||||||||
| From net investment income: |
||||||||||||||||||||||||
| Class A |
(1,062,578 | ) | (1,489,537 | ) | (147,244 | ) | (255,665 | ) | (58,683 | ) | (79,811 | ) | ||||||||||||
| Class B |
(17,177 | ) | (24,352 | ) | N/A | N/A | N/A | N/A | ||||||||||||||||
| Class C |
(38,733 | ) | (40,098 | ) | — | — | — | — | ||||||||||||||||
| Class R3 (1) |
(140,986 | ) | (139,184 | ) | — | (147,814 | ) | (3,152 | ) | (21,831 | ) | |||||||||||||
| Class I (1) |
(5,505,496 | ) | (9,731,593 | ) | (747,683 | ) | (1,447,609 | ) | (200,814 | ) | (383,837 | ) | ||||||||||||
| From accumulated net realized gains: |
||||||||||||||||||||||||
| Class A |
(8,608,834 | ) | (7,600,953 | ) | (2,675,890 | ) | — | — | — | |||||||||||||||
| Class B |
(285,612 | ) | (448,229 | ) | N/A | N/A | N/A | N/A | ||||||||||||||||
| Class C |
(609,468 | ) | (542,775 | ) | (124,428 | ) | — | — | — | |||||||||||||||
| Class R3 (1) |
(1,132,075 | ) | (993,813 | ) | (2,645,479 | ) | — | — | — | |||||||||||||||
| Class I (1) |
(42,337,058 | ) | (46,368,020 | ) | (6,112,513 | ) | — | — | — | |||||||||||||||
| Decrease in net assets from distributions to shareholders |
(59,738,017 | ) | (67,378,554 | ) | (12,453,237 | ) | (1,851,088 | ) | (262,649 | ) | (485,479 | ) | ||||||||||||
| Fund Share Transactions |
||||||||||||||||||||||||
| Proceeds from sale of shares |
79,307,356 | 107,954,328 | 82,320,891 | 151,236,153 | 16,785,253 | 31,404,088 | ||||||||||||||||||
| Proceeds from shares issued to shareholders due to reinvestment of distributions |
44,648,195 | 47,057,562 | 9,328,782 | 994,125 | 162,716 | 265,209 | ||||||||||||||||||
| 123,955,551 | 155,011,890 | 91,649,673 | 152,230,278 | 16,947,969 | 31,669,297 | |||||||||||||||||||
| Cost of redemptions in-kind |
— | — | — | (35,014,943 | ) | — | — | |||||||||||||||||
| Cost of shares redeemed |
(125,277,104 | ) | (313,869,062 | ) | (54,812,798 | ) | (97,192,823 | ) | (16,978,806 | ) | (29,056,893 | ) | ||||||||||||
| Net increase (decrease) in net assets from Fund share transactions |
(1,321,553 | ) | (158,857,172 | ) | 36,836,875 | 20,022,512 | (30,837 | ) | 2,612,404 | |||||||||||||||
| Net increase (decrease) in net assets |
24,959,005 | (155,043,465 | ) | 61,615,806 | 38,792,599 | 7,332,545 | 6,408,730 | |||||||||||||||||
| Net assets at the beginning of period |
742,908,301 | 897,951,766 | 307,392,037 | 268,599,438 | 72,695,079 | 66,286,349 | ||||||||||||||||||
| Net assets at the end of period |
$ | 767,867,306 | $ | 742,908,301 | $ | 369,007,843 | $ | 307,392,037 | $ | 80,027,624 | $ | 72,695,079 | ||||||||||||
| Undistributed (Over-distribution of) net investment income at the end of period |
$ | 1,732,028 | $ | 2,136,039 | $ | 1,248,144 | $ | 885,629 | $ | 408,776 | $ | 255,816 | ||||||||||||
| N/A | - Mid Cap Index and Small Cap Index do not offer Class B Shares. |
| (1) | - Effective January 18, 2011, Class R Shares and Class Y Shares previously offered by FAF Advisors, Inc. were renamed Class R3 Shares and Class I Shares, respectively. |
See accompanying notes to financial statements.
| Nuveen Investments | 85 |
Financial Highlights (Unaudited)
| Selected data for a share outstanding throughout each period: | ||||||||||||||||||||||||||||||||
| Class (Commencement Date) | ||||||||||||||||||||||||||||||||
| Investment Operations | Less Distributions | |||||||||||||||||||||||||||||||
| EQUITY INDEX | ||||||||||||||||||||||||||||||||
| Year Ended October 31, |
Beginning Net Asset Value |
Net Invest- ment Income (Loss)(a) |
Net Realized/ Unrealized Gain (Loss) |
Total | Net Invest- ment Income |
Capital Gains(b) |
Total | Ending Net Asset Value |
||||||||||||||||||||||||
| Class A (12/92) |
|
|||||||||||||||||||||||||||||||
| 2012(f) |
$ | 21.44 | $ | .16 | $ | 2.25 | $ | 2.41 | $ | (.18 | ) | $ | (1.56 | ) | $ | (1.74 | ) | $ | 22.11 | |||||||||||||
| 2011 |
21.51 | .30 | 1.26 | 1.56 | (.26 | ) | (1.37 | ) | (1.63 | ) | 21.44 | |||||||||||||||||||||
| 2010 |
18.86 | .29 | 2.70 | 2.99 | (.30 | ) | (.04 | ) | (.34 | ) | 21.51 | |||||||||||||||||||||
| 2009 |
17.61 | .34 | 1.27 | 1.61 | (.36 | ) | — | (.36 | ) | 18.86 | ||||||||||||||||||||||
| 2008 |
28.67 | .42 | (10.57 | ) | (10.15 | ) | (.38 | ) | (.53 | ) | (.91 | ) | 17.61 | |||||||||||||||||||
| 2007 |
25.80 | .37 | 3.16 | 3.53 | (.36 | ) | (.30 | ) | (.66 | ) | 28.67 | |||||||||||||||||||||
| Class B (8/94) |
|
|||||||||||||||||||||||||||||||
| 2012(f) |
21.10 | .09 | 2.19 | 2.28 | (.09 | ) | (1.56 | ) | (1.65 | ) | 21.73 | |||||||||||||||||||||
| 2011 |
21.19 | .14 | 1.24 | 1.38 | (.10 | ) | (1.37 | ) | (1.47 | ) | 21.10 | |||||||||||||||||||||
| 2010 |
18.58 | .13 | 2.66 | 2.79 | (.14 | ) | (.04 | ) | (.18 | ) | 21.19 | |||||||||||||||||||||
| 2009 |
17.35 | .22 | 1.25 | 1.47 | (.24 | ) | — | (.24 | ) | 18.58 | ||||||||||||||||||||||
| 2008 |
28.27 | .24 | (10.42 | ) | (10.18 | ) | (.21 | ) | (.53 | ) | (.74 | ) | 17.35 | |||||||||||||||||||
| 2007 |
25.47 | .17 | 3.11 | 3.28 | (.18 | ) | (.30 | ) | (.48 | ) | 28.27 | |||||||||||||||||||||
| Class C (2/99) |
|
|||||||||||||||||||||||||||||||
| 2012(f) |
21.24 | .08 | 2.23 | 2.31 | (.10 | ) | (1.56 | ) | (1.66 | ) | 21.89 | |||||||||||||||||||||
| 2011 |
21.32 | .13 | 1.26 | 1.39 | (.10 | ) | (1.37 | ) | (1.47 | ) | 21.24 | |||||||||||||||||||||
| 2010 |
18.70 | .13 | 2.67 | 2.80 | (.14 | ) | (.04 | ) | (.18 | ) | 21.32 | |||||||||||||||||||||
| 2009 |
17.46 | .21 | 1.26 | 1.47 | (.23 | ) | — | (.23 | ) | 18.70 | ||||||||||||||||||||||
| 2008 |
28.45 | .24 | (10.48 | ) | (10.24 | ) | (.22 | ) | (.53 | ) | (.75 | ) | 17.46 | |||||||||||||||||||
| 2007 |
25.62 | .17 | 3.14 | 3.31 | (.18 | ) | (.30 | ) | (.48 | ) | 28.45 | |||||||||||||||||||||
| Class R3 (9/01)(e) |
|
|||||||||||||||||||||||||||||||
| 2012(f) |
21.40 | .13 | 2.24 | 2.37 | (.15 | ) | (1.56 | ) | (1.71 | ) | 22.06 | |||||||||||||||||||||
| 2011 |
21.47 | .25 | 1.26 | 1.51 | (.21 | ) | (1.37 | ) | (1.58 | ) | 21.40 | |||||||||||||||||||||
| 2010 |
18.83 | .23 | 2.70 | 2.93 | (.25 | ) | (.04 | ) | (.29 | ) | 21.47 | |||||||||||||||||||||
| 2009 |
17.58 | .29 | 1.28 | 1.57 | (.32 | ) | — | (.32 | ) | 18.83 | ||||||||||||||||||||||
| 2008 |
28.63 | .35 | (10.54 | ) | (10.19 | ) | (.33 | ) | (.53 | ) | (.86 | ) | 17.58 | |||||||||||||||||||
| 2007 |
25.77 | .29 | 3.17 | 3.46 | (.30 | ) | (.30 | ) | (.60 | ) | 28.63 | |||||||||||||||||||||
| Class I (2/94)(e) |
|
|||||||||||||||||||||||||||||||
| 2012(f) |
21.43 | .19 | 2.24 | 2.43 | (.20 | ) | (1.56 | ) | (1.76 | ) | 22.10 | |||||||||||||||||||||
| 2011 |
21.50 | .36 | 1.26 | 1.62 | (.32 | ) | (1.37 | ) | (1.69 | ) | 21.43 | |||||||||||||||||||||
| 2010 |
18.86 | .34 | 2.69 | 3.03 | (.35 | ) | (.04 | ) | (.39 | ) | 21.50 | |||||||||||||||||||||
| 2009 |
17.61 | .38 | 1.27 | 1.65 | (.40 | ) | — | (.40 | ) | 18.86 | ||||||||||||||||||||||
| 2008 |
28.66 | .48 | (10.56 | ) | (10.08 | ) | (.44 | ) | (.53 | ) | (.97 | ) | 17.61 | |||||||||||||||||||
| 2007 |
25.79 | .44 | 3.16 | 3.60 | (.43 | ) | (.30 | ) | (.73 | ) | 28.66 | |||||||||||||||||||||
| 86 | Nuveen Investments |
| Ratios/Supplemental Data | ||||||||||||||||||||||||||
| Ratios to Average Net Assets Before Reimbursement |
Ratios to Average Net Assets After Reimbursement(d) |
|||||||||||||||||||||||||
| Total Return(c) |
Ending Net Assets (000) |
Expenses | Net Invest- ment Income (Loss) |
Expenses | Net Invest- ment Income (Loss) |
Portfolio Turnover Rate |
||||||||||||||||||||
| 12.42 | % | $ | 134,802 | .71 | %* | 1.46 | %* | .62 | %* | 1.55 | %* | 1 | % | |||||||||||||
| 7.41 | 119,172 | .70 | 1.29 | .62 | 1.37 | 2 | ||||||||||||||||||||
| 15.94 | 119,761 | .79 | 1.23 | .61 | 1.41 | 4 | ||||||||||||||||||||
| 9.51 | 115,213 | .79 | 1.86 | .62 | 2.03 | 10 | ||||||||||||||||||||
| (36.35 | ) | 114,654 | .78 | 1.58 | .62 | 1.74 | 4 | |||||||||||||||||||
| 13.93 | 213,957 | .76 | 1.23 | .62 | 1.37 | 4 | ||||||||||||||||||||
| 12.00 | 3,310 | 1.46 | * | .75 | * | 1.37 | * | .84 | * | 1 | ||||||||||||||||
| 6.60 | 4,227 | 1.45 | .55 | 1.37 | .63 | 2 | ||||||||||||||||||||
| 15.07 | 7,351 | 1.54 | .49 | 1.36 | .67 | 4 | ||||||||||||||||||||
| 8.69 | 9,822 | 1.54 | 1.16 | 1.37 | 1.33 | 10 | ||||||||||||||||||||
| (36.82 | ) | 12,856 | 1.53 | .83 | 1.37 | .99 | 4 | |||||||||||||||||||
| 13.05 | 31,343 | 1.51 | .49 | 1.37 | .63 | 4 | ||||||||||||||||||||
| 12.02 | 8,530 | 1.46 | * | .72 | * | 1.37 | * | .81 | * | 1 | ||||||||||||||||
| 6.61 | 8,261 | 1.45 | .55 | 1.37 | .62 | 2 | ||||||||||||||||||||
| 15.05 | 8,651 | 1.54 | .48 | 1.36 | .66 | 4 | ||||||||||||||||||||
| 8.69 | 8,661 | 1.54 | 1.14 | 1.37 | 1.31 | 10 | ||||||||||||||||||||
| (36.83 | ) | 9,784 | 1.53 | .83 | 1.37 | .99 | 4 | |||||||||||||||||||
| 13.09 | 19,585 | 1.51 | .48 | 1.37 | .62 | 4 | ||||||||||||||||||||
| 12.26 | 27,429 | .97 | * | 1.15 | * | .87 | * | 1.24 | * | 1 | ||||||||||||||||
| 7.15 | 14,218 | .95 | 1.06 | .87 | 1.13 | 2 | ||||||||||||||||||||
| 15.63 | 12,979 | 1.04 | .97 | .86 | 1.15 | 4 | ||||||||||||||||||||
| 9.27 | 10,915 | 1.04 | 1.56 | .87 | 1.73 | 10 | ||||||||||||||||||||
| (36.51 | ) | 9,463 | 1.03 | 1.33 | .87 | 1.49 | 4 | |||||||||||||||||||
| 13.65 | 7,230 | 1.01 | .93 | .87 | 1.07 | 4 | ||||||||||||||||||||
| 12.56 | 593,797 | .46 | * | 1.73 | * | .37 | * | 1.82 | * | 1 | ||||||||||||||||
| 7.68 | 597,030 | .45 | 1.55 | .37 | 1.63 | 2 | ||||||||||||||||||||
| 16.18 | 749,210 | .54 | 1.48 | .36 | 1.66 | 4 | ||||||||||||||||||||
| 9.78 | 827,145 | .54 | 2.14 | .37 | 2.31 | 10 | ||||||||||||||||||||
| (36.18 | ) | 954,582 | .53 | 1.83 | .37 | 1.99 | 4 | |||||||||||||||||||
| 14.22 | 1,714,008 | .51 | 1.48 | .37 | 1.62 | 4 | ||||||||||||||||||||
| (a) | Per share Net Investment Income (Loss) is calculated using the average daily shares method. |
| (b) | Distributions from Capital Gains include short-term capital gains, if any. |
| (c) | Total return is the combination of changes in net asset value, reinvested dividend income at net asset value and reinvested capital gains distributions at net asset value, if any. Total returns are not annualized. |
| (d) | After expense reimbursement from the Adviser, where applicable. |
| (e) | Effective January 18, 2011, Class R Shares and Class Y Shares previously offered by FAF Advisors, Inc. were renamed Class R3 Shares and Class I Shares, respectively. |
| (f) | For the six months ended April 30, 2012. |
| * | Annualized. |
See accompanying notes to financial statements.
| Nuveen Investments | 87 |
Financial Highlights (Unaudited) (continued)
| Selected data for a share outstanding throughout each period: | ||||||||||||||||||||||||||||||||
| Class (Commencement Date) | ||||||||||||||||||||||||||||||||
| Investment Operations | Less Distributions | |||||||||||||||||||||||||||||||
| MID CAP INDEX | ||||||||||||||||||||||||||||||||
| Year Ended October 31, |
Beginning Net Asset Value |
Net ment |
Net Realized/ Unrealized Gain (Loss) |
Total | Net ment |
Capital Gains(b) |
Total | Ending Net Asset Value |
||||||||||||||||||||||||
| Class A (11/99) |
||||||||||||||||||||||||||||||||
| 2012(f) |
$ | 12.87 | $ | .05 | $ | 1.43 | $ | 1.48 | $ | (.03 | ) | $ | (.48 | ) | $ | (.51 | ) | $ | 13.84 | |||||||||||||
| 2011 |
11.98 | .05 | .92 | .97 | (.08 | ) | — | (.08 | ) | 12.87 | ||||||||||||||||||||||
| 2010 |
9.52 | .09 | 2.45 | 2.54 | (.08 | ) | — | (.08 | ) | 11.98 | ||||||||||||||||||||||
| 2009 |
8.83 | .09 | 1.27 | 1.36 | (.07 | ) | (.60 | ) | (.67 | ) | 9.52 | |||||||||||||||||||||
| 2008 |
15.69 | .13 | (5.30 | ) | (5.17 | ) | (.10 | ) | (1.59 | ) | (1.69 | ) | 8.83 | |||||||||||||||||||
| 2007 |
14.25 | .15 | 2.08 | 2.23 | (.13 | ) | (.66 | ) | (.79 | ) | 15.69 | |||||||||||||||||||||
| Class C (9/01) |
||||||||||||||||||||||||||||||||
| 2012(f) |
12.51 | — | 1.38 | 1.38 | — | (.48 | ) | (.48 | ) | 13.41 | ||||||||||||||||||||||
| 2011 |
11.67 | (.05 | ) | .89 | .84 | — | — | — | 12.51 | |||||||||||||||||||||||
| 2010 |
9.28 | .01 | 2.39 | 2.40 | (.01 | ) | — | (.01 | ) | 11.67 | ||||||||||||||||||||||
| 2009 |
8.64 | .04 | 1.23 | 1.27 | (.03 | ) | (.60 | ) | (.63 | ) | 9.28 | |||||||||||||||||||||
| 2008 |
15.41 | .04 | (5.19 | ) | (5.15 | ) | (.03 | ) | (1.59 | ) | (1.62 | ) | 8.64 | |||||||||||||||||||
| 2007 |
14.03 | .04 | 2.03 | 2.07 | (.03 | ) | (.66 | ) | (.69 | ) | 15.41 | |||||||||||||||||||||
| Class R3 (11/00)(e) |
||||||||||||||||||||||||||||||||
| 2012(f) |
12.73 | .03 | 1.41 | 1.44 | — | (.48 | ) | (.48 | ) | 13.69 | ||||||||||||||||||||||
| 2011 |
11.86 | .01 | .92 | .93 | (.06 | ) | — | (.06 | ) | 12.73 | ||||||||||||||||||||||
| 2010 |
9.43 | .06 | 2.43 | 2.49 | (.06 | ) | — | (.06 | ) | 11.86 | ||||||||||||||||||||||
| 2009 |
8.76 | .07 | 1.26 | 1.33 | (.06 | ) | (.60 | ) | (.66 | ) | 9.43 | |||||||||||||||||||||
| 2008 |
15.60 | .10 | (5.27 | ) | (5.17 | ) | (.08 | ) | (1.59 | ) | (1.67 | ) | 8.76 | |||||||||||||||||||
| 2007 |
14.19 | .11 | 2.07 | 2.18 | (.11 | ) | (.66 | ) | (.77 | ) | 15.60 | |||||||||||||||||||||
| Class I (11/99)(e) |
||||||||||||||||||||||||||||||||
| 2012(f) |
12.92 | .06 | 1.44 | 1.50 | (.06 | ) | (.48 | ) | (.54 | ) | 13.88 | |||||||||||||||||||||
| 2011 |
12.03 | .08 | .91 | .99 | (.10 | ) | — | (.10 | ) | 12.92 | ||||||||||||||||||||||
| 2010 |
9.55 | .12 | 2.46 | 2.58 | (.10 | ) | — | (.10 | ) | 12.03 | ||||||||||||||||||||||
| 2009 |
8.84 | .12 | 1.27 | 1.39 | (.08 | ) | (.60 | ) | (.68 | ) | 9.55 | |||||||||||||||||||||
| 2008 |
15.70 | .17 | (5.31 | ) | (5.14 | ) | (.13 | ) | (1.59 | ) | (1.72 | ) | 8.84 | |||||||||||||||||||
| 2007 |
14.27 | .19 | 2.07 | 2.26 | (.17 | ) | (.66 | ) | (.83 | ) | 15.70 | |||||||||||||||||||||
| 88 | Nuveen Investments |
| Ratios/Supplemental Data | ||||||||||||||||||||||||||
| Ratios to Average Net Assets Before Reimbursement |
Ratios to Average Net Assets After Reimbursement(d) |
|||||||||||||||||||||||||
| Total Return(c) |
Ending Net Assets (000) |
Expenses | Net ment |
Expenses | Net ment |
Portfolio Turnover Rate |
||||||||||||||||||||
| 12.13 | % | $ | 95,171 | .82 | %* | .63 | %* | .74 | %* | .70 | %* | 4 | % | |||||||||||||
| 8.07 | 68,856 | .79 | .32 | .75 | .36 | 23 | ||||||||||||||||||||
| 26.79 | 36,499 | .86 | .70 | .74 | .82 | 8 | ||||||||||||||||||||
| 17.53 | 22,766 | .92 | .98 | .75 | 1.15 | 18 | ||||||||||||||||||||
| (36.46 | ) | 11,374 | .84 | .94 | .74 | 1.04 | 15 | |||||||||||||||||||
| 16.32 | 17,868 | .81 | .96 | .75 | 1.02 | 15 | ||||||||||||||||||||
| 11.68 | 3,435 | 1.56 | * | (.10 | )* | 1.49 | * | (.03 | )* | 4 | ||||||||||||||||
| 7.20 | 3,302 | 1.53 | (.42 | ) | 1.50 | (.39 | ) | 23 | ||||||||||||||||||
| 25.86 | 3,100 | 1.61 | (.05 | ) | 1.49 | .07 | 8 | |||||||||||||||||||
| 16.68 | 2,766 | 1.67 | .31 | 1.50 | .48 | 18 | ||||||||||||||||||||
| (36.91 | ) | 3,101 | 1.58 | .20 | 1.48 | .30 | 15 | |||||||||||||||||||
| 15.39 | 5,287 | 1.56 | .22 | 1.50 | .28 | 15 | ||||||||||||||||||||
| 11.96 | 99,527 | 1.07 | * | .37 | * | .99 | * | .45 | * | 4 | ||||||||||||||||
| 7.83 | 65,060 | 1.04 | .07 | 1.00 | .11 | 23 | ||||||||||||||||||||
| 26.48 | 26,458 | 1.11 | .44 | .99 | .56 | 8 | ||||||||||||||||||||
| 17.29 | 12,212 | 1.17 | .72 | 1.00 | .89 | 18 | ||||||||||||||||||||
| (36.66 | ) | 8,157 | 1.10 | .70 | 1.00 | .80 | 15 | |||||||||||||||||||
| 16.01 | 5,913 | 1.06 | .72 | 1.00 | .78 | 15 | ||||||||||||||||||||
| 12.30 | 170,874 | .56 | * | .91 | * | .49 | * | .98 | * | 4 | ||||||||||||||||
| 8.23 | 170,174 | .53 | .59 | .50 | .63 | 23 | ||||||||||||||||||||
| 27.13 | 202,542 | .61 | .95 | .49 | 1.07 | 8 | ||||||||||||||||||||
| 17.92 | 163,432 | .67 | 1.30 | .50 | 1.47 | 18 | ||||||||||||||||||||
| (36.31 | ) | 177,038 | .59 | 1.19 | .49 | 1.29 | 15 | |||||||||||||||||||
| 16.52 | 333,784 | .56 | 1.23 | .50 | 1.29 | 15 | ||||||||||||||||||||
| (a) | Per share Net Investment Income (Loss) is calculated using the average daily shares method. |
| (b) | Distributions from Capital Gains include short-term capital gains, if any. |
| (c) | Total return is the combination of changes in net asset value, reinvested dividend income at net asset value and reinvested capital gains distributions at net asset value, if any. Total returns are not annualized. |
| (d) | After expense reimbursement from the Adviser, where applicable. |
| (e) | Effective January 18, 2011, Class R Shares and Class Y Shares previously offered by FAF Advisors, Inc. were renamed Class R3 Shares and Class I Shares, respectively. |
| (f) | For the six months ended April 30, 2012. |
| * | Annualized. |
See accompanying notes to financial statements.
| Nuveen Investments | 89 |
Financial Highlights (Unaudited) (continued)
| Selected data for a share outstanding throughout each period: | ||||||||||||||||||||||||||||||||
| Class (Commencement Date) | ||||||||||||||||||||||||||||||||
| Investment Operations | Less Distributions | |||||||||||||||||||||||||||||||
| SMALL CAP INDEX | ||||||||||||||||||||||||||||||||
| Year Ended October 31, |
Beginning Net Asset Value |
Net ment |
Net Realized/ Unrealized Gain (Loss) |
Total | Net ment |
Capital Gains(b) |
Total | Ending Net Asset Value |
||||||||||||||||||||||||
| Class A (12/98) |
||||||||||||||||||||||||||||||||
| 2012(f) |
$ | 10.43 | $ | .06 | $ | 1.06 | $ | 1.12 | $ | (.03 | ) | $ | — | $ | (.03 | ) | $ | 11.52 | ||||||||||||||
| 2011 |
9.89 | .05 | .55 | .60 | (.06 | ) | — | (.06 | ) | 10.43 | ||||||||||||||||||||||
| 2010 |
7.90 | .05 | 1.99 | 2.04 | (.05 | ) | — | (.05 | ) | 9.89 | ||||||||||||||||||||||
| 2009 |
8.91 | .06 | .27 | .33 | (.07 | ) | (1.27 | ) | (1.34 | ) | 7.90 | |||||||||||||||||||||
| 2008 |
15.37 | .13 | (4.88 | ) | (4.75 | ) | (.10 | ) | (1.61 | ) | (1.71 | ) | 8.91 | |||||||||||||||||||
| 2007 |
16.23 | .14 | 1.13 | 1.27 | (.12 | ) | (2.01 | ) | (2.13 | ) | 15.37 | |||||||||||||||||||||
| Class C (9/01) |
||||||||||||||||||||||||||||||||
| 2012(f) |
10.02 | .02 | 1.01 | 1.03 | — | — | — | 11.05 | ||||||||||||||||||||||||
| 2011 |
9.52 | (.03 | ) | .53 | .50 | — | — | — | 10.02 | |||||||||||||||||||||||
| 2010 |
7.62 | (.02 | ) | 1.92 | 1.90 | — | — | — | 9.52 | |||||||||||||||||||||||
| 2009 |
8.66 | .01 | .26 | .27 | (.04 | ) | (1.27 | ) | (1.31 | ) | 7.62 | |||||||||||||||||||||
| 2008 |
15.02 | .04 | (4.76 | ) | (4.72 | ) | (.03 | ) | (1.61 | ) | (1.64 | ) | 8.66 | |||||||||||||||||||
| 2007 |
15.92 | .03 | 1.10 | 1.13 | (.02 | ) | (2.01 | ) | (2.03 | ) | 15.02 | |||||||||||||||||||||
| Class R3 (12/98)(e) |
||||||||||||||||||||||||||||||||
| 2012(f) |
10.18 | .04 | 1.03 | 1.07 | — | — | — | 11.25 | ||||||||||||||||||||||||
| 2011 |
9.66 | .03 | .53 | .56 | (.04 | ) | — | (.04 | ) | 10.18 | ||||||||||||||||||||||
| 2010 |
7.73 | .03 | 1.94 | 1.97 | (.04 | ) | — | (.04 | ) | 9.66 | ||||||||||||||||||||||
| 2009 |
8.76 | .04 | .26 | .30 | (.06 | ) | (1.27 | ) | (1.33 | ) | 7.73 | |||||||||||||||||||||
| 2008 |
15.16 | .10 | (4.81 | ) | (4.71 | ) | (.08 | ) | (1.61 | ) | (1.69 | ) | 8.76 | |||||||||||||||||||
| 2007 |
16.04 | .11 | 1.11 | 1.22 | (.09 | ) | (2.01 | ) | (2.10 | ) | 15.16 | |||||||||||||||||||||
| Class I (12/98)(e) |
||||||||||||||||||||||||||||||||
| 2012(f) |
10.46 | .07 | 1.06 | 1.13 | (.06 | ) | — | (.06 | ) | 11.53 | ||||||||||||||||||||||
| 2011 |
9.91 | .08 | .55 | .63 | (.08 | ) | — | (.08 | ) | 10.46 | ||||||||||||||||||||||
| 2010 |
7.91 | .07 | 2.00 | 2.07 | (.07 | ) | — | (.07 | ) | 9.91 | ||||||||||||||||||||||
| 2009 |
8.92 | .09 | .25 | .34 | (.08 | ) | (1.27 | ) | (1.35 | ) | 7.91 | |||||||||||||||||||||
| 2008 |
15.37 | .16 | (4.88 | ) | (4.72 | ) | (.12 | ) | (1.61 | ) | (1.73 | ) | 8.92 | |||||||||||||||||||
| 2007 |
16.23 | .18 | 1.13 | 1.31 | (.16 | ) | (2.01 | ) | (2.17 | ) | 15.37 | |||||||||||||||||||||
| 90 | Nuveen Investments |
| Ratios/Supplemental Data | ||||||||||||||||||||||||||
| Ratios to Average Net Assets Before Reimbursement |
Ratios to Average Net Assets After Reimbursement(d) |
|||||||||||||||||||||||||
| Total Return(c) |
Ending Net Assets (000) |
Expenses | Net ment |
Expenses | Net ment |
Portfolio Turnover Rate |
||||||||||||||||||||
| 10.76 | % | $ | 25,383 | 1.26 | %* | .62 | %* | .83 | %* | 1.05 | %* | 7 | % | |||||||||||||
| 6.03 | 19,406 | 1.17 | .15 | .83 | .50 | 14 | ||||||||||||||||||||
| 25.91 | 12,667 | 1.49 | (.15 | ) | .79 | .55 | 12 | |||||||||||||||||||
| 6.34 | 8,591 | 1.66 | .03 | .82 | .87 | 22 | ||||||||||||||||||||
| (34.15 | ) | 6,043 | 1.31 | .60 | .82 | 1.09 | 19 | |||||||||||||||||||
| 8.56 | 9,109 | 1.12 | .63 | .83 | .92 | 12 | ||||||||||||||||||||
| 10.28 | 1,219 | 1.98 | * | (.12 | )* | 1.58 | * | .29 | * | 7 | ||||||||||||||||
| 5.25 | 1,330 | 1.90 | (.58 | ) | 1.58 | (.26 | ) | 14 | ||||||||||||||||||
| 24.93 | 1,645 | 2.24 | (.90 | ) | 1.54 | (.20 | ) | 12 | ||||||||||||||||||
| 5.60 | 1,380 | 2.41 | (.67 | ) | 1.57 | .17 | 22 | |||||||||||||||||||
| (34.67 | ) | 1,531 | 2.06 | (.15 | ) | 1.57 | .34 | 19 | ||||||||||||||||||
| 7.78 | 2,916 | 1.87 | (.12 | ) | 1.58 | .17 | 12 | |||||||||||||||||||
| 10.54 | 17,803 | 1.52 | * | .36 | * | 1.08 | * | .80 | * | 7 | ||||||||||||||||
| 5.79 | 11,824 | 1.44 | (.12 | ) | 1.08 | .24 | 14 | |||||||||||||||||||
| 25.55 | 4,795 | 1.74 | (.40 | ) | 1.04 | .30 | 12 | |||||||||||||||||||
| 6.08 | 2,512 | 1.91 | (.29 | ) | 1.07 | .55 | 22 | |||||||||||||||||||
| (34.33 | ) | 1,121 | 1.57 | .38 | 1.08 | .87 | 19 | |||||||||||||||||||
| 8.34 | 703 | 1.37 | .43 | 1.08 | .71 | 12 | ||||||||||||||||||||
| 10.83 | 35,623 | .98 | * | .89 | * | .58 | * | 1.29 | * | 7 | ||||||||||||||||
| 6.33 | 40,135 | .90 | .42 | .58 | .75 | 14 | ||||||||||||||||||||
| 26.22 | 47,179 | 1.24 | .10 | .54 | .80 | 12 | ||||||||||||||||||||
| 6.50 | 43,179 | 1.41 | .35 | .57 | 1.19 | 22 | ||||||||||||||||||||
| (33.95 | ) | 54,932 | 1.06 | .84 | .57 | 1.33 | 19 | |||||||||||||||||||
| 8.84 | 114,343 | .87 | .87 | .58 | 1.16 | 12 | ||||||||||||||||||||
| (a) | Per share Net Investment Income (Loss) is calculated using the average daily shares method. |
| (b) | Distributions from Capital Gains include short-term capital gains, if any. |
| (c) | Total return is the combination of changes in net asset value, reinvested dividend income at net asset value and reinvested capital gains distributions at net asset value, if any. Total returns are not annualized. |
| (d) | After expense reimbursement from the Adviser, where applicable. |
| (e) | Effective January 18, 2011, Class R Shares and Class Y Shares previously offered by FAF Advisors, Inc. were renamed Class R3 Shares and Class I Shares, respectively. |
| (f) | For the six months ended April 30, 2012. |
| * | Annualized. |
See accompanying notes to financial statements.
| Nuveen Investments | 91 |
Notes to Financial Statements (Unaudited)
1. General Information and Significant Accounting Policies
General Information
Nuveen Investment Funds, Inc. (the “Trust”), is an open-end investment company registered under the Investment Company Act of 1940, as amended. The Trust is comprised of Nuveen Equity Index Fund (“Equity Index”), Nuveen Mid Cap Index Fund (“Mid Cap Index”) and Nuveen Small Cap Index Fund (“Small Cap Index”) (each a “Fund” and collectively, the “Funds”), among others. The Trust was incorporated in the state of Maryland on August 20, 1987.
Equity Index’s investment objective is to provide investment results that correspond to the performance of the Standard & Poor’s 500® Index (S&P 500 Index). Mid Cap Index’s investment objective is to provide investment results that correspond to the performance of the Standard & Poor’s MidCap 400® Index (S&P MidCap 400 Index). Small Cap Index’s investment objective is to provide investment results that correspond to the performance of the Russell® 2000 Index.
Under normal market conditions, each Fund generally invests at least 90% of its net assets (plus the amount of any borrowings for investment purposes) in common stocks included in its corresponding index. Each Fund also may invest in stock index futures contracts, options on stock indices and options on stock index futures (“derivatives”) on its corresponding index. Each Fund may make these investments to maintain the liquidity needed to meet redemption requests, to increase the level of Fund assets devoted to replicating the composition of its corresponding index and to reduce transaction costs.
Each Fund’s most recent prospectus provides further descriptions of each Fund’s investment objective, principal investment strategies and principal risks.
Significant Accounting Policies
The following is a summary of significant accounting policies followed by the Funds in the preparation of their financial statements in accordance with accounting principles generally accepted in the United States (“U.S. GAAP”).
Investment Valuation
Common stocks and other equity-type securities are valued at the last sales price on the securities exchange on which such securities are primarily traded and are generally classified as Level 1 for fair value measurement purposes. Securities primarily traded on the NASDAQ National Market (“NASDAQ”) are valued, except as indicated below, at the NASDAQ Official Closing Price and are generally classified as Level 1. However, securities traded on a securities exchange or NASDAQ for which there were no transactions on a given day or securities not listed on a securities exchange or NASDAQ are valued at the quoted bid price and are generally classified as Level 2. Prices of certain American Depositary Receipts (“ADR”) held by the Funds that trade in the United States are valued based on the last traded price, official closing price, or the most recent bid price of the underlying non-U.S.-traded stock, adjusted as appropriate for the underlying-to-ADR conversion ratio and foreign exchange rate, and from time-to-time may also be adjusted further to take into account material events that may take place after the close of the local non-U.S. market but before the close of the New York Stock Exchange. These securities generally represent a transfer from a Level 1 to a Level 2 security.
Investments in investment companies are valued at their respective net asset values on the valuation date. These investment vehicles are generally classified as Level 1.
Prices of fixed-income securities are provided by a pricing service approved by the Funds’ Board of Directors. These securities are generally classified as Level 2. The pricing service establishes a security’s fair value using methods that may include consideration of the following: yields or prices of investments of comparable quality, type of issue, coupon, maturity and rating, market quotes or indications of value from security dealers, evaluations of anticipated cash flows or collateral, general market conditions and other information and analysis, including the obligor’s credit characteristics considered relevant. In pricing certain securities, particularly less liquid and lower quality securities, the pricing service may consider information about a security, its issuer, or market activity provided by Nuveen Fund Advisors, Inc. (the “Advisor”), a wholly-owned subsidiary of Nuveen Investments, Inc. (“Nuveen”). These securities are generally classified as Level 2 or Level 3 depending on the priority of the significant inputs.
Futures contracts are valued using the closing settlement price or, in the absence of such a price, the last traded price. Futures contracts are generally classified as Level 1.
Certain securities may not be able to be priced by the pre-established pricing methods as described above. Such securities may be valued by the Funds’ Board of Directors or its designee at fair value. These securities generally include, but are not limited to, restricted securities (securities which may not be publicly sold without registration under the Securities Act of 1933, as amended) for which a pricing service is unable to provide a market price; securities whose trading has been formally suspended; debt securities that have gone into default and for which there is no current market quotation; a security whose market price is not available from a pre-established pricing source; a security with respect to which an event has occurred that is likely to materially affect the value of the security after the market has closed but before the calculation of a Fund’s net asset value (as may be the case in non-U.S. markets on which the security is primarily traded) or make it difficult or impossible to obtain a reliable market quotation; and a security whose price, as provided by the pricing service, is not deemed to reflect the security’s fair value. As a general principle, the fair value of a security would appear to be the amount that the owner might reasonably expect to receive for it in a current sale. A variety of factors may be considered in determining the fair value of such securities, which may include consideration of the following: yields or prices of investments of comparable quality, type of issue, coupon, maturity and rating, market quotes or indications of value from security
| 92 | Nuveen Investments |
dealers, evaluations of anticipated cash flows or collateral, general market conditions and other information and analysis, including the obligor’s credit characteristics considered relevant. These securities are generally classified as Level 2 or Level 3 depending on the priority of the significant inputs. Regardless of the method employed to value a particular security, all valuations are subject to review by the Funds’ Board of Directors or its designee.
Refer to Footnote 2 – Fair Value Measurements for further details on the leveling of securities held by the Funds as of the end of the reporting period.
Investment Transactions
Investment transactions are recorded on a trade date basis. Realized gains and losses from investment transactions are determined on the specific identification method, which is the same basis used for federal income tax purposes.
Investment Income
Dividend income is recorded on the ex-dividend date or, for foreign securities, when information is available. Interest income, which reflects the amortization of premiums and includes accretion of discounts for financial reporting purposes is recorded on an accrual basis. Securities lending income is comprised of fees earned from borrowers and income earned on cash collateral investments, net of lending agent fees.
Income Taxes
Each Fund is a separate taxpayer for federal income tax purposes. Each Fund intends to distribute substantially all of its net investment income and net capital gains to shareholders and to otherwise comply with the requirements of Subchapter M of the Internal Revenue Code applicable to regulated investment companies (“RICs”). Therefore, no federal income tax provision is required.
For all open tax years and all major taxing jurisdictions, management of the Funds has concluded that there are no significant uncertain tax positions that would require recognition in the financial statements. Open tax years are those that are open for examination by taxing authorities (i.e., generally the last four tax year ends and the interim tax period since then). Furthermore, management of the Funds is also not aware of any tax positions for which it is reasonably possible that the total amounts of unrecognized tax benefits will significantly change in the next twelve months.
Dividends and Distributions to Shareholders
Dividends from net investment income are declared and distributed to shareholders annually for Mid Cap Index and Small Cap Index and quarterly for Equity Index. Dividends from net realized capital gains from investment transactions, if any, are declared and distributed to shareholders at least annually. Furthermore, capital gains are distributed only to the extent they exceed available capital loss carryforwards.
Distributions to shareholders are recorded on the ex-dividend date. The amount and timing of distributions are determined in accordance with federal income tax regulations, which may differ from U.S. GAAP.
Mid Cap Index and Small Cap Index receive substantial distributions from holdings in Real Estate Investment Trusts (“REITs”). Distributions from REITs may be characterized as ordinary income, net capital gain, or a return of capital to the REIT shareholder. The proper characterization of REIT distributions is generally not known until after the end of each calendar year. As such, the Funds must use estimates in reporting the character of their income and distributions for financial statement purposes. The actual character of distributions to Fund shareholders will be reflected on the Form 1099 received by shareholders after the end of the calendar year. Due to the nature of REIT investments, a portion of the distributions received by the Fund shareholder may represent a return of capital.
Flexible Sales Charge Program
The Funds only issue Class A Shares for purchase by certain retirement plans and by qualifying clients of investment advisers, financial planners or other financial intermediaries that charge periodic or asset-based fees for their services. Class A Shares are offered to those investors at their net asset value per share with no up-front sales charge. Equity Index will issue Class B shares upon the exchange of Class B Shares from another Nuveen mutual fund or for purposes of dividend reinvestment, but Class B Shares are not available for new accounts or for additional investment into existing accounts. Class B Shares incur a .75% annual 12b-1 distribution fee and a .25% annual 12b-1 service fee. Class B Shares are subject to a contingent deferred sales charge (“CDSC”) of up to 5% depending upon the length of time the shares are held by the investor (CDSC is reduced to 0% at the end of six years). Class B Shares automatically convert to Class A Shares eight years after purchase. Class C Shares are sold without an up-front sales charge but incur a .75% annual 12b-1 distribution fee and a .25% annual 12b-1 service fee. Class C Shares are subject to a CDSC of 1% if redeemed within twelve months of purchase. Class R3 Shares are sold without an up-front sales charge but incur a .25% annual 12b-1 distribution and a .25% annual service fee. Class I Shares are not subject to any sales charge or 12b-1 distribution or service fees.
Futures Contracts
Each Fund is subject to equity price risk in the normal course of pursuing its investment objectives and is authorized to invest in futures contracts in an attempt to manage such risk. Upon entering into a futures contract, a Fund is required to deposit with the broker an amount of cash or liquid securities equal to a specified percentage of the contract amount. This is known as the “initial margin.” Cash held by the broker to cover initial margin requirements on open futures contracts, if any, is recognized as “Deposits with brokers for open futures contracts” on the Statement of Assets and Liabilities. Subsequent payments (“variation margin”) are made or received by a Fund each day, depending on the daily fluctuation of the value of the contract. Variation margin is recognized as a receivable or payable for “Variation margin on futures contracts” on the Statement of Assets and Liabilities, when applicable.
| Nuveen Investments | 93 |
Notes to Financial Statements (Unaudited) (continued)
During the period the futures contract is open, changes in the value of the contract are recognized as an unrealized gain or loss by “marking-to-market” on a daily basis to reflect the changes in market value of the contract, which is recognized as a component of “Change in net unrealized appreciation (depreciation) of futures contracts” on the Statement of Operations. When the contract is closed or expired, a Fund records a realized gain or loss equal to the difference between the value of the contract on the closing date and value of the contract when originally entered into, which is recognized as a component of “Net realized gain (loss) from futures contracts” on the Statement of Operations.
Risks of investments in futures contracts include the possible adverse movement in the price of the securities or indices underlying the contracts, the possibility that there may not be a liquid secondary market for the contracts and/or that a change in the value of the contract may not correlate with a change in the value of the underlying securities or indices.
During the six months ended April 30, 2012, Equity Index invested in S&P 500 Index futures to convert cash into the equivalent of an S&P 500 Index holding in order to manage cash flow activity and minimize tracking error to the Fund’s benchmark index. Mid Cap Index invested in S&P Mid 400 Index futures to convert cash into the equivalent of an S&P Mid 400 Index holding in order to manage cash flow activity and minimize tracking error to the Fund’s benchmark index. Small Cap Index invested in Russell 2000 Index futures to convert cash into the equivalent of a Russell 2000 Index holding in order to manage cash flow activity and minimize tracking error to the Fund’s benchmark index.
The average number of futures contracts outstanding during the six months ended April 30, 2012, were as follows:
| Equity Index |
Mid Cap Index |
Small Cap Index |
||||||||||
| Average number of futures contracts outstanding* |
108 | 267 | 63 | |||||||||
| * | The average number of outstanding contracts is calculated based on the outstanding number of contracts at the beginning of the fiscal year and at the end of each fiscal quarter within the current fiscal year. |
Refer to Footnote 3 – Derivative Instruments and Hedging Activities for further details on futures contracts activity.
Market and Counterparty Credit Risk
In the normal course of business each Fund may invest in financial instruments and enter into financial transactions where risk of potential loss exists due to changes in the market (market risk) or failure of the other party to the transaction to perform (counterparty credit risk). The potential loss could exceed the value of the financial assets recorded on the financial statements. Financial assets, which potentially expose each Fund to counterparty credit risk, consist principally of cash due from counterparties on forward, option and swap transactions, when applicable. The extent of each Fund’s exposure to counterparty credit risk in respect to these financial assets approximates their carrying value as recorded on the Statement of Assets and Liabilities. Futures contracts, when applicable, expose a Fund to minimal counterparty credit risk as they are exchange traded and the exchange’s clearinghouse, which is counterparty to all exchange traded futures, guarantees the futures contracts against default.
Each Fund helps manage counterparty credit risk by entering into agreements only with counterparties the Adviser believes have the financial resources to honor their obligations and by having the Adviser monitor the financial stability of the counterparties. Additionally, counterparties may be required to pledge collateral daily (based on the daily valuation of the financial asset) on behalf of each Fund with a value approximately equal to the amount of any unrealized gain above a pre-determined threshold. Reciprocally, when each Fund has an unrealized loss, the Funds have instructed the custodian to pledge assets of the Funds as collateral with a value approximately equal to the amount of the unrealized loss above a pre-determined threshold. Collateral pledges are monitored and subsequently adjusted if and when the valuations fluctuate, either up or down, by at least the pre-determined threshold amount.
Multiclass Operations and Allocations
Income and expenses of the Funds that are not directly attributable to a specific class of shares are prorated among the classes based on the relative net assets of each class. Expenses directly attributable to a class of shares, which presently only include 12b-1 distribution fees and shareholder service fees, are recorded to the specific class.
Income, realized and unrealized capital gains and losses of the Funds are prorated among the classes based on the relative net assets of each class.
Securities Lending
In order to generate additional income, each Fund may lend securities representing up to one-third of the value of its total assets (which includes collateral for securities on loan) to broker-dealers, banks or other institutions. Each Fund’s policy is to receive cash collateral equal to at least 102% of the value of securities loaned, which is recognized as “Collateral from securities lending program” on the Statement of Assets and Liabilities. The adequacy of the collateral is monitored on a daily basis. If the value of the securities on loan increases, such that the level of collateralization falls below 102%, additional collateral is received from the borrower, which is recognized as “Due from broker” on the Statement of Assets and Liabilities, when applicable. As with other extensions of credit, there may be risks of delay in recovery of the securities or even loss of rights in the collateral should the borrower of the security fail financially.
| 94 | Nuveen Investments |
The Funds’ custodian serves as the securities lending agent for the Funds. Each Fund pays the custodian a fee based on the Fund’s proportional share of the custodian’s expense of operating its securities lending program. Collateral for securities on loan is invested in a money market fund, which is recognized as “Investments purchased with collateral from securities lending” on the Statement of Assets and Liabilities.
Income from securities lending, net of fees paid, is recognized on the Statement of Operations as “Securities lending income.” Securities lending fees paid by each Fund during the six months ended April 30, 2012, were as follows:
| Equity Index |
Mid Cap Index |
Small Cap Index |
||||||||||
| Securities lending fees paid |
$ | 20,828 | $ | 16,385 | $ | 14,146 | ||||||
Indemnifications
Under the Trust’s organizational documents, its officers and directors are indemnified against certain liabilities arising out of the performance of their duties to the Trust. In addition, in the normal course of business, the Trust enters into contracts that provide general indemnifications to other parties. The Trust’s maximum exposure under these arrangements is unknown as this would involve future claims that may be made against the Trust that have not yet occurred. However, the Trust has not had prior claims or losses pursuant to these contracts and expects the risk of loss to be remote.
Use of Estimates
The preparation of financial statements in conformity with U.S. GAAP requires management to make estimates and assumptions that affect the reported amounts of assets and liabilities at the date of the financial statements and the reported amounts of increases and decreases in net assets from operations during the reporting period. Actual results may differ from those estimates.
2. Fair Value Measurements
Fair value is defined as the price that the Funds would receive upon selling an investment or transferring a liability in an orderly transaction to an independent buyer in the principal or most advantageous market for the investment. A three-tier hierarchy is used to maximize the use of observable market data and minimize the use of unobservable inputs and to establish classification of fair value measurements for disclosure purposes. Observable inputs reflect the assumptions market participants would use in pricing the asset or liability. Observable inputs are based on market data obtained from sources independent of the reporting entity. Unobservable inputs reflect the reporting entity’s own assumptions about the assumptions market participants would use in pricing the asset or liability. Unobservable inputs are based on the best information available in the circumstances. The three-tier hierarchy of inputs is summarized in the three broad levels listed below:
| Level 1 – | Quoted prices in active markets for identical securities. | |
| Level 2 – | Other significant observable inputs (including quoted prices for similar securities, interest rates, prepayment speeds, credit risk, etc.). | |
| Level 3 – | Significant unobservable inputs (including management’s assumptions in determining the fair value of investments). |
The inputs or methodologies used for valuing securities are not an indication of the risk associated with investing in those securities. The following is a summary of each Fund’s fair value measurements as of April 30, 2012:
| Equity Index | Level 1 | Level 2 | Level 3 | Total | ||||||||||||
| Long-Term Investments: |
||||||||||||||||
| Common Stocks |
$ | 743,663,329 | $ | — | $ | — | $ | 743,663,329 | ||||||||
| Investments Purchased with Collateral from Securities Lending |
91,559,442 | — | — | 91,559,442 | ||||||||||||
| Short-Term Investments: |
||||||||||||||||
| Money Market Funds |
18,203,383 | — | — | 18,203,383 | ||||||||||||
| U.S. Government & Agency Obligations |
— | 6,396,781 | — | 6,396,781 | ||||||||||||
| Derivatives: |
||||||||||||||||
| Futures Contracts* |
343,649 | — | — | 343,649 | ||||||||||||
| Total |
$ | 853,769,803 | $ | 6,396,781 | $ | — | $ | 860,166,584 | ||||||||
| Mid Cap Index | Level 1 | Level 2 | Level 3 | Total | ||||||||||||
| Long-Term Investments: |
||||||||||||||||
| Common Stocks |
$ | 341,690,150 | $ | — | $ | — | $ | 341,690,150 | ||||||||
| Investments Purchased with Collateral from Securities Lending |
131,577,685 | — | — | 131,577,685 | ||||||||||||
| Short-Term Investments: |
||||||||||||||||
| Money Market Funds |
26,578,634 | — | — | 26,578,634 | ||||||||||||
| U.S. Government & Agency Obligations |
— | 2,348,818 | — | 2,348,818 | ||||||||||||
| Derivatives: |
||||||||||||||||
| Futures Contracts* |
521,631 | — | — | 521,631 | ||||||||||||
| Total |
$ | 500,368,100 | $ | 2,348,818 | $ | — | $ | 502,716,918 | ||||||||
| * | Represents net unrealized appreciation (depreciation) as reported in the Fund’s Portfolio of Investments. |
| Nuveen Investments | 95 |
Notes to Financial Statements (Unaudited) (continued)
| Small Cap Index | Level 1 | Level 2 | Level 3 | Total | ||||||||||||
| Long-Term Investments: |
||||||||||||||||
| Common Stocks |
$ | 77,064,704 | $ | — | $ | — | $ | 77,064,704 | ||||||||
| Rights |
— | — | — | ** | — | ** | ||||||||||
| Warrants |
— | — | 473 | 473 | ||||||||||||
| Investments Purchased with Collateral from Securities Lending |
37,587,463 | — | — | 37,587,463 | ||||||||||||
| Short-Term Investments: |
||||||||||||||||
| Money Market Funds |
2,725,729 | — | — | 2,725,729 | ||||||||||||
| U.S. Government & Agency Obligations |
— | 619,688 | — | 619,688 | ||||||||||||
| Derivatives: |
||||||||||||||||
| Futures Contracts* |
31,361 | — | — | 31,361 | ||||||||||||
| Total |
$ | 117,409,257 | $ | 619,688 | $ | 473 | $ | 118,029,418 | ||||||||
| * | Represents net unrealized appreciation (depreciation) as reported in the Fund’s Portfolio of Investments. |
| ** | Level 3 security has a market value of zero. |
The following is a reconciliation of the Funds’ Level 3 investments held at the beginning and end of the measurement period:
| Mid Cap Index Level 3 Common Stocks |
||||
| Balance at the beginning of period |
$ | — | ** | |
| Gains (losses): |
||||
| Net realized gains (losses) |
— | |||
| Net change in unrealized appreciation (depreciation) |
— | |||
| Purchases at cost |
— | |||
| Sales at proceeds |
— | |||
| Net discounts (premiums) |
— | |||
| Transfers in to |
— | |||
| Transfers out of |
— | |||
| Balance at the end of period |
$ | — | ||
| Small Cap Index Level 3 Common Stocks |
Small Cap Index Level 3 Rights |
Small Cap Index Level 3 Warrants |
Small Cap Index Level 3 Total |
|||||||||||||
| Balance at the beginning of period |
$ | 2,712 | $ | — | ** | $ | 524 | $ | 3,236 | |||||||
| Gains (losses): |
||||||||||||||||
| Net realized gains (losses) |
(90,474 | ) | — | — | (90,474 | ) | ||||||||||
| Net change in unrealized appreciation (depreciation) |
90,339 | — | (51 | ) | 90,288 | |||||||||||
| Purchases at cost |
— | — | — | — | ||||||||||||
| Sales at proceeds |
(2,577 | ) | — | — | (2,577 | ) | ||||||||||
| Net discounts (premiums) |
— | — | — | — | ||||||||||||
| Transfers in to |
— | — | — | — | ||||||||||||
| Transfers out of |
— | — | — | — | ||||||||||||
| Balance at the end of period |
$ | — | $ | — | ** | $ | 473 | $ | 473 | |||||||
| Change in net unrealized appreciation (depreciation) during the period of Level 3 securities held as of April 30, 2012 |
$ | — | $ | — | $ | (51 | ) | $ | — | |||||||
| ** | Level 3 security has a market value of zero. |
During the six months ended April 30, 2012, the Fund recognized no significant transfers to or from Level 1, Level 2 or Level 3.
3. Derivative Instruments and Hedging Activities
The Funds record derivative instruments at fair value, with changes in fair value recognized on the Statement of Operations, when applicable. Even though the Funds’ investments in derivatives may represent economic hedges, they are not considered to be hedge transactions for financial reporting purposes. For additional information on the derivative instruments in which each Fund was invested during and at the end of the reporting period, refer to the Portfolios of Investments, Financial Statements and Footnote 1 – General Information and Significant Accounting Policies.
| 96 | Nuveen Investments |
The following tables present the fair value of all derivative instruments held by the Funds as of April 30, 2012, the location of these instruments on the Statement of Assets and Liabilities and the primary underlying risk exposure.
| Equity Index | ||||||||||||||
| Location on the Statement of Assets and Liabilities | ||||||||||||||
| Underlying Risk Exposure |
Derivative Instrument |
Asset Derivatives | Liability Derivatives | |||||||||||
| Location | Value | Location | Value | |||||||||||
| Equity |
Futures Contracts |
Payable for variation margin on futures contracts* |
$ | 343,649 | — | $ | — | |||||||
| Mid Cap Index | ||||||||||||||
| Location on the Statement of Assets and Liabilities | ||||||||||||||
| Underlying Risk Exposure |
Derivative Instrument |
Asset Derivatives | Liability Derivatives | |||||||||||
| Location | Value | Location | Value | |||||||||||
| Equity |
Futures Contracts |
Payable for variation margin on futures contracts* |
$ | 521,631 | — | $ | — | |||||||
| Small Cap Index | ||||||||||||||
| Location on the Statement of Assets and Liabilities | ||||||||||||||
| Underlying Risk Exposure |
Derivative Instrument |
Asset Derivatives | Liability Derivatives | |||||||||||
| Location | Value | Location | Value | |||||||||||
| Equity |
Futures Contracts |
Payable for variation margin on futures contracts* |
$ | 31,361 | — | $ | — | |||||||
| * | Value represents cumulative gross unrealized appreciation (depreciation) of futures contracts as reported in the Fund’s Portfolio of Investments and not the deposits with brokers, if any, or the receivable or payable for variation margin on futures contracts presented on the Statement of Assets and Liabilities. |
The following tables present the amount of net realized gain (loss) and change in net unrealized appreciation (depreciation) recognized for the six months ended April 30, 2012, on derivative instruments, as well as the primary risk exposure associated with each.
| Net Realized Gain (Loss) from Futures Contracts | Equity Index |
Mid Cap Index |
Small Cap Index |
|||||||||
| Risk Exposure |
||||||||||||
| Equity |
$ | 3,435,676 | $ | 2,801,870 | $ | 779,219 | ||||||
| Change in Net Unrealized Appreciation (Depreciation) of Futures Contracts | Equity Index |
Mid Cap Index |
Small Cap Index |
|||||||||
| Risk Exposure |
||||||||||||
| Equity |
$(916,544) | $ | (984,639 | ) | $ | (396,814 | ) | |||||
| Nuveen Investments | 97 |
Notes to Financial Statements (Unaudited) (continued)
4. Fund Shares
Transactions in Fund shares were as follows:
| Equity Index | ||||||||||||||||
| Six Months Ended 4/30/12 |
Year Ended 10/31/11 |
|||||||||||||||
| Shares | Amount | Shares | Amount | |||||||||||||
| Shares sold: |
||||||||||||||||
| Class A |
721,707 | $ | 15,065,662 | 816,626 | $ | 17,730,870 | ||||||||||
| Class B |
452 | 9,439 | 174 | 3,737 | ||||||||||||
| Class C |
18,574 | 383,547 | 37,219 | 806,830 | ||||||||||||
| Class R3(1) |
1,068,840 | 22,481,301 | 874,238 | 18,843,033 | ||||||||||||
| Class I(1) |
1,931,775 | 41,367,407 | 3,253,969 | 70,569,858 | ||||||||||||
| Shares issued to shareholders due to reinvestment of distributions: |
||||||||||||||||
| Class A |
486,309 | 9,469,841 | 411,949 | 8,776,775 | ||||||||||||
| Class B |
15,715 | 299,090 | 22,005 | 460,694 | ||||||||||||
| Class C |
30,142 | 578,124 | 24,980 | 526,634 | ||||||||||||
| Class R3(1) |
65,476 | 1,273,061 | 53,292 | 1,132,220 | ||||||||||||
| Class I(1) |
1,696,829 | 33,028,079 | 1,697,028 | 36,161,240 | ||||||||||||
| 6,035,819 | 123,955,551 | 7,191,480 | 155,011,891 | |||||||||||||
| Shares redeemed: |
||||||||||||||||
| Class A |
(669,983 | ) | (14,324,364 | ) | (1,238,649 | ) | (27,109,684 | ) | ||||||||
| Class B |
(64,220 | ) | (1,355,215 | ) | (168,827 | ) | (3,677,889 | ) | ||||||||
| Class C |
(47,945 | ) | (991,656 | ) | (79,043 | ) | (1,706,016 | ) | ||||||||
| Class R3(1) |
(555,691 | ) | (11,681,460 | ) | (867,703 | ) | (18,863,985 | ) | ||||||||
| Class I(1) |
(4,621,325 | ) | (96,924,409 | ) | (11,941,637 | ) | (262,511,489 | ) | ||||||||
| (5,959,164 | ) | (125,277,104 | ) | (14,295,859 | ) | (313,869,063 | ) | |||||||||
| Net increase (decrease) |
76,655 | $ | (1,321,553 | ) | (7,104,379 | ) | $ | (158,857,172 | ) | |||||||
| Mid Cap Index | ||||||||||||||||
| Six Months Ended 4/30/12 |
Year Ended 10/31/11 |
|||||||||||||||
| Shares | Amount | Shares | Amount | |||||||||||||
| Shares sold: |
||||||||||||||||
| Class A |
2,297,372 | $ | 30,006,808 | 3,592,756 | $ | 47,969,185 | ||||||||||
| Class C |
17,634 | 228,213 | 77,394 | 1,029,313 | ||||||||||||
| Class R3(1) |
2,479,439 | 32,355,501 | 4,088,313 | 53,833,459 | ||||||||||||
| Class I(1) |
1,491,675 | 19,730,369 | 3,630,449 | 48,404,197 | ||||||||||||
| Shares issued to shareholders due to reinvestment of distributions: |
||||||||||||||||
| Class A |
232,338 | 2,749,626 | 18,543 | 243,472 | ||||||||||||
| Class C |
9,633 | 110,394 | — | — | ||||||||||||
| Class R3(1) |
226,691 | 2,645,480 | 11,361 | 147,814 | ||||||||||||
| Class I(1) |
321,060 | 3,823,282 | 45,808 | 602,840 | ||||||||||||
| 7,075,842 | 91,649,673 | 11,464,624 | 152,230,280 | |||||||||||||
| Shares redeemed: |
||||||||||||||||
| Class A |
(1,001,689 | ) | (13,058,786 | ) | (1,306,952 | ) | (17,153,207 | ) | ||||||||
| Class C |
(35,124 | ) | (455,420 | ) | (79,166 | ) | (1,002,954 | ) | ||||||||
| Class R3(1) |
(546,683 | ) | (7,095,123 | ) | (1,217,533 | ) | (16,165,349 | ) | ||||||||
| Class I(1) |
(2,666,538 | ) | (34,203,469 | ) | (4,679,157 | ) | (62,871,313 | ) | ||||||||
| Class I(1)-In-kind |
— | — | (2,670,858 | ) | (35,014,943 | ) | ||||||||||
| (4,250,034 | ) | (54,812,798 | ) | (9,953,666 | ) | (132,207,766 | ) | |||||||||
| Net increase (decrease) |
2,825,808 | $ | 36,836,875 | 1,510,958 | $ | 20,022,514 | ||||||||||
| (1) | Effective January 18, 2011, Class R Shares and Class Y Shares previously offered by FAF Advisors, Inc. were renamed Class R3 Shares and Class I Shares, respectively. |
| 98 | Nuveen Investments |
| Small Cap Index | ||||||||||||||||
| Six Months Ended 4/30/12 |
Year Ended 10/31/11 |
|||||||||||||||
| Shares | Amount | Shares | Amount | |||||||||||||
| Shares sold: |
||||||||||||||||
| Class A |
673,100 | $ | 7,303,292 | 1,149,404 | $ | 12,460,157 | ||||||||||
| Class C |
6,173 | 67,116 | 24,621 | 265,641 | ||||||||||||
| Class R3(1) |
585,144 | 6,318,597 | 1,009,181 | 10,725,448 | ||||||||||||
| Class I(1) |
280,617 | 3,096,248 | 736,712 | 7,952,841 | ||||||||||||
| Shares issued to shareholders due to reinvestment of distributions: |
||||||||||||||||
| Class A |
5,536 | 58,018 | 7,019 | 77,632 | ||||||||||||
| Class C |
— | — | — | — | ||||||||||||
| Class R3(1) |
308 | 3,152 | 2,020 | 21,831 | ||||||||||||
| Class I(1) |
9,690 | 101,546 | 14,973 | 165,746 | ||||||||||||
| 1,560,568 | 16,947,969 | 2,943,930 | 31,669,296 | |||||||||||||
| Shares redeemed: |
||||||||||||||||
| Class A |
(335,268 | ) | (3,735,533 | ) | (576,592 | ) | (6,078,774 | ) | ||||||||
| Class C |
(28,581 | ) | (310,582 | ) | (64,662 | ) | (661,129 | ) | ||||||||
| Class R3(1) |
(165,205 | ) | (1,799,750 | ) | (345,704 | ) | (3,647,858 | ) | ||||||||
| Class I(1) |
(1,038,837 | ) | (11,132,941 | ) | (1,673,238 | ) | (18,669,132 | ) | ||||||||
| (1,567,891 | ) | (16,978,806 | ) | (2,660,196 | ) | (29,056,893 | ) | |||||||||
| Net increase (decrease) |
(7,323 | ) | $ | (30,837 | ) | 283,734 | $ | 2,612,403 | ||||||||
| (1) | Effective January 18, 2011, Class R Shares and Class Y Shares previously offered by FAF Advisors, Inc. were renamed Class R3 Shares and Class I Shares, respectively. |
Class B Shares that converted to Class A Shares (reflected above as a component of Class A Shares sold and Class B Shares redeemed) during the six months ended April 30, 2012, and fiscal year ended October 31, 2011, were as follows:
| Fund | Six Months Ended 4/30/12 |
Year Ended 10/31/11 |
||||||
| Equity Index |
48,438 | 115,186 | ||||||
5. Investment Transactions
Purchases and sales (including maturities but excluding investments purchased with collateral from securities lending, short-term investments and derivative transactions) during the six months ended April 30, 2012, were as follows:
| Equity Index |
Mid Cap Index |
Small Cap Index |
||||||||||
| Purchases |
$ | 4,827,687 | $ | 46,463,791 | $ | 9,242,828 | ||||||
| Sales and maturities |
30,506,786 | 13,666,518 | 4,934,372 | |||||||||
6. Income Tax Information
The following information is presented on an income tax basis. Differences between amounts for financial statement and federal income tax purposes are primarily due to timing differences in recognizing certain gains and losses on investment transactions. To the extent that differences arise that are permanent in nature, such amounts are reclassified within the capital accounts as detailed below. Temporary differences do not require reclassification. Temporary and permanent differences do not impact the net asset values of the Funds.
At April 30, 2012, the cost and unrealized appreciation (depreciation) of investments (excluding investments in derivatives), as determined on a federal income tax basis, were as follows:
| Equity Index | Mid Cap Index |
Small Cap Index |
||||||||||
| Cost of investments |
$ | 529,180,720 | $ | 442,870,468 | $ | 103,813,913 | ||||||
| Gross unrealized: |
||||||||||||
| Appreciation |
388,852,464 | 81,427,172 | 24,030,603 | |||||||||
| Depreciation |
(58,210,249 | ) | (22,102,353 | ) | (9,846,459 | ) | ||||||
| Net unrealized appreciation (depreciation) of investments |
$ | 330,642,215 | $ | 59,324,819 | $ | 14,184,144 | ||||||
| Nuveen Investments | 99 |
Notes to Financial Statements (Unaudited) (continued)
Permanent differences, primarily due to tax equalization, redemption in-kind, distribution reclass and REIT adjustments, resulted in reclassifications among the Funds’ components of net assets at October 31, 2011, the Funds’ last tax year-end, as follows:
| Equity Index |
Mid Cap Index |
Small Cap Index |
||||||||||
| Capital paid-in |
$ | 7,942,474 | $ | 14,733,016 | $ | — | ||||||
| Undistributed (Over-distribution of) net investment income |
(150,706 | ) | — | (18 | ) | |||||||
| Accumulated net realized gain (loss) |
(7,791,768 | ) | (14,733,016 | ) | 18 | |||||||
The tax components of undistributed net ordinary income and net long-term capital gains at October 31, 2011, the Funds’ last tax year end, were as follows:
| Equity Index |
Mid Cap Index |
Small Cap Index |
||||||||||
| Undistributed ordinary income* |
$ | 3,408,540 | $ | 1,291,412 | $ | 264,307 | ||||||
| Undistributed net long-term capital gains |
51,934,511 | 11,190,512 | — | |||||||||
| * | Net ordinary income consists of net taxable income derived from dividends, interest and net short-term capital gains, if any. |
The tax character of distributions paid during the Funds’ last tax year ended October 31, 2011, was designated for purposes of the dividends paid deduction as follows:
| Equity Index |
Mid Cap Index |
Small Cap Index |
||||||||||
| Distributions from net ordinary income* |
$ | 14,500,272 | $ | 1,851,088 | $ | 485,479 | ||||||
| Distributions from net long-term capital gains |
52,878,282 | — | — | |||||||||
| * | Net ordinary income consists of net taxable income derived from dividends, interest and net short-term capital gains, if any. |
At October 31, 2011, the Funds’ last tax year end, the following Fund had unused capital loss carryforwards available for federal income tax purposes to be applied against future capital gains, if any. If not applied, the carryforwards will expire as follows:
| Small Cap Index |
||||
| Expiration year: |
||||
| October 31, 2017 |
$ | 610,815 | ||
During the Funds’ last tax year ended October 31, 2011, the following Funds utilized their capital loss carryforwards as follows:
| Mid Cap Index |
Small Cap Index |
|||||||
| Utilized capital loss carryforwards |
$ | 250,924 | $ | 5,034,731 | ||||
7. Management Fees and Other Transactions with Affiliates
Each Fund’s management fee consists of two components – a fund-level fee, based only on the amount of assets within each individual Fund, and a complex-level fee, based on the aggregate amount of all eligible fund assets managed by the Adviser. This pricing structure enables Fund shareholders to benefit from growth in the assets within their respective Fund as well as from growth in the amount of complex-wide assets managed by the Adviser.
The annual fund-level fee for each Fund, payable monthly, is calculated according to the following schedule:
| Average Daily Net Assets | Equity Fund-Level Fee Rate |
Mid Cap Fund-Level Fee Rate |
Small Cap Fund-Level Fee Rate |
|||||||||
| For the first $125 million |
.1000 | % | .1500 | % | .1500 | % | ||||||
| For the next $125 million |
.0875 | % | .1375 | % | .1375 | % | ||||||
| For the next $250 million |
.0750 | % | .1250 | % | .1250 | % | ||||||
| For the next $500 million |
.0625 | % | .1125 | % | .1125 | % | ||||||
| For the next $1 billion |
.0500 | % | .1000 | % | .1000 | % | ||||||
| For net assets over $2 billion |
.0250 | % | .0750 | % | .0750 | % | ||||||
| 100 | Nuveen Investments |
The annual complex-level fee for each Fund, payable monthly, is determined by taking the complex-level fee rate, which is based on the aggregate amount of “eligible assets” of all Nuveen funds as set forth in the schedule below, and making, as appropriate, an upward adjustment to that rate based upon the percentage of the particular fund’s assets that are not “eligible assets.” The complex-level fee schedule for each Fund is as follows:
| Complex-Level Asset Breakpoint Level* | Effective Rate at Breakpoint Level | |||
| $55 billion |
.2000 | % | ||
| $56 billion |
.1996 | % | ||
| $57 billion |
.1989 | % | ||
| $60 billion |
.1961 | % | ||
| $63 billion |
.1931 | % | ||
| $66 billion |
.1900 | % | ||
| $71 billion |
.1851 | % | ||
| $76 billion |
.1806 | % | ||
| $80 billion |
.1773 | % | ||
| $91 billion |
.1691 | % | ||
| $125 billion |
.1599 | % | ||
| $200 billion |
.1505 | % | ||
| $250 billion |
.1469 | % | ||
| $300 billion |
.1445 | % | ||
| * | The complex-level fee is calculated based upon the aggregate daily “eligible assets” of all Nuveen Funds. Eligible assets do not include assets attributable to investments in other Nuveen Funds or assets in excess of $2 billion added to the Nuveen Fund complex in connection with Nuveen Fund Advisors’ assumption of the management of the former First American Funds effective January 1, 2011. Eligible assets include closed-end fund assets managed by the Adviser that are attributable to financial leverage. For these purposes, financial leverage includes the closed-end funds’ use of preferred stock and borrowings and investments in the residual interest certificates (also called inverse floating rate securities) in tender option bond (TOB) trusts, including the portion of assets held by the TOB trust that has been effectively financed by the trust’s issuance of floating rate securities, subject to an agreement by the Adviser as to certain funds to limit the amount of such assets for determining eligible assets in certain circumstances. As of April 30, 2012, the complex-level fee rate for each of these Funds was as follows: |
| Fund | Complex-Level Fee Rate | |||
| Equity Index |
.1998 | % | ||
| Mid Cap Index |
.1896 | % | ||
| Small Cap Index |
.1947 | % | ||
The management fee compensates the Adviser for overall investment advisory and administrative services and general office facilities. The Adviser is responsible for each Fund’s overall strategy and asset allocation decisions. The Adviser has entered into sub-advisory agreements with Nuveen Asset Management, LLC (the “Sub-Adviser”), a wholly-owned subsidiary of the Adviser, under which the Sub-Adviser manages the investment portfolios of the Funds. The Sub-Adviser will be compensated for its services to the Funds from the management fees paid to the Adviser.
The Adviser has agreed to waive fees and/or reimburse other Fund expenses of each Fund so that total annual Fund operating expenses, after waivers and/or expense reimbursements and excluding any acquired Fund fees and expenses, do not exceed the average daily net assets of any class of Fund shares in the amounts and for the time periods stated in the following table:
| Equity Index |
Mid Cap Index |
Small Cap Index |
||||||||||
| Class A Shares |
.62 | % | .75 | % | .83 | % | ||||||
| Class B Shares |
1.37 | N/A | N/A | |||||||||
| Class C Shares |
1.37 | 1.50 | 1.58 | |||||||||
| Class R3 Shares |
.87 | 1.00 | 1.08 | |||||||||
| Class I Shares |
.37 | .50 | .58 | |||||||||
| Expiration date |
February 28, 2013 | February 28, 2013 | February 28, 2013 | |||||||||
N/A – Mid Cap Index and Small Cap Index do not offer Class B Shares.
The Adviser may also voluntarily reimburse expenses from time to time in any of the Funds. Voluntary reimbursements may be terminated at any time at the Adviser’s discretion.
The Trust pays no compensation directly to those of its directors who are affiliated with the Adviser or to its officers, all of whom receive remuneration for their services to the Trust from the Adviser or its affiliates. The Board of Directors has adopted a deferred compensation plan for independent directors that enable directors to elect to defer receipt of all or a portion of the annual compensation they are entitled to receive from certain Nuveen-advised funds. Under the plan, deferred amounts are treated as though equal dollar amounts had been invested in shares of select Nuveen-advised funds.
| Nuveen Investments | 101 |
Notes to Financial Statements (Unaudited) (continued)
Class A Shares are offered at their net asset value per share with no up-front sales charge. During the six months ended April 30, 2012, Nuveen Securities, LLC (the “Distributor”), a wholly owned subsidiary of Nuveen, received 12b-1 service fees in Class A Shares, substantially all of which were paid to compensate financial intermediaries for providing services to shareholders relating to their investments.
During the six months ended April 30, 2012, the Distributor compensated financial intermediaries directly with commission advances at the time of purchase as follows:
| Equity Index |
Mid Cap Index |
Small Cap Index |
||||||||||
| Commission advances |
$ | 2,500 | $ | 1,982 | $ | 633 | ||||||
All 12b-1 service and distribution fees collected on Class B and C Shares during the first year following a purchase were retained by the Distributor to compensate for commissions advanced to financial intermediaries. During the six months ended April 30, 2012, the Distributor retained such 12b-1 fees as follows:
| Equity Index |
Mid Cap Index |
Small Cap Index |
||||||||||
| 12b-1 fees retained |
$ | 20,779 | $ | 4,543 | $ | 4,054 | ||||||
The remaining 12b-1 fees charged to the Funds were paid to compensate financial intermediaries for providing services to shareholders relating to their investments.
The Distributor also collected and retained CDSC on share redemptions during the six months ended April 30, 2012, as follows:
| Equity Index |
Mid Cap Index |
Small Cap Index |
||||||||||
| CDSC retained |
$ | 2,219 | $ | 465 | $ | — | ||||||
8. New Accounting Pronouncements
Fair Value Measurements and Disclosures
On May 12, 2011, the Financial Accounting Standards Board (“FASB”) issued Accounting Standards Update (“ASU”) No. 2011-04 (“ASU No. 2011-04”) modifying Topic 820, Fair Value Measurements and Disclosures. At the same time, the International Accounting Standards Board (“IASB”) issued International Financial Reporting Standard (“IFRS”) 13, Fair Value Measurement. The objective of the FASB and IASB is convergence of their guidance on fair value measurements and disclosures. Specifically, ASU No. 2011-04 requires reporting entities to disclose i) the amounts of any transfers between Level 1 and Level 2, and the reasons for the transfers and, ii) for Level 3 fair value measurements, a) quantitative information about significant unobservable inputs used, b) a description of the valuation processes used by the reporting entity and c) a narrative description of the sensitivity of the fair value measurement to changes in unobservable inputs if a change in those inputs might result in a significantly higher or lower fair value measurement. The effective date of ASU No. 2011-04 is for interim and annual periods beginning after December 15, 2011. At this time, management is evaluating the implications of this guidance and the impact it will have to the financial statement amounts and footnote disclosures, if any.
| 102 | Nuveen Investments |
Notes
| Nuveen Investments | 103 |
Notes
| 104 | Nuveen Investments |
Notes
| Nuveen Investments | 105 |
Glossary of Terms Used in this Report
Average Annual Total Return: This is a commonly used method to express an investment’s performance over a particular, usually multi-year time period. It expresses the return that would have been necessary each year to equal the investment’s actual cumulative performance (including change in NAV or offer price and reinvested distributions and capital gains, if any) over the time period being considered.
Lipper S&P 500® Index Objective Funds Classification Average: Represents the average annualized total return for all reporting funds in the Lipper S&P 500® Index Objective Funds Classification. Lipper returns account for the effects of management fees and assume reinvestment of distributions but do not reflect any applicable sales charges.
Lipper Mid-Cap Core Funds Classification Average: Represents the average annualized total return for all reporting funds in the Lipper Mid-Cap Core Funds Classification. Lipper returns account for the effects of management fees and assume reinvestment of distributions but do not reflect any applicable sales charges.
Lipper Small-Cap Core Funds Classification Average: Represents the average annualized total return for all reporting funds in the Lipper Small-Cap Core Funds Classification. Lipper returns account for the effects of management fees and assume reinvestment of distributions but do not reflect any applicable sales charges.
Net Asset Value (NAV): The net market value of all securities held in a portfolio.
Net Asset Value (NAV) Per Share: The market value of one share of a mutual fund or closed-end fund. For a Fund, the NAV is calculated daily by taking the Fund’s total assets (securities, cash, and accrued earnings), subtracting the Fund’s liabilities, and dividing by the number of shares outstanding.
Russell 2000® Index: An index that measures the performance of the small-cap segment of the U.S. equity universe. The Russell 2000 is a subset of the Russell 3000® Index representing approximately 10% of the total market capitalization of that index. It includes approximately 2000 of the smallest securities based on a combination of their market cap and current index membership. The index returns assume reinvestment of distributions, but do not reflect any applicable sales charges or management fees.
S&P 500® Index: An unmanaged index generally considered representative of the U.S. stock market. The index returns assume reinvestment of distributions, but do not reflect any applicable sales charges or management fees.
S&P MidCap 400® Index: An unmanaged, market value-weighted index of 400 mid-cap companies. The index returns assume reinvestment of distributions, but do not reflect any applicable sales charges or management fees.
Tax Equalization: The practice of treating a portion of the distribution made to a redeeming shareholder, which represents his proportionate part of undistributed net investment income and capital gain as a distribution for tax purposes. Such amounts are referred to as the equalization debits (or payments) and will be considered a distribution to the shareholder of net investment income and capital gain for calculation of the Fund’s dividends paid deduction.
| 106 | Nuveen Investments |
| * | The Board of Directors of the Funds, upon recommendation of the Audit Committee, engaged PricewaterhouseCoopers LLP as the Funds’ independent registered public accounting firm as of March 1, 2011. On December 30, 2011, Ernst & Young, LLP (“Ernst & Young”) completed its work on the October 31, 2011 audits and resigned as the independent registered public accounting firm of the Funds. |
| Ernst & Young’s report on the Funds’ financial statements for the most recent fiscal year contained no adverse opinion or disclaimer of opinion, and were not qualified or modified as to uncertainty, audit scope or accounting principles. For the most recent fiscal year and through March 1, 2011, there were no disagreements with Ernst & Young on any matter of accounting principles, financial statement disclosure or auditing scope or procedures, which disagreements, if not resolved to the satisfaction of Ernst & Young, would have caused it to make reference to the subject matter of the disagreements in connection with its reports on the Funds’ financial statements. |
Quarterly Portfolio of Investments and Proxy Voting information: You may obtain (i) each Fund’s quarterly portfolio of investments, (ii) information regarding how each Fund voted proxies relating to portfolio securities held during the most recent twelve-month period ended June 30, and (iii) a description of the policies and procedures that each Fund used to determine how to vote proxies relating to portfolio securities without charge, upon request, by calling Nuveen Investments at (800) 257-8787 or on Nuveen’s website at www.nuveen.com.
You may also obtain this and other Fund information directly from the Securities and Exchange Commission (SEC). The SEC may charge a copying fee for this information. Visit the SEC on-line at http://www.sec.gov or in person at the SEC’s Public Reference Room in Washington, D.C. Call the SEC at (202) 942-8090 for room hours and operation. You may also request Fund information by sending an e-mail request to publicinfo@sec.gov or by writing to the SEC’s Public Reference Section at 100 F Street NE, Washington, D.C. 20549.
The Financial Industry Regulatory Authority (FINRA) provides a Public Disclosure Program which supplies certain information regarding the disciplinary history of FINRA members and their associated persons in response to either telephone inquiries at (800) 289-9999 or written inquiries at www.finra.org. FINRA also provides an investor brochure that includes information describing the Public Disclosure Program.
| Nuveen Investments | 107 |
Nuveen Investments:
Serving Investors for Generations
Since 1898, financial advisors and their clients have relied on Nuveen Investments to provide dependable investment solutions through continued adherence to proven, long-term investing principles. Today, we offer a range of high quality equity and fixed-income solutions designed to be integral components of a well-diversified core portfolio.
Focused on meeting investor needs.
Nuveen Investments provides high-quality investment services designed to help secure the longterm goals of institutional and individual investors as well as the consultants and financial advisors who serve them. Nuveen Investments markets a wide range of specialized investment solutions which provide investors access to capabilities of its high-quality boutique investment affiliates-Nuveen Asset Management, Symphony Asset Management, NWQ Investment Management Company, Santa Barbara Asset Management, Tradewinds Global Investors, Winslow Capital Management, and Gresham Investment Management. In total, Nuveen Investments managed approximately $227 billion as of March 31, 2012.
Find out how we can help you.
To learn more about how the products and services of Nuveen Investments may be able to help you meet your financial goals, talk to your financial advisor, or call us at (800) 257-8787. Please read the information provided carefully before you invest. Investors should consider the investment objective and policies, risk considerations, charges and expenses of any investment carefully. Where applicable, be sure to obtain a prospectus, which contains this and other relevant information. To obtain a prospectus, please contact your securities representative or Nuveen Investments, 333 W. Wacker Dr., Chicago, IL 60606. Please read the prospectus carefully before you invest or send money.
Learn more about Nuveen Funds at: www.nuveen.com/mf
| Distributed by Nuveen Securities, LLC 333 West Wacker Drive Chicago, IL 60606 www.nuveen.com |
MSA-FIDX-0412D

Mutual Funds
Nuveen Equity Funds
For investors seeking the potential for long-term capital appreciation.
Semi-Annual Report
April 30, 2012
| Share Class / Ticker Symbol | ||||||||||
| Fund Name | Class A | Class B | Class C | Class R3 | Class I | |||||
| Nuveen Dividend Value Fund (formerly Nuveen Equity Income Fund) |
FFEIX | FAEBX | FFECX | FEISX | FAQIX | |||||
| Nuveen Large Cap Value Fund |
FASKX | FATBX | FALVX | FAVSX | FSKIX | |||||
| Nuveen Mid Cap Value Fund |
FASEX | FAESX | FACSX | FMVSX | FSEIX | |||||
| Nuveen Small Cap Value Fund |
FSCAX | — | FSCVX | FSVSX | FSCCX | |||||
LIFE IS COMPLEX.
Nuveen makes things e-simple.
It only takes a minute to sign up for e-Reports. Once enrolled, you’ll receive an e-mail as soon as your Nuveen Fund information is ready. No more waiting for delivery by regular mail. Just click on the link within the e-mail to see the report and save it on your computer if you wish.
Free e-Reports right to your e-mail!
www.investordelivery.com
If you receive your Nuveen Fund distributions and statements from your financial advisor or brokerage account.
OR
www.nuveen.com/accountaccess
If you receive your Nuveen Fund distributions and statements directly from Nuveen.
| Must be preceded by or accompanied by a prospectus. | NOT FDIC INSURED | MAY LOSE VALUE | NO BANK GUARANTEE |
| 4 | ||||
| 5 | ||||
| 12 | ||||
| 17 | ||||
| 18 | ||||
| 20 | ||||
| 32 | ||||
| 33 | ||||
| 34 | ||||
| 36 | ||||
| 44 | ||||
| 54 | ||||
| 55 | ||||
Letter to Shareholders


| 4 | Nuveen Investments |
Certain statements in this report are forward-looking statements. Discussions of specific investments are for illustration only and are not intended as recommendations of individual investments. The forward-looking statements and other views expressed herein are those of the portfolio managers as of the date of this report. Actual future results or occurrences may differ significantly from those anticipated in any forward-looking statements and the views expressed herein are subject to change at any time, due to numerous market and other factors. The Funds disclaim any obligation to update publicly or revise any forward-looking statements or views expressed herein.
These Funds feature portfolio management by Nuveen Asset Management, LLC, an affiliate of Nuveen Investments.
Effective February 29, 2012, the Nuveen Equity Income Fund’s name changed to the Nuveen Dividend Value Fund. There have been no changes in the Fund’s investment objectives or policies. Cori Johnson, CFA, Gerald Bren, CFA, and Derek Sadowsky are the portfolio managers for the Fund. Cori, who has 31 years of investment experience, assumed portfolio management responsibilities in 1996. Gerald, with 40 years of investment experience, has been a manager on this Fund since 1994. Derek, who has 14 years of investment experience, became a co-manager on the Dividend Value Fund management team in February of 2012.
Effective April 10, 2012, Cori, Gerald, and Derek were named co-portfolio managers of the Nuveen Large Cap Value Fund. Brent Mellum, CFA, and Kevin Earley, CFA, are no longer portfolio managers of the Fund. There have been no changes in the Fund’s investment objectives or policies. The Board of Directors has approved the reorganization of the Nuveen Large Cap Value Fund into the Nuveen Dividend Value Fund. In order for the reorganization to occur, it must be approved by the shareholders of Nuveen Large Cap Value Fund. A special meeting of Nuveen Large Cap Value Fund’s shareholders for the purpose of voting on the reorganization is expected to be held in early October 2012. Further information regarding the proposed reorganization will be contained in proxy materials that are expected to be sent to Nuveen Large Cap Value Fund’s shareholders in late August 2012. Shareholders are urged to read the proxy materials carefully. Free copies of the proxy materials will be available on the SEC’s web site at www.sec.gov.
Also effective April 10, 2012, Karen Bowie, CFA, and David Chalupnik, CFA, were named co-portfolio managers of the Nuveen Mid Cap Value Fund. Karen and David each have 28 years of investment experience. Brent Mellum, CFA, and Kevin Earley, CFA, are no longer portfolio managers of the Fund. There have been no changes in the Nuveen Mid Cap Value Fund’s investment objectives or policies.
Karen Bowie is also the portfolio manager for the Nuveen Small Cap Value Fund. She assumed portfolio management responsibilities for the Fund in 2006.
On the following pages, the portfolio management teams for the Funds examine key investment strategies and the Funds’ performance for the six-month period ended April 30, 2012.
| Nuveen Investments | 5 |
Nuveen Dividend Value Fund (formerly Nuveen Equity Income Fund)
How did the Fund perform during the six-month period ended April 30, 2012?
The tables in the Fund Performance and Expense Ratios section of this report provide Class A Share total returns for the Fund for the six-month, one-year, five-year and ten-year periods ended April 30, 2012. The Fund’s Class A Shares at net asset value (NAV) outperformed the Russell 1000® Value Index and its Lipper classification average, but underperformed the S&P 500® Index over the six-month period.
What strategies were used to manage the Fund during the reporting period? How did these strategies influence performance?
Over the six-month period, we continued to implement the Fund’s disciplined investment strategy. We seek to achieve consistent, long-term outperformance with lower volatility by building and managing a portfolio diversified between core and opportunistic holdings with a focus on what we believe are attractively valued companies with above average current income or dividend growth. We use an integrated, multi-perspective research and analysis approach that involves a team of portfolio managers, fundamental research analysts and quantitative analysts. The Fund’s holdings exhibit attractive valuations and identifiable catalysts that we believe will drive future stock appreciation. The Fund is also actively managed in an effort to minimize distributed capital gains and maximize after-tax returns using a typical investment horizon of at least two to three years. We adhere to portfolio guidelines to manage volatility and maintain diversification, generally selling a security if it no longer is expected to meet our dividend growth or price appreciation expectations or if we find a better alternative in the marketplace.
The Fund outperformed its Russell benchmark and Lipper average over this period, primarily as a result of favorable security selection in the information technology and consumer discretionary sectors. In information technology, the Fund’s position in Seagate Technology was a particularly strong performer. The company, a leading producer of hard drives, benefited from higher margins when floods in Thailand curtailed the production of its competitors. Consolidation in the market has since produced optimism that pricing will remain stronger and justify higher stock valuations. In addition, Microsoft showed strong gains as initial reports on its new Windows 8, which is expected by year end, showed promise as the operating system will be similar across all platforms from PCs to smart phones. Microsoft’s smart phone offerings have been laggards to date so Windows 8 success could lead to significant share gains. In consumer discretionary, Yum! Brands and Starbucks both experienced strong gains as consumer confidence improved their prospects both domestically and in Asia. Yum! Brands continued to show strong sales in China as it enhanced its position as a leading restaurant chain in the country. Starbucks rose in value as its introduction of single serve products for the Keurig coffeemakers achieved initial success, while at the same time the company announced further product ventures. Furthermore, Starbucks continued to have strong sales as new locations opened in China. Europe remained an area of weakness; however, declining raw coffee bean costs and continued gains in Asian market sales helped to offset the economic slowdown in Europe.
| 6 | Nuveen Investments |
The Fund’s performance was negatively impacted by its underweight in the financials sector as well as unfavorable stock selection in the health care and telecommunication services sectors. The financials sector carries a large weight in the benchmark, and it showed stronger performance as fears related to European financial conditions subsided somewhat during the reporting period. While Greece and Spain have fallen into recession, major financial institutions for the most part have been supported by various European Central Bank programs. Fears about failures in the financial institutions spread to U.S. based financials as well in mid 2011; however, financial stocks experienced a significant rally in their values beginning in late 2011, leading to strong performance across the sector for the six-month period. Therefore, our underweight position in this strongly performing sector reduced the Fund’s overall return. In health care, the Fund did not hold Amgen, a relatively large index position that had strong gains. This accounted for most of the Fund’s shortfall in this sector. Finally, Windstream, a regional wireline-based telecommunications company, experienced weak results during the reporting period. Investors were concerned about its acquisition of Paetec Holding Corporation, a provider of data center, business data and cloud applications, would lead to some initial dilution before merger cost savings could be realized. The Fund did not sell its position in Windstream as we believed its longer term prospects will likely be enhanced by the merger.
Nuveen Large Cap Value Fund
How did the Fund perform during the six-month period ended April 30, 2012?
The tables in the Fund Performance and Expense Ratios section of this report provide Class A Share total returns for the Fund for the six-month, one-year, five-year and ten-year periods ended April 30, 2012. The Fund’s Class A Shares at net asset value (NAV) outperformed both the Russell 1000® Value Index and the Lipper classification average over the six-month period.
What strategies were used to manage the Fund during the reporting period? How did these strategies influence performance?
The Fund pursues a long-term capital appreciation strategy by investing primarily in the common stocks of companies that have market capitalizations of $5 billion or greater at the time of purchase. During this period, we continued to implement the Fund’s investment process of selecting large-cap companies that we believe are undervalued relative to other companies in the same industry or market that demonstrate improving fundamentals and that exhibit a near term catalyst that could close the gap between market value and our perception of fair value. Generally, we sold a holding if the stock price reached its target, the company’s fundamentals or competitive position significantly deteriorated or if a better alternative existed in the marketplace.
The Fund outperformed its Russell benchmark and Lipper average over this period, primarily as a result of strong issue selection in the consumer discretionary and consumer staples sectors. Within consumer discretionary, positions in Wyndham Worldwide, Comcast and CBS all contributed significantly. Wyndham, a hotel and resort company, is
| Nuveen Investments | 7 |
sensitive to economic conditions. The stock market rally which began in mid-fall 2011 was aided by a perception that consumer spending would be sustained in 2012. Comcast and CBS are both media and entertainment companies and, like Wyndham, are sensitive to consumer spending trends. These stocks bottomed in early fall 2011 and experienced a strong recovery during the market’s relief rally. Positive results in consumer staples were largely driven by strong gains in Dean Foods and Philip Morris International. Dean Foods is the largest U.S. producer of dairy products and is structured with relatively high leverage. Difficult competitive conditions improved in late 2011, leading to a strong recovery in the company’s operating income. Philip Morris is a historically profitable company with large cash flows. Because the stock pays a relatively high dividend, it was rewarded as investors searched out securities that have yields competitive with bonds. Additionally, the company’s international sales benefited from the fiscal pressures faced by various countries. Because cigarette taxes are a major revenue source for many countries, the company has been pressured to raise prices, leading to new highs for its gross margins.
The Fund’s performance was negatively impacted by unfavorable stock selection in the industrials and materials sectors. For example Fluor, an engineering and construction firm, was a relative laggard. While the company’s revenue and earnings trends were favorable, Fluor is heavily dependent on continued orders for mine developments as well as oil and gas downstream developments. As such, its stock is sensitive to growth trends in Asia, which remain at risk after an extended period of extraordinary strength. Similarly, positions in Potash Corporation of Saskatchewan and Dow Chemical lagged, again as a result of concerns that weaker growth from Asia would lead to lower commodity prices.
Nuveen Mid Cap Value Fund
How did the Fund perform during the six-month period ended April 30, 2012?
The tables in the Fund Performance and Expense Ratios section of this report provide Class A Share total returns for the Fund for the six-month, one-year, five-year and ten-year periods ended April 30, 2012. The Fund’s Class A Shares at net asset value (NAV) underperformed both the Russell Mid Cap® Value Index and the Lipper classification average over the six-month period.
What strategies were used to manage the Fund during the reporting period? How did these strategies influence performance?
The Fund seeks to provide long-term capital appreciation by investing primarily in the common stocks of companies with market capitalizations at the time of purchase between approximately $350 million and $14 billion. During the period, we continued to implement the Fund’s investment process of selecting mid-cap companies that we believed were undervalued relative to other companies in the same industry or market, that demonstrated improving fundamentals, and that exhibited a near-term catalyst that could close the gap between market value and our perception of fair value. We look for companies that generate strong free cash flow, which allows them to pay down debt, increase dividends, repurchase shares or engage in merger and acquisition activities. At
| 8 | Nuveen Investments |
the same time, we identify a short- or long-term catalyst we can track and monitor over time that could potentially propel each stock to realize its value. Generally, we sold a holding if the stock price reached its target, the company’s fundamentals or competitive position significantly deteriorated or if a better alternative existed in the marketplace.
The Fund performed well in absolute terms during the period’s strongly advancing market, but still fell short of the Russell benchmark and Lipper average returns. We did experience several bright spots in terms of sector weights and stock selection. For example, the Fund’s underweight position in the utilities sector benefited relative performance. Utilities trailed in the strong market environment that was fueled by improving economic conditions in the U.S. We also experienced solid stock selection in the consumer discretionary sector. For example, we continued to see outperformance in retail from turnaround story Foot Locker, a leading athletic footwear and apparel retailer, and Macy’s, the large department store chain. Both retailers benefited from good execution as they continued to beat their competition and gain market share. In the housing industry, the Fund benefited from purchasing home builder D.R. Horton upon signs of stabilization in the housing industry. Other consumer discretionary companies that had a significant positive impact on the portfolio included hotel chain Wyndham Worldwide, toy company Mattel and recreational equipment maker Jarden. These stocks were inexpensive when we bought them based on recommendations by our fundamental analysts. As the economy began to improve, the market was willing to pay more for these fundamentally strong, attractively valued companies that were demonstrating strong execution.
The Fund’s performance was negatively impacted by our underweight position in the financial sector as well as poor stock selection in financials, technology and health care during the period. Because of improving economic conditions in the U.S., financials did outperform the overall Russell Micap® Value Index. Therefore, the Fund’s underweight stance proved detrimental. Also, some of the more aggressive, lower quality financial companies in the benchmark outperformed some of the higher credit quality financials with stronger capital and balance sheet positions that the Fund held. In technology, Polycom was the primary source of underperformance. Shares of Polycom, a telecommunications equipment company, took a hit after the company fell short of earnings expectations for several quarters in a row. The market began to fear the company was losing market share to its largest competitor, Cisco Systems. We continued to own this stock because we believed it would perform better going forward. Not only has Polycom’s stock been attractively valued, but our fundamental work shows the company has been holding its market share and we believe it may likely experience better execution over the next six months. In health care, our position in Humana underperformed over the six-month period. As economic and employment numbers improved, concerns grew over higher levels of utilization for health care services. During the financial crisis, fewer people used health care services, leading to favorable cost trends for HMOs like Humana. With the economy improving, people are returning to doctors, putting pressure on future HMO profitability.
| Nuveen Investments | 9 |
Nuveen Small Cap Value Fund
How did the Fund perform during the six-month period ended April 30, 2012?
The tables in the Fund Performance and Expense Ratios section of this report provide Class A Share total returns for the Fund for the six-month, one-year, five-year and ten-year periods ended April 30, 2012. The Fund’s Class A Shares at net asset value (NAV) outperformed both the Russell 2000® Value Index and the Lipper classification average over the six-month period.
What strategies were used to manage the Fund during the reporting period? How did these strategies influence performance?
The Fund seeks to provide long-term capital appreciation by investing primarily in the common stocks of companies with market capitalizations of less than $3 billion at the time of purchase. During the six-month period, we continued to focus on building a well-diversified portfolio of small-cap stocks from companies that we believed had strengthening balance sheets and free cash flow characteristics. We also continued to target companies with what we thought were sound business models and strong competitive advantages that might gain market share opportunistically in the current environment. We remained committed to our approach of investing in quality companies that are trading at what we believe is a discount to both intrinsic and relative value metrics.
The Fund’s outperformance during the period was primarily driven by favorable stock selection across several sectors including overweight positions in consumer discretionary and health care and underweight positions in utilities and consumer staples. The top contributors to the Fund’s performance were well distributed across a number of sectors. Within the consumer discretionary sector our strongest performers were Sally Beauty Holdings and Group 1 Automotive. Sally Beauty, the leading distributor of brand name beauty products to salon professionals, continued to benefit from solid organic sales growth, accretive acquisitions and improved liquidity. Group 1 Automotive, a leading national auto dealer franchise, benefited from the recovery of domestic auto sales. Within health care, ICU Medical, a medical technologies firm focused on vascular systems, continued to execute on its revenue goals while moving forward with an attractive new product pipeline. In the financial sector, Delphi Financial Group, a firm focused on employee benefit insurance, was acquired. This acquisition aided the Fund’s results. Additionally, Texas Capital Bancshares, a commercial lending focused regional bank, continued to demonstrate strong lending growth and credit improvement trends that surpassed many of its peers.
The Fund’s overweight positions in both the energy and technology sectors were slight detractors from our results. Another reason for underperformance was the Fund’s cash exposure of approximately 1.9% of net assets in a strongly advancing market environment. Other individual detractors included RF MicroDevices, a semiconductor firm, which experienced weaker sales from China during the period. In energy, Newpark Resources, a supplier of fluid and engineering products to the oil and gas industry, was negatively impacted by disorder in a key input cost, barite. The limited supply of barite
| 10 | Nuveen Investments |
negatively impacted the firm’s margins. PHH Mortgage, a mortgage lending servicer, was a detractor in the industrials sector. There were concerns regarding liquidity shortfalls during late 2011 as mortgage defaults coupled with upcoming debt maturities clouded the outlook for this firm.
Risk Considerations
Mutual fund investing involves risk; principal loss is possible.
Nuveen Dividend Value Fund
Equity investments such as those held by the Fund, are subject to market risk and derivatives risk; dividends are not guaranteed. Foreign investments involve additional risks, including currency fluctuation, political and economic instability, lack of liquidity and differing legal and accounting standards. These risks are magnified in emerging markets. In addition, the Fund invests in debt or fixed income securities that are subject to credit risk and interest rate risk. Below investment grade or high yield debt securities are subject to heightened credit risk, liquidity risk and potential for default.
Nuveen Large Cap Value Fund
Equity investments such as those held by the Fund, are subject to market risk, derivatives risk, value stock risk, and common stock risk. Foreign investments involve additional risks, including currency fluctuation, political and economic instability, lack of liquidity and differing legal and accounting standards. These risks are magnified in emerging markets.
Nuveen Mid Cap Value Fund
Equity investments such as those held by the Fund, are subject to market risk, derivatives risk, value stock risk, and common stock risk. Investments in mid-cap companies are subject to greater volatility. Foreign investments involve additional risks, including currency fluctuation, political and economic instability, lack of liquidity and differing legal and accounting standards. These risks are magnified in emerging markets.
Nuveen Small Cap Value Fund
Equity investments such as those held by the Fund, are subject to market risk, derivatives risk, value stock risk, and common stock risk. Investments in small-cap companies are subject to greater volatility. Foreign investments involve additional risks, including currency fluctuation, political and economic instability, lack of liquidity and differing legal and accounting standards. These risks are magnified in emerging markets.
| Nuveen Investments | 11 |
Fund Performance and Expense Ratios
The Fund Performance and Expense Ratios for each Fund are shown on the following four pages.
Returns quoted represent past performance, which is no guarantee of future results. Current performance may be higher or lower than the performance shown. Investment returns and principal value will fluctuate so that when shares are redeemed, they may be worth more or less than their original cost. Returns without sales charges would be lower if the sales charge were included. Returns do not reflect the deduction of taxes that a shareholder would pay on Fund distributions or the redemption of Fund shares.
Returns may reflect a contractual agreement between certain Funds and the investment adviser to waive certain fees and expenses; see Notes to Financial Statements, Footnote 7 — Management Fees and Other Transactions with Affiliates for more information. In addition, returns may reflect a voluntary expense limitation by the Funds’ investment adviser that may be modified or discontinued at any time without notice. For the most recent month-end performance visit www.nuveen.com or call (800) 257-8787.
Returns reflect differences in sales charges and expenses, which are primarily differences in distribution and service fees. Fund returns assume reinvestment of dividends and capital gains.
Comparative index and Lipper return information is provided for the Funds’ Class A Shares at net asset value (NAV) only.
The expense ratios shown reflect the Funds’ total operating expenses (before fee waivers or expense reimbursements, if any) as shown in the Funds’ most recent prospectus. The expense ratios include management fees and other fees and expenses.
| 12 | Nuveen Investments |
Nuveen Dividend Value Fund
Refer to the first page of this Fund Performance and Expense Ratios section for further explanation of the information included within this page.
Fund Performance
Average Annual Total Returns as of April 30, 2012*
|
Cumulative |
Average Annual | |||||||||||||||||
| 6-Month | 1-Year | 5-Year | 10-Year | |||||||||||||||
| Class A Shares at NAV |
12.56% | 3.79% | 2.61% | 5.30% | ||||||||||||||
| Class A Shares at maximum Offering Price |
6.06% | -2.16% | 1.40% | 4.68% | ||||||||||||||
| S&P 500® Index** |
12.77% | 4.76% | 1.01% | 4.71% | ||||||||||||||
| Russell 1000® Value Index** |
11.62% | 1.03% | -1.73% | 4.83% | ||||||||||||||
| Lipper Equity Income Funds Classification Average** |
10.34% | 2.51% | 0.96% | 5.28% | ||||||||||||||
| Class B Shares w/o CDSC*** |
12.10% | 2.96% | 1.83% | 4.51% | ||||||||||||||
| Class B Shares w/CDSC*** |
7.10% | -2.04% | 1.65% | 4.51% | ||||||||||||||
| Class C Shares |
12.19% | 3.04% | 1.84% | 4.51% | ||||||||||||||
| Class R3 Shares |
12.52% | 3.54% | 2.34% | 5.08% | ||||||||||||||
| Class I Shares |
12.68% | 4.04% | 2.85% | 5.56% | ||||||||||||||
Average Annual Total Returns as of March 31, 2012 (Most Recent Calendar Quarter)*
|
Cumulative |
Average Annual | |||||||||||||||||
| 6-Month | 1-Year | 5-Year | 10-Year | |||||||||||||||
| Class A Shares at NAV |
25.26% | 7.16% | 3.43% | 4.93% | ||||||||||||||
| Class A Shares at maximum Offering Price |
18.03% | 0.97% | 2.22% | 4.31% | ||||||||||||||
| Class B Shares w/o CDSC*** |
24.75% | 6.33% | 2.65% | 4.14% | ||||||||||||||
| Class B Shares w/CDSC*** |
19.75% | 1.33% | 2.48% | 4.14% | ||||||||||||||
| Class C Shares |
24.68% | 6.33% | 2.65% | 4.13% | ||||||||||||||
| Class R3 Shares |
25.15% | 6.90% | 3.16% | 4.71% | ||||||||||||||
| Class I Shares |
25.40% | 7.39% | 3.69% | 5.19% | ||||||||||||||
Class A Shares have a maximum 5.75% sales charge (Offering Price). Class A Share purchases of $1 million or more are sold at net asset value without an up-front sales charge but may be subject to a contingent deferred sales charge (CDSC), also known as a back-end sales charge, if redeemed within twelve months of purchase. Class B Shares have a CDSC that begins at 5% for redemptions during the first year and declines periodically until after six years when the charge becomes 0%. Class B Shares automatically convert to Class A Shares eight years after purchase. Class C Shares have a 1% CDSC for redemptions within less than twelve months, which is not reflected in the one-year total return. Class R3 Shares have no sales charge and are available to only certain retirement plans. Class I Shares have no sales charge and may be purchased under limited circumstances or by specified classes of investors.
Expense Ratios as of Most Recent Prospectus
| Expense Ratios |
||||
| Class A Shares |
1.14% | |||
| Class B Shares |
1.89% | |||
| Class C Shares |
1.89% | |||
| Class R3 Shares |
1.39% | |||
| Class I Shares |
0.89% | |||
| * | Six-month returns are cumulative; all other returns are annualized. |
| ** | Refer to the Glossary of Terms Used in this Report for definitions. Indexes and Lipper averages are not available for direct Investment. |
| *** | Class B Shares are available only upon the exchange of Class B Shares from another Nuveen mutual fund or for purposes of dividend reinvestment, but Class B Shares are not available for new accounts or for additional investment into existing accounts. |
| Nuveen Investments | 13 |
Fund Performance and Expense Ratios (continued)
Nuveen Large Cap Value Fund
Refer to the first page of this Fund Performance and Expense Ratios section for further explanation of the information included within this page.
Fund Performance
Average Annual Total Returns as of April 30, 2012*
|
Cumulative |
Average Annual | |||||||||||||||||
| 6-Month | 1-Year | 5-Year | 10-Year | |||||||||||||||
| Class A Shares at NAV |
12.88% | -0.87% | -2.12% | 3.21% | ||||||||||||||
| Class A Shares at maximum Offering Price |
6.39% | -6.56% | -3.27% | 2.60% | ||||||||||||||
| Russell 1000® Value Index** |
11.62% | 1.03% | -1.73% | 4.83% | ||||||||||||||
| Lipper Large-Cap Value Funds Classification Average** |
11.18% | -0.48% | -1.70% | 3.97% | ||||||||||||||
| Class C Shares |
12.42% | -1.61% | -2.85% | 2.43% | ||||||||||||||
| Class R3 Shares |
12.75% | -1.13% | -2.37% | 2.99% | ||||||||||||||
| Class I Shares |
13.02% | -0.61% | -1.87% | 3.46% | ||||||||||||||
Average Annual Total Returns as of March 31, 2012 (Most Recent Calendar Quarter)*
|
Cumulative |
Average Annual | |||||||||||||||||
| 6-Month | 1-Year | 5-Year | 10-Year | |||||||||||||||
| Class A Shares at NAV |
28.57% | 0.54% | -1.09% | 2.86% | ||||||||||||||
| Class A Shares at maximum Offering Price |
21.15% | -5.23% | -2.25% | 2.25% | ||||||||||||||
| Class C Shares |
28.03% | -0.19% | -1.84% | 2.09% | ||||||||||||||
| Class R3 Shares |
28.42% | 0.34% | -1.34% | 2.66% | ||||||||||||||
| Class I Shares |
28.73% | 0.79% | -0.85% | 3.12% | ||||||||||||||
Class A Shares have a maximum 5.75% sales charge (Offering Price). Class A Share purchases of $1 million or more are sold at net asset value without an up-front sales charge but may be subject to a contingent deferred sales charge (CDSC), also known as a back-end sales charge, if redeemed within twelve months of purchase. Class C Shares have a 1% CDSC for redemptions within less than twelve months, which is not reflected in the one-year total return. Class R3 Shares have no sales charge and are available to only certain retirement plans. Class I Shares have no sales charge and may be purchased under limited circumstances or by specified classes of investors.
Expense Ratios as of Most Recent Prospectus
| Expense Ratios |
||||
| Class A Shares |
1.19% | |||
| Class C Shares |
1.94% | |||
| Class R3 Shares |
1.44% | |||
| Class I Shares |
0.94% | |||
| * | Six-month returns are cumulative; all other returns are annualized. |
| ** | Refer to the Glossary of Terms Used in this Report for definitions. Indexes and Lipper averages are not available for direct investment. |
| 14 | Nuveen Investments |
Nuveen Mid Cap Value Fund
Refer to the first page of this Fund Performance and Expense Ratios section for further explanation of the information included within this page.
Fund Performance
Average Annual Total Returns as of April 30, 2012*
| Cumulative | Average Annual | |||||||||||||||||
| 6-Month | 1-Year | 5-Year | 10-Year | |||||||||||||||
| Class A Shares at NAV |
10.08% | -5.88% | -0.65% | 6.31% | ||||||||||||||
| Class A Shares at maximum Offering Price |
3.76% | -11.30% | -1.82% | 5.68% | ||||||||||||||
| Russell Midcap® Value Index** |
11.48% | -0.81% | 0.50% | 7.95% | ||||||||||||||
| Lipper Mid-Cap Value Funds Classification Average** |
11.26% | -3.07% | 0.00% | 6.33% | ||||||||||||||
| Class B Shares w/o CDSC*** |
9.65% | -6.56% | -1.39% | 5.53% | ||||||||||||||
| Class B Shares w/CDSC*** |
4.65% | -11.23% | -1.57% | 5.53% | ||||||||||||||
| Class C Shares |
9.62% | -6.58% | -1.40% | 5.52% | ||||||||||||||
| Class R3 Shares |
9.89% | -6.12% | -0.91% | 6.11% | ||||||||||||||
| Class I Shares |
10.16% | -5.67% | -0.42% | 6.57% | ||||||||||||||
Average Annual Total Returns as of March 31, 2012 (Most Recent Calendar Quarter)*
| Cumulative | Average Annual | |||||||||||||||||
| 6-Month | 1-Year | 5-Year | 10-Year | |||||||||||||||
| Class A Shares at NAV |
25.69% | -3.02% | 0.41% | 6.43% | ||||||||||||||
| Class A Shares at maximum Offering Price |
18.47% | -8.60% | -0.78% | 5.80% | ||||||||||||||
| Class B Shares w/o CDSC*** |
25.16% | -3.76% | -0.33% | 5.64% | ||||||||||||||
| Class B Shares w/CDSC*** |
20.16% | -8.57% | -0.52% | 5.64% | ||||||||||||||
| Class C Shares |
25.26% | -3.72% | -0.34% | 5.64% | ||||||||||||||
| Class R3 Shares |
25.51% | -3.25% | 0.17% | 6.23% | ||||||||||||||
| Class I Shares |
25.79% | -2.79% | 0.65% | 6.69% | ||||||||||||||
Class A Shares have a maximum 5.75% sales charge (Offering Price). Class A Share purchases of $1 million or more are sold at net asset value without an up-front sales charge but may be subject to a contingent deferred sales charge (CDSC), also known as a back-end sales charge, if redeemed within twelve months of purchase. Class B Shares have a CDSC that begins at 5% for redemptions during the first year and declines periodically until after six years when the charge becomes 0%. Class B Shares automatically convert to Class A Shares eight years after purchase. Class C Shares have a 1% CDSC for redemptions within less than twelve months, which is not reflected in the one-year total return. Class R3 Shares have no sales charge and are available to only certain retirement plans. Class I Shares have no sales charge and may be purchased under limited circumstances or by specified classes of investors.
| Expense Ratios as of Most Recent Prospectus | ||||
| Expense Ratios |
||||
| Class A Shares |
1.32% | |||
| Class B Shares |
2.07% | |||
| Class C Shares |
2.07% | |||
| Class R3 Shares |
1.57% | |||
| Class I Shares |
1.07% | |||
| * | Six-month returns are cumulative; all other returns are annualized. |
| ** | Refer to the Glossary of Terms Used in this Report for definitions. Indexes and Lipper averages are not available for direct investment. |
| *** | Class B Shares are available only upon the exchange of Class B Shares from another Nuveen mutual fund or for purposes of dividend reinvestment, but Class B Shares are not available for new accounts or for additional investment into existing accounts. |
| Nuveen Investments | 15 |
Fund Performance and Expense Ratios (continued)
Nuveen Small Cap Value Fund
Refer to the first page of this Fund Performance and Expense Ratios section for further explanation of the information included within this page.
Fund Performance
Average Annual Total Returns as of April 30, 2012*
|
Cumulative |
Average Annual | |||||||||||||||||
| 6-Month | 1-Year | 5-Year | 10-Year | |||||||||||||||
| Class A Shares at NAV |
12.83% | 0.39% | 1.59% | 5.97% | ||||||||||||||
| Class A Shares at maximum Offering Price |
6.34% | -5.35% | 0.39% | 5.35% | ||||||||||||||
| Russell 2000® Value Index** |
11.47% | -4.06% | -0.49% | 6.07% | ||||||||||||||
| Lipper Small-Cap Value Funds Classification Average** |
11.35% | -3.78% | 0.87% | 6.75% | ||||||||||||||
| Class C Shares |
12.39% | -0.36% | 0.83% | 5.19% | ||||||||||||||
| Class R3 Shares |
12.69% | 0.16% | 1.34% | 5.79% | ||||||||||||||
| Class I Shares |
12.96% | 0.61% | 1.83% | 6.24% | ||||||||||||||
Average Annual Total Returns as of March 31, 2012 (Most Recent Calendar Quarter)*
|
Cumulative |
Average Annual | |||||||||||||||||
| 6-Month | 1-Year | 5-Year | 10-Year | |||||||||||||||
| Class A Shares at NAV |
33.96% | 3.86% | 1.98% | 6.45% | ||||||||||||||
| Class A Shares at maximum Offering Price |
26.22% | -2.12% | 0.78% | 5.82% | ||||||||||||||
| Class C Shares |
33.57% | 3.10% | 1.23% | 5.66% | ||||||||||||||
| Class R3 Shares |
33.79% | 3.60% | 1.74% | 6.26% | ||||||||||||||
| Class I Shares |
34.17% | 4.07% | 2.22% | 6.71% | ||||||||||||||
Class A Shares have a maximum 5.75% sales charge (Offering Price). Class A Share purchases of $1 million or more are sold at net asset value without an up-front sales charge but may be subject to a contingent deferred sales charge (CDSC), also known as a back-end sales charge, if redeemed within twelve months of purchase. Class C Shares have a 1% CDSC for redemptions within less than twelve months, which is not reflected in the one-year total return. Class R3 Shares have no sales charge and are available to only certain retirement plans. Class I Shares have no sales charge and may be purchased under limited circumstances or by specified classes of investors.
Expense Ratios as of Most Recent Prospectus
| Expense Ratios |
||||
| Class A Shares |
1.54% | |||
| Class C Shares |
2.29% | |||
| Class R3 Shares |
1.79% | |||
| Class I Shares |
1.29% | |||
| * | Six-month returns are cumulative; all other returns are annualized. |
| ** | Refer to the Glossary of Terms Used in this Report for definitions. Indexes and Lipper averages are not available for direct investment. |
| 16 | Nuveen Investments |
Holding Summaries as of April 30, 2012
This data relates to the securities held in each Fund’s portfolio of investments. It should not be construed as a measure of performance for the Fund itself.


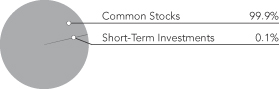
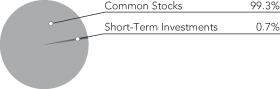
| 1 | As a percentage of total investments (excluding investments purchased with collateral from securities lending) as of April 30, 2012. Holdings are subject to change. |
| 2 | As a percentage of total common stocks as of April 30, 2012. Holdings are subject to change. |
| Nuveen Investments | 17 |
As a shareholder of one or more of the Funds, you incur two types of costs: (1) transaction costs, including up-front and back-end sales charges (loads) or redemption fees, where applicable; and (2) ongoing costs, including management fees; distribution and service (12b-1) fees, where applicable; and other Fund expenses. The Examples below are intended to help you understand your ongoing costs (in dollars) of investing in the Funds and to compare these costs with the ongoing costs of investing in other mutual funds.
The Examples below are based on an investment of $1,000 invested at the beginning of the period and held for the period.
The information under “Actual Performance,” together with the amount you invested, allows you to estimate actual expenses incurred over the reporting period. Simply divide your account value by $1,000 (for example, an $8,600 account value divided by $1,000 = 8.60) and multiply the result by the cost shown for your share class, in the row entitled “Expenses Incurred During Period” to estimate the expenses incurred on your account during this period.
The information under “Hypothetical Performance,” provides information about hypothetical account values and hypothetical expenses based on the respective Fund’s actual expense ratio and an assumed rate of return of 5% per year before expenses, which is not the Fund’s actual return. The hypothetical account values and expenses may not be used to estimate the actual ending account balance or expense you incurred for the period. You may use this information to compare the ongoing costs of investing in the Fund and other funds. To do so, compare this 5% hypothetical example with the 5% hypothetical examples that appear in the shareholder reports of the other funds.
Please note that the expenses shown in the table are meant to highlight your ongoing costs only and do not reflect any transaction costs. Therefore, the hypothetical information is useful in comparing ongoing costs only, and will not help you determine the relative total costs of owning different funds or share classes. In addition, if these transaction costs were included, your costs would have been higher.
Nuveen Dividend Value Fund
| Hypothetical Performance | ||||||||||||||||||||||||||||||||||||||||||
| Actual Performance | (5% annualized return before expenses) | |||||||||||||||||||||||||||||||||||||||||
| A Shares | B Shares | C Shares | R3 Shares | I Shares | A Shares | B Shares | C Shares | R3 Shares | I Shares | |||||||||||||||||||||||||||||||||
| Beginning Account Value (11/01/11) | $ | 1,000.00 | $ | 1,000.00 | $ | 1,000.00 | $ | 1,000.00 | $ | 1,000.00 | $ | 1,000.00 | $ | 1,000.00 | $ | 1,000.00 | $ | 1,000.00 | $ | 1,000.00 | ||||||||||||||||||||||
| Ending Account Value (4/30/12) | $ | 1,125.60 | $ | 1,121.00 | $ | 1,121.90 | $ | 1,125.20 | $ | 1,126.80 | $ | 1,019.05 | $ | 1,015.32 | $ | 1,015.32 | $ | 1,017.80 | $ | 1,020.29 | ||||||||||||||||||||||
| Expenses Incurred During Period | $ | 6.18 | $ | 10.13 | $ | 10.13 | $ | 7.50 | $ | 4.86 | $ | 5.87 | $ | 9.62 | $ | 9.62 | $ | 7.12 | $ | 4.62 | ||||||||||||||||||||||
For each class of the Fund, expenses are equal to the Fund’s annualized net expense ratio of 1.17%, 1.92%, 1.92%, 1.42% and ..92% for Classes A, B, C, R3 and I, respectively, multiplied by the average account value over the period, multiplied by 182/366 (to reflect the one-half year period).
Nuveen Large Cap Value Fund
| Hypothetical Performance | ||||||||||||||||||||||||||||||||||
| Actual Performance | (5% annualized return before expenses) | |||||||||||||||||||||||||||||||||
| A Shares | C Shares | R3 Shares | I Shares | A Shares | C Shares | R3 Shares | I Shares | |||||||||||||||||||||||||||
| Beginning Account Value (11/01/11) | $ | 1,000.00 | $ | 1,000.00 | $ | 1,000.00 | $ | 1,000.00 | $ | 1,000.00 | $ | 1,000.00 | $ | 1,000.00 | $ | 1,000.00 | ||||||||||||||||||
| Ending Account Value (4/30/12) | $ | 1,128.80 | $ | 1,124.20 | $ | 1,127.50 | $ | 1,130.20 | $ | 1,018.35 | $ | 1,014.72 | $ | 1,017.21 | $ | 1,019.69 | ||||||||||||||||||
| Expenses Incurred During Period | $ | 6.93 | $ | 10.77 | $ | 8.15 | $ | 5.51 | $ | 6.57 | $ | 10.22 | $ | 7.72 | $ | 5.22 | ||||||||||||||||||
For each class of the Fund, expenses are equal to the Fund’s annualized net expense ratio of 1.31%, 2.04%, 1.54% and 1.04% for Classes A, C, R3 and I, respectively, multiplied by the average account value over the period, multiplied by 182/366 (to reflect the one-half year period).
Nuveen Mid Cap Value Fund
| Hypothetical Performance | ||||||||||||||||||||||||||||||||||||||||||
| Actual Performance | (5% annualized return before expenses) | |||||||||||||||||||||||||||||||||||||||||
| A Shares | B Shares | C Shares | R3 Shares | I Shares | A Shares | B Shares | C Shares | R3 Shares | I Shares | |||||||||||||||||||||||||||||||||
| Beginning Account Value (11/01/11) | $ | 1,000.00 | $ | 1,000.00 | $ | 1,000.00 | $ | 1,000.00 | $ | 1,000.00 | $ | 1,000.00 | $ | 1,000.00 | $ | 1,000.00 | $ | 1,000.00 | $ | 1,000.00 | ||||||||||||||||||||||
| Ending Account Value (4/30/12) | $ | 1,100.80 | $ | 1,096.50 | $ | 1,096.20 | $ | 1,098.90 | $ | 1,101.60 | $ | 1,018.50 | $ | 1,014.77 | $ | 1,014.77 | $ | 1,017.26 | $ | 1,019.74 | ||||||||||||||||||||||
| Expenses Incurred During Period | $ | 6.69 | $ | 10.58 | $ | 10.58 | $ | 7.98 | $ | 5.38 | $ | 6.42 | $ | 10.17 | $ | 10.17 | $ | 7.67 | $ | 5.17 | ||||||||||||||||||||||
For each class of the Fund, expenses are equal to the Fund’s annualized net expense ratio of 1.28%, 2.03%, 2.03%, 1.53% and 1.03% for Classes A, B, C, R3 and I, respectively, multiplied by the average account value over the period, multiplied by 182/366 (to reflect the one-half year period).
| 18 | Nuveen Investments |
Expense Examples (continued)
Nuveen Small Cap Value Fund
| Hypothetical Performance | ||||||||||||||||||||||||||||||||||
| Actual Performance | (5% annualized return before expenses) | |||||||||||||||||||||||||||||||||
| A Shares | C Shares | R3 Shares | I Shares | A Shares | C Shares | R3 Shares | I Shares | |||||||||||||||||||||||||||
| Beginning Account Value (11/01/11) | $ | 1,000.00 | $ | 1,000.00 | $ | 1,000.00 | $ | 1,000.00 | $ | 1,000.00 | $ | 1,000.00 | $ | 1,000.00 | $ | 1,000.00 | ||||||||||||||||||
| Ending Account Value (4/30/12) | $ | 1,128.30 | $ | 1,123.90 | $ | 1,126.90 | $ | 1,129.60 | $ | 1,017.60 | $ | 1,013.87 | $ | 1,016.36 | $ | 1,018.85 | ||||||||||||||||||
| Expenses Incurred During Period | $ | 7.73 | $ | 11.67 | $ | 9.04 | $ | 6.41 | $ | 7.32 | $ | 11.07 | $ | 8.57 | $ | 6.07 | ||||||||||||||||||
For each class of the Fund, expenses are equal to the Fund’s annualized net expense ratio of 1.46%, 2.21%, 1.71% and 1.21% for Classes A, C, R3 and I, respectively, multiplied by the average account value over the period, multiplied by 182/366 (to reflect the one-half year period).
| Nuveen Investments | 19 |
Portfolio of Investments (Unaudited)
Nuveen Dividend Value Fund
April 30, 2012
| Shares | Description (1) | Value | ||||||||||||
| COMMON STOCKS – 99.7% |
||||||||||||||
| Consumer Discretionary – 10.8% |
||||||||||||||
| 495,357 | Carnival Corporation, ADR, (2) |
$ | 16,094,149 | |||||||||||
| 752,606 | Cinemark Holdings Inc., (2) |
17,279,834 | ||||||||||||
| 346,439 | Hasbro, Inc. |
12,728,169 | ||||||||||||
| 333,410 | Home Depot, Inc. |
17,267,304 | ||||||||||||
| 193,757 | McDonald’s Corporation |
18,881,620 | ||||||||||||
| 338,895 | Starbucks Corporation |
19,445,795 | ||||||||||||
| 149,027 | Whirlpool Corporation, (2) |
9,540,709 | ||||||||||||
| 282,933 | YUM! Brands, Inc. |
20,577,717 | ||||||||||||
| Total Consumer Discretionary |
131,815,297 | |||||||||||||
| Consumer Staples – 7.3% |
||||||||||||||
| 400,947 | Altria Group, Inc. |
12,914,503 | ||||||||||||
| 292,010 | ConAgra Foods, Inc. |
7,539,698 | ||||||||||||
| 176,658 | Kimberly-Clark Corporation |
13,862,353 | ||||||||||||
| 461,548 | Kraft Foods Inc. |
18,401,919 | ||||||||||||
| 237,678 | Philip Morris International |
21,274,558 | ||||||||||||
| 437,369 | Unilever PLC, ADR |
15,023,625 | ||||||||||||
| Total Consumer Staples |
89,016,656 | |||||||||||||
| Energy – 13.4% |
||||||||||||||
| 176,004 | Anadarko Petroleum Corporation |
12,885,253 | ||||||||||||
| 341,557 | Chevron Corporation |
36,396,314 | ||||||||||||
| 160,743 | ConocoPhillips |
11,514,021 | ||||||||||||
| 343,280 | Enbridge Energy Partners LP, (2) |
10,607,352 | ||||||||||||
| 377,892 | Exterran Partners, L.P, (2) |
8,442,107 | ||||||||||||
| 397,700 | Exxon Mobil Corporation |
34,337,418 | ||||||||||||
| 95,191 | Occidental Petroleum Corporation |
8,683,323 | ||||||||||||
| 359,916 | Royal Dutch Shell PLC, Class A |
25,748,391 | ||||||||||||
| 187,685 | Schlumberger Limited |
13,914,966 | ||||||||||||
| Total Energy |
162,529,145 | |||||||||||||
| Financials – 18.2% |
||||||||||||||
| 412,400 | AFLAC Incorporated |
18,574,496 | ||||||||||||
| 651,157 | Annaly Capital Management Inc., (2) |
10,626,882 | ||||||||||||
| 283,743 | BankUnited Inc. |
6,980,078 | ||||||||||||
| 332,392 | Capital One Financial Corporation |
18,441,108 | ||||||||||||
| 625,468 | Citigroup Inc. |
20,665,463 | ||||||||||||
| 216,504 | Community Bank System Inc., (2) |
6,088,092 | ||||||||||||
| 548,370 | Fifth Third Bancorp. |
7,803,305 | ||||||||||||
| 45,024 | Goldman Sachs Group, Inc. |
5,184,514 | ||||||||||||
| 1,013,445 | JP Morgan Chase & Co. |
43,557,866 | ||||||||||||
| 166,130 | Liberty Property Trust, (2) |
6,055,439 | ||||||||||||
| 111,498 | Mid-America Apartment Communities, (2) |
7,589,669 | ||||||||||||
| 199,852 | National Retail Properties, Inc. |
5,471,948 | ||||||||||||
| 781,037 | Old Republic International Corporation |
7,771,318 | ||||||||||||
| 354,100 | Prudential Financial, Inc. |
21,437,214 | ||||||||||||
| 738,051 | Redwood Trust Inc., (2) |
8,620,436 | ||||||||||||
| 456,508 | State Street Corporation |
21,099,800 | ||||||||||||
| 101,264 | Ventas Inc., (2) |
5,953,311 | ||||||||||||
| Total Financials |
221,920,939 | |||||||||||||
| 20 | Nuveen Investments |
| Shares | Description (1) | Value | ||||||||||||
| Health Care – 13.2% |
||||||||||||||
| 340,612 | Abbott Laboratories, (2) |
$ | 21,138,381 | |||||||||||
| 390,092 | Bristol-Myers Squibb Company |
13,017,370 | ||||||||||||
| 280,799 | Covidien PLC |
15,508,529 | ||||||||||||
| 282,652 | GlaxoSmithKline PLC |
13,067,002 | ||||||||||||
| 110,409 | Humana Inc. |
8,907,798 | ||||||||||||
| 283,493 | Johnson & Johnson |
18,452,559 | ||||||||||||
| 504,228 | Merck & Company Inc. |
19,785,907 | ||||||||||||
| 1,508,878 | Pfizer Inc. |
34,598,573 | ||||||||||||
| 275,586 | UnitedHealth Group Incorporated |
15,474,154 | ||||||||||||
| Total Health Care |
159,950,273 | |||||||||||||
| Industrials – 10.4% |
||||||||||||||
| 132,011 | 3M Co. |
11,796,503 | ||||||||||||
| 129,627 | Boeing Company |
9,955,354 | ||||||||||||
| 383,223 | Emerson Electric Company, (2) |
20,134,536 | ||||||||||||
| 124,909 | General Dynamics Corporation |
8,431,358 | ||||||||||||
| 1,326,279 | General Electric Company |
25,968,543 | ||||||||||||
| 240,752 | Ingersoll Rand Company Limited, Class A |
10,236,775 | ||||||||||||
| 395,773 | Republic Services, Inc. |
10,832,307 | ||||||||||||
| 146,548 | United Parcel Service, Inc., Class B |
11,451,261 | ||||||||||||
| 212,846 | United Technologies Corporation |
17,376,747 | ||||||||||||
| Total Industrials |
126,183,384 | |||||||||||||
| Information Technology – 12.6% |
||||||||||||||
| 85,906 | Automatic Data Processing, Inc. |
4,778,092 | ||||||||||||
| 789,389 | Intel Corporation |
22,418,648 | ||||||||||||
| 14,665 | MasterCard, Inc. |
6,632,540 | ||||||||||||
| 505,012 | Maxim Integrated Products, Inc. |
14,938,255 | ||||||||||||
| 776,006 | Microsoft Corporation |
24,847,712 | ||||||||||||
| 450,079 | Molex Inc. |
10,306,809 | ||||||||||||
| 389,440 | Oracle Corporation |
11,445,642 | ||||||||||||
| 241,724 | QUALCOMM, Inc. |
15,431,660 | ||||||||||||
| 871,416 | Seagate Technology |
26,804,756 | ||||||||||||
| 306,895 | Texas Instruments Incorporated |
9,802,226 | ||||||||||||
| 50,407 | Visa Inc., (2) |
6,199,053 | ||||||||||||
| Total Information Technology |
153,605,393 | |||||||||||||
| Materials – 5.4% |
||||||||||||||
| 396,120 | Dow Chemical Company, (2) |
13,420,546 | ||||||||||||
| 253,594 | E.I. Du Pont de Nemours and Company, (2) |
13,557,135 | ||||||||||||
| 287,926 | Potash Corporation of Saskatchewan, (2) |
12,231,096 | ||||||||||||
| 140,993 | PPG Industries, Inc. |
14,838,103 | ||||||||||||
| 103,445 | Praxair, Inc. |
11,968,587 | ||||||||||||
| Total Materials |
66,015,467 | |||||||||||||
| Telecommunication Services – 5.6% |
||||||||||||||
| 420,661 | CenturyLink Inc., (2) |
16,220,688 | ||||||||||||
| 912,137 | Verizon Communications Inc. |
36,832,092 | ||||||||||||
| 1,316,285 | Windstream Corporation, (2) |
14,795,043 | ||||||||||||
| Total Telecommunication Services |
67,847,823 | |||||||||||||
| Nuveen Investments | 21 |
Portfolio of Investments (Unaudited)
Nuveen Dividend Value Fund (continued)
April 30, 2012
| Shares | Description (1) | Value | ||||||||||||
| Utilities – 2.8% |
||||||||||||||
| 561,481 | CenterPoint Energy, Inc. |
$ | 11,347,531 | |||||||||||
| 417,450 | PPL Corporation, (2) |
11,417,255 | ||||||||||||
| 406,450 | Westar Energy Inc., (2) |
11,661,048 | ||||||||||||
| Total Utilities |
34,425,834 | |||||||||||||
| Total Common Stocks (cost $890,183,271) |
1,213,310,211 | |||||||||||||
| Shares | Description (1) | Value | ||||||||||||
| INVESTMENT PURCHASED WITH COLLATERAL FROM SECURITIES LENDING |
||||||||||||||
| Money Market Funds – 12.8% |
||||||||||||||
| 156,050,266 | Mount Vernon Securities Lending Prime Portfolio, Class Z, 0.276%, (3), (4) |
$ | 156,050,266 | |||||||||||
| Total Investments Purchased with Collateral from Securities Lending (cost $156,050,266) |
156,050,266 | |||||||||||||
| Shares | Description (1) | Value | ||||||||||||
| SHORT-TERM INVESTMENTS – 0.4% |
||||||||||||||
| 5,474,249 | First American Treasury Obligations Fund, Class Z, 0.000%, (3) |
$ | 5,474,249 | |||||||||||
| Total Short-Term Investments (cost $5,474,249) |
5,474,249 | |||||||||||||
| Total Investments (cost $1,051,707,786) – 112.9% |
1,374,834,726 | |||||||||||||
| Other Assets Less Liabilities – (12.9)% |
(157,226,266) | |||||||||||||
| Net Assets – 100% |
$ | 1,217,608,460 | ||||||||||||
| For Fund portfolio compliance purposes, the Fund’s industry classifications refer to any one or more of the industry sub-classifications used by one or more widely recognized market indexes or ratings group indexes, and/or as defined by Fund management. This definition may not apply for purposes of this report, which may combine industry sub-classifications into sectors for reporting ease. |
| (1) | All percentages shown in the Portfolio of Investments are based on net assets. |
| (2) | Investment, or a portion of investment, is out on loan for securities lending. |
| (3) | The rate shown is the annualized seven-day effective yield as of April 30, 2012. |
| (4) | The Fund may loan securities representing up to one third of the fair value of its total assets (which includes collateral for securities on loan) to broker dealers, banks, or other institutions. The Fund maintains collateral equal to at least 102% of the fair value of the securities loaned. The cash collateral received by the Fund is invested in this money market fund. See Notes to Financial Statements, Footnote 1 – General Information and Significant Accounting Policies, Securities Lending for more information. |
| ADR | American Depositary Receipt. |
See accompanying notes to financial statements.
| 22 | Nuveen Investments |
Portfolio of Investments (Unaudited)
Nuveen Large Cap Value Fund
April 30, 2012
| Shares | Description (1) | Value | ||||||||||||
| COMMON STOCKS – 99.5% |
||||||||||||||
| Consumer Discretionary – 10.5% |
||||||||||||||
| 61,877 | Carnival Corporation, ADR |
$ | 2,010,384 | |||||||||||
| 89,595 | CBS Corporation, Class B |
2,987,993 | ||||||||||||
| 107,775 | Comcast Corporation, Class A, (3) |
3,268,816 | ||||||||||||
| 42,897 | Hasbro, Inc. |
1,576,036 | ||||||||||||
| 148,530 | Interpublic Group Companies, Inc., (3) |
1,754,139 | ||||||||||||
| 70,859 | Macy’s, Inc., (3) |
2,906,636 | ||||||||||||
| 97,592 | Staples, Inc., (3) |
1,502,917 | ||||||||||||
| Total Consumer Discretionary |
16,006,921 | |||||||||||||
| Consumer Staples – 7.4% |
||||||||||||||
| 22,054 | Coca-Cola Company |
1,683,161 | ||||||||||||
| 39,893 | Corn Products International, Inc. |
2,276,295 | ||||||||||||
| 66,067 | CVS Caremark Corporation |
2,947,910 | ||||||||||||
| 129,782 | Dean Foods Company, (2) |
1,593,723 | ||||||||||||
| 30,609 | Philip Morris International |
2,739,812 | ||||||||||||
| Total Consumer Staples |
11,240,901 | |||||||||||||
| Energy – 13.4% |
||||||||||||||
| 27,211 | Anadarko Petroleum Corporation |
1,992,117 | ||||||||||||
| 21,600 | Chevron Corporation, (3) |
2,301,696 | ||||||||||||
| 20,674 | Devon Energy Corporation |
1,444,079 | ||||||||||||
| 40,977 | Ensco PLC |
2,239,393 | ||||||||||||
| 66,344 | Marathon Oil Corporation |
1,946,533 | ||||||||||||
| 34,440 | National-Oilwell Varco Inc. |
2,609,174 | ||||||||||||
| 16,055 | Occidental Petroleum Corporation |
1,464,537 | ||||||||||||
| 27,574 | Pioneer Natural Resources Company, (3) |
3,193,621 | ||||||||||||
| 93,785 | Williams Companies, Inc. |
3,191,504 | ||||||||||||
| Total Energy |
20,382,654 | |||||||||||||
| Financials – 25.8% |
||||||||||||||
| 42,657 | Ace Limited |
3,240,652 | ||||||||||||
| 49,675 | Ameriprise Financial, Inc. |
2,692,882 | ||||||||||||
| 73,503 | Citigroup Inc. |
2,428,539 | ||||||||||||
| 83,375 | Fifth Third Bancorp. |
1,186,426 | ||||||||||||
| 27,829 | Goldman Sachs Group, Inc. |
3,204,509 | ||||||||||||
| 153,272 | JP Morgan Chase & Co. |
6,587,631 | ||||||||||||
| 137,731 | KeyCorp. |
1,107,357 | ||||||||||||
| 70,856 | Lincoln National Corporation, (3) |
1,755,103 | ||||||||||||
| 65,886 | Marsh & McLennan Companies, Inc. |
2,203,887 | ||||||||||||
| 43,895 | PNC Financial Services Group, Inc. |
2,911,116 | ||||||||||||
| 52,213 | Prudential Financial, Inc. |
3,160,975 | ||||||||||||
| 54,211 | State Street Corporation |
2,505,632 | ||||||||||||
| 52,593 | SunTrust Banks, Inc. |
1,276,958 | ||||||||||||
| 149,265 | Wells Fargo & Company |
4,989,929 | ||||||||||||
| Total Financials |
39,251,596 | |||||||||||||
| Health Care – 12.8% |
||||||||||||||
| 40,842 | Agilent Technologies, Inc., (2), (3) |
1,722,716 | ||||||||||||
| 54,984 | Covidien PLC |
3,036,766 | ||||||||||||
| Nuveen Investments | 23 |
Portfolio of Investments (Unaudited)
Nuveen Large Cap Value Fund (continued)
April 30, 2012
| Shares | Description (1) | Value | ||||||||||||
| Health Care (continued) |
||||||||||||||
| 17,246 | Humana Inc. |
$ | 1,391,407 | |||||||||||
| 31,657 | McKesson HBOC Inc. |
2,893,766 | ||||||||||||
| 47,220 | Merck & Company Inc. |
1,852,913 | ||||||||||||
| 268,134 | Pfizer Inc. |
6,148,313 | ||||||||||||
| 44,587 | UnitedHealth Group Incorporated |
2,503,560 | ||||||||||||
| Total Health Care |
19,549,441 | |||||||||||||
| Industrials – 7.3% |
||||||||||||||
| 15,540 | Boeing Company |
1,193,472 | ||||||||||||
| 48,036 | Emerson Electric Company, (3) |
2,523,811 | ||||||||||||
| 132,254 | General Electric Company, (3) |
2,589,533 | ||||||||||||
| 65,193 | Ingersoll Rand Company Limited, Class A |
2,772,006 | ||||||||||||
| 24,528 | Republic Services, Inc. |
671,331 | ||||||||||||
| 23,224 | Tyco International Ltd. |
1,303,563 | ||||||||||||
| Total Industrials |
11,053,716 | |||||||||||||
| Information Technology – 8.6% |
||||||||||||||
| 116,842 | Intel Corporation |
3,318,313 | ||||||||||||
| 64,073 | Maxim Integrated Products, Inc. |
1,895,279 | ||||||||||||
| 66,761 | Molex Inc. |
1,528,827 | ||||||||||||
| 90,870 | Oracle Corporation |
2,670,669 | ||||||||||||
| 30,341 | QUALCOMM, Inc. |
1,936,969 | ||||||||||||
| 63,723 | Seagate Technology |
1,960,119 | ||||||||||||
| Total Information Technology |
13,310,176 | |||||||||||||
| Materials – 3.7% |
||||||||||||||
| 49,557 | Dow Chemical Company, (3) |
1,678,991 | ||||||||||||
| 49,910 | Potash Corporation of Saskatchewan, (3) |
2,120,177 | ||||||||||||
| 29,360 | Rock-Tenn Company |
1,830,009 | ||||||||||||
| Total Materials |
5,629,177 | |||||||||||||
| Telecommunication Services – 4.2% |
||||||||||||||
| 80,181 | CenturyLink Inc., (3) |
3,091,779 | ||||||||||||
| 80,320 | Verizon Communications Inc., (3) |
3,243,322 | ||||||||||||
| Total Telecommunication Services |
6,335,101 | |||||||||||||
| Utilities – 5.8% |
||||||||||||||
| 82,383 | American Water Works Company |
2,820,794 | ||||||||||||
| 86,845 | CMS Energy Corporation, (3) |
1,996,567 | ||||||||||||
| 16,500 | ONEOK, Inc. |
1,417,185 | ||||||||||||
| 54,357 | Pinnacle West Capital Corporation |
2,628,163 | ||||||||||||
| Total Utilities |
8,862,709 | |||||||||||||
| Total Common Stocks (cost $141,887,189) |
151,622,392 | |||||||||||||
| Shares | Description (1) | Value | ||||||||||||
| INVESTMENT PURCHASED WITH COLLATERAL FROM SECURITIES LENDING |
||||||||||||||
| Money Market Funds – 22.2% |
||||||||||||||
| 33,810,534 | Mount Vernon Securities Lending Prime Portfolio, Class Z, 0.276%, (4), (5) |
$ | 33,810,534 | |||||||||||
| Total Investments Purchased with Collateral from Securities Lending (cost $33,810,534) |
33,810,534 | |||||||||||||
| 24 | Nuveen Investments |
| Shares | Description (1) | Value | ||||||||||||
| SHORT-TERM INVESTMENTS – 0.6% |
||||||||||||||
| 873,511 | First American Treasury Obligations Fund, Class Z, 0.000%, (4) |
$ | 873,511 | |||||||||||
| Total Short-Term Investments (cost $873,511) |
873,511 | |||||||||||||
| Total Investments (cost $176,571,234) – 122.3% |
186,306,437 | |||||||||||||
| Other Assets Less Liabilities – (22.3)% |
(34,000,434) | |||||||||||||
| Net Assets – 100% |
$ | 152,306,003 | ||||||||||||
| For Fund portfolio compliance purposes, the Fund’s industry classifications refer to any one or more of the industry sub-classifications used by one or more widely recognized market indexes or ratings group indexes, and/or as defined by Fund management. This definition may not apply for purposes of this report, which may combine industry sub-classifications into sectors for reporting ease. |
| (1) | All percentages shown in the Portfolio of Investments are based on net assets. |
| (2) | Non-income producing; issuer has not declared a dividend within the past twelve months. |
| (3) | Investment, or a portion of investment, is out on loan for securities lending. |
| (4) | The rate shown is the annualized seven-day effective yield as of April 30, 2012. |
| (5) | The Fund may loan securities representing up to one third of the fair value of its total assets (which includes collateral for securities on loan) to broker dealers, banks, or other institutions. The Fund maintains collateral equal to at least 102% of the fair value of the securities loaned. The cash collateral received by the Fund is invested in this money market fund. See Notes to Financial Statements, Footnote 1 – General Information and Significant Accounting Policies, Securities Lending for more information. |
| ADR | American Depositary Receipt. |
See accompanying notes to financial statements.
| Nuveen Investments | 25 |
Portfolio of Investments (Unaudited)
Nuveen Mid Cap Value Fund
April 30, 2012
| Shares | Description (1) | Value | ||||||||||||
| COMMON STOCKS – 98.7% |
||||||||||||||
| Consumer Discretionary – 15.4% |
||||||||||||||
| 82,224 | Brunswick Corporation, (3) |
$ | 2,161,669 | |||||||||||
| 126,181 | Cinemark Holdings Inc., (3) |
2,897,116 | ||||||||||||
| 162,628 | D.R. Horton, Inc., (3) |
2,658,968 | ||||||||||||
| 104,776 | Dana Holding Corporation, (2), (3) |
1,531,825 | ||||||||||||
| 105,185 | Foot Locker, Inc. |
3,217,609 | ||||||||||||
| 231,883 | Interpublic Group Companies, Inc., (3) |
2,738,538 | ||||||||||||
| 70,531 | Jarden Corporation |
2,957,365 | ||||||||||||
| 97,240 | Macy’s, Inc., (3) |
3,988,785 | ||||||||||||
| 86,334 | Mattel, Inc. |
2,900,822 | ||||||||||||
| 286,332 | Staples, Inc., (3) |
4,409,513 | ||||||||||||
| 29,769 | Whirlpool Corporation |
1,905,811 | ||||||||||||
| Total Consumer Discretionary |
31,368,021 | |||||||||||||
| Consumer Staples – 2.9% |
||||||||||||||
| 99,764 | Constellation Brands, Inc., Class A, (2), (3) |
2,154,902 | ||||||||||||
| 26,839 | Lorillard Inc. |
3,631,048 | ||||||||||||
| Total Consumer Staples |
5,785,950 | |||||||||||||
| Energy – 8.1% |
||||||||||||||
| 21,008 | Concho Resources Inc., (2) |
2,251,637 | ||||||||||||
| 50,772 | Ensco PLC |
2,774,690 | ||||||||||||
| 21,317 | Noble Energy, Inc. |
2,117,204 | ||||||||||||
| 41,193 | Oil States International Inc., (2), (3) |
3,278,139 | ||||||||||||
| 26,365 | Pioneer Natural Resources Company, (3) |
3,053,594 | ||||||||||||
| 87,251 | Williams Companies, Inc. |
2,969,152 | ||||||||||||
| Total Energy |
16,444,416 | |||||||||||||
| Financials – 26.3% |
||||||||||||||
| 64,707 | Ameriprise Financial, Inc. |
3,507,766 | ||||||||||||
| 66,444 | Comerica Incorporated, (3) |
2,127,537 | ||||||||||||
| 143,409 | Developers Diversified Realty Corporation, (3) |
2,122,453 | ||||||||||||
| 63,726 | Discover Financial Services |
2,160,311 | ||||||||||||
| 97,813 | East West Bancorp Inc., (3) |
2,227,202 | ||||||||||||
| 268,565 | Fifth Third Bancorp. |
3,821,680 | ||||||||||||
| 166,999 | Host Hotels & Resorts Inc., (3) |
2,778,863 | ||||||||||||
| 182,970 | Invesco LTD |
4,544,975 | ||||||||||||
| 389,425 | KeyCorp. |
3,130,977 | ||||||||||||
| 108,415 | Kimco Realty Corporation, (3) |
2,104,335 | ||||||||||||
| 135,566 | Lincoln National Corporation |
3,357,970 | ||||||||||||
| 61,556 | Mack-Cali Realty Corporation |
1,767,888 | ||||||||||||
| 103,626 | Marsh & McLennan Companies, Inc. |
3,466,290 | ||||||||||||
| 25,741 | SL Green Realty Corporation, (3) |
2,122,088 | ||||||||||||
| 263,813 | SLM Corporation |
3,912,347 | ||||||||||||
| 117,774 | SunTrust Banks, Inc. |
2,859,553 | ||||||||||||
| 114,374 | Unum Group |
2,715,239 | ||||||||||||
| 43,969 | Ventas Inc., (3) |
2,584,938 | ||||||||||||
| 94,745 | Webster Financial Corporation, (3) |
2,153,554 | ||||||||||||
| Total Financials |
53,465,966 | |||||||||||||
| 26 | Nuveen Investments |
| Shares | Description (1) | Value | ||||||||||||
| Health Care – 9.5% |
||||||||||||||
| 54,999 | Aetna Inc. |
$ | 2,422,156 | |||||||||||
| 62,580 | Agilent Technologies, Inc., (2), (3) |
2,639,624 | ||||||||||||
| 72,784 | AmerisourceBergen Corporation, (3) |
2,708,293 | ||||||||||||
| 119,285 | CareFusion Corporation, (2) |
3,090,674 | ||||||||||||
| 76,720 | Endo Pharmaceuticals Holdings Inc., (2) |
2,695,941 | ||||||||||||
| 48,375 | Humana Inc. |
3,902,895 | ||||||||||||
| 74,456 | Impax Laboratories Inc., (2), (3) |
1,833,851 | ||||||||||||
| Total Health Care |
19,293,434 | |||||||||||||
| Industrials – 9.8% |
||||||||||||||
| 58,416 | Chicago Bridge & Iron Company N.V. |
2,594,839 | ||||||||||||
| 74,991 | Crane Company |
3,309,353 | ||||||||||||
| 51,695 | Dover Corporation |
3,239,209 | ||||||||||||
| 47,694 | Fluor Corporation |
2,754,329 | ||||||||||||
| 81,354 | Ingersoll Rand Company Limited, Class A |
3,459,172 | ||||||||||||
| 89,925 | Oshkosh Truck Corporation |
2,052,988 | ||||||||||||
| 104,227 | Spirit AeroSystems Holdings Inc. |
2,605,675 | ||||||||||||
| Total Industrials |
20,015,565 | |||||||||||||
| Information Techology – 11.7% |
||||||||||||||
| 53,916 | Arrow Electronics, Inc., (2), (3) |
2,267,168 | ||||||||||||
| 59,665 | Autodesk, Inc., (2) |
2,349,011 | ||||||||||||
| 82,690 | Fidelity National Information Services, (3) |
2,784,172 | ||||||||||||
| 103,104 | International Rectifier Corporation, (2), (3) |
2,250,760 | ||||||||||||
| 89,083 | Molex Inc., (3) |
2,457,800 | ||||||||||||
| 54,482 | Plantronics Inc. |
2,087,750 | ||||||||||||
| 207,290 | Polycom Inc., (2), (3) |
2,750,738 | ||||||||||||
| 166,358 | Teradyne Inc., (2), (3) |
2,863,021 | ||||||||||||
| 42,132 | VeriFone Holdings Inc., (2), (3) |
2,007,168 | ||||||||||||
| 52,380 | Western Digital Corporation, (2) |
2,032,868 | ||||||||||||
| Total Information Technology |
23,850,456 | |||||||||||||
| Materials – 6.4% |
||||||||||||||
| 14,076 | CF Industries Holdings, Inc. |
2,717,513 | ||||||||||||
| 43,898 | Cytec Industries, Inc. |
2,790,596 | ||||||||||||
| 103,633 | International Paper Company |
3,452,015 | ||||||||||||
| 71,573 | Packaging Corp. of America |
2,089,216 | ||||||||||||
| 32,084 | Rock-Tenn Company |
1,999,796 | ||||||||||||
| Total Materials |
13,049,136 | |||||||||||||
| Utilities – 8.6% |
||||||||||||||
| 123,578 | American Water Works Company |
4,231,311 | ||||||||||||
| 112,570 | Calpine Corporation, (3) |
2,110,688 | ||||||||||||
| 174,750 | CMS Energy Corporation |
4,017,503 | ||||||||||||
| 74,999 | Edison International |
3,300,706 | ||||||||||||
| 229,438 | NV Energy Inc., (3) |
3,820,142 | ||||||||||||
| Total Utilities |
17,480,350 | |||||||||||||
| Total Common Stocks (cost $188,150,863) |
200,753,294 | |||||||||||||
| Nuveen Investments | 27 |
Portfolio of Investments (Unaudited)
Nuveen Mid Cap Value Fund (continued)
April 30, 2012
| Shares | Description (1) | Value | ||||||||||||
| INVESTMENT PURCHASED WITH COLLATERAL FROM SECURITIES LENDING |
||||||||||||||
| Money Market Funds – 29.3% |
||||||||||||||
| 59,694,980 | Mount Vernon Securities Lending Prime Portfolio, Class Z, 0.276%, (4), (5) |
$ | 59,694,980 | |||||||||||
| Total Investments Purchased with Collateral from Securities Lending (cost $59,694,980) |
59,694,980 | |||||||||||||
| Shares | Description (1) | Value | ||||||||||||
| SHORT-TERM INVESTMENTS – 0.1% |
||||||||||||||
| 111,055 | First American Treasury Obligations Fund, Class Z, 0.000%, (4) |
$ | 111,055 | |||||||||||
| Total Short-Term Investments (cost $111,055) |
111,055 | |||||||||||||
| Total Investments (cost $247,956,898) – 128.1% |
260,559,329 | |||||||||||||
| Other Assets Less Liabilities – (28.1)% |
(57,113,462) | |||||||||||||
| Net Assets – 100% |
$ | 203,445,867 | ||||||||||||
| For Fund portfolio compliance purposes, the Fund’s industry classifications refer to any one or more of the industry sub-classifications used by one or more widely recognized market indexes or ratings group indexes, and/or as defined by Fund management. This definition may not apply for purposes of this report, which may combine industry sub-classifications into sectors for reporting ease. |
| (1) | All percentages shown in the Portfolio of Investments are based on net assets. |
| (2) | Non-income producing; issuer has not declared a dividend within the past twelve months. |
| (3) | Investment, or a portion of investment, is out on loan for securities lending. |
| (4) | The rate shown is the annualized seven-day effective yield as of April 30, 2012. |
| (5) | The Fund may loan securities representing up to one third of the fair value of its total assets (which includes collateral for securities on loan) to broker dealers, banks, or other institutions. The Fund maintains collateral equal to at least 102% of the fair value of the securities loaned. The cash collateral received by the Fund is invested in this money market fund. See Notes to Financial Statements, Footnote 1 – General Information and Significant Accounting Policies, Securities Lending for more information. |
See accompanying notes to financial statements.
| 28 | Nuveen Investments |
Portfolio of Investments (Unaudited)
Nuveen Small Cap Value Fund
April 30, 2012
| Shares | Description (1) | Value | ||||||||||||
| COMMON STOCKS – 99.6% |
||||||||||||||
| Consumer Discretionary – 13.6% |
||||||||||||||
| 42,198 | Ascena Retail Group Inc., (2), (3) |
$ | 864,215 | |||||||||||
| 127,284 | Belo Corp. |
857,894 | ||||||||||||
| 41,627 | Cinemark Holdings Inc., (3) |
955,756 | ||||||||||||
| 60,411 | Cooper Tire & Rubber |
903,144 | ||||||||||||
| 61,684 | Dana Holding Corporation, (2), (3) |
901,820 | ||||||||||||
| 21,824 | Dominos Pizza Inc., (2) |
825,165 | ||||||||||||
| 30,186 | Group 1 Automotive Inc., (3) |
1,747,166 | ||||||||||||
| 52,910 | La Z Boy Inc. |
797,354 | ||||||||||||
| 21,372 | Mens Wearhouse Inc., (3) |
791,619 | ||||||||||||
| 27,989 | P.F. Changs China Bistro, Inc. |
1,110,883 | ||||||||||||
| 50,809 | Sally Beauty Holdings Inc., (2) |
1,351,519 | ||||||||||||
| 54,188 | West Marine, Inc., (3) |
634,541 | ||||||||||||
| Total Consumer Discretionary |
11,741,076 | |||||||||||||
| Consumer Staples – 2.1% |
||||||||||||||
| 44,265 | Inter Parfums, Inc. |
697,174 | ||||||||||||
| 59,880 | Spartan Stores, Inc. |
1,091,612 | ||||||||||||
| Total Consumer Staples |
1,788,786 | |||||||||||||
| Energy – 6.1% |
||||||||||||||
| 39,500 | Basic Energy Services, Inc., (2) |
568,800 | ||||||||||||
| 33,000 | Delek US Holdings Inc., (3) |
537,900 | ||||||||||||
| 46,166 | Matrix Service Company |
630,166 | ||||||||||||
| 49,120 | Midstates Petroleum Co Inc. |
801,638 | ||||||||||||
| 79,090 | Newpark Resources Inc., (3) |
503,012 | ||||||||||||
| 41,193 | Stone Energy Corporation, (2), (3) |
1,155,464 | ||||||||||||
| 37,308 | Swift Energy Company, (3) |
1,128,567 | ||||||||||||
| Total Energy |
5,325,547 | |||||||||||||
| Financials – 29.0% |
||||||||||||||
| 8,429 | Affiliated Managers Group Inc., (2) |
957,703 | ||||||||||||
| 75,518 | Associated Estates Realty Corp. |
1,278,520 | ||||||||||||
| 19,998 | Bank of the Ozarks, Inc., (3) |
617,938 | ||||||||||||
| 105,381 | Brandywine Realty Trust, (3) |
1,249,819 | ||||||||||||
| 188,957 | CNO Financial Group Inc., (2), (3) |
1,373,717 | ||||||||||||
| 45,938 | Community Bank System Inc., (3) |
1,291,777 | ||||||||||||
| 73,104 | CubeSmart |
918,186 | ||||||||||||
| 132,729 | DiamondRock Hospitality Company, (3) |
1,410,909 | ||||||||||||
| 59,014 | East West Bancorp Inc., (3) |
1,343,749 | ||||||||||||
| 26,612 | EZCORP, Inc., (3) |
712,935 | ||||||||||||
| 62,625 | FirstMerit Corporation, (3) |
1,052,100 | ||||||||||||
| 71,004 | Flushing Financial Corporation, (3) |
925,182 | ||||||||||||
| 60,596 | Heartland Financial USA, Inc. |
1,122,238 | ||||||||||||
| 63,086 | Horace Mann Educators Corporation |
1,107,159 | ||||||||||||
| 13,662 | IberiaBank Corporation, (3) |
697,718 | ||||||||||||
| 111,662 | JMP Group Inc. |
827,415 | ||||||||||||
| 31,508 | Knight Trading Group Inc., (3) |
414,015 | ||||||||||||
| 183,977 | MFA Mortgage Investments, Inc. |
1,357,750 | ||||||||||||
| Nuveen Investments | 29 |
Portfolio of Investments (Unaudited)
Nuveen Small Cap Value Fund (continued)
April 30, 2012
| Shares | Description (1) | Value | ||||||||||||
| Financials (continued) |
||||||||||||||
| 162,344 | MGIC Investment Corporation, (2), (3) |
$ | 561,710 | |||||||||||
| 77,598 | National Financial Partners Corp., (2), (3) |
1,144,571 | ||||||||||||
| 14,404 | SVB Financial Group, (2), (3) |
923,152 | ||||||||||||
| 39,184 | Texas Capital BancShares, Inc., (2), (3) |
1,477,629 | ||||||||||||
| 62,852 | Webster Financial Corporation, (3) |
1,428,626 | ||||||||||||
| 23,021 | WSFS Financial Corporation |
918,768 | ||||||||||||
| Total Financials |
25,113,286 | |||||||||||||
| Health Care – 5.8% |
||||||||||||||
| 10,411 | AmericGroup Corporation, (2), (3) |
642,983 | ||||||||||||
| 98,276 | Bioscrip, Inc., (2) |
728,225 | ||||||||||||
| 43,784 | Hanger Orthopedic Group Inc., (2) |
1,031,113 | ||||||||||||
| 17,374 | ICU Medical, Inc., (2), (3) |
911,961 | ||||||||||||
| 26,776 | Impax Laboratories Inc., (2), (3) |
659,493 | ||||||||||||
| 15,280 | Mednax Inc., (2), (3) |
1,073,267 | ||||||||||||
| Total Health Care |
5,047,042 | |||||||||||||
| Industrials – 16.4% |
||||||||||||||
| 32,230 | Actuant Corporation, (3) |
878,912 | ||||||||||||
| 68,176 | Altra Industrial Motion, Inc., (2), (3) |
1,246,257 | ||||||||||||
| 21,660 | Atlas Air Worldwide Holdings Inc., (2), (3) |
997,443 | ||||||||||||
| 41,991 | Emcor Group Inc. |
1,231,176 | ||||||||||||
| 56,320 | Ennis Inc., (3) |
887,603 | ||||||||||||
| 41,512 | G&K Services, Inc. |
1,364,084 | ||||||||||||
| 37,876 | General Cable Corporation, (3) |
1,115,069 | ||||||||||||
| 43,343 | GrafTech International Ltd. |
508,847 | ||||||||||||
| 59,024 | MasTec Inc., (2), (3) |
1,026,427 | ||||||||||||
| 12,232 | Regal-Beloit Corporation |
827,372 | ||||||||||||
| 25,000 | Tetra Tech, Inc., (2), (3) |
667,500 | ||||||||||||
| 40,000 | TriMas Corporation, (2) |
880,400 | ||||||||||||
| 32,787 | Triumph Group Inc., (3) |
2,059,679 | ||||||||||||
| 31,713 | TrueBlue Inc., (2), (3) |
547,366 | ||||||||||||
| Total Industrials |
14,238,135 | |||||||||||||
| Information Technology – 13.3% |
||||||||||||||
| 30,000 | ADTRAN, Inc., (3) |
915,600 | ||||||||||||
| 21,209 | CACI International Inc., (3) |
1,296,506 | ||||||||||||
| 60,000 | Cray, Inc., (3) |
669,000 | ||||||||||||
| 56,000 | Dice Holdings Inc. |
603,680 | ||||||||||||
| 50,645 | International Rectifier Corporation, (2), (3) |
1,105,580 | ||||||||||||
| 45,926 | MKS Instruments Inc., (3) |
1,269,854 | ||||||||||||
| 105,938 | Perficient, Inc., (2), (3) |
1,272,315 | ||||||||||||
| 28,240 | Plantronics Inc., (3) |
1,082,157 | ||||||||||||
| 60,975 | PMC-Sierra, Inc., (2), (3) |
431,093 | ||||||||||||
| 47,407 | Polycom Inc., (2), (3) |
629,091 | ||||||||||||
| 18,872 | Rogers Corporation |
722,609 | ||||||||||||
| 22,886 | SYNNEX Corporation, (2) |
871,728 | ||||||||||||
| 64,862 | TTM Technologies, Inc., (2), (3) |
670,024 | ||||||||||||
| Total Information Technology |
11,539,237 | |||||||||||||
| 30 | Nuveen Investments |
| Shares | Description (1) | Value | ||||||||||||
| Materials – 6.0% |
||||||||||||||
| 31,067 | Buckeye Technologies Inc., (3) |
$ | 1,006,881 | |||||||||||
| 28,300 | Kraton Performance Polymers Inc., (2), (3) |
735,800 | ||||||||||||
| 17,222 | Minerals Technologies Inc., (3) |
1,155,596 | ||||||||||||
| 39,639 | Packaging Corp. of America |
1,157,062 | ||||||||||||
| 9,454 | Rockwood Holdings Inc. |
523,184 | ||||||||||||
| 16,446 | Schnitzer Steel Industries, Inc., (3) |
655,702 | ||||||||||||
| Total Materials |
5,234,225 | |||||||||||||
| Telecommunication Services – 1.3% |
||||||||||||||
| 55,283 | NTELOS Holdings Corp |
1,117,826 | ||||||||||||
| Utilities – 6.0% |
||||||||||||||
| 52,243 | Atmos Energy Corporation |
1,702,077 | ||||||||||||
| 46,515 | El Paso Electric Company, (3) |
1,425,220 | ||||||||||||
| 23,133 | Southwest Gas Corporation, (3) |
972,052 | ||||||||||||
| 31,109 | UIL Holdings Corporation, (3) |
1,069,219 | ||||||||||||
| Total Utilities |
5,168,568 | |||||||||||||
| Total Common Stocks (cost $75,955,378) |
86,313,728 | |||||||||||||
| Shares | Description (1) | Value | ||||||||||||
| INVESTMENT PURCHASED WITH COLLATERAL FROM SECURITIES LENDING |
||||||||||||||
| Money Market Funds – 48.8% |
||||||||||||||
| 42,370,035 | Mount Vernon Securities Lending Prime Portfolio, Class Z, 0.276%, (4), (5) |
$ | 42,370,035 | |||||||||||
| Total Investments Purchased with Collateral from Securities Lending (cost $42,370,035) |
42,370,035 | |||||||||||||
| Shares | Description (1) | Value | ||||||||||||
| SHORT-TERM INVESTMENTS – 0.7% |
||||||||||||||
| 627,525 | First American Treasury Obligations Fund, Class Z, 0.000%, (4) |
$ | 627,525 | |||||||||||
| Total Short-Term Investments (cost $627,525) |
627,525 | |||||||||||||
| Total Investments (cost $118,952,938) – 149.1% |
129,311,288 | |||||||||||||
| Other Assets Less Liabilities – (49.1)% |
(42,563,396) | |||||||||||||
| Net Assets – 100% |
$ | 86,747,892 | ||||||||||||
| For Fund portfolio compliance purposes, the Fund’s industry classifications refer to any one or more of the industry sub-classifications used by one or more widely recognized market indexes or ratings group indexes, and/or as defined by Fund management. This definition may not apply for purposes of this report, which may combine industry sub-classifications into sectors for reporting ease. |
| (1) | All percentages shown in the Portfolio of Investments are based on net assets. |
| (2) | Non-income producing; issuer has not declared a dividend within the past twelve months. |
| (3) | Investment, or a portion of investment, is out on loan for securities lending. |
| (4) | The rate shown is the annualized seven-day effective yield as of April 30, 2012. |
| (5) | The Fund may loan securities representing up to one third of the fair value of its total assets (which includes collateral for securities on loan) to broker dealers, banks, or other institutions. The Fund maintains collateral equal to at least 102% of the fair value of the securities loaned. The cash collateral received by the Fund is invested in this money market fund. See Notes to Financial Statements, Footnote 1 – General Information and Significant Accounting Policies, Securities Lending for more information. |
See accompanying notes to financial statements.
| Nuveen Investments | 31 |
Statement of Assets & Liabilities (Unaudited)
April 30, 2012
| Dividend Value |
Large Cap Value |
Mid Cap Value |
Small Cap Value |
|||||||||||||
| Assets |
||||||||||||||||
| Investments, at value (cost $895,657,520, $142,760,700, $188,261,918 and $76,582,903, respectively) |
$ | 1,218,784,460 | $ | 152,495,903 | $ | 200,864,349 | $ | 86,941,253 | ||||||||
| Investments purchased with collateral from securities lending |
156,050,266 | 33,810,534 | 59,694,980 | 42,370,035 | ||||||||||||
| Receivables: |
||||||||||||||||
| Dividends |
1,510,550 | 208,936 | 73,094 | 22,838 | ||||||||||||
| Due from broker |
21,317 | 4,659 | 6,823 | 5,309 | ||||||||||||
| Investments sold |
7,770,411 | 2,938,384 | 3,880,097 | — | ||||||||||||
| Shares sold |
1,506,965 | 5,290 | 52,900 | 12,510 | ||||||||||||
| Other assets |
10,408 | 320 | 2,550 | 178 | ||||||||||||
| Total assets |
1,385,654,377 | 189,464,026 | 264,574,793 | 129,352,123 | ||||||||||||
| Liabilities |
||||||||||||||||
| Payables: |
||||||||||||||||
| Collateral from securities lending program |
156,050,266 | 33,810,534 | 59,694,980 | 42,370,035 | ||||||||||||
| Investments purchased |
7,738,413 | 2,919,209 | 790,710 | — | ||||||||||||
| Shares redeemed |
3,009,389 | 230,423 | 361,742 | 82,726 | ||||||||||||
| Accrued expenses: |
||||||||||||||||
| Management fees |
759,887 | 92,181 | 113,201 | 68,039 | ||||||||||||
| 12b-1 distribution and service fees |
70,588 | 11,274 | 22,668 | 9,307 | ||||||||||||
| Other |
417,374 | 94,402 | 145,625 | 74,124 | ||||||||||||
| Total liabilities |
168,045,917 | 37,158,023 | 61,128,926 | 42,604,231 | ||||||||||||
| Net assets |
$ | 1,217,608,460 | $ | 152,306,003 | $ | 203,445,867 | $ | 86,747,892 | ||||||||
| Class A Shares |
||||||||||||||||
| Net assets |
$ | 210,162,755 | $ | 49,346,442 | $ | 42,200,631 | $ | 33,975,343 | ||||||||
| Shares outstanding |
14,471,331 | 3,045,019 | 1,766,453 | 2,664,996 | ||||||||||||
| Net asset value per share |
$ | 14.52 | $ | 16.21 | $ | 23.89 | $ | 12.75 | ||||||||
| Offering price per share (net asset value per share plus maximum sales charge of 5.75% of offering price) |
$ | 15.41 | $ | 17.20 | $ | 25.35 | $ | 13.53 | ||||||||
| Class B Shares |
||||||||||||||||
| Net assets |
$ | 2,037,261 | N/A | $ | 1,824,450 | N/A | ||||||||||
| Shares outstanding |
141,629 | N/A | 81,096 | N/A | ||||||||||||
| Net asset value and offering price per share |
$ | 14.38 | N/A | $ | 22.50 | N/A | ||||||||||
| Class C Shares |
||||||||||||||||
| Net assets |
$ | 24,466,191 | $ | 1,228,687 | $ | 9,024,522 | $ | 1,631,942 | ||||||||
| Shares outstanding |
1,702,864 | 77,575 | 392,165 | 146,219 | ||||||||||||
| Net asset value and offering price per share |
$ | 14.37 | $ | 15.84 | $ | 23.01 | $ | 11.16 | ||||||||
| Class R3 Shares |
||||||||||||||||
| Net assets |
$ | 17,311,780 | $ | 485,666 | $ | 12,370,802 | $ | 2,493,668 | ||||||||
| Shares outstanding |
1,194,228 | 30,136 | 520,349 | 199,180 | ||||||||||||
| Net asset value and offering price per share |
$ | 14.50 | $ | 16.12 | $ | 23.77 | $ | 12.52 | ||||||||
| Class I Shares |
||||||||||||||||
| Net assets |
$ | 963,630,473 | $ | 101,245,208 | $ | 138,025,462 | $ | 48,646,939 | ||||||||
| Shares outstanding |
65,844,971 | 6,216,659 | 5,745,167 | 3,696,419 | ||||||||||||
| Net asset value and offering price per share |
$ | 14.63 | $ | 16.29 | $ | 24.02 | $ | 13.16 | ||||||||
| Net assets consist of: |
||||||||||||||||
| Capital paid-in |
$ | 866,397,424 | $ | 225,652,622 | $ | 245,511,159 | $ | 109,924,106 | ||||||||
| Undistributed (Over-distribution of) net investment income |
83,734 | 1,102,923 | 707,149 | 306,450 | ||||||||||||
| Accumulated net realized gain (loss) |
28,000,362 | (84,184,745 | ) | (55,374,872 | ) | (33,841,014 | ) | |||||||||
| Net unrealized appreciation (depreciation) |
323,126,940 | 9,735,203 | 12,602,431 | 10,358,350 | ||||||||||||
| Net assets |
$ | 1,217,608,460 | $ | 152,306,003 | $ | 203,445,867 | $ | 86,747,892 | ||||||||
| Authorized shares |
2 billion | 2 billion | 2 billion | 2 billion | ||||||||||||
| Par value per share |
$ | 0.0001 | $ | 0.0001 | $ | 0.0001 | $ | 0.0001 | ||||||||
| N/A – | Small Cap Value does not offer Class B Shares. Class B Shares of Large Cap Value converted to Class A Shares at the close of business on February 15, 2012 and are no longer available for divided reinvestment or through an exchange from other Nuveen mutual funds. |
See accompanying notes to financial statements.
| 32 | Nuveen Investments |
Statement of Operations (Unaudited)
Six Months Ended April 30, 2012
| Dividend Value |
Large Cap Value |
Mid Cap Value |
Small Cap Value |
|||||||||||||
| Investment Income |
||||||||||||||||
| Dividend and Interest income from unaffiliated investments (net of foreign tax withheld of $135,631, $21,015, $517 and $ –, respectively) |
$ | 18,761,021 | $ | 1,942,345 | $ | 1,923,548 | $ | 861,959 | ||||||||
| Securities lending income |
148,708 | 29,388 | 45,979 | 41,199 | ||||||||||||
| Total investment income |
18,909,729 | 1,971,733 | 1,969,527 | 903,158 | ||||||||||||
| Expenses |
||||||||||||||||
| Management fees |
4,361,933 | 569,195 | 954,589 | 394,564 | ||||||||||||
| 12b-1 service fees – Class A |
240,044 | 61,605 | 56,977 | 41,182 | ||||||||||||
| 12b-1 distribution and service fees – Class B |
12,898 | N/A | 9,770 | N/A | ||||||||||||
| 12b-1 distribution and service fees – Class C |
107,215 | 5,516 | 44,527 | 7,677 | ||||||||||||
| 12b-1 distribution and service fees – Class R3 |
35,489 | 1,679 | 34,731 | 6,152 | ||||||||||||
| Shareholders’ servicing agent fees and expenses |
635,049 | 153,116 | 318,329 | 162,009 | ||||||||||||
| Custodian’s fees and expenses |
86,878 | 18,771 | 26,150 | 12,976 | ||||||||||||
| Directors’ fees and expenses |
16,443 | 2,298 | 3,115 | 1,409 | ||||||||||||
| Professional fees |
35,497 | 357 | 9,531 | 3,651 | ||||||||||||
| Shareholders’ reports – printing and mailing expenses |
53,048 | 11,995 | 14,171 | 10,274 | ||||||||||||
| Federal and state registration fees |
38,547 | 28,704 | 30,282 | 27,311 | ||||||||||||
| Other expenses |
17,685 | 9,442 | 12,767 | 10,489 | ||||||||||||
| Total expenses before expense reimbursement |
5,640,726 | 862,678 | 1,514,939 | 677,694 | ||||||||||||
| Expense reimbursement |
— | (2,178 | ) | (274,566 | ) | (91,943 | ) | |||||||||
| Net expenses |
5,640,726 | 860,500 | 1,240,373 | 585,751 | ||||||||||||
| Net investment income (loss) |
13,269,003 | 1,111,233 | 729,154 | 317,407 | ||||||||||||
| Realized and Unrealized Gain (Loss) |
||||||||||||||||
| Net realized gain (loss) from investments |
29,778,587 | 6,503,135 | 9,613,308 | 6,745,063 | ||||||||||||
| Change in net unrealized appreciation (depreciation) of investments |
95,429,312 | 11,005,895 | 10,130,285 | 3,629,062 | ||||||||||||
| Net realized and unrealized gain (loss) |
125,207,899 | 17,509,030 | 19,743,593 | 10,374,125 | ||||||||||||
| Net increase (decrease) in net assets from operations |
$ | 138,476,902 | $ | 18,620,263 | $ | 20,472,747 | $ | 10,691,532 | ||||||||
| N/A – | Small Cap Value does not offer Class B Shares. Class B Shares of Large Cap Value converted to Class A Shares at the close of business on February 15, 2012 and are no longer available for divided reinvestment or through an exchange from other Nuveen mutual funds. |
See accompanying notes to financial statements.
| Nuveen Investments | 33 |
Statement of Changes in Net Assets (Unaudited)
| Dividend Value | Large Cap Value | |||||||||||||||
| Six Months Ended 4/30/12 |
Year Ended 10/31/11 |
Six Months Ended 4/30/12 |
Year Ended 10/31/11 |
|||||||||||||
| Operations |
||||||||||||||||
| Net investment income (loss) |
$ | 13,269,003 | $ | 22,403,547 | $ | 1,111,233 | $ | 1,694,307 | ||||||||
| Net realized gain (loss) from: |
||||||||||||||||
| Investments |
29,778,587 | 5,603,569 | 6,503,135 | 19,195,878 | ||||||||||||
| Redemptions in-kind |
— | — | — | 15,436,123 | ||||||||||||
| Change in net unrealized appreciation (depreciation) of investments |
95,429,312 | 38,786,442 | 11,005,895 | (24,277,216 | ) | |||||||||||
| Net increase (decrease) in net assets from operations |
138,476,902 | 66,793,558 | 18,620,263 | 12,049,092 | ||||||||||||
| Distributions to Shareholders |
||||||||||||||||
| From net investment income: |
||||||||||||||||
| Class A |
(2,359,586 | ) | (3,311,206 | ) | (189,275 | ) | (696,738 | ) | ||||||||
| Class B |
(22,980 | ) | (30,068 | ) | N/A | (5,760 | ) | |||||||||
| Class C |
(186,243 | ) | (155,136 | ) | — | (5,506 | ) | |||||||||
| Class R3(1) |
(158,565 | ) | (74,593 | ) | (1,206 | ) | (8,973 | ) | ||||||||
| Class I(1) |
(12,449,183 | ) | (19,550,217 | ) | (686,230 | ) | (2,375,027 | ) | ||||||||
| Decrease in net assets from distributions to shareholders |
(15,176,557 | ) | (23,121,220 | ) | (876,711 | ) | (3,092,004 | ) | ||||||||
| Fund Share Transactions |
||||||||||||||||
| Proceeds from sale of shares |
170,770,693 | 441,406,794 | 6,388,916 | 8,440,042 | ||||||||||||
| Proceeds from shares issued to shareholders due to reinvestment of distributions |
6,932,320 | 9,484,764 | 522,996 | 1,788,847 | ||||||||||||
| 177,703,013 | 450,891,558 | 6,911,912 | 10,228,889 | |||||||||||||
| Cost of shares redeemed |
(155,924,595 | ) | (249,150,489 | ) | (26,726,038 | ) | (74,896,322 | ) | ||||||||
| Cost of redemptions in-kind |
— | — | — | (132,685,046 | ) | |||||||||||
| Net increase (decrease) in net assets from Fund share transactions |
21,778,418 | 201,741,069 | (19,814,126 | ) | (197,352,479 | ) | ||||||||||
| Net increase (decrease) in net assets |
145,078,763 | 245,413,407 | (2,070,574 | ) | (188,395,391 | ) | ||||||||||
| Net assets at the beginning of period |
1,072,529,697 | 827,116,290 | 154,376,577 | 342,771,968 | ||||||||||||
| Net assets at the end of period |
$ | 1,217,608,460 | $ | 1,072,529,697 | $ | 152,306,003 | $ | 154,376,577 | ||||||||
| Undistributed (Over-distribution of) net investment income at the end of period |
$ | 83,734 | $ | 1,991,288 | $ | 1,102,923 | $ | 868,401 | ||||||||
| N/A – | Class B Shares of Large Cap Value converted to Class A Shares at the close of business on February 15, 2012 and are no longer available for dividend reinvestment or through an exchange from other Nuveen mutual funds. |
| (1) | Effective January 18, 2011, Class R Shares and Class Y Shares previously offered by FAF Advisors, Inc. were renamed Class R3 Shares and Class I Shares, respectively. |
See accompanying notes to financial statements.
| 34 | Nuveen Investments |
| Mid Cap Value | Small Cap Value | |||||||||||||||
| Six Months Ended 4/30/12 |
Year Ended 10/31/11 |
Six Months Ended 4/30/12 |
Year Ended 10/31/11 |
|||||||||||||
| Operations |
||||||||||||||||
| Net investment income (loss) |
$ | 729,154 | $ | 1,667,039 | $ | 317,407 | $ | (290,831 | ) | |||||||
| Net realized gain (loss) from: |
||||||||||||||||
| Investments |
9,613,308 | 42,262,542 | 6,745,063 | 10,390,805 | ||||||||||||
| Redemptions in-kind |
— | 51,352,202 | — | 27,495,098 | ||||||||||||
| Change in net unrealized appreciation (depreciation) of investments |
10,130,285 | (76,035,365 | ) | 3,629,062 | (17,603,366 | ) | ||||||||||
| Net increase (decrease) in net assets from operations |
20,472,747 | 19,246,418 | 10,691,532 | 19,991,706 | ||||||||||||
| Distributions to Shareholders |
||||||||||||||||
| From net investment income: |
||||||||||||||||
| Class A |
(256,451 | ) | (804,678 | ) | — | — | ||||||||||
| Class B |
— | (9,710 | ) | N/A | N/A | |||||||||||
| Class C |
— | (46,605 | ) | — | — | |||||||||||
| Class R3(1) |
(47,224 | ) | (141,534 | ) | — | — | ||||||||||
| Class I(1) |
(1,219,636 | ) | (2,981,023 | ) | — | — | ||||||||||
| Decrease in net assets from distributions to shareholders |
(1,523,311 | ) | (3,983,550 | ) | — | — | ||||||||||
| Fund Share Transactions |
||||||||||||||||
| Proceeds from sale of shares |
16,220,374 | 38,984,469 | 12,124,973 | 19,212,422 | ||||||||||||
| Proceeds from shares issued to shareholders due to reinvestment of distributions |
817,190 | 2,082,155 | — | — | ||||||||||||
| 17,037,564 | 41,066,624 | 12,124,973 | 19,212,422 | |||||||||||||
| Cost of shares redeemed |
(62,623,790 | ) | (145,839,650 | ) | (20,222,181 | ) | (44,281,152 | ) | ||||||||
| Cost of redemptions in-kind |
— | (261,914,439 | ) | — | (127,930,138 | ) | ||||||||||
| Net increase (decrease) in net assets from Fund share transactions |
(45,586,226 | ) | (366,687,465 | ) | (8,097,208 | ) | (152,998,868 | ) | ||||||||
| Net increase (decrease) in net assets |
(26,636,790 | ) | (351,424,597 | ) | 2,594,324 | (133,007,162 | ) | |||||||||
| Net assets at the beginning of period |
230,082,657 | 581,507,254 | 84,153,568 | 217,160,730 | ||||||||||||
| Net assets at the end of period |
$ | 203,445,867 | $ | 230,082,657 | $ | 86,747,892 | $ | 84,153,568 | ||||||||
| Undistributed (Over-distribution of) net investment income at the end of period |
$ | 707,149 | $ | 1,501,306 | $ | 306,450 | $ | (10,957 | ) | |||||||
| N/A – | Small Cap Value does not offer Class B Shares. |
| (1) | Effective January 18, 2011, Class R Shares and Class Y Shares previously offered by FAF Advisors, Inc. were renamed Class R3 Shares and Class I Shares, respectively. |
See accompanying notes to financial statements.
| Nuveen Investments | 35 |
Financial Highlights (Unaudited)
| Selected data for a share outstanding throughout each period: | ||||||||||||||||||||||||||||||||
| Class (Commencement Date) | ||||||||||||||||||||||||||||||||
| Investment Operations | Less Distributions | |||||||||||||||||||||||||||||||
| DIVIDEND VALUE | ||||||||||||||||||||||||||||||||
| Year Ended October 31, |
Beginning Net Asset Value |
Net Invest- ment Income (Loss)(a) |
Net Realized/ Unrealized Gain (Loss) |
Total | Net Invest- ment Income |
Capital Gains(b) |
Total | Ending Net Asset Value |
||||||||||||||||||||||||
| Class A (12/92) |
|
|||||||||||||||||||||||||||||||
| 2012(f) |
$ | 13.05 | $ | .15 | $ | 1.49 | $ | 1.64 | $ | (.17 | ) | $ | — | $ | (.17 | ) | $ | 14.52 | ||||||||||||||
| 2011 |
12.42 | .27 | .63 | .90 | (.27 | ) | — | (.27 | ) | 13.05 | ||||||||||||||||||||||
| 2010 |
10.76 | .34 | 1.63 | 1.97 | (.31 | ) | — | (.31 | ) | 12.42 | ||||||||||||||||||||||
| 2009 |
10.09 | .29 | .71 | 1.00 | (.33 | ) | — | (.33 | ) | 10.76 | ||||||||||||||||||||||
| 2008 |
16.43 | .33 | (5.28 | ) | (4.95 | ) | (.29 | ) | (1.10 | ) | (1.39 | ) | 10.09 | |||||||||||||||||||
| 2007 |
15.90 | .29 | 1.96 | 2.25 | (.29 | ) | (1.43 | ) | (1.72 | ) | 16.43 | |||||||||||||||||||||
| Class B (8/94) |
|
|||||||||||||||||||||||||||||||
| 2012(f) |
12.93 | .10 | 1.47 | 1.57 | (.12 | ) | — | (.12 | ) | 14.38 | ||||||||||||||||||||||
| 2011 |
12.25 | .17 | .61 | .78 | (.10 | ) | — | (.10 | ) | 12.93 | ||||||||||||||||||||||
| 2010 |
10.61 | .24 | 1.61 | 1.85 | (.21 | ) | — | (.21 | ) | 12.25 | ||||||||||||||||||||||
| 2009 |
9.96 | .22 | .68 | .90 | (.25 | ) | — | (.25 | ) | 10.61 | ||||||||||||||||||||||
| 2008 |
16.23 | .22 | (5.19 | ) | (4.97 | ) | (.20 | ) | (1.10 | ) | (1.30 | ) | 9.96 | |||||||||||||||||||
| 2007 |
15.75 | .17 | 1.94 | 2.11 | (.20 | ) | (1.43 | ) | (1.63 | ) | 16.23 | |||||||||||||||||||||
| Class C (2/99) |
|
|||||||||||||||||||||||||||||||
| 2012(f) |
12.92 | .09 | 1.48 | 1.57 | (.12 | ) | — | (.12 | ) | 14.37 | ||||||||||||||||||||||
| 2011 |
12.26 | .17 | .62 | .79 | (.13 | ) | — | (.13 | ) | 12.92 | ||||||||||||||||||||||
| 2010 |
10.63 | .26 | 1.60 | 1.86 | (.23 | ) | — | (.23 | ) | 12.26 | ||||||||||||||||||||||
| 2009 |
9.98 | .21 | .69 | .90 | (.25 | ) | — | (.25 | ) | 10.63 | ||||||||||||||||||||||
| 2008 |
16.26 | .22 | (5.20 | ) | (4.98 | ) | (.20 | ) | (1.10 | ) | (1.30 | ) | 9.98 | |||||||||||||||||||
| 2007 |
15.78 | .17 | 1.94 | 2.11 | (.20 | ) | (1.43 | ) | (1.63 | ) | 16.26 | |||||||||||||||||||||
| Class R3 (9/01)(e) |
|
|||||||||||||||||||||||||||||||
| 2012(f) |
13.03 | .13 | 1.49 | 1.62 | (.15 | ) | — | (.15 | ) | 14.50 | ||||||||||||||||||||||
| 2011 |
12.41 | .23 | .63 | .86 | (.24 | ) | — | (.24 | ) | 13.03 | ||||||||||||||||||||||
| 2010 |
10.76 | .30 | 1.64 | 1.94 | (.29 | ) | — | (.29 | ) | 12.41 | ||||||||||||||||||||||
| 2009 |
10.08 | .28 | .68 | .96 | (.28 | ) | — | (.28 | ) | 10.76 | ||||||||||||||||||||||
| 2008 |
16.41 | .29 | (5.26 | ) | (4.97 | ) | (.26 | ) | (1.10 | ) | (1.36 | ) | 10.08 | |||||||||||||||||||
| 2007 |
15.88 | .23 | 1.98 | 2.21 | (.25 | ) | (1.43 | ) | (1.68 | ) | 16.41 | |||||||||||||||||||||
| Class I (8/94)(e) |
|
|||||||||||||||||||||||||||||||
| 2012(f) |
13.16 | .17 | 1.49 | 1.66 | (.19 | ) | — | (.19 | ) | 14.63 | ||||||||||||||||||||||
| 2011 |
12.53 | .31 | .64 | .95 | (.32 | ) | — | (.32 | ) | 13.16 | ||||||||||||||||||||||
| 2010 |
10.85 | .37 | 1.65 | 2.02 | (.34 | ) | — | (.34 | ) | 12.53 | ||||||||||||||||||||||
| 2009 |
10.18 | .32 | .70 | 1.02 | (.35 | ) | — | (.35 | ) | 10.85 | ||||||||||||||||||||||
| 2008 |
16.55 | .36 | (5.30 | ) | (4.94 | ) | (.33 | ) | (1.10 | ) | (1.43 | ) | 10.18 | |||||||||||||||||||
| 2007 |
16.00 | .33 | 1.98 | 2.31 | (.33 | ) | (1.43 | ) | (1.76 | ) | 16.55 | |||||||||||||||||||||
| 36 | Nuveen Investments |
| Ratios/Supplemental Data | ||||||||||||||||||||||||||
| Ratios to Average Net Assets Before Reimbursement |
Ratios to Average Net Assets After Reimbursement(d) |
|||||||||||||||||||||||||
| Total Return(c) |
Ending Net Assets (000) |
Expenses | Net Invest- ment Income (Loss) |
Expenses | Net Invest- ment Income (Loss) |
Portfolio Turnover Rate |
||||||||||||||||||||
| 12.56 | % | $ | 210,163 | 1.17 | %* | 2.14 | %* | 1.17 | %* | 2.14 | %* | 11 | % | |||||||||||||
| 7.28 | 176,954 | 1.14 | 2.05 | 1.14 | 2.05 | 33 | ||||||||||||||||||||
| 18.46 | 125,226 | 1.19 | 2.87 | 1.17 | 2.89 | 29 | ||||||||||||||||||||
| 10.32 | 100,059 | 1.19 | 3.00 | 1.19 | 3.00 | 48 | ||||||||||||||||||||
| (32.51 | ) | 100,824 | 1.17 | 2.45 | 1.17 | 2.45 | 32 | |||||||||||||||||||
| 15.24 | 179,379 | 1.16 | 1.83 | 1.16 | 1.83 | 20 | ||||||||||||||||||||
| 12.10 | 2,037 | 1.92 | * | 1.49 | * | 1.92 | * | 1.49 | * | 11 | ||||||||||||||||
| 6.45 | 3,016 | 1.89 | 1.32 | 1.89 | 1.32 | 33 | ||||||||||||||||||||
| 17.59 | 5,039 | 1.94 | 2.05 | 1.92 | 2.07 | 29 | ||||||||||||||||||||
| 9.41 | 7,237 | 1.94 | 2.28 | 1.94 | 2.28 | 48 | ||||||||||||||||||||
| (32.95 | ) | 9,113 | 1.92 | 1.69 | 1.92 | 1.69 | 32 | |||||||||||||||||||
| 14.40 | 16,893 | 1.91 | 1.09 | 1.91 | 1.09 | 20 | ||||||||||||||||||||
| 12.19 | 24,466 | 1.92 | * | 1.37 | * | 1.92 | * | 1.37 | * | 11 | ||||||||||||||||
| 6.42 | 18,714 | 1.89 | 1.31 | 1.89 | 1.31 | 33 | ||||||||||||||||||||
| 17.60 | 11,107 | 1.94 | 2.20 | 1.92 | 2.22 | 29 | ||||||||||||||||||||
| 9.41 | 4,921 | 1.94 | 2.23 | 1.94 | 2.23 | 48 | ||||||||||||||||||||
| (32.95 | ) | 4,625 | 1.92 | 1.69 | 1.92 | 1.69 | 32 | |||||||||||||||||||
| 14.37 | 9,241 | 1.91 | 1.09 | 1.91 | 1.09 | 20 | ||||||||||||||||||||
| 12.52 | 17,312 | 1.42 | * | 1.86 | * | 1.42 | * | 1.86 | * | 11 | ||||||||||||||||
| 6.93 | 12,092 | 1.41 | 1.75 | 1.41 | 1.75 | 33 | ||||||||||||||||||||
| 18.16 | 1,204 | 1.41 | 2.48 | 1.39 | 2.50 | 29 | ||||||||||||||||||||
| 9.92 | 122 | 1.45 | 2.94 | 1.45 | 2.94 | 48 | ||||||||||||||||||||
| (32.64 | ) | 535 | 1.42 | 2.20 | 1.42 | 2.20 | 32 | |||||||||||||||||||
| 14.98 | 940 | 1.41 | 1.48 | 1.41 | 1.48 | 20 | ||||||||||||||||||||
| 12.68 | 963,630 | .92 | * | 2.40 | * | .92 | * | 2.40 | * | 11 | ||||||||||||||||
| 7.56 | 861,754 | .89 | 2.30 | .89 | 2.31 | 33 | ||||||||||||||||||||
| 18.78 | 684,540 | .94 | 3.12 | .92 | 3.10 | 29 | ||||||||||||||||||||
| 10.51 | 570,690 | .94 | 3.25 | .94 | 3.25 | 48 | ||||||||||||||||||||
| (32.29 | ) | 574,162 | .92 | 2.70 | .92 | 2.70 | 32 | |||||||||||||||||||
| 15.54 | 1,061,433 | .91 | 2.09 | .91 | 2.09 | 20 | ||||||||||||||||||||
| (a) | Per share Net Investment Income (Loss) is calculated using the average daily shares method. |
| (b) | Distributions from Capital Gains include short-term capital gains, if any. |
| (c) | Total return is the combination of changes in net asset value without any sales charge, reinvested dividend income at net asset value and reinvested capital gains distributions at net asset value, if any. Total returns are not annualized. |
| (d) | After expense reimbursement from the Adviser, where applicable. |
| (e) | Effective January 18, 2011, Class R Shares and Class Y Shares previously offered by FAF Advisors, Inc. were renamed Class R3 Shares and Class I Shares, respectively. |
| (f) | For the six months ended April 30, 2012. |
| * | Annualized. |
See accompanying notes to financial statements.
| Nuveen Investments | 37 |
Financial Highlights (Unaudited) (continued)
| Selected data for a share outstanding throughout each period: | ||||||||||||||||||||||||||||||||
| Class (Commencement Date) | ||||||||||||||||||||||||||||||||
| Investment Operations | Less Distributions | |||||||||||||||||||||||||||||||
| LARGE CAP VALUE | ||||||||||||||||||||||||||||||||
| Year Ended October 31, |
Beginning Net Asset Value |
Net Invest- ment Income (Loss)(a) |
Net Realized/ Unrealized Gain (Loss) |
Total | Net Invest- ment Income |
Capital Gains(b) |
Total | Ending Net Asset Value |
||||||||||||||||||||||||
| Class A (12/87) |
|
|||||||||||||||||||||||||||||||
| 2012(f) |
$ | 14.42 | $ | .10 | $ | 1.75 | $ | 1.85 | $ | (.06 | ) | $ | — | $ | (.06 | ) | $ | 16.21 | ||||||||||||||
| 2011 |
14.32 | .08 | .21 | .29 | (.19 | ) | — | (.19 | ) | 14.42 | ||||||||||||||||||||||
| 2010 |
13.14 | .09 | 1.27 | 1.36 | (.18 | ) | — | (.18 | ) | 14.32 | ||||||||||||||||||||||
| 2009 |
12.88 | .18 | .22 | .40 | (.14 | ) | — | (.14 | ) | 13.14 | ||||||||||||||||||||||
| 2008 |
22.61 | .25 | (7.02 | ) | (6.77 | ) | (.16 | ) | (2.80 | ) | (2.96 | ) | 12.88 | |||||||||||||||||||
| 2007 |
22.12 | .23 | 2.19 | 2.42 | (.24 | ) | (1.69 | ) | (1.93 | ) | 22.61 | |||||||||||||||||||||
| Class C (2/99) |
|
|||||||||||||||||||||||||||||||
| 2012(f) |
14.09 | .04 | 1.71 | 1.75 | — | — | — | 15.84 | ||||||||||||||||||||||||
| 2011 |
13.97 | (.03 | ) | .21 | .18 | (.06 | ) | — | (.06 | ) | 14.09 | |||||||||||||||||||||
| 2010 |
12.81 | (.01 | ) | 1.22 | 1.21 | (.05 | ) | — | (.05 | ) | 13.97 | |||||||||||||||||||||
| 2009 |
12.59 | .09 | .21 | .30 | (.08 | ) | — | (.08 | ) | 12.81 | ||||||||||||||||||||||
| 2008 |
22.21 | .11 | (6.86 | ) | (6.75 | ) | (.07 | ) | (2.80 | ) | (2.87 | ) | 12.59 | |||||||||||||||||||
| 2007 |
21.81 | .07 | 2.14 | 2.21 | (.12 | ) | (1.69 | ) | (1.81 | ) | 22.21 | |||||||||||||||||||||
| Class R3 (9/01)(e) |
|
|||||||||||||||||||||||||||||||
| 2012(f) |
14.32 | .08 | 1.74 | 1.82 | (.02 | ) | — | (.02 | ) | 16.12 | ||||||||||||||||||||||
| 2011 |
14.24 | .05 | .21 | .26 | (.18 | ) | — | (.18 | ) | 14.32 | ||||||||||||||||||||||
| 2010 |
13.09 | .05 | 1.26 | 1.31 | (.16 | ) | — | (.16 | ) | 14.24 | ||||||||||||||||||||||
| 2009 |
12.85 | .13 | .23 | .36 | (.12 | ) | — | (.12 | ) | 13.09 | ||||||||||||||||||||||
| 2008 |
22.57 | .20 | (6.99 | ) | (6.79 | ) | (.13 | ) | (2.80 | ) | (2.93 | ) | 12.85 | |||||||||||||||||||
| 2007 |
22.10 | .17 | 2.17 | 2.34 | (.18 | ) | (1.69 | ) | (1.87 | ) | 22.57 | |||||||||||||||||||||
| Class I (2/94)(e) |
|
|||||||||||||||||||||||||||||||
| 2012(f) |
14.51 | .12 | 1.76 | 1.88 | (.10 | ) | — | (.10 | ) | 16.29 | ||||||||||||||||||||||
| 2011 |
14.41 | .15 | .18 | .33 | (.23 | ) | — | (.23 | ) | 14.51 | ||||||||||||||||||||||
| 2010 |
13.23 | .12 | 1.27 | 1.39 | (.21 | ) | — | (.21 | ) | 14.41 | ||||||||||||||||||||||
| 2009 |
12.95 | .21 | .23 | .44 | (.16 | ) | — | (.16 | ) | 13.23 | ||||||||||||||||||||||
| 2008 |
22.69 | .29 | (7.04 | ) | (6.75 | ) | (.19 | ) | (2.80 | ) | (2.99 | ) | 12.95 | |||||||||||||||||||
| 2007 |
22.19 | .29 | 2.18 | 2.47 | (.28 | ) | (1.69 | ) | (1.97 | ) | 22.69 | |||||||||||||||||||||
| 38 | Nuveen Investments |
| Ratios/Supplemental Data | ||||||||||||||||||||||||||
| Ratios to Average Net Assets Before Reimbursement |
Ratios to Average Net Assets After Reimbursement(d) |
|||||||||||||||||||||||||
| Total Return(c) |
Ending Net Assets (000) |
Expenses | Net Invest- ment Income (Loss) |
Expenses | Net Invest- ment Income (Loss) |
Portfolio Turnover Rate |
||||||||||||||||||||
| 12.88 | % | $ | 49,346 | 1.32 | %* | 1.30 | %* | 1.31 | %* | 1.30 | %* | 47 | % | |||||||||||||
| 1.98 | 46,659 | 1.24 | .56 | 1.24 | .56 | 114 | ||||||||||||||||||||
| 10.36 | 52,567 | 1.23 | .63 | 1.23 | .63 | 135 | ||||||||||||||||||||
| 3.24 | 55,401 | 1.22 | 1.49 | 1.22 | 1.49 | 68 | ||||||||||||||||||||
| (34.00 | ) | 60,870 | 1.19 | 1.41 | 1.19 | 1.41 | 90 | |||||||||||||||||||
| 11.60 | 113,223 | 1.17 | 1.05 | 1.17 | 1.05 | 81 | ||||||||||||||||||||
| 12.42 | 1,229 | 2.04 | * | .54 | * | 2.04 | * | .54 | * | 47 | ||||||||||||||||
| 1.28 | 1,094 | 1.99 | (.19 | ) | 1.99 | (.19 | ) | 114 | ||||||||||||||||||
| 9.45 | 1,337 | 1.98 | (.10 | ) | 1.98 | (.10 | ) | 135 | ||||||||||||||||||
| 2.47 | 2,016 | 1.97 | .76 | 1.97 | .76 | 68 | ||||||||||||||||||||
| (34.46 | ) | 2,643 | 1.94 | .66 | 1.94 | .66 | 90 | |||||||||||||||||||
| 10.71 | 4,587 | 1.92 | .31 | 1.92 | .31 | 81 | ||||||||||||||||||||
| 12.75 | 486 | 1.54 | * | 1.08 | * | 1.54 | * | 1.08 | * | 47 | ||||||||||||||||
| 1.74 | 768 | 1.49 | .33 | 1.49 | .33 | 114 | ||||||||||||||||||||
| 10.04 | 794 | 1.49 | .35 | 1.49 | .35 | 135 | ||||||||||||||||||||
| 2.96 | 340 | 1.47 | 1.06 | 1.47 | 1.06 | 68 | ||||||||||||||||||||
| (34.13 | ) | 174 | 1.44 | 1.18 | 1.44 | 1.18 | 90 | |||||||||||||||||||
| 11.25 | 188 | 1.42 | .78 | 1.42 | .78 | 81 | ||||||||||||||||||||
| 13.02 | 101,245 | 1.04 | * | 1.55 | * | 1.04 | * | 1.55 | * | 47 | ||||||||||||||||
| 2.22 | 104,949 | .99 | .96 | .99 | .96 | 114 | ||||||||||||||||||||
| 10.54 | 286,736 | .98 | .89 | .98 | .89 | 135 | ||||||||||||||||||||
| 3.54 | 335,589 | .97 | 1.76 | .97 | 1.76 | 68 | ||||||||||||||||||||
| (33.80 | ) | 401,006 | .94 | 1.66 | .94 | 1.66 | 90 | |||||||||||||||||||
| 11.83 | 726,512 | .92 | 1.30 | .92 | 1.30 | 81 | ||||||||||||||||||||
| (a) | Per share Net Investment Income (Loss) is calculated using the average daily shares method. |
| (b) | Distributions from Capital Gains include short-term capital gains, if any. |
| (c) | Total return is the combination of changes in net asset value without any sales charge, reinvested dividend income at net asset value and reinvested capital gains distributions at net asset value, if any. Total returns are not annualized. |
| (d) | After expense reimbursement from the Adviser, where applicable. |
| (e) | Effective January 18, 2011, Class R Shares and Class Y Shares previously offered by FAF Advisors Inc. were renamed Class R3 Shares and Class I Shares, respectively. |
| (f) | For the six months ended April 30, 2012. |
| * | Annualized. |
See accompanying notes to financial statements.
| Nuveen Investments | 39 |
Financial Highlights (Unaudited) (continued)
| Selected data for a share outstanding throughout each period: | ||||||||||||||||||||||||||||||||
| Class (Commencement Date) | ||||||||||||||||||||||||||||||||
| Investment Operations | Less Distributions | |||||||||||||||||||||||||||||||
| MID CAP VALUE | ||||||||||||||||||||||||||||||||
| Year Ended October 31, |
Beginning Net Asset Value |
Net Invest- ment Income (Loss)(a) |
Net Realized/ Unrealized Gain (Loss) |
Total | Net Invest- ment Income |
Capital Gains(b) |
Total | Ending Net Asset Value |
||||||||||||||||||||||||
| Class A (12/87) |
|
|||||||||||||||||||||||||||||||
| 2012(f) |
$ | 21.83 | $ | .07 | $ | 2.12 | $ | 2.19 | $ | (.13 | ) | $ | — | $ | (.13 | ) | $ | 23.89 | ||||||||||||||
| 2011 |
22.20 | .07 | (.19 | ) | (.12 | ) | (.25 | ) | — | (.25 | ) | 21.83 | ||||||||||||||||||||
| 2010 |
18.28 | .12 | 4.00 | 4.12 | (.20 | ) | — | (.20 | ) | 22.20 | ||||||||||||||||||||||
| 2009 |
16.13 | .24 | 1.99 | 2.23 | (.08 | ) | — | (.08 | ) | 18.28 | ||||||||||||||||||||||
| 2008 |
27.83 | .21 | (9.92 | ) | (9.71 | ) | (.16 | ) | (1.83 | ) | (1.99 | ) | 16.13 | |||||||||||||||||||
| 2007 |
26.65 | .14 | 2.78 | 2.92 | (.16 | ) | (1.58 | ) | (1.74 | ) | 27.83 | |||||||||||||||||||||
| Class B (8/94) |
|
|||||||||||||||||||||||||||||||
| 2012(f) |
20.52 | (.02 | ) | 2.00 | 1.98 | — | — | — | 22.50 | |||||||||||||||||||||||
| 2011 |
20.87 | (.10 | ) | (.18 | ) | (.28 | ) | (.07 | ) | — | (.07 | ) | 20.52 | |||||||||||||||||||
| 2010 |
17.21 | (.04 | ) | 3.78 | 3.74 | (.08 | ) | — | (.08 | ) | 20.87 | |||||||||||||||||||||
| 2009 |
15.22 | .13 | 1.87 | 2.00 | (.01 | ) | — | (.01 | ) | 17.21 | ||||||||||||||||||||||
| 2008 |
26.48 | .03 | (9.39 | ) | (9.36 | ) | (.07 | ) | (1.83 | ) | (1.90 | ) | 15.22 | |||||||||||||||||||
| 2007 |
25.50 | (.05 | ) | 2.65 | 2.60 | (.04 | ) | (1.58 | ) | (1.62 | ) | 26.48 | ||||||||||||||||||||
| Class C (2/99) |
|
|||||||||||||||||||||||||||||||
| 2012(f) |
20.99 | (.02 | ) | 2.04 | 2.02 | — | — | — | 23.01 | |||||||||||||||||||||||
| 2011 |
21.36 | (.10 | ) | (.18 | ) | (.28 | ) | (.09 | ) | — | (.09 | ) | 20.99 | |||||||||||||||||||
| 2010 |
17.61 | (.04 | ) | 3.86 | 3.82 | (.07 | ) | — | (.07 | ) | 21.36 | |||||||||||||||||||||
| 2009 |
15.58 | .12 | 1.92 | 2.04 | (.01 | ) | — | (.01 | ) | 17.61 | ||||||||||||||||||||||
| 2008 |
27.05 | .03 | (9.60 | ) | (9.57 | ) | (.07 | ) | (1.83 | ) | (1.90 | ) | 15.58 | |||||||||||||||||||
| 2007 |
26.02 | (.06 | ) | 2.72 | 2.66 | (.05 | ) | (1.58 | ) | (1.63 | ) | 27.05 | ||||||||||||||||||||
| Class R3 (9/01)(e) |
|
|||||||||||||||||||||||||||||||
| 2012(f) |
21.70 | .04 | 2.10 | 2.14 | (.07 | ) | — | (.07 | ) | 23.77 | ||||||||||||||||||||||
| 2011 |
22.05 | .01 | (.19 | ) | (.18 | ) | (.17 | ) | — | (.17 | ) | 21.70 | ||||||||||||||||||||
| 2010 |
18.15 | .06 | 3.99 | 4.05 | (.15 | ) | — | (.15 | ) | 22.05 | ||||||||||||||||||||||
| 2009 |
16.04 | .19 | 1.98 | 2.17 | (.06 | ) | — | (.06 | ) | 18.15 | ||||||||||||||||||||||
| 2008 |
27.72 | .15 | (9.87 | ) | (9.72 | ) | (.13 | ) | (1.83 | ) | (1.96 | ) | 16.04 | |||||||||||||||||||
| 2007 |
26.56 | .06 | 2.78 | 2.84 | (.10 | ) | (1.58 | ) | (1.68 | ) | 27.72 | |||||||||||||||||||||
| Class I (2/94)(e) |
|
|||||||||||||||||||||||||||||||
| 2012(f) |
21.99 | .09 | 2.13 | 2.22 | (.19 | ) | — | (.19 | ) | 24.02 | ||||||||||||||||||||||
| 2011 |
22.37 | .15 | (.22 | ) | (.07 | ) | (.31 | ) | — | (.31 | ) | 21.99 | ||||||||||||||||||||
| 2010 |
18.42 | .16 | 4.05 | 4.21 | (.26 | ) | — | (.26 | ) | 22.37 | ||||||||||||||||||||||
| 2009 |
16.24 | .28 | 2.01 | 2.29 | (.11 | ) | — | (.11 | ) | 18.42 | ||||||||||||||||||||||
| 2008 |
27.98 | .27 | (9.99 | ) | (9.72 | ) | (.19 | ) | (1.83 | ) | (2.02 | ) | 16.24 | |||||||||||||||||||
| 2007 |
26.77 | .22 | 2.80 | 3.02 | (.23 | ) | (1.58 | ) | (1.81 | ) | 27.98 | |||||||||||||||||||||
| 40 | Nuveen Investments |
| Ratios/Supplemental Data | ||||||||||||||||||||||||||
| Ratios to Average Net Assets Before Reimbursement |
Ratios to Average Net Assets After Reimbursement(d) |
|||||||||||||||||||||||||
| Total Return(c) |
Ending Net Assets (000) |
Expenses | Net Invest- ment Income (Loss) |
Expenses | Net Invest- ment Income (Loss) |
Portfolio Turnover Rate |
||||||||||||||||||||
| 10.08 | % | $ | 42,201 | 1.53 | %* | .33 | %* | 1.28 | %* | .58 | %* | 78 | % | |||||||||||||
| (.64 | ) | 52,334 | 1.33 | .27 | 1.31 | .30 | 123 | |||||||||||||||||||
| 22.65 | 76,667 | 1.25 | .58 | 1.25 | .58 | 123 | ||||||||||||||||||||
| 13.95 | 130,222 | 1.25 | 1.52 | 1.25 | 1.52 | 106 | ||||||||||||||||||||
| (37.32 | ) | 124,275 | 1.23 | .90 | 1.23 | .90 | 93 | |||||||||||||||||||
| 11.47 | 254,342 | 1.22 | .58 | 1.22 | .58 | 95 | ||||||||||||||||||||
| 9.65 | 1,824 | 2.28 | * | (.44 | )* | 2.03 | * | (.18 | )* | 78 | ||||||||||||||||
| (1.35 | ) | 2,073 | 2.08 | (.48 | ) | 2.06 | (.45 | ) | 123 | |||||||||||||||||
| 21.77 | 2,815 | 2.00 | (.20 | ) | 2.00 | (.20 | ) | 123 | ||||||||||||||||||
| 13.13 | 3,481 | 1.98 | .85 | 1.98 | .85 | 106 | ||||||||||||||||||||
| (37.82 | ) | 4,133 | 1.98 | .14 | 1.98 | .14 | 93 | |||||||||||||||||||
| 10.67 | 8,360 | 1.97 | (.13 | ) | 1.97 | (.13 | ) | 95 | ||||||||||||||||||
| 9.62 | 9,025 | 2.29 | * | (.45 | )* | 2.03 | * | (.19 | )* | 78 | ||||||||||||||||
| (1.35 | ) | 8,957 | 2.08 | (.48 | ) | 2.06 | (.45 | ) | 123 | |||||||||||||||||
| 21.74 | 11,564 | 2.00 | (.21 | ) | 2.00 | (.21 | ) | 123 | ||||||||||||||||||
| 13.10 | 12,040 | 2.00 | .80 | 2.00 | .80 | 106 | ||||||||||||||||||||
| (37.80 | ) | 13,154 | 1.98 | .14 | 1.98 | .14 | 93 | |||||||||||||||||||
| 10.66 | 26,141 | 1.97 | (.18 | ) | 1.97 | (.18 | ) | 95 | ||||||||||||||||||
| 9.89 | 12,371 | 1.77 | * | .08 | * | 1.53 | * | .33 | * | 78 | ||||||||||||||||
| (.87 | ) | 15,310 | 1.58 | .03 | 1.56 | .06 | 123 | |||||||||||||||||||
| 22.40 | 20,195 | 1.50 | .30 | 1.50 | .30 | 123 | ||||||||||||||||||||
| 13.63 | 25,664 | 1.50 | 1.21 | 1.50 | 1.21 | 106 | ||||||||||||||||||||
| (37.47 | ) | 23,423 | 1.49 | .64 | 1.49 | .64 | 93 | |||||||||||||||||||
| 11.18 | 29,752 | 1.47 | .29 | 1.47 | .29 | 95 | ||||||||||||||||||||
| 10.16 | 138,025 | 1.29 | * | .56 | * | 1.03 | * | .82 | * | 78 | ||||||||||||||||
| (.42 | ) | 151,409 | 1.07 | .65 | 1.06 | .65 | 123 | |||||||||||||||||||
| 22.98 | 470,266 | 1.00 | .78 | 1.00 | .78 | 123 | ||||||||||||||||||||
| 14.24 | 440,968 | 1.00 | 1.76 | 1.00 | 1.76 | 106 | ||||||||||||||||||||
| (37.17 | ) | 415,486 | .99 | 1.14 | .99 | 1.14 | 93 | |||||||||||||||||||
| 11.79 | 772,178 | .97 | .86 | .97 | .86 | 95 | ||||||||||||||||||||
| (a) | Per share Net Investment Income (Loss) is calculated using the average daily shares method. |
| (b) | Distributions from Capital Gains include short-term capital gains, if any. |
| (c) | Total return is the combination of changes in net asset value without any sales charge, reinvested dividend income at net asset value and reinvested capital gains distributions at net asset value, if any. Total returns are not annualized. |
| (d) | After expense reimbursement from the Adviser, where applicable. |
| (e) | Effective January 18, 2011, Class R Shares and Class Y Shares previously offered by FAF Advisors Inc. were renamed Class R3 Shares and Class I Shares, respectively. |
| (f) | For the six months ended April 30, 2012. |
| * | Annualized. |
See accompanying notes to financial statements.
| Nuveen Investments | 41 |
Financial Highlights (Unaudited) (continued)
| Selected data for a share outstanding throughout each period: | ||||||||||||||||||||||||||||||||
| Class (Commencement Date) | ||||||||||||||||||||||||||||||||
| Investment Operations | Less Distributions | |||||||||||||||||||||||||||||||
| SMALL CAP VALUE |
||||||||||||||||||||||||||||||||
| Year Ended October 31, |
Beginning Net Asset Value |
Net Invest- ment Income (Loss)(a) |
Net Realized/ Unrealized Gain (Loss) |
Total | Net Invest- ment Income |
Capital Gains(b) |
Total | Ending Net Asset Value |
||||||||||||||||||||||||
| Class A (8/94) |
|
|||||||||||||||||||||||||||||||
| 2012(f) |
$ | 11.30 | $ | .04 | $ | 1.41 | $ | 1.45 | $ | — | $ | — | $ | — | $ | 12.75 | ||||||||||||||||
| 2011 |
10.26 | (.05 | ) | 1.09 | 1.04 | — | — | — | 11.30 | |||||||||||||||||||||||
| 2010 |
8.22 | (.01 | ) | 2.07 | 2.06 | (.02 | ) | — | (.02 | ) | 10.26 | |||||||||||||||||||||
| 2009 |
8.12 | .03 | .15 | .18 | (.08 | ) | — | (.08 | ) | 8.22 | ||||||||||||||||||||||
| 2008 |
13.52 | .08 | (3.97 | ) | (3.89 | ) | (.14 | ) | (1.37 | ) | (1.51 | ) | 8.12 | |||||||||||||||||||
| 2007 |
15.38 | .12 | .48 | .60 | (.02 | ) | (2.44 | ) | (2.46 | ) | 13.52 | |||||||||||||||||||||
| Class C (2/99) |
|
|||||||||||||||||||||||||||||||
| 2012(f) |
9.93 | (.01 | ) | 1.24 | 1.23 | — | — | — | 11.16 | |||||||||||||||||||||||
| 2011 |
9.08 | (.12 | ) | .97 | .85 | — | — | — | 9.93 | |||||||||||||||||||||||
| 2010 |
7.31 | (.07 | ) | 1.84 | 1.77 | — | — | — | 9.08 | |||||||||||||||||||||||
| 2009 |
7.22 | (.02 | ) | .13 | .11 | (.02 | ) | — | (.02 | ) | 7.31 | |||||||||||||||||||||
| 2008 |
12.19 | — | * | (3.54 | ) | (3.54 | ) | (.06 | ) | (1.37 | ) | (1.43 | ) | 7.22 | ||||||||||||||||||
| 2007 |
14.17 | .02 | .44 | .46 | — | (2.44 | ) | (2.44 | ) | 12.19 | ||||||||||||||||||||||
| Class R3 (9/01)(e) |
|
|||||||||||||||||||||||||||||||
| 2012(f) |
11.11 | .02 | 1.39 | 1.41 | — | — | — | 12.52 | ||||||||||||||||||||||||
| 2011 |
10.11 | (.07 | ) | 1.07 | 1.00 | — | — | — | 11.11 | |||||||||||||||||||||||
| 2010 |
8.10 | (.03 | ) | 2.04 | 2.01 | — | — | — | 10.11 | |||||||||||||||||||||||
| 2009 |
8.00 | .01 | .15 | .16 | (.06 | ) | — | (.06 | ) | 8.10 | ||||||||||||||||||||||
| 2008 |
13.35 | .05 | (3.91 | ) | (3.86 | ) | (.12 | ) | (1.37 | ) | (1.49 | ) | 8.00 | |||||||||||||||||||
| 2007 |
15.24 | .10 | .47 | .57 | (.02 | ) | (2.44 | ) | (2.46 | ) | 13.35 | |||||||||||||||||||||
| Class I (8/94)(e) |
|
|||||||||||||||||||||||||||||||
| 2012(f) |
11.65 | .05 | 1.46 | 1.51 | — | — | — | 13.16 | ||||||||||||||||||||||||
| 2011 |
10.55 | (.02 | ) | 1.12 | 1.10 | — | — | — | 11.65 | |||||||||||||||||||||||
| 2010 |
8.45 | .01 | 2.13 | 2.14 | (.04 | ) | — | (.04 | ) | 10.55 | ||||||||||||||||||||||
| 2009 |
8.36 | .05 | .15 | .20 | (.11 | ) | — | (.11 | ) | 8.45 | ||||||||||||||||||||||
| 2008 |
13.87 | .11 | (4.08 | ) | (3.97 | ) | (.17 | ) | (1.37 | ) | (1.54 | ) | 8.36 | |||||||||||||||||||
| 2007 |
15.71 | .16 | .49 | .65 | (.05 | ) | (2.44 | ) | (2.49 | ) | 13.87 | |||||||||||||||||||||
| 42 | Nuveen Investments |
| Ratios/Supplemental Data | ||||||||||||||||||||||||||
| Ratios to Average Net Assets Before Reimbursement |
Ratios to Average Net Assets After Reimbursement(d) |
|||||||||||||||||||||||||
| Total Return(c) |
Ending Net Assets (000) |
Expenses | Net Invest- ment Income (Loss) |
Expenses | Net Invest- ment Income (Loss) |
Portfolio Turnover Rate |
||||||||||||||||||||
| 12.83 | % | $ | 33,975 | 1.67 | %*** | .38 | %*** | 1.46 | %*** | .59 | %*** | 23 | % | |||||||||||||
| 10.14 | 31,814 | 1.48 | (.41 | ) | 1.46 | (.40 | ) | 41 | ||||||||||||||||||
| 25.15 | 32,332 | 1.34 | (.11 | ) | 1.34 | (.11 | ) | 58 | ||||||||||||||||||
| 2.40 | 29,026 | 1.37 | .46 | 1.37 | .46 | 73 | ||||||||||||||||||||
| (31.75 | ) | 28,344 | 1.31 | .75 | 1.31 | .75 | 49 | |||||||||||||||||||
| 4.18 | 53,498 | 1.26 | .90 | 1.26 | .90 | 63 | ||||||||||||||||||||
| 12.39 | 1,632 | 2.42 | *** | (.35 | )*** | 2.21 | *** | (.14 | )*** | 23 | ||||||||||||||||
| 9.36 | 1,498 | 2.23 | (1.18 | ) | 2.21 | (1.18 | ) | 41 | ||||||||||||||||||
| 24.21 | 1,843 | 2.09 | (.86 | ) | 2.09 | (.86 | ) | 58 | ||||||||||||||||||
| 1.56 | 2,080 | 2.12 | (.27 | ) | 2.12 | (.27 | ) | 73 | ||||||||||||||||||
| (32.23 | ) | 2,373 | 2.06 | — | ** | 2.06 | — | ** | 49 | |||||||||||||||||
| 3.42 | 4,006 | 2.01 | .14 | 2.01 | .14 | 63 | ||||||||||||||||||||
| 12.69 | 2,494 | 1.92 | *** | .14 | *** | 1.71 | *** | .35 | *** | 23 | ||||||||||||||||
| 9.89 | 2,246 | 1.73 | (.66 | ) | 1.71 | (.65 | ) | 41 | ||||||||||||||||||
| 24.85 | 2,111 | 1.59 | (.35 | ) | 1.59 | (.35 | ) | 58 | ||||||||||||||||||
| 2.14 | 2,327 | 1.62 | .19 | 1.62 | .19 | 73 | ||||||||||||||||||||
| (31.90 | ) | 2,159 | 1.56 | .50 | 1.56 | .50 | 49 | |||||||||||||||||||
| 3.96 | 3,263 | 1.51 | .72 | 1.51 | .72 | 63 | ||||||||||||||||||||
| 12.96 | 48,647 | 1.42 | *** | .65 | *** | 1.21 | *** | .86 | *** | 23 | ||||||||||||||||
| 10.43 | 48,596 | 1.21 | (.16 | ) | 1.21 | (.16 | ) | 41 | ||||||||||||||||||
| 25.43 | 180,875 | 1.09 | .14 | 1.09 | .14 | 58 | ||||||||||||||||||||
| 2.59 | 149,515 | 1.12 | .72 | 1.12 | .72 | 73 | ||||||||||||||||||||
| (31.56 | ) | 158,112 | 1.06 | 1.00 | 1.06 | 1.00 | 49 | |||||||||||||||||||
| 4.45 | 302,683 | 1.01 | 1.15 | 1.01 | 1.15 | 63 | ||||||||||||||||||||
| (a) | Per share Net Investment Income (Loss) is calculated using the average daily shares method. |
| (b) | Distributions from Capital Gains include short-term capital gains, if any. |
| (c) | Total return is the combination of changes in net asset value without any sales charge, reinvested dividend income at net asset value and reinvested capital gains distributions at net asset value, if any. Total returns are not annualized. |
| (d) | After expense reimbursement from the Adviser, where applicable. |
| (e) | Effective January 18, 2011, Class R Shares and Class Y Shares previously offered by FAF Advisors Inc. were renamed Class R3 Shares and Class I Shares, respectively. |
| (f) | For the six months ended April 30, 2012. |
| * | Rounds to less than $.01 per share. |
| ** | Rounds to less than .01%. |
| *** | Annualized. |
See accompanying notes to financial statements.
| Nuveen Investments | 43 |
Notes to Financial Statements (Unaudited)
1. General Information and Significant Accounting Policies
General Information
Nuveen Investment Funds, Inc. (the “Trust”), is an open-end investment company registered under the Investment Company Act of 1940, as amended. The Trust is comprised of Nuveen Dividend Value Fund (“Dividend Value”) formerly known as Nuveen Equity Income Fund, Nuveen Large Cap Value Fund (“Large Cap Value”), Nuveen Mid Cap Value Fund (“Mid Cap Value”) and Nuveen Small Cap Value Fund (“Small Cap Value”) (each a “Fund” and collectively, the “Funds”), among others. The Trust was incorporated in the State of Maryland on August 20, 1987.
Dividend Value’s investment objective is long-term growth of capital and income. Under normal market conditions, the Fund invests at least 80% of net assets, plus the amount of any borrowings for investment purposes, in equity securities of companies Nuveen Asset Management, LLC (the “Sub-Adviser”), a wholly-owned subsidiary of Nuveen Fund Advisors, Inc. (the “Adviser”), a wholly-owned subsidiary of Nuveen Investments, Inc. (“Nuveen”), believes have the ability to pay above average dividends and finance expected growth have strong management and are trading at attractive valuations. The Fund also invests in convertible debt securities in pursuit of both long-term growth of capital and income.
Large Cap Value’s investment objective is capital appreciation, with current income as the Fund’s secondary objective. Under normal market conditions, the Fund invests at least 80% of net assets, plus the amount of any borrowings for investment purposes, in common stocks of large-capitalization companies, defined as companies that have market capitalizations of $5 billion or greater at the time of purchase.
Mid Cap Value’s investment objective is capital appreciation. Under normal market conditions, the Fund invests at least 80% of net assets, plus the amount of any borrowings for investment purposes, in common stocks of mid-capitalization companies, defined as companies that have market capitalizations at the time of purchase within the market capitalization range of the companies in the Russell MidCap ® Index immediately after its most recent reconstitution prior to such purchase. It is expected that reconstitution of the index will occur each year at the end of June. Immediately after the most recent reconstitution, the range was $520 million to $17.9 billion.
Small Cap Value’s investment objective is capital appreciation. Under normal market conditions, the Fund invests at least 80% of its net assets, plus the amount of any borrowings for investment purposes, in common stocks of small-capitalization companies, defined as companies that have market capitalizations of less than $3 billion at the time of purchase.
Each Fund may invest up to 15% of its total assets in non-dollar denominated equity securities of foreign issuers. Each Fund may invest up to 25% of its assets, collectively, in non-dollar denominated equity securities of non-U.S. issuers and in dollar denominated equity securities of non-U.S. issuers that are either listed on a U.S. stock exchange or represented by depositary receipts that may or may not be sponsored by a domestic bank. Up to 15% of the Fund’s total assets may be invested in equity securities of emerging market issuers. Each Fund may also invest in options, futures contracts, options on futures contracts and forward foreign currency exchanges contracts (“derivatives”) to manage market or business risk, enhance its return or hedge against adverse movements in currency exchange rates.
Each Fund’s most recent prospectus provides further descriptions of each Fund’s investment objective, principal investment strategies and principal risks.
Effective at the close of business on February 15, 2012, Class B Shares of Large Cap Value were converted to Class A Shares and are no longer available for dividend reinvestment or through an exchange from other Nuveen mutual funds.
Significant Accounting Policies
The following is a summary of significant accounting policies followed by the Funds in the preparation of their financial statements in accordance with accounting principles generally accepted in the United States (“U.S. GAAP”).
Investment Valuation
Common stocks and other equity-type securities are valued at the last sales price on the securities exchange on which such securities are primarily traded and are generally classified as Level 1 for fair value measurement purposes. Securities primarily traded on the NASDAQ National Market (“NASDAQ”) are valued, except as indicated below, at the NASDAQ Official Closing Price and are generally classified as Level 1. However, securities traded on a securities exchange or NASDAQ for which there were no transactions on a given day or securities not listed on a securities exchange or NASDAQ are valued at the quoted bid price and are generally classified as Level 2. Prices of certain American Depositary Receipts (“ADR”) held by the Funds that trade in the United States are valued based on the last traded price, official closing price, or the most recent bid price of the underlying non-U.S.-traded stock, adjusted as appropriate for the underlying-to-ADR conversion ratio and foreign exchange rate, and from time-to-time may also be adjusted further to take into account material events that may take place after the close of the local non-U.S. market but before the close of the New York Stock Exchange (“NYSE”). These securities generally represent a transfer from a Level 1 to a Level 2 security. Investments in investment companies are valued at their respective net asset values on the valuation date. These investment vehicles are generally classified as Level 1.
| 44 | Nuveen Investments |
Certain securities may not be able to be priced by the pre-established pricing methods as described above. Such securities may be valued by the Funds’ Board of Directors or its designee at fair value. These securities generally include, but are not limited to, restricted securities (securities which may not be publicly sold without registration under the Securities Act of 1933, as amended) for which a pricing service is unable to provide a market price; securities whose trading has been formally suspended; debt securities that have gone into default and for which there is no current market quotation; a security whose market price is not available from a pre-established pricing source; a security with respect to which an event has occurred that is likely to materially affect the value of the security after the market has closed but before the calculation of a Fund’s net asset value (as may be the case in non-U.S. markets on which the security is primarily traded) or make it difficult or impossible to obtain a reliable market quotation; and a security whose price, as provided by the pricing service, is not deemed to reflect the security’s fair value. As a general principle, the fair value of a security would appear to be the amount that the owner might reasonably expect to receive for it in a current sale. A variety of factors may be considered in determining the fair value of such securities, which may include consideration of the following: yields or prices of investments of comparable quality, type of issue, coupon, maturity and rating, market quotes or indications of value from security dealers, evaluations of anticipated cash flows or collateral, general market conditions and other information and analysis, including the obligor’s credit characteristics considered relevant. These securities are generally classified as Level 2 or Level 3 depending on the priority of the significant inputs. Regardless of the method employed to value a particular security, all valuations are subject to review by the Funds’ Board of Directors or its designee.
Refer to Footnote 2 – Fair Value Measurements for further details on the leveling of securities held by the Funds as of the end of the reporting period.
Investment Transactions
Investment transactions are recorded on a trade date basis. Realized gains and losses from investment transactions are determined on the specific identification method, which is the same basis used for federal income tax purposes.
Investment Income
Dividend income is recorded on the ex-dividend date or, for foreign securities, when information is available. Interest income is recorded on an accrual basis. Securities lending income is comprised of fees earned from borrowers and income earned on cash collateral investments, net of lending agent fees.
Income Taxes
Each Fund is a separate taxpayer for federal income tax purposes. Each Fund intends to distribute substantially all of its net investment income and net capital gains to shareholders and to otherwise comply with the requirements of Subchapter M of the Internal Revenue Code applicable to regulated investment companies (“RIC’s”). Therefore, no federal income tax provision is required.
For all open tax years and all major taxing jurisdictions, management of the Funds has concluded that there are no significant uncertain tax positions that would require recognition in the financial statements. Open tax years are those that are open for examination by taxing authorities (i.e., generally the last four tax year ends and the interim tax period since then). Furthermore, management of the Funds is also not aware of any tax positions for which it is reasonably possible that the total amounts of unrecognized tax benefits will significantly change in the next twelve months.
Dividends and Distributions to Shareholders
Dividends from net investment income are declared and distributed to shareholders at least annually for each Fund with the exception of Dividend Value, which declares and distributes dividends from net investment income to shareholders quarterly. Dividends from net realized capital gains from investment transactions, if any, are declared and distributed to shareholders at least annually. Furthermore, capital gains are distributed only to the extent they exceed available capital loss carryforwards.
Distributions to shareholders are recorded on the ex-dividend date. The amount and timing of distributions are determined in accordance with federal income tax regulations, which may differ from U.S. GAAP.
Small Cap Value receives substantial distributions from holdings in Real Estate Investment Trusts (“REITs”). Distributions from REITs may be characterized as ordinary income, net capital gain, or a return of capital to the REIT shareholder. The proper characterization of REIT distributions is generally not known until after the end of each calendar year. As such, Small Cap Value must use estimates in reporting the character of their income and distributions for financial reporting purposes. The actual character of distributions to Fund shareholders will be reflected on the Form 1099 received by shareholders after the end of the calendar year. Due to the nature of REIT investments, a portion of the distributions received by the Fund shareholder may represent a return of capital.
Flexible Sales Charge Program
Class A Shares are generally sold with an up-front sales charge and incur a .25% annual 12b-1 service fee. Class A Share purchases of $1 million or more are sold at net asset value without an up-front sales charge but may be subject to a contingent deferred sales charge (“CDSC”) if redeemed within twelve months of purchase. Class B Shares were sold without an up-front sales charge but incur a .75% annual 12b-1 distribution fee and a .25% annual 12b-1 service fee. Class B Shares are subject to a CDSC of up to 5% depending upon the length of time the shares are held by the investor (CDSC is reduced to 0% at the end of six years). Class B Shares automatically convert to Class A Shares eight years after purchase. Class C Shares are sold without an up-front sales charge but incur a
| Nuveen Investments | 45 |
Notes to Financial Statements (Unaudited) (continued)
..75% annual 12b-1 distribution fee and a .25% annual 12b-1 service fee. Class C Shares are subject to a CDSC of 1% if redeemed within twelve months of purchase. Class R3 Shares are sold without an up-front sales charge but incur a .25% annual 12b-1 distribution and a .25% annual service fee. Class I Shares are not subject to any sales charge or 12b-1 distribution or service fees.
Derivative Financial Instruments
Each Fund is authorized to invest in certain derivative instruments, including foreign currency exchange contracts, futures, options and swap contracts. Although the Funds are authorized to invest in such financial instruments, and may do so in the future, they did not make any such investments during the six months ended April 30, 2012.
Market and Counterparty Credit Risk
In the normal course of business each Fund may invest in financial instruments and enter into financial transactions where risk of potential loss exists due to changes in the market (market risk) or failure of the other party to the transaction to perform (counterparty credit risk). The potential loss could exceed the value of the financial assets recorded on the financial statements. Financial assets, which potentially expose each Fund to counterparty credit risk, consist principally of cash due from counterparties on forward, option and swap transactions, when applicable. The extent of each Fund’s exposure to counterparty credit risk in respect to these financial assets approximates their carrying value as recorded on the Statement of Assets and Liabilities. Futures contracts, when applicable, expose a Fund to minimal counterparty credit risk as they are exchange traded and the exchange’s clearinghouse, which is counterparty to all exchange traded futures, guarantees the futures contracts against default.
Each Fund helps manage counterparty credit risk by entering into agreements only with counterparties the Adviser believes have the financial resources to honor their obligations and by having the Adviser monitor the financial stability of the counterparties. Additionally, counterparties may be required to pledge collateral daily (based on the daily valuation of the financial asset) on behalf of each Fund with a value approximately equal to the amount of any unrealized gain above a pre-determined threshold. Reciprocally, when each Fund has an unrealized loss, the Funds have instructed the custodian to pledge assets of the Funds as collateral with a value approximately equal to the amount of the unrealized loss above a pre-determined threshold. Collateral pledges are monitored and subsequently adjusted if and when the valuations fluctuate, either up or down, by at least the pre-determined threshold amount.
Multiclass Operations and Allocations
Income and expenses of the Funds that are not directly attributable to a specific class of shares are prorated among the classes based on the relative net assets of each class. Expenses directly attributable to a class of shares, which presently only include 12b-1 distribution fees and shareholder service fees, are recorded to the specific class.
Realized and unrealized capital gains and losses of the Funds are prorated among the classes based on the relative net assets of each class.
Securities Lending
In order to generate additional income, each Fund may lend securities representing up to one-third of the value of its total assets (which includes collateral for securities on loan) to broker-dealers, banks, or other institutions. Each Fund’s policy is to receive cash collateral equal to at least 102% of the value of securities loaned, which is recognized as “Collateral from securities lending program” on the Statement of Assets and Liabilities. The adequacy of the collateral is monitored on a daily basis. If the value of the securities on loan increases, such that the level of collateralization falls below 102%, additional collateral is received from the borrower, which is recognized as “Due from broker” on the Statement of Assets and Liabilities, when applicable. As with other extensions of credit, there may be risks of delay in recovery of the securities or even loss of rights in the collateral should the borrower of the security fail financially.
The Funds’ custodian serves as the securities lending agent for the Funds in transactions involving the lending of portfolio securities on behalf of the Funds. Each Fund pays the custodian a fee based on the Fund’s proportional share of the custodian’s expense of operating its securities lending program. Collateral for securities on loan is invested in a money market fund, which is recognized as “Investments purchased with collateral from securities lending” on the Statement of Assets and Liabilities.
Income from securities lending, net of fees paid, is recognized on the Statement of Operations as “Securities lending income.” Securities lending fees paid by each Fund during the six months ended April 30, 2012, were as follows:
| Dividend Value |
Large Cap Value |
Mid Cap Value |
Small Cap Value |
|||||||||||||
| Securities lending fees paid |
$ | 22,398 | $ | 4,575 | $ | 6,922 | $ | 5,867 | ||||||||
Indemnifications
Under the Trust’s organizational documents, its officers and directors are indemnified against certain liabilities arising out of the performance of their duties to the Trust. In addition, in the normal course of business, the Trust enters into contracts that provide general indemnifications to other parties. The Trust’s maximum exposure under these arrangements is unknown as this would involve future claims that may be made against the Trust that have not yet occurred. However, the Trust has not had prior claims or losses pursuant to these contracts and expects the risk of loss to be remote.
| 46 | Nuveen Investments |
Use of Estimates
The preparation of financial statements in conformity with U.S. GAAP requires management to make estimates and assumptions that affect the reported amounts of assets and liabilities at the date of the financial statements and the reported amounts of increases and decreases in net assets from operations during the reporting period. Actual results may differ from those estimates.
2. Fair Value Measurements
Fair value is defined as the price that the Funds would receive upon selling an investment or transferring a liability in an orderly transaction to an independent buyer in the principal or most advantageous market for the investment. A three-tier hierarchy is used to maximize the use of observable market data and minimize the use of unobservable inputs and to establish classification of fair value measurements for disclosure purposes. Observable inputs reflect the assumptions market participants would use in pricing the asset or liability. Observable inputs are based on market data obtained from sources independent of the reporting entity. Unobservable inputs reflect the reporting entity’s own assumptions about the assumptions market participants would use in pricing the asset or liability. Unobservable inputs are based on the best information available in the circumstances. The three-tier hierarchy of inputs is summarized in the three broad levels listed below:
| Level 1 – | Quoted prices in active markets for identical securities. | |
| Level 2 – | Other significant observable inputs, (including quoted prices for similar securities, interest rates, prepayment speeds, credit risk, etc.). | |
| Level 3 – | Significant unobservable inputs (including management’s assumptions in determining the fair value of investments). |
The inputs or methodologies used for valuing securities are not an indication of the risk associated with investing in those securities. The following is a summary of each Fund’s fair value measurements as of April 30, 2012:
| Dividend Value | Level 1 | Level 2 | Level 3 | Total | ||||||||||||
| Long-Term Investments: |
||||||||||||||||
| Common Stocks |
$ | 1,213,310,211 | $ | — | $ | — | $ | 1,213,310,211 | ||||||||
| Investments Purchased with Collateral from Securities Lending |
156,050,266 | — | — | 156,050,266 | ||||||||||||
| Short-Term Investments: |
— | |||||||||||||||
| Money Market Funds |
5,474,249 | — | — | 5,474,249 | ||||||||||||
| Total |
$ | 1,374,834,726 | $ | — | $ | — | $ | 1,374,834,726 | ||||||||
| Large Cap Value | Level 1 | Level 2 | Level 3 | Total | ||||||||||||
| Long-Term Investments: |
||||||||||||||||
| Common Stocks |
$ | 151,622,392 | $ | — | $ | — | $ | 151,622,392 | ||||||||
| Investments Purchased with Collateral from Securities Lending |
33,810,534 | — | — | 33,810,534 | ||||||||||||
| Short-Term Investments: |
||||||||||||||||
| Money Market Funds |
873,511 | — | — | 873,511 | ||||||||||||
| Total |
$ | 186,306,437 | $ | — | $ | — | $ | 186,306,437 | ||||||||
| Mid Cap Value | Level 1 | Level 2 | Level 3 | Total | ||||||||||||
| Long-Term Investments: |
||||||||||||||||
| Common Stocks |
$ | 200,753,294 | $ | — | $ | — | $ | 200,753,294 | ||||||||
| Investments Purchased with Collateral from Securities Lending |
59,694,980 | — | — | 59,694,980 | ||||||||||||
| Short-Term Investments: |
||||||||||||||||
| Money Market Funds |
111,055 | — | — | 111,055 | ||||||||||||
| Total |
$ | 260,559,329 | $ | — | $ | — | $ | 260,559,329 | ||||||||
| Small Cap Value | Level 1 | Level 2 | Level 3 | Total | ||||||||||||
| Long-Term Investments: |
||||||||||||||||
| Common Stocks |
$ | 86,313,728 | $ | — | $ | — | $ | 86,313,728 | ||||||||
| Investments Purchased with Collateral from Securities Lending |
42,370,035 | — | — | 42,370,035 | ||||||||||||
| Short-Term Investments: |
||||||||||||||||
| Money Market Funds |
627,525 | — | — | 627,525 | ||||||||||||
| Total |
$ | 129,311,288 | $ | — | $ | — | $ | 129,311,288 | ||||||||
During the six months ended April 30, 2012, the Funds recognized no significant transfers to or from Level 1, Level 2 or Level 3.
3. Derivative Instruments and Hedging Activities
The Funds record derivative instruments at fair value, with changes in fair value recognized on the Statement of Operations, when applicable. Even though the Funds’ investments in derivatives may represent economic hedges, they are not considered to be hedge transactions for financial reporting purposes. The Funds did not invest in derivative instruments during the six months ended April 30, 2012.
| Nuveen Investments | 47 |
Notes to Financial Statements (Unaudited) (continued)
4. Fund Shares
Transactions in Fund shares were as follows:
| Dividend Value | ||||||||||||||||
| Six Months Ended 4/30/12 |
Year Ended 10/31/11 |
|||||||||||||||
| Shares | Amount | Shares | Amount | |||||||||||||
| Shares sold: |
||||||||||||||||
| Class A |
2,783,368 | $ | 38,475,112 | 6,608,005 | $ | 87,417,806 | ||||||||||
| Class B |
3,096 | 41,018 | 3,490 | 47,078 | ||||||||||||
| Class C |
369,614 | 5,000,249 | 709,239 | 9,350,202 | ||||||||||||
| Class R3(1) |
343,180 | 4,756,093 | 1,001,768 | 12,618,814 | ||||||||||||
| Class I(1) |
8,910,983 | 122,498,221 | 25,218,507 | 331,972,894 | ||||||||||||
| Shares issued to shareholders due to reinvestment of distributions: |
|
|||||||||||||||
| Class A |
159,456 | 2,194,735 | 232,425 | 3,044,340 | ||||||||||||
| Class B |
1,622 | 21,911 | 2,171 | 28,844 | ||||||||||||
| Class C |
11,985 | 162,795 | 10,006 | 131,048 | ||||||||||||
| Class R3(1) |
11,512 | 158,565 | 5,904 | 74,585 | ||||||||||||
| Class I(1) |
316,149 | 4,394,314 | 466,773 | 6,205,947 | ||||||||||||
| 12,910,965 | 177,703,013 | 34,258,288 | 450,891,558 | |||||||||||||
| Shares redeemed: |
||||||||||||||||
| Class A |
(2,026,205 | ) | (28,304,599 | ) | (3,368,560 | ) | (44,368,177 | ) | ||||||||
| Class B |
(96,250 | ) | (1,327,724 | ) | (183,928 | ) | (2,428,779 | ) | ||||||||
| Class C |
(127,523 | ) | (1,727,181 | ) | (176,678 | ) | (2,327,271 | ) | ||||||||
| Class R3(1) |
(88,432 | ) | (1,204,395 | ) | (176,764 | ) | (2,358,157 | ) | ||||||||
| Class I(1) |
(8,889,150 | ) | (123,360,696 | ) | (14,801,249 | ) | (197,668,105 | ) | ||||||||
| (11,227,560 | ) | (155,924,595 | ) | (18,707,179 | ) | (249,150,489 | ) | |||||||||
| Net increase (decrease) |
1,683,405 | $ | 21,778,418 | 15,551,109 | $ | 201,741,069 | ||||||||||
| Large Cap Value | ||||||||||||||||
| Six Months Ended 4/30/12 |
Year Ended 10/31/11 |
|||||||||||||||
| Shares | Amount | Shares | Amount | |||||||||||||
| Shares sold: |
||||||||||||||||
| Class A |
93,447 | $ | 1,440,101 | 129,555 | $ | 1,983,849 | ||||||||||
| Class B |
— | — | 434 | 6,096 | ||||||||||||
| Class C |
12,835 | 197,332 | 6,312 | 96,550 | ||||||||||||
| Class R3(1) |
4,145 | 61,864 | 18,521 | 282,596 | ||||||||||||
| Class I(1) |
318,955 | 4,689,619 | 408,149 | 6,070,951 | ||||||||||||
| Shares issued to shareholders due to reinvestment of distributions: |
|
|||||||||||||||
| Class A |
12,126 | 178,131 | 42,189 | 643,379 | ||||||||||||
| Class B |
— | — | 387 | 5,704 | ||||||||||||
| Class C |
— | — | 342 | 5,125 | ||||||||||||
| Class R3(1) |
83 | 1,206 | 591 | 8,973 | ||||||||||||
| Class I(1) |
23,299 | 343,659 | 73,525 | 1,125,666 | ||||||||||||
| 464,890 | 6,911,912 | 680,005 | 10,228,889 | |||||||||||||
| Shares redeemed: |
||||||||||||||||
| Class A |
(296,735 | ) | (4,486,247 | ) | (607,199 | ) | (9,237,406 | ) | ||||||||
| Class B |
(65,477 | ) | (977,960 | ) | (32,714 | ) | (482,834 | ) | ||||||||
| Class C |
(12,907 | ) | (190,804 | ) | (24,700 | ) | (370,567 | ) | ||||||||
| Class R3(1) |
(27,717 | ) | (425,673 | ) | (21,216 | ) | (322,006 | ) | ||||||||
| Class I(1) |
(1,359,148 | ) | (20,645,354 | ) | (4,021,522 | ) | (64,483,509 | ) | ||||||||
| Class I(1)-In-kind |
— | — | (9,125,519 | ) | (132,685,046 | ) | ||||||||||
| (1,761,984 | ) | (26,726,038 | ) | (13,832,870 | ) | (207,581,368 | ) | |||||||||
| Net increase (decrease) |
(1,297,094 | ) | $ | (19,814,126 | ) | (13,152,865 | ) | $ | (197,352,479 | ) | ||||||
| (1) | Effective January 18, 2011, Class R Shares and Class Y Shares previously offered by FAF Advisors, Inc. were renamed Class R3 Shares and Class I Shares, respectively. |
| 48 | Nuveen Investments |
| Mid Cap Value | ||||||||||||||||
| Six Months Ended 4/30/12 |
Year Ended 10/31/11 |
|||||||||||||||
| Shares | Amount | Shares | Amount | |||||||||||||
| Shares sold: |
||||||||||||||||
| Class A |
119,321 | $ | 2,686,954 | 540,631 | $ | 12,712,823 | ||||||||||
| Class B |
— | — | 309 | 6,599 | ||||||||||||
| Class C |
7,226 | 161,540 | 20,707 | 482,019 | ||||||||||||
| Class R3(1) |
84,074 | 1,901,929 | 238,587 | 5,504,530 | ||||||||||||
| Class I(1) |
511,169 | 11,469,951 | 864,453 | 20,278,498 | ||||||||||||
| Shares issued to shareholders due to reinvestment of distributions: |
||||||||||||||||
| Class A |
11,313 | 248,544 | 32,132 | 764,424 | ||||||||||||
| Class B |
— | — | 406 | 9,131 | ||||||||||||
| Class C |
— | — | 1,838 | 42,309 | ||||||||||||
| Class R3(1) |
2,157 | 47,196 | 5,967 | 141,365 | ||||||||||||
| Class I(1) |
23,627 | 521,450 | 47,049 | 1,124,926 | ||||||||||||
| 758,887 | 17,037,564 | 1,752,079 | 41,066,624 | |||||||||||||
| Shares redeemed: |
||||||||||||||||
| Class A |
(761,153 | ) | (16,968,927 | ) | (1,628,870 | ) | (37,492,081 | ) | ||||||||
| Class B |
(19,917 | ) | (435,589 | ) | (34,585 | ) | (774,881 | ) | ||||||||
| Class C |
(41,837 | ) | (918,900 | ) | (137,168 | ) | (3,110,928 | ) | ||||||||
| Class R3(1) |
(271,488 | ) | (6,192,305 | ) | (454,863 | ) | (10,396,502 | ) | ||||||||
| Class I(1) |
(1,676,105 | ) | (38,108,069 | ) | (3,913,945 | ) | (94,065,258 | ) | ||||||||
| Class I(1) -In-Kind |
— | — | (11,137,781 | ) | (261,914,439 | ) | ||||||||||
| (2,770,500 | ) | (62,623,790 | ) | (17,307,212 | ) | (407,754,089 | ) | |||||||||
| Net increase (decrease) |
(2,011,613 | ) | $ | (45,586,226 | ) | (15,555,133 | ) | $ | (366,687,465 | ) | ||||||
| Small Cap Value | ||||||||||||||||
| Six Months Ended 4/30/12 |
Year Ended 10/31/11 |
|||||||||||||||
| Shares | Amount | Shares | Amount | |||||||||||||
| Shares sold: |
||||||||||||||||
| Class A |
132,819 | $ | 1,593,036 | 410,931 | $ | 4,808,143 | ||||||||||
| Class C |
12,892 | 139,481 | 25,221 | 264,358 | ||||||||||||
| Class R3(1) |
27,627 | 330,080 | 60,254 | 689,608 | ||||||||||||
| Class I(1) |
807,824 | 10,062,376 | 1,124,872 | 13,450,313 | ||||||||||||
| Shares issued to shareholders due to reinvestment of distributions: |
||||||||||||||||
| Class A |
— | — | — | — | ||||||||||||
| Class C |
— | — | — | — | ||||||||||||
| Class R3(1) |
— | — | — | — | ||||||||||||
| Class I(1) |
— | — | — | — | ||||||||||||
| 981,162 | 12,124,973 | 1,621,278 | 19,212,422 | |||||||||||||
| Shares redeemed: |
||||||||||||||||
| Class A |
(283,462 | ) | (3,430,357 | ) | (747,673 | ) | (8,799,625 | ) | ||||||||
| Class C |
(17,525 | ) | (183,983 | ) | (77,338 | ) | (778,138 | ) | ||||||||
| Class R3(1) |
(30,588 | ) | (375,412 | ) | (66,911 | ) | (777,156 | ) | ||||||||
| Class I(1) |
(1,282,690 | ) | (16,232,429 | ) | (2,666,164 | ) | (33,926,233 | ) | ||||||||
| Class I(1)-In-Kind |
— | — | (11,425,320 | ) | (127,930,138 | ) | ||||||||||
| (1,614,265 | ) | (20,222,181 | ) | (14,983,406 | ) | (172,211,290 | ) | |||||||||
| Net increase (decrease) |
(633,103 | ) | $ | (8,097,208) | (13,362,128 | ) | $ | (152,998,868 | ) | |||||||
| (1) | Effective January 18, 2011, Class R Shares and Class Y Shares previously offered by FAF Advisors, Inc. were renamed Class R3 Shares and Class I Shares, respectively. |
| Nuveen Investments | 49 |
Notes to Financial Statements (Unaudited) (continued)
Class B Shares that converted to Class A Shares (recognized as a component of Class A Shares sold and Class B Shares redeemed) during the six months ended April 30, 2012, and fiscal year ended October 31, 2011, were as follows:
| Fund | Six Months Ended 4/30/12 |
Year Ended 10/31/11 |
||||||
| Dividend Value |
89,478 | 111,573 | ||||||
| Large Cap Value |
6,077 | 23,298 | ||||||
| Mid Cap Value |
11,224 | 18,251 | ||||||
5. Investment Transactions
Purchases and sales (including maturities but excluding investments purchased with collateral from securities lending and short-term investments, where applicable) during the six months ended April 30, 2012, were as follows:
| Dividend Value |
Large Cap Value |
Mid Cap Value |
Small Cap Value |
|||||||||||||
| Purchases |
$ | 147,342,690 | $ | 71,438,028 | $ | 166,988,372 | $ | 19,521,703 | ||||||||
| Sales and maturities |
119,558,529 | 90,359,545 | 214,031,922 | 25,439,417 | ||||||||||||
6. Income Tax Information
The following information is presented on an income tax basis. Differences between amounts for financial statement and federal income tax purposes are primarily due to timing differences in recognizing certain gains and losses on investment transactions. To the extent that differences arise that are permanent in nature, such amounts are reclassified within the capital accounts as detailed below. Temporary differences do not require reclassification. Temporary and permanent differences do not impact the net asset values of the Funds.
At April 30, 2012, the cost and unrealized appreciation (depreciation) of investments, as determined on a federal income tax basis, were as follows:
| Dividend Value |
Large Cap Value |
Mid Cap Value |
Small Cap Value |
|||||||||||||
| Cost of investments |
$ | 1,052,045,057 | $ | 176,594,259 | $ | 247,954,373 | $ | 118,981,163 | ||||||||
| Gross unrealized: |
||||||||||||||||
| Appreciation |
$ | 329,112,181 | $ | 14,396,573 | $ | 15,938,178 | $ | 14,297,660 | ||||||||
| Depreciation |
(6,322,512 | ) | (4,684,395 | ) | (3,333,222 | ) | (3,967,535 | ) | ||||||||
| Net unrealized appreciation (depreciation) of investments |
$ | 322,789,669 | $ | 9,712,178 | $ | 12,604,956 | $ | 10,330,125 | ||||||||
Permanent differences, primarily due to the redemption-in-kind, net operating losses, tax equalization, REIT adjustments, and investments in partnerships, resulted in reclassifications among the Funds’ components of net assets at October 31, 2011, the Funds’ last tax year end, as follows:
| Dividend Value |
Large Cap Value |
Mid Cap Value |
Small Cap Value |
|||||||||||||
| Capital paid-in |
$ | 346,283 | $ | 15,381,988 | $ | 50,922,036 | $ | 27,173,948 | ||||||||
| Undistributed (Over-distribution) of net investment income |
(1,263,505 | ) | (43,799 | ) | (153,738 | ) | 290,800 | |||||||||
| Accumulated net realized gain (loss) |
917,222 | 15,338,189 | (50,768,298 | ) | (27,464,748 | ) | ||||||||||
The tax components of undistributed net ordinary income and net long-term capital gains at October 31, 2011, the Funds’ last tax year end, were as follows:
| Dividend Value |
Large Cap Value |
Mid Cap Value |
Small Cap Value |
|||||||||||||
| Undistributed net ordinary income* |
$ | 2,008,681 | $ | 880,660 | $ | 1,514,285 | $ | — | ||||||||
| Undistributed net long-term capital gains |
— | — | — | — | ||||||||||||
| * | Net ordinary income consists of net taxable income derived from dividends, interest and net short-term capital gains, if any. |
The tax character of distributions paid during the Funds’ last tax year ended October 31, 2011, was designated for purposes of the dividends paid deduction as follows:
| Dividend Value |
Large Cap Value |
Mid Cap Value |
Small Cap Value |
|||||||||||||
| Distributions from net ordinary income* |
$ | 23,121,220 | $ | 3,092,004 | $ | 3,983,550 | $ | — | ||||||||
| Distributions from net long-term capital gains |
— | — | — | — | ||||||||||||
| * | Net ordinary income consists of net taxable income derived from dividends, interest, net short-term capital gains and current year earnings and profits attributable to realized gains, if any. |
| 50 | Nuveen Investments |
At October 31, 2011, the Funds’ last tax year end, the Funds had unused capital loss carryforwards available for federal income tax purposes to be applied against future capital gains, if any. If not applied, the carryforwards will expire as follows:
| Dividend Value |
Large Cap Value |
Mid Cap Value |
Small Cap Value |
|||||||||||||
| Expiration: |
||||||||||||||||
| October 31, 2016 |
$ | — | $ | 9,777,738 | $ | — | $ | 3,444,834 | ||||||||
| October 31, 2017 |
1,440,955 | 80,887,118 | 64,990,706 | 37,113,109 | ||||||||||||
| Total |
$ | 1,440,955 | $ | 90,664,856 | $ | 64,990,706 | $ | 40,557,853 | ||||||||
During the Funds’ last tax year ended October 31, 2011, the Funds utilized their capital loss carryforwards as follows:
| Dividend Value |
Large Cap Value |
Mid Cap Value |
Small Cap Value |
|||||||||||||
| Utilized capital loss carryforwards |
$ | 6,857,017 | $ | 19,152,964 | $ | 42,620,369 | $ | 10,362,493 | ||||||||
7. Management Fees and Other Transactions with Affiliates
Each Fund’s management fee consists of two components – a fund-level fee, based only on the amount of assets within each individual Fund, and a complex-level fee, based on the aggregate amount of all eligible fund assets managed by the Adviser. This pricing structure enables each Fund’s shareholders to benefit from growth in the assets within their respective Fund as well as from growth in the amount of complex-wide assets managed by the Adviser.
The annual fund-level fee for each Fund, payable monthly, is calculated according to the following schedule:
| Average Daily Net Assets | Dividend Fund-Level |
Large Fund-Level |
Mid Cap Fund-Level |
Small Fund-Level |
||||||||||||
| For the first $125 million |
.6000 | % | .5500 | % | .7000 | % | .7000 | % | ||||||||
| For the next $125 million |
.5875 | .5375 | .6875 | .6875 | ||||||||||||
| For the next $250 million |
.5750 | .5250 | .6750 | .6750 | ||||||||||||
| For the next $500 million |
.5625 | .5125 | .6625 | .6625 | ||||||||||||
| For the next $1 billion |
.5500 | .5000 | .6500 | .6500 | ||||||||||||
| For net assets over $2 billion |
.5250 | .4750 | .6250 | .6250 | ||||||||||||
The annual complex-level fee for each Fund, payable monthly, is determined by taking the complex-level free rate, which is based on the aggregate amount of “eligible assets” of all Nuveen funds as set forth in the schedule below, and making, as appropriate, an upward adjustment to that rate based upon the percentage of the particular fund’s assets that are not “eligible assets”. The complex-level fee schedule for each Fund is as follows:
| Complex-Level Asset Breakpoint Level* | Effective Rate at Breakpoint Level | |||
| $55 billion |
.2000 | % | ||
| $56 billion |
.1996 | |||
| $57 billion |
.1989 | |||
| $60 billion |
.1961 | |||
| $63 billion |
.1931 | |||
| $66 billion |
.1900 | |||
| $71 billion |
.1851 | |||
| $76 billion |
.1806 | |||
| $80 billion |
.1773 | |||
| $91 billion |
.1691 | |||
| $125 billion |
.1599 | |||
| $200 billion |
.1505 | |||
| $250 billion |
.1469 | |||
| $300 billion |
.1445 | |||
| * | The complex-level fee is calculated based upon the aggregate daily “eligible assets” of all Nuveen Funds. Eligible assets do not include assets attributable to investments in other Nuveen Funds or assets in excess of $2 billion added to the Nuveen Fund complex in connection with the Adviser’s assumption of the management of the former First American Funds effective January 1, 2011. Eligible assets include closed-end fund assets managed by the Adviser that are attributable to financial leverage. For these purposes, financial leverage includes the closed-end funds’ use of preferred stock and borrowings and investments in the residual interest certificates (also called inverse floating rate securities) in tender option bond (TOB) trusts, including the portion of assets held by a TOB trust that has been effectively financed by the trust’s issuance of floating rate securities, subject to an agreement by the Adviser as to certain funds to limit the amount of such assets for determining eligible assets in certain circumstances. As of April 30, 2012, the complex-level fee rate for each of these Funds was as follows: |
| Fund | Complex-Level Fee Rate | |||
| Dividend Value |
.1922 | % | ||
| Large Cap Value |
.1998 | |||
| Mid Cap Value |
.1998 | |||
| Small Cap Value |
.1998 | |||
| Nuveen Investments | 51 |
Notes to Financial Statements (Unaudited) (continued)
The management fee compensates the Adviser for overall investment advisory and administrative services and general office facilities. The Adviser is responsible for each Fund’s overall strategy and asset allocation decisions. The Adviser has entered into sub-advisory agreements with the Sub-Adviser, under which the Sub-Adviser manages the investment portfolios of the Funds. The Sub-Adviser is compensated for its services to the Funds from the management fees paid to the Adviser.
The Adviser has agreed to waive fees and/or reimburse expenses of Mid Cap Value and Small Cap Value so that total annual Fund operating expenses, after fee waivers and/or expense reimbursements and excluding acquired Fund fees and expenses, do not exceed the percentages of the average daily net assets of any class of Fund shares in the amounts and for the time periods stated in the following table:
| Mid Cap Value |
Small Cap Value |
|||||||
| Class A Shares |
1.34 | % | 1.50 | % | ||||
| Class B Shares |
2.09 | N/A | ||||||
| Class C Shares |
2.09 | 2.25 | ||||||
| Class R3 Shares |
1.59 | 1.75 | ||||||
| Class I Shares |
1.09 | 1.25 | ||||||
| Expiration Date |
February 28, 2013 | February 28, 2013 | ||||||
| N/A | Small Cap Value does not offer Class B Shares. |
The Adviser has agreed to reimburse management fees across all share classes of Dividend Value and Large Cap Value through December 31, 2012, to the extent necessary to maintain Class I Share total annual operating expenses, not including any acquired fund fees and expenses, at the applicable percentage of daily net assets listed in the Maximum Expense Level row of the following table, provided that in no event will the Adviser be required to make any reimbursements that would result in an annualized net management fee of less than the applicable percentage of daily net assets listed in the Minimum Management Fee row of the following table.
| Dividend Value |
Large Cap Value |
|||||||
| Maximum Expense Level |
.95 | % | .78 | % | ||||
| Minimum Management Fee |
1.06 | .74 | ||||||
The Adviser may also voluntarily reimburse expenses from time to time in any of the Funds. Voluntary reimbursements may be terminated at any time at the Adviser’s discretion.
The Trust pays no compensation directly to those of its directors who are affiliated with the Adviser or to its officers, all of whom receive remuneration for their services to the Trust from the Adviser or its affiliates. The Board of Directors has adopted a deferred compensation plan for independent directors that enable directors to elect to defer receipt of all or a portion of the annual compensation they are entitled to receive from certain Nuveen-advised funds. Under the plan, deferred amounts are treated as though equal dollar amounts had been invested in shares of select Nuveen-advised funds.
During the six months ended April 30, 2012, Nuveen Securities, LLC (the “Distributor”), a wholly-owned subsidiary of Nuveen, collected sales charges on purchases of Class A Shares, the majority of which were paid out as concessions to financial intermediaries as follows:
| Dividend Value |
Large Cap Value |
Mid Cap Value |
Small Cap Value |
|||||||||||||
| Sales charges collected |
$ | 180,806 | $ | 9,033 | $ | 9,286 | $ | 7,736 | ||||||||
| Paid to financial intermediaries |
157,961 | 7,875 | 8,253 | 6,735 | ||||||||||||
The Distributor also received 12b-1 service fees in Class A Shares, substantially all of which were paid to compensate financial intermediaries for providing services to shareholders relating to their investments.
During the six months ended April 30, 2012, the Distributor compensated financial intermediaries directly with commission advances at the time of purchase as follows:
| Dividend Value |
Large Cap Value |
Mid Cap Value |
Small Cap Value |
|||||||||||||
| Commission advances |
$ | 51,647 | $ | 839 | $ | 1,400 | $ | 806 | ||||||||
To compensate for commissions advanced to financial intermediaries, all 12b-1 service and distribution fees collected on Class B Shares and C Shares during the first year following a purchase were retained by the Distributor. During the six months ended April 30, 2012, the Distributor retained such 12b-1 fees as follows:
| Dividend Value |
Large Cap Value |
Mid Cap Value |
Small Cap Value |
|||||||||||||
| 12b-1 fees retained |
$ | 37,396 | $ | 2,367 | $ | 8,729 | $ | 748 | ||||||||
| 52 | Nuveen Investments |
The remaining 12b-1 fees charged to the Funds were paid to compensate financial intermediaries for providing services to shareholders relating to their investments.
The Distributor also collected and retained CDSC on share redemptions during the six months ended April 30, 2012, as follows:
| Dividend Value |
Large Cap Value |
Mid Cap Value |
Small Cap Value |
|||||||||||||
| CDSC retained |
$ | 4,432 | $ | 171 | $ | 890 | $ | 93 | ||||||||
8. New Accounting Pronouncements
Fair Value Measurements and Disclosures
On May 12, 2011, the Financial Accounting Standards Board (“FASB”) issued Accounting Standards Update (“ASU”) No. 2011-04 (“ASU No. 2011-04”) modifying Topic 820, Fair Value Measurements and Disclosures. At the same time, the International Accounting Standards Board (“IASB”) issued International Financial Reporting Standard (“IFRS”) 13, Fair Value Measurement. The objective of the FASB and IASB is convergence of their guidance on fair value measurements and disclosures. Specifically, ASU No. 2011-04 requires reporting entities to disclose i) the amounts of any transfers between Level 1 and Level 2 and the reasons for the transfers and ii) for Level 3 fair value measurements, a) quantitative information about significant unobservable inputs used, b) a description of the valuation processes used by the reporting entity and c) a narrative description of the sensitivity of the fair value measurement to changes in unobservable inputs if a change in those inputs might result in a significantly higher or lower fair value measurement. The effective date of ASU No. 2011-04 is for interim and annual periods beginning after December 15, 2011. At this time, management is evaluating the implications of this guidance and the impact it will have to the financial statement amounts and footnote disclosures, if any.
9. Subsequent Events
Fund Reorganizations
The Board of Directors has approved the reorganization of Large Cap Value (the “Acquired Fund”) into Dividend Value (the “Acquiring Fund”). In order for the reorganization to occur, it must be approved by the shareholders of the Acquired Fund. A special meeting of the Acquired Fund’s shareholders for the purpose of voting on the reorganization is expected to be held in early October 2012. For the reorganizations, upon shareholder approval, the Acquired Fund will transfer all of its assets and liabilities to the Acquiring Fund in exchange for Acquiring Fund shares of equal value. These Acquiring Fund shares will then be distributed to the shareholders of the Acquired Fund and the Acquired Fund will be terminated. As a result of the reorganization, shareholders of the Acquired Fund will become shareholders of the Acquiring Fund. The shareholders of the Acquired Fund will receive Acquiring Fund shares with a total value equal to the total value of their Acquired Fund shares immediately prior to the closing of the reorganization. A special meeting of the Acquired Fund’s shareholders for the purpose of voting on the reorganization is expected to be held in early October 2012. If the required shareholder approvals are obtained on the meeting date, it is anticipated that the reorganization will be consummated shortly after its special shareholder meeting. Further information regarding the proposed reorganization of Large Cap Value will be contained in proxy materials that are expected to be sent to Large Cap Value’s shareholders in late August 2012.
| Nuveen Investments | 53 |
Glossary of Terms Used in this Report
Average Annual Total Return: This is a commonly used method to express an investment’s performance over a particular, usually multi-year time period. It expresses the return that would have been necessary each year to equal the investment’s actual cumulative performance (including change in NAV or offer price and reinvested distributions and capital gains, if any) over the time period being considered.
Lipper Equity Income Funds Classification Average: Represents the average annualized total return for all reporting funds in the Lipper Equity Income Funds Classification. Lipper returns account for the effects of management fees and assume reinvestment of distributions but do not reflect any applicable sales charges.
Lipper Large-Cap Value Funds Classification Average: Represents the average annualized total return for all reporting funds in the Lipper Large-Cap Value Funds Classification. Lipper returns account for the effects of management fees and assume reinvestment of distributions but do not reflect any applicable sales charges.
Lipper Mid-Cap Value Funds Classification Average: Represents the average annualized total return for all reporting funds in the Lipper Mid-Cap Value Funds Classification. Lipper returns account for the effects of management fees and assume reinvestment of distributions but do not reflect any applicable sales charges.
Lipper Small-Cap Value Funds Classification Average: Represents the average annualized total return for all reporting funds in the Lipper Small-Cap Value Funds Classification. Lipper returns account for the effects of management fees and assume reinvestment of distributions but do not reflect any applicable sales charges.
Net Asset Value (NAV): The net market value of all securities held in a portfolio.
Net Asset Value (NAV) Per Share: The market value of one share of a mutual fund or closed-end fund. For a Fund, the NAV is calculated daily by taking the Fund’s total assets (securities, cash, and accrued earnings), subtracting the Fund’s liabilities, and dividing by the number of shares outstanding.
Russell 1000® Value Index: An index that measures the performance of those Russell 1000 companies with lower price-to-book ratios and lower forecasted growth values. The index returns assume reinvestment of distributions, but do not reflect any applicable sales charges or management fees.
Russell 2000® Value Index: An index that measures the performance of those Russell 2000 companies with lower price-to-book ratios and lower forecasted growth values. The index returns assume reinvestment of distributions, but do not reflect any applicable sales charges or management fees.
Russell Midcap® Value Index: An index that measures the performance of the mid-cap value segment of the U.S. equity universe. It includes those Russell Midcap Index companies with lower price-to-book ratios and lower forecasted growth values. The index returns assume reinvestment of distributions, but do not reflect any applicable sales charges or management fees.
S&P 500® Index: An unmanaged index generally considered representative of the U.S. stock market. The index returns assume reinvestment of distributions, but do not reflect any applicable sales charges or management fees.
Tax Equalization: The practice of treating a portion of the distribution made to a redeeming shareholder, which represents his proportionate part of undistributed net investment income and capital gain as a distribution for tax purposes. Such amounts are referred to as the equalization debits (or payments) and will be considered a distribution to the shareholder of net investment income and capital gain for calculation of the Fund’s dividends paid deduction.
| 54 | Nuveen Investments |
| * | The Board of Directors of the Funds, upon recommendation of the Audit Committee, engaged PricewaterhouseCoopers LLP as the Funds’ independent registered public accounting firm as of March 1, 2011. On December 30, 2011, Ernst & Young, LLP (“Ernst & Young”) completed its work on the October 31, 2011 audits and resigned as the independent registered public accounting firm of the Funds. |
Ernst & Young’s report on the Funds’ financial statements for the most recent fiscal year contained no adverse opinion or disclaimer of opinion, and were not qualified or modified as to uncertainty, audit scope or accounting principles. For the most recent fiscal year and through March 1, 2011, there were no disagreements with Ernst & Young on any matter of accounting principles, financial statement disclosure or auditing scope or procedures, which disagreements, if not resolved to the satisfaction of Ernst & Young, would have caused it to make reference to the subject matter of the disagreements in connection with its reports on the Funds’ financial statements.
Quarterly Portfolio of Investments and Proxy Voting information: You may obtain (i) each Fund’s quarterly portfolio of investments, (ii) information regarding how each Fund voted proxies relating to portfolio securities held during the most recent twelve-month period ended June 30, and (iii) a description of the policies and procedures that each Fund used to determine how to vote proxies relating to portfolio securities without charge, upon request, by calling Nuveen Investments at (800) 257-8787 or on Nuveen’s website at www.nuveen.com.
You may also obtain this and other Fund information directly from the Securities and Exchange Commission (SEC). The SEC may charge a copying fee for this information. Visit the SEC on-line at http://www.sec.gov or in person at the SEC’s Public Reference Room in Washington, D.C. Call the SEC at (202) 942-8090 for room hours and operation. You may also request Fund information by sending an e-mail request to publicinfo@sec.gov or by writing to the SEC’s Public Reference Section at 100 F Street NE, Washington, D.C. 20549.
The Financial Industry Regulatory Authority (FINRA) provides a Public Disclosure Program which supplies certain information regarding the disciplinary history of FINRA members and their associated persons in response to either telephone inquiries at (800) 289-9999 or written inquiries at www.finra.org. FINRA also provides an investor brochure that includes information describing the Public Disclosure Program.
| Nuveen Investments | 55 |
Nuveen Investments:
Serving Investors for Generations
Since 1898, financial advisors and their clients have relied on Nuveen Investments to provide dependable investment solutions through continued adherence to proven, long-term investing principles. Today, we offer a range of high quality equity and fixed-income solutions designed to be integral components of a well-diversified core portfolio.
Focused on meeting investor needs.
Nuveen Investments provides high-quality investment services designed to help secure the longterm goals of institutional and individual investors as well as the consultants and financial advisors who serve them. Nuveen Investments markets a wide range of specialized investment solutions which provide investors access to capabilities of its high-quality boutique investment affiliates-Nuveen Asset Management, Symphony Asset Management, NWQ Investment Management Company, Santa Barbara Asset Management, Tradewinds Global Investors, Winslow Capital Management, and Gresham Investment Management. In total, Nuveen Investments managed approximately $227 billion as of March 31, 2012.
Find out how we can help you.
To learn more about how the products and services of Nuveen Investments may be able to help you meet your financial goals, talk to your financial advisor, or call us at (800) 257-8787. Please read the information provided carefully before you invest. Investors should consider the investment objective and policies, risk considerations, charges and expenses of any investment carefully. Where applicable, be sure to obtain a prospectus, which contains this and other relevant information. To obtain a prospectus, please contact your securities representative or Nuveen Investments, 333 W. Wacker Dr., Chicago, IL 60606. Please read the prospectus carefully before you invest or send money.
Learn more about Nuveen Funds at: www.nuveen.com/mf
| Distributed by Nuveen Securities, LLC 333 West Wacker Drive Chicago, IL 60606 www.nuveen.com |
MSA-FSTK-0412P

Mutual Funds
Nuveen Equity Funds
For investors seeking the potential for long-term capital appreciation.
Semi-Annual Report
April 30, 2012
| Share Class / Ticker Symbol | ||||||||||
| Fund Name | Class A | Class B | Class C | Class R3 | Class I | |||||
| Nuveen International Fund |
FAIAX | FNABX | FIACX | ARQIX | FAICX | |||||
| Nuveen International Select Fund |
ISACX | — | ICCSX | ISRCX | ISYCX | |||||
| Nuveen Quantitative Enhanced Core Equity Fund |
FQCAX | — | FQCCX | — | FQCYX | |||||
| Nuveen Tactical Market Opportunities Fund |
NTMAX | — | NTMCX | — | FGTYX | |||||
LIFE IS COMPLEX.
Nuveen makes things e-simple.
It only takes a minute to sign up for e-Reports. Once enrolled, you’ll receive an e-mail as soon as your Nuveen Fund information is ready. No more waiting for delivery by regular mail. Just click on the link within the e-mail to see the report and save it on your computer if you wish.
Free e-Reports right to your e-mail!
www.investordelivery.com
If you receive your Nuveen Fund distributions and statements from your financial advisor or brokerage account.
OR
www.nuveen.com/accountaccess
If you receive your Nuveen Fund distributions and statements directly from Nuveen.
| Must be preceded by or accompanied by a prospectus. | NOT FDIC INSURED | MAY LOSE VALUE | NO BANK GUARANTEE |
| 4 | ||||
| 5 | ||||
| 15 | ||||
| 20 | ||||
| 22 | ||||
| 24 | ||||
| 52 | ||||
| 53 | ||||
| 54 | ||||
| 56 | ||||
| 64 | ||||
| 80 | ||||
| 81 | ||||
Letter to Shareholders


| 4 | Nuveen Investments |
Certain statements in this report are forward-looking statements. Discussions of specific investments are for illustration only and are not intended as recommendations of individual investments. The forward-looking statements and other views expressed herein are those of the portfolio managers as of the date of this report. Actual future results or occurrences may differ significantly from those anticipated in any forward-looking statements and the views expressed herein are subject to change at any time, due to numerous market and other factors. The Funds disclaim any obligation to update publicly or revise any forward-looking statements or views expressed herein.
The Nuveen International Fund is managed by a team of managers associated with three different sub-advisers: Nuveen Asset Management, LLC, an affiliate of Nuveen Investments; Altrinisic Global Advisors, LLC; and Hansberger Global Investors, Inc. The Nuveen International Select Fund is managed by a team of managers associated with four different sub-advisers: Nuveen Asset Management, LLC; Altrinsic Global Advisors, LLC; Hansberger Global Investors, Inc.; and Lazard Asset Management LLC. The Nuveen Quantitative Enhanced Core Equity Fund and the Nuveen Tactical Market Opportunities Fund are managed by a team of managers from Nuveen Asset Management, LLC. On the following pages, the portfolio management teams for the Funds examine key investment strategies and the Funds’ performance for the six-month period ended April 30, 2012.
Nuveen International Fund
How did the Fund perform during the six-month period ended April 30, 2012?
The tables in the Fund Performance and Expense Ratios section of this report provide Class A Share total returns for the Fund for the six-month, one-year, five-year and ten-year periods ended April 30, 2012. The Fund’s Class A Shares at net asset value (NAV) outperformed the MSCI EAFE Index, but underperformed the Lipper classification average over the six-month period.
What strategies were used to manage the Fund during the reporting period? How did these strategies influence performance?
The Fund seeks to provide long-term capital appreciation by investing primarily in equity securities of foreign issuers that trade in U.S. or foreign markets, depositary receipts representing shares of foreign issuers, and exchange-traded funds and other investment companies that provide exposure to foreign issuers. Two of the Fund’s sub-advisers, Altrinsic Global Advisors, LLC and Hansberger Global Investors, Inc., select stocks for the Fund according to the developed markets value and developed markets growth styles, respectively. At the same time, the Fund’s third sub-adviser, Nuveen Asset Management, LLC, maintains strategic oversight of the Fund, which includes allocating assets among the sub-advisers (including itself), tactically adjusting the overall portfolio balance and country emphasis using index related investments and selecting stocks in the infrastructure sector.
The Fund’s positioning, in particular its low exposure to cash for the majority of the reporting period, was generally successful given the rising markets that occurred. However, later in the period, we did raise the Fund’s cash level above the minimum necessary to accommodate ordinary transactions, and as a result became more conservative in our positioning.
| Nuveen Investments | 5 |
Equity, fixed income and currency futures contracts were used as an overlay strategy to adjust the exposures created by the Fund’s multi-manager framework so that the overall Fund had the desired exposures to key markets. Long and short futures contracts were used to implement various tactical market and hedging strategies. Our cash holdings and use of currency futures to benefit from currency price fluctuations also added value. The U.S. dollar strengthened during the reporting period. We also held positions in futures that benefited from the growing strength of the U.S. dollar against the euro, the Australian dollar and a general basket of all U.S. trading partners.
The Fund’s positioning largely reflected our long held concerns about the euro zone. We continued to be averse of the weaker euro zone nations, as we had long anticipated growing imbalances and debt problems from this incomplete union. During the period, worldwide market turbulence was driven by that region. At the beginning of the period, our underweights in Europe were helpful as enthusiasm for the European Central Bank actions of September and early October 2011 waned and the MSCI Europe Index had fallen. But a coordinated action by the European Central Bank and counterparts in the U.S., Japan, England, Canada and Switzerland boosted confidence that deleveraging by consumers and businesses would be countered by banks. Investor confidence pushed European indexes up again, taking the MSCI Europe Index up significantly over the course of the following four months. During the final six weeks of the reporting period, uncertainty prevailed and global markets declined.
In conjunction with our success from underweighting Europe we also made favorable country selections outside the region. We invested in nations such as the Philippines, Thailand, Taiwan, Indonesia and Australia. We took a short position on the Korea Composite Stock Price Index (KOSPI) and maintain concerns about Korea’s dependency on maintaining competitive exports as growth in exports may be constrained by international consumer conditions.
Japan benefited from its relative isolation from Europe, and the Nikkei Index had a strong performance. We have emphasized Japan as part of our more cautious exposure. More recently, it appears that the Bank of Japan has not stimulated domestic demand. The yen has risen further, making the country’s exports more expensive. Several major electronics manufacturers, especially in the television industry, have suffered sharp losses. Therefore, we have reduced the Fund’s exposure to Japan.
Among all these successful country and sentiment decisions, some unsuccessful decisions have to be acknowledged. We had anticipated a higher global growth rate would continue to drive commodity prices, including metals, minerals, energy and agricultural products. Since the Fund does not invest in commodities directly, we emphasized Australian, Russian and Canadian indexes as our way to profit from this demand. Our position in gold miners was unsuccessful, as the stocks underperformed the price of gold which stagnated during the period. Despite Russia’s heavy orientation to oil and the generally strong price for it, the Russian index lagged due to its exposure to other industries. Australian and Canadian index holdings were generally mixed as speculation about Chinese production levels hit metals market conditions. Materials and energy producers worldwide performed relatively poorly.
| 6 | Nuveen Investments |
Finally, we experienced very solid results in the Fund’s stock selection. These included such diversified companies as a health care provider in Spain, an energy producer in Brazil, a property company in China and a drug company in the United Kingdom. On the unsuccessful side, the Fund held Nokia Oyj, which had its dominant position in mobile phones severely disrupted by lower cost phones powered by Google’s Android software. Nokia Oyj has not yet seen sales growth from its partnership with Microsoft.
Nuveen International Select Fund
How did the Fund perform during the six-month period ended April 30, 2012?
The tables in the Fund Performance and Expense Ratios section of this report provide Class A Share total returns for the Fund for the six-month, one-year and since inception periods ended April 30, 2012. The Fund’s Class A Shares at net asset value (NAV) outperformed the MSCI All Country World Investable Market Index (ex U.S.), but underperformed the Lipper classification average over the six-month period.
What strategies were used to manage the Fund during the reporting period? How did these strategies influence performance?
The Fund seeks to provide long-term capital appreciation by investing primarily in equity securities of foreign issuers that trade in U.S. or foreign markets, depositary receipts representing shares of foreign issuers, and exchange-traded funds and other investment companies that provide exposure to foreign issuers. Three of the Fund’s sub-advisers, Altrinsic Global Advisors, LLC, Hansberger Global Investors, Inc., and Lazard Asset Management LLC, select stocks for the Fund according to the developed markets value, developed markets growth or emerging market styles, respectively. At the same time, the Fund’s fourth sub-adviser, Nuveen Asset Management, LLC, maintains strategic oversight of the Fund, which includes allocating assets among the sub-advisers (including itself), tactically adjusting the overall portfolio balance and country emphasis using index-related investments and selecting stocks in the infrastructure sector.
The Fund’s positioning, in particular its low exposure to cash for the majority of the reporting period, was generally successful given the rising markets that occurred. However, later in the period, we did raise the Fund’s cash level above the minimum necessary to accommodate ordinary transactions, and as a result became more conservative in our positioning.
Equity, fixed income and currency futures contracts were used as an overlay strategy to adjust the exposures created by the Fund’s multi-manager framework so that the overall Fund had the desired exposures to key markets. Long and short futures contracts were used to implement various tactical market and hedging strategies. Our cash holdings and use of currency futures to benefit from currency price fluctuations more than offset the cash drag. The U.S. dollar strengthened during the reporting period. We held positions in futures that benefited from the growing strength of the U.S. dollar against the euro, the Australian dollar and a general basket of all U.S. trading partners.
| Nuveen Investments | 7 |
The Fund’s positioning largely reflected our long held concerns about the euro zone. We continued to be averse of the weaker euro zone nations, as we had long anticipated growing imbalances and debt problems from this incomplete union. During the period, worldwide market turbulence was driven by that region. At the beginning of the period, our underweights in Europe were helpful as enthusiasm for the European Central Bank actions of September and early October 2011 waned and the MSCI Europe Index had fallen. But a coordinated action by the European Central Bank and counterparts in the U.S., Japan, England, Canada and Switzerland boosted confidence that deleveraging by consumers and businesses would be countered by banks. Investor confidence pushed European indexes up again, taking the MSCI Europe Index up significantly over the course of the following four months. During the final six weeks of the reporting period, uncertainty prevailed and global markets declined.
In conjunction with our success from underweighting Europe we also made favorable country selections outside the region. We continued to be cautious about India, consciously shorting its stock market index to offset individual securities selected from India. We also shifted our Asian emphasis to nations such as the Philippines, Thailand, Taiwan, Indonesia and Australia.
Japan benefited from its relative isolation from Europe, and the Nikkei Index had a strong performance. We have emphasized Japan as part of our more cautious exposure. More recently, it appears that the Bank of Japan has not stimulated domestic demand. The yen has risen further, making the country’s exports more expensive. Several major electronics manufacturers, especially in the television industry, have suffered sharp losses. Therefore, we have pulled back on the Fund’s exposure to Japan.
Among all these successful country and sentiment decisions, some unsuccessful decisions have to be acknowledged. We had anticipated a higher global growth rate would continue to drive commodity prices, including metals, minerals, energy and agricultural products. Since the Fund does not invest in commodities directly, we emphasized Australian, Russian and Canadian indexes as our way to profit from this demand. Our position in gold miners was unsuccessful, as the stocks underperformed the price of gold which stagnated during the period. Likewise, Russia’s heavy orientation to oil did not cause its index to participate in the generally strong price for the commodity. Australian and Canadian index holdings were generally mixed as speculation about Chinese production levels hit metals market conditions. Materials and energy producers worldwide performed relatively poorly.
We also experienced solid results from the Fund’s stock selection. Three of our Brazilian companies, Cielo, Companhia Energetica de Minas Gerais and Souza Cruz, made solid gains in a strong market, compensating for a decline in the Brazilian real during the period. The Fund had less success with its holding in YPF SA, whose properties in Argentina were seized by the government.
Finally, the Fund’s portfolio included a significant, slightly above benchmark weight in Canada. Many international funds represented in the Lipper classification average are less diversified globally, concentrating on other developed or emerging markets. As Canada
| 8 | Nuveen Investments |
lagged during this reporting period, the Fund did not match the Lipper classification average return, despite having success against the broader MSCI All Country World Investable Market Index (ex U.S.).
Nuveen Quantitative Enhanced Core Equity Fund
How did the Fund perform during the six-month period ended April 30, 2012?
The tables in the Fund Performance and Expense Ratios section of this report provide Class A Share total returns for the Fund for the six-month, one-year and since inception periods ended April 30, 2012. The Fund’s Class A Shares at net asset value (NAV) underperformed the S&P 500® Index over the six-month period, but performed in-line with the Lipper classification average.
What strategies were used to manage the Fund during the reporting period? How did these strategies influence performance?
The Fund’s goal is to provide, over the long-term, a total return that exceeds the return of the S&P 500® Index. In attempting to achieve this goal, the Fund primarily invests in the common stocks of companies that have market capitalizations at the time of purchase within the range of the companies in the S&P 500® Index. To select specific stocks, we use proprietary models that help establish quantitative links between economic and market variables, investment factors and equity market returns. Our proprietary models analyze macroeconomic and market data and other statistics to determine what we believe will be the key drivers of performance in the current economy. We use historical analysis of these drivers to estimate equity market returns and the relative contribution to these returns from a comprehensive list of investment factors. We then evaluate each stock in the investable universe to determine its sensitivity to each factor and estimate a potential contribution for each stock. Our goal is to build an optimized portfolio that targets the highest expected returns, while using the proprietary models and processes described above to maintain as tight a control as possible on overall risk.
We continued to implement our strategy of taking conservative style shifts away from the S&P 500® Index on various measures, positioning the Fund in the sectors and styles that we expected to perform best in the anticipated economic climate. During the reporting period, several of our style positions and sector weights added favorably to the Fund’s returns. However, in aggregate the Fund’s strategies were not successful over this period as unfavorable results among several other themes offset the areas of strength.
The Fund benefited the most from its slightly higher risk profile than its benchmark, which added to performance in the period’s strongly advancing market. As has historically been the case, the Fund was positioned a little more aggressively at the beginning of each year to capture the so-called “January effect.” Several other style positions also aided results, including emphases on stocks with lower price/earnings ratios, stocks that were not as heavily traded and stocks that were levered away from a strengthening dollar, which are typically exporters that tend to profit as the dollar weakens. The Fund was also rewarded for a shift toward companies with volatile earnings histories as those stocks generally experienced surprises to the upside as investors searched for new opportunities.
| Nuveen Investments | 9 |
Among the Fund’s sector weights, we had three successful contributors. One was an overweight to financial stocks, which performed above the benchmark weight during the period. The financial sector was one of the top performers in the S&P 500® Index during the period. Performance was also enhanced by our overweight in health care stocks, particularly our emphasis on medical products and pharmaceuticals companies within the segment. Investors favored pharmaceuticals during the period for their higher dividends and perceived ability to grow even if broader economic growth is tepid. The Fund also experienced a slight benefit from an underweight in industrial stocks.
In terms of individual stocks, the Fund benefited from a lower than index weight in Amazon.com, which underperformed other retail oriented stocks. Amazon experienced pressure on its margins as the introduction of its low cost Kindle tablet caused concerns that the company was achieving growth at the expense of profitability. An overweight position in AT&T also helped results as the company’s subscriber growth and profitability have continued to be strong. Our purchases and sales of Hewlett-Packard were also beneficial. Finally, the Fund was rewarded for an overweight in Microsoft throughout the period. Microsoft’s stock price advanced on rising optimism for its Windows 8 software due out this fall and its potential to work across desktops, tablets and phones.
The biggest detractor from performance during the period was our emphasis on high volatility stocks. Normally in a strong market, we would expect to see higher volatility stocks outperform. However, this style was out of favor during the period as many investors sought out low volatility solutions. We also, on average, continued to emphasize smaller sized holdings within the S&P 500® Index universe, which was a detractor during the period. Smaller sized stocks turned in slightly lower results than their larger cap counterparts. We were also unsuccessful with our shift toward the value style and subsequent underweight to growth oriented stocks during a period when growth outperformed.
Fund performance was also hindered by a strong overweight to technology and stock selection within that sector. Although the technology sector overall turned in strong results in the large-cap market, much of that outperformance was driven by Apple, the leading manufacturer of smart phones, desktop and portable computing devices. Apple continued to gain meaningful and profitable market share due to its ongoing product and geographic expansion. Unfortunately, our portfolio had an underweight position in that stock during the period. Meanwhile, we emphasized Google, which performed below the sector average.
Regarding other detrimental sector weights, our slight overweight in utilities was not a success as this sector trailed the more economically sensitive sectors. Performance was also hindered by an average underweight in consumer stocks, both in the discretionary and staples groups. Consumer discretionary, in particular, was the top performing sector in the S&P 500® Index during the reporting period.
Throughout the period, we also invested in S&P 500® Index futures contracts which were used to convert cash into the equivalent of an S&P 500® Index holding. This minimized tracking error to the Fund’s benchmark index resulting from cash flow activity and tactical portfolio management positioning.
| 10 | Nuveen Investments |
At the end of the period, we positioned the Fund for slower growth in the markets by generally aligning our positions closer to the S&P 500® Index. For example, we brought the portfolio’s beta more in-line with the benchmark and lowered our technology weighting, while still maintaining a slight overweight versus the benchmark. We are generally not as oriented toward growth stocks, which we believe will benefit results if the global growth slowdown continues. We are only using approximately three-fourths of our risk budget; therefore, the Fund’s returns are more likely to be closer in-line with the benchmark returns.
Nuveen Tactical Market Opportunities Fund
How did the Fund perform during the six-month period ended April 30, 2012?
The tables in the Fund Performance and Expense Ratios section of this report provide Class A Share total returns for the Fund for the six-month, one-year and since inception periods ended April 30, 2012. The Fund’s Class A Shares at net asset value (NAV) outperformed the Bank of America Merrill Lynch 3-Month U.S. Treasury Bill Index, but underperformed the Lipper classification average over the six-month period.
What strategies were used to manage the Fund during the reporting period? How did these strategies influence performance?
The Fund seeks to provide investors with the potential for a positive total return over a reasonable period of time, regardless of market conditions. Our goal is to generate these returns through asset allocation decisions rather than individual security selection by adjusting the Fund’s allocations to fixed income, equities and cash. To accomplish the Fund’s goal, we are able to invest in a variety of asset classes, long or short, throughout the world. We also may use other alternative asset classes, such as currencies and commodities, and investment tools such as the VIX (S&P 500® Volatility Index) to take advantage of market opportunities, to further diversify the Fund or as part of our volatility management strategies. The Fund owns no individual securities except for investment grade government bonds. We focus on generating returns in the portfolio in three ways: income oriented positions, market directional positions and long and short relative value positions (spread trades) that produce returns through differential performance.
During this reporting period, the Fund’s portfolio focus was primarily on income and gross (long/short) equity exposure, implemented by spread trades as opposed to net market directional exposure. As a result, the overall risk profile of the portfolio was lower than in previous periods. Given our view that valuations in both fixed income and equity markets were stretched, we believed a lower net market directional positioning within the Fund’s portfolio was warranted. Although the Fund generated a positive return over the six-month reporting period, it would have benefited from higher net market directional exposure during the equity market’s strong advance. Strong equity market performance was also the primary factor in the Fund’s shortfall versus its Lipper classification average. Given the significant differences in strategies, designated benchmarks, and much higher realized volatility in the Lipper classification average, it becomes challenging to make direct comparisons with the Fund, especially given the Fund’s relatively conservative approach.
| Nuveen Investments | 11 |
Overall, our focus on income was the primary driver of the Fund’s outperformance of the Bank of America Merrill Lynch 3-Month U.S. Treasury Bill Index during this period. Specifically, positions in domestic high yield, municipal high yield and National Association of Real Estate Investment Trusts (NAREIT) ETFs added significantly to performance. Spread trades such as long S&P 500® Index/short, Russell 2000® Index and long Indian equities/short Mexican equities also contributed to outperformance of the index.
Because we continue to view the return outlook for both equities and fixed income as modest with significant downside risk, our tactical strategy remains focused on what we expect will be relatively stable income generating positions and relative value long/short positioning, with only modest directional exposure to select segments of the equity and fixed income markets. At the end of the period, long direction positions included domestic high yield, long-term investment grade corporate and higher yielding high quality government bonds (such as longer-term Australian Treasuries) and income producing equities on a global basis. The Fund’s U.S. Treasury allocations are low relative to past allocations, given the low level of yields today. Instead, we are focusing our strategy on gross exposure with matched long/short equity index positions such as long large-cap domestic equities and short small-cap domestic equities, favoring Canada over the U.S., Holland over Germany and other matched country positions. At the end of the period, the Fund had no direct commodity exposure and modest foreign exchange positioning that we believe should benefit from weakness in industrial commodity prices.
Equity, fixed income and currency futures contracts were also used as part of the management of the Fund. Long and short futures contracts were used to implement various absolute return, tactical market and hedging strategies.
Risk Considerations
Mutual fund investing involves risk; principal loss is possible.
Nuveen International Fund/Nuveen International Select Fund
Equity investments such as those held by the Fund, are subject to market risk, additional expenses risk, common stock risk, derivatives risk, small and mid cap stock risk, and multi-manager risk. Foreign investments involve additional risks, including currency fluctuation, political and economic instability, lack of liquidity and differing legal and accounting standards. These risks are magnified in emerging markets.
Nuveen Quantitative Enhanced Core Equity Fund
There is no guarantee that the fund’s proprietary quantitative strategy will be successful. Equity securities such as the common stocks held in the portfolio are subject to market risk or the risk of decline. Foreign securities involve additional risks including currency fluctuations, and economic or political instability. The use of derivative instruments such as futures contracts, involve substantial financial risks and transaction costs. The potential investment in ETFs means shareholders bear both their proportionate share of fund expenses and indirectly, the expenses of the ETFs.
| 12 | Nuveen Investments |
Nuveen Tactical Market Opportunities Fund
There is no guarantee that the fund will achieve its investment objective and the portfolio manager’s asset allocation decisions may adversely affect fund performance. The fund is exposed to the risks of the underlying derivative instruments, ETFs, U.S. Treasury bonds, foreign government bonds, commodities, and short-term securities that may be held in the portfolio. These risks include market risk, frequent trading risk, liquidity risk, interest rate risk, and credit risk. The credit risk and liquidity risk is heightened for non-investment grade or high-yield securities. The use of derivatives involves substantial financial risks and transaction costs. Commodities may be highly volatile and foreign investments are subject to additional risks including currency fluctuations, and economic or political instability. These risks are magnified in emerging markets. In addition, the fund will bear its proportionate share of any fees and expensed paid by the ETFs in which it invests.
| Nuveen Investments | 13 |
[THIS PAGE INTENTIONALLY LEFT BLANK]
| 14 | Nuveen Investments |
Fund Performance and Expense Ratios
The Fund Performance and Expense Ratios for each Fund are shown on the following four pages.
Returns quoted represent past performance, which is no guarantee of future results. Current performance may be higher or lower than the performance shown. Investment returns and principal value will fluctuate so that when shares are redeemed, they may be worth more or less than their original cost. Returns without sales charges would be lower if the sales charge were included. Returns do not reflect the deduction of taxes that a shareholder would pay on Fund distributions or the redemption of Fund shares.
Returns may reflect a contractual agreement between certain Funds and the investment adviser to waive certain fees and expenses; see Notes to Financial Statements, Footnote 7 — Management Fees and Other Transactions with Affiliates for more information. In addition, returns may reflect a voluntary expense limitation by the Funds’ investment adviser that may be modified or discontinued at any time without notice. For the most recent month-end performance visit www.nuveen.com or call (800) 257-8787.
Returns reflect differences in sales charges and expenses, which are primarily differences in distribution and service fees. Fund returns assume reinvestment of dividends and capital gains.
Comparative index and Lipper return information is provided for the Funds’ Class A Shares at net asset value (NAV) only.
The expense ratios shown reflect the Funds’ total operating expenses (before fee waivers or expense reimbursements, if any) as shown in the Funds’ most recent prospectus. The expense ratios include management fees and other fees and expenses.
| Nuveen Investments | 15 |
Fund Performance and Expense Ratios (continued)
Nuveen International Fund
Refer to the first page of this Fund Performance and Expense Ratios section for further explanation of the information included within this page.
Fund Performance
Average Annual Total Returns as of April 30, 2012*
|
Cumulative |
Average Annual | |||||||||||||||||
| 6-Month | 1-Year | 5-Year | 10-Year | |||||||||||||||
| Class A Shares at NAV |
5.00% | -11.21% | -3.67% | 3.93% | ||||||||||||||
| Class A Shares at maximum Offering Price |
-1.05% | -16.30% | -4.80% | 3.32% | ||||||||||||||
| MSCI EAFE Index** |
2.71% | -12.38% | -4.25% | 5.89% | ||||||||||||||
| Lipper International Large-Cap Growth Fund Classification Average** |
6.12% | -10.44% | -2.06% | 5.64% | ||||||||||||||
| Class C Shares |
4.61% | -11.90% | -4.38% | 3.15% | ||||||||||||||
| Class R3 Shares |
4.88% | -11.32% | -3.84% | 3.69% | ||||||||||||||
| Class I Shares |
5.12% | -11.15% | -3.47% | 4.17% | ||||||||||||||
Average Annual Total Returns as of March 31, 2012 (Most Recent Calendar Quarter)*
| Cumulative | Average Annual | |||||||||||||||||
| 6-Month | 1-Year | 5-Year | 10-Year | |||||||||||||||
| Class A Shares at NAV |
15.91% | -5.37% | -2.71% | 4.01% | ||||||||||||||
| Class A Shares at maximum Offering Price |
9.28% | -10.78% | -3.86% | 3.40% | ||||||||||||||
| Class C Shares |
15.46% | -6.08% | -3.44% | 3.24% | ||||||||||||||
| Class R3 Shares |
15.91% | -5.46% | -2.87% | 3.79% | ||||||||||||||
| Class I Shares |
15.91% | -5.28% | -2.49% | 4.26% | ||||||||||||||
Class A Shares have a maximum 5.75% sales charge (Offering Price). Class A Share purchases of $1 million or more are sold at net asset value without an up-front sales charge but may be subject to a contingent deferred sales charge (CDSC), also known as a back-end sales charge, if redeemed within twelve months of purchase. Class C Shares have a 1% CDSC for redemptions within less than twelve months, which is not reflected in the one-year total return. Class R3 Shares have no sales charge and are available to only certain retirement plans. Class I Shares have no sales charge and may be purchased under limited circumstances or by specified classes of investors.
Expense Ratios as of Most Recent Prospectus
| Expense Ratios |
||||
| Class A Shares |
1.43% | |||
| Class C Shares |
2.18% | |||
| Class R3 Shares |
1.68% | |||
| Class I Shares |
1.18% | |||
| * | Six-month returns are cumulative; all other returns are annualized. |
| ** | Refer to the Glossary of Terms Used in this Report for definitions. Indexes and Lipper averages are not available for direct investment. |
| 16 | Nuveen Investments |
Nuveen International Select Fund
Refer to the first page of this Fund Performance and Expense Ratios section for further explanation of the information included within this page.
Fund Performance
Average Annual Total Returns as of April 30, 2012*
| Cumulative | Average Annual | |||||||||||||||||
| 6-Month | 1-Year | 5-Year |
Since Inception** |
|||||||||||||||
| Class A Shares at NAV |
4.29% | -12.76% | -2.20% | -0.56% | ||||||||||||||
| Class A Shares at maximum Offering Price |
-1.71% | -17.81% | -3.35% | -1.65% | ||||||||||||||
| MSCI All Country World Investable Market Index (ex U.S.)*** |
3.22% | -12.56% | -0.23% | -4.93% | ||||||||||||||
| Lipper International Large-Cap Growth Fund Classification Average*** |
6.12% | -10.44% | -0.58% | -2.06% | ||||||||||||||
| Class C Shares |
4.02% | -13.36% | -2.91% | -1.29% | ||||||||||||||
| Class R3 Shares**** |
4.18% | -12.98% | -2.78% | -1.13% | ||||||||||||||
| Class I Shares |
4.47% | -12.58% | -1.94% | -0.31% | ||||||||||||||
Average Annual Total Returns as of March 31, 2012 (Most Recent Calendar Quarter)*
| Cumulative | Average Annual | |||||||||||||||||
| 6-Month | 1-Year | 5-Year |
Since Inception** |
|||||||||||||||
| Class A Shares at NAV |
16.10% | -7.71% | -1.05% | -0.21% | ||||||||||||||
| Class A Shares at maximum Offering Price |
9.48% | -13.01 | -.2.23% | -1.33% | ||||||||||||||
| Class C Shares |
15.56% | -8.49% | -1.81% | -0.97% | ||||||||||||||
| Class R3 Shares**** |
15.82% | -8.04% | -1.65% | -0.81% | ||||||||||||||
| Class I Shares |
16.15% | -7.63% | -0.83% | 0.02% | ||||||||||||||
Class A Shares have a maximum 5.75% sales charge (Offering Price). Class A Share purchases of $1 million or more are sold at net asset value without an up-front sales charge but may be subject to a contingent deferred sales charge (CDSC), also known as a back-end sales charge, if redeemed within twelve months of purchase. Class C Shares have a 1% CDSC for redemptions within less than twelve months, which is not reflected in the one-year total return. Class R3 Shares have no sales charge and are available to only certain retirement plans. Class I Shares have no sales charge and may be purchased under limited circumstances or by specified classes of investors.
Expense Ratios as of Most Recent Prospectus
| Expense Ratios |
||||
| Class A Shares |
1.46% | |||
| Class C Shares |
2.21% | |||
| Class R3 Shares |
1.71% | |||
| Class I Shares |
1.21% | |||
| * | Six-month returns are cumulative; all other returns are annualized. |
| ** | Since inception returns are from 12/21/06. |
| *** | Refer to the Glossary of Terms Used in this Report for definitions. Indexes and Lipper averages are not available for direct investment. |
| **** | Effective May 14, 2012, Class R3 Shares were closed to all new investments. After the close of business on June 13, 2012, the Fund liquidated all shareholder accounts invested in Class R3 Shares and distributed the proceeds of the liquidation. |
| Nuveen Investments | 17 |
Fund Performance and Expense Ratios (continued)
Nuveen Quantitative Enhanced Core Equity Fund
Refer to the first page of this Fund Performance and Expense Ratios section for further explanation of the information included within this page.
Fund Performance
Average Annual Total Returns as of April 30, 2012*
| Cumulative | Average Annual | |||||||||||||
| 6-Month | 1-Year | Since Inception** |
||||||||||||
| Class A Shares |
11.61% | 1.79% | 0.45% | |||||||||||
| S&P 500® Index*** |
12.77% | 4.76% | 1.36% | |||||||||||
| Lipper Large Cap Core Funds Classification Average*** |
11.62% | 2.22% | 0.54% | |||||||||||
| Class C Shares |
11.17% | 1.02% | -0.28% | |||||||||||
| Class I Shares |
11.72% | 2.05% | 0.71% | |||||||||||
Average Annual Total Returns as of March 31, 2012 (Most Recent Calendar Quarter)*
| Cumulative | Average Annual | |||||||||||||
| 6-Month | 1-Year | Since Inception** |
||||||||||||
| Class A Shares |
25.00% | 5.57% | 0.67% | |||||||||||
| Class C Shares |
24.54% | 4.78% | -0.07% | |||||||||||
| Class I Shares |
25.21% | 5.88% | 0.93% | |||||||||||
Class A Shares have no sales charge and are available only through fee-based programs and certain retirement plans. Class C Shares have a 1% CDSC for redemptions within less than twelve months, which is not reflected in the one-year total return. Class I Shares have no sales charge and may be purchased under limited circumstances or by specified classes of investors.
Expense Ratios as of Most Recent Prospectus
| Gross Expense Ratios |
Net Expense Ratios |
|||||||
| Class A Shares |
0.89% | 0.71% | ||||||
| Class C Shares |
1.64% | 1.46% | ||||||
| Class I Shares |
0.64% | 0.46% | ||||||
The fund’s investment adviser has contractually agreed to waive fees and/or reimburse other fund expenses through February 28, 2013 so that total annual fund operating expenses, after fee waivers and/or expense reimbursements and excluding any Acquired Fund Fees and Expenses, do not exceed 0.70%, 1.45%, and 0.45% for Class A, Class C and Class I shares, respectively. Fee waivers and/or expense reimbursements will not be terminated prior to that time without the approval of the fund’s board of directors.
| * | Six-month returns are cumulative; all other returns are annualized. |
| ** | Since inception returns are from 7/31/07. |
| *** | Refer to the Glossary of Terms Used in this Report for definitions. Indexes and Lipper averages are not available for direct investment. |
| 18 | Nuveen Investments |
Nuveen Tactical Market Opportunities Fund
Refer to the first page of this Fund Performance and Expense Ratios section for further explanation of the information included within this page.
Fund Performance
Average Annual Total Returns as of April 30, 2012*
| Cumulative | Average Annual | |||||||||||||
| 6-Month | 1-Year | Since Inception** |
||||||||||||
| Class A Shares at NAV |
1.18% | 3.48% | 5.91% | |||||||||||
| Class A Shares at maximum Offering Price |
-4.60% | -2.47% | 3.26% | |||||||||||
| Bank of America Merrill Lynch 3-Month U.S. Treasury Bill Index*** |
0.01% | 0.05% | 0.10% | |||||||||||
| Lipper Flexible Portfolio Funds Classification Average*** |
4.82% | -1.31% | 7.44% | |||||||||||
| Class C Shares |
0.73% | 2.66% | 5.09% | |||||||||||
| Class I Shares |
1.33% | 3.83% | 6.22% | |||||||||||
Average Annual Total Returns as of March 31, 2012 (Most Recent Calendar Quarter)*
| Cumulative | Average Annual | |||||||||||||
| 6-Month | 1-Year | Since Inception** |
||||||||||||
| Class A Shares at NAV |
1.72% | 4.74% | 5.88% | |||||||||||
| Class A Shares at maximum Offering Price |
-4.15% | -1.30% | 3.13% | |||||||||||
| Class C Shares |
1.28% | 3.91% | 5.07% | |||||||||||
| Class I Shares |
1.88% | 5.09% | 6.20% | |||||||||||
Class A Shares have a maximum 5.75% sales charge (Offering Price). Class A Share purchases of $1 million or more are sold at net asset value without an up-front sales charge but may be subject to a contingent deferred sales charge (CDSC), also known as a back-end sales charge, if redeemed within twelve months of purchase. Class C Shares have a 1% CDSC for redemptions within less than twelve months, which is not reflected in the one-year total return. Class I Shares have no sales charge and may be purchased under limited circumstances or by specified classes of investors.
Expense Ratios as of Most Recent Prospectus
| Gross Expense Ratios |
Net Expense Ratios |
|||||||
| Class A Shares |
1.66% | 1.42% | ||||||
| Class C Shares |
2.41% | 2.17% | ||||||
| Class I Shares |
1.41% | 1.17% | ||||||
The fund’s investment adviser has contractually agreed to waive fees and/or reimburse other fund expenses through February 28, 2013 so that total annual fund operating expenses, after fee waivers and/or expense reimbursements and excluding Acquired Fund Fees and Expenses, do not exceed 1.20%, 1.95%, and 0.95% for Class A, Class C and Class I shares, respectively. Fee waivers and/or expense reimbursements will not be terminated prior to that time without the approval of the fund’s board of directors.
| * | Six-month returns are cumulative; all other returns are annualized. |
| ** | Since inception returns for Class A, Class C and Class I Shares, and for the comparative index and Lipper classification average, are from 12/30/09. Class I Share returns are actual. The returns for Class A and Class C Shares are actual for the periods since class inception on 2/24/11; returns prior to class inception are Class I Share returns adjusted for differences in sales charges and expense, which are primarily differences in distribution and service fees. |
| *** | Refer to the Glossary of Terms Used in this Report for definitions. Indexes and Lipper averages are not available for direct investment. |
| Nuveen Investments | 19 |
Holding Summaries as of April 30, 2012
This data relates to the securities held in each Fund’s portfolio of investments. It should not be construed as a measure of performance for the Fund itself.
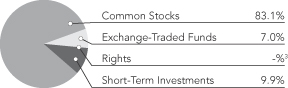
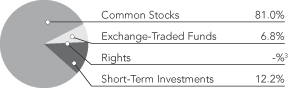
| 1 | As a percentage of total investments (excluding investments in derivatives) as of April 30, 2012. Holdings are subject to change. |
| 2 | As a percentage of total common stocks as of April 30, 2012. Holdings are subject to change. |
| 3 | Rounds to less than 0.1%. |
| 20 | Nuveen Investments |
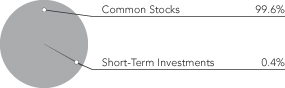
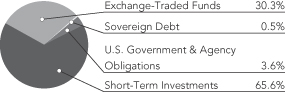
| 1 | As a percentage of total investments (excluding investments purchased with collateral from securities lending and investments in derivatives) as of April 30, 2012. Holdings are subject to change. |
| 2 | As a percentage of total common stocks as of April 30, 2012. Holdings are subject to change. |
| 3 | As a percentage of total investments (excluding investments in derivatives) as of April 30, 2012. Holdings are subject to change. |
| Nuveen Investments | 21 |
As a shareholder of one or more of the Funds, you incur two types of costs: (1) transaction costs, including up-front and back-end sales charges (loads) or redemption fees, where applicable; and (2) ongoing costs, including management fees; distribution and service (12b-1) fees, where applicable; and other Fund expenses. The Examples below are intended to help you understand your ongoing costs (in dollars) of investing in the Funds and to compare these costs with the ongoing costs of investing in other mutual funds.
The Examples below are based on an investment of $1,000 invested at the beginning of the period and held for the period.
The information under “Actual Performance,” together with the amount you invested, allows you to estimate actual expenses incurred over the reporting period. Simply divide your account value by $1,000 (for example, an $8,600 account value divided by $1,000 = 8.60) and multiply the result by the cost shown for your share class, in the row entitled “Expenses Incurred During Period” to estimate the expenses incurred on your account during this period.
The information under “Hypothetical Performance,” provides information about hypothetical account values and hypothetical expenses based on the respective Fund’s actual expense ratio and an assumed rate of return of 5% per year before expenses, which is not the Fund’s actual return. The hypothetical account values and expenses may not be used to estimate the actual ending account balance or expense you incurred for the period. You may use this information to compare the ongoing costs of investing in the Fund and other Funds. To do so, compare this 5% hypothetical example with the 5% hypothetical examples that appear in the shareholder reports of the other funds.
Please note that the expenses shown in the table are meant to highlight your ongoing costs only and do not reflect any transaction costs. Therefore, the hypothetical information is useful in comparing ongoing costs only, and will not help you determine the relative total costs of owning different funds or share classes. In addition, if these transaction costs were included, your costs would have been higher.
Nuveen International Fund
| Actual Performance | Hypothetical Performance (5% annualized return before expenses) |
|||||||||||||||||||||||||||||||||
| A Shares | C Shares | R3 Shares | I Shares | A Shares | C Shares | R3 Shares | I Shares | |||||||||||||||||||||||||||
| Beginning Account Value (11/01/11) | $ | 1,000.00 | $ | 1,000.00 | $ | 1,000.00 | $ | 1,000.00 | $ | 1,000.00 | $ | 1,000.00 | $ | 1,000.00 | $ | 1,000.00 | ||||||||||||||||||
| Ending Account Value (4/30/12) | $ | 1,050.00 | $ | 1,046.10 | $ | 1,048.80 | $ | 1,051.20 | $ | 1,017.50 | $ | 1,013.77 | $ | 1,016.26 | $ | 1,018.75 | ||||||||||||||||||
| Expenses Incurred During Period | $ | 7.54 | $ | 11.34 | $ | 8.81 | $ | 6.27 | $ | 7.42 | $ | 11.17 | $ | 8.67 | $ | 6.17 | ||||||||||||||||||
For each class of the Fund, expenses are equal to the Fund’s annualized net expense ratio of 1.48%, 2.23%, 1.73% and 1.23% for Classes A, C, R3 and I, respectively, multiplied by the average account value over the period, multiplied by 182/366 (to reflect the one-half year period).
Nuveen International Select Fund
| Actual Performance | Hypothetical Performance (5% annualized return before expenses) |
|||||||||||||||||||||||||||||||||
| A Shares | C Shares | R3 Shares | I Shares | A Shares | C Shares | R3 Shares | I Shares | |||||||||||||||||||||||||||
| Beginning Account Value (11/01/11) | $ | 1,000.00 | $ | 1,000.00 | $ | 1,000.00 | $ | 1,000.00 | $ | 1,000.00 | $ | 1,000.00 | $ | 1,000.00 | $ | 1,000.00 | ||||||||||||||||||
| Ending Account Value (4/30/12) | $ | 1,042.90 | $ | 1,040.20 | $ | 1,041.80 | $ | 1,044.70 | $ | 1,017.50 | $ | 1,013.77 | $ | 1,016.26 | $ | 1,018.75 | ||||||||||||||||||
| Expenses Incurred During Period | $ | 7.52 | $ | 11.31 | $ | 8.78 | $ | 6.25 | $ | 7.42 | $ | 11.17 | $ | 8.67 | $ | 6.17 | ||||||||||||||||||
For each class of the Fund, expenses are equal to the Fund’s annualized net expense ratio of 1.48%, 2.23%, 1.73% and 1.23% for Classes A, C, R3 and I, respectively, multiplied by the average account value over the period, multiplied by 182/366 (to reflect the one-half year period).
Nuveen Quantitative Enhanced Core Equity Fund
| Actual Performance | Hypothetical Performance (5% annualized return before expenses) |
|||||||||||||||||||||||||
| A Shares | C Shares | I Shares | A Shares | C Shares | I Shares | |||||||||||||||||||||
| Beginning Account Value (11/01/11) | $ | 1,000.00 | $ | 1,000.00 | $ | 1,000.00 | $ | 1,000.00 | $ | 1,000.00 | $ | 1,000.00 | ||||||||||||||
| Ending Account Value (4/30/12) | $ | 1,116.10 | $ | 1,111.70 | $ | 1,117.20 | $ | 1,021.38 | $ | 1,017.65 | $ | 1,022.63 | ||||||||||||||
| Expenses Incurred During Period | $ | 3.68 | $ | 7.61 | $ | 2.37 | $ | 3.52 | $ | 7.27 | $ | 2.26 | ||||||||||||||
For each class of the Fund, expenses are equal to the Fund’s annualized net expense ratio of .70%, 1.45% and .45% for Classes A, C and I, respectively, multiplied by the average account value over the period, multiplied by 182/366 (to reflect the one-half year period).
| 22 | Nuveen Investments |
Nuveen Tactical Market Opportunities Fund
| Actual Performance | Hypothetical Performance (5% annualized return before expenses) |
|||||||||||||||||||||||||
| A Shares | C Shares | I Shares | A Shares | C Shares | I Shares | |||||||||||||||||||||
| Beginning Account Value (11/01/11) | $ | 1,000.00 | $ | 1,000.00 | $ | 1,000.00 | $ | 1,000.00 | $ | 1,000.00 | $ | 1,000.00 | ||||||||||||||
| Ending Account Value (4/30/12) | $ | 1,011.80 | $ | 1,007.30 | $ | 1,013.30 | $ | 1,019.00 | $ | 1,015.27 | $ | 1,020.24 | ||||||||||||||
| Expenses Incurred During Period | $ | 5.90 | $ | 9.63 | $ | 4.66 | $ | 5.92 | $ | 9.67 | $ | 4.67 | ||||||||||||||
For each class of the Fund, expenses are equal to the Fund’s annualized net expense ratio of 1.18%, 1.93% and .93% for Classes A, C and I, respectively, multiplied by the average account value over the period, multiplied by 182/366 (to reflect the one-half year period).
| Nuveen Investments | 23 |
Portfolio of Investments (Unaudited)
Nuveen International Fund
April 30, 2012
| Shares | Description (1) | Value | ||||||||||||
| COMMON STOCKS – 82.2% |
||||||||||||||
| Australia – 2.5% |
||||||||||||||
| 7,062 | APA Group |
$ | 38,410 | |||||||||||
| 16,611 | Australian Infrastructure Fund |
38,596 | ||||||||||||
| 31,112 | DUET Group |
59,972 | ||||||||||||
| 216,201 | Incitec Pivot |
736,634 | ||||||||||||
| 4,902 | Macquarie Atlas Roads Group, (2) |
8,453 | ||||||||||||
| 17,245 | Newcrest Mining |
472,569 | ||||||||||||
| 7,230 | QR National |
27,421 | ||||||||||||
| 34,357 | Sydney Airport |
104,173 | ||||||||||||
| 64,520 | Transurban Group |
394,620 | ||||||||||||
| 14,940 | Woodside Petroleum |
543,590 | ||||||||||||
| 18,494 | WorleyParsons |
544,372 | ||||||||||||
| Total Australia |
2,968,810 | |||||||||||||
| Austria – 0.0% |
||||||||||||||
| 662 | Oesterreichische Post |
23,485 | ||||||||||||
| Belgium – 0.8% |
||||||||||||||
| 13,911 | Anheuser-Busch InBev |
1,002,639 | ||||||||||||
| 281 | Elia System Operator |
12,022 | ||||||||||||
| Total Belgium |
1,014,661 | |||||||||||||
| Brazil – 0.7% |
||||||||||||||
| 2,236 | Companhia de Saneamento de Minas Gerais |
52,376 | ||||||||||||
| 10,921 | Companhia Energetica de Minas Gerais, ADR |
269,421 | ||||||||||||
| 749 | Companhia Paranaense de Energia-Copel, ADR |
18,762 | ||||||||||||
| 1,204 | CPFL Energia, ADR |
33,953 | ||||||||||||
| 8,214 | Energias do Brasil |
57,269 | ||||||||||||
| 17,201 | Itau Unibanco Holding, ADR |
269,884 | ||||||||||||
| 1,730 | Santos Brasil Participacoes |
30,223 | ||||||||||||
| 3,883 | Wilson Sons – BDR |
58,057 | ||||||||||||
| Total Brazil |
789,945 | |||||||||||||
| Canada – 7.1% |
||||||||||||||
| 9,785 | Agrium |
860,102 | ||||||||||||
| 14,000 | Bank of Nova Scotia |
776,440 | ||||||||||||
| 3,075 | Brookfield Renewable Energy |
86,132 | ||||||||||||
| 21,144 | Cameco |
467,282 | ||||||||||||
| 26,210 | Canadian Natural Resources |
910,591 | ||||||||||||
| 8,041 | Cenovus Energy |
291,815 | ||||||||||||
| 1,612 | Emera |
57,049 | ||||||||||||
| 9,035 | Enbridge |
378,476 | ||||||||||||
| 1,634 | Enbridge |
68,463 | ||||||||||||
| 25,960 | EnCana |
543,719 | ||||||||||||
| 6,088 | Keyera |
248,919 | ||||||||||||
| 71,770 | Kinross Gold, (3) |
642,977 | ||||||||||||
| 122,642 | Lundin Mining, (2) |
595,922 | ||||||||||||
| 57,321 | Manulife Financial |
783,578 | ||||||||||||
| 16,151 | Suncor Energy |
533,629 | ||||||||||||
| 24 | Nuveen Investments |
| Shares | Description (1) | Value | ||||||||||||
| Canada (continued) |
||||||||||||||
| 68,370 | Talisman Energy, (3) |
$ | 894,205 | |||||||||||
| 697 | TransCanada |
30,654 | ||||||||||||
| 1,068 | Veresen |
16,314 | ||||||||||||
| 2,738 | Westshore Terminals Investment |
68,433 | ||||||||||||
| 16,217 | Yamana Gold |
238,390 | ||||||||||||
| Total Canada |
8,493,090 | |||||||||||||
| Chile – 0.2% |
||||||||||||||
| 20,411 | Aguas Andinas, Class A |
13,503 | ||||||||||||
| 52,125 | Empresa Electrica Del Norte Grande |
139,430 | ||||||||||||
| 1,034 | Empresa Nacional de Electrcidad, ADR |
56,477 | ||||||||||||
| 395 | Inversiones Aguas Metropolitanas |
696 | ||||||||||||
| Total Chile |
210,106 | |||||||||||||
| China – 1.6% |
||||||||||||||
| 306,000 | Agile Property Holdings |
399,920 | ||||||||||||
| 8,688 | ENN Energy Holdings |
30,570 | ||||||||||||
| 540,000 | Industrial & Commercial Bank of China, Class H |
360,527 | ||||||||||||
| 18,669 | Jiangsu Expressway, Class H |
18,408 | ||||||||||||
| 11,278 | New Oriental Education & Technology Group, ADR, (2) |
301,461 | ||||||||||||
| 42,500 | Ping An Insurance |
355,506 | ||||||||||||
| 14,500 | Tencent Holdings |
455,633 | ||||||||||||
| Total China |
1,922,025 | |||||||||||||
| Czech Republic – 0.0% |
||||||||||||||
| 638 | CEZ |
25,726 | ||||||||||||
| Denmark – 0.5% |
||||||||||||||
| 4,335 | Novo Nordisk, Class B |
639,428 | ||||||||||||
| Finland – 0.4% |
||||||||||||||
| 1,075 | Fortum Oyj |
23,123 | ||||||||||||
| 119,356 | Nokia Oyj |
428,788 | ||||||||||||
| Total Finland |
451,911 | |||||||||||||
| France – 3.2% |
||||||||||||||
| 969 | Aeroports de Paris |
81,526 | ||||||||||||
| 13,403 | Alstom |
478,666 | ||||||||||||
| 38,557 | AXA |
546,104 | ||||||||||||
| 29,351 | Carrefour |
589,576 | ||||||||||||
| 9,321 | DANONE |
655,774 | ||||||||||||
| 1,234 | Eutelsat Communications |
43,923 | ||||||||||||
| 4,606 | GDF Suez |
106,026 | ||||||||||||
| 721 | Groupe Eurotunnel |
6,067 | ||||||||||||
| 5,817 | L’oreal |
699,848 | ||||||||||||
| 1,794 | Rubis |
97,565 | ||||||||||||
| 10,657 | Total SA |
508,826 | ||||||||||||
| 2,068 | Vinci |
95,809 | ||||||||||||
| Total France |
3,909,710 | |||||||||||||
| Germany – 7.6% |
||||||||||||||
| 18,968 | Adidas |
1,581,797 | ||||||||||||
| Nuveen Investments | 25 |
Portfolio of Investments (Unaudited)
Nuveen International Fund (continued)
April 30, 2012
| Shares | Description (1) | Value | ||||||||||||
| Germany (continued) |
||||||||||||||
| 34,234 | Aixtron |
$ | 626,939 | |||||||||||
| 9,986 | Allianz |
1,112,728 | ||||||||||||
| 2,621 | BASF |
215,763 | ||||||||||||
| 9,045 | Bayer |
637,075 | ||||||||||||
| 5,877 | BMW |
558,636 | ||||||||||||
| 9,570 | Daimler |
529,070 | ||||||||||||
| 7,927 | Deutsche Boerse |
497,680 | ||||||||||||
| 34,594 | E.ON |
783,730 | ||||||||||||
| 621 | Fraport Frankfurt Airport |
40,353 | ||||||||||||
| 1,250 | Hamburger Hafen und Logistik |
41,448 | ||||||||||||
| 11,480 | Henkel KGAA |
854,017 | ||||||||||||
| 10,382 | Siemens |
961,571 | ||||||||||||
| 25,231 | Symrise |
731,421 | ||||||||||||
| Total Germany |
9,172,228 | |||||||||||||
| Hong Kong – 2.5% |
||||||||||||||
| 9,981 | Beijing Enterprises Holdings |
55,831 | ||||||||||||
| 45,980 | Cheung Kong Holdings |
611,593 | ||||||||||||
| 28,156 | Cheung Kong Infrastructure Holdings |
167,115 | ||||||||||||
| 107,686 | China Everbright International |
51,077 | ||||||||||||
| 503,000 | China Longyuan Power, Class H |
397,413 | ||||||||||||
| 61,260 | China Merchants Holdings International |
198,181 | ||||||||||||
| 206,000 | China Resources Land |
396,672 | ||||||||||||
| 158,000 | China Unicom |
281,028 | ||||||||||||
| 42,724 | COSCO Pacific |
62,225 | ||||||||||||
| 74,681 | Guangdong Investment |
54,962 | ||||||||||||
| 27,478 | Hong Kong & China Gas |
70,265 | ||||||||||||
| 238,000 | Li & Fung |
509,212 | ||||||||||||
| 17,803 | MTR |
63,332 | ||||||||||||
| 13,546 | NWS Holdings |
20,462 | ||||||||||||
| 14,677 | Power Assets Holdings |
109,718 | ||||||||||||
| 30,715 | Towngas China |
21,773 | ||||||||||||
| Total Hong Kong |
3,070,859 | |||||||||||||
| India – 0.4% |
||||||||||||||
| 883 | GAIL India, GDR |
33,113 | ||||||||||||
| 10,825 | HDFC Bank, ADR |
371,622 | ||||||||||||
| 15,164 | Power Grid |
32,011 | ||||||||||||
| Total India |
436,746 | |||||||||||||
| Ireland – 1.5% |
||||||||||||||
| 24,532 | Covidien |
1,354,902 | ||||||||||||
| 31,859 | WPP |
430,953 | ||||||||||||
| Total Ireland |
1,785,855 | |||||||||||||
| Israel – 1.1% |
||||||||||||||
| 17,291 | NICE Systems, ADR, (2) |
664,320 | ||||||||||||
| 13,410 | Teva Pharmaceutical Industries, ADR |
613,373 | ||||||||||||
| Total Israel |
1,277,693 | |||||||||||||
| 26 | Nuveen Investments |
| Shares | Description (1) | Value | ||||||||||||
| Italy – 1.6% |
||||||||||||||
| 15,363 | Atlantia |
$ | 232,847 | |||||||||||
| 4,480 | Autostrada Torino-Milano |
24,254 | ||||||||||||
| 18,665 | Hera |
28,042 | ||||||||||||
| 12,132 | IREN |
8,026 | ||||||||||||
| 124,400 | Prada, (2) |
844,977 | ||||||||||||
| 13,599 | Saipem |
671,796 | ||||||||||||
| 9,447 | Snam |
44,943 | ||||||||||||
| 2,619 | Societa Inizative Autostradalie e Servizi |
16,398 | ||||||||||||
| 3,856 | Terna-Rete Elettrica Nationale |
14,343 | ||||||||||||
| Total Italy |
1,885,626 | |||||||||||||
| Japan – 14.3% |
||||||||||||||
| 82,826 | AMADA |
566,420 | ||||||||||||
| 14,527 | Canon |
667,762 | ||||||||||||
| 21,100 | DeNA |
661,489 | ||||||||||||
| 3,200 | FANUC |
544,689 | ||||||||||||
| 140 | INPEX |
929,359 | ||||||||||||
| 2,908 | Japan Airport Terminal |
39,919 | ||||||||||||
| 2,221 | Kamigumi |
17,887 | ||||||||||||
| 32,900 | KOMATSU |
953,952 | ||||||||||||
| 51,584 | Mitsubishi |
1,126,139 | ||||||||||||
| 33,205 | Mitsui Sumitomo Insurance Group |
616,771 | ||||||||||||
| 5,387 | Nintendo |
735,450 | ||||||||||||
| 40,284 | NKSJ Holdings |
835,045 | ||||||||||||
| 783 | Rakuten |
872,833 | ||||||||||||
| 11,313 | SECOM |
538,444 | ||||||||||||
| 7,856 | SMC |
1,319,501 | ||||||||||||
| 12,929 | Sugi Holdings |
419,091 | ||||||||||||
| 48,195 | Sumitomo Metal Mining |
637,449 | ||||||||||||
| 317,632 | Sumitomo Mitsui Trust |
938,892 | ||||||||||||
| 59,766 | Suzuki Motor |
1,420,041 | ||||||||||||
| 13,700 | TERUMO |
630,605 | ||||||||||||
| 248,392 | The Bank of Yokohama |
1,210,227 | ||||||||||||
| 24,267 | THK |
487,528 | ||||||||||||
| 26,500 | Toyota Motor |
1,096,975 | ||||||||||||
| Total Japan |
17,266,468 | |||||||||||||
| Luxembourg – 0.6% |
||||||||||||||
| 6,514 | Millicom International Cellular |
691,979 | ||||||||||||
| 554 | SES |
13,266 | ||||||||||||
| Total Luxembourg |
705,245 | |||||||||||||
| Malaysia – 0.3% |
||||||||||||||
| 97,542 | Sime Darby Berhad |
313,965 | ||||||||||||
| Mexico – 0.3% |
||||||||||||||
| 35,517 | OHL Mexico, (2) |
56,169 | ||||||||||||
| 10,559 | Wal-Mart de Mexico, ADR |
301,459 | ||||||||||||
| Total Mexico |
357,628 | |||||||||||||
| Nuveen Investments | 27 |
Portfolio of Investments (Unaudited)
Nuveen International Fund (continued)
April 30, 2012
| Shares | Description (1) | Value | ||||||||||||
| Netherlands – 1.3% |
||||||||||||||
| 27,452 | Heineken |
$ | 1,501,310 | |||||||||||
| 944 | Koninklijke Vopak |
60,848 | ||||||||||||
| Total Netherlands |
1,562,158 | |||||||||||||
| New Zealand – 0.1% |
||||||||||||||
| 20,933 | Auckland International Airport |
43,308 | ||||||||||||
| 28,052 | Infratil |
43,470 | ||||||||||||
| 7,960 | Port of Tauranga |
74,858 | ||||||||||||
| 1,335 | Vector |
2,882 | ||||||||||||
| Total New Zealand |
164,518 | |||||||||||||
| Norway – 1.6% |
||||||||||||||
| 2,417 | Hafslund, Class B, (3) |
22,806 | ||||||||||||
| 177,370 | Norsk Hydro, (3) |
862,838 | ||||||||||||
| 53,549 | Telenor ASA, (3) |
984,345 | ||||||||||||
| Total Norway |
1,869,989 | |||||||||||||
| Philippines – 0.1% |
||||||||||||||
| 46,121 | International Container Terminal Services |
74,283 | ||||||||||||
| Poland – 0.0% |
||||||||||||||
| 3,818 | PGE |
22,860 | ||||||||||||
| Portugal – 0.0% |
||||||||||||||
| 6,999 | Brisa Auto-Estradas de Portugal |
24,551 | ||||||||||||
| Singapore – 0.5% |
||||||||||||||
| 89,478 | CitySpring Infrastructure Trust |
28,561 | ||||||||||||
| 14,408 | ComfortDelGro |
17,814 | ||||||||||||
| 445,156 | Golden Agri-Resources |
264,396 | ||||||||||||
| 53,955 | Hutchison Port Holdings Trust |
40,736 | ||||||||||||
| 11,310 | Hyflux |
13,115 | ||||||||||||
| 27,233 | Parkway Life, REIT |
40,712 | ||||||||||||
| 10,060 | Singapore Airport Terminal Services |
21,217 | ||||||||||||
| 104,357 | Singapore Post |
85,594 | ||||||||||||
| 19,718 | Singapore Telecommunications |
49,713 | ||||||||||||
| 59,514 | SMRT |
80,795 | ||||||||||||
| Total Singapore |
642,653 | |||||||||||||
| South Africa – 0.8% |
||||||||||||||
| 55,438 | MTN Group |
969,141 | ||||||||||||
| South Korea – 0.7% |
||||||||||||||
| 1,395 | Hyundai Mobis |
379,571 | ||||||||||||
| 764 | Samsung Electronics, GDR |
469,842 | ||||||||||||
| Total South Korea |
849,413 | |||||||||||||
| Spain – 1.4% |
||||||||||||||
| 11,671 | Abertis Infraestructuras |
180,597 | ||||||||||||
| 59,182 | Banco Santander |
369,760 | ||||||||||||
| 908 | Enagas |
15,955 | ||||||||||||
| 27,434 | Ferrovial |
305,476 | ||||||||||||
| 33,937 | Grifols, (2) |
854,647 | ||||||||||||
| Total Spain |
1,726,435 | |||||||||||||
| 28 | Nuveen Investments |
| Shares | Description (1) | Value | ||||||||||||
| Sweden – 0.7% |
||||||||||||||
| 88,567 | Ericsson |
$ | 877,592 | |||||||||||
| Switzerland – 9.7% |
||||||||||||||
| 36,814 | ABB |
670,857 | ||||||||||||
| 10,660 | Adecco |
519,112 | ||||||||||||
| 9,894 | Compagnie Financiere Richemont |
611,528 | ||||||||||||
| 19,749 | Credit Suisse Group, (2) |
472,375 | ||||||||||||
| 488 | Flughafen Zuerich, (2) |
181,726 | ||||||||||||
| 34,319 | Foster Wheeler, (2) |
789,337 | ||||||||||||
| 10,560 | Holcim |
657,346 | ||||||||||||
| 21,659 | Nestle |
1,326,767 | ||||||||||||
| 21,435 | Noble |
815,816 | ||||||||||||
| 22,772 | Novartis |
1,255,703 | ||||||||||||
| 13,410 | Roche Holding |
2,449,598 | ||||||||||||
| 40,309 | UBS, (2) |
503,169 | ||||||||||||
| 71,869 | Xstrata |
1,373,393 | ||||||||||||
| Total Switzerland |
11,626,727 | |||||||||||||
| Taiwan – 0.5% |
||||||||||||||
| 33,000 | Hiwin Technologies |
312,957 | ||||||||||||
| 109,200 | Hon Hai Precision Industry |
345,450 | ||||||||||||
| Total Taiwan |
658,407 | |||||||||||||
| Turkey – 0.6% |
||||||||||||||
| 187,590 | Turkiye Garanti Bankasi |
690,011 | ||||||||||||
| United Kingdom – 13.3% |
||||||||||||||
| 155,260 | Aberdeen Asset Management |
714,340 | ||||||||||||
| 40,715 | Anglo American |
1,564,691 | ||||||||||||
| 55,494 | ARM Holdings |
471,921 | ||||||||||||
| 26,169 | BG Group |
616,024 | ||||||||||||
| 14,737 | BHP Billiton |
472,236 | ||||||||||||
| 18,279 | BP, ADR |
793,491 | ||||||||||||
| 70,794 | Diageo |
1,781,971 | ||||||||||||
| 68,159 | GlaxoSmithKline |
1,576,270 | ||||||||||||
| 16,793 | HSBC Holdings, ADR |
758,540 | ||||||||||||
| 5,013 | National Grid, ADR |
271,153 | ||||||||||||
| 70,769 | Prudential |
866,552 | ||||||||||||
| 75,936 | Rolls Royce Holdings |
1,014,854 | ||||||||||||
| 21,085 | Stagecoach Group |
84,863 | ||||||||||||
| 43,331 | Standard Chartered |
1,059,049 | ||||||||||||
| 113,729 | Tesco |
585,736 | ||||||||||||
| 5,537 | United Utilities Group |
55,578 | ||||||||||||
| 35,867 | Vedanta Resources |
708,399 | ||||||||||||
| 45,108 | Vodafone Group, ADR |
1,255,356 | ||||||||||||
| 37,224 | Willis Group Holdings |
1,357,187 | ||||||||||||
| Total United Kingdom |
16,008,211 | |||||||||||||
| United States – 3.7% |
||||||||||||||
| 13 | American States Water |
474 | ||||||||||||
| Nuveen Investments | 29 |
Portfolio of Investments (Unaudited)
Nuveen International Fund (continued)
April 30, 2012
| Shares | Description (1) | Value | ||||||||||||
| United States (continued) |
||||||||||||||
| 5,243 | American Tower, Class A |
$ | 343,836 | |||||||||||
| 860 | American Water Works |
29,446 | ||||||||||||
| 1,043 | Aqua America |
23,687 | ||||||||||||
| 958 | Atmos Energy |
31,212 | ||||||||||||
| 59 | Boardwalk Pipeline Partners |
1,630 | ||||||||||||
| 4,351 | Brookfield Infrastructure Partners |
137,231 | ||||||||||||
| 11,765 | Bunge |
758,843 | ||||||||||||
| 705 | California Water Service Group |
12,768 | ||||||||||||
| 368 | Chesapeake Utilities |
15,463 | ||||||||||||
| 1,070 | Covanta Holding |
17,174 | ||||||||||||
| 673 | Dominion Resources |
35,124 | ||||||||||||
| 3,181 | El Paso |
94,380 | ||||||||||||
| 289 | ITC Holdings |
22,386 | ||||||||||||
| 1,588 | Kinder Morgan |
57,009 | ||||||||||||
| 529 | Middlesex Water Company |
9,818 | ||||||||||||
| 4,571 | NiSource |
112,675 | ||||||||||||
| 3,173 | OGE Energy |
171,215 | ||||||||||||
| 326 | ONEOK |
28,000 | ||||||||||||
| 8,072 | Pepco Holdings |
152,722 | ||||||||||||
| 10,316 | Philip Morris International |
923,385 | ||||||||||||
| 1,292 | Piedmont Natural Gas |
39,380 | ||||||||||||
| 462 | Pinnacle West Capital |
22,338 | ||||||||||||
| 8,802 | Questar |
173,840 | ||||||||||||
| 7,446 | Schlumberger |
552,046 | ||||||||||||
| 675 | South Jersey Industries |
33,244 | ||||||||||||
| 6,093 | Spectra Energy |
187,299 | ||||||||||||
| 1,259 | Standard Parking, (2) |
23,997 | ||||||||||||
| 667 | UIL Holdings |
22,925 | ||||||||||||
| 546 | Unitil |
14,447 | ||||||||||||
| 5,137 | Waste Connections |
165,566 | ||||||||||||
| 295 | Westar Energy |
8,464 | ||||||||||||
| 674 | WGL Holdings |
27,034 | ||||||||||||
| 4,626 | Williams |
157,423 | ||||||||||||
| Total United States |
4,406,481 | |||||||||||||
| Total Common Stocks (cost $94,937,420) |
98,894,640 | |||||||||||||
| EXCHANGE-TRADED FUNDS – 6.9% |
||||||||||||||
| United States – 6.9% |
||||||||||||||
| 97,640 | iShares MSCI Malysia Index Fund |
1,416,756 | ||||||||||||
| 55,000 | iShares S&P Global Energy Sector Index Fund |
2,160,950 | ||||||||||||
| 62,478 | Market Vectors Agribusiness ETF |
3,256,978 | ||||||||||||
| 31,966 | Market Vectors Gold Miners ETF |
1,482,903 | ||||||||||||
| Total Exchange-Traded Funds (cost $9,142,530) |
8,317,587 | |||||||||||||
| RIGHTS – 0.0% |
||||||||||||||
| Spain – 0.0% |
||||||||||||||
| 59,182 | Banco Santander, (2), (4) |
15,407 | ||||||||||||
| Total Rights (cost $23,542) |
15,407 | |||||||||||||
| 30 | Nuveen Investments |
| Shares/ Principal Amount (000) |
Description (1) | Coupon | Maturity | Ratings (5) | Value | |||||||||||||||
| SHORT-TERM INVESTMENTS – 9.9% |
||||||||||||||||||||
| Money Market Funds – 2.6% |
||||||||||||||||||||
| 3,070,135 | State Street Institutional Liquid Reserves Fund |
0.210%, | (6) | N/A | N/A | $ | 3,070,135 | |||||||||||||
| U.S. Government and Agency Obligations – 7.3% |
||||||||||||||||||||
| $ | 2,032 | U.S. Treasury Bill, (7) |
0.108% | 8/23/12 | Aaa | 2,031,309 | ||||||||||||||
| 6,740 | U.S. Treasury Bill, (7) |
0.123% | 9/20/12 | Aaa | 6,736,610 | |||||||||||||||
| $ | 8,772 | Total U.S. Government and Agency Obligations |
8,767,919 | |||||||||||||||||
| Total Short-Term Investments (cost $11,839,380) |
11,838,054 | |||||||||||||||||||
| Total Investments (cost $115,942,872) – 99.0% |
119,065,688 | |||||||||||||||||||
| Other Assets Less Liabilities – 1.0% (8) |
1,220,135 | |||||||||||||||||||
| Net Assets – 100.0% |
$ | 120,285,823 | ||||||||||||||||||
Investments in Derivatives at April 30, 2012:
Futures Contracts outstanding:
| Type | Contract Position |
Number of Contracts |
Contract Expiration |
Value | Unrealized Appreciation (Depreciation) |
|||||||||||||||
| Amsterdam Index |
Long | 37 | 5/12 | $ | 2,986,604 | $ | (21,753 | ) | ||||||||||||
| British Pound Currency |
Short | (9 | ) | 6/12 | (912,881 | ) | (31,875 | ) | ||||||||||||
| CAC 40 10 Euro Index |
Long | 15 | 6/12 | 621,873 | (50,279 | ) | ||||||||||||||
| E-Mini MSCI EAFE |
Long | 37 | 6/12 | 2,787,210 | 19,879 | |||||||||||||||
| E-Mini MSCI Emerging Market Index |
Long | 68 | 6/12 | 3,465,960 | (133,095 | ) | ||||||||||||||
| E-Mini MSCI Singapore Index |
Long | 5 | 5/12 | 275,394 | 1,022 | |||||||||||||||
| FTSE 100 Index |
Long | 146 | 6/12 | 13,541,335 | (264,559 | ) | ||||||||||||||
| FTSE/JSE Top 40 |
Short | (120 | ) | 6/12 | (4,720,590 | ) | (54,526 | ) | ||||||||||||
| H-Shares Index |
Short | (50 | ) | 5/12 | (3,548,298 | ) | (75,980 | ) | ||||||||||||
| Kospi2 Index |
Short | (40 | ) | 6/12 | (4,691,516 | ) | (74,523 | ) | ||||||||||||
| Mexican Bolsa Index |
Short | (186 | ) | 6/12 | (5,644,706 | ) | (245,941 | ) | ||||||||||||
| NASDAQ 100 E-Mini |
Short | (126 | ) | 6/12 | (6,852,510 | ) | (113,448 | ) | ||||||||||||
| Nikkei 225 Index |
Long | 204 | 6/12 | 9,664,500 | (210,018 | ) | ||||||||||||||
| OMXS 30 Index |
Long | 292 | 5/12 | 4,550,757 | 50,562 | |||||||||||||||
| Russell 2000 Mini Index |
Short | (70 | ) | 6/12 | (5,704,300 | ) | (95,795 | ) | ||||||||||||
| S&P 500 Index |
Short | (9 | ) | 6/12 | (3,135,600 | ) | (74,173 | ) | ||||||||||||
| S&P/TSX 60 Index |
Short | (48 | ) | 6/12 | (6,787,103 | ) | 92,336 | |||||||||||||
| SGX S&P CNX Nifty |
Short | (45 | ) | 5/12 | (473,985 | ) | (495 | ) | ||||||||||||
| SPI 200 |
Long | 104 | 6/12 | 11,911,768 | 430,297 | |||||||||||||||
| $ | (852,364 | ) | ||||||||||||||||||
| For Fund portfolio compliance purposes, the Fund’s industry classifications refer to any one or more of the industry sub-classifications used by one or more widely recognized market indexes or ratings group indexes, and/or as defined by Fund management. This definition may not apply for purposes of this report which may combine industry sub-classifications into sectors for reporting ease. |
| (1) | All percentages shown in the Portfolio of Investments are based on net assets. |
| (2) | Non-income producing; issuer has not declared a dividend within the past twelve months. |
| (3) | For fair value measurement disclosure purposes, Common Stock categorized as Level 2. See Notes to Financial Statements, Footnote 1 - General Information and Significant Accounting Policies, Investment Valuation for more information. |
| (4) | Investments valued at fair value using methods determined in good faith by, or at the discretion of, the Board of Directors. For fair value measurement disclosure purposes, investment categorized as Level 3. See Notes to Financial Statements, Footnote 1 – General Information and Significant Accounting Policies, Investment Valuation for more information. |
| (5) | Ratings: Using the highest of Standard & Poor’s Group (“Standard & Poor’s”), Moody’s Investors Service, Inc. (“Moody’s”) or Fitch, Inc. (“Fitch”) rating. Ratings below BBB by Standard & Poor’s, Baa by Moody’s or BBB by Fitch are considered to be below investment grade. Holdings designated N/R are not rated by any of these national rating agencies. |
| (6) | The rate shown is the annualized seven-day effective yield as of April 30, 2012. |
| (7) | Investment, or portion of investment, segregated as collateral for investments in derivatives. |
| (8) | Other Assets Less Liabilities includes the net Unrealized Appreciation (Depreciation) of derivatives instruments as listed within Investments in Derivatives at April 30, 2012. |
| N/A | Not applicable |
| ADR | American Depositary Receipt |
| BDR | Brazilian Depositary Receipt |
| ETF | Exchange-Traded Fund |
| GDR | Global Depositary Receipt |
| REIT | Real Estate Investment Trust |
See accompanying notes to financial statements.
| Nuveen Investments | 31 |
Portfolio of Investments (Unaudited)
Nuveen International Select Fund
April 30, 2012
| Shares | Description (1) | Value | ||||||||||||
| COMMON STOCKS – 80.7% |
||||||||||||||
| Argentina – 0.2% |
||||||||||||||
| 58,254 | YPF Sociedad Anonima |
$ | 849,343 | |||||||||||
| Australia – 2.1% |
||||||||||||||
| 26,958 | APA Group |
146,624 | ||||||||||||
| 65,472 | Australian Infrastructure Fund |
152,127 | ||||||||||||
| 36,194 | BHP Billiton |
1,340,672 | ||||||||||||
| 122,357 | DUET Group |
235,856 | ||||||||||||
| 526,564 | Incitec Pivot |
1,794,095 | ||||||||||||
| 19,379 | Macquarie Atlas Roads Group, (2) |
33,418 | ||||||||||||
| 46,365 | Newcrest Mining |
1,270,552 | ||||||||||||
| 28,505 | QR National |
108,111 | ||||||||||||
| 135,338 | Sydney Airport |
410,354 | ||||||||||||
| 253,759 | Transurban Group |
1,552,051 | ||||||||||||
| 52,956 | Woodside Petroleum |
1,926,796 | ||||||||||||
| 65,532 | WorleyParsons |
1,928,938 | ||||||||||||
| Total Australia |
10,899,594 | |||||||||||||
| Austria – 0.0% |
||||||||||||||
| 2,608 | Oesterreichische Post |
92,519 | ||||||||||||
| Belgium – 0.4% |
||||||||||||||
| 28,841 | Anheuser-Busch InBev |
2,078,723 | ||||||||||||
| 1,106 | Elia System Operator |
47,317 | ||||||||||||
| Total Belgium |
2,126,040 | |||||||||||||
| Brazil – 6.5% |
||||||||||||||
| 412,543 | Banco do Brasil |
5,118,507 | ||||||||||||
| 163,448 | Cielo |
4,909,914 | ||||||||||||
| 44,000 | Companhia de Bebidas das Americas, ADR |
1,847,120 | ||||||||||||
| 188,800 | Companhia de Concessoes Rodoviarias |
1,463,927 | ||||||||||||
| 8,811 | Companhia de Saneamento de Minas Gerais |
206,390 | ||||||||||||
| 132,037 | Companhia Energetica de Minas Gerais, ADR |
3,257,353 | ||||||||||||
| 2,951 | Companhia Paranaense de Energia-Copel, ADR |
73,923 | ||||||||||||
| 197,200 | Companhia Siderurgica Nacional, ADR |
1,759,024 | ||||||||||||
| 4,740 | CPFL Energia, ADR |
133,668 | ||||||||||||
| 32,301 | Energias do Brasil |
225,208 | ||||||||||||
| 79,257 | Itau Unibanco Holding, ADR |
1,243,542 | ||||||||||||
| 98,900 | Natura Cosmeticos |
2,234,674 | ||||||||||||
| 288,930 | Redecard |
4,814,111 | ||||||||||||
| 6,808 | Santos Brasil Participacoes |
118,934 | ||||||||||||
| 139,095 | Souza Cruz |
2,161,422 | ||||||||||||
| 177,600 | Vale – ADR |
3,942,720 | ||||||||||||
| 15,276 | Wilson Sons – BDR |
228,401 | ||||||||||||
| Total Brazil |
33,738,838 | |||||||||||||
| Canada – 4.7% |
||||||||||||||
| 23,839 | Agrium |
2,095,448 | ||||||||||||
| 31,306 | Bank of Nova Scotia |
1,736,231 | ||||||||||||
| 12,102 | Brookfield Renewable Energy |
338,981 | ||||||||||||
| 32 | Nuveen Investments |
| Shares | Description (1) | Value | ||||||||||||
| Canada (continued) |
||||||||||||||
| 74,919 | Cameco |
$ | 1,655,710 | |||||||||||
| 63,880 | Canadian Natural Resources |
2,219,326 | ||||||||||||
| 19,597 | Cenovus Energy |
711,193 | ||||||||||||
| 6,355 | Emera |
224,903 | ||||||||||||
| 35,588 | Enbridge |
1,490,781 | ||||||||||||
| 6,431 | Enbridge |
269,453 | ||||||||||||
| 63,227 | EnCana |
1,324,256 | ||||||||||||
| 70,900 | First Quantum Minerals |
1,472,762 | ||||||||||||
| 23,936 | Keyera |
978,666 | ||||||||||||
| 174,780 | Kinross Gold, (3) |
1,565,828 | ||||||||||||
| 298,720 | Lundin Mining, (2) |
1,451,492 | ||||||||||||
| 128,180 | Manulife Financial |
1,752,221 | ||||||||||||
| 57,227 | Suncor Energy |
1,890,780 | ||||||||||||
| 166,600 | Talisman Energy, (3) |
2,178,946 | ||||||||||||
| 2,745 | TransCanada |
120,725 | ||||||||||||
| 4,207 | Veresen |
64,264 | ||||||||||||
| 10,776 | Westshore Terminals Investment |
269,332 | ||||||||||||
| 39,489 | Yamana Gold |
580,488 | ||||||||||||
| Total Canada |
24,391,786 | |||||||||||||
| Chile – 0.4% |
||||||||||||||
| 80,453 | Aguas Andinas, Class A |
53,222 | ||||||||||||
| 205,439 | Empresa Electrica Del Norte Grande |
549,531 | ||||||||||||
| 4,068 | Empresa Nacional de Electrcidad, ADR |
222,194 | ||||||||||||
| 1,555 | Inversiones Aguas Metropolitanas |
2,741 | ||||||||||||
| 19,225 | Sociedad Quimica y Minera de Chile, ADR |
1,120,625 | ||||||||||||
| Total Chile |
1,948,313 | |||||||||||||
| China – 2.8% |
||||||||||||||
| 1,416,000 | Agile Property Holdings |
1,850,611 | ||||||||||||
| 3,841,350 | China Construction Bank, Class H |
2,990,436 | ||||||||||||
| 34,168 | ENN Energy Holdings |
120,225 | ||||||||||||
| 2,490,000 | Industrial & Commercial Bank of China, Class H |
1,662,428 | ||||||||||||
| 73,429 | Jiangsu Expressway, Class H |
72,401 | ||||||||||||
| 23,400 | NetEase.com, ADR, (2) |
1,411,488 | ||||||||||||
| 51,969 | New Oriental Education & Technology Group, ADR |
1,389,131 | ||||||||||||
| 193,000 | Ping An Insurance |
1,614,417 | ||||||||||||
| 64,900 | Tencent Holdings |
2,039,352 | ||||||||||||
| 249,500 | Weichai Power, Class H, (2) |
1,175,362 | ||||||||||||
| Total China |
14,325,851 | |||||||||||||
| Czech Republic – 0.0% |
||||||||||||||
| 2,518 | CEZ |
101,532 | ||||||||||||
| Denmark – 0.3% |
||||||||||||||
| 9,694 | Novo Nordisk, Class B |
1,429,900 | ||||||||||||
| Egypt – 0.9% |
||||||||||||||
| 351,485 | Commercial International Bank |
1,487,863 | ||||||||||||
| 29,908 | Eastern Tobacco |
450,061 | ||||||||||||
| Nuveen Investments | 33 |
Portfolio of Investments (Unaudited)
Nuveen International Select Fund (continued)
April 30, 2012
| Shares | Description (1) | Value | ||||||||||||
| Egypt (continued) |
||||||||||||||
| 18,998 | Mobinil |
$ | 613,442 | |||||||||||
| 43,075 | Orascom Construction Industries |
1,895,079 | ||||||||||||
| Total Egypt |
4,446,445 | |||||||||||||
| Finland – 0.2% |
||||||||||||||
| 4,232 | Fortum Oyj |
91,031 | ||||||||||||
| 290,719 | Nokia Oyj |
1,044,412 | ||||||||||||
| Total Finland |
1,135,443 | |||||||||||||
| France – 2.2% |
||||||||||||||
| 3,821 | Aeroports de Paris |
321,477 | ||||||||||||
| 32,650 | Alstom |
1,166,041 | ||||||||||||
| 97,777 | AXA |
1,384,870 | ||||||||||||
| 71,494 | Carrefour |
1,436,107 | ||||||||||||
| 27,469 | CFAO |
1,184,629 | ||||||||||||
| 19,323 | DANONE |
1,359,460 | ||||||||||||
| 4,858 | Eutelsat Communications |
172,917 | ||||||||||||
| 18,135 | GDF Suez |
417,451 | ||||||||||||
| 2,836 | Groupe Eurotunnel |
23,864 | ||||||||||||
| 14,159 | L’oreal |
1,703,481 | ||||||||||||
| 7,065 | Rubis |
384,224 | ||||||||||||
| 25,953 | Total SA |
1,239,145 | ||||||||||||
| 8,153 | Vinci |
377,724 | ||||||||||||
| Total France |
11,171,390 | |||||||||||||
| Germany – 4.2% |
||||||||||||||
| 43,064 | Adidas |
3,591,232 | ||||||||||||
| 75,970 | Aixtron |
1,391,265 | ||||||||||||
| 24,324 | Allianz |
2,710,394 | ||||||||||||
| 6,391 | BASF |
526,112 | ||||||||||||
| 20,227 | Bayer |
1,424,667 | ||||||||||||
| 12,752 | BMW |
1,212,137 | ||||||||||||
| 23,320 | Daimler |
1,289,227 | ||||||||||||
| 17,234 | Deutsche Boerse |
1,082,001 | ||||||||||||
| 89,770 | E.ON |
2,033,746 | ||||||||||||
| 2,447 | Fraport Frankfurt Airport |
159,007 | ||||||||||||
| 4,924 | Hamburger Hafen und Logistik |
163,273 | ||||||||||||
| 27,956 | Henkel KGAA |
2,079,696 | ||||||||||||
| 25,295 | Siemens |
2,342,799 | ||||||||||||
| 61,460 | Symrise |
1,781,662 | ||||||||||||
| Total Germany |
21,787,218 | |||||||||||||
| Hong Kong – 2.8% |
||||||||||||||
| 39,342 | Beijing Enterprises Holdings |
220,070 | ||||||||||||
| 111,983 | Cheung Kong Holdings |
1,489,518 | ||||||||||||
| 110,912 | Cheung Kong Infrastructure Holdings |
658,297 | ||||||||||||
| 423,373 | China Everbright International |
200,810 | ||||||||||||
| 2,320,000 | China Longyuan Power, Class H |
1,832,999 | ||||||||||||
| 241,091 | China Merchants Holdings International |
779,953 | ||||||||||||
| 34 | Nuveen Investments |
| Shares | Description (1) | Value | ||||||||||||
| Hong Kong (continued) |
||||||||||||||
| 46,311 | China Mobile Limited |
$ | 2,562,851 | |||||||||||
| 952,000 | China Resources Land |
1,833,164 | ||||||||||||
| 824,000 | China Unicom |
1,465,616 | ||||||||||||
| 168,294 | COSCO Pacific |
245,110 | ||||||||||||
| 294,345 | Guangdong Investment |
216,624 | ||||||||||||
| 108,118 | Hong Kong & China Gas |
276,473 | ||||||||||||
| 2,122,000 | Huabao International Holdings, (4) |
763,905 | ||||||||||||
| 516,000 | Li & Fung |
1,104,006 | ||||||||||||
| 69,995 | MTR |
248,995 | ||||||||||||
| 53,254 | NWS Holdings |
80,444 | ||||||||||||
| 57,706 | Power Assets Holdings |
431,383 | ||||||||||||
| 120,787 | Towngas China |
85,624 | ||||||||||||
| Total Hong Kong |
14,495,842 | |||||||||||||
| Hungary – 0.4% |
||||||||||||||
| 116,758 | OTP Bank |
2,053,514 | ||||||||||||
| India – 1.8% |
||||||||||||||
| 172,631 | Bank of India |
1,157,971 | ||||||||||||
| 335,945 | Bharat Heavy Electricals |
1,432,707 | ||||||||||||
| 3,482 | GAIL India, GDR |
130,575 | ||||||||||||
| 49,880 | HDFC Bank, ADR |
1,712,380 | ||||||||||||
| 17,400 | Infosys Technologies, ADR |
823,890 | ||||||||||||
| 145,073 | Jindal Steel & Power |
1,387,415 | ||||||||||||
| 59,780 | Power Grid |
126,196 | ||||||||||||
| 138,248 | Punjab National Bank |
2,230,200 | ||||||||||||
| 3,134 | Tata Consultancy Services |
74,132 | ||||||||||||
| Total India |
9,075,466 | |||||||||||||
| Indonesia – 1.8% |
||||||||||||||
| 2,172,066 | Bank of Mandiri |
1,748,928 | ||||||||||||
| 2,732,500 | Perusahaan Gas Negara |
996,015 | ||||||||||||
| 889,300 | Semen Gresik Persero |
1,175,670 | ||||||||||||
| 419,700 | Tambang Batubara Bukit Asam |
842,521 | ||||||||||||
| 94,200 | Telekomunikasi Indonesia, ADR |
3,410,982 | ||||||||||||
| 369,519 | United Tractors |
1,190,118 | ||||||||||||
| Total Indonesia |
9,364,234 | |||||||||||||
| Ireland – 0.8% |
||||||||||||||
| 59,750 | Covidien |
3,299,993 | ||||||||||||
| 77,597 | WPP |
1,049,646 | ||||||||||||
| Total Ireland |
4,349,639 | |||||||||||||
| Israel – 0.6% |
||||||||||||||
| 38,666 | NICE Systems, ADR, (2) |
1,485,548 | ||||||||||||
| 29,988 | Teva Pharmaceutical Industries, ADR |
1,371,651 | ||||||||||||
| Total Israel |
2,857,199 | |||||||||||||
| Italy – 1.1% |
||||||||||||||
| 60,543 | Atlantia |
917,610 | ||||||||||||
| 17,620 | Autostrada Torino-Milano |
95,393 | ||||||||||||
| Nuveen Investments | 35 |
Portfolio of Investments (Unaudited)
Nuveen International Select Fund (continued)
April 30, 2012
| Shares | Description (1) | Value | ||||||||||||
| Italy (continued) |
||||||||||||||
| 73,570 | Hera |
$ | 110,531 | |||||||||||
| 47,703 | IREN |
31,560 | ||||||||||||
| 269,800 | Prada, (2) |
1,832,595 | ||||||||||||
| 48,186 | Saipem |
2,380,406 | ||||||||||||
| 37,218 | Snam |
177,060 | ||||||||||||
| 10,297 | Societa Iniziative Autostradali e Servizi |
64,470 | ||||||||||||
| 15,201 | Terna-Rete Elettrica Nazionale |
56,541 | ||||||||||||
| Total Italy |
5,666,166 | |||||||||||||
| Japan – 8.0% |
||||||||||||||
| 201,732 | AMADA |
1,379,580 | ||||||||||||
| 31,566 | Canon |
1,450,992 | ||||||||||||
| 47,600 | DeNA |
1,492,270 | ||||||||||||
| 6,900 | FANUC |
1,174,486 | ||||||||||||
| 330 | INPEX |
2,190,631 | ||||||||||||
| 11,434 | Japan Airport Terminal |
156,960 | ||||||||||||
| 8,750 | Kamigumi |
70,469 | ||||||||||||
| 71,700 | KOMATSU |
2,078,977 | ||||||||||||
| 125,648 | Mitsubishi |
2,743,042 | ||||||||||||
| 80,885 | Mitsui Sumitomo Insurance Group |
1,502,411 | ||||||||||||
| 13,116 | Nintendo |
1,790,636 | ||||||||||||
| 98,102 | NKSJ Holdings |
2,033,552 | ||||||||||||
| 1,657 | Rakuten |
1,847,107 | ||||||||||||
| 27,552 | SECOM |
1,311,343 | ||||||||||||
| 18,535 | SMC |
3,113,156 | ||||||||||||
| 31,483 | Sugi Holdings |
1,020,516 | ||||||||||||
| 117,385 | Sumitomo Metal Mining |
1,552,587 | ||||||||||||
| 773,669 | Sumitomo Mitsui Trust |
2,286,897 | ||||||||||||
| 145,580 | Suzuki Motor |
3,458,984 | ||||||||||||
| 29,700 | TERUMO |
1,367,078 | ||||||||||||
| 605,178 | The Bank of Yokohama |
2,948,575 | ||||||||||||
| 59,106 | THK |
1,187,450 | ||||||||||||
| 75,100 | Toyota Motor |
3,108,786 | ||||||||||||
| Total Japan |
41,266,485 | |||||||||||||
| Luxembourg – 0.5% |
||||||||||||||
| 14,567 | Millicom International Cellular |
1,547,444 | ||||||||||||
| 27,255 | Oriflame Cosmetics – SDR |
979,693 | ||||||||||||
| 2,184 | SES |
52,297 | ||||||||||||
| Total Luxembourg |
2,579,434 | |||||||||||||
| Malaysia – 0.4% |
||||||||||||||
| 65,400 | British American Tobacco |
1,200,369 | ||||||||||||
| 237,580 | Sime Darby Berhad |
764,716 | ||||||||||||
| Total Malaysia |
1,965,085 | |||||||||||||
| Mexico – 1.8% |
||||||||||||||
| 85,800 | America Movil, Series L, ADR |
2,286,570 | ||||||||||||
| 5,200 | Desarrolladora Homex, ADR, (2) |
87,412 | ||||||||||||
| 36 | Nuveen Investments |
| Shares | Description (1) | Value | ||||||||||||
| Mexico (continued) |
||||||||||||||
| 871,517 | Grupo Mexico, Series B |
$ | 2,686,284 | |||||||||||
| 70,400 | Grupo Televisa, ADR |
1,546,688 | ||||||||||||
| 548,100 | Kimberly-Clark de Mexico, Series A |
1,117,159 | ||||||||||||
| 139,937 | OHL Mexico, (2) |
221,305 | ||||||||||||
| 48,655 | Wal-Mart de Mexico, ADR |
1,389,100 | ||||||||||||
| Total Mexico |
9,334,518 | |||||||||||||
| Netherlands – 0.8% |
||||||||||||||
| 66,873 | Heineken |
3,657,186 | ||||||||||||
| 3,717 | Koninklijke Vopak |
239,588 | ||||||||||||
| Total Netherlands |
3,896,774 | |||||||||||||
| New Zealand – 0.1% |
||||||||||||||
| 82,367 | Auckland International Airport |
170,409 | ||||||||||||
| 110,409 | Infratil |
171,093 | ||||||||||||
| 31,376 | Port of Tauranga |
295,063 | ||||||||||||
| 5,250 | Vector |
11,334 | ||||||||||||
| Total New Zealand |
647,899 | |||||||||||||
| Norway – 0.8% |
||||||||||||||
| 9,658 | Hafslund, Class B, (3) |
91,130 | ||||||||||||
| 432,014 | Norsk Hydro, (3) |
2,101,586 | ||||||||||||
| 118,060 | Telenor ASA, (3) |
2,170,194 | ||||||||||||
| Total Norway |
4,362,910 | |||||||||||||
| Philippines – 0.7% |
||||||||||||||
| 181,567 | International Container Terminal Services |
292,434 | ||||||||||||
| 51,300 | Philippine Long Distance Telephone – ADR |
3,114,936 | ||||||||||||
| Total Philippines |
3,407,370 | |||||||||||||
| Poland – 0.0% |
||||||||||||||
| 15,043 | PGE |
90,068 | ||||||||||||
| Portugal – 0.0% |
||||||||||||||
| 27,535 | Brisa Auto-Estradas de Portugal |
96,587 | ||||||||||||
| Russia – 2.5% |
||||||||||||||
| 167,187 | Gazprom OAO, ADR |
1,929,338 | ||||||||||||
| 21,100 | LUKOIL, ADR |
1,294,485 | ||||||||||||
| 43,971 | Magnit, 144A, GDR |
1,104,982 | ||||||||||||
| 155,450 | Mobile TeleSystems – ADR |
3,040,602 | ||||||||||||
| 986,679 | Sberbank |
3,156,633 | ||||||||||||
| 408,336 | TNK-BP Holding, (3) |
1,213,289 | ||||||||||||
| 34,924 | Uralkali – GDR, Class S, (3) |
1,321,873 | ||||||||||||
| Total Russia |
13,061,202 | |||||||||||||
| Singapore – 0.4% |
||||||||||||||
| 352,743 | CitySpring Infrastructure Trust |
112,593 | ||||||||||||
| 56,651 | ComfortDelGro |
70,041 | ||||||||||||
| 1,084,276 | Golden Agri-Resources |
643,994 | ||||||||||||
| 212,128 | Hutchison Port Holdings Trust |
160,157 | ||||||||||||
| 44,536 | Hyflux |
51,644 | ||||||||||||
| 106,631 | Parkway Life, REIT |
159,408 | ||||||||||||
| Nuveen Investments | 37 |
Portfolio of Investments (Unaudited)
Nuveen International Select Fund (continued)
April 30, 2012
| Shares | Description (1) | Value | ||||||||||||
| Singapore (continued) |
||||||||||||||
| 39,579 | Singapore Airport Terminal Services |
$ | 83,476 | |||||||||||
| 411,439 | Singapore Post |
337,463 | ||||||||||||
| 77,590 | Singapore Telecommunications |
195,621 | ||||||||||||
| 234,186 | SMRT |
317,925 | ||||||||||||
| Total Singapore |
2,132,322 | |||||||||||||
| South Africa – 3.9% |
||||||||||||||
| 98,397 | Bidvest Group |
2,327,219 | ||||||||||||
| 23,251 | Massmart Holdings |
499,816 | ||||||||||||
| 135,040 | MTN Group |
2,360,705 | ||||||||||||
| 390,463 | Murray & Roberts Holdings |
1,436,102 | ||||||||||||
| 73,461 | Nedbank Group |
1,601,640 | ||||||||||||
| 334,892 | Pretoria Portland Cement |
1,334,681 | ||||||||||||
| 307,020 | Sanlam |
1,320,762 | ||||||||||||
| 170,221 | Shoprite Holdings |
2,943,094 | ||||||||||||
| 94,427 | Standard Bank Group |
1,393,935 | ||||||||||||
| 46,370 | Tiger Brands |
1,700,097 | ||||||||||||
| 177,636 | Truworths International |
1,896,710 | ||||||||||||
| 73,374 | Vodacom Group |
1,020,375 | ||||||||||||
| 56,937 | Woolworths Holdings |
356,051 | ||||||||||||
| Total South Africa |
20,191,187 | |||||||||||||
| South Korea – 4.9% |
||||||||||||||
| 19,775 | Hite Jinro |
428,703 | ||||||||||||
| 15,154 | Hyundai Mobis |
4,123,348 | ||||||||||||
| 60,550 | KB Financial Group |
2,062,759 | ||||||||||||
| 311,302 | Korea Life Insurance |
1,881,378 | ||||||||||||
| 45,360 | KT&G |
3,114,643 | ||||||||||||
| 9,751 | NHN |
2,208,832 | ||||||||||||
| 3,517 | Samsung Electronics, GDR |
2,162,871 | ||||||||||||
| 3,559 | Samsung Electronics, GDR |
4,377,401 | ||||||||||||
| 96,006 | Shinhan Financial Group, ADR |
3,355,591 | ||||||||||||
| 49,157 | Woongjin Coway |
1,574,590 | ||||||||||||
| Total South Korea |
25,290,116 | |||||||||||||
| Spain – 0.9% |
||||||||||||||
| 46,004 | Abertis Infraestructuras |
711,867 | ||||||||||||
| 144,148 | Banco Santander |
900,617 | ||||||||||||
| 3,576 | Enagas |
62,838 | ||||||||||||
| 108,133 | Ferrovial |
1,204,054 | ||||||||||||
| 75,890 | Grifols, (2) |
1,911,163 | ||||||||||||
| Total Spain |
4,790,539 | |||||||||||||
| Sweden – 0.4% |
||||||||||||||
| 215,723 | Ericsson |
2,137,556 | ||||||||||||
| Switzerland – 5.5% |
||||||||||||||
| 90,312 | ABB |
1,645,745 | ||||||||||||
| 23,838 | Adecco |
1,160,843 | ||||||||||||
| 21,467 | Compagnie Financiere Richemont |
1,326,832 | ||||||||||||
| 38 | Nuveen Investments |
| Shares | Description (1) | Value | ||||||||||||
| Switzerland (continued) |
||||||||||||||
| 48,151 | Credit Suisse Group, (2) |
$ | 1,151,719 | |||||||||||
| 1,924 | Flughafen Zuerich |
716,479 | ||||||||||||
| 83,583 | Foster Wheeler, (2) |
1,922,409 | ||||||||||||
| 28,206 | Holcim |
1,755,786 | ||||||||||||
| 52,749 | Nestle |
3,231,250 | ||||||||||||
| 52,210 | Noble |
1,987,113 | ||||||||||||
| 55,457 | Novartis |
3,058,032 | ||||||||||||
| 31,940 | Roche Holding |
5,834,465 | ||||||||||||
| 98,176 | UBS, (2) |
1,225,510 | ||||||||||||
| 187,649 | Xstrata |
3,585,912 | ||||||||||||
| Total Switzerland |
28,602,095 | |||||||||||||
| Taiwan – 2.0% |
||||||||||||||
| 166,000 | Hiwin Technologies |
1,574,268 | ||||||||||||
| 928,497 | Hon Hai Precision Industry |
2,937,267 | ||||||||||||
| 125,706 | HTC |
1,906,554 | ||||||||||||
| 122,150 | MediaTek |
1,058,046 | ||||||||||||
| 927,961 | Taiwan Semiconductor Manufacturing |
2,757,658 | ||||||||||||
| Total Taiwan |
10,233,793 | |||||||||||||
| Thailand – 0.8% |
||||||||||||||
| 34,900 | Banpu Public |
631,037 | ||||||||||||
| 670,400 | CP ALL |
1,667,824 | ||||||||||||
| 38,400 | PTT Exploration and Production Public Company |
221,659 | ||||||||||||
| 110,900 | Siam Cement |
1,507,519 | ||||||||||||
| Total Thailand |
4,028,039 | |||||||||||||
| Turkey – 1.9% |
||||||||||||||
| 334,081 | Akbank T.A.S. |
1,240,260 | ||||||||||||
| 413,264 | Koc Holding |
1,534,224 | ||||||||||||
| 208,300 | Turkcell Iletisim Hizmetleri – ADR |
2,574,588 | ||||||||||||
| 456,910 | Turkiye Garanti Bankasi |
1,680,648 | ||||||||||||
| 1,113,250 | Turkiye Is Bankasi, Class C |
2,548,193 | ||||||||||||
| Total Turkey |
9,577,913 | |||||||||||||
| United Kingdom – 7.5% |
||||||||||||||
| 356,008 | Aberdeen Asset Management |
1,637,967 | ||||||||||||
| 106,948 | Anglo American |
4,110,047 | ||||||||||||
| 124,092 | ARM Holdings |
1,055,279 | ||||||||||||
| 92,725 | BG Group |
2,182,765 | ||||||||||||
| 44,511 | BP, ADR |
1,932,223 | ||||||||||||
| 172,537 | Diageo |
4,342,966 | ||||||||||||
| 166,015 | GlaxoSmithKline |
3,839,323 | ||||||||||||
| 37,553 | HSBC Holdings, ADR |
1,696,269 | ||||||||||||
| 19,747 | National Grid, ADR |
1,068,115 | ||||||||||||
| 158,251 | Prudential |
1,937,752 | ||||||||||||
| 169,806 | Rolls-Royce Group |
2,269,389 | ||||||||||||
| 82,927 | Stagecoach Group |
333,764 | ||||||||||||
| Nuveen Investments | 39 |
Portfolio of Investments (Unaudited)
Nuveen International Select Fund (continued)
April 30, 2012
| Shares | Description (1) | Value | ||||||||||||
| United Kingdom (continued) |
||||||||||||||
| 99,552 | Standard Chartered |
$ | 2,433,141 | |||||||||||
| 235,775 | Tesco |
1,214,307 | ||||||||||||
| 21,822 | United Utilities Group |
219,042 | ||||||||||||
| 105,356 | Vedanta Resources |
2,080,857 | ||||||||||||
| 109,873 | Vodafone Group, ADR |
3,057,766 | ||||||||||||
| 90,660 | Willis Group Holdings |
3,305,464 | ||||||||||||
| Total United Kingdom |
38,716,436 | |||||||||||||
| United States – 2.7% |
||||||||||||||
| 51 | American States Water |
1,858 | ||||||||||||
| 20,666 | American Tower, Class A |
1,355,276 | ||||||||||||
| 3,388 | American Water Works |
116,005 | ||||||||||||
| 4,110 | Aqua America |
93,338 | ||||||||||||
| 3,777 | Atmos Energy |
123,055 | ||||||||||||
| 232 | Boardwalk Pipeline Partners |
6,410 | ||||||||||||
| 17,125 | Brookfield Infrastructure Partners |
540,122 | ||||||||||||
| 28,660 | Bunge |
1,848,570 | ||||||||||||
| 2,778 | California Water Service Group |
50,310 | ||||||||||||
| 1,447 | Chesapeake Utilities |
60,803 | ||||||||||||
| 4,218 | Covanta Holding |
67,699 | ||||||||||||
| 2,647 | Dominion Resources |
138,147 | ||||||||||||
| 12,522 | El Paso |
371,528 | ||||||||||||
| 1,135 | ITC Holdings |
87,917 | ||||||||||||
| 6,256 | Kinder Morgan |
224,590 | ||||||||||||
| 2,083 | Middlesex Water Company |
38,660 | ||||||||||||
| 17,995 | NiSource |
443,577 | ||||||||||||
| 12,506 | OGE Energy |
674,824 | ||||||||||||
| 1,283 | ONEOK |
110,197 | ||||||||||||
| 31,795 | Pepco Holdings |
601,561 | ||||||||||||
| 25,139 | Philip Morris International |
2,250,192 | ||||||||||||
| 5,089 | Piedmont Natural Gas |
155,113 | ||||||||||||
| 1,816 | Pinnacle West Capital |
87,804 | ||||||||||||
| 34,638 | Questar |
684,100 | ||||||||||||
| 18,140 | Schlumberger |
1,344,900 | ||||||||||||
| 2,663 | South Jersey Industries |
131,153 | ||||||||||||
| 24,001 | Spectra Energy |
737,791 | ||||||||||||
| 4,960 | Standard Parking, (2) |
94,538 | ||||||||||||
| 2,628 | UIL Holdings |
90,324 | ||||||||||||
| 2,147 | Unitil |
56,810 | ||||||||||||
| 20,237 | Waste Connections |
652,238 | ||||||||||||
| 1,161 | Westar Energy |
33,309 | ||||||||||||
| 2,656 | WGL Holdings |
106,532 | ||||||||||||
| 18,208 | Williams |
619,618 | ||||||||||||
| Total United States |
13,998,869 | |||||||||||||
| Total Common Stocks (cost $391,982,326) |
416,713,469 | |||||||||||||
| 40 | Nuveen Investments |
| Shares | Description (1) | Value | ||||||||||||||||||
| EXCHANGE-TRADED FUNDS – 6.8% |
||||||||||||||||||||
| United States – 6.8% |
||||||||||||||||||||
| 400,000 | iShares MSCI Malaysia Index Fund |
$ | 5,804,000 | |||||||||||||||||
| 190,000 | iShares S&P Global Energy Sector Index Fund |
7,465,100 | ||||||||||||||||||
| 150,000 | Market Vectors Agribusiness ETF |
7,819,500 | ||||||||||||||||||
| 90,000 | Market Vectors Gold Miners ETF |
4,175,100 | ||||||||||||||||||
| 325,000 | Market Vectors Russia ETF |
9,733,750 | ||||||||||||||||||
| Total Exchange-Traded Funds (cost $37,063,757) |
34,997,450 | |||||||||||||||||||
| RIGHTS – 0.0% |
||||||||||||||||||||
| Spain – 0.0% |
||||||||||||||||||||
| 144,148 | Banco Santander, (2), (4) |
37,526 | ||||||||||||||||||
| Total Rights (cost $56,916) |
37,526 | |||||||||||||||||||
| Shares/ Principal Amount (000) |
Description (1) | Coupon | Maturity | Ratings (5) | Value | |||||||||||||||
| SHORT-TERM INVESTMENTS – 12.1% |
||||||||||||||||||||
| Money Market Funds – 6.3% |
||||||||||||||||||||
| 32,740,867 | State Street Institutional Liquid Reserves Fund |
0.210% | (6) | N/A | N/A | $ | 32,740,867 | |||||||||||||
| U.S. Government and Agency Obligations – 5.8% |
||||||||||||||||||||
| $ | 5,025 | U.S. Treasury Bill, (7) |
0.108% | 8/23/12 | Aaa | 5,023,292 | ||||||||||||||
| 24,750 | U.S. Treasury Bill, (7) |
0.123% | 9/20/12 | Aaa | 24,737,551 | |||||||||||||||
| $ | 29,775 | Total U.S. Government and Agency Obligations |
29,760,843 | |||||||||||||||||
| Total Short-Term Investments (cost $62,506,009) |
62,501,710 | |||||||||||||||||||
| Total Investments (cost $491,609,008) – 99.6% |
514,250,155 | |||||||||||||||||||
| Other Assets Less Liabilities – 0.4% (8) |
1,998,753 | |||||||||||||||||||
| Net Assets – 100.0% |
$ | 516,248,908 | ||||||||||||||||||
| Nuveen Investments | 41 |
Portfolio of Investments (Unaudited)
Nuveen International Select Fund (continued)
April 30, 2012
Investments in Derivatives at April 30, 2012:
Futures Contracts outstanding:
| Type | Contract Position |
Number of Contracts |
Contract Expiration |
Value | Unrealized Appreciation (Depreciation) |
|||||||||||||||
| Amsterdam Index |
Long | 29 | 5/12 | $ | 2,340,852 | $ | (17,049 | ) | ||||||||||||
| Australian Dollar Currency |
Short | (135 | ) | 6/12 | (13,996,800 | ) | (52,535 | ) | ||||||||||||
| British Pound Currency |
Short | (9 | ) | 6/12 | (912,881 | ) | (31,875 | ) | ||||||||||||
| CAC 40 10 Euro Index |
Long | 120 | 6/12 | 4,974,982 | (402,232 | ) | ||||||||||||||
| DAX Index |
Short | (12 | ) | 6/12 | (2,690,414 | ) | 43,048 | |||||||||||||
| Dollar Index |
Long | 240 | 6/12 | 18,923,522 | (505,440 | ) | ||||||||||||||
| E-Mini MSCI EAFE |
Long | 51 | 6/12 | 3,841,830 | (53,438 | ) | ||||||||||||||
| E-Mini MSCI Emerging Markets Index |
Short | (169 | ) | 6/12 | (8,613,930 | ) | 329,553 | |||||||||||||
| Euro FX Currency |
Short | (24 | ) | 6/12 | (3,972,600 | ) | (64,150 | ) | ||||||||||||
| FTSE 100 Index |
Long | 340 | 6/12 | 31,534,617 | (616,098 | ) | ||||||||||||||
| FTSE/JSE Top 40 |
Short | (481 | ) | 6/12 | (18,921,699 | ) | (218,560 | ) | ||||||||||||
| H-Shares Index |
Long | 30 | 5/12 | 2,128,979 | 45,237 | |||||||||||||||
| Kospi2 Index |
Short | (42 | ) | 6/12 | (4,926,092 | ) | (78,249 | ) | ||||||||||||
| Mexican Bolsa Index |
Short | (334 | ) | 6/12 | (10,136,193 | ) | (239,045 | ) | ||||||||||||
| MSCI Taiwan Index |
Long | 275 | 5/12 | 7,356,250 | (89,513 | ) | ||||||||||||||
| NASDAQ 100 E-Mini |
Short | (432 | ) | 6/12 | (23,494,320 | ) | (651,456 | ) | ||||||||||||
| Nikkei 225 Index |
Long | 484 | 6/12 | 22,929,500 | (498,278 | ) | ||||||||||||||
| OMXS 30 Index |
Long | 815 | 5/12 | 12,701,598 | 141,123 | |||||||||||||||
| Russell 2000 Mini Index |
Short | (176 | ) | 6/12 | (14,342,240 | ) | (240,856 | ) | ||||||||||||
| S&P 500 Index |
Short | (19 | ) | 6/12 | (6,619,600 | ) | (156,589 | ) | ||||||||||||
| S&P/TSX 60 Index |
Long | 198 | 6/12 | 27,996,801 | (382,771 | ) | ||||||||||||||
| SET50 Index |
Short | (100 | ) | 6/12 | (2,806,829 | ) | (55,855 | ) | ||||||||||||
| SGX S&P CNX Nifty |
Short | (130 | ) | 5/12 | (1,369,290 | ) | (1,430 | ) | ||||||||||||
| SPI 200 |
Long | 303 | 6/12 | 34,704,477 | 1,253,655 | |||||||||||||||
| $ | (2,542,803 | ) | ||||||||||||||||||
| For Fund portfolio compliance purposes, the Fund’s industry classifications refer to any one or more of the industry sub-classifications used by one or more widely recognized market indexes or ratings group indexes, and/or as defined by Fund management. This definition may not apply for purposes of this report which may combine industry sub-classifications into sectors for reporting ease. |
| (1) | All percentages shown in the Portfolio of Investments are based on net assets. |
| (2) | Non-income producing; issuer has not declared a dividend within the past twelve months. |
| (3) | For fair value measurement disclosure purposes, Common Stock categorized as Level 2. See Notes to Financial Statements, Footnote 1 – General Information and Significant Accounting Policies, Investment Valuation for more information. |
| (4) | Investment valued at fair value using methods determined in good faith by, or at the discretion of, the Board of Directors. For fair value measurement disclosure purposes, investment categorized as Level 3. See Notes to Financial Statements, Footnote 1 – General Information and Significant Accounting Policies, Investment Valuation for more information. |
| (5) | Ratings: Using the highest of Standard & Poor’s Group (“Standard & Poor’s”), Moody’s Investors Service, Inc. (“Moody’s”) or Fitch, Inc. (“Fitch”) rating. Ratings below BBB by Standard & Poor’s, Baa by Moody’s or BBB by Fitch are considered to be below investment grade. Holdings designated N/R are not rated by any of these national rating agencies. |
| (6) | The rate shown is the annualized seven-day effective yield as of April 30, 2012. |
| (7) | Investment, or portion of investment, segregated as collateral for investments in derivatives. |
| (8) | Other Assets Less Liabilities includes the net Unrealized Appreciation (Depreciation) of derivatives instruments as listed within Investments in Derivatives at April 30, 2012. |
| N/A | Not applicable |
| 144A | Investment is exempt from registration under Rule 144A of the Securities Act of 1933, as amended. These investments may only be resold in transactions exempt from registration, which are normally those transactions with qualified institutional buyers. |
| ADR | American Depositary Receipt |
| BDR | Brazilian Depositary Receipt |
| ETF | Exchange-Traded Fund |
| GDR | Global Depositary Receipt |
| REIT | Real Estate Investment Trust |
| SDR | Swedish Depositary Receipt |
See accompanying notes to financial statements.
| 42 | Nuveen Investments |
Portfolio of Investments (Unaudited)
Nuveen Quantitative Enhanced Core Equity Fund
April 30, 2012
| Shares | Description (1) | Value | ||||||||||||
| COMMON STOCKS – 94.5% |
||||||||||||||
| Consumer Discretionary – 6.7% |
||||||||||||||
| 2,318 | Amazon.com, Inc., (2) |
$ | 537,544 | |||||||||||
| 4,607 | Apollo Group, Inc., (2) |
162,259 | ||||||||||||
| 1,510 | AutoNation Inc., (2), (3) |
52,216 | ||||||||||||
| 211 | AutoZone, Inc., (2) |
83,590 | ||||||||||||
| 1,810 | Bed Bath and Beyond Inc., (2), (3) |
127,406 | ||||||||||||
| 19,573 | Career Education Corporation, (2), (3) |
139,555 | ||||||||||||
| 6,965 | Comcast Corporation, Class A, (3) |
211,248 | ||||||||||||
| 5,926 | Devry, Inc. |
190,521 | ||||||||||||
| 6,375 | Education Management Corporation, (3) |
79,050 | ||||||||||||
| 874 | Family Dollar Stores, Inc. |
59,039 | ||||||||||||
| 50,385 | Ford Motor Company, (3) |
568,343 | ||||||||||||
| 8,510 | General Motors Company, (2), (3) |
195,730 | ||||||||||||
| 10,130 | Home Depot, Inc. |
524,633 | ||||||||||||
| 3,118 | Interpublic Group Companies, Inc. |
36,824 | ||||||||||||
| 5,575 | Johnson Controls, Inc. |
178,233 | ||||||||||||
| 1,910 | Kohl’s Corporation, (3) |
95,748 | ||||||||||||
| 7,282 | Lowe’s Companies, Inc. |
229,165 | ||||||||||||
| 3,165 | Macy’s, Inc., (3) |
129,828 | ||||||||||||
| 6,130 | McDonald’s Corporation |
597,369 | ||||||||||||
| 31,725 | News Corporation, Class A |
621,810 | ||||||||||||
| 357 | Nike, Inc., Class B |
39,938 | ||||||||||||
| 3,856 | Omnicom Group, Inc., (3) |
197,851 | ||||||||||||
| 131 | Priceline.com Incorporated, (2), (3) |
99,667 | ||||||||||||
| 4,965 | Signet Jewelers Limited, (3) |
242,143 | ||||||||||||
| 2,123 | Staples, Inc., (3) |
32,694 | ||||||||||||
| 6,878 | Target Corporation |
398,511 | ||||||||||||
| 4,468 | Time Warner Inc. |
167,371 | ||||||||||||
| 519 | TJX Companies, Inc., (3) |
21,647 | ||||||||||||
| 1,389 | Viacom Inc., Class B |
64,436 | ||||||||||||
| 2,812 | Walt Disney Company, (3) |
121,225 | ||||||||||||
| Total Consumer Discretionary |
6,205,594 | |||||||||||||
| Consumer Staples – 5.5% |
||||||||||||||
| 11,520 | Altria Group, Inc. |
371,059 | ||||||||||||
| 6,676 | Archer-Daniels-Midland Company |
205,821 | ||||||||||||
| 10,345 | Coca-Cola Company |
789,530 | ||||||||||||
| 1,127 | Colgate-Palmolive Company |
111,505 | ||||||||||||
| 4,767 | Constellation Brands, Inc., Class A, (2), (3) |
102,967 | ||||||||||||
| 224 | Costco Wholesale Corporation |
19,750 | ||||||||||||
| 4,686 | CVS Caremark Corporation |
209,089 | ||||||||||||
| 303 | General Mills, Inc. |
11,784 | ||||||||||||
| 3,569 | PepsiCo, Inc. |
235,554 | ||||||||||||
| 8,312 | Philip Morris International |
744,007 | ||||||||||||
| 20,688 | Procter & Gamble Company |
1,316,584 | ||||||||||||
| 4,824 | Tyson Foods, Inc., Class A |
88,038 | ||||||||||||
| Nuveen Investments | 43 |
Portfolio of Investments (Unaudited)
Nuveen Quantitative Enhanced Core Equity Fund (continued)
April 30, 2012
| Shares | Description (1) | Value | ||||||||||||
| Consumer Staples (continued) |
||||||||||||||
| 4,338 | Walgreen Co., (3) |
$ | 152,090 | |||||||||||
| 13,170 | Wal-Mart Stores, Inc., (3) |
775,845 | ||||||||||||
| Total Consumer Staples |
5,133,623 | |||||||||||||
| Energy – 12.8% |
||||||||||||||
| 3,702 | Anadarko Petroleum Corporation |
271,023 | ||||||||||||
| 4,314 | Apache Corporation |
413,885 | ||||||||||||
| 3,448 | Baker Hughes Incorporated |
152,091 | ||||||||||||
| 7,185 | Chesapeake Energy Corporation |
132,491 | ||||||||||||
| 21,124 | Chevron Corporation, (3) |
2,250,973 | ||||||||||||
| 13,603 | ConocoPhillips |
974,383 | ||||||||||||
| 7,330 | Devon Energy Corporation |
512,001 | ||||||||||||
| 3,852 | El Paso Corporation |
114,289 | ||||||||||||
| 403 | EOG Resources, Inc. |
44,253 | ||||||||||||
| 43,778 | Exxon Mobil Corporation, (3) |
3,779,793 | ||||||||||||
| 10,617 | Halliburton Company |
363,314 | ||||||||||||
| 3,904 | Hess Corporation |
203,555 | ||||||||||||
| 1,341 | HollyFrontier Company |
41,330 | ||||||||||||
| 11,965 | Marathon Oil Corporation |
351,053 | ||||||||||||
| 4,938 | Marathon Petroleum Corporation |
205,470 | ||||||||||||
| 1,529 | Murphy Oil Corporation |
84,049 | ||||||||||||
| 2,272 | Nabors Industries Inc., (2) |
37,829 | ||||||||||||
| 2,517 | National-Oilwell Varco Inc. |
190,688 | ||||||||||||
| 4,374 | Newfield Exploration Company, (2) |
157,027 | ||||||||||||
| 855 | Noble Corporation, (2) |
32,541 | ||||||||||||
| 179 | Noble Energy, Inc. |
17,778 | ||||||||||||
| 5,279 | Occidental Petroleum Corporation |
481,550 | ||||||||||||
| 3,305 | Patterson-UTI Energy, Inc. |
53,442 | ||||||||||||
| 10,119 | Schlumberger Limited |
750,223 | ||||||||||||
| 770 | SeaCor Smit Inc., (2) |
71,556 | ||||||||||||
| 1,307 | Unit Corporation, (2) |
55,221 | ||||||||||||
| 8,248 | Valero Energy Corporation |
203,726 | ||||||||||||
| Total Energy |
11,945,534 | |||||||||||||
| Financials – 14.6% |
||||||||||||||
| 2,146 | AFLAC Incorporated |
96,656 | ||||||||||||
| 17,985 | American Capital Agency Corporation, (3) |
561,851 | ||||||||||||
| 6,020 | American Capital Limited, (2) |
59,779 | ||||||||||||
| 9,608 | American Express Company |
578,498 | ||||||||||||
| 2,692 | American International Group, (2) |
91,609 | ||||||||||||
| 578 | American Tower REIT Inc. |
37,905 | ||||||||||||
| 11,643 | Annaly Capital Management Inc., (3) |
190,014 | ||||||||||||
| 5,114 | AON PLC |
264,905 | ||||||||||||
| 78,496 | Bank of America Corporation |
636,603 | ||||||||||||
| 9,581 | Bank of New York Company, Inc., (3) |
226,591 | ||||||||||||
| 5,256 | BB&T Corporation, (3) |
168,402 | ||||||||||||
| 10,245 | Berkshire Hathaway Inc., Class B, (2) |
824,210 | ||||||||||||
| 44 | Nuveen Investments |
| Shares | Description (1) | Value | ||||||||||||
| Financials (continued) |
||||||||||||||
| 2,324 | Brown & Brown Inc. |
$ | 62,678 | |||||||||||
| 7,983 | Capital One Financial Corporation |
442,897 | ||||||||||||
| 4,912 | CIT Group Inc., (2) |
185,919 | ||||||||||||
| 29,356 | Citigroup Inc. |
969,922 | ||||||||||||
| 9,113 | Discover Financial Services |
308,931 | ||||||||||||
| 10,483 | Fifth Third Bancorp. |
149,173 | ||||||||||||
| 1,335 | First Citizens Bancshs Inc. |
231,356 | ||||||||||||
| 3,424 | First Republic Bank of San Francisco, (2) |
113,095 | ||||||||||||
| 16,670 | Genworth Financial Inc., Class A, (2) |
100,187 | ||||||||||||
| 3,677 | Goldman Sachs Group, Inc. |
423,407 | ||||||||||||
| 3,361 | Hartford Financial Services Group, Inc., (3) |
69,069 | ||||||||||||
| 29,767 | JPMorgan Chase & Co. |
1,279,386 | ||||||||||||
| 35,606 | KeyCorp. |
286,272 | ||||||||||||
| 10,959 | Loews Corporation |
450,744 | ||||||||||||
| 637 | M&T Bank Corporation, (3) |
54,954 | ||||||||||||
| 5,773 | Marsh & McLennan Companies, Inc. |
193,107 | ||||||||||||
| 10,389 | MetLife, Inc. |
374,316 | ||||||||||||
| 11,317 | Morgan Stanley, (3) |
195,558 | ||||||||||||
| 6,052 | PNC Financial Services Group, Inc. |
401,369 | ||||||||||||
| 1,739 | Prudential Financial, Inc. |
105,279 | ||||||||||||
| 1,664 | Public Storage, Inc. |
238,385 | ||||||||||||
| 2,858 | Rayonier Inc., (3) |
129,610 | ||||||||||||
| 3,659 | Reinsurance Group of America Inc., (3) |
212,734 | ||||||||||||
| 3,220 | Simon Property Group, Inc., (3) |
501,032 | ||||||||||||
| 9,309 | SLM Corporation |
138,052 | ||||||||||||
| 1,311 | SunTrust Banks, Inc. |
31,831 | ||||||||||||
| 5,043 | Unum Group |
119,721 | ||||||||||||
| 2,812 | Vornado Realty Trust, (3) |
241,382 | ||||||||||||
| 42,561 | Wells Fargo & Company |
1,422,814 | ||||||||||||
| 20,131 | Weyerhaeuser Company |
409,867 | ||||||||||||
| Total Financials |
13,580,070 | |||||||||||||
| Health Care – 13.1% |
||||||||||||||
| 15,584 | Abbott Laboratories, (3) |
967,143 | ||||||||||||
| 4,239 | Agilent Technologies, Inc., (2), (3) |
178,801 | ||||||||||||
| 1,487 | Allergan, Inc. |
142,752 | ||||||||||||
| 4,042 | AmerisourceBergen Corporation, (3) |
150,403 | ||||||||||||
| 8,670 | Amgen Inc. |
616,524 | ||||||||||||
| 5,510 | Baxter International, Inc. |
305,309 | ||||||||||||
| 3,391 | Becton, Dickinson and Company |
266,024 | ||||||||||||
| 1,118 | Biogen Idec Inc., (2) |
149,823 | ||||||||||||
| 1,140 | Bio-Rad Laboratories Inc., (2) |
123,109 | ||||||||||||
| 2,243 | Boston Scientific Corporation, (2) |
14,041 | ||||||||||||
| 8,812 | Bristol-Myers Squibb Company |
294,056 | ||||||||||||
| 1,479 | C. R. Bard, Inc. |
146,362 | ||||||||||||
| 9,602 | Cardinal Health, Inc. |
405,877 | ||||||||||||
| Nuveen Investments | 45 |
Portfolio of Investments (Unaudited)
Nuveen Quantitative Enhanced Core Equity Fund (continued)
April 30, 2012
| Shares | Description (1) | Value | ||||||||||||
| Health Care (continued) |
||||||||||||||
| 1,694 | CareFusion Corporation, (2) |
$ | 43,892 | |||||||||||
| 2,294 | Celgene Corporation, (2), (3) |
167,278 | ||||||||||||
| 3,865 | CIGNA Corporation |
178,679 | ||||||||||||
| 6,064 | Covidien PLC |
334,915 | ||||||||||||
| 7,586 | Eli Lilly and Company |
313,985 | ||||||||||||
| 2,566 | Endo Pharmaceuticals Holdings Inc., (2) |
90,169 | ||||||||||||
| 7,496 | Gilead Sciences, Inc., (2) |
389,867 | ||||||||||||
| 5,243 | HCA Holdings Inc., (2) |
141,142 | ||||||||||||
| 942 | Henry Schein Inc., (2), (3) |
72,289 | ||||||||||||
| 3,473 | Hill Rom Holdings Inc., (3) |
112,699 | ||||||||||||
| 993 | Hospira Inc., (2) |
34,874 | ||||||||||||
| 25,562 | Johnson & Johnson |
1,663,831 | ||||||||||||
| 4,618 | McKesson HBOC Inc. |
422,131 | ||||||||||||
| 12,515 | Medtronic, Inc. |
478,073 | ||||||||||||
| 22,611 | Merck & Company Inc. |
887,256 | ||||||||||||
| 1,487 | Mylan Laboratories Inc., (2) |
32,283 | ||||||||||||
| 2,673 | Perkinelmer Inc. |
73,775 | ||||||||||||
| 63,882 | Pfizer Inc. |
1,464,814 | ||||||||||||
| 2,405 | Saint Jude Medical Inc. |
93,122 | ||||||||||||
| 4,117 | Stryker Corporation, (3) |
224,665 | ||||||||||||
| 6,494 | Thermo Fisher Scientific, Inc., (2) |
361,391 | ||||||||||||
| 5,081 | UnitedHealth Group Incorporated |
285,298 | ||||||||||||
| 840 | Varian Medical Systems, Inc., (2), (3) |
53,273 | ||||||||||||
| 3,158 | Warner Chilcott Limited, (2) |
68,687 | ||||||||||||
| 662 | Waters Corporation, (2) |
55,681 | ||||||||||||
| 1,585 | Watson Pharmaceuticals Inc., (2) |
119,446 | ||||||||||||
| 2,487 | Wellpoint Inc. |
168,668 | ||||||||||||
| 2,381 | Zimmer Holdings, Inc., (2) |
149,836 | ||||||||||||
| Total Health Care |
12,242,243 | |||||||||||||
| Industrials – 9.7% |
||||||||||||||
| 5,159 | 3M Co. |
461,008 | ||||||||||||
| 5,433 | Air Lease Corporation, (3) |
127,784 | ||||||||||||
| 6,431 | Alliant Techsystems Inc. |
342,772 | ||||||||||||
| 4,179 | Boeing Company |
320,947 | ||||||||||||
| 1,610 | Caterpillar Inc., (3) |
165,460 | ||||||||||||
| 7,548 | Cintas Corporation, (3) |
295,655 | ||||||||||||
| 13,842 | Copart Inc., (3) |
365,567 | ||||||||||||
| 7,832 | Corrections Corporation of America |
226,266 | ||||||||||||
| 8,776 | Danaher Corporation, (3) |
475,835 | ||||||||||||
| 7,772 | Delta Air Lines, Inc., (2) |
85,181 | ||||||||||||
| 961 | Dover Corporation |
60,216 | ||||||||||||
| 13,530 | Exelis Inc. |
156,001 | ||||||||||||
| 1,524 | FedEx Corporation |
134,478 | ||||||||||||
| 7,963 | General Dynamics Corporation |
537,503 | ||||||||||||
| 63,142 | General Electric Company, (3) |
1,236,320 | ||||||||||||
| 46 | Nuveen Investments |
| Shares | Description (1) | Value | ||||||||||||
| Industrials (continued) |
||||||||||||||
| 9,425 | Hertz Global Holdings Inc., (2), (3) |
$ | 145,239 | |||||||||||
| 4,523 | Honeywell International Inc. |
274,365 | ||||||||||||
| 4,432 | L-3 Communications Holdings, Inc. |
325,929 | ||||||||||||
| 2,000 | Lockheed Martin Corporation |
181,080 | ||||||||||||
| 4,244 | Manpower Inc. |
180,794 | ||||||||||||
| 3,135 | Navistar International Corporation |
106,433 | ||||||||||||
| 2,835 | Nielsen Holdings BV, (2) |
82,839 | ||||||||||||
| 5,561 | Northrop Grumman Corporation, (3) |
351,900 | ||||||||||||
| 8,467 | Raytheon Company |
458,403 | ||||||||||||
| 4,369 | Robert Half International Inc. |
130,196 | ||||||||||||
| 1,373 | Ryder System, Inc. |
66,893 | ||||||||||||
| 9,289 | Tyco International Ltd. |
521,392 | ||||||||||||
| 1,684 | Union Pacific Corporation |
189,349 | ||||||||||||
| 11,627 | United Continental Holdings Inc., (2) |
254,864 | ||||||||||||
| 5,082 | United Parcel Service, Inc., Class B, (3) |
397,107 | ||||||||||||
| 4,248 | United Technologies Corporation |
346,807 | ||||||||||||
| 1,864 | Verisk Analytics Inc, Class A Shares, (2) |
91,243 | ||||||||||||
| Total Industrials |
9,095,826 | |||||||||||||
| Information Technology – 26.9% |
||||||||||||||
| 5,881 | Accenture Limited, (3) |
381,971 | ||||||||||||
| 364 | Akamai Technologies, Inc., (2) |
11,866 | ||||||||||||
| 2,263 | Amphenol Corporation, Class A, (3) |
131,571 | ||||||||||||
| 7,199 | Apple, Inc., (2) |
4,205,944 | ||||||||||||
| 22,012 | Applied Materials, Inc. |
263,924 | ||||||||||||
| 6,253 | Arrow Electronics, Inc., (2), (3) |
262,939 | ||||||||||||
| 5,277 | Automatic Data Processing, Inc. |
293,507 | ||||||||||||
| 9,800 | Avnet Inc., (2) |
353,584 | ||||||||||||
| 20,394 | AVX Group |
259,004 | ||||||||||||
| 7,455 | Booz Allen Hamilton Holding, (3) |
127,481 | ||||||||||||
| 5,195 | Broadcom Corporation, Class A, (2) |
190,137 | ||||||||||||
| 6,958 | CA Inc., (3) |
183,830 | ||||||||||||
| 55,241 | Cisco Systems, Inc. |
1,113,106 | ||||||||||||
| 3,597 | Cognizant Technology Solutions Corporation, Class A, (2) |
263,732 | ||||||||||||
| 4,842 | CoreLogic Inc., (2) |
80,861 | ||||||||||||
| 27,129 | Corning Incorporated |
389,301 | ||||||||||||
| 22,034 | Dell Inc., (2) |
360,697 | ||||||||||||
| 1,402 | Dolby Laboratories, Inc., (2) |
55,000 | ||||||||||||
| 1,545 | DST Systems Inc. |
86,489 | ||||||||||||
| 16,184 | eBay Inc., (2) |
664,353 | ||||||||||||
| 12,466 | EMC Corporation, (2), (3) |
351,666 | ||||||||||||
| 3,398 | Fidelity National Information Services |
114,411 | ||||||||||||
| 5,504 | Fiserv, Inc., (2) |
386,876 | ||||||||||||
| 1,245 | FleetCor Technologies Inc., (2) |
49,240 | ||||||||||||
| 1,116 | Global Payments Inc. |
51,816 | ||||||||||||
| 2,349 | Google Inc., Class A, (2) |
1,421,685 | ||||||||||||
| Nuveen Investments | 47 |
Portfolio of Investments (Unaudited)
Nuveen Quantitative Enhanced Core Equity Fund (continued)
April 30, 2012
| Shares | Description (1) | Value | ||||||||||||
| Information Technology (continued) |
||||||||||||||
| 2,220 | Harris Corporation, (3) |
$ | 101,099 | |||||||||||
| 26,547 | Hewlett-Packard Company, (3) |
657,304 | ||||||||||||
| 3,568 | IAC/InterActiveCorp. |
171,799 | ||||||||||||
| 17,534 | Ingram Micro, Inc., Class A, (2) |
341,212 | ||||||||||||
| 43,030 | Intel Corporation |
1,222,052 | ||||||||||||
| 10,525 | International Business Machines Corporation (IBM) |
2,179,517 | ||||||||||||
| 1,842 | International Rectifier Corporation, (2), (3) |
40,211 | ||||||||||||
| 10,788 | Jabil Circuit Inc. |
252,979 | ||||||||||||
| 3,910 | Juniper Networks Inc., (2) |
83,791 | ||||||||||||
| 88 | KLA-Tencor Corporation |
4,589 | ||||||||||||
| 5,242 | Lexmark International, Inc., Class A, (3) |
157,784 | ||||||||||||
| 631 | MasterCard, Inc. |
285,382 | ||||||||||||
| 70,113 | Microsoft Corporation |
2,245,018 | ||||||||||||
| 7,382 | Motorola Solutions Inc. |
376,703 | ||||||||||||
| 4,273 | NCR Corporation, (2) |
100,416 | ||||||||||||
| 640 | NetApp, Inc., (2) |
24,851 | ||||||||||||
| 34,296 | Oracle Corporation |
1,007,959 | ||||||||||||
| 5,210 | QLogic Corporation, (2) |
89,873 | ||||||||||||
| 15,181 | QUALCOMM, Inc. |
969,155 | ||||||||||||
| 19,187 | SAIC, Inc., (2), (3) |
233,314 | ||||||||||||
| 5,321 | SanDisk Corporation, (2) |
196,930 | ||||||||||||
| 1,042 | Symantec Corporation |
17,214 | ||||||||||||
| 10,046 | TE Connectivity Limited |
366,277 | ||||||||||||
| 2,688 | Tech Data Corporation, (2), (3) |
144,588 | ||||||||||||
| 12,904 | Texas Instruments Incorporated, (3) |
412,154 | ||||||||||||
| 3,296 | VeriSign, Inc., (2) |
135,499 | ||||||||||||
| 2,533 | Visa Inc., (3) |
311,508 | ||||||||||||
| 6,446 | Western Digital Corporation, (2) |
250,169 | ||||||||||||
| 4,668 | Western Union Company, (3) |
85,798 | ||||||||||||
| 28,891 | Xerox Corporation |
224,772 | ||||||||||||
| 16,789 | Yahoo! Inc., (2) |
260,901 | ||||||||||||
| 2,084 | Zebra Technologies Corporation, Class A, (2) |
80,838 | ||||||||||||
| Total Information Technology |
25,086,647 | |||||||||||||
| Materials – 1.5% |
||||||||||||||
| 513 | Cliffs Natural Resources Inc. |
31,939 | ||||||||||||
| 3,474 | Dow Chemical Company, (3) |
117,699 | ||||||||||||
| 6,925 | E.I. Du Pont de Nemours and Company, (3) |
370,211 | ||||||||||||
| 7,147 | Freeport-McMoRan Copper & Gold, Inc. |
273,730 | ||||||||||||
| 10,111 | LyondellBasell Industries NV |
422,438 | ||||||||||||
| 1,359 | Newmont Mining Corporation |
64,756 | ||||||||||||
| 902 | Praxair, Inc. |
104,361 | ||||||||||||
| Total Materials |
1,385,134 | |||||||||||||
| Telecommunication Services – 3.7% |
||||||||||||||
| 63,237 | AT&T Inc., (3) |
2,081,130 | ||||||||||||
| 5,929 | CenturyLink Inc., (3) |
228,621 | ||||||||||||
| 48 | Nuveen Investments |
| Shares | Description (1) | Value | ||||||||||||||||||
| Telecommunication Services (continued) |
||||||||||||||||||||
| 2,038 | Telephone and Data Systems Inc. |
$ | 49,502 | |||||||||||||||||
| 12,724 | TW Telecom Inc., (2) |
277,128 | ||||||||||||||||||
| 21,063 | Verizon Communications Inc., (3) |
850,523 | ||||||||||||||||||
| Total Telecommunication Services |
3,486,904 | |||||||||||||||||||
| Total Common Stocks (cost $78,569,747) |
88,161,575 | |||||||||||||||||||
| Shares | Description (1) | Value | ||||||||||||||||||
| INVESTMENTS PURCHASED WITH COLLATERAL FROM SECURITIES LENDING – 22.9% |
|
|||||||||||||||||||
| Money Market Funds – 22.9% |
||||||||||||||||||||
| 21,361,416 | Mount Vernon Securities Lending Prime Portfolio, 0.276%, (4), (5) |
$ | 21,361,416 | |||||||||||||||||
| Total Investments Purchased with Collateral from Securities Lending (cost $21,361,416) |
|
21,361,416 | ||||||||||||||||||
| Principal Amount (000) |
Description (1) | Coupon | Maturity | Ratings (6) | Value | |||||||||||||||
| SHORT-TERM INVESTMENTS – 0.4% |
||||||||||||||||||||
| U.S. Government and Agency Obligations – 0.4% |
||||||||||||||||||||
| $ | 350 | U.S. Treasury Bill, (7) |
0.123% | 9/20/12 | Aaa | $ | 349,824 | |||||||||||||
| $ | 350 | Total Short-Term Investments (cost $349,883) |
349,824 | |||||||||||||||||
| Total Investments (cost $100,281,046) – 117.8% |
109,872,815 | |||||||||||||||||||
| Other Assets Less Liabilities – (17.8)% (8) |
(16,609,475) | |||||||||||||||||||
| Net Assets – 100% |
$ | 93,263,340 | ||||||||||||||||||
Investments in Derivatives at April 30, 2012:
Futures Contracts outstanding:
| Type | Contract Position |
Number of Contracts |
Contract Expiration |
Value | Unrealized Appreciation (Depreciation) |
|||||||||||||||
| S&P 500 Index |
Long | 14 | 6/12 | $ | 4,877,600 | $ | (12,206 | ) | ||||||||||||
| For Fund portfolio compliance purposes, the Fund’s industry classifications refer to any one or more of the industry sub-classifications used by one or more widely recognized market indexes or ratings group indexes, and/or as defined by Fund management. This definition may not apply for purposes of this report which may combine industry sub-classifications into sectors for reporting ease. |
| (1) | All percentages shown in the Portfolio of Investments are based on net assets. |
| (2) | Non-income producing; issuer has not declared a dividend within the past twelve months. |
| (3) | Investment, or a portion of investment, is out on loan for securities lending. |
| (4) | The rate shown is the annualized seven-day effective yield as of April 30, 2012. |
| (5) | The Fund may loan securities representing up to one third of the fair value of its total assets (which includes collateral for securities on loan) to broker dealers, banks, and other institutions. The Fund maintains collateral equal to at least 102% of the fair value of the securities loaned. The cash collateral received by the Fund is invested in this money market fund. See Notes to Financial Statements, Footnote 1 - General Information and Significant Accounting Policies, Securities Lending for more information. |
| (6) | Ratings: Using the highest of Standard & Poor’s Group (“Standard & Poor’s”), Moody’s Investors Service, Inc. (“Moody’s”) or Fitch, Inc. (“Fitch”) rating. Ratings below BBB by Standard & Poor’s, Baa by Moody’s or BBB by Fitch are considered to be below investment grade. Holdings designated N/R are not rated by any of these national rating agencies. |
| (7) | Investment, or portion of investment, segregated as collateral for investments in derivatives. |
| (8) | Other Assets Less Liabilities includes the net Unrealized Appreciation (Depreciation) of derivatives instruments as listed within Investments in Derivatives at April 30, 2012. |
| REIT | Real Estate Investment Trust |
See accompanying notes to financial statements.
| Nuveen Investments | 49 |
Portfolio of Investments (Unaudited)
Nuveen Tactical Market Opportunities Fund
April 30, 2012
| Shares | Description (1) | Value | ||||||||||||||||||
| EXCHANGE-TRADED FUNDS – 29.3% |
||||||||||||||||||||
| 35,000 | iShares 10+ Year Credit Bond Fund |
$ | 2,059,050 | |||||||||||||||||
| 75,400 | iShares Barclays 1-3 Credit Bond Fund |
7,905,690 | ||||||||||||||||||
| 5,000 | iShares Barclays MBS Bond Fund |
541,450 | ||||||||||||||||||
| 379,000 | iShares FTSE NAREIT Mortgage Plus Capped Index Fund |
5,306,000 | ||||||||||||||||||
| 95,500 | iShares iBoxx $ High Yield Corporate Bond Fund |
8,709,600 | ||||||||||||||||||
| 44,000 | iShares MSCI Brazil Index Fund |
2,651,440 | ||||||||||||||||||
| 33,000 | iShares MSCI Indonesia Investable Market Index Fund |
1,020,690 | ||||||||||||||||||
| 66,000 | iShares MSCI Malaysia Index Fund |
957,660 | ||||||||||||||||||
| 21,000 | iShares S&P National AMT-Free Municipal Bond Fund |
2,312,310 | ||||||||||||||||||
| 39,000 | iShares S&P Short Term National AMT-Free Municipal Bond Fund |
4,161,690 | ||||||||||||||||||
| 112,000 | Market Vectors Emerging Markets Local Currency Bond ETF |
2,959,040 | ||||||||||||||||||
| 24,000 | Market Vectors Gold Miners ETF |
1,113,360 | ||||||||||||||||||
| 55,000 | Market Vectors Russia ETF |
1,647,250 | ||||||||||||||||||
| 86,000 | Powershares Senior Loan Portfolio Fund |
2,114,740 | ||||||||||||||||||
| 153,000 | SPDR Barclays Capital High Yield Bond ETF |
6,078,690 | ||||||||||||||||||
| 10,500 | SPDR S&P Emerging Markets Dividend ETF |
515,655 | ||||||||||||||||||
| 19,000 | SPDR S&P International Dividend ETF |
920,170 | ||||||||||||||||||
| 128,000 | Utilities Select Sector SPDR Fund |
4,564,480 | ||||||||||||||||||
| Total Exchange-Traded Funds (cost $54,814,826) |
55,538,965 | |||||||||||||||||||
| Principal Amount (000) |
Description (1) | Coupon | Maturity | Ratings (2) | Value | |||||||||||||||
| SOVEREIGN DEBT – 0.4% |
||||||||||||||||||||
| $ | 750 | United Mexican States |
5.875% | 1/15/14 | Baa1 | $ | 809,250 | |||||||||||||
| $ | 750 | Total Sovereign Debt (cost $806,016) |
809,250 | |||||||||||||||||
| Principal Amount (000) |
Description (1) | Coupon | Maturity | Ratings (2) | Value | |||||||||||||||
| U.S. GOVERNMENT AND AGENCY OBLIGATIONS – 3.5% |
||||||||||||||||||||
| $ | 5,200 | U.S. Treasury Bonds |
4.500% | 8/15/39 | Aaa | $ | 6,643,811 | |||||||||||||
| $ | 5,200 | Total U.S. Government and Agency Obligations (cost $5,828,593) |
6,643,811 | |||||||||||||||||
| Shares/ Principal Amount (000) |
Description (1) | Coupon | Maturity | Ratings (2) | Value | |||||||||||||||
| SHORT-TERM INVESTMENTS – 63.5% |
||||||||||||||||||||
| Money Market Funds – 51.7% |
||||||||||||||||||||
| 97,862,153 | First American Treasury Obligations Fund, Class Z |
0.000% | (3) | N/A | N/A | $ | 97,862,153 | |||||||||||||
| U.S. Government and Agency Obligations – 11.8% |
||||||||||||||||||||
| $ | 1,200 | U.S. Treasury Bill, (4) |
0.108% | 8/23/12 | Aaa | 1,199,592 | ||||||||||||||
| 15,000 | U.S. Treasury Bill, (4) |
0.123% | 9/13/12 | Aaa | 14,992,965 | |||||||||||||||
| 6,100 | U.S. Treasury Bill, (4) |
0.123% | 9/20/12 | Aaa | 6,096,932 | |||||||||||||||
| $ | 22,300 | Total U.S. Government and Agency Obligations |
22,289,489 | |||||||||||||||||
| Total Short-Term Investments (cost $120,151,740) |
120,151,642 | |||||||||||||||||||
| Total Investments (cost $181,601,175) – 96.7% |
183,143,668 | |||||||||||||||||||
| Other Assets Less Liabilities – 3.3% (5) |
6,155,621 | |||||||||||||||||||
| Net Assets – 100% |
$ | 189,299,289 | ||||||||||||||||||
| 50 | Nuveen Investments |
Investments in Derivatives at April 30, 2012:
Futures Contracts outstanding:
| Type | Contract Position |
Number of Contracts |
Contract Expiration |
Value | Unrealized Appreciation (Depreciation) |
|||||||||||||||
| Amsterdam Index |
Long | 48 | 5/12 | $ | 3,874,514 | $ | (28,220 | ) | ||||||||||||
| Australian 10-Year Bond |
Long | 64 | 6/12 | 6,427,074 | 115,112 | |||||||||||||||
| Australian Dollar Currency |
Short | (77 | ) | 6/12 | (7,983,360 | ) | (29,965 | ) | ||||||||||||
| CBOE VIX Index |
Long | 15 | 5/12 | 276,750 | (46,552 | ) | ||||||||||||||
| DAX Index |
Short | (18 | ) | 6/12 | (4,035,621 | ) | 64,572 | |||||||||||||
| Dollar Index |
Long | 90 | 6/12 | 7,096,321 | (164,932 | ) | ||||||||||||||
| E-Mini MSCI Emerging Markets Index |
Long | 39 | 6/12 | 1,987,830 | (7,239 | ) | ||||||||||||||
| Euro Bund |
Short | (26 | ) | 6/12 | (4,855,770 | ) | 1,769 | |||||||||||||
| Hang Seng Index |
Short | (36 | ) | 5/12 | (4,858,062 | ) | (87,634 | ) | ||||||||||||
| H-Shares Index |
Long | 67 | 5/12 | 4,754,719 | 101,029 | |||||||||||||||
| Mexican Bolsa Index |
Short | (92 | ) | 6/12 | (2,792,005 | ) | (26,917 | ) | ||||||||||||
| Mexican Peso |
Long | 80 | 6/12 | 3,055,000 | 35,018 | |||||||||||||||
| NASDAQ 100 E-Mini |
Short | (127 | ) | 6/12 | (6,906,895 | ) | (142,790 | ) | ||||||||||||
| Russell 2000 Mini Index |
Short | (165 | ) | 6/12 | (13,445,850 | ) | (169,307 | ) | ||||||||||||
| S&P 500 Index |
Long | 232 | 6/12 | 16,165,760 | 337,826 | |||||||||||||||
| S&P/TSX 60 Index |
Long | 28 | 6/12 | 3,959,144 | (26,572 | ) | ||||||||||||||
| SET50 Index |
Short | (153 | ) | 6/12 | (4,294,449 | ) | (103,010 | ) | ||||||||||||
| SPI 200 |
Long | 36 | 6/12 | 4,123,304 | 148,949 | |||||||||||||||
| $ | (28,863 | ) | ||||||||||||||||||
| (1) | All percentages shown in the Portfolio of Investments are based on net assets. |
| (2) | Ratings: Using the highest of Standard & Poor’s Group (“Standard & Poor’s”), Moody’s Investors Service, Inc. (“Moody’s”) or Fitch, Inc. (“Fitch”) rating. Ratings below BBB by Standard & Poor’s, Baa by Moody’s or BBB by Fitch are considered to be below investment grade. Holdings designated N/R are not rated by any of these national rating agencies. |
| (3) | The rate shown is the annualized seven-day effective yield as of April 30, 2012. |
| (4) | Investment, or portion of investment, segregated as collateral for investments in derivatives. |
| (5) | Other Assets Less Liabilities includes the Unrealized Appreciation (Depreciation) of derivative instruments as listed within Investments in Derivatives at April 30, 2012. |
| N/A | Not applicable |
| ETF | Exchange-Traded Fund |
| SPDR | Standard & Poor’s Depositary Receipts |
See accompanying notes to financial statements.
| Nuveen Investments | 51 |
Statement of Assets & Liabilities (Unaudited)
April 30, 2012
| International | International Select |
Quantitative Enhanced |
Tactical Market |
|||||||||||||
| Assets |
||||||||||||||||
| Investments, at value (cost $104,103,492, $429,102,999, $78,569,747 and $61,449,435, respectively) |
$ | 107,227,634 | $ | 451,748,445 | $ | 88,161,575 | $ | 62,992,026 | ||||||||
| Investment purchased with collateral from securities lending (at cost, which approximates value) |
— | — | 21,361,416 | — | ||||||||||||
| Short-term investments (cost $11,839,380, $62,506,009, $349,883 and $120,151,740, respectively) |
11,838,054 | 62,501,710 | 349,824 | 120,151,642 | ||||||||||||
| Cash denominated in foreign currencies (cost $6,186,278, $6,945,748, $– and $3,351,034, respectively) |
6,205,760 | 6,979,465 | — | 3,374,425 | ||||||||||||
| Receivables: |
||||||||||||||||
| Deposits with brokers for open futures contracts |
800,000 | 1,000,000 | — | 800,000 | ||||||||||||
| Dividends |
449,049 | 1,622,236 | 101,242 | — | ||||||||||||
| Due from broker |
— | — | 3,512 | — | ||||||||||||
| Interest |
849 | 5,823 | — | 61,831 | ||||||||||||
| Investments sold |
1,572,160 | 6,068,783 | 6,907,441 | 2,022,883 | ||||||||||||
| Reclaims |
685,515 | 574,314 | — | — | ||||||||||||
| Shares sold |
63,952 | 28,262 | — | 970,341 | ||||||||||||
| Variation margin on futures contracts |
— | 346,717 | — | 95,608 | ||||||||||||
| Other assets |
4,082 | 8,283 | 257 | 32 | ||||||||||||
| Total assets |
128,847,055 | 530,884,038 | 116,885,267 | 190,468,788 | ||||||||||||
| Liabilities |
||||||||||||||||
| Cash overdraft |
5,785,012 | 6,818,864 | 324,107 | 866,554 | ||||||||||||
| Payables: |
||||||||||||||||
| Collateral from securities lending program |
— | — | 21,361,416 | — | ||||||||||||
| Investments purchased |
1,818,254 | 5,812,356 | 1,782,056 | — | ||||||||||||
| Shares redeemed |
612,278 | 1,264,617 | 72,034 | 150,078 | ||||||||||||
| Variation margin on futures contracts |
106,974 | — | 17,150 | — | ||||||||||||
| Accrued expenses: |
||||||||||||||||
| Management fees |
28,308 | 537,710 | 25,029 | 100,658 | ||||||||||||
| 12b-1 distribution and service fees |
6,079 | 1,448 | 125 | 14,857 | ||||||||||||
| Other |
204,327 | 200,135 | 40,010 | 37,352 | ||||||||||||
| Total liabilities |
8,561,232 | 14,635,130 | 23,621,927 | 1,169,499 | ||||||||||||
| Net assets |
$ | 120,285,823 | $ | 516,248,908 | $ | 93,263,340 | $ | 189,299,289 | ||||||||
| Class A Shares |
||||||||||||||||
| Net assets |
$ | 22,568,859 | $ | 4,165,874 | $ | 129,188 | $ | 43,014,904 | ||||||||
| Shares outstanding |
2,341,288 | 462,621 | 5,551 | 3,857,878 | ||||||||||||
| Net asset value per share |
$ | 9.64 | $ | 9.00 | $ | 23.27 | $ | 11.15 | ||||||||
| Offering price per share (net asset value per share plus maximum sales charge of 5.75% of offering price) |
$ | 10.23 | $ | 9.55 | $ | 23.27 | (1) | $ | 11.83 | |||||||
| Class C Shares |
||||||||||||||||
| Net assets |
$ | 1,746,787 | $ | 735,268 | $ | 120,608 | $ | 7,981,827 | ||||||||
| Shares outstanding |
192,349 | 82,457 | 5,206 | 720,401 | ||||||||||||
| Net asset value and offering price per share |
$ | 9.08 | $ | 8.92 | $ | 23.17 | $ | 11.08 | ||||||||
| Class R3 Shares |
||||||||||||||||
| Net assets |
$ | 43,710 | $ | 13,727 | N/A | N/A | ||||||||||
| Shares outstanding |
4,530 | 1,554 | N/A | N/A | ||||||||||||
| Net asset value and offering price per share |
$ | 9.65 | $ | 8.83 | N/A | N/A | ||||||||||
| Class I Shares |
||||||||||||||||
| Net assets |
$ | 95,926,467 | $ | 511,334,039 | $ | 93,013,544 | $ | 138,302,558 | ||||||||
| Shares outstanding |
9,835,837 | 56,731,019 | 3,990,327 | 12,376,356 | ||||||||||||
| Net asset value and offering price per share |
$ | 9.75 | $ | 9.01 | $ | 23.31 | $ | 11.17 | ||||||||
| Net assets consist of: |
||||||||||||||||
| Capital paid-in |
$ | 123,356,415 | $ | 514,840,709 | $ | 79,435,129 | $ | 187,096,839 | ||||||||
| Undistributed (Over-distribution of) net investment income |
503,247 | 2,551,326 | 995,399 | 159,980 | ||||||||||||
| Accumulated net realized gain (loss) |
(5,926,072 | ) | (21,340,920 | ) | 3,253,249 | 505,449 | ||||||||||
| Net unrealized appreciation (depreciation) |
2,352,233 | 20,197,793 | 9,579,563 | 1,537,021 | ||||||||||||
| Net assets |
$ | 120,285,823 | $ | 516,248,908 | $ | 93,263,340 | $ | 189,299,289 | ||||||||
| Authorized shares |
2 billion | 2 billion | 2 billion | 2 billion | ||||||||||||
| Par value per share |
$ | 0.0001 | $ | 0.0001 | $ | 0.0001 | $ | 0.0001 | ||||||||
| N/A – | Quantitative Enhanced Core Equity and Tactical Market Opportunities do not offer Class R3 Shares. |
| (1) – | Quantitative Enhanced Core Equity does not have a maximum sales charge. |
See accompanying notes to financial statements.
| 52 | Nuveen Investments |
Statement of Operations (Unaudited)
Six Months Ended April 30, 2012
| International | International Select |
Quantitative Enhanced Core Equity |
Tactical Market Opportunities |
|||||||||||||
| Investment Income |
||||||||||||||||
| Dividend and interest income (net of foreign tax withheld of $129,880, $525,940, $283 and $–, respectively) |
$ | 1,329,871 | $ | 5,843,292 | $ | 1,183,350 | $ | 856,643 | ||||||||
| Securities lending income |
— | — | 22,659 | — | ||||||||||||
| Total investment income |
1,329,871 | 5,843,292 | 1,206,009 | 856,643 | ||||||||||||
| Expenses |
||||||||||||||||
| Management fees |
693,483 | 2,710,700 | 244,274 | 449,546 | ||||||||||||
| 12b-1 service fees – Class A |
29,761 | 5,151 | 177 | 31,213 | ||||||||||||
| 12b-1 distribution and service fees – Class C |
9,034 | 3,481 | 567 | 20,214 | ||||||||||||
| 12b-1 distribution and service fees – Class R3 |
78 | 33 | N/A | N/A | ||||||||||||
| Shareholders’ servicing agent fees and expenses |
170,192 | 310,143 | 127,848 | 35,850 | ||||||||||||
| Custodian’s fees and expenses |
193,454 | 319,303 | 30,659 | 8,470 | ||||||||||||
| Directors’ fees and expenses |
1,095 | 7,196 | 1,478 | 1,969 | ||||||||||||
| Professional fees |
23,119 | 25,718 | 5,677 | 3,727 | ||||||||||||
| Shareholders’ reports – printing and mailing expenses |
46,827 | 2,292 | 2,306 | 16,734 | ||||||||||||
| Federal and state registration fees |
29,911 | 28,762 | 22,404 | 44,844 | ||||||||||||
| Other expenses |
57,600 | 29,908 | 2,242 | 9,760 | ||||||||||||
| Total expenses before expense reimbursement |
1,254,554 | 3,442,687 | 437,632 | 622,327 | ||||||||||||
| Expense reimbursement |
(396,787 | ) | (183,504 | ) | (217,129 | ) | (32,848 | ) | ||||||||
| Net expenses |
857,767 | 3,259,183 | 220,503 | 589,479 | ||||||||||||
| Net investment income (loss) |
472,104 | 2,584,109 | 985,506 | 267,164 | ||||||||||||
| Realized and Unrealized Gain (Loss) |
||||||||||||||||
| Net realized gain (loss) from: |
||||||||||||||||
| Investments and foreign currency |
(6,426,595 | ) | (14,479,335 | ) | 3,501,667 | 567,071 | ||||||||||
| Futures contracts |
2,272,370 | (2,663,838 | ) | 783,205 | (237,500 | ) | ||||||||||
| Change in net unrealized appreciation (depreciation) of: |
||||||||||||||||
| Investments and foreign currency |
10,351,191 | 36,205,687 | 5,559,180 | 695,267 | ||||||||||||
| Futures contracts |
(2,280,353 | ) | (1,075,667 | ) | (84,028 | ) | 207,045 | |||||||||
| Net realized and unrealized gain (loss) |
3,916,613 | 17,986,847 | 9,760,024 | 1,231,883 | ||||||||||||
| Net increase (decrease) in net assets from operations |
$ | 4,388,717 | $ | 20,570,956 | $ | 10,745,530 | $ | 1,499,047 | ||||||||
| N/A – | Quantitative Enhanced Core Equity and Tactical Market Opportunities do not offer Class R3 Shares. |
See accompanying notes to financial statements.
| Nuveen Investments | 53 |
Statement of Changes in Net Assets (Unaudited)
| International | International Select | |||||||||||||||
| Six Months Ended 4/30/12 |
Year Ended 10/31/11 |
Six Months Ended 4/30/12 |
Year Ended 10/31/11 |
|||||||||||||
| Operations |
||||||||||||||||
| Net investment income (loss) |
$ | 472,104 | $ | 7,452,325 | $ | 2,584,109 | $ | 9,342,486 | ||||||||
| Net realized gain (loss) from: |
||||||||||||||||
| Investments and foreign currency |
(6,426,595 | ) | 79,229,286 | (14,479,335 | ) | 51,311,264 | ||||||||||
| Futures contracts |
2,272,370 | (3,656,977 | ) | (2,663,838 | ) | (10,916,532 | ) | |||||||||
| Redemptions in-kind |
— | — | — | — | ||||||||||||
| Change in net unrealized appreciation (depreciation) of: |
||||||||||||||||
| Investments and foreign currency |
10,351,191 | (121,677,805 | ) | 36,205,687 | (93,468,555 | ) | ||||||||||
| Futures contracts |
(2,280,353 | ) | 8,604,468 | (1,075,667 | ) | 8,252,883 | ||||||||||
| Net increase (decrease) in net assets from operations |
4,388,717 | (30,048,703 | ) | 20,570,956 | (35,478,454 | ) | ||||||||||
| Distributions to Shareholders |
||||||||||||||||
| From net investment income: |
||||||||||||||||
| Class A |
(953,170 | ) | (107,500 | ) | (59,108 | ) | (33,025 | ) | ||||||||
| Class B |
N/A | — | N/A | N/A | ||||||||||||
| Class C |
(66,670 | ) | — | (2,770 | ) | (740 | ) | |||||||||
| Class R3(1) |
(685 | ) | (15 | ) | (125 | ) | — | |||||||||
| Class I(1) |
(5,063,526 | ) | (4,195,268 | ) | (7,900,833 | ) | (6,454,548 | ) | ||||||||
| From accumulated net realized gains: |
||||||||||||||||
| Class A |
(2,889,460 | ) | — | (47,540 | ) | — | ||||||||||
| Class B |
N/A | — | N/A | N/A | ||||||||||||
| Class C |
(265,665 | ) | — | (7,969 | ) | — | ||||||||||
| Class R3(1) |
(2,164 | ) | — | (152 | ) | — | ||||||||||
| Class I(1) |
(15,999,350 | ) | — | (6,194,924 | ) | — | ||||||||||
| Decrease in net assets from distributions to shareholders |
(25,240,690 | ) | (4,302,783 | ) | (14,213,421 | ) | (6,488,313 | ) | ||||||||
| Fund Share Transactions |
||||||||||||||||
| Proceeds from sale of shares |
7,501,375 | 9,534,322 | 56,043,260 | 100,109,897 | ||||||||||||
| Proceeds from shares issued to shareholders due to reinvestment of distributions |
10,997,912 | 3,103,920 | 4,681,594 | 1,537,568 | ||||||||||||
| 18,499,287 | 12,638,242 | 60,724,854 | 101,647,465 | |||||||||||||
| Cost of shares redeemed |
(43,899,195 | ) | (495,221,106 | ) | (134,548,170 | ) | (330,484,054 | ) | ||||||||
| Cost of redemptions in-kind |
— | — | — | — | ||||||||||||
| Net increase (decrease) in net assets from Fund share transactions |
(25,399,908 | ) | (482,582,864 | ) | (73,823,316 | ) | (228,836,589 | ) | ||||||||
| Net increase (decrease) in net assets |
(46,251,881 | ) | (516,934,350 | ) | (67,465,781 | ) | (270,803,356 | ) | ||||||||
| Net assets at the beginning of period |
166,537,704 | 683,472,054 | 583,714,689 | 854,518,045 | ||||||||||||
| Net assets at the end of period |
$ | 120,285,823 | $ | 166,537,704 | $ | 516,248,908 | $ | 583,714,689 | ||||||||
| Undistributed (Over-distribution of) net investment income at the end of period |
$ | 503,247 | $ | 6,115,194 | $ | 2,551,326 | $ | 7,930,053 | ||||||||
See accompanying notes to financial statements.
| 54 | Nuveen Investments |
| Quantitative Enhanced Core Equity |
Tactical Market Opportunities |
|||||||||||||||
| Six Months Ended 4/30/12 |
Year Ended 10/31/11 |
Six Months Ended 4/30/12 |
Year Ended 10/31/11 |
|||||||||||||
| Operations |
||||||||||||||||
| Net investment income (loss) |
$ | 985,506 | $ | 2,921,001 | $ | 267,164 | $ | 388,017 | ||||||||
| Net realized gain (loss) from: |
||||||||||||||||
| Investments and foreign currency |
3,501,667 | 11,480,043 | 567,071 | 778,007 | ||||||||||||
| Futures contracts |
783,205 | 152,170 | (237,500 | ) | 440,455 | |||||||||||
| Redemptions in-kind |
— | 2,329,724 | — | — | ||||||||||||
| Change in net unrealized appreciation (depreciation) of: |
||||||||||||||||
| Investments and foreign currency |
5,559,180 | (4,839,582 | ) | 695,267 | 753,994 | |||||||||||
| Futures contracts |
(84,028 | ) | 71,822 | 207,045 | (201,998 | ) | ||||||||||
| Net increase (decrease) in net assets from operations |
10,745,530 | 12,115,178 | 1,499,047 | 2,158,475 | ||||||||||||
| Distributions to Shareholders |
||||||||||||||||
| From net investment income: |
||||||||||||||||
| Class A(2) |
(2,808 | ) | (2,341 | ) | (47,114 | ) | — | |||||||||
| Class B |
N/A | N/A | N/A | N/A | ||||||||||||
| Class C(2) |
(1,032 | ) | (946 | ) | — | — | ||||||||||
| Class R3(1) |
N/A | N/A | N/A | N/A | ||||||||||||
| Class I(1) |
(1,931,314 | ) | (2,864,205 | ) | (353,238 | ) | (154,561 | ) | ||||||||
| From accumulated net realized gains: |
||||||||||||||||
| Class A(2) |
(2,645 | ) | — | (209,804 | ) | — | ||||||||||
| Class B |
N/A | N/A | N/A | N/A | ||||||||||||
| Class C(2) |
(1,769 | ) | — | (23,497 | ) | — | ||||||||||
| Class R3(1) |
N/A | N/A | N/A | N/A | ||||||||||||
| Class I(1) |
(1,571,914 | ) | — | (815,282 | ) | (47,469 | ) | |||||||||
| Decrease in net assets from distributions to shareholders |
(3,511,482 | ) | (2,867,492 | ) | (1,448,935 | ) | (202,030 | ) | ||||||||
| Fund Share Transactions |
||||||||||||||||
| Proceeds from sale of shares |
3,604,797 | 9,839,732 | 143,608,216 | 33,827,603 | ||||||||||||
| Proceeds from shares issued to shareholders due to reinvestment of distributions |
1,379,059 | 878,112 | 1,316,662 | 158,329 | ||||||||||||
| 4,983,856 | 10,717,844 | 144,924,878 | 33,985,932 | |||||||||||||
| Cost of shares redeemed |
(26,960,621 | ) | (97,606,723 | ) | (8,568,510 | ) | (10,349,661 | ) | ||||||||
| Cost of redemptions in-kind |
— | (17,935,393 | ) | — | — | |||||||||||
| Net increase (decrease) in net assets from Fund share transactions |
(21,976,765 | ) | (104,824,272 | ) | 136,356,368 | 23,636,271 | ||||||||||
| Net increase (decrease) in net assets |
(14,742,717 | ) | (95,576,586 | ) | 136,406,480 | 25,592,716 | ||||||||||
| Net assets at the beginning of period |
108,006,057 | 203,582,643 | 52,892,809 | 27,300,093 | ||||||||||||
| Net assets at the end of period |
$ | 93,263,340 | $ | 108,006,057 | $ | 189,299,289 | $ | 52,892,809 | ||||||||
| Undistributed (Over-distribution of) net investment income at the end of period |
$ | 995,399 | $ | 1,945,047 | $ | 159,980 | $ | 293,168 | ||||||||
| N/A – | International Select does not offer Class B Shares. Quantitative Enhanced Core Equity and Tactical Market Opportunities do not offer Class B Shares and Class R3 Shares. Class B Shares of International converted to Class A Shares at the close of business on February 15, 2012 and are no longer available for dividend reinvestment or through an exchange from other Nuveen mutual funds. |
| (1) – | Effective January 18, 2011, Class R Shares and Class Y Shares previously offered by FAF Advisors, Inc. were renamed Class R3 Shares and Class I Shares, respectively. |
| (2) – | Tactical Market Opportunities did not offer Class A Shares and Class C Shares prior to February 24, 2011. |
See accompanying notes to financial statements.
| Nuveen Investments | 55 |
Financial Highlights (Unaudited)
| Selected data for a share outstanding throughout each period: | ||||||||||||||||||||||||||||||||
| Class (Commencement Date) | ||||||||||||||||||||||||||||||||
| Investment Operations | Less Distributions | |||||||||||||||||||||||||||||||
| INTERNATIONAL | ||||||||||||||||||||||||||||||||
| Year Ended October 31, |
Beginning Net Asset Value |
Net Invest- ment Income (Loss)(a) |
Net Realized/ Unrealized Gain (Loss) |
Total | Net Invest- ment Income |
Capital Gains(b) |
Total | Ending Net Asset Value |
||||||||||||||||||||||||
| Class A (5/94) |
||||||||||||||||||||||||||||||||
| 2012(f) |
$ | 11.12 | $ | .03 | $ | .30 | $ | .33 | $ | (.41 | ) | $ | (1.40 | ) | $ | (1.81 | ) | $ | 9.64 | |||||||||||||
| 2011 |
11.62 | .10 | (.55 | ) | (.45 | ) | (.05 | ) | — | (.05 | ) | 11.12 | ||||||||||||||||||||
| 2010 |
10.78 | .07 | .81 | .88 | (.04 | ) | — | (.04 | ) | 11.62 | ||||||||||||||||||||||
| 2009 |
8.68 | .09 | 2.09 | 2.18 | (.08 | ) | — | (.08 | ) | 10.78 | ||||||||||||||||||||||
| 2008 |
17.15 | .26 | (7.14 | ) | (6.88 | ) | (.14 | ) | (1.45 | ) | (1.59 | ) | 8.68 | |||||||||||||||||||
| 2007 |
14.80 | .15 | 2.59 | 2.74 | (.13 | ) | (.26 | ) | (.39 | ) | 17.15 | |||||||||||||||||||||
| Class C (9/01) |
||||||||||||||||||||||||||||||||
| 2012(f) |
10.51 | (.01 | ) | .29 | .28 | (.31 | ) | (1.40 | ) | (1.71 | ) | 9.08 | ||||||||||||||||||||
| 2011 |
11.03 | .01 | (.53 | ) | (.52 | ) | — | — | — | 10.51 | ||||||||||||||||||||||
| 2010 |
10.26 | (.02 | ) | .79 | .77 | — | — | — | 11.03 | |||||||||||||||||||||||
| 2009 |
8.25 | .02 | 1.99 | 2.01 | — | — | — | 10.26 | ||||||||||||||||||||||||
| 2008 |
16.36 | .15 | (6.79 | ) | (6.64 | ) | (.02 | ) | (1.45 | ) | (1.47 | ) | 8.25 | |||||||||||||||||||
| 2007 |
14.13 | .03 | 2.48 | 2.51 | (.02 | ) | (.26 | ) | (.28 | ) | 16.36 | |||||||||||||||||||||
| Class R3 (4/94)(e) |
||||||||||||||||||||||||||||||||
| 2012(f) |
11.11 | .02 | .30 | .32 | (.38 | ) | (1.40 | ) | (1.78 | ) | 9.65 | |||||||||||||||||||||
| 2011 |
11.61 | .07 | (.54 | ) | (.47 | ) | (.03 | ) | — | (.03 | ) | 11.11 | ||||||||||||||||||||
| 2010 |
10.78 | .04 | .82 | .86 | (.03 | ) | — | (.03 | ) | 11.61 | ||||||||||||||||||||||
| 2009 |
8.67 | .07 | 2.11 | 2.18 | (.07 | ) | — | (.07 | ) | 10.78 | ||||||||||||||||||||||
| 2008 |
17.17 | .19 | (7.10 | ) | (6.91 | ) | (.14 | ) | (1.45 | ) | (1.59 | ) | 8.67 | |||||||||||||||||||
| 2007 |
14.81 | .10 | 2.61 | 2.71 | (.09 | ) | (.26 | ) | (.35 | ) | 17.17 | |||||||||||||||||||||
| Class I (4/94)(e) |
||||||||||||||||||||||||||||||||
| 2012(f) |
11.25 | .04 | .31 | .35 | (.45 | ) | (1.40 | ) | (1.85 | ) | 9.75 | |||||||||||||||||||||
| 2011 |
11.78 | .14 | (.59 | ) | (.45 | ) | (.08 | ) | — | (.08 | ) | 11.25 | ||||||||||||||||||||
| 2010 |
10.92 | .10 | .83 | .93 | (.07 | ) | — | (.07 | ) | 11.78 | ||||||||||||||||||||||
| 2009 |
8.81 | .11 | 2.12 | 2.23 | (.12 | ) | — | (.12 | ) | 10.92 | ||||||||||||||||||||||
| 2008 |
17.38 | .30 | (7.24 | ) | (6.94 | ) | (.18 | ) | (1.45 | ) | (1.63 | ) | 8.81 | |||||||||||||||||||
| 2007 |
14.99 | .19 | 2.62 | 2.81 | (.16 | ) | (.26 | ) | (.42 | ) | 17.38 | |||||||||||||||||||||
| 56 | Nuveen Investments |
| Ratios/Supplemental Data | ||||||||||||||||||||||||||
| Ratios to Average Net Assets Before Reimbursement |
Ratios to Average Net Assets After Reimbursement(d) |
|||||||||||||||||||||||||
| Total Return(c) |
Ending Net Assets (000) |
Expenses | Net Invest- ment Income (Loss) |
Expenses | Net Invest- ment Income (Loss) |
Portfolio Turnover Rate |
||||||||||||||||||||
| 5.00 | % | $ | 22,569 | 2.12 | %* | (.08 | )%* | 1.48 | %* | .54 | %* | 30 | % | |||||||||||||
| (3.93 | ) | 22,328 | 1.46 | .84 | 1.46 | .84 | 72 | |||||||||||||||||||
| 8.21 | 26,698 | 1.59 | .51 | 1.48 | .62 | 56 | ||||||||||||||||||||
| 25.29 | 27,995 | 1.59 | .90 | 1.49 | 1.00 | 231 | ||||||||||||||||||||
| (43.82 | ) | 25,342 | 1.54 | 1.87 | 1.49 | 1.92 | 18 | |||||||||||||||||||
| 18.92 | 56,705 | 1.53 | .93 | 1.49 | .97 | 14 | ||||||||||||||||||||
| 4.61 | 1,747 | 2.84 | * | (.81 | )* | 2.23 | * | (.20 | )* | 30 | ||||||||||||||||
| (4.71 | ) | 1,987 | 2.21 | .10 | 2.21 | .10 | 72 | |||||||||||||||||||
| 7.50 | 2,607 | 2.34 | (.25 | ) | 2.23 | (.14 | ) | 56 | ||||||||||||||||||
| 24.36 | 3,269 | 2.34 | .14 | 2.24 | .24 | 231 | ||||||||||||||||||||
| (44.21 | ) | 3,232 | 2.29 | 1.15 | 2.24 | 1.20 | 18 | |||||||||||||||||||
| 18.09 | 7,173 | 2.28 | .16 | 2.24 | .20 | 14 | ||||||||||||||||||||
| 4.88 | 44 | 2.44 | * | (.29 | )* | 1.73 | * | .43 | * | 30 | ||||||||||||||||
| (4.10 | ) | 11 | 1.68 | .59 | 1.68 | .59 | 72 | |||||||||||||||||||
| 7.94 | 6 | 1.84 | .27 | 1.73 | .38 | 56 | ||||||||||||||||||||
| 25.39 | 5 | 1.84 | .63 | 1.74 | .73 | 231 | ||||||||||||||||||||
| (43.94 | ) | 2 | 1.79 | 1.35 | 1.74 | 1.40 | 18 | |||||||||||||||||||
| 18.66 | 4 | 1.78 | .56 | 1.74 | .60 | 14 | ||||||||||||||||||||
| 5.12 | 95,926 | 1.82 | * | .17 | * | 1.23 | * | .76 | * | 30 | ||||||||||||||||
| (3.90 | ) | 141,264 | 1.21 | 1.17 | 1.21 | 1.17 | 72 | |||||||||||||||||||
| 8.52 | 652,664 | 1.34 | .76 | 1.23 | .87 | 56 | ||||||||||||||||||||
| 25.68 | 680,309 | 1.34 | 1.15 | 1.24 | 1.25 | 231 | ||||||||||||||||||||
| (43.68 | ) | 658,276 | 1.29 | 2.14 | 1.24 | 2.19 | 18 | |||||||||||||||||||
| 19.23 | 1,670,810 | 1.28 | 1.17 | 1.24 | 1.21 | 14 | ||||||||||||||||||||
| (a) | Per share Net Investment Income (Loss) is calculated using the average daily shares method. |
| (b) | Distributions from Capital Gains include short-term capital gains, if any. |
| (c) | Total return is the combination of changes in net asset value without any sales charge, reinvested dividend income at net asset value and reinvested capital gains distributions at net asset value, if any. Total returns are not annualized. |
| (d) | After expense reimbursement from the Adviser, where applicable. |
| (e) | Effective January 18, 2011, Class R Shares and Class Y Shares previously offered by FAF Advisors, Inc. were renamed Class R3 Shares and Class I Shares, respectively. |
| (f) | For the six months ended April 30, 2012. |
| * | Annualized. |
See accompanying notes to financial statements.
| Nuveen Investments | 57 |
Financial Highlights (Unaudited) (continued)
| Selected data for a share outstanding throughout each period: | ||||||||||||||||||||||||||||||||
| Class (Commencement Date) | ||||||||||||||||||||||||||||||||
| Investment Operations | Less Distributions | |||||||||||||||||||||||||||||||
| INTERNATIONAL SELECT | ||||||||||||||||||||||||||||||||
| Year Ended October 31, |
Beginning Net Asset Value |
Net Invest- ment Income (Loss)(a) |
Net Realized/ Unrealized Gain (Loss) |
Total | Net Invest- ment Income |
Capital Gains(b) |
Total | Ending Net Asset Value |
||||||||||||||||||||||||
| Class A (12/06) |
||||||||||||||||||||||||||||||||
| 2012(g) |
$ | 8.85 | $ | .03 | $ | .33 | $ | .36 | $ | (.11 | ) | $ | (.10 | ) | $ | (.21 | ) | $ | 9.00 | |||||||||||||
| 2011 |
9.54 | .09 | (.72 | ) | (.63 | ) | (.06 | ) | — | (.06 | ) | 8.85 | ||||||||||||||||||||
| 2010 |
8.48 | .06 | 1.02 | 1.08 | (.02 | ) | — | (.02 | ) | 9.54 | ||||||||||||||||||||||
| 2009 |
6.53 | .07 | 2.00 | 2.07 | (.12 | ) | — | (.12 | ) | 8.48 | ||||||||||||||||||||||
| 2008 |
12.15 | .15 | (5.52 | ) | (5.37 | ) | (.06 | ) | (.19 | ) | (.25 | ) | 6.53 | |||||||||||||||||||
| 2007(f) |
10.00 | .09 | 2.07 | 2.16 | (.01 | ) | — | (.01 | ) | 12.15 | ||||||||||||||||||||||
| Class C (12/06) |
||||||||||||||||||||||||||||||||
| 2012(g) |
8.72 | — | * | .34 | .34 | (.04 | ) | (.10 | ) | (.14 | ) | 8.92 | ||||||||||||||||||||
| 2011 |
9.43 | .02 | (.72 | ) | (.70 | ) | (.01 | ) | — | (.01 | ) | 8.72 | ||||||||||||||||||||
| 2010 |
8.42 | .01 | 1.00 | 1.01 | — | — | — | 9.43 | ||||||||||||||||||||||||
| 2009 |
6.46 | .03 | 1.97 | 2.00 | (.04 | ) | — | (.04 | ) | 8.42 | ||||||||||||||||||||||
| 2008 |
12.07 | .09 | (5.48 | ) | (5.39 | ) | (.03 | ) | (.19 | ) | (.22 | ) | 6.46 | |||||||||||||||||||
| 2007(f) |
10.00 | .03 | 2.04 | 2.07 | — | — | — | 12.07 | ||||||||||||||||||||||||
| Class R3 (12/06)(e) |
||||||||||||||||||||||||||||||||
| 2012(g) |
8.67 | .02 | .32 | .34 | (.08 | ) | (.10 | ) | (.18 | ) | 8.83 | |||||||||||||||||||||
| 2011 |
9.48 | .10 | (.91 | ) | (.81 | ) | — | — | — | 8.67 | ||||||||||||||||||||||
| 2010 |
8.42 | .05 | 1.01 | 1.06 | — | — | — | 9.48 | ||||||||||||||||||||||||
| 2009 |
6.52 | .09 | 1.94 | 2.03 | (.13 | ) | — | (.13 | ) | 8.42 | ||||||||||||||||||||||
| 2008 |
12.12 | .08 | (5.46 | ) | (5.38 | ) | (.03 | ) | (.19 | ) | (.22 | ) | 6.52 | |||||||||||||||||||
| 2007(f) |
10.00 | .07 | 2.06 | 2.13 | (.01 | ) | — | (.01 | ) | 12.12 | ||||||||||||||||||||||
| Class I (12/06)(e) |
||||||||||||||||||||||||||||||||
| 2012(g) |
8.87 | .04 | .33 | .37 | (.13 | ) | (.10 | ) | (.23 | ) | 9.01 | |||||||||||||||||||||
| 2011 |
9.57 | .12 | (.74 | ) | (.62 | ) | (.08 | ) | — | (.08 | ) | 8.87 | ||||||||||||||||||||
| 2010 |
8.49 | .09 | 1.02 | 1.11 | (.03 | ) | — | (.03 | ) | 9.57 | ||||||||||||||||||||||
| 2009 |
6.55 | .08 | 2.01 | 2.09 | (.15 | ) | — | (.15 | ) | 8.49 | ||||||||||||||||||||||
| 2008 |
12.17 | .17 | (5.52 | ) | (5.35 | ) | (.08 | ) | (.19 | ) | (.27 | ) | 6.55 | |||||||||||||||||||
| 2007(f) |
10.00 | .13 | 2.05 | 2.18 | (.01 | ) | — | (.01 | ) | 12.17 | ||||||||||||||||||||||
| 58 | Nuveen Investments |
| Ratios/Supplemental Data | ||||||||||||||||||||||||||
| Ratios to Average Net Assets Before Reimbursement |
Ratios to Average Net Assets After Reimbursement(d) |
|||||||||||||||||||||||||
| Total Return(c) |
Ending Net Assets (000) |
Expenses | Net Invest- ment Income (Loss) |
Expenses | Net Invest- ment Income (Loss) |
Portfolio Turnover Rate |
||||||||||||||||||||
| 4.29 | % | $ | 4,166 | 1.55 | %** | .68 | %** | 1.48 | %** | .75 | %** | 24 | % | |||||||||||||
| (6.70 | ) | 4,388 | 1.46 | .96 | 1.46 | .96 | 59 | |||||||||||||||||||
| 12.72 | 5,530 | 1.62 | .56 | 1.49 | .69 | 47 | ||||||||||||||||||||
| 32.32 | 3,029 | 1.76 | .77 | 1.49 | 1.04 | 64 | ||||||||||||||||||||
| (45.00 | ) | 1,904 | 1.70 | 1.31 | 1.49 | 1.52 | 63 | |||||||||||||||||||
| 21.58 | 3,228 | 1.89 | * | .55 | ** | 1.49 | * | .95 | ** | 45 | ||||||||||||||||
| 4.02 | 735 | 2.30 | ** | (.06 | )** | 2.23 | ** | .01 | ** | 24 | ||||||||||||||||
| (7.45 | ) | 717 | 2.21 | .21 | 2.21 | .21 | 59 | |||||||||||||||||||
| 12.00 | 816 | 2.37 | (.05 | ) | 2.24 | .08 | 47 | |||||||||||||||||||
| 31.43 | 244 | 2.51 | .13 | 2.24 | .40 | 64 | ||||||||||||||||||||
| (45.39 | ) | 226 | 2.45 | .71 | 2.24 | .92 | 63 | |||||||||||||||||||
| 20.75 | 287 | 2.64 | ** | (.10 | )** | 2.24 | ** | .30 | ** | 45 | ||||||||||||||||
| 4.18 | 14 | 1.77 | ** | .47 | ** | 1.73 | ** | .51 | ** | 24 | ||||||||||||||||
| (8.54 | ) | 13 | 1.67 | 1.02 | 1.67 | 1.02 | 59 | |||||||||||||||||||
| 12.59 | 7 | 1.87 | .40 | 1.74 | .53 | 47 | ||||||||||||||||||||
| 31.99 | 19 | 2.01 | 1.03 | 1.74 | 1.30 | 64 | ||||||||||||||||||||
| (45.10 | ) | 48 | 1.95 | .69 | 1.74 | .90 | 63 | |||||||||||||||||||
| 21.27 | 17 | 2.14 | ** | .37 | ** | 1.74 | ** | .77 | ** | 45 | ||||||||||||||||
| 4.47 | 511,334 | 1.30 | ** | .91 | ** | 1.23 | ** | .98 | ** | 24 | ||||||||||||||||
| (6.60 | ) | 578,597 | 1.21 | 1.23 | 1.21 | 1.23 | 59 | |||||||||||||||||||
| 13.14 | 848,165 | 1.37 | .85 | 1.24 | .98 | 47 | ||||||||||||||||||||
| 32.68 | 584,667 | 1.51 | .90 | 1.24 | 1.17 | 64 | ||||||||||||||||||||
| (44.86 | ) | 249,805 | 1.45 | 1.51 | 1.24 | 1.72 | 63 | |||||||||||||||||||
| 21.78 | 343,161 | 1.64 | ** | .96 | ** | 1.24 | ** | 1.36 | ** | 45 | ||||||||||||||||
| (a) | Per share Net Investment Income (Loss) is calculated using the average daily shares method. |
| (b) | Distributions from Capital Gains include short-term capital gains, if any. |
| (c) | Total return is the combination of changes in net asset value without any sales charge, reinvested dividend income at net asset value and reinvested capital gains distributions at net asset value, if any. Total returns are not annualized. |
| (d) | After expense reimbursement from the Adviser, where applicable. |
| (e) | Effective January 18, 2011, Class R Shares and Class Y Shares previously offered by FAF Advisors, Inc. were renamed Class R3 Shares and Class I Shares, respectively. |
| (f) | For the period December 21, 2006 (commencement of operations) through October 31, 2007. |
| (g) | For the six months ended April 30, 2012. |
| * | Rounds to less than $.01 per share. |
| ** | Annualized. |
See accompanying notes to financial statements.
| Nuveen Investments | 59 |
Financial Highlights (Unaudited) (continued)
| Selected data for a share outstanding throughout each period: | ||||||||||||||||||||||||||||||||
| Class (Commencement Date) | ||||||||||||||||||||||||||||||||
| Investment Operations | Less Distributions | |||||||||||||||||||||||||||||||
| QUANTITATIVE ENHANCED CORE EQUITY | ||||||||||||||||||||||||||||||||
| Year Ended October 31, |
Beginning Net Asset Value |
Net Invest- ment Income (Loss)(a) |
Net Realized/ Unrealized Gain (Loss) |
Total | Net Invest- ment Income |
Capital Gains(b) |
Total | Ending Net Asset Value |
||||||||||||||||||||||||
| Class A (7/07) |
||||||||||||||||||||||||||||||||
| 2012(g) |
$ | 21.57 | $ | .19 | $ | 2.23 | $ | 2.42 | $ | (.37 | ) | $ | (.35 | ) | $ | (.72 | ) | $ | 23.27 | |||||||||||||
| 2011 |
20.50 | .31 | 1.02 | 1.33 | (.26 | ) | — | (.26 | ) | 21.57 | ||||||||||||||||||||||
| 2010 |
18.01 | .25 | 2.48 | 2.73 | (.24 | ) | — | (.24 | ) | 20.50 | ||||||||||||||||||||||
| 2009 |
16.56 | .31 | 1.29 | 1.60 | (.15 | ) | — | (.15 | ) | 18.01 | ||||||||||||||||||||||
| 2008 |
26.90 | .40 | (10.21 | ) | (9.81 | ) | (.29 | ) | (.24 | ) | (.53 | ) | 16.56 | |||||||||||||||||||
| 2007(f) |
25.00 | .06 | 1.91 | 1.97 | (.07 | ) | — | (.07 | ) | 26.90 | ||||||||||||||||||||||
| Class C (7/07) |
||||||||||||||||||||||||||||||||
| 2012(g) |
21.40 | .11 | 2.21 | 2.32 | (.20 | ) | (.35 | ) | (.55 | ) | 23.17 | |||||||||||||||||||||
| 2011 |
20.50 | .12 | 1.06 | 1.18 | (.28 | ) | — | (.28 | ) | 21.40 | ||||||||||||||||||||||
| 2010 |
17.91 | .08 | 2.51 | 2.59 | — | — | — | 20.50 | ||||||||||||||||||||||||
| 2009 |
16.51 | .24 | 1.24 | 1.48 | (.08 | ) | — | (.08 | ) | 17.91 | ||||||||||||||||||||||
| 2008 |
26.88 | .23 | (10.20 | ) | (9.97 | ) | (.16 | ) | (.24 | ) | (.40 | ) | 16.51 | |||||||||||||||||||
| 2007(f) |
25.00 | .02 | 1.90 | 1.92 | (.04 | ) | — | (.04 | ) | 26.88 | ||||||||||||||||||||||
| Class I (7/07)(e) |
||||||||||||||||||||||||||||||||
| 2012(g) |
21.64 | .22 | 2.22 | 2.44 | (.42 | ) | (.35 | ) | (.77 | ) | 23.31 | |||||||||||||||||||||
| 2011 |
20.57 | .37 | 1.03 | 1.40 | (.33 | ) | — | (.33 | ) | 21.64 | ||||||||||||||||||||||
| 2010 |
18.04 | .29 | 2.51 | 2.80 | (.27 | ) | — | (.27 | ) | 20.57 | ||||||||||||||||||||||
| 2009 |
16.57 | .35 | 1.29 | 1.64 | (.17 | ) | — | (.17 | ) | 18.04 | ||||||||||||||||||||||
| 2008 |
26.90 | .44 | (10.20 | ) | (9.76 | ) | (.33 | ) | (.24 | ) | (.57 | ) | 16.57 | |||||||||||||||||||
| 2007(f) |
25.00 | .11 | 1.87 | 1.98 | (.08 | ) | — | (.08 | ) | 26.90 | ||||||||||||||||||||||
| 60 | Nuveen Investments |
| Ratios/Supplemental Data | ||||||||||||||||||||||||||
| Ratios to Average Net Assets Before Reimbursement |
Ratios to Average Net Assets After Reimbursement(d) |
|||||||||||||||||||||||||
| Total Return(c) |
Ending Net Assets (000) |
Expenses | Net Invest- ment Income (Loss) |
Expenses | Net Invest- ment Income (Loss) |
Portfolio Turnover Rate |
||||||||||||||||||||
| 11.61 | % | $ | 129 | 1.13 | %* | 1.32 | %* | .70 | %* | 1.75 | %* | 92 | % | |||||||||||||
| 6.50 | 164 | .86 | 1.25 | .70 | 1.41 | 159 | ||||||||||||||||||||
| 15.24 | 253 | .93 | 1.05 | .70 | 1.28 | 142 | ||||||||||||||||||||
| 9.87 | 243 | 1.01 | 1.62 | .69 | 1.94 | 75 | ||||||||||||||||||||
| (37.08 | ) | 118 | 1.18 | 1.29 | .70 | 1.77 | 153 | |||||||||||||||||||
| 7.89 | 131 | 1.40 | * | .21 | * | .70 | * | .91 | * | 55 | ||||||||||||||||
| 11.17 | 121 | 1.91 | * | .53 | * | 1.45 | * | .99 | * | 92 | ||||||||||||||||
| 5.76 | 108 | 1.61 | .40 | 1.45 | .56 | 159 | ||||||||||||||||||||
| 14.46 | 14 | 1.68 | .20 | 1.45 | .43 | 142 | ||||||||||||||||||||
| 9.05 | 4 | 1.76 | 1.25 | 1.44 | 1.57 | 75 | ||||||||||||||||||||
| (37.58 | ) | 10 | 1.93 | .51 | 1.45 | .99 | 153 | |||||||||||||||||||
| 7.69 | 15 | 2.15 | * | (.47 | )* | 1.45 | * | .23 | * | 55 | ||||||||||||||||
| 11.72 | 93,014 | .89 | * | 1.57 | * | .45 | * | 2.02 | * | 92 | ||||||||||||||||
| 6.79 | 107,734 | .63 | 1.50 | .45 | 1.68 | 159 | ||||||||||||||||||||
| 15.61 | 203,316 | .68 | 1.27 | .45 | 1.50 | 142 | ||||||||||||||||||||
| 10.13 | 146,180 | .76 | 1.87 | .44 | 2.19 | 75 | ||||||||||||||||||||
| (36.93 | ) | 89,270 | .93 | 1.51 | .45 | 1.99 | 153 | |||||||||||||||||||
| 7.93 | 48,745 | 1.15 | * | 1.03 | * | .45 | * | 1.73 | * | 55 | ||||||||||||||||
| (a) | Per share Net Investment Income (Loss) is calculated using the average daily shares method. |
| (b) | Distributions from Capital Gains include short-term capital gains, if any. |
| (c) | Total return is the combination of changes in net asset value, reinvested dividend income at net asset value and reinvested capital gains distributions at net asset value, if any. Total returns are not annualized. |
| (d) | After expense reimbursement from the Adviser, where applicable. |
| (e) | Effective January 18, 2011, Class Y Shares previously offered by FAF Advisors, Inc. were renamed Class I Shares. |
| (f) | For the period July 31, 2007 (commencement of operations) through October 31, 2007. |
| (g) | For the six months ended April 30, 2012. |
| * | Annualized. |
See accompanying notes to financial statements.
| Nuveen Investments | 61 |
Financial Highlights (Unaudited) (continued)
| Selected data for a share outstanding throughout each period: | ||||||||||||||||||||||||||||||||
| Class (Commencement Date) | ||||||||||||||||||||||||||||||||
| Investment Operations | Less Distributions | |||||||||||||||||||||||||||||||
| TACTICAL MARKET OPPORTUNITIES | ||||||||||||||||||||||||||||||||
| Year Ended October 31, | Beginning Net Asset Value |
Net Invest- ment Income (Loss)(a) |
Net Realized/ Unrealized Gain (Loss) |
Total | Net Invest- ment Income |
Capital Gains(b) |
Total | Ending Net Asset Value |
||||||||||||||||||||||||
| Class A (2/11) |
||||||||||||||||||||||||||||||||
| 2012(h) |
$ | 11.22 | $ | .01 | $ | .12 | $ | .13 | $ | (.03 | ) | $ | (.17 | ) | $ | (.20 | ) | $ | 11.15 | |||||||||||||
| 2011(e) |
10.59 | .04 | .59 | .63 | — | — | — | 11.22 | ||||||||||||||||||||||||
| Class C (2/11) |
||||||||||||||||||||||||||||||||
| 2012(h) |
11.17 | (.03 | ) | .11 | .08 | — | (.17 | ) | (.17 | ) | 11.08 | |||||||||||||||||||||
| 2011(e) |
10.59 | — | * | .58 | .58 | — | — | — | 11.17 | |||||||||||||||||||||||
| Class I (12/09)(f) |
||||||||||||||||||||||||||||||||
| 2012(h) |
11.25 | .03 | .12 | .15 | (.06 | ) | (.17 | ) | (.23 | ) | 11.17 | |||||||||||||||||||||
| 2011 |
10.62 | .14 | .59 | .73 | (.08 | ) | (.02 | ) | (.10 | ) | 11.25 | |||||||||||||||||||||
| 2010(g) |
10.00 | .02 | .60 | .62 | — | — | — | 10.62 | ||||||||||||||||||||||||
| 62 | Nuveen Investments |
| Ratios/Supplemental Data | ||||||||||||||||||||||||||
| Ratios to Average Net Assets Before Reimbursement |
Ratios to Average Net Assets After Reimbursement(d) |
|||||||||||||||||||||||||
| Total Return(c) |
Ending Net Assets (000) |
Expenses | Net Invest- ment Income (Loss) |
Expenses | Net Invest- ment Income (Loss) |
Portfolio Turnover Rate |
||||||||||||||||||||
| 1.18% | $ | 43,015 | 1.23 | %** | .17 | %** | 1.18 | %** | .22 | %** | 104 | % | ||||||||||||||
| 5.95 | 3,558 | 1.67 | ** | .06 | ** | 1.19 | ** | .54 | 177 | |||||||||||||||||
| .73 | 7,982 | 1.98 | ** | (.59 | )** | 1.93 | ** | (.54 | )** | 104 | ||||||||||||||||
| 5.48 | 475 | 2.31 | ** | (.37 | )** | 1.94 | ** | — | *** | 177 | ||||||||||||||||
| 1.33 | 138,303 | .99 | ** | .52 | ** | .93 | ** | .58 | ** | 104 | ||||||||||||||||
| 6.95 | 48,860 | 1.18 | 1.01 | .94 | 1.25 | 177 | ||||||||||||||||||||
| 6.20 | 27,300 | 4.14 | ** | (1.83 | )** | .92 | ** | 1.39 | ** | 156 | ||||||||||||||||
| (a) | Per share Net Investment Income (Loss) is calculated using the average daily shares method. |
| (b) | Distributions from Capital Gains include short-term capital gains, if any. |
| (c) | Total return is the combination of changes in net asset value without any sales charge, reinvested dividend income at net asset value and reinvested capital gains distributions at net asset value, if any. Total returns are not annualized. |
| (d) | After expense reimbursement from the Adviser, where applicable. |
| (e) | For the period February 24, 2011 (commencement of operations) through October 31, 2011. |
| (f) | Effective January 18, 2011, Class Y Shares previously offered by FAF Advisors, Inc. were renamed Class I Shares. |
| (g) | For the period December 30, 2009 (commencement of operations) through October 31, 2010. |
| (h) | For the six months ended April 30, 2012. |
| * | Rounds to less than $.01 per share. |
| ** | Annualized. |
| *** | Annualized ratio rounds to less than .01%. |
See accompanying notes to financial statements.
| Nuveen Investments | 63 |
Notes to Financial Statements (Unaudited)
1. General Information and Significant Accounting Policies
General Information
Nuveen Investment Funds, Inc. (the “Trust”), is an open-end investment company registered under the Investment Company Act of 1940, as amended. The Trust is comprised of Nuveen International Fund (“International”), Nuveen International Select Fund (“International Select”), Nuveen Quantitative Enhanced Core Equity Fund (“Quantitative Enhanced Core Equity”) and Nuveen Tactical Market Opportunities Fund (“Tactical Market Opportunities”) (each a “Fund” and collectively, the “Funds”), among others. The Trust was incorporated in the state of Maryland on August 20, 1987.
International’s investment objective is long-term growth of capital. Under normal market conditions, the Fund invests primarily in equity securities of non-U.S. issuers that trade in U.S. or non-U.S. markets, depositary receipts representing shares of non-U.S. issuers, and exchange traded funds (“ETFs”) and other investment companies (“investment companies”) that provide exposure to non-U.S. issuers. Up to 15% of the Fund’s total assets may be invested in equity securities of emerging market issuers.
International Select’s investment objective is long-term growth of capital. Under normal market conditions, the Fund invests primarily in equity securities of non-U.S. issuers that trade in U.S. or non-U.S. markets, depositary receipts representing shares of foreign issuers, and ETFs and other investment companies that provide exposure to non-U.S. issuers.
International and International Select also may invest in options, futures contracts, options on futures contracts and forward foreign currency exchanges contracts (“derivatives”) to manage market or business risk, enhance its return or hedge against adverse movements in currency exchange rates.
Quantitative Enhanced Core Equity’s investment objective is to provide, over the long-term, a total return that exceeds the total return of the Standard & Poor’s 500 ® Index (“S&P 500 Index”). Under normal market conditions, the Fund invests at least 80% of its net assets, plus the amount of any borrowings for investment purposes, in equity securities that have market capitalization within the same range of market capitalization of companies in the S&P 500 Index. The Fund’s investments may include common stocks of non-U.S. issuers which are listed on a U.S. stock exchange. The Fund may also buy and sell stock index futures contracts.
Tactical Market Opportunities’ investment objective is to earn a positive total return over a reasonable period of time, regardless of market conditions. Under normal market conditions, the Fund will seek to outperform the Merrill Lynch 3 Month Treasury Bill Index (the “Treasury Bill Index”) by 400 basis points, or 4%, on an annualized basis. The Fund seeks to outperform the Treasury Bill Index over a reasonable period of time, although there is no guarantee that it will be able to do so. The Fund seeks to achieve its objective by investing in U.S. international and emerging market equity and debt securities (including high yield debt securities), commodities, currencies, high quality, short-term debt securities and money market funds. The Fund also gains exposure to these asset classes by investing in ETFs and derivative instruments such as options; futures contracts, including futures on equity and commodities indices, interest rate and currency futures; options on futures contracts; interest rate caps and floors; foreign currency contracts; options on foreign currencies; interest rate, total return, currency and credit default swaps; and options on the foregoing types of swap agreements.
Each Fund’s most recent prospectus provides further descriptions of each Fund’s investment objective, principal investment strategies and principal risks.
Effective at the close of business on February 15, 2012, Class B Shares of International were converted to Class A Shares of the Fund and are no longer available for dividend reinvestment or through an exchange from other Nuveen mutual funds.
Significant Accounting Policies
The following is a summary of significant accounting policies followed by the Funds in the preparation of their financial statements in accordance with accounting principles generally accepted in the United States (“U.S. GAAP”).
Investment Valuation
Common stocks and other equity-type securities are valued at the last sales price on the securities exchange on which such securities are primarily traded and are generally classified as Level 1 for fair value measurement purposes. Securities primarily traded on the NASDAQ National Market (“NASDAQ”) are valued, except as indicated below, at the NASDAQ Official Closing Price and are generally classified as Level 1. However, securities traded on a securities exchange or NASDAQ for which there were no transactions on a given day or securities not listed on a securities exchange or NASDAQ are valued at the quoted bid price and are generally classified as Level 2. Prices of certain American Depositary Receipts (“ADR”) held by the Funds that trade in the United States are valued based on the last traded price, official closing price, or the most recent bid price of the underlying non-U.S.-traded stock, adjusted as appropriate for the underlying-to-ADR conversion ratio and foreign exchange rate, and from time-to-time may also be adjusted further to take into account material events that may take place after the close of the local non-U.S. market but before the close of the New York Stock Exchange. These securities generally represent a transfer from a Level 1 to a Level 2 security.
The ETFs in which the Funds invests are valued at the last sales price on the securities exchange on which such securities are primarily traded and are generally classified as Level 1.
Investments in investment companies are valued at their respective net asset values on the valuation date. These investment vehicles are generally classified as Level 1.
| 64 | Nuveen Investments |
Prices of fixed-income securities are provided by a pricing service approved by the Funds’ Board of Directors. These securities are generally classified as Level 2. The pricing service establishes a security’s fair value using methods that may include consideration of the following: yields or prices of investments of comparable quality, type of issue, coupon, maturity and rating, market quotes or indications of value from security dealers, evaluations of anticipated cash flows or collateral, general market conditions and other information and analysis, including the obligor’s credit characteristics considered relevant. In pricing certain securities, particularly less liquid and lower quality securities, the pricing service may consider information about a security, its issuer, or market activity provided by Nuveen Fund Advisors, Inc. (the “Adviser”), a wholly-owned subsidiary of Nuveen Investments, Inc. (“Nuveen”). These securities are generally classified as Level 2 or Level 3 depending on the priority of the significant inputs.
Futures contracts are valued using the closing settlement price or, in the absence of such a price, the last traded price. Futures contracts are generally classified as Level 1.
If significant market events occur between the time of determination of the closing price of a foreign security on an exchange and the time that the Funds’ net asset value (NAV) is determined, or if under the Funds’ procedures, the closing price of a foreign security is not deemed to be reliable, the security would be valued at fair value as determined in accordance with procedures established in good faith by the Funds’ Board of Directors. These securities are generally classified as Level 2 or Level 3 depending on the priority of the significant inputs.
Certain securities may not be able to be priced by the pre-established pricing methods as described above. Such securities may be valued by the Funds’ Board of Directors or its designee at fair value. These securities generally include, but are not limited to, restricted securities (securities which may not be publicly sold without registration under the Securities Act of 1933, as amended) for which a pricing service is unable to provide a market price; securities whose trading has been formally suspended; debt securities that have gone into default and for which there is no current market quotation; a security whose market price is not available from a pre-established pricing source; a security with respect to which an event has occurred that is likely to materially affect the value of the security after the market has closed but before the calculation of a Fund’s net asset value (as may be the case in non-U.S. markets on which the security is primarily traded) or make it difficult or impossible to obtain a reliable market quotation; and a security whose price, as provided by the pricing service, is not deemed to reflect the security’s fair value. As a general principle, the fair value of a security would appear to be the amount that the owner might reasonably expect to receive for it in a current sale. A variety of factors may be considered in determining the fair value of such securities, which may include consideration of the following: yields or prices of investments of comparable quality, type of issue, coupon, maturity and rating, market quotes or indications of value from security dealers, evaluations of anticipated cash flows or collateral, general market conditions and other information and analysis, including the obligor’s credit characteristics considered relevant. These securities are generally classified as Level 2 or Level 3 depending on the priority of the significant inputs. Regardless of the method employed to value a particular security, all valuations are subject to review by the Funds’ Board of Directors or its designee.
Refer to Footnote 2 – Fair Value Measurements for further details on the leveling of securities held by the Funds as of the end of the reporting period.
Investment Transactions
Investment transactions are recorded on a trade date basis. Realized gains and losses from investment transactions are determined on the specific identification method, which is the same basis used for federal income tax purposes.
Investment Income
Dividend income is recorded on the ex-dividend date or, for foreign securities, when information is available. Interest income, which reflects the amortization of premiums includes accretion of discounts for financial reporting purposes is recorded on an accrual basis. Securities lending income is comprised of fees earned from borrowers and income earned on cash collateral investments, net of lending agent fees.
Income Taxes
Each Fund is a separate taxpayer for federal income tax purposes. Each Fund intends to distribute substantially all of its net investment income and net capital gains to shareholders and to otherwise comply with the requirements of Subchapter M of the Internal Revenue Code applicable to regulated investment companies. Therefore, no federal income tax provision is required.
For all open tax years and all major taxing jurisdictions, management of the Funds has concluded that there are no significant uncertain tax positions that would require recognition in the financial statements. Open tax years are those that are open for examination by taxing authorities (i.e., generally the last four tax year ends and the interim tax period since then). Furthermore, management of the Funds is also not aware of any tax positions for which it is reasonably possible that the total amounts of unrecognized tax benefits will significantly change in the next twelve months.
Dividends and Distributions to Shareholders
Dividends from net investment income and net realized gains from investment transactions, if any, are declared and distributed to shareholders at least annually. Furthermore, capital gains are distributed only to the extent they exceed available capital loss carryforwards.
Distributions to shareholders are recorded on the ex-dividend date. The amount and timing of distributions are determined in accordance with federal income tax regulations, which may differ from U.S. GAAP.
| Nuveen Investments | 65 |
Notes to Financial Statements (Unaudited) (continued)
Flexible Sales Charge Program
Class A Shares are generally sold with an up-front sales charge, with the exception of Quantitative Enhanced Core Equity, and incur a .25% annual 12b-1 service fee. Class A Share purchases of the Funds for $1 million or more are sold at net asset value without an up-front sales charge but may be subject to a contingent deferred sales charge (“CDSC”) if redeemed within twelve months of purchase. Quantitative Enhanced Core Equity only issues Class A Shares for purchase by certain retirement plans and by qualifying clients of investment advisers, financial planners or other financial intermediaries that charge periodic or asset-based fees for their services. Class A Shares of Quantitative Enhanced Core Equity are offered to those investors at their net asset value per share with no up-front sales charge. Class B Shares were sold without an up-front sales charge but incur a .75% annual 12b-1 distribution fee and a .25% annual 12b-1 service fee. Class B Shares are subject to a CDSC of up to 5% depending upon the length of time the shares are held by the investor (CDSC is reduced to 0% at the end of six years). Class B Shares automatically convert to Class A Shares eight years after purchase. Class C Shares are sold without an up-front sales charge but incur a .75% annual 12b-1 distribution fee and a .25% annual 12b-1 service fee. Class C Shares are subject to a CDSC of 1% if redeemed within twelve months of purchase. Class R3 Shares are sold without an up-front sales charge but incur a .25% annual 12b-1 distribution and a .25% annual service fee. Class I Shares are not subject to any sales charge or 12b-1 distribution or service fees.
Foreign Currency Transactions
Each Fund is authorized to engage in foreign currency exchange transactions, including foreign currency exchange contracts, futures, options and swap contracts. To the extent that the Funds invest in securities and/or contracts that are denominated in a currency other than U.S. dollars, the Funds will be subject to currency risk, which is the risk that an increase in the U.S. dollar relative to the foreign currency will reduce returns or portfolio value. Generally, when the U.S. dollar rises in value against a foreign currency, the Funds’ investments denominated in that currency will lose value because its currency is worth fewer U.S. dollars; the opposite effect occurs if the U.S. dollar falls in relative value. Investments and other assets and liabilities denominated in foreign currencies are converted into U.S. dollars on a spot (i.e. cash) basis at the spot rate prevailing in the foreign currency exchange market at the time of valuation. Purchases and sales of investments and income denominated in foreign currencies are translated into U.S. dollars on the respective dates of such transactions.
The books and records of the Funds are maintained in U.S. dollars. Foreign currencies, assets and liabilities are translated into U.S. dollars at 4:00 p.m. Eastern Time. Investment transactions, income and expenses are translated on the respective dates of such transactions. Net realized foreign currency gains and losses resulting from changes in exchange rates include foreign currency gains and losses between trade date and settlement date of the transactions, foreign currency transactions, and the difference between the amounts of interest and dividends recorded on the books of a Fund and the amounts actually received.
The realized gains and losses resulting from changes in foreign currency exchange rates and changes in foreign exchange rates associated with other assets and liabilities on investments, securities sold short, foreign currency exchange contracts, futures, options purchased, options written and swap contracts, when applicable, are recognized as a component of “Net realized gain (loss) from investments and foreign currency,” on the Statement of Operations.
The unrealized gains and losses resulting from changes in foreign currency exchange rates and changes in foreign exchange rates associated with other assets and liabilities on investments are recognized as a component of “Change in net unrealized appreciation (depreciation) of investments and foreign currency,” on the Statement of Operations, when applicable. The unrealized gains and losses resulting from changes in foreign exchange rates associated with foreign currency exchange contracts, futures, options purchased, options written and swap contracts are recognized as a component of “Change in net unrealized appreciation (depreciation) of foreign currency exchange contracts, futures, options purchased, options written and swap contracts, respectively” on the Statement of Operations, when applicable.
Futures Contracts
Each Fund is subject to equity price risk, interest rate risk and foreign currency exchange rate risk in the normal course of pursuing its investment objectives and is authorized to invest in futures contracts in an attempt to manage such risk. Upon entering into a futures contract, a Fund is required to deposit with the broker an amount of cash or liquid securities equal to a specified percentage of the contract amount. This is known as the “initial margin.” Cash held by the broker to cover initial margin requirements on open futures contracts, if any, is recognized as “Deposits with brokers for open futures contracts” on the Statement of Assets and Liabilities. Subsequent payments (“variation margin”) are made or received by a Fund each day, depending on the daily fluctuation of the value of the contract. Variation margin is recognized as a receivable and/or payable for “Variation margin on futures contracts” on the Statement of Assets and Liabilities, when applicable.
During the period the futures contract is open, changes in the value of the contract are recognized as an unrealized gain or loss by “marking-to-market” on a daily basis to reflect the changes in market value of the contract, which is recognized as a component of “Change in net unrealized appreciation (depreciation) of futures contracts” on the Statement of Operations. When the contract is closed or expired, a Fund records a realized gain or loss equal to the difference between the value of the contract on the closing date and value of the contract when originally entered into, which is recognized as a component of “Net realized gain (loss) from futures contracts” on the Statement of Operations.
Risks of investments in futures contracts include the possible adverse movement in the price of the securities or indices underlying the contracts, the possibility that there may not be a liquid secondary market for the contracts and/or that a change in the value of the contract may not correlate with a change in the value of the underlying securities or indices.
| 66 | Nuveen Investments |
During the six months ended April 30, 2012, International and International Select invested in equity and currency futures contracts, which were used as an overlay strategy to adjust the exposures created by the Funds’ multi-manager framework, so that each Fund overall had the desired exposures to key markets. These Funds’ long and short futures contracts were used to implement various tactical market and hedging strategies. Quantitative Enhanced Core Equity invested in S&P 500 Index futures contracts, which were used to convert cash into the equivalent of an S&P 500 Index holding in order to minimize any tracking error to the Fund’s benchmark index resulting from cash flow activity and for tactical portfolio management positioning. Tactical Market Opportunities invested in equity, fixed income and currency futures contracts, which were used as part of the management of the Fund. This Fund’s long and short futures contracts were used to implement various absolute return, tactical market and hedging strategies.
The average number of futures contracts outstanding during the six months ended April 30, 2012, for each Fund, were as follows:
| International | International Select |
Quantitative Enhanced Core Equity |
Tactical Market Opportunities |
|||||||||||||
| Average number of futures contracts outstanding* |
1,743 | 5,080 | 10 | 888 | ||||||||||||
| * | The average number of outstanding contracts is calculated based on the outstanding number of contracts at the beginning of the fiscal year and at the end of each fiscal quarter within the current fiscal year. |
Refer to Footnote 3 – Derivative Instruments and Hedging Activities for further details on futures contracts activity.
Market and Counterparty Credit Risk
In the normal course of business each Fund may invest in financial instruments and enter into financial transactions where risk of potential loss exists due to changes in the market (market risk) or failure of the other party to the transaction to perform (counterparty credit risk). The potential loss could exceed the value of the financial assets recorded on the financial statements. Financial assets, which potentially expose each Fund to counterparty credit risk, consist principally of cash due from counterparties on forward, option and swap transactions, when applicable. The extent of each Fund’s exposure to counterparty credit risk in respect to these financial assets approximates their carrying value as recorded on the Statement of Assets and Liabilities. Futures contracts, when applicable, expose a Fund to minimal counterparty credit risk as they are exchange traded and the exchange’s clearinghouse, which is counterparty to all exchange traded futures, guarantees the futures contracts against default.
Each Fund helps manage counterparty credit risk by entering into agreements only with counterparties the Adviser believes have the financial resources to honor their obligations and by having the Adviser monitor the financial stability of the counterparties. Additionally, counterparties may be required to pledge collateral daily (based on the daily valuation of the financial asset) on behalf of each Fund with a value approximately equal to the amount of any unrealized gain above a pre-determined threshold. Reciprocally, when each Fund has an unrealized loss, the Funds have instructed the custodian to pledge assets of the Funds as collateral with a value approximately equal to the amount of the unrealized loss above a pre-determined threshold. Collateral pledges are monitored and subsequently adjusted if and when the valuations fluctuate, either up or down, by at least the pre-determined threshold amount.
Multiclass Operations and Allocations
Income and expenses of the Funds that are not directly attributable to a specific class of shares are prorated among the classes based on the relative net assets of each class. Expenses directly attributable to a class of shares, which presently only include 12b-1 distribution fees and shareholder service fees, are recorded to the specific class.
Realized and unrealized capital gains and losses of the Funds are prorated among the classes based on the relative net assets of each class.
Securities Lending
In order to generate additional income, each Fund may lend securities representing up to one-third of the value of its total assets (which includes collateral for securities on loan) to broker-dealers, banks or other institutions. Each Fund’s policy is to receive cash collateral equal to at least 102% of the value of securities loaned, which is recognized as “Collateral from securities lending program” on the Statement of Assets and Liabilities. The adequacy of the collateral is monitored on a daily basis. If the value of the securities on loan increases, such that the level of collateralization falls below 102%, additional collateral is received from the borrower, which is recognized as “Due from broker” on the Statement of Assets and Liabilities, when applicable. As with other extensions of credit, there may be risks of delay in recovery of the securities or even loss of rights in the collateral should the borrower of the security fail financially.
The Funds’ custodian serves as the securities lending agent for the Funds. Each Fund pays the custodian a fee based on the Fund’s proportional share of the custodian’s expense of operating its securities lending program. Collateral for securities on loan is invested in a money market fund, which is recognized as “Investments purchased with collateral from securities lending” on the Statement of Assets and Liabilities.
| Nuveen Investments | 67 |
Notes to Financial Statements (Unaudited) (continued)
Income from securities lending, net of fees paid, is recognized on the Statement of Operations as “Securities lending income.” Securities lending fees paid by each Fund during the six months ended April 30, 2012, were as follows:
| International | International Select |
Quantitative Enhanced Core Equity |
Tactical Market Opportunities |
|||||||||||||
| Securities lending fees paid |
$ | — | $ | — | $ | 3,452 | $ | — | ||||||||
Indemnifications
Under the Trust’s organizational documents, its officers and directors are indemnified against certain liabilities arising out of the performance of their duties to the Trust. In addition, in the normal course of business, the Trust enters into contracts that provide general indemnifications to other parties. The Trust’s maximum exposure under these arrangements is unknown as this would involve future claims that may be made against the Trust that have not yet occurred. However, the Trust has not had prior claims or losses pursuant to these contracts and expects the risk of loss to be remote.
Use of Estimates
The preparation of financial statements in conformity with U.S. GAAP requires management to make estimates and assumptions that affect the reported amounts of assets and liabilities at the date of the financial statements and the reported amounts of increases and decreases in net assets from operations during the reporting period. Actual results may differ from those estimates.
2. Fair Value Measurements
Fair value is defined as the price that the Funds would receive upon selling an investment or transferring a liability in an orderly transaction to an independent buyer in the principal or most advantageous market for the investment. A three-tier hierarchy is used to maximize the use of observable market data and minimize the use of unobservable inputs and to establish classification of fair value measurements for disclosure purposes. Observable inputs reflect the assumptions market participants would use in pricing the asset or liability. Observable inputs are based on market data obtained from sources independent of the reporting entity. Unobservable inputs reflect the reporting entity’s own assumptions about the assumptions market participants would use in pricing the asset or liability. Unobservable inputs are based on the best information available in the circumstances. The three-tier hierarchy of inputs is summarized in the three broad levels listed below:
| Level 1 – | Quoted prices in active markets for identical securities. | |
| Level 2 – | Other significant observable inputs (including quoted prices for similar securities, interest rates, prepayment speeds, credit risk, etc.). | |
| Level 3 – | Significant unobservable inputs (including management’s assumptions in determining the fair value of investments). |
The inputs or methodologies used for valuing securities are not an indication of the risk associated with investing in those securities. The following is a summary of each Fund’s fair value measurements as of April 30, 2012:
| International | Level 1 | Level 2 | Level 3 | Total | ||||||||||||
| Long-Term Investments: |
||||||||||||||||
| Common Stocks* |
$ | 95,487,469 | $ | 3,407,171 | $ | — | $ | 98,894,640 | ||||||||
| Exchange-Traded Funds |
8,317,587 | — | — | 8,317,587 | ||||||||||||
| Rights |
— | — | 15,407 | 15,407 | ||||||||||||
| Short-Term Investments: |
||||||||||||||||
| Money Market Funds |
3,070,135 | — | — | 3,070,135 | ||||||||||||
| U.S. Government and Agency Obligations |
— | 8,767,919 | — | 8,767,919 | ||||||||||||
| Derivatives: |
||||||||||||||||
| Futures Contracts** |
(852,364 | ) | — | — | (852,364 | ) | ||||||||||
| Total |
$ | 106,022,827 | $ | 12,175,090 | $ | 15,407 | $ | 118,213,324 | ||||||||
| International Select | Level 1 | Level 2 | Level 3 | Total | ||||||||||||
| Long-Term Investments: |
||||||||||||||||
| Common Stocks* |
$ | 405,306,718 | $ | 10,642,846 | $ | 763,905 | $ | 416,713,469 | ||||||||
| Exchange-Traded Funds |
34,997,450 | — | — | 34,997,450 | ||||||||||||
| Rights |
— | — | 37,526 | 37,526 | ||||||||||||
| Short-Term Investments: |
||||||||||||||||
| Money Market Funds |
32,740,867 | — | — | 32,740,867 | ||||||||||||
| U.S. Government and Agency Obligations |
— | 29,760,843 | — | 29,760,843 | ||||||||||||
| Derivatives: |
||||||||||||||||
| Futures Contracts** |
(2,542,803 | ) | — | — | (2,542,803 | ) | ||||||||||
| Total |
$ | 470,502,232 | $ | 40,403,689 | $ | 801,431 | $ | 511,707,352 | ||||||||
| * | Refer to the Fund’s Portfolio of Investments for industry breakdown of Common Stocks classified as Level 2. |
| ** | Represents net unrealized appreciation (depreciation) as reported in the Fund’s Portfolio of Investments. |
| 68 | Nuveen Investments |
| Quantitative Enhanced Core Equity | Level 1 | Level 2 | Level 3 | Total | ||||||||||||
| Long-Term Investments: |
||||||||||||||||
| Common Stocks |
$ | 88,161,575 | $ | — | $ | — | $ | 88,161,575 | ||||||||
| Investments Purchased with Collateral from Securities Lending |
21,361,416 | — | — | 21,361,416 | ||||||||||||
| Short-Term Investments: |
||||||||||||||||
| U.S. Government and Agency Obligations |
— | 349,824 | — | 349,824 | ||||||||||||
| Derivatives: |
||||||||||||||||
| Futures Contracts** |
(12,206 | ) | — | — | (12,206 | ) | ||||||||||
| Total |
$ | 109,510,785 | $ | 349,824 | $ | — | $ | 109,860,609 | ||||||||
| Tactical Market Opportunities | Level 1 | Level 2 | Level 3 | Total | ||||||||||||
| Long-Term Investments: |
||||||||||||||||
| Exchange-Traded Funds |
$ | 55,538,965 | $ | — | $ | — | $ | 55,538,965 | ||||||||
| Sovereign Debt |
— | 809,250 | — | 809,250 | ||||||||||||
| U.S. Government & Agency Obligations |
— | 6,643,811 | — | 6,643,811 | ||||||||||||
| Short-Term Investments: |
||||||||||||||||
| Money Market Funds |
97,862,153 | — | — | 97,862,153 | ||||||||||||
| U.S. Government and Agency Obligations |
— | 22,289,489 | — | 22,289,489 | ||||||||||||
| Derivatives: |
||||||||||||||||
| Futures Contracts** |
(28,863 | ) | — | — | (28,863 | ) | ||||||||||
| Total |
$ | 153,372,255 | $ | 29,742,550 | $ | — | $ | 183,114,805 | ||||||||
| ** | Represents net unrealized appreciation (depreciation) as reported in the Fund’s Portfolio of Investments. |
The following is a reconciliation of the Funds’ Level 3 investments held at the beginning and end of the measurement period:
| International Level 3 Rights |
International Select Level 3 Common Stocks |
International Select Level 3 Rights |
International Select Level 3 Total |
|||||||||||||
| Balance at the beginning of period |
$ | — | $ | 1,116,787 | $ | — | $ | 1,116,787 | ||||||||
| Gains (losses): |
||||||||||||||||
| Net realized gains (losses) |
— | — | — | — | ||||||||||||
| Net change in unrealized appreciation (depreciation) |
(8,135 | ) | 96,502 | (19,390 | ) | 77,112 | ||||||||||
| Purchases at cost |
23,542 | — | 56,916 | 56,916 | ||||||||||||
| Sales at proceeds |
— | — | — | — | ||||||||||||
| Net discounts (premiums) |
— | — | — | — | ||||||||||||
| Transfers in to |
— | 763,905 | — | 763,905 | ||||||||||||
| Transfers out of |
— | (1,213,289 | ) | — | (1,213,289 | ) | ||||||||||
| Balance at the end of period |
$ | 15,407 | $ | 763,905 | $ | 37,526 | $ | 801,431 | ||||||||
| Change in net unrealized appreciation (depreciation) during the year of Level 3 securities held as of April 30, 2012 |
$ | (8,135 | ) | $ | (321,476 | ) | $ | (19,390 | ) | $ | (340,866 | ) | ||||
| Quantitative Enhanced Core Equity Level 3 Common Stocks |
||||
| Balance at the beginning of period |
$ | — | *** | |
| Gains (losses): |
||||
| Net realized gains (losses) |
— | |||
| Net change in unrealized appreciation (depreciation) |
— | |||
| Purchases at cost |
— | |||
| Sales at proceeds |
— | |||
| Net discounts (premiums) |
— | |||
| Transfers into |
— | |||
| Transfers (out of) |
— | |||
| Balance at the end of period |
$ | — | ||
| Change in net unrealized appreciation (depreciation) during the year of Level 3 securities held as of April 30, 2012 |
$ | — | ||
| *** | Level 3 security has a market value of zero at the beginning of the period. As of April 30, 2012, this security is no longer held in the portfolio. |
During the six months ended April 30, 2012, the Funds recognized no significant transfers to or from Level 1 or Level 2. Transfers in and/or out of Level 3 are shown using end of period values.
| Nuveen Investments | 69 |
Notes to Financial Statements (Unaudited) (continued)
3. Derivative Instruments and Hedging Activities
The Funds record derivative instruments at fair value, with changes in fair value recognized on the Statement of Operations, when applicable. Even though the Funds’ investments in derivatives may represent economic hedges, they are not considered to be hedge transactions for financial reporting purposes. For additional information on the derivative instruments in which each Fund was invested during and at the end of the reporting period, refer to the Portfolios of Investments, Financial Statements and Footnote 1 – General Information and Significant Accounting Policies.
The following tables present the fair value of all derivative instruments held by the Funds as of April 30, 2012, the location of these instruments on the Statement of Assets and Liabilities, and the primary underlying risk exposure.
| International |
||||||||||||||
| Location on the Statement of Assets and Liabilities |
||||||||||||||
| Underlying Risk Exposure |
Derivative Instrument |
Asset Derivatives |
Liability Derivatives |
|||||||||||
| Location | Value | Location | Value | |||||||||||
| Equity |
Futures Contracts |
Payable for variation margin on futures contracts* | $ | 594,096 | Payable for variation margin on futures contracts* | $ | (1,414,585 | ) | ||||||
| Foreign Currency Exchange Rate |
Futures Contracts |
— | — | Payable for variation margin on futures contracts* | (31,875 | ) | ||||||||
| Total |
$ | 594,096 | $ | (1,446,460 | ) | |||||||||
| International Select | ||||||||||||||
| Location on the Statement of Assets and Liabilities |
||||||||||||||
| Underlying Risk Exposure |
Derivative Instrument |
Asset Derivatives |
Liability Derivatives |
|||||||||||
| Location | Value | Location | Value | |||||||||||
| Equity |
Futures Contracts |
Receivable for variation margin on futures contracts* | $ | 1,812,616 | Receivable for variation margin on futures contracts* | $ | (4,206,859 | ) | ||||||
| Foreign Currency Exchange Rate |
Futures Contracts |
— | — | Receivable for variation margin on futures contracts* | (148,560 | ) | ||||||||
| Total |
$ | 1,812,616 | $ | (4,355,419 | ) | |||||||||
| Quantitative Enhanced Core Equity | ||||||||||||||
| Location on the Statement of Assets and Liabilities |
||||||||||||||
| Underlying Risk Exposure |
Derivative Instrument |
Asset Derivatives |
Liability Derivatives |
|||||||||||
| Location | Value | Location | Value | |||||||||||
| Equity |
Futures Contracts |
— | $ | — | Payable for variation margin on futures contracts* | $ | (12,206 | ) | ||||||
| Tactical Market Opportunities | ||||||||||||||
| Location on the Statement of Assets and Liabilities |
||||||||||||||
| Underlying Risk Exposure |
Derivative Instrument |
Asset Derivatives |
Liability Derivatives |
|||||||||||
| Location | Value | Location | Value | |||||||||||
| Equity |
Futures Contracts |
Receivable for variation margin on futures contracts* | $ | 654,145 | Receivable for variation margin on futures contracts* | $ | (803,173 | ) | ||||||
| Foreign Currency Exchange Rate |
Futures Contracts |
Receivable for variation margin on futures contracts* | 35,018 | Receivable for variation margin on futures contracts* | (29,965 | ) | ||||||||
| Interest Rate |
Futures Contracts |
Receivable for variation margin on futures contracts* | 115,112 | — | — | |||||||||
| Total |
$ | 804,275 | $ | (833,138 | ) | |||||||||
| * | Value represents cumulative gross unrealized appreciation (depreciation) of futures contracts as reported in the Fund’s Portfolio of Investments and not the deposits with brokers, if any, or receivable or payable for variation margin on futures contracts presented on the Statement of Assets and Liabilities. |
| 70 | Nuveen Investments |
The following tables present the amount of net realized gain (loss) and change in net unrealized appreciation (depreciation) recognized for the six months ended April 30, 2012, on derivative instruments, as well as the primary risk exposure associated with each.
| Net Realized Gain (Loss) from Futures Contracts | International | International Select |
Quantitative Enhanced Core Equity |
Tactical Market Opportunities |
||||||||||||
| Risk Exposure |
||||||||||||||||
| Equity |
$ | 2,292,204 | $ | (2,215,592 | ) | $ | 783,205 | $ | 133,270 | |||||||
| Foreign Currency Exchange Rate |
(19,834 | ) | (448,246 | ) | — | (402,607 | ) | |||||||||
| Interest Rate |
— | — | — | 31,837 | ||||||||||||
| Total |
$ | 2,272,370 | $ | (2,663,838 | ) | $ | 783,205 | $ | (237,500 | ) | ||||||
| Change in Net Unrealized Appreciation (Depreciation) of Futures Contracts |
International | International Select |
Quantitative Enhanced Core Equity |
Tactical Market Opportunities |
||||||||||||
| Risk Exposure |
||||||||||||||||
| Equity |
$ | (2,248,478 | ) | $ | (1,651,329 | ) | $ | (84,028 | ) | $ | (181,815 | ) | ||||
| Foreign Currency Exchange Rate |
(31,875 | ) | 575,662 | — | 289,601 | |||||||||||
| Interest Rate |
— | — | — | 99,259 | ||||||||||||
| Total |
$ | (2,280,353 | ) | $ | (1,075,667 | ) | $ | (84,028 | ) | $ | 207,045 | |||||
4. Fund Shares
Transactions in Fund shares were as follows:
| International | ||||||||||||||||
| Six Months Ended 4/30/12 |
Year Ended 10/31/11 |
|||||||||||||||
| Shares | Amount | Shares | Amount | |||||||||||||
| Shares sold: |
||||||||||||||||
| Class A |
156,589 | $ | 1,510,097 | 155,847 | $ | 1,889,675 | ||||||||||
| Class B |
— | — | 708 | 7,844 | ||||||||||||
| Class C |
6,094 | 56,175 | 9,594 | 107,941 | ||||||||||||
| Class R3 (1) |
3,625 | 33,788 | 420 | 4,678 | ||||||||||||
| Class I (1) |
611,892 | 5,901,315 | 610,959 | 7,524,184 | ||||||||||||
| Shares issued to shareholders due to reinvestment of |
||||||||||||||||
| Class A |
391,582 | 3,481,781 | 8,099 | 98,570 | ||||||||||||
| Class B |
19,368 | 153,859 | — | — | ||||||||||||
| Class C |
38,018 | 317,206 | — | — | ||||||||||||
| Class R3 (1) |
321 | 2,849 | 1 | 15 | ||||||||||||
| Class I (1) |
779,190 | 7,042,217 | 244,138 | 3,005,335 | ||||||||||||
| 2,006,679 | 18,499,287 | 1,029,766 | 12,638,242 | |||||||||||||
| Shares redeemed: |
||||||||||||||||
| Class A |
(215,370 | ) | (2,099,913 | ) | (452,448 | ) | (5,470,263 | ) | ||||||||
| Class B |
(113,441 | ) | (981,338 | ) | (48,241 | ) | (533,542 | ) | ||||||||
| Class C |
(40,803 | ) | (350,950 | ) | (56,942 | ) | (628,677 | ) | ||||||||
| Class R3 (1) |
(382 | ) | (3,444 | ) | (8 | ) | (93 | ) | ||||||||
| Class I (1) |
(4,112,069 | ) | (40,463,550 | ) | (43,702,675 | ) | (488,588,531 | ) | ||||||||
| (4,482,065 | ) | (43,899,195 | ) | (44,260,314 | ) | (495,221,106 | ) | |||||||||
| Net increase (decrease) |
(2,475,386 | ) | $ | (25,399,908 | ) | (43,230,548 | ) | $ | (482,582,864 | ) | ||||||
| (1) | Effective January 18, 2011, Class R Shares and Class Y Shares previously offered by FAF Advisors, Inc. were renamed Class R3 Shares and Class I Shares, respectively. |
| Nuveen Investments | 71 |
Notes to Financial Statements (Unaudited) (continued)
| International Select | ||||||||||||||||
| Six Months Ended 4/30/12 |
Year Ended 10/31/11 |
|||||||||||||||
| Shares | Amount | Shares | Amount | |||||||||||||
| Shares sold: |
||||||||||||||||
| Class A |
21,778 | $ | 195,165 | 128,323 | $ | 1,261,455 | ||||||||||
| Class C |
4,783 | 42,465 | 10,355 | 102,343 | ||||||||||||
| Class R3 (1) |
— | — | 1,599 | 15,960 | ||||||||||||
| Class I (1) |
6,408,822 | 55,805,630 | 10,212,001 | 98,730,139 | ||||||||||||
| Shares issued to shareholders due to reinvestment of distributions: |
||||||||||||||||
| Class A |
10,687 | 86,950 | 2,840 | 28,114 | ||||||||||||
| Class C |
1,333 | 10,675 | 71 | 695 | ||||||||||||
| Class R3 (1) |
35 | 277 | — | — | ||||||||||||
| Class I (1) |
562,947 | 4,583,692 | 152,246 | 1,508,759 | ||||||||||||
| 7,010,385 | 60,724,854 | 10,507,435 | 101,647,465 | |||||||||||||
| Shares redeemed: |
||||||||||||||||
| Class A |
(65,816 | ) | (570,693 | ) | (214,539 | ) | (2,113,176 | ) | ||||||||
| Class C |
(5,834 | ) | (48,991 | ) | (14,772 | ) | (145,301 | ) | ||||||||
| Class R3 (1) |
— | — | (787 | ) | (7,720 | ) | ||||||||||
| Class I (1) |
(15,477,847 | ) | (133,928,486 | ) | (33,796,114 | ) | (328,217,857 | ) | ||||||||
| (15,549,497 | ) | (134,548,170 | ) | (34,026,212 | ) | (330,484,054 | ) | |||||||||
| Net increase (decrease) |
(8,539,112 | ) | $ | (73,823,316 | ) | (23,518,777 | ) | $ | (228,836,589 | ) | ||||||
| Quantitative Enhanced Core Equity | ||||||||||||||||
| Six Months Ended 4/30/12 |
Year Ended 10/31/11 |
|||||||||||||||
| Shares | Amount | Shares | Amount | |||||||||||||
| Shares sold: |
||||||||||||||||
| Class A |
371 | $ | 8,490 | 2,166 | $ | 47,265 | ||||||||||
| Class C |
— | — | 4,938 | 108,004 | ||||||||||||
| Class I (1) |
169,700 | 3,596,307 | 440,684 | 9,684,463 | ||||||||||||
| Shares issued to shareholders due to reinvestment of distributions: |
||||||||||||||||
| Class A |
232 | 4,850 | 98 | 2,118 | ||||||||||||
| Class C |
136 | 2,801 | 44 | 946 | ||||||||||||
| Class I (1) |
65,570 | 1,371,408 | 40,343 | 875,048 | ||||||||||||
| 236,009 | 4,983,856 | 488,273 | 10,717,844 | |||||||||||||
| Shares redeemed: |
||||||||||||||||
| Class A |
(2,663 | ) | (58,486 | ) | (7,005 | ) | (152,739 | ) | ||||||||
| Class C |
— | — | (589 | ) | (12,027 | ) | ||||||||||
| Class I (1) |
(1,223,416 | ) | (26,902,135 | ) | (4,516,389 | ) | (97,441,957 | ) | ||||||||
| Class I (1) —In-kind |
— | — | (871,073 | ) | (17,935,393 | ) | ||||||||||
| (1,226,079 | ) | (26,960,621 | ) | (5,395,056 | ) | (115,542,116 | ) | |||||||||
| Net increase (decrease) |
(990,070 | ) | $ | (21,976,765 | ) | (4,906,783 | ) | $ | (104,824,272 | ) | ||||||
| (1) | Effective January 18, 2011, Class R Shares and Class Y Shares previously offered by FAF Advisors, Inc. were renamed Class R3 Shares and Class I Shares, respectively. |
| 72 | Nuveen Investments |
| Tactical Market Opportunities | ||||||||||||||||
| Six Months Ended 4/30/12 |
Year Ended 10/31/11 |
|||||||||||||||
| Shares | Amount | Shares | Amount | |||||||||||||
| Shares sold: |
||||||||||||||||
| Class A |
3,793,969 | $ | 42,202,062 | 330,236 | $ | 3,676,372 | ||||||||||
| Class C |
690,807 | 7,639,403 | 42,498 | 468,794 | ||||||||||||
| Class I (1) |
8,419,683 | 93,766,751 | 2,709,930 | 29,682,437 | ||||||||||||
| Shares issued to shareholders due to reinvestment of |
||||||||||||||||
| Class A |
20,431 | 225,356 | — | — | ||||||||||||
| Class C |
1,961 | 21,516 | — | — | ||||||||||||
| Class I (1) |
96,689 | 1,069,790 | 15,144 | 158,329 | ||||||||||||
| 13,023,540 | 144,924,878 | 3,097,808 | 33,985,932 | |||||||||||||
| Shares redeemed: |
||||||||||||||||
| Class A |
(273,611 | ) | (3,038,463 | ) | (13,147 | ) | (145,801 | ) | ||||||||
| Class C |
(14,864 | ) | (164,602 | ) | — | — | ||||||||||
| Class I (1) |
(482,037 | ) | (5,365,445 | ) | (954,155 | ) | (10,203,860 | ) | ||||||||
| (770,512 | ) | (8,568,510 | ) | (967,302 | ) | (10,349,661 | ) | |||||||||
| Net increase (decrease) |
12,253,028 | $ | 136,356,368 | 2,130,506 | $ | 23,636,271 | ||||||||||
| (1) | Effective January 18, 2011, Class R Shares and Class Y Shares previously offered by FAF Advisors, Inc. were renamed Class R3 Shares and Class I Shares, respectively. |
Class B Shares converted to Class A Shares (recognized as a component of Class A Shares sold and Class B Shares redeemed) during the six months ended April 30, 2012, and fiscal year ended October 31, 2011, were as follows:
| Fund | Six Months Ended 4/30/12 |
Year Ended 10/31/11 |
||||||
| International |
110,163 | 23,122 | ||||||
5. Investment Transactions
Purchases and sales (including maturities but excluding short-term investments and derivative transactions) during the six months ended April 30, 2012, were as follows:
| International | International Select |
Quantitative Enhanced Core Equity |
Tactical Market Opportunities |
|||||||||||||
| Purchases: |
||||||||||||||||
| Investment securities |
$ | 36,108,683 | $ | 118,164,631 | $ | 86,412,694 | $ | 58,652,686 | ||||||||
| U.S. Government and agency obligations |
— | — | — | 27,559,984 | ||||||||||||
| Sales and maturities: |
||||||||||||||||
| Investment securities |
85,423,510 | 221,239,765 | 113,098,981 | 19,727,414 | ||||||||||||
| U.S. Government and agency obligations |
— | — | — | 28,043,586 | ||||||||||||
6. Income Tax Information
The following information is presented on an income tax basis. Differences between amounts for financial statement and federal income tax purposes are primarily due to timing differences in recognizing certain gains and losses on investment transactions. To the extent that differences arise that are permanent in nature, such amounts are reclassified within the capital accounts as detailed below. Temporary differences do not require reclassification. Temporary and permanent differences do not impact the net asset values of the Funds.
At April 30, 2012, the cost and unrealized appreciation (depreciation) of investments (excluding investments in derivatives), as determined on a federal income tax basis, were as follows:
| International | International Select |
Quantitative Enhanced Core Equity |
Tactical Market Opportunities |
|||||||||||||
| Cost of investments |
$ | 116,497,762 | $ | 497,380,109 | $ | 101,245,768 | $ | 181,643,982 | ||||||||
| Gross unrealized: |
||||||||||||||||
| Appreciation |
$ | 12,533,643 | $ | 57,286,241 | $ | 11,084,419 | $ | 1,910,141 | ||||||||
| Depreciation |
(9,965,717 | ) | (40,416,195 | ) | (2,457,372 | ) | (410,455 | ) | ||||||||
| Net unrealized appreciation (depreciation) of investments |
$ | 2,567,926 | $ | 16,870,046 | $ | 8,627,047 | $ | 1,499,686 | ||||||||
| Nuveen Investments | 73 |
Notes to Financial Statements (Unaudited) (continued)
Permanent differences, primarily due to the redemption in-kind, tax equalization, REIT adjustments, foreign currency reclassifications and investments in passive foreign investment companies, resulted in reclassifications among the Funds’ components of net assets at October 31, 2011, the Funds’ last tax year end, as follows:
| International | International Select |
Quantitative Enhanced Core Equity |
Tactical Market Opportunities |
|||||||||||||
| Capital paid-in |
$ | 51,556,643 | $ | 6,812,345 | $ | 5,389,685 | $ | — | ||||||||
| Undistributed (Over-distribution) of net investment income |
(1,304,412 | ) | (1,205,020 | ) | (59,953 | ) | 7,382 | |||||||||
| Accumulated net realized gain (loss) |
(50,252,231 | ) | (5,607,325 | ) | (5,329,732 | ) | (7,382 | ) | ||||||||
The tax components of undistributed net ordinary income and net long-term capital gains at October 31, 2011, the Funds’ last tax year end, were as follows:
| International | International Select |
Quantitative Enhanced Core Equity |
Tactical Market Opportunities |
|||||||||||||
| Undistributed net ordinary income* |
$ | 6,142,535 | $ | 7,992,972 | $ | 1,950,713 | $ | 1,123,426 | ||||||||
| Undistributed net long-term capital gains |
19,357,175 | 6,305,748 | 1,581,249 | 395,716 | ||||||||||||
| * | Net ordinary income consists of net taxable income derived from dividends, interest and net short-term capital gains, if any. |
The tax character of distributions paid during the Funds’ last tax year ended October 31, 2011, was designated for purposes of the dividends paid deduction as follows:
| International | International Select |
Quantitative Enhanced Core Equity |
Tactical Market Opportunities |
|||||||||||||
| Distributions from net ordinary income* |
$ | 4,302,783 | $ | 6,488,314 | $ | 2,867,492 | $ | 202,030 | ||||||||
| Distributions from net long-term capital gains |
— | — | — | — | ||||||||||||
| * | Net ordinary income consists of net taxable income derived from dividends, interest, net short-term capital gains and current year earnings and profits attributable to realized gains, if any. |
During the Funds’ last tax year ended October 31, 2011, the following Funds utilized their capital loss carryforwards as follows:
| International | International Select |
Quantitative Enhanced Core Equity |
||||||||||
| Utilized capital loss carryforwards |
$ | 14,507,197 | $ | 38,754,135 | $ | 7,765,820 | ||||||
7. Management Fees and Other Transactions with Affiliates
Each Fund’s management fee consists of two components – a fund-level fee, based only on the amount of assets within each individual Fund, and a complex-level fee, based on the aggregate amount of all eligible fund assets managed by the Adviser. This pricing structure enables each Fund’s shareholders to benefit from growth in the assets within their respective Fund as well as from growth in the amount of complex-wide assets managed by the Adviser.
The annual fund-level fee for each Fund, payable monthly, is calculated according to the following schedule:
| Average Daily Net Assets | International | International Select |
Quantitative Enhanced Core Equity |
Tactical Market Opportunities |
||||||||||||
| For the first $125 million |
.8500 | % | .8500 | % | .3000 | % | .6000 | % | ||||||||
| For the next $125 million |
.8375 | .8375 | .2875 | .5875 | ||||||||||||
| For the next $250 million |
.8250 | .8250 | .2750 | .5750 | ||||||||||||
| For the next $500 million |
.8125 | .8125 | .2625 | .5625 | ||||||||||||
| For the next $1 billion |
.8000 | .8000 | .2500 | .5500 | ||||||||||||
| For net assets over $2 billion |
.7750 | .7750 | .2250 | .5250 | ||||||||||||
| 74 | Nuveen Investments |
The annual complex-level fee for each Fund, payable monthly, is determined by taking the complex-level fee rate, which is based on the aggregate amount of “eligible assets” of all Nuveen funds as set forth in the schedule below, and making, as appropriate, an upward adjustment to that rate based upon the percentage of the particular fund’s assets that are not “eligible assets.” The complex-level fee schedule for each Fund is as follows:
| Complex-Level Asset Breakpoint Level* | Effective Rate at Breakpoint Level | |||
| $55 billion |
.2000 | % | ||
| $56 billion |
.1996 | |||
| $57 billion |
.1989 | |||
| $60 billion |
.1961 | |||
| $63 billion |
.1931 | |||
| $66 billion |
.1900 | |||
| $71 billion |
.1851 | |||
| $76 billion |
.1806 | |||
| $80 billion |
.1773 | |||
| $91 billion |
.1691 | |||
| $125 billion |
.1599 | |||
| $200 billion |
.1505 | |||
| $250 billion |
.1469 | |||
| $300 billion |
.1445 | |||
| * | The complex-level fee is calculated based upon the aggregate daily “eligible assets” of all Nuveen Funds. Eligible assets do not include assets attributable to investments in other Nuveen Funds or assets in excess of $2 billion added to the Nuveen Fund complex in connection with the Adviser’s assumption of the management of the former First American Funds effective January 1, 2011. Eligible assets include closed-end fund assets managed by the Adviser that are attributable to financial leverage. For these purposes, financial leverage includes the closed-end funds’ use of preferred stock and borrowings and investments in the residual interest certificates (also called inverse floating rate securities) in tender option bond (TOB) trusts, including the portion of assets held by the TOB trust that has been effectively financed by the trust’s issuance of floating rate securities, subject to an agreement by the Adviser as to certain funds to limit the amount of such assets for determining eligible assets in certain circumstances. As of April 30, 2012, the complex-level fee rate for each of these Funds was as follows: |
| Fund | Rate | |||
| International |
.1998 | % | ||
| International Select |
.1998 | |||
| Quantitative Enhanced Core Equity |
.1998 | |||
| Tactical Market Opportunities |
.1753 | |||
The management fee compensates the Adviser for the overall investment advisory and administrative services and general office facilities. The Adviser is responsible for each Fund’s overall strategy and asset allocation decisions. The Adviser has entered into sub-advisory agreements with Nuveen Asset Management, LLC (the “Sub-Adviser”), a wholly-owned subsidiary of the Adviser, under which the Sub-Adviser manages the investment portfolios of the Funds. The Sub-Adviser will be compensated for its services to the Funds from the management fees paid to the Adviser.
The Adviser has agreed to waive fees and/or reimburse expenses of each Fund so that total annual Fund operating expenses, after fee waivers and/or expense reimbursements and excluding acquired Fund fees and expenses, do not exceed the percentage of the average daily net assets of any class of Fund shares in the amounts and for the time periods stated in the following table:
| International | International Select |
Quantitative Enhanced Core Equity |
Tactical Market Opportunities |
|||||||||||||
| Class A Shares |
1.49 | % | 1.49 | % | .70 | % | 1.20 | % | ||||||||
| Class C Shares |
2.24 | 2.24 | 1.45 | 1.95 | ||||||||||||
| Class R3 Shares |
1.74 | 1.74 | N/A | N/A | ||||||||||||
| Class I Shares |
1.24 | 1.24 | .45 | .95 | ||||||||||||
| Expiration Date |
February 29, 2013 | February 29, 2013 | February 29, 2013 | February 29, 2013 | ||||||||||||
| N/A - | Quantitative Enhanced Core Equity and Tactical Market Opportunities do not offer Class R3 Shares. |
The Adviser may also voluntarily reimburse expenses from time to time in any of the Funds. Voluntary reimbursements may be terminated at anytime at the Adviser’s discretion.
The Trust pays no compensation directly to those of its directors who are affiliated with the Adviser or to its officers, all of whom receive remuneration for their services to the Trust from the Adviser or its affiliates. The Board of Directors has adopted a deferred compensation plan for independent directors that enable directors to elect to defer receipt of all or a portion of the annual compensation they are entitled to receive from certain Nuveen-advised funds. Under the plan, deferred amounts are treated as though equal dollar amounts had been invested in shares of select Nuveen-advised funds.
| Nuveen Investments | 75 |
Notes to Financial Statements (Unaudited) (continued)
During the six months ended April, 30, 2012, Nuveen Securities, LLC. (the “Distributor”), a wholly-owned subsidiary of Nuveen, collected sales charges on purchases of Class A Shares, the majority of which were paid out as concessions to financial intermediaries as follows:
| International | International Select |
Quantitative Enhanced Core Equity |
Tactical Market Opportunities |
|||||||||||||
| Sales charges collected |
$ | 8,743 | $ | 4,115 | N/A | $ | 91,331 | |||||||||
| Paid to financial intermediaries |
7,637 | 3,594 | N/A | 80,006 | ||||||||||||
N/A - Class A Shares of Quantitative Enhanced Core Equity are offered at their net asset value per share with no upfront sales charge.
The Distributor also received 12b-1 service fees on Class A Shares, substantially all of which were paid to compensate financial intermediaries for providing services to shareholders relating to their investments.
During the six months ended April 30, 2012, the Distributor compensated financial intermediaries directly with commission advances at the time of purchase as follows:
| International | International Select |
Quantitative Enhanced Core Equity |
Tactical Market Opportunities |
|||||||||||||
| Commission advances |
$ | 255 | $ | 233 | $ | — | $ | 71,949 | ||||||||
All 12b-1 service and distribution fees collected on Class B Shares and C Shares during the first year following a purchase were retained by the Distributor to compensate for commissions advanced to financial intermediaries. During the six months ended April 30, 2012, the Distributor retained such 12b-1 fees as follows:
| International | International Select |
Quantitative Enhanced Core Equity |
Tactical Market Opportunities |
|||||||||||||
| 12b-1 fees retained |
$ | 2,768 | $ | 230 | $ | 178 | $ | 20,012 | ||||||||
The remaining 12b-1 fees charged to the Funds were paid to compensate financial intermediaries for providing services to shareholders relating to their investments.
The Distributor also collected and retained CDSC on share redemptions during the six months ended April 30, 2012, as follows:
| International | International Select |
Quantitative Enhanced Core Equity |
Tactical Market Opportunities |
|||||||||||||
| CDSC retained |
$ | 353 | $ | 163 | $ | — | $ | 313 | ||||||||
8. New Accounting Pronouncements
Fair Value Measurements and Disclosures
On May 12, 2011, the Financial Accounting Standards Board (“FASB”) issued Accounting Standards Update (“ASU”) No. 2011-04 (“ASU No. 2011-04”) modifying Topic 820, Fair Value Measurements and Disclosures. At the same time, the International Accounting Standards Board (“IASB”) issued International Financial Reporting Standard (“IFRS”) 13, Fair Value Measurement. The objective of the FASB and IASB is convergence of their guidance on fair value measurements and disclosures. Specifically, ASU No. 2011-04 requires reporting entities to disclose i) the amounts of any transfers between Level 1 and Level 2, the reasons for the transfers and ii) for Level 3 fair value measurements, a) quantitative information about significant unobservable inputs used, b) a description of the valuation processes used by the reporting entity and c) a narrative description of the sensitivity of the fair value measurement to changes in unobservable inputs if a change in those inputs might result in a significantly higher or lower fair value measurement. The effective date of ASU No. 2011-04 is for interim and annual periods beginning after December 15, 2011. At this time, management is evaluating the implications of this guidance and the impact it will have to the financial statement amounts and footnote disclosures, if any.
9. Subsequent Events
Liquidation of Class R3 Shares
Effective May 14, 2012, Class R3 Shares of International Select were closed to all new investments. After the close of business on June 13, 2012, the Fund liquidated all shareholder accounts invested in Class R3 Shares and distributed the proceeds of the liquidation.
| 76 | Nuveen Investments |
Notes
| Nuveen Investments | 77 |
Glossary of Terms Used in this Report
Average Annual Total Return: This is a commonly used method to express an investment’s performance over a particular, usually multi-year time period. It expresses the return that would have been necessary each year to equal the investment’s actual cumulative performance (including change in NAV or offer price and reinvested distributions and capital gains, if any) over the time period being considered.
Bank of America Merrill Lynch 3-Month U.S. Treasury Bill Index: The Bank of America Merrill Lynch 3-Month U.S. Treasury Bill Index is an unmanaged index that is comprised of a single U.S. Treasury issue with approximately three months to final maturity, purchased at the beginning of each month and held for one full month. The index returns assume reinvestment of distributions, but do not reflect any applicable sales charges or management fees.
Beta: A measure of the variability of the change in the share price for a fund in relation to a change in the value of the fund’s market benchmark. Securities with betas higher than 1.0 have been, and are expected to be, more volatile than the benchmark; securities with betas lower than 1.0 have been, and are expected to be, less volatile than the benchmark.
Futures Contracts: Exchange-traded, standardized agreements to buy or sell specific amounts of financial instruments or physical commodities at a specified time in the future.
Lipper International Large-Cap Growth Funds Classification Average: Represents the average annualized total return for all reporting funds in the Lipper International Large-Cap Growth Funds Classification. Lipper returns account for the effects of management fees and assume reinvestment of distributions but do not reflect any applicable sales charges.
Lipper Large-Cap Core Funds Classification Average: Represents the average annualized total return for all reporting funds in the Lipper Large-Cap Core Funds Classification. Lipper returns account for the effects of management fees and assume reinvestment of distributions but do not reflect any applicable sales charges.
Lipper Flexible Portfolio Funds Classification Average: Represents the average annualized total return for all reporting funds in the Lipper Flexible Portfolio Funds Classification. Lipper returns account for the effects of management fees and assume reinvestment of distributions but do not reflect any applicable sales charges.
MSCI EAFE Index: The MSCI (Morgan Stanley Capital International) EAFE (Europe, Australasia, Far East) Index is a free float-adjusted market capitalization weighted index designed to measure developed market equity performance, excluding the U.S. and Canada. The index returns assume reinvestment of distributions, but do not reflect any applicable sales charges or management fees.
MSCI All Country World Investable Market Index (ex U.S.): The MSCI (Morgan Stanley Capital International) All Country World Investable Market Index (ex U.S.) is a free float-adjusted market capitalization weighted index that is designed to measure the equity market performance of developed and emerging markets. The index consists of 45 country indexes comprising 24 developed and 21 emerging market countries. The index returns assume reinvestment of distributions, but do not reflect any applicable sales charges or management fees.
Net Asset Value (NAV): The net market value of all securities held in a portfolio.
Net Asset Value (NAV) Per Share: The market value of one share of a mutual fund or closed-end fund. For a Fund, the NAV is calculated daily by taking the Fund’s total assets (securities, cash, and accrued earnings), subtracting the Fund’s liabilities, and dividing by the number of shares outstanding.
S&P 500® Index: An unmanaged index generally considered representative of the U.S. stock market. The index returns assume reinvestment of distributions, but do not reflect any applicable sales charges or management fees.
Tax Equalization: The practice of treating a portion of the distribution made to a redeeming shareholder, which represents his proportionate part of undistributed net investment income and capital gain as a distribution for tax purposes. Such amounts are referred to as the equalization debits (or payments) and will be considered a distribution to the shareholder of net investment income and capital gain for calculation of the Fund’s dividends paid deduction.
| 78 | Nuveen Investments |
| * | The Board of Directors of the Funds, upon recommendation of the Audit Committee, engaged PricewaterhouseCoopers LLP as the Funds’ independent registered public accounting firm as of March 1, 2011. On December 30, 2011, Ernst & Young, LLP (“Ernst & Young”) completed its work on the October 31, 2011 audits and resigned as the independent registered public accounting firm of the Funds. |
| Ernst & Young’s report on the Funds’ financial statements for the most recent fiscal year contained no adverse opinion or disclaimer of opinion, and were not qualified or modified as to uncertainty, audit scope or accounting principles. For the most recent fiscal year and through March 1, 2011, there were no disagreements with Ernst & Young on any matter of accounting principles, financial statement disclosure or auditing scope or procedures, which disagreements, if not resolved to the satisfaction of Ernst & Young, would have caused it to make reference to the subject matter of the disagreements in connection with its reports on the Funds’ financial statements. |
Quarterly Portfolio of Investments and Proxy Voting information: You may obtain (i) each Fund’s quarterly portfolio of investments, (ii) information regarding how each Fund voted proxies relating to portfolio securities held during the most recent twelve-month period ended June 30, and (iii) a description of the policies and procedures that each Fund used to determine how to vote proxies relating to portfolio securities without charge, upon request, by calling Nuveen Investments at (800) 257-8787 or on Nuveen’s website at www.nuveen.com.
You may also obtain this and other Fund information directly from the Securities and Exchange Commission (SEC). The SEC may charge a copying fee for this information. Visit the SEC on-line at http://www.sec.gov or in person at the SEC’s Public Reference Room in Washington, D.C. Call the SEC at (202) 942-8090 for room hours and operation. You may also request Fund information by sending an e-mail request to publicinfo@sec.gov or by writing to the SEC’s Public Reference Section at 100 F Street NE, Washington, D.C. 20549.
The Financial Industry Regulatory Authority (FINRA) provides a Public Disclosure Program which supplies certain information regarding the disciplinary history of FINRA members and their associated persons in response to either telephone inquiries at (800) 289-9999 or written inquiries at www.finra.org. FINRA also provides an investor brochure that includes information describing the Public Disclosure Program.
| Nuveen Investments | 79 |
Nuveen Investments:
Serving Investors for Generations
Since 1898, financial advisors and their clients have relied on Nuveen Investments to provide dependable investment solutions through continued adherence to proven, long-term investing principles. Today, we offer a range of high quality equity and fixed-income solutions designed to be integral components of a well-diversified core portfolio.
Focused on meeting investor needs.
Nuveen Investments provides high-quality investment services designed to help secure the longterm goals of institutional and individual investors as well as the consultants and financial advisors who serve them. Nuveen Investments markets a wide range of specialized investment solutions which provide investors access to capabilities of its high-quality boutique investment affiliates-Nuveen Asset Management, Symphony Asset Management, NWQ Investment Management Company, Santa Barbara Asset Management, Tradewinds Global Investors, Winslow Capital Management, and Gresham Investment Management. In total, Nuveen Investments managed approximately $227 billion as of March 31, 2012.
Find out how we can help you.
To learn more about how the products and services of Nuveen Investments may be able to help you meet your financial goals, talk to your financial advisor, or call us at (800) 257-8787. Please read the information provided carefully before you invest. Investors should consider the investment objective and policies, risk considerations, charges and expenses of any investment carefully. Where applicable, be sure to obtain a prospectus, which contains this and other relevant information. To obtain a prospectus, please contact your securities representative or Nuveen Investments, 333 W. Wacker Dr., Chicago, IL 60606. Please read the prospectus carefully before you invest or send money.
Learn more about Nuveen Funds at: www.nuveen.com/mf
| Distributed by Nuveen Securities, LLC 333 West Wacker Drive Chicago, IL 60606 www.nuveen.com |
MSA-FQTII-0412D

Mutual Funds
Nuveen Equity Funds
For investors seeking the potential for long-term capital appreciation.
Semi-Annual Report
April 30, 2012
| Share Class / Ticker Symbol | ||||||||||
| Fund Name | Class A | Class B | Class C | Class R3 | Class I | |||||
| Nuveen Large Cap Growth Opportunities Fund |
FRGWX | FETBX | FAWCX | FLCYX | FIGWX | |||||
| Nuveen Mid Cap Growth Opportunities Fund |
FRSLX | FMQBX | FMECX | FMEYX | FISGX | |||||
| Nuveen Small Cap Growth Opportunities Fund |
FRMPX | FROBX | FMPCX | FMPYX | FIMPX | |||||
LIFE IS COMPLEX.
Nuveen makes things e-simple.
It only takes a minute to sign up for e-Reports. Once enrolled, you’ll receive an e-mail as soon as your Nuveen Fund information is ready. No more waiting for delivery by regular mail. Just click on the link within the e-mail to see the report and save it on your computer if you wish.
Free e-Reports right to your e-mail!
www.investordelivery.com
If you receive your Nuveen Fund distributions and statements from your financial advisor or brokerage account.
OR
www.nuveen.com/accountaccess
If you receive your Nuveen Fund distributions and statements directly from Nuveen.
| Must be preceded by or accompanied by a prospectus. | NOT FDIC INSURED | MAY LOSE VALUE | NO BANK GUARANTEE |
| 4 | ||||
| 5 | ||||
| 13 | ||||
| 17 | ||||
| 18 | ||||
| 19 | ||||
| 28 | ||||
| 29 | ||||
| 30 | ||||
| 32 | ||||
| 38 | ||||
| 50 | ||||
| 51 | ||||
Letter to Shareholders


| 4 | Nuveen Investments |
Certain statements in this report are forward-looking statements. Discussions of specific investments are for illustration only and are not intended as recommendations of individual investments. The forward-looking statements and other views expressed herein are those of the portfolio managers as of the date of this report. Actual future results or occurrences may differ significantly from those anticipated in any forward-looking statements and the views expressed herein are subject to change at any time, due to numerous market and other factors. The Funds disclaim any obligation to update publicly or revise any forward-looking statements or views expressed herein.
These Funds feature portfolio management by Nuveen Asset Management, LLC, an affiliate of Nuveen Investments.
Harold (Hal) Goldstein, Scott Mullinix, CFA, and James (Jim) Diedrich, CFA, are the portfolio managers for the Nuveen Large Cap Growth Opportunities Fund. Hal, who has 30 years of investment experience, assumed portfolio management responsibilities in 2002. Scott and Jim, who have 23 and 28 years of experience, respectively, have been on the management team for the Fund since 2006.
Jim, Hal and Scott are also the portfolio managers for the Nuveen Mid Cap Growth Opportunities Fund. Jim and Scott assumed portfolio management responsibilities in 2006. Hal has been on the management team of the Fund since 2005.
Rob McDougall, CFA, and Jon Loth, CFA, are the portfolio managers for the Nuveen Small Cap Growth Opportunities Fund. Rob, who has 24 years of investment experience, assumed portfolio management responsibilities in 2004. Jon, with 18 years of investment experience, has been on the management team for the Fund since 2007.
On the following pages, the portfolio management teams for the Funds examine key investment strategies and the Funds’ performance for the six-month period ended April 30, 2012.
Nuveen Large Cap Growth Opportunities Fund
How did the Fund perform during the six-month period ended April 30, 2012?
The tables in the Fund Performance and Expense Ratios section of this report provide Class A Share total returns for the Fund for the six-month, one-year, five-year and ten-year periods ended April 30, 2012. The Fund’s Class A Shares at net asset value (NAV) outperformed its Lipper classification average, but slightly underperformed the Russell 1000® Growth Index over the six-month period.
What strategies were used to manage the Fund during the reporting period? How did these strategies influence performance?
The Fund seeks to provide long-term capital appreciation by investing primarily in the common stocks of companies that have market capitalizations of $3 billion or greater at the time of purchase. We start by identifying what we believe are exceptional growth companies with open-ended growth prospects, outstanding financial characteristics and solid management teams. From that highly selective group, we invest in companies where our expectations for earnings growth exceed consensus expectations. For each Fund
| Nuveen Investments | 5 |
holding, we develop a proprietary growth thesis. When the growth thesis is validated, we hold or buy more; however, when our growth thesis is not validated, we sell the holding. Although we made individual position changes during the reporting period, our underlying investment strategy remained consistent.
During the reporting period, the Fund’s performance benefited from strong stock selection in the consumer staples and technology sectors. While the consumer staples sector was an average performer in the index, it was the best performing category for the Fund. Monster Energy and Estee Lauder were responsible for the majority of the Fund’s outperformance versus the benchmark in this sector. Monster Energy, the energy drink producer, benefited from accelerating volumes as the energy drink portion of the beverage industry gained market share. As a result, Monster saw its margins increase while international growth was strong. Estee Lauder, the global manufacturer of high end cosmetics, continued to gain from improved margins through operational cost savings. The company has reported earnings above consensus expectations over the past few years. Favorable stock selection in the technology sector was led by the Fund’s overweight position in Apple, a top large-cap technology performer. This leading manufacturer of smartphones, desktop and portable computing devices saw its stock advance dramatically during the period. Apple was able to gain meaningful and profitable market share in the computing devices market via the introduction of its new iPad, upgrades to its iPhone and continued demand for desktop and portable Mac computers. The Fund’s performance also benefited from the information technology holdings Visa and MasterCard. These stable, secular growth companies had strong results with moderate multiples of approximately 15 times earnings.
The greatest contributor toward the Fund’s shortfall versus the Russell Index was the industrials sector, where performance was hindered by a slight underweight versus the benchmark as well as stock selection. Most of the underperformance resulted from Joy Global, a highly cyclical holding tied to the energy and materials sectors. The company manufactures equipment and aftermarket parts used in the mining of coal, copper, iron ore and other mineral resources. Fears that fundamentals were going to deteriorate in these two segments led to a decline in the Joy Global stock price. Overall, the consumer discretionary sector did not enhance the Fund’s performance. Premier jeweler Tiffany & Company underperformed as its business declined due to the recessionary environment in Europe and slowing traffic into its flagship stores. Wynn Resorts was also a laggard in this sector. This developer and operator of high end resorts and casinos saw its stock price decline due to fears of lower market share in Macau. Even though the Fund underperformed in the sector overall, priceline.com performed well as the company continued to post strong earnings despite Europe’s economic slowdown. Another detractor was CARBO Ceramics in the energy sector. CARBO is one of the few companies that makes the ceramic proppant used in oil and gas drilling to enhance the recoverability of shale wells. As natural gas prices have fallen dramatically, natural gas drilling has also declined and most of CARBO’s customers have shifted to crude oil drilling. Not only has the company’s cost of doing business increased as it is forced to move equipment, but also less of its proppant product is used in crude drilling. We sold our positions in Tiffany and Wynn Resorts during the period since they did not meet our overall investment objectives. The fundamentals for Tiffany deteriorated too much as European and
| 6 | Nuveen Investments |
U.S. consumer spending declined. We agreed with the market’s concerns about Wynn Resorts and its market share declines in Macau. We also sold Joy Global based on fundamental concerns and CARBO Ceramics as our growth thesis surrounding increased shale drilling was derailed by falling natural gas prices.
During the period, we added several new positions to replace those that were sold. Given the uncertainty in the economic growth outlook, we continued to be interested in consistent, organic volume-driven growth companies. New purchases included Rackspace Hosting, a market leader in hosting cloud-based technology services for small- and mid-sized business. Rackspace’s revenues are increasing faster than expenses as the company is able to leverage the growing number of businesses switching over to cloud-based services. We also added a position in McKesson Corporation, one of the three large distributors of pharmaceuticals and supplies to the health care industry. McKesson has enhanced margins through expense management and has benefited from the secular growth trends in the pharmaceutical distribution business. Finally, we bought GNC Holdings, the operator of general nutrition stores that offer products ranging from vitamins to diet and exercise aids. GNC continues to have strong sales as it benefits from the consistent quest by American consumers to be more health conscious.
Nuveen Mid Cap Growth Opportunities Fund
How did the Fund perform during the six-month period ended April 30, 2012?
The tables in the Fund Performance and Expense Ratios section of this report provide Class A Share total returns for the Fund for the six-month, one-year, five-year and ten-year periods ended April 30, 2012. The Fund’s Class A Shares at net asset value (NAV) outperformed both the Russell Midcap® Growth Index and the Lipper classification average over the six-month period.
What strategies were used to manage the Fund during the reporting period? How did these strategies influence performance?
The Fund pursues a long-term capital appreciation strategy by investing primarily in the common stocks of companies that have market capitalizations between approximately $350 million and $14 billion at the time of purchase. We start by identifying what we believe are exceptional growth companies with open-ended growth prospects, outstanding financial characteristics and solid management teams. From that highly selective group, we invest in companies where our expectations for earnings growth exceed consensus expectations. For each Fund holding, we develop a proprietary growth thesis. When the growth thesis is validated, we hold or buy more; however, when our growth thesis is not validated, we sell the holding. Although we made individual position changes during the reporting period, our underlying investment strategy remained consistent.
The Fund’s performance benefited from strong stock selection across the energy, consumer staples, technology and telecommunications services sectors. The most significant contributors in the Fund were three energy companies despite the fact that the overall energy sector significantly underperformed the market. For example, FMC
| Nuveen Investments | 7 |
Technologies, an oil services company mainly for off-shore, deep water energy companies, was a top performer. FMC benefited from strong orders for its sub-sea technologies and its position as the largest operator in that segment. The Fund had favorable results from a relatively new oil and gas exploration and production company, Cobalt International Energy. The company is focused on sub-salt formations in the deep offshore waters of the Gulf of Mexico and West Africa. Cobalt International recently experienced its first big discovery in off-shore Angola. This discovery was larger than expected, and it has more large sites yet to drill. Finally, the Fund’s position in energy services provider Core Laboratories yielded positive results during the period. Core Laboratories helps exploration and production companies in the petroleum industry to optimize their production. The company has virtually no competition in this segment, leading to strong pricing power and good earnings. While the consumer staples sector was an average performer in the index, two of the Fund’s holdings in this sector performed well. Monster Energy, the energy drink producer, benefited from accelerating volumes as the energy drink portion of the beverage industry gained market share. As a result, Monster saw its margins increase while international growth was strong. Estee Lauder, the global manufacturer of high end cosmetics, continued to gain from improved margins through operational cost savings. The company has reported earnings above consensus expectations over the past few years. The Fund still owns Monster, but it sold the Estee Lauder position because its market capitalization of approximately $20 billion became too large for mid-cap market capitalization parameters. Although technology as a sector underperformed, our stock selection within this segment was strong. The Fund benefited from the acquisition of Success Factors, a cloud-based human resources software company, by SAP for a significant premium. We also saw strong results from Rackspace Hosting, a market leader in hosting cloud-based technology services for small- and mid-sized business. Rackspace’s revenues are increasing faster than expenses as the company is able to leverage the growing number of businesses switching over to cloud-based services. In addition, the Fund benefited from owning LinkedIn, a network focused on connecting professionals. Its earnings have outpaced consensus expectations as the company has started to monetize its business. Finally, the Fund outperformed in the telecommunications services sector with its position in SBA Communications. The company, which operates wireless communication towers, showed consistent volume and made a favorable acquisition that added to earnings.
Overall, the consumer discretionary sector did not enhance Fund performance. This underperformance was led by Deckers Outdoor, the maker of the popular Ugg sheepskin boots and Teva sandals. Our growth thesis was that Deckers would broaden its product line and expand internationally with more direct consumer stores. However, the company experienced low sales due to warm winter weather and an increase in sheepskin prices. Abercrombie & Fitch underperformed as the company’s international expansion via its new flagship stores in Europe was hindered by the region’s economic crisis. Premier jeweler Tiffany & Company underperformed as its business declined due to the recessionary environment in Europe and slowing traffic into its flagship stores. Wynn Resorts was also a laggard in this sector. This developer and operator of high end resorts and casinos saw its stock price decline due to fears of lower market share in Macau. Even though the Fund underperformed in the sector overall, priceline.com performed well as
| 8 | Nuveen Investments |
the company continued to post strong earnings despite Europe’s economic slowdown. Another detractor was CARBO Ceramics from the energy sector. CARBO is one of the few companies that makes the ceramic proppant used in oil and gas drilling to enhance the recoverability of shale wells. As natural gas prices have fallen dramatically, natural gas drilling has also declined and most of CARBO’s customers have shifted to crude oil drilling. The company’s cost of doing business increased as it was forced to move equipment, and less of its proppant product was used in crude drilling. We sold Deckers Outdoor, Abercrombie & Fitch, Tiffany & Company and Wynn Resorts because they did not meet our overall investment objectives. As a result, the Fund’s weighting in the consumer discretionary sector has declined. We also sold CARBO Ceramics since our growth thesis surrounding increased shale drilling has been derailed by falling natural gas prices. Finally, we sold outperformer FMC Technologies before its earnings were released. Earnings did not meet expectations, causing the stock price to fall and underperform.
We added several new positions to replace those that were sold. We increased the Fund’s technology sector weighting. Purchases included software company Citrix Systems due to its promising new XenDesktop product, software that provides server and desktop virtualization technologies to businesses. Another addition, Amphenol, makes and supplies electrical connectors used in the auto, industrial and aerospace industries. Amphenol outperformed estimates as the company is in a secular growth industry and has gained market share by consolidating other operators. We also bought NetSuite, a cloud-based enterprise resource planning company that has shown rapid growth potential. NetSuite sells software to help small and medium sized companies run their business on the cloud instead of utilizing their own IT department.
Nuveen Small Cap Growth Opportunities Fund
How did the Fund perform during the six-month period ended April 30, 2012?
The tables in the Fund Performance and Expense Ratios section of this report provide Class A Share total returns for the Fund for the six-month, one-year, five-year and ten-year periods ended April 30, 2012. The Fund’s Class A Shares at net asset value (NAV) outperformed both the Russell 2000® Growth Index and the Lipper classification average over the six-month period.
What strategies were used to manage the Fund during the reporting period? How did these strategies influence performance?
The Fund seeks to provide long-term capital appreciation by investing primarily in equity securities of companies with market capitalizations in the range of the benchmark Russell Index. The investment process we use seeks to exploit secular trends that we believe will provide above-average growth, which should mute the effects of the business cycle over the longer term. Importantly, our process also emphasizes a valuation discipline aimed at finding what we believe are attractive investment opportunities that could benefit from multiple expansion when particular investment catalysts become evident in the marketplace. The Fund’s portfolio typically features investments in high-quality companies
| Nuveen Investments | 9 |
with attractive margin profiles, generally healthy balance sheets and prospects for attractive revenue and earnings growth.
The longer term track record of the Fund remains attractive, and results for the reporting period exceeded the benchmark. Despite November volatility that was driven by continued European debt concerns coupled with the U.S. Congressional Super Committee’s failure to reach an agreement on a $1.2 trillion debt reduction package, investors began to focus increasingly on generally strong U.S. corporate earnings, signs of improvement in the labor market and potential stability in housing. Accordingly, the Fund’s outperformance over this time frame was derived from several of the more economically sensitive sectors.
Stock selection in the industrials, consumer discretionary and health care sectors contributed to the Fund’s performance. Results in industrials were led by the portfolio’s position in United Rentals, a major U.S. construction rental firm that benefited from a secular change in the industry in favor of increased rentals as a means of structural cost reduction. In addition to posting earnings results ahead of investors’ expectations, the company also announced it would acquire its biggest competitor to form the largest equipment rental organization in the U.S., which spurred a strongly positive reaction in the stock price. Performance was also driven by shares of Altra Holdings, a manufacturer of mechanical transmission and motion control products. Altra reported strong third quarter 2011 results, reaffirming the health of its early cycle business while at the same time exhibiting the acceleration in its late cycle, energy related operations. The consumer discretionary sector was also a positive contributor to the Fund’s performance, most notably in the leisure equipment and products group. Shares of Arctic Cat, a well-known manufacturer of snowmobiles and all-terrain vehicles, were exceptionally strong as new product launches in both areas amidst a lean dealer inventory environment drove expectations of revenue growth in excess of 20% for the year. Ascena Retail Group, an operator of women’s clothing and accessories stores, provided a strong earnings report for the first quarter 2012 and also signaled that it would be acquiring their competitor, Charming Shoppes. Finally, shares of Zumiez, a teen-focused clothing retailer, provided earnings results for the third quarter 2011 that were ahead of expectations, driven by contribution from new stores and strong growth in online sales. Importantly, its management also reported robust November comparable store sales growth that suggested the fourth quarter 2011 was off to a healthy start. The health care sector also contributed favorably to investment results. The share price of Salix Pharmaceuticals, a specialty pharmaceutical firm focused on gastrointestinal disorders, reacted positively due to drug development for irritable bowel syndrome and another intestinal condition common with opiate use. Finally, the Fund benefited from positions in Align Technology, a global manufacturer of clear orthodontic aligners. The company reported solid results for the first quarter 2012 that included strong growth in case shipments, healthy gross margins and a rebound in oral scanner sales.
The largest detractor to relative performance was stock selection in the information technology sector, most notably in the communications equipment and semiconductor-related groups. A significant negative impact came from the Fund’s position in Vocus, an on-demand software provider for public relations management. Despite posting solid
| 10 | Nuveen Investments |
fourth quarter 2011 results, its share price fell due to an announced increase in 2012 investment spending and a sizeable, dilutive acquisition. Weakness in the share price of Acme Packet also hindered performance. This communications equipment provider, which is focused on session board controllers sold primarily to telecommunications carriers and increasingly to large enterprises, came under pressure as management provided guidance for full year revenue growth below investor expectations. Finally, shares of OmniVision Technologies, a consumer-oriented image sensing company, lagged during this period as it became clear the firm had lost a key design decision to a Japanese competitor.
In the information technology sector, we took advantage of the current weakness in communications equipment shares due to recent reduced spending from Tier-1 carriers, a trend that we believe could reverse later in the year. The Fund’s industrial sector positioning will be influenced by our assessment of what appears to be a mid-cycle slowdown and the resulting impact on valuations in areas such as staffing and construction. We continued to find attractively valued consumer discretionary names, particularly as gasoline prices have declined from their recent highs heading into the summer driving season, and the relative performance of the group so far this year has been impressive. Moreover, it appears that both Europe and selected portions of Asia are currently experiencing a deceleration in economic activity, which is causing us to emphasize domestic exposure over the near term in these cyclical groups.
The Fund’s portfolio is currently equally weighted to its benchmark index in the health care sector with a preference for defensive, unit growth investments with lower reimbursement risks as we await the Supreme Court’s decision on the constitutionality of the Affordable Care Act and the upcoming November elections. However, our bias would be to increase the Fund’s holdings in health care as the outlook improves. Finally, it appears as though the energy sector is in the midst of a corrective phase, which could present an opportunity to gain exposure heading into the latter half of 2012. The Fund’s portfolio remains underweight in the financial services, consumer staples and materials sectors given the lack of compelling growth opportunities in light of current valuations.
Risk Considerations
Mutual fund investing involves risk; principal loss is possible.
Nuveen Large Cap Growth Opportunities Fund
Equity investments, such as those held by the Fund, are subject to market risk, active management risk, and growth stock risk. Foreign investments involve additional risks, including currency fluctuation, political and economic instability, lack of liquidity and differing legal and accounting standards. These risks are magnified in emerging markets. Diversification does not assure a profit or protect against a loss in a declining market. The use of derivatives involves additional risk and transaction costs.
Nuveen Mid Cap Growth Opportunities Fund
Equity investments are subject to market risk. Foreign investments involve additional risks, including currency fluctuation, political and economic instability, lack of liquidity and
| Nuveen Investments | 11 |
differing legal and accounting standards. These risks are magnified in emerging markets. Investments in small- and mid-cap companies are subject to greater volatility. The use of derivatives involves additional risk and transaction costs. The Fund’s ability to invest in initial public offerings (IPOs) involves a higher degree of risk than more seasoned companies.
Nuveen Small Cap Growth Opportunities Fund
Equity investments are subject to market risk. Foreign investments involve additional risks, including currency fluctuation, political and economic instability, lack of liquidity and differing legal and accounting standards. These risks are magnified in emerging markets. Investments in small- and mid-cap companies are subject to greater volatility. The use of derivatives involves additional risks and transactions costs. The Fund’s ability to invest in initial public offerings (IPOs) involves a higher degree of risk than more seasoned companies. Small cap stocks involve substantial risk.
| 12 | Nuveen Investments |
Fund Performance and Expense Ratios
The Fund Performance and Expense Ratios for each Fund are shown on the following three pages.
Returns quoted represent past performance, which is no guarantee of future results. Current performance may be higher or lower than the performance shown. Investment returns and principal value will fluctuate so that when shares are redeemed, they may be worth more or less than their original cost. Returns without sales charges would be lower if the sales charge were included. Returns do not reflect the deduction of taxes that a shareholder would pay on Fund distributions or the redemption of Fund shares.
Returns may reflect a contractual agreement between certain Funds and the investment adviser to waive certain fees and expenses; see Notes to Financial Statements, Footnote 7 — Management Fees and Other Transactions with Affiliates for more information. In addition, returns may reflect a voluntary expense limitation by the Funds’ investment adviser that may be modified or discontinued at any time without notice. For the most recent month-end performance visit www.nuveen.com or call (800) 257-8787.
Returns reflect differences in sales charges and expenses, which are primarily differences in distribution and service fees. Fund returns assume reinvestment of dividends and capital gains.
Comparative index and Lipper return information is provided for the Funds’ Class A Shares at net asset value (NAV) only.
The expense ratios shown reflect the Funds’ total operating expenses (before fee waivers or expense reimbursements, if any) as shown in the Funds’ most recent prospectus. The expense ratios include management fees and other fees and expenses.
| Nuveen Investments | 13 |
Fund Performance and Expense Ratios (continued)
Nuveen Large Cap Growth Opportunities Fund
Refer to the first page of this Fund Performance and Expense Ratios section for further explanation of the information included within this page.
Fund Performance
Average Annual Total Returns as of April 30, 2012*
| Cumulative | Average Annual | |||||||||||||||
| 6-Month | 1-Year | 5-Year | 10-Year | |||||||||||||
| Class A Shares at NAV |
13.37% | 4.75% | 5.39% | 5.04% | ||||||||||||
| Class A Shares at maximum Offering Price |
6.85% | -1.26% | 4.15% | 4.42% | ||||||||||||
| Russell 1000® Growth Index** |
14.13% | 7.26% | 4.11% | 5.16% | ||||||||||||
| Lipper Large-Cap Growth Funds Classification Average** |
12.89% | 4.71% | 2.97% | 4.33% | ||||||||||||
| Class B Shares w/o CDSC*** |
12.94% | 3.90% | 4.60% | 4.26% | ||||||||||||
| Class B Shares w/CDSC*** |
7.94% | -1.08% | 4.43% | 4.26% | ||||||||||||
| Class C Shares |
12.98% | 3.94% | 4.61% | 4.25% | ||||||||||||
| Class R3 Shares |
13.22% | 4.44% | 5.12% | 4.83% | ||||||||||||
| Class I Shares |
13.49% | 4.99% | 5.65% | 5.30% | ||||||||||||
Average Annual Total Returns as of March 31, 2012 (Most Recent Calendar Quarter)*
| Cumulative | Average Annual | |||||||||||||||
| 6-Month | 1-Year | 5-Year | 10-Year | |||||||||||||
| Class A Shares at NAV |
23.93% | 7.98% | 6.29% | 4.45% | ||||||||||||
| Class A Shares at maximum Offering Price |
16.81% | 1.78% | 5.05% | 3.84% | ||||||||||||
| Class B Shares w/o CDSC*** |
23.48% | 7.16% | 5.50% | 3.67% | ||||||||||||
| Class B Shares w/CDSC*** |
18.48% | 2.16% | 5.34% | 3.67% | ||||||||||||
| Class C Shares |
23.49% | 7.18% | 5.51% | 3.67% | ||||||||||||
| Class R3 Shares |
23.78% | 7.69% | 6.03% | 4.25% | ||||||||||||
| Class I Shares |
24.14% | 8.26% | 6.57% | 4.71% | ||||||||||||
Class A Shares have a maximum 5.75% sales charge (Offering Price). Class A Share purchases of $1 million or more are sold at net asset value without an up-front sales charge but may be subject to a contingent deferred sales charge (CDSC), also known as a back-end sales charge, if redeemed within twelve months of purchase. Class B Shares have a CDSC that begins at 5% for redemptions during the first year and declines periodically until after six years when the charge becomes 0%. Class B Shares automatically convert to Class A Shares eight years after purchase. Class C Shares have a 1% CDSC for redemptions within less than twelve months, which is not reflected in the one-year total return. Class R3 Shares have no sales charge and are available to only certain retirement plan clients of financial intermediaries. Class I Shares have no sales charge and may be purchased under limited circumstances or by specified classes of investors.
Expense Ratios as of Most Recent Prospectus
| Expense Ratios |
||||
| Class A Shares |
1.21% | |||
| Class B Shares |
1.96% | |||
| Class C Shares |
1.96% | |||
| Class R3 Shares |
1.46% | |||
| Class I Shares |
0.96% | |||
| * | Six-month returns are cumulative; all other returns are annualized. |
| ** | Refer to the Glossary of Terms Used in this Report for definitions. Indexes and Lipper averages are not available for direct investment. |
| *** | Class B Shares are available only upon the exchange of Class B Shares from another Nuveen mutual fund or for purposes of dividend reinvestment, but Class B Shares are not available for new accounts or for additional investment into existing accounts. |
| 14 | Nuveen Investments |
Nuveen Mid Cap Growth Opportunities Fund
Refer to the first page of this Fund Performance and Expense Ratios section for further explanation of the information included within this page.
Fund Performance
Average Annual Total Returns as of April 30, 2012*
| Cumulative | Average Annual | |||||||||||||||
| 6-Month | 1-Year | 5-Year | 10-Year | |||||||||||||
| Class A Shares at NAV |
12.48% | 0.37% | 4.24% | 8.18% | ||||||||||||
| Class A Shares at maximum Offering Price |
6.02% | -5.41% | 3.02% | 7.54% | ||||||||||||
| Russell Midcap® Growth Index** |
12.26% | 0.78% | 3.55% | 7.50% | ||||||||||||
| Lipper Multi-Cap Growth Funds Classification Average** |
11.84% | 1.02% | 2.76% | 5.54% | ||||||||||||
| Class B Shares w/o CDSC*** |
12.07% | -0.38% | 3.46% | 7.37% | ||||||||||||
| Class B Shares w/CDSC*** |
7.07% | -5.13% | 3.28% | 7.37% | ||||||||||||
| Class C Shares |
12.03% | -0.39% | 3.46% | 7.39% | ||||||||||||
| Class R3 Shares |
12.34% | 0.13% | 3.98% | 7.97% | ||||||||||||
| Class I Shares |
12.60% | 0.63% | 4.50% | 8.45% | ||||||||||||
Average Annual Total Returns as of March 31, 2012 (Most Recent Calendar Quarter)*
| Cumulative | Average Annual | |||||||||||||||
| 6-Month | 1-Year | 5-Year | 10-Year | |||||||||||||
| Class A Shares at NAV |
25.51% | 3.35% | 4.95% | 8.01% | ||||||||||||
| Class A Shares at maximum Offering Price |
18.28% | -2.59% | 3.72% | 7.38% | ||||||||||||
| Class B Shares w/o CDSC*** |
25.02% | 2.57% | 4.17% | 7.21% | ||||||||||||
| Class B Shares w/CDSC*** |
20.02% | -2.31% | 4.00% | 7.21% | ||||||||||||
| Class C Shares |
25.01% | 2.58% | 4.17% | 7.22% | ||||||||||||
| Class R3 Shares |
25.35% | 3.09% | 4.69% | 7.81% | ||||||||||||
| Class I Shares |
25.64% | 3.59% | 5.21% | 8.29% | ||||||||||||
Class A Shares have a maximum 5.75% sales charge (Offering Price). Class A Share purchases of $1 million or more are sold at net asset value without an up-front sales charge but may be subject to a contingent deferred sales charge (CDSC), also known as a back-end sales charge, if redeemed within twelve months of purchase. Class B Shares have a CDSC that begins at 5% for redemptions during the first year and declines periodically until after six years when the charge becomes 0%. Class B Shares automatically convert to Class A Shares eight years after purchase. Class C Shares have a 1% CDSC for redemptions within less than twelve months, which is not reflected in the one-year total return. Class R3 Shares have no sales charge and are available to only certain retirement plan clients of financial intermediaries. Class I Shares have no sales charge and may be purchased under limited circumstances or by specified classes of investors.
Expense Ratios as of Most Recent Prospectus
| Expense Ratios |
||||
| Class A Shares |
1.28% | |||
| Class B Shares |
2.03% | |||
| Class C Shares |
2.03% | |||
| Class R3 Shares |
1.53% | |||
| Class I Shares |
1.03% | |||
| * | Six-month returns are cumulative; all other returns are annualized. |
| ** | Refer to the Glossary of Terms Used in this Report for definitions. Indexes and Lipper averages are not available for direct investment. |
| *** | Class B Shares are available only upon the exchange of Class B Shares from another Nuveen mutual fund or for purposes of dividend reinvestment, but Class B Shares are not available for new accounts or for additional investment into existing accounts. |
| Nuveen Investments | 15 |
Fund Performance and Expense Ratios (continued)
Nuveen Small Cap Growth Opportunities Fund
Refer to the first page of this Fund Performance and Expense Ratios section for further explanation of the information included within this page.
Fund Performance
Average Annual Total Returns as of April 30, 2012*
| Cumulative | Average Annual | |||||||||||||||
| 6-Month | 1-Year | 5-Year | 10-Year | |||||||||||||
| Class A Shares at NAV |
13.39% | -2.35% | 3.99% | 5.91% | ||||||||||||
| Class A Shares at maximum Offering Price |
6.84% | -7.98% | 2.77% | 5.28% | ||||||||||||
| Russell 2000® Growth Index** |
10.58% | -4.42% | 3.27% | 6.06% | ||||||||||||
| Lipper Small-Cap Growth Funds Classification Average** |
11.70% | -4.09% | 2.82% | 5.91% | ||||||||||||
| Class B Shares w/o CDSC*** |
12.93% | -3.14% | 3.21% | 5.11% | ||||||||||||
| Class B Shares w/CDSC*** |
7.93% | -7.90% | 3.03% | 5.11% | ||||||||||||
| Class C Shares |
12.93% | -3.13% | 3.22% | 5.12% | ||||||||||||
| Class R3 Shares |
13.23% | -2.61% | 3.73% | 5.72% | ||||||||||||
| Class I Shares |
13.49% | -2.14% | 4.24% | 6.16% | ||||||||||||
Average Annual Total Returns as of March 31, 2012 (Most Recent Calendar Quarter)*
| Cumulative | Average Annual | |||||||||||||||
| 6-Month | 1-Year | 5-Year | 10-Year | |||||||||||||
| Class A Shares at NAV |
33.31% | 2.92% | 4.82% | 5.85% | ||||||||||||
| Class A Shares at maximum Offering Price |
25.65% | -3.00% | 3.59% | 5.23% | ||||||||||||
| Class B Shares w/o CDSC*** |
32.81% | 2.14% | 4.04% | 5.06% | ||||||||||||
| Class B Shares w/CDSC*** |
27.81% | -2.86% | 3.87% | 5.06% | ||||||||||||
| Class C Shares |
32.85% | 2.19% | 4.04% | 5.07% | ||||||||||||
| Class R3 Shares |
33.18% | 2.66% | 4.56% | 5.66% | ||||||||||||
| Class I Shares |
33.47% | 3.20% | 5.08% | 6.11% | ||||||||||||
Class A Shares have a maximum 5.75% sales charge (Offering Price). Class A Share purchases of $1 million or more are sold at net asset value without an up-front sales charge but may be subject to a contingent deferred sales charge (CDSC), also known as a back-end sales charge, if redeemed within twelve months of purchase. Class B Shares have a CDSC that begins at 5% for redemptions during the first year and declines periodically until after six years when the charge becomes 0%. Class B Shares automatically convert to Class A Shares eight years after purchase. Class C Shares have a 1% CDSC for redemptions within less than twelve months, which is not reflected in the one-year total return. Class R3 Shares have no sales charge and are available to only certain retirement plan clients of financial intermediaries. Class I Shares have no sales charge and may be purchased under limited circumstances or by specified classes of investors.
Expense Ratios as of Most Recent Prospectus
| Gross Expense Ratios |
Net Expense Ratios |
|||||||
| Class A Shares |
1.54% | 1.48% | ||||||
| Class B Shares |
2.29% | 2.23% | ||||||
| Class C Shares |
2.29% | 2.23% | ||||||
| Class R3 Shares |
1.79% | 1.73% | ||||||
| Class I Shares |
1.29% | 1.23% | ||||||
The Fund’s adviser has contractually agreed to waive fees and/or reimburse other Fund expenses through February 28, 2013, so that total annual Fund operating expenses, after fee waivers and/or expense reimbursements and excluding any acquired Fund fees and expenses, do not exceed 1.47%, 2.22%, 2.22%, 1.72% and 1.22% for Class A, Class B, Class C, Class R3 and Class I Shares, respectively. Fee waivers and/or expense reimbursements will not be terminated prior to that time without with approval of the Fund’s Board of Directors.
| * | Six-month returns are cumulative; all other returns are annualized. |
| ** | Refer to the Glossary of Terms Used in this Report for definitions. Indexes and Lipper averages are not available for direct investment. |
| *** | Class B Shares are available only upon the exchange of Class B Shares from another Nuveen mutual fund or for purposes of dividend reinvestment, but Class B Shares are not available for new accounts or for additional investment into existing accounts. |
| 16 | Nuveen Investments |
Holding Summaries as of April 30, 2012
This data relates to the securities held in each Fund’s portfolio of investments. It should not be construed as a measure of performance for the Fund itself.
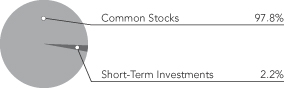
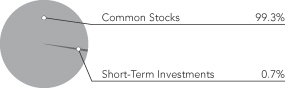
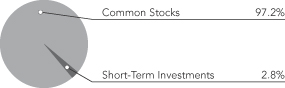
| 1 | As a percentage of total investments (excluding investments purchased with collateral from securities lending) as of April 30, 2012. Holdings are subject to change. |
| 2 | As a percentage of total common stocks as of April 30, 2012. Holdings are subject to change. |
| Nuveen Investments | 17 |
As a shareholder of one or more of the Funds, you incur two types of costs: (1) transaction costs, including up-front and back-end sales charges (loads) or redemption fees, where applicable; and (2) ongoing costs, including management fees; distribution and service (12b-1) fees, where applicable; and other Fund expenses. The Examples below are intended to help you understand your ongoing costs (in dollars) of investing in the Funds and to compare these costs with the ongoing costs of investing in other mutual funds.
The Examples below are based on an investment of $1,000 invested at the beginning of the period and held for the period.
The information under “Actual Performance,” together with the amount you invested, allows you to estimate actual expenses incurred over the reporting period. Simply divide your account value by $1,000 (for example, an $8,600 account value divided by $1,000 = 8.60) and multiply the result by the cost shown for your share class, in the row entitled “Expenses Incurred During Period” to estimate the expenses incurred on your account during this period.
The information under “Hypothetical Performance,” provides information about hypothetical account values and hypothetical expenses based on the respective Fund’s actual expense ratio and an assumed rate of return of 5% per year before expenses, which is not the Fund’s actual return. The hypothetical account values and expenses may not be used to estimate the actual ending account balance or expense you incurred for the period. You may use this information to compare the ongoing costs of investing in the Fund and other Funds. To do so, compare this 5% hypothetical example with the 5% hypothetical examples that appear in the shareholder reports of the other funds.
Please note that the expenses shown in the table are meant to highlight your ongoing costs only and do not reflect any transaction costs. Therefore, the hypothetical information is useful in comparing ongoing costs only, and will not help you determine the relative total costs of owning different funds or share classes. In addition, if these transaction costs were included, your costs would have been higher.
Nuveen Large Cap Growth Opportunities Fund
| Actual Performance | Hypothetical Performance (5% annualized return before expenses) |
|||||||||||||||||||||||||||||||||||||||||
| A Shares | B Shares | C Shares | R3 Shares | I Shares | A Shares | B Shares | C Shares | R3 Shares | I Shares | |||||||||||||||||||||||||||||||||
| Beginning Account Value (11/01/11) | $ | 1,000.00 | $ | 1,000.00 | $ | 1,000.00 | $ | 1,000.00 | $ | 1,000.00 | $ | 1,000.00 | $ | 1,000.00 | $ | 1,000.00 | $ | 1,000.00 | $ | 1,000.00 | ||||||||||||||||||||||
| Ending Account Value (4/30/12) | $ | 1,133.70 | $ | 1,129.40 | $ | 1,129.80 | $ | 1,132.20 | $ | 1,134.90 | $ | 1,018.60 | $ | 1,014.87 | $ | 1,014.87 | $ | 1,017.35 | $ | 1,019.84 | ||||||||||||||||||||||
| Expenses Incurred During Period | $ | 6.68 | $ | 10.64 | $ | 10.64 | $ | 8.01 | $ | 5.36 | $ | 6.32 | $ | 10.07 | $ | 10.07 | $ | 7.57 | $ | 5.07 | ||||||||||||||||||||||
For each class of the Fund, expenses are equal to the Fund’s annualized net expense ratio of 1.26%, 2.01%, 2.01%, 1.51% and 1.01% for Classes A, B, C, R3 and I, respectively, multiplied by the average account value over the period, multiplied by 182/366 (to reflect the one-half year period).
Nuveen Mid Cap Growth Opportunities Fund
| Actual Performance | Hypothetical Performance (5% annualized return before expenses) |
|||||||||||||||||||||||||||||||||||||||||
| A Shares | B Shares | C Shares | R3 Shares | I Shares | A Shares | B Shares | C Shares | R3 Shares | I Shares | |||||||||||||||||||||||||||||||||
| Beginning Account Value (11/01/11) | $ | 1,000.00 | $ | 1,000.00 | $ | 1,000.00 | $ | 1,000.00 | $ | 1,000.00 | $ | 1,000.00 | $ | 1,000.00 | $ | 1,000.00 | $ | 1,000.00 | $ | 1,000.00 | ||||||||||||||||||||||
| Ending Account Value (4/30/12) | $ | 1,124.80 | $ | 1,120.70 | $ | 1,120.30 | $ | 1,123.40 | $ | 1,126.00 | $ | 1,018.45 | $ | 1,014.72 | $ | 1,014.72 | $ | 1,017.21 | $ | 1,019.69 | ||||||||||||||||||||||
| Expenses Incurred During Period | $ | 6.82 | $ | 10.76 | $ | 10.75 | $ | 8.13 | $ | 5.50 | $ | 6.47 | $ | 10.22 | $ | 10.22 | $ | 7.72 | $ | 5.22 | ||||||||||||||||||||||
For each class of the Fund, expenses are equal to the Fund’s annualized net expense ratio of 1.29%, 2.04%, 2.04%, 1.54% and 1.04% for Classes A, B, C, R3 and I, respectively, multiplied by the average account value over the period, multiplied by 182/366 (to reflect the one-half year period).
Nuveen Small Cap Growth Opportunities Fund
| Actual Performance | Hypothetical Performance (5% annualized return before expenses) |
|||||||||||||||||||||||||||||||||||||||||
| A Shares | B Shares | C Shares | R3 Shares | I Shares | A Shares | B Shares | C Shares | R3 Shares | I Shares | |||||||||||||||||||||||||||||||||
| Beginning Account Value (11/01/11) | $ | 1,000.00 | $ | 1,000.00 | $ | 1,000.00 | $ | 1,000.00 | $ | 1,000.00 | $ | 1,000.00 | $ | 1,000.00 | $ | 1,000.00 | $ | 1,000.00 | $ | 1,000.00 | ||||||||||||||||||||||
| Ending Account Value (4/30/12) | $ | 1,133.90 | $ | 1,129.30 | $ | 1,129.30 | $ | 1,132.30 | $ | 1,134.90 | $ | 1,017.55 | $ | 1,013.82 | $ | 1,013.82 | $ | 1,016.31 | $ | 1,018.80 | ||||||||||||||||||||||
| Expenses Incurred During Period | $ | 7.80 | $ | 11.75 | $ | 11.75 | $ | 9.12 | $ | 6.48 | $ | 7.37 | $ | 11.12 | $ | 11.12 | $ | 8.62 | $ | 6.12 | ||||||||||||||||||||||
For each class of the Fund, expenses are equal to the Fund’s annualized net expense ratio of 1.47%, 2.22%, 2.22%, 1.72% and 1.22% for Classes A, B, C, R3 and I, respectively, multiplied by the average account value over the period, multiplied by 182/366 (to reflect the one-half year period).
| 18 | Nuveen Investments |
Portfolio of Investments (Unaudited)
Nuveen Large Cap Growth Opportunities Fund
April 30, 2012
| Shares | Description (1) | Value | ||||||||||||
| COMMON STOCKS – 99.6% |
||||||||||||||
| Consumer Discretionary – 21.3% |
||||||||||||||
| 63,515 | Amazon.com, Inc., (2) |
$ | 14,729,129 | |||||||||||
| 107,925 | BorgWarner Inc., (2), (3) |
8,530,392 | ||||||||||||
| 16,868 | Chipotle Mexican Grill, (2), (3) |
6,985,882 | ||||||||||||
| 71,329 | Coach, Inc. |
5,218,430 | ||||||||||||
| 77,376 | Dollar Tree Stores Inc., (2) |
7,866,044 | ||||||||||||
| 37,331 | Fossil Inc., (3) |
4,878,042 | ||||||||||||
| 131,253 | GNC Holdings Inc, Class A |
5,126,742 | ||||||||||||
| 117,979 | Lululemon Athletica Inc., (2), (3) |
8,746,963 | ||||||||||||
| 111,087 | PetSmart Inc., (3) |
6,471,929 | ||||||||||||
| 20,682 | Priceline.com Incorporated, (2), (3) |
15,735,279 | ||||||||||||
| 65,530 | Ralph Lauren Corporation, (3) |
11,288,853 | ||||||||||||
| 220,280 | Starbucks Corporation |
12,639,666 | ||||||||||||
| 217,107 | TJX Companies, Inc., (3) |
9,055,533 | ||||||||||||
| 150,592 | YUM! Brands, Inc. |
10,952,556 | ||||||||||||
| Total Consumer Discretionary |
128,225,440 | |||||||||||||
| Consumer Staples – 7.9% |
||||||||||||||
| 108,957 | Costco Wholesale Corporation |
9,606,739 | ||||||||||||
| 166,435 | Estee Lauder Companies Inc., Class A |
10,876,527 | ||||||||||||
| 74,079 | Mead Johnson Nutrition Company, Class A Shares |
6,338,199 | ||||||||||||
| 129,002 | Monster Beverage Corporation, (2) |
8,379,970 | ||||||||||||
| 146,095 | Whole Foods Market, Inc., (3) |
12,136,112 | ||||||||||||
| Total Consumer Staples |
47,337,547 | |||||||||||||
| Energy – 7.1% |
||||||||||||||
| 105,408 | Cobalt International Energy, Inc., (2), (3) |
2,820,718 | ||||||||||||
| 55,429 | Concho Resources Inc., (2) |
5,940,880 | ||||||||||||
| 112,499 | National-Oilwell Varco Inc. |
8,522,924 | ||||||||||||
| 80,184 | Occidental Petroleum Corporation |
7,314,384 | ||||||||||||
| 81,828 | Pioneer Natural Resources Company, (3) |
9,477,319 | ||||||||||||
| 111,547 | Schlumberger Limited |
8,270,095 | ||||||||||||
| Total Energy |
42,346,320 | |||||||||||||
| Financials – 3.2% |
||||||||||||||
| 104,700 | American Express Company |
6,303,987 | ||||||||||||
| 200,398 | American Tower REIT Inc. |
13,142,101 | ||||||||||||
| Total Financials |
19,446,088 | |||||||||||||
| Health Care – 11.5% |
||||||||||||||
| 183,556 | Agilent Technologies, Inc., (2) |
7,742,392 | ||||||||||||
| 90,080 | Alexion Pharmaceuticals Inc. |
8,136,026 | ||||||||||||
| 116,206 | Allergan, Inc. |
11,155,776 | ||||||||||||
| 111,103 | Cerner Corporation, (2), (3) |
9,009,342 | ||||||||||||
| 128,979 | Gilead Sciences, Inc., (2) |
6,708,198 | ||||||||||||
| 74,532 | Idexx Labs Inc., (2), (3) |
6,553,599 | ||||||||||||
| 71,359 | McKesson HBOC Inc. |
6,522,926 | ||||||||||||
| 26,986 | Mettler-Toledo International Inc. |
4,839,130 | ||||||||||||
| 79,718 | Perrigo Company, (3) |
8,362,418 | ||||||||||||
| Total Health Care |
69,029,807 | |||||||||||||
| Nuveen Investments | 19 |
Portfolio of Investments (Unaudited)
Nuveen Large Cap Growth Opportunities Fund (continued)
April 30, 2012
| Shares | Description (1) | Value | ||||||||||||
| Industrials – 9.9% |
||||||||||||||
| 81,901 | Boeing Company |
$ | 6,289,997 | |||||||||||
| 111,725 | Cummins Inc. |
12,941,107 | ||||||||||||
| 195,408 | Danaher Corporation, (3) |
10,595,022 | ||||||||||||
| 85,660 | Graco Inc. |
4,566,535 | ||||||||||||
| 109,196 | Kansas City Southern Industries, (2), (3) |
8,410,276 | ||||||||||||
| 47,375 | Precision Castparts Corporation |
8,355,529 | ||||||||||||
| 40,731 | W.W. Grainger, Inc., (3) |
8,464,716 | ||||||||||||
| Total Industrials |
59,623,182 | |||||||||||||
| Information Technology – 37.0% |
||||||||||||||
| 164,555 | Accenture Limited, Class A, (3) |
10,687,847 | ||||||||||||
| 101,174 | Apple, Inc., (2) |
59,109,898 | ||||||||||||
| 48,641 | Check Point Software Technology Limited, (2) |
2,827,501 | ||||||||||||
| 54,680 | Citrix Systems, (2) |
4,681,155 | ||||||||||||
| 292,769 | EMC Corporation, (2), (3) |
8,259,013 | ||||||||||||
| 48,740 | F5 Networks, Inc., (2) |
6,527,748 | ||||||||||||
| 24,526 | Google Inc., Class A, (2) |
14,843,871 | ||||||||||||
| 65,699 | International Business Machines Corporation (IBM) |
13,604,949 | ||||||||||||
| 46,091 | LinkedIn Corporation, Class A Shares, (2), (3) |
4,998,569 | ||||||||||||
| 38,353 | MasterCard, Inc., Class A |
17,345,911 | ||||||||||||
| 77,292 | NetSuite Inc., (2) |
3,430,219 | ||||||||||||
| 261,232 | QUALCOMM, Inc. |
16,677,051 | ||||||||||||
| 77,827 | Rackspace Hosting Inc., (2), (3) |
4,520,970 | ||||||||||||
| 116,390 | Red Hat, Inc., (2) |
6,938,008 | ||||||||||||
| 38,624 | Salesforce.com, Inc., (2), (3) |
6,014,916 | ||||||||||||
| 135,001 | Teradata Corporation, (2), (3) |
9,420,370 | ||||||||||||
| 127,132 | VeriFone Holdings Inc., (2), (3) |
6,056,568 | ||||||||||||
| 89,197 | Visa Inc., (3) |
10,969,447 | ||||||||||||
| 84,754 | VMware Inc., Class A, (3) |
9,468,717 | ||||||||||||
| 169,381 | Xilinx, Inc., (3) |
6,162,081 | ||||||||||||
| Total Information Technology |
222,544,809 | |||||||||||||
| Materials – 1.7% |
||||||||||||||
| 136,563 | Monsanto Company |
10,403,369 | ||||||||||||
| Total Common Stocks (cost $418,390,641) |
598,956,562 | |||||||||||||
| Shares | Description (1) | Value | ||||||||||||
| INVESTMENTS PURCHASED WITH COLLATERAL FROM SECURITIES LENDING – 29.8% |
||||||||||||||
| Money Market Funds – 29.8% |
||||||||||||||
| 179,194,145 | Mount Vernon Securities Lending Prime Portfolio, 0.276% (4), (5) |
$ | 179,194,145 | |||||||||||
| Total Investments Purchased with Collateral from Securities Lending (cost $179,194,145) |
179,194,145 | |||||||||||||
| 20 | Nuveen Investments |
| Shares | Description (1) | Value | ||||||||||||
| SHORT-TERM INVESTMENTS – 2.2% |
||||||||||||||
| Money Market Funds – 2.2% |
||||||||||||||
| 13,409,991 | First American Treasury Obligations Fund, Class Z, 0.000% (4) |
$ | 13,409,991 | |||||||||||
| Total Short-Term Investments (cost $13,409,991) |
13,409,991 | |||||||||||||
| Total Investments (cost $610,994,777) – 131.6% |
791,560,698 | |||||||||||||
| Other Assets Less Liabilities – (31.6)% |
(190,212,030) | |||||||||||||
| Net Assets – 100% |
$ | 601,348,668 | ||||||||||||
| For Fund portfolio compliance purposes, the Fund’s industry classifications refer to any one or more of the industry sub-classifications used by one or more widely recognized market indexes or ratings group indexes, and/or as defined by Fund management. This definition may not apply for purposes of this report which may combine industry sub-classifications into sectors for reporting ease. |
| (1) | All percentages shown in the Portfolio of Investments are based on net assets. |
| (2) | Non-income producing; issuer has not declared a dividend within the past twelve months. |
| (3) | Investment, or a portion of investment, is out on loan for securities lending. |
| (4) | The rate shown is the annualized seven-day effective yield as of April 30, 2012. |
| (5) | The Fund may loan securities representing up to one third of the fair value of its total assets (which includes collateral for securities on loan) to broker dealers, banks, and other institutions. The Fund maintains collateral equal to at least 102% of the fair value of the securities loaned. The cash collateral received by the Fund is invested in this money market fund. See Notes to Financial Statements, Footnote 1 – General Information and Significant Accounting Policies, Securities Lending for more information. |
See accompanying notes to financial statements.
| Nuveen Investments | 21 |
Portfolio of Investments (Unaudited)
Nuveen Mid Cap Growth Opportunities Fund
April 30, 2012
| Shares | Description (1) | Value | ||||||||||||
| COMMON STOCKS – 98.7% |
||||||||||||||
| Consumer Discretionary – 20.8% |
||||||||||||||
| 264,572 | Bed Bath and Beyond Inc., (2), (3) |
$ | 18,623,223 | |||||||||||
| 175,009 | BorgWarner Inc., (2), (3) |
13,832,711 | ||||||||||||
| 33,942 | Chipotle Mexican Grill, Class A, (2), (3) |
14,057,079 | ||||||||||||
| 251,656 | Dick’s Sporting Goods Inc. |
12,733,794 | ||||||||||||
| 194,921 | Discovery Communications inc., Class A Shares, (2), (3) |
10,607,601 | ||||||||||||
| 199,907 | Dollar Tree Stores Inc., (2) |
20,322,546 | ||||||||||||
| 84,576 | Fossil Inc., (3) |
11,051,546 | ||||||||||||
| 471,291 | GNC Holdings Inc, Class A |
18,408,626 | ||||||||||||
| 211,531 | Lululemon Athletica Inc., (2), (3) |
15,682,908 | ||||||||||||
| 283,489 | PetSmart Inc., (3) |
16,516,069 | ||||||||||||
| 191,695 | Polaris Industries Inc. |
15,228,251 | ||||||||||||
| 25,753 | Priceline.com Incorporated, (2), (3) |
19,593,397 | ||||||||||||
| 113,653 | Ralph Lauren Corporation, (3) |
19,579,002 | ||||||||||||
| 194,607 | Ross Stores, Inc. |
11,985,845 | ||||||||||||
| 270,966 | Select Comfort Corporation, (2) |
7,825,498 | ||||||||||||
| 203,262 | Ulta Salon, Cosmetics & Fragrance, Inc., (2), (3) |
17,923,643 | ||||||||||||
| Total Consumer Discretionary |
243,971,739 | |||||||||||||
| Consumer Staples – 3.0% |
||||||||||||||
| 306,018 | Monster Beverage Corporation, (2) |
19,878,929 | ||||||||||||
| 188,547 | Whole Foods Market, Inc. |
15,662,599 | ||||||||||||
| Total Consumer Staples |
35,541,528 | |||||||||||||
| Energy – 8.8% |
||||||||||||||
| 298,192 | Cobalt International Energy, Inc., (2) |
7,979,618 | ||||||||||||
| 159,948 | Concho Resources Inc., (2) |
17,143,227 | ||||||||||||
| 155,037 | Core Laboratories NV, (3) |
21,236,968 | ||||||||||||
| 410,290 | Midstates Petroleum Co Inc. |
6,695,933 | ||||||||||||
| 261,925 | Oasis Petroleum Inc. |
8,661,860 | ||||||||||||
| 361,985 | Oceaneering International Inc., (3) |
18,689,286 | ||||||||||||
| 195,873 | Pioneer Natural Resources Company, (3) |
22,686,011 | ||||||||||||
| Total Energy |
103,092,903 | |||||||||||||
| Financials – 4.6% |
||||||||||||||
| 170,471 | Affiliated Managers Group Inc., (2) |
19,368,915 | ||||||||||||
| 198,075 | Digital Realty Trust Inc., (3) |
14,873,452 | ||||||||||||
| 365,696 | Discover Financial Services |
12,397,094 | ||||||||||||
| 195,352 | Marketaxess |
6,702,527 | ||||||||||||
| Total Financials |
53,341,988 | |||||||||||||
| Health Care – 14.1% |
||||||||||||||
| 432,477 | Agilent Technologies, Inc., (2) |
18,241,880 | ||||||||||||
| 296,360 | Alexion Pharmaceuticals Inc. |
26,767,235 | ||||||||||||
| 119,347 | AthenaHealth Inc., (2), (3) |
8,646,690 | ||||||||||||
| 170,669 | Catalyst Health Soltuions Inc., (2) |
14,740,682 | ||||||||||||
| 341,690 | Cerner Corporation, (2), (3) |
27,707,642 | ||||||||||||
| 132,660 | Edwards Lifesciences Corporation, (2) |
11,006,800 | ||||||||||||
| 213,018 | Idexx Labs Inc., (2), (3) |
18,730,673 | ||||||||||||
| 238,296 | Perrigo Company, (3) |
24,997,250 | ||||||||||||
| 22 | Nuveen Investments |
| Shares | Description (1) | Value | ||||||||||||
| Health Care (continued) |
||||||||||||||
| 109,320 | Regeneron Pharmaceuticals, Inc., (2), (3) |
$ | 14,786,623 | |||||||||||
| Total Health Care |
165,625,475 | |||||||||||||
| Industrials – 18.2% |
||||||||||||||
| 168,754 | AGCO Corporation, (2), (3) |
7,858,874 | ||||||||||||
| 393,859 | Ametek Inc. |
19,822,923 | ||||||||||||
| 232,475 | Graco Inc. |
12,393,242 | ||||||||||||
| 633,321 | Hexcel Corporation, (2), (3) |
17,340,329 | ||||||||||||
| 88,287 | IHS Inc., (2), (3) |
8,923,167 | ||||||||||||
| 305,393 | J.B. Hunt Transports Serives Inc., (3) |
16,897,395 | ||||||||||||
| 177,212 | Kansas City Southern Industries, (2), (3) |
13,648,868 | ||||||||||||
| 236,080 | MSC Industrial Direct Inc., Class A |
17,401,457 | ||||||||||||
| 163,253 | Roper Industries Inc. |
16,635,481 | ||||||||||||
| 462,103 | Ryanair Holdings PLC, (3) |
15,559,008 | ||||||||||||
| 152,024 | TransDigm Group Inc. |
19,173,267 | ||||||||||||
| 410,134 | Verisk Analytics Inc, Class A Shares, (2) |
20,076,059 | ||||||||||||
| 85,027 | W.W. Grainger, Inc., (3) |
17,670,311 | ||||||||||||
| 135,091 | Wabtec Corporation |
10,507,378 | ||||||||||||
| Total Industrials |
213,907,759 | |||||||||||||
| Information Technology – 23.0% |
||||||||||||||
| 324,506 | Amphenol Corporation, Class A, (3) |
18,866,779 | ||||||||||||
| 244,103 | Ansys Inc., (2), (3) |
16,371,988 | ||||||||||||
| 358,693 | ARM Holdings PLC, (3) |
9,085,694 | ||||||||||||
| 506,175 | Avago Technologies Limited |
17,452,914 | ||||||||||||
| 120,286 | Check Point Software Technology Limited, (2), (3) |
6,992,225 | ||||||||||||
| 114,019 | Citrix Systems, (2) |
9,761,167 | ||||||||||||
| 153,687 | CommVault Systems, Inc., (2), (3) |
8,002,482 | ||||||||||||
| 298,528 | Cornerstone OnDemand Inc., (2), (3) |
6,203,412 | ||||||||||||
| 141,543 | F5 Networks, Inc., (2) |
18,956,854 | ||||||||||||
| 277,120 | FleetCor Technologies Inc., (2) |
10,960,096 | ||||||||||||
| 348,052 | Fortinet Inc., (2) |
9,091,118 | ||||||||||||
| 129,085 | LinkedIn Corporation, Class A Shares, (2), (3) |
13,999,268 | ||||||||||||
| 245,309 | Micros Systems, Inc., (2) |
13,940,910 | ||||||||||||
| 182,405 | NetSuite Inc., (2) |
8,095,134 | ||||||||||||
| 339,896 | Rackspace Hosting Inc., (2), (3) |
19,744,559 | ||||||||||||
| 318,626 | Red Hat, Inc., (2) |
18,993,296 | ||||||||||||
| 286,974 | Teradata Corporation, (2) |
20,025,046 | ||||||||||||
| 435,792 | VeriFone Holdings Inc., (2), (3) |
20,761,131 | ||||||||||||
| 611,689 | Xilinx, Inc., (3) |
22,253,247 | ||||||||||||
| Total Information Technology |
269,557,320 | |||||||||||||
| Materials – 4.2% |
||||||||||||||
| 139,353 | Agrium Inc., (3) |
12,249,129 | ||||||||||||
| 277,968 | Albemarle Corporation |
18,151,310 | ||||||||||||
| 297,980 | Ecolab Inc., (3) |
18,978,346 | ||||||||||||
| Total Materials |
49,378,785 | |||||||||||||
| Nuveen Investments | 23 |
Portfolio of Investments (Unaudited)
Nuveen Mid Cap Growth Opportunities Fund (continued)
April 30, 2012
| Shares | Description (1) | Value | ||||||||||||
| Telecommunication Services – 2.0% |
||||||||||||||
| 439,963 | SBA Communications Corporation, (2), (3) |
$ | 23,643,612 | |||||||||||
| Total Common Stocks (cost $870,034,577) |
1,158,061,109 | |||||||||||||
| Shares | Description (1) | Value | ||||||||||||
| INVESTMENTS PURCHASED WITH COLLATERAL FROM SECURITIES LENDING – 36.7% |
||||||||||||||
| Money Market Funds – 36.7% |
||||||||||||||
| 430,267,245 | Mount Vernon Securities Lending Prime Portfolio, 0.276% (4), (5) |
$ | 430,267,245 | |||||||||||
| Total Investments Purchased with Collateral from Securities Lending (cost $430,267,245) |
430,267,245 | |||||||||||||
| Shares | Description (1) | Value | ||||||||||||
| SHORT-TERM INVESTMENTS – 0.7% |
||||||||||||||
| Money Market Funds – 0.7% |
||||||||||||||
| 7,904,946 | First American Treasury Obligations Fund, Class Z, 0.000% (4) |
$ | 7,904,649 | |||||||||||
| Total Short-Term Investments (cost $7,904,649) |
7,904,649 | |||||||||||||
| Total Investments (cost $1,308,206,471) – 136.1% |
1,596,233,003 | |||||||||||||
| Other Assets Less Liabilities – (36.1)% |
(423,063,476) | |||||||||||||
| Net Assets – 100% |
$ | 1,173,169,527 | ||||||||||||
| For Fund portfolio compliance purposes, the Fund’s industry classifications refer to any one or more of the industry sub-classifications used by one or more widely recognized market indexes or ratings group indexes, and/or as defined by Fund management. This definition may not apply for purposes of this report which may combine industry sub-classifications into sectors for reporting ease. |
| (1) | All percentages shown in the Portfolio of Investments are based on net assets. |
| (2) | Non-income producing; issuer has not declared a dividend within the past twelve months. |
| (3) | Investment, or a portion of investment, is out on loan for securities lending. |
| (4) | The rate shown is the annualized seven-day effective yield as of April 30, 2012. |
| (5) | The Fund may loan securities representing up to one third of the fair value of its total assets (which includes collateral for securities on loan) to broker dealers, banks, and other institutions. The Fund maintains collateral equal to at least 102% of the fair value of the securities loaned. The cash collateral received by the Fund is invested in this money market fund. See Notes to Financial Statements, Footnote 1 – General Information and Significant Accounting Policies, Securities Lending for more information. |
See accompanying notes to financial statements.
| 24 | Nuveen Investments |
Portfolio of Investments (Unaudited)
Nuveen Small Cap Growth Opportunities Fund
April 30, 2012
| Shares | Description (1) | Value | ||||||||||||
| COMMON STOCKS – 98.3% |
||||||||||||||
| Consumer Discretionary – 17.5% |
||||||||||||||
| 49,824 | Ann Inc., (2), (3) |
$ | 1,379,627 | |||||||||||
| 78,947 | Ascena Retail Group Inc., (2), (3) |
1,616,835 | ||||||||||||
| 42,679 | Brunswick Corporation, (3) |
1,122,031 | ||||||||||||
| 25,549 | Coinstar Inc., (2), (3) |
1,604,222 | ||||||||||||
| 88,565 | Crocs, Inc., (3) |
1,789,013 | ||||||||||||
| 173,492 | Hhgregg Inc., (2), (3) |
1,814,726 | ||||||||||||
| 22,075 | Joseph A Bank Clothiers, Inc., (3) |
1,049,666 | ||||||||||||
| 34,097 | Mens Wearhouse Inc. |
1,262,953 | ||||||||||||
| 58,231 | Penske Auto Group, Inc., (3) |
1,539,628 | ||||||||||||
| 34,612 | Sothebys Holdings Inc., (3) |
1,360,944 | ||||||||||||
| 54,731 | Tenneco Inc., (2) |
1,687,357 | ||||||||||||
| 117,489 | Texas Roadhouse, Inc., (3) |
2,026,685 | ||||||||||||
| Total Consumer Discretionary |
18,253,687 | |||||||||||||
| Energy – 10.3% |
||||||||||||||
| 55,262 | Basic Energy Services, Inc., (2) |
795,773 | ||||||||||||
| 33,647 | Berry Petroleum Company, (3) |
1,532,621 | ||||||||||||
| 56,108 | Carrizo Oil & Gas, Inc., (2), (3) |
1,573,268 | ||||||||||||
| 25,984 | Dril Quip Inc., (3) |
1,751,062 | ||||||||||||
| 58,791 | Energy XXI Limited Bermuda, (2), (3) |
2,215,245 | ||||||||||||
| 74,763 | Midstates Petroleum Co Inc. |
1,220,132 | ||||||||||||
| 52,083 | Oasis Petroleum Inc., (3) |
1,722,385 | ||||||||||||
| Total Energy |
10,810,486 | |||||||||||||
| Financials – 6.0% |
||||||||||||||
| 66,551 | Evercore Partners Inc., (3) |
1,758,943 | ||||||||||||
| 52,213 | EZCORP, Inc., (3) |
1,398,786 | ||||||||||||
| 53,197 | Home Bancshares, Inc. |
1,550,161 | ||||||||||||
| 43,927 | Stifel Financial Corporation, (3) |
1,599,821 | ||||||||||||
| Total Financials |
6,307,711 | |||||||||||||
| Health Care – 20.4% |
||||||||||||||
| 43,237 | Align Technology, Inc., (2) |
1,371,045 | ||||||||||||
| 72,808 | Alkermes Inc., (2), (3) |
1,259,578 | ||||||||||||
| 61,048 | Ariad Pharmaceuticals, Inc., (2), (3) |
995,082 | ||||||||||||
| 16,654 | AthenaHealth Inc., (2), (3) |
1,206,582 | ||||||||||||
| 39,568 | Cubist Pharmaceuticals Inc., (3) |
1,672,935 | ||||||||||||
| 11,054 | Gen-Probe, Inc., (2) |
901,454 | ||||||||||||
| 22,076 | Haemonetics Corporation |
1,579,979 | ||||||||||||
| 86,758 | HealthSouth Corporation, (3) |
1,942,512 | ||||||||||||
| 61,290 | HMS Holdings Corporation, (2), (3) |
1,474,637 | ||||||||||||
| 23,491 | ICU Medical, Inc., (2) |
1,233,043 | ||||||||||||
| 69,577 | Impax Laboratories Inc., (2), (3) |
1,713,682 | ||||||||||||
| 24,990 | Incyte Pharmaceuticals Inc., (2), (3) |
566,773 | ||||||||||||
| 14,171 | Medivation, Inc., (2) |
1,146,150 | ||||||||||||
| 16,002 | Onyx Pharmaceuticals Inc., (3) |
728,251 | ||||||||||||
| 60,380 | PSS World Medical Inc., (2), (3) |
1,444,893 | ||||||||||||
| 33,499 | Salix Pharmaceuticals Limited, (2), (3) |
1,654,851 | ||||||||||||
| Nuveen Investments | 25 |
Portfolio of Investments (Unaudited)
Nuveen Small Cap Growth Opportunities Fund (continued)
April 30, 2012
| Shares | Description (1) | Value | ||||||||||||
| Health Care (continued) |
||||||||||||||
| 17,212 | Vivus, Inc., (3) |
$ | 416,875 | |||||||||||
| Total Health Care |
21,308,322 | |||||||||||||
| Industrials – 17.0% |
||||||||||||||
| 38,825 | Actuant Corporation, (3) |
1,058,758 | ||||||||||||
| 29,106 | Acuity Brands Inc., (3) |
1,617,420 | ||||||||||||
| 89,059 | Altra Industrial Motion, Inc., (2) |
1,627,999 | ||||||||||||
| 166,817 | CBIZ Inc., (2), (3) |
1,012,579 | ||||||||||||
| 52,684 | ESCO Technologies Inc., (3) |
1,812,330 | ||||||||||||
| 55,521 | General Cable Corporation, (3) |
1,634,538 | ||||||||||||
| 100,509 | Interface, Inc., (3) |
1,423,207 | ||||||||||||
| 78,752 | MasTec Inc., (2), (3) |
1,369,497 | ||||||||||||
| 121,580 | Orbital Sciences Corporation, (2), (3) |
1,527,045 | ||||||||||||
| 59,749 | Tetra Tech, Inc., (2) |
1,595,298 | ||||||||||||
| 75,665 | TrueBlue Inc., (2), (3) |
1,305,978 | ||||||||||||
| 42,124 | Woodward Governor Company |
1,751,937 | ||||||||||||
| Total Industrials |
17,736,586 | |||||||||||||
| Information Technology – 24.5% |
||||||||||||||
| 52,056 | Acme Packet, Inc., (3) |
1,461,212 | ||||||||||||
| 44,838 | ADTRAN, Inc., (3) |
1,368,456 | ||||||||||||
| 66,106 | Advent Software Inc., (2), (3) |
1,784,201 | ||||||||||||
| 65,201 | Fabrinet, (2) |
1,096,681 | ||||||||||||
| 63,799 | International Rectifier Corporation, (2), (3) |
1,392,732 | ||||||||||||
| 114,231 | IXIA, (2) |
1,439,311 | ||||||||||||
| 118,396 | JDS Uniphase Corporation, (2) |
1,438,511 | ||||||||||||
| 46,397 | Kenexa Corporation |
1,515,790 | ||||||||||||
| 34,655 | Micros Systems, Inc., (2) |
1,969,444 | ||||||||||||
| 51,820 | MKS Instruments Inc. |
1,432,823 | ||||||||||||
| 55,677 | National Instruments Corporation, (3) |
1,514,414 | ||||||||||||
| 110,574 | Perficient, Inc., (2) |
1,327,994 | ||||||||||||
| 170,811 | Photronics Inc., (2) |
1,057,320 | ||||||||||||
| 44,174 | Plantronics Inc. |
1,692,748 | ||||||||||||
| 116,846 | Polycom Inc., (2), (3) |
1,550,546 | ||||||||||||
| 63,433 | Semtech Corporation, (3) |
1,729,184 | ||||||||||||
| 108,343 | Teradyne Inc., (2), (3) |
1,864,583 | ||||||||||||
| 591,081 | Video Propulsion Inc., (4) |
— | ||||||||||||
| Total Information Technology |
25,635,950 | |||||||||||||
| Materials – 2.6% |
||||||||||||||
| 46,076 | H.B. Fuller Company |
1,515,900 | ||||||||||||
| 31,254 | Schnitzer Steel Industries, Inc., (3) |
1,246,097 | ||||||||||||
| Total Materials |
2,761,997 | |||||||||||||
| Total Common Stocks (cost $90,058,224) |
102,814,739 | |||||||||||||
| 26 | Nuveen Investments |
| Shares | Description (1) | Value | ||||||||||||
| INVESTMENTS PURCHASED WITH COLLATERAL FROM SECURITIES LENDING – 46.3% |
||||||||||||||
| Money Market Funds – 46.3% |
||||||||||||||
| 48,365,957 | Mount Vernon Securities Lending Prime Portfolio, 0.276% (5), (6) |
$ | 48,365,957 | |||||||||||
| Total Investments Purchased with Collateral from Securities Lending (cost $48,365,957) |
48,365,957 | |||||||||||||
| Shares | Description (1) | Value | ||||||||||||
| SHORT-TERM INVESTMENTS – 2.8% |
||||||||||||||
| Money Market Funds – 2.8% |
||||||||||||||
| 2,957,008 | First American Treasury Obligations Fund, Class Z, 0.000% (5) |
$ | 2,957,008 | |||||||||||
| Total Short-Term Investments (cost $2,957,008) |
2,957,008 | |||||||||||||
| Total Investments (cost $141,381,189) – 147.4% |
154,137,704 | |||||||||||||
| Other Assets Less Liabilities – (47.4)% |
(49,599,850) | |||||||||||||
| Net Assets – 100% |
$ | 104,537,854 | ||||||||||||
| For Fund portfolio compliance purposes, the Fund’s industry classifications refer to any one or more of the industry sub-classifications used by one or more widely recognized market indexes or ratings group indexes, and/or as defined by Fund management. This definition may not apply for purposes of this report which may combine industry sub-classifications into sectors for reporting ease. |
| (1) | All percentages shown in the Portfolio of Investments are based on net assets. |
| (2) | Non-income producing; issuer has not declared a dividend within the past twelve months. |
| (3) | Investment, or a portion of investment, is out on loan for securities lending. |
| (4) | Investment valued at fair value using methods determined in good faith by, or at the discretion of, the Board of Directors. For fair value measurement disclosure purposes, investment categorized as Level 3. See Notes to Financial Statements Footnote 1 – General Information and Significant Accounting Policies, Investment Valuation for more information. |
| (5) | The rate shown is the annualized seven-day effective yield as of April 30, 2012. |
| (6) | The Fund may loan securities representing up to one third of the fair value of its total assets (which includes collateral for securities on loan) to broker dealers, banks, and other institutions. The Fund maintains collateral equal to at least 102% of the fair value of the securities loaned. The cash collateral received by the Fund is invested in this money market fund. See Notes to Financial Statements, Footnote 1 – General Information and Significant Accounting Policies, Securities Lending for more information. |
See accompanying notes to financial statements.
| Nuveen Investments | 27 |
Statement of Assets & Liabilities (Unaudited)
April 30, 2012
| Large Cap Growth Opportunities |
Mid Cap Growth Opportunities |
Small Cap Growth Opportunities |
||||||||||
| Assets |
||||||||||||
| Investments, at value (cost $431,800,632, $877,939,226 and $93,015,232, respectively) |
$ | 612,366,553 | $ | 1,165,965,758 | $ | 105,771,747 | ||||||
| Investments purchased with collateral from securities lending (at cost, which approximates value) |
179,194,145 | 430,267,245 | 48,365,957 | |||||||||
| Receivables: |
||||||||||||
| Dividends |
221,265 | 316,882 | 11,510 | |||||||||
| Due from broker |
24,150 | 59,127 | 14,550 | |||||||||
| Investments sold |
— | 27,441,059 | 2,867,116 | |||||||||
| Shares sold |
1,418,954 | 1,225,672 | 27,893 | |||||||||
| Other assets |
5,364 | 10,709 | 205 | |||||||||
| Total assets |
793,230,431 | 1,625,286,452 | 157,058,978 | |||||||||
| Liabilities |
||||||||||||
| Payables: |
||||||||||||
| Collateral from securities lending program |
179,194,145 | 430,267,245 | 48,365,957 | |||||||||
| Investments purchased |
10,538,483 | 18,512,323 | 3,616,214 | |||||||||
| Shares redeemed |
1,566,221 | 1,898,425 | 373,328 | |||||||||
| Accrued expenses: |
||||||||||||
| Management fees |
335,025 | 784,124 | 80,427 | |||||||||
| 12b-1 distribution and service fees |
38,117 | 98,830 | 11,434 | |||||||||
| Other |
209,772 | 555,978 | 73,764 | |||||||||
| Total liabilities |
191,881,763 | 452,116,925 | 52,521,124 | |||||||||
| Net assets |
$ | 601,348,668 | $ | 1,173,169,527 | $ | 104,537,854 | ||||||
| Class A Shares |
||||||||||||
| Net assets |
$ | 124,119,102 | $ | 320,189,066 | $ | 39,597,779 | ||||||
| Shares outstanding |
3,456,870 | 7,178,880 | 1,738,200 | |||||||||
| Net asset value per share |
$ | 35.91 | $ | 44.60 | $ | 22.78 | ||||||
| Offering price per share (net asset value per share plus maximum sales charge of 5.75% of offering price) |
$ | 38.10 | $ | 47.32 | $ | 24.17 | ||||||
| Class B Shares |
||||||||||||
| Net assets |
$ | 1,908,976 | $ | 3,422,537 | $ | 1,081,988 | ||||||
| Shares outstanding |
58,988 | 89,245 | 55,037 | |||||||||
| Net asset value and offering price per share |
$ | 32.36 | $ | 38.35 | $ | 19.66 | ||||||
| Class C Shares |
||||||||||||
| Net assets |
$ | 11,184,843 | $ | 17,604,356 | $ | 1,730,126 | ||||||
| Shares outstanding |
337,637 | 436,566 | 83,876 | |||||||||
| Net asset value and offering price per share |
$ | 33.13 | $ | 40.32 | $ | 20.63 | ||||||
| Class R3 Shares |
||||||||||||
| Net assets |
$ | 8,366,987 | $ | 41,878,980 | $ | 2,618,279 | ||||||
| Shares outstanding |
237,267 | 961,049 | 117,227 | |||||||||
| Net asset value and offering price per share |
$ | 35.26 | $ | 43.58 | $ | 22.34 | ||||||
| Class I Shares |
||||||||||||
| Net assets |
$ | 455,768,760 | $ | 790,074,588 | $ | 59,509,682 | ||||||
| Shares outstanding |
12,189,213 | 16,351,018 | 2,413,651 | |||||||||
| Net asset value and offering price per share |
$ | 37.39 | $ | 48.32 | $ | 24.66 | ||||||
| Net assets consist of: |
||||||||||||
| Capital paid-in |
$ | 419,821,738 | $ | 848,413,082 | $ | 85,343,534 | ||||||
| Undistributed (Over-distribution of) net investment income |
(251,565 | ) | (1,811,120 | ) | (463,117 | ) | ||||||
| Accumulated net realized gain (loss) |
1,212,574 | 38,541,033 | 6,900,922 | |||||||||
| Net unrealized appreciation (depreciation) |
180,565,921 | 288,026,532 | 12,756,515 | |||||||||
| Net assets |
$ | 601,348,668 | $ | 1,173,169,527 | $ | 104,537,854 | ||||||
| Authorized shares |
2 billion | 2 billion | 2 billion | |||||||||
| Par value per share |
$ | 0.0001 | $ | 0.0001 | $ | 0.0001 | ||||||
See accompanying notes to financial statements.
| 28 | Nuveen Investments |
Statement of Operations (Unaudited)
Six Months Ended April 30, 2012
| Large Cap Growth Opportunities |
Mid Cap Growth Opportunities |
Small Cap Growth Opportunities |
||||||||||
| Investment Income |
||||||||||||
| Dividend and interest income (net of foreign tax withheld of $–, $23,278 and $–, respectively) |
$ | 2,393,364 | $ | 3,714,058 | $ | 163,742 | ||||||
| Securities lending income |
339,837 | 662,507 | 85,781 | |||||||||
| Total investment income |
2,733,201 | 4,376,565 | 249,523 | |||||||||
| Expenses |
||||||||||||
| Management fees |
2,286,475 | 4,698,003 | 519,989 | |||||||||
| 12b-1 service fees – Class A |
123,810 | 368,508 | 47,104 | |||||||||
| 12b-1 distribution and service fees – Class B |
10,679 | 18,520 | 6,372 | |||||||||
| 12b-1 distribution and service fees – Class C |
46,697 | 76,723 | 8,036 | |||||||||
| 12b-1 distribution and service fees – Class R3 |
15,114 | 92,319 | 6,149 | |||||||||
| Shareholders’ servicing agent fees and expenses |
412,785 | 812,457 | 231,379 | |||||||||
| Custodian’s fees and expenses |
50,679 | 92,116 | 15,384 | |||||||||
| Directors’ fees and expenses |
7,905 | 15,300 | 1,611 | |||||||||
| Professional fees |
18,945 | 38,805 | 4,636 | |||||||||
| Shareholders’ reports – printing and mailing expenses |
26,202 | 49,078 | 10,303 | |||||||||
| Federal and state registration fees |
34,990 | 39,166 | 29,610 | |||||||||
| Other expenses |
15,486 | 21,519 | 10,812 | |||||||||
| Total expenses before expense reimbursement |
3,049,767 | 6,322,514 | 891,385 | |||||||||
| Expense reimbursement |
(79,586 | ) | (153,348 | ) | (189,435 | ) | ||||||
| Net expenses |
2,970,181 | 6,169,166 | 701,950 | |||||||||
| Net investment income (loss) |
(236,980 | ) | (1,792,601 | ) | (452,427 | ) | ||||||
| Realized and Unrealized Gain (Loss) |
||||||||||||
| Net realized gain (loss) from investments |
4,097,388 | 38,745,479 | 8,263,632 | |||||||||
| Change in net unrealized appreciation (depreciation) of investments |
67,938,196 | 93,210,672 | 5,197,241 | |||||||||
| Net realized and unrealized gain (loss) |
72,035,584 | 131,956,151 | 13,460,873 | |||||||||
| Net increase (decrease) in net assets from operations |
$ | 71,798,604 | $ | 130,163,550 | $ | 13,008,446 | ||||||
See accompanying notes to financial statements.
| Nuveen Investments | 29 |
Statement of Changes in Net Assets (Unaudited)
| Large Cap Growth Opportunities | Mid Cap Growth Opportunities | Small Cap Growth Opportunities | ||||||||||||||||||||||
| Six Months Ended 4/30/12 |
Year Ended 10/31/11 |
Six Months Ended 4/30/12 |
Year Ended 10/31/11 |
Six Months Ended 4/30/12 |
Year Ended 10/31/11 |
|||||||||||||||||||
| Operations |
||||||||||||||||||||||||
| Net investment income (loss) |
$ | (236,980 | ) | $ | (1,299,396 | ) | $ | (1,792,601 | ) | $ | (3,745,607 | ) | $ | (452,427 | ) | $ | (1,334,376 | ) | ||||||
| Net realized gain (loss) from: |
||||||||||||||||||||||||
| Investments and |
4,097,388 | 60,485,177 | 38,745,479 | 138,057,126 | 8,263,632 | 16,904,730 | ||||||||||||||||||
| Futures contracts |
— | — | — | — | — | 662,007 | ||||||||||||||||||
| Redemptions in-kind |
— | 29,395,704 | — | 97,107,318 | — | 10,195,953 | ||||||||||||||||||
| Change in net unrealized appreciation (depreciation) of investments and |
67,938,196 | (34,390,022 | ) | 93,210,672 | (91,117,542 | ) | 5,197,241 | (9,343,473 | ) | |||||||||||||||
| Net increase (decrease) in net assets from operations |
71,798,604 | 54,191,463 | 130,163,550 | 140,301,295 | 13,008,446 | 17,084,841 | ||||||||||||||||||
| Distributions to Shareholders |
||||||||||||||||||||||||
| From accumulated net realized gains: |
||||||||||||||||||||||||
| Class A |
(3,267,944 | ) | — | (10,990,297 | ) | — | (522,866 | ) | — | |||||||||||||||
| Class B |
(86,687 | ) | — | (172,338 | ) | — | (21,854 | ) | — | |||||||||||||||
| Class C |
(329,271 | ) | — | (618,790 | ) | — | (24,581 | ) | — | |||||||||||||||
| Class R3(1) |
(146,968 | ) | — | (1,376,941 | ) | — | (34,697 | ) | — | |||||||||||||||
| Class I(1) |
(14,243,083 | ) | — | (25,461,450 | ) | — | (807,347 | ) | — | |||||||||||||||
| Decrease in net assets from distributions to shareholders |
(18,073,953 | ) | — | (38,619,816 | ) | — | (1,411,345 | ) | — | |||||||||||||||
| Fund Share Transactions |
||||||||||||||||||||||||
| Proceeds from sale of shares |
110,116,460 | 117,946,299 | 151,510,603 | 279,657,651 | 7,722,437 | 29,550,383 | ||||||||||||||||||
| Proceeds from shares issued to shareholders due to reinvestment of distributions |
10,225,671 | — | 30,318,777 | — | 833,300 | — | ||||||||||||||||||
| 120,342,131 | 117,946,299 | 181,829,380 | 279,657,651 | 8,555,737 | 29,550,383 | |||||||||||||||||||
| Cost of shares redeemed |
(106,885,988 | ) | (172,879,927 | ) | (171,454,261 | ) | (348,970,454 | ) | (21,031,437 | ) | (81,538,615 | ) | ||||||||||||
| Cost of redemptions in-kind |
— | (86,539,024 | ) | — | (320,656,806 | ) | — | (46,264,595 | ) | |||||||||||||||
| Net increase (decrease) in net assets from Fund share transactions |
13,456,143 | (141,472,652 | ) | 10,375,119 | (389,969,609 | ) | (12,475,700 | ) | (98,252,827 | ) | ||||||||||||||
| Net increase (decrease) in net assets |
67,180,794 | (87,281,189 | ) | 101,918,853 | (249,668,314 | ) | (878,599 | ) | (81,167,986 | ) | ||||||||||||||
| Net assets at the beginning of period |
534,167,874 | 621,449,063 | 1,071,250,674 | 1,320,918,988 | 105,416,453 | 186,584,439 | ||||||||||||||||||
| Net assets at the end of period |
$ | 601,348,668 | $ | 534,167,874 | $ | 1,173,169,527 | $ | 1,071,250,674 | $ | 104,537,854 | $ | 105,416,453 | ||||||||||||
| Undistributed (Over-distribution of) net investment income at the end of period |
$ | (251,565 | ) | $ | (14,585 | ) | $ | (1,811,120 | ) | $ | (18,519 | ) | $ | (463,117 | ) | $ | (10,690 | ) | ||||||
| (1) | Effective January 18, 2011, Class R Shares and Class Y Shares previously offered by FAF Advisors, Inc. were renamed Class R3 Shares and Class I Shares, respectively. |
See accompanying notes to financial statements.
| 30 | Nuveen Investments |
Financial Highlights (Unaudited)
| Nuveen Investments | 31 |
Financial Highlights (Unaudited)
| Selected data for a share outstanding throughout each period: | ||||||||||||||||||||||||||||||||
| Class (Commencement Date) | ||||||||||||||||||||||||||||||||
| Investment Operations | Less Distributions | |||||||||||||||||||||||||||||||
| LARGE CAP GROWTH OPPORTUNITIES |
||||||||||||||||||||||||||||||||
| Year Ended October 31, |
Beginning Net Asset Value |
Net Invest- ment Income (Loss)(a) |
Net Realized/ Unrealized Gain (Loss) |
Total | Net Invest- ment Income |
Capital Gains(b) |
Total | Ending Net Asset Value |
||||||||||||||||||||||||
| Class A (1/95) |
|
|||||||||||||||||||||||||||||||
| 2012(f) |
$ | 32.92 | $ | (.05 | ) | $ | 4.20 | $ | 4.15 | $ | — | $ | (1.16 | ) | $ | (1.16 | ) | $ | 35.91 | |||||||||||||
| 2011 |
30.24 | (.15 | ) | 2.83 | 2.68 | — | — | — | 32.92 | |||||||||||||||||||||||
| 2010 |
24.23 | (.09 | ) | 6.15 | 6.06 | (.05 | ) | — | (.05 | ) | 30.24 | |||||||||||||||||||||
| 2009 |
21.52 | .05 | 2.68 | 2.73 | (.02 | ) | — | (.02 | ) | 24.23 | ||||||||||||||||||||||
| 2008 |
36.27 | .02 | (11.65 | ) | (11.63 | ) | — | (3.12 | ) | (3.12 | ) | 21.52 | ||||||||||||||||||||
| 2007 |
29.58 | (.05 | ) | 7.08 | 7.03 | — | (.34 | ) | (.34 | ) | 36.27 | |||||||||||||||||||||
| Class B (3/99) |
|
|||||||||||||||||||||||||||||||
| 2012(f) |
29.90 | (.14 | ) | 3.76 | 3.62 | — | (1.16 | ) | (1.16 | ) | 32.36 | |||||||||||||||||||||
| 2011 |
27.68 | (.36 | ) | 2.58 | 2.22 | — | — | — | 29.90 | |||||||||||||||||||||||
| 2010 |
22.31 | (.26 | ) | 5.63 | 5.37 | — | — | — | 27.68 | |||||||||||||||||||||||
| 2009 |
19.93 | (.09 | ) | 2.47 | 2.38 | — | — | — | 22.31 | |||||||||||||||||||||||
| 2008 |
34.08 | (.19 | ) | (10.84 | ) | (11.03 | ) | — | (3.12 | ) | (3.12 | ) | 19.93 | |||||||||||||||||||
| 2007 |
28.01 | (.27 | ) | 6.68 | 6.41 | — | (.34 | ) | (.34 | ) | 34.08 | |||||||||||||||||||||
| Class C (9/01) |
|
|||||||||||||||||||||||||||||||
| 2012(f) |
30.57 | (.16 | ) | 3.88 | 3.72 | — | (1.16 | ) | (1.16 | ) | 33.13 | |||||||||||||||||||||
| 2011 |
28.30 | (.37 | ) | 2.64 | 2.27 | — | — | — | 30.57 | |||||||||||||||||||||||
| 2010 |
22.81 | (.27 | ) | 5.76 | 5.49 | — | — | — | 28.30 | |||||||||||||||||||||||
| 2009 |
20.38 | (.10 | ) | 2.53 | 2.43 | — | — | — | 22.81 | |||||||||||||||||||||||
| 2008 |
34.77 | (.19 | ) | (11.08 | ) | (11.27 | ) | — | (3.12 | ) | (3.12 | ) | 20.38 | |||||||||||||||||||
| 2007 |
28.58 | (.28 | ) | 6.81 | 6.53 | — | (.34 | ) | (.34 | ) | 34.77 | |||||||||||||||||||||
| Class R3 (11/00)(e) |
|
|||||||||||||||||||||||||||||||
| 2012(f) |
32.39 | (.10 | ) | 4.13 | 4.03 | — | (1.16 | ) | (1.16 | ) | 35.26 | |||||||||||||||||||||
| 2011 |
29.83 | (.23 | ) | 2.79 | 2.56 | — | — | — | 32.39 | |||||||||||||||||||||||
| 2010 |
23.92 | (.16 | ) | 6.07 | 5.91 | — | — | — | 29.83 | |||||||||||||||||||||||
| 2009 |
21.26 | (.01 | ) | 2.67 | 2.66 | — | — | — | 23.92 | |||||||||||||||||||||||
| 2008 |
35.97 | (.05 | ) | (11.54 | ) | (11.59 | ) | — | (3.12 | ) | (3.12 | ) | 21.26 | |||||||||||||||||||
| 2007 |
29.41 | (.12 | ) | 7.02 | 6.90 | — | (.34 | ) | (.34 | ) | 35.97 | |||||||||||||||||||||
| Class I (12/92)(e) |
|
|||||||||||||||||||||||||||||||
| 2012(f) |
34.19 | — | ** | 4.36 | 4.36 | — | (1.16 | ) | (1.16 | ) | 37.39 | |||||||||||||||||||||
| 2011 |
31.33 | (.06 | ) | 2.92 | 2.86 | — | — | — | 34.19 | |||||||||||||||||||||||
| 2010 |
25.09 | (.03 | ) | 6.38 | 6.35 | (.11 | ) | — | (.11 | ) | 31.33 | |||||||||||||||||||||
| 2009 |
22.31 | .11 | 2.77 | 2.88 | (.10 | ) | — | (.10 | ) | 25.09 | ||||||||||||||||||||||
| 2008 |
37.42 | .10 | (12.07 | ) | (11.97 | ) | (.02 | ) | (3.12 | ) | (3.14 | ) | 22.31 | |||||||||||||||||||
| 2007 |
30.48 | .03 | 7.30 | 7.33 | (.05 | ) | (.34 | ) | (.39 | ) | 37.42 | |||||||||||||||||||||
| 32 | Nuveen Investments |
| Ratios/Supplemental Data | ||||||||||||||||||||||||||
| Ratios to Average Net Assets Before Reimbursement |
Ratios to Average Net Assets After Reimbursement(d) |
|||||||||||||||||||||||||
| Total Return(c) |
Ending Net Assets (000) |
Expenses | Net Invest- ment Income (Loss) |
Expenses | Net Invest- ment Income (Loss) |
Portfolio Turnover Rate |
||||||||||||||||||||
| 13.37 | % | $ | 124,119 | 1.29 | %* | (.33 | )%* | 1.26 | %* | (.30 | )%* | 40 | % | |||||||||||||
| 8.86 | 84,875 | 1.20 | (.46 | ) | 1.20 | (.46 | ) | 88 | ||||||||||||||||||
| 25.03 | 66,409 | 1.21 | (.36 | ) | 1.20 | (.35 | ) | 106 | ||||||||||||||||||
| 12.73 | 56,963 | 1.22 | .24 | 1.22 | .24 | 112 | ||||||||||||||||||||
| (34.81 | ) | 53,430 | 1.20 | .07 | 1.20 | .07 | 92 | |||||||||||||||||||
| 24.01 | 96,514 | 1.19 | (.15 | ) | 1.19 | (.15 | ) | 102 | ||||||||||||||||||
| 12.94 | 1,909 | 2.02 | * | (.99 | )* | 2.01 | * | (.97 | )* | 40 | ||||||||||||||||
| 8.02 | 2,411 | 1.95 | (1.19 | ) | 1.95 | (1.19 | ) | 88 | ||||||||||||||||||
| 24.07 | 3,473 | 1.96 | (1.07 | ) | 1.95 | (1.06 | ) | 106 | ||||||||||||||||||
| 11.94 | 4,749 | 1.97 | (.48 | ) | 1.97 | (.48 | ) | 112 | ||||||||||||||||||
| (35.33 | ) | 5,907 | 1.95 | (.68 | ) | 1.95 | (.68 | ) | 92 | |||||||||||||||||
| 23.13 | 11,955 | 1.94 | (.90 | ) | 1.94 | (.90 | ) | 102 | ||||||||||||||||||
| 12.98 | 11,185 | 2.04 | * | (1.08 | )* | 2.01 | * | (1.05 | )* | 40 | ||||||||||||||||
| 8.02 | 7,832 | 1.95 | (1.21 | ) | 1.95 | (1.21 | ) | 88 | ||||||||||||||||||
| 24.07 | 4,220 | 1.96 | (1.09 | ) | 1.95 | (1.08 | ) | 106 | ||||||||||||||||||
| 11.92 | 4,509 | 1.97 | (.51 | ) | 1.97 | (.51 | ) | 112 | ||||||||||||||||||
| (35.31 | ) | 4,368 | 1.95 | (.68 | ) | 1.95 | (.68 | ) | 92 | |||||||||||||||||
| 23.09 | 8,506 | 1.94 | (.90 | ) | 1.94 | (.90 | ) | 102 | ||||||||||||||||||
| 13.22 | 8,367 | 1.54 | * | (.64 | )* | 1.51 | * | (.61 | )* | 40 | ||||||||||||||||
| 8.58 | 3,431 | 1.45 | (.72 | ) | 1.45 | (.72 | ) | 88 | ||||||||||||||||||
| 24.71 | 742 | 1.46 | (.60 | ) | 1.45 | (.59 | ) | 106 | ||||||||||||||||||
| 12.51 | 667 | 1.47 | (.05 | ) | 1.47 | (.05 | ) | 112 | ||||||||||||||||||
| (35.00 | ) | 454 | 1.45 | (.18 | ) | 1.45 | (.18 | ) | 92 | |||||||||||||||||
| 23.70 | 566 | 1.44 | (.39 | ) | 1.44 | (.39 | ) | 102 | ||||||||||||||||||
| 13.49 | 455,769 | 1.03 | * | (.03 | )* | 1.01 | * | (.01 | )* | 40 | ||||||||||||||||
| 9.13 | 435,619 | .95 | (.17 | ) | .95 | (.17 | ) | 88 | ||||||||||||||||||
| 25.34 | 546,605 | .96 | (.11 | ) | .95 | (.10 | ) | 106 | ||||||||||||||||||
| 13.02 | 482,222 | .97 | .48 | .97 | .48 | 112 | ||||||||||||||||||||
| (34.65 | ) | 417,337 | .95 | .32 | .95 | .32 | 92 | |||||||||||||||||||
| 24.32 | 749,865 | .94 | .11 | .94 | .11 | 102 | ||||||||||||||||||||
| (a) | Per share Net Investment Income (Loss) is calculated using the average daily shares method. |
| (b) | Distributions from Capital Gains include short-term capital gains, if any. |
| (c) | Total return is the combination of changes in net asset value without any sales charge, reinvested dividend income at net asset value and reinvested capital gains distributions at net asset value, if any. Total returns are not annualized. |
| (d) | After expense reimbursement from the Adviser, where applicable. |
| (e) | Effective January 18, 2011, Class R Shares and Class Y Shares previously offered by FAF Advisors, Inc. were renamed Class R3 Shares and Class I Shares, respectively. |
| (f) | For the six months ended April 30, 2012. |
| * | Annualized. |
| ** | Rounds to less than $.01 per share. |
See accompanying notes to financial statements.
| Nuveen Investments | 33 |
Financial Highlights (Unaudited) (continued)
| Selected data for a share outstanding throughout each period: | ||||||||||||||||||||||||||||||||
| Class (Commencement Date) | ||||||||||||||||||||||||||||||||
| Investment Operations | Less Distributions | |||||||||||||||||||||||||||||||
| MID CAP GROWTH OPPORTUNITIES | ||||||||||||||||||||||||||||||||
| Year Ended October 31, |
Beginning Net Asset Value |
Net Invest- ment Income (Loss)(a) |
Net Realized/ Unrealized Gain (Loss) |
Total | Net Invest- ment Income |
Capital Gains(b) |
Total | Ending Net Asset Value |
||||||||||||||||||||||||
| Class A (1/95) |
|
|||||||||||||||||||||||||||||||
| 2012(f) |
$ | 41.36 | $ | (.10 | ) | $ | 4.93 | $ | 4.83 | $ | — | $ | (1.59 | ) | $ | (1.59 | ) | $ | 44.60 | |||||||||||||
| 2011 |
37.26 | (.22 | ) | 4.32 | 4.10 | — | — | — | 41.36 | |||||||||||||||||||||||
| 2010 |
28.83 | (.18 | ) | 8.61 | 8.43 | — | — | — | 37.26 | |||||||||||||||||||||||
| 2009 |
23.88 | (.08 | ) | 5.03 | 4.95 | — | — | — | 28.83 | |||||||||||||||||||||||
| 2008 |
46.57 | (.16 | ) | (17.86 | ) | (18.02 | ) | — | (4.67 | ) | (4.67 | ) | 23.88 | |||||||||||||||||||
| 2007 |
41.43 | (.24 | ) | 9.19 | 8.95 | — | (3.81 | ) | (3.81 | ) | 46.57 | |||||||||||||||||||||
| Class B (3/99) |
|
|||||||||||||||||||||||||||||||
| 2012(f) |
35.93 | (.21 | ) | 4.22 | 4.01 | — | (1.59 | ) | (1.59 | ) | 38.35 | |||||||||||||||||||||
| 2011 |
32.62 | (.46 | ) | 3.77 | 3.31 | — | — | — | 35.93 | |||||||||||||||||||||||
| 2010 |
25.43 | (.37 | ) | 7.56 | 7.19 | — | — | — | 32.62 | |||||||||||||||||||||||
| 2009 |
21.22 | (.23 | ) | 4.44 | 4.21 | — | — | — | 25.43 | |||||||||||||||||||||||
| 2008 |
42.21 | (.38 | ) | (15.94 | ) | (16.32 | ) | — | (4.67 | ) | (4.67 | ) | 21.22 | |||||||||||||||||||
| 2007 |
38.15 | (.51 | ) | 8.38 | 7.87 | — | (3.81 | ) | (3.81 | ) | 42.21 | |||||||||||||||||||||
| Class C (9/01) |
|
|||||||||||||||||||||||||||||||
| 2012(f) |
37.70 | (.23 | ) | 4.44 | 4.21 | — | (1.59 | ) | (1.59 | ) | 40.32 | |||||||||||||||||||||
| 2011 |
34.21 | (.49 | ) | 3.98 | 3.49 | — | — | — | 37.70 | |||||||||||||||||||||||
| 2010 |
26.67 | (.39 | ) | 7.93 | 7.54 | — | — | — | 34.21 | |||||||||||||||||||||||
| 2009 |
22.26 | (.24 | ) | 4.65 | 4.41 | — | — | — | 26.67 | |||||||||||||||||||||||
| 2008 |
44.03 | (.40 | ) | (16.70 | ) | (17.10 | ) | — | (4.67 | ) | (4.67 | ) | 22.26 | |||||||||||||||||||
| 2007 |
39.65 | (.53 | ) | 8.72 | 8.19 | — | (3.81 | ) | (3.81 | ) | 44.03 | |||||||||||||||||||||
| Class R3 (12/00)(e) |
|
|||||||||||||||||||||||||||||||
| 2012(f) |
40.50 | (.15 | ) | 4.82 | 4.67 | — | (1.59 | ) | (1.59 | ) | 43.58 | |||||||||||||||||||||
| 2011 |
36.58 | (.31 | ) | 4.23 | 3.92 | — | — | — | 40.50 | |||||||||||||||||||||||
| 2010 |
28.37 | (.26 | ) | 8.47 | 8.21 | — | — | — | 36.58 | |||||||||||||||||||||||
| 2009 |
23.56 | (.14 | ) | 4.95 | 4.81 | — | — | — | 28.37 | |||||||||||||||||||||||
| 2008 |
46.11 | (.24 | ) | (17.64 | ) | (17.88 | ) | — | (4.67 | ) | (4.67 | ) | 23.56 | |||||||||||||||||||
| 2007 |
41.15 | (.34 | ) | 9.11 | 8.77 | — | (3.81 | ) | (3.81 | ) | 46.11 | |||||||||||||||||||||
| Class I (12/89)(e) |
|
|||||||||||||||||||||||||||||||
| 2012(f) |
44.62 | (.05 | ) | 5.34 | 5.29 | — | (1.59 | ) | (1.59 | ) | 48.32 | |||||||||||||||||||||
| 2011 |
40.09 | (.10 | ) | 4.63 | 4.53 | — | — | — | 44.62 | |||||||||||||||||||||||
| 2010 |
30.94 | (.11 | ) | 9.26 | 9.15 | — | — | — | 40.09 | |||||||||||||||||||||||
| 2009 |
25.57 | (.02 | ) | 5.39 | 5.37 | — | — | — | 30.94 | |||||||||||||||||||||||
| 2008 |
49.40 | (.07 | ) | (19.09 | ) | (19.16 | ) | — | (4.67 | ) | (4.67 | ) | 25.57 | |||||||||||||||||||
| 2007 |
43.62 | (.14 | ) | 9.73 | 9.59 | — | (3.81 | ) | (3.81 | ) | 49.40 | |||||||||||||||||||||
| 34 | Nuveen Investments |
| Ratios/Supplemental Data | ||||||||||||||||||||||||||
| Ratios to Average Net Assets Before Reimbursement |
Ratios to Average Net Assets After Reimbursement(d) |
|||||||||||||||||||||||||
| Total Return(c) |
Ending Net Assets (000) |
Expenses | Net Invest- ment Income (Loss) |
Expenses | Net Invest- ment Income (Loss) |
Portfolio Turnover Rate |
||||||||||||||||||||
| 12.48 | % | $ | 320,189 | 1.32 | %* | (.51 | )%* | 1.29 | %* | (.48 | )%* | 59 | % | |||||||||||||
| 11.00 | 289,038 | 1.26 | (.53 | ) | 1.26 | (.53 | ) | 114 | ||||||||||||||||||
| 29.24 | 275,040 | 1.23 | (.57 | ) | 1.23 | (.57 | ) | 114 | ||||||||||||||||||
| 20.73 | 231,743 | 1.23 | (.33 | ) | 1.23 | (.33 | ) | 123 | ||||||||||||||||||
| (42.75 | ) | 209,052 | 1.22 | (.43 | ) | 1.22 | (.43 | ) | 113 | |||||||||||||||||
| 23.36 | 425,995 | 1.21 | (.56 | ) | 1.21 | (.56 | ) | 96 | ||||||||||||||||||
| 12.07 | 3,423 | 2.06 | * | (1.23 | )* | 2.04 | * | (1.20 | )* | 59 | ||||||||||||||||
| 10.15 | 4,127 | 2.01 | (1.26 | ) | 2.01 | (1.26 | ) | 114 | ||||||||||||||||||
| 28.27 | 5,490 | 1.98 | (1.31 | ) | 1.98 | (1.31 | ) | 114 | ||||||||||||||||||
| 19.84 | 6,762 | 1.98 | (1.06 | ) | 1.98 | (1.06 | ) | 123 | ||||||||||||||||||
| (43.18 | ) | 7,241 | 1.97 | (1.18 | ) | 1.97 | (1.18 | ) | 113 | |||||||||||||||||
| 22.47 | 15,820 | 1.96 | (1.31 | ) | 1.96 | (1.31 | ) | 96 | ||||||||||||||||||
| 12.03 | 17,604 | 2.07 | * | (1.27 | )* | 2.04 | * | (1.24 | )* | 59 | ||||||||||||||||
| 10.20 | 14,314 | 2.01 | (1.28 | ) | 2.01 | (1.28 | ) | 114 | ||||||||||||||||||
| 28.27 | 13,564 | 1.98 | (1.32 | ) | 1.98 | (1.32 | ) | 114 | ||||||||||||||||||
| 19.81 | 12,894 | 1.98 | (1.07 | ) | 1.98 | (1.07 | ) | 123 | ||||||||||||||||||
| (43.16 | ) | 13,011 | 1.97 | (1.18 | ) | 1.97 | (1.18 | ) | 113 | |||||||||||||||||
| 22.42 | 28,891 | 1.96 | (1.31 | ) | 1.96 | (1.31 | ) | 96 | ||||||||||||||||||
| 12.34 | 41,879 | 1.57 | * | (.77 | )* | 1.54 | * | (.74 | )* | 59 | ||||||||||||||||
| 10.72 | 34,929 | 1.51 | (.77 | ) | 1.51 | (.77 | ) | 114 | ||||||||||||||||||
| 28.94 | 33,772 | 1.48 | (.82 | ) | 1.48 | (.82 | ) | 114 | ||||||||||||||||||
| 20.42 | 26,822 | 1.48 | (.59 | ) | 1.48 | (.59 | ) | 123 | ||||||||||||||||||
| (42.88 | ) | 21,246 | 1.47 | (.69 | ) | 1.47 | (.69 | ) | 113 | |||||||||||||||||
| 23.06 | 29,490 | 1.46 | (.81 | ) | 1.46 | (.81 | ) | 96 | ||||||||||||||||||
| 12.60 | 790,075 | 1.07 | * | (.25 | )* | 1.04 | * | (.23 | )* | 59 | ||||||||||||||||
| 11.30 | 728,843 | 1.01 | (.21 | ) | 1.01 | (.21 | ) | 114 | ||||||||||||||||||
| 29.57 | 993,053 | .98 | (.31 | ) | .98 | (.31 | ) | 114 | ||||||||||||||||||
| 21.00 | 907,825 | .98 | (.09 | ) | .98 | (.09 | ) | 123 | ||||||||||||||||||
| (42.59 | ) | 732,559 | .97 | (.18 | ) | .97 | (.18 | ) | 113 | |||||||||||||||||
| 23.68 | 1,478,374 | .96 | (.31 | ) | .96 | (.31 | ) | 96 | ||||||||||||||||||
| (a) | Per share Net Investment Income (Loss) is calculated using the average daily shares method. |
| (b) | Distributions from Capital Gains include short-term capital gains, if any. |
| (c) | Total return is the combination of changes in net asset value without any sales charge, reinvested dividend income at net asset value and reinvested capital gains distributions at net asset value, if any. Total returns are not annualized. |
| (d) | After expense reimbursement from the Adviser, where applicable. |
| (e) | Effective January 18, 2011, Class R Shares and Class Y Shares previously offered by FAF Advisors, Inc. were renamed Class R3 Shares and Class I Shares, respectively. |
| (f) | For the six months ended April 30, 2012. |
| * | Annualized. |
See accompanying notes to financial statements.
| Nuveen Investments | 35 |
Financial Highlights (Unaudited) (continued)
| Selected data for a share outstanding throughout each period: | ||||||||||||||||||||||||||||||||
| Class (Commencement Date) | ||||||||||||||||||||||||||||||||
| Investment Operations | Less Distributions | |||||||||||||||||||||||||||||||
| SMALL CAP GROWTH OPPORTUNITIES |
||||||||||||||||||||||||||||||||
| Year Ended October 31, |
Beginning Net Asset Value |
Net Invest- ment Income (Loss)(a) |
Net Realized/ Unrealized Gain (Loss) |
Total | Net Invest- ment Income |
Capital Gains(b) |
Total | Ending Net Asset Value |
||||||||||||||||||||||||
| Class A (8/95) |
|
|||||||||||||||||||||||||||||||
| 2012(f) |
$ | 20.41 | $ | (.11 | ) | $ | 2.78 | $ | 2.67 | $ | — | $ | (.30 | ) | $ | (.30 | ) | $ | 22.78 | |||||||||||||
| 2011 |
19.04 | (.24 | ) | 1.61 | 1.37 | — | — | — | 20.41 | |||||||||||||||||||||||
| 2010 |
14.55 | (.18 | ) | 4.67 | 4.49 | — | — | — | 19.04 | |||||||||||||||||||||||
| 2009 |
11.96 | (.11 | ) | 2.70 | 2.59 | — | — | — | 14.55 | |||||||||||||||||||||||
| 2008 |
21.65 | (.14 | ) | (7.97 | ) | (8.11 | ) | — | (1.58 | ) | (1.58 | ) | 11.96 | |||||||||||||||||||
| 2007 |
20.49 | (.19 | ) | 2.67 | 2.48 | — | (1.32 | ) | (1.32 | ) | 21.65 | |||||||||||||||||||||
| Class B (3/99) |
|
|||||||||||||||||||||||||||||||
| 2012(f) |
17.72 | (.16 | ) | 2.40 | 2.24 | — | (.30 | ) | (.30 | ) | 19.66 | |||||||||||||||||||||
| 2011 |
16.66 | (.35 | ) | 1.41 | 1.06 | — | — | — | 17.72 | |||||||||||||||||||||||
| 2010 |
12.82 | (.27 | ) | 4.11 | 3.84 | — | — | — | 16.66 | |||||||||||||||||||||||
| 2009 |
10.62 | (.18 | ) | 2.38 | 2.20 | — | — | — | 12.82 | |||||||||||||||||||||||
| 2008 |
19.56 | (.23 | ) | (7.13 | ) | (7.36 | ) | — | (1.58 | ) | (1.58 | ) | 10.62 | |||||||||||||||||||
| 2007 |
18.76 | (.31 | ) | 2.43 | 2.12 | — | (1.32 | ) | (1.32 | ) | 19.56 | |||||||||||||||||||||
| Class C (9/01) |
|
|||||||||||||||||||||||||||||||
| 2012(f) |
18.58 | (.17 | ) | 2.52 | 2.35 | — | (.30 | ) | (.30 | ) | 20.63 | |||||||||||||||||||||
| 2011 |
17.46 | (.36 | ) | 1.48 | 1.12 | — | — | — | 18.58 | |||||||||||||||||||||||
| 2010 |
13.44 | (.28 | ) | 4.30 | 4.02 | — | — | — | 17.46 | |||||||||||||||||||||||
| 2009 |
11.13 | (.19 | ) | 2.50 | 2.31 | — | — | — | 13.44 | |||||||||||||||||||||||
| 2008 |
20.41 | (.24 | ) | (7.46 | ) | (7.70 | ) | — | (1.58 | ) | (1.58 | ) | 11.13 | |||||||||||||||||||
| 2007 |
19.53 | (.33 | ) | 2.53 | 2.20 | — | (1.32 | ) | (1.32 | ) | 20.41 | |||||||||||||||||||||
| Class R3 (12/00)(e) |
|
|||||||||||||||||||||||||||||||
| 2012(f) |
20.04 | (.13 | ) | 2.73 | 2.60 | — | (.30 | ) | (.30 | ) | 22.34 | |||||||||||||||||||||
| 2011 |
18.74 | (.29 | ) | 1.59 | 1.30 | — | — | — | 20.04 | |||||||||||||||||||||||
| 2010 |
14.36 | (.22 | ) | 4.60 | 4.38 | — | — | — | 18.74 | |||||||||||||||||||||||
| 2009 |
11.83 | (.16 | ) | 2.69 | 2.53 | — | — | — | 14.36 | |||||||||||||||||||||||
| 2008 |
21.49 | (.17 | ) | (7.91 | ) | (8.08 | ) | — | (1.58 | ) | (1.58 | ) | 11.83 | |||||||||||||||||||
| 2007 |
20.39 | (.24 | ) | 2.66 | 2.42 | — | (1.32 | ) | (1.32 | ) | 21.49 | |||||||||||||||||||||
| Class I (8/95)(e) |
|
|||||||||||||||||||||||||||||||
| 2012(f) |
22.04 | (.09 | ) | 3.01 | 2.92 | — | (.30 | ) | (.30 | ) | 24.66 | |||||||||||||||||||||
| 2011 |
20.51 | (.19 | ) | 1.72 | 1.53 | — | — | — | 22.04 | |||||||||||||||||||||||
| 2010 |
15.63 | (.15 | ) | 5.03 | 4.88 | — | — | — | 20.51 | |||||||||||||||||||||||
| 2009 |
12.81 | (.09 | ) | 2.91 | 2.82 | — | — | — | 15.63 | |||||||||||||||||||||||
| 2008 |
23.03 | (.10 | ) | (8.54 | ) | (8.64 | ) | — | (1.58 | ) | (1.58 | ) | 12.81 | |||||||||||||||||||
| 2007 |
21.66 | (.15 | ) | 2.84 | 2.69 | — | (1.32 | ) | (1.32 | ) | 23.03 | |||||||||||||||||||||
| 36 | Nuveen Investments |
| Ratios/Supplemental Data | ||||||||||||||||||||||||||
| Ratios to Average Net Assets Before Reimbursement |
Ratios to Average Net Assets After Reimbursement(d) |
|||||||||||||||||||||||||
| Total Return(c) |
Ending Net Assets (000) |
Expenses | Net Invest- ment Income (Loss) |
Expenses | Net Invest- ment Income (Loss) |
Portfolio Turnover Rate |
||||||||||||||||||||
| 13.39 | % | $ | 39,598 | 1.84 | %* | (1.36 | )%* | 1.47 | %* | (.99 | )%* | 54 | % | |||||||||||||
| 7.20 | 36,188 | 1.54 | (1.19 | ) | 1.47 | (1.12 | ) | 118 | ||||||||||||||||||
| 30.86 | 39,501 | 1.68 | (1.26 | ) | 1.47 | (1.05 | ) | 142 | ||||||||||||||||||
| 21.66 | 30,202 | 1.79 | (1.21 | ) | 1.47 | (.89 | ) | 169 | ||||||||||||||||||
| (40.07 | ) | 29,022 | 1.63 | (.99 | ) | 1.46 | (.82 | ) | 138 | |||||||||||||||||
| 12.81 | 149,231 | 1.59 | (1.01 | ) | 1.47 | (.89 | ) | 118 | ||||||||||||||||||
| 12.93 | 1,082 | 2.56 | * | (2.08 | )* | 2.22 | * | (1.74 | )* | 54 | ||||||||||||||||
| 6.36 | 1,482 | 2.31 | (1.95 | ) | 2.22 | (1.86 | ) | 118 | ||||||||||||||||||
| 29.95 | 2,088 | 2.43 | (2.00 | ) | 2.22 | (1.79 | ) | 142 | ||||||||||||||||||
| 20.72 | 2,025 | 2.54 | (1.96 | ) | 2.22 | (1.64 | ) | 169 | ||||||||||||||||||
| (40.55 | ) | 1,978 | 2.38 | (1.74 | ) | 2.21 | (1.57 | ) | 138 | |||||||||||||||||
| 12.03 | 4,467 | 2.34 | (1.77 | ) | 2.22 | (1.65 | ) | 118 | ||||||||||||||||||
| 12.93 | 1,730 | 2.59 | * | (2.11 | )* | 2.22 | * | (1.74 | )* | 54 | ||||||||||||||||
| 6.41 | 1,546 | 2.29 | (1.94 | ) | 2.22 | (1.87 | ) | 118 | ||||||||||||||||||
| 29.91 | 1,596 | 2.43 | (2.01 | ) | 2.22 | (1.80 | ) | 142 | ||||||||||||||||||
| 20.75 | 1,341 | 2.54 | (1.98 | ) | 2.22 | (1.66 | ) | 169 | ||||||||||||||||||
| (40.53 | ) | 1,104 | 2.38 | (1.73 | ) | 2.21 | (1.56 | ) | 138 | |||||||||||||||||
| 11.96 | 2,295 | 2.34 | (1.76 | ) | 2.22 | (1.64 | ) | 118 | ||||||||||||||||||
| 13.23 | 2,618 | 2.09 | * | (1.61 | )* | 1.72 | * | (1.24 | )* | 54 | ||||||||||||||||
| 6.94 | 2,334 | 1.79 | (1.44 | ) | 1.72 | (1.37 | ) | 118 | ||||||||||||||||||
| 30.50 | 2,185 | 1.93 | (1.52 | ) | 1.72 | (1.31 | ) | 142 | ||||||||||||||||||
| 21.39 | 1,469 | 2.04 | (1.56 | ) | 1.72 | (1.24 | ) | 169 | ||||||||||||||||||
| (40.24 | ) | 433 | 1.89 | (1.21 | ) | 1.72 | (1.04 | ) | 138 | |||||||||||||||||
| 12.56 | 522 | 1.84 | (1.29 | ) | 1.72 | (1.17 | ) | 118 | ||||||||||||||||||
| 13.49 | 59,510 | 1.58 | * | (1.10 | )* | 1.22 | * | (.74 | )* | 54 | ||||||||||||||||
| 7.46 | 63,866 | 1.31 | (.94 | ) | 1.22 | (.84 | ) | 118 | ||||||||||||||||||
| 31.22 | 141,215 | 1.43 | (1.01 | ) | 1.22 | (.80 | ) | 142 | ||||||||||||||||||
| 22.01 | 103,423 | 1.54 | (.99 | ) | 1.22 | (.67 | ) | 169 | ||||||||||||||||||
| (39.97 | ) | 75,355 | 1.39 | (.73 | ) | 1.22 | (.56 | ) | 138 | |||||||||||||||||
| 13.10 | 154,456 | 1.34 | (.76 | ) | 1.22 | (.64 | ) | 118 | ||||||||||||||||||
| (a) | Per share Net Investment Income (Loss) is calculated using the average daily shares method. |
| (b) | Distributions from Capital Gains include short-term capital gains, if any. |
| (c) | Total return is the combination of changes in net asset value without any sales charge, reinvested dividend income at net asset value and reinvested capital gains distributions at net asset value, if any. Total returns are not annualized. |
| (d) | After expense reimbursement from the Adviser, where applicable. |
| (e) | Effective January 18, 2011, Class R Shares and Class Y Shares previously offered by FAF Advisors, Inc. were renamed Class R3 Shares and Class I Shares, respectively. |
| (f) | For the six months ended April 30, 2012. |
| * | Annualized. |
See accompanying notes to financial statements.
| Nuveen Investments | 37 |
Notes to Financial Statements (Unaudited)
1. General Information and Significant Accounting Policies
General Information
Nuveen Investment Funds, Inc. (the “Trust”), is an open-end investment company registered under the Investment Company Act of 1940, as amended. The Trust is comprised of Nuveen Large Cap Growth Opportunities Fund (“Large Cap Growth Opportunities”), Nuveen Mid Cap Growth Opportunities Fund (“Mid Cap Growth Opportunities”) and Nuveen Small Cap Growth Opportunities Fund (“Small Cap Growth Opportunities”), (each a “Fund” and collectively, the “Funds”), among others. The Trust was incorporated in the State of Maryland on August 20, 1987.
Large Cap Growth Opportunities’ investment objective is long-term growth of capital. Under normal market conditions, the Fund invests at least 80% of its net assets, plus the amount of any borrowings for investment purposes, in common stocks of large-capitalization companies, defined as companies that have market capitalizations of $5 billion or greater at the time of purchase.
Mid Cap Growth Opportunities’ investment objective is capital appreciation. Under normal market conditions, the Fund invests at least 80% of its net assets, plus the amount of any borrowings for investment purposes, in common stocks of mid-capitalization companies, defined as companies that have market capitalizations at the time of purchase within the market capitalization range of the companies in the Russell Midcap® Index immediately after its most recent reconstitution prior to such purchase. It is expected that reconstitution of the index will occur each year at the end of June. Immediately after the most recent reconstitution, the range was $520 million to $17.9 billion. Under certain market conditions, the Fund may frequently invest in companies at the time of their initial public offering.
Small Cap Growth Opportunities’ investment objective is growth of capital. Under normal market conditions, the Fund invests at least 80% of its net assets, plus the amount of any borrowings for investment purposes, in common stocks of small-capitalization companies, defined as companies that have market capitalizations of less than $3 billion at the time of purchase. Under certain market conditions, the Fund may frequently invest in companies at the time of their initial public offering.
Each Fund may invest up to 15% of its total assets in non-dollar denominated equity securities of non-U.S. issuers. Each Fund may invest up to 25% of its assets, collectively, in non-dollar denominated equity securities of non-U.S. issuers and in dollar-denominated equity securities of non-U.S. issuers that are either listed on a U.S. stock exchange or represented by depositary receipts that may or may not be sponsored by a domestic bank. Up to 15% of each Fund’s total assets may be invested in equity securities of emerging market issuers. Each Fund may invest in options, futures contracts, options on futures contracts and forward foreign currency exchanges contracts (“derivatives”) to manage market or business risk, enhance its return, or hedge against adverse movements in currency exchange rates.
Each Fund’s most recent prospectus provides further descriptions of each Fund’s investment objective, principal investment strategies and principal risks.
Significant Accounting Policies
The following is a summary of significant accounting policies followed by the Funds in the preparation of their financial statements in accordance with accounting principles generally accepted in the United States (“U.S. GAAP”).
Investment Valuation
Common stocks and other equity-type securities are valued at the last sales price on the securities exchange on which such securities are primarily traded and are generally classified as Level 1 for fair value measurement purposes. Securities primarily traded on the NASDAQ National Market (“NASDAQ”) are valued, except as indicated below, at the NASDAQ Official Closing Price and are generally classified as Level 1. However, securities traded on a securities exchange or NASDAQ for which there were no transactions on a given day or securities not listed on a securities exchange or NASDAQ are valued at the quoted bid price and are generally classified as Level 2. Prices of certain American Depositary Receipts (“ADR”) held by the Funds that trade in only limited volume in the United States are valued based on the last traded price, official closing price, or the most recent bid price of the underlying non-U.S.-traded stock, adjusted as appropriate for the underlying-to-ADR conversion ratio and foreign exchange rate, and from time-to-time may also be adjusted further to take into account material events that may take place after the close of the local non-U.S. market but before the close of the New York Stock Exchange. These securities generally represent a transfer from a Level 1 to a Level 2 security.
Investments in investment companies are valued at their respective net asset values on the valuation date. These investment vehicles are generally classified as Level 1.
Certain securities may not be able to be priced by the pre-established pricing methods as described above. Such securities may be valued by the Funds’ Board of Directors or its designee at fair value. These securities generally include, but are not limited to, restricted securities (securities which may not be publicly sold without registration under the Securities Act of 1933, as amended) for which a pricing service is unable to provide a market price; securities whose trading has been formally suspended; debt securities that have gone into default and for which there is no current market quotation; a security whose market price is not available from a pre-established pricing source; a security with respect to which an event has occurred that is likely to materially affect the value of the security after the market has closed but before the calculation of a Fund’s net asset value (as may be the case in non-U.S. markets on which the security is primarily traded) or make it difficult or impossible to obtain a reliable market quotation; and a security whose
| 38 | Nuveen Investments |
price, as provided by the pricing service, is not deemed to reflect the security’s fair value. As a general principle, the fair value of a security would appear to be the amount that the owner might reasonably expect to receive for it in a current sale. A variety of factors may be considered in determining the fair value of such securities, which may include consideration of the following: yields or prices of investments of comparable quality, type of issue, coupon, maturity and rating, market quotes or indications of value from security dealers, evaluations of anticipated cash flows or collateral, general market conditions and other information and analysis, including the obligor’s credit characteristics considered relevant. These securities are generally classified as Level 2 or Level 3 depending on the priority of the significant inputs. Regardless of the method employed to value a particular security, all valuations are subject to review by the Funds’ Board of Directors or its designee.
Refer to Footnote 2 – Fair Value Measurements for further details on the leveling of securities held by the Funds as of the end of the reporting period.
Investment Transactions
Investment transactions are recorded on a trade date basis. Realized gains and losses from investment transactions are determined on the specific identification method, which is the same basis used for federal income tax purposes.
Investment Income
Dividend income is recorded on the ex-dividend date or, for foreign securities, when information is available. Interest income is recorded on an accrual basis. Securities lending income is comprised of fees earned from borrowers and income earned on cash collateral investments, net of lending agent fees.
Income Taxes
Each Fund is a separate taxpayer for federal income tax purposes. Each Fund intends to distribute substantially all of its net investment income and net capital gains to shareholders and to otherwise comply with the requirements of Subchapter M of the Internal Revenue Code applicable to regulated investment companies (“RICs”). Therefore, no federal income tax provision is required.
For all open tax years and all major taxing jurisdictions, management of the Funds has concluded that there are no significant uncertain tax positions that would require recognition in the financial statements. Open tax years are those that are open for examination by taxing authorities (i.e., generally the last four tax year ends and the interim tax period since then). Furthermore, management of the Funds is also not aware of any tax positions for which it is reasonably possible that the total amounts of unrecognized tax benefits will significantly change in the next twelve months.
Dividends and Distributions to Shareholders
Dividends from net investment income and net realized gains from investment transactions, if any, are declared and distributed to shareholders at least annually. Furthermore, capital gains are distributed only to the extent they exceed available capital loss carryforwards.
Distributions to shareholders are recorded on the ex-dividend date. The amount and timing of distributions are determined in accordance with federal income tax regulations, which may differ from U.S. GAAP.
Flexible Sales Charge Program
Class A Shares are generally sold with an up-front sales charge and incur a .25% annual 12b-1 service fee. Class A Share purchases of $1 million or more are sold at net asset value without an up-front sales charge but may be subject to a contingent deferred sales charge (“CDSC”) if redeemed within twelve months of purchase. Class B Shares were sold without an up-front sales charge but incur a .75% annual 12b-1 distribution fee and a .25% annual 12b-1 service fee. Class B Shares are subject to a CDSC of up to 5% depending upon the length of time the shares are held by the investor (CDSC is reduced to 0% at the end of six years). Class B Shares automatically convert to Class A Shares eight years after purchase. Class C Shares are sold without an up-front sales charge but incur a .75% annual 12b-1 distribution fee and a .25% annual 12b-1 service fee. Class C Shares are subject to a CDSC of 1% if redeemed within twelve months of purchase. Class R3 Shares are sold without an upfront sales charge but incur a .25% annual 12b-1 distribution and a .25% annual 12b-1 service fee. Class I Shares are not subject to any sales charge or 12b-1 distribution or service fees.
Foreign Currency Transactions
Each Fund is authorized to engage in foreign currency exchange transactions, including foreign currency exchange contracts, futures, options and swap contracts. To the extent that the Funds invest in securities and/or contracts that are denominated in a currency other than U.S. dollars, the Funds will be subject to currency risk, which is the risk that an increase in the U.S. dollar relative to the foreign currency will reduce returns or portfolio value. Generally, when the U.S. dollar rises in value against a foreign currency, the Funds’ investments denominated in that currency will lose value because its currency is worth fewer U.S. dollars; the opposite effect occurs if the U.S. dollar falls in relative value. Investments and other assets and liabilities denominated in foreign currencies are converted into U.S. dollars on a spot (i.e. cash) basis at the spot rate prevailing in the foreign currency exchange market at the time of valuation. Purchases and sales of investments and income denominated in foreign currencies are translated into U.S. dollars on the respective dates of such transactions.
The books and records of the Funds are maintained in U.S. dollars. Foreign currencies, assets and liabilities are translated into U.S. dollars at 4:00 p.m. Eastern Time. Investment transactions, income and expenses are translated on the respective dates of such transactions. Net realized foreign currency gains and losses resulting from changes in exchange rates include foreign currency gains
| Nuveen Investments | 39 |
Notes to Financial Statements (Unaudited) (continued)
and losses between trade date and settlement date of the transactions, foreign currency transactions, and the difference between the amounts of interest and dividends recorded on the books of a Fund and the amounts actually received.
The realized gains and losses resulting from changes in foreign currency exchange rates and changes in foreign exchange rates associated with other assets and liabilities on investments and derivatives are recognized as a component of “Net realized gain (loss) from investments and foreign currency,” on the Statement of Operations, when applicable.
The unrealized gains and losses resulting from changes in foreign currency exchange rates and changes in foreign exchange rates associated with other assets and liabilities on investments are recognized as a component of “Change in net unrealized appreciation (depreciation) of investments and foreign currency,” on the Statement of Operations, when applicable.
Futures Contracts
Each Fund is subject to equity price risk, interest rate risk and foreign currency exchange rate risk in the normal course of pursuing its investment objectives and is authorized to invest in futures contracts in an attempt to manage such risk. Upon entering into a futures contract, a Fund is required to deposit with the broker an amount of cash or liquid securities equal to a specified percentage of the contract amount. This is known as the “initial margin.” Cash held by the broker to cover initial margin requirements on open futures contracts, if any, is recognized as “Deposits with brokers for open futures contracts” on the Statement of Assets and Liabilities. Subsequent payments (“variation margin”) are made or received by a Fund each day, depending on the daily fluctuation of the value of the contract. Variation margin is recognized as a receivable and/or payable for “Variation margin on futures contracts” on the Statement of Assets and Liabilities, when applicable.
During the period the futures contract is open, changes in the value of the contract are recognized as an unrealized gain or loss by “marking-to-market” on a daily basis to reflect the changes in market value of the contract, which is recognized as a component of “Change in net unrealized appreciation (depreciation) of futures contracts” on the Statement of Operations. When the contract is closed or expired, a Fund records a realized gain or loss equal to the difference between the value of the contract on the closing date and value of the contract when originally entered into, which is recognized as a component of “Net realized gain (loss) from futures contracts” on the Statement of Operations.
Risks of investments in futures contracts include the possible adverse movement in the price of the securities or indices underlying the contracts, the possibility that there may not be a liquid secondary market for the contracts and/or that a change in the value of the contract may not correlate with a change in the value of the underlying securities or indices.
During the six months ended April 30, 2012, none of the Funds invested in future contracts.
Market and Counterparty Credit Risk
In the normal course of business each Fund may invest in financial instruments and enter into financial transactions where risk of potential loss exists due to changes in the market (market risk) or failure of the other party to the transaction to perform (counterparty credit risk). The potential loss could exceed the value of the financial assets recorded on the financial statements. Financial assets, which potentially expose each Fund to counterparty credit risk, consist principally of cash due from counterparties on forward, option and swap transactions, when applicable. The extent of each Fund’s exposure to counterparty credit risk in respect to these financial assets approximates their carrying value as recorded on the Statement of Assets and Liabilities. Futures contracts, when applicable, expose a Fund to minimal counterparty credit risk as they are exchange traded and the exchange’s clearinghouse, which is counterparty to all exchange traded futures, guarantees the futures contracts against default.
Each Fund helps manage counterparty credit risk by entering into agreements only with counterparties Nuveen Fund Advisors, Inc. (the “Adviser”), a wholly-owned subsidiary of Nuveen Investments, Inc. (“Nuveen”), believes have the financial resources to honor their obligations and by having the Adviser monitor the financial stability of the counterparties. Additionally, counterparties may be required to pledge collateral daily (based on the daily valuation of the financial asset) on behalf of each Fund with a value approximately equal to the amount of any unrealized gain above a pre-determined threshold. Reciprocally, when each Fund has an unrealized loss, the Funds have instructed the custodian to pledge assets of the Funds as collateral with a value approximately equal to the amount of the unrealized loss above a pre-determined threshold. Collateral pledges are monitored and subsequently adjusted if and when the valuations fluctuate, either up or down, by at least the pre-determined threshold amount.
Multiclass Operations and Allocations
Income and expenses of the Funds that are not directly attributable to a specific class of shares are prorated among the classes based on the relative net assets of each class. Expenses directly attributable to a class of shares, which presently only include 12b-1 distribution fees and shareholder service fees, are recorded to the specific class.
Realized and unrealized capital gains and losses of the Funds are prorated among the classes based on the relative net assets of each class.
Securities Lending
In order to generate additional income, each Fund may lend securities representing up to one-third of the value of its total assets (which includes collateral for securities on loan) to broker-dealers, banks or other institutions. Each Fund’s policy is to receive cash collateral equal to at least 102% of the value of securities loaned, which is recognized as “Collateral from securities lending program” on the Statement of
| 40 | Nuveen Investments |
Assets and Liabilities. The adequacy of the collateral is monitored on a daily basis. If the value of the securities on loan increases, such that the level of collateralization falls below 102%, additional collateral is received from the borrower, which is recognized as “Due from broker” on the Statement of Assets and Liabilities, when applicable. As with other extensions of credit, there may be risks of delay in recovery of the securities or even loss of rights in the collateral should the borrower of the security fail financially.
The Funds’ custodian serves as the securities lending agent for the Funds. Each Fund pays the custodian a fee based on the Fund’s proportional share of the custodian’s expense of operating its securities lending program. Collateral for securities on loan is invested in a money market fund, which is recognized as “Investments purchased with collateral from securities lending” on the Statement of Assets and Liabilities.
Income from securities lending, net of fees paid, is recognized on the Statement of Operations as “Securities lending income.” Securities lending fees paid by each Fund during the six months ended April 30, 2012, were as follows:
| Large Cap Growth Opportunities |
Mid Cap Growth Opportunities |
Small Cap Growth Opportunities |
||||||||||
| Securities lending fees paid |
$ | 64,225 | $ | 114,248 | $ | 12,214 | ||||||
Indemnifications
Under the Trust’s organizational documents, its officers and directors are indemnified against certain liabilities arising out of the performance of their duties to the Trust. In addition, in the normal course of business, the Trust enters into contracts that provide general indemnifications to other parties. The Trust’s maximum exposure under these arrangements is unknown as this would involve future claims that may be made against the Trust that have not yet occurred. However, the Trust has not had prior claims or losses pursuant to these contracts and expects the risk of loss to be remote.
Use of Estimates
The preparation of financial statements in conformity with U.S. GAAP requires management to make estimates and assumptions that affect the reported amounts of assets and liabilities at the date of the financial statements and the reported amounts of increases and decreases in net assets from operations during the reporting period. Actual results may differ from those estimates.
2. Fair Value Measurements
Fair value is defined as the price that the Funds would receive upon selling an investment or transferring a liability in an orderly transaction to an independent buyer in the principal or most advantageous market for the investment. A three-tier hierarchy is used to maximize the use of observable market data and minimize the use of unobservable inputs and to establish classification of fair value measurements for disclosure purposes. Observable inputs reflect the assumptions market participants would use in pricing the asset or liability. Observable inputs are based on market data obtained from sources independent of the reporting entity. Unobservable inputs reflect the reporting entity’s own assumptions about the assumptions market participants would use in pricing the asset or liability. Unobservable inputs are based on the best information available in the circumstances. The three-tier hierarchy of inputs is summarized in the three broad levels listed below:
| Level 1 – | Quoted prices in active markets for identical securities. | |
| Level 2 – | Other significant observable inputs (including quoted prices for similar securities, interest rates, prepayment speeds, credit risk, etc.). | |
| Level 3 – | Significant unobservable inputs (including management’s assumptions in determining the fair value of investments). |
| Nuveen Investments | 41 |
Notes to Financial Statements (Unaudited) (continued)
The inputs or methodologies used for valuing securities are not an indication of the risk associated with investing in those securities. The following is a summary of each Fund’s fair value measurements as of April 30, 2012:
| Large Cap Growth Opportunities | Level 1 | Level 2 | Level 3 | Total | ||||||||||||
| Long-Term Investments: |
||||||||||||||||
| Common Stocks |
$ | 598,956,562 | $ | — | $ | — | $ | 598,956,562 | ||||||||
| Investments Purchased with Collateral from Securities Lending |
179,194,145 | — | — | 179,194,145 | ||||||||||||
| Short-Term Investments: |
||||||||||||||||
| Money Market Funds |
13,409,991 | — | — | 13,409,991 | ||||||||||||
| Total |
$ | 791,560,698 | $ | — | $ | — | $ | 791,560,698 | ||||||||
| Mid Cap Growth Opportunities | Level 1 | Level 2 | Level 3 | Total | ||||||||||||
| Long-Term Investments: |
||||||||||||||||
| Common Stocks |
$ | 1,158,061,109 | $ | — | $ | — | $ | 1,158,061,109 | ||||||||
| Investments Purchased with Collateral from Securities Lending |
430,267,245 | — | — | 430,267,245 | ||||||||||||
| Short-Term Investments: |
||||||||||||||||
| Money Market Funds |
7,904,649 | — | — | 7,904,649 | ||||||||||||
| Total |
$ | 1,596,233,003 | $ | — | $ | — | $ | 1,596,233,003 | ||||||||
| Small Cap Growth Opportunities | Level 1 | Level 2 | Level 3 | Total | ||||||||||||
| Long-Term Investments: |
||||||||||||||||
| Common Stocks |
$ | 102,814,739 | $ | — | $ | — | * | $ | 102,814,739 | |||||||
| Investments Purchased with Collateral from Securities Lending |
48,365,957 | — | — | 48,365,957 | ||||||||||||
| Short-Term Investments: |
||||||||||||||||
| Money Market Funds |
2,957,008 | — | — | 2,957,008 | ||||||||||||
| Total |
$ | 154,137,704 | $ | — | $ | — | * | $ | 154,137,704 | |||||||
| * | Level 3 security has a market value of zero. |
The following is a reconciliation of the Small Cap Growth Opportunities’ Level 3 investments held at the beginning and end of the measurement period:
| Small Cap Growth Opportunities Level 3 Common Stocks |
||||
| Balance at the beginning of period |
$ | — | * | |
| Gains (losses): |
||||
| Net realized gains (losses) |
— | |||
| Net change in unrealized appreciation (depreciation) |
— | |||
| Purchases at cost |
— | |||
| Sales at proceeds |
— | |||
| Net discounts (premiums) |
— | |||
| Transfers in to |
— | |||
| Transfers out of |
— | |||
| Balance at the end of period |
$ | — | * | |
| Change in net unrealized appreciation (depreciation) during the period of Level 3 securities held as of April 30, 2012 |
$ | — | ||
| * | Level 3 security has a market value of zero. |
During the six months ended April 30, 2012, the Funds recognized no significant transfers to or from Level 1, Level 2 or Level 3.
3. Derivative Instruments and Hedging Activities
The Funds record derivative instruments at fair value, with changes in fair value recognized on the Statement of Operations, when applicable. Even though the Funds’ investments in derivatives may represent economic hedges, they are not considered to be hedge transactions for financial reporting purposes. The Funds did not invest in derivative instruments during the six months ended April 30, 2012.
| 42 | Nuveen Investments |
4. Fund Shares
Transactions in Fund shares were as follows:
| Large Cap Growth Opportunities | ||||||||||||||||
| Six Months Ended 4/30/12 |
Year Ended 10/31/11 |
|||||||||||||||
| Shares | Amount | Shares | Amount | |||||||||||||
| Shares sold: |
||||||||||||||||
| Class A |
1,102,045 | $ | 37,238,868 | 1,030,651 | $ | 34,137,022 | ||||||||||
| Class B |
1,007 | 32,387 | 5,871 | 178,105 | ||||||||||||
| Class C |
93,472 | 2,853,921 | 136,693 | 4,197,857 | ||||||||||||
| Class R3(1) |
165,814 | 5,271,859 | 97,634 | 3,261,354 | ||||||||||||
| Class I(1) |
1,909,463 | 64,719,425 | 2,239,175 | 76,171,961 | ||||||||||||
| Shares issued to shareholders due to reinvestment of distributions: |
||||||||||||||||
| Class A |
105,705 | 3,128,856 | — | — | ||||||||||||
| Class B |
3,203 | 85,704 | — | — | ||||||||||||
| Class C |
8,270 | 226,508 | — | — | ||||||||||||
| Class R3(1) |
5,050 | 146,968 | — | — | ||||||||||||
| Class I(1) |
215,508 | 6,637,635 | — | — | ||||||||||||
| 3,609,537 | 120,342,131 | 3,510,024 | 117,946,299 | |||||||||||||
| Shares redeemed: |
||||||||||||||||
| Class A |
(329,445 | ) | (11,001,713 | ) | (648,075 | ) | (21,533,002 | ) | ||||||||
| Class B |
(25,838 | ) | (791,302 | ) | (50,698 | ) | (1,544,574 | ) | ||||||||
| Class C |
(20,258 | ) | (609,990 | ) | (29,628 | ) | (911,615 | ) | ||||||||
| Class R3(1) |
(39,526 | ) | (1,321,783 | ) | (16,584 | ) | (534,485 | ) | ||||||||
| Class I(1) |
(2,678,643 | ) | (93,161,200 | ) | (4,263,570 | ) | (148,356,251 | ) | ||||||||
| Class I(1) – In-Kind |
— | — | (2,678,398 | ) | (86,539,024 | ) | ||||||||||
| (3,093,710 | ) | (106,885,988 | ) | (7,686,953 | ) | (259,418,951 | ) | |||||||||
| Net increase (decrease) |
515,827 | $ | 13,456,143 | (4,176,929 | ) | $ | (141,472,652 | ) | ||||||||
| Mid Cap Growth Opportunities | ||||||||||||||||
| Six Months Ended 4/30/12 |
Year Ended 10/31/11 |
|||||||||||||||
| Shares | Amount | Shares | Amount | |||||||||||||
| Shares sold: |
||||||||||||||||
| Class A |
982,553 | $ | 40,378,347 | 1,758,690 | $ | 73,910,507 | ||||||||||
| Class B |
642 | 21,551 | 1,906 | 68,527 | ||||||||||||
| Class C |
79,109 | 2,964,037 | 70,600 | 2,674,150 | ||||||||||||
| Class R3(1) |
322,572 | 13,053,105 | 514,920 | 21,199,623 | ||||||||||||
| Class I(1) |
2,140,913 | 95,093,563 | 3,994,324 | 181,804,844 | ||||||||||||
| Shares issued to shareholders due to reinvestment of distributions: |
||||||||||||||||
| Class A |
293,603 | 10,810,445 | — | — | ||||||||||||
| Class B |
5,239 | 166,355 | — | — | ||||||||||||
| Class C |
16,012 | 534,474 | — | — | ||||||||||||
| Class R3(1) |
38,238 | 1,376,941 | — | — | ||||||||||||
| Class I(1) |
437,404 | 17,430,562 | — | — | ||||||||||||
| 4,316,285 | 181,829,380 | 6,340,440 | 279,657,651 | |||||||||||||
| Shares redeemed: |
||||||||||||||||
| Class A |
(1,084,867 | ) | (44,830,816 | ) | (2,152,411 | ) | (91,460,035 | ) | ||||||||
| Class B |
(31,489 | ) | (1,133,747 | ) | (55,374 | ) | (2,033,061 | ) | ||||||||
| Class C |
(38,264 | ) | (1,416,211 | ) | (87,325 | ) | (3,307,929 | ) | ||||||||
| Class R3(1) |
(262,168 | ) | (10,545,995 | ) | (575,859 | ) | (23,989,967 | ) | ||||||||
| Class I(1) |
(2,563,024 | ) | (113,527,492 | ) | (5,002,958 | ) | (228,179,462 | ) | ||||||||
| Class I(1) – In-Kind |
— | — | (7,424,395 | ) | (320,656,806 | ) | ||||||||||
| (3,979,812 | ) | (171,454,261 | ) | (15,298,322 | ) | (669,627,260 | ) | |||||||||
| Net increase (decrease) |
336,473 | $ | 10,375,119 | (8,957,882 | ) | $ | (389,969,609 | ) | ||||||||
| (1) | Effective January 18, 2011, Class R Shares and Class Y Shares previously offered by FAF Advisor, Inc. were renamed Class R3 Shares and Class I Shares, respectively. |
| Nuveen Investments | 43 |
Notes to Financial Statements (Unaudited) (continued)
| Small Cap Growth Opportunities | ||||||||||||||||
| Six Months Ended 4/30/12 |
Year Ended 10/31/11 |
|||||||||||||||
| Shares | Amount | Shares | Amount | |||||||||||||
| Shares sold: |
||||||||||||||||
| Class A |
113,177 | $ | 2,494,188 | 281,619 | $ | 6,049,377 | ||||||||||
| Class B |
1 | 21 | 2,154 | 39,844 | ||||||||||||
| Class C |
5,191 | 105,232 | 13,293 | 264,550 | ||||||||||||
| Class R3(1) |
25,903 | 552,913 | 61,642 | 1,261,846 | ||||||||||||
| Class I(1) |
194,556 | 4,570,083 | 950,540 | 21,934,766 | ||||||||||||
| Shares issued to shareholders due to reinvestment of distributions: |
||||||||||||||||
| Class A |
25,561 | 492,295 | — | — | ||||||||||||
| Class B |
1,301 | 21,675 | — | — | ||||||||||||
| Class C |
1,334 | 23,323 | — | — | ||||||||||||
| Class R3(1) |
1,836 | 34,697 | — | — | ||||||||||||
| Class I(1) |
12,551 | 261,310 | — | — | ||||||||||||
| 381,411 | 8,555,737 | 1,309,248 | 29,550,383 | |||||||||||||
| Shares redeemed: |
||||||||||||||||
| Class A |
(173,539 | ) | (3,776,821 | ) | (583,516 | ) | (12,808,551 | ) | ||||||||
| Class B |
(29,884 | ) | (565,370 | ) | (43,903 | ) | (811,714 | ) | ||||||||
| Class C |
(5,861 | ) | (110,078 | ) | (21,496 | ) | (428,292 | ) | ||||||||
| Class R3(1) |
(26,984 | ) | (570,810 | ) | (61,745 | ) | (1,292,506 | ) | ||||||||
| Class I(1) |
(691,452 | ) | (16,008,358 | ) | (2,956,187 | ) | (66,197,552 | ) | ||||||||
| Class I(1) – In-Kind |
— | — | (1,983,052 | ) | (46,264,595 | ) | ||||||||||
| (927,720 | ) | (21,031,437 | ) | (5,649,899 | ) | (127,803,210 | ) | |||||||||
| Net increase (decrease) |
(546,309 | ) | $ | (12,475,700 | ) | (4,340,651 | ) | $ | (98,252,827 | ) | ||||||
| (1) | Effective January 18, 2011, Class R Shares and Class Y Shares previously offered by FAF Advisor, Inc. were renamed Class R3 Shares and Class I Shares, respectively. |
Class B Shares that converted to Class A Shares (recognized as a component of Class A Shares sold and Class B Shares redeemed) during the six months ended April 30, 2012 and fiscal year ended October 31, 2011, were as follows:
| Fund | Six Months Ended 4/30/12 |
Year Ended 10/31/11 |
||||||
| Large Cap Growth Opportunities |
24,754 | 29,920 | ||||||
| Mid Cap Growth Opportunities |
16,358 | 28,096 | ||||||
| Small Cap Growth Opportunities |
23,194 | 33,211 | ||||||
5. Investment Transactions
Purchases and sales (including maturities but excluding investments purchased with collateral from securities lending and short-term investments) during the six months ended April 30, 2012, were as follows:
| Large Cap Growth Opportunities |
Mid Cap Growth Opportunities |
Small Cap Growth Opportunities |
||||||||||
| Purchases |
$ | 218,102,917 | $ | 640,879,414 | $ | 55,691,450 | ||||||
| Sales and maturities |
222,148,670 | 681,753,032 | 69,231,263 | |||||||||
6. Income Tax Information
The following information is presented on an income tax basis. Differences between amounts for financial statement and federal income tax purposes are primarily due to timing differences in recognizing certain gains and losses on investment transactions. To the extent that differences arise that are permanent in nature, such amounts are reclassified within the capital accounts as detailed below. Temporary differences do not require reclassification. Temporary and permanent differences do not impact the net asset values of the Funds.
| 44 | Nuveen Investments |
At April 30, 2012, the cost and unrealized appreciation (depreciation) of investments, as determined on a federal income tax basis, were as follows:
| Large Cap Growth Opportunities |
Mid Cap Growth Opportunities |
Small Cap Growth Opportunities |
||||||||||
| Cost of investments |
$ | 613,987,259 | $ | 1,308,536,875 | $ | 142,752,960 | ||||||
| Gross unrealized: |
||||||||||||
| Appreciation |
$ | 181,541,853 | $ | 291,804,216 | $ | 16,236,386 | ||||||
| Depreciation |
(3,968,414 | ) | (4,108,088 | ) | (4,851,642 | ) | ||||||
| Net unrealized appreciation (depreciation) of investments |
$ | 177,573,439 | $ | 287,696,128 | $ | 11,384,744 | ||||||
Permanent differences, primarily due to redemptions in-kind, net operating losses, tax equalization, Real Estate Investment Trust (“REITs”) adjustments, and investments in partnerships, resulted in reclassifications among the Funds’ components of net assets at October 31, 2011, the Funds’ last year tax end, as follows:
| Large Cap Growth Opportunities |
Mid Cap Growth Opportunities |
Small Cap Growth Opportunities |
||||||||||
| Capital paid-in |
$ | 30,262,272 | $ | 100,365,222 | $ | 8,631,450 | ||||||
| Undistributed (Over-distribution) of net investment income |
1,297,287 | 3,741,336 | 1,333,259 | |||||||||
| Accumulated net realized gain (loss) |
(31,559,559 | ) | (104,106,558 | ) | (9,964,709 | ) | ||||||
The tax components of undistributed net ordinary income and net long-term capital gains at October 31, 2011, the Funds’ last tax year end, were as follows:
| Large Cap Growth Opportunities |
Mid Cap Growth Opportunities |
Small Cap Growth Opportunities |
||||||||||
| Undistributed net ordinary income* |
$ | — | $ | — | $ | — | ||||||
| Undistributed net long-term capital gains |
18,181,621 | 38,745,775 | 1,420,407 | |||||||||
| * | Net ordinary income consists of net taxable income derived from dividends, interest and net short-term capital gains, if any. |
The tax character of distributions paid during the Funds’ last tax year ended October 31, 2011, was designated for purposes of the dividends paid deduction as follows:
| Large Cap Growth Opportunities |
Mid Cap Growth Opportunities |
Small Cap Growth Opportunities |
||||||||||
| Distributions from net ordinary income* |
$ | — | $ | — | $ | — | ||||||
| Distributions from net long-term capital gains |
— | — | — | |||||||||
| * | Net ordinary income consists of net taxable income derived from dividends, interest, net short-term capital gains and current year earnings and profits attributable to realized gains, if any. |
During the Funds’ last tax year ended October 31, 2011, the Funds utilized their capital loss carryforwards as follows:
| Large Cap Growth Opportunities |
Mid Cap Growth Opportunities |
Small Cap Growth Opportunities |
||||||||||
| Utilized capital loss carryforwards |
$ | 42,227,234 | $ | 91,798,557 | $ | 16,280,987 | ||||||
7. Management Fees and Other Transactions with Affiliates
Each Fund’s management fee consists of two components – a fund-level fee, based only on the amount of assets within each individual Fund, and a complex-level fee, based on the aggregate amount of all eligible fund assets managed by the Adviser. This pricing structure enables Fund shareholders to benefit from growth in the assets within their respective Fund as well as from growth in the amount of complex-wide assets managed by the Adviser.
| Nuveen Investments | 45 |
Notes to Financial Statements (Unaudited) (continued)
The annual fund-level fee for each Fund, payable monthly, is calculated according to the following schedule:
| Average Daily Net Assets | Large Cap Growth Opportunities Fund-Level Fee Rate |
Mid Cap Growth Opportunities Fund-Level Fee Rate |
Small Cap Growth Opportunities Fund-Level Fee Rate |
|||||||||
| For the first $125 million |
.6500 | % | .7000 | % | .8000 | % | ||||||
| For the next $125 million |
.6375 | .6875 | .7875 | |||||||||
| For the next $250 million |
.6250 | .6750 | .7750 | |||||||||
| For the next $500 million |
.6125 | .6625 | .7625 | |||||||||
| For the next $1 billion |
.6000 | .6500 | .7500 | |||||||||
| For net assets over $2 billion |
.5750 | .6250 | .7250 | |||||||||
The annual complex-level fee for each Fund, payable monthly, is determined by taking the complex-level fee rate, which is based on the aggregate amount of “eligible assets” of all Nuveen funds as set forth in the schedule below, and making, as appropriate, an upward adjustment to that rate based upon the percentage of the particular fund’s assets that are not “eligible assets.” The complex-level fee schedule is as follows:
| Complex-Level Asset Breakpoint Level* | Effective Rate at Breakpoint Level | |||
| $55 billion |
.2000 | % | ||
| $56 billion |
.1996 | |||
| $57 billion |
.1989 | |||
| $60 billion |
.1961 | |||
| $63 billion |
.1931 | |||
| $66 billion |
.1900 | |||
| $71 billion |
.1851 | |||
| $76 billion |
.1806 | |||
| $80 billion |
.1773 | |||
| $91 billion |
.1691 | |||
| $125 billion |
.1599 | |||
| $200 billion |
.1505 | |||
| $250 billion |
.1469 | |||
| $300 billion |
.1445 | |||
| * | The complex-level fee is calculated based upon the aggregate daily “eligible assets” of all Nuveen Funds. Eligible assets do not include assets attributable to investments in other Nuveen Funds or assets in excess of $2 billion added to the Nuveen Fund complex in connection with Adviser’s assumption of the management of the former First American Funds effective January 1, 2011. Eligible assets include closed-end fund assets managed by the Adviser that are attributable to financial leverage. For these purposes, financial leverage includes the closed-end funds’ use of preferred stock and borrowings and investments in the residual interest certificates (also called inverse floating rate securities) in tender option bond (TOB) trusts, including the portion of assets held by the TOB trust that has been effectively financed by the trust’s issuance of floating rate securities, subject to an agreement by the Adviser as to certain funds to limit the amount of such assets for determining eligible assets in certain circumstances. As of April 30, 2012, the complex-level fee rate for each Fund was as follows: |
| Fund | Complex-Level Fee Rate | |||
| Large Cap Growth Opportunities |
.1951 | % | ||
| Mid Cap Growth Opportunities |
.1951 | |||
| Small Cap Growth Opportunities |
.1998 | |||
The management fee compensates the Adviser for overall investment advisory and administrative services and general office facilities. The Adviser is responsible for each Fund’s overall strategy and asset allocation decisions. The Adviser has entered into sub-advisory agreements with Nuveen Asset Management, LLC (the “Sub-Adviser”), a wholly-owned subsidiary of the Adviser, under which the Sub-Adviser manages the investment portfolios of the Funds. The Sub-Adviser will be compensated for its services to the Funds from the management fees paid to the Adviser.
The Adviser has agreed to waive fees and/or reimburse other Fund expenses of Small Cap Growth Opportunities so that total annual Fund operating expenses, after fee waivers and/or expense reimbursements and excluding any acquired Fund fees and expenses, do not exceed the percentages of the average daily net assets of any class of Fund shares in the amounts and for the time period stated in the following table:
| Small Cap Growth Opportunities |
||||||
| Class A Shares |
1.47 | % | ||||
| Class B Shares |
2.22 | |||||
| Class C Shares |
2.22 | |||||
| Class R3 Shares |
1.72 | |||||
| Class I Shares |
1.22 | |||||
| Expiration date |
February 28, 2013 | |||||
| 46 | Nuveen Investments |
The Adviser has agreed to reimburse management fees across all share classes of Large Cap Growth Opportunities and Mid Cap Growth Opportunities through December 31, 2012, to the extent necessary to maintain Class I Share total annual operating expenses, not including any acquired Fund fees and expenses, at the applicable percentage of daily net assets listed in the Maximum Expense Level row of the following table, provided that in no event will the Adviser be required to make any reimbursements that would result in an annualized net management fee of less than the applicable percentage of daily net assets listed in the Minimum Management Fee row of the following table.
| Large Cap Growth Opportunities |
Mid Cap Growth Opportunities |
|||||||
| Maximum Expense Level |
.98 | % | .99 | % | ||||
| Minimum Management Fee |
.80 | .84 | ||||||
The Adviser may also voluntarily reimburse expenses from time to time in any of the Funds. Voluntary reimbursements may be terminated at any time at the Adviser’s discretion.
The Trust pays no compensation directly to those of its directors who are affiliated with the Adviser or to its officers, all of whom receive remuneration for their services to the Trust from the Adviser or its affiliates. The Board of Directors has adopted a deferred compensation plan for independent directors that enable directors to elect to defer receipt of all or a portion of the annual compensation they are entitled to receive from certain Nuveen-advised funds. Under the plan, deferred amounts are treated as though equal dollar amounts had been invested in shares of select Nuveen-advised funds.
During the six months ended April 30, 2012, Nuveen Securities, LLC (the “Distributor”), a wholly-owned subsidiary fo Nuveen, collected sales charges on purchases of Class A Shares, the majority of which were paid out as concessions to financial intermediaries as follows:
| Large Cap Growth Opportunities |
Mid Cap Growth Opportunities |
Small Cap Growth Opportunities |
||||||||||
| Sales charges collected |
$ | 74,857 | $ | 71,789 | $ | 19,009 | ||||||
| Paid to financial intermediaries |
67,106 | 62,810 | 16,589 | |||||||||
The Distributor also received 12b-1 service fees on Class A Shares, substantially all of which were paid to compensate financial intermediaries for providing services to shareholders relating to their investments.
During the six months ended April 30, 2012, the Distributor compensated financial intermediaries directly with commission advances at the time of purchase as follows:
| Large Cap Growth Opportunities |
Mid Cap Growth Opportunities |
Small Cap Growth Opportunities |
||||||||||
| Commission advances |
$ | 40,852 | $ | 28,322 | $ | 1,028 | ||||||
To compensate for commissions advanced to financial intermediaries, all 12b-1 service and distribution fees collected on Class B Shares and C Shares during the first year following a purchase were retained by the Distributor. During the six months ended April 30, 2012, the Distributor retained such 12b-1 fees as follows:
| Large Cap Growth Opportunities |
Mid Cap Growth Opportunities |
Small Cap Growth Opportunities |
||||||||||
| 12b-1 fees retained |
$ | 35,447 | $ | 33,360 | $ | 6,168 | ||||||
The remaining 12b-1 fees charged to the Funds were paid to compensate financial intermediaries for providing services to shareholders relating to their investments.
The Distributor also collected and retained CDSC on share redemptions during the six months ended April 30, 2012, as follows:
| Large Cap Growth Opportunities |
Mid Cap Growth Opportunities |
Small Cap Growth Opportunities |
||||||||||
| CDSC retained |
$ | 1,977 | $ | 4,756 | $ | 108 | ||||||
| Nuveen Investments | 47 |
Notes to Financial Statements (Unaudited) (continued)
8. New Accounting Pronouncements
Fair Value Measurements and Disclosures
On May 12, 2011, the Financial Accounting Standards Board (“FASB”) issued Accounting Standards Update (“ASU”) No. 2011-04 (“ASU No. 2011-04”) modifying Topic 820, Fair Value Measurements and Disclosures. At the same time, the International Accounting Standards Board (“IASB”) issued International Financial Reporting Standard (“IFRS”) 13, Fair Value Measurement. The objective of the FASB and IASB is convergence of their guidance on fair value measurements and disclosures. Specifically, ASU No. 2011-04 requires reporting entities to disclose i) the amounts of any transfers between Level 1 and Level 2 and the reasons for the transfers and ii) for Level 3 fair value measurements, a) quantitative information about significant unobservable inputs used, b) a description of the valuation processes used by the reporting entity and c) a narrative description of the sensitivity of the fair value measurement to changes in unobservable inputs if a change in those inputs might result in a significantly higher or lower fair value measurement. The effective date of ASU No. 2011-04 is for interim and annual periods beginning after December 15, 2011. At this time, management is evaluating the implications of this guidance and the impact it will have to the financial statement amounts and footnote disclosures, if any.
| 48 | Nuveen Investments |
Notes
| Nuveen Investments | 49 |
Glossary of Terms Used in this Report
Average Annual Total Return: This is a commonly used method to express an investment’s performance over a particular, usually multi-year time period. It expresses the return that would have been necessary each year to equal the investment’s actual cumulative performance (including change in NAV or offer price and reinvested distributions and capital gains, if any) over the time period being considered.
Lipper Large-Cap Growth Funds Classification Average: Represents the average annualized total return for all reporting funds in the Lipper Large-Cap Growth Funds Classification. Lipper returns account for the effects of management fees and assume reinvestment of distributions but do not reflect any applicable sales charges.
Lipper Multi-Cap Growth Funds Classification Average: Represents the average annualized total return for all reporting funds in the Lipper Multi-Cap Growth Funds Classification. Lipper returns account for the effects of management fees and assume reinvestment of distributions but do not reflect any applicable sales charges.
Lipper Small-Cap Growth Funds Classification Average: Represents the average annualized total return for all reporting funds in the Lipper Small-Cap Growth Funds Classification. Lipper returns account for the effects of management fees and assume reinvestment of distributions but do not reflect any applicable sales charges.
Net Asset Value (NAV): The net market value of all securities held in a portfolio.
Net Asset Value (NAV) Per Share: The market value of one share of a mutual fund or closed-end fund. For a Fund, the NAV is calculated daily by taking the Fund’s total assets (securities, cash, and accrued earnings), subtracting the Fund’s liabilities, and dividing by the number of shares outstanding.
Russell 1000® Growth Index: An index that measures the performance of those Russell 1000 companies with higher price-to-book ratios and higher forecasted growth values. The index returns assume reinvestment of distributions, but do not reflect any applicable sales charges or management fees.
Russell 2000® Growth Index: An index that measures the performance of those Russell 2000 companies with higher price-to-book ratios and higher forecasted growth values. The index returns assume reinvestment of distributions, but do not reflect any applicable sales charges or management fees.
Russell Midcap® Growth Index: An index that measures the performance of the mid-cap growth segment of the U.S. equity universe. It includes those Russell Midcap Index companies with higher price-to-book ratios and higher forecasted growth values. The index returns assume reinvestment of distributions, but do not reflect any applicable sales charges or management fees.
Tax Equalization: The practice of treating a portion of the distribution made to a redeeming shareholder, which represents his proportionate part of undistributed net investment income and capital gain as a distribution for tax purposes. Such amounts are referred to as the equalization debits (or payments) and will be considered a distribution to the shareholder of net investment income and capital gain for calculation of the Fund’s dividends paid deduction.
| 50 | Nuveen Investments |
| * | The Board of Directors of the Funds, upon recommendation of the Audit Committee, engaged PricewaterhouseCoopers LLP as the Funds’ independent registered public accounting firm as of March 1, 2011. On December 30, 2011, Ernst & Young, LLP (“Ernst & Young”) completed its work on the October 31, 2011 audits and resigned as the independent registered public accounting firm of the Funds. |
| Ernst & Young’s report on the Funds’ financial statements for the most recent fiscal year contained no adverse opinion or disclaimer of opinion, and were not qualified or modified as to uncertainty, audit scope or accounting principles. For the most recent fiscal year and through March 1, 2011, there were no disagreements with Ernst & Young on any matter of accounting principles, financial statement disclosure or auditing scope or procedures, which disagreements, if not resolved to the satisfaction of Ernst & Young, would have caused it to make reference to the subject matter of the disagreements in connection with its reports on the Funds’ financial statements. |
Quarterly Portfolio of Investments and Proxy Voting information: You may obtain (i) each Fund’s quarterly portfolio of investments, (ii) information regarding how each Fund voted proxies relating to portfolio securities held during the most recent twelve-month period ended June 30, and (iii) a description of the policies and procedures that each Fund used to determine how to vote proxies relating to portfolio securities without charge, upon request, by calling Nuveen Investments at (800) 257-8787 or on Nuveen’s website at www.nuveen.com.
You may also obtain this and other Fund information directly from the Securities and Exchange Commission (SEC). The SEC may charge a copying fee for this information. Visit the SEC on-line at http://www.sec.gov or in person at the SEC’s Public Reference Room in Washington, D.C. Call the SEC at (202) 942-8090 for room hours and operation. You may also request Fund information by sending an e-mail request to publicinfo@sec.gov or by writing to the SEC’s Public Reference Section at 100 F Street NE, Washington, D.C. 20549.
The Financial Industry Regulatory Authority (FINRA) provides a Public Disclosure Program which supplies certain information regarding the disciplinary history of FINRA members and their associated persons in response to either telephone inquiries at (800) 289-9999 or written inquiries at www.finra.org. FINRA also provides an investor brochure that includes information describing the Public Disclosure Program.
| Nuveen Investments | 51 |
Nuveen Investments:
Serving Investors for Generations
Since 1898, financial advisors and their clients have relied on Nuveen Investments to provide dependable investment solutions through continued adherence to proven, long-term investing principles. Today, we offer a range of high quality equity and fixed-income solutions designed to be integral components of a well-diversified core portfolio.
Focused on meeting investor needs.
Nuveen Investments provides high-quality investment services designed to help secure the longterm goals of institutional and individual investors as well as the consultants and financial advisors who serve them. Nuveen Investments markets a wide range of specialized investment solutions which provide investors access to capabilities of its high-quality boutique investment affiliates-Nuveen Asset Management, Symphony Asset Management, NWQ Investment Management Company, Santa Barbara Asset Management, Tradewinds Global Investors, Winslow Capital Management, and Gresham Investment Management. In total, Nuveen Investments managed approximately $227 billion as of March 31, 2012.
Find out how we can help you.
To learn more about how the products and services of Nuveen Investments may be able to help you meet your financial goals, talk to your financial advisor, or call us at (800) 257-8787. Please read the information provided carefully before you invest. Investors should consider the investment objective and policies, risk considerations, charges and expenses of any investment carefully. Where applicable, be sure to obtain a prospectus, which contains this and other relevant information. To obtain a prospectus, please contact your securities representative or Nuveen Investments, 333 W. Wacker Dr., Chicago, IL 60606. Please read the prospectus carefully before you invest or send money.
Learn more about Nuveen Funds at: www.nuveen.com/mf
| Distributed by Nuveen Securities, LLC 333 West Wacker Drive Chicago, IL 60606 www.nuveen.com |
MSA-FCGO-0412P

Mutual Funds
Nuveen Equity Funds
For investors seeking the potential for long-term capital appreciation.
Semi-Annual Report
April 30, 2012
| Share Class / Ticker Symbol | ||||||||||
| Fund Name | Class A | Class B | Class C | Class R3 | Class I | |||||
| Nuveen Large Cap Select Fund |
FLRAX | — | FLYCX | FLSSX | FLRYX | |||||
| Nuveen Mid Cap Select Fund |
FATAX | — | FTACX | — | FATCX | |||||
| Nuveen Small Cap Select Fund |
EMGRX | ARSBX | FHMCX | ASEIX | ARSTX | |||||
LIFE IS COMPLEX.
Nuveen makes things e-simple.
It only takes a minute to sign up for e-Reports. Once enrolled, you’ll receive an e-mail as soon as your Nuveen Fund information is ready. No more waiting for delivery by regular mail. Just click on the link within the e-mail to see the report and save it on your computer if you wish.
Free e-Reports right to your e-mail!
www.investordelivery.com
If you receive your Nuveen Fund distributions and statements from your financial advisor or brokerage account.
OR
www.nuveen.com/accountaccess
If you receive your Nuveen Fund distributions and statements directly from Nuveen.
| Must be preceded by or accompanied by a prospectus. | NOT FDIC INSURED | MAY LOSE VALUE | NO BANK GUARANTEE |
| 4 | ||||
| 5 | ||||
| 12 | ||||
| 16 | ||||
| 17 | ||||
| 18 | ||||
| 28 | ||||
| 29 | ||||
| 30 | ||||
| 31 | ||||
| 38 | ||||
| 50 | ||||
| 51 | ||||
Letter to Shareholders


| 4 | Nuveen Investments |
Certain statements in this report are forward-looking statements. Discussions of specific investments are for illustration only and are not intended as recommendations of individual investments. The forward-looking statements and other views expressed herein are those of the portfolio managers as of the date of this report. Actual future results or occurrences may differ significantly from those anticipated in any forward-looking statements and the views expressed herein are subject to change at any time, due to numerous market and other factors. The Funds disclaim any obligation to update publicly or revise any forward-looking statements or views expressed herein.
These Funds feature portfolio management by Nuveen Asset Management, LLC, an affiliate of Nuveen Investments.
David Chalupnik, CFA, and Tony Burger, CFA, are the portfolio managers for the Nuveen Large Cap Select Fund. David, who has 28 years of investment experience, assumed portfolio management responsibilities in 2003. Tony has 18 years of investment experience, and joined the management team for the Fund in 2004.
Tony and Scott Tonneson, CFA, are the portfolio managers for the Nuveen Mid Cap Select Fund. Tony assumed portfolio management responsibilities in 2005. Scott, who has 18 years of investment experience, joined the management team for the Fund in 2012.
Allen Steinkopf, CFA, and Mark Traster, CFA, are the portfolio managers for the Nuveen Small Cap Select Fund. Allen, who has 19 years of investment experience, assumed portfolio management responsibilities in 2004. Mark, with 20 years of investment experience, joined the management team for the Fund in 2008.
On the following pages, the portfolio management teams for the Funds examine key investment strategies and the Funds’ performance for the six-month period ended April 30, 2012.
Nuveen Large Cap Select Fund
How did the Fund perform during the six-month period ended April 30, 2012?
The tables in the Fund Performance and Expense Ratios section of this report provide Class A Share total returns for the Fund for the six-month, one-year, five-year and since inception periods ended April 30, 2012. The Fund’s Class A Shares at net asset value (NAV) outperformed both the S&P 500® Index and the Lipper classification average over the six-month period.
What strategies were used to manage the Fund during the reporting period? How did these strategies influence performance?
The Fund pursues a long-term capital appreciation strategy by investing primarily in the common stocks of companies that have market capitalizations of $3 billion or greater at the time of purchase. During the reporting period, we continued to utilize our deep, rigorous research approach to find and invest in stocks that we believed had strong and/or improving fundamentals, attractive valuations and a catalyst for future positive relative price performance. We also continued to shift the portfolio to areas of the market that our research suggested were particularly attractive. Throughout this time frame, the portfolio
| Nuveen Investments | 5 |
was shifted toward cyclical stocks and sectors that appeared to have further margin expansion capacity while still selling at attractive valuations. Stocks that we sold generally faced an expected or actual deterioration in their fundamental earnings outlook, the realization or removal of the expected catalyst or excessive valuation.
The stock market made strong advances during the reporting period. The Fund was well positioned in both sector weightings and stock selection. As U.S. economic data continued to improve, the more economically sensitive sectors of the market outperformed. The Fund benefited from its overweight positions in three of these outperforming cyclical sectors: technology, financials and consumer discretionary. Stocks in these sectors had generally been selling at lower valuations and were revalued higher during the reporting period. The financial sector was further aided by reduced financial risk from Europe. At the same time, the Fund’s lower weights in economically stable areas also proved beneficial to relative performance. This included our underweight position in utilities, which lagged the overall market.
Stock selection was also strong in the technology sector, where the Fund was rewarded for its significant overweight position in Apple, the leading manufacturer of smartphones, desktop and portable computing devices. Apple’s stock advanced dramatically during the period as the introduction of its new iPad and upgrades to its iPhone allowed it to gain meaningful and profitable market share in the computing devices market. Another of the Fund’s technology standouts was a direct beneficiary of Apple’s strength. QUALCOMM, the largest global manufacturer of mobile phone chipsets, outperformed due to the increasing demand for smartphones. Before period end, we sold the QUALCOMM position based on its valuation to secure the gains. We also sold some of the Fund’s Apple position to realize profits. However, at period end, the Fund still maintained an overweight position in Apple versus the S&P 500® Index.
The Fund also benefited from an overweight position in the financials sector. Financials rebounded significantly during this time frame as U.S. economic growth and employment began to improve while the housing market began to stabilize. Equally important, the European Central Bank took meaningful steps to avert a systemic financial crisis by injecting massive amounts of liquidity into its banking system through a long-term refinancing operation. This move calmed the market’s fears about the financing ability of Europe’s banks and had a positive impact on U.S. banks as well, including several of our large, diversified financials. For example, Wells Fargo was a significant positive contributor to performance, benefiting from its substantial exposure to mortgage origination, good operating trends, strong credit quality and positive earnings trends. Two other financial holdings, JPMorgan Chase and Fifth Third Bancorp, also benefited from the improved U.S. economy and reduced risk in Europe.
Fund performance in consumer discretionary was aided by our holdings in the recreational products, retail and housing industries. Boat and marine engine manufacturer Brunswick turned in strong results, propelled by better economic conditions and increased consumer spending. On the retail side, the Fund continued to see outperformance from turnaround story Foot Locker, a leading athletic footwear and apparel retailer, and Macy’s, the large department store chain. Both retailers benefited from good execution as they continued to beat their competition and gain market share.
| 6 | Nuveen Investments |
In the housing industry, the Fund was rewarded for its position in home builder D.R. Horton. After buying the stock on signs of stabilization in housing, it performed exceptionally well. We sold the Fund’s position in D.R. Horton during the period since it attained our valuation target.
The health care sector was a detractor from performance. Holdings in health maintenance organizations (HMOs) fell short of expectations. As economic and employment numbers improved, concerns grew over higher levels of utilization which may pressure future HMO profitability. The Fund’s positive results from a position in the strongly performing United Healthcare were more than offset by our holding in Humana, which was down for the quarter.
Toward the end of the reporting period, improvement in U.S. economic numbers started to slow and European problems resurfaced again. Therefore, we have reduced cyclicality quite a bit in the Fund’s portfolio by lowering its technology exposure to an underweight while reducing its overweight positions in consumer discretionary, industrials and financials. The consumer staples sector remains the Fund’s largest underweight followed by utilities and then technology. Meanwhile, we have moved to a health care overweight, which could help reduce cyclicality in the portfolio.
Nuveen Mid Cap Select Fund
How did the Fund perform during the six-month period ended April 30, 2012?
The tables in the Fund Performance and Expense Ratios section of this report provide Class A Share total returns for the Fund for the six-month, one-year, five-year and ten-year periods ended April 30, 2012. The Fund’s Class A Shares at net asset value (NAV) outperformed both the Russell Midcap® Index and the Lipper classification average over the six-month period.
What strategies were used to manage the Fund during the reporting period? How did these strategies influence performance?
The Fund seeks to provide long-term capital appreciation by investing primarily in the common stocks of companies with market capitalizations at the time of purchase between approximately $350 million and $14 billion. During the reporting period, we continued to implement our “best of the best” investment approach. We started by using a combination of fundamental and quantitative analysis to identify mid-sized companies that we believed had strong fundamentals, attractive valuations and a catalyst for future positive relative performance. We further narrowed down our investable universe by identifying only those stocks that were held in other funds within our firm. We then combined a subset of those stocks into a portfolio that had risk tolerances within our acceptable limits. Generally, stocks we sold faced an expected or actual deterioration in their fundamental earnings outlook, the realization or removal of the expected catalyst or excessive valuation.
Toward the end of 2011, we saw multiple signs that the economic recovery was better than had been anticipated throughout the summer months. As the market advanced over
| Nuveen Investments | 7 |
the reporting period, the Fund benefited from its emphasis on early cyclical sectors such as consumer discretionary, particularly in the retail industry. Within this sector, the Fund was rewarded for holding companies like Foot Locker, Ascena Retail Group and Wyndham Worldwide. In retail, turnaround story Foot Locker, a leading athletic footwear and apparel retailer, benefited from good execution as it continued to beat its competition and gain market share. Also, Ascena Retail Group, a specialty retailer of girl’s and women’s apparel, showed strong earnings as it experienced improving same store and e-commerce sales. In addition, hotel and resort chain Wyndham Worldwide had a positive impact on the portfolio as its stock price increased after we purchased the holding. As the economy improved, the market was willing to pay more for this fundamentally strong, attractively valued company that was demonstrating strong execution.
Another bright spot was the stock selection within the smallest quintile of the benchmark’s market-cap range. Share prices for Coinstar and Athenahealth, Inc. both rose during the period. The Fund continued to overweight the small-cap area with success.
The Fund also benefited from the quantitative influence in its portfolio construction process. Our focus on the most attractively ranked stocks according to our proprietary quantitative model and our underweight to the most unattractively ranked stocks paid off well for the Fund. Finally, underweight positions in the less economically sensitive sectors such as consumer staples, health care, telecommunication services and utilities aided results.
The Fund’s overweight in Humana and AmerisourceBergen generally hurt performance during the period. As economic and employment numbers improved, concerns grew over higher levels of utilization which may pressure future HMO profitability. In the case of pharmaceutical distributor AmerisourceBergen, the company continued to execute well. However, the less economically sensitive health care services sector did not keep pace with the market rally.
Stock selection in the oil services industry also hindered performance as several energy holdings were negatively impacted by a slowdown in international drilling. Detractors included Parker Drilling, a provider of equipment and drilling solutions to the energy industry, and Newpark Resources, a diversified supplier of products and services to oil and gas exploration and production companies. In telecommunications, equipment provider Polycom had lower share prices after the company did not meet earnings expectations and the market feared it was losing market share to its largest competitor.
Despite the market rally, the Fund was also negatively impacted by our overweight in higher beta stocks, which was not a strong segment over the past six months. Higher beta names that hindered performance included Vocus, an online software-as-a-service company. Although the company is in a growing marketplace and has a solid offering, its share prices declined due to lower guidance in conjunction with its announcement of a strategic acquisition. Also, share prices of engineering and construction firm MasTec fell after orders for its equipment declined, leading investors to question the company’s growth prospects.
Toward the end of the reporting period, improvement in U.S. economic numbers started to slow and European problems resurfaced again. Therefore, we have reduced cyclicality
| 8 | Nuveen Investments |
quite a bit in the Fund’s portfolio by lowering its beta as market risks have increased in the near term. We reduced the Fund’s large overweight in consumer discretionary to a slight underweight, while we added to the health care and telecommunications sectors. At the end of the period, the Fund was overweight in health care and neutral in telecomm.
Nuveen Small Cap Select Fund
How did the Fund perform during the six-month period ended April 30, 2012?
The tables in the Fund Performance and Expense Ratios section of this report provide Class A Share total returns for the Fund for the six-month, one-year, five-year and ten-year periods ended April 30, 2012. The Fund’s Class A Shares at net asset value (NAV) outperformed both the Russell 2000® Index and the Lipper classification average over the six-month period.
What strategies were used to manage the Fund during the reporting period? How did these strategies influence performance?
The Fund seeks to provide long-term capital appreciation by investing primarily in the common stocks of companies with market capitalizations of less than $2.5 billion at the time of purchase. During this period, we continued to execute on our strategy of investing in well run, small-cap companies we believe offer good value in order to generate competitive returns for the Fund. We also continued to keep the Fund well diversified, with its sector weightings very close to the weights in the Russell 2000® Index.
Over the reporting period, the Fund experienced broad based outperformance, surpassing the index in every sector except for technology. In particular, the Fund benefited from strong stock selection in the consumer discretionary, health care, financials, industrials and energy sectors. Consumer discretionary was the top-performing sector led by teen retailer Zumiez. After the market sold off Zumiez to an extremely low valuation in the summer of 2011, we took advantage and built a large position in the Fund’s portfolio. The company was able to overcome the general sluggishness in retail as its unique brand of merchandise continued to be well received by its teen customer base. Zumiez made a strong contribution to the Fund’s returns given its operating performance and double-digit same store sales growth. We also benefited from owning hotel company Gaylord Entertainment, which specializes in group bookings for large properties in Nashville, Orlando, Washington D.C. and Dallas. Similar to Zumiez, Gaylord Entertainment was sold off last summer due to economic growth concerns. However, since that time, Gaylord’s stock price has increased significantly as travel and entertainment bookings are improving and the company’s profitability and efficiency improved. Elsewhere in consumer discretionary, performance was aided by our position in boat and marine engine manufacturer Brunswick. Although retail boat sales have not recovered to the highs reached in 2007, Brunswick has been able to successfully adjust its business to current volumes. The company has seen improved operating performance and a return to profitability while retail boat sales are starting to increase.
Favorable stock selection in health care was led by ZOLL Medical, which designs and manufactures cardiac resuscitation devices. We bought the stock when the price was low
| Nuveen Investments | 9 |
due to concerns that its new LifeVest product would not receive full reimbursement from insurance companies. Since that time, ZOLL Medical continued to post strong operating performance and these concerns were resolved. This resulted in its acquisition by a Japanese company for a significant premium. Align Technology, a medical device designer and manufacturer, was another positive contributor in health care. We purchased shares of this company, a pioneer and leader in the invisible orthodontics market, after a price decline. Share prices made substantial gains during the period. Also, the Fund’s position in Salix Pharmaceuticals was a significant contributor. Salix Pharmaceuticals’ new drug for irritable bowel syndrome has shown positive results, and strong demand is anticipated for this drug.
Outperformance in financials was driven almost exclusively by the Fund’s position in Delphi Financial Group, a strong franchise in employer’s compensation and life insurance. We purchased Delphi in 2008 when the share price declined due to fears about its investment portfolio. The company managed its business effectively and performed well throughout the financial crisis. It was acquired by a Japanese financial company for a significant premium in late 2011.
In industrials, United Rentals share prices increased significantly over this period. The company rents light and heavy equipment to customers in the manufacturing and construction industries. The rental business has been stimulated by the slow economy as companies, reluctant to make more costly capital equipment purchases, have rented instead. This positive secular trend along with a recent merger with its largest competitor has propelled the stock price.
The Fund’s energy performance was solid with particularly strong results from Energy XXI, an oil exploration and production company that acquires, develops and improves production at existing sites in the Gulf of Mexico. In 2009, Energy XXI made a strategic acquisition of oil producing properties from Exxon Mobil and immediately started to improve their production profiles. Since that time, the company has benefited from improved revenue streams and commodity prices.
Technology was the only sector where the Fund underperformed. RF Micro Devices, a designer and manufacturer of semiconductor components used in wireless and broadband communications, detracted from performance. RF Micro Devices has traditionally been a large supplier to companies such as Nokia and Research in Motion, both of which are under pressure and experiencing declining volumes. However, we believed that demand from Korean and Chinese handset manufacturers would offset this declining demand. In reality, demand has fallen more rapidly than we predicted from both the traditional and Asian manufacturers. Therefore, we have exited the Fund’s position in the company. Shares prices of Vocus, an online software-as-a-service company specializing in public relations and online marketing, also declined during the period. Although the company is in a growing marketplace and has a solid offering, its share prices decreased upon the announcement of a strategic acquisition of an online e-mail marketing company. The company plans to dramatically expand its sales and marketing spending to drive the growth of its product, which will collapse its operating margins for at least 12 to 18 months. After talking to management about future plans, we actually bought more of Vocus on price weakness as we believe its stock price will recover.
| 10 | Nuveen Investments |
Toward the end of the reporting period, improvement in U.S. economic numbers started to slow and European problems resurfaced again. Therefore, we are focused on company valuations in light of ongoing volatility. We are also closely watching the sustainability of company growth.
Risk Considerations
Mutual fund investing involves risk; principal loss is possible.
Nuveen Large Cap Select Fund
Equity investments, such as those held by the Fund, are subject to market risk, derivatives risk, and common stock risk. Foreign investments involve additional risks including currency fluctuations, political and economic instability, and lack of liquidity. These risks are magnified in emerging markets.
Nuveen Mid Cap Select Fund
Equity investments, such as those held by the Fund, are subject to market risk, derivatives risk, and common stock risk. Mid-cap stocks are subject to greater volatility. Foreign investments involve additional risks including currency fluctuations, political and economic instability, and lack of liquidity. These risks are magnified in emerging markets.
Nuveen Small Cap Select Fund
Equity investments, such as those held by the Fund, are subject to market risk, derivatives risk, IPO risk, and common stock risk. Small-cap stocks are subject to greater volatility and liquidity risks. Foreign investments involve additional risks including currency fluctuations, political and economic instability, and lack of liquidity. These risks are magnified in emerging markets.
| Nuveen Investments | 11 |
Fund Performance and Expense Ratios
The Fund Performance and Expense Ratios for each Fund are shown on the following three pages.
Returns quoted represent past performance, which is no guarantee of future results. Current performance may be higher or lower than the performance shown. Investment returns and principal value will fluctuate so that when shares are redeemed, they may be worth more or less than their original cost. Returns without sales charges would be lower if the sales charge were included. Returns do not reflect the deduction of taxes that a shareholder would pay on Fund distributions or the redemption of Fund shares.
Returns may reflect a contractual agreement between certain Funds and the investment adviser to waive certain fees and expenses; see Notes to Financial Statements, Footnote 7 — Management Fees and Other Transactions with Affiliates for more information. In addition, returns may reflect a voluntary expense limitation by the Funds’ investment adviser that may be modified or discontinued at any time without notice. For the most recent month-end performance visit www.nuveen.com or call (800) 257-8787.
Returns reflect differences in sales charges and expenses, which are primarily differences in distribution and service fees. Fund returns assume reinvestment of dividends and capital gains.
Comparative index and Lipper return information is provided for the Funds’ Class A Shares at net asset value (NAV) only.
The expense ratios shown reflect the Funds’ total operating expenses (before fee waivers or expense reimbursements, if any) as shown in the Funds’ most recent prospectus. The expense ratios include management fees and other fees and expenses.
| 12 | Nuveen Investments |
Nuveen Large Cap Select Fund
Refer to the first page of this Fund Performance and Expense Ratios section for further explanation of the information included within this page.
Fund Performance
Average Annual Total Returns as of April 30, 2012*
| Cumulative | Average Annual | |||||||||||||||||
| 6-Month | 1-Year | 5-Year | Since Inception** |
|||||||||||||||
| Class A Shares at NAV |
15.09% | -0.30% | -0.14% | 6.25% | ||||||||||||||
| Class A Shares at maximum Offering Price |
8.43% | -6.05% | -1.31% | 5.57% | ||||||||||||||
| S&P 500® Index*** |
12.77% | 4.76% | 1.01% | 7.59% | ||||||||||||||
| Lipper Large-Cap Core Funds Classification Average*** |
11.62% | 2.22% | 0.37% | 6.94% | ||||||||||||||
| Class C Shares |
14.63% | -1.08% | -0.94% | 5.41% | ||||||||||||||
| Class R3 Shares |
14.93% | -0.60% | -0.38% | 5.99% | ||||||||||||||
| Class I Shares |
15.21% | -0.11% | 0.10% | 6.51% | ||||||||||||||
Average Annual Total Returns as of March 31, 2012 (Most Recent Calendar Quarter)*
|
Cumulative |
Average Annual | |||||||||||||||||
| 6-Month | 1-Year | 5-Year | Since Inception** |
|||||||||||||||
| Class A Shares at NAV |
30.90% | 1.57% | 0.88% | 6.39% | ||||||||||||||
| Class A Shares at maximum Offering Price |
23.41% | -4.29% | -0.30% | 5.71% | ||||||||||||||
| Class C Shares |
30.38% | 0.86% | 0.07% | 5.56% | ||||||||||||||
| Class R3 Shares |
30.77% | 1.36% | 0.64% | 6.14% | ||||||||||||||
| Class I Shares |
31.15% | 1.90% | 1.14% | 6.66% | ||||||||||||||
Class A Shares have a maximum 5.75% sales charge (Offering Price). Class A Share purchases of $1 million or more are sold at net asset value without an up-front sales charge but may be subject to a contingent deferred sales charge (CDSC), also known as a back-end sales charge, if redeemed within twelve months of purchase. Class C Shares have a 1% CDSC for redemptions within less than twelve months, which is not reflected in the one-year total return. Class R3 Shares have no sales charge and are available to only certain retirement plans. Class I Shares have no sales charge and may be purchased under limited circumstances or by specified classes of investors.
Expense Ratios as of Most Recent Prospectus
| Expense Ratios |
||||
| Class A Shares |
1.19% | |||
| Class C Shares |
1.94% | |||
| Class R3 Shares |
1.44% | |||
| Class I Shares |
0.94% | |||
| * | Six-month returns are cumulative; all other returns are annualized. |
| ** | Since inception returns are from 1/31/03. |
| *** | Refer to the Glossary of Terms Used in this Report for definitions. Indexes and Lipper averages are not available for direct investment. |
| Nuveen Investments | 13 |
Fund Performance and Expense Ratios (continued)
Nuveen Mid Cap Select Fund
Refer to the first page of this Fund Performance and Expense Ratios section for further explanation of the information included within this page.
Fund Performance
Average Annual Total Returns as of April 30, 2012*
| Cumulative | Average Annual | |||||||||||||||||
| 6-Month | 1-Year | 5-Year | 10-Year | |||||||||||||||
| Class A Shares at NAV |
11.92% | -3.37% | 0.44% | 3.56% | ||||||||||||||
| Class A Shares at maximum Offering Price |
5.47% | -8.93% | -0.75% | 2.95% | ||||||||||||||
| Russell Midcap® Index** |
11.87% | -0.03% | 2.19% | 8.03% | ||||||||||||||
| Lipper Mid-Cap Growth Funds Classification Average** |
11.27% | -1.85% | 3.39% | 6.31% | ||||||||||||||
| Class C Shares |
11.49% | -4.15% | -0.33% | 2.79% | ||||||||||||||
| Class I Shares |
12.11% | -3.14% | 0.69% | 3.83% | ||||||||||||||
Average Annual Total Returns as of March 31, 2012 (Most Recent Calendar Quarter)*
| Cumulative | Average Annual | |||||||||||||||||
| 6-Month | 1-Year | 5-Year | 10-Year | |||||||||||||||
| Class A Shares at NAV |
28.85% | -0.19% | 1.36% | 2.51% | ||||||||||||||
| Class A Shares at maximum Offering Price |
21.40% | -5.96% | 0.17% | 1.91% | ||||||||||||||
| Class C Shares |
28.24% | -1.01% | 0.60% | 1.73% | ||||||||||||||
| Class I Shares |
28.97% | 0.00% | 1.59% | 2.77% | ||||||||||||||
Class A Shares have a maximum 5.75% sales charge (Offering Price). Class A Share purchases of $1 million or more are sold at net asset value without an up-front sales charge but may be subject to a contingent deferred sales charge (CDSC), also known as a back-end sales charge, if redeemed within twelve months of purchase. Class C Shares have a 1% CDSC for redemptions within less than twelve months, which is not reflected in the one-year total return. Class I Shares have no sales charge and may be purchased under limited circumstances or by specified classes of investors.
Expense Ratios as of Most Recent Prospectus
| Gross Expense Ratios |
Net Expense Ratios |
|||||||
| Class A Shares |
1.84% | 1.41% | ||||||
| Class C Shares |
2.59% | 2.16% | ||||||
| Class I Shares |
1.59% | 1.16% | ||||||
The investment adviser has contractually agreed to waive fees and/or reimburse expenses through February 28, 2013, so that total annual Fund operating expenses, after waivers and excluding any acquired Fund fees and expenses, do not exceed 1.41%, 2.16% and 1.16%, for Class A, Class C and Class I Shares, respectively. Fee waivers and/or expense reimbursements will not be terminated prior to that time without the approval of the Fund’s Board of Directors.
| * | Six-month returns are cumulative; all other returns are annualized. |
| ** | Refer to the Glossary of Terms Used in this Report for definitions. Indexes and Lipper averages are not available for direct investment. |
| 14 | Nuveen Investments |
Nuveen Small Cap Select Fund
Refer to the first page of this Fund Performance and Expense Ratios section for further explanation of the information included within this page.
Fund Performance
Average Annual Total Returns as of April 30, 2012*
| Cumulative | Average Annual | |||||||||||||||||
| 6-Month | 1-Year | 5-Year | 10-Year | |||||||||||||||
| Class A Shares at NAV |
13.43% | -3.55% | 1.75% | 6.55% | ||||||||||||||
| Class A Shares at maximum Offering Price |
6.90% | -9.08% | 0.54% | 5.92% | ||||||||||||||
| Russell 2000® Index** |
11.02% | -4.25% | 1.45% | 6.19% | ||||||||||||||
| Lipper Small-Cap Core Funds Classification Average** |
10.58% | -3.64% | 1.46% | 6.43% | ||||||||||||||
| Class B Shares w/o CDSC*** |
13.00% | -4.25% | 0.98% | 5.75% | ||||||||||||||
| Class B Shares w/CDSC*** |
8.00% | -8.89% | 0.80% | 5.75% | ||||||||||||||
| Class C Shares |
13.01% | -4.23% | 1.00% | 5.76% | ||||||||||||||
| Class R3 Shares |
13.36% | -3.77% | 1.51% | 6.35% | ||||||||||||||
| Class I Shares |
13.60% | -3.32% | 2.00% | 6.81% | ||||||||||||||
Average Annual Total Returns as of March 31, 2012 (Most Recent Calendar Quarter)*
| Cumulative | Average Annual | |||||||||||||||||
| 6-Month | 1-Year | 5-Year | 10-Year | |||||||||||||||
| Class A Shares at NAV |
36.38% | 2.77% | 2.84% | 6.94% | ||||||||||||||
| Class A Shares at maximum Offering Price |
28.55% | -3.12% | 1.62% | 6.30% | ||||||||||||||
| Class B Shares w/o CDSC*** |
36.05% | 2.07% | 2.08% | 6.14% | ||||||||||||||
| Class B Shares w/CDSC*** |
31.05% | -2.87% | 1.90% | 6.14% | ||||||||||||||
| Class C Shares |
35.84% | 1.96% | 2.07% | 6.14% | ||||||||||||||
| Class R3 Shares |
36.36% | 2.54% | 2.59% | 6.74% | ||||||||||||||
| Class I Shares |
36.62% | 3.00% | 3.10% | 7.20% | ||||||||||||||
Class A Shares have a maximum 5.75% sales charge (Offering Price). Class A Share purchases of $1 million or more are sold at net asset value without an up-front sales charge but may be subject to a contingent deferred sales charge (CDSC), also known as a back-end sales charge, if redeemed within twelve months of purchase. Class B Shares have a CDSC that begins at 5% for redemptions during the first year and declines periodically until after six years when the charge becomes 0%. Class B Shares automatically convert to Class A Shares eight years after purchase. Class C Shares have a 1% CDSC for redemptions within less than twelve months, which is not reflected in the one-year total return. Class R3 Shares have no sales charge and are available to only certain retirement plans. Class I Shares have no sales charge and may be purchased under limited circumstances or by specified classes of investors.
Expense Ratios as of Most Recent Prospectus
| Expense Ratios |
||||
| Class A Shares |
1.32% | |||
| Class B Shares |
2.07% | |||
| Class C Shares |
2.07% | |||
| Class R3 Shares |
1.57% | |||
| Class I Shares |
1.07% | |||
| * | Six-month returns are cumulative; all other returns are annualized. |
| ** | Refer to the Glossary of Terms Used in this Report for definitions. Indexes and Lipper averages are not available for direct investment. |
| *** | Class B Shares are available only upon the exchange of Class B Shares from another Nuveen mutual fund or for purposes of dividend reinvestment, but Class B shares are not available for new accounts or for additional investment into existing accounts. |
| Nuveen Investments | 15 |
Holding Summaries as of April 30, 2012
This data relates to the securities held in each Fund’s portfolio of investments. It should not be construed as a measure of performance for the Fund itself.
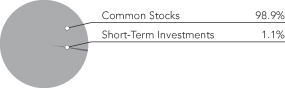

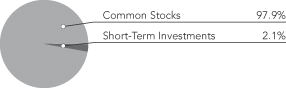
| 1 | As a percentage of total investments (excluding investments purchased with collateral from securities lending) as of April 30, 2012. Holdings are subject to change. |
| 2 | As a percentage of total common stocks as of April 30, 2012. Holdings are subject to change. |
| 16 | Nuveen Investments |
As a shareholder of one or more of the Funds, you incur two types of costs: (1) transaction costs, including up-front and back-end sales charges (loads) or redemption fees, where applicable; and (2) ongoing costs, including management fees; distribution and service (12b-1) fees, where applicable; and other Fund expenses. The Examples below are intended to help you understand your ongoing costs (in dollars) of investing in the Funds and to compare these costs with the ongoing costs of investing in other mutual funds.
The Examples below are based on an investment of $1,000 invested at the beginning of the period and held for the period.
The information under “Actual Performance,” together with the amount you invested, allows you to estimate actual expenses incurred over the reporting period. Simply divide your account value by $1,000 (for example, an $8,600 account value divided by $1,000 = 8.60) and multiply the result by the cost shown for your share class, in the row entitled “Expenses Incurred During Period” to estimate the expenses incurred on your account during this period.
The information under “Hypothetical Performance,” provides information about hypothetical account values and hypothetical expenses based on the respective Fund’s actual expense ratio and an assumed rate of return of 5% per year before expenses, which is not the Fund’s actual return. The hypothetical account values and expenses may not be used to estimate the actual ending account balance or expense you incurred for the period. You may use this information to compare the ongoing costs of investing in the Fund and other Funds. To do so, compare this 5% hypothetical example with the 5% hypothetical examples that appear in the shareholder reports of the other funds.
Please note that the expenses shown in the table are meant to highlight your ongoing costs only and do not reflect any transaction costs. Therefore, the hypothetical information is useful in comparing ongoing costs only, and will not help you determine the relative total costs of owning different funds or share classes. In addition, if these transaction costs were included, your costs would have been higher.
Nuveen Large Cap Select Fund
| Actual Performance | Hypothetical Performance (5% annualized return before expenses) |
|||||||||||||||||||||||||||||||||
| A Shares | C Shares | R3 Shares | I Shares | A Shares | C Shares | R3 Shares | I Shares | |||||||||||||||||||||||||||
| Beginning Account Value (11/01/11) | $ | 1,000.00 | $ | 1,000.00 | $ | 1,000.00 | $ | 1,000.00 | $ | 1,000.00 | $ | 1,000.00 | $ | 1,000.00 | $ | 1,000.00 | ||||||||||||||||||
| Ending Account Value (4/30/12) | $ | 1,150.90 | $ | 1,146.30 | $ | 1,149.30 | $ | 1,152.10 | $ | 1,017.16 | $ | 1,013.43 | $ | 1,015.91 | $ | 1,018.40 | ||||||||||||||||||
| Expenses Incurred During Period | $ | 8.29 | $ | 12.27 | $ | 9.62 | $ | 6.96 | $ | 7.77 | $ | 11.51 | $ | 9.02 | $ | 6.52 | ||||||||||||||||||
For each class of the Fund, expenses are equal to the Fund’s annualized net expense ratio of 1.55%, 2.30%, 1.80% and 1.30% for Classes A, C, R3 and I, respectively, multiplied by the average account value over the period, multiplied by 182/366 (to reflect the one-half year period).
Nuveen Mid Cap Select Fund
| Actual Performance | Hypothetical Performance (5% annualized return before expenses) |
|||||||||||||||||||||||||
| A Shares | C Shares | I Shares | A Shares | C Shares | I Shares | |||||||||||||||||||||
| Beginning Account Value (11/01/11) |
$ | 1,000.00 | $ | 1,000.00 | $ | 1,000.00 | $ | 1,000.00 | $ | 1,000.00 | $ | 1,000.00 | ||||||||||||||
| Ending Account Value (4/30/12) |
$ | 1,119.20 | $ | 1,114.90 | $ | 1,121.10 | $ | 1,017.85 | $ | 1,014.12 | $ | 1,019.10 | ||||||||||||||
| Expenses Incurred During Period |
$ | 7.43 | $ | 11.36 | $ | 6.12 | $ | 7.07 | $ | 10.82 | $ | 5.82 | ||||||||||||||
For each class of the Fund, expenses are equal to the Fund’s annualized net expense ratio of 1.41%, 2.16% and 1.16% for Classes A, C and I, respectively, multiplied by the average account value over the period, multiplied by 182/366 (to reflect the one-half year period).
Nuveen Small Cap Select Fund
| Actual Performance | Hypothetical Performance (5% annualized return before expenses) |
|||||||||||||||||||||||||||||||||||||||||
| A Shares | B Shares | C Shares | R3 Shares | I Shares | A Shares | B Shares | C Shares | R3 Shares | I Shares | |||||||||||||||||||||||||||||||||
| Beginning Account Value (11/01/11) |
$ | 1,000.00 | $ | 1,000.00 | $ | 1,000.00 | $ | 1,000.00 | $ | 1,000.00 | $ | 1,000.00 | $ | 1,000.00 | $ | 1,000.00 | $ | 1,000.00 | $ | 1,000.00 | ||||||||||||||||||||||
| Ending Account Value (4/30/12) |
$ | 1,134.30 | $ | 1,130.00 | $ | 1,130.10 | $ | 1,133.60 | $ | 1,136.03 | $ | 1,018.45 | $ | 1,014.72 | $ | 1,014.72 | $ | 1,017.21 | $ | 1,019.69 | ||||||||||||||||||||||
| Expenses Incurred During Period |
$ | 6.85 | $ | 10.80 | $ | 10.80 | $ | 8.17 | $ | 5.52 | $ | 6.47 | $ | 10.22 | $ | 10.22 | $ | 7.72 | $ | 5.22 | ||||||||||||||||||||||
For each class of the Fund, expenses are equal to the Fund’s annualized net expense ratio of 1.29%, 2.04%, 2.04%, 1.54% and 1.04% for Classes A, B, C, R3 and I, respectively, multiplied by the average account value over the period, multiplied by 182/366 (to reflect the one-half year period).
| Nuveen Investments | 17 |
Portfolio of Investments (Unaudited)
Nuveen Large Cap Select Fund
April 30, 2012
| Shares | Description (1) | Value | ||||||||||||
| COMMON STOCKS – 99.5% |
||||||||||||||
| Consumer Discretionary – 18.3% |
||||||||||||||
| 8,174 | Bed Bath and Beyond Inc., (2), (3) |
$ | 575,368 | |||||||||||
| 16,134 | Brunswick Corporation, (2) |
424,163 | ||||||||||||
| 31,443 | Dana Holding Corporation, (2), (3) |
459,697 | ||||||||||||
| 16,313 | Foot Locker, Inc. |
499,015 | ||||||||||||
| 19,680 | Home Depot, Inc. |
1,019,227 | ||||||||||||
| 45,399 | Interpublic Group Companies, Inc., (2) |
536,162 | ||||||||||||
| 20,011 | Jarden Corporation |
839,061 | ||||||||||||
| 23,152 | Macy’s, Inc., (2) |
949,695 | ||||||||||||
| 5,245 | Polaris Industries Inc. |
416,663 | ||||||||||||
| 789 | priceline.com Incorporated, (2), (3) |
600,287 | ||||||||||||
| 43,053 | Staples, Inc., (2) |
663,016 | ||||||||||||
| 9,560 | Starbucks Corporation |
548,553 | ||||||||||||
| 10,346 | Whirlpool Corporation |
662,351 | ||||||||||||
| Total Consumer Discretionary |
8,193,258 | |||||||||||||
| Consumer Staples – 5.2% |
||||||||||||||
| 25,441 | CVS Caremark Corporation |
1,135,177 | ||||||||||||
| 12,639 | Dr. Pepper Snapple Group |
512,891 | ||||||||||||
| 17,660 | Kraft Foods Inc. |
704,104 | ||||||||||||
| Total Consumer Staples |
2,352,172 | |||||||||||||
| Energy – 12.4% |
||||||||||||||
| 6,142 | Anadarko Petroleum Corporation |
449,656 | ||||||||||||
| 10,894 | Chevron Corporation, (2) |
1,160,865 | ||||||||||||
| 9,032 | Exxon Mobil Corporation, (2) |
779,823 | ||||||||||||
| 17,847 | Marathon Oil Corporation |
523,631 | ||||||||||||
| 9,124 | Occidental Petroleum Corporation |
832,291 | ||||||||||||
| 6,360 | Pioneer Natural Resources Company, (2) |
736,615 | ||||||||||||
| 14,427 | Schlumberger Limited |
1,069,618 | ||||||||||||
| Total Energy |
5,552,499 | |||||||||||||
| Financials – 16.1% |
||||||||||||||
| 14,375 | AFLAC Incorporated |
647,450 | ||||||||||||
| 14,633 | Capital One Financial Corporation |
811,839 | ||||||||||||
| 29,076 | Citigroup Inc. |
960,671 | ||||||||||||
| 30,338 | JPMorgan Chase & Co. |
1,303,927 | ||||||||||||
| 10,886 | PNC Financial Services Group, Inc., (2) |
721,960 | ||||||||||||
| 14,064 | Prudential Financial, Inc. |
851,435 | ||||||||||||
| 36,385 | SLM Corporation |
539,590 | ||||||||||||
| 41,840 | Wells Fargo & Company, (2) |
1,398,711 | ||||||||||||
| Total Financials |
7,235,583 | |||||||||||||
| Health Care – 14.5% |
||||||||||||||
| 16,129 | Agilent Technologies, Inc., (2), (3) |
680,321 | ||||||||||||
| 6,589 | Allergan, Inc. |
632,544 | ||||||||||||
| 21,885 | CareFusion Corporation, (3) |
567,040 | ||||||||||||
| 8,507 | Covidien PLC |
469,842 | ||||||||||||
| 9,621 | Gilead Sciences, Inc., (3) |
500,388 | ||||||||||||
| 18 | Nuveen Investments |
| Shares | Description (1) | Value | ||||||||||||
| Health Care (continued) |
||||||||||||||
| 5,225 | Humana Inc. |
$ | 421,553 | |||||||||||
| 9,234 | McKesson HBOC Inc. |
844,080 | ||||||||||||
| 4,281 | Perrigo Company, (2) |
449,077 | ||||||||||||
| 55,653 | Pfizer Inc. |
1,276,123 | ||||||||||||
| 12,069 | UnitedHealth Group Incorporated |
677,674 | ||||||||||||
| Total Health Care |
6,518,642 | |||||||||||||
| Industrials – 8.2% |
||||||||||||||
| 9,350 | Boeing Company |
718,080 | ||||||||||||
| 12,805 | Dover Corporation |
802,361 | ||||||||||||
| 15,673 | Emerson Electric Company, (2) |
823,459 | ||||||||||||
| 17,268 | General Electric Company, (2) |
338,107 | ||||||||||||
| 13,539 | Ingersoll Rand Company Limited, Class A |
575,678 | ||||||||||||
| 19,441 | Oshkosh Truck Corporation, (2) |
443,838 | ||||||||||||
| Total Industrials |
3,701,523 | |||||||||||||
| Information Technology – 16.9% |
||||||||||||||
| 4,396 | Apple, Inc., (3) |
2,568,319 | ||||||||||||
| 12,919 | Autodesk, Inc., (3) |
508,621 | ||||||||||||
| 32,140 | EMC Corporation, (2), (3) |
906,669 | ||||||||||||
| 1,248 | Google Inc., Class A, (3) |
755,327 | ||||||||||||
| 33,760 | Intel Corporation |
958,784 | ||||||||||||
| 1,427 | MasterCard, Class A |
645,389 | ||||||||||||
| 16,511 | Molex Inc. |
378,102 | ||||||||||||
| 8,348 | VeriFone Holdings Inc., (2), (3) |
397,699 | ||||||||||||
| 4,030 | VMware Inc., (2) |
450,232 | ||||||||||||
| Total Information Technology |
7,569,142 | |||||||||||||
| Materials – 3.8% |
||||||||||||||
| 2,733 | CF Industries Holdings, Inc. |
527,633 | ||||||||||||
| 13,151 | LyondellBasell Industries NV |
549,449 | ||||||||||||
| 21,601 | Packaging Corporation of America |
630,533 | ||||||||||||
| Total Materials |
1,707,615 | |||||||||||||
| Telecommunication Services – 2.7% |
||||||||||||||
| 24,594 | AT&T Inc. |
809,389 | ||||||||||||
| 10,320 | Verizon Communications Inc., (2) |
416,722 | ||||||||||||
| Total Telecommunication Services |
1,226,111 | |||||||||||||
| Utilities – 1.4% |
||||||||||||||
| 14,193 | Edison International |
624,634 | ||||||||||||
| Total Common Stocks (cost $39,826,211) |
44,681,179 | |||||||||||||
| Shares | Description (1) | Value | ||||||||||||
| INVESTMENTS PURCHASED WITH COLLATERAL FROM SECURITIES LENDING – 28.0% |
||||||||||||||
| Money Market Funds – 28.0% |
||||||||||||||
| 12,566,136 | Mount Vernon Securities Lending Prim Portfolio, 0.276%, (4), (5) |
$ | 12,566,136 | |||||||||||
| Total Investments Purchased with Collateral from Securities Lending (cost $12,566,136) |
12,566,136 | |||||||||||||
| Nuveen Investments | 19 |
Portfolio of Investments (Unaudited)
Nuveen Large Cap Select Fund (continued)
April 30, 2012
| Shares | Description (1) | Value | ||||||||||||
| SHORT-TERM INVESTMENTS – 1.2% |
||||||||||||||
| Money Market Funds – 1.2% |
||||||||||||||
| 511,952 | First American Treasury Obligations Fund, Class Z, 0.000%, (4) |
$ | 511,952 | |||||||||||
| Total Short-Term Investments (cost $511,952) |
511,952 | |||||||||||||
| Total Investments (cost $52,904,299) – 128.7% |
57,759,267 | |||||||||||||
| Other Assets Less Liabilities – (28.7)% |
(12,872,420) | |||||||||||||
| Net Assets – 100% |
$ | 44,886,847 | ||||||||||||
| For Fund portfolio compliance purposes, the Fund’s industry classifications refer to any one or more of the industry sub-classifications used by one or more widely recognized market indexes or ratings group indexes, and/or as defined by Fund management. This definition may not apply for purposes of this report which may combine industry sub-classifications into sectors for reporting ease. |
| (1) | All percentages shown in the Portfolio of Investments are based on net assets. |
| (2) | Investment, or a portion of investment, is out on loan for securities lending. |
| (3) | Non-income producing; issuer has not declared a dividend within the past twelve months. |
| (4) | The rate shown is the annualized seven-day effective yield as of April 30, 2012. |
| (5) | The Fund may loan securities representing up to one third of the fair value of its total assets (which includes collateral for securities on loan) to broker dealers, banks, and other institutions. The Fund maintains collateral equal to at least 102% of the fair value of the securities loaned. The cash collateral received by the Fund is invested in this money market fund. See Notes to Financial Statements, Footnote 1 – General Information and Significant Accounting Policies, Securities Lending for more information. |
| 20 | Nuveen Investments |
Portfolio of Investments (Unaudited)
Nuveen Mid Cap Select Fund
April 30, 2012
| Shares | Description (1) | Value | ||||||||||||
| COMMON STOCKS – 100.3% |
||||||||||||||
| Consumer Discretionary – 21.5% |
||||||||||||||
| 19,888 | Ascena Retail Group Inc., (2), (3) |
$ | 407,306 | |||||||||||
| 5,142 | Bed Bath and Beyond Inc., (3) |
361,945 | ||||||||||||
| 3,668 | BorgWarner Inc., (3) |
289,919 | ||||||||||||
| 8,154 | Brunswick Corporation, (2) |
214,369 | ||||||||||||
| 15,075 | Cinemark Holdings Inc., (2) |
346,122 | ||||||||||||
| 7,232 | Coinstar Inc., (2), (3) |
454,097 | ||||||||||||
| 25,170 | Dana Holding Corporation, (2), (3) |
367,985 | ||||||||||||
| 4,934 | Dollar Tree Stores Inc., (3) |
501,590 | ||||||||||||
| 16,235 | Foot Locker, Inc. |
496,629 | ||||||||||||
| 12,362 | Jarden Corporation |
518,339 | ||||||||||||
| 10,910 | Macy’s, Inc. |
447,528 | ||||||||||||
| 9,222 | Mattel, Inc. |
309,859 | ||||||||||||
| 6,508 | Polaris Industries Inc. |
516,996 | ||||||||||||
| 13,632 | Sally Beauty Holdings Inc., (3) |
362,611 | ||||||||||||
| 5,494 | Sothebys Holdings Inc., (2) |
216,024 | ||||||||||||
| 24,977 | Staples, Inc. |
384,646 | ||||||||||||
| Total Consumer Discretionary |
6,195,965 | |||||||||||||
| Consumer Staples – 3.5% |
||||||||||||||
| 11,208 | Constellation Brands, Inc., Class A, (2), (3) |
242,093 | ||||||||||||
| 5,936 | Monster Beverage Corporation, (3) |
385,603 | ||||||||||||
| 21,192 | Spartan Stores, Inc. |
386,330 | ||||||||||||
| Total Consumer Staples |
1,014,026 | |||||||||||||
| Energy – 4.1% |
||||||||||||||
| 14,222 | Basic Energy Services, Inc., (3) |
204,797 | ||||||||||||
| 4,589 | Concho Resources Inc., (3) |
491,849 | ||||||||||||
| 10,299 | Marathon Oil Corporation |
302,173 | ||||||||||||
| 38,309 | Parker Drilling Company, (3) |
198,058 | ||||||||||||
| Total Energy |
1,196,877 | |||||||||||||
| Financials – 21.5% |
||||||||||||||
| 6,557 | AFLAC Incorporated |
295,327 | ||||||||||||
| 6,149 | American Tower REIT Inc. |
403,251 | ||||||||||||
| 7,977 | Capital One Financial Corporation |
442,564 | ||||||||||||
| 34,740 | CNO Financial Group Inc., (2), (3) |
252,560 | ||||||||||||
| 5,182 | Digital Realty Trust Inc. (2) |
389,116 | ||||||||||||
| 5,428 | Discover Financial Services |
184,009 | ||||||||||||
| 9,516 | EZCORP, Inc. |
254,934 | ||||||||||||
| 37,517 | Fifth Third Bancorp. |
533,867 | ||||||||||||
| 32,512 | KeyCorp. |
261,396 | ||||||||||||
| 19,769 | Knight Trading Group Inc., (2) |
259,765 | ||||||||||||
| 12,998 | Lincoln National Corporation |
321,960 | ||||||||||||
| 43,820 | MFA Mortgage Investments, Inc. |
323,392 | ||||||||||||
| 11,787 | National Retail Properties, Inc., (2) |
322,728 | ||||||||||||
| 7,006 | Prudential Financial, Inc. |
424,143 | ||||||||||||
| 5,795 | PS Business Parks Inc., (2) |
395,509 | ||||||||||||
| Nuveen Investments | 21 |
Portfolio of Investments (Unaudited)
Nuveen Mid Cap Select Fund (continued)
April 30, 2012
| Shares | Description (1) | Value | ||||||||||||
| Financials (continued) |
||||||||||||||
| 31,153 | SLM Corporation |
$ | 461,999 | |||||||||||
| 13,765 | Unum Group |
326,781 | ||||||||||||
| 14,957 | Webster Financial Corporation, (2) |
339,973 | ||||||||||||
| Total Financials |
6,193,274 | |||||||||||||
| Health Care – 12.0% |
||||||||||||||
| 4,106 | Aetna Inc. |
180,828 | ||||||||||||
| 12,921 | Agilent Technologies, Inc., (3) |
545,008 | ||||||||||||
| 5,472 | Alexion Pharmaceuticals Inc. |
494,231 | ||||||||||||
| 12,717 | AmerisourceBergen Corporation, (2) |
473,200 | ||||||||||||
| 3,858 | Haemonetics Corporation |
276,117 | ||||||||||||
| 5,711 | Humana Inc. |
460,763 | ||||||||||||
| 6,342 | ICU Medical, Inc., (2), (3) |
332,892 | ||||||||||||
| 2,927 | Idexx Labs Inc., (2), (3) |
257,371 | ||||||||||||
| 4,710 | McKesson HBOC Inc. |
430,541 | ||||||||||||
| Total Health Care |
3,450,951 | |||||||||||||
| Industrials – 11.7% |
||||||||||||||
| 15,596 | Actuant Corporation, (2) |
425,303 | ||||||||||||
| 9,081 | Ametek Inc. |
457,047 | ||||||||||||
| 4,968 | Crane Company |
219,238 | ||||||||||||
| 5,607 | Dover Corporation |
351,335 | ||||||||||||
| 7,792 | G&K Services, Inc., (2) |
256,045 | ||||||||||||
| 7,923 | General Cable Corporation, (2) |
233,253 | ||||||||||||
| 11,848 | Ingersoll Rand Company Limited, Class A |
503,777 | ||||||||||||
| 3,318 | Roper Industries Inc. |
338,104 | ||||||||||||
| 2,120 | TransDigm Group Inc. |
267,374 | ||||||||||||
| 6,483 | Verisk Analytics Inc, Class A Shares, (3) |
317,343 | ||||||||||||
| Total Industrials |
3,368,819 | |||||||||||||
| Information Technology – 13.7% |
||||||||||||||
| 12,215 | Autodesk, Inc., (3) |
480,905 | ||||||||||||
| 4,117 | CommVault Systems, Inc., (3) |
214,372 | ||||||||||||
| 3,593 | F5 Networks, Inc., (3) |
481,210 | ||||||||||||
| 42,323 | Integrated Device Technology, Inc., (2), (3) |
286,527 | ||||||||||||
| 11,144 | Maxim Integrated Products, Inc. |
329,640 | ||||||||||||
| 9,052 | Molex Inc., (2) |
249,745 | ||||||||||||
| 41,623 | Photronics Inc., (2), (3) |
257,646 | ||||||||||||
| 5,893 | Plantronics Inc., (2) |
225,820 | ||||||||||||
| 31,568 | Polycom Inc., (3) |
418,907 | ||||||||||||
| 6,212 | Red Hat, Inc., (3) |
370,297 | ||||||||||||
| 6,659 | VeriFone Holdings Inc., (2), (3) |
317,235 | ||||||||||||
| 7,961 | Western Digital Corporation, (3) |
308,966 | ||||||||||||
| Total Information Technology |
3,941,270 | |||||||||||||
| Materials – 7.3% |
||||||||||||||
| 6,334 | Albemarle Corporation |
413,610 | ||||||||||||
| 1,564 | CF Industries Holdings, Inc. |
301,946 | ||||||||||||
| 5,961 | Ecolab Inc., (2) |
379,656 | ||||||||||||
| 22 | Nuveen Investments |
| Shares | Description (1) | Value | ||||||||||||
| Materials (continued) |
||||||||||||||
| 4,544 | Minerals Technologies Inc., (2) |
$ | 304,902 | |||||||||||
| 11,420 | Packaging Corporation of America |
333,350 | ||||||||||||
| 3,635 | PPG Industries, Inc. |
382,547 | ||||||||||||
| Total Materials |
2,116,011 | |||||||||||||
| Telecommunication Services – 0.5% |
||||||||||||||
| 7,850 | NTELOS Holdings Corp |
158,727 | ||||||||||||
| Utilities – 4.5% |
||||||||||||||
| 13,217 | CenterPoint Energy, Inc. |
267,116 | ||||||||||||
| 15,718 | CMS Energy Corporation, (2) |
361,357 | ||||||||||||
| 11,595 | El Paso Electric Company, (2) |
355,270 | ||||||||||||
| 6,355 | Pinnacle West Capital Corporation |
307,264 | ||||||||||||
| Total Utilities |
1,291,007 | |||||||||||||
| Total Common Stocks (cost $26,331,668) |
28,926,927 | |||||||||||||
| Shares | Description (1) | Value | ||||||||||||
| INVESTMENTS PURCHASED WITH COLLATERAL FROM SECURITIES LENDING – 27.9% |
||||||||||||||
| Money Market Funds – 27.9% |
||||||||||||||
| 8,043,707 | Mount Vernon Securities Lending Prim Portfolio, 0.276%, (4), (5) |
$ | 8,043,707 | |||||||||||
| Total Investments Purchased with Collateral from Securities Lending (cost $8,043,707) |
8,043,707 | |||||||||||||
| Shares | Description (1) | Value | ||||||||||||
| SHORT-TERM INVESTMENTS – 1.4% |
||||||||||||||
| Money Market Funds – 1.4% |
||||||||||||||
| 426,552 | First American Treasury Obligations Fund, Class Z, 0.000%, (4) |
$ | 426,552 | |||||||||||
| Total Short-Term Investments (cost $426,552) |
426,552 | |||||||||||||
| Total Investments (cost $34,801,927) – 129.6% |
37,397,186 | |||||||||||||
| Other Assets Less Liabilities – (29.6)% |
(8,550,023) | |||||||||||||
| Net Assets – 100% |
$ | 28,847,163 | ||||||||||||
| For Fund portfolio compliance purposes, the Fund’s industry classifications refer to any one or more of the industry sub-classifications used by one or more widely recognized market indexes or ratings group indexes, and/or as defined by Fund management. This definition may not apply for purposes of this report which may combine industry sub-classifications into sectors for reporting ease. |
| (1) | All percentages shown in the Portfolio of Investments are based on net assets. |
| (2) | Investment, or a portion of investment, is out on loan for securities lending. |
| (3) | Non-income producing; issuer has not declared a dividend within the past twelve months. |
| (4) | The rate shown is the annualized seven-day effective yield as of April 30, 2012. |
| (5) | The Fund may loan securities representing up to one third of the fair value of its total assets (which includes collateral for securities on loan) to broker dealers, banks, and other institutions. The Fund maintains collateral equal to at least 102% of the fair value of the securities loaned. The cash collateral received by the Fund is invested in this money market fund. See Notes to Financial Statements, Footnote 1 – General Information and Significant Accounting Policies, Securities Lending for more information. |
| Nuveen Investments | 23 |
Portfolio of Investments (Unaudited)
Nuveen Small Cap Select Fund
April 30, 2012
| Shares | Description (1) | Value | ||||||||||||
| COMMON STOCKS – 98.6% |
||||||||||||||
| Consumer Discretionary – 14.1% |
||||||||||||||
| 106,940 | Ann Inc., (2), (3) |
$ | 2,961,169 | |||||||||||
| 232,163 | Ascena Retail Group Inc., (2), (3) |
4,754,698 | ||||||||||||
| 243,425 | Bravo Brio Restaurant Group, (2), (3) |
4,917,185 | ||||||||||||
| 305,089 | Brunswick Corporation, (2) |
8,020,790 | ||||||||||||
| 64,585 | Coinstar Inc., (2), (3) |
4,055,292 | ||||||||||||
| 74,413 | Columbia Sportswear Company, (2) |
3,504,852 | ||||||||||||
| 87,951 | G III Apparel Group, Limited, (2), (3) |
2,361,484 | ||||||||||||
| 224,508 | Gaylord Entertainment Company, (2) |
7,067,512 | ||||||||||||
| 148,456 | Life Time Fitness Inc., (2), (3) |
6,912,111 | ||||||||||||
| 15,349 | Panera Bread Company, Class A, (3) |
2,423,914 | ||||||||||||
| 99,942 | Pool Corporation, (2) |
3,688,859 | ||||||||||||
| 247,641 | ReachLocal Inc., (2), (3) |
1,872,166 | ||||||||||||
| 700,213 | Ruby Tuesday, Inc., (2) |
4,761,448 | ||||||||||||
| 327,239 | Texas Roadhouse, Inc., (2) |
5,644,873 | ||||||||||||
| 68,051 | Warnaco Group, Inc., (2) |
3,603,981 | ||||||||||||
| 71,416 | Zumiez, Inc., (2) |
2,618,111 | ||||||||||||
| Total Consumer Discretionary |
69,168,445 | |||||||||||||
| Consumer Staples – 3.7% |
||||||||||||||
| 119,118 | Hain Celestial Group Inc., (2), (3) |
5,634,281 | ||||||||||||
| 1,146,114 | Smart Balance Inc., (2), (3) |
6,762,073 | ||||||||||||
| 89,699 | The Chef’s Warehouse Inc. |
2,168,922 | ||||||||||||
| 58,104 | Treehouse Foods Inc., (2), (3) |
3,341,561 | ||||||||||||
| Total Consumer Staples |
17,906,837 | |||||||||||||
| Energy – 6.7% |
||||||||||||||
| 131,763 | Atwood Oceanics Inc. |
5,841,054 | ||||||||||||
| 166,264 | Carrizo Oil & Gas, Inc., (2), (3) |
4,662,043 | ||||||||||||
| 187,730 | Energy XXI Limited Bermuda, (2), (3) |
7,073,666 | ||||||||||||
| 391,715 | Goodrich Petroleum Corporation, (2), (3) |
6,569,061 | ||||||||||||
| 317,225 | Key Energy Services Inc., (2) |
4,016,069 | ||||||||||||
| 941,086 | Parker Drilling Company, (2), (3) |
4,865,415 | ||||||||||||
| Total Energy |
33,027,308 | |||||||||||||
| Financials – 20.4% |
||||||||||||||
| 486,424 | Associated Banc-Corp. |
6,484,032 | ||||||||||||
| 120,456 | Bank of the Ozarks, Inc., (2) |
3,722,090 | ||||||||||||
| 511,481 | Calamos Asset Management, Inc. Class A |
6,608,335 | ||||||||||||
| 324,302 | Cardinal Financial Corporation, (2) |
3,914,325 | ||||||||||||
| 104,535 | EastGroup Properties Inc. – REIT, (2) |
5,258,111 | ||||||||||||
| 241,720 | Evercore Partners Inc., Class A |
6,388,660 | ||||||||||||
| 138,620 | Home Bancshares, Inc. |
4,039,387 | ||||||||||||
| 329,663 | Invesco Mortgage Capital Inc. – REIT, (2) |
5,815,255 | ||||||||||||
| 296,518 | Knight Trading Group Inc., Class A, (2) |
3,896,247 | ||||||||||||
| 578,222 | Maiden Holdings, Ltd |
4,799,243 | ||||||||||||
| 333,765 | MFA Mortgage Investments, Inc. – REIT |
2,463,186 | ||||||||||||
| 285,577 | MGIC Investment Corporation, (2), (3) |
988,096 | ||||||||||||
| 24 | Nuveen Investments |
| Shares | Description (1) | Value | ||||||||||||
| Financials (continued) |
||||||||||||||
| 236,193 | National Retail Properties, Inc. – REIT, (2) |
$ | 6,466,964 | |||||||||||
| 180,695 | Platinum Underwriters Holdings Limited, (2) |
6,617,051 | ||||||||||||
| 80,716 | PS Business Parks Inc. – REIT, (2) |
5,508,867 | ||||||||||||
| 139,797 | Stifel Financial Corporation, (2) |
5,091,407 | ||||||||||||
| 213,766 | Terreno Realty Corporation – REIT, (2) |
3,056,854 | ||||||||||||
| 778,832 | Umpqua Holdings Corporation, (2) |
10,311,736 | ||||||||||||
| 271,658 | Waddell & Reed Financial, Inc., Class A, (2) |
8,687,623 | ||||||||||||
| Total Financials |
100,117,469 | |||||||||||||
| Health Care – 12.9% |
||||||||||||||
| 173,272 | Align Technology, Inc., (2), (3) |
5,494,455 | ||||||||||||
| 39,808 | Alkermes Inc., (2), (3) |
688,678 | ||||||||||||
| 71,251 | Ariad Pharmaceuticals, Inc., (2), (3) |
1,161,391 | ||||||||||||
| 333,896 | Cadence Pharmaceuticals, Inc., (2), (3) |
1,232,076 | ||||||||||||
| 26,410 | Cepheid, Inc., (2), (3) |
1,014,408 | ||||||||||||
| 25,694 | Cubist Pharmaceuticals Inc., (2) |
1,086,342 | ||||||||||||
| 179,868 | Endologix, Inc., (2), (3) |
2,694,423 | ||||||||||||
| 189,156 | HealthSouth Corporation, (2) |
4,235,203 | ||||||||||||
| 53,434 | ICU Medical, Inc., (2), (3) |
2,804,751 | ||||||||||||
| 36,421 | Immunogen, Inc., (2), (3) |
464,368 | ||||||||||||
| 35,817 | Incyte Pharmaceuticals Inc., (2), (3) |
812,330 | ||||||||||||
| 148,041 | Integra Lifesciences Holdings Corporation, (2) |
5,511,566 | ||||||||||||
| 86,215 | Mednax Inc., (2), (3) |
6,055,742 | ||||||||||||
| 13,176 | Medivation, Inc., (2), (3) |
1,065,675 | ||||||||||||
| 447,276 | Merit Medical Systems, Inc., (2) |
5,912,989 | ||||||||||||
| 26,271 | Onyx Pharmaceuticals Inc., (2) |
1,195,593 | ||||||||||||
| 97,147 | Salix Pharmaceuticals Limited, (2), (3) |
4,799,062 | ||||||||||||
| 43,198 | Seattle Genetics, Inc., (2) |
854,024 | ||||||||||||
| 115,218 | Sirona Dental Systems, Inc., (3) |
5,819,661 | ||||||||||||
| 71,202 | Theravance Inc., (2), (3) |
1,540,811 | ||||||||||||
| 156,499 | Thoratec Corporation |
5,447,730 | ||||||||||||
| 138,914 | U.S. Physical Therapy, Inc. |
3,386,723 | ||||||||||||
| Total Health Care |
63,278,001 | |||||||||||||
| Industrials – 17.0% |
||||||||||||||
| 175,254 | Actuant Corporation, Class A, (2) |
4,779,177 | ||||||||||||
| 90,286 | Acuity Brands Inc., (2) |
5,017,193 | ||||||||||||
| 100,131 | Allegiant Travel Company, (2), (3) |
5,883,698 | ||||||||||||
| 362,088 | Altra Industrial Motion, Inc., (2), (3) |
6,618,969 | ||||||||||||
| 570,319 | CBIZ Inc., (2), (3) |
3,461,836 | ||||||||||||
| 189,554 | Con-Way, Inc. |
6,160,505 | ||||||||||||
| 175,615 | ESCO Technologies Inc., (2) |
6,041,156 | ||||||||||||
| 219,645 | General Cable Corporation |
6,466,349 | ||||||||||||
| 379,659 | MasTec Inc., (2), (3) |
6,602,270 | ||||||||||||
| 271,803 | MYR Group Inc., (2), (3) |
4,544,546 | ||||||||||||
| 561,887 | Orbital Sciences Corporation, (2), (3) |
7,057,301 | ||||||||||||
| 77,065 | Regal-Beloit Corporation |
5,212,677 | ||||||||||||
| Nuveen Investments | 25 |
Portfolio of Investments (Unaudited)
Nuveen Small Cap Select Fund (continued)
April 30, 2012
| Shares | Description (1) | Value | ||||||||||||
| Industrials (continued) |
||||||||||||||
| 110,326 | Robbins & Myers, Inc. |
$ | 5,373,979 | |||||||||||
| 162,224 | Sykes Enterprises Inc., (2) |
2,571,250 | ||||||||||||
| 300,043 | TrueBlue Inc., (2), (3) |
5,178,742 | ||||||||||||
| 59,099 | United Rentals Inc., (2), (3) |
2,758,741 | ||||||||||||
| Total Industrials |
83,728,389 | |||||||||||||
| Information Technology – 16.5% |
||||||||||||||
| 82,409 | ADTRAN, Inc., (2) |
2,515,123 | ||||||||||||
| 979,793 | Brocade Communications Systems Inc., (3) |
5,428,053 | ||||||||||||
| 86,603 | Cavium Networks Inc., (2), (3) |
2,534,004 | ||||||||||||
| 36,365 | CommVault Systems, Inc., (2), (3) |
1,893,526 | ||||||||||||
| 378,300 | Euronet Worldwide, Inc., (2) |
8,182,629 | ||||||||||||
| 245,058 | Finisar Corporation, (2), (3) |
4,048,358 | ||||||||||||
| 54,928 | Global Payments Inc. |
2,550,307 | ||||||||||||
| 1,173,518 | Integrated Device Technology, Inc., (2), (3) |
7,944,717 | ||||||||||||
| 355,548 | International Rectifier Corporation, (3) |
7,761,613 | ||||||||||||
| 289,660 | Keynote Systems, Inc. |
5,329,744 | ||||||||||||
| 505,475 | Newport Corporation, (2) |
8,628,458 | ||||||||||||
| 380,869 | Polycom Inc., (2), (3) |
5,054,132 | ||||||||||||
| 288,150 | Progress Software Corporation, (2) |
6,667,791 | ||||||||||||
| 341,001 | RF Micro Devices, Inc., (2) |
1,476,534 | ||||||||||||
| 138,702 | Semtech Corporation, (2) |
3,781,017 | ||||||||||||
| 1,187,788 | Smith Micro Software, Inc. |
2,387,454 | ||||||||||||
| 371,176 | Vocus, Inc., (2), (3) |
4,799,306 | ||||||||||||
| Total Information Technology |
80,982,766 | |||||||||||||
| Materials – 5.2% |
||||||||||||||
| 154,189 | Buckeye Technologies Inc., (2) |
4,997,265 | ||||||||||||
| 187,964 | Kraton Performance Polymers Inc., (2), (3) |
4,887,064 | ||||||||||||
| 86,310 | Minerals Technologies Inc., (2) |
5,791,401 | ||||||||||||
| 78,886 | Rock-Tenn Company |
4,916,964 | ||||||||||||
| 124,639 | Schnitzer Steel Industries, Inc., (2) |
4,969,354 | ||||||||||||
| Total Materials |
25,562,048 | |||||||||||||
| Telecommunication Services – 1.1% |
||||||||||||||
| 842,800 | Cbeyond Inc. |
5,419,204 | ||||||||||||
| Utilities – 1.0% |
||||||||||||||
| 154,736 | Atmos Energy Corporation |
5,041,299 | ||||||||||||
| Total Common Stocks (cost $433,369,514) |
484,231,766 | |||||||||||||
| Shares | Description (1) | Value | ||||||||||||
| INVESTMENTS PURCHASED WITH COLLATERAL FROM SECURITIES LENDING – 48.1% |
||||||||||||||
| Money Market Funds – 48.1% |
||||||||||||||
| 236,418,881 | Mount Vernon Securities Lending Prim Portfolio, 0.276%, (4), (5) |
$ | 236,418,881 | |||||||||||
| Total Investments Purchased with Collateral from Securities Lending (cost $236,418,881) |
236,418,881 | |||||||||||||
| 26 | Nuveen Investments |
| Shares | Description (1) | Value | ||||||||||||
| SHORT-TERM INVESTMENTS – 2.1% |
||||||||||||||
| Money Market Funds – 2.1% |
||||||||||||||
| 10,414,426 | First American Treasury Obligations Fund, Class Z, 0.000%, (4) |
$ | 10,414,426 | |||||||||||
| Total Short-Term Investments (cost $10,414,426) |
10,414,426 | |||||||||||||
| Total Investments (cost $680,202,821) – 148.8% |
731,065,073 | |||||||||||||
| Other Assets Less Liabilities – (48.8)% |
(239,791,012) | |||||||||||||
| Net Assets – 100% |
$ | 491,274,061 | ||||||||||||
| For Fund portfolio compliance purposes, the Fund’s industry classifications refer to any one or more of the industry sub-classifications used by one or more widely recognized market indexes or ratings group indexes, and/or as defined by Fund management. This definition may not apply for purposes of this report which may combine industry sub-classifications into sectors for reporting ease. |
| (1) | All percentages shown in the Portfolio of Investments are based on net assets. |
| (2) | Investment, or a portion of investment, is out on loan for securities lending. |
| (3) | Non-income producing; issuer has not declared a dividend within the past twelve months. |
| (4) | The rate shown is the annualized seven-day effective yield as of April 30, 2012. |
| (5) | The Fund may loan securities representing up to one third of the fair value of its total assets (which includes collateral for securities on loan) to broker dealers, banks, and other institutions. The Fund maintains collateral equal to at least 102% of the fair value of the securities loaned. The cash collateral received by the Fund is invested in this money market fund. See Notes to Financial Statements, Footnote 1 – General Information and Significant Accounting Policies, Securities Lending for more information. |
| REIT | Real Estate Investment Trust |
| Nuveen Investments | 27 |
Statement of Assets & Liabilities (Unaudited)
April 30, 2012
| Large Cap Select |
Mid Cap Select |
Small Cap Select |
||||||||||
| Assets |
||||||||||||
| Investments, at value (cost $40,338,163, $26,758,220 and $443,783,940, respectively) |
$ | 45,193,131 | $ | 29,353,479 | $ | 494,646,192 | ||||||
| Investment purchased with collateral from securities lending (at cost, which approximates value) |
12,566,136 | 8,043,707 | 236,418,881 | |||||||||
| Cash |
— | — | 436,779 | |||||||||
| Receivables: |
||||||||||||
| Dividends |
18,069 | 10,360 | 202,043 | |||||||||
| Due from broker |
1,832 | 1,300 | 44,242 | |||||||||
| Investments sold |
847,080 | 1,155,704 | 3,587,462 | |||||||||
| Shares sold |
295 | 1,200 | 402,811 | |||||||||
| Other assets |
158 | 54 | 6,075 | |||||||||
| Total assets |
58,626,701 | 38,565,804 | 735,744,485 | |||||||||
| Liabilities |
||||||||||||
| Payables: |
||||||||||||
| Collateral from securities lending program |
12,566,136 | 8,043,707 | 236,418,881 | |||||||||
| Investments purchased |
1,083,042 | 1,052,592 | 5,158,984 | |||||||||
| Shares redeemed |
44,100 | 551,098 | 2,055,184 | |||||||||
| Accrued expenses: |
||||||||||||
| Management fees |
27,908 | 11,572 | 316,352 | |||||||||
| 12b-1 distribution and service fees |
846 | 3,857 | 55,501 | |||||||||
| Other |
17,822 | 55,815 | 465,522 | |||||||||
| Total liabilities |
13,739,854 | 9,718,641 | 244,470,424 | |||||||||
| Net assets |
$ | 44,886,847 | $ | 28,847,163 | $ | 491,274,061 | ||||||
| Class A Shares |
||||||||||||
| Net assets |
$ | 3,208,497 | $ | 11,969,461 | $ | 168,958,083 | ||||||
| Shares outstanding |
237,747 | 1,128,371 | 12,278,863 | |||||||||
| Net asset value per share |
$ | 13.50 | $ | 10.61 | $ | 13.76 | ||||||
| Offering price per share (net asset value per share plus maximum sales charge of 5.75% of offering price) |
$ | 14.32 | $ | 11.26 | $ | 14.60 | ||||||
| Class B Shares |
||||||||||||
| Net assets |
N/A | N/A | $ | 2,561,508 | ||||||||
| Shares outstanding |
N/A | N/A | 239,511 | |||||||||
| Net asset value and offering price per share |
N/A | N/A | $ | 10.69 | ||||||||
| Class C Shares |
||||||||||||
| Net assets |
$ | 183,616 | $ | 1,789,937 | $ | 12,510,232 | ||||||
| Shares outstanding |
14,286 | 184,464 | 1,014,639 | |||||||||
| Net asset value and offering price per share |
$ | 12.85 | $ | 9.70 | $ | 12.33 | ||||||
| Class R3 Shares |
||||||||||||
| Net assets |
$ | 99,972 | N/A | $ | 19,745,821 | |||||||
| Shares outstanding |
7,505 | N/A | 1,473,997 | |||||||||
| Net asset value and offering price per share |
$ | 13.32 | N/A | $ | 13.40 | |||||||
| Class I Shares |
||||||||||||
| Net assets |
$ | 41,394,762 | $ | 15,087,765 | $ | 287,498,417 | ||||||
| Shares outstanding |
3,047,806 | 1,358,489 | 19,123,549 | |||||||||
| Net asset value and offering price per share |
$ | 13.58 | $ | 11.11 | $ | 15.03 | ||||||
| Net assets consist of: |
||||||||||||
| Capital paid-in |
$ | 111,942,193 | $ | 46,779,519 | $ | 388,408,142 | ||||||
| Undistributed (Over-distribution of) net investment income |
15,660 | 22,414 | (1,160,048 | ) | ||||||||
| Accumulated net realized gain (loss) |
(71,925,974 | ) | (20,550,029 | ) | 53,163,715 | |||||||
| Net unrealized appreciation (depreciation) |
4,854,968 | 2,595,259 | 50,862,252 | |||||||||
| Net assets |
$ | 44,886,847 | $ | 28,847,163 | $ | 491,274,061 | ||||||
| Authorized shares |
2 billion | 2 billion | 2 billion | |||||||||
| Par value per share |
$ | 0.0001 | $ | 0.0001 | $ | 0.0001 | ||||||
| N/A - | Large Cap Select does not offer Class B Shares and Mid Cap Select does not offer Class R3 Shares. Class B Shares of Mid Cap Select converted to Class A Shares at the close of business on February 15, 2012 and are no longer available for dividend reinvestment or through an exchange from other Nuveen mutual funds. |
See accompanying notes to financial statements.
| 28 | Nuveen Investments |
Statement of Operations (Unaudited)
Six Months Ended April 30, 2012
| Large Cap Select |
Mid Cap Select |
Small Cap Select |
||||||||||
| Investment Income |
||||||||||||
| Dividend and interest income (net of foreign tax withheld of $429, $288 and $–, respectively) |
$ | 383,688 | $ | 208,438 | $ | 1,889,708 | ||||||
| Securities lending income |
11,346 | 15,294 | 399,955 | |||||||||
| Total investment income |
395,034 | 223,732 | 2,289,663 | |||||||||
| Expenses |
||||||||||||
| Management fees |
181,346 | 129,171 | 2,535,998 | |||||||||
| 12b-1 service fees – Class A |
3,688 | 16,143 | 321,232 | |||||||||
| 12b-1 distribution and service fees – Class B |
N/A | N/A | 13,800 | |||||||||
| 12b-1 distribution and service fees – Class C |
913 | 8,801 | 66,947 | |||||||||
| 12b-1 distribution and service fees – Class R3 |
280 | N/A | 49,084 | |||||||||
| Shareholders’ servicing agent fees and expenses |
72,669 | 73,222 | 477,163 | |||||||||
| Custodian’s fees and expenses |
19,697 | 8,829 | 54,342 | |||||||||
| Directors’ fees and expenses |
797 | 562 | 8,057 | |||||||||
| Professional fees |
3,213 | 1,594 | 22,304 | |||||||||
| Shareholders’ reports – printing and mailing expenses |
1,047 | 3,283 | 64,312 | |||||||||
| Federal and state registration fees |
25,620 | 22,115 | 37,412 | |||||||||
| Other expenses |
10,157 | 9,767 | 17,082 | |||||||||
| Total expenses before expense reimbursement |
319,427 | 273,487 | 3,667,733 | |||||||||
| Expense reimbursement |
(37 | ) | (82,250 | ) | (232,695 | ) | ||||||
| Net expenses |
319,390 | 191,237 | 3,435,038 | |||||||||
| Net investment income (loss) |
75,644 | 32,495 | (1,145,375 | ) | ||||||||
| Realized and Unrealized Gain (Loss) |
||||||||||||
| Net realized gain (loss) from: |
||||||||||||
| Investments |
4,482,750 | 2,984,949 | 54,574,347 | |||||||||
| Futures contracts |
— | — | 1,762,906 | |||||||||
| Change in net unrealized appreciation (depreciation) of investments |
1,983,750 | 199,036 | 24,566,721 | |||||||||
| Net realized and unrealized gain (loss) |
6,466,500 | 3,183,985 | 80,903,974 | |||||||||
| Net increase (decrease) in net assets from operations |
$ | 6,542,144 | $ | 3,216,480 | $ | 79,758,599 | ||||||
| N/A - | Large Cap Select does not offer Class B Shares and Mid Cap Select does not offer Class R3 Shares. Class B Shares of Mid Cap Select converted to Class A Shares at the close of business on February 15, 2012 and are no longer available for dividend reinvestment or through an exchange from other Nuveen mutual funds. |
See accompanying notes to financial statements.
| Nuveen Investments | 29 |
Statement of Changes in Net Assets (Unaudited)
| Large Cap Select | Mid Cap Select | Small Cap Select | ||||||||||||||||||||||
| Year Ended 4/30/12 |
Year Ended 10/31/11 |
Year Ended 4/30/12 |
Year Ended 10/31/11 |
Year Ended 4/30/12 |
Year Ended 10/31/11 |
|||||||||||||||||||
| Operations |
||||||||||||||||||||||||
| Net investment income (loss) |
$ | 75,644 | $ | 58,871 | $ | 32,495 | $ | (148,459 | ) | $ | (1,145,375 | ) | $ | (4,233,152 | ) | |||||||||
| Net realized gain (loss) from: |
||||||||||||||||||||||||
| Investments |
4,482,750 | 17,580,711 | 2,984,949 | 3,660,893 | 54,574,347 | 112,701,639 | ||||||||||||||||||
| Futures contracts |
— | — | — | 253,183 | 1,762,906 | — | ||||||||||||||||||
| Redemptions in-kind |
— | 3,119,565 | — | — | — | 14,572,758 | ||||||||||||||||||
| Change in net unrealized appreciation (depreciation) of investments |
1,983,750 | (16,096,080 | ) | 199,036 | (2,658,745 | ) | 24,566,721 | (67,223,592 | ) | |||||||||||||||
| Net increase (decrease) in net assets from operations |
6,542,144 | 4,663,067 | 3,216,480 | 1,106,872 | 79,758,599 | 55,817,653 | ||||||||||||||||||
| Distributions to Shareholders |
||||||||||||||||||||||||
| From net investment income: |
||||||||||||||||||||||||
| Class A |
— | — | — | — | — | — | ||||||||||||||||||
| Class B |
N/A | N/A | N/A | — | — | — | ||||||||||||||||||
| Class C |
— | — | — | — | — | — | ||||||||||||||||||
| Class R3(1) |
— | — | N/A | N/A | — | — | ||||||||||||||||||
| Class I(1) |
(49,038 | ) | (150,204 | ) | — | — | — | — | ||||||||||||||||
| From accumulated net realized gains: |
||||||||||||||||||||||||
| Class A |
— | — | — | — | (6,635,048 | ) | — | |||||||||||||||||
| Class B |
N/A | N/A | N/A | — | (85,210 | ) | — | |||||||||||||||||
| Class C |
— | — | — | — | (355,957 | ) | — | |||||||||||||||||
| Class R3(1) |
— | — | N/A | N/A | (488,508 | ) | — | |||||||||||||||||
| Class I(1) |
— | — | — | — | (5,892,281 | ) | — | |||||||||||||||||
| Decrease in net assets from distributions to shareholders |
(49,038 | ) | (150,204 | ) | — | — | (13,457,004 | ) | — | |||||||||||||||
| Fund Share Transactions |
||||||||||||||||||||||||
| Proceeds from sale of shares |
2,340,856 | 4,582,330 | 1,634,113 | 2,536,394 | 71,159,220 | 188,172,315 | ||||||||||||||||||
| Proceeds from shares issued to shareholders due to reinvestment of distributions |
22,258 | 73,066 | — | — | 12,262,794 | — | ||||||||||||||||||
| 2,363,114 | 4,655,396 | 1,634,113 | 2,536,394 | 83,422,014 | 188,172,315 | |||||||||||||||||||
| Cost of shares redeemed |
(25,516,323 | ) | (66,857,732 | ) | (6,054,206 | ) | (12,697,979 | ) | (245,345,699 | ) | (386,973,091 | ) | ||||||||||||
| Cost of redemptions in-kind |
— | (15,345,963 | ) | — | — | — | (49,354,066 | ) | ||||||||||||||||
| Net increase (decrease) in net assets from Fund share transactions |
(23,153,209 | ) | (77,548,299 | ) | (4,420,093 | ) | (10,161,585 | ) | (161,923,685 | ) | (248,154,842 | ) | ||||||||||||
| Net increase (decrease) in net assets |
(16,660,103 | ) | (73,035,436 | ) | (1,203,613 | ) | (9,054,713 | ) | (95,622,090 | ) | (192,337,189 | ) | ||||||||||||
| Net assets at the beginning of period |
61,546,950 | 134,582,386 | 30,050,776 | 39,105,489 | 586,896,151 | 779,233,340 | ||||||||||||||||||
| Net assets at the end of period |
$ | 44,886,847 | $ | 61,546,950 | $ | 28,847,163 | $ | 30,050,776 | $ | 491,274,061 | $ | 586,896,151 | ||||||||||||
| Undistributed (Over-distribution of) net investment income at the end of period |
$ | 15,660 | $ | (10,946 | ) | $ | 22,414 | $ | (10,081 | ) | $ | (1,160,048 | ) | $ | (14,674 | ) | ||||||||
| N/A - | Large Cap Select does not offer Class B Shares and Mid Cap Select does not offer Class R3 Shares. Class B Shares of MidCap Select converted to Class A Shares at the close of business on February 15, 2012 and are no longer available for dividend reinvestment or through an exchange from other Nuveen mutual funds. |
| (1) - | Effective January 18, 2011, Class R Shares and Class Y Shares previously offered by FAF Advisors, Inc. were renamed Class R3 Shares and Class I Shares, respectively. |
See accompanying notes to financial statements.
| 30 | Nuveen Investments |
Financial Highlights (Unaudited)
| Nuveen Investments | 31 |
Financial Highlights (Unaudited)
| Selected data for a share outstanding throughout each period: | ||||||||||||||||||||||||||||||||
| Class (Commencement Date) | ||||||||||||||||||||||||||||||||
| Investment Operations | Less Distributions | |||||||||||||||||||||||||||||||
| LARGE CAP SELECT | ||||||||||||||||||||||||||||||||
| Year Ended October 31, |
Beginning Net Asset Value |
Net Invest- ment Income (Loss)(a) |
Net Realized/ Unrealized Gain (Loss) |
Total | Net Invest- ment Income |
Capital Gains(b) |
Total | Ending Net Asset Value |
||||||||||||||||||||||||
| Class A (1/03) |
|
|||||||||||||||||||||||||||||||
| 2012(f) |
$ | 11.73 | $ | — | * | $ | 1.77 | $ | 1.77 | $ | — | $ | — | $ | — | $ | 13.50 | |||||||||||||||
| 2011 |
11.65 | (.02 | ) | .10 | .08 | — | — | — | 11.73 | |||||||||||||||||||||||
| 2010 |
9.80 | (.01 | ) | 1.92 | 1.91 | (.06 | ) | — | (.06 | ) | 11.65 | |||||||||||||||||||||
| 2009 |
8.83 | .04 | .97 | 1.01 | (.04 | ) | — | (.04 | ) | 9.80 | ||||||||||||||||||||||
| 2008 |
17.05 | .06 | (6.04 | ) | (5.98 | ) | (.04 | ) | (2.20 | ) | (2.24 | ) | 8.83 | |||||||||||||||||||
| 2007 |
15.18 | .03 | 2.12 | 2.15 | (.03 | ) | (.25 | ) | (.28 | ) | 17.05 | |||||||||||||||||||||
| Class C (1/03) |
|
|||||||||||||||||||||||||||||||
| 2012(f) |
11.21 | (.04 | ) | 1.68 | 1.64 | — | — | — | 12.85 | |||||||||||||||||||||||
| 2011 |
11.22 | (.11 | ) | .10 | (.01 | ) | — | — | — | 11.21 | ||||||||||||||||||||||
| 2010 |
9.46 | (.08 | ) | 1.84 | 1.76 | — | — | — | 11.22 | |||||||||||||||||||||||
| 2009 |
8.56 | (.02 | ) | .93 | .91 | (.01 | ) | — | (.01 | ) | 9.46 | |||||||||||||||||||||
| 2008 |
16.69 | (.03 | ) | (5.90 | ) | (5.93 | ) | — | (2.20 | ) | (2.20 | ) | 8.56 | |||||||||||||||||||
| 2007 |
14.95 | (.09 | ) | 2.08 | 1.99 | — | (.25 | ) | (.25 | ) | 16.69 | |||||||||||||||||||||
| Class R3 (1/03)(e) |
|
|||||||||||||||||||||||||||||||
| 2012(f) |
11.59 | (.01 | ) | 1.74 | 1.73 | — | — | — | 13.32 | |||||||||||||||||||||||
| 2011 |
11.54 | (.05 | ) | .10 | .05 | — | — | — | 11.59 | |||||||||||||||||||||||
| 2010 |
9.74 | (.03 | ) | 1.89 | 1.86 | (.06 | ) | — | (.06 | ) | 11.54 | |||||||||||||||||||||
| 2009 |
8.78 | .01 | .98 | .99 | (.03 | ) | — | (.03 | ) | 9.74 | ||||||||||||||||||||||
| 2008 |
16.97 | .03 | (6.00 | ) | (5.97 | ) | (.02 | ) | (2.20 | ) | (2.22 | ) | 8.78 | |||||||||||||||||||
| 2007 |
15.12 | — | * | 2.11 | 2.11 | (.01 | ) | (.25 | ) | (.26 | ) | 16.97 | ||||||||||||||||||||
| Class I (1/03)(e) |
|
|||||||||||||||||||||||||||||||
| 2012(f) |
11.80 | .02 | 1.77 | 1.79 | (.01 | ) | — | (.01 | ) | 13.58 | ||||||||||||||||||||||
| 2011 |
11.71 | .01 | .10 | .11 | (.02 | ) | — | (.02 | ) | 11.80 | ||||||||||||||||||||||
| 2010 |
9.85 | .02 | 1.92 | 1.94 | (.08 | ) | — | (.08 | ) | 11.71 | ||||||||||||||||||||||
| 2009 |
8.87 | .07 | .96 | 1.03 | (.05 | ) | — | (.05 | ) | 9.85 | ||||||||||||||||||||||
| 2008 |
17.10 | .09 | (6.05 | ) | (5.96 | ) | (.07 | ) | (2.20 | ) | (2.27 | ) | 8.87 | |||||||||||||||||||
| 2007 |
15.22 | .07 | 2.13 | 2.20 | (.07 | ) | (.25 | ) | (.32 | ) | 17.10 | |||||||||||||||||||||
| 32 | Nuveen Investments |
| Ratios/Supplemental Data | ||||||||||||||||||||||||||
| Ratios to Average Net Assets Before Reimbursement |
Ratios to Average Net Assets After Reimbursement(d) |
|||||||||||||||||||||||||
| Total Return(c) |
Ending Net Assets (000) |
Expenses | Net Invest- ment Income (Loss) |
Expenses | Net Invest- ment Income (Loss) |
Portfolio Turnover Rate |
||||||||||||||||||||
| 15.09 | % | $ | 3,208 | 1.55 | %** | .03 | %** | 1.55 | %** | .03 | %** | 67 | % | |||||||||||||
| .69 | 2,938 | 1.20 | (.18 | ) | 1.20 | (.18 | ) | 139 | ||||||||||||||||||
| 19.49 | 3,487 | 1.32 | (.06 | ) | 1.32 | (.06 | ) | 140 | ||||||||||||||||||
| 11.54 | 3,292 | 1.29 | .52 | 1.29 | .52 | 185 | ||||||||||||||||||||
| (39.81 | ) | 3,608 | 1.21 | .49 | 1.21 | .49 | 210 | |||||||||||||||||||
| 14.36 | 7,998 | 1.19 | .20 | 1.19 | .20 | 138 | ||||||||||||||||||||
| 14.63 | 184 | 2.30 | ** | (.71 | )** | 2.30 | ** | (.71 | )** | 67 | ||||||||||||||||
| (.09 | ) | 183 | 1.95 | (.90 | ) | 1.95 | (.90 | ) | 139 | |||||||||||||||||
| 18.60 | 175 | 2.07 | (.79 | ) | 2.07 | (.79 | ) | 140 | ||||||||||||||||||
| 10.64 | 186 | 2.05 | (.23 | ) | 2.05 | (.23 | ) | 185 | ||||||||||||||||||
| (40.38 | ) | 180 | 1.96 | (.26 | ) | 1.96 | (.26 | ) | 210 | |||||||||||||||||
| 13.45 | 325 | 1.94 | (.57 | ) | 1.94 | (.57 | ) | 138 | ||||||||||||||||||
| 14.93 | 100 | 1.80 | ** | (.19 | )** | 1.80 | ** | (.19 | )** | 67 | ||||||||||||||||
| .43 | 112 | 1.45 | (.42 | ) | 1.45 | (.42 | ) | 139 | ||||||||||||||||||
| 19.11 | 117 | 1.58 | (.32 | ) | 1.58 | (.32 | ) | 140 | ||||||||||||||||||
| 11.31 | 66 | 1.56 | .12 | 1.56 | .12 | 185 | ||||||||||||||||||||
| (39.94 | ) | 20 | 1.46 | .24 | 1.46 | .24 | 210 | |||||||||||||||||||
| 14.09 | 37 | 1.44 | .02 | 1.44 | .02 | 138 | ||||||||||||||||||||
| 15.21 | 41,395 | 1.30 | ** | .34 | ** | 1.30 | ** | .34 | ** | 67 | ||||||||||||||||
| .89 | 58,314 | .95 | .07 | .95 | .07 | 139 | ||||||||||||||||||||
| 19.75 | 130,803 | 1.07 | .21 | 1.07 | .21 | 140 | ||||||||||||||||||||
| 11.81 | 147,231 | 1.04 | .82 | 1.04 | .82 | 185 | ||||||||||||||||||||
| (39.63 | ) | 207,904 | .96 | .74 | .96 | .74 | 210 | |||||||||||||||||||
| 14.65 | 449,201 | .94 | .45 | .94 | .45 | 138 | ||||||||||||||||||||
| (a) | Per share Net Investment Income (Loss) is calculated using the average daily shares method. |
| (b) | Distributions from Capital Gains include short-term capital gains, if any. |
| (c) | Total return is the combination of changes in net asset value without any sales charge, reinvested dividend income at net asset value and reinvested capital gains distributions at net asset value, if any. Total returns are not annualized. |
| (d) | After expense reimbursement from the Adviser, where applicable. |
| (e) | Effective January 18, 2011, Class R Shares and Class Y Shares previously offered by FAF Advisors, Inc. were renamed Class R3 Shares and Class I Shares, respectively. |
| (f) | For the six month ended April 30, 2012. |
| * | Rounds to less than $.01 per share. |
| ** | Annualized. |
See accompanying notes to financial statements.
| Nuveen Investments | 33 |
Financial Highlights (Unaudited) (continued)
| Selected data for a share outstanding throughout each period: | ||||||||||||||||||||||||||||||||
| Class (Commencement Date) | ||||||||||||||||||||||||||||||||
| Investment Operations | Less Distributions | |||||||||||||||||||||||||||||||
| MID CAP SELECT (g) | ||||||||||||||||||||||||||||||||
| Year Ended October 31, |
Beginning Net Asset Value |
Net Invest- ment Income (Loss)(a) |
Net Realized/ Unrealized Gain (Loss) |
Total | Net Invest- ment Income |
Capital Gains(b) |
Total | Ending Net Asset Value |
||||||||||||||||||||||||
| Class A (4/94) |
|
|||||||||||||||||||||||||||||||
| 2012(f) |
$ | 9.48 | $ | .01 | $ | 1.12 | $ | 1.13 | $ | — | $ | — | $ | — | $ | 10.61 | ||||||||||||||||
| 2011 |
9.31 | (.05 | ) | .22 | .17 | — | — | — | 9.48 | |||||||||||||||||||||||
| 2010 |
7.65 | (.02 | ) | 1.70 | 1.68 | (.02 | ) | — | (.02 | ) | 9.31 | |||||||||||||||||||||
| 2009 |
7.00 | .03 | .62 | .65 | — | — | — | 7.65 | ||||||||||||||||||||||||
| 2008 |
10.64 | (.01 | ) | (3.63 | ) | (3.64 | ) | — | — | — | 7.00 | |||||||||||||||||||||
| 2007 |
9.57 | (.02 | ) | 1.09 | 1.07 | — | — | — | 10.64 | |||||||||||||||||||||||
| Class C (2/00) |
|
|||||||||||||||||||||||||||||||
| 2012(f) |
8.70 | (.03 | ) | 1.03 | 1.00 | — | — | — | 9.70 | |||||||||||||||||||||||
| 2011 |
8.61 | (.11 | ) | .20 | .09 | — | — | — | 8.70 | |||||||||||||||||||||||
| 2010 |
7.12 | (.08 | ) | 1.57 | 1.49 | — | — | — | 8.61 | |||||||||||||||||||||||
| 2009 |
6.56 | (.01 | ) | .57 | .56 | — | — | — | 7.12 | |||||||||||||||||||||||
| 2008 |
10.04 | (.08 | ) | (3.40 | ) | (3.48 | ) | — | — | — | 6.56 | |||||||||||||||||||||
| 2007 |
9.09 | (.09 | ) | 1.04 | .95 | — | — | — | 10.04 | |||||||||||||||||||||||
| Class I (4/94)(e) |
|
|||||||||||||||||||||||||||||||
| 2012(f) |
9.91 | .02 | 1.18 | 1.20 | — | — | — | 11.11 | ||||||||||||||||||||||||
| 2011 |
9.71 | (.02 | ) | .22 | .20 | — | — | — | 9.91 | |||||||||||||||||||||||
| 2010 |
7.98 | — | * | 1.77 | 1.77 | (.04 | ) | — | (.04 | ) | 9.71 | |||||||||||||||||||||
| 2009 |
7.31 | .06 | .64 | .70 | (.03 | ) | — | (.03 | ) | 7.98 | ||||||||||||||||||||||
| 2008 |
11.09 | .01 | (3.79 | ) | (3.78 | ) | — | — | — | 7.31 | ||||||||||||||||||||||
| 2007 |
9.95 | — | * | 1.15 | 1.15 | (.01 | ) | — | (.01 | ) | 11.09 | |||||||||||||||||||||
| 34 | Nuveen Investments |
| Ratios/Supplemental Data | ||||||||||||||||||||||||||
| Ratios to Average Net Assets Before Reimbursement |
Ratios to Average Net Assets After Reimbursement(d) |
|||||||||||||||||||||||||
| Total Return(c) |
Ending Net Assets (000) |
Expenses | Net Invest- ment Income (Loss) |
Expenses | Net Invest- ment Income (Loss) |
Portfolio Turnover Rate |
||||||||||||||||||||
| 11.92 | % | $ | 11,969 | 1.98 | %** | (.45 | )%** | 1.41 | %** | .12 | %** | 125 | % | |||||||||||||
| 1.83 | 10,829 | 1.97 | (1.04 | ) | 1.41 | (.48 | ) | 148 | ||||||||||||||||||
| 22.03 | 12,402 | 1.98 | (.84 | ) | 1.41 | (.27 | ) | 154 | ||||||||||||||||||
| 9.32 | 12,487 | 1.92 | (.02 | ) | 1.41 | .49 | 186 | |||||||||||||||||||
| (34.21 | ) | 12,848 | 1.60 | (.32 | ) | 1.41 | (.13 | ) | 170 | |||||||||||||||||
| 11.18 | 21,817 | 1.49 | (.28 | ) | 1.41 | (.20 | ) | 151 | ||||||||||||||||||
| 11.49 | 1,790 | 2.73 | ** | (1.18 | )** | 2.16 | ** | (.60 | )** | 125 | ||||||||||||||||
| 1.05 | 1,771 | 2.71 | (1.78 | ) | 2.16 | (1.22 | ) | 148 | ||||||||||||||||||
| 20.93 | 2,332 | 2.73 | (1.60 | ) | 2.16 | (1.03 | ) | 154 | ||||||||||||||||||
| 8.54 | 2,526 | 2.67 | (.75 | ) | 2.16 | (.24 | ) | 186 | ||||||||||||||||||
| (34.66 | ) | 3,068 | 2.35 | (1.07 | ) | 2.16 | (.88 | ) | 170 | |||||||||||||||||
| 10.45 | 5,190 | 2.24 | (1.04 | ) | 2.16 | (.96 | ) | 151 | ||||||||||||||||||
| 12.11 | 15,088 | 1.73 | ** | (.17 | )** | 1.16 | ** | .40 | ** | 125 | ||||||||||||||||
| 2.06 | 16,646 | 1.71 | (.77 | ) | 1.16 | (.23 | ) | 148 | ||||||||||||||||||
| 22.26 | 23,076 | 1.73 | (.60 | ) | 1.16 | (.03 | ) | 154 | ||||||||||||||||||
| 9.62 | 27,030 | 1.67 | .30 | 1.16 | .81 | 186 | ||||||||||||||||||||
| (34.08 | ) | 40,409 | 1.35 | (.07 | ) | 1.16 | .12 | 170 | ||||||||||||||||||
| 11.62 | 79,574 | 1.24 | (.06 | ) | 1.16 | .02 | 151 | |||||||||||||||||||
| (a) | Per share Net Investment Income (Loss) is calculated using the average daily shares method. |
| (b) | Distributions from Capital Gains include short-term capital gains, if any. |
| (c) | Total return is the combination of changes in net asset value without any sales charge, reinvested dividend income at net asset value and reinvested capital gains distributions at net asset value, if any. Total returns are not annualized. |
| (d) | After expense reimbursement from the Adviser, where applicable. |
| (e) | Effective January 18, 2011, Class Y Shares previously offered by FAF Advisors, Inc. were renamed Class I Shares. |
| (f) | For the six months ended April 30, 2012. |
| (g) | The financial highlights for the period from November 1, 2006 through May 3, 2009 are those of Small-Mid Cap Core Fund, which changed its principal investment strategies and changed its name to Mid Cap Select Fund on May 4, 2009. |
| * | Rounds to less than $.01 per share. |
| ** | Annualized. |
See accompanying notes to financial statements.
| Nuveen Investments | 35 |
Financial Highlights (Unaudited) (continued)
| Selected data for a share outstanding throughout each period: | ||||||||||||||||||||||||||||||||
| Class (Commencement Date) | ||||||||||||||||||||||||||||||||
| Investment Operations | Less Distributions | |||||||||||||||||||||||||||||||
| SMALL CAP SELECT |
||||||||||||||||||||||||||||||||
| Year Ended October 31, |
Beginning Net Asset Value |
Net Invest- ment Income (Loss)(a) |
Net Realized/ Unrealized Gain (Loss) |
Total | Net Invest- ment Income |
Capital Gains(b) |
Total | Ending Net Asset Value |
||||||||||||||||||||||||
| Class A (5/92) |
|
|||||||||||||||||||||||||||||||
| 2012(f) |
$ | 12.44 | $ | (.03 | ) | $ | 1.65 | $ | 1.62 | $ | — | $ | (.30 | ) | $ | (.30 | ) | $ | 13.76 | |||||||||||||
| 2011 |
11.72 | (.09 | ) | .81 | .72 | — | — | — | 12.44 | |||||||||||||||||||||||
| 2010 |
9.53 | (.05 | ) | 2.24 | 2.19 | — | — | — | 11.72 | |||||||||||||||||||||||
| 2009 |
8.27 | (.01 | ) | 1.27 | 1.26 | — | — | — | 9.53 | |||||||||||||||||||||||
| 2008 |
14.06 | (.02 | ) | (4.92 | ) | (4.94 | ) | — | (.85 | ) | (.85 | ) | 8.27 | |||||||||||||||||||
| 2007 |
15.12 | (.02 | ) | 1.04 | 1.02 | — | (2.08 | ) | (2.08 | ) | 14.06 | |||||||||||||||||||||
| Class B (3/95) |
|
|||||||||||||||||||||||||||||||
| 2012(f) |
9.77 | (.06 | ) | 1.28 | 1.22 | — | (.30 | ) | (.30 | ) | 10.69 | |||||||||||||||||||||
| 2011 |
9.27 | (.15 | ) | .65 | .50 | — | — | — | 9.77 | |||||||||||||||||||||||
| 2010 |
7.60 | (.10 | ) | 1.77 | 1.67 | — | — | — | 9.27 | |||||||||||||||||||||||
| 2009 |
6.64 | (.05 | ) | 1.01 | .96 | — | — | — | 7.60 | |||||||||||||||||||||||
| 2008 |
11.56 | (.08 | ) | (3.99 | ) | (4.07 | ) | — | (.85 | ) | (.85 | ) | 6.64 | |||||||||||||||||||
| 2007 |
12.88 | (.11 | ) | .87 | .76 | — | (2.08 | ) | (2.08 | ) | 11.56 | |||||||||||||||||||||
| Class C (9/01) |
|
|||||||||||||||||||||||||||||||
| 2012(f) |
11.22 | (.07 | ) | 1.48 | 1.41 | — | (.30 | ) | (.30 | ) | 12.33 | |||||||||||||||||||||
| 2011 |
10.65 | (.17 | ) | .74 | .57 | — | — | — | 11.22 | |||||||||||||||||||||||
| 2010 |
8.73 | (.12 | ) | 2.04 | 1.92 | — | — | — | 10.65 | |||||||||||||||||||||||
| 2009 |
7.63 | (.06 | ) | 1.16 | 1.10 | — | — | — | 8.73 | |||||||||||||||||||||||
| 2008 |
13.13 | (.09 | ) | (4.56 | ) | (4.65 | ) | — | (.85 | ) | (.85 | ) | 7.63 | |||||||||||||||||||
| 2007 |
14.36 | (.12 | ) | .97 | .85 | — | (2.08 | ) | (2.08 | ) | 13.13 | |||||||||||||||||||||
| Class R3 (1/94)(e) |
|
|||||||||||||||||||||||||||||||
| 2012(f) |
12.13 | (.05 | ) | 1.62 | 1.57 | — | (.30 | ) | (.30 | ) | 13.40 | |||||||||||||||||||||
| 2011 |
11.46 | (.12 | ) | .79 | .67 | — | — | — | 12.13 | |||||||||||||||||||||||
| 2010 |
9.34 | (.08 | ) | 2.20 | 2.12 | — | — | — | 11.46 | |||||||||||||||||||||||
| 2009 |
8.12 | (.03 | ) | 1.25 | 1.22 | — | — | — | 9.34 | |||||||||||||||||||||||
| 2008 |
13.86 | (.04 | ) | (4.85 | ) | (4.89 | ) | — | (.85 | ) | (.85 | ) | 8.12 | |||||||||||||||||||
| 2007 |
14.98 | (.05 | ) | 1.01 | .96 | — | (2.08 | ) | (2.08 | ) | 13.86 | |||||||||||||||||||||
| Class I (5/92)(e) |
|
|||||||||||||||||||||||||||||||
| 2012(f) |
13.54 | (.02 | ) | 1.81 | 1.79 | — | (.30 | ) | (.30 | ) | 15.03 | |||||||||||||||||||||
| 2011 |
12.73 | (.06 | ) | .87 | .81 | — | — | — | 13.54 | |||||||||||||||||||||||
| 2010 |
10.33 | (.03 | ) | 2.44 | 2.41 | (.01 | ) | — | (.01 | ) | 12.73 | |||||||||||||||||||||
| 2009 |
8.94 | .02 | 1.37 | 1.39 | — | — | — | 10.33 | ||||||||||||||||||||||||
| 2008 |
15.10 | .01 | (5.31 | ) | (5.30 | ) | (.01 | ) | (.85 | ) | (.86 | ) | 8.94 | |||||||||||||||||||
| 2007 |
16.06 | .01 | 1.11 | 1.12 | — | (2.08 | ) | (2.08 | ) | 15.10 | ||||||||||||||||||||||
| 36 | Nuveen Investments |
| Ratios/Supplemental Data | ||||||||||||||||||||||||||
| Ratios to Average Net Assets Before Reimbursement |
Ratios to Average Net Assets After Reimbursement(d) |
|||||||||||||||||||||||||
| Total Return(c) |
Ending Net Assets (000) |
Expenses | Net Invest- ment Income (Loss) |
Expenses | Net Invest- ment Income (Loss) |
Portfolio Turnover Rate |
||||||||||||||||||||
| 13.43 | % | $ | 168,958 | 1.36 | %* | (.59 | )%* | 1.29 | %* | (.51 | )%* | 36 | % | |||||||||||||
| 6.14 | 275,994 | 1.34 | (.74 | ) | 1.30 | (.70 | ) | 69 | ||||||||||||||||||
| 22.98 | 339,826 | 1.25 | (.49 | ) | 1.24 | (.48 | ) | 88 | ||||||||||||||||||
| 15.24 | 295,348 | 1.26 | (.09 | ) | 1.26 | (.09 | ) | 99 | ||||||||||||||||||
| (37.00 | ) | 166,698 | 1.26 | (.15 | ) | 1.26 | (.15 | ) | 92 | |||||||||||||||||
| 7.35 | 238,129 | 1.23 | (.22 | ) | 1.23 | (.22 | ) | 97 | ||||||||||||||||||
| 13.00 | 2,562 | 2.12 | * | (1.31 | )* | 2.04 | * | (1.23 | )* | 36 | ||||||||||||||||
| 5.39 | 2,866 | 2.09 | (1.51 | ) | 2.05 | (1.45 | ) | 69 | ||||||||||||||||||
| 21.97 | 3,925 | 2.00 | (1.23 | ) | 1.99 | (1.22 | ) | 88 | ||||||||||||||||||
| 14.46 | 5,511 | 2.01 | (.80 | ) | 2.01 | (.80 | ) | 99 | ||||||||||||||||||
| (37.52 | ) | 6,249 | 2.01 | (.90 | ) | 2.01 | (.90 | ) | 92 | |||||||||||||||||
| 6.51 | 13,720 | 1.98 | (.97 | ) | 1.98 | (.97 | ) | 97 | ||||||||||||||||||
| 13.01 | 12,510 | 2.12 | * | (1.31 | )* | 2.04 | * | (1.23 | )* | 36 | ||||||||||||||||
| 5.35 | 14,009 | 2.09 | (1.50 | ) | 2.05 | (1.45 | ) | 69 | ||||||||||||||||||
| 21.99 | 17,393 | 2.00 | (1.24 | ) | 1.99 | (1.23 | ) | 88 | ||||||||||||||||||
| 14.42 | 16,938 | 2.01 | (.80 | ) | 2.01 | (.80 | ) | 99 | ||||||||||||||||||
| (37.44 | ) | 17,062 | 2.01 | (.90 | ) | 2.01 | (.90 | ) | 92 | |||||||||||||||||
| 6.46 | 34,505 | 1.98 | (.95 | ) | 1.98 | (.95 | ) | 97 | ||||||||||||||||||
| 13.36 | 19,746 | 1.62 | * | (.81 | )* | 1.54 | * | (.73 | )* | 36 | ||||||||||||||||
| 5.85 | 20,044 | 1.60 | (1.00 | ) | 1.55 | (.95 | ) | 69 | ||||||||||||||||||
| 22.70 | 18,047 | 1.50 | (.72 | ) | 1.49 | (.71 | ) | 88 | ||||||||||||||||||
| 15.02 | 24,701 | 1.51 | (.31 | ) | 1.51 | (.31 | ) | 99 | ||||||||||||||||||
| (37.19 | ) | 23,069 | 1.51 | (.40 | ) | 1.51 | (.40 | ) | 92 | |||||||||||||||||
| 6.99 | 38,181 | 1.48 | (.43 | ) | 1.48 | (.43 | ) | 97 | ||||||||||||||||||
| 13.60 | 287,498 | 1.12 | * | (.31 | )* | 1.04 | * | (.23 | )* | 36 | ||||||||||||||||
| 6.36 | 273,983 | 1.09 | (.49 | ) | 1.05 | (.45 | ) | 69 | ||||||||||||||||||
| 23.30 | 400,042 | 1.00 | (.24 | ) | .99 | (.23 | ) | 88 | ||||||||||||||||||
| 15.55 | 322,658 | 1.01 | .19 | 1.01 | .19 | 99 | ||||||||||||||||||||
| (36.86 | ) | 289,685 | 1.01 | .10 | 1.01 | .10 | 92 | |||||||||||||||||||
| 7.58 | 691,488 | .98 | .03 | .98 | .03 | 97 | ||||||||||||||||||||
| (a) | Per share Net Investment Income (Loss) is calculated using the average daily shares method. |
| (b) | Distributions from Capital Gains include short-term capital gains, if any. |
| (c) | Total return is the combination of changes in net asset value without any sales charge, reinvested dividend income at net asset value and reinvested capital gains distributions at net asset value, if any. Total returns are not annualized. |
| (d) | After expense reimbursement from the Adviser, where applicable. |
| (e) | Effective January 18, 2011, Class R Shares and Class Y Shares previously offered by FAF Advisors, Inc. were renamed Class R3 Shares and Class I Shares, respectively. |
| (f) | For the six months ended April 30, 2012. |
| * | Annualized. |
See accompanying notes to financial statements.
| Nuveen Investments | 37 |
Notes to Financial Statements (Unaudited)
1. General Information and Significant Accounting Policies
General Information
Nuveen Investment Funds, Inc. (the “Trust”), is an open-end investment company registered under the Investment Company Act of 1940, as amended. The Trust is comprised of Nuveen Large Cap Select Fund (“Large Cap Select”), Nuveen Mid Cap Select Fund (“Mid Cap Select”), and Nuveen Small Cap Select Fund (“Small Cap Select”), (each a “Fund” and collectively, the “Funds”), among others. The Trust was incorporated in the state of Maryland on August 20, 1987.
Large Cap Select’s investment objective is capital appreciation. Under normal market conditions, the Fund invests at least 80% of net assets, plus the amount of any borrowings for investment purposes, in common stocks of large-capitalization companies, defined as companies that have market capitalizations of $5 billion or greater at the time of purchase.
Mid Cap Select’s investment objective is long-term growth of capital. Under normal market conditions, the Fund invests at least 80% of net assets, plus the amount of any borrowings for investment purposes, in common stocks of mid-capitalization companies, defined as companies that have market capitalizations at the time of purchase within the market capitalization range of the companies in the Russell Midcap® Index immediately after its most recent reconstitution prior to such purchase. It is expected that reconstitution of the index will occur each year at the end of June. Immediately after the most recent reconstitution, the range was $520 million to $17.9 billion.
Small Cap Select’s investment objective is capital appreciation. Under normal market conditions, the Fund invests at least 80% of net assets, plus the amount of any borrowings for investment purposes, in common stocks of small-capitalization companies, defined as companies that have market capitalizations of less than $3 billion at the time of purchase.
Each Fund may invest up to 15% of its total assets in non-dollar denominated equity securities of non-U.S. issuers. Each Fund may invest up to 25% of its assets, collectively, in non-dollar denominated equity securities of non-U.S. issuers and in dollar-denominated equity securities of non-U.S. issuers that are either listed on a U.S. stock exchange or represented by depositary receipts that may or may not be sponsored by a domestic bank. Up to 15% of each Fund’s total assets may be invested in equity securities of emerging market issuers. Each Fund also may invest in options, futures contracts, options on futures contracts and forward foreign currency exchanges contracts (“derivatives”) to manage market or business risk, enhance its return or hedge against adverse movements in currency exchange rates.
Each Fund’s most recent prospectus provides further descriptions of each Fund’s investment objective, principal investment strategies and principal risks.
Effective at the close of business on February 15, 2012, Class B Shares of Mid Cap Select were converted to Class A Shares and are no longer available for dividend reinvestment or through an exchange from other Nuveen mutual funds.
Significant Accounting Policies
The following is a summary of significant accounting policies followed by the Funds in the preparation of their financial statements in accordance with accounting principles generally accepted in the United States (“U.S. GAAP”).
Investment Valuation
Common stocks and other equity-type securities are valued at the last sales price on the securities exchange on which such securities are primarily traded and are generally classified as Level 1 for fair value measurement purposes. Securities primarily traded on the NASDAQ National Market (“NASDAQ”) are valued, except as indicated below, at the NASDAQ Official Closing Price and are generally classified as Level 1. However, securities traded on a securities exchange or NASDAQ for which there were no transactions on a given day or securities not listed on a securities exchange or NASDAQ are valued at the quoted bid price and are generally classified as Level 2.
Investments in investment companies are valued at their respective net asset values on the valuation date. These investment vehicles are generally classified as Level 1.
Futures contracts are valued using the closing settlement price or, in the absence of such a price, the last traded price. Futures contracts are generally classified as Level 1.
Certain securities may not be able to be priced by the pre-established pricing methods as described above. Such securities may be valued by the Funds’ Board of Directors or its designee at fair value. These securities generally include, but are not limited to, restricted securities (securities which may not be publicly sold without registration under the Securities Act of 1933, as amended) for which a pricing service is unable to provide a market price; securities whose trading has been formally suspended; debt securities that have gone into default and for which there is no current market quotation; a security whose market price is not available from a pre-established pricing source; a security with respect to which an event has occurred that is likely to materially affect the value of the security after the market has closed but before the calculation of a Fund’s net asset value (as may be the case in non-U.S. markets on which the security is primarily traded) or make it difficult or impossible to obtain a reliable market quotation; and a security whose price, as provided by the pricing service, is not deemed to reflect the security’s fair value. As a general principle, the fair value of a security would appear to be the amount that the owner might reasonably expect to receive for it in a current sale. A variety of factors
| 38 | Nuveen Investments |
may be considered in determining the fair value of such securities, which may include consideration of the following: yields or prices of investments of comparable quality, type of issue, coupon, maturity and rating, market quotes or indications of value from security dealers, evaluations of anticipated cash flows or collateral, general market conditions and other information and analysis, including the obligor’s credit characteristics considered relevant. These securities are generally classified as Level 2 or Level 3 depending on the priority of the significant inputs. Regardless of the method employed to value a particular security, all valuations are subject to review by the Funds’ Board of Directors or its designee.
Refer to Footnote 2 – Fair Value Measurements for further details on the leveling of securities held by the Funds as of the end of the reporting period.
Investment Transactions
Investment transactions are recorded on a trade date basis. Realized gains and losses from investment transactions are determined on the specific identification method, which is the same basis used for federal income tax purposes.
Investment Income
Dividend income is recorded on the ex-dividend date or, for foreign securities, when information is available. Interest income is recorded on an accrual basis. Securities lending income is comprised of fees earned from borrowers and income earned on cash collateral investments, net of lending agent fees.
Income Taxes
Each Fund is a separate taxpayer for federal income tax purposes. Each Fund intends to distribute substantially all of its net investment income and net capital gains to shareholders and to otherwise comply with the requirements of Subchapter M of the Internal Revenue Code applicable to regulated investment companies. Therefore, no federal income tax provision is required.
For all open tax years and all major taxing jurisdictions, management of the Funds has concluded that there are no significant uncertain tax positions that would require recognition in the financial statements. Open tax years are those that are open for examination by taxing authorities (i.e., generally the last four tax year ends and the interim tax period since then). Furthermore, management of the Funds is also not aware of any tax positions for which it is reasonably possible that the total amounts of unrecognized tax benefits will significantly change in the next twelve months.
Dividends and Distributions to Shareholders
Dividends from net investment income and net realized gains from investment transactions, if any, are declared and distributed to shareholders at least annually. Furthermore, capital gains are distributed only to the extent they exceed available capital loss carryforwards.
Distributions to shareholders are recorded on the ex-dividend date. The amount and timing of distributions are determined in accordance with federal income tax regulations, which may differ from U.S. GAAP.
Small Cap Select receives substantial distributions from holdings in Real Estate Investment Trusts (“REITs”). Distributions from REITs may be characterized as ordinary income, net capital gain, or a return of capital to the REIT shareholder. The proper characterization of REIT distributions is generally not known until after the end of each calendar year. As such, Small Cap Select must use estimates in reporting the character of their income and distributions for financial reporting purposes. The actual character of distributions to Fund shareholders will be reflected on the Form 1099 received by shareholders after the end of the calendar year. Due to the nature of REIT investments, a portion of the distributions received by the Fund shareholder may represent a return of capital.
Flexible Sales Charge Program
Class A Shares are generally sold with an up-front sales charge and incur a .25% annual 12b-1 service fee. Class A Share purchases of $1 million or more are sold at net asset value without an up-front sales charge but may be subject to a contingent deferred sales charge (“CDSC”) if redeemed within twelve months of purchase. Class B Shares were sold without an up-front sales charge but incur a .75% annual 12b-1 distribution fee and a .25% annual 12b-1 service fee. Class B Shares are subject to a CDSC of up to 5% depending upon the length of time the shares are held by the investor (CDSC is reduced to 0% at the end of six years). Class B Shares automatically convert to Class A Shares eight years after purchase. Class C Shares are sold without an up-front sales charge but incur a .75% annual 12b-1 distribution fee and a .25% annual 12b-1 service fee. Class C Shares are subject to a CDSC of 1% if redeemed within twelve months of purchase. Class R3 Shares are sold without an up-front sales charge but incur a .25% annual 12b-1 distribution and a .25% annual 12b-1 service fee. Class I Shares are not subject to any sales charge or 12b-1 distribution or service fees.
Foreign Currency Transactions
Each Fund is authorized to engage in foreign currency exchange transactions, including foreign currency exchange contracts, futures, options and swap contracts. To the extent that the Funds invest in securities and/or contracts that are denominated in a currency other than U.S. dollars, the Funds will be subject to currency risk, which is the risk that an increase in the U.S. dollar relative to the foreign currency will reduce returns or portfolio value. Generally, when the U.S. dollar rises in value against a foreign currency, the Funds’ investments denominated in that currency will lose value because its currency is worth fewer U.S. dollars; the opposite effect occurs if the U.S. dollar falls in relative value. Investments and other assets and liabilities denominated in foreign currencies are converted into U.S. dollars on a spot (i.e. cash) basis at the spot rate prevailing in the foreign currency exchange market at the time of valuation. Purchases and sales of investments and income denominated in foreign currencies are translated into U.S. dollars on the respective dates of such transactions.
| Nuveen Investments | 39 |
Notes to Financial Statements (Unaudited) (continued)
The books and records of the Funds are maintained in U.S. dollars. Foreign currencies, assets and liabilities are translated into U.S. dollars at 4:00 p.m. Eastern Time. Investment transactions, income and expenses are translated on the respective dates of such transactions. Net realized foreign currency gains and losses resulting from changes in exchange rates include foreign currency gains and losses between trade date and settlement date of the transactions, foreign currency transactions, and the difference between the amounts of interest and dividends recorded on the books of a Fund and the amounts actually received.
The realized gains and losses resulting from changes in foreign currency exchange rates and changes in foreign exchange rates associated with other assets and liabilities on investments and derivatives are recognized as a component of “Net realized gain (loss) from investments and foreign currency,” on the Statement of Operations, when applicable.
The unrealized gains and losses resulting from changes in foreign currency exchange rates and changes in foreign exchange rates associated with other assets and liabilities on investments are recognized as a component of “Change in net unrealized appreciation (depreciation) of investments and foreign currency,” on the Statement of Operations, when applicable.
Futures Contracts
Each Fund is subject to equity price risk in the normal course of pursuing its investment objectives and is authorized to invest in futures contracts in an attempt to manage such risk. Upon entering into a futures contract, a Fund is required to deposit with the broker an amount of cash or liquid securities equal to a specified percentage of the contract amount. This is known as the “initial margin.” Cash held by the broker to cover initial margin requirements on open futures contracts, if any, is recognized as “Deposits with brokers for open futures contracts” on the Statement of Assets and Liabilities. Subsequent payments (“variation margin”) are made or received by a Fund each day, depending on the daily fluctuation of the value of the contract. Variation margin is recognized as a receivable and/or payable for “Variation margin on futures contracts” on the Statement of Assets and Liabilities, when applicable.
During the period the futures contract is open, changes in the value of the contract are recognized as an unrealized gain or loss by “marking-to-market” on a daily basis to reflect the changes in market value of the contract, which is recognized as a component of “Change in net unrealized appreciation (depreciation) of futures contracts” on the Statement of Operations. When the contract is closed or expired, a Fund records a realized gain or loss equal to the difference between the value of the contract on the closing date and value of the contract when originally entered into, which is recognized as a component of “Net realized gain (loss) from futures contracts” on the Statement of Operations.
Risks of investments in futures contracts include the possible adverse movement in the price of the securities or indices underlying the contracts, the possibility that there may not be a liquid secondary market for the contracts and/or that a change in the value of the contract may not correlate with a change in the value of the underlying securities or indices.
During the six months ended April 30, 2012, Small Cap Select invested in long equity futures contracts as part of the management of the Fund. These long futures contracts were used to manage cash flow activity and implement various tactical market and hedging strategies.
The average number of futures contracts outstanding during the six months ended April 30, 2012, were as follows:
| Small Cap Select |
||||
| Average number of futures contracts outstanding* |
— | |||
| * | The average number of outstanding contracts is calculated based on the outstanding number of contracts at the beginning of the fiscal year and at the end of each fiscal quarter within the current fiscal year. |
Refer to Footnote 3 – Derivative Instruments and Hedging Activities for further details on futures contracts activity.
Market and Counterparty Credit Risk
In the normal course of business each Fund may invest in financial instruments and enter into financial transactions where risk of potential loss exists due to changes in the market (market risk) or failure of the other party to the transaction to perform (counterparty credit risk). The potential loss could exceed the value of the financial assets recorded on the financial statements. Financial assets, which potentially expose each Fund to counterparty credit risk, consist principally of cash due from counterparties on forward, option and swap transactions, when applicable. The extent of each Fund’s exposure to counterparty credit risk in respect to these financial assets approximates their carrying value as recorded on the Statement of Assets and Liabilities. Futures contracts, when applicable, expose a Fund to minimal counterparty credit risk as they are exchange traded and the exchange’s clearinghouse, which is counterparty to all exchange traded futures, guarantees the futures contracts against default.
Each Fund helps manage counterparty credit risk by entering into agreements only with counterparties Nuveen Fund Advisors, Inc. (the “Adviser”), a wholly-owned subsidiary of Nuveen Investments, Inc. (“Nuveen”), believes have the financial resources to honor their obligations and by having the Adviser monitor the financial stability of the counterparties. Additionally, counterparties may be required to pledge collateral daily (based on the daily valuation of the financial asset) on behalf of each Fund with a value approximately equal to the amount of any unrealized gain above a pre-determined threshold. Reciprocally, when each Fund has an unrealized loss, the Funds have instructed the custodian to pledge assets of the Funds as collateral with a value approximately equal to the amount of the unrealized loss above a pre-determined threshold. Collateral pledges are monitored and subsequently adjusted if and when the valuations fluctuate, either up or down, by at least the pre-determined threshold amount.
| 40 | Nuveen Investments |
Multiclass Operations and Allocations
Income and expenses of the Funds that are not directly attributable to a specific class of shares are prorated among the classes based on the relative net assets of each class. Expenses directly attributable to a class of shares, which presently only include 12b-1 distribution fees and shareholder service fees, are recorded to the specific class.
Realized and unrealized capital gains and losses of the Funds are prorated among the classes based on the relative net assets of each class.
Securities Lending
In order to generate additional income, each Fund may lend securities representing up to one-third of the value of its total assets (which includes collateral for securities on loan) to broker-dealers, banks or other institutions. Each Fund’s policy is to receive cash collateral equal to at least 102% of the value of securities loaned, which is recognized as “Collateral from securities lending program” on the Statement of Assets and Liabilities. The adequacy of the collateral is monitored on a daily basis. If the value of the securities on loan increases, such that the level of collateralization falls below 102%, additional collateral is received from the borrower, which is recognized as “Due from broker” on the Statement of Assets and Liabilities, when applicable. As with other extensions of credit, there may be risks of delay in recovery of the securities or even loss of rights in the collateral should the borrower of the security fail financially.
The Funds’ custodian serves as the securities lending agent for the Funds. Each Fund pays the custodian a fee based on the Fund’s proportional share of the custodian’s expense of operating its securities lending program. Collateral for securities on loan is invested in a money market fund, which is recognized as “Investments purchased with collateral from securities lending” on the Statement of Assets and Liabilities.
Income from securities lending, net of fees paid, is recognized on the Statement of Operations as “Securities lending income.” Securities lending fees paid by each Fund during the six months ended April 30, 2012, were as follows:
| Large Cap Select |
Mid Cap Select |
Small Cap Select |
||||||||||
| Securities lending fees paid |
$ | 1,744 | $ | 2,843 | $ | 63,344 | ||||||
Indemnifications
Under the Trust’s organizational documents, its officers and directors are indemnified against certain liabilities arising out of the performance of their duties to the Trust. In addition, in the normal course of business, the Trust enters into contracts that provide general indemnifications to other parties. The Trust’s maximum exposure under these arrangements is unknown as this would involve future claims that may be made against the Trust that have not yet occurred. However, the Trust has not had prior claims or losses pursuant to these contracts and expects the risk of loss to be remote.
Use of Estimates
The preparation of financial statements in conformity with U.S. GAAP requires management to make estimates and assumptions that affect the reported amounts of assets and liabilities at the date of the financial statements and the reported amounts of increases and decreases in net assets from operations during the reporting period. Actual results may differ from those estimates.
2. Fair Value Measurements
Fair value is defined as the price that the Funds would receive upon selling an investment or transferring a liability in an orderly transaction to an independent buyer in the principal or most advantageous market for the investment. A three-tier hierarchy is used to maximize the use of observable market data and minimize the use of unobservable inputs and to establish classification of fair value measurements for disclosure purposes. Observable inputs reflect the assumptions market participants would use in pricing the asset or liability. Observable inputs are based on market data obtained from sources independent of the reporting entity. Unobservable inputs reflect the reporting entity’s own assumptions about the assumptions market participants would use in pricing the asset or liability. Unobservable inputs are based on the best information available in the circumstances. The three-tier hierarchy of inputs is summarized in the three broad levels listed below:
| Level 1 – | Quoted prices in active markets for identical securities. | |
| Level 2 – | Other significant observable inputs (including quoted prices for similar securities, interest rates, prepayment speeds, credit risk, etc.). | |
| Level 3 – | Significant unobservable inputs (including management’s assumptions in determining the fair value of investments). |
| Nuveen Investments | 41 |
Notes to Financial Statements (Unaudited) (continued)
The inputs or methodologies used for valuing securities are not an indication of the risk associated with investing in those securities. The following is a summary of each Fund’s fair value measurements as of April 30, 2012:
| Large Cap Select | Level 1 | Level 2 | Level 3 | Total | ||||||||||||
| Long-Term Investments: |
||||||||||||||||
| Common Stocks |
$ | 44,681,179 | $ | — | $ | — | $ | 44,681,179 | ||||||||
| Investments Purchased with Collateral from Securities Lending |
12,566,136 | — | — | 12,566,136 | ||||||||||||
| Short-Term Investments: |
||||||||||||||||
| Money Market Funds |
511,952 | — | — | 511,952 | ||||||||||||
| Total |
$ | 57,759,267 | $ | — | $ | — | $ | 57,759,267 | ||||||||
| Mid Cap Select | Level 1 | Level 2 | Level 3 | Total | ||||||||||||
| Long-Term Investments: |
||||||||||||||||
| Common Stocks |
$ | 28,926,927 | $ | — | $ | — | $ | 28,926,927 | ||||||||
| Investments Purchased with Collateral from Securities Lending |
8,043,707 | — | — | 8,043,707 | ||||||||||||
| Short-Term Investments: |
||||||||||||||||
| Money Market Funds |
426,552 | — | — | 426,552 | ||||||||||||
| Total |
$ | 37,397,186 | $ | — | $ | — | $ | 37,397,186 | ||||||||
| Small Cap Select | Level 1 | Level 2 | Level 3 | Total | ||||||||||||
| Long-Term Investments: |
||||||||||||||||
| Common Stocks |
$ | 484,231,766 | $ | — | $ | — | $ | 484,231,766 | ||||||||
| Investments Purchased with Collateral from Securities Lending |
236,418,881 | — | — | 236,418,881 | ||||||||||||
| Short-Term Investments: |
||||||||||||||||
| Money Market Funds |
10,414,426 | — | — | 10,414,426 | ||||||||||||
| Total |
$ | 731,065,073 | $ | — | $ | — | $ | 731,065,073 | ||||||||
During the six months ended April 30, 2012, the Funds recognized no transfers to or from Level 1, Level 2 or Level 3.
3. Derivative Instruments and Hedging Activities
The Funds record derivative instruments at fair value, with changes in fair value recognized on the Statement of Operations, when applicable. Even though the Funds’ investments in derivatives may represent economic hedges, they are not considered to be hedge transactions for financial reporting purposes. For additional information on the derivative instruments in which each Fund was invested during and at the end of the reporting period, refer to the Portfolios of Investments, Financial Statements and Footnote 1 – General Information and Significant Accounting Policies.
The following table presents the amount of net realized gain (loss) recognized for the six months ended April 30, 2012, on derivative instruments, as well as the primary risk exposure associated with each.
| Net Realized Gain (Loss) from Futures Contracts | Small Cap Select |
|||
| Risk Exposure |
||||
| Equity |
$ | 1,762,906 | ||
| 42 | Nuveen Investments |
4. Fund Shares
Transactions in Fund shares were as follows:
| Large Cap Select | ||||||||||||||||
| Six Months Ended 4/30/12 |
Year Ended 10/31/11 |
|||||||||||||||
| Shares |
Amount |
Shares |
Amount |
|||||||||||||
| Shares sold: |
||||||||||||||||
| Class A |
20,449 | $ | 267,823 | 48,975 | 630,342 | |||||||||||
| Class C |
102 | 1,126 | 3,506 | 44,297 | ||||||||||||
| Class R3 (1) |
504 | 6,159 | 929 | 11,842 | ||||||||||||
| Class I (1) |
177,000 | 2,065,748 | 317,616 | 3,895,849 | ||||||||||||
| Shares issued to shareholders due to reinvestment of distributions: |
||||||||||||||||
| Class A |
— | — | — | — | ||||||||||||
| Class C |
— | — | — | — | ||||||||||||
| Class R3 (1) |
— | — | — | — | ||||||||||||
| Class I (1) |
1,891 | 22,258 | 5,718 | 73,066 | ||||||||||||
| 199,946 | 2,363,114 | 376,744 | 4,655,396 | |||||||||||||
| Shares redeemed: |
||||||||||||||||
| Class A |
(33,237 | ) | (407,945 | ) | (97,791 | ) | (1,234,341 | ) | ||||||||
| Class C |
(2,181 | ) | (26,483 | ) | (2,802 | ) | (33,700 | ) | ||||||||
| Class R3 (1) |
(2,655 | ) | (34,618 | ) | (1,428 | ) | (18,315 | ) | ||||||||
| Class I (1) |
(2,071,810 | ) | (25,047,277 | ) | (5,270,687 | ) | (65,571,376 | ) | ||||||||
| Class I (1) – In-Kind |
— | — | (1,284,181 | ) | (15,345,963 | ) | ||||||||||
| (2,109,883 | ) | (25,516,323 | ) | (6,656,889 | ) | (82,203,695 | ) | |||||||||
| Net increase (decrease) |
(1,909,937 | ) | $ | (23,153,209 | ) | (6,280,145 | ) | (77,548,299 | ) | |||||||
| Mid Cap Select | ||||||||||||||||
| Six Months Ended 4/30/12 |
Year Ended 10/31/11 |
|||||||||||||||
| Shares |
Amount |
Shares |
Amount |
|||||||||||||
| Shares sold: |
||||||||||||||||
| Class A |
98,407 | $ | 998,102 | 100,917 | 1,030,004 | |||||||||||
| Class B |
— | — | 1,214 | 10,402 | ||||||||||||
| Class C |
3,716 | 32,634 | 6,959 | 64,006 | ||||||||||||
| Class I (1) |
59,427 | 603,377 | 136,645 | 1,431,982 | ||||||||||||
| Shares issued to shareholders due to reinvestment of distributions: |
||||||||||||||||
| Class A |
— | — | — | — | ||||||||||||
| Class B |
— | — | — | — | ||||||||||||
| Class C |
— | — | — | — | ||||||||||||
| Class I (1) |
— | — | — | — | ||||||||||||
| 161,550 | 1,634,113 | 245,735 | 2,536,394 | |||||||||||||
| Shares redeemed: |
||||||||||||||||
| Class A |
(112,730 | ) | (1,119,141 | ) | (290,360 | ) | (2,916,390 | ) | ||||||||
| Class B |
(100,888 | ) | (862,888 | ) | (64,355 | ) | (547,919 | ) | ||||||||
| Class C |
(22,792 | ) | (210,011 | ) | (74,184 | ) | (677,927 | ) | ||||||||
| Class I (1) |
(380,609 | ) | (3,862,166 | ) | (833,219 | ) | (8,555,743 | ) | ||||||||
| (617,019 | ) | (6,054,206 | ) | (1,262,118 | ) | (12,697,979 | ) | |||||||||
| Net increase (decrease) |
(455,469 | ) | $ | (4,420,093 | ) | (1,016,383 | ) | (10,161,585 | ) | |||||||
| (1) | Effective January 18, 2011, Class R Shares and Class Y Shares previously offered by FAF Advisors, Inc. were renamed Class R3 Shares and Class I Shares, respectively. |
| Nuveen Investments | 43 |
Notes to Financial Statements (Unaudited) (continued)
| Small Cap Select | ||||||||||||||||
| Six Months Ended 4/30/12 |
Year Ended 10/30/11 |
|||||||||||||||
| Shares | Amount | Shares | Amount | |||||||||||||
| Shares sold: |
||||||||||||||||
| Class A |
2,265,544 | $ | 29,884,511 | 9,066,714 | $ | 118,699,201 | ||||||||||
| Class B |
55 | 510 | 829 | 8,923 | ||||||||||||
| Class C |
17,283 | 204,865 | 44,237 | 520,442 | ||||||||||||
| Class R3 (1) |
202,950 | 2,613,678 | 732,709 | 9,445,253 | ||||||||||||
| Class I (1) |
2,697,265 | 38,455,656 | 4,213,928 | 59,498,496 | ||||||||||||
| Shares issued to shareholders due to reinvestment of distributions: |
||||||||||||||||
| Class A |
555,167 | 6,578,724 | — | — | ||||||||||||
| Class B |
8,774 | 81,068 | — | — | ||||||||||||
| Class C |
31,588 | 336,407 | — | — | ||||||||||||
| Class R3 (1) |
42,049 | 485,669 | — | — | ||||||||||||
| Class I (1) |
369,469 | 4,780,926 | — | — | ||||||||||||
| 6,190,144 | 83,422,014 | 14,058,417 | 188,172,315 | |||||||||||||
| Shares redeemed: |
||||||||||||||||
| Class A |
(12,734,645 | ) | (176,341,872 | ) | (15,876,132 | ) | (207,042,276 | ) | ||||||||
| Class B |
(62,653 | ) | (652,706 | ) | (130,715 | ) | (1,343,789 | ) | ||||||||
| Class C |
(283,313 | ) | (3,344,540 | ) | (428,685 | ) | (4,846,091 | ) | ||||||||
| Class R3 (1) |
(423,590 | ) | (5,291,908 | ) | (655,473 | ) | (8,328,827 | ) | ||||||||
| Class I (1) |
(4,176,714 | ) | (59,714,673 | ) | (11,942,604 | ) | (165,412,108 | ) | ||||||||
| Class I (1) – In-Kind |
— | — | (3,470,750 | ) | (49,354,066 | ) | ||||||||||
| (17,680,915 | ) | (245,345,699 | ) | (32,504,359 | ) | (436,327,157 | ) | |||||||||
| Net increase (decrease) |
(11,490,771 | ) | $ | (161,923,685 | ) | (18,445,942 | ) | $ | (248,154,842 | ) | ||||||
| (1) | Effective January 18, 2011, Class R Shares and Class Y Shares previously offered by FAF Advisors, Inc. were renamed Class R3 Shares and Class I Shares, respectively. |
Class B Shares that converted to Class A Shares (recognized as a component of Class A Shares sold and Class B Shares redeemed) during the six months ended April 30, 2012 and fiscal year ended October 31, 2011, were as follows:
| Fund | Six Months Ended |
Year Ended 10/31/11 |
||||||
| Mid Cap Select |
178,360 | 42,682 | ||||||
| Small Cap Select |
36,811 | 68,111 | ||||||
5. Investment Transactions
Purchases and sales (including maturities but excluding investments purchased with collateral from securities lending, short-term investments and derivative transactions, where applicable) during the six months ended April 30, 2012, were as follows:
| Large Cap Select |
Mid Cap Select |
Small Cap Select |
||||||||||
| Purchases |
$ | 33,163,378 | $ | 36,053,058 | $ | 198,503,788 | ||||||
| Sales and maturities |
56,541,754 | 39,897,793 | 356,550,482 | |||||||||
6. Income Tax Information
The following information is presented on an income tax basis. Differences between amounts for financial statement and federal income tax purposes are primarily due to timing differences in recognizing certain gains and losses on investment transactions. To the extent that differences arise that are permanent in nature, such amounts are reclassified within the capital accounts as detailed below. Temporary differences do not require reclassification. Temporary and permanent differences do not impact the net asset values of the Funds.
At April 30, 2012, the cost and unrealized appreciation (depreciation) of investments (excluding investments in derivatives, where applicable), as determined on a federal income tax basis, were as follows:
| Large Cap Select |
Mid Cap Select |
Small Cap Select |
||||||||||
| Cost of investments |
$ | 53,396,873 | $ | 34,808,884 | $ | 683,508,375 | ||||||
| Gross unrealized: |
||||||||||||
| Appreciation |
$ | 5,365,056 | $ | 3,049,314 | $ | 76,864,986 | ||||||
| Depreciation |
(1,002,662 | ) | (461,012 | ) | (29,308,288 | ) | ||||||
| Net unrealized appreciation (depreciation) of investments |
$ | 4,362,394 | $ | 2,588,302 | $ | 47,556,698 | ||||||
| 44 | Nuveen Investments |
Permanent differences, primarily due to the expiration of capital loss carryforwards, net operating losses, tax equalization, REIT adjustments and redemptions in-kind, resulted in reclassifications among the Funds’ components of net assets at October 31, 2011, the Funds’ last tax year end, as follows:
| Large Cap Select |
Mid Cap Select |
Small Cap Select |
||||||||||
| Capital paid-in |
$ | 3,048,972 | $ | (552,956 | ) | $ | 13,968,508 | |||||
| Undistributed (Over-distribution) of net investment income |
14,242 | 147,799 | 4,230,625 | |||||||||
| Accumulated net realized gain (loss) |
(3,063,214 | ) | 406,275 | (18,199,133 | ) | |||||||
The tax components of undistributed net ordinary income and net long-term capital gains at October 31, 2011, the Funds’ last tax year end, were as follows:
| Large Cap Select |
Mid Cap Select |
Small Cap Select |
||||||||||
| Undistributed net ordinary income* |
$ | — | $ | — | $ | — | ||||||
| Undistributed net long-term capital gains |
— | — | 13,467,301 | |||||||||
| * | Net ordinary income consists of net taxable income derived from dividends, interest and net short-term capital gains, if any. |
The tax character of distributions paid during the Funds’ last tax year ended October 31, 2011, was designated for purposes of the dividends paid deduction as follows:
| Large Cap Select |
Mid Cap Select |
Small Cap Select |
||||||||||
| Distributions from net ordinary income* |
$ | 150,204 | $ | — | $ | — | ||||||
| Distributions from net long-term capital gains |
— | — | — | |||||||||
| * | Net ordinary income consists of net taxable income derived from dividends, interest, net short-term capital gains and current year earnings and profits attributable to realized gains, if any. |
At October 31, 2011, the Funds’ last tax year end, the following Funds had unused capital loss carryforwards available for federal income tax purposes to be applied against future capital gains, if any. If not applied, the carryforwards will expire as follows:
| Large Cap Select |
Mid Cap Select |
|||||||
| Expiration: |
||||||||
| October 31, 2016 |
$ | 21,600,658 | $ | 7,819,829 | ||||
| October 31, 2017 |
54,315,490 | 15,708,192 | ||||||
| Total |
$ | 75,916,148 | $ | 23,528,021 | ||||
At October 31, 2011, the Funds’ last tax year end, $405,157 of Mid Cap Select’s capital loss carryforward expired.
During the Funds’ last tax year ended October 31, 2011, the Funds utilized their capital loss carryforwards as follows:
| Large Cap Select |
Mid Cap Select |
Small Cap Select |
||||||||||
| Utilized capital loss carryforwards |
$ | 18,067,551 | $ | 3,915,028 | $ | 92,018,632 | ||||||
7. Management Fees and Other Transactions with Affiliates
Each Fund’s management fee consists of two components – a fund-level fee, based only on the amount of assets within each individual Fund, and a complex-level fee, based on the aggregate amount of all eligible fund assets managed by the Adviser. This pricing structure enables Fund shareholders to benefit from growth in the assets within their respective Fund as well as from growth in the amount of complex-wide assets managed by the Adviser.
The annual fund-level fee for each Fund, payable monthly, is calculated according to the following schedule:
| Average Daily Net Assets | Large Cap Select Fund-Level Fee Rate |
Mid Cap Select Fund-Level Fee Rate |
Small Cap Select Fund-Level Fee Rate |
|||||||||
| For the first $125 million |
.5500 | % | .7000 | % | .7000 | % | ||||||
| For the next $125 million |
.5375 | .6875 | .6875 | |||||||||
| For the next $250 million |
.5250 | .6750 | .6750 | |||||||||
| For the next $500 million |
.5125 | .6625 | .6625 | |||||||||
| For the next $1 billion |
.5000 | .6500 | .6500 | |||||||||
| For net assets over $2 billion |
.4750 | .6250 | .6250 | |||||||||
| Nuveen Investments | 45 |
Notes to Financial Statements (Unaudited) (continued)
The annual complex-level fee for each Fund, payable monthly, is determined by taking the complex-level fee rate, which is based on the aggregate amount of “eligible assets” of all Nuveen funds as set forth in the schedule below, and making, as appropriate, an upward adjustment to that rate based upon the percentage of the particular fund’s assets that are not “eligible assets.” The complex-level fee schedule for each Fund is as follows:
| Complex-Level Asset Breakpoint Level* | Effective Rate at Breakpoint Level | |||
| $55 billion |
.2000 | % | ||
| $56 billion |
.1996 | |||
| $57 billion |
.1989 | |||
| $60 billion |
.1961 | |||
| $63 billion |
.1931 | |||
| $66 billion |
.1900 | |||
| $71 billion |
.1851 | |||
| $76 billion |
.1806 | |||
| $80 billion |
.1773 | |||
| $91 billion |
.1691 | |||
| $125 billion |
.1599 | |||
| $200 billion |
.1505 | |||
| $250 billion |
.1469 | |||
| $300 billion |
.1445 | |||
| * | The complex-level fee is calculated based upon the aggregate daily “eligible assets” of all Nuveen Funds. Eligible assets do not include assets attributable to investments in other Nuveen Funds or assets in excess of $2 billion added to the Nuveen Fund complex in connection with the Adviser’s assumption of the management of the former First American Funds effective January 1, 2011. Eligible assets include closed-end fund assets managed by the Adviser that are attributable to financial leverage. For these purposes, financial leverage includes the closed-end funds’ use of preferred stock and borrowings and investments in the residual interest certificates (also called inverse floating rate securities) in tender option bond (TOB) trusts, including the portion of assets held by the TOB trust that has been effectively financed by the trust’s issuance of floating rate securities, subject to an agreement by the Adviser as to certain funds to limit the amount of such assets for determining eligible assets in certain circumstances. As of April 30, 2012, the complex-level fee rate for each of these Funds was as follows: |
| Fund | Complex-Level Fee Rate | |||
| Large Cap Select |
.1998 | % | ||
| Mid Cap Select |
.1998 | |||
| Small Cap Select |
.1998 | |||
The management fee compensates the Adviser for overall investment advisory and administrative services and general office facilities. The Adviser is responsible for each Fund’s overall strategy and asset allocation decisions. The Adviser has entered into sub-advisory agreements with Nuveen Asset Management, LLC (the “Sub-Adviser”), a wholly-owned subsidiary of the Adviser, under which the Sub-Adviser manages the investment portfolios of the Funds. The Sub-Adviser will be compensated for its services to the Funds from the management fees paid to the Adviser.
The Adviser has agreed to waive fees and/or reimburse expenses of Mid Cap Select so that total annual Fund operating expenses, after fee waivers and/or expense reimbursements and excluding acquired Fund fees and expenses, do not exceed the percentages of the average daily net assets of any class of Fund shares in the amounts and for the time periods stated in the following table:
| Mid Cap Select |
||||
| Class A Shares |
1.41 | % | ||
| Class C Shares |
2.16 | |||
| Class I Shares |
1.16 | |||
| Expiration Date |
February 28, 2013 | |||
The Adviser has agreed to reimburse management fees across all share classes of Large Cap Select and Small Cap Select through December 31, 2012, to the extent necessary to maintain Class I Share total annual operating expenses, not including any acquired fund fees and expenses, at the applicable percentage of daily net assets listed in the Maximum Expense Level row of the following table, provided that in no event will the Adviser be required to make any reimbursements that would result in an annualized net management fee of less than the applicable percentage of daily net assets listed in the Minimum Management Fee row of the following table.
| Large Cap Select |
Small Cap Select |
|||||||
| Maximum Expense Level |
1.13 | % | 1.00 | % | ||||
| Minimum Management Fee |
.75 | .80 | ||||||
The Adviser may also voluntarily reimburse expenses from time to time in any of the Funds. Voluntary reimbursements may be terminated at any time at the Adviser’s discretion.
| 46 | Nuveen Investments |
The Trust pays no compensation directly to those of its directors who are affiliated with the Adviser or to its officers, all of whom receive remuneration for their services to the Trust from the Adviser or its affiliates. The Board of Directors has adopted a deferred compensation plan for independent directors that enable directors to elect to defer receipt of all or a portion of the annual compensation they are entitled to receive from certain Nuveen-advised funds. Under the plan, deferred amounts are treated as though equal dollar amounts had been invested in shares of select Nuveen-advised funds.
During the six months ended April 30, 2012, Nuveen Securities, LLC (the “Distributor”), a wholly-owned subsidiary of Nuveen, collected sales charges on purchases of Class A Shares, the majority of which were paid out as concessions to financial intermediaries as follows:
| Large Cap Select |
Mid Cap Select |
Small Cap Select |
||||||||||
| Sales charges collected |
$ | 1,629 | $ | 4,652 | $ | 20,831 | ||||||
| Paid to financial intermediaries |
1,423 | 4,066 | 18,209 | |||||||||
The Distributor also received 12b-1 service fees on Class A Shares, substantially all of which were paid to compensate financial intermediaries for providing services to shareholders relating to their investments.
During the six months ended April 30, 2012, the Distributor compensated financial intermediaries directly with commission advances at the time of purchase as follows:
| Large Cap Select |
Mid Cap Select |
Small Cap Select |
||||||||||
| Commission advances |
$ | — | $ | 307 | $ | 1,532 | ||||||
To compensate for commissions advanced to financial intermediaries, all 12b-1 service and distribution fees collected on Class B Shares and Class C Shares during the first year following a purchase were retained by the Distributor. During the six months ended April 30, 2012, the Distributor retained such 12b-1 fees as follows:
| Large Cap Select |
Mid Cap Select |
Small Cap Select |
||||||||||
| 12b-1 fees retained |
$ | — | $ | 2,124 | $ | 14,231 | ||||||
The remaining 12b-1 fees charged to the Funds were paid to compensate financial intermediaries for providing services to shareholders relating to their investments.
The Distributor also collected and retained CDSC on share redemptions during the six months ended April 30, 2012, as follows:
| Large Cap Select |
Mid Cap Select |
Small Cap Select |
||||||||||
| CDSC retained |
$ | — | $ | 349 | $ | 1,281 | ||||||
8. New Accounting Pronouncements
Fair Value Measurements and Disclosures
On May 12, 2011, the Financial Accounting Standards Board (“FASB”) issued Accounting Standards Update (“ASU”) No. 2011-04 (“ASU No. 2011-04”) modifying Topic 820, Fair Value Measurements and Disclosures. At the same time, the International Accounting Standards Board (“IASB”) issued International Financial Reporting Standard (“IFRS”) 13, Fair Value Measurement. The objective of the FASB and IASB is convergence of their guidance on fair value measurements and disclosures. Specifically, ASU No. 2011-04 requires reporting entities to disclose i) the amounts of any transfers between Level 1 and Level 2 and the reasons for the transfers and ii) for Level 3 fair value measurements, a) quantitative information about significant unobservable inputs used, b) a description of the valuation processes used by the reporting entity and c) a narrative description of the sensitivity of the fair value measurement to changes in unobservable inputs if a change in those inputs might result in a significantly higher or lower fair value measurement. The effective date of ASU No. 2011-04 is for interim and annual periods beginning after December 15, 2011. At this time, management is evaluating the implications of this guidance and the impact it will have to the financial statement amounts and footnote disclosures, if any.
| Nuveen Investments | 47 |
Notes
| 48 | Nuveen Investments |
Notes
| Nuveen Investments | 49 |
Glossary of Terms Used in this Report
Average Annual Total Return: This is a commonly used method to express an investment’s performance over a particular, usually multi-year time period. It expresses the return that would have been necessary each year to equal the investment’s actual cumulative performance (including change in NAV or offer price and reinvested distributions and capital gains, if any) over the time period being considered.
Beta: A measure of the variability of the change in the share price for a fund in relation to a change in the value of the fund’s market benchmark. Securities with betas higher than 1.0 have been, and are expected to be, more volatile than the benchmark; securities with betas lower than 1.0 have been, and are expected to be, less volatile than the benchmark.
Lipper Large-Cap Core Funds Classification Average: Represents the average annualized total return for all reporting funds in the Lipper Large-Cap Core Funds Classification. Lipper returns account for the effects of management fees and assume reinvestment of distributions but do not reflect any applicable sales charges.
Lipper Mid-Cap Growth Funds Classification Average: Represents the average annualized total return for all reporting funds in the Lipper Mid-Cap Growth Funds Classification. Lipper returns account for the effects of management fees and assume reinvestment of distributions but do not reflect any applicable sales charges.
Lipper Small-Cap Core Funds Classification Average: Represents the average annualized total return for all reporting funds in the Lipper Small-Cap Core Funds Classification. Lipper returns account for the effects of management fees and assume reinvestment of distributions but do not reflect any applicable sales charges.
Net Asset Value (NAV): The net market value of all securities held in a portfolio.
Net Asset Value (NAV) Per Share: The market value of one share of a mutual fund or closed-end fund. For a Fund, the NAV is calculated daily by taking the Fund’s total assets (securities, cash, and accrued earnings), subtracting the Fund’s liabilities, and dividing by the number of shares outstanding.
Russell 2000® Index: An index that measures the performance of the small-cap segment of the U.S. equity universe. The Russell 2000 is a subset of the Russell 3000® Index representing approximately 10% of the total market capitalization of that index. It includes approximately 2,000 of the smallest securities based on a combination of their market cap and current index membership. The index returns assume reinvestment of distributions, but do not reflect any applicable sales charges or management fees.
Russell MidCap® Index: An index that measures the performance of the mid-cap segment of the U.S. equity universe. The Russell Midcap is a subset of the Russell 1000® Index. It includes approximately 800 of the smallest securities based on a combination of their market cap and current index membership. The Russell Midcap represents approximately 31% of the total market capitalization of the Russell 1000 companies. The index returns assume reinvestment of distributions, but do not reflect any applicable sales charges or management fees.
S&P 500® Index: An unmanaged index generally considered representative of the U.S. stock market. The index returns assume reinvestment of distributions, but do not reflect any applicable sales charges or management fees.
Tax Equalization: The practice of treating a portion of the distribution made to a redeeming shareholder, which represents his proportionate part of undistributed net investment income and capital gain as a distribution for tax purposes. Such amounts are referred to as the equalization debits (or payments) and will be considered a distribution to the shareholder of net investment income and capital gain for calculation of the Fund’s dividends paid deduction.
| 50 | Nuveen Investments |
* The Board of Directors of the Funds, upon recommendation of the Audit Committee, engaged PricewaterhouseCoopers LLP as the Funds’ independent registered public accounting firm as of March 1, 2011. On December 30, 2011, Ernst & Young, LLP (“Ernst & Young”) completed its work on the October 31, 2011 audits and resigned as the independent registered public accounting firm of the Funds.
Ernst & Young’s report on the Funds’ financial statements for the most recent fiscal year contained no adverse opinion or disclaimer of opinion, and were not qualified or modified as to uncertainty, audit scope or accounting principles. For the most recent fiscal year and through March 1, 2011, there were no disagreements with Ernst & Young on any matter of accounting principles, financial statement disclosure or auditing scope or procedures, which disagreements, if not resolved to the satisfaction of Ernst & Young, would have caused it to make reference to the subject matter of the disagreements in connection with its reports on the Funds’ financial statements.
Quarterly Portfolio of Investments and Proxy Voting information: You may obtain (i) each Fund’s quarterly portfolio of investments, (ii) information regarding how each Fund voted proxies relating to portfolio securities held during the most recent twelve-month period ended June 30, and (iii) a description of the policies and procedures that each Fund used to determine how to vote proxies relating to portfolio securities without charge, upon request, by calling Nuveen Investments at (800) 257-8787 or on Nuveen’s website at www.nuveen.com.
You may also obtain this and other Fund information directly from the Securities and Exchange Commission (SEC). The SEC may charge a copying fee for this information. Visit the SEC on-line at http://www.sec.gov or in person at the SEC’s Public Reference Room in Washington, D.C. Call the SEC at (202) 942-8090 for room hours and operation. You may also request Fund information by sending an e-mail request to publicinfo@sec.gov or by writing to the SEC’s Public Reference Section at 100 F Street NE, Washington, D.C. 20549.
The Financial Industry Regulatory Authority (FINRA) provides a Public Disclosure Program which supplies certain information regarding the disciplinary history of FINRA members and their associated persons in response to either telephone inquiries at (800) 289-9999 or written inquiries at www.finra.org. FINRA also provides an investor brochure that includes information describing the Public Disclosure Program.
| Nuveen Investments | 51 |
Nuveen Investments:
Serving Investors for Generations
Since 1898, financial advisors and their clients have relied on Nuveen Investments to provide dependable investment solutions through continued adherence to proven, long-term investing principles. Today, we offer a range of high quality equity and fixed-income solutions designed to be integral components of a well-diversified core portfolio.
Focused on meeting investor needs.
Nuveen Investments provides high-quality investment services designed to help secure the longterm goals of institutional and individual investors as well as the consultants and financial advisors who serve them. Nuveen Investments markets a wide range of specialized investment solutions which provide investors access to capabilities of its high-quality boutique investment affiliates-Nuveen Asset Management, Symphony Asset Management, NWQ Investment Management Company, Santa Barbara Asset Management, Tradewinds Global Investors, Winslow Capital Management, and Gresham Investment Management. In total, Nuveen Investments managed approximately $227 billion as of March 31, 2012.
Find out how we can help you.
To learn more about how the products and services of Nuveen Investments may be able to help you meet your financial goals, talk to your financial advisor, or call us at (800) 257-8787. Please read the information provided carefully before you invest. Investors should consider the investment objective and policies, risk considerations, charges and expenses of any investment carefully. Where applicable, be sure to obtain a prospectus, which contains this and other relevant information. To obtain a prospectus, please contact your securities representative or Nuveen Investments, 333 W. Wacker Dr., Chicago, IL 60606. Please read the prospectus carefully before you invest or send money.
Learn more about Nuveen Funds at: www.nuveen.com/mf
| Distributed by Nuveen Securities, LLC 333 West Wacker Drive Chicago, IL 60606 www.nuveen.com |
MSA-FSLCT-0412P
Item 2. Code of Ethics.
Not applicable to this filing.
Item 3. Audit Committee Financial Expert.
Not applicable to this filing.
Item 4. Principal Accountant Fees and Services.
Not applicable to this filing.
Item 5. Audit Committee of Listed Registrants.
Not applicable to this registrant.
Item 6. Schedule of Investments.
(a) See Portfolio of Investments in Item 1.
(b) Not applicable.
Item 7. Disclosure of Proxy Voting Policies and Procedures for Closed-End Management Investment Companies.
Not applicable to this registrant.
Item 8. Portfolio Managers of Closed-End Management Investment Companies.
Not applicable to this registrant.
Item 9. Purchases of Equity Securities by Closed-End Management Investment Company and Affiliated Purchasers.
Not applicable to this registrant.
Item 10. Submission of Matters to a Vote of Security Holders.
There have been no material changes to the procedures by which shareholders may recommend nominees to the registrant’s Board implemented after the registrant last provided disclosure in response to this item.
Item 11. Controls and Procedures.
| (a) | The registrant’s principal executive and principal financial officers, or persons performing similar functions, have concluded that the registrant’s disclosure controls and procedures (as defined in Rule 30a-3(c) under the Investment Company Act of 1940, as amended (the “1940 Act”) (17 CFR 270.30a-3(c))) are effective, as of a date within 90 days of the filing date of this report that includes the disclosure required by this paragraph, based on their evaluation of the controls and procedures required by Rule 30a-3(b) under the 1940 Act (17 CFR 270.30a-3(b)) and Rules 13a-15(b) or 15d-15(b) under the Securities Exchange Act of 1934, as amended (the “Exchange Act”) (17 CFR 240.13a-15(b) or 240.15d-15(b)). |
| (b) | There were no changes in the registrant’s internal control over financial reporting (as defined in Rule 30a-3(d) under the 1940 Act (17 CFR 270.30a-3(d)) that occurred during the second fiscal quarter of the period covered by this report that has materially affected, or is reasonably likely to materially affect, the registrant’s internal control over financial reporting. |
Item 12. Exhibits.
File the exhibits listed below as part of this Form.
(a)(1) Any code of ethics, or amendment thereto, that is the subject of the disclosure required by Item 2, to the extent that the registrant intends to satisfy the Item 2 requirements through filing of an exhibit: Not applicable to this filing.
(a)(2) A separate certification for each principal executive officer and principal financial officer of the registrant as required by Rule 30a-2(a) under the 1940 Act (17 CFR 270.30a-2(a)) in the exact form set forth below: See EX-99.CERT attached hereto.
(a)(3) Any written solicitation to purchase securities under Rule 23c-1 under the 1940 Act (17 CFR 270.23c-1) sent or given during the period covered by the report by or on behalf of the registrant to 10 or more persons: Not applicable to this registrant.
(b) If the report is filed under Section 13(a) or 15(d) of the Exchange Act, provide the certifications required by Rule 30a-2(b) under the 1940 Act (17 CFR 270.30a-2(b)), Rule 13a-14(b) or Rule 15d-14(b) under the Exchange Act (17 CFR 240.13a-14(b) or 240.15d-14(b)), and Section 1350 of Chapter 63 of Title 18 of the United States Code (18 U.S.C. 1350) as an Exhibit. A certification furnished pursuant to this paragraph will not be deemed “filed” for purposes of Section 18 of the Exchange Act (15 U.S.C. 78r), or otherwise subject to the liability of that section. Such certification will not be deemed to be incorporated by reference into any filing under the Securities Act of 1933 or the Exchange Act, except to the extent that the registration specifically incorporates it by reference: See EX-99.906 CERT attached hereto.
SIGNATURES
Pursuant to the requirements of the Securities Exchange Act of 1934 and the Investment Company Act of 1940, the registrant has duly caused this report to be signed on its behalf by the undersigned, thereunto duly authorized.
(Registrant) Nuveen Investment Funds, Inc.
| By | (Signature and Title) | /s/ Kevin J. McCarthy | ||||
| Kevin J. McCarthy Vice President and Secretary |
Date: July 9, 2012
Pursuant to the requirements of the Securities Exchange Act of 1934 and the Investment Company Act of 1940, this report has been signed below by the following persons on behalf of the registrant and in the capacities and on the dates indicated.
| By | (Signature and Title) | /s/ Gifford R. Zimmerman | ||||
| Gifford R. Zimmerman Chief Administrative Officer (principal executive officer) |
Date: July 9, 2012
| By | (Signature and Title) | /s/ Stephen D. Foy | ||||
| Stephen D. Foy Vice President and Controller (principal financial officer) |
Date: July 9, 2012