UNITED STATES
SECURITIES AND EXCHANGE COMMISSION
Washington, D.C. 20549
FORM N-CSR
CERTIFIED SHAREHOLDER REPORT OF REGISTERED MANAGEMENT
INVESTMENT COMPANIES
Investment Company Act file number 811-05309
Nuveen Investment Funds, Inc.
(Exact name of registrant as specified in charter)
Nuveen Investments
333 West Wacker Drive Chicago, IL 60606
(Address of principal executive offices) (Zip code)
Kevin J. McCarthy
Nuveen Investments
333 West Wacker Drive Chicago, IL 60606
(Name and address of agent for service)
Registrant’s telephone number, including area code: (312) 917-7700
Date of fiscal year end: June 30
Date of reporting period: December 31, 2011
Form N-CSR is to be used by management investment companies to file reports with the Commission not later than 10 days after the transmission to stockholders of any report that is required to be transmitted to stockholders under Rule 30e-1 under the Investment Company Act of 1940 (17 CFR 270.30e-1). The Commission may use the information provided on Form N-CSR in its regulatory, disclosure review, inspection, and policy making roles.
A registrant is required to disclose the information specified by Form N-CSR, and the Commission will make this information public. A registrant is not required to respond to the collection of information contained in Form N-CSR unless the Form displays a currently valid Office of Management and Budget (“OMB”) control number. Please direct comments concerning the accuracy of the information collection burden estimate and any suggestions for reducing the burden to Secretary, Securities and Exchange Commission, 450 Fifth Street, NW, Washington, DC 20549-0609. The OMB has reviewed this collection of information under the clearance requirements of 44 U.S.C. ss.3507.
Item 1. Reports to Stockholders.

Mutual Funds
Nuveen Income Funds
For investors seeking attractive income and portfolio diversification potential.
Semi-Annual Report
December 31, 2011
| Share Class / Ticker Symbol | ||||||||||
| Fund Name | Class A | Class B | Class C | Class R3 | Class I | |||||
| Nuveen Core Bond Fund |
FAFIX | FFIBX | FFAIX | FFISX | FFIIX | |||||
| Nuveen Global Total Return Bond Fund |
NGTAX | — | NGTCX | NGTRX | NGTIX | |||||
| Nuveen High Income Bond Fund |
FJSIX | FJSBX | FCSIX | FANSX | FJSYX | |||||
| Nuveen Inflation Protected Securities Fund |
FAIPX | — | FCIPX | FRIPX | FYIPX | |||||
| Nuveen Intermediate Government Bond Fund |
FIGAX | — | FYGCX | FYGRX | FYGYX | |||||
| Nuveen Intermediate Term Bond Fund |
FAIIX | — | NTIBX | — | FINIX | |||||
| Nuveen Short Term Bond Fund |
FALTX | — | FBSCX | — | FLTIX | |||||
| Nuveen Total Return Bond Fund |
FCDDX | FCBBX | FCBCX | FABSX | FCBYX | |||||
LIFE IS COMPLEX.
Nuveen makes things e-simple.
It only takes a minute to sign up for e-Reports. Once enrolled, you’ll receive an e-mail as soon as your Nuveen Fund information is ready. No more waiting for delivery by regular mail. Just click on the link within the e-mail to see the report and save it on your computer if you wish.
Free e-Reports right to your e-mail!
www.investordelivery.com
If you receive your Nuveen Fund distributions and statements from your financial advisor or brokerage account.
OR
www.nuveen.com/accountaccess
If you receive your Nuveen Fund distributions and statements directly from Nuveen.
| Must be preceded by or accompanied by a prospectus. | NOT FDIC INSURED | MAY LOSE VALUE | NO BANK GUARANTEE |
| 4 | ||||
| 5 | ||||
| 19 | ||||
| 28 | ||||
| 30 | ||||
| 34 | ||||
| 36 | ||||
| 37 | ||||
| 117 | ||||
| 122 | ||||
| 124 | ||||
| 128 | ||||
| 144 | ||||
| 172 | ||||
| 177 | ||||
| 179 | ||||
Letter to Shareholders


| 4 | Nuveen Investments |
Certain statements in this report are forward-looking statements. Discussions of specific investments are for illustration only and are not intended as recommendations of individual investments. The forward-looking statements and other views expressed herein are those of the portfolio managers as of the date of this report. Actual future results or occurrences may differ significantly from those anticipated in any forward-looking statements and the views expressed herein are subject to change at any time, due to numerous market and other factors. The Funds disclaim any obligation to update publicly or revise any forward-looking statements or views expressed herein.
Ratings shown are the highest rating given by one of the following national rating agencies: Standard & Poor’s Group, Moody’s Investors Service, Inc. or Fitch, Inc. Credit ratings are subject to change. AAA, AA, A and BBB are investment grade ratings; BB, B, CCC, CC, C and D are below-investment grade ratings. Certain bonds backed by U.S. Government or agency securities are regarded as having an implied rating equal to the rating of such securities. Holdings designated N/R are not rated by a national rating agency.
These Funds feature portfolio management by Nuveen Asset Management, an affiliate of Nuveen Investments. Here the various portfolio management teams for the Funds examine key investment strategies and the Funds’ performance during the six months ending December 31, 2011. These management teams include:
Nuveen Core Bond Fund
Chris Neuharth, CFA, who has 31 years of investment experience, has managed the Fund since 2006. Timothy Palmer, CFA, with 26 years of investment experience, Wan-Chong Kung, CFA, with 28 years of financial experience, and Jeffrey Ebert, with 21 years of financial experience, have been part of the management team for the Fund since 2003, 2001, and 2005, respectively.
Nuveen Global Total Return Bond Fund
Timothy Palmer, CFA, with 26 years of investment experience, and Steve Lee, CFA, with 12 years of investment experience, have managed the Fund since its inception on December 2, 2011.
Nuveen High Income Bond Fund
John Fruit, CFA, who has 24 years of investment experience, has managed the Fund since 2006. Jeffrey Schmitz, CFA, with 25 years of investment experience, has been part of the management team for the Fund since 2008.
Nuveen Inflation Protected Securities Fund
Wan-Chong Kung, CFA, who has 28 years of investment experience, has managed the Fund since its inception in 2004. Chad Kemper, with 13 years of investment experience, joined the Fund as a co-portfolio manager in October 2010.
Nuveen Intermediate Government Bond Fund
Wan-Chong Kung, CFA, who has 28 years of investment experience, has managed the Fund since 2002. Chris Neuharth, CFA, with 31 years of investment experience, and Jason O’Brien, CFA, with 19 years of investment experience, have been on the Fund’s management team since 2009.
Nuveen Intermediate Term Bond Fund
Wan-Chong Kung, CFA, who has 28 years of financial experience, has managed the Fund since 2002 and Jeffrey Ebert, with 21 years of financial experience, since 2000.
| Nuveen Investments | 5 |
Nuveen Short Term Bond Fund
Chris Neuharth, CFA, who has 31 years of investment experience, has been a co-portfolio manager of the Fund since 2004. Peter Agrimson, CFA, with seven years of investment experience, joined the Fund as a co-portfolio manager on January 1, 2011.
Nuveen Total Return Bond Fund
Timothy Palmer, CFA, with 26 years of investment experience, has been the lead manager of the Fund since 2005. Jeffrey Ebert, who has 21 years of investment experience, has been on the management team since 2000. Marie Newcome, CFA, with 20 years of investment experience, joined the Fund as a co-portfolio manager in 2011.
How did the Funds perform during the six-month period ended December 31, 2011?
The tables in the Fund Performance and Expense Ratios section of this report provide total return performance information for the six-month, one-year, five-year, ten-year and/or since inception periods ending December 31, 2011. Each Fund’s Class A Share total returns are compared with the performance of the appropriate Barclays Capital bond index and Lipper peer fund average.
What strategies were used to manage the Funds during the six-month reporting period? How did these strategies influence performance?
All of the Funds continued to employ the same fundamental investment strategies and tactics used previously, although implementation of those strategies depended on the individual characteristics of the portfolios, as well as market conditions. All of the Fund management teams used a highly collaborative, research-driven approach that we believe offers the best opportunity to achieve consistent, superior long-term performance on a risk-adjusted basis across the full range of market environments. Going into the reporting period, we were generally comfortable with each Fund’s positioning and saw little need to make large-scale shifts to weightings. The Funds also invested in various derivative instruments during this reporting period. These activities are discussed in more detail on page 16.
Nuveen Core Bond Fund
The Fund’s Class A Shares at net asset value (NAV) underperformed both the Barclays Capital Aggregate Bond Index and the Lipper Intermediate Investment Grade Debt Funds Classification Average for the six-month period. Our macro expectation of ongoing global expansion and limited financial contagion from Europe, which prompted us to position the Fund with an underweight to U.S. Treasuries and overweights to non-government bonds, was challenged in the second half of 2011 and was the primary driver of the Fund’s underperformance. Because we believed that the domestic economy would continue to expand modestly and that corporate earnings and balance sheets would remain strong, we maintained the Fund’s overweight to corporate bonds, with a specific emphasis on financial companies and lower rated investment-grade issuers. As the situation with European sovereign debt deteriorated in late summer, investors sought the
| 6 | Nuveen Investments |
safety of U.S. Treasury securities and the market segments that we were emphasizing in the Fund underperformed by fairly wide margins. This resulted in Fund performance that lagged both the benchmark and many peers.
Given that our fundamental view on strong bottom-up credit metrics remained largely intact, we deliberately took advantage of opportunities to add about 5% to our investment-grade corporate exposure, which we funded by trading out of other investment-grade sectors. As time wore on, our conviction that policymakers would be supportive of Europe’s financial system was rewarded with the announcement of several coordinated central bank policy responses late in 2011, which provided a boost to risk assets.
Looking ahead, while there is no immediate fix for the structural problems faced by many eurozone countries, we believe that the combination of providing liquidity to the banking sector, long-term fiscal reform and movement toward fiscal integration will continue to slowly remove “tail risk” fears from the markets. We expect non-U.S. growth will remain choppy, with Europe likely in a recession but, more importantly, China and other emerging economies expanding. We expect the U.S. economy to muddle through with growth likely tapering in early 2012 as fiscal stimulus fades and business spending declines with tax incentives expiring. Job creation has been encouraging and should be supportive of moderate consumer spending.
We think the risk premiums on non-government securities are very attractive given compelling fundamentals and favorable long-term technicals. While volatility for credit sectors will likely remain high, we think investors are being well compensated for this risk and we expect to maintain the Fund’s overweight in this area. Although we are eager to become defensive with our interest rate strategy, the Fund’s duration has been mostly in line with the benchmark. This was done primarily out of respect for ongoing policy accommodation, positioning for periodic risk flares that cause flights to quality, and currently supportive technical factors.
Nuveen Global Total Return Bond Fund
The Fund’s Class A Shares at net asset value underperformed the Barclays Capital Global Aggregate Unhedged Bond Index and the Lipper Global Income Funds Classification Average over the brief period from the Fund’s inception on December 2, 2011, through December 31, 2011.
The Fund was launched and became fully invested during this abbreviated reporting period. The objective of the Fund is to seek total return by investing in a diversified portfolio of securities, of which at least 80% are domestic and international bonds, with a minimum of 40% of the Fund’s net assets in non-U.S. domiciled issuers. Up to 30% of the Fund’s net assets may be invested in securities rated below investment grade at the time of purchase.
During the Fund’s initial invest up, we selected fixed-income securities using an investment process that focused on the fundamental research of our investment team. We also implemented strategies designed to benefit from our expectation of moderate economic growth globally.
During the period, economic data continued to show improvement in the United States and major emerging markets. Central banks around the world continued to provide and expand monetary accommodation and financial liquidity remained high, despite reduced
| Nuveen Investments | 7 |
market trading liquidity into year end. While Europe continued to work haltingly toward addressing fiscal imbalances, the European Central Bank provided meaningful new liquidity support measures intended to stabilize bank funding conditions.
We positioned the Fund to benefit from improving economic growth and positive credit conditions. The Fund had exposure to a broad range of markets and had an overweight in growth-oriented currencies such as the Canadian dollar, Australian dollar and Mexican peso, and an underweight in the euro, Japanese yen and U.S. dollar. Interest rate exposure was modestly less than that of the Barclays Capital benchmark index. From a sector standpoint, key overweights were investment-grade and high-yield corporate securities. The Fund has an underweight stance in government securities from large markets such as the United States, Japan and peripheral Europe, in favor of higher real interest rate markets and non-government sectors broadly.
Going forward, we expect to continue to actively position the Fund based on our fundamental economic research, global market outlook, and country and sector-specific bottom-up research.
Nuveen High Income Bond Fund
The Fund’s Class A Shares at net asset value (NAV) underperformed both the Barclays Capital High Yield 2% Issuer Capped Index and the Lipper High Current Yield Funds Classification Average for the six-month period. The Fund’s relative underperformance was predominately a function of its higher allocation to higher risk and higher yielding securities compared to its peers and to the benchmark. In a period where the macro environment and developments in the European sovereign crisis were the primary drivers of risk appetites, investors generally were rewarded for more conservative portfolio positioning, as opposed to trying to differentiate between individual credits. While the Fund suffered very little in the way of credit losses or deterioration, simply having allocations to less liquid areas of the market — such as emerging market debt, financial hybrids and CCC-rated securities — detracted from performance. Our investment thesis has been to overweight these less liquid but higher yielding securities on the baseline view of slow-to-steady Gross Domestic Product (GDP) growth accompanied by sound corporate fundamentals and declining default risks. While the market volatility seen early in the third quarter of 2011 compromised this strategy to some degree, our underlying assumptions essentially have not changed. We believe that sticking to our strategy will be rewarded once global macro risks start to recede. The yield advantage of moving from BB-rated securities to single B-rated securities at the end of 2011 was 230 basis points and to CCC-rated securities was 755 basis points, according to analysis from Citigroup. These spread differentials moved wider during the period as investors focused on higher quality assets.
We maintained the Fund’s roughly 9% allocation to emerging market (EM) corporate securities, and while fears of a global recession had a negative effect on the pricing of many of these issues, underlying credit quality and fundamentals remained robust. Therefore, we were able to add to some of these holdings at attractive yields as the worst of the credit conditions surfaced early in the fourth quarter. We believe projected default rates in EM regions, similar to domestic high-yield credit, may remain very well behaved over the course of 2012. As a result, we still take a constructive view toward this segment of the market.
| 8 | Nuveen Investments |
The Fund had an allocation to out-of-index holdings of approximately 8% at the end of the reporting period. Much of this allocation was in preferred securities, but also included small allocations to closed-end funds, convertible bonds and high-yielding equities. Financial preferred securities tended to lag the performance of high-yield bonds as the contagion effect from the European banking sector kept a lid on valuations. We anticipate these out-of-index holdings will be a positive contributor if and when interest rates begin to head up, because these securities will demonstrate less interest rate sensitivity than most high-yield bonds, but especially compared to higher quality fixed-income instruments. In the interim, they are a mainstream fixed-income alternative that adds diversification to the Fund’s portfolio.
From a sector standpoint, we continued to overweight securities in oil services as that area benefited from strong energy prices as well as robust drilling activity both domestically and internationally. We added to holdings within the homebuilding and building products industries, which were among the best performers in the fourth quarter of 2011. Despite the well-known challenges these markets have faced since the housing downturn began, the current level of valuations appears attractive if recent data on existing home sales and residential construction are more than simply short-term blips. We added to holdings in the energy, health care and wireless sectors and maintained an overweight to the metals and mining sector. While near-term concerns over China’s growth have garnered much attention, we believe the long-term supply/demand dynamics of most base metals should underpin the credit quality of many of the metals and mining credits that we follow. Within the financial sector, many of the issuers were new entrants into the high-yield universe coming out of the financial crisis and did well as balance sheets were repaired in the banking and insurance sectors.
Fund flows into the high-yield asset class, which had been brisk during the first part of 2011, reversed course to $10.1 billion in outflows from June to mid-September and then back to net inflows of $12.7 billion in the final 15 weeks of the year. The last three months of 2011, alternated between risk on and risk off, as a strong October was followed by a weak November and then a strong December. Market volatility finally began to subside in the final few weeks of the year, albeit on very light volumes. Macro volatility caused the market to trade in a wide range, as the option adjusted spread’s intra-year high of 867 basis points reached on October 4 was more than double the low of 426 basis points from February 8. The trailing twelve-month U.S. speculative grade default rate continued to move downward all year, falling to 1.99% in November, the first sub-2% figure since early 2008. However, default activity picked up in the fourth quarter, and ratings migration momentum has started to swing decidedly downward, suggesting that default rates could soon begin to rise. While some caution is warranted as we await better clarity about developments in Europe, we think any rise in the default rate will remain fairly well contained. All things considered, we think it should prove to be a good environment to focus on individual credit selection by choosing issues that have the wherewithal to survive a slower growth economy and that offer an attractive risk/reward trade-off. We believe that our philosophy of diversifying among not only individual bonds, but also among a variety of asset classes, will assist in providing competitive risk-adjusted returns even if volatile financial market conditions persist in the near term.
| Nuveen Investments | 9 |
Nuveen Inflation Protected Securities Fund
The Fund’s Class A Shares at net asset value (NAV) outperformed the Lipper Treasury Inflation Protected Securities Funds Classification Average but fell short of the Barclays Capital U.S. TIPS Index for the six-month period. This period was marked by two dramatically different investment environments. In the first three months, fixed-income markets experienced a massive flight to quality, driven by the lack of a credible solution to the European debt crisis, months of Congressional debate about the U.S. debt ceiling and slowing global growth readings. Investors flocked to U.S. Treasury securities and rates plummeted as the market priced in weaker growth and future policy responses. Nominal U.S. Treasuries outperformed all other fixed-income asset classes in this environment. Meanwhile, a combination of weaker economic growth data and falling energy prices caused lower inflation expectations as the market anticipated a downturn in the Consumer Price Index (CPI). U.S. Treasury inflation-protected securities (TIPS) fell short of nominal Treasuries, but outperformed other non-government fixed-income securities. Riskier assets endured their worst three-month performance since the liquidity crisis of late 2008 with high-yield and investment-grade corporate securities significantly underperforming U.S. Treasuries, particularly corporate securities in the financial sector.
During this “risk off” environment, the Fund performed in line with its Barclays Capital benchmark and outperformed its peers. Our underweight allocation to TIPS aided performance as this segment fell short of nominal U.S. Treasuries. In addition, the Fund benefited from our relative allocations along the TIPS yield curve, specifically underweights to the front end and the five-year segment. The shortest maturities and five-year bonds were the worst performers on the TIPS curve. However, performance was hindered by the Fund’s approximately 10% allocation to non-U.S. Treasury spread sectors, which underperformed TIPS. These sectors included high yield, commercial mortgage-backed securities (CMBS), asset-backed securities (ABS), mortgage-backed securities (MBS), investment-grade corporate securities, non-dollar-denominated bonds and emerging market debt. An underweight position in the longest maturity TIPS also negatively impacted performance as the flattening yield curve caused their valuations to increase the most.
In the second half of the period, a combination of improved economic indicators and stabilization in Europe assuaged investors’ worst-case fears, causing a strong rally in the equity markets and paving the way for a contraction in fixed-income risk premiums. In the U.S. Treasury market, rates moved slightly lower during the quarter on a flight to safety away from European risk, even as U.S. economic data surprised to the upside. Riskier assets — particularly high-yield corporates, emerging market (EM) debt and CMBS — outpaced U.S. Treasuries by significant margins. Meanwhile, investor interest returned to the TIPS segment despite very low yields. This renewed interest was likely driven by relatively attractive breakeven spreads (the difference between the yields of nominal U.S. Treasuries and TIPS) and anticipation over an improvement in inflation measurements. However, market speculation increased regarding the prospects of another round of easing by the Federal Reserve, which could potentially increase inflation expectations.
In this environment, the Fund continued to outpace its Lipper peer group, but underperformed the Barclays Capital benchmark. Performance versus its peers was
| 10 | Nuveen Investments |
enhanced by our allocation to non-U.S. Treasury spread sectors, which produced positive excess returns. Beneficial weightings included approximately 3% in high-yield corporate securities and 5% in CMBS, the two top-performing domestic fixed-income sectors during the second half of the reporting period. However, the Fund underperformed the Barclays Capital benchmark due to our relative allocations along the TIPS yield curve. The tactical duration moves we made during the six-month period, which changed the Fund’s sensitivity to interest rates, offset each other and did not have a meaningful impact on performance.
During the period, we covered some of the Fund’s underweight position in intermediate maturity TIPS. We also added to the Fund’s weightings in 30-year maturities in both TIPS and nominal U.S. Treasuries as a way to benefit from the flatter yield curve. By the end of the reporting period, the Fund’s TIPS position had increased by approximately 2% of net assets. We expect to see better support for the TIPS segment in the months ahead with the return of investor interest and a potential increase in inflation expectations given the recent rise in gasoline prices. During periods of market weakness, we took advantage of the lower valuations and increased exposure to the high-yield segment by slightly less than 2%. In addition, we modestly reduced the Fund’s CMBS allocation by about 1% as we tried to be cautious with the Fund’s risk allocation, given the negative overall risk environment.
Going forward, we plan to continue increasing the Fund’s TIPS allocation, with a focus on short and intermediate maturities on the yield curve. Also, we are looking for opportunities to increase the Fund’s allocation to riskier assets, given their attractive valuations and supportive fundamentals. However, we recognize that market volatility will likely challenge this positioning periodically and will cause us to take a more tactical approach to our non-U.S. Treasury spread allocations. The Fund’s duration is currently positioned close to neutral, but we intend to continue being very tactical in our positioning.
Nuveen Intermediate Government Bond Fund
The Fund’s Class A Shares at net asset value (NAV) underperformed both the Barclays Capital Intermediate Government Bond Index and the Lipper Intermediate U.S. Government Funds Classification Average for the six-month period. As we entered the reporting period, we had positioned the Fund for a gradual economic recovery with a corresponding view that the fundamental and technical environment for non-U.S. Treasury securities would continue to support their valuations. In addition, we believed that European policymakers were making positive steps toward resolving the region’s sovereign debt crisis. However, fixed-income markets experienced a massive flight to quality in August and September sparked by the convergence of a number of negative factors, including a deterioration of progress in Europe, fears of a global growth slowdown and months of U.S. debt ceiling debate. Rates plummeted and U.S. Treasuries rallied, significantly outperforming all other non-government risk assets, which endured their worst performance since the liquidity crisis of late 2008. Although the market environment reversed later in the period as progress was made on the European front and various economic indicators experienced modest improvement, the recovery was not enough to make up for the earlier shortfall.
| Nuveen Investments | 11 |
In light of this backdrop, the majority of the Fund’s underperformance versus the benchmark and peer group was driven by our sector weightings. In a reversal from the previous reporting period, the Fund’s underweight to U.S. Treasuries was the main negative contributor as all of the spread sectors underperformed during the second half of 2011. The more influential of our Fund’s sector overweights, commercial mortgage-backed securities (CMBS) and mortgage-backed securities (MBS), registered excess returns versus U.S. Treasuries.
During the first three months of the period, we increased the Fund’s CMBS weighting by approximately 3% and its asset-backed security (ABS) exposure by about 1.5% during the weakness in those sectors. This helped offset some of the negative performance as the environment turned positive for CMBS and ABS in the final few months. If the stronger performance for spread sectors continues in 2012, we will look for opportunities to sell out of some of the Fund’s positions into this market strength.
We made several tactical yield curve positioning and duration moves during the period, in order to change the Fund’s sensitivity to interest rates. Those trades proved to be slight detractors to the Fund’s performance during the six-month period as well. With the situation in Europe being far from over, we will stay cautious with the Fund’s duration and yield curve positioning for the time being. However, given the better economic numbers of late and the low level nominal interest rates, we are not looking to be too long versus our benchmark either.
Nuveen Intermediate Term Bond Fund
The Fund’s Class A Shares at net asset value (NAV) fell short of the Barclays Capital Intermediate Government/Credit Bond Index and the Lipper Short-Intermediate Investment Grade Debt Funds Classification Average for the six-month period. Going into the reporting period, we had positioned the Fund for a continued global economic expansion. Second-quarter corporate earnings were strong, domestic credit fundamentals appeared supportive and corporate bond valuations were attractive. Also, European policymakers seemed to be moving toward a coordinated solution to their sovereign debt situation. However in late summer and into the fall, the fixed-income markets experienced a massive flight to quality, which was fueled by the lack of progress toward a credible solution in Europe, fears of a global growth slowdown and months of political wrangling about the U.S. debt ceiling. As the market priced in weaker growth and future policy responses, rates plummeted and U.S. Treasuries rallied. Consequently, U.S. Treasuries significantly outperformed all other non-government risk assets, which endured their worst performance since the liquidity crisis of late 2008. Later in the reporting period, progress on the European front combined with modest improvement in various economic indicators drove a contraction in fixed-income risk premiums. While fixed-income risk assets outpaced U.S. Treasuries by significant margins in the final months of 2011, the recovery was not enough to make up for the earlier shortfall.
In light of this backdrop, the Fund’s underperformance versus the Barclays Capital benchmark was mainly driven by our sector positioning, specifically overweights to risk assets such as commercial mortgage-backed securities (CMBS), investment-grade corporate bonds and mortgage-backed securities (MBS). At the same time, the Fund’s
| 12 | Nuveen Investments |
underweight position in U.S. Treasuries also hurt performance. Excess returns for nearly all risk assets were negative for the overall six-month period ending December 31, 2011.
Although our Fund’s performance suffered from forces external to our markets, we continued to believe that positive bottom-up fundamentals and strong sector-specific technicals would return to the forefront over the long run. We based this view on our outlook for continued modest economic growth and improvements in labor conditions and consumer sentiment over the course of 2012.
Given the move down in the prices of risk assets during the period, particularly investment-grade corporate securities, we changed the size and mix of the Fund’s allocation to these bonds. We added to the Fund’s weighting in investment-grade corporate securities over the period, raising that allocation by nearly 4%. Within the investment-grade sector, we found opportunities in commodity based credits that should benefit from reasonably strong global growth. We also added securities issued by the highest quality, large U.S. banks in the senior part of their capital structures after watching valuations get stretched beyond recession-like levels. We maintained a significant overweight to investment-grade credit as we continued to believe it to be the greatest opportunity to add value.
After seeing valuations in asset-backed securities (ABS), CMBS and MBS hold up better relative to corporate bonds during the period, we pared back the Fund’s positions in those sectors by a combined 7%. In addition, we recognized that the risk of a further deterioration in the sovereign and bank funding crises emanating from Europe was still a possibility; therefore, we increased the Fund’s U.S. Treasury holdings by almost 7%, while still remaining underweight versus the benchmark.
Our duration policy, which indicates the Fund’s sensitivity to interest rate changes, was close to neutral compared to its benchmark throughout most of the period. Therefore, it was not a major factor in the Fund’s performance. With rates at extremely low levels, we anticipate becoming more defensive with the Fund’s interest rate strategy going forward. However, we’ll need to have more conviction about the durability of the domestic recovery and see some progress toward reducing global fiscal uncertainty before shortening the Fund’s duration.
Nuveen Short Term Bond Fund
The Fund’s Class A Shares at net asset value (NAV) underperformed both the Barclays Capital 1-3 Year Government/Credit Bond Index and the Lipper Short Investment Grade Debt Funds Classification Average for the six-month period. We positioned the Fund for ongoing global expansion, with the view that the European sovereign situation would be more quickly addressed by coordinated policy efforts. With domestic bottom-up credit fundamentals very supportive and valuations on corporate bonds at attractive levels in mid-2011, we viewed the long-term risk/reward for both high-grade and high-yield corporate bonds as quite compelling. Therefore, the Fund entered the reporting period with overweight positions in both investment-grade and noninvestment-grade corporate bonds. Consistent with our view of an expanding global economy and very low U.S. Treasury rates, the Fund held an underweight position relative to government-backed securities and maintained exposure to sectors such as higher quality commercial mortgage-backed securities (CMBS) and asset-backed securities (ABS).
| Nuveen Investments | 13 |
As the situation with European sovereign debt deteriorated in late summer, this positioning proved challenging as investors sought the safety of U.S. Treasury securities. The market segments that we were emphasizing in the Fund underperformed government bonds, resulting in performance that lagged both the benchmark and many peers over the summer months. However, our conviction in our macro views was rewarded in the final months of the year. Market fears about global recession and financial system contagion were soothed as economic data proved to be much better than expected and several coordinated central bank policy responses designed to support European financial liquidity were implemented. These were catalysts for a recovery in risk asset pricing, resulting in a strong recovery for the Fund in the final months of the year.
In response to the heightened volatility of the summer months, we took a cautious approach toward managing risk in the portfolio. We gradually added to the Fund’s investment-grade corporate holdings as the reporting period wore on, with offsetting reductions to ABS and CMBS, sectors which held their value much better than corporate securities. Heading into 2012, our fundamental view on strong bottom-up credit metrics remained largely intact and we expect to maintain a significant emphasis on the corporate sector in the Fund.
While there is no immediate fix for the structural problems faced by many eurozone countries, we believe the combination of providing liquidity to the banking sector, long-term fiscal reform and movement toward fiscal integration will continue to slowly remove “tail risk” fears from the markets. Non-U.S. growth will remain choppy, with Europe likely in a recession but, more importantly, China and other emerging economies expanding.
We expect the U.S. economy to muddle through with growth likely tapering in early 2012 as fiscal stimulus fades and business spending declines with tax incentives expiring. Job creation has been encouraging and should be supportive of moderate consumer spending. Risk premiums on non-government securities are very attractive given compelling fundamentals and favorable long-term technicals. Our interest rate strategy is currently defensive relative to the benchmark, simply due to the extremely unattractive rate levels at the short end of the curve.
Nuveen Total Return Bond Fund
The Fund’s Class A Shares at net asset value (NAV) underperformed both the Barclays Capital Aggregate Bond Index and the Lipper Intermediate Investment Grade Debt Funds Classification Average for the six-month period. The Fund’s positioning for an improvement in global financial market conditions hindered results during the first half of the semi-annual reporting period, but helped in the second half. However, the Fund’s recovery in the latter months was not enough to make up for the earlier shortfall, leading to the Fund’s underperformance for the period.
Heading into the period, we positioned the Fund for an ongoing economic expansion as second-quarter corporate earnings were strong, credit metrics across the investment-grade and high-yield sectors remained fundamentally supportive and capital, liquidity and credit trends at financials continued to be constructive. However, fixed-income markets experienced a massive flight to quality in August and September, driven by a lack of a credible solution to the European debt crisis, months of Congressional debate about the
| 14 | Nuveen Investments |
U.S. debt ceiling and fears of slowing economic growth. U.S. Treasuries rallied and rates plummeted as the market priced in weaker growth and future policy responses. With this backdrop, in the third quarter non-government fixed-income securities endured their worst three-month performance since the liquidity crisis of late 2008. High-yield and investment-grade corporate securities significantly underperformed U.S. Treasuries with financials performing particularly poorly amid the stresses in Europe. In this so-called “risk off” environment, the Fund underperformed, particularly due to our overweight position in investment-grade corporate securities, with specific emphasis on financials and lower rated, high-grade holdings. The Fund’s substantial overweight in high-yield corporate securities was also detrimental. Additionally, our overweight in foreign bonds and currencies did not prove fruitful in the risk averse environment, despite the strong growth fundamentals, compelling yields and attractive credit profiles of select overseas markets.
In the second half of the period, a combination of improved economic indicators and stabilization in Europe caused a strong rally in the equity markets, paving the way for a contraction in fixed-income risk premiums. Fixed-income risk assets — particularly high-yield corporate securities, but also emerging market (EM) debt and commercial mortgage-backed securities (CMBS) — outpaced U.S. Treasuries by significant margins. In a significant reversal from the previous few months, the Fund benefited from its overweight in investment-grade corporate securities, particularly the previously noted emphasis on lower-rated, investment-grade financial sector holdings. An overweight in high yield and CMBS also added to results as these asset classes were the top two performers. In addition, foreign currency exposure in some of the strongest performing countries such as Canada and Australia proved beneficial. This environment helped the Fund recover some of the underperformance experienced during third-quarter’s global market sell-off.
We maintained the Fund’s overall positioning for an improving economic environment throughout the period; however, we did make smaller scaled shifts that were geared toward improving its profile in response to changing fundamental conditions and significant changes in relative valuations. For example, we modestly lowered exposures to asset-backed securities (ABS), CMBS and high yield holdings by between 1.5% and 0.5% per sector during the period. In the case of CMBS, we reduced our weighting as spreads slowly tightened to levels that no longer appeared compelling relative to corporate securities and MBS. Within high yield, emerging markets and foreign bonds, we used market volatility to reposition the Fund with respect to individual credit and country/currency selection.
During periods of market weakness, we took advantage of the lower valuations and added exposure to the corporate segment, increasing the Fund’s exposure to investment-grade bonds by approximately 4%. We also continued to find relative value opportunities within sectors and rotated corporate holdings (both high-yield and investment grade) into new credits identified through our research process. On the heels of the flight to quality, we moved to further underweight U.S. Treasuries and agencies in the portfolio.
Early in the period, as stress built in the financial markets, we positioned the Fund’s duration closer to neutral versus the benchmark and with more exposure to the long end of the yield curve. Therefore, our duration positioning, which indicates the Fund’s sensitivity to interest rate changes, had a minimal impact on performance.
| Nuveen Investments | 15 |
We are encouraged by recent improvements in U.S. economic data and expect global growth to remain on track, supporting risk appetite and valuations in financial markets. While there is no near-term fix for the European debt and banking crisis, ongoing fiscal efforts and the provision of substantial liquidity to the banking system will provide a supporting framework that will gradually reduce financial crisis “tail risk” premiums in the market. The markets are likely to increasingly shift their focus toward strong corporate fundamentals and the improved global economic environment. As a result, even though continued market volatility is likely, we expect credit and other non-government sectors of the market to outperform over reasonable investment horizons.
With this outlook in mind, we continue to overweight investment-grade and high-yield corporate bonds as well as structured assets such as ABS and CMBS. We also remain constructive on select growth-oriented, higher yielding foreign currencies and bonds and see value in emerging market debt. Despite near-term uncertainty and volatility, we believe investors are best served by focusing on the long-term benefits of owning fundamentally sound assets at attractive valuations. As markets stabilize and focus shifts away from global shocks and high asset correlation, we believe individual credit, industry and country/currency selection will exhibit a greater impact on investment performance. In a slow growth global environment, the rising tide will not necessarily lift all boats, so we believe security selection and flexibility will be key.
Despite the historically low interest rates, we will continue to maintain the Fund’s duration positioning near that of its benchmark index, given the Federal Reserve’s ongoing provision of substantial liquidity and low inflationary pressures. Our longer term bias is for moderately higher rates, but future positioning will be dependent on market risk appetite, valuations and the unfolding paths of global growth and policy.
Investments in Derivatives
All of the Funds invested in futures contracts. We used long and short U.S. Treasury note and bond futures to manage portfolio duration and yield curve exposure. For example, to increase the duration of the Fund’s portfolio, a long U.S. Treasury bond or Treasury note futures position would be acquired. To manage currency exposure, the Inflation Protected Securities Fund also entered into foreign currency futures, allowing us to manage each Fund’s foreign currency exposure. For example, to reduce unwanted currency exposure from the Fund’s portfolio, a short foreign currency future would be acquired.
The Core Bond Fund, Global Total Return Bond Fund, Inflation Protected Securities Fund, Intermediate Term Bond Fund, Short Term Bond Fund and Total Return Bond Fund entered into credit default swap contacts to add diversified exposure to a broad segment of the credit markets, or to express a view on credit as part of an overall portfolio sector management strategy. For example, to increase the Fund’s credit exposure to the Investment Grade or High Yield Bond segment of the market, a long CDX Investment Grade Index swap and CDX High Yield Index swap, respectively, would be acquired. These Funds, with the exception of Global Total Return Bond Fund, also hedged against changes in interest rate spreads by taking a short interest rate swap position.
| 16 | Nuveen Investments |
In the Global Total Return Bond Fund, Inflation Protected Securities Fund, Short Term Bond Fund, and Total Return Bond Fund we utilized forward foreign currency exchange contracts to manage foreign currency exposure. For example, to reduce unwanted currency exposure from the Fund’s portfolio, a short foreign currency forward would be acquired.
In the Global Total Return Bond Fund and Total Return Bond Fund, we purchased futures options on U.S. Treasury Notes as part of an overall portfolio interest rate strategy. For example, call options may be purchased to hedge the portfolio against adverse interest rate movements while limiting downside exposure to a portfolio.
Risk Considerations
Mutual fund investing involves risk; principal loss is possible. Debt or fixed income securities such as those held by the funds, are subject to market risk, credit risk, interest rate risk, call risk, derivatives risk, and income risk. The value of, and income generated by debt securities will decrease or increase based on changes in market interest rates. As interest rates rise, bond prices fall. Asset-backed and mortgage-backed securities are subject to additional risks such as prepayment risk, liquidity risk, default risk and adverse economic developments.
Below investment grade or high yield debt securities such as those held by the Nuveen Core Bond Fund, the Nuveen Global Total Return Bond Fund, the Nuveen High Income Bond Fund, the Nuveen Inflation Protected Securities Fund, the Nuveen Short Term Bond Fund, and the Nuveen Total Return Bond Fund are subject to liquidity risk and heightened credit risk.
Foreign investments such as those held by the Nuveen Core Bond Fund, the Nuveen Global Total Return Bond Fund, the Nuveen Inflation Protected Securities Fund, the Nuveen Intermediate Term Bond Fund, the Nuveen Short Term Bond Fund, and the Nuveen Total Return Bond Fund involve additional risks, including currency fluctuation, political and economic instability, lack of liquidity and differing legal and accounting standards. For the Nuveen Global Total Return Bond Fund and the Nuveen Total Return Bond Fund, these risks are magnified in emerging markets.
For the Nuveen Inflation Protected Securities Fund, the guarantee provided by the U.S. government to treasury inflation protected securities (TIPS) relates only to the prompt payment of principal and interest and does not remove the market risks of investing in the fund shares. The fund’s investment in inflation protected securities has tax consequences that may result in income distributions to shareholders.
| Nuveen Investments | 17 |
[THIS PAGE INTENTIONALLY LEFT BLANK]
| 18 | Nuveen Investments |
Fund Performance and Expense Ratios (Unaudited)
The Fund Performance and Expense Ratios for each Fund are shown on the following eight pages.
Returns quoted represent past performance, which is no guarantee of future results. Current performance may be higher or lower than the performance shown. Investment returns and principal value will fluctuate so that when shares are redeemed, they may be worth more or less than their original cost. Returns without sales charges would be lower if the sales charge were included. Returns do not reflect the deduction of taxes that a shareholder would pay on Fund distributions or the redemption of Fund shares.
Returns may reflect a contractual agreement between certain Funds and the investment adviser to waive certain fees and expenses; see Notes to Financial Statements, Footnote 7 — Management Fees and Other Transactions with Affiliates for more information. In addition, returns may reflect a voluntary expense limitation by the Funds’ investment adviser that may be modified or discontinued at any time without notice. For the most recent month-end performance visit www.nuveen.com or call (800) 257-8787.
Returns reflect differences in sales charges and expenses, which are primarily differences in distribution and service fees. Fund returns assume reinvestment of dividends and capital gains.
Comparative index and Lipper return information is provided for the Funds’ Class A Shares at net asset value (NAV) only.
The expense ratios shown reflect the Funds’ total operating expenses (before fee waivers or expense reimbursements, if any) as shown in the Funds’ most recent prospectus. The expense ratios include management fees and other fees and expenses.
| Nuveen Investments | 19 |
Fund Performance and Expense Ratios (Unaudited) (continued)
Nuveen Core Bond Fund
Refer to the first page of this Fund Performance and Expense Ratios section for further explanation of the information included within this page.
Fund Performance
Average Annual Total Returns as of December 31, 2011*
| Cumulative | Average Annual | |||||||||||||||
| 6-Month | 1-Year | 5-Year | 10-Year | |||||||||||||
| Class A Shares at NAV |
1.94% | 4.65% | 5.69% | 4.96% | ||||||||||||
| Class A Shares at maximum Offering Price |
-2.41% | 0.23% | 4.77% | 4.51% | ||||||||||||
| Barclays Capital Aggregate Bond Index** |
4.98% | 7.84% | 6.50% | 5.78% | ||||||||||||
| Lipper Intermediate Investment Grade Debt Funds Classification Average** |
3.32% | 6.22% | 5.57% | 5.13% | ||||||||||||
| Class B Shares w/o CDSC |
1.46% | 3.87% | 4.91% | 4.17% | ||||||||||||
| Class B Shares w/CDSC |
-3.54% | -1.13% | 4.74% | 4.17% | ||||||||||||
| Class C Shares |
1.48% | 3.90% | 4.91% | 4.17% | ||||||||||||
| Class R3 Shares |
1.73% | 4.40% | 5.47% | 4.79% | ||||||||||||
| Class I Shares |
1.98% | 4.92% | 5.96% | 5.22% | ||||||||||||
Class A Shares have a maximum 4.25% sales charge (Offering Price). Class A Share purchases of $1 million or more are sold at net asset value without an up-front sales charge but may be subject to a contingent deferred sales charge (CDSC), also known as a back-end sales charge, if redeemed within eighteen months of purchase. Class B Shares have a CDSC that begins at 5% for redemptions during the first year and declines periodically until after six years when the charge becomes 0%. Class B Shares automatically convert to Class A Shares eight years after purchase. Class C Shares have a 1% CDSC for redemptions within less than twelve months, which is not reflected in the one-year total return. Class R3 Shares have no sales charge and are available to only certain retirement plans. Class I Shares have no sales charge and may be purchased under limited circumstances or by specified classes of investors.
Expense Ratios as of Most Recent Prospectus
| Expense Ratios |
||||
| Class A Shares |
0.95% | |||
| Class B Shares |
1.70% | |||
| Class C Shares |
1.70% | |||
| Class R3 Shares |
1.20% | |||
| Class I Shares |
0.70% | |||
| * | Six-month returns are cumulative, all other returns are annualized. |
| ** | Refer to the Glossary of Terms Used in this Report for definitions. |
| 20 | Nuveen Investments |
Fund Performance and Expense Ratios
Nuveen Global Total Return Bond Fund
Refer to the first page of this Fund Performance and Expense Ratios section for further explanation of the information included within this page.
Fund Performance
Cumulative Total Returns as of December 31, 2011
| Cumulative | ||||
| Since Inception* |
||||
| Class A Shares at NAV |
-0.35% | |||
| Class A Shares at maximum Offering Price |
-5.10% | |||
| Barclays Capital Global Aggregate Unhedged Bond Index** |
0.48% | |||
| Lipper Global Income Funds Classification Average** |
0.53% | |||
| Class C Shares |
-0.40% | |||
| Class R3 Shares |
-0.40% | |||
| Class I Shares |
-0.35% | |||
Class A Shares have a maximum 4.75% sales charge (Offering Price). Class A Share purchases of $1 million or more are sold at net asset value without an up-front sales charge but may be subject to a contingent deferred sales charge (CDSC), also known as a back-end sales charge, if redeemed within eighteen months of purchase. Class C Shares have a 1% CDSC for redemptions within less than twelve months, which is not reflected in the one-year total return. Class R3 Shares have no sales charge and are available to only certain retirement plans. Class I Shares have no sales charge and may be purchased under limited circumstances or by specified classes of investors.
Expense Ratios as of Most Recent Prospectus
| Gross Expense Ratios |
Net Expense Ratios |
|||||||
| Class A Shares |
1.18% | 1.00% | ||||||
| Class C Shares |
1.93% | 1.75% | ||||||
| Class R3 Shares |
1.43% | 1.25% | ||||||
| Class I Shares |
0.93% | 0.75% | ||||||
The Fund’s investment adviser has agreed to waive fees and/or reimburse expenses through October 31, 2014, so that total annual Fund operating expenses (excluding 12b-1 distribution and/or service fees, interest expenses, taxes, fees incurred in acquiring and disposing of portfolio securities, and extraordinary expenses) do not exceed 0.75% of the average daily net assets of any class of Fund shares. The expense limitation expiring October 31, 2014, may be terminated or modified prior to that date only with the approval of the Board of Trustees of the Fund.
| * | Since inception returns are from 12/02/11. |
| ** | Refer to the Glossary of Terms Used in this Report for definitions. |
| Nuveen Investments | 21 |
Fund Performance and Expense Ratios (Unaudited) (continued)
Nuveen High Income Bond Fund
Refer to the first page of this Fund Performance and Expense Ratios section for further explanation of the information included within this page.
Fund Performance
Average Annual Total Returns as of December 31, 2011*
| Cumulative | Average Annual | |||||||||||||||
| 6-Month | 1-Year | 5-Year | 10-Year | |||||||||||||
| Class A Shares at NAV |
-3.71% | 0.97% | 5.66% | 7.29% | ||||||||||||
| Class A Shares at maximum Offering Price |
-8.27% | -3.87% | 4.64% | 6.78% | ||||||||||||
| Barclays Capital High Yield 2% Issuer Capped Index** |
-0.02% | 4.96% | 7.74% | 8.96% | ||||||||||||
| Lipper High Current Yield Funds Classification Average** |
-1.41% | 2.81% | 5.10% | 6.99% | ||||||||||||
| Class B Shares w/o CDSC |
-3.92% | 0.39% | 4.87% | 6.52% | ||||||||||||
| Class B Shares w/CDSC |
-8.54% | -4.29% | 4.73% | 6.52% | ||||||||||||
| Class C Shares |
-3.91% | 0.40% | 4.91% | 6.53% | ||||||||||||
| Class R3 Shares |
-3.70% | 0.93% | 5.41% | 7.09% | ||||||||||||
| Class I Shares |
-3.47% | 1.35% | 5.92% | 7.57% | ||||||||||||
Class A Shares have a maximum 4.75% sales charge (Offering Price). Class A Share purchases of $1 million or more are sold at net asset value without an up-front sales charge but may be subject to a contingent deferred sales charge (CDSC), also known as a back-end sales charge, if redeemed within eighteen months of purchase. Class B Shares have a CDSC that begins at 5% for redemptions during the first year and declines periodically until after six years when the charge becomes 0%. Class B Shares automatically convert to Class A Shares eight years after purchase. Class C Shares have a 1% CDSC for redemptions within less than twelve months, which is not reflected in the one-year total return. Class R3 Shares have no sales charge and are available to only certain retirement plans. Class I Shares have no sales charge and may be purchased under limited circumstances or by specified classes of investors.
| Expense Ratios as of Most Recent Prospectus | ||||
| Expense Ratios |
||||
| Class A Shares |
1.11% | |||
| Class B Shares |
1.86% | |||
| Class C Shares |
1.86% | |||
| Class R3 Shares |
1.36% | |||
| Class I Shares |
0.86% | |||
| * | Six-month returns are cumulative; all other returns are annualized. |
| ** | Refer to the Glossary of Terms Used in this Report for definitions. |
| 22 | Nuveen Investments |
Fund Performance and Expense Ratios
Nuveen Inflation Protected Securities Fund
Refer to the first page of this Fund Performance and Expense Ratios section for further explanation of the information included within this page.
Fund Performance
Average Annual Total Returns as of December 31, 2011*
| Cumulative | Average Annual | |||||||||||||||
| 6-Month | 1-Year | 5-Year | Since Inception** |
|||||||||||||
| Class A Shares at NAV |
7.23% | 12.74% | 7.42% | 5.75% | ||||||||||||
| Class A Shares at maximum Offering Price |
2.63% | 7.99% | 6.49% | 5.12% | ||||||||||||
| Barclays Capital U.S. TIPs Index*** |
7.32% | 13.56% | 7.95% | 6.34% | ||||||||||||
| Lipper Treasury Inflation Protected Securities Funds Classification Average*** |
5.36% | 11.03% | 6.67% | 5.67% | ||||||||||||
| Class C Shares |
6.82% | 11.94% | 6.61% | 4.94% | ||||||||||||
| Class R3 Shares |
7.10% | 12.42% | 7.01% | 5.40% | ||||||||||||
| Class I Shares |
7.26% | 13.02% | 7.66% | 5.99% | ||||||||||||
Class A Shares have a maximum 4.25% sales charge (Offering Price). Class A Share purchases of $1 million or more are sold at net asset value without an up-front sales charge but may be subject to a contingent deferred sales charge (CDSC), also known as a back-end sales charge, if redeemed within eighteen months of purchase. Class C Shares have a 1% CDSC for redemptions within less than twelve months, which is not reflected in the one-year total return. Class R3 Shares have no sales charge and are available to only certain retirement plans. Class I Shares have no sales charge and may be purchased under limited circumstances or by specified classes of investors.
Expense Ratios as of Most Recent Prospectus
| Gross Expense Ratios |
Net Expense Ratios |
|||||||
| Class A Shares |
1.08% | 0.86% | ||||||
| Class C Shares |
1.83% | 1.61% | ||||||
| Class R3 Shares |
1.33% | 1.11% | ||||||
| Class I Shares |
0.83% | 0.61% | ||||||
The Fund’s investment adviser has contractually agreed to waive fees and/or reimburse other Fund expenses through October 31, 2013, so that total annual Fund operating expenses, after fee waivers and/or expense reimbursements and excluding acquired Fund fees and expenses, do not exceed 0.85%, 1.60%, 1.10% and 0.60% for Class A, Class C, Class R3 and Class I Shares, respectively. Fee waivers and/or expense reimbursements will not be terminated prior to that time without the approval of the Fund’s Board of Directors.
| * | Six-month returns are cumulative; all other returns are annualized. |
| ** | Since inception returns are from 10/01/04. |
| *** | Refer to the Glossary of Terms Used in this Report for definitions. |
| Nuveen Investments | 23 |
Fund Performance and Expense Ratios (Unaudited) (continued)
Nuveen Intermediate Government Bond Fund
Refer to the first page of this Fund Performance and Expense Ratios section for further explanation of the information included within this page.
Fund Performance
Average Annual Total Returns as of December 31, 2011*
| Cumulative | Average Annual | |||||||||||||||
| 6-Month | 1-Year | 5-Year | Since Inception** |
|||||||||||||
| Class A Shares at NAV |
2.90% | 4.98% | 5.34% | 3.93% | ||||||||||||
| Class A Shares at maximum Offering Price |
-0.15% | 1.84% | 4.70% | 3.59% | ||||||||||||
| Barclays Capital Intermediate Government Bond Index*** |
3.90% | 6.08% | 5.86% | 4.50% | ||||||||||||
| Lipper Intermediate U.S. Government Funds Classification Average*** |
4.87% | 6.99% | 5.74% | 4.30% | ||||||||||||
| Class I Shares |
2.97% | 5.13% | 5.49% | 4.09% | ||||||||||||
| Cumulative | Average Annual | |||||||||||
| 6-Month | 1-Year | Since Inception** |
||||||||||
| Class C Shares |
2.46% | 4.18% | 3.60% | |||||||||
| Class R3 Shares |
2.62% | 4.63% | 4.02% | |||||||||
Class A Shares have a maximum 3.00% sales charge (Offering Price). Class A Share purchases of $1 million or more are sold at net asset value without an up-front sales charge but may be subject to a contingent deferred sales charge (CDSC), also known as a back-end sales charge, if redeemed within eighteen months of purchase. Class C Shares have a 1% CDSC for redemptions within less than twelve months, which is not reflected in the one-year total return. Class R3 Shares have no sales charge and are available to only certain retirement plans. Class I Shares have no sales charge and may be purchased under limited circumstances or by specified classes of investors.
| Expense Ratios as of Most Recent Prospectus | ||||||||
| Gross Expense Ratios |
Net Expense Ratios |
|||||||
| Class A Shares |
1.07% | 0.85% | ||||||
| Class C Shares |
1.82% | 1.60% | ||||||
| Class R3 Shares |
1.32% | 1.10% | ||||||
| Class I Shares |
0.82% | 0.60% | ||||||
The Fund’s investment adviser has contractually agreed to waive fees and/or reimburse other Fund expenses through October 31, 2013, so that total annual Fund operating expenses, after fee waivers and/or expense reimbursements and excluding acquired Fund fees and expenses, do not exceed 0.85%, 1.60%, 1.10% and 0.60% for Class A, Class C, Class R3 and Class I Shares, respectively. Fee waivers and/or expense reimbursements will not be terminated prior to that time without the approval of the Fund’s Board of Directors.
| * | Six-month returns are cumulative; all other returns are annualized. |
| ** | Since inception returns for Class A and Class I Shares, and for the comparative index and average, are from 10/25/02. Since inception returns for Class C and Class R3 Shares are from 10/28/09. |
| *** | Refer to the Glossary of Terms Used in this Report for definitions. |
| 24 | Nuveen Investments |
Fund Performance and Expense Ratios
Nuveen Intermediate Term Bond Fund
Refer to the first page of this Fund Performance and Expense Ratios section for further explanation of the information included within this page.
Fund Performance
Average Annual Total Returns as of December 31, 2011*
| Cumulative | Average Annual | |||||||||||||||
| 6-Month | 1-Year | 5-Year | 10-Year | |||||||||||||
| Class A Shares at NAV |
1.49% | 4.02% | 5.50% | 4.71% | ||||||||||||
| Class A Shares at maximum Offering Price |
-1.52% | 0.91% | 4.86% | 4.39% | ||||||||||||
| Barclays Capital Intermediate Government/Credit Bond Index** |
3.25% | 5.80% | 5.88% | 5.20% | ||||||||||||
| Lipper Short-Intermediate Investment Grade Debt Funds Classification Average** |
1.60% | 3.96% | 4.88% | 4.36% | ||||||||||||
| Class I Shares |
1.65% | 4.16% | 5.67% | 4.86% | ||||||||||||
| Cumulative | ||||||||
| 6-Month | Since Inception*** |
|||||||
| Class C Shares |
1.06% | 2.83% | ||||||
Class A Shares have a maximum 3.00% sales charge (Offering Price). Class A Share purchases of $1 million or more are sold at net asset value without an up-front sales charge but may be subject to a contingent deferred sales charge (CDSC), also known as a back-end sales charge, if redeemed within eighteen months of purchase. Class C Shares have a 1% CDSC for redemptions within less than twelve months, which is not reflected in the one-year total return. Class I Shares have no sales charge and may be purchased under limited circumstances or by specified classes of investors.
| Expense Ratios as of Most Recent Prospectus | ||||||||
| Gross Expense Ratios |
Net Expense Ratios |
|||||||
| Class A Shares |
0.96% | 0.95% | ||||||
| Class C Shares |
1.71% | 1.70% | ||||||
| Class I Shares |
0.71% | 0.70% | ||||||
The Fund’s investment adviser has contractually agreed to waive fees and/or reimburse other Fund expenses through October 31, 2013, so that total annual Fund operating expenses, after fee waivers and/or expense reimbursements and excluding acquired Fund fees and expenses, do not exceed 0.95%, 1.70% and 0.70% for Class A, Class C and Class I shares, respectively. Fee waivers and/or expense reimbursements will not be terminated prior to that time without the approval of the Fund’s Board of Directors.
| * | Six-month returns and returns less than one year are cumulative; all other returns are annualized. |
| ** | Refer to the Glossary of Terms Used in this Report for definitions. |
| *** | Since inception return for Class C Shares is from 1/18/11. |
| Nuveen Investments | 25 |
Fund Performance and Expense Ratios (Unaudited) (continued)
Nuveen Short Term Bond Fund
Refer to the first page of this Fund Performance and Expense Ratios section for further explanation of the information included within this page.
Fund Performance
Average Annual Total Returns as of December 31, 2011*
| Cumulative | Average Annual | |||||||||||||||
| 6-Month | 1-Year | 5-Year | 10-Year | |||||||||||||
| Class A Shares at NAV |
-1.02% | 0.48% | 3.40% | 3.11% | ||||||||||||
| Class A Shares at maximum Offering Price |
-3.23% | -1.78% | 2.93% | 2.87% | ||||||||||||
| Barclays Capital 1-3 Year Government/Credit Bond Index** |
0.53% | 1.59% | 3.99% | 3.63% | ||||||||||||
| Lipper Short Investment Grade Debt Funds Classification Average** |
-0.04% | 1.26% | 3.03% | 3.10% | ||||||||||||
| Class I Shares |
-1.03% | 0.56% | 3.54% | 3.25% | ||||||||||||
| Cumulative |
Average Annual | |||||||||||||
| 6-Month | 1-Year | Since Inception*** |
||||||||||||
| Class C Shares |
-1.53% | -0.46% | 1.17% | |||||||||||
| Cumulative | ||||
| Since Inception*** | ||||
| Class R3 Shares |
0.49% | |||
Class A Shares have a maximum 2.25% sales charge (Offering Price). Class A Share purchases of $250,000 or more are sold at net asset value without an up-front sales charge but may be subject to a contingent deferred sales charge (CDSC), also known as a back-end sales charge, if redeemed within eighteen months of purchase. Class C Shares have a 1% CDSC for redemptions within less than twelve months, which is not reflected in the one-year total return. Class R3 Shares have no sales charge and are available to only certain retirement plans. Class I Shares have no sales charge and may be purchased under limited circumstances or by specified classes of investors.
Expense Ratios as of Most Recent Prospectus
| Expense Ratios |
||||
| Class A Shares |
0.79% | |||
| Class C Shares |
1.54% | |||
| Class R3 Shares |
1.04% | |||
| Class I Shares |
0.54% | |||
| * | Six-month returns and returns less than one year are cumulative; all other returns are annualized. |
| ** | Refer to the Glossary of Terms Used in this Report for definitions. |
| *** | Since inception return for Class C Shares is from 10/28/09. Since inception return for Class R3 Shares is from 9/23/11. |
| 26 | Nuveen Investments |
Fund Performance and Expense Ratios
Nuveen Total Return Bond Fund
Refer to the first page of this Fund Performance and Expense Ratios section for further explanation of the information included within this page.
Fund Performance
Average Annual Total Returns as of December 31, 2011*
| Cumulative | Average Annual | |||||||||||||||
| 6-Month | 1-Year | 5-Year | 10-Year | |||||||||||||
| Class A Shares at NAV |
0.10% | 3.34% | 6.77% | 6.01% | ||||||||||||
| Class A Shares at maximum Offering Price |
-4.19% | -1.05% | 5.86% | 5.55% | ||||||||||||
| Barclays Capital Aggregate Bond Index** |
4.98% | 7.84% | 6.50% | 5.78% | ||||||||||||
| Lipper Intermediate Investment Grade Debt Funds Classification Average** |
3.32% | 6.22% | 5.57% | 5.13% | ||||||||||||
| Class B Shares w/o CDSC |
-0.41% | 2.51% | 5.93% | 5.20% | ||||||||||||
| Class B Shares w/CDSC |
-5.31% | -2.45% | 5.77% | 5.20% | ||||||||||||
| Class C Shares |
-0.32% | 2.52% | 5.96% | 5.21% | ||||||||||||
| Class R3 Shares |
-0.13% | 3.03% | 6.42% | 5.79% | ||||||||||||
| Class I Shares |
0.10% | 3.55% | 7.00% | 6.26% | ||||||||||||
Class A Shares have a maximum 4.25% sales charge (Offering Price). Class A Share purchases of $1 million or more are sold at net asset value without an up-front sales charge but may be subject to a contingent deferred sales charge (CDSC), also known as a back-end sales charge, if redeemed within eighteen months of purchase. Class B Shares have a CDSC that begins at 5% for redemptions during the first year and declines periodically until after six years when the charge becomes 0%. Class B Shares automatically convert to Class A Shares eight years after purchase. Class C Shares have a 1% CDSC for redemptions within less than twelve months, which is not reflected in the one-year total return. Class R3 Shares have no sales charge and are available to only certain retirement plans. Class I Shares have no sales charge and may be purchased under limited circumstances or by specified classes of investors.
Expense Ratios as of Most Recent Prospectus
| Gross Expense Ratios |
Net Expense Ratios |
|||||||
| Class A Shares |
0.89% | 0.86% | ||||||
| Class B Shares |
1.64% | 1.61% | ||||||
| Class C Shares |
1.64% | 1.61% | ||||||
| Class R3 Shares |
1.14% | 1.11% | ||||||
| Class I Shares |
0.64% | 0.61% | ||||||
The Fund’s investment adviser has contractually agreed to waive fees and/or reimburse other Fund expenses through October 31, 2013, so that total annual Fund operating expenses, after fee waivers and/or expense reimbursements and excluding acquired Fund fees and expenses, do not exceed 0.84%, 1.59%, 1.59%, 1.09% and 0.59% for Class A, Class B, Class C, Class R3 and Class I Shares, respectively. Fee waivers and/or expense reimbursements will not be terminated prior to that time without the approval of the Fund’s Board of Directors.
| * | Six-month returns are cumulative; all other returns are annualized. |
| ** | Refer to the Glossary of Terms Used in this Report for definitions. |
| Nuveen Investments | 27 |
Yields (Unaudited) as of December 31, 2011
Dividend Yield is the most recent dividend per share (annualized) divided by the offering price per share.
The SEC 30-Day Yield is a standardized measure of a Fund’s yield that accounts for the future amortization of premiums or discounts of bonds held in the Fund’s portfolio. The SEC 30-Day Yield is computed under an SEC standardized formula and is based on the maximum offer price per share. Dividend Yield may differ from the SEC 30-Day Yield because the Fund may be paying out more or less than it is earning and it may not include the effect of amortization of bond premium.
Nuveen Core Bond Fund
| Dividend Yield |
SEC 30-Day Yield |
|||||||
| Class A Shares(1) |
3.51% | 3.37% | ||||||
| Class B Shares |
2.91% | 2.78% | ||||||
| Class C Shares |
2.95% | 2.79% | ||||||
| Class R3 Shares |
3.44% | 3.27% | ||||||
| Class I Shares |
3.91% | 3.77% | ||||||
Nuveen Global Total Return Bond Fund
| Dividend Yield(2) |
SEC 30-Day Yield |
|||||||
| Class A Shares(1) |
0.00% | 1.07% | ||||||
| Class C Shares |
0.00% | 0.47% | ||||||
| Class R3 Shares |
0.00% | 0.91% | ||||||
| Class I Shares |
0.00% | 1.50% | ||||||
Nuveen High Income Bond Fund
| Dividend Yield |
SEC 30-Day Yield |
|||||||
| Class A Shares(1) |
8.07% | 8.87% | ||||||
| Class B Shares |
7.73% | 8.57% | ||||||
| Class C Shares |
7.71% | 8.57% | ||||||
| Class R3 Shares |
8.23% | 9.08% | ||||||
| Class I Shares |
8.76% | 9.59% | ||||||
Nuveen Inflation Protected Securities Fund
| Dividend Yield |
SEC 30-Day Yield |
|||||||
| Class A Shares(1) |
14.39% | -2.22% | ||||||
| Class C Shares |
11.42% | -3.05% | ||||||
| Class R3 Shares |
8.96% | -2.55% | ||||||
| Class I Shares |
15.28% | -2.05% | ||||||
Nuveen Intermediate Government Bond Fund
| Dividend Yield |
SEC 30-Day Yield |
|||||||
| Class A Shares(1) |
2.07% | 1.60% | ||||||
| Class C Shares |
1.27% | 0.81% | ||||||
| Class R3 Shares |
1.80% | 1.31% | ||||||
| Class I Shares |
2.27% | 1.80% | ||||||
Nuveen Intermediate Term Bond Fund
| Dividend Yield |
SEC 30-Day Yield |
|||||||
| Class A Shares(1) |
2.95% | 2.36% | ||||||
| Class C Shares |
2.19% | 1.58% | ||||||
| Class I Shares |
3.16% | 2.57% | ||||||
| 28 | Nuveen Investments |
Yields (Unaudited) (continued) as of December 31, 2011
Nuveen Short Term Bond Fund
| Dividend Yield |
SEC 30-Day Yield |
|||||||
| Class A Shares(1) |
2.74% | 2.45% | ||||||
| Class C Shares |
2.01% | 1.66% | ||||||
| Class R3 Shares |
2.50% | 2.16% | ||||||
| Class I Shares |
2.99% | 2.66% | ||||||
Nuveen Total Return Bond Fund
| Dividend Yield |
SEC 30-Day Yield |
|||||||
| Class A Shares(1) |
3.82% | 3.69% | ||||||
| Class B Shares |
3.15% | 3.11% | ||||||
| Class C Shares |
3.16% | 3.10% | ||||||
| Class R3 Shares |
3.69% | 3.61% | ||||||
| Class I Shares |
4.17% | 4.11% | ||||||
| (1) | The SEC Yield for Class A Shares quoted in the table reflects the maximum sales load. Investors paying a reduced load because of volume discounts, investors paying no load because they qualify for one of the several exclusions from the load, and existing shareholders who previously paid a load but would like to know the SEC Yield applicable to their shares on a going-forward basis, should understand that the SEC Yield effectively applicable to them would be higher than the figure quoted in the table. |
| (2) | The Fund did not declare dividends to shareholders during the period December 2, 2011 (commencement of operations) through December 31, 2011. |
| Nuveen Investments | 29 |
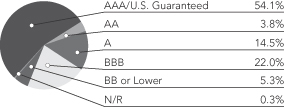
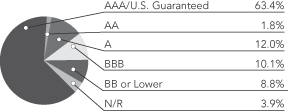
Holding Summaries (Unaudited) as of December 31, 2011
This data relates to the securities held in each Fund’s portfolio of investments. It should not be construed as a measure of performance for the Fund itself.
Ratings shown are the highest rating given by one of the following national rating agencies: Standard & Poor’s Group, Moody’s Investors Service, Inc. or Fitch, Inc. Credit ratings are subject to change. AAA, AA, A and BBB are investment grade ratings; BB, B, CCC, CC, C and D are below investment grade ratings. Certain bonds backed by U.S. Government or agency securities are regarded as having an implied rating equal to the rating of such securities. Holdings designated N/R are not rated by a national rating agency.
| 1 | As a percentage of total investments (excluding money market funds, investments in derivatives and investments purchased with collateral from securities lending) as of December 31, 2011. Holdings are subject to change. |
| 2 | As a percentage of total investments (excluding investments in derivatives and investments purchased with collateral from securities lending) as of December 31, 2011. Holdings are subject to change. |
| 3 | As a percentage of total corporate debt holdings as of December 31, 2011. Corporate debt holdings include corporate bonds (high-yield investment grade rated), convertible bonds, and any other debt instruments issued by a corporation (or that references a corporation) held by the fund at the end of the reporting period. Holdings are subject to change. |
| 4 | As a percentage of total investments (excluding money market funds and investments in derivatives) as of December 31, 2011. Holdings are subject to change. |
| 5 | As a percentage of total investments (excluding investments in derivatives) as of December 31, 2011. Holdings are subject to change. |
| 30 | Nuveen Investments |
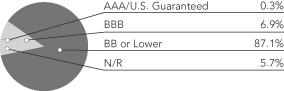
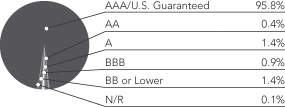
| 1 | As a percentage of total investments (excluding common stocks, exchange-traded funds, investment companies, money market funds, investments in derivatives, investments purchased with collateral from securities lending and warrants) as of December 31, 2011. Holdings are subject to change. |
| 2 | As a percentage of total investments (excluding investments in derivatives and investments purchased with collateral from securities lending) as of December 31, 2011. Holdings are subject to change. |
| 3 | As a percentage of total corporate debt holdings as of December 31, 2011. Corporate debt holdings include corporate bonds (high-yield investment grade rated), convertible bonds, and any other debt instruments issued by a corporation (or that references a corporation) held by the fund at the end of the reporting period. Holdings are subject to change. |
| 4 | As a percentage of total investments (excluding exchange-traded funds, investment companies, money market funds, investments in derivatives and investments purchased with collateral from securities lending) as of December 31, 2011. Holdings are subject to change. |
| 5 | Rounds to less than 0.1%. |
| Nuveen Investments | 31 |
Holding Summaries (Unaudited) (continued) as of December 31, 2011
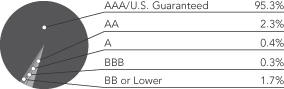
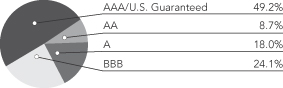
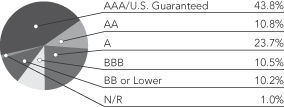
| 1 | As a percentage of total investments (excluding money market funds, investments in derivatives and investments purchased with collateral from securities lending) as of December 31, 2011. Holdings are subject to change. |
| 2 | As a percentage of total investments (excluding investments in derivatives and investments purchased with collateral from securities lending) as of December 31, 2011. Holdings are subject to change. |
| 3 | As a percentage of total corporate debt holdings as of December 31, 2011. Corporate debt holdings include corporate bonds (high-yield investment grade rated), convertible bonds, and any other debt instruments issued by a corporation (or that references a corporation) held by the fund at the end of the reporting period. Holdings are subject to change. |
| 32 | Nuveen Investments |
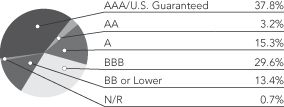
| 1 | As a percentage of total investments (excluding common stock, investment companies, money market funds, investments in derivatives and investments purchased with collateral from securities lending) as of December 31, 2011. Holdings are subject to change. |
| 2 | As a percentage of total investments (excluding investments in derivatives and investments purchased with collateral from securities lending) as of December 31, 2011. Holdings are subject to change. |
| 3 | As a percentage of total corporate debt holdings as of December 31, 2011. Corporate debt holdings include corporate bonds (high-yield investment grade rated), convertible bonds, and any other debt instruments issued by a corporation (or that references a corporation) held by the fund at the end of the reporting period. Holdings are subject to change. |
| 4 | Rounds to less than 0.1%. |
| Nuveen Investments | 33 |
As a shareholder of one or more of the Funds, you incur two types of costs: (1) transaction costs, including up-front and back-end sales charges (loads) or redemption fees, where applicable; and (2) ongoing costs, including management fees; distribution and service (12b-1) fees, where applicable; and other Fund expenses. The Examples below are intended to help you understand your ongoing costs (in dollars) of investing in the Funds and to compare these costs with the ongoing costs of investing in other mutual funds. Since the expense examples for Nuveen Global Total Return Bond Fund reflect only 30 days of the Fund’s operations they may not provide a meaningful understanding of the Fund’s ongoing expenses. Since the expense examples for Class R3 Shares of Nuveen Short Term Bond Fund reflect only the first 100 days of the Class’s operations they may not provide a meaningful understanding of the Class’s ongoing expenses.
The Examples below are based on an investment of $1,000 invested at the beginning of the period and held for the period.
The information under “Actual Performance,” together with the amount you invested, allows you to estimate actual expenses incurred over the reporting period. Simply divide your account value by $1,000 (for example, an $8,600 account value divided by $1,000 = 8.60) and multiply the result by the cost shown for your share class, in the row entitled “Expenses Incurred During Period” to estimate the expenses incurred on your account during this period.
The information under “Hypothetical Performance,” provides information about hypothetical account values and hypothetical expenses based on the respective Fund’s actual expense ratio and an assumed rate of return of 5% per year before expenses, which is not the Fund’s actual return. The hypothetical account values and expenses may not be used to estimate the actual ending account balance or expense you incurred for the period. You may use this information to compare the ongoing costs of investing in the Fund and other Funds. To do so, compare this 5% hypothetical example with the 5% hypothetical examples that appear in the shareholder reports of the other funds.
Please note that the expenses shown in the table are meant to highlight your ongoing costs only and do not reflect any transaction costs. Therefore, the hypothetical information is useful in comparing ongoing costs only, and will not help you determine the relative total costs of owning different funds or share classes. In addition, if these transaction costs were included, your costs would have been higher.
Nuveen Core Bond Fund
| Hypothetical Performance | ||||||||||||||||||||||||||||||||||||||||||
| Actual Performance | (5% annualized return before expenses) | |||||||||||||||||||||||||||||||||||||||||
| A Shares | B Shares | C Shares | R3 Shares | I Shares | A Shares | B Shares | C Shares | R3 Shares | I Shares | |||||||||||||||||||||||||||||||||
| Beginning Account Value (7/01/11) | $ | 1,000.00 | $ | 1,000.00 | $ | 1,000.00 | $ | 1,000.00 | $ | 1,000.00 | $ | 1,000.00 | $ | 1,000.00 | $ | 1,000.00 | $ | 1,000.00 | $ | 1,000.00 | ||||||||||||||||||||||
| Ending Account Value (12/31/11) | $ | 1,019.40 | $ | 1,014.60 | $ | 1,014.80 | $ | 1,017.30 | $ | 1,019.80 | $ | 1,020.42 | $ | 1,016.64 | $ | 1,016.64 | $ | 1,019.16 | $ | 1,021.68 | ||||||||||||||||||||||
| Expenses Incurred During Period | $ | 4.82 | $ | 8.61 | $ | 8.61 | $ | 6.08 | $ | 3.55 | $ | 4.84 | $ | 8.64 | $ | 8.64 | $ | 6.11 | $ | 3.57 | ||||||||||||||||||||||
For each class of the Fund, expenses are equal to the Fund’s annualized net expense ratio of .95%, 1.70%, 1.70%, 1.20% and ..70% for Classes A, B, C, R3 and I, respectively, multiplied by the average account value over the period, multiplied by 184/366 (to reflect the one-half year period).
Nuveen Global Total Return Bond Fund
| Actual Performance | Hypothetical Performance | |||||||||||||||||||||||||||||||||
| A Shares | C Shares | R3 Shares | I Shares | A Shares | C Shares | R3 Shares | I Shares | |||||||||||||||||||||||||||
| Beginning Account Value (12/02/11) | $ | 1,000.00 | $ | 1,000.00 | $ | 1,000.00 | $ | 1,000.00 | $ | 1,000.00 | $ | 1,000.00 | $ | 1,000.00 | $ | 1,000.00 | ||||||||||||||||||
| Ending Account Value (12/31/11) | $ | 996.50 | $ | 996.00 | $ | 996.00 | $ | 996.50 | $ | 1,003.32 | $ | 1,002.70 | $ | 1,003.12 | $ | 1,003.53 | ||||||||||||||||||
| Expenses Incurred During Period | $ | .79 | $ | 1.40 | $ | .99 | $ | .58 | $ | .79 | $ | 1.41 | $ | 1.00 | $ | .58 | ||||||||||||||||||
For each class of the Fund, expenses are equal to the Fund’s annualized net expense ratio of .96%, 1.71%, 1.21%, and .71% for Classes A, C, R3, and I, respectively, multiplied by the average account value over the period, multiplied by 30/366 (to reflect the 30 days in the period since the Fund’s commencement of operations).
Nuveen High Income Bond Fund
| Hypothetical Performance | ||||||||||||||||||||||||||||||||||||||||||
| Actual Performance | (5% annualized return before expenses) | |||||||||||||||||||||||||||||||||||||||||
| A Shares | B Shares | C Shares | R3 Shares | I Shares | A Shares | B Shares | C Shares | R3 Shares | I Shares | |||||||||||||||||||||||||||||||||
| Beginning Account Value (7/01/11) | $ | 1,000.00 | $ | 1,000.00 | $ | 1,000.00 | $ | 1,000.00 | $ | 1,000.00 | $ | 1,000.00 | $ | 1,000.00 | $ | 1,000.00 | $ | 1,000.00 | $ | 1,000.00 | ||||||||||||||||||||||
| Ending Account Value (12/31/11) | $ | 962.90 | $ | 960.80 | $ | 960.90 | $ | 963.00 | $ | 965.30 | $ | 1,019.61 | $ | 1,015.78 | $ | 1,015.68 | $ | 1,018.35 | $ | 1,020.92 | ||||||||||||||||||||||
| Expenses Incurred During Period | $ | 5.48 | $ | 9.22 | $ | 9.32 | $ | 6.71 | $ | 4.20 | $ | 5.65 | $ | 9.50 | $ | 9.60 | $ | 6.92 | $ | 4.33 | ||||||||||||||||||||||
For each class of the Fund, expenses are equal to the Fund’s annualized net expense ratio of 1.10%, 1.87%, 1.89%, 1.35% and ..85% for Classes A, B, C, R3 and I, respectively, multiplied by the average account value over the period, multiplied by 184/366 (to reflect the one-half year period).
| 34 | Nuveen Investments |
Nuveen Inflation Protected Securities Fund
| Hypothetical Performance | ||||||||||||||||||||||||||||||||||
| Actual Performance | (5% annualized return before expenses) | |||||||||||||||||||||||||||||||||
| A Shares | C Shares | R3 Shares | I Shares | A Shares | C Shares | R3 Shares | I Shares | |||||||||||||||||||||||||||
| Beginning Account Value (7/01/11) | $ | 1,000.00 | $ | 1,000.00 | $ | 1,000.00 | $ | 1,000.00 | $ | 1,000.00 | $ | 1,000.00 | $ | 1,000.00 | $ | 1,000.00 | ||||||||||||||||||
| Ending Account Value (12/31/11) | $ | 1,072.30 | $ | 1,068.20 | $ | 1,071.00 | $ | 1,072.60 | $ | 1,020.97 | $ | 1,017.19 | $ | 1,019.71 | $ | 1,022.23 | ||||||||||||||||||
| Expenses Incurred During Period | $ | 4.38 | $ | 8.27 | $ | 5.67 | $ | 3.07 | $ | 4.28 | $ | 8.08 | $ | 5.55 | $ | 3.01 | ||||||||||||||||||
For each class of the Fund, expenses are equal to the Fund’s annualized net expense ratio of .84%, 1.59%, 1.09% and .59% for Classes A, C, R3 and I, respectively, multiplied by the average account value over the period, multiplied by 184/366 (to reflect the one-half year period).
Nuveen Intermediate Government Bond Fund
| Hypothetical Performance | ||||||||||||||||||||||||||||||||||
| Actual Performance | (5% annualized return before expenses) | |||||||||||||||||||||||||||||||||
| A Shares | C Shares | R3 Shares | I Shares | A Shares | C Shares | R3 Shares | I Shares | |||||||||||||||||||||||||||
| Beginning Account Value (7/01/11) | $ | 1,000.00 | $ | 1,000.00 | $ | 1,000.00 | $ | 1,000.00 | $ | 1,000.00 | $ | 1,000.00 | $ | 1,000.00 | $ | 1,000.00 | ||||||||||||||||||
| Ending Account Value (12/31/11) | $ | 1,029.00 | $ | 1,024.60 | $ | 1,026.20 | $ | 1,029.70 | $ | 1,021.37 | $ | 1,017.14 | $ | 1,019.66 | $ | 1,022.18 | ||||||||||||||||||
| Expenses Incurred During Period | $ | 3.83 | $ | 8.14 | $ | 5.60 | $ | 3.06 | $ | 3.82 | $ | 8.13 | $ | 5.60 | $ | 3.06 | ||||||||||||||||||
For each class of the Fund, expenses are equal to the Fund’s annualized net expense ratio of .75%, 1.60%, 1.10% and .60% for Classes A, C, R3 and I, respectively, multiplied by the average account value over the period, multiplied by 184/366 (to reflect the one-half year period).
Nuveen Intermediate Term Bond Fund
| Hypothetical Performance | ||||||||||||||||||||||||||
| Actual Performance | (5% annualized return before expenses) | |||||||||||||||||||||||||
| A Shares | C Shares | I Shares | A Shares | C Shares | I Shares | |||||||||||||||||||||
| Beginning Account Value (7/01/11) | $ | 1,000.00 | $ | 1,000.00 | $ | 1,000.00 | $ | 1,000.00 | $ | 1,000.00 | $ | 1,000.00 | ||||||||||||||
| Ending Account Value (12/31/11) | $ | 1,014.90 | $ | 1,010.60 | $ | 1,016.50 | $ | 1,020.92 | $ | 1,016.64 | $ | 1,021.68 | ||||||||||||||
| Expenses Incurred During Period | $ | 4.31 | $ | 8.59 | $ | 3.55 | $ | 4.33 | $ | 8.64 | $ | 3.57 | ||||||||||||||
For each class of the Fund, expenses are equal to the Fund’s annualized net expense ratio of .85%, 1.70% and .70% for classes A, C and I, respectively, multiplied by the average account value over the period, multiplied by 184/366 (to reflect the one-half year period).
Nuveen Short Term Bond Fund
| Hypothetical Performance | ||||||||||||||||||||||||||||||||||
| Actual Performance | (5% annualized return before expenses) | |||||||||||||||||||||||||||||||||
| A Shares | C Shares | R3 Shares | I Shares | A Shares | C Shares | R3 Shares | I Shares | |||||||||||||||||||||||||||
| Beginning Account Value (7/01/11) | $ | 1,000.00 | $ | 1,000.00 | $ | 1,000.00 | $ | 1,000.00 | $ | 1,000.00 | $ | 1,000.00 | $ | 1,000.00 | $ | 1,000.00 | ||||||||||||||||||
| Ending Account Value (12/31/11) | $ | 989.80 | $ | 984.70 | $ | 1,004.90 | $ | 989.70 | $ | 1,021.58 | $ | 1,016.99 | $ | 1,019.61 | $ | 1,022.33 | ||||||||||||||||||
| Expenses Incurred During Period | $ | 3.60 | $ | 8.13 | $ | 5.59 | $ | 2.85 | $ | 3.67 | $ | 8.29 | $ | 5.65 | $ | 2.91 | ||||||||||||||||||
For each class of the Fund, expenses are equal to the Fund’s annualized net expense ratio of .72%, 1.63% and .57% for Classes A, C and I, respectively, multiplied by the average account value over the period, multiplied by 184/366 (to reflect the one-half year period). For Class R3 of the Fund, expenses are equal to the Fund’s annualized net expense ratio of 1.10% multiplied by the average account value over the period multiplies 100/366 (to reflect 100 days in the period since class commencement of operations).
Nuveen Total Return Bond Fund
| Hypothetical Performance | ||||||||||||||||||||||||||||||||||||||||||
| Actual Performance | (5% annualized return before expenses) | |||||||||||||||||||||||||||||||||||||||||
| A Shares | B Shares | C Shares | R3 Shares | I Shares | A Shares | B Shares | C Shares | R3 Shares | I Shares | |||||||||||||||||||||||||||||||||
| Beginning Account Value (7/01/11) | $ | 1,000.00 | $ | 1,000.00 | $ | 1,000.00 | $ | 1,000.00 | $ | 1,000.00 | $ | 1,000.00 | $ | 1,000.00 | $ | 1,000.00 | $ | 1,000.00 | $ | 1,000.00 | ||||||||||||||||||||||
| Ending Account Value (12/31/11) | $ | 1,001.00 | $ | 995.90 | $ | 996.80 | $ | 998.70 | $ | 1,001.00 | $ | 1,020.76 | $ | 1,016.74 | $ | 1,016.79 | $ | 1,019.26 | $ | 1,021.78 | ||||||||||||||||||||||
| Expenses Incurred During Period | $ | 4.38 | $ | 8.43 | $ | 8.38 | $ | 5.93 | $ | 3.42 | $ | 4.43 | $ | 8.54 | $ | 8.49 | $ | 6.01 | $ | 3.47 | ||||||||||||||||||||||
For each class of the Fund, expenses are equal to the Fund’s annualized net expense ratio of .87%, 1.68%, 1.68%, 1.18% and ..68% for Classes A, B, C, R3 and I, respectively, multiplied by the average account value over the period, multiplied by 184/366 (to reflect the one-half year period).
| Nuveen Investments | 35 |
A special meeting of shareholders was held in the offices of Nuveen Investments on October 28, 2011; at this meeting the shareholders were asked to vote on an Agreement and Plan of Reorganization.
| High Yield Bond Fund |
||||
| To approve an Agreement and Plan of Reorganization (and the related transactions) which provides for (i) the transfer of all the assets of the Acquired Fund to Nuveen High Income Bond Fund (the “Acquiring Fund”) in exchange solely for voting shares of common stock of the Acquiring Fund and the assumption by the Acquiring Fund of all the liabilities of the Acquired Fund; and (ii) the distribution by the Acquired Fund of all the shares of each class of the Acquiring Fund to the holders of shares of the corresponding class of the Acquired Fund in complete liquidation and termination of the Acquired Fund. |
||||
| For |
4,334,981 | |||
| Against |
65,290 | |||
| Abstain |
35,446 | |||
| Broker Non-Votes |
— | |||
| Total |
4,435,717 | |||
| Short Duration Bond Fund |
||||
| To approve an Agreement and Plan of Reorganization (and the related transactions) which provides for (i) the transfer of all the assets of the Acquired Fund to Nuveen Short Term Bond Fund (the “Acquiring Fund”) in exchange solely for voting shares of common stock of the Acquiring Fund and the assumption by the Acquiring Fund of all the liabilities of the Acquired Fund; and (ii) the distribution by the Acquired Fund of all the shares of each class of the Acquiring Fund to the holders of shares of the corresponding class of the Acquired Fund in complete liquidation and termination of the Acquired Fund. |
||||
| For |
4,387,186 | |||
| Against |
45,469 | |||
| Abstain |
106,459 | |||
| Broker Non-Votes |
— | |||
| Total |
4,539,114 | |||
| Multi-Strategy Core Bond Fund |
||||
| To approve an Agreement and Plan of Reorganization (and the related transactions) which provides for (i) the transfer of all the assets of the Acquired Fund to Nuveen Total Return Bond Fund (the “Acquiring Fund”) in exchange solely for voting shares of common stock of the Acquiring Fund and the assumption by the Acquiring Fund of all the liabilities of the Acquired Fund; and (ii) the distribution by the Acquired Fund of all the shares of each class of the Acquiring Fund to the holders of shares of the corresponding class of the Acquired Fund in complete liquidation and termination of the Acquired Fund. |
||||
| For |
2,132,116 | |||
| Against |
16,370 | |||
| Abstain |
41,815 | |||
| Broker Non-Votes |
— | |||
| Total |
2,190,301 | |||
| 36 | Nuveen Investments |
Portfolio of Investments (Unaudited)
Nuveen Core Bond Fund
December 31, 2011
| Principal Amount (000) |
Description (1) | Coupon | Maturity | Ratings (2) | Value | |||||||||||||||
| CORPORATE BONDS – 38.5% |
||||||||||||||||||||
| Aerospace & Defense – 0.3% |
||||||||||||||||||||
| $ | 2,780 | Exelis, Inc., 144A |
5.550% | 10/01/21 | BBB+ | $ | 2,902,376 | |||||||||||||
| Airlines – 0.7% |
||||||||||||||||||||
| 1,740 | Air Canada, 144A, (4) |
9.250% | 8/01/15 | B+ | 1,522,500 | |||||||||||||||
| 2,800 | American Airlines Pass Through Trust 2011-2 |
8.625% | 10/15/21 | BBB– | 2,856,000 | |||||||||||||||
| 1,983 | Northwest Airlines Trust Pass Through Certificates 2007-1 |
7.027% | 11/01/19 | Baa1 | 2,020,520 | |||||||||||||||
| 6,523 | Total Airlines |
6,399,020 | ||||||||||||||||||
| Beverages – 0.3% |
||||||||||||||||||||
| 2,275 | Pernod-Ricard SA, 144A |
5.750% | 4/07/21 | BBB– | 2,566,657 | |||||||||||||||
| Biotechnology – 0.2% |
||||||||||||||||||||
| 1,475 | Gilead Sciences Inc., (4) |
4.400% | 12/01/21 | A– | 1,561,571 | |||||||||||||||
| Capital Markets – 2.8% |
||||||||||||||||||||
| 2,415 | Goldman Sachs Capital II |
5.793% | 6/01/43 | BBB+ | 1,485,225 | |||||||||||||||
| 4,640 | Goldman Sachs Group, Inc. |
6.000% | 6/15/20 | A1 | 4,753,040 | |||||||||||||||
| 2,495 | Goldman Sachs Group, Inc. |
5.250% | 7/27/21 | A1 | 2,433,972 | |||||||||||||||
| 3,685 | Goldman Sachs Group, Inc. |
6.750% | 10/01/37 | A2 | 3,428,940 | |||||||||||||||
| 6,250 | Morgan Stanley |
5.500% | 7/24/20 | A | 5,682,688 | |||||||||||||||
| 3,375 | Morgan Stanley |
5.750% | 1/25/21 | A | 3,148,220 | |||||||||||||||
| 5,200 | Morgan Stanley, (4) |
5.500% | 7/28/21 | A2 | 4,808,102 | |||||||||||||||
| 28,060 | Total Capital Markets |
25,740,187 | ||||||||||||||||||
| Chemicals – 1.0% |
||||||||||||||||||||
| 2,375 | Braskem Finance Limited, 144A, (4) |
5.750% | 4/15/21 | BBB– | 2,357,188 | |||||||||||||||
| 1,515 | Ecolab Inc. |
4.350% | 12/08/21 | BBB+ | 1,617,852 | |||||||||||||||
| 3,830 | Incitec Pivot Finance, 144A |
6.000% | 12/10/19 | BBB | 4,184,765 | |||||||||||||||
| 1,000 | LyondellBasell Industries NV, 144A, (4) |
6.000% | 11/15/21 | BB+ | 1,037,500 | |||||||||||||||
| 8,720 | Total Chemicals |
9,197,305 | ||||||||||||||||||
| Commercial Banks – 3.0% |
||||||||||||||||||||
| 4,350 | Australia and New Zealand Banking Group Limited, 144A |
2.400% | 11/23/16 | AAA | 4,308,923 | |||||||||||||||
| 1,910 | Banco Bradesco S.A. Grand Cayman, 144A |
4.125% | 5/16/16 | Baa1 | 1,926,235 | |||||||||||||||
| 2,900 | Bancolombia SA |
5.950% | 6/03/21 | Baa2 | 2,910,875 | |||||||||||||||
| 1,425 | BBVA Bancomer SA Texas, 144A |
4.500% | 3/10/16 | A1 | 1,396,500 | |||||||||||||||
| 1,106 | FNBC 1993-A Pas Through Trust Certificates |
8.080% | 1/05/18 | Aa1 | 1,250,913 | |||||||||||||||
| 1,890 | HSBC Holdings PLC |
6.800% | 6/01/38 | AA– | 1,957,560 | |||||||||||||||
| 4,250 | Lloyds TSB Bank, (4) |
4.875% | 1/21/16 | A1 | 4,141,982 | |||||||||||||||
| 3,675 | Sovereign Bank |
8.750% | 5/30/18 | A | 4,097,585 | |||||||||||||||
| 3,500 | Wachovia Capital Trust III |
5.570% | 3/29/49 | A | 2,931,250 | |||||||||||||||
| 2,760 | Wells Fargo Capital Trust X |
5.950% | 12/15/36 | A | 2,763,450 | |||||||||||||||
| 27,766 | Total Commercial Banks |
27,685,273 | ||||||||||||||||||
| Commercial Services & Supplies – 0.4% |
||||||||||||||||||||
| 1,990 | Donnelley & Son Company |
7.625% | 6/15/20 | BBB | 1,860,650 | |||||||||||||||
| 1,715 | International Lease Finance Corporation |
8.875% | 9/01/17 | BBB– | 1,775,025 | |||||||||||||||
| 3,705 | Total Commercial Services & Supplies |
3,635,675 | ||||||||||||||||||
| Nuveen Investments | 37 |
Portfolio of Investments (Unaudited)
Nuveen Core Bond Fund (continued)
December 31, 2011
| Principal Amount (000) |
Description (1) | Coupon | Maturity | Ratings (2) | Value | |||||||||||||||
| Computers & Peripherals – 0.2% |
||||||||||||||||||||
| $ | 1,935 | Hewlett Packard Company, (4) |
4.650% | 12/09/21 | A | $ | 2,041,580 | |||||||||||||
| Consumer Finance – 1.3% |
||||||||||||||||||||
| 1,650 | Ally Financial Inc., (4) |
7.500% | 9/15/20 | BB | 1,666,500 | |||||||||||||||
| 2,790 | Capital One Bank |
8.800% | 7/15/19 | BBB+ | 3,191,732 | |||||||||||||||
| 2,570 | Capital One Financial Corporation, (4) |
4.750% | 7/15/21 | A– | 2,644,820 | |||||||||||||||
| 3,690 | Discover Financial Services |
10.250% | 7/15/19 | BBB | 4,497,955 | |||||||||||||||
| 10,700 | Total Consumer Finance |
12,001,007 | ||||||||||||||||||
| Diversified Financial Services – 3.3% |
||||||||||||||||||||
| 1,910 | Bank of America Corporation, (4) |
3.750% | 7/12/16 | A | 1,768,505 | |||||||||||||||
| 3,725 | Bank of America Corporation |
5.750% | 12/01/17 | A | 3,518,341 | |||||||||||||||
| 2,845 | Bank of America Corporation |
5.875% | 1/05/21 | A | 2,707,948 | |||||||||||||||
| 3,720 | CitiGroup Capital XXI |
8.300% | 12/21/57 | BBB | 3,715,350 | |||||||||||||||
| 4,390 | Countrywide Financial Corporation, Convertible Bond, 144A, (5) |
6.250% | 5/15/16 | A– | 4,135,968 | |||||||||||||||
| 2,915 | General Electric Capital Corporation |
6.875% | 1/10/39 | AA+ | 3,492,263 | |||||||||||||||
| 4,330 | JPMorgan Chase & Company |
4.400% | 7/22/20 | AA– | 4,421,865 | |||||||||||||||
| 2,750 | JPMorgan Chase & Company |
4.250% | 10/15/20 | AA– | 2,769,313 | |||||||||||||||
| 700 | JPMorgan Chase & Company, (4) |
4.350% | 8/15/21 | AA– | 706,935 | |||||||||||||||
| 2,180 | JPMorgan Chase & Company |
6.400% | 5/15/38 | AA– | 2,530,712 | |||||||||||||||
| 29,465 | Total Diversified Financial Services |
29,767,200 | ||||||||||||||||||
| Diversified Telecommunication Services – 2.0% |
||||||||||||||||||||
| 2,970 | AT&T, Inc., (4) |
5.550% | 8/15/41 | A | 3,496,928 | |||||||||||||||
| 2,575 | Embarq Corporation |
7.082% | 6/01/16 | BBB– | 2,791,161 | |||||||||||||||
| 3,500 | Frontier Communications Corporation, (4) |
8.500% | 4/15/20 | BB+ | 3,583,125 | |||||||||||||||
| 1,980 | Sprint Nextel Corporation, (4) |
6.000% | 12/01/16 | B+ | 1,643,400 | |||||||||||||||
| 4,575 | Telefonica Emisiones SAU |
5.462% | 2/16/21 | BBB+ | 4,365,767 | |||||||||||||||
| 2,010 | Verizon Communications |
6.900% | 4/15/38 | A | 2,686,554 | |||||||||||||||
| 17,610 | Total Diversified Telecommunication Services |
18,566,935 | ||||||||||||||||||
| Electric Utilities – 1.3% |
||||||||||||||||||||
| 2,370 | Comision Federal de Electricidad of the United States of Mexcio, 144A |
4.875% | 5/26/21 | Baa1 | 2,441,100 | |||||||||||||||
| 3,690 | FirstEnergy Solutions Corporation |
6.050% | 8/15/21 | BBB | 4,094,775 | |||||||||||||||
| 1,685 | MidAmerican Energy Holdings Company |
6.125% | 4/01/36 | BBB+ | 2,012,478 | |||||||||||||||
| 2,725 | NV Energy Inc. |
6.250% | 11/15/20 | BB+ | 2,823,520 | |||||||||||||||
| 10,470 | Total Electric Utilities |
11,371,873 | ||||||||||||||||||
| Electronic Equipment & Instruments – 0.2% |
||||||||||||||||||||
| 2,000 | Ingram Micro Inc. |
5.250% | 9/01/17 | BBB– | 2,060,176 | |||||||||||||||
| Energy Equipment & Services – 2.1% |
||||||||||||||||||||
| 3,280 | Diamond Offshore Drilling Inc. |
5.700% | 10/15/39 | A– | 3,657,462 | |||||||||||||||
| 2,623 | Energy Transfer Equity LP, (4) |
7.500% | 10/15/20 | BB | 2,865,628 | |||||||||||||||
| 3,870 | Ensco PLC |
4.700% | 3/15/21 | BBB+ | 4,030,241 | |||||||||||||||
| 2,935 | Nabors Industries Inc. |
5.000% | 9/15/20 | BBB | 2,992,235 | |||||||||||||||
| 1,500 | NGPL PipeCo LLC |
7.119% | 12/15/17 | BB+ | 1,480,770 | |||||||||||||||
| 3,740 | Weatherford International Limited |
7.000% | 3/15/38 | BBB | 4,255,305 | |||||||||||||||
| 17,948 | Total Energy Equipment & Services |
19,281,641 | ||||||||||||||||||
| 38 | Nuveen Investments |
| Principal Amount (000) |
Description (1) | Coupon | Maturity | Ratings (2) | Value | |||||||||||||||
| Health Care Providers & Services – 0.6% |
||||||||||||||||||||
| $ | 2,400 | HCA Inc. |
7.250% | 9/15/20 | BB+ | $ | 2,532,000 | |||||||||||||
| 2,185 | UnitedHealth Group Incorporated |
6.875% | 2/15/38 | A– | 2,930,223 | |||||||||||||||
| 4,585 | Total Health Care Providers & Services |
5,462,223 | ||||||||||||||||||
| Independent Power Producers & Energy Traders – 0.4% |
||||||||||||||||||||
| 3,305 | Constellation Energy Group |
5.150% | 12/01/20 | BBB– | 3,581,430 | |||||||||||||||
| Industrial Conglomerates – 0.4% |
||||||||||||||||||||
| 4,000 | GE Capital Trust I, (4) |
6.375% | 11/15/67 | Aa3 | 3,930,000 | |||||||||||||||
| Insurance – 3.5% |
||||||||||||||||||||
| 3,975 | AFLAC Insurance, (4) |
6.450% | 8/15/40 | A– | 4,209,958 | |||||||||||||||
| 4,805 | Allied World Assurance Holdings Limited |
7.500% | 8/01/16 | BBB+ | 5,422,750 | |||||||||||||||
| 2,970 | Catlin Insurance Company Limited |
7.249% | 7/29/49 | BBB+ | 2,524,500 | |||||||||||||||
| 2,950 | Hartford Financial Services Group Inc. |
6.000% | 1/15/19 | BBB | 3,027,550 | |||||||||||||||
| 3,015 | Liberty Mutual Group Inc., 144A |
5.000% | 6/01/21 | Baa2 | 2,954,417 | |||||||||||||||
| 2,295 | Lincoln National Corporation |
8.750% | 7/01/19 | A– | 2,791,544 | |||||||||||||||
| 3,205 | Lincoln National Corporation |
6.050% | 4/20/67 | BBB | 2,668,163 | |||||||||||||||
| 1,640 | Pacific LifeCorp. |
6.000% | 2/10/20 | BBB+ | 1,745,459 | |||||||||||||||
| 4,000 | Prudential Holdings LLC, 144A |
7.245% | 12/18/23 | AA– | 4,519,640 | |||||||||||||||
| 2,755 | ZFS Finance USA Trust V |
6.500% | 5/09/37 | A | 2,479,500 | |||||||||||||||
| 31,610 | Total Insurance |
32,343,481 | ||||||||||||||||||
| Machinery – 0.2% |
||||||||||||||||||||
| 2,000 | Navistar International Corporation |
8.250% | 11/01/21 | BB | 2,127,500 | |||||||||||||||
| Media – 2.4% |
||||||||||||||||||||
| 1,950 | British Sky Broadcasting Group PLC |
6.100% | 2/15/18 | BBB+ | 2,184,306 | |||||||||||||||
| 2,215 | DIRECTV Holdings LLC |
5.200% | 3/15/20 | BBB | 2,387,358 | |||||||||||||||
| 1,315 | NBC Universal Media LLC |
4.375% | 4/01/21 | BBB+ | 1,387,780 | |||||||||||||||
| 3,060 | NBC Universal Media LLC |
6.400% | 4/30/40 | BBB+ | 3,761,946 | |||||||||||||||
| 3,590 | News America Holdings Inc., (4) |
6.650% | 11/15/37 | BBB+ | 4,067,229 | |||||||||||||||
| 2,000 | Time Warner Cable Inc. |
8.750% | 2/14/19 | BBB | 2,553,858 | |||||||||||||||
| 2,410 | Time Warner Cable Inc. |
5.875% | 11/15/40 | BBB | 2,608,249 | |||||||||||||||
| 2,105 | Viacom Inc. |
6.875% | 4/30/36 | BBB+ | 2,634,525 | |||||||||||||||
| 18,645 | Total Media |
21,585,251 | ||||||||||||||||||
| Metals & Mining – 3.0% |
||||||||||||||||||||
| 4,530 | Anglogold Holdings PLC |
6.500% | 4/15/40 | BBB– | 4,407,323 | |||||||||||||||
| 6,035 | Alcoa Inc., (4) |
5.400% | 4/15/21 | BBB– | 6,046,255 | |||||||||||||||
| 5,500 | ArcelorMittal, (4) |
7.000% | 10/15/39 | BBB | 5,111,227 | |||||||||||||||
| 2,550 | Southern Copper Corporation |
7.500% | 7/27/35 | BBB | 2,785,373 | |||||||||||||||
| 1,440 | Teck Resources Limited |
6.250% | 7/15/41 | BBB | 1,663,507 | |||||||||||||||
| 3,895 | Vale Overseas Limited, (4) |
6.875% | 11/10/39 | A– | 4,461,333 | |||||||||||||||
| 2,340 | Xstrata Finance Canada Limited, 144A |
6.900% | 11/15/37 | BBB+ | 2,606,730 | |||||||||||||||
| 26,290 | Total Metals & Mining |
27,081,748 | ||||||||||||||||||
| Multiline Retail – 0.3% |
||||||||||||||||||||
| 2,585 | J.C. Penney Corporation Inc. |
5.650% | 6/01/20 | BBB– | 2,533,300 | |||||||||||||||
| Nuveen Investments | 39 |
Portfolio of Investments (Unaudited)
Nuveen Core Bond Fund (continued)
December 31, 2011
| Principal Amount (000) |
Description (1) | Coupon | Maturity | Ratings (2) | Value | |||||||||||||||
| Oil, Gas & Consumable Fuels – 4.7% |
||||||||||||||||||||
| $ | 3,230 | Anadarko Petroleum Corporation, (4) |
6.200% | 3/15/40 | BBB– | $ | 3,594,635 | |||||||||||||
| 2,000 | Canadian Oil Sands Trust |
7.750% | 5/15/19 | BBB | 2,463,682 | |||||||||||||||
| 3,000 | Chesapeake Energy Corporation, (4) |
6.125% | 2/15/21 | BB+ | 3,082,500 | |||||||||||||||
| 2,000 | Husky Energy Inc. |
6.200% | 9/15/17 | BBB+ | 2,339,848 | |||||||||||||||
| 690 | Kinder Morgan Energy Partners, L.P. |
6.950% | 1/15/38 | BBB | 779,347 | |||||||||||||||
| 4,785 | Lukoil International Finance, 144A |
6.125% | 11/09/20 | Baa2 | 4,689,300 | |||||||||||||||
| 3,475 | Nexen Inc. |
6.400% | 5/15/37 | BBB– | 3,680,925 | |||||||||||||||
| 1,500 | Noble Energy Inc., (4) |
4.150% | 12/15/21 | BBB | 1,551,740 | |||||||||||||||
| 2,495 | Petrobras International Finance Company |
6.875% | 1/20/40 | A3 | 2,889,672 | |||||||||||||||
| 2,255 | Petro-Canada |
6.800% | 5/15/38 | BBB+ | 2,911,600 | |||||||||||||||
| 3,000 | Petroleos Mexicanos, (4) |
5.500% | 1/21/21 | Baa1 | 3,255,000 | |||||||||||||||
| 3,000 | Seagate HDD Cayman |
6.875% | 5/01/20 | BB+ | 3,082,500 | |||||||||||||||
| 4,995 | Transcapitalinvest LP |
5.670% | 3/05/14 | Baa1 | 5,182,313 | |||||||||||||||
| 3,290 | Valero Energy Corporation |
6.125% | 2/01/20 | BBB | 3,659,556 | |||||||||||||||
| 39,715 | Total Oil, Gas & Consumable Fuels |
43,162,618 | ||||||||||||||||||
| Paper & Forest Products – 0.7% |
||||||||||||||||||||
| 1,820 | Georgia-Pacific Corporation, 144A, (4) |
5.400% | 11/01/20 | A– | 2,015,919 | |||||||||||||||
| 3,015 | International Paper Company |
8.700% | 6/15/38 | BBB | 4,090,481 | |||||||||||||||
| 4,835 | Total Paper & Forest Products |
6,106,400 | ||||||||||||||||||
| Pharmaceuticals – 0.2% |
||||||||||||||||||||
| 2,080 | Valeant Pharmaceuticals International, 144A |
6.875% | 12/01/18 | BB | 2,074,800 | |||||||||||||||
| Real Estate Investment Trust – 0.7% |
||||||||||||||||||||
| 2,995 | Prologis Inc. |
6.875% | 3/15/20 | Baa2 | 3,325,423 | |||||||||||||||
| 2,705 | Vornado Realty LP |
4.250% | 4/01/15 | BBB | 2,799,453 | |||||||||||||||
| 5,700 | Total Real Estate Investment Trust |
6,124,876 | ||||||||||||||||||
| Semiconductors & Equipment – 0.2% |
||||||||||||||||||||
| 1,300 | Intel Corporation |
4.800% | 10/01/41 | A+ | 1,456,919 | |||||||||||||||
| Specialty Retail – 0.4% |
||||||||||||||||||||
| 3,200 | O’Reilly Automotive Inc. |
4.875% | 1/14/21 | BBB– | 3,404,922 | |||||||||||||||
| Thrifts & Mortgage Finance – 0.3% |
||||||||||||||||||||
| 2,730 | WEA Finance LLC, 144A, (4) |
4.625% | 5/10/21 | A2 | 2,679,479 | |||||||||||||||
| Tobacco – 0.7% |
||||||||||||||||||||
| 2,100 | Altria Group Inc., (4) |
4.750% | 5/05/21 | BBB+ | 2,312,180 | |||||||||||||||
| 3,350 | Lorillard Tobacco |
8.125% | 6/23/19 | Baa2 | 3,990,513 | |||||||||||||||
| 5,450 | Total Tobacco |
6,302,693 | ||||||||||||||||||
| Transportation Infrastructure – 0.4% |
||||||||||||||||||||
| 3,800 | Asciano Finance Limited, 144A |
5.000% | 4/07/18 | Baa2 | 3,810,439 | |||||||||||||||
| Wireless Telecommunication Services – 0.3% |
||||||||||||||||||||
| 2,980 | American Tower Company |
5.050% | 9/01/20 | BBB– | 2,985,386 | |||||||||||||||
| $ | 336,242 | Total Corporate Bonds (cost $337,887,079) |
351,531,941 | |||||||||||||||||
| Shares | Description (1) | Coupon | Ratings (2) | Value | ||||||||||||||||
| $25 PAR (OR SIMILAR) PREFERRED SECURITIES – 0.3% |
||||||||||||||||||||
| Financials – 0.3% |
||||||||||||||||||||
| 104,794 | Endurance Specialty Holdings Limited |
7.500% | Aaa | $ | 2,671,199 | |||||||||||||||
| 40 | Nuveen Investments |
| Shares | Description (1) | Coupon | Ratings (2) | Value | ||||||||||||||||
| Sovereign Agency – 0.0% |
||||||||||||||||||||
| 218,000 | Federal National Mortgage Association |
0.000% | Ca | $ | 300,840 | |||||||||||||||
| Total $25 Par (or similar) Preferred Securities (cost $7,792,950) |
2,972,039 | |||||||||||||||||||
| Principal Amount (000) |
Description (1) | Optional Call Provisions (3) |
Ratings (2) | Value | ||||||||||||||||
| MUNICIPAL BONDS – 0.7% |
||||||||||||||||||||
| Illinois – 0.7% |
||||||||||||||||||||
| $ | 5,765 | Illinois State, General Obligation Bonds, Taxable Series 2011, 5.877%, 3/01/19 |
No Opt. Call | A+ | $ | 6,213,517 | ||||||||||||||
| $ | 5,765 | Total Municipal Bonds (cost $5,765,000) |
6,213,517 | |||||||||||||||||
| Principal Amount (000) |
Description (1) | Coupon | Maturity | Ratings (2) | Value | |||||||||||||||
| U.S. GOVERNMENT AND AGENCY OBLIGATIONS – 3.5% |
||||||||||||||||||||
| $ | 3,650 | U.S. Treasury Notes, (4) |
2.375% | 2/28/15 | AAA | $ | 3,872,708 | |||||||||||||
| 8,985 | U.S. Treasury Notes, (4) |
1.250% | 8/31/15 | AAA | 9,223,660 | |||||||||||||||
| 1,385 | U.S. Treasury Notes, (4) |
3.625% | 2/15/20 | AAA | 1,606,276 | |||||||||||||||
| 6,630 | U.S. Treasury Notes, (4) |
2.625% | 8/15/20 | AAA | 7,150,561 | |||||||||||||||
| 1,435 | U.S. Treasury Notes, (4) |
3.125% | 5/15/21 | AAA | 1,602,266 | |||||||||||||||
| 2,065 | U.S. Treasury Notes, (4) |
3.875% | 8/15/40 | AAA | 2,475,419 | |||||||||||||||
| 4,455 | U.S. Treasury Bonds, (4) |
4.250% | 11/15/40 | AAA | 5,681,515 | |||||||||||||||
| 425 | U.S. Treasury Bonds, (4) |
4.750% | 2/15/41 | AAA | 585,703 | |||||||||||||||
| $ | 29,030 | Total U.S. Government and Agency Obligations (cost $28,473,185) |
32,198,108 | |||||||||||||||||
| Principal Amount (000) |
Description (1) | Coupon | Maturity | Ratings (2) | Value | |||||||||||||||
| ASSET-BACKED AND MORTGAGE-BACKED SECURITIES – 56.4% |
||||||||||||||||||||
| $ | 4,802 | 321 Henderson Receivables LLC, Series 2010-3A |
3.820% | 12/15/48 | Aaa | $ | 4,729,561 | |||||||||||||
| 2,090 | American Homes Mortgage Advance Trust, Series 2011-SART1 |
5.920% | 5/10/43 | BBB | 2,090,000 | |||||||||||||||
| 6,125 | AmeriCold LLC Trust, Series 2010 |
6.811% | 1/14/29 | A | 6,191,799 | |||||||||||||||
| 19 | Amresco Residential Securities Corporation, Mortgage Loan Pass-Through Certificates, Serioes 1997-3 |
6.960% | 3/25/27 | AAA | 19,131 | |||||||||||||||
| 5,480 | Arkle Master Issuer PLC, Mortgage Asset Backed Instrument, |
1.616% | 5/17/60 | AAA | 5,457,231 | |||||||||||||||
| 3,471 | Bank of America Auto Trust, Series 2010-2 |
1.310% | 7/15/14 | AAA | 3,481,080 | |||||||||||||||
| 125 | Bank of America Commercial Mortgage Inc., Commerical Mortgage Pass-Through Certificates, Series 2004-5 |
4.561% | 11/10/41 | AAA | 125,420 | |||||||||||||||
| 1,341 | Bank of America Funding Trust, Mortgage Pass-Through Certificates, Series 2007-4 |
5.500% | 6/25/37 | CC | 723,364 | |||||||||||||||
| 1,250 | Bayview Financial Mortgage Pass-Through Trust, Mortgage |
5.500% | 12/28/35 | AA | 1,002,468 | |||||||||||||||
| 5,005 | Cabela’s Master Credit Card Trust, Series 2011-2A A2 |
0.878% | 6/17/19 | AAA | 5,036,118 | |||||||||||||||
| 4,653 | Citigroup Commercial Mortgage Securities Trust, Commercial Mortgage Pass-Through Certificates, Series 2007-CD4 |
5.205% | 12/11/49 | AAA | 4,711,559 | |||||||||||||||
| 4,225 | Commercial Mortgage Pass-Through Certificates, Series2006-CN2A |
5.449% | 2/05/19 | AAA | 4,102,830 | |||||||||||||||
| 3,835 | Countrywide ABS Asset-Backed Certificate Trust 2007-9 |
0.424% | 6/25/47 | BB+ | 3,088,207 | |||||||||||||||
| 271 | Countrywide Alternative Loan Trust, Mortgage Pass-Through Certificates, Series 2004-J1 |
6.000% | 2/25/34 | AAA | 275,217 | |||||||||||||||
| Nuveen Investments | 41 |
Portfolio of Investments (Unaudited)
Nuveen Core Bond Fund (continued)
December 31, 2011
| Principal Amount (000) |
Description (1) | Coupon | Maturity | Ratings (2) | Value | |||||||||||||||
| ASSET-BACKED AND MORTGAGE-BACKED SECURITIES (continued) |
||||||||||||||||||||
| $ | 1,888 | Countrywide Alternative Loan Trust, Mortgage Pass-Through Certificates, Series 2006-19CB |
6.000% | 8/25/36 | CCC | $ | 1,359,371 | |||||||||||||
| 3,580 | Countrywide Hoen Loans, Asset Backed Certificates Series 2007-7 |
0.454% | 10/25/47 | BB– | 2,782,104 | |||||||||||||||
| 1,398 | Countrywide Home Loan Mortgage Pass Through Trust, Series 2004-2 |
2.748% | 2/25/34 | BB | 1,251,828 | |||||||||||||||
| 616 | Countrywide Home Loans, Asset-Backed Certificates, |
2.544% | 9/25/23 | A+ | 486,281 | |||||||||||||||
| 3,684 | Credit Suisse First Boston Mortgage Securities Corporation, Mortgage-Backed Pass-Through Certificates, Series 2003-8 |
6.225% | 4/25/33 | AAA | 3,244,617 | |||||||||||||||
| 2,550 | DBUBS Mortgage Trust, Commercial Mortgage Pass Through Certificates, Series 2011-LC3A |
3.642% | 8/10/44 | AAA | 2,686,282 | |||||||||||||||
| 3,435 | Discover Card Master Trust I 2007-A |
5.650% | 3/16/20 | AAA | 4,110,149 | |||||||||||||||
| 2,870 | Entergy Louisiana Investment Recovery Funding LLC, Series 2011-A |
2.040% | 9/01/23 | AAA | 2,877,720 | |||||||||||||||
| 6,410 | Extended Stay America Trust 2010-EHSA |
4.860% | 11/05/27 | A | 6,489,516 | |||||||||||||||
| 9,580 | Fannie Mae Mortgage Pool 20130701 |
3.790% | 7/01/13 | AAA | 9,831,810 | |||||||||||||||
| 293 | Fannie Mae Mortgage Pool 20140201 |
5.500% | 2/01/14 | AAA | 317,806 | |||||||||||||||
| 82 | Fannie Mae Mortgage Pool 20150201 |
7.000% | 2/01/15 | AAA | 85,833 | |||||||||||||||
| 169 | Fannie Mae Mortgage Pool 20160801 |
7.000% | 8/01/16 | AAA | 186,461 | |||||||||||||||
| 1,172 | Fannie Mae Mortgage Pool 20171201 |
5.500% | 12/01/17 | AAA | 1,274,182 | |||||||||||||||
| 1,395 | Fannie Mae Mortgage Pool 20221001 |
6.000% | 10/01/22 | AAA | 1,542,948 | |||||||||||||||
| 3,543 | Fannie Mae Mortgage Pool 20250101, (4) |
5.500% | 1/01/25 | AAA | 3,885,947 | |||||||||||||||
| 87 | Fannie Mae Mortgage Pool 20260401 |
7.000% | 4/01/26 | AAA | 100,441 | |||||||||||||||
| 191 | Fannie Mae Mortgage Pool 20260501 |
7.000% | 5/01/26 | AAA | 220,699 | |||||||||||||||
| 3,060 | Fannie Mae Mortgage Pool 20270801 |
6.000% | 8/01/27 | AAA | 3,372,189 | |||||||||||||||
| 851 | Fannie Mae Mortgage Pool 20290201 |
6.500% | 2/01/29 | AAA | 972,275 | |||||||||||||||
| 2,986 | Fannie Mae Mortgage Pool 20300801 |
4.000% | 8/01/30 | AAA | 3,141,348 | |||||||||||||||
| 204 | Fannie Mae Mortgage Pool 20310301 |
4.000% | 3/01/31 | AAA | 216,187 | |||||||||||||||
| 1,745 | Fannie Mae Mortgage Pool 20311201, (4) |
2.274% | 12/01/31 | AAA | 1,925,417 | |||||||||||||||
| 3,045 | Fannie Mae Mortgage Pool 20320401 |
2.493% | 4/01/32 | AAA | 3,326,141 | |||||||||||||||
| 1,285 | Fannie Mae Mortgage Pool 20320701 |
6.500% | 7/01/32 | AAA | 1,491,023 | |||||||||||||||
| 531 | Fannie Mae Mortgage Pool 20320701 |
6.000% | 7/01/32 | AAA | 617,266 | |||||||||||||||
| 317 | Fannie Mae Mortgage Pool 20320701 |
7.000% | 7/01/32 | AAA | 367,522 | |||||||||||||||
| 1,612 | Fannie Mae Mortgage Pool 20320901 |
7.000% | 9/01/32 | AAA | 1,796,593 | |||||||||||||||
| 3,101 | Fannie Mae Mortgage Pool 20330301, (4) |
7.000% | 3/01/33 | AAA | 3,463,688 | |||||||||||||||
| 2,952 | Fannie Mae Mortgage Pool 20330401, (4) |
6.000% | 4/01/33 | AAA | 3,226,885 | |||||||||||||||
| 2,287 | Fannie Mae Mortgage Pool 20330501, (4) |
6.000% | 5/01/33 | AAA | 2,602,831 | |||||||||||||||
| 5,338 | Fannie Mae Mortgage Pool 20330701, (4) |
5.500% | 7/01/33 | AAA | 5,907,243 | |||||||||||||||
| 908 | Fannie Mae Mortgage Pool 20330901 |
4.000% | 9/01/33 | AAA | 951,707 | |||||||||||||||
| 2,302 | Fannie Mae Mortgage Pool 20331001, (4) |
6.500% | 10/01/33 | AAA | 2,516,081 | |||||||||||||||
| 409 | Fannie Mae Mortgage Pool 20331101 |
5.500% | 11/01/33 | AAA | 455,825 | |||||||||||||||
| 225 | Fannie Mae Mortgage Pool 20331101 |
2.212% | 11/01/33 | AAA | 251,075 | |||||||||||||||
| 1,528 | Fannie Mae Mortgage Pool 20340301 |
5.500% | 3/01/34 | AAA | 1,652,275 | |||||||||||||||
| 2,724 | Fannie Mae Mortgage Pool 20340301, (4) |
6.000% | 3/01/34 | AAA | 2,945,648 | |||||||||||||||
| 4,085 | Fannie Mae Mortgage Pool 20340601, (4) |
6.000% | 6/01/34 | AAA | 4,642,659 | |||||||||||||||
| 1 | Fannie Mae Mortgage Pool 20340601 |
5.000% | 6/01/34 | AAA | 823 | |||||||||||||||
| 654 | Fannie Mae Mortgage Pool 20341001 |
5.000% | 10/01/34 | AAA | 726,349 | |||||||||||||||
| 3,955 | Fannie Mae Mortgage Pool 20341101 |
4.500% | 11/01/34 | AAA | 4,233,433 | |||||||||||||||
| 42 | Nuveen Investments |
| Principal Amount (000) |
Description (1) | Coupon | Maturity | Ratings (2) | Value | |||||||||||||||
| ASSET-BACKED AND MORTGAGE-BACKED SECURITIES (continued) |
||||||||||||||||||||
| $ | 7,230 | Fannie Mae Mortgage Pool 20360701, (4) |
6.500% | 7/01/36 | AAA | $ | 7,898,529 | |||||||||||||
| 1,644 | Fannie Mae Mortgage Pool 20360801 |
5.000% | 8/01/36 | AAA | 1,836,423 | |||||||||||||||
| 3,100 | Fannie Mae Mortgage Pool 20360901, (4) |
6.000% | 9/01/36 | AAA | 3,462,510 | |||||||||||||||
| 1,612 | Fannie Mae Mortgage Pool 20370601 |
5.229% | 6/01/37 | AAA | 1,776,517 | |||||||||||||||
| 1,030 | Fannie Mae Mortgage Pool 20370801 |
5.500% | 8/01/37 | AAA | 1,152,480 | |||||||||||||||
| 1,896 | Fannie Mae Mortgage Pool 20370901, (4) |
6.000% | 9/01/37 | AAA | 2,078,790 | |||||||||||||||
| 7,131 | Fannie Mae Mortgage Pool 20380101, (4) |
6.000% | 1/01/38 | AAA | 7,771,124 | |||||||||||||||
| 12,004 | Fannie Mae Mortgage Pool 20380301, (4) |
6.000% | 3/01/38 | AAA | 12,976,485 | |||||||||||||||
| 9,971 | Fannie Mae Mortgage Pool 20380501, (4) |
6.500% | 5/01/38 | AAA | 10,865,862 | |||||||||||||||
| 1 | Fannie Mae Mortgage Pool 20380501 |
6.000% | 5/01/38 | AAA | 1,347 | |||||||||||||||
| 352 | Fannie Mae Mortgage Pool 20380601 |
5.500% | 6/01/38 | AAA | 387,498 | |||||||||||||||
| 1 | Fannie Mae Mortgage Pool 20380701 |
5.000% | 7/01/38 | AAA | 1,424 | |||||||||||||||
| 2,279 | Fannie Mae Mortgage Pool 20380801, (4) |
5.500% | 8/01/38 | AAA | 2,510,832 | |||||||||||||||
| 3,437 | Fannie Mae Mortgage Pool 20381001, (4) |
5.000% | 10/01/38 | AAA | 3,796,819 | |||||||||||||||
| 7,871 | Fannie Mae Mortgage Pool 20390901, (4) |
6.000% | 9/01/39 | AAA | 8,382,637 | |||||||||||||||
| 1,865 | Fannie Mae Mortgage Pool 20391201 |
5.500% | 12/01/39 | AAA | 2,027,436 | |||||||||||||||
| 7,008 | Fannie Mae Mortgage Pool 20391201, (4) |
6.000% | 12/01/39 | AAA | 7,463,434 | |||||||||||||||
| 11,336 | Fannie Mae Mortgage Pool 20400501, (4) |
6.000% | 5/01/40 | AAA | 12,259,316 | |||||||||||||||
| 8,507 | Fannie Mae Mortgage Pool 20401101, (4) |
4.500% | 11/01/40 | AAA | 8,944,563 | |||||||||||||||
| 9,368 | Fannie Mae Mortgage Pool 20401201, (4) |
5.000% | 12/01/40 | AAA | 9,850,227 | |||||||||||||||
| 12,086 | Fannie Mae Mortgage Pool 20410101, (4) |
4.500% | 1/01/41 | AAA | 12,707,504 | |||||||||||||||
| 11,516 | Fannie Mae Mortgage Pool 20410201, (4) |
5.000% | 2/01/41 | AAA | 12,108,047 | |||||||||||||||
| 3,797 | Fannie Mae Mortgage Pool 20410501, (4) |
4.000% | 5/01/41 | AAA | 4,044,030 | |||||||||||||||
| 21,400 | Fannie Mae Mortgage TBA Pools, (WI/DD) |
4.000% | TBA | AAA | 22,480,032 | |||||||||||||||
| 15,920 | Fannie Mae Mortgage TBA Pools, (WI/DD) |
3.500% | TBA | AAA | 16,372,725 | |||||||||||||||
| 533 | Fannie Mae Real Estate Mortgage Investment Conduit, Pass Through Certificates SERIES 1996 20260725 |
3.900% | 7/25/26 | AAA | 613,454 | |||||||||||||||
| 2,916 | Fannie Mae Real Estate Mortgage Investment Conduit, Pass Through Certificates SERIES 2003 20171025 |
7.000% | 10/25/17 | AAA | 2,957,727 | |||||||||||||||
| 2,082 | Fannie Mae Real Estate Mortgage Investment Conduit, Pass Through Certificates SERIES 2005 20350625 |
5.000% | 6/25/35 | AAA | 2,333,280 | |||||||||||||||
| 20 | Fannie Mae Real Estate Mortgage Investment Conduit, Pass Through Certificates SERIES 8824 20181025 |
9.000% | 10/25/18 | AAA | 22,469 | |||||||||||||||
| 19 | Fannie Mae Real Estate Mortgage Investment Conduit, Pass Through Certificates SERIES 8944 20190725 |
8.700% | 7/25/19 | AAA | 21,823 | |||||||||||||||
| 3 | Fannie Mae Real Estate Mortgage Investment Conduit, Pass Through Certificates SERIES 8990 20191225 |
6.500% | 12/25/19 | AAA | 3,889 | |||||||||||||||
| 21 | Fannie Mae Real Estate Mortgage Investment Conduit, Pass Through Certificates SERIES 90-102 20200825 |
9.000% | 8/25/20 | AAA | 22,702 | |||||||||||||||
| 181 | Fannie Mae Real Estate Mortgage Investment Conduit, Pass Through Certificates SERIES 90105 20200925 |
7.000% | 9/25/20 | AAA | 197,651 | |||||||||||||||
| 12 | Fannie Mae Real Estate Mortgage Investment Conduit, Pass Through Certificates SERIES 9030 20200325 |
6.500% | 3/25/20 | AAA | 12,886 | |||||||||||||||
| 17 | Fannie Mae Real Estate Mortgage Investment Conduit, Pass Through Certificates SERIES 9061 20200625 |
6.500% | 6/25/20 | AAA | 18,739 | |||||||||||||||
| 16 | Fannie Mae Real Estate Mortgage Investment Conduit, Pass Through Certificates SERIES 9061 20200725 |
7.000% | 7/25/20 | AAA | 18,247 | |||||||||||||||
| Nuveen Investments | 43 |
Portfolio of Investments (Unaudited)
Nuveen Core Bond Fund (continued)
December 31, 2011
| Principal Amount (000) |
Description (1) | Coupon | Maturity | Ratings (2) | Value | |||||||||||||||
| ASSET-BACKED AND MORTGAGE-BACKED SECURITIES (continued) |
||||||||||||||||||||
| $ | 112 | Fannie Mae Real Estate Mortgage Investment Conduit, Pass Through Certificates SERIES 91134 20211025 |
7.000% | 10/25/21 | AAA | $ | 125,828 | |||||||||||||
| 61 | Fannie Mae Real Estate Mortgage Investment Conduit, Pass Through Certificates SERIES 9156 20210625 |
6.750% | 6/25/21 | AAA | 65,134 | |||||||||||||||
| 18 | Fannie Mae Real Estate Mortgage Investment Conduit, Pass Through Certificates SERIES 92120 20220725 |
6.500% | 7/25/22 | AAA | 19,432 | |||||||||||||||
| 1,438 | Fannie Mae REMIC Pass-Through Certificates SERIES 2003 20421225 |
5.750% | 12/25/42 | AAA | 723,310 | |||||||||||||||
| 4,767 | FDIC Structures Sale Guaranteed Notes, Series 2010-S1 |
0.820% | 2/25/48 | AAA | 4,757,453 | |||||||||||||||
| 673 | Federal Home Loan Bank Mortgages 20290401 |
2.334% | 4/01/29 | AAA | 710,956 | |||||||||||||||
| 952 | Federal Home Loan Bank Mortgages 20300301 |
2.460% | 3/01/30 | AAA | 1,008,779 | |||||||||||||||
| 1,183 | Federal Home Loan Bank Mortgages 20300701 |
2.341% | 7/01/30 | AAA | 1,246,273 | |||||||||||||||
| 488 | Federal Home Loan Bank Mortgages 20310601 |
1.940% | 6/01/31 | AAA | 497,926 | |||||||||||||||
| 3,671 | Federal Home Loan Bank Mortgages 20370901, (4) |
5.803% | 9/01/37 | AAA | 3,915,371 | |||||||||||||||
| 30 | Federal Home Loan Mortgage Corporation, REMIC SERIES 1790 20220415 |
8.250% | 4/15/22 | AAA | 32,631 | |||||||||||||||
| 16 | Federal Home Loan Mortgage Corporation, REMIC SERIES 1022 20201215 |
6.000% | 12/15/20 | AAA | 17,162 | |||||||||||||||
| 37 | Federal Home Loan Mortgage Corporation, REMIC SERIES 118 20210715 |
7.000% | 7/15/21 | AAA | 42,598 | |||||||||||||||
| 45 | Federal Home Loan Mortgage Corporation, REMIC SERIES 162 20210515 |
0.878% | 5/15/21 | AAA | 49,707 | |||||||||||||||
| 106 | Federal Home Loan Mortgage Corporation, REMIC SERIES 188 20210915 |
9.050% | 9/15/21 | AAA | 118,608 | |||||||||||||||
| 2,286 | Federal Home Loan Mortgage Corporation, REMIC SERIES 2704 20230515 |
0.828% | 5/15/23 | AAA | 2,294,580 | |||||||||||||||
| 1,788 | Federal Home Loan Mortgage Corporation, REMIC SERIES 2755 20320415 |
0.728% | 4/15/32 | AAA | 1,788,291 | |||||||||||||||
| 5,000 | Federal Home Loan Mortgage Corporation, REMIC SERIES 2901 20330315 |
7.000% | 3/15/33 | AAA | 5,290,633 | |||||||||||||||
| 5,907 | Federal Home Loan Mortgage Corporation, REMIC SERIES 3423 20360615 |
7.000% | 6/15/36 | AAA | 5,907,256 | |||||||||||||||
| 3,507 | Federal Home Loan Mortgage Corporation, REMIC SERIES 3591 20390615 |
5.000% | 6/15/39 | AAA | 3,514,178 | |||||||||||||||
| 10 | Federal Home Loan Mortgage Corporation, REMIC SERIES 6 20190615 |
0.778% | 6/15/19 | AAA | 11,363 | |||||||||||||||
| 3,935 | Fieldstone Mortgage Investment Trust, Mortgage Backed Notes, |
1.374% | 3/25/35 | A+ | 3,539,919 | |||||||||||||||
| 2,316 | Ford Credit Auto Lease Trust, Series 2011-B |
0.480% | 11/15/12 | AAA | 2,316,447 | |||||||||||||||
| 4,315 | Fosse Master Issuer PLC, Residential Mortgage Pool, Series 2011-1A |
1.805% | 10/18/54 | AAA | 4,298,556 | |||||||||||||||
| 846 | Freddie Mac Mortgage Pool, Various 20180301 |
4.500% | 3/01/18 | AAA | 883,825 | |||||||||||||||
| 2,013 | Freddie Mac Mortgage Pool, Various 20180501 |
4.500% | 5/01/18 | AAA | 2,109,694 | |||||||||||||||
| 441 | Freddie Mac Mortgage Pool, Various 20280101 |
6.500% | 1/01/28 | AAA | 495,589 | |||||||||||||||
| 843 | Freddie Mac Mortgage Pool, Various 20281101 |
6.500% | 11/01/28 | AAA | 966,466 | |||||||||||||||
| 671 | Freddie Mac Mortgage Pool, Various 20281201 |
6.500% | 12/01/28 | AAA | 769,095 | |||||||||||||||
| 378 | Freddie Mac Mortgage Pool, Various 20290401 |
6.500% | 4/01/29 | AAA | 433,546 | |||||||||||||||
| 1,261 | Freddie Mac Mortgage Pool, Various 20310701 |
6.500% | 7/01/31 | AAA | 1,445,042 | |||||||||||||||
| 1,086 | Freddie Mac Mortgage Pool, Various 20331101 |
6.000% | 11/01/33 | AAA | 1,209,293 | |||||||||||||||
| 968 | Freddie Mac Mortgage Pool, Various 20370801 |
7.000% | 8/01/37 | AAA | 1,099,609 | |||||||||||||||
| 436 | Freddie Mac Mortgage Pool, Various 20370901 |
7.000% | 9/01/37 | AAA | 495,630 | |||||||||||||||
| 125 | Freddie Mac Non Gold Participation Certificates 20250501 |
2.421% | 5/01/25 | AAA | 131,712 | |||||||||||||||
| 22 | GMAC Mortgage Corporation, Mortgage Pass-Through Certificates, Series 2010-1 |
4.250% | 7/25/40 | Aa2 | 22,364 | |||||||||||||||
| 44 | Nuveen Investments |
| Principal Amount (000) |
Description (1) | Coupon | Maturity | Ratings (2) | Value | |||||||||||||||
| ASSET-BACKED AND MORTGAGE-BACKED SECURITIES (continued) |
||||||||||||||||||||
| $ | 647 | Goldman Sachs Mortgage Securities Corporation, Mortgage |
6.748% | 3/25/43 | Ba3 | $ | 556,728 | |||||||||||||
| 759 | Goldman Sachs Mortgage Securities Corporation, Mortgage |
7.500% | 3/25/35 | BB+ | 759,489 | |||||||||||||||
| 862 | Goldman Sachs Mortgage Securities Corporation, Mortgage |
7.500% | 9/25/35 | BB– | 876,873 | |||||||||||||||
| 1 | Government National Mortgage Association Pool 20230820 |
4.500% | 8/20/23 | AAA | 976 | |||||||||||||||
| 205 | Government National Mortgage Association Pool 2030115 |
1.625% | 11/15/30 | AAA | 244,880 | |||||||||||||||
| 10,002 | Government National Mortgage Association Pool 20410220 |
7.500% | 2/20/41 | AAA | 10,930,452 | |||||||||||||||
| 11,500 | Government National Mortgage Association Pool, (WI/DD) |
4.500% | 1/01/42 | AAA | 12,524,218 | |||||||||||||||
| 642 | Green Tree Fiancial Manufactured Housing Loans, Series 2008-MH1 |
7.000% | 4/25/38 | AAA | 648,544 | |||||||||||||||
| 1,180 | IndyMac INDX Mortgage Loan Trust, Pass Through Certificates, |
2.625% | 3/25/35 | AAA | 1,007,178 | |||||||||||||||
| 294 | JPMorgan Mortage Trust, Mortgage Pass-Through Certtificates, |
5.687% | 1/25/37 | C | 24,674 | |||||||||||||||
| 2,884 | JPMorgan Alternative Loan Trust, Mortgage Pass-Through Certificates, Series 2007-S1 |
0.574% | 4/25/47 | CCC | 1,962,774 | |||||||||||||||
| 7,571 | JPMorgan Chase Commercial Mortgage Securities Corporation, Commercial Mortgage Pass-Through Certificates, Series 2010-C1 |
3.853% | 6/15/43 | AAA | 7,917,747 | |||||||||||||||
| 2,250 | JPMorgan Chase Commercial Mortgage Securities Corporation, Commercial Mortgage Pass-Through Certificates, Series 2011-C4 C |
5.251% | 7/15/46 | A | 1,919,948 | |||||||||||||||
| 5,570 | JPMorgan Chase Commerical Mortgage Trust, Commerical Mortage Pass Through Certificates, Series 2011-C4 |
4.106% | 7/15/46 | AAA | 5,878,578 | |||||||||||||||
| 3,455 | LB-UBS Commercial Mortgage Trust, Commercial Mortgage |
5.103% | 11/15/30 | AAA | 3,453,490 | |||||||||||||||
| 6,000 | LB-UBS Commerical Mortgage Trust, Commercial Mortgage |
4.367% | 3/15/36 | AAA | 6,268,668 | |||||||||||||||
| 1,751 | Lehman Mortgage Trust, Mortgage Pass Through Certificates, |
5.870% | 7/25/47 | A | 1,627,132 | |||||||||||||||
| 705 | Mid-State Capital Corporation Trust Notes, Series 2005-1 |
5.745% | 1/15/40 | AAA | 766,739 | |||||||||||||||
| 2,325 | Morgan Stanley Capital I Trust, Commercial Mortgage Pass-Through Certificates, Series 2011-C1 C |
5.255% | 9/15/47 | A | 2,054,675 | |||||||||||||||
| 3,864 | Morgan Stanley Dean Witter Capital I Trust, Commercial Mortgage Pass-Through Certificates, Series 2002-TOP7 |
5.980% | 1/15/39 | AAA | 3,892,035 | |||||||||||||||
| 952 | Mortgage Asset Securitization Transaction Inc., Alternative Loan Trust Mortgage Pass-Through Certificates Series 2004-1 |
7.000% | 1/25/34 | AAA | 984,463 | |||||||||||||||
| 4,002 | Mortgage Equity Conversion Asset Trust 2010-1A |
4.000% | 7/25/60 | AA | 3,998,531 | |||||||||||||||
| 4,185 | National Credit Union Adminstration Guaranteed Structured Collateral Notes |
2.900% | 10/29/20 | AAA | 4,418,574 | |||||||||||||||
| 5,590 | OBP Depositor LLC Trust, Commercial Mortgage Pass Through Certificates, Series 2010-OBP |
4.646% | 7/15/45 | AAA | 6,249,167 | |||||||||||||||
| 3,545 | Ocwen Advance Receivables Backed Notes, Series 2009-3A |
4.140% | 7/15/23 | AAA | 3,549,431 | |||||||||||||||
| 602 | RBSSP Resecuritization Trust 2009-11 |
2.044% | 12/26/37 | Aa3 | 602,722 | |||||||||||||||
| 633 | RBSSP Resecuritization Trust 2009-8 |
0.434% | 3/26/37 | Aaa | 622,945 | |||||||||||||||
| 3,524 | RBSSP Resecuritization Trust 2010-10 |
0.424% | 9/26/36 | Aaa | 3,116,631 | |||||||||||||||
| 3,569 | RBSSP Resecuritization Trust 2010-11 |
0.464% | 3/26/37 | Aaa | 3,407,632 | |||||||||||||||
| 6,133 | RBSSP Resecuritization Trust 2010-4 |
0.404% | 3/26/36 | A | 5,619,402 | |||||||||||||||
| 1,934 | RBSSP Resecuritization Trust 2010-8 |
0.624% | 7/26/36 | Aaa | 1,811,162 | |||||||||||||||
| 4,365 | Renaissance Home Equity Loan Trust I, Home Equity Loan Asset-Backed Notes, Series 2005-3 |
5.140% | 11/25/35 | AA+ | 3,294,100 | |||||||||||||||
| Nuveen Investments | 45 |
Portfolio of Investments (Unaudited)
Nuveen Core Bond Fund (continued)
December 31, 2011
| Principal Amount (000) |
Description (1) | Coupon | Maturity | Ratings (2) | Value | |||||||||||||||
| ASSET-BACKED AND MORTGAGE-BACKED SECURITIES (continued) |
||||||||||||||||||||
| $ | 3,704 | Sequoia Mortgage Trust, Mortgage Pass Through Certificates, |
4.125% | 2/25/41 | AAA | $ | 3,684,492 | |||||||||||||
| 4,544 | Springleaf Mortgage Loan Trust 2011-1 |
4.050% | 1/25/58 | AAA | 4,538,649 | |||||||||||||||
| 320 | Structured Adjustable Rate Mortgage Loan Trust, Mortgage Pass-Through Certificates, Series 2004-11 |
2.610% | 8/25/34 | Baa2 | 275,387 | |||||||||||||||
| 4,140 | U.S. Small Business Administration Guaranteed Participating Securities Participation Certificates, Series 2006-P10B |
5.681% | 8/10/16 | AAA | 4,527,591 | |||||||||||||||
| 6,730 | U.S. Small Business Administration Guaranteed Participating Securities Participation Certificates, Series 2010-P10A |
4.108% | 3/10/20 | AAA | 7,023,357 | |||||||||||||||
| 7,313 | United States Department of Veterans, Affairs, Guaranteed REMIC |
3.750% | 2/15/35 | AAA | 7,632,138 | |||||||||||||||
| 2,423 | Vericrest Opportunity Loan Transferee, Series 2011-NL3A |
5.194% | 9/25/51 | N/R | 2,407,338 | |||||||||||||||
| 2,847 | Wachovia Bank Commercial Mortgage Trust, Commercial Mortgage |
0.358% | 6/15/20 | Aaa | 2,545,466 | |||||||||||||||
| 4,643 | Wachovia Mortgage Loan Trust LLC, Mortgage Pass-Through Certificates, Series 2005-B |
2.637% | 10/20/35 | CCC | 3,561,012 | |||||||||||||||
| 1,475 | Washington Mutual Mortgage Securities Corporation, Mortgage Pass-through Certificates, Series 2007-HY2 |
5.502% | 9/25/36 | CCC | 140,184 | |||||||||||||||
| 1,499 | Wells Fargo Mortagge Backed Securities Trust, Mortgage Pass_Through Certificate Series 2007-2 |
5.750% | 3/25/37 | Caa1 | 1,232,948 | |||||||||||||||
| 2,300 | Wells Fargo-RBS Commercial Mortage Trust, Commercial Mortgage Pass-Through Certificates, Series 2011-C2 |
5.392% | 2/15/44 | A | 2,057,457 | |||||||||||||||
| 2,250 | Wells Fargo-RBS Commercial Mortgage Trust, Commercial Mortgage Pass-Through Certificates, Series 2011-C3 |
5.335% | 3/15/44 | A | 1,976,137 | |||||||||||||||
| 5,000 | Wells Fargo-RBS Commercial Mortgage Trust, Commercial Mortgage Pass-Through Certificates, Series 2011-C3, (4) |
4.375% | 3/15/44 | AAA | 5,323,995 | |||||||||||||||
| $ | 502,362 | Total Asset-Backed and Mortgage-Backed Securities (cost $500,824,797) |
|
514,220,886 | ||||||||||||||||
| Shares | Description (1) | Value | ||||||||||||||||||
| INVESTMENTS PURCHASED WITH COLLATERAL FROM SECURITIES LENDING – 29.1% |
| |||||||||||||||||||
| Money Market Funds – 29.1% |
||||||||||||||||||||
| 265,290,988 | Mount Vernon Securities Lending Prime Portfolio, 0.233% (5), (6) |
$ | 265,290,988 | |||||||||||||||||
| Total Investments Purchased with Collateral from Securities Lending (cost $265,290,988) |
|
265,290,988 | ||||||||||||||||||
|
Principal |
Description (1) | Coupon | Maturity | Ratings (2) | Value | |||||||||||||||
| SHORT-TERM INVESTMENTS – 6.1% |
||||||||||||||||||||
| Money Market Funds – 5.6% |
||||||||||||||||||||
| 51,512,634 | First American Treasury Obligations Fund, Class Z |
0.000% (5) | N/A | N/A | $ | 51,512,634 | ||||||||||||||
| U.S. Government and Agency Obligations – 0.5% |
||||||||||||||||||||
| $ | 1,620 | U.S. Treasury Bills, (7) |
0.013% | 4/05/12 | Aaa | 1,619,916 | ||||||||||||||
| 1,270 | U.S. Treasury Bills, (7) |
0.018% | 5/03/12 | Aaa | 1,269,893 | |||||||||||||||
| 1,170 | U.S. Treasury Bills, (7) |
0.053% | 7/26/12 | Aaa | 1,169,634 | |||||||||||||||
| $ | 4,060 | Total U.S. Government and Agency Obligations |
4,059,443 | |||||||||||||||||
| Total Short-Term Investments (cost $55,572,280) |
55,572,077 | |||||||||||||||||||
| Total Investments (cost $1,201,606,279) – 134.6% |
1,227,999,556 | |||||||||||||||||||
| Other Assets Less Liabilities – (34.6)% (8) |
(315,389,986) | |||||||||||||||||||
| Net Assets – 100% |
$ | 912,609,570 | ||||||||||||||||||
| 46 | Nuveen Investments |
Investments in Derivatives at December 31, 2011:
Interest Rate Swaps outstanding:
| Counterparty | Notional Amount |
Fund Pay/Receive Floating Rate |
Floating Rate Index |
Fixed Rate (Annualized) |
Fixed Rate Payment Frequency |
Termination Date |
Value (U.S. Dollars) |
Unrealized Appreciation (Depreciation) (U.S. Dollars) |
||||||||||||||||||||||||
| JPMorgan |
$ | 8,000,000 | Receive | 3-Month USD-LIBOR | 3.858 | % | Semi-Annually | 1/19/20 | $ | (1,413,143 | ) | $ | (1,413,143 | ) | ||||||||||||||||||
| UBS |
33,000,000 | Receive | 3-Month USD-LIBOR | 1.133 | Semi-Annually | 3/25/12 | (140,475 | ) | (140,475 | ) | ||||||||||||||||||||||
| UBS |
33,000,000 | Receive | 3-Month USD-LIBOR | 1.048 | Semi-Annually | 6/25/12 | (71,125 | ) | (71,125 | ) | ||||||||||||||||||||||
| UBS |
14,000,000 | Receive | 3-Month USD-LIBOR | 3.001 | Semi-Annually | 8/03/14 | (976,274 | ) | (976,274 | ) | ||||||||||||||||||||||
| $ | (2,601,017 | ) | ||||||||||||||||||||||||||||||
Futures Contracts outstanding:
| Type | Contract Position |
Number of Contracts |
Contract Expiration |
Value (U.S. Dollars) |
Unrealized Appreciation (Depreciation) (U.S. Dollars) |
|||||||||||||||
| U.S. Treasury 2-Year Note |
Long | 410 | 3/12 | $ | 90,424,221 | $ | 50,301 | |||||||||||||
| U.S. Treasury 5-Year Note |
Short | (285 | ) | 3/12 | (35,128,476 | ) | (102,369) | |||||||||||||
| U.S. Treasury 10-Year Note |
Short | (290 | ) | 3/12 | (38,026,250 | ) | (315,305) | |||||||||||||
| U.S. Treasury Long Bond |
Long | 113 | 3/12 | 16,363,813 | 107,535 | |||||||||||||||
| U.S. Treasury Ultra Bond |
Long | 1 | 3/12 | 160,188 | 1,544 | |||||||||||||||
| $ | (258,294) | |||||||||||||||||||
| For Fund portfolio compliance purposes, the Fund’s industry classifications refer to any one or more of the industry sub-classifications used by one or more widely recognized market indexes or ratings group indexes, and/or as defined by Fund management. This definition may not apply for purposes of this report, which may combine industry sub-classifications into sectors for reporting ease. |
| (1) | All Percentages shown in the Portfolio of Investments are based on net assets. |
| (2) | Ratings: Using the highest of Standard & Poor’s Group (“Standard & Poor’s”), Moody’s Investors Service, Inc. (“Moody’s”) or Fitch, Inc. (“Fitch”) rating. Ratings below BBB by Standard & Poor’s, Baa by Moody’s or BBB by Fitch are considered to be below investment grade. Holdings designated N/R are not rated by any of these national rating agencies. |
| (3) | Optional Call Provisions: Dates (month and year) and prices of the earliest optional call or redemption. There may be other call provisions at varying prices at later dates. Certain mortgage-backed securities may be subject to periodic principal paydowns. |
| (4) | Investment, or a portion of investment, is out on loan for securities lending. |
| (5) | The rate shown is the annualized seven-day effective yield as of December 31, 2011. |
| (6) | The Fund may loan securities representing up to one third of the fair value of its total assets (which includes collateral for securities on loan) to broker-dealers, banks, or other institutional borrowers of securities. The Fund maintains collateral equal to at least 102% of the fair value of the securities loaned. The adequacy of the collateral is monitored on a daily basis. The cash collateral received by the Fund is invested in this money market fund. |
| (7) | Investment, or portion of investment, segregated as collateral for investments in derivatives. Yield shown is effective yield as of December 31, 2011. |
| (8) | Other Assets Less Liabilities, includes the Unrealized Appreciation (Depreciation) of derivative instruments as noted within Investments in Derivatives at December 31, 2011. |
| N/A | Not applicable. |
| N/R | Not rated. |
| TBA | To be announced. Maturity date not known prior to settlement of this transaction. |
| WI/DD | Purchased on a when-issued or delayed delivery basis. |
| 144A | Investment is exempt from registration under Rule 144A of the Securities Act of 1933, as amended. These investments may only be resold in transactions exempt from registration, which are normally those transactions with qualified institutional buyers. |
| USD-LIBOR | United States Dollar–London Inter-Bank Offered Rate. |
See accompanying notes to financial statements.
| Nuveen Investments | 47 |
Portfolio of Investments (Unaudited)
Nuveen Global Total Return Bond Fund
December 31, 2011
| Principal Amount (000) |
Description (1) | Coupon | Maturity | Ratings (2) | Value | |||||||||||||||
| CORPORATE BONDS – 20.4% |
||||||||||||||||||||
| Aerospace & Defense – 0.1% |
||||||||||||||||||||
| $ | 20 | Huntington Ingalls Industries Inc., 144A |
7.125% | 3/15/21 | Ba3 | $ | 19,600 | |||||||||||||
| Airlines – 0.1% |
||||||||||||||||||||
| 20 | United Airlines Inc., 144A |
12.000% | 11/01/13 | B– | 20,850 | |||||||||||||||
| Auto Components – 0.1% |
||||||||||||||||||||
| 20 | Dana Holding Corporation |
6.500% | 2/15/19 | BB– | 20,200 | |||||||||||||||
| Automobiles – 0.2% |
||||||||||||||||||||
| 30 | Chrysler GP/CG Company, 144A |
8.000% | 6/15/19 | B | 27,450 | |||||||||||||||
| Biotechnology – 0.4% |
||||||||||||||||||||
| 30 | Gilead Sciences Inc. |
4.400% | 12/01/21 | A– | 31,761 | |||||||||||||||
| 20 | STHI Holding Corporation, 144A |
8.000% | 3/15/18 | B | 20,550 | |||||||||||||||
| 50 | Total Biotechnology |
52,311 | ||||||||||||||||||
| Building Products – 0.3% |
||||||||||||||||||||
| 25 | Corporativo Javer S.A. de C.V, 144A |
9.875% | 4/06/21 | B1 | 22,750 | |||||||||||||||
| 20 | Texas Industries Inc. |
9.250% | 8/15/20 | B– | 17,900 | |||||||||||||||
| 45 | Total Building Products |
40,650 | ||||||||||||||||||
| Capital Markets – 1.9% |
||||||||||||||||||||
| 125 | Goldman Sachs Group, Inc. |
6.000% | 6/15/20 | A1 | 128,045 | |||||||||||||||
| 125 | Morgan Stanley |
5.500% | 7/24/20 | A2 | 113,654 | |||||||||||||||
| 25 | UBS AG Stamford |
4.875% | 8/04/20 | Aa3 | 24,829 | |||||||||||||||
| 275 | Total Capital Markets |
266,528 | ||||||||||||||||||
| Chemicals – 0.6% |
||||||||||||||||||||
| 30 | Ecolab Inc. |
4.350% | 12/08/21 | BBB+ | 32,037 | |||||||||||||||
| 20 | Georgia Gulf Corporation |
9.000% | 1/15/17 | B+ | 21,150 | |||||||||||||||
| 25 | Huntsman International LLC, Series 2011 |
8.625% | 3/15/21 | B | 26,500 | |||||||||||||||
| 75 | Total Chemicals |
79,687 | ||||||||||||||||||
| Commercial Banks – 0.3% |
||||||||||||||||||||
| 25 | HSBC Holdings PLC |
6.800% | 6/01/38 | A1 | 25,894 | |||||||||||||||
| 20 | Royal Bank of Scotland Group PLC |
6.400% | 10/21/19 | A– | 18,724 | |||||||||||||||
| 45 | Total Commercial Banks |
44,618 | ||||||||||||||||||
| Communications Equipment – 0.1% |
||||||||||||||||||||
| 20 | Goodman Networks Inc., 144A |
12.125% | 7/01/18 | B+ | 19,100 | |||||||||||||||
| Computers & Peripherals – 0.4% |
||||||||||||||||||||
| 30 | Hewlett Packard Company |
4.650% | 12/09/21 | A2 | 31,652 | |||||||||||||||
| 20 | Seagate HDD Cayman |
6.875% | 5/01/20 | BB+ | 20,550 | |||||||||||||||
| 50 | Total Computers & Peripherals |
52,202 | ||||||||||||||||||
| Consumer Finance – 0.4% |
||||||||||||||||||||
| 30 | Capital One Bank |
8.800% | 7/15/19 | Baa1 | 34,320 | |||||||||||||||
| 20 | Discover Financial Services |
10.250% | 7/15/19 | BBB– | 24,379 | |||||||||||||||
| 50 | Total Consumer Finance |
58,699 | ||||||||||||||||||
| Containers & Packaging – 0.1% |
||||||||||||||||||||
| 15 | Intertape Polymer US Inc. |
8.500% | 8/01/14 | Caa1 | 14,325 | |||||||||||||||
| 48 | Nuveen Investments |
| Principal Amount (000) |
Description (1) | Coupon | Maturity | Ratings (2) | Value | |||||||||||||||
| Diversified Financial Services – 3.5% |
||||||||||||||||||||
| $ | 50 | Bank of America Corporation |
5.750% | 12/01/17 | A– | $ | 47,226 | |||||||||||||
| 115 | Bank of America Corporation |
5.875% | 1/05/21 | A– | 109,460 | |||||||||||||||
| 80 | Citigroup Inc. |
5.375% | 8/09/20 | A– | 82,262 | |||||||||||||||
| 30 | Citigroup Inc. |
6.125% | 8/25/36 | BBB+ | 25,950 | |||||||||||||||
| 30 | General Electric Capital Corporation |
5.300% | 2/11/21 | AA | 32,069 | |||||||||||||||
| 25 | General Electric Capital Corporation |
6.875% | 1/10/39 | AA+ | 29,951 | |||||||||||||||
| 105 | JPMorgan Chase & Company |
4.350% | 8/15/21 | Aa3 | 106,040 | |||||||||||||||
| 45 | JPMorgan Chase & Company |
6.400% | 5/15/38 | Aa3 | 52,239 | |||||||||||||||
| 480 | Total Diversified Financial Services |
485,197 | ||||||||||||||||||
| Diversified Telecommunication Services – 0.8% |
||||||||||||||||||||
| 25 | AT&T, Inc. |
5.550% | 8/15/41 | A2 | 29,435 | |||||||||||||||
| 20 | Embarq Corporation |
7.082% | 6/01/16 | Baa3 | 21,679 | |||||||||||||||
| 25 | Telecom Italia Capital S.p.A |
7.175% | 6/18/19 | BBB | 23,428 | |||||||||||||||
| 35 | Telefonica Emisiones SAU |
5.462% | 2/16/21 | BBB+ | 33,399 | |||||||||||||||
| 105 | Total Diversified Telecommunication Services |
107,941 | ||||||||||||||||||
| Energy Equipment & Services – 0.4% |
||||||||||||||||||||
| 20 | Diamond Offshore Drilling Inc. |
5.700% | 10/15/39 | A– | 22,302 | |||||||||||||||
| 25 | Weatherford International Limited |
7.000% | 3/15/38 | BBB | 28,445 | |||||||||||||||
| 45 | Total Energy Equipment & Services |
50,747 | ||||||||||||||||||
| Food Products – 0.6% |
||||||||||||||||||||
| 100 | JBS Finance II Limited, 144A |
8.250% | 1/29/18 | BB | 90,750 | |||||||||||||||
| Health Care Providers & Services – 0.2% |
||||||||||||||||||||
| 25 | HCA Holdings Inc. |
7.750% | 5/15/21 | B– | 25,438 | |||||||||||||||
| Hotels, Restaurants & Leisure – 0.9% |
||||||||||||||||||||
| 20 | Isle of Capri Casinos, Inc. |
7.750% | 3/15/19 | B– | 18,300 | |||||||||||||||
| 100 | Reynolds Group, 144A |
7.125% | 4/15/19 | BB– | 101,750 | |||||||||||||||
| 120 | Total Hotels, Restaurants & Leisure |
120,050 | ||||||||||||||||||
| Industrial Conglomerates – 0.1% |
||||||||||||||||||||
| 20 | Abengoa Finance SAU, 144A |
8.875% | 11/01/17 | Ba3 | 20,000 | |||||||||||||||
| Insurance – 1.1% |
||||||||||||||||||||
| 30 | Allied World Assurance Holdings Limited |
7.500% | 8/01/16 | BBB+ | 33,857 | |||||||||||||||
| 30 | Genworth Financial Inc. |
6.515% | 5/22/18 | BBB | 27,532 | |||||||||||||||
| 35 | Hartford Financial Services Group Inc. |
6.000% | 1/15/19 | BBB | 35,920 | |||||||||||||||
| 25 | MetLife Inc. |
6.750% | 6/01/16 | A– | 28,801 | |||||||||||||||
| 20 | Prudential Financial Inc. |
5.500% | 3/15/16 | A | 21,679 | |||||||||||||||
| 140 | Total Insurance |
147,789 | ||||||||||||||||||
| Media – 1.5% |
||||||||||||||||||||
| 20 | Comcast Corporation |
6.400% | 5/15/38 | BBB+ | 24,029 | |||||||||||||||
| 55 | DIRECTV Holdings LLC |
5.200% | 3/15/20 | BBB | 59,280 | |||||||||||||||
| 30 | NBC Universal Media LLC |
4.375% | 4/01/21 | BBB+ | 31,660 | |||||||||||||||
| 20 | News America Holdings Inc. |
6.650% | 11/15/37 | BBB+ | 22,659 | |||||||||||||||
| 40 | Time Warner Inc. |
6.100% | 7/15/40 | BBB | 46,893 | |||||||||||||||
| 20 | Viacom Inc. |
6.875% | 4/30/36 | BBB+ | 25,031 | |||||||||||||||
| 185 | Total Media |
209,552 | ||||||||||||||||||
| Nuveen Investments | 49 |
Portfolio of Investments (Unaudited)
Nuveen Global Total Return Bond Fund (continued)
December 31, 2011
| Principal Amount (000) |
Description (1) | Coupon | Maturity | Ratings (2) | Value | |||||||||||||||
| Metals & Mining – 1.7% |
||||||||||||||||||||
| $ | 55 | Alcoa Inc. |
5.400% | 4/15/21 | BBB– | $ | 55,103 | |||||||||||||
| 25 | Anglogold Holdings PLC |
6.500% | 4/15/40 | BBB– | 24,323 | |||||||||||||||
| 35 | ArcelorMittal |
7.000% | 10/15/39 | BBB– | 32,526 | |||||||||||||||
| 35 | Cliffs Natural Resources Inc. |
4.800% | 10/01/20 | BBB– | 34,719 | |||||||||||||||
| 20 | JMC Steel Group, 144A |
8.250% | 3/15/18 | B | 19,500 | |||||||||||||||
| 20 | Taseko Mines Limited |
7.750% | 4/15/19 | B | 18,050 | |||||||||||||||
| 20 | Thompson Creek Metals Company |
7.375% | 6/01/18 | B | 17,800 | |||||||||||||||
| 25 | Vale Overseas Limited |
6.875% | 11/10/39 | A– | 28,635 | |||||||||||||||
| 235 | Total Metals & Mining |
230,656 | ||||||||||||||||||
| Oil, Gas & Consumable Fuels – 2.4% |
||||||||||||||||||||
| 20 | Anadarko Petroleum Corporation |
6.200% | 3/15/40 | BBB– | 22,258 | |||||||||||||||
| 100 | Bumi Capital Pte Limited, 144A |
12.000% | 11/10/16 | BB | 101,000 | |||||||||||||||
| 20 | Carrizo Oil and Gas Inc. |
8.625% | 10/15/18 | B– | 20,200 | |||||||||||||||
| 20 | Kodiak Oil and Gas Corporation, 144A |
8.125% | 12/01/19 | B– | 20,725 | |||||||||||||||
| 25 | Nexen Inc. |
6.400% | 5/15/37 | BBB– | 26,481 | |||||||||||||||
| 30 | Noble Energy Inc. |
4.150% | 12/15/21 | BBB | 31,035 | |||||||||||||||
| 25 | OGX Petroleo e Gas Participacoes SA, 144A |
8.500% | 6/01/18 | B1 | 24,500 | |||||||||||||||
| 50 | Petrobras International Finance Company |
6.875% | 1/20/40 | A3 | 57,909 | |||||||||||||||
| 25 | Valero Energy Corporation |
6.125% | 2/01/20 | BBB | 27,808 | |||||||||||||||
| 315 | Total Oil, Gas & Consumable Fuels |
331,916 | ||||||||||||||||||
| Paper & Forest Products – 0.3% |
||||||||||||||||||||
| 30 | International Paper Company |
8.700% | 6/15/38 | BBB | 40,701 | |||||||||||||||
| Pharmaceuticals – 0.2% |
||||||||||||||||||||
| 30 | Valeant Pharmaceuticals International, 144A |
6.875% | 12/01/18 | BB | 29,925 | |||||||||||||||
| Real Estate Investment Trust – 0.5% |
||||||||||||||||||||
| 15 | Prologis Inc. |
6.875% | 3/15/20 | Baa2 | 16,655 | |||||||||||||||
| 20 | Simon Property Group, LP |
5.650% | 2/01/20 | A– | 22,921 | |||||||||||||||
| 30 | Vornado Realty LP |
4.250% | 4/01/15 | BBB | 31,048 | |||||||||||||||
| 65 | Total Real Estate Investment Trust |
70,624 | ||||||||||||||||||
| Real Estate Management & Development – 0.6% |
||||||||||||||||||||
| 100 | Agile Property Holdings Limited, 144A |
10.000% | 11/14/16 | BB | 88,500 | |||||||||||||||
| Tobacco – 0.2% |
||||||||||||||||||||
| 20 | Altria Group Inc. |
4.750% | 5/05/21 | Baa1 | 22,021 | |||||||||||||||
| Wireless Telecommunication Services – 0.4% |
||||||||||||||||||||
| 25 | American Tower Company |
5.050% | 9/01/20 | Baa3 | 25,045 | |||||||||||||||
| 25 | NII Capital Corporation |
7.625% | 4/01/21 | B+ | 24,812 | |||||||||||||||
| 50 | Total Wireless Telecommunication Services |
49,857 | ||||||||||||||||||
| $ | 2,780 | Total Corporate Bonds (cost $2,822,788) |
2,837,884 | |||||||||||||||||
| 50 | Nuveen Investments |
| Principal Amount (000) |
Description (1) | Coupon | Maturity | Ratings (2) | Value | |||||||||||||||
| CONVERTIBLE BONDS – 0.1% |
||||||||||||||||||||
| Health Care Equipment & Supplies – 0.1% |
||||||||||||||||||||
| $ | 20 | Boston Properties Limited Partnership |
4.125% | 5/15/21 | A– | $ | 20,126 | |||||||||||||
| $ | 20 | Total Convertible Bonds (cost $20,421) |
20,126 | |||||||||||||||||
| Principal Amount (000) |
Description (1) | Coupon | Maturity | Ratings (2) | Value | |||||||||||||||
| U.S. GOVERNMENT AND AGENCY OBLIGATIONS – 7.2% |
||||||||||||||||||||
| $ | 1,000 | U.S. Treasury Notes |
0.375% | 6/20/13 | Aaa | $ | 1,002,383 | |||||||||||||
| $ | 1,000 | Total U.S. Government and Agency Obligations (cost $1,002,454) |
1,002,383 | |||||||||||||||||
| Principal Amount (000) |
Description (1) | Coupon | Maturity | Ratings (2) | Value | |||||||||||||||
| ASSET-BACKED AND MORTGAGE-BACKED SECURITIES – 15.1% |
||||||||||||||||||||
| $ | 250 | Fannie Mae Mortgage TBA Pools, (WI/DD) |
3.500% | TBA | Aaa | $ | 257,109 | |||||||||||||
| 1,330 | Fannie Mae Mortgage TBA Pools, (WI/DD) |
4.000% | TBA | Aaa | 1,397,122 | |||||||||||||||
| 430 | Fannie Mae Mortgage TBA Pools, (WI/DD) |
4.500% | TBA | Aaa | 457,549 | |||||||||||||||
| $ | 2,010 | Total Asset-Backed and Mortgage-Backed Securities (cost $2,101,591) |
2,111,780 | |||||||||||||||||
| Principal Amount (000) (3) |
Description (1) | Coupon | Maturity | Ratings (2) | Value | |||||||||||||||
| SOVEREIGN DEBT – 53.5% |
||||||||||||||||||||
| Argentina – 0.7% |
||||||||||||||||||||
| $ | 100 | Argentine Republic Government International Bond |
8.750% | 6/02/17 | B | $ | 94,000 | |||||||||||||
| Australia – 4.4% |
||||||||||||||||||||
| 100 AUD | Australian Government Bond |
6.500% | 5/15/13 | Aaa | 106,649 | |||||||||||||||
| 250 AUD | Australian Government Bond |
4.750% | 6/15/16 | Aaa | 271,297 | |||||||||||||||
| 200 AUD | Australian Government Bond |
5.750% | 5/15/21 | AAA | 237,907 | |||||||||||||||
| 550 AUD | Total Australia |
615,853 | ||||||||||||||||||
| Canada – 4.7% |
||||||||||||||||||||
| 100 CAD | Canadian Government Bond |
1.500% | 11/01/13 | AAA | 99,146 | |||||||||||||||
| 275 CAD | Canadian Government Bond |
2.750% | 9/01/16 | AAA | 287,890 | |||||||||||||||
| 250 CAD | Canadian Government Bond |
3.250% | 6/01/21 | AAA | 272,834 | |||||||||||||||
| 625 CAD | Total Canada |
659,870 | ||||||||||||||||||
| Finland – 2.5% |
||||||||||||||||||||
| 250 EUR | Finland Government Bond |
3.375% | 4/15/20 | AAA | 350,838 | |||||||||||||||
| Germany – 5.7% |
||||||||||||||||||||
| 390 EUR | Deutschland Republic |
2.250% | 9/04/21 | AAA | 525,350 | |||||||||||||||
| 200 EUR | Bundesobligation |
1.250% | 10/14/16 | AAA | 264,479 | |||||||||||||||
| 590 EUR | Total Germany |
789,829 | ||||||||||||||||||
| Indonesia – 0.8% |
||||||||||||||||||||
| 100 | Republic of Indonesia, 144A |
5.875% | 3/13/20 | BB+ | 113,250 | |||||||||||||||
| Mexico – 6.0% |
||||||||||||||||||||
| 40 MXN | Mexican Bonos de DeSarrollo |
9.500% | 12/18/14 | A– | 320,609 | |||||||||||||||
| 50 MXN | Mexican Bonos de DeSarrollo |
6.250% | 6/16/16 | Baa1 | 368,776 | |||||||||||||||
| 20 MXN | Mexican Bonos de DeSarrollo |
6.500% | 6/10/21 | A– | 143,113 | |||||||||||||||
| 110 MXN | Total Mexico |
832,498 | ||||||||||||||||||
| Nuveen Investments | 51 |
Portfolio of Investments (Unaudited)
Nuveen Global Total Return Bond Fund (continued)
December 31, 2011
| Principal Amount (000) (3) |
Description (1) | Coupon | Maturity | Ratings (2) | Value | |||||||||||||||
| Netherlands – 2.5% |
||||||||||||||||||||
| $ | 150 EUR | Netherlands Government |
2.750% | 1/15/15 | AAA | $ | 205,374 | |||||||||||||
| 100 EUR | Netherlands Government |
3.750% | 1/15/23 | Aaa | 146,909 | |||||||||||||||
| 250 EUR | Total Netherlands |
352,283 | ||||||||||||||||||
| New Zealand – 2.2% |
||||||||||||||||||||
| 350 NZD | New Zealand Government |
6.000% | 12/15/17 | Aaa | 312,199 | |||||||||||||||
| Norway – 3.1% |
||||||||||||||||||||
| 2,300 EUR | Norway Government Bond |
3.750% | 5/25/21 | AAA | 426,401 | |||||||||||||||
| Peru – 0.5% |
||||||||||||||||||||
| 50 | Republic of Peru |
6.550% | 3/14/37 | BBB | 63,500 | |||||||||||||||
| Philippines – 0.7% |
||||||||||||||||||||
| 100 | Republic of the Philippines |
4.000% | 1/15/21 | Ba2 | 102,500 | |||||||||||||||
| South Africa – 2.4% |
||||||||||||||||||||
| 2,800 ZAR | Republic of South Africa |
7.250% | 1/15/20 | A | 333,501 | |||||||||||||||
| Sweden – 2.4% |
||||||||||||||||||||
| 2,000 SEK | Swedish Government |
3.500% | 6/01/22 | AAA | 341,785 | |||||||||||||||
| Turkey – 3.8% |
||||||||||||||||||||
| 1,100 TRY | Turkey Government Bond |
0.000% | 11/07/12 | N/R | 529,185 | |||||||||||||||
| United Kingdom – 11.1% |
||||||||||||||||||||
| 100 GBP | United Kingdom, Treasury Bill |
4.500% | 3/07/13 | AAA | 162,935 | |||||||||||||||
| 100 GBP | United Kingdom, Treasury Bill |
4.000% | 9/07/16 | AAA | 177,584 | |||||||||||||||
| 250 GBP | United Kingdom, Treasury Bill |
3.750% | 9/07/19 | AAA | 448,045 | |||||||||||||||
| 350 GBP | United Kingdom, Treasury Bill |
3.750% | 9/07/21 | AAA | 628,649 | |||||||||||||||
| 70 GBP | United Kingdom, Treasury Bill |
4.250% | 9/07/39 | AAA | 133,882 | |||||||||||||||
| 870 GBP | Total United Kingdom |
1,551,095 | ||||||||||||||||||
| Total Sovereign Debt (cost $7,521,891) |
7,468,587 | |||||||||||||||||||
| Shares | Description (1) | Coupon |
Value | |||||||||||||||||
| SHORT-TERM INVESTMENTS – 22.5% |
||||||||||||||||||||
| Money Market Funds – 22.5% |
||||||||||||||||||||
| 3,134,657 | State Street Institutional Liquid Reserve Fund |
0.150% (4) | $ | 3,134,657 | ||||||||||||||||
| Total Short-Term Investments (cost $3,134,657) |
3,134,657 | |||||||||||||||||||
| Total Investments (cost $16,603,802) – 118.8% |
16,575,417 | |||||||||||||||||||
| Other Assets Less Liabilities – (18.8)% (5) |
(2,620,497 | ) | ||||||||||||||||||
| Net Assets – 100% |
$ | 13,954,920 | ||||||||||||||||||
Investments in Derivatives at December 31, 2011:
Forward Foreign Currency Exchange Contracts outstanding:
| Counterparty |
Currency Contracts to Deliver | Amount (Local Currency) |
In Exchange For Currency |
Amount (Local Currency) |
Settlement Date |
Unrealized Appreciation Depreciation) (U.S. Dollars) (5) |
||||||||||||||||
| Citigroup |
Brazilian Real | 1,350,000 | U.S. Dollar | 725,806 | 1/04/12 | $ | 2,984 | |||||||||||||||
| Morgan Stanley |
Danish Krone | 4,000,000 | U.S. Dollar | 699,521 | 2/16/12 | 2,764 | ||||||||||||||||
| Morgan Stanley |
Euro | 500,000 | U.S. Dollar | 667,675 | 2/13/12 | 20,323 | ||||||||||||||||
| Morgan Stanley |
Euro | 500,000 | U.S. Dollar | 649,442 | 2/16/12 | 2,071 | ||||||||||||||||
| Morgan Stanley |
Euro | 1,145,712 | U.S. Dollar | 1,533,649 | 2/29/12 | 50,058 | ||||||||||||||||
| Citigroup |
Malaysian Ringgit | 1,400,000 | U.S. Dollar | 441,640 | 1/06/12 | 223 | ||||||||||||||||
| Citigroup |
South Korean Won | |
1,500,000,000 |
|
U.S. Dollar | 1,293,103 | 1/06/12 | (8,896 | ) | |||||||||||||
| 52 | Nuveen Investments |
Investments in Derivatives at December 31, 2011 (continued):
Forward Foreign Currency Exchange Contracts outstanding (continued):
| Counterparty |
Currency Contracts to Deliver | Amount (Local Currency) |
In Exchange For Currency |
Amount (Local Currency) |
Settlement Date |
Unrealized Appreciation Depreciation) (U.S. Dollars) (5) |
||||||||||||||||
| Citigroup |
U.S. Dollar | 752,508 | Brazilian Real | 1,350,000 | 1/04/12 | $ | (29,686 | ) | ||||||||||||||
| Citigroup |
U.S. Dollar | 1,332,741 | South Korean Won | 1,500,000,000 | 1/06/12 | (31,381 | ) | |||||||||||||||
| Citigroup |
U.S. Dollar | 448,718 | Malaysian Ringgit | 1,400,000 | 1/06/12 | (7,300 | ) | |||||||||||||||
| Morgan Stanley |
U.S. Dollar | 450,000 | Indonesian Rupiah | 4,068,000,000 | 1/09/12 | (1,833 | ) | |||||||||||||||
| Morgan Stanley |
U.S. Dollar | 768,145 | Chinese Yuan | 4,900,000 | 12/07/12 | 7,287 | ||||||||||||||||
| Citigroup |
U.S. Dollar | 720,923 | Brazilian Real | 1,350,000 | 2/02/12 | (3,287 | ) | |||||||||||||||
| Morgan Stanley |
U.S. Dollar | 1,017,394 | Canadian Dollar | 1,030,000 | 2/06/12 | (7,234 | ) | |||||||||||||||
| Citigroup |
U.S. Dollar | 448,873 | Chilean Peso | 232,000,000 | 2/06/12 | (4,685 | ) | |||||||||||||||
| Morgan Stanley |
U.S. Dollar | 692,353 | Australian Dollar | 678,000 | 2/07/12 | (2,137 | ) | |||||||||||||||
| Morgan Stanley |
U.S. Dollar | 773,823 | Mexican Peso | 10,500,000 | 2/07/12 | (23,950 | ) | |||||||||||||||
| Morgan Stanley |
U.S. Dollar | 134,903 | New Zealand Dollar | 173,379 | 2/08/12 | (329 | ) | |||||||||||||||
| Morgan Stanley |
U.S. Dollar | 693,351 | Canadian Dollar | 700,000 | 2/09/12 | (6,881 | ) | |||||||||||||||
| Citigroup |
U.S. Dollar | 1,289,879 | South Korean Won | 1,500,000,000 | 2/13/12 | 12,121 | ||||||||||||||||
| Citigroup |
U.S. Dollar | 440,390 | Malaysian Ringgit | 1,400,000 | 2/27/12 | 1,027 | ||||||||||||||||
| $ | (28,741 | ) | ||||||||||||||||||||
Credit Default Swaps outstanding:
| Counterparty | Reference Entity | Buy/Sell Protection (6) |
Current Credit Spread (7) |
Notional Amount |
Fixed Rate* |
Termination Date |
Value (U.S. Dollars) |
Unrealized Appreciation Depreciation) (U.S. Dollars) (5) |
||||||||||||||||||||||||||
| Citibank N.A. |
Markit CDX NA HY17 Index | Sell | 7.04 | % | $ | 784,000 | USD | 5.000 | % | 12/20/16 | $ | (34,378 | ) | $ | 3,638 | |||||||||||||||||||
| Citibank N.A. |
Markit CDX NA IG17 Index | Sell | 1.25 | 1,000,000 | USD | 1.000 | 12/20/16 | (9,384 | ) | 2,370 | ||||||||||||||||||||||||
| Citibank N.A. |
CITI ITRX EUR XOVER Index | Sell | 8.13 | 400,000 | EUR | 5.000 | 12/20/16 | (47,380 | ) | (2,881 | ) | |||||||||||||||||||||||
| Morgan Stanley |
ITRAXX ASIA EX JAPAN IG Index | Sell | 1.97 | 500,000 | USD | 1.000 | 12/20/16 | (23,999 | ) | (4,067 | ) | |||||||||||||||||||||||
| Morgan Stanley |
ITRAXX EUROPE Index | Sell | 1.91 | 600,000 | EUR | 1.000 | 12/20/16 | (25,749 | ) | (1,251 | ) | |||||||||||||||||||||||
| $ | (2,191 | ) | ||||||||||||||||||||||||||||||||
| * | Annualized. |
Futures Contracts outstanding:
| Type | Contract Position |
Number of Contracts |
Contract Expiration |
Value (U.S. Dollars) |
Unrealized Appreciation Depreciation) (U.S. Dollars) (5) |
|||||||||||||||
| 3 Month Euro Euribor |
Long | 23 | 3/14 | $ | 7,347,408 | $ | 18,451 | |||||||||||||
| U.S. Treasury Long Bond |
Short | (2 | ) | 3/12 | (289,625 | ) | 433 | |||||||||||||
| $ | 18,884 | |||||||||||||||||||
Call Options Purchased outstanding:
| Number of Contracts | Type | Notional Amount (8) |
Expiration Date |
Strike Price |
Value (5) | |||||||||||||
| 17 | U.S. 10-Year Note Futures |
$ | 226,100 | 2/12 | 133.0 | $ | 2,922 | |||||||||||
| Total Call Options Purchased (premiums paid $6,216) |
$ | 2,922 | ||||||||||||||||
| Nuveen Investments | 53 |
Portfolio of Investments (Unaudited)
Nuveen Global Total Return Bond Fund (continued)
December 31, 2011
| (1) | All percentages shown in the Portfolio of Investments are based on net assets. |
| (2) | Ratings: Using the highest of Standard & Poor’s Group (“Standard & Poor’s”), Moody’s Investors Service, Inc. (“Moody’s”) or Fitch, Inc. (“Fitch”) rating. Ratings below BBB by Standard & Poor’s, Baa by Moody’s or BBB by Fitch are considered to be below investment grade. Holdings designated N/R are not rated by any of these national rating agencies. |
| (3) | Principal Amount (000) denominated in U.S. Dollars, unless otherwise noted. |
| (4) | The rate shown is the annualized seven-day effective yield as of December 31, 2011. |
| (5) | Other Assets Less Liabilities, includes the Value and the Unrealized Appreciation (Depreciation) of derivative instruments as noted within Investments in Derivatives at December 31, 2011. |
| (6) | The Fund entered into the credit default swaps to gain investment exposure to the referenced entity. Selling protection has a similar credit risk position to owning the referenced entity. Buying protection has a similar credit risk position to selling the referenced entity short. |
| (7) | The credit spread generally serves as an indication of the current status of the payment/performance risk and therefore the likelihood of default of the credit derivative. The credit spread also reflects the cost of buying/selling protection and may include upfront payments required to be made to enter into a credit default swap contract. Higher credit spreads are indicative of higher likelihood of performance by the seller of protection. |
| (8) | For disclosure purposes, Notional Amount is calculated by multiplying the Number of Contracts by Strike Price by 100. |
| N/R | Not rated. |
| TBA | To be announced. Maturity date not known prior to settlement of this transaction. |
| WI/DD | Purchased on a when-issued or delayed delivery basis. |
| 144A | Investment is exempt from registration under Rule 144A of the Securities Act of 1933, as amended. These investments may only be resold in transactions exempt from registration, which are normally those transactions with qualified institutional buyers. |
| AUD | Australian Dollar |
| CAD | Canadian Dollar |
| EUR | Euro |
| GBP | British Pound Sterling |
| MXN | Mexican Peso |
| NZD | New Zealand Dollar |
| SEK | Swedish Krona |
| TRY | Turkish Lira |
| USD | United States Dollar |
| ZAR | South African Rand |
See accompanying notes to financial statements.
| 54 | Nuveen Investments |
Portfolio of Investments (Unaudited)
Nuveen High Income Bond Fund
December 31, 2011
| Shares | Description (1) | Value | ||||||||||||||||||
| COMMON STOCKS – 1.1% |
||||||||||||||||||||
| Building Products – 0.0% |
||||||||||||||||||||
| 527 | Dayton Superior, (3) |
$ | 30,195 | |||||||||||||||||
| 585 | Dayton Superior, (3) |
33,550 | ||||||||||||||||||
| Total Building Products |
63,745 | |||||||||||||||||||
| Consumer Discretionary – 0.1% |
||||||||||||||||||||
| 14,000 | Target Corporation |
717,080 | ||||||||||||||||||
| Consumer Staples – 0.1% |
||||||||||||||||||||
| 12,306 | Archer-Daniels-Midland Company, (4) |
351,952 | ||||||||||||||||||
| Energy – 0.3% |
||||||||||||||||||||
| 5,300 | ConocoPhillips, (4) |
386,211 | ||||||||||||||||||
| 10,500 | Marathon Petroleum Corporation |
349,545 | ||||||||||||||||||
| 34,000 | Pengrowth Energy Corporation |
358,020 | ||||||||||||||||||
| 34,000 | Provident Energy Limited |
329,460 | ||||||||||||||||||
| Total Energy |
1,423,236 | |||||||||||||||||||
| Financials – 0.3% |
||||||||||||||||||||
| 15,700 | Mid-America Apartment Communities |
982,035 | ||||||||||||||||||
| 57,000 | Och-Ziff Capital Management Group, Class A Shares |
479,370 | ||||||||||||||||||
| 18,000 | Protective Life Corporation, (4) |
406,080 | ||||||||||||||||||
| Total Financials |
1,867,485 | |||||||||||||||||||
| Industrials – 0.1% |
||||||||||||||||||||
| 21,658 | Delta Air Lines, Inc., (5) |
175,213 | ||||||||||||||||||
| 2,860 | Magnachip Semiconductor Inc Escrow, (5), (6) |
21,393 | ||||||||||||||||||
| 21,100 | Nortek Inc., (5) |
551,976 | ||||||||||||||||||
| Total Industrials |
748,582 | |||||||||||||||||||
| Telecommunication Services – 0.2% |
||||||||||||||||||||
| 14,506 | FairPoint Communications Inc., (4), (5) |
62,814 | ||||||||||||||||||
| 8,300 | Nippon Telegraph and Telephone Corporation, ADR |
210,239 | ||||||||||||||||||
| 18,000 | Telefonica S.A., Sponsored ADR |
309,420 | ||||||||||||||||||
| 19,000 | Vodafone Group PLC, Sponsored ADR, (4) |
532,570 | ||||||||||||||||||
| Total Telecommunication Services |
1,115,043 | |||||||||||||||||||
| Total Common Stocks (cost $7,112,307) |
6,287,123 | |||||||||||||||||||
| Shares | Description (1) | Value | ||||||||||||||||||
| EXCHANGE-TRADED FUNDS – 0.3% |
||||||||||||||||||||
| 5,000 | iShares Iboxx HY Corp Bond ETF, (4) |
$ | 447,150 | |||||||||||||||||
| 2,900 | SPDR DB International Government Inflation Protected Bond ETF |
|
164,604 | |||||||||||||||||
| 14,400 | SPDR S&P Dividend ETF |
775,728 | ||||||||||||||||||
| Total Exchange-Traded Funds (cost $1,254,882) |
1,387,482 | |||||||||||||||||||
| Principal Amount (000) |
Description (1) | Coupon | Maturity | Ratings (2) | Value | |||||||||||||||
| CORPORATE BONDS – 89.3% |
||||||||||||||||||||
| Aerospace & Defense – 1.5% |
||||||||||||||||||||
| $ | 1,900 | CHC Helicopter, (4) |
9.250% | 10/15/20 | B+ | $ | 1,710,000 | |||||||||||||
| 1,000 | Ducommun Inc., 144A |
9.750% | 7/15/18 | B– | 1,015,000 | |||||||||||||||
| Nuveen Investments | 55 |
Portfolio of Investments (Unaudited)
Nuveen High Income Bond Fund (continued)
December 31, 2011
| Principal Amount (000) |
Description (1) | Coupon | Maturity | Ratings (2) | Value | |||||||||||||||
| Aerospace & Defense (continued) |
||||||||||||||||||||
| $ | 3,010 | DynCorp International Inc. |
10.375% | 7/01/17 | B2 | $ | 2,618,700 | |||||||||||||
| 2,900 | Huntington Ingalls Industries Inc., 144A |
6.875% | 3/15/18 | BB | 2,842,000 | |||||||||||||||
| 8,810 | Total Aerospace & Defense |
8,185,700 | ||||||||||||||||||
| Air Freight & Logistics – 0.6% |
||||||||||||||||||||
| 3,300 | Park-Ohio Industries Inc. |
8.125% | 4/01/21 | B3 | 3,250,500 | |||||||||||||||
| Airlines – 2.1% |
||||||||||||||||||||
| 2,350 | Air Canada, 144A |
12.000% | 2/01/16 | B– | 2,026,875 | |||||||||||||||
| 1,000 | American Airlines Inc., (4) |
10.500% | 10/15/12 | N/R | 955,000 | |||||||||||||||
| 2,782 | American Airlines Pass Through Certificates Trust, Series 2011-1, (4) |
7.000% | 1/31/18 | B+ | 2,475,550 | |||||||||||||||
| 2,964 | Continental Airlines, inc. |
7.875% | 7/02/18 | Ba3 | 2,890,325 | |||||||||||||||
| 1,000 | North Atlantic Trading Company, 144A |
19.000% | 1/15/17 | Caa2 | 955,000 | |||||||||||||||
| 2,544 | United Airlines Inc., 144A |
12.000% | 11/01/13 | BB | 2,652,120 | |||||||||||||||
| 12,640 | Total Airlines |
11,954,870 | ||||||||||||||||||
| Auto Components – 1.2% |
||||||||||||||||||||
| 2,250 | American & Axle Manufacturing Inc., (4) |
7.750% | 11/15/19 | B1 | 2,205,000 | |||||||||||||||
| 2,250 | Dana Holding Corporation |
6.500% | 2/15/19 | BB– | 2,272,500 | |||||||||||||||
| 2,565 | Pittsburgh Glass Works LLC, 144A |
8.500% | 4/15/16 | B+ | 2,468,813 | |||||||||||||||
| 7,065 | Total Auto Components |
6,946,313 | ||||||||||||||||||
| Automobiles – 0.9% |
||||||||||||||||||||
| 4,250 | Chrysler GP/CG Company, 144A, (4) |
8.250% | 6/15/21 | B | 3,867,500 | |||||||||||||||
| 750 | Ford Motor Company, (4) |
7.450% | 7/16/31 | BB+ | 900,000 | |||||||||||||||
| 5,000 | Total Automobiles |
4,767,500 | ||||||||||||||||||
| Biotechnology – 0.4% |
||||||||||||||||||||
| 2,105 | STHI Holding Corporation, 144A |
8.000% | 3/15/18 | B | 2,162,888 | |||||||||||||||
| Building Products – 2.0% |
||||||||||||||||||||
| 1,135 | Associated Materials Inc., (4) |
9.125% | 11/01/17 | B | 990,288 | |||||||||||||||
| 3,897 | Corporativo Javer S.A. de C.V, 144A, (4) |
9.875% | 4/06/21 | B+ | 3,546,270 | |||||||||||||||
| 3,000 | Nortek Inc. |
10.000% | 12/01/18 | B | 2,842,500 | |||||||||||||||
| 1,500 | Ply Gem Industries Inc., (4) |
8.250% | 2/15/18 | B– | 1,306,875 | |||||||||||||||
| 2,830 | Texas Industries Inc., (4) |
9.250% | 8/15/20 | B– | 2,532,850 | |||||||||||||||
| 12,362 | Total Building Products |
11,218,783 | ||||||||||||||||||
| Capital Markets – 1.9% |
||||||||||||||||||||
| 2,000 | Ace Cash Express Inc., 144A, (4) |
11.000% | 2/01/19 | B | 1,835,000 | |||||||||||||||
| 2,500 | Constellation Enterprises LLC, 144A |
10.625% | 2/01/16 | B | 2,350,000 | |||||||||||||||
| 2,000 | E Trade Financial Corporation, (4) |
7.875% | 12/01/15 | B2 | 2,010,000 | |||||||||||||||
| 2,690 | Goldman Sachs Capital II |
5.793% | 6/01/43 | BBB+ | 1,654,350 | |||||||||||||||
| 1,000 | MPL 2 Acquisition Canco |
9.875% | 8/15/18 | B | 875,000 | |||||||||||||||
| 2,000 | Speedy Cash Inc,, 144A |
10.750% | 5/15/18 | B | 2,010,000 | |||||||||||||||
| 12,190 | Total Capital Markets |
10,734,350 | ||||||||||||||||||
| Chemicals – 2.3% |
||||||||||||||||||||
| 755 | Georgia Gulf Corporation |
9.000% | 1/15/17 | B+ | 798,413 | |||||||||||||||
| 2,000 | Huntsman International LLC, Series 2011, (4) |
8.625% | 3/15/21 | B | 2,120,000 | |||||||||||||||
| 2,500 | Ineos Finance PLC, 144A, (4) |
9.000% | 5/15/15 | Ba3 | 2,537,500 | |||||||||||||||
| 2,000 | IntelSat Jackson Holding, 144A, (4) |
8.500% | 11/01/19 | B | 2,120,000 | |||||||||||||||
| 3,500 | Momentive Performance Materials, 144A |
9.000% | 1/15/21 | Caa1 | 2,660,000 | |||||||||||||||
| 2,000 | Omonva Solutions Inc. |
7.875% | 11/01/18 | B2 | 1,730,000 | |||||||||||||||
| 1,000 | Vertellus Specialities Inc., 144A |
9.375% | 10/01/15 | B | 765,000 | |||||||||||||||
| 13,755 | Total Chemicals |
12,730,913 | ||||||||||||||||||
| 56 | Nuveen Investments |
| Principal Amount (000) |
Description (1) | Coupon | Maturity | Ratings (2) | Value | |||||||||||||||
| Commercial Banks – 0.8% |
||||||||||||||||||||
| $ | 2,000 | ABN AMRO North America Holding Capital, 144A |
6.523% | 12/29/49 | BB+ | $ | 1,362,500 | |||||||||||||
| 2,000 | PrivatBank Commercial Bank JSC |
8.750% | 2/09/16 | B1 | 1,157,600 | |||||||||||||||
| 1,750 | Regions Financial Corporation |
5.750% | 6/15/15 | BBB– | 1,671,250 | |||||||||||||||
| 5,750 | Total Commercial Banks |
4,191,350 | ||||||||||||||||||
| Commercial Services & Supplies – 1.9% |
||||||||||||||||||||
| 1,100 | Aramark Holdings Corporation, 144A |
8.625% | 5/01/16 | B– | 1,133,000 | |||||||||||||||
| 915 | Casella Waste Systems Inc. |
7.750% | 2/15/19 | B– | 894,413 | |||||||||||||||
| 2,300 | Donnelley & Son Company, (4) |
7.250% | 5/15/18 | BB+ | 2,231,000 | |||||||||||||||
| 1,000 | Donnelley & Son Company |
7.625% | 6/15/20 | BBB | 935,000 | |||||||||||||||
| 1,000 | Emergency Medical Services Corporation, (4) |
8.125% | 6/01/19 | B– | 997,500 | |||||||||||||||
| 1,715 | EnergySolutions Inc. |
10.750% | 8/15/18 | BB– | 1,605,669 | |||||||||||||||
| 750 | Geo Group Inc. |
6.625% | 2/15/21 | B+ | 753,750 | |||||||||||||||
| 1,300 | Liberty Tire Recycling, 144A |
11.000% | 10/01/16 | B | 1,296,750 | |||||||||||||||
| 1,000 | Suare Two Financial Corporation |
11.625% | 4/01/17 | B | 965,000 | |||||||||||||||
| 11,080 | Total Commercial Services & Supplies |
10,812,082 | ||||||||||||||||||
| Communications Equipment – 0.6% |
||||||||||||||||||||
| 3,250 | Goodman Networks Inc., 144A |
12.125% | 7/01/18 | B+ | 3,103,750 | |||||||||||||||
| Computers & Peripherals – 0.6% |
||||||||||||||||||||
| 2,563 | Hutchinson Technology Inc., (4) |
8.500% | 1/15/26 | N/R | 1,816,526 | |||||||||||||||
| 1,600 | Seagate HDD Cayman |
6.875% | 5/01/20 | BB+ | 1,644,000 | |||||||||||||||
| 4,163 | Total Computers & Peripherals |
3,460,526 | ||||||||||||||||||
| Construction & Engineering – 0.5% |
||||||||||||||||||||
| 1,500 | Shea Homes LP, 144A |
8.625% | 5/15/19 | B | 1,402,500 | |||||||||||||||
| 1,500 | Wyle Services Corporation, 144A |
10.500% | 4/01/18 | B– | 1,500,000 | |||||||||||||||
| 3,000 | Total Construction & Engineering |
2,902,500 | ||||||||||||||||||
| Construction Materials – 0.8% |
||||||||||||||||||||
| 2,000 | Cemex SAB de CV, 144A |
9.000% | 1/11/18 | B+ | 1,595,000 | |||||||||||||||
| 3,000 | West China Cement Limtied, 144A, (4) |
7.500% | 1/25/16 | BB | 2,445,000 | |||||||||||||||
| 2,000 | William Lyon Homes Inc. |
7.500% | 2/15/14 | C | 570,000 | |||||||||||||||
| 7,000 | Total Construction Materials |
4,610,000 | ||||||||||||||||||
| Consumer Finance – 1.0% |
||||||||||||||||||||
| 5,000 | AFGC Capital Trust I, 144A |
6.000% | 1/15/67 | Caa2 | 2,075,000 | |||||||||||||||
| 3,700 | Ally Financial Inc. |
6.250% | 12/01/17 | BB | 3,569,020 | |||||||||||||||
| 8,700 | Total Consumer Finance |
5,644,020 | ||||||||||||||||||
| Containers & Packaging – 2.0% |
||||||||||||||||||||
| 3,250 | Berry Plastics Corporation, 144A, (4) |
9.750% | 1/15/21 | Caa1 | 3,241,875 | |||||||||||||||
| 1,000 | Graham Packaging Company LP, GPC Capital Corporation I |
8.250% | 10/01/18 | B | 1,008,750 | |||||||||||||||
| 2,755 | Intertape Polymer US Inc. |
8.500% | 8/01/14 | Caa1 | 2,631,025 | |||||||||||||||
| 2,500 | Longview Fibre Paper & Packaging, 144A |
8.000% | 6/01/16 | B+ | 2,500,000 | |||||||||||||||
| 2,000 | Solo Cup Company, (4) |
8.500% | 2/15/14 | CCC | 1,840,000 | |||||||||||||||
| 11,505 | Total Containers & Packaging |
11,221,650 | ||||||||||||||||||
| Diversified Financial Services – 0.9% |
||||||||||||||||||||
| 800 | Eksportfinans ASA |
1.875% | 4/02/13 | BBB+ | 754,270 | |||||||||||||||
| 2,500 | Metalloinvest Finance Limited, 144A |
6.500% | 7/21/16 | BB– | 2,237,500 | |||||||||||||||
| 2,300 | UPCB Finance III Limited, 144A |
6.625% | 7/01/20 | Ba3 | 2,265,500 | |||||||||||||||
| 5,600 | Total Diversified Financial Services |
5,257,270 | ||||||||||||||||||
| Nuveen Investments | 57 |
Portfolio of Investments (Unaudited)
Nuveen High Income Bond Fund (continued)
December 31, 2011
| Principal Amount (000) |
Description (1) | Coupon | Maturity | Ratings (2) | Value | |||||||||||||||
| Diversified Telecommunication Services – 3.0% |
||||||||||||||||||||
| $ | 1,500 | Alaska Communications Systems Group Inc. |
6.250% | 5/01/18 | N/R | $ | 954,375 | |||||||||||||
| 1,043 | FairPoint Communications Inc., (4) |
13.125% | 4/02/18 | N/R | 10,430 | |||||||||||||||
| 2,550 | Frontier Communications Corporation, (4) |
8.500% | 4/15/20 | BB+ | 2,610,563 | |||||||||||||||
| 2,825 | Integra Telecom, 144A |
10.750% | 4/15/16 | B– | 2,309,438 | |||||||||||||||
| 2,500 | IntelSat Bermuda Limited |
11.250% | 2/04/17 | CCC+ | 2,418,750 | |||||||||||||||
| 1,970 | IntelSat Jackson Holdings, 144A, (4) |
7.250% | 4/01/19 | B | 1,999,550 | |||||||||||||||
| 2,500 | Level 3 Communications Inc., (4) |
11.875% | 2/01/19 | B– | 2,662,500 | |||||||||||||||
| 1,750 | Sprint Nextel Corporation |
6.000% | 12/01/16 | B+ | 1,452,500 | |||||||||||||||
| 2,250 | Windstream Corporation, (4) |
7.875% | 11/01/17 | BB+ | 2,435,625 | |||||||||||||||
| 18,888 | Total Diversified Telecommunication Services |
16,853,731 | ||||||||||||||||||
| Electric Utilities – 2.0% |
||||||||||||||||||||
| 2,350 | Edison Mission Energy, (4) |
7.500% | 6/15/13 | B– | 2,279,500 | |||||||||||||||
| 2,000 | Empresa Distribuidora y Comercializadora Norte S.A, 144A, (4) |
9.750% | 10/25/22 | B2 | 1,640,000 | |||||||||||||||
| 3,000 | Energy Future Holdings, (4) |
10.875% | 11/01/17 | B | 2,415,000 | |||||||||||||||
| 2,991 | Midwest Generation LLC |
8.560% | 1/02/16 | Ba3 | 3,021,015 | |||||||||||||||
| 2,000 | Texas Competitive Electric Holdings, 144A, (4) |
11.500% | 10/01/20 | B | 1,697,500 | |||||||||||||||
| 12,341 | Total Electric Utilities |
11,053,015 | ||||||||||||||||||
| Energy Equipment & Services – 3.0% |
||||||||||||||||||||
| 2,500 | Alta Mesa Holdngs Finance |
9.625% | 10/15/18 | B | 2,425,000 | |||||||||||||||
| 1,500 | Evergreen Solar Inc. |
13.000% | 4/15/15 | N/R | 780,000 | |||||||||||||||
| 2,000 | Forbes Energy Services |
9.000% | 6/15/19 | B– | 1,870,000 | |||||||||||||||
| 2,000 | Green Field Energy Services, 144A |
13.000% | 11/15/16 | CCC+ | 1,940,000 | |||||||||||||||
| 3,100 | Jasper Explorer Limited Cyprus |
13.500% | 5/27/16 | N/R | 2,573,899 | |||||||||||||||
| 2,800 | NGPL PipeCo LLC |
7.119% | 12/15/17 | BB+ | 2,764,104 | |||||||||||||||
| 2,800 | SESI LLC, Convertible Bond, 144A, (4) |
7.125% | 12/15/21 | BB+ | 2,940,000 | |||||||||||||||
| 1,700 | Troll Drilling & Services Ltd. |
13.750% | 8/19/16 | N/R | 1,598,578 | |||||||||||||||
| 18,400 | Total Energy Equipment & Services |
16,891,581 | ||||||||||||||||||
| Food & Staples Retailing – 0.4% |
||||||||||||||||||||
| 2,000 | Rite Aid Corporation, (4) |
7.500% | 3/01/17 | BB– | 1,997,500 | |||||||||||||||
| Food Products – 3.1% |
||||||||||||||||||||
| 2,050 | Fage Dairy Industry SA, 144A |
9.875% | 2/01/20 | B– | 1,814,250 | |||||||||||||||
| 400 | JBS Finance II Limited, 144A |
8.250% | 1/29/18 | BB | 363,000 | |||||||||||||||
| 2,800 | JBS USA LLC |
7.250% | 6/01/21 | BB | 2,611,000 | |||||||||||||||
| 2,500 | Land O Lakes Capital Trust I |
7.450% | 3/15/28 | Ba1 | 2,393,750 | |||||||||||||||
| 3,400 | Marfrig Overseas Limited |
9.500% | 5/04/20 | B+ | 2,516,000 | |||||||||||||||
| 1,575 | MHP SA, 144A |
10.250% | 4/29/15 | B | 1,386,000 | |||||||||||||||
| 1,500 | Mriya Agro Holding PLC, 144A |
10.950% | 3/30/16 | B | 1,311,063 | |||||||||||||||
| 2,550 | Pinnacle Foods Finance LLC, (4) |
8.250% | 9/01/17 | B3 | 2,652,000 | |||||||||||||||
| 2,275 | Viterra Inc. |
5.950% | 8/01/20 | BBB– | 2,324,948 | |||||||||||||||
| 19,050 | Total Food Products |
17,372,011 | ||||||||||||||||||
| Health Care Equipment & Supplies – 4.1% |
||||||||||||||||||||
| 2,000 | Acadia Healthcare, 144A |
12.875% | 11/01/18 | B– | 1,980,000 | |||||||||||||||
| 2,000 | Accellent Inc. |
10.000% | 11/01/17 | CCC+ | 1,620,000 | |||||||||||||||
| 2,000 | Chiron Merger Sub Inc., 144A |
10.500% | 11/01/18 | B | 1,960,000 | |||||||||||||||
| 58 | Nuveen Investments |
| Principal Amount (000) |
Description (1) | Coupon | Maturity | Ratings (2) | Value | |||||||||||||||
| Health Care Equipment & Supplies (continued) |
||||||||||||||||||||
| $ | 2,915 | Community Health Systems, Inc., 144A, (4) |
8.000% | 11/15/19 | B | $ | 2,944,150 | |||||||||||||
| 2,135 | HCA Holdings Inc., (4) |
7.750% | 5/15/21 | B– | 2,172,363 | |||||||||||||||
| 2,000 | Health Management Associates, 144A, (4) |
7.375% | 1/15/20 | BB– | 2,080,000 | |||||||||||||||
| 1,850 | HealthSouth Corporation, (4) |
7.750% | 9/15/22 | B+ | 1,819,938 | |||||||||||||||
| 1,810 | Kindred Healthcare Inc., Term Loan, (4) |
8.250% | 6/01/19 | B– | 1,520,400 | |||||||||||||||
| 1,500 | Merge Healthcare Inc. |
11.750% | 5/01/15 | B+ | 1,590,000 | |||||||||||||||
| 1,250 | National Mentor Holdings, 144A |
12.500% | 2/15/18 | CCC+ | 1,151,563 | |||||||||||||||
| 1,000 | Radiation Therapy Services Inc. |
9.875% | 4/15/17 | B3 | 747,500 | |||||||||||||||
| 3,020 | Res-Care Inc., 144A |
10.750% | 1/15/19 | B– | 3,118,150 | |||||||||||||||
| — | (7) | Symbion Inc. |
11.000% | 8/23/15 | CCC+ | 487 | ||||||||||||||
| 23,480 | Total Health Care Equipment & Services |
22,704,551 | ||||||||||||||||||
| Hotels, Restaurants & Leisure – 4.2% |
||||||||||||||||||||
| 1,350 | Ameristar Casinos, Inc., (4) |
7.500% | 4/15/21 | B+ | 1,390,500 | |||||||||||||||
| 2,500 | Chukchansi Economic Development Authority, 144A |
8.000% | 11/15/13 | Ca | 1,612,500 | |||||||||||||||
| 1,500 | CKE Holdings, 144A |
10.500% | 3/14/16 | Caa1 | 1,432,500 | |||||||||||||||
| 2,000 | El Pollo Loco Inc., 144A |
17.000% | 1/01/18 | Caa2 | 1,700,000 | |||||||||||||||
| 1,000 | Fontainebleau Las Vegas |
10.250% | 6/15/15 | N/R | 625 | |||||||||||||||
| 30 | Greektown LLC, (3), (4), (5) |
10.750% | 12/01/13 | N/R | — | |||||||||||||||
| 2,500 | Harrah’s Operating Company, Inc., 144A |
12.750% | 4/15/18 | CCC | 1,987,500 | |||||||||||||||
| 1,500 | Icon Health and Fitness Inc., 144A |
11.875% | 10/15/16 | B | 1,218,750 | |||||||||||||||
| 2,680 | Isle of Capri Casinos, Inc., (4) |
7.750% | 3/15/19 | B– | 2,452,200 | |||||||||||||||
| 2,500 | MGM Mirage Inc., (4) |
6.875% | 4/01/16 | B– | 2,312,500 | |||||||||||||||
| 2,500 | MGM Resorts International |
10.000% | 11/01/16 | B– | 2,625,000 | |||||||||||||||
| 1,500 | Mohegan Tribal Gaming Authority |
6.125% | 2/15/13 | Caa2 | 1,005,000 | |||||||||||||||
| 500 | MTR Gaming Group Inc., (4) |
11.500% | 8/01/19 | B– | 426,250 | |||||||||||||||
| 3,250 | Rare Restaurant Group LLC |
9.250% | 5/15/14 | CCC | 2,600,000 | |||||||||||||||
| 2,550 | Reynolds Group |
9.250% | 5/15/18 | B– | 2,441,625 | |||||||||||||||
| 27,860 | Total Hotels, Restaurants & Leisure |
23,204,950 | ||||||||||||||||||
| Household Durables – 1.6% |
||||||||||||||||||||
| 3,250 | Beazer Homes USA, Inc., (4) |
9.125% | 6/15/18 | CCC | 2,234,375 | |||||||||||||||
| 1,750 | Central Garden & Pet Compa |
8.250% | 3/01/18 | B | 1,715,000 | |||||||||||||||
| 1,500 | K. Hovnanian Enterprises Inc., (4) |
10.625% | 10/15/16 | B– | 1,196,250 | |||||||||||||||
| 3,095 | Standard Pacific Corporation |
10.750% | 9/15/16 | B | 3,249,750 | |||||||||||||||
| 1,000 | William Lyon Homes Inc. |
10.750% | 4/01/13 | C | 285,000 | |||||||||||||||
| 10,595 | Total Household Products |
8,680,375 | ||||||||||||||||||
| Independent Power Producers & Energy Traders – 1.6% |
||||||||||||||||||||
| 2,275 | AES Corporation |
8.000% | 10/15/17 | BB | 2,502,500 | |||||||||||||||
| 2,495 | Calpine Corporation, 144A, (4) |
7.875% | 7/31/20 | BB | 2,688,363 | |||||||||||||||
| 1,800 | Mirant Americas Generation LLC |
8.500% | 10/01/21 | BB | 1,678,500 | |||||||||||||||
| 2,000 | NRG Energy Inc., 144A |
7.875% | 5/15/21 | BB | 1,950,000 | |||||||||||||||
| 8,570 | Total Independent Power Producers & Energy Traders |
8,819,363 | ||||||||||||||||||
| Industrial Conglomerates – 1.1% |
||||||||||||||||||||
| 3,730 | Abengoa Finance SAU, 144A |
8.875% | 11/01/17 | BB | 3,730,000 | |||||||||||||||
| 445 | Offshore Group Investment Limited |
11.500% | 8/01/15 | B– | 481,156 | |||||||||||||||
| Nuveen Investments | 59 |
Portfolio of Investments (Unaudited)
Nuveen High Income Bond Fund (continued)
December 31, 2011
| Principal Amount (000) |
Description (1) | Coupon | Maturity | Ratings (2) | Value | |||||||||||||||
| Industrial Conglomerates (continued) |
||||||||||||||||||||
| $ | 2,000 | Panoro Energy ASA |
12.000% | 11/15/18 | N/R | $ | 2,000,000 | |||||||||||||
| 6,175 | Total Industrial Conglomerates |
6,211,156 | ||||||||||||||||||
| Insurance – 1.6% |
||||||||||||||||||||
| 2,300 | American International Group, Inc. |
6.250% | 3/15/37 | BBB | 1,664,625 | |||||||||||||||
| 4,500 | Glen Meadows Pass Through Trust |
6.505% | 2/12/67 | BB+ | 3,172,500 | |||||||||||||||
| 2,500 | Lincoln National Corporation, (4) |
7.000% | 5/17/66 | BBB | 2,256,250 | |||||||||||||||
| 2,500 | XL Capital Ltd, (4) |
6.500% | 12/29/49 | BBB– | 1,956,250 | |||||||||||||||
| 11,800 | Total Insurance |
9,049,625 | ||||||||||||||||||
| Internet Software & Services – 0.2% |
||||||||||||||||||||
| 1,500 | Earthlink Inc., (4) |
8.875% | 5/15/19 | B2 | 1,380,000 | |||||||||||||||
| IT Services – 1.5% |
||||||||||||||||||||
| 5,475 | First Data Corporation, 144A, (4) |
8.750% | 1/15/22 | B– | 4,708,500 | |||||||||||||||
| 1,981 | First Data Corporation, 144A |
12.625% | 1/15/22 | B– | 1,723,470 | |||||||||||||||
| 2,000 | IPayment Inc |
10.250% | 5/15/18 | B3 | 1,880,000 | |||||||||||||||
| 9,456 | Total IT Services |
8,311,970 | ||||||||||||||||||
| Machinery – 1.3% |
||||||||||||||||||||
| 1,000 | Cleaver-Brooks Inc. |
12.250% | 5/01/16 | B | 1,000,000 | |||||||||||||||
| 2,500 | CNH America LLC, (4) |
7.250% | 1/15/16 | BB+ | 2,681,250 | |||||||||||||||
| 2,500 | Commercial Vehicle Group, 144A |
7.875% | 4/15/19 | B2 | 2,406,250 | |||||||||||||||
| 1,000 | Trimas Corporation, (4) |
9.750% | 12/15/17 | B2 | 1,085,000 | |||||||||||||||
| 7,000 | Total Machinery |
7,172,500 | ||||||||||||||||||
| Marine – 0.5% |
||||||||||||||||||||
| 1,000 | Marquette Transportation Company Inc., Finance |
10.875% | 1/15/17 | B– | 1,007,500 | |||||||||||||||
| 2,725 | Navios Maritime Acquisition Corporation, (4) |
8.625% | 11/01/17 | B | 1,975,625 | |||||||||||||||
| 3,725 | Total Marine |
2,983,125 | ||||||||||||||||||
| Media – 5.4% |
||||||||||||||||||||
| 2,135 | AMC Networks Inc., 144A, (4) |
7.750% | 7/15/21 | B+ | 2,321,813 | |||||||||||||||
| 2,000 | American Media Inc., 144A, (4) |
13.500% | 6/15/18 | CCC+ | 1,620,000 | |||||||||||||||
| 2,500 | Belo Corporation, (4) |
7.750% | 6/01/27 | BB | 2,168,750 | |||||||||||||||
| 4,000 | Charter Communications, CCO Holdings LLC |
7.000% | 1/15/19 | BB– | 4,170,000 | |||||||||||||||
| 3,300 | Clear Channel Communications, Inc. |
9.000% | 3/01/21 | CCC+ | 2,780,250 | |||||||||||||||
| 2,500 | CSC Holdings Inc. |
7.875% | 2/15/18 | BB | 2,768,750 | |||||||||||||||
| 2,200 | Cumulus Media Inc., 144A, (4) |
7.750% | 5/01/19 | B3 | 1,952,500 | |||||||||||||||
| 1,750 | Dish DBS Corporation, (4) |
6.750% | 6/01/21 | Ba2 | 1,885,625 | |||||||||||||||
| 500 | Media General Inc., (4) |
11.750% | 2/15/17 | B3 | 477,500 | |||||||||||||||
| 2,000 | National CineMedia LLC |
7.875% | 7/15/21 | B | 1,982,500 | |||||||||||||||
| 2,000 | Virgina Media Finance PLC, (4) |
9.500% | 8/15/16 | BB+ | 2,245,000 | |||||||||||||||
| 2,375 | WM Finance Corporation, 144A |
11.500% | 10/01/18 | B– | 2,357,188 | |||||||||||||||
| 3,345 | XM Satellite Radio Inc., 144A |
7.625% | 11/01/18 | BB | 3,512,250 | |||||||||||||||
| 30,605 | Total Media |
30,242,126 | ||||||||||||||||||
| Metals & Mining – 7.1% |
||||||||||||||||||||
| 2,250 | AK Steel Corporation, (4) |
7.625% | 5/15/20 | BB– | 2,115,000 | |||||||||||||||
| 1,000 | Aleris International Inc. |
10.000% | 12/15/16 | N/R | 100 | |||||||||||||||
| 2,300 | Alrosa Finance SA, 144A |
7.750% | 11/03/20 | BB– | 2,288,500 | |||||||||||||||
| 60 | Nuveen Investments |
| Principal Amount (000) |
Description (1) | Coupon | Maturity | Ratings (2) | Value | |||||||||||||||
| Metals & Mining (continued) |
||||||||||||||||||||
| $ | 1,750 | AM Castle & Company, 144A |
12.750% | 12/15/16 | B3 | $ | 1,758,750 | |||||||||||||
| 2,250 | APERAM, 144A |
7.750% | 4/01/18 | BB | 1,867,500 | |||||||||||||||
| 1,500 | ArcelorMittal |
6.750% | 3/01/41 | BBB | 1,348,845 | |||||||||||||||
| 1,000 | Atkore International Inc. |
9.875% | 1/01/18 | B | 957,500 | |||||||||||||||
| 2,750 | Fosun International Limited, 144A, (4) |
7.500% | 5/12/16 | BB+ | 2,392,500 | |||||||||||||||
| 2,000 | Goden Close Marit Corporation |
11.000% | 12/09/15 | N/R | 2,090,000 | |||||||||||||||
| 1,750 | Harmony Foods Corporation, 144A |
10.000% | 5/01/16 | B– | 1,758,750 | |||||||||||||||
| 1,900 | Hidili Industry Internationl Development Limited, 144A, (4) |
8.625% | 11/04/15 | B+ | 1,415,500 | |||||||||||||||
| 3,490 | JMC Steel Group, 144A |
8.250% | 3/15/18 | B | 3,402,750 | |||||||||||||||
| 2,000 | Mirabela Nickel Limited, 144A, (4) |
8.750% | 4/15/18 | B2 | 1,795,000 | |||||||||||||||
| 2,600 | Patriot Coal Corporation, (4) |
8.250% | 4/30/18 | B+ | 2,496,000 | |||||||||||||||
| 4,835 | Taseko Mines Limited |
7.750% | 4/15/19 | B | 4,363,588 | |||||||||||||||
| 2,000 | Tempel Steel Company, 144A |
12.000% | 8/15/16 | B | 1,900,000 | |||||||||||||||
| 3,265 | Thompson Creek Metals Company |
7.375% | 6/01/18 | B | 2,905,850 | |||||||||||||||
| 1,550 | Vedanta Resources PLC, 144A, (4) |
9.500% | 7/18/18 | BB | 1,333,000 | |||||||||||||||
| 2,000 | Winsway Coking Coal Holding Limited, 144A, (4) |
8.500% | 4/08/16 | BB | 1,590,000 | |||||||||||||||
| 2,000 | WPE International Cooperatief U.A, 144A |
10.375% | 9/30/20 | B+ | 1,780,000 | |||||||||||||||
| 44,190 | Total Metals & Mining |
39,559,133 | ||||||||||||||||||
| Multiline Retail – 0.7% |
||||||||||||||||||||
| 1,650 | Burlington Coat Factory |
10.000% | 2/15/19 | Caa1 | 1,612,875 | |||||||||||||||
| 2,000 | Macys Retail Holdings Inc. |
7.875% | 8/15/36 | BBB– | 2,097,860 | |||||||||||||||
| 3,650 | Total Multiline Retail |
3,710,735 | ||||||||||||||||||
| Oil, Gas & Consumable Fuels – 13.3% |
||||||||||||||||||||
| 2,400 | Black Elk Energy Offshore Operations LLC |
13.750% | 12/01/15 | B | 2,439,000 | |||||||||||||||
| 1,000 | Bluewater Holding BV |
3.525% | 7/17/14 | N/R | 790,000 | |||||||||||||||
| 1,000 | Bumi Capital Pte Limited, 144A |
12.000% | 11/10/16 | BB | 1,010,000 | |||||||||||||||
| 1,825 | Calumet Specialty Products, 144A |
9.375% | 5/01/19 | B | 1,770,250 | |||||||||||||||
| 2,475 | Carrizo Oil and Gas Inc., (4) |
8.625% | 10/15/18 | B– | 2,499,750 | |||||||||||||||
| 1,900 | Chaparral Energy Inc. |
9.875% | 10/01/20 | B– | 2,052,000 | |||||||||||||||
| 1,000 | Connacher Oil and Gas Limited, 144A |
8.500% | 8/01/19 | BB– | 905,000 | |||||||||||||||
| 2,000 | El Paso Corporation, (4) |
7.750% | 1/15/32 | BB+ | 2,310,000 | |||||||||||||||
| 3,150 | Energy XXI Gulf Coast Inc., 144A |
9.250% | 12/15/17 | B | 3,417,750 | |||||||||||||||
| 2,500 | Exco Resources Inc. |
7.500% | 9/15/18 | B | 2,362,500 | |||||||||||||||
| 1,500 | Floatel Superior Ltd |
13.000% | 9/02/15 | N/R | 1,665,000 | |||||||||||||||
| 1,100 | Global Rig Company ASA |
13.000% | 6/15/15 | N/R | 1,078,000 | |||||||||||||||
| 3,720 | Inergy LP Finance |
7.000% | 10/01/18 | Ba3 | 3,775,800 | |||||||||||||||
| 2,325 | Kodiak Oil and Gas Corporation, 144A, (4) |
8.125% | 12/01/19 | B– | 2,409,281 | |||||||||||||||
| 2,125 | Linn Energy LLC Finance Corporation, (4) |
8.625% | 4/15/20 | B | 2,305,625 | |||||||||||||||
| 2,520 | Martin Mid-Stream Partners LP Finance |
8.875% | 4/01/18 | B | 2,595,600 | |||||||||||||||
| 2,500 | Ocean Rig UDW Inc. |
9.500% | 4/27/16 | CCC+ | 2,281,250 | |||||||||||||||
| 2,500 | OGX Petroleo e Gas Participacoes SA, 144A |
8.500% | 6/01/18 | B+ | 2,450,000 | |||||||||||||||
| 3,475 | PetroPlus Finance, (4) |
9.375% | 9/15/19 | CCC | 1,754,875 | |||||||||||||||
| 2,300 | Polarcus Alima AS |
12.150% | 10/29/16 | B– | 2,185,000 | |||||||||||||||
| 1,000 | Range Resources Corporation |
8.000% | 5/15/19 | BB | 1,115,000 | |||||||||||||||
| Nuveen Investments | 61 |
Portfolio of Investments (Unaudited)
Nuveen High Income Bond Fund (continued)
December 31, 2011
| Principal Amount (000) |
Description (1) | Coupon | Maturity | Ratings (2) | Value | |||||||||||||||
| Oil, Gas & Consumable Fuels (continued) |
||||||||||||||||||||
| $ | 1,925 | Rubicon Drilling Services, Utlra-Deepwater Limited, 144A |
11.875% | 3/15/17 | B– | $ | 2,030,875 | |||||||||||||
| 2,192 | Sabine Pass LNG LP, (4) |
7.500% | 11/30/16 | B+ | 2,202,960 | |||||||||||||||
| 1,000 | Sandridge Energy Inc. |
7.500% | 3/15/21 | B3 | 992,500 | |||||||||||||||
| 1,750 | Saratoga Resources Inc. |
12.500% | 7/01/16 | N/R | 1,776,250 | |||||||||||||||
| 2,700 | Seadrill Limited |
6.500% | 10/05/15 | N/R | 2,565,000 | |||||||||||||||
| 3,150 | SM Energy Company, 144A |
6.625% | 2/15/19 | BB | 3,276,000 | |||||||||||||||
| 2,100 | Southern Union Company |
3.447% | 11/01/66 | Ba1 | 1,958,250 | |||||||||||||||
| 2,850 | Springleaf Finance Corporation |
6.900% | 12/15/17 | B | 2,052,000 | |||||||||||||||
| 2,250 | Stone Energy Corporation |
8.625% | 2/01/17 | B | 2,295,000 | |||||||||||||||
| 2,820 | Tesoro Petroleum Corporation, (4) |
6.500% | 6/01/17 | BB+ | 2,890,500 | |||||||||||||||
| 1,995 | United Refining Inc., 144A, (4) |
10.500% | 2/28/18 | B | 1,865,325 | |||||||||||||||
| 1,000 | Valero Energy Corporation |
6.625% | 6/15/37 | BBB | 1,072,237 | |||||||||||||||
| 1,500 | W&T Offshore, Inc., 144A |
8.500% | 6/15/19 | B | 1,552,500 | |||||||||||||||
| 4,075 | Western Refining Inc., (4) |
11.250% | 6/15/17 | B+ | 4,635,313 | |||||||||||||||
| 75,622 | Total Oil, Gas & Consumable Fuels |
74,336,391 | ||||||||||||||||||
| Paper & Forest Products – 2.1% |
||||||||||||||||||||
| 1,669 | AbitibiBowater Inc., 144A |
10.250% | 10/15/18 | BB– | 1,840,073 | |||||||||||||||
| 2,100 | McClatchy Company |
11.500% | 2/15/17 | B | 2,031,750 | |||||||||||||||
| 2,000 | Millar Western Forest Products Ltd, 144A, (4) |
8.500% | 4/01/21 | B– | 1,520,000 | |||||||||||||||
| 2,325 | Stora Enso Oyj |
7.250% | 4/15/36 | BB | 1,894,875 | |||||||||||||||
| 2,575 | Tembec Industries, Inc., (4) |
11.250% | 12/15/18 | B– | 2,652,250 | |||||||||||||||
| 1,575 | Verso Paper Holdings LLC, (4) |
11.500% | 7/01/14 | Ba2 | 1,606,500 | |||||||||||||||
| 12,244 | Total Paper & Forest Products |
11,545,448 | ||||||||||||||||||
| Pharmaceuticals – 0.4% |
||||||||||||||||||||
| 2,315 | Valeant Pharmaceuticals International, 144A |
6.875% | 12/01/18 | BB | 2,309,213 | |||||||||||||||
| Real Estate Investment Trust – 1.0% |
||||||||||||||||||||
| 2,000 | CNL Lifestyle Properties Inc. |
7.250% | 4/15/19 | BB– | 1,850,000 | |||||||||||||||
| 3,350 | Weyerhaeuser Company |
7.375% | 10/01/19 | BBB– | 3,774,338 | |||||||||||||||
| 5,350 | Total Real Estate Investment Trust |
5,624,338 | ||||||||||||||||||
| Real Estate Management & Development – 2.5% |
||||||||||||||||||||
| 1,650 | Agile Property Holdings Limited, 144A |
10.000% | 11/14/16 | BB | 1,460,250 | |||||||||||||||
| 1,875 | Central China Real Estate Limited, 144A, (4) |
12.250% | 10/20/15 | B+ | 1,617,188 | |||||||||||||||
| 2,000 | China Overseas Finance Cayman II |
5.500% | 11/10/20 | BBB | 1,868,242 | |||||||||||||||
| 2,950 | Country Garden Holding Company, 144A, (4) |
11.125% | 2/23/18 | BB– | 2,551,750 | |||||||||||||||
| 2,000 | Realogy Corporation, 144A |
7.875% | 2/15/19 | Caa1 | 1,740,000 | |||||||||||||||
| 3,375 | Realogy Corporation, 144A, (4) |
11.500% | 4/15/17 | Caa3 | 2,632,500 | |||||||||||||||
| 1,500 | Shanghai Industrial Urban Development Group Limited, 144A |
9.750% | 7/23/14 | B2 | 1,395,393 | |||||||||||||||
| 1,000 | Shimao Property Holdings Limited |
11.000% | 3/08/18 | BB+ | 779,166 | |||||||||||||||
| 16,350 | Total Real Estate Management & Development |
14,044,489 | ||||||||||||||||||
| Road & Rail – 0.4% |
||||||||||||||||||||
| 2,400 | Hertz Corporation |
7.375% | 1/15/21 | BB– | 2,439,000 | |||||||||||||||
| Semiconductors & Equipment – 0.8% |
||||||||||||||||||||
| 2,000 | Freescale Semiconductor Inc., 144A, (4) |
10.125% | 3/15/18 | Ba3 | 2,180,000 | |||||||||||||||
| 2,000 | NXP BV, 144A, (4) |
9.750% | 8/01/18 | B+ | 2,180,000 | |||||||||||||||
| 4,000 | Total Semiconductors & Equipment |
4,360,000 | ||||||||||||||||||
| 62 | Nuveen Investments |
| Principal Amount (000) |
Description (1) | Coupon | Maturity | Ratings (2) | Value | |||||||||||||||
| Textiles, Apparel & Luxury Goods – 0.3% |
||||||||||||||||||||
| $ | 1,350 | Liz Claiborne Inc., 144A, (4) |
10.500% | 4/15/19 | B2 | $ | 1,444,500 | |||||||||||||
| Trading Companies & Distributors – 1.0% |
||||||||||||||||||||
| 1,500 | Neff Rental LLC/Neff Finance Corporation, 144A |
9.625% | 5/15/16 | B– | 1,320,000 | |||||||||||||||
| 850 | United Rentals North America Inc. |
9.250% | 12/15/19 | B+ | 890,375 | |||||||||||||||
| 3,300 | United Rentals North America Inc., (4) |
8.375% | 9/15/20 | B | 3,217,500 | |||||||||||||||
| 5,650 | Total Trading Companies & Distributors |
5,427,875 | ||||||||||||||||||
| Wireless Telecommunication Services – 3.1% |
||||||||||||||||||||
| 1,500 | Bakrie Telecom TPE Limited |
11.500% | 5/07/15 | B | 930,000 | |||||||||||||||
| 3,250 | Clearwire Corporation, (4) |
12.000% | 12/01/15 | B3 | 3,111,875 | |||||||||||||||
| 3,300 | Digicel Group, Limited, 144A |
8.875% | 1/15/15 | B– | 3,250,500 | |||||||||||||||
| 3,500 | Nextel Communications, Inc., (4) |
7.375% | 8/01/15 | B+ | 3,202,500 | |||||||||||||||
| 475 | NII Capital Corporation |
7.625% | 4/01/21 | B+ | 471,438 | |||||||||||||||
| 1,500 | Sprint Nextel Corporation, 144A, (4) |
9.000% | 11/15/18 | BB | 1,575,000 | |||||||||||||||
| 1,500 | Trilogy International Partners LLC, (4) |
10.250% | 8/15/16 | CCC+ | 1,372,495 | |||||||||||||||
| 3,500 | Wind Acquisition Finance SA, 144A |
7.250% | 2/15/18 | BB+ | 3,184,995 | |||||||||||||||
| 18,525 | Total Wireless Telecommunication Services |
17,098,803 | ||||||||||||||||||
| $ | 540,366 | Total Corporate Bonds (cost $522,199,349) |
497,982,469 | |||||||||||||||||
| Shares | Description (1) | Coupon | Maturity | Ratings (2) | Value | |||||||||||||||
| CONVERTIBLE PREFERRED SECURITIES – 0.5% |
||||||||||||||||||||
| Auto – 0.1% |
||||||||||||||||||||
| 21,000 | General Motors Corporation |
4.750% | 12/01/13 | B+ | $ | 719,250 | ||||||||||||||
| Oil, Gas & Consumable Fuels – 0.4% |
||||||||||||||||||||
| 23,975 | Chesapeake Energy Corporation, Convertible |
5.000% | 12/31/49 | B+ | 1,999,515 | |||||||||||||||
| Total Convertible Preferred Securities (cost $2,938,210) |
2,718,765 | |||||||||||||||||||
| Shares | Description (1) | Coupon | Ratings (2) | Value | ||||||||||||||||
| $25 PAR (OR SIMILAR) PREFERRED SECURITIES – 4.7% |
||||||||||||||||||||
| Building Residential and Commercial – 0.1% |
||||||||||||||||||||
| 25,000 | M-I Homes, (5) |
9.750% | CCC | $ | 287,500 | |||||||||||||||
| Diversified – 0.7% |
||||||||||||||||||||
| 50,000 | Digital Realty Trust Inc. |
7.000% | Baa3 | 1,279,500 | ||||||||||||||||
| 65,000 | Dupont Fabros Technology |
7.875% | Ba2 | 1,632,150 | ||||||||||||||||
| 29,338 | Seaspan Corporation |
9.500% | N/R | 800,927 | ||||||||||||||||
| Total Diversified |
3,712,577 | |||||||||||||||||||
| Diversified Banking – 1.4% |
||||||||||||||||||||
| 3,500 | Ally Financial Inc., 144A |
7.000% | B3 | 2,508,953 | ||||||||||||||||
| 71,944 | Bank of America Corporation |
8.625% | BBB– | 1,579,890 | ||||||||||||||||
| 106,713 | Bank of America Corporation |
4.000% | BBB– | 1,568,681 | ||||||||||||||||
| 135,000 | Morgan Stanley, Series 2006A |
4.000% | BBB+ | 1,985,850 | ||||||||||||||||
| Total Diversified Banking |
7,643,374 | |||||||||||||||||||
| Diversified Financial Services – 0.5% |
||||||||||||||||||||
| 98,231 | Citigroup Capital Trust IX, (5) |
6.000% | BBB | 2,103,126 | ||||||||||||||||
| 25,000 | Citigroup Capital Trust XI |
6.000% | Baa3 | 534,250 | ||||||||||||||||
| Total Diversified Financial Services |
2,637,376 | |||||||||||||||||||
| Nuveen Investments | 63 |
Portfolio of Investments (Unaudited)
Nuveen High Income Bond Fund (continued)
December 31, 2011
| Shares | Description (1) | Coupon | Ratings (2) | Value | ||||||||||||||||
| Financials – 0.4% |
||||||||||||||||||||
| 45,000 | Aspen Insurance Holdings Limited |
7.401% | BBB– | $ | 1,111,500 | |||||||||||||||
| 55,000 | Endurance Specialty Holdings Limited (5) |
7.500% | BBB– | 1,401,950 | ||||||||||||||||
| Total Financials |
2,513,450 | |||||||||||||||||||
| Health Care – 0.2% |
||||||||||||||||||||
| 50,000 | Cogdell Spencer Inc. |
8.500% | N/R | 1,265,000 | ||||||||||||||||
| Hotels – 0.9% |
||||||||||||||||||||
| 51,900 | Ashford Hospitality Trust Inc., (5) |
8.450% | N/R | 1,210,308 | ||||||||||||||||
| 30,000 | Hersha Hospitality Trust, (5) |
8.000% | N/R | 663,000 | ||||||||||||||||
| 50,000 | LaSalle Hotel Properties |
7.500% | N/R | 1,223,500 | ||||||||||||||||
| 50,000 | Pebblebrook Hotel Trust |
7.875% | N/R | 1,200,500 | ||||||||||||||||
| 40,000 | Summit Hotel Properties Inc. |
9.250% | N/R | 990,000 | ||||||||||||||||
| Total Hotels |
5,287,308 | |||||||||||||||||||
| Manufactured Homes – 0.1% |
||||||||||||||||||||
| 30,000 | Equity Lifestyle Properties Inc. |
8.034% | N/R | 759,300 | ||||||||||||||||
| Mortgage – 0.0% |
||||||||||||||||||||
| 10,000 | American Home Mortgage Investment Corporation, (5) |
9.250% | N/R | 10 | ||||||||||||||||
| Multi-line Insurance – 0.1% |
||||||||||||||||||||
| 34,700 | American International Group |
7.700% | BBB | 811,633 | ||||||||||||||||
| Office Property – 0.2% |
||||||||||||||||||||
| 40,000 | CommomWealth REIT, (4), (5) |
7.250% | Baa3 | 979,600 | ||||||||||||||||
| Warehouse & Industrial – 0.1% |
||||||||||||||||||||
| 20,000 | First Potomac Realty Trust |
7.750% | N/R | 507,400 | ||||||||||||||||
| Sovereign Agency – 0.0% |
||||||||||||||||||||
| 35,522 | Federal Home Loan Mortgage Corporation, (5) |
6.550% | C | 37,298 | ||||||||||||||||
| Total $25 Par (or similar) Preferred Securities (cost $28,423,785) |
26,441,826 | |||||||||||||||||||
| Principal Amount (000) |
Description (1) | Coupon | Maturity | Ratings (2) | Value | |||||||||||||||
| U.S. GOVERNMENT AND AGENCY OBLIGATIONS – 0.2% |
||||||||||||||||||||
| $ | 155 | U.S. Treasury Notes |
3.375% | 6/30/13 | Aaa | $ | 162,278 | |||||||||||||
| 1,000 | U.S. Treasury Notes, (4) |
1.500% | 12/31/13 | Aaa | 1,024,844 | |||||||||||||||
| $ | 1,155 | Total U.S. Government and Agency Obligations (cost $1,159,461) |
1,187,122 | |||||||||||||||||
| Principal Amount (000) |
Description (1) | Coupon | Maturity | Ratings (2) | Value | |||||||||||||||
| ASSET-BACKED AND MORTGAGE-BACKED SECURITIES – 0.0% |
||||||||||||||||||||
| $ | 4 | Green Tree Financial Corporation, Manufactured Housing Contract Pass Through Certificates, Series 1998-1 |
6.040% | 11/01/29 | A | $ | 3,952 | |||||||||||||
| $ | 4 | Total Asset-Backed and Mortgage-Backed Securities (cost $3,893) |
3,952 | |||||||||||||||||
| Shares | Description (1) | Value | ||||||||||||||||||
| INVESTMENT COMPANIES – 1.0% |
||||||||||||||||||||
| 26,000 | Alliance National Municipal Inc. |
$ | 384,280 | |||||||||||||||||
| 153,000 | Blackrock Credit Allocation Income Trust IV |
1,858,950 | ||||||||||||||||||
| 23,500 | Gabelli Global Gold Natural Resources and Income Trust, (4) |
331,585 | ||||||||||||||||||
| 99,500 | Pimco Income Strategy Fund, (4) |
1,034,800 | ||||||||||||||||||
| 64 | Nuveen Investments |
| Shares | Description (1) | Value | ||||||||||||||||||
| INVESTMENT COMPANIES (continued) |
||||||||||||||||||||
| 119,000 | Pioneer Floating Rate Trust |
$ | 1,483,930 | |||||||||||||||||
| 24,000 | First Strategic High Income Fund |
366,720 | ||||||||||||||||||
| Total Investment Companies (cost $5,436,180) |
5,460,265 | |||||||||||||||||||
| Principal Amount (000) |
Description (1) | Coupon | Maturity | Ratings (2) | Value | |||||||||||||||
| SOVEREIGN DEBT – 0.8% |
||||||||||||||||||||
| Argentina – 0.7% |
||||||||||||||||||||
| $ | 1,250 | Provincia de Buenos Aires |
0.000% | 1/26/21 | B | $ | 940,625 | |||||||||||||
| 2,000 | Provincia de Cordoba |
12.375% | 8/17/17 | B | 1,680,000 | |||||||||||||||
| 1,250 | Republic of Argentina |
8.750% | 6/02/17 | B | 1,175,000 | |||||||||||||||
| 4,500 | Total Argentina |
3,795,625 | ||||||||||||||||||
| Ukraine – 0.1% |
||||||||||||||||||||
| 1,000 | Ukraine State Enterprise for Financing of Infrastructure Projects |
7.400% | 4/20/18 | B2 | 777,500 | |||||||||||||||
| $ | 5,500 | Total Sovereign Debt (cost $5,550,934) |
4,573,125 | |||||||||||||||||
| Shares | Description (1) | Value | ||||||||||||||||||
| WARRANTS – 0.0% |
||||||||||||||||||||
| 6,488 | FairPoint Communications Inc., (5) |
649 | ||||||||||||||||||
| 2,000 | Green Field Energy Services |
90,000 | ||||||||||||||||||
| Total Warrants (cost $78,416) |
90,649 | |||||||||||||||||||
| Shares | Description (1) | Value | ||||||||||||||||||
| TOTAL INVESTMENTS PURCHASED WITH COLLATERAL FROM SECURITIES LENDING – 25.4% |
| |||||||||||||||||||
| Money Market Funds – 25.4% |
||||||||||||||||||||
| 141,911,228 | Mount Vernon Securities Lending Prime Portfolio, 0.233% (8),(9) |
$ | 141,911,228 | |||||||||||||||||
| Total Investments Purchased with Collateral from Securities Lending (cost $141,911,228) |
|
141,911,228 | ||||||||||||||||||
| Principal Amount (000)/ Shares |
Description (1) | Coupon |
Maturity |
Ratings (2) |
Value | |||||||||||||||
| SHORT-TERM INVESTMENTS – 0.4% |
||||||||||||||||||||
| Money Market Funds – 0.3% |
||||||||||||||||||||
| 1,805,270 | First American Treasury Obligations Fund, Class Z |
0.000% | (8) | N/A | N/A | $ | 1,805,270 | |||||||||||||
| U.S. Government and Agency Obligations – 0.1% |
||||||||||||||||||||
| $ | 100 | U.S. Treasury Bills, (10) |
0.053% | 7/26/12 | Aaa | 99,969 | ||||||||||||||
| 120 | U.S. Treasury Bills, (10) |
0.013% | 3/22/12 | Aaa | 119,995 | |||||||||||||||
| $ | 220 | Total U.S. Government and Agency Obligations |
219,964 | |||||||||||||||||
| Total Short-Term Investments (cost $2,025,250) |
2,025,234 | |||||||||||||||||||
| Total Investments (cost $718,093,895) – 123.7% |
690,069,240 | |||||||||||||||||||
| Other Assets Less Liabilities – (23.7)% (11) |
(132,036,055) | |||||||||||||||||||
| Net Assets – 100% |
$ | 558,033,185 | ||||||||||||||||||
| Nuveen Investments | 65 |
Portfolio of Investments (Unaudited)
Nuveen High Income Bond Fund (continued)
December 31, 2011
Investments in Derivatives at December 31, 2011:
Future Contracts outstanding:
| Type | Contract Position |
Number of Contracts |
Contract Expiration |
Value (U.S. Dollars) |
Unrealized Appreciation (Depreciation) (U.S. Dollars) |
|||||||||||||||
| U.S. Treasury 10-Year Note |
Long | 5 | 3/12 | $ | 655,625 | $ | 625 | |||||||||||||
| U.S. Treasury Long Bond |
Long | 32 | 3/12 | 4,634,000 | 38,176 | |||||||||||||||
| $ | 38,801 | |||||||||||||||||||
| For Fund portfolio compliance purposes, the Fund’s industry classifications refer to any one or more of the industry sub-classifications used by one or more widely recognized market indexes or ratings group indexes, and/or as defined by Fund management. This definition may not apply for purposes of this report which may combine industry sub-classifications into sectors for reporting ease. |
| (1) | All percentages shown in the Portfolio of Investments are based on net assets. |
| (2) | Ratings: Using the highest of Standard & Poor’s Group (“Standard & Poor’s”), Moody’s Investors Service, Inc. (“Moody’s”) or Fitch, Inc. (“Fitch”) rating. Ratings below BBB by Standard & Poor’s, Baa by Moody’s or BBB by Fitch are considered to be below investment grade. Holdings designated N/R are not rated by any of these national rating agencies. |
| (3) | Investment valued at fair value using methods determined in good faith by, or at the discretion of, the Board of Directors. For fair value measurement disclosure purposes, investment categorized as Level 3. See Notes to Financial Statements, Footnote 1 – General Information and Significant Accounting Policies, Investment Valuation for more information. |
| (4) | Investment, or a portion of investment, is out on loan for securities lending. |
| (5) | Non-income producing; issuer has not declared a dividend within the past twelve months. |
| (6) | For fair value measurement disclosure purposes, Common Stock categorized as Level 2. See Notes to Financial Statements, Footnote 1 – General Information and Significant Accounting Policies, Investment Valuation for more information. |
| (7) | Principal Amount (000) rounds to less than $1,000. |
| (8) | The rate shown is the annualized seven-day effective yield as of December 31, 2011. |
| (9) | The Fund may loan securities representing up to one third of the fair value of its total assets (which includes collateral for securities on loan) to broker-dealers, banks, or other institutional borrowers of securities. The Fund maintains collateral equal to at least 102% of the fair value of the securities loaned. The adequacy of the collateral is monitored on a daily basis. The cash collateral received by the Fund is invested in this money market fund. |
| (10) | Investment, or portion of investment, segregated as collateral for investments in derivatives. Yield shown is effective yield as of December 31, 2011. |
| (11) | Other Assets Less Liabilities, includes the Unrealized Appreciation (Depreciation) of derivative instruments as noted in Investments in Derivatives at December 31, 2011. |
| N/A | Not applicable. |
| N/R | Not rated. |
| 144A | Investment is exempt from registration under Rule 144A of the Securities Act of 1933, as amended. These investments may only be resold in transactions exempt from registration, which are normally those transactions with qualified institutional buyers. |
| ADR | American Depositary Receipt. |
| REIT | Real Estate Investment Trust |
See accompanying notes to financial statements.
| 66 | Nuveen Investments |
Portfolio of Investments (Unaudited)
Nuveen Inflation Protected Securities Fund
December 31, 2011
| Shares | Description (1) | Value | ||||||||||||||||||
| EXCHANGE-TRADED FUNDS – 0.0% |
||||||||||||||||||||
| 1,500 | iShares Iboxx HY Corp Bond, (4) |
$ | 134,145 | |||||||||||||||||
| Total Exchange-Traded Funds (cost $129,980) |
134,145 | |||||||||||||||||||
| Principal Amount (000) |
Description (1) | Coupon | Maturity | Ratings (2) | Value | |||||||||||||||
| CORPORATE BONDS – 2.5% |
||||||||||||||||||||
| Auto Components – 0.1% |
||||||||||||||||||||
| $ | 175 | Dana Holding Corporation |
6.500% | 2/15/19 | BB– | $ | 176,750 | |||||||||||||
| Automobiles – 0.0% |
||||||||||||||||||||
| 100 | Chrysler GP/CG Company, 144A, (4) |
8.000% | 6/15/19 | B | 91,500 | |||||||||||||||
| Chemicals – 0.1% |
||||||||||||||||||||
| 150 | Huntsman International LLC, (4) |
5.500% | 6/30/16 | B+ | 147,000 | |||||||||||||||
| 150 | Sinochem Overseas Capital Limited, (4) |
4.500% | 11/12/20 | BBB+ | 146,007 | |||||||||||||||
| 300 | Total Chemicals |
293,007 | ||||||||||||||||||
| Commercial Banks – 0.1% |
||||||||||||||||||||
| 200 | Banco do Nordeste do Brasil, 144A, (4) |
3.625% | 11/09/15 | BBB | 199,500 | |||||||||||||||
| Electric Utilities – 0.2% |
||||||||||||||||||||
| 570 | Comision Federal de Electricidad of the United States of Mexcio, 144A |
4.875% | 5/26/21 | Baa1 | 587,100 | |||||||||||||||
| Energy Equipment & Services – 0.2% |
||||||||||||||||||||
| 350 | Energy Transfer Equity LP, (4) |
7.500% | 10/15/20 | BB | 382,375 | |||||||||||||||
| 200 | NGPL PipeCo LLC |
7.119% | 12/15/17 | BB+ | 197,436 | |||||||||||||||
| 550 | Total Energy Equipment & Services |
579,811 | ||||||||||||||||||
| Food Products – 0.1% |
||||||||||||||||||||
| 250 | Viterra Inc. |
5.950% | 8/01/20 | BBB– | 255,489 | |||||||||||||||
| Health Care Providers & Services – 0.1% |
||||||||||||||||||||
| 360 | HCA Inc. |
7.250% | 9/15/20 | BB+ | 379,800 | |||||||||||||||
| Hotels, Restaurants & Leisure – 0.1% |
||||||||||||||||||||
| 175 | Reynolds Group, 144A |
7.125% | 4/15/19 | BB– | 178,063 | |||||||||||||||
| Independent Power Producers & Energy Traders – 0.1% |
||||||||||||||||||||
| 150 | AES Corporation |
8.000% | 10/15/17 | BB | 165,000 | |||||||||||||||
| 250 | Calpine Corporation, 144A, (4) |
7.875% | 7/31/20 | BB | 269,375 | |||||||||||||||
| 400 | Total Independent Power Producers & Energy Traders |
434,375 | ||||||||||||||||||
| Insurance – 0.3% |
||||||||||||||||||||
| 1,000 | Pacific Life Global Funding, 144A |
6.050% | 2/06/16 | A+ | 1,008,910 | |||||||||||||||
| Marine – 0.0% |
||||||||||||||||||||
| 150 | Navios Maritime Acquisition Corporation, (4) |
8.625% | 11/01/17 | B | 108,750 | |||||||||||||||
| Metals & Mining – 0.5% |
||||||||||||||||||||
| 150 | Alrosa Finance SA, 144A |
7.750% | 11/03/20 | BB– | 149,250 | |||||||||||||||
| 1,000 | Southern Copper Corporation |
7.500% | 7/27/35 | BBB | 1,092,303 | |||||||||||||||
| 200 | Taseko Mines Limited |
7.750% | 4/15/19 | B | 180,500 | |||||||||||||||
| 350 | Vedanta Resources PLC, 144A, (4) |
9.500% | 7/18/18 | BB | 301,000 | |||||||||||||||
| 1,700 | Total Metals & Mining |
1,723,053 | ||||||||||||||||||
| Oil, Gas & Consumable Fuels – 0.4% |
||||||||||||||||||||
| 130 | Carrizo Oil and Gas Inc., (4) |
8.625% | 10/15/18 | B– | 131,300 | |||||||||||||||
| 175 | Linn Energy LLC Finance Corporation, (4) |
8.625% | 4/15/20 | B | 189,875 | |||||||||||||||
| Nuveen Investments | 67 |
Portfolio of Investments (Unaudited)
Nuveen Inflation Protected Securities Fund (continued)
December 31, 2011
| Principal Amount (000) |
Description (1) | Coupon | Maturity | Ratings (2) | Value | |||||||||||||||
| Oil, Gas & Consumable Fuels (continued) |
||||||||||||||||||||
| $ | 250 | Range Resources Corporation |
8.000% | 5/15/19 | BB | $ | 278,750 | |||||||||||||
| 200 | Seadrill Limited |
6.500% | 10/05/15 | N/R | 190,000 | |||||||||||||||
| 175 | SM Energy Company, 144A |
6.625% | 2/15/19 | BB | 182,000 | |||||||||||||||
| 150 | Tesoro Petroleum Corporation, (4) |
6.500% | 6/01/17 | BB+ | 153,750 | |||||||||||||||
| 1,080 | Total Oil, Gas & Consumable Fuels |
1,125,675 | ||||||||||||||||||
| Real Estate Investment Trust – 0.0% |
||||||||||||||||||||
| 150 | Weyerhaeuser Company |
7.375% | 10/01/19 | BBB– | 169,000 | |||||||||||||||
| Real Estate Management & Development – 0.1% |
||||||||||||||||||||
| 200 | Country Garden Holding Company, 144A, (4) |
11.125% | 2/23/18 | BB– | 173,000 | |||||||||||||||
| Road & Rail – 0.1% |
||||||||||||||||||||
| 175 | Hertz Corporation |
7.375% | 1/15/21 | BB– | 177,844 | |||||||||||||||
| Wireless Telecommunication Services – 0.0% |
||||||||||||||||||||
| 150 | NII Capital Corporation |
8.875% | 12/15/19 | B+ | 157,874 | |||||||||||||||
| $ | 7,685 | Total Corporate Bonds (cost $7,745,861) |
7,819,501 | |||||||||||||||||
| Shares | Description (1) | Coupon | Maturity | Ratings (2) | Value | |||||||||||||||
| CONVERTIBLE PREFERRED SECURITIES – 0.1% |
||||||||||||||||||||
| Oil, Gas & Consumable Fuels – 0.1% |
||||||||||||||||||||
| 2,000 | Chesapeake Energy Corporation, Convertible |
5.000% | 12/31/49 | B+ | $ | 166,800 | ||||||||||||||
| Total Convertible Preferred Securities (cost $170,000) |
166,800 | |||||||||||||||||||
| Shares | Description (1) | Coupon | Ratings (2) | Value | ||||||||||||||||
| $25 PAR (OR SIMILAR) PREFERRED SECURITIES – 0.1% |
|
|||||||||||||||||||
| Diversified Banking – 0.1% |
||||||||||||||||||||
| 10,000 | Bank of America Corporation |
5.500% | BBB– | $ | 147,000 | |||||||||||||||
| 13,000 | Goldman Sachs Group Inc. |
3.750% | BBB+ | 216,710 | ||||||||||||||||
| 3,000 | Morgan Stanley, Series 2006A |
4.000% | BBB+ | 44,130 | ||||||||||||||||
| Total Diversified Banking |
407,840 | |||||||||||||||||||
| Sovereign Agency – 0.0% |
||||||||||||||||||||
| 16,000 | Federal National Mortgage Association, (4) |
8.250% | C | 22,080 | ||||||||||||||||
| Total $25 Par (or similar) Preferred Securities (cost $891,431) |
|
429,920 | ||||||||||||||||||
| Principal Amount (000) |
Description (1) | Optional Call Provisions (3) |
Ratings (2) | Value | ||||||||||||||||
| MUNICIPAL BONDS – 0.4% |
||||||||||||||||||||
| Illinois – 0.4% |
||||||||||||||||||||
| $ | 1,130 | Illinois State, General Obligation Bonds, Taxable |
No Opt. Call | A+ | $ | 1,217,914 | ||||||||||||||
| $ | 1,130 | Total Municipal Bonds (cost $1,130,000) |
1,217,914 | |||||||||||||||||
| Principal Amount (000) |
Description (1) | Coupon | Maturity | Ratings (2) | Value | |||||||||||||||
| U.S. GOVERNMENT AND AGENCY OBLIGATIONS – 89.8% |
|
|||||||||||||||||||
| $ | 1,245 | Federal National Mortgage Association |
4.625% | 5/01/13 | Aa2 | $ | 1,311,488 | |||||||||||||
| 1,055 | Tennessee Valley Authority, Series A |
3.875% | 2/15/21 | AAA | 1,203,657 | |||||||||||||||
| 68 | Nuveen Investments |
| Principal Amount (000) |
Description (1) | Coupon | Maturity | Ratings (2) | Value | |||||||||||||||
| U.S. GOVERNMENT AND AGENCY OBLIGATIONS (continued) |
||||||||||||||||||||
| $ | 2,335 | U.S. Treasury Bonds, (4) |
8.750% | 8/15/20 | AAA | $ | 3,682,916 | |||||||||||||
| 2,580 | U.S. Treasury Bonds, (4) |
8.000% | 11/15/21 | AAA | 4,032,460 | |||||||||||||||
| 5,961 | U.S. Treasury Bonds |
2.000% | 1/15/26 | AAA | 7,326,917 | |||||||||||||||
| 8,849 | U.S. Treasury Bonds |
3.875% | 4/15/29 | AAA | 13,788,876 | |||||||||||||||
| 3,353 | U.S. Treasury Inflation Indexed Obligations |
2.000% | 4/15/12 | AAA | 3,367,678 | |||||||||||||||
| 2,519 | U.S. Treasury Inflation Indexed Obligations |
3.000% | 7/15/12 | AAA | 2,572,689 | |||||||||||||||
| 8,034 | U.S. Treasury Inflation Indexed Obligations, (4) |
0.625% | 4/15/13 | AAA | 8,169,803 | |||||||||||||||
| 3,637 | U.S. Treasury Inflation Indexed Obligations |
1.875% | 7/15/13 | AAA | 3,802,971 | |||||||||||||||
| 4,669 | U.S. Treasury Inflation Indexed Obligations, (4) |
2.000% | 1/15/14 | AAA | 4,944,117 | |||||||||||||||
| 6,355 | U.S. Treasury Inflation Indexed Obligations, (4) |
1.250% | 4/15/14 | AAA | 6,659,439 | |||||||||||||||
| 4,685 | U.S. Treasury Inflation Indexed Obligations |
2.000% | 7/15/14 | AAA | 5,047,335 | |||||||||||||||
| 4,227 | U.S. Treasury Inflation Indexed Obligations |
1.625% | 1/15/15 | AAA | 4,559,255 | |||||||||||||||
| 12,830 | U.S. Treasury Inflation Indexed Obligations |
0.500% | 4/15/15 | AAA | 13,424,539 | |||||||||||||||
| 6,234 | U.S. Treasury Inflation Indexed Obligations, (4) |
1.875% | 7/15/15 | AAA | 6,874,424 | |||||||||||||||
| 5,333 | U.S. Treasury Inflation Indexed Obligations, (4) |
2.000% | 1/15/16 | AAA | 5,961,091 | |||||||||||||||
| 19,110 | U.S. Treasury Inflation Indexed Obligations |
0.125% | 4/15/16 | AAA | 19,922,468 | |||||||||||||||
| 6,194 | U.S. Treasury Inflation Indexed Obligations |
2.500% | 7/15/16 | AAA | 7,164,218 | |||||||||||||||
| 5,984 | U.S. Treasury Inflation Indexed Obligations |
2.375% | 1/15/17 | AAA | 6,946,474 | |||||||||||||||
| 3,824 | U.S. Treasury Inflation Indexed Obligations, (4) |
2.625% | 7/15/17 | AAA | 4,551,633 | |||||||||||||||
| 6,279 | U.S. Treasury Inflation Indexed Obligations |
1.625% | 1/15/18 | AAA | 7,150,655 | |||||||||||||||
| 4,134 | U.S. Treasury Inflation Indexed Obligations |
2.125% | 1/15/19 | AAA | 4,913,639 | |||||||||||||||
| 6,952 | U.S. Treasury Inflation Indexed Obligations |
1.375% | 1/15/20 | AAA | 7,915,975 | |||||||||||||||
| 10,029 | U.S. Treasury Inflation Indexed Obligations, (4) |
1.250% | 7/15/20 | AAA | 11,343,974 | |||||||||||||||
| 16,411 | U.S. Treasury Inflation Indexed Obligations, (4) |
1.125% | 1/15/21 | AAA | 18,301,967 | |||||||||||||||
| 14,165 | U.S. Treasury Inflation Indexed Obligations, (4) |
0.625% | 7/15/21 | AAA | 15,153,086 | |||||||||||||||
| 11,453 | U.S. Treasury Inflation Indexed Obligations, (4) |
2.375% | 1/15/25 | AAA | 14,561,854 | |||||||||||||||
| 5,109 | U.S. Treasury Inflation Indexed Obligations |
2.375% | 1/15/27 | AAA | 6,597,621 | |||||||||||||||
| 6,296 | U.S. Treasury Inflation Indexed Obligations |
1.750% | 1/15/28 | AAA | 7,570,952 | |||||||||||||||
| 8,225 | U.S. Treasury Inflation Indexed Obligations |
3.625% | 4/15/28 | AAA | 12,228,761 | |||||||||||||||
| 2,900 | U.S. Treasury Inflation Indexed Obligations |
2.500% | 1/15/29 | AAA | 3,869,172 | |||||||||||||||
| 7,935 | U.S. Treasury Inflation Indexed Obligations |
2.125% | 2/15/40 | AAA | 10,648,857 | |||||||||||||||
| 11,994 | U.S. Treasury Inflation Indexed Obligations |
2.125% | 2/15/41 | AAA | 16,199,775 | |||||||||||||||
| 5,381 | U.S. Treasury Notes |
1.375% | 7/15/18 | AAA | 6,092,587 | |||||||||||||||
| 4,533 | U.S. Treasury Notes |
1.875% | 7/15/19 | AAA | 5,341,193 | |||||||||||||||
| $ | 240,809 | Total U.S. Government and Agency Obligations (cost $258,028,142) |
|
283,204,516 | ||||||||||||||||
| Principal Amount (000) |
Description (1) | Coupon | Maturity | Ratings (2) | Value | |||||||||||||||
| ASSET-BACKED AND MORTGAGE-BACKED SECURITIES – 5.4% |
|
|||||||||||||||||||
| $ | 730 | DBUBS Mortgage Trust, Commercial Mortgage Pass Through Certificates, Series 2011-LC3A |
3.642% | 8/10/44 | AAA | $ | 769,014 | |||||||||||||
| 1,040 | Extended Stay America Trust 2010-EHSA |
4.860% | 11/05/27 | A | 1,052,901 | |||||||||||||||
| 2,300 | Greenwich Capital Commercial Funding Corporation, Commercial Mortgage Pass Through Certificates, Series 2007-GG11 |
5.736% | 12/10/49 | AAA | 2,481,192 | |||||||||||||||
| Nuveen Investments | 69 |
Portfolio of Investments (Unaudited)
Nuveen Inflation Protected Securities Fund (continued)
December 31, 2011
| Principal Amount (000) |
Description (1) | Coupon | Maturity | Ratings (2) | Value | |||||||||||||||
| ASSET-BACKED AND MORTGAGE-BACKED SECURITIES (continued) |
||||||||||||||||||||
| $ | 1,400 | JPMorgan Chase Commercial Mortgage Securities Corporation, Commercial Mortgage Pass-Through Certificates, |
5.440% | 6/12/47 | Aaa | $ | 1,500,537 | |||||||||||||
| 2,000 | JPMorgan Chase Commercial Mortgage Securities Corporation, Commercial Mortgage Pass-Through Certificates, |
5.794% | 2/12/51 | AAA | 2,202,156 | |||||||||||||||
| 988 | JPMorgan Chase Commercial Mortgage Securities Corporation, Commercial Mortgage Pass-Through Certificates, |
3.853% | 6/15/43 | AAA | 1,033,410 | |||||||||||||||
| 1,470 | JPMorgan Chase Commerical Mortgage Trust, Commerical Mortage Pass Through Certificates, Series 2011-C4 |
4.106% | 7/15/46 | AAA | 1,551,438 | |||||||||||||||
| 380 | Merrill Lynch Mortgage Trust, Commercial Mortgage Pass-Through Certificates, Series 2008-C1 |
5.690% | 2/15/51 | AAA | 413,081 | |||||||||||||||
| 500 | Morgan Stanley Capital I Trust, Commercial Mortgage Pass-Through Certificates, Series 2006-IQ12 |
5.332% | 12/15/43 | AAA | 558,876 | |||||||||||||||
| 425 | Morgan Stanley Capital I Trust, Commercial Mortgage Pass-Through Certificates, Series 2011-C1 C |
5.255% | 9/15/47 | A | 375,586 | |||||||||||||||
| 1,957 | Morgan Stanley Capital I Trust, Commercial Mortgage Pass-Through Certificates, Series 2011-C3 A1 |
2.178% | 7/15/49 | Aaa | 1,974,748 | |||||||||||||||
| 700 | OBP Depositor LLC Trust, Commercial Mortgage Pass Through Certificates, Series 2010-OBP |
4.646% | 7/15/45 | AAA | 782,543 | |||||||||||||||
| 713 | Sequoia Mortgage Trust, Mortgage Pass Through Certificates, Series 2011-1 |
4.125% | 2/25/41 | AAA | 708,874 | |||||||||||||||
| 450 | Wells Fargo-RBS Commercial Mortage Trust, Commercial Mortgage Pass-Through Certificates, Series 2011-C2 |
5.392% | 2/15/44 | A | 402,554 | |||||||||||||||
| 1,260 | Wells Fargo-RBS Commercial Mortgage Trust, Commercial Mortgage Pass-Through Certificates, Series 2011-C3, (4) |
4.375% | 3/15/44 | AAA | 1,341,645 | |||||||||||||||
| $ | 16,313 | Total Asset-Backed and Mortgage-Backed Securities (cost $16,699,043) |
|
17,148,555 | ||||||||||||||||
| Shares | Description (1) | Value | ||||||||||||||||||
| INVESTMENT COMPANIES – 0.1% |
||||||||||||||||||||
| 10,500 | Blackrock Credit Allocation Income Trust IV |
$ | 127,575 | |||||||||||||||||
| 11,000 | Pimco Income Strategy Fund, (4) |
114,400 | ||||||||||||||||||
| Total Investment Companies (cost $242,375) |
241,975 | |||||||||||||||||||
| Principal Amount (000) |
Description (1) | Coupon | Maturity | Ratings (2) | Value | |||||||||||||||
| SOVEREIGN DEBT – 0.6% |
||||||||||||||||||||
| Canada – 0.5% |
||||||||||||||||||||
| 800 CAD | Canadian Government |
1.500% | 3/01/12 | AAA | $ | 786,038 | ||||||||||||||
| 750 CAD | Canadian Government |
3.500% | 6/01/20 | AAA | 830,915 | |||||||||||||||
| 1,550 CAD | Total Canada |
1,616,953 | ||||||||||||||||||
| Poland – 0.1% |
||||||||||||||||||||
| 250 PLN | Republic of Poland |
6.375% | 7/15/19 | A2 | 276,875 | |||||||||||||||
| Total Sovereign Debt (cost $1,761,981) |
1,893,828 | |||||||||||||||||||
| 70 | Nuveen Investments |
| Shares | Description (1) | Value | ||||||||||||||||||
| INVESTMENTS PURCHASED WITH COLLATERAL FROM SECURITIES LENDING – 34.9% |
|
|||||||||||||||||||
| Money Market Funds – 34.9% |
||||||||||||||||||||
| 110,025,443 | Mount Vernon Securities Lending Prime Portfolio, 0.233% (5), (6) |
$ | 110,025,443 | |||||||||||||||||
| Total Investments Purchased with Collateral from Securities Lending (cost $110,025,443) |
|
110,025,443 | ||||||||||||||||||
| Principal Amount (000)/ Shares |
Description (1) | Coupon |
Maturity |
Ratings (2) | Value | |||||||||||||||
| SHORT-TERM INVESTMENTS – 1.6% |
||||||||||||||||||||
| Money Market Funds – 1.3% |
||||||||||||||||||||
| 3,954,290 | First American Treasury Obligations Fund, Class Z |
0.000% (5) | N/A | N/A | $ | 3,954,290 | ||||||||||||||
| U.S. Government and Agency Obligations – 0.3% |
||||||||||||||||||||
| $ | 20 | U.S. Treasury Bill, (7) |
0.008% | 2/15/12 | Aaa | 20,000 | ||||||||||||||
| 625 | U.S. Treasury Bill, (7) |
0.013% | 4/05/12 | Aaa | 624,967 | |||||||||||||||
| 400 | U.S. Treasury Bill, (7) |
0.053% | 7/26/12 | Aaa | 399,875 | |||||||||||||||
| $ | 1,045 | Total U.S. Government and Agency Obligations |
1,044,842 | |||||||||||||||||
| Total Short-Term Investments (cost $4,999,174) |
4,999,132 | |||||||||||||||||||
| Total Investments (cost $401,823,430) – 135.5% |
427,281,729 | |||||||||||||||||||
| Other Assets Less Liabilities – (35.5)% (8) |
(112,018,965) | |||||||||||||||||||
| Net Assets – 100% |
$ | 315,262,764 | ||||||||||||||||||
Investments in Derivatives at December 31, 2011:
Forward Foreign Currency Exchange Contracts outstanding:
| Counterparty | Currency Contracts to Deliver | Amount (Local Currency) |
In Exchange For Currency |
Amount (Local Currency) |
Settlement Date |
Unrealized Appreciation Depreciation) (U.S. Dollars) |
||||||||||||||||
| Goldman Sachs |
U.S. Dollar | 788,720 | Australian Dollar | 800,000 | 2/21/12 | $ | 24,494 | |||||||||||||||
| Goldman Sachs |
U.S. Dollar | 3,239,093 | Canadian Dollar | 3,350,000 | 2/21/12 | 45,259 | ||||||||||||||||
| $ | 69,753 | |||||||||||||||||||||
Credit Default Swaps outstanding:
| Counterparty | Reference Entity | Buy/Sell Protection (9) |
Current Credit Spread (10) |
Notional Amount (U.S. Dollars) |
Fixed Rate |
Termination Date |
Value (U.S. Dollars) |
Unrealized Appreciation Depreciation) (U.S. Dollars) |
||||||||||||||||||||||||||
| UBS |
MARKIT CDX NA HY 17 | Sell | 8.37 | % | $ | 4,900,000 | 5.00 | % | 12/20/16 | $ | (335,611 | ) | $ | 249,179 | ||||||||||||||||||||
Interest Rate Swaps outstanding:
| Counterparty | Notional Amount |
Fund Pay/Receive Floating Rate |
Floating Rate Index |
Fixed Rate* | Fixed Rate Payment Frequency |
Termination Date |
Value (U.S. Dollars) |
Unrealized Appreciation (Depreciation) (U.S. Dollars) |
||||||||||||||||||||||||
| JPMorgan Chase |
$ | 1,000,000 | Receive | 3-Month USD-LIBOR | 3.858 | % | Semi-Annually | 1/19/20 | $ | (176,643 | ) | $ | (176,643 | ) | ||||||||||||||||||
| UBS |
2,000,000 | Receive | 3-Month USD-LIBOR | 1.133 | Semi-Annually | 3/25/12 | (8,514 | ) | (8,514 | ) | ||||||||||||||||||||||
| UBS |
4,000,000 | Receive | 3-Month USD-LIBOR | 1.048 | Semi-Annually | 6/25/12 | (8,621 | ) | (8,621 | ) | ||||||||||||||||||||||
| UBS |
2,000,000 | Receive | 3-Month USD-LIBOR | 3.001 | Semi-Annually | 8/03/14 | (139,467 | ) | (139,467 | ) | ||||||||||||||||||||||
| $ | (333,245 | ) | ||||||||||||||||||||||||||||||
| * | Annualized. |
| Nuveen Investments | 71 |
Portfolio of Investments (Unaudited)
Nuveen Inflation Protected Securities Fund (continued)
December 31, 2011
Investments in Derivatives at December 31, 2011 (continued):
Futures Contracts outstanding:
| Type | Contract Position |
Number of Contracts |
Contract Expiration |
Value (U.S. Dollars) |
Unrealized Appreciation Depreciation) (U.S. Dollars) |
|||||||||||||||
| U.S. Treasury 10-Year Note |
Short | (10 | ) | 3/12 | $ | (1,311,250 | ) | $ | (2,273) | |||||||||||
| U.S. Treasury 5-Year Note |
Long | 30 | 3/12 | 3,697,734 | 4,733 | |||||||||||||||
| U.S. Treasury Long Bond |
Long | 10 | 3/12 | 1,448,125 | 11,227 | |||||||||||||||
| U.S. Ultra Bond |
Long | 1 | 3/12 | 160,188 | 1,545 | |||||||||||||||
| $ | 15,232 | |||||||||||||||||||
| For Fund portfolio compliance purposes, the Fund’s industry classifications refer to any one or more of the industry sub-classifications used by one or more widely recognized market indexes or ratings group indexes, and/or as defined by Fund management. This definition may not apply for purposes of this report which may combine industry sub-classifications into sectors for reporting ease. |
| (1) | All Percentages shown in the Portfolio of Investments are based on net assets. |
| (2) | Ratings: Using the highest of Standard & Poor’s Group (“Standard & Poor’s”), Moody’s Investors Service, Inc. (“Moody’s”) or Fitch, Inc. (“Fitch”) rating. Ratings below BBB by Standard & Poor’s, Baa by Moody’s or BBB by Fitch are considered to be below investment grade. Holdings designated N/R are not rated by any of these national rating agencies. |
| (3) | Optional Call Provisions: Dates (month and year) and prices of the earliest optional call or redemption. There may be other call provisions at varying prices at later dates. Certain mortgage-backed securities may be subject to periodic principal paydowns. |
| (4) | Investment, or a portion of investment, is out on loan for securities lending. |
| (5) | The rate shown is the annualized seven-day effective yield as of December 31, 2011. |
| (6) | The Fund may loan securities representing up to one third of the fair value of its total assets (which includes collateral for securities on loan) to broker-dealers, banks, or other institutional borrowers of securities. The Fund maintains collateral equal to at least 102% of the fair value of the securities loaned. The adequacy of the collateral is monitored on a daily basis. The cash collateral received by the Fund is invested in this money market fund. |
| (7) | Investment, or portion of investment, segregated as collateral for investments in derivatives. Yield shown is effective yield as of December 31, 2011. |
| (8) | Other Assets Less Liabilities, includes the Unrealized Appreciation (Depreciation) of derivative instruments as noted in Investments in Derivatives at December 31, 2011. |
| (9) | The Fund entered into the credit default swaps to gain investment exposure to the referenced entity. Selling protection has a similar credit risk position to owning the referenced entity. Buying protection has a similar credit risk position to selling the referenced entity short. |
| (10) | The credit spread generally serves as an indication of the current status of the payment/performance risk and therefore the likelihood of default of the credit derivative. The credit spread also reflects the cost of buying/selling protection and may include upfront payments required to be made to enter into a credit default swap contract. Higher credit spreads are indicative of higher likelihood of performance by the seller of protection. |
| N/A | Not Applicable. |
| N/R | Not Rated. |
| 144A | Investment is exempt from registration under Rule 144A of the Securities Act of 1933, as amended. These investments may only be resold in transactions exempt from registration, which are normally those transactions with qualified institutional buyers. |
| USD-LIBOR | United States Dollar–London Inter-Bank Offered Rate. |
| CAD | Canadian Dollar |
| PLN | Polish Zloty |
See accompanying notes to financial statements.
| 72 | Nuveen Investments |
Portfolio of Investments (Unaudited)
Nuveen Intermediate Government Bond Fund
December 31, 2011
| Principal Amount (000) |
Description (1) | Coupon | Maturity | Ratings (2) | Value | |||||||||||||||
| U.S. GOVERNMENT AND AGENCY OBLIGATIONS – 46.1% |
||||||||||||||||||||
| $ | 1,105 | Fannie Mae Notes |
0.550% | 9/27/13 | AAA | $ | 1,109,484 | |||||||||||||
| 2,360 | Fannie Mae Notes |
1.000% | 9/02/14 | AAA | 2,473,776 | |||||||||||||||
| 1,000 | Fannie Mae Notes |
0.750% | 12/19/14 | AAA | 1,003,083 | |||||||||||||||
| 1,150 | Fannie Mae Notes, (3) |
2.250% | 3/15/16 | AAA | 1,150,574 | |||||||||||||||
| 1,140 | Fannie Mae Notes, (3) |
1.250% | 9/28/16 | AAA | 1,138,641 | |||||||||||||||
| 845 | Federal Farm Credit Banks, Consolidated Systemwide Notes |
2.125% | 6/18/12 | AAA | 862,824 | |||||||||||||||
| 700 | Federal Farm Credit Banks, Consolidated Systemwide Notes |
2.100% | 8/10/12 | AAA | 744,647 | |||||||||||||||
| 1,400 | Federal Farm Credit Banks, Consolidated Systemwide Notes |
4.500% | 10/17/12 | AAA | 1,466,990 | |||||||||||||||
| 1,350 | Federal Farm Credit Banks, Consolidated Systemwide Notes |
1.375% | 6/25/13 | AAA | 1,432,401 | |||||||||||||||
| 1,705 | Federal Farm Credit Banks, Consolidated Systemwide Notes |
3.875% | 10/07/13 | AAA | 1,732,822 | |||||||||||||||
| 565 | Federal Farm Credit Banks, Consolidated Systemwide Notes |
2.625% | 4/17/14 | AAA | 583,911 | |||||||||||||||
| 500 | Federal Farm Credit Banks, Consolidated Systemwide Notes, (3) |
3.000% | 9/22/14 | AAA | 505,922 | |||||||||||||||
| 1,130 | Federal Farm Credit Banks, Consolidated Systemwide Notes, (3) |
1.500% | 11/16/15 | AAA | 1,140,080 | |||||||||||||||
| 1,080 | Federal Home Loan Bank Bonds, (3) |
1.500% | 1/16/13 | Aaa | 1,239,143 | |||||||||||||||
| 1,710 | Federal Home Loan Bank Bonds, (3) |
0.500% | 8/28/13 | AAA | 1,724,715 | |||||||||||||||
| 1,865 | Federal Home Loan Bank Bonds, (3) |
3.125% | 12/13/13 | Aaa | 1,954,341 | |||||||||||||||
| 1,345 | Federal Home Loan Bank Bonds, (3) |
0.875% | 12/27/13 | AAA | 1,347,453 | |||||||||||||||
| 2,000 | Federal Home Loan Bank Bonds |
4.125% | 3/13/20 | Aaa | 2,024,834 | |||||||||||||||
| 365 | Federal Home Loan Mortgage Corporation, Notes |
0.600% | 9/20/13 | AAA | 416,659 | |||||||||||||||
| 575 | Federal Home Loan Mortgage Corporation, Notes |
2.500% | 4/23/14 | AAA | 601,070 | |||||||||||||||
| 1,005 | Federal Home Loan Mortgage Corporation, Notes, (3) |
3.750% | 3/27/19 | AAA | 1,003,804 | |||||||||||||||
| 1,700 | Federal National Mortgage Association |
5.250% | 8/01/12 | AAA | 1,758,019 | |||||||||||||||
| 1,075 | Federal National Mortgage Association |
4.625% | 5/01/13 | AAA | 1,134,201 | |||||||||||||||
| 1,145 | Federal National Mortgage Association |
1.500% | 1/27/15 | AAA | 1,145,657 | |||||||||||||||
| 580 | Federal National Mortgage Association, (3) |
2.375% | 7/28/15 | Aa2 | 610,974 | |||||||||||||||
| 785 | Federal National Mortgage Association, (3) |
1.875% | 10/15/15 | Aa2 | 806,710 | |||||||||||||||
| 270 | Freddie Mac Reference Notes, (3) |
1.375% | 2/25/14 | Aa2 | 301,836 | |||||||||||||||
| 1,140 | Freddie Mac Reference Notes |
1.000% | 7/30/14 | AAA | 1,143,235 | |||||||||||||||
| 1,925 | Freddie Mac Reference Notes, (3) |
1.750% | 9/10/15 | AAA | 1,986,090 | |||||||||||||||
| 780 | Freddie Mac Reference Notes, (3) |
1.500% | 9/21/16 | AAA | 788,363 | |||||||||||||||
| 1,135 | Freddie Mac Reference Notes, (3) |
5.000% | 12/14/18 | AAA | 1,153,355 | |||||||||||||||
| 345 | Private Export Funding |
3.050% | 10/15/14 | Aaa | 358,701 | |||||||||||||||
| 505 | Private Export Funding |
4.550% | 5/15/15 | Aaa | 567,338 | |||||||||||||||
| 550 | Private Export Funding |
2.125% | 7/15/16 | Aaa | 584,355 | |||||||||||||||
| 2,725 | Tennessee Valley Authority |
3.875% | 2/15/21 | AAA | 2,912,044 | |||||||||||||||
| 3,175 | Tennessee Valley Authority |
6.790% | 5/23/12 | AAA | 3,256,921 | |||||||||||||||
| 530 | Tennessee Valley Authority, Series A |
6.000% | 3/15/13 | AAA | 604,681 | |||||||||||||||
| 695 | U.S. Treasury Bonds, (3) |
8.125% | 8/15/19 | AAA | 1,096,200 | |||||||||||||||
| 430 | U.S. Treasury Bonds, (3) |
8.500% | 2/15/20 | AAA | 661,361 | |||||||||||||||
| 1,105 | U.S. Treasury Bonds, (3) |
8.750% | 8/15/20 | AAA | 1,643,344 | |||||||||||||||
| 635 | U.S. Treasury Bonds |
9.000% | 11/15/18 | AAA | 960,289 | |||||||||||||||
| 435 | U.S. Treasury Bonds, (3) |
8.000% | 11/15/21 | AAA | 679,891 | |||||||||||||||
| $ | 46,560 | Total U.S. Government and Agency Obligations (cost $47,909,364) |
49,810,739 | |||||||||||||||||
| Nuveen Investments | 73 |
Portfolio of Investments (Unaudited)
Nuveen Intermediate Government Bond Fund (continued)
December 31, 2011
| Principal Amount (000) |
Description (1) | Coupon | Maturity | Ratings (2) | Value | |||||||||||||||
| ASSET-BACKED AND MORTGAGE-BACKED SECURITIES – 52.7% |
||||||||||||||||||||
| $ | 820 | 321 Henderson Receivables LLC, Series 2010-3A |
3.820% | 12/15/48 | Aaa | $ | 807,264 | |||||||||||||
| 883 | 321 Henderson Receivables LLC., Series 2010-1A |
5.560% | 7/15/59 | Aaa | 954,790 | |||||||||||||||
| 750 | Bear Stearns Commercial Mortgage Securities Trust, Commercial Mortgage Pass-Through Certificates, Series 2005-PW10 |
5.405% | 12/11/40 | AAA | 825,582 | |||||||||||||||
| 550 | Bear Stearns Commercial Mortgage Securities Trust, Commercial Mortgage Pass-Through Certificates, Series 2005-T20 |
5.145% | 10/12/42 | AAA | 608,243 | |||||||||||||||
| 550 | Commercial Mortgage Pass-Through Certificates, Series 2005-LP5 |
4.982% | 5/10/43 | AAA | 599,737 | |||||||||||||||
| 280 | DBUBS Mortgage Trust, Commercial Mortgage Pass Through Certificates, Series 2011-LC3A |
3.642% | 8/10/44 | AAA | 294,964 | |||||||||||||||
| 1,000 | Discover Card Master Trust I 2011-A3 A |
0.488% | 3/15/17 | AAA | 999,173 | |||||||||||||||
| 862 | Extended Stay America Trust 2010-EHSA |
2.951% | 11/05/27 | AAA | 863,982 | |||||||||||||||
| 14 | Fannie Mae Mortgage Pool 20130401 |
6.000% | 4/01/13 | AAA | 14,721 | |||||||||||||||
| 11 | Fannie Mae Mortgage Pool 20130801 |
6.500% | 8/01/13 | AAA | 11,131 | |||||||||||||||
| 23 | Fannie Mae Mortgage Pool 20131101 |
6.000% | 11/01/13 | AAA | 24,639 | |||||||||||||||
| 16 | Fannie Mae Mortgage Pool 20141001 |
7.000% | 10/01/14 | AAA | 16,622 | |||||||||||||||
| 1,851 | Fannie Mae Mortgage Pool 20150101 |
3.120% | 1/01/15 | AAA | 1,937,187 | |||||||||||||||
| 141 | Fannie Mae Mortgage Pool 20160401 |
5.500% | 4/01/16 | AAA | 153,060 | |||||||||||||||
| 262 | Fannie Mae Mortgage Pool 20170701 |
7.000% | 7/01/17 | AAA | 289,162 | |||||||||||||||
| 259 | Fannie Mae Mortgage Pool 20170701 |
6.500% | 7/01/17 | AAA | 285,089 | |||||||||||||||
| 164 | Fannie Mae Mortgage Pool 20171201 |
5.500% | 12/01/17 | AAA | 178,385 | |||||||||||||||
| 230 | Fannie Mae Mortgage Pool 20180401 |
5.500% | 4/01/18 | AAA | 247,736 | |||||||||||||||
| 467 | Fannie Mae Mortgage Pool 20180501 |
4.500% | 5/01/18 | AAA | 499,782 | |||||||||||||||
| 557 | Fannie Mae Mortgage Pool 20190901 |
5.500% | 9/01/19 | AAA | 606,194 | |||||||||||||||
| 231 | Fannie Mae Mortgage Pool 20220101 |
6.000% | 1/01/22 | AAA | 254,177 | |||||||||||||||
| 226 | Fannie Mae Mortgage Pool 20220601 |
6.500% | 6/01/22 | AAA | 251,907 | |||||||||||||||
| 283 | Fannie Mae Mortgage Pool 20310901 |
7.000% | 9/01/31 | AAA | 320,111 | |||||||||||||||
| 349 | Fannie Mae Mortgage Pool 20311201 |
6.500% | 12/01/31 | AAA | 385,083 | |||||||||||||||
| 951 | Fannie Mae Mortgage Pool 20320401, (3) |
6.000% | 4/01/32 | AAA | 1,038,286 | |||||||||||||||
| 779 | Fannie Mae Mortgage Pool 20320601 |
6.500% | 6/01/32 | AAA | 861,870 | |||||||||||||||
| 169 | Fannie Mae Mortgage Pool 20320801 |
6.000% | 8/01/32 | AAA | 184,791 | |||||||||||||||
| 1,453 | Fannie Mae Mortgage Pool 20340401 |
2.416% | 4/01/34 | AAA | 1,529,825 | |||||||||||||||
| 971 | Fannie Mae Mortgage Pool 20341001, (3) |
5.000% | 10/01/34 | AAA | 1,050,573 | |||||||||||||||
| 575 | Fannie Mae Mortgage Pool 20350301, (3) |
2.540% | 3/01/35 | AAA | 605,158 | |||||||||||||||
| 219 | Fannie Mae Mortgage Pool 20351201 |
2.068% | 12/01/35 | AAA | 225,680 | |||||||||||||||
| 360 | Fannie Mae Mortgage Pool 20360701 |
2.745% | 7/01/36 | AAA | 382,192 | |||||||||||||||
| 491 | Fannie Mae Mortgage Pool 20360801 |
6.500% | 8/01/36 | AAA | 551,254 | |||||||||||||||
| 297 | Fannie Mae Mortgage Pool 20360901 |
2.548% | 9/01/36 | AAA | 312,010 | |||||||||||||||
| 849 | Fannie Mae Mortgage Pool 20370301 |
5.371% | 3/01/37 | AAA | 901,736 | |||||||||||||||
| 556 | Fannie Mae Mortgage Pool 20370401 |
5.692% | 4/01/37 | AAA | 588,737 | |||||||||||||||
| 661 | Fannie Mae Mortgage Pool 20370601 |
7.000% | 6/01/37 | AAA | 754,906 | |||||||||||||||
| 320 | Fannie Mae Mortgage Pool 20380301 |
2.388% | 3/01/38 | AAA | 336,449 | |||||||||||||||
| 1,051 | Fannie Mae Mortgage Pool 20401001 |
3.500% | 10/01/40 | AAA | 1,081,452 | |||||||||||||||
| 966 | Fannie Mae Mortgage Pool 20401201, (3) |
4.000% | 12/01/40 | AAA | 1,015,487 | |||||||||||||||
| 1,845 | Fannie Mae Mortgage Pool 20401201, (3) |
4.000% | 11/01/40 | AAA | 1,939,582 | |||||||||||||||
| 896 | Fannie Mae Mortgage Pools 20160401 |
3.240% | 4/01/16 | AAA | 950,258 | |||||||||||||||
| 74 | Nuveen Investments |
| Principal Amount (000) |
Description (1) | Coupon | Maturity | Ratings (2) | Value | |||||||||||||||
| ASSET-BACKED AND MORTGAGE-BACKED SECURITIES (continued) |
||||||||||||||||||||
| $ | 2,220 | Fannie Mae Mortgage TBA Pools (WI/DD) |
4.500% | TBA | AAA | $ | 2,362,219 | |||||||||||||
| 839 | Fannie Mae REMIC Pass-Through Certificates 20190725 |
3.400% | 7/25/19 | AAA | 891,849 | |||||||||||||||
| 1,362 | Fannie Mae REMIC Pass-Through Certificates 20190925 |
3.305% | 6/25/19 | AAA | 1,445,736 | |||||||||||||||
| 1,380 | Fannie Mae REMIC Pass-Through Certificates 20200625 |
2.520% | 6/25/20 | AAA | 1,428,612 | |||||||||||||||
| 503 | Fannie Mae REMIC Pass-Through Certificates 20420225 |
7.108% | 2/25/42 | Aaa | 584,749 | |||||||||||||||
| 1,040 | FDIC Structures Sale Guaranteed Notes, Series 2010-S1 |
3.250% | 4/25/38 | AAA | 1,064,537 | |||||||||||||||
| 396 | FDIC Trust 2001-C1 |
1.840% | 4/25/31 | AAA | 399,812 | |||||||||||||||
| 755 | Federal Home Loan Bank Mortgages 201801115 |
5.507% | 5/01/37 | AAA | 795,615 | |||||||||||||||
| 814 | Federal Home Loan Bank Mortgages 20330901 |
2.343% | 9/01/33 | AAA | 854,400 | |||||||||||||||
| 598 | Federal Home Loan Bank Mortgages 20360301 |
2.532% | 3/01/36 | AAA | 632,356 | |||||||||||||||
| 472 | Federal Home Loan Mortgage Corporation, REMIC 20180315 |
3.250% | 3/15/18 | AAA | 485,290 | |||||||||||||||
| 299 | Federal Home Loan Mortgage Corporation, REMIC SERIES 2843 20180115 |
4.000% | 1/15/18 | AAA | 302,572 | |||||||||||||||
| 3 | Freddie Mac Mortgage Pool, Various 20120901 |
7.500% | 9/01/12 | AAA | 3,464 | |||||||||||||||
| 14 | Freddie Mac Mortgage Pool, Various 20131001 |
6.000% | 10/01/13 | AAA | 15,060 | |||||||||||||||
| 21 | Freddie Mac Mortgage Pool, Various 20140901 |
7.000% | 9/01/14 | AAA | 22,313 | |||||||||||||||
| 140 | Freddie Mac Mortgage Pool, Various 20280101 |
6.500% | 1/01/28 | AAA | 157,659 | |||||||||||||||
| 24 | Freddie Mac Mortgage Pool, Various 20300101 |
7.500% | 1/01/30 | AAA | 27,178 | |||||||||||||||
| 269 | Freddie Mac Mortgage Pool, Various 20310301 |
6.500% | 3/01/31 | AAA | 308,644 | |||||||||||||||
| 1,187 | Freddie Mac Mulitfamily Strucured Pass Through Certificates, Series K701 SERIES K-701 20170625 |
2.776% | 6/25/17 | AAA | 1,236,392 | |||||||||||||||
| 801 | Freddie Mac Multifamily Structured Pass Through Certificates, |
3.320% | 7/25/20 | Aaa | 856,484 | |||||||||||||||
| 654 | Freddie Mac Structured Pass-Through Certificates Series T045 SERIES T-045 20120827 |
4.520% | 8/27/12 | AAA | 665,617 | |||||||||||||||
| 978 | Freddie Mac Structured Pass-Through Certificates, Series K008 SERIES K-008 20191225 |
2.746% | 12/25/19 | AAA | 1,020,562 | |||||||||||||||
| 1,135 | GMAC Mortgage Services Advance Funding, Series 2011-1A |
3.720% | 3/15/23 | Aaa | 1,132,163 | |||||||||||||||
| 761 | Goldman Sachs Mortgage Securities Corporation, Mortgage Pass-Through Certificates, Series 2003-1 |
6.748% | 3/25/43 | Ba3 | 654,974 | |||||||||||||||
| 1,221 | Goldman Sachs Mortgage Securities Corporation, Mortgage Pass-Through Certificates, Series 2005-4F |
5.768% | 5/25/35 | CC | 756,813 | |||||||||||||||
| 46 | Government National Mortgage Association Pool 20221215 |
7.500% | 12/15/22 | AAA | 47,906 | |||||||||||||||
| 6 | Government National Mortgage Association Pool 20270915 |
7.000% | 9/15/27 | AAA | 7,257 | |||||||||||||||
| 281 | Government National Mortgage Association Pool 20280715 |
6.500% | 7/15/28 | AAA | 324,476 | |||||||||||||||
| 104 | Government National Mortgage Association Pool 20310820 |
6.500% | 8/20/31 | AAA | 118,971 | |||||||||||||||
| 142 | Government National Mortgage Association Pool 20311215 |
7.500% | 12/15/31 | AAA | 169,753 | |||||||||||||||
| 987 | Government National Mortgage Association Pool 20340915 |
6.000% | 9/15/34 | AAA | 1,129,030 | |||||||||||||||
| 1,020 | Government National Mortgage Association Pool 20410220 |
4.500% | 2/20/41 | AAA | 1,114,536 | |||||||||||||||
| 1,000 | Greenwich Capital Commercial Funding Corporation, Commercial Mortgage Pass Through Certificates, Series 2007-GG11 |
5.736% | 12/10/49 | AAA | 1,078,779 | |||||||||||||||
| 31 | GRMT Mortgage Loan Trust 2001-1A |
8.272% | 7/20/31 | A | 28,711 | |||||||||||||||
| 358 | Impac Secured Assets Corporation, Mortgage Pass-Through Certificates, Series 2000-3 |
8.000% | 10/25/30 | BBB | 329,584 | |||||||||||||||
| 911 | JPMorgan Chase Commercial Mortgage Securities Corporation, Commercial Mortgage Pass-Through Certificates, Series 2010-C2 A1 |
2.749% | 11/15/43 | AAA | 922,700 | |||||||||||||||
| 422 | Lehman Mortgage Trust, Mortgage Pass Through Certificates, Series 2008-6 |
5.870% | 7/25/47 | A | 391,623 | |||||||||||||||
| 650 | Morgan Stanley Capital I Trust, Commercial Mortgage Pass-Through Certificates, Series 2006-IQ12 |
5.332% | 12/15/43 | AAA | 726,538 | |||||||||||||||
| Nuveen Investments | 75 |
Portfolio of Investments (Unaudited)
Nuveen Intermediate Government Bond Fund (continued)
December 31, 2011
| Principal Amount (000) |
Description (1) | Coupon | Maturity | Ratings (2) | Value | |||||||||||||||
| ASSET-BACKED AND MORTGAGE-BACKED SECURITIES (continued) |
||||||||||||||||||||
| $ | 714 | Morgan Stanley Capital I Trust, Commercial Mortgage Pass-Through Certificates, Series 2011-C3 A1 |
2.178% | 7/15/49 | Aaa | $ | 720,317 | |||||||||||||
| 1,017 | National Credit Union Adminstration Guaranteed Structured Collateral Notes |
1.600% | 10/29/20 | AAA | 1,029,683 | |||||||||||||||
| 743 | Origen Manufactured Housing Contract Trust Collaterlized Notes Series 2005B |
5.990% | 1/15/37 | AA | 777,533 | |||||||||||||||
| 455 | Residential Accredit Loans Inc., Mortgage Asset-Backed Pass-Through Certificates, Series 2003-QS12 |
5.000% | 6/25/18 | CC | 362,296 | |||||||||||||||
| 377 | Sequoia Mortgage Trust, Mortgage Pass Through Certificates, Series 2011-1 |
4.125% | 2/25/41 | AAA | 375,043 | |||||||||||||||
| 212 | U.S. Small Business Administration Guaranteed Participating Securities Participation Certificates, Series 2005-10B |
4.940% | 8/10/15 | AAA | 224,588 | |||||||||||||||
| 1,000 | U.S. Small Business Administration Guaranteed Participating Securities Participation Certificates, Series 2008-10A |
5.902% | 2/10/18 | AAA | 1,134,124 | |||||||||||||||
| 960 | U.S. Small Business Administration Guaranteed Participating Securities Participation Certificates, Series 2010-P10A |
4.108% | 3/10/20 | AAA | 1,003,337 | |||||||||||||||
| 276 | U.S. Small Business Administration Guaranteed Participating Securities, Participation Certificates Series 2005-P10A |
4.638% | 2/10/15 | AAA | 294,414 | |||||||||||||||
| 751 | United States Department of Veterans, Affairs, Guaranteed REMIC |
3.750% | 2/15/35 | AAA | 785,364 | |||||||||||||||
| $ | 54,537 | Total Asset-Backed and Mortgage-Backed Securities (cost $55,069,953) |
56,940,600 | |||||||||||||||||
| Shares |
Description (1) | Value | ||||||||||||||||||
| INVESTMENTS PURCHASED WITH COLLATERAL FROM SECURITIES LENDING – 28.2% |
|
|||||||||||||||||||
| Money Market Funds – 28.2% |
||||||||||||||||||||
| 30,419,777 | Mount Vernon Securities Lending Prime Portfolio, 0.233% (4), (5) |
$ | 30,419,777 | |||||||||||||||||
| Total Investments Purchased with Collateral from Securities Lending (cost $30,419,777) |
|
30,419,777 | ||||||||||||||||||
| Principal Shares |
Description (1) | Coupon | Maturity | Ratings (2) | Value | |||||||||||||||
| SHORT-TERM INVESTMENTS – 3.0% |
||||||||||||||||||||
| Money Market Funds – 2.8% |
||||||||||||||||||||
| 3,007,668 | First American Treasury Obligations Fund, Class Z |
0.000% | (4) | N/A | N/A | $ | 3,007,668 | |||||||||||||
| U.S. Government and Agency Obligations – 0.2% |
||||||||||||||||||||
| $ | 10 | U.S. Treasury Bills, (6) |
0.008% | 2/16/12 | Aaa | 10,000 | ||||||||||||||
| 200 | U.S. Treasury Bills, (6) |
0.053% | 7/26/12 | Aaa | 199,937 | |||||||||||||||
| $ | 210 | Total U.S. Government and Agency Obligations |
209,937 | |||||||||||||||||
| Total Short-Term Investments (cost $3,217,633) |
3,217,605 | |||||||||||||||||||
| Total Investments (cost $136,616,727) – 130.0% |
140,388,721 | |||||||||||||||||||
| Other Assets Less Liabilities – (30.0)% (7) |
(32,363,830) | |||||||||||||||||||
| Net Assets – 100% |
$ | 108,024,891 | ||||||||||||||||||
| 76 | Nuveen Investments |
Investments in Derivatives at December 31, 2011:
Futures Contracts outstanding:
| Type | Contract Position |
Number of Contracts |
Contract Expiration |
Value (U.S. Dollars) |
Unrealized Appreciation (Depreciation) (U.S. Dollars) |
|||||||||||||||
| U.S. Treasury 2-Year Note |
Long | 68 | 3/12 | $ | 14,997,188 | $ | 8,343 | |||||||||||||
| U.S. Treasury 5-Year Note |
Long | 84 | 3/12 | 10,353,656 | 39,452 | |||||||||||||||
| U.S. Treasury 10-Year Note |
Long | 20 | 3/12 | 2,622,500 | 23,305 | |||||||||||||||
| U.S. Treasury Long Bond |
Long | 16 | 3/12 | 2,317,000 | 19,510 | |||||||||||||||
| $ | 90,610 | |||||||||||||||||||
| For Fund portfolio compliance purposes, the Fund’s industry classifications refer to any one or more of the industry sub-classifications used by one or more widely recognized market indexes or ratings group indexes, and/or as defined by Fund management. This definition may not apply for purposes of this report which may combine industry sub-classifications into sectors for reporting ease. |
| (1) | All Percentages shown in the Portfolio of Investments are based on net assets. |
| (2) | Ratings: Using the highest of Standard & Poor’s Group (“Standard & Poor’s”), Moody’s Investors Service, Inc. (“Moody’s”) or Fitch, Inc. (“Fitch”) rating. Ratings below BBB by Standard & Poor’s, Baa by Moody’s or BBB by Fitch are considered to be below investment grade. Holdings designated N/R are not rated by any of these national rating agencies. |
| (3) | Investment, or a portion of investment, is out on loan for securities lending. |
| (4) | The rate shown is the annualized seven-day effective yield as of December 31, 2011. |
| (5) | The Fund may loan securities representing up to one third of the fair value of its total assets (which includes collateral for securities on loan) to broker-dealers, banks, or other institutional borrowers of securities. The Fund maintains collateral equal to at least 102% of the fair value of the securities loaned. The adequacy of the collateral is monitored on a daily basis. The cash collateral received by the Fund is invested in this money market fund. |
| (6) | Investment, or portion of investment, segregated as collateral for investments in derivatives. Yield shown is effective yield as of December 31, 2011. |
| (7) | Other Assets Less Liabilities includes the Unrealized Appreciation (Depreciation) of derivative instruments as noted in Investments in Derivatives at December 31, 2011. |
| TBA | To be announced. Maturity date not known prior to settlement of this transaction. |
| WI/DD | Purchased on a when-issued or delayed delivery basis. |
| N/A | Not applicable. |
| N/R | Not Rated. |
See accompanying notes to financial statements.
| Nuveen Investments | 77 |
Portfolio of Investments (Unaudited)
Nuveen Intermediate Term Bond Fund
December 31, 2011
| Principal Amount (000) |
Description (1) | Coupon | Maturity | Ratings (2) | Value | |||||||||||||||
| CORPORATE BONDS – 47.4% |
||||||||||||||||||||
| Aerospace & Defense – 0.3% |
||||||||||||||||||||
| $ | 1,885 | Exelis, Inc., 144A |
5.550% | 10/01/21 | BBB+ | $ | 1,967,978 | |||||||||||||
| Airlines – 0.3% |
||||||||||||||||||||
| 1,920 | American Airlines Pass Through Trust 2011-2 |
8.625% | 10/15/21 | BBB– | 1,958,400 | |||||||||||||||
| Capital Markets – 3.6% |
||||||||||||||||||||
| 3,330 | Ameriprise Financial, Inc., (4) |
5.300% | 3/15/20 | A | 3,583,280 | |||||||||||||||
| 3,205 | Deutsche Bank London |
3.875% | 8/18/14 | Aa3 | 3,260,366 | |||||||||||||||
| 1,165 | Goldman Sachs Capital II |
5.793% | 6/01/43 | BBB+ | 716,475 | |||||||||||||||
| 3,845 | Goldman Sachs Group, Inc. |
6.150% | 4/01/18 | A1 | 3,968,382 | |||||||||||||||
| 3,125 | Goldman Sachs Group, Inc. |
6.000% | 6/15/20 | A1 | 3,201,131 | |||||||||||||||
| 1,605 | Goldman Sachs Group, Inc. |
5.250% | 7/27/21 | A1 | 1,565,742 | |||||||||||||||
| 2,250 | Morgan Stanley |
5.500% | 7/24/20 | A | 2,045,768 | |||||||||||||||
| 2,180 | Morgan Stanley |
5.750% | 1/25/21 | A | 2,033,517 | |||||||||||||||
| 3,520 | Morgan Stanley, (4) |
5.500% | 7/28/21 | A2 | 3,254,715 | |||||||||||||||
| 24,225 | Total Capital Markets |
23,629,376 | ||||||||||||||||||
| Chemicals – 0.8% |
||||||||||||||||||||
| 2,680 | Dow Chemical Company |
2.500% | 2/15/16 | BBB | 2,691,661 | |||||||||||||||
| 2,255 | Incitec Pivot Finance, 144A |
6.000% | 12/10/19 | BBB | 2,463,876 | |||||||||||||||
| 4,935 | Total Chemicals |
5,155,537 | ||||||||||||||||||
| Commercial Banks – 4.6% |
||||||||||||||||||||
| 3,000 | Australia and New Zealand Banking Group Limited, 144A |
2.400% | 11/23/16 | AAA | 2,971,671 | |||||||||||||||
| 1,245 | Banco Bradesco S.A. Grand Cayman, 144A |
4.125% | 5/16/16 | Baa1 | 1,255,583 | |||||||||||||||
| 1,910 | Bancolombia SA |
5.950% | 6/03/21 | Baa2 | 1,917,163 | |||||||||||||||
| 925 | BBVA Bancomer SA Texas, 144A |
4.500% | 3/10/16 | A1 | 906,500 | |||||||||||||||
| 2,340 | BNP Paribas |
3.250% | 3/11/15 | AA– | 2,211,852 | |||||||||||||||
| 3,245 | Comerica Bank |
5.750% | 11/21/16 | A2 | 3,556,400 | |||||||||||||||
| 1,000 | Lloyds TSB Bank |
4.375% | 1/12/15 | A1 | 962,656 | |||||||||||||||
| 2,500 | Lloyds TSB Bank, (4) |
4.875% | 1/21/16 | A1 | 2,436,460 | |||||||||||||||
| 1,830 | National Australia Bank, 144A |
3.000% | 7/27/16 | AA | 1,823,170 | |||||||||||||||
| 3,500 | Nordea Eiendomskreditt, 144A |
1.875% | 4/07/14 | Aaa | 3,503,164 | |||||||||||||||
| 1,000 | Royal Bank of Scotland Group PLC |
6.400% | 10/21/19 | A | 936,188 | |||||||||||||||
| 2,040 | Sovereign Bank |
8.750% | 5/30/18 | A | 2,274,578 | |||||||||||||||
| 2,200 | Swedbank Hypotek AB, 144A, (4) |
2.125% | 8/31/16 | AAA | 2,165,046 | |||||||||||||||
| 2,220 | Wachovia Capital Trust III |
5.570% | 3/29/49 | A | 1,859,250 | |||||||||||||||
| 1,450 | Wachovia Corporation, (4) |
5.750% | 6/15/17 | AA– | 1,638,258 | |||||||||||||||
| 30,405 | Total Commercial Banks |
30,417,939 | ||||||||||||||||||
| Commercial Services & Supplies – 0.6% |
||||||||||||||||||||
| 1,195 | Donnelley & Son Company |
7.625% | 6/15/20 | BBB | 1,117,325 | |||||||||||||||
| 2,705 | Waste Management Inc. |
4.600% | 3/01/21 | BBB | 2,931,244 | |||||||||||||||
| 3,900 | Total Commercial Services & Supplies |
4,048,569 | ||||||||||||||||||
| Communications Equipment – 0.5% |
||||||||||||||||||||
| 2,945 | Motorola, Inc. |
6.000% | 11/15/17 | BBB | 3,300,950 | |||||||||||||||
| 78 | Nuveen Investments |
| Principal Amount (000) |
Description (1) | Coupon | Maturity | Ratings (2) | Value | |||||||||||||||
| Consumer Finance – 1.8% |
||||||||||||||||||||
| $ | 2,405 | American Express Credit Corporation |
7.300% | 8/20/13 | A+ | $ | 2,610,048 | |||||||||||||
| 1,700 | American Express Credit Corporation, (4) |
2.800% | 9/19/16 | A+ | 1,708,330 | |||||||||||||||
| 4,210 | Capital One Bank |
8.800% | 7/15/19 | BBB+ | 4,816,198 | |||||||||||||||
| 2,245 | Discover Financial Services |
10.250% | 7/15/19 | BBB | 2,736,561 | |||||||||||||||
| 10,560 | Total Consumer Finance |
11,871,137 | ||||||||||||||||||
| Diversified Financial Services – 6.2% |
||||||||||||||||||||
| 3,270 | Bank of America Corporation |
5.875% | 1/05/21 | A | 3,112,474 | |||||||||||||||
| 1,275 | Bank of America Corporation, (4) |
3.750% | 7/12/16 | A | 1,180,547 | |||||||||||||||
| 2,500 | Bank of America Corporation |
5.750% | 12/01/17 | A | 2,361,303 | |||||||||||||||
| 2,000 | Citigroup Inc. |
4.587% | 12/15/15 | A | 2,012,794 | |||||||||||||||
| 2,090 | Citigroup Inc. |
6.125% | 11/21/17 | A | 2,230,513 | |||||||||||||||
| 2,000 | Citigroup Inc. |
4.500% | 1/14/22 | A– | 1,924,046 | |||||||||||||||
| 2,395 | Countrywide Financial Corporation, 144A, (4) |
6.250% | 5/15/16 | A– | 2,256,411 | |||||||||||||||
| 4,770 | General Electric Capital Corporation |
2.100% | 1/07/14 | AA+ | 4,841,407 | |||||||||||||||
| 2,500 | General Electric Capital Corporation |
3.750% | 11/14/14 | AA+ | 2,635,170 | |||||||||||||||
| 3,955 | General Electric Capital Corporation |
5.625% | 9/15/17 | AA+ | 4,377,295 | |||||||||||||||
| 1,530 | General Electric Capital Corporation, (4) |
5.300% | 2/11/21 | AA | 1,635,497 | |||||||||||||||
| 1,470 | ING Bank NV, 144A |
4.000% | 3/15/16 | Aa3 | 1,420,377 | |||||||||||||||
| 3,290 | JPMorgan Chase & Company, (4) |
5.150% | 10/01/15 | A+ | 3,491,940 | |||||||||||||||
| 7,585 | JPMorgan Chase & Company |
4.250% | 10/15/20 | AA– | 7,638,269 | |||||||||||||||
| 40,630 | Total Diversified Financial Services |
41,118,043 | ||||||||||||||||||
| Diversified Telecommunication Services – 1.8% |
||||||||||||||||||||
| 1,170 | Embarq Corporation |
7.082% | 6/01/16 | BBB– | 1,268,217 | |||||||||||||||
| 2,570 | Telecom Italia Capital S.p.A, (4) |
7.175% | 6/18/19 | BBB | 2,408,368 | |||||||||||||||
| 3,300 | Telefonica Emisiones SAU |
5.462% | 2/16/21 | BBB+ | 3,149,078 | |||||||||||||||
| 3,755 | Verizon Communications |
8.750% | 11/01/18 | A | 5,071,976 | |||||||||||||||
| 10,795 | Total Diversified Telecommunication Services |
11,897,639 | ||||||||||||||||||
| Electric Utilities – 0.7% |
||||||||||||||||||||
| 2,220 | FirstEnergy Solutions Corporation, (4) |
6.050% | 8/15/21 | BBB | 2,463,523 | |||||||||||||||
| 2,100 | Ohio Power Company, (4) |
6.000% | 6/01/16 | A– | 2,425,059 | |||||||||||||||
| 4,320 | Total Electric Utilities |
4,888,582 | ||||||||||||||||||
| Electronic Equipment & Instruments – 0.2% |
||||||||||||||||||||
| 1,205 | Ingram Micro Inc. |
5.250% | 9/01/17 | BBB– | 1,241,256 | |||||||||||||||
| Energy Equipment & Services – 1.3% |
||||||||||||||||||||
| 2,765 | Ensco PLC |
4.700% | 3/15/21 | BBB+ | 2,879,488 | |||||||||||||||
| 1,735 | Nabors Industries Inc., (4) |
5.000% | 9/15/20 | BBB | 1,768,834 | |||||||||||||||
| 3,810 | Weatherford International Limited Bermuda, (4) |
5.125% | 9/15/20 | BBB | 3,959,268 | |||||||||||||||
| 8,310 | Total Energy Equipment & Services |
8,607,590 | ||||||||||||||||||
| Food Products – 1.5% |
||||||||||||||||||||
| 1,595 | ConAgra Foods, Inc. |
5.875% | 4/15/14 | BBB | 1,750,379 | |||||||||||||||
| 1,840 | General Mills, Inc. |
3.150% | 12/15/21 | BBB+ | 1,864,143 | |||||||||||||||
| 2,620 | Kellogg Company |
4.450% | 5/30/16 | A3 | 2,908,297 | |||||||||||||||
| 1,225 | Kraft Foods Inc. |
6.500% | 8/11/17 | Baa2 | 1,457,218 | |||||||||||||||
| 1,785 | Kraft Foods Inc. |
5.375% | 2/10/20 | Baa2 | 2,059,624 | |||||||||||||||
| 9,065 | Total Food Products |
10,039,661 | ||||||||||||||||||
| Nuveen Investments | 79 |
Portfolio of Investments (Unaudited)
Nuveen Intermediate Term Bond Fund (continued)
December 31, 2011
| Principal Amount (000) |
Description (1) | Coupon | Maturity | Ratings (2) | Value | |||||||||||||||
| Health Care Providers & Services – 0.5% |
||||||||||||||||||||
| $ | 2,120 | Express Scripts Inc., (4) |
3.125% | 5/15/16 | BBB+ | $ | 2,131,751 | |||||||||||||
| 1,295 | UnitedHealth Group Incorporated |
3.875% | 10/15/20 | A– | 1,375,374 | |||||||||||||||
| 3,415 | Total Health Care Providers & Services |
3,507,125 | ||||||||||||||||||
| Independent Power Producers & Energy Traders – 0.4% |
||||||||||||||||||||
| 2,275 | Constellation Energy Group |
5.150% | 12/01/20 | BBB– | 2,465,281 | |||||||||||||||
| Industrial Conglomerates – 0.4% |
||||||||||||||||||||
| 2,405 | Tyco International Group |
3.375% | 10/15/15 | A– | 2,516,905 | |||||||||||||||
| Insurance – 5.5% |
||||||||||||||||||||
| 3,000 | AFLAC Insurance |
8.500% | 5/15/19 | A– | 3,676,650 | |||||||||||||||
| 2,860 | Allied World Assurance Holdings Limited |
7.500% | 8/01/16 | BBB+ | 3,227,693 | |||||||||||||||
| 3,000 | American International Group, Inc., (4) |
8.250% | 8/15/18 | A– | 3,175,503 | |||||||||||||||
| 4,000 | Berkshire Hathaway Inc. |
2.200% | 8/15/16 | AA+ | 4,117,476 | |||||||||||||||
| 1,650 | Catlin Insurance Company Limited |
7.249% | 7/29/49 | BBB+ | 1,402,500 | |||||||||||||||
| 3,055 | Hartford Financial Services Group Inc. |
6.000% | 1/15/19 | BBB | 3,135,310 | |||||||||||||||
| 1,985 | Liberty Mutual Group Inc., 144A |
5.000% | 6/01/21 | Baa2 | 1,945,113 | |||||||||||||||
| 2,720 | Lincoln National Corporation |
8.750% | 7/01/19 | A– | 3,308,496 | |||||||||||||||
| 3,730 | Met Life Global Funding I |
5.125% | 4/10/13 | AA– | 3,896,481 | |||||||||||||||
| 2,205 | Pacific Life Global Funding |
5.150% | 4/15/13 | A+ | 2,303,169 | |||||||||||||||
| 965 | Pacific LifeCorp. |
6.000% | 2/10/20 | BBB+ | 1,027,053 | |||||||||||||||
| 3,235 | Prudential Financial Inc. |
5.100% | 9/20/14 | A | 3,479,424 | |||||||||||||||
| 1,530 | ZFS Finance USA Trust V |
6.500% | 5/09/37 | A | 1,377,000 | |||||||||||||||
| 33,935 | Total Insurance |
36,071,868 | ||||||||||||||||||
| Life Sciences, Tools & Services – 0.2% |
||||||||||||||||||||
| 1,265 | Thermo Fischer Scientific Inc. |
3.200% | 5/01/15 | A | 1,337,099 | |||||||||||||||
| Machinery – 0.4% |
||||||||||||||||||||
| 2,295 | John Deere Capital Corporation |
2.800% | 9/18/17 | A | 2,407,673 | |||||||||||||||
| Media – 4.6% |
||||||||||||||||||||
| 1,845 | British Sky Broadcasting Group PLC |
6.100% | 2/15/18 | BBB+ | 2,066,690 | |||||||||||||||
| 1,625 | CBS Corporation, (4) |
5.750% | 4/15/20 | BBB | 1,826,957 | |||||||||||||||
| 1,930 | Comcast Corporation, (4) |
5.150% | 3/01/20 | BBB+ | 2,194,858 | |||||||||||||||
| 2,850 | DIRECTV Holdings LLC |
3.550% | 3/15/15 | BBB | 2,966,480 | |||||||||||||||
| 2,800 | DIRECTV Holdings LLC |
5.200% | 3/15/20 | BBB | 3,017,879 | |||||||||||||||
| 1,460 | Discovery Communications Inc., (4) |
5.050% | 6/01/20 | BBB | 1,600,934 | |||||||||||||||
| 3,895 | NBC Universal Media LLC |
5.150% | 4/30/20 | BBB+ | 4,336,596 | |||||||||||||||
| 2,000 | News America Holdings Inc. |
5.650% | 8/15/20 | BBB+ | 2,233,272 | |||||||||||||||
| 2,100 | News America Inc., (4) |
4.500% | 2/15/21 | BBB+ | 2,201,869 | |||||||||||||||
| 2,000 | Time Warner Cable Inc. |
8.250% | 2/14/14 | BBB | 2,254,312 | |||||||||||||||
| 2,025 | Time Warner Cable Inc., (4) |
6.750% | 7/01/18 | BBB | 2,405,123 | |||||||||||||||
| 3,000 | Time Warner Cable Inc. |
4.700% | 1/15/21 | BBB | 3,230,160 | |||||||||||||||
| 27,530 | Total Media |
30,335,130 | ||||||||||||||||||
| Metals & Mining – 2.7% |
||||||||||||||||||||
| 3,835 | Alcoa Inc., (4) |
5.400% | 4/15/21 | BBB– | 3,842,152 | |||||||||||||||
| 3,260 | ArcelorMittal, (4) |
5.250% | 8/05/20 | BBB | 2,960,282 | |||||||||||||||
| 3,000 | BHP Billiton Finance Limited, (4) |
3.250% | 11/21/21 | A+ | 3,088,800 | |||||||||||||||
| 80 | Nuveen Investments |
| Principal Amount (000) |
Description (1) | Coupon | Maturity | Ratings (2) | Value | |||||||||||||||
| Metals & Mining (continued) |
||||||||||||||||||||
| $ | 1,970 | Rio Tinto Finance USA Limited, (4) |
3.500% | 11/02/20 | A– | $ | 2,013,547 | |||||||||||||
| 2,000 | Southern Copper Corporation, (4) |
5.375% | 4/16/20 | BBB | 2,109,422 | |||||||||||||||
| 1,760 | Teck Resources Limited, (4) |
4.750% | 1/15/22 | BBB | 1,891,810 | |||||||||||||||
| 1,940 | Vale Overseas Limited, (4) |
4.625% | 9/15/20 | A– | 2,006,162 | |||||||||||||||
| 17,765 | Total Metals & Mining |
17,912,175 | ||||||||||||||||||
| Oil, Gas & Consumable Fuels – 3.0% |
||||||||||||||||||||
| 2,745 | Anadarko Petroleum Corporation |
6.375% | 9/15/17 | BBB– | 3,181,823 | |||||||||||||||
| 2,500 | EOG Resources Inc., (4) |
4.100% | 2/01/21 | A– | 2,722,613 | |||||||||||||||
| 2,750 | Hess Corporation |
8.125% | 2/15/19 | BBB | 3,530,073 | |||||||||||||||
| 1,460 | Husky Energy Inc. |
6.200% | 9/15/17 | BBB+ | 1,708,089 | |||||||||||||||
| 1,685 | Marathon Petroleum Corporation |
5.125% | 3/01/21 | BBB | 1,760,271 | |||||||||||||||
| 1,000 | Petroleos Mexicanos, (4) |
4.875% | 3/15/15 | Baa1 | 1,063,750 | |||||||||||||||
| 1,275 | SunCor Energy Inc., (4) |
6.100% | 6/01/18 | BBB+ | 1,509,299 | |||||||||||||||
| 2,990 | Transcapitalinvest LP |
5.670% | 3/05/14 | Baa1 | 3,102,125 | |||||||||||||||
| 1,315 | Valero Energy Corporation |
4.500% | 2/01/15 | BBB | 1,406,943 | |||||||||||||||
| 17,720 | Total Oil, Gas & Consumable Fuels |
19,984,986 | ||||||||||||||||||
| Paper & Forest Products – 0.3% |
||||||||||||||||||||
| 2,000 | Celulosa Arauco Y Constitucion, (4) |
5.625% | 4/20/15 | BBB+ | 2,167,476 | |||||||||||||||
| Pharmaceuticals – 0.9% |
||||||||||||||||||||
| 3,330 | Merck & Company Inc. |
2.250% | 1/15/16 | AA | 3,455,424 | |||||||||||||||
| 2,100 | Roche Holdings Inc. |
6.000% | 3/01/19 | AA– | 2,552,367 | |||||||||||||||
| 5,430 | Total Pharmaceuticals |
6,007,791 | ||||||||||||||||||
| Real Estate Investment Trust – 0.8% |
||||||||||||||||||||
| 1,630 | Health Care REIT Inc. |
3.625% | 3/15/16 | BBB | 1,604,176 | |||||||||||||||
| 1,885 | Prologis Inc. |
6.875% | 3/15/20 | Baa2 | 2,092,963 | |||||||||||||||
| 1,730 | Vornado Realty LP |
4.250% | 4/01/15 | BBB | 1,790,408 | |||||||||||||||
| 5,245 | Total Real Estate Investment Trust |
5,487,547 | ||||||||||||||||||
| Road & Rail – 0.6% |
||||||||||||||||||||
| 3,320 | Union Pacific Corporation |
5.750% | 11/15/17 | BBB+ | 3,927,274 | |||||||||||||||
| Semiconductors & Equipment – 0.7% |
||||||||||||||||||||
| 1,855 | Applied Materials Inc., (4) |
4.300% | 6/15/21 | A– | 1,969,940 | |||||||||||||||
| 2,190 | Intel Corporation |
3.300% | 10/01/21 | A+ | 2,307,009 | |||||||||||||||
| 4,045 | Total Semiconductors & Equipment |
4,276,949 | ||||||||||||||||||
| Thrifts & Mortgage Finance – 0.3% |
||||||||||||||||||||
| 1,780 | WEA Finance LLC, 144A, (4) |
4.625% | 5/10/21 | A2 | 1,747,059 | |||||||||||||||
| Tobacco – 1.1% |
||||||||||||||||||||
| 1,300 | Altria Group Inc. |
9.700% | 11/10/18 | BBB+ | 1,749,036 | |||||||||||||||
| 1,365 | Altria Group Inc., (4) |
4.750% | 5/05/21 | BBB+ | 1,502,916 | |||||||||||||||
| 1,815 | Lorillard Tobacco |
8.125% | 6/23/19 | Baa2 | 2,162,023 | |||||||||||||||
| 1,480 | Reynolds American Inc. |
6.750% | 6/15/17 | BBB– | 1,682,208 | |||||||||||||||
| 5,960 | Total Tobacco |
7,096,183 | ||||||||||||||||||
| Transportation Infrastructure – 0.4% |
||||||||||||||||||||
| 2,450 | Asciano Finance Limited, 144A |
5.000% | 4/07/18 | Baa2 | 2,456,730 | |||||||||||||||
| Wireless Telecommunication Services – 0.4% |
||||||||||||||||||||
| 2,405 | American Tower Company |
5.050% | 9/01/20 | BBB– | 2,409,352 | |||||||||||||||
| $ | 296,340 | Total Corporate Bonds (cost $298,254,503) |
312,257,260 | |||||||||||||||||
| Nuveen Investments | 81 |
Portfolio of Investments (Unaudited)
Nuveen Intermediate Term Bond Fund (continued)
December 31, 2011
| Principal Amount (000) |
Description (1) | Optional Call Provisions (3) |
Ratings (2) | Value | ||||||||||||||||
| MUNICIPAL BONDS – 1.0% |
||||||||||||||||||||
| Illinois – 0.6% |
||||||||||||||||||||
| $ | 3,735 | Illinois State, General Obligation Bonds, Taxable Series 2011, 5.877%, 3/01/19 |
No Opt. Call | A+ | $ | 4,025,583 | ||||||||||||||
| Nevada – 0.4% |
||||||||||||||||||||
| 2,500 | Las Vegas Valley Water District, Nevada, General Obligation Bonds, Refunding Taxable Series 2011B, 3.176%, 6/01/17 |
No Opt. Call | AA+ | 2,534,700 | ||||||||||||||||
| $ | 6,235 | Total Municipal Bonds (cost $6,235,000) |
6,560,283 | |||||||||||||||||
| Principal Amount (000) |
Description (1) | Coupon | Maturity | Ratings (2) | Value | |||||||||||||||
| U.S. GOVERNMENT AND AGENCY OBLIGATIONS – 13.6% |
||||||||||||||||||||
| $ | 3,160 | Fannie Mae Notes, (4) |
1.250% | 9/28/16 | AAA | $ | 3,172,823 | |||||||||||||
| 6,150 | Fannie Mae Notes, (4) |
2.250% | 3/15/16 | AAA | 6,446,492 | |||||||||||||||
| 10,000 | Fannie Mae Notes |
0.750% | 12/19/14 | AAA | 10,030,830 | |||||||||||||||
| 4,595 | Federal National Mortgage Association, (4) |
2.375% | 7/28/15 | AAA | 4,848,051 | |||||||||||||||
| 3,580 | Federal National Mortgage Association, (4) |
1.000% | 9/23/13 | AAA | 3,617,035 | |||||||||||||||
| 2,055 | Freddie Mac Reference Notes, (4) |
5.000% | 12/14/18 | Aa2 | 2,297,307 | |||||||||||||||
| 6,655 | Freddie Mac Reference Notes, (4) |
2.000% | 8/25/16 | AAA | 6,920,308 | |||||||||||||||
| 7,345 | Freddie Mac Reference Notes, (4) |
1.375% | 2/25/14 | AAA | 7,463,783 | |||||||||||||||
| 575 | Private Export Funding |
3.050% | 10/15/14 | Aaa | 610,917 | |||||||||||||||
| 1,275 | U.S. Treasury Bonds, (4) |
4.750% | 2/15/41 | AAA | 1,757,109 | |||||||||||||||
| 8,615 | U.S. Treasury Notes, (4) |
2.000% | 11/15/21 | AAA | 8,713,263 | |||||||||||||||
| 5,105 | U.S. Treasury Notes, (4) |
3.125% | 5/15/21 | AAA | 5,700,049 | |||||||||||||||
| 6,065 | U.S. Treasury Notes, (4) |
2.625% | 11/15/20 | AAA | 6,529,349 | |||||||||||||||
| 12,685 | U.S. Treasury Notes, (4) |
0.875% | 11/30/16 | AAA | 12,723,651 | |||||||||||||||
| 1,215 | U.S. Treasury Notes, (4) |
3.250% | 7/31/16 | AAA | 1,351,023 | |||||||||||||||
| 2,670 | U.S. Treasury Notes, (4) |
1.500% | 6/30/16 | AAA | 2,761,156 | |||||||||||||||
| 2,160 | U.S. Treasury Notes, (4) |
1.250% | 8/31/15 | AAA | 2,217,374 | |||||||||||||||
| 1,375 | U.S. Treasury Notes, (4) |
2.375% | 2/28/15 | AAA | 1,458,897 | |||||||||||||||
| 1,085 | U.S. Treasury Notes, (4) |
1.375% | 1/15/13 | AAA | 1,098,478 | |||||||||||||||
| $ | 86,365 | Total U.S. Government and Agency Obligations (cost $86,878,874) |
89,717,895 | |||||||||||||||||
| Principal Amount (000) |
Description (1) | Coupon | Maturity | Ratings (2) | Value | |||||||||||||||
| ASSET-BACKED AND MORTGAGE-BACKED SECURITIES – 34.1% |
||||||||||||||||||||
| $ | 2,093 | 321 Henderson Receivables LLC, Series 2010-3A |
3.820% | 12/15/48 | Aaa | $ | 2,061,487 | |||||||||||||
| 4,041 | American Homes Mortgage Advance Trust, Series 2011-SART-1 A2 |
3.370% | 5/10/43 | AAA | 4,024,836 | |||||||||||||||
| 4,415 | AmeriCold LLC Trust, Series 2010 |
2.500% | 1/14/29 | AAA | 4,320,020 | |||||||||||||||
| 13 | Amresco Residential Securities Corporation, Mortgage Loan Pass-Through Certificates, Series 1997-3 |
6.960% | 3/25/27 | AAA | 13,055 | |||||||||||||||
| 3,570 | Arkle Master Issuer PLC, Mortgage Asset Backed Instrument, Series 2010-1A |
1.616% | 5/17/60 | AAA | 3,555,167 | |||||||||||||||
| 226 | Bear Stearns Commercial Mortgage Securities Trust, Commercial Mortgage Pass-Through Certificates, Series 2007-PW15 |
5.205% | 2/11/44 | AAA | 225,559 | |||||||||||||||
| 4,030 | Cabela’s Master Credit Card Trust, Series 2010-1A |
1.728% | 1/16/18 | AAA | 4,156,475 | |||||||||||||||
| 4,340 | Cabela’s Master Credit Card Trust, Series 2010-2A |
2.290% | 9/17/18 | AAA | 4,470,859 | |||||||||||||||
| 82 | Nuveen Investments |
| Principal Amount (000) |
Description (1) | Coupon | Maturity | Ratings (2) | Value | |||||||||||||||
| ASSET-BACKED AND MORTGAGE-BACKED SECURITIES (continued) |
||||||||||||||||||||
| $ | 4,251 | CenterPoint Energy Transition Bond Company III, LLC, Senior Secured Transition Bonds, Series 2008 |
4.192% | 2/01/20 | AAA | $ | 4,573,956 | |||||||||||||
| 2,317 | Citigroup Commercial Mortgage Securities Trust, Commercial Mortgage Pass-Through Certificates, Series 2007-CD4 |
5.205% | 12/11/49 | AAA | 2,345,755 | |||||||||||||||
| 2,430 | Commercial Mortgage Pass-Through Certificates, Series 2006-CN2A |
5.449% | 2/05/19 | AAA | 2,359,734 | |||||||||||||||
| 7 | ContiMortgage Home Equity Loan Trust, Series 1997-2 |
7.090% | 4/15/28 | AAA | 6,524 | |||||||||||||||
| 3,530 | Discover Card Master Trust I 2007-A |
5.650% | 3/16/20 | AAA | 4,223,821 | |||||||||||||||
| 1,212 | DT Auto Owner Trust 2011-2A |
0.960% | 1/15/14 | AAA | 1,210,653 | |||||||||||||||
| 1,950 | Entergy Louisiana Investment Recovery Funding LLC, Series 2011-A |
2.040% | 9/01/23 | AAA | 1,955,245 | |||||||||||||||
| 7,149 | Extended Stay America Trust 2010-EHSA |
2.951% | 11/05/27 | AAA | 7,162,218 | |||||||||||||||
| 2,600 | Fannie Mae Mortgage Pool 20150101, (4) |
3.030% | 1/01/15 | AAA | 2,717,008 | |||||||||||||||
| 3,867 | Fannie Mae Mortgage Pool 20331001 |
2.622% | 10/01/33 | AAA | 4,104,287 | |||||||||||||||
| 3,820 | Fannie Mae Mortgage Pool 20350301, (4) |
2.540% | 3/01/35 | AAA | 4,022,386 | |||||||||||||||
| 583 | Fannie Mae Mortgage Pool 20351201 |
2.068% | 12/01/35 | AAA | 601,813 | |||||||||||||||
| 1,281 | Fannie Mae Mortgage Pool 20360701 |
2.745% | 7/01/36 | AAA | 1,359,468 | |||||||||||||||
| 2,732 | Fannie Mae Mortgage Pool 20360701 |
2.426% | 7/01/36 | AAA | 2,878,608 | |||||||||||||||
| 1,132 | Fannie Mae Mortgage Pool 20360901 |
2.548% | 9/01/36 | AAA | 1,190,882 | |||||||||||||||
| 2,386 | Fannie Mae Mortgage Pool 20380301 |
2.388% | 3/01/38 | AAA | 2,511,901 | |||||||||||||||
| 924 | Fannie Mae Mortgage Pool 20330901 |
2.415% | 9/01/33 | AAA | 978,272 | |||||||||||||||
| 4,950 | Fannie Mae Multifamily REMIC Trust 2010-M6, Guaranteed Pass Through Certificates 20200925 |
2.210% | 9/25/20 | AAA | 5,038,917 | |||||||||||||||
| 2,610 | Fannie Mae Real Estate Mortgage Investment Conduit, Pass Through Certificates 20230625 |
0.694% | 6/25/23 | AAA | 2,615,340 | |||||||||||||||
| 1,752 | Fannie Mae Real Estate Mortgage Investment Conduit, Pass Through Certificates 20171025 |
3.900% | 10/25/17 | AAA | 1,776,658 | |||||||||||||||
| 9 | Fannie Mae Real Estate Mortgage Investment Conduit, Pass Through Certificates 20200725 |
6.500% | 7/25/20 | AAA | 10,364 | |||||||||||||||
| 5,586 | Fannie Mae REMIC Pass-Through Certificates 20190925 |
3.305% | 6/25/19 | AAA | 5,928,349 | |||||||||||||||
| 3,356 | Fannie Mae REMIC Pass-Through Certificates 20190725 |
3.400% | 7/25/19 | AAA | 3,567,394 | |||||||||||||||
| 3,306 | FDIC Structures Sale Guaranteed Notes, Series 2010-S1 |
3.250% | 4/25/38 | AAA | 3,435,207 | |||||||||||||||
| 560 | Federal Home Loan Bank Mortgages 20280101 |
2.516% | 1/01/28 | AAA | 594,167 | |||||||||||||||
| 630 | Federal Home Loan Bank Mortgages 20290401 |
2.334% | 4/01/29 | AAA | 665,380 | |||||||||||||||
| 1,938 | Federal Home Loan Bank Mortgages 20301001 |
2.338% | 10/01/30 | AAA | 2,041,080 | |||||||||||||||
| 582 | Federal Home Loan Bank Mortgages 20310501 |
2.398% | 5/01/31 | AAA | 614,780 | |||||||||||||||
| 1,565 | Federal Home Loan Bank Mortgages 20330901 |
2.414% | 9/01/33 | AAA | 1,655,123 | |||||||||||||||
| 2,861 | Federal Home Loan Bank Mortgages 20380101 |
2.482% | 1/01/38 | AAA | 3,016,774 | |||||||||||||||
| 3,682 | Federal Home Loan Mortgage Corporation, REMIC SERIES 2750 20190215 |
5.000% | 2/15/19 | AAA | 3,935,443 | |||||||||||||||
| 29 | Federal Home Loan Mortgage Corporation, REMIC 20220515 |
6.000% | 5/15/22 | AAA | 31,272 | |||||||||||||||
| 1,855 | Federal Home Loan Mortgage Corporation, REMIC SERIES 2863 20190215 |
0.778% | 2/15/19 | AAA | 1,859,932 | |||||||||||||||
| 2,354 | Federal Home Loan Mortgage Corporation, REMIC 2SERIES 2755 0320415 |
0.728% | 4/15/32 | AAA | 2,354,593 | |||||||||||||||
| 2,329 | Federal Home Loan Mortgage Corporation, REMIC SERIES 3555 20141215 |
4.000% | 12/15/14 | AAA | 2,372,625 | |||||||||||||||
| 1,650 | Federal Home Loan Mortgage Corporation, REMIC SERIES 3555 20141215 |
4.000% | 12/15/14 | AAA | 1,680,609 | |||||||||||||||
| 1,245 | Federal Home Loan Mortgage Corporation, REMIC SERIES 2795 20170715 |
4.500% | 7/15/17 | AAA | 1,251,962 | |||||||||||||||
| 10 | Federal Home Loan Mortgage Corporation, REMIC |
7.500% | 11/15/21 | AAA | 11,768 | |||||||||||||||
| 2,568 | Fieldstone Mortgage Investment Trust, Mortgage Backed Notes, Series 2005-1 |
1.374% | 3/25/35 | A+ | 2,310,014 | |||||||||||||||
| Nuveen Investments | 83 |
Portfolio of Investments (Unaudited)
Nuveen Intermediate Term Bond Fund (continued)
December 31, 2011
| Principal Amount (000) |
Description (1) | Coupon | Maturity | Ratings (2) | Value | |||||||||||||||
| ASSET-BACKED AND MORTGAGE-BACKED SECURITIES (continued) |
||||||||||||||||||||
| $ | 2,835 | Fosse Master Issuer PLC, Residential Mortgage Pool, Series 2011-1A |
1.805% | 10/18/54 | AAA | $ | 2,824,196 | |||||||||||||
| 4,025 | Freddie Mac Structured Pass-Through Certificates 2002 Series T-47 |
4.159% | 8/27/12 | AAA | 4,056,561 | |||||||||||||||
| 13 | GMAC Mortgage Corporation, Mortgage Pass-Through Certificates, Series 2010-1 |
4.250% | 7/25/40 | Aa2 | 13,356 | |||||||||||||||
| 2,093 | Goldman Sachs Mortgage Securities Corporation II, Commercial Mortgage Pass-Through Certificates, Series 2006-GG6 |
5.506% | 4/10/38 | AAA | 2,106,987 | |||||||||||||||
| 5,875 | Goldman Sachs Mortgage Securities Corporation II, Commercial Mortgage Pass-Through Certificates, Series 2010-C1 |
3.679% | 8/10/43 | Aaa | 6,139,136 | |||||||||||||||
| 345 | Green Tree Financial Manufactured Housing Loans, Series 2008-MH1 |
7.000% | 4/25/38 | AAA | 348,411 | |||||||||||||||
| 41 | Green Tree Financial Corporation, Manufactured Housing Contract Pass Through Certificates, Series 1996-9 |
7.200% | 1/15/28 | AAA | 42,303 | |||||||||||||||
| 5,000 | Hertz Vehicle Financing LLC Series 2009 |
4.260% | 3/25/14 | Aaa | 5,118,411 | |||||||||||||||
| 4,568 | JP Morgan Chase Commercial Mortgage Securities Corporation, Commercial Mortgage Pass-Through Certificates, Series 2010-C1 |
3.853% | 6/15/43 | AAA | 4,776,990 | |||||||||||||||
| 3,790 | JP Morgan Chase Commercial Mortgage Securities Corporation, Commercial Mortgage Pass-Through Certificates, Series 2010-C2 A1 |
2.749% | 11/15/43 | AAA | 3,837,487 | |||||||||||||||
| 3,685 | JP Morgan Chase Commercial Mortgage Trust, Commercial Mortage Pass Through Certificates, Series 2011-C4 |
4.106% | 7/15/46 | AAA | 3,889,149 | |||||||||||||||
| 2,572 | Mortgage Equity Conversion Asset Trust 2010-1A |
4.000% | 7/25/60 | AA | 2,570,484 | |||||||||||||||
| 4,631 | National Credit Union Administration Guaranteed Structured Collateral Notes |
1.600% | 10/29/20 | AAA | 4,690,276 | |||||||||||||||
| 5,791 | National Credit Union Guaranteed Notes, Series 2010-R2 1A |
0.644% | 11/06/17 | Aaa | 5,791,539 | |||||||||||||||
| 5,515 | National Credit Union Guaranteed Notes, Series 2010-R3 2A |
0.834% | 12/08/20 | AAA | 5,537,050 | |||||||||||||||
| 3,200 | OBP Depositor LLC Trust, Commercial Mortgage Pass Through Certificates, Series 2010-OBP |
4.646% | 7/15/45 | AAA | 3,577,341 | |||||||||||||||
| 1,960 | Ocwen Advance Receivables Backed Notes, Series 2009-3A |
4.140% | 7/15/23 | AAA | 1,962,450 | |||||||||||||||
| 354 | RBSSP Resecuritization Trust 2009-11 |
2.044% | 12/26/37 | Aa3 | 354,513 | |||||||||||||||
| 1,484 | RBSSP Resecuritization Trust 2009-13 |
0.394% | 11/26/36 | A | 1,470,556 | |||||||||||||||
| 347 | RBSSP Resecuritization Trust 2009-8 |
0.434% | 3/26/37 | Aaa | 341,121 | |||||||||||||||
| 2,087 | RBSSP Resecuritization Trust 2010-10 |
0.424% | 9/26/36 | Aaa | 1,845,738 | |||||||||||||||
| 3,578 | RBSSP Resecuritization Trust 2010-4 |
0.404% | 3/26/36 | Aaa | 3,277,984 | |||||||||||||||
| 2,089 | RBSSP Resecuritization Trust 2010-8 |
0.624% | 7/26/36 | Aaa | 1,956,113 | |||||||||||||||
| 2,590 | Renaissance Home Equity Loan Trust I, Home Equity Loan Asset-Backed Notes, Series 2005-3 |
5.140% | 11/25/35 | AA+ | 1,954,575 | |||||||||||||||
| 1,373 | Santander Drive Auto Receivables Trust, Series 2010-1 |
1.360% | 3/15/13 | AAA | 1,374,069 | |||||||||||||||
| 2,465 | Sequoia Mortgage Trust, Mortgage Pass Through Certificates, Series 2011-1 |
4.125% | 2/25/41 | AAA | 2,452,207 | |||||||||||||||
| 6,215 | SMART Trust, Asset Backed Securities, Series 2011-1USA |
1.128% | 10/14/14 | AAA | 6,203,734 | |||||||||||||||
| 221 | Structured Adjustable Rate Mortgage Loan Trust, Mortgage Pass-Through Certificates, Series 2004-11 |
2.610% | 8/25/34 | Baa2 | 190,295 | |||||||||||||||
| 1,692 | U.S. Small Business Administration Guaranteed Participating Securities Participation Certificates, Series 2006-10A |
5.408% | 2/10/16 | AAA | 1,838,100 | |||||||||||||||
| 5,271 | U.S. Small Business Administration Guaranteed Participating Securities, Participation Certificates, Series 2010-P10B |
3.215% | 9/10/20 | AAA | 5,395,791 | |||||||||||||||
| 4,824 | United States Department of Veterans, Affairs, Guaranteed REMIC Pass-Through Certificates, Vendee Mortgage Trust, Series 2011-1 |
3.750% | 2/15/35 | AAA | 5,034,392 | |||||||||||||||
| 1,077 | Vericrest Opportunity Loan Transferee, Series 2011-NL2A |
5.682% | 6/25/51 | AAA | 1,075,698 | |||||||||||||||
| 6,000 | Vornado DP LLC Commercial Mortgage Credit Tenant Lease Series 2010-VNO |
4.004% | 9/13/28 | AAA | 6,424,116 | |||||||||||||||
| 5,940 | Wachovia Bank Commercial Mortgage Trust, Commercial Mortgage Pass-Through Certificates, Series 2007-C30 |
5.246% | 12/15/43 | AAA | 6,003,261 | |||||||||||||||
| 84 | Nuveen Investments |
| Principal Amount (000) |
Description (1) | Coupon | Maturity | Ratings (2) | Value | |||||||||||||||
| ASSET-BACKED AND MORTGAGE-BACKED SECURITIES (continued) |
||||||||||||||||||||
| $ | 1,839 | Wachovia Bank Commercial Mortgage Trust, Commercial Mortgage Pass-Through Certificates, Series 2007-WHl8 |
0.358% | 6/15/20 | Aaa | $ | 1,644,465 | |||||||||||||
| 1,240 | Wells Fargo Mortgage Backed Securities Trust, Mortgage Pass-Through Certificate Series 2003-J |
4.415% | 10/25/33 | AAA | 1,240,779 | |||||||||||||||
| 3,220 | Wells Fargo-RBS Commercial Mortgage Trust, Commercial Mortgage Pass-Through Certificates, Series 2011-C3 |
4.375% | 3/15/44 | AAA | 3,428,649 | |||||||||||||||
| $ | 220,171 | Total Asset-Backed and Mortgage-Backed Securities (cost $219,606,679) |
224,586,023 | |||||||||||||||||
| Principal Amount (000) |
Description (1) | Coupon | Maturity | Ratings (2) | Value | |||||||||||||||
| SOVEREIGN DEBT – 0.2% |
||||||||||||||||||||
| Mexico – 0.2% |
||||||||||||||||||||
| $ | 1,400 MXN | United Mexican States, (4) |
5.625% | 1/15/17 | Baa1 | $ | 1,610,000 | |||||||||||||
| Total Sovereign Debt (cost $1,387,694) |
1,610,000 | |||||||||||||||||||
| Shares | Description (1) | Value | ||||||||||||||||||
| INVESTMENTS PURCHASED WITH COLLATERAL FROM SECURITIES LENDING – 22.0% |
|
|||||||||||||||||||
| Money Market Funds – 22.0% |
||||||||||||||||||||
| 145,279,759 | Mount Vernon Securities Lending Prime Portfolio, 0.233% (5), (6) |
$ | 145,279,759 | |||||||||||||||||
| Total Investments Purchased with Collateral from Securities Lending (cost $145,279,759) |
|
145,279,759 | ||||||||||||||||||
| Principal Amount (000)/ Shares |
Description (1) | Coupon | Maturity | Ratings (2) | Value | |||||||||||||||
| SHORT-TERM INVESTMENTS – 2.8% |
||||||||||||||||||||
| Money Market Funds – 2.5% |
||||||||||||||||||||
| 16,529,647 | First American Treasury Obligations Fund, Class Z |
0.000% | (5) | N/A | N/A | $ | 16,529,647 | |||||||||||||
| U.S. Government and Agency Obligations – 0.3% |
||||||||||||||||||||
| $ | 140 | U.S. Treasury Bills, (7) |
0.013% | 3/22/12 | Aaa | 139,994 | ||||||||||||||
| 830 | U.S. Treasury Bills, (7) |
0.013% | 4/05/12 | Aaa | 829,957 | |||||||||||||||
| 950 | U.S. Treasury Bills, (7) |
0.018% | 5/03/12 | Aaa | 949,920 | |||||||||||||||
| 330 | U.S. Treasury Bills, (7) |
0.053% | 7/26/12 | Aaa | 329,897 | |||||||||||||||
| $ | 2,250 | Total U.S. Government and Agency Obligations |
2,249,768 | |||||||||||||||||
| Short-Term Investments (cost $18,779,484) |
18,779,415 | |||||||||||||||||||
| Total Investments (cost $776,421,993) – 121.1% |
798,790,635 | |||||||||||||||||||
| Other Assets Less Liabilities – (21.1)% (8) |
(139,351,762) | |||||||||||||||||||
| Net Assets – 100% |
$ | 659,438,873 | ||||||||||||||||||
Investments in Derivatives at December 31, 2011:
Interest Rate Swaps outstanding:
| Counterparty | Notional Amount |
Fund Pay/Receive Floating Rate |
Floating Index Rate |
Fixed Rate* |
Fixed Rate Payment Frequency |
Termination Date |
Value (U.S. Dollars) |
Unrealized Appreciation (Depreciation) (U.S. Dollars) |
||||||||||||||||||||||||
| JPMorgan Chase |
$ | 5,000,000 | Receive | 3-Month USD-LIBOR | 3.858 | % | Semi-Annually | 1/19/20 | $ | (883,214 | ) | $ | (883,214 | ) | ||||||||||||||||||
| UBS |
19,000,000 | Receive | 3-Month USD-LIBOR | 1.133 | Semi-Annually | 3/25/12 | (80,880 | ) | (80,880 | ) | ||||||||||||||||||||||
| UBS |
20,000,000 | Receive | 3-Month USD-LIBOR | 1.048 | Semi-Annually | 6/25/12 | (43,106 | ) | (43,106 | ) | ||||||||||||||||||||||
| UBS |
8,000,000 | Receive | 3-Month USD-LIBOR | 3.001 | Semi-Annually | 8/03/14 | (557,871 | ) | (557,871 | ) | ||||||||||||||||||||||
| $ | (1,565,071 | ) | ||||||||||||||||||||||||||||||
| * | Annualized. |
| Nuveen Investments | 85 |
Portfolio of Investments (Unaudited)
Nuveen Intermediate Term Bond Fund (continued)
December 31, 2011
Investments in Derivatives at December 31, 2011 (continued):
Futures Contracts outstanding:
| Type | Contract Position |
Number of Contracts |
Contract Expiration |
Value (U.S. Dollars) |
Unrealized Appreciation (Depreciation) (U.S. Dollars) |
|||||||||||||||
| U.S. Treasury 2-Year Note |
Long | 124 | 3/12 | $ | 27,347,813 | $ | 15,213 | |||||||||||||
| U.S. Treasury 5-Year Note |
Long | 312 | 3/12 | 38,456,437 | 147,159 | |||||||||||||||
| U.S. Treasury 10-Year Note |
Short | (229 | ) | 3/12 | (30,027,625 | ) | (253,552 | ) | ||||||||||||
| U.S. Treasury Long Bond |
Long | 6 | 3/12 | 868,875 | 7,158 | |||||||||||||||
| $ | (84,022 | ) | ||||||||||||||||||
| For Fund portfolio compliance purposes, the Fund’s industry classifications refer to any one or more of the industry sub-classifications used by one or more widely recognized market indexes or ratings group indexes, and/or as defined by Fund management. This definition may not apply for purposes of this report which may combine industry sub-classifications into sectors for reporting ease. |
| (1) | All Percentages shown in the Portfolio of Investments are based on net assets. |
| (2) | Ratings: Using the highest of Standard & Poor’s Group (“Standard & Poor’s”), Moody’s Investors Service, Inc. (“Moody’s”) or Fitch, Inc. (“Fitch”) rating. Ratings below BBB by Standard & Poor’s, Baa by Moody’s or BBB by Fitch are considered to be below investment grade. Holdings designated N/R are not rated by any of these national rating agencies. |
| (3) | Optional Call Provisions: Dates (month and year) and prices of the earliest optional call or redemption. There may be other call provisions at varying prices at later dates. Certain mortgage-backed securities may be subject to periodic principal paydowns. |
| (4) | Investment, or a portion of investment, is out on loan for securities lending. |
| (5) | The rate shown is the annualized seven-day effective yield as of December 31, 2011. |
| (6) | The Fund may loan securities representing up to one third of the fair value of its total assets (which includes collateral for securities on loan) to broker-dealers, banks, or other institutional borrowers of securities. The Fund maintains collateral equal to at least 102% of the fair value of the securities loaned. The adequacy of the collateral is monitored on a daily basis. The cash collateral received by the Fund is invested in this money market fund. |
| (7) | Investment, or portion of investment, segregated as collateral for investments in derivatives. Yield shown is effective yield as of December 31, 2011. |
| (8) | Other Assets Less Liabilities includes the Unrealized Appreciation (Depreciation) of derivative instruments as noted in Investments in Derivatives at December 31, 2011. |
| N/A | Not applicable. |
| 144A | Investment is exempt from registration under Rule 144A of the Securities Act of 1933, as amended. These investments may only be resold in transactions exempt from registration, which are normally those transactions with qualified institutional buyers. |
| MXN | Mexican Peso |
| USD-LIBOR | United States Dollar–London Inter-Bank Offered Rate. |
| REIT | Real Estate Investment Trust |
See accompanying notes to financial statements.
| 86 | Nuveen Investments |
Portfolio of Investments (Unaudited)
Nuveen Short Term Bond Fund
December 31, 2011
| Principal Amount (000) |
Description (1) | Coupon | Maturity | Ratings (2) | Value | |||||||||||||||
| CORPORATE BONDS – 46.9% |
||||||||||||||||||||
| Aerospace & Defense – 0.3% |
||||||||||||||||||||
| $ | 255 | QDynCorp International Inc. |
10.375% | 7/01/17 | B2 | $ | 221,850 | |||||||||||||
| 2,032 | Northrop Grunman |
3.700% | 8/01/14 | BBB+ | 2,146,497 | |||||||||||||||
| 2,287 | Total Aerospace & Defense |
2,368,347 | ||||||||||||||||||
| Airlines – 1.1% |
||||||||||||||||||||
| 2,090 | Air Canada, 144A, (4) |
9.250% | 8/01/15 | B+ | 1,828,750 | |||||||||||||||
| 2,695 | Delta Airlines, (4) |
5.300% | 4/15/19 | A– | 2,721,950 | |||||||||||||||
| 2,000 | United Airlines Inc., 144A, (4) |
9.875% | 8/01/13 | BB | 2,045,000 | |||||||||||||||
| 768 | United Airlines Pass-Through Trust. Series 2009-1 |
10.400% | 11/01/16 | BBB+ | 849,403 | |||||||||||||||
| 1,607 | US Airways Pass Through Trust, Pass Through Certificates, Series 2001 |
7.076% | 3/20/21 | BB | 1,510,540 | |||||||||||||||
| 9,160 | Total Airlines |
8,955,643 | ||||||||||||||||||
| Auto Components – 0.6% |
||||||||||||||||||||
| 1,750 | American Axle and Manufacturing Holdings Inc., 144A, (4) |
9.250% | 1/15/17 | BB+ | 1,898,750 | |||||||||||||||
| 1,500 | Pittsburgh Glass Works LLC, 144A, (4) |
8.500% | 4/15/16 | B+ | 1,443,750 | |||||||||||||||
| 1,300 | TRW Automotive Inc., 144A |
8.875% | 12/01/17 | BB+ | 1,410,500 | |||||||||||||||
| 4,550 | Total Auto Components |
4,753,000 | ||||||||||||||||||
| Automobiles – 0.5% |
||||||||||||||||||||
| 400 | Chrysler GP/CG Company, 144A, (4) |
8.000% | 6/15/19 | B | 366,000 | |||||||||||||||
| 3,335 | Volkswagen International Finance NV |
1.625% | 8/12/13 | A– | 3,344,161 | |||||||||||||||
| 3,735 | Total Automobiles |
3,710,161 | ||||||||||||||||||
| Beverages – 0.8% |
||||||||||||||||||||
| 2,235 | Anheuser-Busch Companies Inc. |
5.050% | 10/15/16 | A– | 2,545,558 | |||||||||||||||
| 1,500 | Constellation Brands Inc. |
8.375% | 12/15/14 | BB+ | 1,683,750 | |||||||||||||||
| 1,860 | Dr. Pepper Snapple Group Inc. |
2.900% | 1/15/16 | Baa1 | 1,929,047 | |||||||||||||||
| 5,595 | Total Beverages |
6,158,355 | ||||||||||||||||||
| Biotechnology – 0.4% |
||||||||||||||||||||
| 2,000 | Genentech Inc. |
4.750% | 7/15/15 | AA– | 2,230,882 | |||||||||||||||
| 1,000 | Gilead Sciences Inc. |
2.400% | 12/01/14 | A– | 1,018,008 | |||||||||||||||
| 3,000 | Total Biotechnology |
3,248,890 | ||||||||||||||||||
| Capital Markets – 4.4% |
||||||||||||||||||||
| 1,225 | Credit Suisse New York |
5.500% | 5/01/14 | Aa1 | 1,273,290 | |||||||||||||||
| 2,000 | Deutsche Bank London |
2.375% | 1/11/13 | Aa3 | 1,985,178 | |||||||||||||||
| 920 | Deutsche Bank London |
4.875% | 5/20/13 | Aa3 | 940,428 | |||||||||||||||
| 2,000 | Deutsche Bank London |
3.875% | 8/18/14 | Aa3 | 2,034,550 | |||||||||||||||
| 1,625 | Goldman Sachs Group, Inc., (4) |
5.150% | 1/15/14 | A1 | 1,655,929 | |||||||||||||||
| 4,640 | Goldman Sachs Group, Inc. |
1.435% | 2/07/14 | A1 | 4,337,008 | |||||||||||||||
| 585 | Goldman Sachs Group, Inc. |
5.500% | 11/15/14 | A1 | 602,707 | |||||||||||||||
| 7,500 | Goldman Sachs Group, Inc. |
3.700% | 8/01/15 | A1 | 7,347,780 | |||||||||||||||
| 4,000 | Morgan Stanley |
2.016% | 1/24/14 | A2 | 3,681,728 | |||||||||||||||
| 1,645 | Morgan Stanley |
4.100% | 1/26/15 | A | 1,561,444 | |||||||||||||||
| 2,000 | Morgan Stanley |
4.200% | 11/20/14 | A | 1,928,882 | |||||||||||||||
| 1,015 | Morgan Stanley, (4) |
2.875% | 7/28/14 | A2 | 955,887 | |||||||||||||||
| 1,000 | UBS AG Stamford |
3.875% | 1/15/15 | Aa3 | 997,250 | |||||||||||||||
| 3,875 | UBS AG Stamford |
1.425% | 1/28/14 | Aa3 | 3,773,483 | |||||||||||||||
| 2,650 | UBS AG Stamford |
2.250% | 8/12/13 | Aa3 | 2,626,375 | |||||||||||||||
| 36,680 | Total Capital Markets |
35,701,919 | ||||||||||||||||||
| Nuveen Investments | 87 |
Portfolio of Investments (Unaudited)
Nuveen Short Term Bond Fund (continued)
December 31, 2011
| Principal Amount (000) |
Description (1) | Coupon | Maturity | Ratings (2) | Value | |||||||||||||||
| Chemicals – 1.3% |
||||||||||||||||||||
| $ | 335 | CF Industries Inc. |
6.875% | 5/01/18 | BBB– | $ | 383,575 | |||||||||||||
| 3,455 | Dow Chemical Company |
2.500% | 2/15/16 | BBB | 3,470,033 | |||||||||||||||
| 1,375 | Georgia Gulf Corporation, (4) |
9.000% | 1/15/17 | B+ | 1,454,063 | |||||||||||||||
| 2,850 | Huntsman International LLC, (4) |
5.500% | 6/30/16 | B+ | 2,793,000 | |||||||||||||||
| 503 | Lyondell Chemical Company |
8.000% | 11/01/17 | BB+ | 549,528 | |||||||||||||||
| 1,875 | Potash Corporation of Saskatchewan |
3.750% | 9/30/15 | A– | 2,010,251 | |||||||||||||||
| 10,393 | Total Chemicals |
10,660,450 | ||||||||||||||||||
| Commercial Banks – 7.8% |
||||||||||||||||||||
| 8,000 | Australia and New Zealand Banking Group Limited, 144A, (4) |
2.400% | 11/23/16 | AAA | 7,924,456 | |||||||||||||||
| 800 | Banco do Nordeste do Brasil, 144A, (4) |
3.625% | 11/09/15 | BBB | 798,000 | |||||||||||||||
| 6,180 | Bank of Montreal, 144A |
1.300% | 10/31/14 | AAA | 6,169,395 | |||||||||||||||
| 2,500 | Barclays Bank PLC, (4) |
2.375% | 1/13/14 | Aa3 | 2,446,938 | |||||||||||||||
| 2,315 | BB&T Corporation |
3.200% | 3/15/16 | A+ | 2,413,228 | |||||||||||||||
| 1,300 | BBVA Bancomer SA Texas, 144A |
4.500% | 3/10/16 | A1 | 1,274,000 | |||||||||||||||
| 2,660 | BNP Paribas |
3.250% | 3/11/15 | AA– | 2,514,328 | |||||||||||||||
| 1,550 | Fifth Third Bancorp., (4) |
3.625% | 1/25/16 | A– | 1,572,618 | |||||||||||||||
| 2,015 | Fifth Third Bancorp. |
6.250% | 5/01/13 | A– | 2,118,176 | |||||||||||||||
| 1,245 | Lloyds TSB Bank |
4.375% | 1/12/15 | A1 | 1,198,507 | |||||||||||||||
| 3,250 | Lloyds TSB Bank, (4) |
4.875% | 1/21/16 | A1 | 3,167,398 | |||||||||||||||
| 2,760 | National Australia Bank, 144A |
3.000% | 7/27/16 | AA | 2,749,700 | |||||||||||||||
| 5,200 | Nordea Eiendomskreditt, 144A |
1.875% | 4/07/14 | Aaa | 5,204,701 | |||||||||||||||
| 2,000 | Nordea Bank AB, 144A, (4) |
2.125% | 1/14/14 | Aa2 | 1,961,490 | |||||||||||||||
| 485 | PNC Funding Corporation |
3.625% | 2/08/15 | A+ | 509,453 | |||||||||||||||
| 1,400 | Rabobank Nederland |
3.200% | 3/11/15 | Aaa | 1,426,008 | |||||||||||||||
| 2,330 | Royal Bank of Scotland Group PLC |
4.875% | 8/25/14 | A | 2,279,856 | |||||||||||||||
| 2,000 | Santander US Debt SA Unipersonal |
2.485% | 1/18/13 | AA– | 1,920,218 | |||||||||||||||
| 3,750 | Societe Generale, 144A |
2.500% | 1/15/14 | A+ | 3,472,500 | |||||||||||||||
| 3,300 | Swedbank Hypotek AB, 144A, (4) |
2.125% | 8/31/16 | AAA | 3,247,570 | |||||||||||||||
| 2,000 | Wells Fargo & Company |
3.750% | 10/01/14 | AA– | 2,111,432 | |||||||||||||||
| 3,755 | Wells Fargo & Company |
3.676% | 6/15/16 | AA– | 3,923,967 | |||||||||||||||
| 2,000 | Wells Fargo Bank NA |
4.750% | 2/09/15 | A+ | 2,086,578 | |||||||||||||||
| 62,795 | Total Commercial Banks |
62,490,517 | ||||||||||||||||||
| Commercial Services & Supplies – 0.4% |
||||||||||||||||||||
| 1,000 | International Lease Finance Corporation |
6.500% | 9/01/14 | BBB– | 1,022,500 | |||||||||||||||
| 1,815 | Waste Management Inc. |
2.600% | 9/01/16 | BBB | 1,842,272 | |||||||||||||||
| 2,815 | Total Commercial Services & Supplies |
2,864,772 | ||||||||||||||||||
| Computers & Peripherals – 0.6% |
||||||||||||||||||||
| 2,760 | Hewlett Packard Company, (4) |
2.625% | 12/09/14 | A | 2,784,318 | |||||||||||||||
| 1,933 | Seagate Technology International, 144A |
10.000% | 5/01/14 | BBB | 2,186,706 | |||||||||||||||
| 4,693 | Total Computers & Peripherals |
4,971,024 | ||||||||||||||||||
| Construction Materials – 0.2% |
||||||||||||||||||||
| 1,750 | Lafarge SA |
6.500% | 7/15/16 | BB+ | 1,785,016 | |||||||||||||||
| Consumer Finance – 1.5% |
||||||||||||||||||||
| 1,000 | Ally Financial Inc. |
8.300% | 2/12/15 | BB | 1,055,000 | |||||||||||||||
| 2,980 | American Express Credit Corporation |
7.300% | 8/20/13 | A+ | 3,234,072 | |||||||||||||||
| 88 | Nuveen Investments |
| Principal Amount (000) |
Description (1) | Coupon | Maturity | Ratings (2) | Value | |||||||||||||||
| Consumer Finance (continued) |
||||||||||||||||||||
| $ | 2,250 | Capital One Bank |
6.500% | 6/13/13 | BBB+ | $ | 2,373,298 | |||||||||||||
| 225 | Capital One Financial Corporation |
7.375% | 5/23/14 | A– | 247,210 | |||||||||||||||
| 1,915 | Capital One Financial Corporation |
2.125% | 7/15/14 | A– | 1,890,450 | |||||||||||||||
| 1,500 | Ford Motor Credit Company |
7.000% | 10/01/13 | BB+ | 1,590,498 | |||||||||||||||
| 2,000 | Household Finance Corporation |
4.750% | 7/15/13 | AA– | 2,042,286 | |||||||||||||||
| 11,870 | Total Consumer Finance |
12,432,814 | ||||||||||||||||||
| Containers & Packaging – 0.0% |
||||||||||||||||||||
| 300 | Graham Packaging Company LP, GPC Capital Corporation I |
8.250% | 10/01/18 | B | 302,625 | |||||||||||||||
| Diversified Financial Services – 6.1% |
||||||||||||||||||||
| 3,000 | Bank of America Corporation, (4) |
1.848% | 1/30/14 | A | 2,708,466 | |||||||||||||||
| 10,010 | Bank of America Corporation |
4.500% | 4/01/15 | A | 9,659,510 | |||||||||||||||
| 3,000 | Citigroup Inc. |
4.587% | 12/15/15 | A | 3,019,191 | |||||||||||||||
| 1,000 | Citigroup Inc. |
5.850% | 7/02/13 | A | 1,028,008 | |||||||||||||||
| 6,015 | Citigroup Inc. |
6.375% | 8/12/14 | A | 6,312,869 | |||||||||||||||
| 4,500 | General Electric Capital Corporation |
2.100% | 1/07/14 | AA+ | 4,567,365 | |||||||||||||||
| 3,000 | General Electric Capital Corporation |
3.750% | 11/14/14 | AA+ | 3,162,204 | |||||||||||||||
| 3,500 | General Electric Capital Corporation |
1.875% | 9/16/13 | AA+ | 3,543,110 | |||||||||||||||
| 1,675 | ING Bank NV, 144A |
4.000% | 3/15/16 | Aa3 | 1,618,457 | |||||||||||||||
| 850 | JPMorgan Chase & Company |
5.750% | 1/02/13 | A+ | 881,739 | |||||||||||||||
| 2,000 | JPMorgan Chase & Company |
3.700% | 1/20/15 | AA– | 2,073,610 | |||||||||||||||
| 2,500 | JPMorgan Chase & Company |
1.216% | 1/24/14 | AA– | 2,462,158 | |||||||||||||||
| 4,500 | JPMorgan Chase & Company |
5.125% | 9/15/14 | A+ | 4,744,355 | |||||||||||||||
| 2,970 | National Rural Utilities Cooperative Finance Corporation |
1.900% | 11/01/15 | A+ | 2,987,704 | |||||||||||||||
| 48,520 | Total Diversified Financial Services |
48,768,746 | ||||||||||||||||||
| Diversified Telecommunication Services – 2.1% |
||||||||||||||||||||
| 525 | AT&T, Inc., (4) |
6.700% | 11/15/13 | A | 578,765 | |||||||||||||||
| 2,250 | AT&T, Inc. |
2.500% | 8/15/15 | A | 2,329,808 | |||||||||||||||
| 1,500 | Citizens Communications Company |
6.625% | 3/15/15 | BB+ | 1,485,000 | |||||||||||||||
| 1,550 | Deutsche Telekom International Finance BV |
5.875% | 8/20/13 | BBB+ | 1,643,085 | |||||||||||||||
| 2,000 | Qwest Corporation |
7.500% | 10/01/14 | BBB– | 2,202,844 | |||||||||||||||
| 310 | Telecom Italia Capital |
5.250% | 10/01/15 | BBB | 284,372 | |||||||||||||||
| 1,540 | Telecom Italia Capital |
4.950% | 9/30/14 | BBB | 1,429,434 | |||||||||||||||
| 200 | Telefonica Emisiones SAU |
4.949% | 1/15/15 | BBB+ | 198,948 | |||||||||||||||
| 1,450 | Telefonica Emisiones SAU |
2.582% | 4/26/13 | BBB+ | 1,414,906 | |||||||||||||||
| 4,500 | Verizon Wireless Capital LLC, (4) |
5.550% | 2/01/14 | A | 4,889,075 | |||||||||||||||
| 15,825 | Total Diversified Telecommunication Services |
16,456,237 | ||||||||||||||||||
| Electric Utilities – 0.5% |
||||||||||||||||||||
| 1,640 | Commonwealth Edison Company, First Mortgage |
1.625% | 1/15/14 | A– | 1,651,895 | |||||||||||||||
| 200 | Exelon Generation Co. LLC |
5.350% | 1/15/14 | A3 | 213,629 | |||||||||||||||
| 847 | Midwest Generation LLC |
8.560% | 1/02/16 | Ba3 | 855,812 | |||||||||||||||
| 400 | Niagara Mohawk Power Company, 144A |
3.553% | 10/01/14 | A– | 420,183 | |||||||||||||||
| 1,375 | Texas Competitive Electric Holdings, 144A, (4) |
11.500% | 10/01/20 | B | 1,167,031 | |||||||||||||||
| 4,462 | Total Electric Utilities |
4,308,550 | ||||||||||||||||||
| Nuveen Investments | 89 |
Portfolio of Investments (Unaudited)
Nuveen Short Term Bond Fund (continued)
December 31, 2011
| Principal Amount (000) |
Description (1) | Coupon | Maturity | Ratings (2) | Value | |||||||||||||||
| Energy Equipment & Services – 0.9% |
||||||||||||||||||||
| $ | 3,000 | Ensco PLC |
3.250% | 3/15/16 | BBB+ | $ | 3,060,435 | |||||||||||||
| 2,000 | NGPL PipeCo LLC |
7.119% | 12/15/17 | BB+ | 1,974,360 | |||||||||||||||
| 1,825 | Noble Holding International Limited |
3.450% | 8/01/15 | A– | 1,898,652 | |||||||||||||||
| 6,825 | Total Energy Equipment & Services |
6,933,447 | ||||||||||||||||||
| Food & Staples Retailing – 0.0% |
||||||||||||||||||||
| 250 | Supervalu Inc., (4) |
7.500% | 11/15/14 | B+ | 254,375 | |||||||||||||||
| Food Products – 0.6% |
||||||||||||||||||||
| 1,000 | ConAgra Foods, Inc. |
5.875% | 4/15/14 | BBB | 1,097,416 | |||||||||||||||
| 1,090 | General Mills, Inc. |
1.550% | 5/16/14 | BBB+ | 1,097,317 | |||||||||||||||
| 2,000 | Smithfield Foods Inc. |
10.000% | 7/15/14 | BB+ | 2,325,000 | |||||||||||||||
| 4,090 | Total Food Products |
4,519,733 | ||||||||||||||||||
| Gas Utilities – 0.0% |
||||||||||||||||||||
| 50 | Ferrellgas LP |
6.500% | 5/01/21 | Ba3 | 44,000 | |||||||||||||||
| Health Care Equipment & Supplies – 0.5% |
||||||||||||||||||||
| 1,720 | Biomet Inc. |
10.000% | 10/15/17 | B– | 1,857,600 | |||||||||||||||
| 2,000 | Boston Scientific Corporation |
6.250% | 11/15/15 | BBB– | 2,217,044 | |||||||||||||||
| 3,720 | Total Health Care Equipment & Supplies |
4,074,644 | ||||||||||||||||||
| Health Care Providers & Services – 0.7% |
||||||||||||||||||||
| 1,910 | HCA Inc., (4) |
8.500% | 4/15/19 | BB+ | 2,091,450 | |||||||||||||||
| 2,630 | Saint Jude Medical Inc. |
2.200% | 9/15/13 | A | 2,677,724 | |||||||||||||||
| 690 | Saint Jude Medical Inc., (4) |
3.750% | 7/15/14 | A | 731,734 | |||||||||||||||
| 5,230 | Total Health Care Providers & Services |
5,500,908 | ||||||||||||||||||
| Hotels, Restaurants & Leisure – 0.4% |
||||||||||||||||||||
| 1,195 | CKE Restaurant Inc., (4) |
11.375% | 7/15/18 | B2 | 1,302,550 | |||||||||||||||
| 2,000 | Reynolds Group Escrow, 144A |
8.750% | 10/15/16 | BB– | 2,105,000 | |||||||||||||||
| 3,195 | Total Hotels, Restaurants & Leisure |
3,407,550 | ||||||||||||||||||
| Independent Power Producers & Energy Traders – 0.4% |
||||||||||||||||||||
| 2,000 | AES Corporation |
9.750% | 4/15/16 | BB | 2,290,000 | |||||||||||||||
| 300 | NRG Energy Inc., (4) |
7.375% | 1/15/17 | BB | 311,250 | |||||||||||||||
| 500 | RRI Energy Inc., (4) |
7.625% | 6/15/14 | BB– | 500,000 | |||||||||||||||
| 2,800 | Total Independent Power Producers & Energy Traders |
3,101,250 | ||||||||||||||||||
| Industrial Conglomerates – 0.1% |
||||||||||||||||||||
| 250 | Abengoa Finance SAU, 144A |
8.875% | 11/01/17 | BB | 250,000 | |||||||||||||||
| 220 | Offshore Group Investment Limited |
11.500% | 8/01/15 | B– | 237,875 | |||||||||||||||
| 470 | Total Industrial Conglomerates |
487,875 | ||||||||||||||||||
| Insurance – 2.5% |
||||||||||||||||||||
| 3,460 | AFLAC Insurance |
3.450% | 8/15/15 | A– | 3,570,661 | |||||||||||||||
| 1,900 | Allstate Life Global Funding |
5.375% | 4/30/13 | A+ | 2,006,273 | |||||||||||||||
| 1,450 | American International Group, Inc. |
3.650% | 1/15/14 | A– | 1,408,226 | |||||||||||||||
| 4,030 | American International Group, Inc. |
4.250% | 9/15/14 | A– | 3,913,646 | |||||||||||||||
| 550 | Berkshire Hathaway Inc. |
2.200% | 8/15/16 | AA+ | 566,153 | |||||||||||||||
| 2,000 | Hartford Financial Services Group Inc. |
4.000% | 3/30/15 | BBB | 2,009,686 | |||||||||||||||
| 2,000 | Lincoln National Corporation |
4.300% | 6/15/15 | A– | 2,071,292 | |||||||||||||||
| 275 | Met Life Global Funding I |
5.125% | 4/10/13 | AA– | 287,274 | |||||||||||||||
| 90 | Nuveen Investments |
| Principal Amount (000) |
Description (1) | Coupon | Maturity | Ratings (2) | Value | |||||||||||||||
| Insurance (continued) |
||||||||||||||||||||
| $ | 2,325 | Prudential Financial Inc., (4) |
5.100% | 9/20/14 | A | $ | 2,500,668 | |||||||||||||
| 2,000 | Willis Group Holdings PLC |
4.125% | 3/15/16 | BBB– | 2,031,274 | |||||||||||||||
| 19,990 | Total Insurance |
20,365,153 | ||||||||||||||||||
| Life Sciences Tools & Services – 0.6% |
||||||||||||||||||||
| 1,625 | Thermo Fischer Scientific Inc. |
3.250% | 11/20/14 | A | 1,720,742 | |||||||||||||||
| 1,250 | Thermo Fischer Scientific Inc. |
3.200% | 5/01/15 | A | 1,321,244 | |||||||||||||||
| 1,745 | Thermo Fischer Scientific Inc., (4) |
2.250% | 8/15/16 | A | 1,778,980 | |||||||||||||||
| 4,620 | Total Life Sciences Tools & Services |
4,820,966 | ||||||||||||||||||
| Machinery – 0.3% |
||||||||||||||||||||
| 1,000 | Case New Holland Inc., (4) |
7.750% | 9/01/13 | BB+ | 1,062,500 | |||||||||||||||
| 1,490 | Caterpillar Financial Services Corporation, (4) |
4.900% | 8/15/13 | A | 1,587,728 | |||||||||||||||
| 2,490 | Total Machinery |
2,650,228 | ||||||||||||||||||
| Media – 1.4% |
||||||||||||||||||||
| 1,570 | DIRECTV Holdings LLC, (4) |
3.550% | 3/15/15 | BBB | 1,634,166 | |||||||||||||||
| 2,000 | DIRECTV Holdings LLC |
3.125% | 2/15/16 | BBB | 2,025,988 | |||||||||||||||
| 2,000 | NBC Universal Media LLC |
3.650% | 4/30/15 | BBB+ | 2,110,938 | |||||||||||||||
| 1,000 | News America Holdings Inc., (4) |
5.300% | 12/15/14 | BBB+ | 1,089,120 | |||||||||||||||
| 250 | Sirius XM Radio Inc., 144A |
8.750% | 4/01/15 | BB | 273,750 | |||||||||||||||
| 1,000 | TCM Sub LLC |
3.550% | 1/15/15 | A– | 1,036,741 | |||||||||||||||
| 1,025 | Time Warner Cable Inc. |
8.250% | 2/14/14 | BBB | 1,155,335 | |||||||||||||||
| 1,790 | XM Satellite Radio Inc., 144A |
7.625% | 11/01/18 | BB | 1,879,500 | |||||||||||||||
| 10,635 | Total Media |
11,205,538 | ||||||||||||||||||
| Metals & Mining – 1.6% |
||||||||||||||||||||
| 3,680 | ArcelorMittal, (4) |
3.750% | 3/01/16 | BBB | 3,493,380 | |||||||||||||||
| 2,780 | BHP Billiton Finance Limited, (4) |
1.125% | 11/21/14 | A+ | 2,786,525 | |||||||||||||||
| 2,400 | Corporacion Nacional del Cobre, 144A |
5.500% | 10/15/13 | A+ | 2,571,905 | |||||||||||||||
| 375 | Patriot Coal Corporation, (4) |
8.250% | 4/30/18 | B+ | 360,000 | |||||||||||||||
| 1,375 | Rio Tinto Finance USA Limited, |
8.950% | 5/01/14 | A– | 1,608,082 | |||||||||||||||
| 2,000 | United States Steel Corporation, (4) |
6.050% | 6/01/17 | BB | 1,910,000 | |||||||||||||||
| 12,610 | Total Metals & Mining |
12,729,892 | ||||||||||||||||||
| Multi-Utilities – 0.2% |
||||||||||||||||||||
| 1,500 | Duke Energy Corporation |
3.950% | 9/15/14 | BBB+ | 1,600,380 | |||||||||||||||
| Oil, Gas & Consumable Fuels – 4.1% |
||||||||||||||||||||
| 1,000 | Anadarko Petroleum Corporation |
6.375% | 9/15/17 | BBB– | 1,159,134 | |||||||||||||||
| 2,550 | BP Capital Markets PLC |
1.140% | 3/11/14 | A | 2,548,710 | |||||||||||||||
| 2,000 | Chesapeake Energy Corporation |
9.500% | 2/15/15 | BB+ | 2,290,000 | |||||||||||||||
| 1,220 | Cloud Peak Energy Resources LLC and Cloud Peak Energy Finance Corporation |
8.250% | 12/15/17 | BB– | 1,299,300 | |||||||||||||||
| 2,000 | El Paso Pipeline Partners Operating Company LLC |
4.100% | 11/15/15 | BBB– | 2,047,456 | |||||||||||||||
| 2,680 | EnCana Corporation |
4.750% | 10/15/13 | BBB+ | 2,816,843 | |||||||||||||||
| 100 | Energy XXI Gulf Coast Inc., 144A |
9.250% | 12/15/17 | B | 108,500 | |||||||||||||||
| 900 | Forest Oil Corporation |
8.500% | 2/15/14 | B1 | 981,000 | |||||||||||||||
| 2,780 | Husky Energy Inc. |
5.900% | 6/15/14 | BBB+ | 3,021,499 | |||||||||||||||
| 3,000 | Marathon Petroleum Corporation |
3.500% | 3/01/16 | BBB | 3,053,676 | |||||||||||||||
| 3,275 | MidAmerican Energy Company |
4.650% | 10/01/14 | A | 3,565,607 | |||||||||||||||
| Nuveen Investments | 91 |
Portfolio of Investments (Unaudited)
Nuveen Short Term Bond Fund (continued)
December 31, 2011
| Principal Amount (000) |
Description (1) | Coupon | Maturity | Ratings (2) | Value | |||||||||||||||
| Oil, Gas & Consumable Fuels (continued) |
||||||||||||||||||||
| $ | 2,000 | Petroleos Mexicanos, (4) |
4.875% | 3/15/15 | Baa1 | $ | 2,127,500 | |||||||||||||
| 500 | PetroPlus Finance Limited, 144A, (4) |
7.000% | 5/01/17 | CCC | 247,500 | |||||||||||||||
| 1,180 | Shell International Finance BV |
3.250% | 9/22/15 | Aa1 | 1,269,535 | |||||||||||||||
| 1,885 | Total Capital Canada Limited, (4) |
1.625% | 1/28/14 | Aa1 | 1,916,726 | |||||||||||||||
| 2,500 | Transcapitalinvest LP, 144A |
7.700% | 8/07/13 | Baa1 | 2,694,195 | |||||||||||||||
| 1,875 | Western Refining Inc., (4) |
11.250% | 6/15/17 | B+ | 2,132,813 | |||||||||||||||
| 31,445 | Total Oil, Gas & Consumable Fuels |
33,279,994 | ||||||||||||||||||
| Paper & Forest Products – 0.1% |
||||||||||||||||||||
| 300 | Stora Enso Oyj, 144A |
6.404% | 4/15/16 | BB | 289,500 | |||||||||||||||
| 500 | Verso Paper Holdings LLC, (4) |
11.500% | 7/01/14 | Ba2 | 510,000 | |||||||||||||||
| 800 | Total Paper & Forest Products |
799,500 | ||||||||||||||||||
| Pharmaceuticals – 1.1% |
||||||||||||||||||||
| 3,600 | Merck & Company Inc., (4) |
2.250% | 1/15/16 | AA | 3,735,594 | |||||||||||||||
| 1,000 | Novartis Capital Corporation, (4) |
2.900% | 4/24/15 | Aa2 | 1,058,332 | |||||||||||||||
| 1,750 | Valeant Pharmaceuticals International, 144A |
6.500% | 7/15/16 | BB | 1,747,813 | |||||||||||||||
| 1,890 | Wyeth |
5.500% | 2/01/14 | AA | 2,071,931 | |||||||||||||||
| 8,240 | Total Pharmaceuticals |
8,613,670 | ||||||||||||||||||
| Real Estate Investment Trust – 1.4% |
||||||||||||||||||||
| 2,000 | DuPont Fabros Technology LP |
8.500% | 12/15/17 | Ba1 | 2,140,000 | |||||||||||||||
| 2,385 | HCP Inc., (4) |
2.700% | 2/01/14 | BBB+ | 2,381,532 | |||||||||||||||
| 2,395 | Health Care REIT Inc. |
3.625% | 3/15/16 | BBB | 2,357,056 | |||||||||||||||
| 2,000 | Simon Property Group, L.P., (4) |
4.200% | 2/01/15 | A– | 2,120,848 | |||||||||||||||
| 2,000 | Windstream Corporation |
8.125% | 8/01/13 | BB+ | 2,139,986 | |||||||||||||||
| 10,780 | Total Real Estate Investment Trust |
11,139,422 | ||||||||||||||||||
| Semiconductors & Equipment – 0.1% |
||||||||||||||||||||
| 1,000 | National Semiconductor Corporation |
3.950% | 4/15/15 | A+ | 1,080,195 | |||||||||||||||
| Specialty Retail – 0.4% |
||||||||||||||||||||
| 2,440 | Home Depot, Inc., (4) |
5.400% | 3/01/16 | A– | 2,818,122 | |||||||||||||||
| Trading Companies & Distributors – 0.1% |
||||||||||||||||||||
| 1,000 | GATX Corporation |
4.750% | 5/15/15 | Baa1 | 1,065,866 | |||||||||||||||
| Wireless Telecommunication Services – 0.8% |
||||||||||||||||||||
| 2,000 | America Movil S.A. de C.V. |
2.375% | 9/08/16 | A | 1,994,429 | |||||||||||||||
| 1,000 | Telefonica Moviles Chile SA, 144A |
2.875% | 11/09/15 | BBB+ | 986,945 | |||||||||||||||
| 750 | UPC Germany GmbH |
8.125% | 12/01/17 | BB– | 792,189 | |||||||||||||||
| 2,500 | Vodafone Group PLC, (4) |
5.000% | 9/15/15 | A– | 2,790,742 | |||||||||||||||
| 6,250 | Total Wireless Telecommunication Services |
6,564,305 | ||||||||||||||||||
| $ | 368,860 | Total Corporate Bonds (cost $377,654,972) |
376,994,079 | |||||||||||||||||
| Principal Amount (000) |
Description (1) | Optional Call Provisions (3) |
Ratings (2) | Value | ||||||||||||||||
| MUNICIPAL BONDS – 3.8% |
||||||||||||||||||||
| Arizona – 0.6% |
||||||||||||||||||||
| Phoenix Civic Improvement Corporation, Arizona, Excise Tax Revenue Bonds, Taxable Series 2011: |
||||||||||||||||||||
| $ | 2,800 | 2.302%, 7/01/14 |
No Opt. Call | AA | $ | 2,846,228 | ||||||||||||||
| 2,000 | 2.828%, 7/01/15 |
No Opt. Call | AA | 2,059,860 | ||||||||||||||||
| 4,800 | Total Arizona |
4,906,088 | ||||||||||||||||||
| 92 | Nuveen Investments |
| Principal Amount (000) |
Description (1) | Optional Call Provisions (3) |
Ratings (2) | Value | ||||||||||||||||
| California – 0.6% |
||||||||||||||||||||
| $ | 1,015 | California State, General Obligation Bonds, Various Purpose Build America Taxable Bond Series 2010, 5.750%, 3/01/17 |
No Opt. Call | A1 | $ | 1,138,038 | ||||||||||||||
| San Francisco Airports Commission, California, Revenue Bonds, San Francisco International Airport, Refunding Taxable Second Series 2011E: |
||||||||||||||||||||
| 1,000 | 1.507%, 5/01/13 |
No Opt. Call | A+ | 1,005,580 | ||||||||||||||||
| 2,640 | 2.021%, 5/01/14 |
No Opt. Call | A+ | 2,678,703 | ||||||||||||||||
| 4,655 | Total California |
4,822,321 | ||||||||||||||||||
| Florida – 0.1% |
||||||||||||||||||||
| 950 | Florida Housing Finance Corporation, Multifamily Mortgage Revenue Bonds, Crossroads Apartments, Series 2010A-2, 6.750%, 2/15/12 |
No Opt. Call | N/R | 950,000 | ||||||||||||||||
| Massachusetts – 0.5% |
||||||||||||||||||||
| Massachusetts Port Authority, Special Facilities Revenue Bonds, ConRac Project Series 3011B: |
||||||||||||||||||||
| 3,260 | 1.910%, 7/01/14 |
No Opt. Call | A | 3,291,589 | ||||||||||||||||
| 400 | 3.230%, 7/01/15 |
No Opt. Call | A | 409,464 | ||||||||||||||||
| 3,660 | Total Massachusetts |
3,701,053 | ||||||||||||||||||
| Michigan – 0.4% |
||||||||||||||||||||
| 3,000 | Wayne County, Michigan, General Obligation Bonds, Taxable Notes Series 2011, 5.000%, 9/15/13 |
No Opt. Call | BBB+ | 3,001,830 | ||||||||||||||||
| Minnesota – 0.5% |
||||||||||||||||||||
| 4,000 | Tobacco Securitization Authority, Minnesota, Tobacco Settlement Revenue Bonds, Taxable Series 2011A, 2.643%, 3/01/14 |
No Opt. Call | A | 3,983,200 | ||||||||||||||||
| Nevada – 0.3% |
||||||||||||||||||||
| 2,500 | Las Vegas Valley Water District, Nevada, General Obligation Bonds, Refunding Taxable Series 2011B, 3.176%, 6/01/17 |
No Opt. Call | AA+ | 2,534,700 | ||||||||||||||||
| Texas – 0.8% |
||||||||||||||||||||
| 1,500 | Dallas Fort Worth International Airport Facility Improvement Corporation, Texas, Learjet Inc. Project, Revenue Bonds, Series 2001-A1, 6.150%, 1/01/16 |
No Opt. Call | Ba2 | 1,500,345 | ||||||||||||||||
| 5,000 | Dallas-Ft. Worth International Airport, Texas, Joint Revenue Bonds, Refunding Taxable Series 2011E, 1.770%, 11/01/14 |
No Opt. Call | A+ | 5,014,850 | ||||||||||||||||
| 6,500 | Total Texas |
6,515,195 | ||||||||||||||||||
| $ | 30,065 | Total Municipal Bonds (cost $30,187,347) |
30,414,387 | |||||||||||||||||
| Principal Amount (000) |
Description (1) | Coupon | Maturity | Ratings (2) | Value | |||||||||||||||
| U.S. GOVERNMENT AND AGENCY OBLIGATIONS – 2.2% |
||||||||||||||||||||
| $ | 6,000 | Federal Home Loan Bank Bonds, (4) |
2.250% | 4/13/12 | Aaa | $ | 6,035,478 | |||||||||||||
| 5,400 | Federal Home Loan Bank Bonds, (4) |
1.500% | 1/16/13 | Aaa | 5,467,052 | |||||||||||||||
| 1,775 | U.S. Treasury Notes, (P/O), (4) |
0.000% | 2/15/12 | AAA | 1,774,932 | |||||||||||||||
| 200 | U.S. Treasury Notes |
4.875% | 6/30/12 | AAA | 204,719 | |||||||||||||||
| 250 | U.S. Treasury Notes |
4.125% | 8/31/12 | AAA | 256,592 | |||||||||||||||
| 500 | U.S. Treasury Notes |
1.375% | 9/15/12 | AAA | 504,394 | |||||||||||||||
| 1,800 | U.S. Treasury Notes, (4) |
1.375% | 5/15/13 | AAA | 1,828,546 | |||||||||||||||
| 55 | U.S. Treasury Notes, (I/O) |
0.000% | 5/15/14 | AAA | 54,598 | |||||||||||||||
| 380 | U.S. Treasury Notes |
1.875% | 2/28/14 | AAA | 392,944 | |||||||||||||||
| 1,310 | U.S. Treasury Notes, (4) |
1.500% | 6/30/16 | AAA | 1,354,725 | |||||||||||||||
| $ | 17,670 | Total U.S. Government and Agency Obligations (cost $17,702,485) |
17,873,980 | |||||||||||||||||
| Nuveen Investments | 93 |
Portfolio of Investments (Unaudited)
Nuveen Short Term Bond Fund (continued)
December 31, 2011
| Principal Amount (000) |
Description (1) | Coupon | Maturity | Ratings (2) | Value | |||||||||||||||
| ASSET-BACKED AND MORTGAGE-BACKED SECURITIES – 43.0% |
||||||||||||||||||||
| $ | 1,548 | Ally Master Owner Trust 2010-3 |
2.880% | 4/15/15 | AAA | $ | 1,573,541 | |||||||||||||
| 1,955 | American Homes Mortgage Advance Trust, Series 2011-SART1 |
5.920% | 5/10/43 | BBB | 1,955,000 | |||||||||||||||
| 4,770 | AmeriCold LLC Trust, Series 2010 |
2.500% | 1/17/29 | AAA | 4,667,383 | |||||||||||||||
| 1,050 | AmeriCredit Automobile Receivables Trust, Series 2010-4 |
1.990% | 10/08/15 | Aaa | 1,046,643 | |||||||||||||||
| 1,520 | Ameriquest Mortgage Securities Inc., Asset-Backed Pass-Through Certificates, Series 2005-R9 |
0.524% | 11/25/35 | AAA | 1,463,731 | |||||||||||||||
| 5,200 | Arkle Master Issuer PLC, Mortgage Asset Backed Instrument, |
1.616% | 5/17/60 | AAA | 5,178,394 | |||||||||||||||
| 148 | Bank of America Auto Trust, Series 2009- 2A, 144A |
2.130% | 9/15/13 | AAA | 147,981 | |||||||||||||||
| 82 | Bank of America Auto Trust, Series 2009-1A |
2.670% | 7/15/13 | AAA | 81,899 | |||||||||||||||
| 850 | Bank of America Commercial Mortgage Inc., Commercial Mortgage Pass-Through Certificates, Series 2005-4 |
4.933% | 7/10/45 | AAA | 924,815 | |||||||||||||||
| 4,970 | Cabela’s Master Credit Card Trust, Series 2010-1A |
1.728% | 1/15/18 | AAA | 5,125,975 | |||||||||||||||
| 4,290 | Cabela’s Master Credit Card Trust, Series 2010-2A |
2.290% | 9/17/18 | AAA | 4,419,351 | |||||||||||||||
| 189 | Capital Auto Receivables Asset Trust, Asset Backed Notes, |
5.210% | 3/15/14 | AAA | 190,131 | |||||||||||||||
| 575 | CarMax Auto Owner Trust 2010-3 |
2.000% | 5/16/16 | AA | 578,203 | |||||||||||||||
| 1,019 | CenterPoint Energy Transition Bond Company II, LLC, Senior Secured Transition Bonds, Series 2005A |
4.970% | 8/01/14 | AAA | 1,026,795 | |||||||||||||||
| 73 | Chrysler Financial Auto Securitization Trust, Asset Backed Notes. Series 2009A |
2.820% | 1/15/16 | AAA | 73,308 | |||||||||||||||
| 872 | Chrysler Financial Auto Securtization Trust, Series 2010A |
1.650% | 11/08/13 | AA | 869,477 | |||||||||||||||
| 183 | Citicorp Residential Mortgage Trust, REMIC Pass-Through Certificates, Series 2007-2 |
5.977% | 6/25/37 | AAA | 183,592 | |||||||||||||||
| 5,430 | Citigroup Mortgage Loan Trust Inc., Mortgage Pass Through Certificates, Series 2010-10 |
4.778% | 12/27/32 | BBB | 5,397,004 | |||||||||||||||
| 12 | CNH Agriculture Equipment Trust, Series 2009C |
1.850% | 12/15/13 | AAA | 11,513 | |||||||||||||||
| 290 | CNH Equipment Trust 2010-A |
1.540% | 7/15/14 | AAA | 290,816 | |||||||||||||||
| 3,565 | Countrywide ABS Asset-Backed Certificate Trust 2007-9 |
0.424% | 6/25/47 | BB+ | 2,870,784 | |||||||||||||||
| 1,064 | Countrywide Alternative Loan Trust, Mortgage Pass-Through Certificates, Series 2006-19CB |
6.000% | 8/25/36 | CCC | 765,843 | |||||||||||||||
| 671 | Countrywide Asset-Backed Certificates Trust, Series 2005-16 2AF2 |
5.377% | 2/25/30 | B3 | 513,911 | |||||||||||||||
| 3,850 | Countrywide Asset-Backed Certificates Trust, Series 2006-25 |
0.414% | 6/25/47 | BB+ | 3,400,673 | |||||||||||||||
| 3,325 | Countrywide Hoen Loans, Asset Backed Certificates Series 2007-7 |
0.454% | 10/25/47 | BB– | 2,583,937 | |||||||||||||||
| 281 | Countrywide Home Loan Mortgage Pass Through Trust, Series 2004-2 |
2.748% | 2/25/34 | BB | 251,938 | |||||||||||||||
| 937 | Credit Suisse First Boston Mortgage Securities Corporation, |
5.750% | 9/25/33 | AAA | 965,378 | |||||||||||||||
| 2,000 | Crown Castle Towers LLC |
4.523% | 1/15/35 | A | 2,085,882 | |||||||||||||||
| 930 | CS First Boston Mortgage Securities Corporation, Commercial Mortgage Pass-Through Certificates, Series 2004-C1 |
4.750% | 1/15/37 | AAA | 974,204 | |||||||||||||||
| 55 | Daimler Chrysler Auto Trust 2008B |
5.320% | 11/08/14 | AAA | 55,101 | |||||||||||||||
| 2,405 | DBUBS Mortgage Trust, Commercial Mortgage Pass Through Certificates, Series 2011-LC3A |
3.642% | 8/12/44 | AAA | 2,533,533 | |||||||||||||||
| 700 | Developers Diversified Realty Corporation, Commercial Mortgage Pass Through Certificates Series 2009-DDR1 |
5.730% | 10/17/22 | Aa1 | 753,226 | |||||||||||||||
| 2,000 | Discover Card Master Trust I 2011-A3 A |
0.488% | 3/15/17 | AAA | 1,998,345 | |||||||||||||||
| 5,216 | DT Auto Owner Trust 2011-2A |
0.960% | 1/15/14 | AAA | 5,209,477 | |||||||||||||||
| 4,612 | DT Auto Owner Trust, Series 2011-3A |
1.400% | 8/15/14 | AAA | 4,602,222 | |||||||||||||||
| 94 | Nuveen Investments |
| Principal Amount (000) |
Description (1) | Coupon | Maturity | Ratings (2) | Value | |||||||||||||||
| ASSET-BACKED AND MORTGAGE-BACKED SECURITIES (continued) |
||||||||||||||||||||
| $ | 1,835 | Entergy Louisiana Investment Recovery Funding LLC, Series 2011-A |
2.040% | 9/01/23 | AAA | $ | 1,839,936 | |||||||||||||
| 94 | Equivantage Acceptance Corporation, Home Equity Loan Asset-Backed Certificates, Series 1996-4 |
7.250% | 1/25/28 | BBB+ | 93,072 | |||||||||||||||
| 3,920 | Extended Stay America Trust 2010-EHSA |
4.860% | 11/05/27 | A | 3,968,628 | |||||||||||||||
| 1,960 | Extended Stay America Trust 2010-EHSA |
2.951% | 11/05/27 | AAA | 1,963,596 | |||||||||||||||
| 3,018 | Fannie Mae Mortgage Interest Strips |
5.000% | 10/01/35 | AAA | 296,376 | |||||||||||||||
| 21 | Fannie Mae Mortgage Pool 20120501 |
5.500% | 5/01/12 | AAA | 21,450 | |||||||||||||||
| 48 | Fannie Mae Mortgage Pool 20130301 |
5.000% | 3/01/13 | AAA | 51,310 | |||||||||||||||
| 545 | Fannie Mae Mortgage Pool 20131201 |
4.000% | 12/01/13 | AAA | 574,896 | |||||||||||||||
| 1,638 | Fannie Mae Mortgage Pool 20200501 |
4.000% | 5/01/20 | AAA | 1,741,991 | |||||||||||||||
| 4,342 | Fannie Mae Mortgage Pool 20210601, (4) |
3.500% | 6/01/21 | AAA | 4,547,275 | |||||||||||||||
| 3,070 | Fannie Mae Mortgage Pool 20260201 |
3.500% | 2/01/26 | AAA | 3,212,912 | |||||||||||||||
| 398 | Fannie Mae Mortgage Pool 20251101 |
2.275% | 11/01/25 | AAA | 408,138 | |||||||||||||||
| 196 | Fannie Mae Mortgage Pool 20310601 |
2.418% | 6/01/31 | AAA | 206,544 | |||||||||||||||
| 1,015 | Fannie Mae Mortgage Pool 20311201 |
5.054% | 12/01/31 | AAA | 1,092,359 | |||||||||||||||
| 19 | Fannie Mae Mortgage Pool 20320301 |
2.389% | 3/01/32 | AAA | 20,268 | |||||||||||||||
| 132 | Fannie Mae Mortgage Pool 20320501 |
2.540% | 5/01/32 | AAA | 132,837 | |||||||||||||||
| 163 | Fannie Mae Mortgage Pool 20320501 |
2.389% | 5/01/32 | AAA | 169,089 | |||||||||||||||
| 27 | Fannie Mae Mortgage Pool 20321001 |
2.346% | 10/01/32 | AAA | 28,313 | |||||||||||||||
| 182 | Fannie Mae Mortgage Pool 20321201 |
2.504% | 12/01/32 | AAA | 185,187 | |||||||||||||||
| 2,314 | Fannie Mae Mortgage Pool 20340401 |
2.416% | 4/01/34 | AAA | 2,435,678 | |||||||||||||||
| 141 | Fannie Mae Mortgage Pool 20340401 |
2.257% | 4/01/34 | AAA | 143,656 | |||||||||||||||
| 2,165 | Fannie Mae Mortgage Pool 20340601 |
2.445% | 6/01/34 | AAA | 2,278,426 | |||||||||||||||
| 1,536 | Fannie Mae Mortgage Pool 20340701 |
1.937% | 7/01/34 | AAA | 1,602,544 | |||||||||||||||
| 1,510 | Fannie Mae Mortgage Pool 20341101 |
2.521% | 11/01/34 | AAA | 1,603,391 | |||||||||||||||
| 1,374 | Fannie Mae Mortgage Pool 20341101 |
2.322% | 11/01/34 | AAA | 1,438,155 | |||||||||||||||
| 2,583 | Fannie Mae Mortgage Pool 20350301, (4) |
2.540% | 3/01/35 | AAA | 2,719,899 | |||||||||||||||
| 1,205 | Fannie Mae Mortgage Pool 20350701 |
2.513% | 7/01/35 | AAA | 1,270,652 | |||||||||||||||
| 1,204 | Fannie Mae Mortgage Pool 20350801 |
2.260% | 8/01/35 | AAA | 1,268,034 | |||||||||||||||
| 583 | Fannie Mae Mortgage Pool 20351201 |
2.068% | 12/01/35 | AAA | 601,813 | |||||||||||||||
| 740 | Fannie Mae Mortgage Pool 20360701 |
2.745% | 7/01/36 | AAA | 785,232 | |||||||||||||||
| 2,680 | Fannie Mae Mortgage Pool 20360701 |
2.426% | 7/01/36 | AAA | 2,824,268 | |||||||||||||||
| 184 | Fannie Mae Mortgage Pool 20360801 |
2.404% | 8/01/36 | AAA | 193,364 | |||||||||||||||
| 741 | Fannie Mae Mortgage Pool 20360901 |
2.548% | 9/01/36 | AAA | 780,025 | |||||||||||||||
| 1,719 | Fannie Mae Mortgage Pool 20370801 |
2.386% | 8/01/37 | AAA | 1,810,336 | |||||||||||||||
| 1,701 | Fannie Mae Mortgage Pool 20380301 |
2.388% | 3/01/38 | AAA | 1,790,397 | |||||||||||||||
| 137 | Fannie Mae Mortgage Pool 20350801 |
1.898% | 8/01/35 | AAA | 142,533 | |||||||||||||||
| 1,845 | Fannie Mae Multifamily REMIC Trust 2010-M6, Guaranteed Pass Through Certificates 20200925 |
2.210% | 9/25/20 | AAA | 1,878,441 | |||||||||||||||
| 1,292 | Fannie Mae Real Estate Mortgage Investment Conduit, Pass Through Certificates 20340325 |
4.350% | 3/25/34 | AAA | 1,337,907 | |||||||||||||||
| 2,455 | Fannie Mae Real Estate Mortgage Investment Conduit, Pass Through Certificates 20180425 |
0.744% | 4/25/18 | AAA | 2,465,136 | |||||||||||||||
| 2,233 | Fannie Mae Real Estate Mortgage Investment Conduit, Pass Through Certificates 20341125 |
0.594% | 11/25/34 | AAA | 2,227,889 | |||||||||||||||
| 1,228 | Fannie Mae Real Estate Mortgage Investment Conduit, Pass Through Certificates 20220725 |
3.000% | 7/25/22 | AAA | 1,244,456 | |||||||||||||||
| Nuveen Investments | 95 |
Portfolio of Investments (Unaudited)
Nuveen Short Term Bond Fund (continued)
December 31, 2011
| Principal Amount (000) |
Description (1) | Coupon | Maturity | Ratings (2) | Value | |||||||||||||||
| ASSET-BACKED AND MORTGAGE-BACKED SECURITIES (continued) |
||||||||||||||||||||
| $ | 46 | Fannie Mae Real Estate Mortgage Investment Conduit, Pass Through Certificates 2022925 |
5.500% | 9/25/22 | AAA | $ | 50,568 | |||||||||||||
| 2,784 | Fannie Mae Real Estate Mortgage Investment Conduit, Pass Through Certificates 20280225 |
4.500% | 2/25/28 | AAA | 2,842,881 | |||||||||||||||
| 1,906 | Fannie Mae REMIC Pass-Through Certificates 20190925 |
3.305% | 9/25/19 | AAA | 2,023,200 | |||||||||||||||
| 2,740 | Fannie Mae REMIC Pass-Through Certificates 20200625 |
2.750% | 6/25/20 | AAA | 2,826,840 | |||||||||||||||
| 1,750 | FDIC Structured Sales Guaranteed Notes, Series 2010-L1A |
0.000% | 10/25/13 | AAA | 1,729,578 | |||||||||||||||
| 4,026 | FDIC Structures Sale Guaranteed Notes, Series 2010-S1 |
3.250% | 4/30/38 | AAA | 4,120,868 | |||||||||||||||
| 3,611 | FDIC Structures Sale Guaranteed Notes, Series 2010-S1 |
0.820% | 3/02/48 | AAA | 3,603,771 | |||||||||||||||
| 3,605 | FDIC Trust 2001-C1 |
1.840% | 4/25/31 | AAA | 3,638,690 | |||||||||||||||
| 327 | Federal Home Loan Bank Mortgages 20261201 |
2.514% | 12/01/26 | AAA | 346,599 | |||||||||||||||
| 254 | Federal Home Loan Bank Mortgages 20290101 |
2.394% | 1/01/29 | AAA | 266,954 | |||||||||||||||
| 235 | Federal Home Loan Bank Mortgages 20291001 |
2.260% | 10/01/29 | AAA | 246,028 | |||||||||||||||
| 254 | Federal Home Loan Bank Mortgages 20300401 |
3.967% | 4/01/30 | AAA | 270,967 | |||||||||||||||
| 167 | Federal Home Loan Bank Mortgages 20300501 |
1.945% | 5/01/30 | AAA | 167,558 | |||||||||||||||
| 1,188 | Federal Home Loan Bank Mortgages 20301001 |
2.375% | 10/01/30 | AAA | 1,252,783 | |||||||||||||||
| 136 | Federal Home Loan Bank Mortgages 20310601 |
2.239% | 6/01/31 | AAA | 142,950 | |||||||||||||||
| 1,959 | Federal Home Loan Bank Mortgages 20320801 |
2.266% | 8/01/32 | AAA | 2,056,785 | |||||||||||||||
| 844 | Federal Home Loan Bank Mortgages 20320901 |
2.390% | 9/01/32 | AAA | 890,400 | |||||||||||||||
| 154 | Federal Home Loan Bank Mortgages 20321001 |
2.487% | 10/01/32 | AAA | 163,104 | |||||||||||||||
| 568 | Federal Home Loan Bank Mortgages 20330501 |
2.472% | 5/01/33 | AAA | 597,476 | |||||||||||||||
| 1,194 | Federal Home Loan Bank Mortgages 20331001 |
2.344% | 10/01/33 | AAA | 1,252,320 | |||||||||||||||
| 1,285 | Federal Home Loan Bank Mortgages 20340301 |
2.480% | 3/01/34 | AAA | 1,342,460 | |||||||||||||||
| 2,406 | Federal Home Loan Bank Mortgages 20360301 |
2.532% | 3/01/36 | AAA | 2,542,557 | |||||||||||||||
| 2,601 | Federal Home Loan Bank Mortgages 20380101 |
2.482% | 6/01/38 | AAA | 2,743,264 | |||||||||||||||
| 898 | Federal Home Loan Mortgage Corporation, REMIC 20121015 |
1.250% | 10/15/12 | AAA | 899,012 | |||||||||||||||
| 1,196 | Federal Home Loan Mortgage Corporation, REMIC 20180115 |
4.000% | 1/15/18 | AAA | 1,210,288 | |||||||||||||||
| 1,804 | Federal Home Loan Mortgage Corporation, REMIC 20180315 |
3.250% | 3/15/18 | AAA | 1,856,233 | |||||||||||||||
| 16 | Federal Home Loan Mortgage Corporation, REMIC 20201215 |
6.000% | 12/15/20 | AAA | 16,931 | |||||||||||||||
| 1,294 | Federal Home Loan Mortgage Corporation, REMIC 20141215 |
4.000% | 12/15/14 | AAA | 1,318,632 | |||||||||||||||
| 526 | Federal Home Loan Mortgage Corporation, REMIC 20141215 |
4.000% | 12/15/14 | AAA | 535,362 | |||||||||||||||
| 869 | Federal Home Loan Mortgage Corporation, REMIC 20170715 |
4.500% | 7/15/17 | AAA | 874,086 | |||||||||||||||
| 3,575 | Fieldstone Mortgage Investment Trust, Mortgage Backed Notes, Series 2005-1 |
1.374% | 3/25/35 | A+ | 3,216,675 | |||||||||||||||
| 710 | Ford Credit Auto Owner Trust 10A |
2.930% | 11/15/15 | AAA | 735,939 | |||||||||||||||
| 1,000 | Ford Credit Auto Owner Trust 2009E |
2.420% | 11/15/14 | AAA | 1,018,253 | |||||||||||||||
| 1,480 | Ford Credit Floorplan Master Owner Trust Series 2010-3 |
4.200% | 2/15/17 | AAA | 1,590,667 | |||||||||||||||
| 4,020 | Fosse Master Issuer PLC, Residential Mortgage Pool, Series 2011-1A |
1.805% | 10/19/54 | AAA | 4,004,680 | |||||||||||||||
| 1,867 | Freddie Mac Mortgage Pool, Various 20180501 |
4.500% | 5/01/18 | AAA | 1,992,281 | |||||||||||||||
| 639 | Freddie Mac Mortgage Pool, Various 20220401 |
4.500% | 4/01/22 | AAA | 667,209 | |||||||||||||||
| 2,596 | Freddie Mac Multi-Class Certificates SERIES 3780 20201215 |
0.678% | 12/15/20 | AAA | 2,598,750 | |||||||||||||||
| 2,473 | Freddie Mac Multifamily Structured Pass Through Certificates, Series K703 20180125 |
1.873% | 1/25/18 | AAA | 2,508,497 | |||||||||||||||
| 876 | Freddie Mac Non Gold Participation Certificates 20180125 |
2.340% | 8/01/36 | AAA | 919,798 | |||||||||||||||
| 2,783 | Freddie Mac Structured Pass-Through Certificates Series T045 20360801 |
4.520% | 8/27/12 | AAA | 2,833,627 | |||||||||||||||
| 96 | Nuveen Investments |
| Principal Amount (000) |
Description (1) | Coupon | Maturity | Ratings (2) | Value | |||||||||||||||
| ASSET-BACKED AND MORTGAGE-BACKED SECURITIES (continued) |
||||||||||||||||||||
| $ | 501 | General Electric Capital Commercial Mortgage Corporation, Commercial Mortgage Pass-Through Certificates, Series 2002-2 |
5.349% | 8/11/36 | AAA | $ | 506,671 | |||||||||||||
| 1,840 | General Electric Capital Credit Card Master Note Trust Series 2010-3 |
2.210% | 6/15/16 | AAA | 1,876,394 | |||||||||||||||
| 51 | GMAC Mortgage Corporation, Mortgage Pass-Through Certificates, Series 2010-1 |
4.250% | 7/25/40 | Aa2 | 51,261 | |||||||||||||||
| 9,265 | GMAC Mortgage Services Advance Funding, Series 2011-1A |
3.720% | 3/15/23 | Aaa | 9,241,838 | |||||||||||||||
| 6,998 | Goldman Sachs Mortgage Securities Corporation II, COmmercial Mortgage Pass Through Certificates, Series 2001-ALF |
2.716% | 2/12/21 | AAA | 7,014,641 | |||||||||||||||
| 5,768 | Goldman Sachs Mortgage Securities Corporation II, Commercial Mortgage Pass-Through Certificates, Series 2010-C1 |
3.679% | 8/12/43 | Aaa | 6,027,692 | |||||||||||||||
| 1,900 | Goldman Sachs Mortgage Securities Corporation, Mortgage Pass-Through Certificates, Series 2005-AR1 |
3.052% | 1/25/35 | CC | 949,768 | |||||||||||||||
| 1,271 | Government National Mortgage Assocation, Guaranteed REMIC Pass Through Securities and MX Securities Trust |
4.500% | 5/16/38 | AAA | 1,350,550 | |||||||||||||||
| 1,308 | Government National Mortgage Assocation, Guaranteed REMIC Pass Through Securities and MX Securities Trust |
5.500% | 6/20/28 | AAA | 1,328,267 | |||||||||||||||
| 106 | Government National Mortgage Association Pool |
2.000% | 8/20/21 | AAA | 109,906 | |||||||||||||||
| 144 | Government National Mortgage Association Pool |
1.625% | 7/20/22 | AAA | 148,607 | |||||||||||||||
| 81 | Government National Mortgage Association Pool |
1.625% | 9/20/25 | AAA | 83,332 | |||||||||||||||
| 65 | Government National Mortgage Association Pool |
2.375% | 4/20/26 | AAA | 67,386 | |||||||||||||||
| 24 | Government National Mortgage Association Pool |
1.625% | 8/20/27 | AAA | 24,586 | |||||||||||||||
| 37 | Government National Mortgage Association Pool |
2.375% | 1/20/28 | AAA | 37,812 | |||||||||||||||
| 95 | Government National Mortgage Association Pool |
2.375% | 5/20/29 | AAA | 98,768 | |||||||||||||||
| 194 | Government National Mortgage Association Pool |
1.875% | 11/20/30 | AAA | 200,546 | |||||||||||||||
| 61 | Government National Mortgage Association Pool |
2.375% | 4/20/31 | AAA | 62,869 | |||||||||||||||
| 207 | Government National Mortgage Association Pool |
1.625% | 8/20/31 | AAA | 212,812 | |||||||||||||||
| 45 | Government National Mortgage Association Pool |
2.500% | 2/20/32 | AAA | 46,621 | |||||||||||||||
| 148 | Green Tree Fiancial Manufactured Housing Loans, Series 2008-MH1 |
7.000% | 4/25/38 | AAA | 149,664 | |||||||||||||||
| 2,764 | Greenwich Capital Commercial Funding Corporation, Commercial Mortgage Pass-Through Certificates, Series 2005-GG5 |
5.117% | 4/10/37 | AAA | 2,775,827 | |||||||||||||||
| 3,863 | Hertz Vehicle Financing LLC Series 2009 |
4.260% | 3/25/14 | Aaa | 3,954,484 | |||||||||||||||
| 1,051 | IMC Home Mortgage Company, Home Equity Loan Pass-Through Certificates, Series 1998-3 |
6.770% | 8/20/29 | AA+ | 968,466 | |||||||||||||||
| 415 | IndyMac INDX Mortgage Loan Trust, Pass Through Certificates, Series 2005-AR1 |
2.625% | 3/25/35 | AAA | 354,017 | |||||||||||||||
| 147 | JPMorgan Mortage Trust, Mortgage Pass-Through Certtificates, Series 2006-A7 |
5.687% | 1/25/37 | C | 12,337 | |||||||||||||||
| 4,171 | JPMorgan Chase Commercial Mortgage Securities Corporation, Commercial Mortgage Pass-Through Certificates, Series 2010-C1 |
3.853% | 6/15/43 | AAA | 4,361,600 | |||||||||||||||
| 3,729 | JPMorgan Chase Commercial Mortgage Securities Corporation, Commercial Mortgage Pass-Through Certificates, Series 2010-C2 A1 |
2.749% | 11/15/43 | AAA | 3,775,973 | |||||||||||||||
| 7,745 | JPMorgan Chase Commerical Mortgage Trust, Commerical Mortage Pass Through Certificates, Series 2011-C4 |
1.525% | 7/17/46 | AAA | 7,713,635 | |||||||||||||||
| 2,743 | Merrill Lynch Mortgage Trust, Commercial Mortgage Pass-Through Certificates, Series 2006-C1 A2 |
5.621% | 5/12/39 | AAA | 2,816,578 | |||||||||||||||
| 2,469 | Morgan Stanley ABS Capital I Inc., Mortgage Pass-Through Certificates, Series 2007-NC2 |
0.404% | 2/25/37 | B3 | 2,264,433 | |||||||||||||||
| 1,882 | Morgan Stanley Capital I Inc Trust, Mortage Pass-Through Certificates, Series 2006-NC2 |
0.474% | 2/25/36 | B– | 1,635,780 | |||||||||||||||
| Nuveen Investments | 97 |
Portfolio of Investments (Unaudited)
Nuveen Short Term Bond Fund (continued)
December 31, 2011
| Principal Amount (000) |
Description (1) | Coupon | Maturity | Ratings (2) | Value | |||||||||||||||
| ASSET-BACKED AND MORTGAGE-BACKED SECURITIES (continued) |
||||||||||||||||||||
| $ | 4,289 | Morgan Stanley Capital I Trust, Commercial Mortgage Pass-Through Certificates, Series 2011-C1 |
2.602% | 9/15/47 | AAA | $ | 4,352,830 | |||||||||||||
| 2,345 | Morgan Stanley Dean Witter Capital I Trust, Commercial Mortgage Pass-Through Certificates, Series 2002-TOP7 |
5.980% | 1/15/39 | AAA | 2,362,188 | |||||||||||||||
| 341 | Mortgage Asset Securitization Tranasction Inc., Alternative Loan Trust Mortgage Pass-Through Certificates, Series 2004-13 |
8.000% | 1/25/35 | A | 351,881 | |||||||||||||||
| 1,870 | Mortgage Asset Securitization Transaction Inc., Adjustable Rate Mortgage Pass-Through Certificates, Series 2003-5 |
1.969% | 11/25/33 | AAA | 1,436,815 | |||||||||||||||
| 2,477 | Mortgage Equity Conversion Asset Trust 2010-1A |
4.000% | 7/25/60 | AA | 2,475,281 | |||||||||||||||
| 1,497 | National Credit Union Administration, Guaranteed Notes Series 2011-R1 |
0.724% | 1/08/20 | Aaa | 1,499,464 | |||||||||||||||
| 1,042 | National Credit Union Adminstration Guaranteed Structured Collateral Notes |
2.900% | 10/29/20 | AAA | 1,100,156 | |||||||||||||||
| 2,097 | National Credit Union Adminstration, Guaranteed Notes, Series 2010-R1 |
1.840% | 10/07/20 | AAA | 2,110,467 | |||||||||||||||
| 5,913 | National Credit Union Guaranteed Notes, Series 2010-R3 2A |
0.834% | 12/08/20 | AAA | 5,936,821 | |||||||||||||||
| 2,669 | Newcastle Investment Trust, Manufactured Housing Contracts and Loans, Series 2010-MH1 |
4.500% | 7/10/35 | AAA | 2,717,796 | |||||||||||||||
| 4,178 | Newcastle Investment Trust, Manufactured Housing Loans, Series 2011-MH1 |
2.450% | 12/10/33 | AAA | 4,206,794 | |||||||||||||||
| 178 | Nissan Auto Receivables Owner Trust, Series 2009-1 |
5.000% | 9/15/14 | AAA | 179,777 | |||||||||||||||
| 2,000 | Ocwen Advance Receivables Backed Notes, Series 2009-3A |
4.140% | 7/15/23 | AAA | 2,002,500 | |||||||||||||||
| 5,795 | Park Place Securities Inc., Asset Backed Pass Through Certificatess Series 2005- WCH1 |
0.814% | 2/25/35 | AA | 4,977,609 | |||||||||||||||
| 105 | PG&E Energy Recovery Funding LLC Bond Series 2005-2 |
5.030% | 3/25/14 | AAA | 106,354 | |||||||||||||||
| 800 | PSE&G Transition Funding LLC Bonds, Series 2001-1 |
6.610% | 6/15/15 | AAA | 838,926 | |||||||||||||||
| 1,598 | RBSSP Resecuritization Trust 2009-10 |
0.394% | 3/26/37 | N/R | 1,550,223 | |||||||||||||||
| 214 | RBSSP Resecuritization Trust 2009-11 |
2.044% | 12/26/37 | Aa3 | 214,046 | |||||||||||||||
| 1,022 | RBSSP Resecuritization Trust 2009-13 |
0.394% | 11/26/36 | A | 1,012,705 | |||||||||||||||
| 180 | RBSSP Resecuritization Trust 2009-8 |
0.434% | 3/26/37 | Aaa | 177,449 | |||||||||||||||
| 2,031 | RBSSP Resecuritization Trust 2010-10 |
0.424% | 9/26/36 | Aaa | 1,796,565 | |||||||||||||||
| 2,227 | RBSSP Resecuritization Trust 2010-11 |
0.464% | 3/26/37 | Aaa | 2,126,093 | |||||||||||||||
| 1,442 | RBSSP Resecuritization Trust 2010-8 |
0.624% | 7/26/36 | Aaa | 1,349,993 | |||||||||||||||
| 2,425 | Renaissance Home Equity Loan Trust I, Home Equity Loan Asset-Backed Notes, Series 2005-3 |
5.140% | 11/25/35 | AA+ | 1,830,055 | |||||||||||||||
| 833 | Salomon Brothers Commercial Mortgage Trust Pass-Through Certificates, Series 2002-KEY2 |
4.865% | 3/18/36 | AAA | 840,651 | |||||||||||||||
| 4,750 | Santander Drive Auto Receivables Trust, Series 2011-1 |
1.280% | 1/15/15 | Aaa | 4,744,307 | |||||||||||||||
| 1,850 | Santander Drive Auto Receivables Trust, Series 2011-3 |
1.110% | 8/15/14 | AAA | 1,847,984 | |||||||||||||||
| 569 | Sequoia Mortgage Trust, Mortgage Pass-Through Certificates, Series 2007-1 |
3.414% | 2/20/47 | CCC | 423,949 | |||||||||||||||
| 9,080 | SMART Trust, Asset Backed Securities, Series 2011-1USA |
1.128% | 10/14/14 | AAA | 9,063,541 | |||||||||||||||
| 4,544 | Springleaf Mortgage Loan Trust 2011-1 |
4.050% | 1/25/58 | AAA | 4,538,649 | |||||||||||||||
| 175 | Structured Adjustable Rate Mortgage Loan Trust, Mortgage Pass-Through Certificates, Series 2004-11 |
2.610% | 8/25/34 | Baa2 | 150,075 | |||||||||||||||
| 1,210 | Thornburg Mortgage Securities Trust, Mortgage Loan Pass-Through Certificates, Series 2007-4 |
6.054% | 9/25/37 | AAA | 1,176,703 | |||||||||||||||
| 2,621 | U.S. Small Business Administration Guaranteed Participating Securities Participation Certificates, Series 2005-10B |
4.940% | 8/10/15 | AAA | 2,777,868 | |||||||||||||||
| 823 | U.S. Small Business Administration Guaranteed Participating Securities Participation Certificates, Series 2006-10A |
5.408% | 2/10/16 | AAA | 894,211 | |||||||||||||||
| 1,265 | U.S. Small Business Administration Guaranteed Participating Securities, Participation Certificates Series 2005-P10A |
4.638% | 2/10/15 | AAA | 1,344,386 | |||||||||||||||
| 98 | Nuveen Investments |
| Principal Amount (000) |
Description (1) | Coupon | Maturity | Ratings (2) | Value | |||||||||||||||
| ASSET-BACKED AND MORTGAGE-BACKED SECURITIES (continued) |
||||||||||||||||||||
| $ | 2,459 | U.S. Small Business Administration Guaranteed Participating Securities, Participation Certificates, Series 2005-10B |
4.941% | 9/10/15 | AAA | $ | 2,651,705 | |||||||||||||
| 455 | U.S. Small Business Administration Guaranteed Participating Securities, Participation Certificates, Series 2007-10A |
5.459% | 2/10/17 | AAA | 492,195 | |||||||||||||||
| 400 | USAA Auto Owners Trust 2010-1 |
2.140% | 9/15/15 | AAA | 405,730 | |||||||||||||||
| 1,906 | Vericrest Opportunity Loan Transferee, Series 2011-NL1A |
5.926% | 12/26/50 | N/R | 1,908,198 | |||||||||||||||
| 1,256 | Vericrest Opportunity Loan Transferee, Series 2011-NL2A |
5.682% | 6/25/51 | N/R | 1,254,981 | |||||||||||||||
| 1,878 | Vericrest Opportunity Loan Transferee, Series 2011-NL3A |
5.194% | 9/25/51 | N/R | 1,866,043 | |||||||||||||||
| 4,877 | Vornado DP LLC Commercial Mortgage Credit Tenant Lease Series 2010-VNO |
2.970% | 9/14/28 | AAA | 5,008,395 | |||||||||||||||
| 1,739 | Wachovia Bank Commercial Mortgage Trust, Commercial Mortgage Pass-Through Certificates, Series 2007-C30 |
5.246% | 12/15/43 | AAA | 1,757,520 | |||||||||||||||
| 2,599 | Wachovia Bank Commercial Mortgage Trust, Commercial Mortgage Pass-Through Certificates, Series 2007-WHl8 |
0.358% | 6/15/20 | Aaa | 2,324,361 | |||||||||||||||
| 598 | Washington Mutual Mortgage Securities Corporation, Mortgage Pass-through Certificates, Series 2007-HY2 |
5.502% | 9/25/36 | CCC | 56,778 | |||||||||||||||
| 1,101 | Wells Fargo Mortagge Backed Securities Trust, Mortgage Pass_Through Certificate Series 2007-2 |
5.750% | 3/25/37 | Caa1 | 905,470 | |||||||||||||||
| 338 | Wells Fargo Mortgage Backed Securities Trust, Mortgage Pass-Through Certificate Series 2006-3 |
5.500% | 3/25/36 | B2 | 330,528 | |||||||||||||||
| 1,659 | Wells Fargo Mortgage Backed Securities Trust, Mortgage Pass-Through Certificate Series 2006-AR14 |
2.628% | 10/25/36 | Caa2 | 1,114,312 | |||||||||||||||
| 41 | Wells Fargo Mortgage Backed Securties, 2005-AR16 Class 3A2 |
2.690% | 10/25/35 | BBB– | 36,038 | |||||||||||||||
| 4,327 | Wells Fargo-RBS Commercial Mortgage Trust, Commercial Mortgage Pass-Through Certificates, Series 2011-C3 |
1.988% | 3/17/44 | AAA | 4,367,666 | |||||||||||||||
| 4,310 | WF-RBS Commercial Mortage Trust, Commercial Mortgage Pass-Through Certificates, Series 2011-C2 |
2.501% | 2/18/44 | AAA | 4,388,635 | |||||||||||||||
| 354 | World Omni Auto Receeivables Trust, Series 2010A |
1.340% | 12/16/13 | AAA | 354,060 | |||||||||||||||
| $ | 351,332 | Total Asset-Backed and Mortgage-Backed Securities (cost $345,926,595) |
346,042,784 | |||||||||||||||||
| Principal Amount (000) |
Description (1) | Coupon | Maturity | Ratings (2) | Value | |||||||||||||||
| SOVEREIGN DEBT – 2.2% |
||||||||||||||||||||
| Canada – 1.2% |
||||||||||||||||||||
| 8,000 CAD | Canadian Government |
1.500% | 12/01/12 | Aaa | $ | 7,889,904 | ||||||||||||||
| 1,350 CAD | Province of Ontario |
1.375% | 1/27/14 | Aa1 | 1,364,135 | |||||||||||||||
| 9,350 CAD | Total Canada |
9,254,039 | ||||||||||||||||||
| Mexico – 0.5% |
||||||||||||||||||||
| 510 MXN | United Mexican States |
9.500% | 12/18/14 | A– | 4,087,762 | |||||||||||||||
| New Zealand – 0.5% |
||||||||||||||||||||
| 5,000 NZD | New Zealand Government |
6.500% | 4/15/13 | AAA | 4,090,131 | |||||||||||||||
| Total Sovereign Debt (cost $18,275,216) |
17,431,932 | |||||||||||||||||||
| Shares | Description (1) | Value | ||||||||||||||||||
| INVESTMENTS PURCHASED WITH COLLATERAL FROM SECURITIES LENDING – 10.6% |
|
|||||||||||||||||||
| Money Market Funds – 10.6% |
||||||||||||||||||||
| 85,327,821 | Mount Vernon Securities Lending Prime Portfolio, 0.233% (5), (6) |
$ | 85,327,821 | |||||||||||||||||
| Total Investments Purchased with Collateral from Securities Lending (cost $85,327,821) |
|
85,327,821 | ||||||||||||||||||
| Nuveen Investments | 99 |
Portfolio of Investments (Unaudited)
Nuveen Short Term Bond Fund (continued)
December 31, 2011
| Principal Shares |
Description (1) | Coupon | Maturity | Rating (2) | Value | |||||||||||||||
| SHORT-TERM INVESTMENTS – 1.6% |
||||||||||||||||||||
| Money Market Funds – 1.2% |
||||||||||||||||||||
| 9,772,646 | First American Treasury Obligations Fund, Class Z |
0.000% (5) | N/A | N/A | $ | 9,772,646 | ||||||||||||||
| U.S. Government and Agency Obligations – 0.4% |
||||||||||||||||||||
| $ | 765 | U.S. Treasury Bills, (7) |
0.013 | 4/05/12 | Aaa | 764,960 | ||||||||||||||
| 985 | U.S. Treasury Bills, (7) |
0.018 | 5/03/12 | Aaa | 984,919 | |||||||||||||||
| 300 | U.S. Treasury Bills, (7) |
0.033 | 5/31/12 | Aaa | 299,950 | |||||||||||||||
| 1,180 | U.S. Treasury Bills, (7) |
0.053 | 7/26/12 | Aaa | 1,179,630 | |||||||||||||||
| $ | 3,230 | Total U.S. Government and Agency Obligations |
3,229,459 | |||||||||||||||||
| Total Short-Term Investments (cost $13,002,291) |
13,002,105 | |||||||||||||||||||
| Total Investments (cost $888,076,727) – 110.3% |
887,087,088 | |||||||||||||||||||
| Other Assets Less Liabilities – (10.3)% (8) |
(82,950,161) | |||||||||||||||||||
| Net Assets – 100% |
$ | 804,136,927 | ||||||||||||||||||
Investments in Derivatives at December 31, 2011:
Forward Foreign Currency Exchange Contracts outstanding:
| Counterparty | Currency Contracts to Deliver |
Amount (Local Currency) |
In Exchange For Currency |
Amount (Local Currency) |
Settlement Date |
Unrealized Appreciation Depreciation) (U.S. Dollars) |
||||||||||||||||||
| Citigroup |
U.S. Dollar | 4,732,320 | Australian Dollar | 4,800,000 | 2/21/12 | $ | 146,966 | |||||||||||||||||
| Citigroup |
U.S. Dollar | 3,891,271 | South Korean Won | 4,364,450,000 | 1/13/12 | (106,798) | ||||||||||||||||||
| $ | 40,168 | |||||||||||||||||||||||
Interest Rate Swaps outstanding:
| Counterparty | Notional Amount |
Fund Pay/Receive Floating Rate |
Floating Rate Index |
Fixed Rate* |
Fixed Rate Payment Frequency |
Termination Date |
Value |
Unrealized Appreciation (Depreciation) (U.S. Dollars) |
||||||||||||||||||||||||
| JPMorgan Chase |
$ | 4,000,000 | Receive | 3-Month USD-LIBOR | 3.858 | % | Semi-Annually | 1/19/20 | $ | (706,572 | ) | $ | (706,572 | ) | ||||||||||||||||||
| UBS |
16,000,000 | Receive | 3-Month USD-LIBOR | 1.133 | Semi-Annually | 3/25/12 | (68,109 | ) | (68,109 | ) | ||||||||||||||||||||||
| UBS |
18,000,000 | Receive | 3-Month USD-LIBOR | 1.048 | Semi-Annually | 6/25/12 | (38,796 | ) | (38,796 | ) | ||||||||||||||||||||||
| UBS |
4,000,000 | Receive | 3-Month USD-LIBOR | 3.001 | Semi-Annually | 8/03/14 | (278,935 | ) | (278,935 | ) | ||||||||||||||||||||||
| $ | (1,092,412 | ) | ||||||||||||||||||||||||||||||
| * | Annualized. |
Futures Contracts outstanding:
| Type | Contract Position |
Number of Contracts |
Contract Expiration |
Value (U.S. Dollars) |
Unrealized Appreciation (Depreciation) (U.S. Dollars) |
|||||||||||||||
| U.S. Treasury 2-Year Note |
Short | (203 | ) | 3/12 | $ | (44,771,017 | ) | $ | (22,456 | ) | ||||||||||
| U.S. Treasury 5-Year Note |
Short | (673 | ) | 3/12 | (82,952,506 | ) | (359,880 | ) | ||||||||||||
| U.S. Treasury 10-Year Note |
Short | (44 | ) | 3/12 | (5,769,500 | ) | (52,089 | ) | ||||||||||||
| $ | (434,425 | ) | ||||||||||||||||||
| 100 | Nuveen Investments |
| For Fund portfolio compliance purposes, the Fund’s industry classifications refer to any one or more of the industry sub-classifications used by one or more widely recognized market indexes or ratings group indexes, and/or as defined by Fund management. This definition may not apply for purposes of this report which may combine industry sub-classifications into sectors for reporting ease. |
| (1) | All Percentages shown in the Portfolio of Investments are based on net assets. |
| (2) | Ratings: Using the highest of Standard & Poor’s Group (“Standard & Poor’s”), Moody’s Investors Service, Inc. (“Moody’s”) or Fitch, Inc. (“Fitch”) rating. Ratings below BBB by Standard & Poor’s, Baa by Moody’s or BBB by Fitch are considered to be below investment grade. Holdings designated N/R are not rated by any of these national rating agencies. |
| (3) | Optional Call Provisions: Dates (month and year) and prices of the earliest optional call or redemption. There may be other call provisions at varying prices at later dates. Certain mortgage-backed securities may be subject to periodic principal paydowns. |
| (4) | Investment, or a portion of investment, is out on loan for securities lending. |
| (5) | The rate shown is the annualized seven-day effective yield as of December 31, 2011. |
| (6) | The Fund may loan securities representing up to one third of the fair value of its total assets (which includes collateral for securities on loan) to broker-dealers, banks, or other institutional borrowers of securities. The Fund maintains collateral equal to at least 102% of the fair value of the securities loaned. The adequacy of the collateral is monitored on a daily basis. The cash collateral received by the Fund is invested in this money market fund. |
| (7) | Investment, or portion of investment, segregated as collateral for investments in derivatives. Yield shown is effective yield as of December 31, 2011. |
| (8) | Other Assets Less Liabilities includes the Unrealized Appreciation (Depreciation) of derivative instruments as noted in Investments in Derivatives at December 31, 2011. |
| N/A | Not applicable. |
| N/R | Not Rated. |
| 144A | Investment is exempt from registration under Rule 144A of the Securities Act of 1933, as amended. These investments may only be resold in transactions exempt from registration, which are normally those transactions with qualified institutional buyers. |
| I/O | Interest Only Security. |
| P/O | Principal Only Security. |
| CAD | Canadian Dollar |
| MXN | Mexican Peso |
| NZD | New Zealand Dollar |
| USD-LIBOR | United States Dollar–London Inter-Bank Offered Rate. |
See accompanying notes to financial statements.
| Nuveen Investments | 101 |
Portfolio of Investments (Unaudited)
Nuveen Total Return Bond Fund
December 31, 2011
| Shares | Description (1) | Value | ||||||||||||||||||
| COMMON STOCK – 0.0% |
||||||||||||||||||||
| Building Products – 0.0% |
||||||||||||||||||||
| 50 | Dayton Superior, (2) |
$ | 2,839 | |||||||||||||||||
| 55 | Dayton Superior, (2) |
3,154 | ||||||||||||||||||
| Total Common Stock (cost $20,079) |
5,993 | |||||||||||||||||||
| Principal Amount (000) |
Description (1) | Coupon | Maturity | Ratings (3) | Value | |||||||||||||||
| CORPORATE BONDS – 50.3% |
||||||||||||||||||||
| Aerospace & Defense – 0.9% |
||||||||||||||||||||
| $ | 110 | DynCorp International Inc. |
10.375% | 7/01/17 | B2 | $ | 95,700 | |||||||||||||
| 2,140 | Exelis, Inc., 144A |
5.550% | 10/01/21 | BBB+ | 2,234,203 | |||||||||||||||
| 2,280 | Huntington Ingalls Industries Inc., 144A |
7.125% | 3/15/21 | BB | 2,234,400 | |||||||||||||||
| 850 | Martin Marietta Materials |
6.600% | 4/15/18 | BBB+ | 895,635 | |||||||||||||||
| 300 | Textron Inc. |
7.250% | 10/01/19 | BBB– | 339,303 | |||||||||||||||
| 5,680 | Aerospace & Defense |
5,799,241 | ||||||||||||||||||
| Airlines – 1.5% |
||||||||||||||||||||
| 125 | Air Canada, 144A |
12.000% | 2/01/16 | B– | 107,813 | |||||||||||||||
| 1,320 | Air Canada, 144A, (4) |
9.250% | 8/01/15 | B+ | 1,155,000 | |||||||||||||||
| 2,060 | American Airlines Pass Through Trust 2011-2 |
8.625% | 10/15/21 | BBB– | 2,101,200 | |||||||||||||||
| 1,213 | American West Airlines Pass Through Certificates, Series 2001-1 |
8.057% | 7/02/20 | BBB | 1,188,814 | |||||||||||||||
| 1,700 | Delta Airlines, (4) |
5.300% | 4/15/19 | A– | 1,717,000 | |||||||||||||||
| 1,040 | Northwest Airlines Trust Pass Through Certificates 2007-1 |
7.027% | 11/01/19 | Baa1 | 1,059,255 | |||||||||||||||
| 1,201 | United Airlines Pass Through Trust, Series 2007 |
6.636% | 7/02/22 | Baa2 | 1,201,094 | |||||||||||||||
| 1,152 | United Airlines Pass-Through Trust. Series 2009-1 |
10.400% | 11/01/16 | BBB+ | 1,274,104 | |||||||||||||||
| 9,811 | Airlines |
9,804,280 | ||||||||||||||||||
| Auto Components – 0.3% |
||||||||||||||||||||
| 1,805 | Dana Holding Corporation |
6.500% | 2/15/19 | BB– | 1,823,050 | |||||||||||||||
| Automobiles – 0.6% |
||||||||||||||||||||
| 2,920 | Chrysler GP/CG Company, 144A, (4) |
8.000% | 6/15/19 | B | 2,671,800 | |||||||||||||||
| 1,350 | Ford Motor Credit Company |
6.625% | 8/15/17 | BB+ | 1,469,555 | |||||||||||||||
| 4,270 | Automobiles |
4,141,355 | ||||||||||||||||||
| Beverages – 0.3% |
||||||||||||||||||||
| 1,560 | Pernod-Ricard SA, 144A |
5.750% | 4/07/21 | BBB– | 1,759,994 | |||||||||||||||
| Biotechnology – 0.5% |
||||||||||||||||||||
| 1,115 | Gilead Sciences Inc., (4) |
4.400% | 12/01/21 | A– | 1,180,442 | |||||||||||||||
| 1,807 | STHI Holding Corporation, 144A |
8.000% | 3/15/18 | B | 1,856,693 | |||||||||||||||
| 2,922 | Biotechnology |
3,037,135 | ||||||||||||||||||
| Capital Markets – 3.4% |
||||||||||||||||||||
| 1,495 | Goldman Sachs Capital II |
5.793% | 6/01/43 | BBB+ | 919,425 | |||||||||||||||
| 505 | Goldman Sachs Group, Inc. |
5.500% | 11/15/14 | A1 | 520,286 | |||||||||||||||
| 8,030 | Goldman Sachs Group, Inc. |
6.000% | 6/15/20 | A1 | 8,225,627 | |||||||||||||||
| 1,890 | Goldman Sachs Group, Inc. |
5.250% | 7/27/21 | A1 | 1,843,771 | |||||||||||||||
| 2,475 | Morgan Stanley |
5.750% | 1/25/21 | A | 2,308,695 | |||||||||||||||
| 750 | Morgan Stanley, (4) |
7.300% | 5/13/19 | A | 763,837 | |||||||||||||||
| 2,600 | Morgan Stanley, (4) |
5.500% | 7/24/20 | A | 2,363,998 | |||||||||||||||
| 3,890 | Morgan Stanley, (4) |
5.500% | 7/28/21 | A2 | 3,596,830 | |||||||||||||||
| 102 | Nuveen Investments |
| Principal Amount (000) |
Description (1) | Coupon | Maturity | Ratings (3) | Value | |||||||||||||||
| Capital Markets (continued) |
||||||||||||||||||||
| $ | 150 | Morgan Stanley |
5.625% | 9/23/19 | A | $ | 138,912 | |||||||||||||
| 235 | State Street Corporation |
4.956% | 3/15/18 | A– | 244,264 | |||||||||||||||
| 1,410 | UBS AG Stamford |
4.875% | 8/04/20 | Aa3 | 1,400,382 | |||||||||||||||
| 23,430 | Total Capital Markets |
22,326,027 | ||||||||||||||||||
| Chemicals – 1.4% |
||||||||||||||||||||
| 190 | Airgas, Inc. |
4.500% | 9/15/14 | BBB | 201,316 | |||||||||||||||
| 1,625 | Braskem Finance Limited, 144A, (4) |
5.750% | 4/15/21 | BBB– | 1,612,813 | |||||||||||||||
| 145 | CF Industries Inc. |
6.875% | 5/01/18 | BBB– | 166,025 | |||||||||||||||
| 1,125 | Ecolab Inc. |
4.350% | 12/08/21 | BBB+ | 1,201,375 | |||||||||||||||
| 1,350 | Georgia Gulf Corporation |
9.000% | 1/15/17 | B+ | 1,427,625 | |||||||||||||||
| 1,430 | Huntsman International LLC, Series 2011, (4) |
8.625% | 3/15/21 | B | 1,515,800 | |||||||||||||||
| 1,915 | Incitec Pivot Finance, 144A |
6.000% | 12/10/19 | BBB | 2,092,383 | |||||||||||||||
| 225 | Rhodia SA, 144A |
6.875% | 9/15/20 | BBB+ | 245,250 | |||||||||||||||
| 750 | Sinochem Overseas Capital Limited, (4) |
4.500% | 11/12/20 | BBB+ | 730,035 | |||||||||||||||
| 8,755 | Total Chemicals |
9,192,622 | ||||||||||||||||||
| Commercial Banks – 2.5% |
||||||||||||||||||||
| 1,330 | Banco Bradesco S.A. Grand Cayman, 144A |
4.125% | 5/16/16 | Baa1 | 1,341,305 | |||||||||||||||
| 2,000 | Bancolombia SA |
5.950% | 6/03/21 | Baa2 | 2,007,500 | |||||||||||||||
| 1,330 | Barclays Bank PLC |
6.881% | 3/29/49 | N/R | 809,034 | |||||||||||||||
| 1,000 | BBVA Bancomer SA Texas, 144A |
4.500% | 3/10/16 | A1 | 980,000 | |||||||||||||||
| 2,360 | HSBC Holdings PLC |
6.800% | 6/01/38 | AA– | 2,444,361 | |||||||||||||||
| 2,100 | Royal Bank of Scotland Group PLC |
6.400% | 10/21/19 | A | 1,965,995 | |||||||||||||||
| 2,120 | Russian Agricultural Bank, 144A |
7.750% | 5/29/18 | Baa1 | 2,257,800 | |||||||||||||||
| 2,350 | Sovereign Bank |
8.750% | 5/30/18 | A | 2,620,224 | |||||||||||||||
| 2,585 | Wachovia Capital Trust III |
5.570% | 3/29/49 | A | 2,164,938 | |||||||||||||||
| 17,175 | Total Commercial Banks |
16,591,157 | ||||||||||||||||||
| Commercial Services & Supplies – 0.6% |
||||||||||||||||||||
| 1,070 | Donnelley & Son Company |
7.625% | 6/15/20 | BBB | 1,000,450 | |||||||||||||||
| 985 | International Lease Finance Corporation |
8.875% | 9/01/17 | BBB– | 1,019,475 | |||||||||||||||
| 1,905 | International Lease Finance Corporation, (4) |
8.250% | 12/15/20 | BBB– | 1,924,050 | |||||||||||||||
| 3,960 | Total Commercial Services & Supplies |
3,943,975 | ||||||||||||||||||
| Communications Equipment – 0.2% |
||||||||||||||||||||
| 1,150 | Goodman Networks Inc., 144A |
12.125% | 7/01/18 | B+ | 1,098,250 | |||||||||||||||
| Computers & Peripherals – 0.3% |
||||||||||||||||||||
| 645 | Hewlett Packard Company, (4) |
4.650% | 12/09/21 | A | 680,527 | |||||||||||||||
| 1,190 | Seagate HDD Cayman |
6.875% | 5/01/20 | BB+ | 1,222,725 | |||||||||||||||
| 1,835 | Total Computers & Peripherals |
1,903,252 | ||||||||||||||||||
| Consumer Finance – 0.9% |
||||||||||||||||||||
| 910 | Ally Financial Inc., (4) |
7.500% | 9/15/20 | BB | 919,100 | |||||||||||||||
| 185 | American Express Credit Corporation |
7.300% | 8/20/13 | A+ | 200,773 | |||||||||||||||
| 1,615 | Capital One Bank |
8.800% | 7/15/19 | BBB+ | 1,847,544 | |||||||||||||||
| 235 | Capital One Capital III Corporation |
7.686% | 8/15/36 | BBB | 234,413 | |||||||||||||||
| 185 | Capital One Financial Corporation |
7.375% | 5/23/14 | A– | 203,262 | |||||||||||||||
| 1,975 | Discover Financial Services |
10.250% | 7/15/19 | BBB | 2,407,442 | |||||||||||||||
| 5,105 | Total Consumer Finance |
5,812,534 | ||||||||||||||||||
| Nuveen Investments | 103 |
Portfolio of Investments (Unaudited)
Nuveen Total Return Bond Fund (continued)
December 31, 2011
| Principal Amount (000) |
Description (1) | Coupon | Maturity | Ratings (3) | Value | |||||||||||||||
| Containers & Packaging – 0.2% |
||||||||||||||||||||
| $ | 1,045 | Intertape Polymer US Inc. |
8.500% | 8/01/14 | Caa1 | $ | 997,975 | |||||||||||||
| Diversified Financial Services – 4.4% |
||||||||||||||||||||
| 1,370 | Bank of America Corporation, (4) |
3.750% | 7/12/16 | A | 1,268,509 | |||||||||||||||
| 2,615 | Bank of America Corporation |
5.750% | 12/01/17 | A | 2,469,922 | |||||||||||||||
| 5,985 | Bank of America Corporation |
5.875% | 1/05/21 | A | 5,696,685 | |||||||||||||||
| 3,075 | Citigroup Capital XXI |
8.300% | 12/21/57 | BBB | 3,071,156 | |||||||||||||||
| 2,765 | Citigroup Inc. |
6.125% | 8/25/36 | A– | 2,391,753 | |||||||||||||||
| 300 | Citigroup Inc. |
6.875% | 3/05/38 | A | 329,584 | |||||||||||||||
| 975 | CNH Capital LLC, 144A, (4) |
6.250% | 11/01/16 | BB | 1,004,250 | |||||||||||||||
| 2,885 | Countrywide Financial Corporation, Convertible Bond, 144A |
6.250% | 5/15/16 | A– | 2,718,057 | |||||||||||||||
| 65 | General Electric Capital Corporation |
5.625% | 9/15/17 | AA+ | 71,940 | |||||||||||||||
| 1,000 | General Electric Capital Corporation, (4) |
5.300% | 2/11/21 | AA | 1,068,952 | |||||||||||||||
| 2,545 | General Electric Capital Corporation |
6.875% | 1/10/39 | AA+ | 3,048,991 | |||||||||||||||
| 200 | ING Bank NV, 144A |
4.000% | 3/15/16 | Aa3 | 193,249 | |||||||||||||||
| 1,350 | JPMorgan Chase & Company |
4.250% | 10/15/20 | AA– | 1,359,481 | |||||||||||||||
| 1,685 | JPMorgan Chase & Company, (4) |
4.350% | 8/15/21 | AA– | 1,701,693 | |||||||||||||||
| 2,280 | JPMorgan Chase & Company |
6.400% | 5/15/38 | AA– | 2,646,800 | |||||||||||||||
| 29,095 | Total Diversified Financial Services |
29,041,022 | ||||||||||||||||||
| Diversified Telecommunication Services – 2.0% |
||||||||||||||||||||
| 2,050 | AT&T, Inc., (4) |
5.550% | 8/15/41 | A | 2,413,705 | |||||||||||||||
| 300 | CenturyLink Inc. |
6.150% | 9/15/19 | BBB– | 301,371 | |||||||||||||||
| 1,545 | Embarq Corporation |
7.082% | 6/01/16 | BBB– | 1,674,697 | |||||||||||||||
| 1,355 | Frontier Communications Corporation, (4) |
8.500% | 4/15/20 | BB+ | 1,387,181 | |||||||||||||||
| 215 | Telecom Italia Capital |
5.250% | 10/01/15 | BBB | 197,226 | |||||||||||||||
| 2,250 | Telecom Italia Capital S.p.A, (4) |
7.175% | 6/18/19 | BBB | 2,108,493 | |||||||||||||||
| 130 | Telefonica Emisiones SAU |
4.949% | 1/15/15 | BBB+ | 129,316 | |||||||||||||||
| 5,270 | Telefonica Emisiones SAU |
5.462% | 2/16/21 | BBB+ | 5,028,982 | |||||||||||||||
| 13,115 | Total Diversified Telecommunication Services |
13,240,971 | ||||||||||||||||||
| Electric Utilities – 1.5% |
||||||||||||||||||||
| 35 | American Electric Power |
5.250% | 6/01/15 | BBB | 38,320 | |||||||||||||||
| 1,485 | Comision Federal de Electricidad of the United States of Mexico, 144A |
4.875% | 5/26/21 | Baa1 | 1,529,550 | |||||||||||||||
| 2,230 | FirstEnergy Solutions Corporation, (4) |
6.050% | 8/15/21 | BBB | 2,474,620 | |||||||||||||||
| 2,630 | MidAmerican Energy Holdings Company |
6.125% | 4/01/36 | BBB+ | 3,141,138 | |||||||||||||||
| 1,522 | Midwest Generation LLC |
8.560% | 1/02/16 | Ba3 | 1,537,608 | |||||||||||||||
| 10 | Progress Energy, Inc. |
7.000% | 10/30/31 | BBB | 13,296 | |||||||||||||||
| 980 | Texas Competitive Electric Holdings, 144A, (4) |
11.500% | 10/01/20 | B | 831,775 | |||||||||||||||
| 8,892 | Total Electric Utilities |
9,566,307 | ||||||||||||||||||
| Electronic Equipment & Instruments – 0.3% |
||||||||||||||||||||
| 845 | Avnet Inc. |
5.875% | 6/15/20 | BBB– | 888,102 | |||||||||||||||
| 1,090 | Ingram Micro Inc. |
5.250% | 9/01/17 | BBB– | 1,122,796 | |||||||||||||||
| 1,935 | Total Electronic Equipment & Instruments |
2,010,898 | ||||||||||||||||||
| Energy Equipment & Services – 1.2% |
||||||||||||||||||||
| 1,985 | Diamond Offshore Drilling Inc. |
5.700% | 10/15/39 | A– | 2,213,434 | |||||||||||||||
| 325 | Ensco PLC |
4.700% | 3/15/21 | BBB+ | 338,457 | |||||||||||||||
| 104 | Nuveen Investments |
| Principal Amount (000) |
Description (1) | Coupon | Maturity | Ratings (3) | Value | |||||||||||||||
| Energy Equipment & Services (continued) |
||||||||||||||||||||
| $ | 85 | Nabors Industries Inc. |
9.250% | 1/15/19 | BBB+ | $ | 106,921 | |||||||||||||
| 1,590 | Nabors Industries Inc., (4) |
5.000% | 9/15/20 | BBB | 1,621,007 | |||||||||||||||
| 1,000 | Transocean Inc. |
6.375% | 12/15/21 | BBB– | 1,062,883 | |||||||||||||||
| 2,310 | Weatherford International Limited |
7.000% | 3/15/38 | BBB | 2,628,276 | |||||||||||||||
| 7,295 | Total Energy Equipment & Services |
7,970,978 | ||||||||||||||||||
| Food & Staples Retailing – 0.1% |
||||||||||||||||||||
| 200 | Albertson’s, Inc. |
8.700% | 5/01/30 | B+ | 174,500 | |||||||||||||||
| 260 | CVS Caremark Corporation |
3.250% | 5/18/15 | BBB+ | 274,131 | |||||||||||||||
| 460 | Total Food & Staples Retailing |
448,631 | ||||||||||||||||||
| Food Products – 0.8% |
||||||||||||||||||||
| 3,410 | Bunge Limited Finance Company |
4.100% | 3/15/16 | BBB | 3,531,140 | |||||||||||||||
| 1,175 | JBS Finance II Limited, 144A |
8.250% | 1/29/18 | BB | 1,066,313 | |||||||||||||||
| 500 | Marfrig Overseas Limited |
9.500% | 5/04/20 | B+ | 370,000 | |||||||||||||||
| 700 | MHP SA, 144A |
10.250% | 4/29/15 | B | 616,000 | |||||||||||||||
| 5,785 | Total Food Products |
5,583,453 | ||||||||||||||||||
| Gas Utilities – 0.0% |
||||||||||||||||||||
| 25 | Ferrellgas LP |
6.500% | 5/01/21 | Ba3 | 22,000 | |||||||||||||||
| Health Care Equipment & Supplies – 1.0% |
||||||||||||||||||||
| 3,050 | Boston Properties Limited Partnership |
4.125% | 5/15/21 | A– | 3,069,212 | |||||||||||||||
| 1,125 | HCA Holdings Inc., (4) |
7.750% | 5/15/21 | B-e | 1,144,688 | |||||||||||||||
| 1,575 | UnitedHealth Group Incorporated |
6.875% | 2/15/38 | A– | 2,112,174 | |||||||||||||||
| 5,750 | Total Health Care Equipment & Supplies |
6,326,074 | ||||||||||||||||||
| Hotels, Restaurants & Leisure – 0.5% |
||||||||||||||||||||
| 845 | CKE Restaurant Inc., (4) |
11.375% | 7/15/18 | B2 | 921,050 | |||||||||||||||
| 1,150 | Isle of Capri Casinos, Inc., (4) |
7.750% | 3/15/19 | B– | 1,052,250 | |||||||||||||||
| 1,500 | Reynolds Group, 144A |
7.125% | 4/15/19 | BB– | 1,526,250 | |||||||||||||||
| 3,495 | Hotels, Restaurants & Leisure |
3,499,550 | ||||||||||||||||||
| Household Durables – 0.0% |
||||||||||||||||||||
| 155 | MDC Holdings Inc. |
5.625% | 2/01/20 | BBB– | 141,807 | |||||||||||||||
| Independent Power Producers & Energy Traders – 0.6% |
||||||||||||||||||||
| 1,490 | Calpine Corporation, 144A, (4) |
7.875% | 7/31/20 | BB | 1,605,475 | |||||||||||||||
| 2,010 | Constellation Energy Group |
5.150% | 12/01/20 | BBB– | 2,178,116 | |||||||||||||||
| 175 | NRG Energy Inc., (4) |
7.375% | 1/15/17 | BB | 181,563 | |||||||||||||||
| 3,675 | Total Independent Power Producers & Energy Traders |
3,965,154 | ||||||||||||||||||
| Industrial Conglomerates – 0.6% |
||||||||||||||||||||
| 4,030 | GE Capital Trust I |
6.375% | 11/15/67 | Aa3 | 3,959,475 | |||||||||||||||
| 100 | Offshore Group Investment Limited |
11.500% | 8/01/15 | B– | 108,125 | |||||||||||||||
| 4,130 | Total Industrial Conglomerates |
4,067,600 | ||||||||||||||||||
| Insurance – 4.1% |
||||||||||||||||||||
| 2,475 | AFLAC Insurance, (4) |
6.450% | 8/15/40 | A– | 2,621,295 | |||||||||||||||
| 2,510 | Allied World Assurance Holdings Limited |
7.500% | 8/01/16 | BBB+ | 2,832,696 | |||||||||||||||
| 100 | Berkshire Hathaway Finance Corporation |
5.400% | 5/15/18 | AA+ | 116,622 | |||||||||||||||
| 2,050 | Catlin Insurance Company Limited |
7.249% | 7/29/49 | BBB+ | 1,742,500 | |||||||||||||||
| 2,955 | Genworth Financial Inc. |
6.515% | 5/22/18 | BBB | 2,711,942 | |||||||||||||||
| Nuveen Investments | 105 |
Portfolio of Investments (Unaudited)
Nuveen Total Return Bond Fund (continued)
December 31, 2011
| Principal Amount (000) |
Description (1) | Coupon | Maturity | Ratings (3) | Value | |||||||||||||||
| Insurance (continued) |
||||||||||||||||||||
| $ | 2,645 | Hartford Financial Services Group Inc. |
6.000% | 1/15/19 | BBB | $ | 2,714,532 | |||||||||||||
| 1,705 | Liberty Mutual Group |
7.000% | 3/15/37 | Baa3 | 1,432,200 | |||||||||||||||
| 2,395 | Lincoln National Corporation |
8.750% | 7/01/19 | A– | 2,913,180 | |||||||||||||||
| 1,620 | Lincoln National Corporation |
6.050% | 4/20/67 | BBB | 1,348,650 | |||||||||||||||
| 1,600 | MetLife Inc., (4) |
6.750% | 6/01/16 | A– | 1,843,261 | |||||||||||||||
| 75 | MetLife Inc. |
7.717% | 2/15/19 | A– | 94,046 | |||||||||||||||
| 840 | Pacific LifeCorp. |
6.000% | 2/10/20 | BBB+ | 894,015 | |||||||||||||||
| 1,650 | Prudential Financial Inc. |
5.500% | 3/15/16 | A | 1,788,547 | |||||||||||||||
| 170 | Prudential Financial Inc. |
7.375% | 6/15/19 | A | 200,950 | |||||||||||||||
| 160 | Prudential Financial Inc. |
5.900% | 3/17/36 | A | 160,724 | |||||||||||||||
| 1,830 | UnumProvident Corporation |
5.625% | 9/15/20 | BBB | 1,884,298 | |||||||||||||||
| 1,860 | ZFS Finance USA Trust V |
6.500% | 5/09/37 | A | 1,674,000 | |||||||||||||||
| 26,640 | Total Insurance |
26,973,458 | ||||||||||||||||||
| IT Services – 0.0% |
||||||||||||||||||||
| 150 | First Data Corporation, 144A, (4) |
8.750% | 1/15/22 | B– | 129,000 | |||||||||||||||
| Marine – 0.1% |
||||||||||||||||||||
| 1,350 | Navios Maritime Acquisition Corporation, (4) |
8.625% | 11/01/17 | B | 978,750 | |||||||||||||||
| Media – 3.4% |
||||||||||||||||||||
| 1,175 | AMC Networks Inc., 144A, (4) |
7.750% | 7/15/21 | B+ | 1,277,813 | |||||||||||||||
| 1,975 | British Sky Broadcasting Group PLC |
6.100% | 2/15/18 | BBB+ | 2,212,310 | |||||||||||||||
| 1,790 | Comcast Corporation |
6.400% | 5/15/38 | BBB+ | 2,150,565 | |||||||||||||||
| 1,935 | DIRECTV Holdings LLC |
5.200% | 3/15/20 | BBB | 2,085,570 | |||||||||||||||
| 2,515 | NBC Universal Media LLC, (4) |
4.375% | 4/01/21 | BBB+ | 2,654,195 | |||||||||||||||
| 2,750 | News America Holdings Inc., (4) |
6.650% | 11/15/37 | BBB+ | 3,115,566 | |||||||||||||||
| 870 | TCM Sub LLC |
3.550% | 1/15/15 | A– | 901,965 | |||||||||||||||
| 405 | Time Warner Cable Inc. |
6.550% | 5/01/37 | BBB | 460,653 | |||||||||||||||
| 1,515 | Time Warner Cable Inc. |
5.875% | 11/15/40 | BBB | 1,639,625 | |||||||||||||||
| 1,500 | Time Warner Inc., (4) |
4.750% | 3/29/21 | BBB | 1,626,713 | |||||||||||||||
| 1,750 | Time Warner Inc., (4) |
6.100% | 7/15/40 | BBB | 2,051,586 | |||||||||||||||
| 1,625 | Viacom Inc. |
6.875% | 4/30/36 | BBB+ | 2,033,779 | |||||||||||||||
| 140 | XM Satellite Radio Inc., 144A |
7.625% | 11/01/18 | BB | 147,000 | |||||||||||||||
| 19,945 | Total Media |
22,357,340 | ||||||||||||||||||
| Metals & Mining – 5.0% |
||||||||||||||||||||
| 4,180 | Alcoa Inc., (4) |
5.400% | 4/15/21 | BBB– | 4,187,796 | |||||||||||||||
| 1,515 | Alrosa Finance SA, 144A |
7.750% | 11/03/20 | BB– | 1,507,425 | |||||||||||||||
| 2,690 | Anglogold Holdings PLC |
6.500% | 4/15/40 | BBB– | 2,617,152 | |||||||||||||||
| 3,450 | ArcelorMittal |
7.000% | 10/15/39 | BBB | 3,206,133 | |||||||||||||||
| 2,860 | Cliffs Natural Resources Inc. |
4.800% | 10/01/20 | BBB– | 2,837,049 | |||||||||||||||
| 1,500 | Fosun International Limited, 144A, (4) |
7.500% | 5/12/16 | BB+ | 1,305,000 | |||||||||||||||
| 925 | Hidili Industry Internationl Development Limited, 144A, (4) |
8.625% | 11/04/15 | B+ | 689,125 | |||||||||||||||
| 1,035 | JMC Steel Group, 144A |
8.250% | 3/15/18 | B | 1,009,125 | |||||||||||||||
| 830 | Mirabela Nickel Limited, 144A, (4) |
8.750% | 4/15/18 | B2 | 744,925 | |||||||||||||||
| 250 | Patriot Coal Corporation, (4) |
8.250% | 4/30/18 | B+ | 240,000 | |||||||||||||||
| 1,515 | Southern Copper Corporation |
7.500% | 7/27/35 | BBB | 1,654,839 | |||||||||||||||
| 106 | Nuveen Investments |
| Principal Amount (000) |
Description (1) | Coupon | Maturity | Ratings (3) | Value | |||||||||||||||
| Metals & Mining (continued) |
||||||||||||||||||||
| $ | 1,910 | Taseko Mines Limited |
7.750% | 4/15/19 | B | $ | 1,723,775 | |||||||||||||
| 1,775 | Teck Resources Limited |
6.125% | 10/01/35 | BBB | 1,947,386 | |||||||||||||||
| 1,140 | Teck Resources Limited |
6.250% | 7/15/41 | BBB | 1,316,943 | |||||||||||||||
| 1,275 | Thompson Creek Metals Company |
7.375% | 6/01/18 | B | 1,134,750 | |||||||||||||||
| 2,410 | Vale Overseas Limited |
6.875% | 11/10/39 | A– | 2,760,414 | |||||||||||||||
| 1,400 | Vedanta Resources PLC, 144A, (4) |
9.500% | 7/18/18 | BB | 1,204,000 | |||||||||||||||
| 955 | Winsway Coking Coal Holding Limited, 144A, (4) |
8.500% | 4/08/16 | BB | 759,225 | |||||||||||||||
| 1,765 | Xstrata Finance Canada Limited, 144A |
6.900% | 11/15/37 | BBB+ | 1,966,187 | |||||||||||||||
| 33,380 | Total Metals & Mining |
32,811,249 | ||||||||||||||||||
| Multiline Retail – 0.2% |
||||||||||||||||||||
| 1,425 | J.C. Penney Corporation Inc. |
5.650% | 6/01/20 | BBB– | 1,396,500 | |||||||||||||||
| Multi-Utilities – 0.0% |
||||||||||||||||||||
| 5 | PSE&G Power LLC |
8.625% | 4/15/31 | BBB+ | 7,376 | |||||||||||||||
| Oil, Gas & Consumable Fuels – 5.2% |
||||||||||||||||||||
| 240 | Amerada Hess Corporation |
7.125% | 3/15/33 | BBB | 311,635 | |||||||||||||||
| 1,235 | Anadarko Petroleum Corporation |
6.375% | 9/15/17 | BBB– | 1,431,530 | |||||||||||||||
| 1,870 | Anadarko Petroleum Corporation, (4) |
6.200% | 3/15/40 | BBB– | 2,081,104 | |||||||||||||||
| 1,700 | Canadian Oil Sands Trust |
7.750% | 5/15/19 | BBB | 2,094,130 | |||||||||||||||
| 1,424 | Carrizo Oil and Gas Inc., (4) |
8.625% | 10/15/18 | B– | 1,438,240 | |||||||||||||||
| 195 | Enbridge Energy Partners LP |
5.200% | 3/15/20 | BBB | 216,630 | |||||||||||||||
| 50 | Energy XXI Gulf Coast Inc., 144A |
9.250% | 12/15/17 | B | 54,250 | |||||||||||||||
| 1,285 | Exco Resources Inc. |
7.500% | 9/15/18 | B | 1,214,325 | |||||||||||||||
| 1,375 | Husky Energy Inc. |
6.200% | 9/15/17 | BBB+ | 1,608,646 | |||||||||||||||
| 600 | Kinder Morgan Energy Partners, L.P. |
6.950% | 1/15/38 | BBB | 677,693 | |||||||||||||||
| 250 | Kinder Morgan Energy Partners, L.P. |
6.500% | 9/01/39 | BBB | 277,874 | |||||||||||||||
| 1,100 | Kodiak Oil and Gas Corporation, 144A |
8.125% | 12/01/19 | B– | 1,139,875 | |||||||||||||||
| 2,625 | Lukoil International Finance, 144A |
6.125% | 11/09/20 | Baa2 | 2,572,500 | |||||||||||||||
| 1,150 | Martin Mid-Stream Partners LP Finance |
8.875% | 4/01/18 | B | 1,184,500 | |||||||||||||||
| 2,500 | Nexen Inc. |
6.400% | 5/15/37 | BBB– | 2,648,148 | |||||||||||||||
| 1,120 | Noble Energy Inc., (4) |
4.150% | 12/15/21 | BBB | 1,158,632 | |||||||||||||||
| 1,735 | OGX Petroleo e Gas Participacoes SA, 144A |
8.500% | 6/01/18 | B+ | 1,700,300 | |||||||||||||||
| 1,770 | Petrobras International Finance Company |
6.875% | 1/20/40 | A3 | 2,049,987 | |||||||||||||||
| 1,275 | Petro-Canada |
6.800% | 5/15/38 | BBB+ | 1,646,248 | |||||||||||||||
| 1,165 | PetroPlus Finance, (4) |
9.375% | 9/15/19 | CCC | 588,325 | |||||||||||||||
| 1,600 | Seadrill Limited |
6.500% | 10/05/15 | N/R | 1,520,000 | |||||||||||||||
| 175 | SM Energy Company, 144A |
6.625% | 2/15/19 | BB | 182,000 | |||||||||||||||
| 545 | Southern Union Company |
3.447% | 11/01/66 | Ba1 | 508,213 | |||||||||||||||
| 100 | Stone Energy Corporation |
8.625% | 2/01/17 | B | 102,000 | |||||||||||||||
| 245 | SunCor Energy Inc. |
6.100% | 6/01/18 | BBB+ | 290,022 | |||||||||||||||
| 2,670 | Transcapitalinvest LP |
5.670% | 3/05/14 | Baa1 | 2,770,125 | |||||||||||||||
| 2,475 | Valero Energy Corporation |
6.125% | 2/01/20 | BBB | 2,753,009 | |||||||||||||||
| 200 | Western Refining Inc., (4) |
11.250% | 6/15/17 | B+ | 227,500 | |||||||||||||||
| 32,674 | Total Oil, Gas & Consumable Fuels |
34,447,441 | ||||||||||||||||||
| Nuveen Investments | 107 |
Portfolio of Investments (Unaudited)
Nuveen Total Return Bond Fund (continued)
December 31, 2011
| Principal Amount (000) |
Description (1) | Coupon | Maturity | Ratings (3) | Value | |||||||||||||||
| Paper & Forest Products – 0.6% |
||||||||||||||||||||
| $ | 1,860 | International Paper Company |
8.700% | 6/15/38 | BBB | $ | 2,523,481 | |||||||||||||
| 200 | Stora Enso Oyj, 144A |
6.404% | 4/15/16 | BB | 193,000 | |||||||||||||||
| 900 | Tembec Industries, Inc., (4) |
11.250% | 12/15/18 | B– | 927,000 | |||||||||||||||
| 8 | Westvaco Corporation |
8.200% | 1/15/30 | BBB | 9,096 | |||||||||||||||
| 2,968 | Total Paper & Forest Products |
3,652,577 | ||||||||||||||||||
| Pharmaceuticals – 1.7% |
||||||||||||||||||||
| 2,580 | Valeant Pharmaceuticals International, 144A |
6.875% | 12/01/18 | BB | 2,573,550 | |||||||||||||||
| 1,420 | Plum Creek Timberlands LP |
4.700% | 3/15/21 | BBB | 1,428,026 | |||||||||||||||
| 2,125 | Prologis Inc. |
6.875% | 3/15/20 | Baa2 | 2,359,441 | |||||||||||||||
| 1,825 | Simon Property Group, L.P. |
5.650% | 2/01/20 | A– | 2,091,556 | |||||||||||||||
| 2,975 | Vornado Realty LP |
4.250% | 4/01/15 | BBB | 3,078,881 | |||||||||||||||
| 10,925 | Total Pharmaceuticals |
11,531,454 | ||||||||||||||||||
| Real Estate Management & Development – 0.4% |
||||||||||||||||||||
| 825 | Central China Real Estate Limited, 144A |
12.250% | 10/20/15 | B+ | 711,563 | |||||||||||||||
| 1,500 | Country Garden Holding Company, 144A, (4) |
11.125% | 2/23/18 | BB– | 1,297,500 | |||||||||||||||
| 620 | Shimao Property Holdings Limited, 144A |
8.000% | 12/01/16 | BB+ | 468,100 | |||||||||||||||
| 2,945 | Total Real Estate Management & Development |
2,477,163 | ||||||||||||||||||
| Road & Rail – 0.2% |
||||||||||||||||||||
| 1,250 | Hertz Corporation |
7.375% | 1/15/21 | BB– | 1,270,313 | |||||||||||||||
| Semiconductors & Equipment – 0.1% |
||||||||||||||||||||
| 840 | Intel Corporation |
4.800% | 10/01/41 | A+ | 941,394 | |||||||||||||||
| Specialty Retail – 0.4% |
||||||||||||||||||||
| 2,220 | O’Reilly Automotive Inc. |
4.875% | 1/14/21 | BBB– | 2,362,164 | |||||||||||||||
| Thrifts & Mortgage Finance – 0.3% |
||||||||||||||||||||
| 1,855 | WEA Finance LLC, 144A, (4) |
4.625% | 5/10/21 | A2 | 1,820,671 | |||||||||||||||
| Tobacco – 1.1% |
||||||||||||||||||||
| 815 | Altria Group Inc., (4) |
4.750% | 5/05/21 | BBB+ | 897,346 | |||||||||||||||
| 3,125 | Altria Group Inc. |
9.950% | 11/10/38 | BBB+ | 4,753,069 | |||||||||||||||
| 1,590 | Lorillard Tobacco |
8.125% | 6/23/19 | Baa2 | 1,894,005 | |||||||||||||||
| 5,530 | Total Tobacco |
7,544,420 | ||||||||||||||||||
| Transportation Infrastructure – 0.4% |
||||||||||||||||||||
| 2,550 | Asciano Finance Limited, 144A |
5.000% | 4/07/18 | Baa2 | 2,557,005 | |||||||||||||||
| Wireless Telecommunication Services – 0.5% |
||||||||||||||||||||
| 2,195 | American Tower Company, (4) |
5.050% | 9/01/20 | BBB– | 2,198,970 | |||||||||||||||
| 1,275 | NII Capital Corporation |
8.875% | 12/15/19 | B+ | 1,341,927 | |||||||||||||||
| 3,470 | Total Wireless Telecommunication Services |
3,540,897 | ||||||||||||||||||
| $ | 322,432 | Total Corporate Bonds (cost $323,028,088) |
330,914,464 | |||||||||||||||||
| Shares | Description (1) | Coupon | Maturity |
Ratings (3) | Value | |||||||||||||||||
| CONVERTIBLE PREFERRED SECURITIES – 0.1% |
||||||||||||||||||||||
| Oil, Gas & Consumable Fuels – 0.1% |
||||||||||||||||||||||
| 7,300 | Chesapeake Energy Corporation, Convertible |
5.000% | 12/31/49 | B+ | $ | 608,820 | ||||||||||||||||
| Total Convertible Preferred Securities (cost $620,500) |
608,820 | |||||||||||||||||||||
| 108 | Nuveen Investments |
| Shares | Description (1) | Coupon | Ratings (3) | Value | ||||||||||||||||
| $25 PAR (OR SIMILAR) PREFERRED SECURITIES – 1.0% |
||||||||||||||||||||
| Diversified Banking Institutions – 0.2% |
||||||||||||||||||||
| 25,000 | Bank of America Corporation |
4.000% | BBB– | $ | 367,500 | |||||||||||||||
| 51,000 | Goldman Sachs Group Inc. |
3.750% | BBB+ | 850,170 | ||||||||||||||||
| 14,000 | Royal Bank of Scotland Group PLC, Series L |
5.750% | BB | 206,500 | ||||||||||||||||
| Total Diversified Banking Institutions |
1,424,170 | |||||||||||||||||||
| Diversified Financial Services – 0.1% |
||||||||||||||||||||
| 28,000 | Citigroup Capital Trust XI, (4) |
6.000% | Baa3 | 598,360 | ||||||||||||||||
| Financials – 0.6% |
||||||||||||||||||||
| 84,500 | Aspen Insurance Holdings Limited |
7.401% | BBB– | 2,087,150 | ||||||||||||||||
| 73,140 | Endurance Specialty Holdings Limited |
5.500% | BBB– | 1,864,338 | ||||||||||||||||
| Total Financials |
3,951,488 | |||||||||||||||||||
| Sovereign Agency – 0.1% |
||||||||||||||||||||
| 217,000 | Federal National Mortgage Association, (4) |
4.811% | Ca | 299,460 | ||||||||||||||||
| Total $25 Par (or similar) Preferred Securities (cost $11,445,368) |
|
6,273,478 | ||||||||||||||||||
| Principal Amount (000) |
Description (1) | Optional Call Provisions (5) |
Ratings (3) | Value | ||||||||||||||||
| MUNICIPAL BONDS – 0.6% |
||||||||||||||||||||
| Illinois – 0.6% |
||||||||||||||||||||
| $ | 3,840 | Illinois State, General Obligation Bonds, |
No Opt. Call | A+ | $ | 4,138,752 | ||||||||||||||
| $ | 3,840 | Total Municipal Bonds (cost $3,840,000) |
4,138,752 | |||||||||||||||||
| Principal Amount (000) |
Description (1) | Coupon | Maturity | Ratings (3) | Value | |||||||||||||||
| U.S. GOVERNMENT AND AGENCY OBLIGATIONS – 0.3% |
|
|||||||||||||||||||
| $ | 190 | Tennessee Valley Authority |
5.250% | 9/15/39 | AAA | $ | 242,537 | |||||||||||||
| 225 | U.S. Treasury Bonds, (4) |
5.250% | 11/15/28 | AAA | 310,219 | |||||||||||||||
| 450 | U.S. Treasury Bonds |
4.750% | 2/15/37 | AAA | 611,226 | |||||||||||||||
| 455 | U.S. Treasury Bonds, (4) |
3.500% | 2/15/39 | AAA | 511,804 | |||||||||||||||
| $ | 1,320 | Total U.S. Government and Agency Obligations (cost $1,294,386) |
|
1,675,786 | ||||||||||||||||
| Principal Amount (000) |
Description (1) | Coupon | Maturity | Ratings (3) | Value | |||||||||||||||
| ASSET-BACKED AND MORTGAGE-BACKED SECURITIES – 41.0% |
|
|||||||||||||||||||
| $ | 1,885 | 321 Henderson Receivables LLC, Series 2010-3A |
3.820% | 12/15/48 | Aaa | $ | 1,856,250 | |||||||||||||
| 1,425 | American Homes Mortgage Advance Trust, |
5.920% | 5/10/43 | BBB | 1,425,000 | |||||||||||||||
| 3,470 | AmeriCold LLC Trust, Series 2010 |
6.811% | 1/14/29 | A | 3,507,844 | |||||||||||||||
| 550 | AmeriCredit Automobile Receivables Trust, Series 2010-4 |
1.990% | 10/08/15 | Aaa | 548,241 | |||||||||||||||
| 1,143 | Banc of America Alternative Loan Trust. Mortgage |
5.443% | 4/25/37 | C | 93,668 | |||||||||||||||
| 65 | Bank of America Alternative Loan Trust, |
6.000% | 6/25/35 | Caa1 | 46,068 | |||||||||||||||
| 63 | Bank of America Auto Trust, Series 2009- 2A, 144A |
2.130% | 9/15/13 | AAA | 63,420 | |||||||||||||||
| 161 | Bank of America Auto Trust, Series 2010-1A |
1.390% | 3/15/14 | AAA | 161,082 | |||||||||||||||
| 350 | Bank of America Commercial Mortgage Inc., Commercial Mortgage Pass-Through Certificates, Series 2005-4 |
4.933% | 7/10/45 | AAA | 380,806 | |||||||||||||||
| Nuveen Investments | 109 |
Portfolio of Investments (Unaudited)
Nuveen Total Return Bond Fund (continued)
December 31, 2011
| Principal Amount (000) |
Description (1) | Coupon | Maturity | Ratings (3) | Value | |||||||||||||||
| ASSET-BACKED AND MORTGAGE-BACKED SECURITIES (continued) |
|
|||||||||||||||||||
| $ | 800 | BMW Vehicle Owners Trust, Series 2010-A |
2.100% | 10/25/16 | AAA | $ | 813,269 | |||||||||||||
| 275 | CarMax Auto Owner Trust 2010-3 |
2.000% | 5/16/16 | AA | 276,532 | |||||||||||||||
| 425 | Chrysler Financial Auto Securtization Trust, Series 2010A |
1.650% | 11/08/13 | AA | 423,770 | |||||||||||||||
| 550 | CitiBank Credit Card Issuance Trust, Series 2009-A5 |
2.250% | 12/23/14 | AAA | 558,126 | |||||||||||||||
| 1,346 | Citigroup Commercial Mortgage Securities Trust, Commercial Mortgage Pass-Through Certificates, Series 2007-CD4, (4) |
5.205% | 12/11/49 | AAA | 1,363,345 | |||||||||||||||
| 5,650 | Citigroup Commercial Mortgage Securities Trust, Commercial Mortgage Pass-Through Certificates, Series 2007-CD5 |
5.886% | 11/15/44 | AAA | 6,262,132 | |||||||||||||||
| 119 | CNH Equipment Trust 2010-A |
1.540% | 7/15/14 | AAA | 119,748 | |||||||||||||||
| 1,805 | Commercial Mortgage Pass-Through Certificates, |
5.449% | 2/05/19 | AAA | 1,752,807 | |||||||||||||||
| 2,600 | Countrywide ABS Asset-Backed Certificate Trust 2007-9 |
0.424% | 6/25/47 | BB+ | 2,093,699 | |||||||||||||||
| 715 | Countrywide Alternative Loan Trust, Mortgage Pass-Through Certificates, Series 2004-24CB |
5.000% | 11/25/19 | BB+ | 714,409 | |||||||||||||||
| 993 | Countrywide Alternative Loan Trust, Mortgage Pass-Through Certificates, Series 2006-19CB |
6.000% | 8/25/36 | CCC | 714,786 | |||||||||||||||
| 1,794 | Countrywide Asset-Backed Certificates Trust, Series 2006-25 |
0.414% | 6/25/47 | BB+ | 1,584,091 | |||||||||||||||
| 2,195 | Countrywide Hoen Loans, Asset Backed Certificates |
0.454% | 10/25/47 | BB– | 1,705,787 | |||||||||||||||
| 771 | Countrywide Home Loan Mortgage Pass Through Trust, |
2.748% | 2/25/34 | BB | 690,309 | |||||||||||||||
| 352 | Credit Suisse First Boston Mortgage Securities Corporation, Mortgage-Backed Pass-Through Certificates, Series 2003-23 |
5.750% | 9/25/33 | AAA | 362,982 | |||||||||||||||
| 500 | CS First Boston Mortgage Securities Corporation, Commercial Mortgage Pass-Through Certificates, Series 2004-C1 |
4.750% | 1/15/37 | AAA | 523,766 | |||||||||||||||
| 49 | Daimler Chrysler Auto Trust 2008B |
5.320% | 11/10/14 | AAA | 49,173 | |||||||||||||||
| 1,850 | DBUBS Mortgage Trust, Commercial Mortgage Pass Through Certificates, Series 2011-LC3A |
3.642% | 8/10/44 | AAA | 1,948,871 | |||||||||||||||
| 3,630 | Extended Stay America Trust 2010-EHSA |
4.860% | 11/05/27 | A | 3,675,030 | |||||||||||||||
| 1,772 | Fannie Mae Mortgage Interest Strips |
5.000% | 10/01/35 | AAA | 174,043 | |||||||||||||||
| 1,715 | Fannie Mae Mortgage Pool 20240701 |
5.500% | 7/01/24 | AAA | 1,863,076 | |||||||||||||||
| 1,006 | Fannie Mae Mortgage Pool 20250201 |
5.500% | 2/01/25 | AAA | 1,103,844 | |||||||||||||||
| 3,706 | Fannie Mae Mortgage Pool 20251001 |
5.500% | 10/01/25 | AAA | 4,051,637 | |||||||||||||||
| 290 | Fannie Mae Mortgage Pool 20320401, (4) |
6.000% | 4/01/32 | AAA | 316,222 | |||||||||||||||
| 489 | Fannie Mae Mortgage Pool 20330601 |
5.500% | 6/01/33 | AAA | 534,109 | |||||||||||||||
| 3,450 | Fannie Mae Mortgage Pool 20340301 |
5.000% | 11/01/33 | AAA | 3,730,469 | |||||||||||||||
| 665 | Fannie Mae Mortgage Pool 20340301 |
6.000% | 3/01/34 | AAA | 740,847 | |||||||||||||||
| 526 | Fannie Mae Mortgage Pool 20340301 |
5.000% | 3/01/34 | AAA | 568,635 | |||||||||||||||
| 440 | Fannie Mae Mortgage Pool 20340301 |
5.000% | 3/01/34 | AAA | 476,342 | |||||||||||||||
| 754 | Fannie Mae Mortgage Pool 20340801 |
5.500% | 9/01/34 | AAA | 823,700 | |||||||||||||||
| 274 | Fannie Mae Mortgage Pool 20341101 |
6.000% | 11/01/34 | AAA | 304,405 | |||||||||||||||
| 179 | Fannie Mae Mortgage Pool 20350401 |
5.500% | 4/01/35 | AAA | 195,235 | |||||||||||||||
| 113 | Fannie Mae Mortgage Pool 20350501 |
2.547% | 5/01/35 | AAA | 117,843 | |||||||||||||||
| 629 | Fannie Mae Mortgage Pool 20360401 |
6.500% | 4/01/36 | AAA | 709,144 | |||||||||||||||
| 287 | Fannie Mae Mortgage Pool 20360401 |
6.500% | 4/01/36 | AAA | 323,165 | |||||||||||||||
| 814 | Fannie Mae Mortgage Pool 20360801 |
6.500% | 8/01/36 | AAA | 917,389 | |||||||||||||||
| 1,584 | Fannie Mae Mortgage Pool 20360901 |
6.500% | 9/01/36 | AAA | 1,782,139 | |||||||||||||||
| 110 | Nuveen Investments |
| Principal Amount (000) |
Description (1) | Coupon | Maturity | Ratings (3) | Value | |||||||||||||||
| ASSET-BACKED AND MORTGAGE-BACKED SECURITIES (continued) |
|
|||||||||||||||||||
| $ | 593 | Fannie Mae Mortgage Pool 20370401 |
5.500% | 4/01/37 | AAA | $ | 646,693 | |||||||||||||
| 688 | Fannie Mae Mortgage Pool 20370601 |
6.000% | 6/01/37 | AAA | 758,269 | |||||||||||||||
| 874 | Fannie Mae Mortgage Pool 20370901, (4) |
6.000% | 9/01/37 | AAA | 958,319 | |||||||||||||||
| 4,068 | Fannie Mae Mortgage Pool 20380101 |
5.500% | 1/01/38 | AAA | 4,432,601 | |||||||||||||||
| 1 | Fannie Mae Mortgage Pool 20380501 |
5.500% | 5/01/38 | AAA | 1,086 | |||||||||||||||
| 1 | Fannie Mae Mortgage Pool 20380701 |
5.500% | 7/01/38 | AAA | 1,115 | |||||||||||||||
| 1,045 | Fannie Mae Mortgage Pool 20380801 |
6.000% | 8/01/38 | AAA | 1,151,601 | |||||||||||||||
| 1,809 | Fannie Mae Mortgage Pool 20381101 |
5.500% | 11/01/38 | AAA | 1,971,291 | |||||||||||||||
| 2,476 | Fannie Mae Mortgage Pool 20381201 |
5.500% | 12/01/38 | AAA | 2,698,357 | |||||||||||||||
| 3,162 | Fannie Mae Mortgage Pool 20390901 |
6.000% | 9/01/39 | AAA | 3,485,609 | |||||||||||||||
| 5,541 | Fannie Mae Mortgage Pool 20390901 |
4.500% | 9/01/39 | AAA | 5,901,481 | |||||||||||||||
| 4,879 | Fannie Mae Mortgage Pool 20391201 |
4.500% | 12/01/39 | AAA | 5,196,558 | |||||||||||||||
| 1,425 | Fannie Mae Mortgage Pool 20400801 |
4.500% | 8/01/40 | AAA | 1,517,605 | |||||||||||||||
| 5,066 | Fannie Mae Mortgage Pool 20401201, (4) |
4.000% | 12/01/40 | AAA | 5,326,231 | |||||||||||||||
| 8,917 | Fannie Mae Mortgage Pool 20401201, (4) |
4.000% | 12/01/40 | AAA | 9,375,391 | |||||||||||||||
| 13,217 | Fannie Mae Mortgage Pool 20410101 |
4.000% | 1/01/41 | AAA | 13,896,494 | |||||||||||||||
| 190 | Fannie Mae Mortgage Pool 20330901 |
2.212% | 9/01/33 | AAA | 198,897 | |||||||||||||||
| 555 | Fannie Mae Mortgage Pool 20350101 |
2.369% | 1/01/35 | AAA | 585,043 | |||||||||||||||
| 137 | Fannie Mae Mortgage Pool 20350801 |
1.898% | 8/01/35 | AAA | 142,533 | |||||||||||||||
| 104 | Fannie Mae Mortgage Pool 20361201 |
6.001% | 12/01/36 | AAA | 112,772 | |||||||||||||||
| 328 | Fannie Mae Mortgage Pool 20370901 |
6.157% | 9/01/37 | AAA | 357,195 | |||||||||||||||
| 6,125 | Fannie Mae Mortgage TBA Pools (WI/DD) |
5.000% | TBA | AAA | 6,616,914 | |||||||||||||||
| 6,080 | Fannie Mae Mortgage TBA Pools (WI/DD) |
4.500% | TBA | AAA | 6,469,500 | |||||||||||||||
| 38,155 | Fannie Mae Mortgage TBA Pools (WI/DD) |
4.000% | TBA | AAA | 40,080,637 | |||||||||||||||
| 6,750 | Fannie Mae Mortgage TBA Pools (WI/DD) |
3.500% | TBA | AAA | 6,941,953 | |||||||||||||||
| 7,275 | Fannie Mae Mortgage TBA Pools (WI/DD) |
6.000% | TBA | AAA | 8,010,457 | |||||||||||||||
| 6,250 | Fannie Mae Mortgage TBA Pools (WI/DD) |
5.500% | TBA | AAA | 6,805,664 | |||||||||||||||
| 650 | FDIC Structured Sales Guaranteed Notes, Series 2010-L1A |
0.000% | 10/25/13 | AAA | 642,415 | |||||||||||||||
| 2,964 | FDIC Structures Sales Guaranteed Notes, Series 2010-S1 |
0.820% | 2/25/48 | AAA | 2,958,541 | |||||||||||||||
| 2,501 | Federal Home Loan Bank Mortgages 20380501 |
2.456% | 5/01/38 | AAA | 2,636,600 | |||||||||||||||
| 581 | Federal Home Loan Bank Mortgages 20291001 |
2.695% | 10/01/29 | AAA | 590,411 | |||||||||||||||
| 501 | Federal Home Loan Bank Mortgages 20300701 |
2.341% | 7/01/30 | AAA | 528,362 | |||||||||||||||
| 345 | Federal Home Loan Bank Mortgages 20330501 |
2.211% | 5/01/33 | AAA | 362,753 | |||||||||||||||
| 1,069 | Federal Home Loan Bank Mortgages 20360701 |
2.498% | 7/01/36 | AAA | 1,127,449 | |||||||||||||||
| 31 | Federal Home Loan Mortgage Corporation, Mortgage Pool 1B3220 |
5.136% | 1/01/37 | AAA | 33,057 | |||||||||||||||
| 62 | Federal Home Loan Mortgage Corporation, Series 2376 |
5.500% | 11/15/16 | AAA | 65,341 | |||||||||||||||
| 50 | Fifth Third Auto Trust 2008-1 |
4.810% | 1/15/13 | AAA | 49,993 | |||||||||||||||
| 290 | Ford Credit Auto Owner Trust 10A |
2.930% | 11/15/15 | AAA | 300,595 | |||||||||||||||
| 2,950 | Fosse Master Issuer PLC, Residential Mortgage Pool, |
1.805% | 10/18/54 | AAA | 2,938,758 | |||||||||||||||
| 853 | Freddie Mac Mortgage Pool, Various 20310701 |
6.500% | 7/01/31 | AAA | 977,721 | |||||||||||||||
| 531 | Freddie Mac Mortgage Pool, Various 20370801 |
7.000% | 8/01/37 | AAA | 602,861 | |||||||||||||||
| 76 | Freddie Mac Non Gold Participation Certificates 20361201 |
6.212% | 12/01/36 | AAA | 82,188 | |||||||||||||||
| 207 | General Electric Capital Commercial Mortgage Corporation, Commercial Mortgage Pass-Through Certificates, Series 2002-2 |
5.349% | 8/11/36 | AAA | 209,218 | |||||||||||||||
| Nuveen Investments | 111 |
Portfolio of Investments (Unaudited)
Nuveen Total Return Bond Fund (continued)
December 31, 2011
| Principal Amount (000) |
Description (1) | Coupon | Maturity | Ratings (3) | Value | |||||||||||||||
| ASSET-BACKED AND MORTGAGE-BACKED SECURITIES (continued) |
|
|||||||||||||||||||
| $ | 850 | General Electric Capital Credit Card Master Note Trust Series 2010-3 |
2.210% | 6/15/16 | AAA | $ | 866,812 | |||||||||||||
| 12 | GMAC Mortgage Corporation, Mortgage Pass-Through Certificates, Series 2010-1 |
4.250% | 7/25/40 | Aa2 | 12,119 | |||||||||||||||
| 1,799 | Goldman Sachs Mortgage Securities Corporation II, Commercial Mortgage Pass-Through Certificates, Series 2006-GG6 |
5.506% | 4/10/38 | AAA | 1,811,077 | |||||||||||||||
| 3,135 | Goldman Sachs Mortgage Securities Corporation II, Commerical Mortgage Pass-Through Certificates, Series 2006-GG8 |
5.560% | 11/10/39 | AAA | 3,441,926 | |||||||||||||||
| 1,390 | Goldman Sachs Mortgage Securities Corporation II, Commercial Mortgage Pass-Through Certificates, Series 2007-GG10, (4) |
5.790% | 8/10/45 | AAA | 1,509,521 | |||||||||||||||
| 2,296 | Goldman Sachs Mortgage Securities Corporation, Mortgage Pass-Through Certificates, Series 2003-1 |
6.748% | 3/25/43 | Ba3 | 1,976,831 | |||||||||||||||
| 2,035 | Goldman Sachs Mortgage Securities Corporation, Mortgage Pass-Through Certificates, Series 2005-4F |
5.768% | 5/25/35 | CC | 1,261,355 | |||||||||||||||
| 1,943 | Goldman Sachs Mortgage Securities Corporation, Mortgage Pass-Through Certificates, Series 2005-AR1 |
3.052% | 1/25/35 | CC | 971,354 | |||||||||||||||
| 531 | Government National Mortgage Assocation, Guaranteed REMIC Pass Through Securities and MX Securities Trust |
4.500% | 5/16/38 | AAA | 564,053 | |||||||||||||||
| 2,145 | Government National Mortgage Association Mortgage Backed Securities |
5.000% | 1/01/42 | AAA | 2,375,923 | |||||||||||||||
| 458 | Green Tree Financial Corporation, Manufactured Housing Loans, |
7.000% | 4/25/38 | AAA | 462,671 | |||||||||||||||
| 73 | Green Tree Financial Corporation, Manufactured Housing Contract Pass Through Certificates Series 1996-8 |
8.050% | 11/15/26 | AAA | 75,187 | |||||||||||||||
| 2,420 | Greenwich Capital Commercial Funding Corporation, Commercial Mortgage Pass-Through Certificates, Series 2005-GG5 |
5.117% | 4/10/37 | AAA | 2,430,845 | |||||||||||||||
| 650 | Greenwich Capital Commercial Funding Corporation, Commercial Mortgage Pass Through Certificates, Series 2007-GG11 |
5.736% | 12/10/49 | AAA | 701,206 | |||||||||||||||
| 92 | GRMT Mortgage Loan Trust 2001-1A |
8.272% | 7/20/31 | A | 86,133 | |||||||||||||||
| 360 | Hertz Vehicle Financing LLC Series 2009 |
4.260% | 3/25/14 | Aaa | 368,526 | |||||||||||||||
| 120 | Hyundai Auto Receivables Trust 2009A |
2.030% | 8/15/13 | AAA | 120,336 | |||||||||||||||
| 2,080 | Impac Secured Assets Corporation, Mortgage Pass-Through Certificates, Series 2000-3 |
8.000% | 10/25/30 | BBB | 1,917,003 | |||||||||||||||
| 477 | IndyMac INDX Mortgage Loan Trust, Pass Through Certificates, Series 2005-AR1 |
2.625% | 3/25/35 | AAA | 407,119 | |||||||||||||||
| 526 | JPMorgan Mortage Trust, Mortgage Pass-Through Certtificates, Series 2006-A7 |
5.687% | 1/25/37 | C | 44,042 | |||||||||||||||
| 1,720 | JPMorgan Alternative Loan Trust, Mortgage Pass-Through Certificates, Series 2007-S1 |
0.574% | 4/25/47 | CCC | 1,170,339 | |||||||||||||||
| 4,035 | JPMorgan Chase Commercial Mortgage Securities Corporation, Commercial Mortgage Pass-Through Certificates, |
3.853% | 6/15/43 | AAA | 4,219,759 | |||||||||||||||
| 2,250 | JPMorgan Chase Commercial Mortgage Securities Corporation, Commercial Mortgage Pass-Through Certificates, Series 2011-C4 C |
5.251% | 7/15/46 | A | 1,919,948 | |||||||||||||||
| 3,845 | JPMorgan Chase Commerical Mortgage Trust, Commerical Mortage Pass Through Certificates, Series 2011-C4 |
4.106% | 7/15/46 | AAA | 4,058,013 | |||||||||||||||
| 1,547 | LB-UBS Commercial Mortgage Trust, Commercial Mortgage Pass-Through Certificates, Series 2005-C7 |
5.103% | 11/15/30 | AAA | 1,545,878 | |||||||||||||||
| 1,848 | Lehman Mortgage Trust, Mortgage Pass Through Certificates, Series 2008-6 |
5.870% | 7/25/47 | A | 1,717,399 | |||||||||||||||
| 112 | Nuveen Investments |
| Principal Amount (000) |
Description (1) | Coupon | Maturity | Ratings (3) | Value | |||||||||||||||
| ASSET-BACKED AND MORTGAGE-BACKED SECURITIES (continued) |
|
|||||||||||||||||||
| $ | 3,838 | Master RePerforming Loan Trust 2005-1 |
7.500% | 8/25/34 | BB | $ | 4,010,408 | |||||||||||||
| 230 | Merrill Lynch Mortgage Investors Inc, Commercial Mortgage Pass-Through Certificates, Series 2006 |
5.204% | 12/12/49 | Aa2 | 215,775 | |||||||||||||||
| 4,570 | Morgan Stanley Capital I Trust, Commercial Mortgage Pass-Through Certificates, Series 2006-IQ12 |
5.332% | 12/15/43 | AAA | 5,108,122 | |||||||||||||||
| 508 | National Credit Union Adminstration Guaranteed Structured Collateral Notes |
2.900% | 10/29/20 | AAA | 536,353 | |||||||||||||||
| 2,880 | OBP Depositor LLC Trust, Commercial Mortgage Pass Through Certificates, Series 2010-OBP |
4.646% | 7/15/45 | AAA | 3,219,607 | |||||||||||||||
| 1,745 | Ocwen Advance Receivables Backed Notes, Series 2009-3A |
4.140% | 7/15/23 | AAA | 1,747,181 | |||||||||||||||
| 1,999 | RBSSP Resecuritization Trust 2010-11 |
0.464% | 3/26/37 | 1,908,688 | ||||||||||||||||
| 2,982 | RBSSP Resecuritization Trust 2010-4 |
0.404% | 3/26/36 | A | 2,732,411 | |||||||||||||||
| 2,495 | Renaissance Home Equity Loan Trust I, Home Equity Loan Asset-Backed Notes, Series 2005-3 |
5.140% | 11/25/35 | AA+ | 1,882,882 | |||||||||||||||
| 510 | Residential Accredit Loans Inc., Mortgage Asset-Backed Pass-Through Certificates, Series 2005-QS12 |
5.500% | 8/25/35 | CCC | 446,726 | |||||||||||||||
| 350 | Salomon Brothers Commercial Mortgage Trust Pass-Through Certificates, Series 2002-KEY2 |
4.865% | 3/18/36 | AAA | 353,215 | |||||||||||||||
| 1,204 | Santander Drive Auto Receivables Trust, Series 2010-1 |
1.360% | 3/15/13 | AAA | 1,204,576 | |||||||||||||||
| 2,540 | Sequoia Mortgage Trust, Mortgage Pass Through Certificates, Series 2011-1 |
4.125% | 2/25/41 | AAA | 2,526,391 | |||||||||||||||
| 420 | Toyota Auto Receivables Owner Trust, Class A3, Series 2003B |
1.860% | 5/16/16 | AAA | 424,658 | |||||||||||||||
| 756 | Wachovia Mortgage Loan Trust LLC, Mortgage PasS-Through Certificates, Series 2005-B |
2.637% | 10/20/35 | CCC | 579,631 | |||||||||||||||
| 773 | Washington Mutual Mortgage Securities Corporation, Mortgage Pass-Through Certificates, Series 2004-RA3 |
6.437% | 8/25/38 | AAA | 806,097 | |||||||||||||||
| 40 | Wells Fargo Mortgage Backed Securties, 2005-AR16 Class 3A2 |
2.690% | 3/25/35 | BBB– | 36,334 | |||||||||||||||
| 2,250 | Wells Fargo-RBS Commercial Mortgage Trust, Commercial Mortgage Pass-Through Certificates, Series 2011-C3 |
5.335% | 3/15/44 | A | 1,976,138 | |||||||||||||||
| 3,300 | Wells Fargo-RBS Commercial Mortgage Trust, Commercial Mortgage Pass-Through Certificates, Series 2011-C3 |
4.375% | 3/15/44 | AAA | 3,513,834 | |||||||||||||||
| $ | 265,623 | Total Asset-Backed and Mortgage-Backed Securities (cost $266,108,678) |
|
269,458,186 | ||||||||||||||||
| Principal Amount (000) (6) |
Description (1) | Coupon | Maturity | Ratings (3) | Value | |||||||||||||||
| SOVEREIGN DEBT – 3.4% |
||||||||||||||||||||
| Argentina – 0.5% |
||||||||||||||||||||
| $ | 1,040 | Provincia de Buenos Aires |
10.875% | 1/26/21 | B | $ | 782,600 | |||||||||||||
| 160 | Province de Buenos Aires |
10.875% | 1/26/21 | B | 120,400 | |||||||||||||||
| 1,300 | Provincia de Cordoba |
12.375% | 8/17/17 | B | 1,092,000 | |||||||||||||||
| 1,400 | Republic of Argentina |
8.750% | 6/02/17 | B | 1,316,000 | |||||||||||||||
| 3,900 | Total Argentina |
3,311,000 | ||||||||||||||||||
| Australia – 1.2% |
||||||||||||||||||||
| 7,350 AUD | Australian Government |
4.500% | 4/15/20 | AAA | 8,001,172 | |||||||||||||||
| Canada – 0.9% |
||||||||||||||||||||
| 5,500 CAD | Canadian Government Debt |
3.75% | 6/01/19 | BBB | 6,177,600 | |||||||||||||||
| Indonesia – 0.3% |
||||||||||||||||||||
| 1,830 | Republic of Indonesia, 144A |
5.875% | 3/13/20 | BBB– | 2,072,475 | |||||||||||||||
| Nuveen Investments | 113 |
Portfolio of Investments (Unaudited)
Nuveen Total Return Bond Fund (continued)
December 31, 2011
| Principal Amount (000) (6) |
Description (1) | Coupon | Maturity | Ratings (3) | Value | |||||||||||||||
| Peru – 0.3% |
||||||||||||||||||||
| $ | 1,605 | Republic of Peru |
6.550% | 3/14/37 | BBB | $ | 2,038,350 | |||||||||||||
| Ukraine – 0.2% |
||||||||||||||||||||
| 1,250 | Ukraine Government |
7.750% | 9/23/20 | B+ | 1,081,250 | |||||||||||||||
| Total Sovereign Debt (cost $21,196,527) |
22,681,847 | |||||||||||||||||||
| Shares | Description (1) | Value | ||||||||||||||||||
| INVESTMENT COMPANIES – 0.2% |
||||||||||||||||||||
| 15,000 | Alliance National Municipal Inc. |
$ | 221,700 | |||||||||||||||||
| 36,000 | Blackrock Credit Allocation Income Trust IV |
437,400 | ||||||||||||||||||
| 40,000 | CBRE Clarion Global Real Estate Income Fund |
273,600 | ||||||||||||||||||
| 23,000 | Highland Credit Strategies Fund |
142,140 | ||||||||||||||||||
| 20,000 | Invesco Municipal Income Opportunities Trust |
133,000 | ||||||||||||||||||
| 2,000 | Pimco Income Strategy Fund |
20,800 | ||||||||||||||||||
| 16,000 | Pioneer Diversified High Income Trust, (4) |
307,520 | ||||||||||||||||||
| Total Investment Companies (cost $1,504,063) |
1,536,160 | |||||||||||||||||||
| Shares | Description (1) | Value | ||||||||||||||||||
| INVESTMENTS PURCHASED WITH COLLATERAL FROM SECURITIES LENDING – 10.3% |
|
|||||||||||||||||||
| Money Market Funds – 10.3% |
||||||||||||||||||||
| 67,926,716 | Mount Vernon Securities Lending Prime Portfolio, 0.233% (7),(8) |
$ | 67,926,716 | |||||||||||||||||
| Total Investments Purchased with Collateral from Securities Lending (cost $67,926,716) |
|
67,926,716 | ||||||||||||||||||
| Principal Shares |
Description (1) | Coupon |
Maturity |
Ratings (3) | Value | |||||||||||||||
| SHORT-TERM INVESTMENTS – 12.6% |
||||||||||||||||||||
| Money Market Funds – 11.8% |
||||||||||||||||||||
| 5 | First American Prime Obligations Fund, Class Z |
0.036% (7) | N/A | N/A | $ | 5 | ||||||||||||||
| 77,144,276 | First American Treasury Obligations Fund, Class Z |
0.000% (7) | N/A | N/A | 77,144,276 | |||||||||||||||
| Total Money Market Funds |
77,144,281 | |||||||||||||||||||
| U.S. Government and Agency Obligations – 0.8% |
||||||||||||||||||||
| $ | 3,500 | U.S. Treasury Bills, (9) |
0.013% | 4/05/12 | Aaa | $ | 3,499,818 | |||||||||||||
| 715 | U.S. Treasury Bills, (9) |
0.018% | 5/03/12 | Aaa | 714,940 | |||||||||||||||
| 350 | U.S. Treasury Bills, (9) |
0.033% | 5/31/12 | Aaa | 349,942 | |||||||||||||||
| 900 | U.S. Treasury Bills, (9) |
0.053% | 7/26/12 | Aaa | 899,718 | |||||||||||||||
| $ | 5,465 | Total U.S. Government and Agency Obligations |
5,464,418 | |||||||||||||||||
| Total Short-Term Investments (cost $82,608,775) |
82,608,699 | |||||||||||||||||||
| Total Investments (cost $779,593,180) – 119.8% |
787,828,901 | |||||||||||||||||||
| Other Assets Less Liabilities – (19.8)% (10) |
(130,136,330) | |||||||||||||||||||
| Net Assets – 100% |
$ | 657,692,571 | ||||||||||||||||||
| 114 | Nuveen Investments |
Investments in Derivatives at December 31, 2011:
Forward Foreign Currency Exchange Contracts outstanding:
| Counterparty | Currency Contracts to Deliver | Amount (Local Currency) |
In Exchange For Currency |
Amount (Local Currency) |
Settlement Date |
Unrealized Appreciation Depreciation) (U.S. Dollars)(10) |
||||||||||||||||
| JPMorgan Chase |
Euro | 5,280,000 | U.S. Dollar | 7,050,648 | 2/13/12 | $ | 214,613 | |||||||||||||||
| Citigroup |
Euro | 1,110,000 | U.S. Dollar | 1,448,679 | 2/21/12 | 11,446 | ||||||||||||||||
| JPMorgan Chase |
Euro | 10,600,000 | U.S. Dollar | 13,810,528 | 2/29/12 | 84,510 | ||||||||||||||||
| Citigroup |
U.S. Dollar | 3,491,886 | South Korean Won | 3,916,500,000 | 1/13/12 | (95,837 | ) | |||||||||||||||
| JPMorgan Chase |
U.S. Dollar | 2,597,458 | South Korean Won | 3,025,000,000 | 1/25/12 | 23,177 | ||||||||||||||||
| Citigroup |
U.S. Dollar | 3,753,065 | Mexican Peso | 52,800,000 | 2/08/12 | 17,438 | ||||||||||||||||
| Citigroup |
U.S. Dollar | 5,826,590 | New Zealand Dollar | 7,700,000 | 2/08/12 | 149,993 | ||||||||||||||||
| State Street |
U.S. Dollar | 3,626,796 | Australian Dollar | 3,270,000 | 2/17/12 | (301,383) | ||||||||||||||||
| Citigroup |
U.S. Dollar | 7,098,480 | Australian Dollar | 7,200,000 | 2/21/12 | 220,449 | ||||||||||||||||
| Citigroup |
U.S. Dollar | 5,995,900 | Canadian Dollar | 5,750,000 | 2/21/12 | 16,159 | ||||||||||||||||
| Citigroup |
U.S. Dollar | 5,621,163 | Canadian Dollar | 6,200,000 | 2/21/12 | 82,604 | ||||||||||||||||
| JPMorgan Chase |
U.S. Dollar | 3,169,103 | Mexican Peso | 43,900,000 | 2/21/12 | (37,278 | ) | |||||||||||||||
| JPMorgan Chase |
U.S. Dollar | 2,582,785 | South African Rand | 21,800,000 | 2/21/12 | 94,680 | ||||||||||||||||
| $ | 480,571 | |||||||||||||||||||||
Credit Default Swaps outstanding:
| Counterparty | Reference Entity | Buy/Sell Protection (11) |
Current Credit Spread (12) |
Notional (U.S. Dollars) |
Received* Fixed Rate |
Termination Date |
Value | Appreciation Depreciation) (U.S. Dollars)(10) |
||||||||||||||||||||||
| JPMorgan Chase |
Markit CDX NA HY17 Index | Sell | 8.35 | % | $ | 5,488,000 | 5.000 | % | 12/20/16 | $ | (375,885 | ) | $ | 275,806 | ||||||||||||||||
| UBS |
Markit CDX NA HY17 Index | Sell | 8.37 | 3,136,000 | 5.000 | 12/20/16 | (402,733 | ) | 165,273 | |||||||||||||||||||||
| UBS |
Markit CDX NA HY17 Index | Sell | 8.37 | 5,880,000 | 5.000 | 12/20/16 | (214,791 | ) | 299,016 | |||||||||||||||||||||
| $ | 740,095 | |||||||||||||||||||||||||||||
| * | Annualized. |
Interest Rate Swaps outstanding:
| Counterparty | Notional Amount |
Fund Pay/Receive Floating Rate |
Floating Rate Index |
Fixed Rate* | Fixed Rate Payment Frequency |
Termination Date |
Value (U.S. Dollars) |
Unrealized Appreciation (Depreciation) (U.S. Dollars)(10) |
||||||||||||||||||||||||||
| Citigroup |
$ | 9,800,000 | ZAR | Pay | 3-Month JIBAR | 7.655 | % | Quarterly | 1/07/21 | $ | 18,050 | $ | 18,050 | |||||||||||||||||||||
| Citigroup |
23,500,000 | ZAR | Pay | 3-Month JIBAR | 7.655 | Quarterly | 1/07/21 | 41,472 | 42,132 | |||||||||||||||||||||||||
| UBS |
41,000,000 | USD | Receive | 3-Month USD-LIBOR | 2.056 | Semi-Annually | 7/01/15 | (2,030,848 | ) | (2,030,848 | ) | |||||||||||||||||||||||
| $ | (1,970,666) | |||||||||||||||||||||||||||||||||
| * | Annualized. |
Futures Contracts outstanding:
| Type | Contract Position |
Number of Contracts |
Contract Expiration |
Value (U.S. Dollars) |
Unrealized Appreciation (Depreciation) (U.S. Dollars)(10) |
|||||||||||||||
| U.S. Treasury 5-Year Note |
Short | (208 | ) | 3/12 | $ | (25,637,624 | ) | $ | (109,318) | |||||||||||
| U.S. Treasury 10-Year Note |
Short | (209 | ) | 3/12 | (27,405,125 | ) | (294,282 | ) | ||||||||||||
| U.S. Treasury Long Bond |
Short | (18 | ) | 3/12 | (2,606,625 | ) | (67,092 | ) | ||||||||||||
| $ | (470,692 | ) | ||||||||||||||||||
Call Options Purchased outstanding:
| Number of Contracts | Type | Notional Amount (13) |
Expiration Date |
Strike Price |
Value(10) | |||||||||||||
| 411 | U.S. 10-Year Note Futures |
5,466,300 | 2/12 | 133.0 | $ | 70,641 | ||||||||||||
| 411 | Total Call Options Purchased (premiums paid $150,916) |
$ | 70,641 | |||||||||||||||
| Nuveen Investments | 115 |
Portfolio of Investments (Unaudited)
Nuveen Total Return Bond Fund (continued)
December 31, 2011
| For Fund portfolio compliance purposes, the Fund’s industry classifications refer to any one or more of the industry sub-classifications used by one or more widely recognized market indexes or ratings group indexes, and/or as defined by Fund management. This definition may not apply for purposes of this report which may combine industry sub-classifications into sectors for reporting ease. |
| (1) | All Percentages shown in the Portfolio of Investments are based on net assets. |
| (2) | Investment valued at fair value using methods determined in good faith by, or at the discretion of, the Board of Directors. For fair value measurement disclosure purposes, investment categorized as Level 3. See Notes to Financial Statements, Footnote 1 – General Information and Significant Accounting Policies, Investment Valuation for more information. |
| (3) | Ratings: Using the highest of Standard & Poor’s Group (“Standard & Poor’s”), Moody’s Investors Service, Inc. (“Moody’s”) or Fitch, Inc. (“Fitch”) rating. Ratings below BBB by Standard & Poor’s, Baa by Moody’s or BBB by Fitch are considered to be below investment grade. Holdings designated N/R are not rated by any of these national rating agencies. |
| (4) | Investment, or a portion of investment, is out on loan for securities lending. |
| (5) | Optional Call Provisions: Dates (month and year) and prices of the earliest optional call or redemption. There may be other call provisions at varying prices at later dates. Certain mortgage-backed securities may be subject to periodic principal paydowns. |
| (6) | Principal Amount (000) denominated in U.S. Dollars, unless otherwise noted. |
| (7) | The rate shown is the annualized seven-day effective yield as of December 31, 2011. |
| (8) | The Fund may loan securities representing up to one third of the fair value of its total assets (which includes collateral for securities on loan) to broker-dealers, banks, or other institutional borrowers of securities. The Fund maintains collateral equal to at least 102% of the fair value of the securities loaned. The adequacy of the collateral is monitored on a daily basis. The cash collateral received by the Fund is invested in this money market fund. |
| (9) | Investment, or portion of investment, segregated as collateral for investments in derivatives. Yield shown is effective yield as of December 31, 2011. |
| (10) | Other Assets Less Liabilities, includes the Value and the Unrealized Appreciation (Depreciation) of derivative instruments as noted in Investments in Derivatives at December 31, 2011. |
| (11) | The Fund entered into the credit default swaps to gain investment exposure to the referenced entity. Selling protection has a similar credit risk position to owning the referenced entity. Buying protection has a similar credit risk position to selling the referenced entity short. |
| (12) | The credit spread generally serves as an indication of the current status of the payment/performance risk and therefore the likelihood of default of the credit derivative. The credit spread also reflects the cost of buying/selling protection and may include upfront payments required to be made to enter into a credit default swap contract. Higher credit spreads are indicative of higher likelihood of performance by the seller of protection. |
| (13) | For disclosure purposes, Notional Amount is calculated by multiplying the Number of Contracts by Strike Price by 100. |
| WI/DD | Purchased on a when-issued or delayed delivery basis. |
| N/A | Not applicable. |
| N/R | Not rated. |
| TBA | To be announced. Maturity date not known prior to settlement of this transaction. |
| 144A | Investment is exempt from registration under Rule 144A of the Securities Act of 1933, as amended. These investments may only be resold in transactions exempt from registration, which are normally those transactions with qualified institutional buyers. |
| JIBAR | Johannesburg Inter-Bank Agreed Rate |
| USD-LIBOR | United States Dollar–London Inter-Bank Offered Rate. |
| AUD | Australian Dollar |
| CAD | Canadian Dollar |
| ZAR | South African Rand |
See accompanying notes to financial statements.
| 116 | Nuveen Investments |
Statement of Assets & Liabilities
| Nuveen Investments | 117 |
Statement of Assets & Liabilities (Unaudited)
December 31, 2011
| Core Bond |
Global Total Return Bond |
High Income Bond |
Inflation Protected Securities |
|||||||||||||
| Assets |
||||||||||||||||
| Investments, at value (cost $880,743,011, $13,469,145, $574,157,417 and $286,798,813, respectively) |
$ | 907,136,491 | $ | 13,440,760 | $ | 546,132,778 | $ | 312,257,154 | ||||||||
| Investment purchased with collateral from securities lending (at cost, which approximates value) |
265,290,988 | — | 141,911,228 | 110,025,443 | ||||||||||||
| Short-Term investments (cost $55,572,280, $3,134,657, $2,025,250 and $4,999,174, respectively) |
55,572,077 | 3,134,657 | 2,025,234 | 4,999,132 | ||||||||||||
| Options purchased, at value (premiums paid $—, $6,216, $— and $—, respectively) |
— | 2,922 | — | — | ||||||||||||
| Cash denominated in foreign currencies (cost $—, $139,293, $— and $—, respectively) |
— | 136,795 | — | — | ||||||||||||
| Cash |
— | 3,103,473 | 38,969 | 16,252 | ||||||||||||
| Unrealized appreciation on: |
||||||||||||||||
| Credit default swaps |
— | 3,127 | — | 249,179 | ||||||||||||
| Forward foreign currency exchange contracts |
— | 98,858 | — | 69,753 | ||||||||||||
| Interest rate swaps |
— | — | — | — | ||||||||||||
| Receivables: |
||||||||||||||||
| Dividends |
— | — | 269,199 | 4,978 | ||||||||||||
| Due from broker |
206,170 | — | 42,025 | 10,268 | ||||||||||||
| Interest |
7,082,060 | 130,933 | 12,151,021 | 1,905,873 | ||||||||||||
| Investments sold |
18,478,303 | — | 2,805,678 | 154,787 | ||||||||||||
| Shares sold |
274,811 | — | 979,725 | 763,407 | ||||||||||||
| Variation margin on futures contracts |
— | 1,912 | 10,411 | 7,110 | ||||||||||||
| Other assets |
25,154 | — | 22,474 | 33,513 | ||||||||||||
| Total assets |
1,254,066,054 | 20,053,437 | 706,388,742 | 430,496,849 | ||||||||||||
| Liabilities |
||||||||||||||||
| Cash overdraft |
199,874 | — | — | — | ||||||||||||
| Credit default swap premiums received |
— | 137,035 | — | 584,791 | ||||||||||||
| Unrealized depreciation on: |
||||||||||||||||
| Credit default swaps |
— | 5,318 | — | — | ||||||||||||
| Forward foreign currency exchange contracts |
— | 127,599 | — | — | ||||||||||||
| Interest rate swaps |
2,601,017 | — | — | 333,245 | ||||||||||||
| Payables: |
||||||||||||||||
| Collateral from securities lending program |
265,290,988 | — | 141,911,228 | 110,025,443 | ||||||||||||
| Dividends |
1,967,771 | — | 2,902,071 | 3,686,281 | ||||||||||||
| Investments purchased |
69,331,822 | 5,818,382 | 949,882 | — | ||||||||||||
| Shares redeemed |
1,107,396 | — | 1,498,901 | 220,156 | ||||||||||||
| Variation margin on futures contracts |
68,151 | — | — | — | ||||||||||||
| Accrued expenses: |
||||||||||||||||
| Management fees |
483,172 | 3,987 | 362,450 | 158,401 | ||||||||||||
| 12b-1 distribution and service fees |
22,120 | 71 | 57,228 | 9,613 | ||||||||||||
| Other |
384,173 | 6,125 | 673,797 | 216,155 | ||||||||||||
| Total liabilities |
341,456,484 | 6,098,517 | 148,355,557 | 115,234,085 | ||||||||||||
| Net assets |
$ | 912,609,570 | $ | 13,954,920 | $ | 558,033,185 | $ | 315,262,764 | ||||||||
See accompanying notes to financial statements.
| 118 | Nuveen Investments |
| Core Bond |
Global Total Return Bond |
High Income Bond |
Inflation Protected Securities |
|||||||||||||
| Class A Shares |
||||||||||||||||
| Net assets |
$ | 82,762,826 | $ | 49,829 | $ | 88,977,371 | $ | 13,784,599 | ||||||||
| Shares outstanding |
7,231,304 | 2,500 | 10,661,517 | 1,200,807 | ||||||||||||
| Net asset value per share |
$ | 11.45 | $ | 19.93 | $ | 8.35 | $ | 11.48 | ||||||||
| Offering price per share (net asset value per share plus maximum sales charge of 4.25%, 4.75%, 4.75% and 4.25%, respectively, of offering price) |
$ | 11.96 | $ | 20.92 | $ | 8.77 | $ | 11.99 | ||||||||
| Class B Shares |
||||||||||||||||
| Net assets |
$ | 1,425,491 | N/A | $ | 2,293,625 | N/A | ||||||||||
| Shares outstanding |
125,718 | N/A | 276,359 | N/A | ||||||||||||
| Net asset value and offering price per share |
$ | 11.34 | N/A | $ | 8.30 | N/A | ||||||||||
| Class C Shares |
||||||||||||||||
| Net assets |
$ | 4,080,972 | $ | 49,798 | $ | 43,474,889 | $ | 7,950,359 | ||||||||
| Shares outstanding |
358,058 | 2,500 | 5,220,779 | 697,704 | ||||||||||||
| Net asset value and offering price per share |
$ | 11.40 | $ | 19.92 | $ | 8.33 | $ | 11.40 | ||||||||
| Class R3 Shares |
||||||||||||||||
| Net assets |
$ | 373,120 | $ | 49,819 | $ | 427,739 | $ | 118,336 | ||||||||
| Shares outstanding |
32,438 | 2,500 | 50,165 | 10,356 | ||||||||||||
| Net asset value and offering price per share |
$ | 11.50 | $ | 19.93 | $ | 8.53 | $ | 11.43 | ||||||||
| Class I Shares |
||||||||||||||||
| Net assets |
$ | 823,967,161 | $ | 13,805,474 | $ | 422,859,561 | $ | 293,409,470 | ||||||||
| Shares outstanding |
72,030,837 | 692,500 | 50,571,477 | 25,537,458 | ||||||||||||
| Net asset value and offering price per share |
$ | 11.44 | $ | 19.94 | $ | 8.36 | $ | 11.49 | ||||||||
| Net assets consist of: |
||||||||||||||||
| Capital paid-in |
$ | 898,322,775 | $ | 14,000,000 | $ | 596,472,070 | $ | 298,290,600 | ||||||||
| Undistributed (Over-distribution of) net investment income |
430,778 | 15,035 | 896,530 | 653,845 | ||||||||||||
| Accumulated net realized gain (loss) |
(9,677,949 | ) | (12,677 | ) | (11,349,583 | ) | (9,140,901 | ) | ||||||||
| Net unrealized appreciation (depreciation) |
23,533,966 | (47,438 | ) | (27,985,832 | ) | 25,459,220 | ||||||||||
| Net assets |
$ | 912,609,570 | $ | 13,954,920 | $ | 558,033,185 | $ | 315,262,764 | ||||||||
| Authorized shares |
2 billion | Unlimited | 2 billion | 2 billion | ||||||||||||
| Par value per share |
$ | 0.0001 | $ | 0.01 | $ | 0.0001 | $ | 0.0001 | ||||||||
| N/A | – Global Total Return Bond and Inflation Protected Securities do not offer Class B Shares. |
See accompanying notes to financial statements.
| Nuveen Investments | 119 |
Statement of Assets & Liabilities (Unaudited) (continued)
December 31, 2011
| Intermediate Government Bond |
Intermediate Term Bond |
Short Term Bond |
Total Return Bond |
|||||||||||||
| Assets |
||||||||||||||||
| Investments, at value (cost $102,979,317, $612,362,750, $789,746,615 and $629,057,689, respectively) |
$ | 106,751,339 | $ | 634,731,461 | $ | 788,757,162 | $ | 637,293,486 | ||||||||
| Investment purchased with collateral from securities lending (at cost, which approximates value) |
30,419,777 | 145,279,759 | 85,327,821 | 67,926,716 | ||||||||||||
| Short-Term investments (cost $3,217,633, $18,779,484, $13,002,291 and $82,608,775, respectively) |
3,217,605 | 18,779,415 | 13,002,105 | 82,608,699 | ||||||||||||
| Options purchased, at value (premiums paid $—, $—, $— and $150,916, respectively) |
— | — | — | 70,641 | ||||||||||||
| Cash denominated in foreign currencies (cost $—, $—, $762 and $310,036, respectively) |
— | — | 637 | 307,593 | ||||||||||||
| Cash |
2,819 | — | 173,498 | — | ||||||||||||
| Unrealized appreciation on: |
||||||||||||||||
| Credit default swaps |
— | — | — | 740,095 | ||||||||||||
| Forward foreign currency exchange contracts |
— | — | 146,966 | 915,069 | ||||||||||||
| Interest rate swaps |
— | — | — | 60,182 | ||||||||||||
| Receivables: |
||||||||||||||||
| Dividends |
— | — | — | 62,710 | ||||||||||||
| Due from broker |
9,387 | 12,477 | 10,958 | 41,058 | ||||||||||||
| Interest |
547,337 | 5,297,346 | 6,076,807 | 6,417,436 | ||||||||||||
| Investments sold |
41,982 | 58,941 | 151,533 | 47,261,330 | ||||||||||||
| Shares sold |
41,624 | 4,488,130 | 1,178,366 | 1,330,373 | ||||||||||||
| Variation margin on futures contracts |
30,374 | 779 | — | — | ||||||||||||
| Other assets |
16,823 | 15,961 | 75,240 | 114,012 | ||||||||||||
| Total assets |
141,079,067 | 808,664,269 | 894,901,093 | 845,149,400 | ||||||||||||
| Liabilities |
||||||||||||||||
| Cash overdraft |
— | 189 | — | 342,939 | ||||||||||||
| Credit default swap premiums received |
— | — | — | 1,733,504 | ||||||||||||
| Unrealized depreciation on: |
||||||||||||||||
| Credit default swaps |
— | — | — | — | ||||||||||||
| Forward foreign currency exchange contracts |
— | — | 106,798 | 434,498 | ||||||||||||
| Interest rate swaps |
— | 1,565,071 | 1,092,412 | 2,030,848 | ||||||||||||
| Payables: |
||||||||||||||||
| Collateral from securities lending program |
30,419,777 | 145,279,759 | 85,327,821 | 67,926,716 | ||||||||||||
| Dividends |
126,905 | 1,210,724 | 1,360,038 | 1,581,456 | ||||||||||||
| Investments purchased |
2,351,466 | 132,430 | — | 111,933,400 | ||||||||||||
| Shares redeemed |
35,793 | 358,281 | 1,708,874 | 454,677 | ||||||||||||
| Variation margin on futures contracts |
— | — | 143,902 | 105,432 | ||||||||||||
| Accrued expenses: |
||||||||||||||||
| Management fees |
36,465 | 375,270 | 422,339 | 437,499 | ||||||||||||
| 12b-1 distribution and service fees |
3,015 | 3,466 | 58,304 | 38,202 | ||||||||||||
| Other |
80,755 | 300,206 | 543,678 | 437,655 | ||||||||||||
| Total liabilities |
33,054,176 | 149,225,396 | 90,764,166 | 187,456,829 | ||||||||||||
| Net assets |
$ | 108,024,891 | $ | 659,438,873 | $ | 804,136,927 | $ | 657,692,571 | ||||||||
See accompanying notes to financial statements.
| 120 | Nuveen Investments |
| Intermediate Government Bond |
Intermediate Term Bond |
Short Term Bond |
Total Return Bond |
|||||||||||||
| Class A Shares |
||||||||||||||||
| Net assets |
$ | 13,714,192 | $ | 21,176,803 | $ | 128,486,782 | $ | 53,677,620 | ||||||||
| Shares outstanding |
1,523,646 | 2,021,964 | 13,065,181 | 5,103,402 | ||||||||||||
| Net asset value per share |
$ | 9.00 | $ | 10.47 | $ | 9.83 | $ | 10.52 | ||||||||
| Offering price per share (net asset value per share plus maximum sales charge of 3.00%, 3.00%, 2.25% and 4.25%, respectively, of offering price) |
$ | 9.28 | $ | 10.79 | $ | 10.06 | $ | 10.99 | ||||||||
| Class B Shares |
||||||||||||||||
| Net assets |
N/A | N/A | N/A | $ | 2,386,755 | |||||||||||
| Shares outstanding |
N/A | N/A | N/A | 228,145 | ||||||||||||
| Net asset value and offering price per share |
N/A | N/A | N/A | $ | 10.46 | |||||||||||
| Class C Shares |
||||||||||||||||
| Net assets |
$ | 1,262,717 | $ | 875,179 | $ | 47,965,477 | $ | 29,544,868 | ||||||||
| Shares outstanding |
140,202 | 83,923 | 4,866,416 | 2,826,949 | ||||||||||||
| Net asset value and offering price per share |
$ | 9.01 | $ | 10.43 | $ | 9.86 | $ | 10.45 | ||||||||
| Class R3 Shares |
||||||||||||||||
| Net assets |
$ | 532,114 | N/A | $ | 478,246 | $ | 1,239,261 | |||||||||
| Shares outstanding |
59,163 | N/A | 48,596 | 117,367 | ||||||||||||
| Net asset value and offering price per share |
$ | 8.99 | N/A | $ | 9.84 | $ | 10.56 | |||||||||
| Class I Shares |
||||||||||||||||
| Net assets |
$ | 92,515,868 | $ | 637,386,891 | $ | 627,206,422 | $ | 570,844,067 | ||||||||
| Shares outstanding |
10,274,639 | 61,089,682 | 63,768,746 | 54,320,606 | ||||||||||||
| Net asset value and offering price per share |
$ | 9.00 | $ | 10.43 | $ | 9.84 | $ | 10.51 | ||||||||
| Net assets consist of: |
||||||||||||||||
| Capital paid-in |
$ | 113,844,192 | $ | 640,285,956 | $ | 833,064,681 | $ | 714,028,982 | ||||||||
| Undistributed (Over-distribution of) net investment income |
(28,289 | ) | (719,854 | ) | 823,159 | 2,717,716 | ||||||||||
| Accumulated net realized gain (loss) |
(9,653,616 | ) | (846,778 | ) | (27,274,567 | ) | (65,998,804 | ) | ||||||||
| Net unrealized appreciation (depreciation) |
3,862,604 | 20,719,549 | (2,476,346 | ) | 6,944,677 | |||||||||||
| Net assets |
$ | 108,024,891 | $ | 659,438,873 | $ | 804,136,927 | $ | 657,692,571 | ||||||||
| Authorized shares |
2 billion | 2 billion | 2 billion | 2 billion | ||||||||||||
| Par value per share |
$ | 0.0001 | $ | 0.0001 | $ | 0.0001 | $ | 0.0001 | ||||||||
| N/A | – Intermediate Government Bond and Short Term Bond do not offer Class B Shares. Intermediate Term Bond does not offer Class B Shares or Class R3 Shares. |
See accompanying notes to financial statements.
| Nuveen Investments | 121 |
Statement of Operations (Unaudited)
Six Months Ended December 31, 2011
| Core Bond |
Global Total Return Bond* |
High Income Bond |
Inflation Protected Securities |
|||||||||||||
| Investment Income |
||||||||||||||||
| Dividend and interest income (net of foreign tax withheld of $—, $—, $6,656 and $—, respectively) |
$ | 21,171,777 | $ | 23,215 | $ | 22,735,733 | $ | 3,323,330 | ||||||||
| Securities lending income |
99,520 | — | 211,493 | 66,546 | ||||||||||||
| Total investment income |
21,271,297 | 23,215 | 22,947,226 | 3,389,876 | ||||||||||||
| Expenses |
||||||||||||||||
| Management fees |
3,007,181 | 6,355 | 1,875,430 | 985,077 | ||||||||||||
| 12b-1 service fees – Class A |
105,670 | 10 | 60,583 | 16,872 | ||||||||||||
| 12b-1 distribution and service fees – Class B |
8,101 | N/A | 7,468 | N/A | ||||||||||||
| 12b-1 distribution and service fees – Class C |
19,154 | 41 | 100,786 | 37,869 | ||||||||||||
| 12b-1 distribution and service fees – Class R3 |
952 | 20 | 848 | 213 | ||||||||||||
| Shareholders’ servicing agent fees and expenses |
201,819 | 1,164 | 213,420 | 93,030 | ||||||||||||
| Custodian’s fees and expenses |
93,105 | 440 | 70,265 | 31,984 | ||||||||||||
| Directors’/Trustees’ fees and expenses |
12,747 | 29 | 8,510 | 4,277 | ||||||||||||
| Professional fees |
7,499 | 2,621 | 8,029 | 8,241 | ||||||||||||
| Shareholders’ reports – printing and mailing expenses |
80,159 | 571 | 56,100 | 24,785 | ||||||||||||
| Federal and state registration fees |
20,280 | 1,283 | 32,821 | 24,899 | ||||||||||||
| Reorganization expense |
— | — | 19,000 | — | ||||||||||||
| Other expenses |
21,272 | 18 | 17,745 | 10,954 | ||||||||||||
| Total expenses before expense reimbursement |
3,577,939 | 12,552 | 2,471,005 | 1,238,201 | ||||||||||||
| Expense reimbursement |
(72,800 | ) | (4,372 | ) | (165,511 | ) | (261,619 | ) | ||||||||
| Net expenses |
3,505,139 | 8,180 | 2,305,494 | 976,582 | ||||||||||||
| Net investment income (loss) |
17,766,158 | 15,035 | 20,641,732 | 2,413,294 | ||||||||||||
| Realized and Unrealized Gain (Loss) |
||||||||||||||||
| Net realized gain (loss) from: |
||||||||||||||||
| Investments and foreign currency |
12,922,483 | (20,826 | ) | (10,763,570 | ) | 3,115,040 | ||||||||||
| Forward foreign currency exchange contracts |
— | — | — | (30,640 | ) | |||||||||||
| Futures contracts |
(6,034,026 | ) | 10,141 | (76,238 | ) | (221,438 | ) | |||||||||
| Options purchased |
— | (3,281 | ) | — | — | |||||||||||
| Options written |
— | — | — | — | ||||||||||||
| Swaps |
(1,140,065 | ) | 1,289 | — | (582,431 | ) | ||||||||||
| Change in net unrealized appreciation (depreciation) of: |
||||||||||||||||
| Investments and foreign currency |
(3,407,490 | ) | (32,096 | ) | (32,894,094 | ) | 15,909,757 | |||||||||
| Forward foreign currency exchange contracts |
— | (28,741 | ) | — | 69,753 | |||||||||||
| Futures contracts |
(1,146,984 | ) | 18,884 | 38,801 | (61,134 | ) | ||||||||||
| Options purchased |
— | (3,294 | ) | — | — | |||||||||||
| Options written |
— | — | — | — | ||||||||||||
| Swaps |
(124,532 | ) | (2,191 | ) | — | 220,075 | ||||||||||
| Net realized and unrealized gain (loss) |
1,069,386 | (60,115 | ) | (43,695,101 | ) | 18,418,982 | ||||||||||
| Net increase (decrease) in net assets from operations |
$ | 18,835,544 | $ | (45,080 | ) | $ | (23,053,369 | ) | $ | 20,832,276 | ||||||
| * | For the period December 2, 2011 (commencement of operations) through December 31, 2011. |
| N/A – | Global Total Return Bond and Inflation Protected Securities does not offer Class B Shares. |
See accompanying notes to financial statements.
| 122 | Nuveen Investments |
| Intermediate Government Bond |
Intermediate Term Bond |
Short Term Bond |
Total Return Bond |
|||||||||||||
| Investment Income |
||||||||||||||||
| Dividend and interest income (net of foreign tax withheld of $—, $—, $— and $—, respectively) |
$ | 1,574,534 | $ | 12,304,107 | $ | 12,601,518 | $ | 13,952,951 | ||||||||
| Securities lending income |
11,748 | 69,815 | 56,673 | 52,118 | ||||||||||||
| Total investment income |
1,586,282 | 12,373,922 | 12,658,191 | 14,005,069 | ||||||||||||
| Expenses |
||||||||||||||||
| Management fees |
366,049 | 2,061,717 | 1,867,309 | 1,940,460 | ||||||||||||
| 12b-1 service fees – Class A |
10,449 | 16,570 | 67,910 | 42,495 | ||||||||||||
| 12b-1 distribution and service fees – Class B |
N/A | N/A | N/A | 7,363 | ||||||||||||
| 12b-1 distribution and service fees – Class C |
6,650 | 4,444 | 77,772 | 72,997 | ||||||||||||
| 12b-1 distribution and service fees – Class R3 |
1,248 | N/A | 302 | 2,829 | ||||||||||||
| Shareholders’ servicing agent fees and expenses |
45,983 | 112,459 | 158,192 | 112,496 | ||||||||||||
| Custodian’s fees and expenses |
11,290 | 57,628 | 84,053 | 69,820 | ||||||||||||
| Directors’/Trustees’ fees and expenses |
1,527 | 8,733 | 13,694 | 10,925 | ||||||||||||
| Professional fees |
8,295 | 7,807 | 7,768 | 7,968 | ||||||||||||
| Shareholders’ reports – printing and mailing expenses |
15,967 | 29,192 | 64,091 | 51,544 | ||||||||||||
| Federal and state registration fees |
17,626 | 30,265 | 7,483 | 18,328 | ||||||||||||
| Reorganization expense |
— | — | 99,000 | 121,000 | ||||||||||||
| Other expenses |
11,542 | 17,255 | 22,888 | 19,261 | ||||||||||||
| Total expenses before expense reimbursement |
496,626 | 2,346,070 | 2,470,462 | 2,477,486 | ||||||||||||
| Expense reimbursement |
(140,739 | ) | (34,072 | ) | (60,393 | ) | (150,858 | ) | ||||||||
| Net expenses |
355,887 | 2,311,998 | 2,410,069 | 2,326,628 | ||||||||||||
| Net investment income (loss) |
1,230,395 | 10,061,924 | 10,248,122 | 11,678,441 | ||||||||||||
| Realized and Unrealized Gain (Loss) |
||||||||||||||||
| Net realized gain (loss) from: |
||||||||||||||||
| Investments and foreign currency |
404,905 | 3,709,409 | 3,316,781 | 8,241,702 | ||||||||||||
| Forward foreign currency exchange contracts |
— | — | (442,249 | ) | (2,232,173 | ) | ||||||||||
| Futures contracts |
519,404 | (604,919 | ) | (6,302,279 | ) | (5,524,323 | ) | |||||||||
| Options purchased |
|
— |
|
— | — | (1,075,687 | ) | |||||||||
| Options written |
— | — | — | (321,084 | ) | |||||||||||
| Swaps |
— | (477,114 | ) | (2,002,014 | ) | (1,512,017 | ) | |||||||||
| Change in net unrealized appreciation (depreciation) of: |
||||||||||||||||
| Investments and foreign currency |
1,038,862 | (1,457,094 | ) | (14,585,477 | ) | (6,534,985 | ) | |||||||||
| Forward foreign currency exchange contracts |
— | — | 132,990 | 466,827 | ||||||||||||
| Futures contracts |
100,934 | (178,927 | ) | 191,389 | (669,157 | ) | ||||||||||
| Options purchased |
— | — | — | (80,275 | ) | |||||||||||
| Options written |
— | — | — | (113,961 | ) | |||||||||||
| Swaps |
— | (107,011 | ) | (508,439 | ) | (195,081 | ) | |||||||||
| Net realized and unrealized gain (loss) |
2,064,105 | 884,344 | (20,199,298 | ) | (9,550,214 | ) | ||||||||||
| Net increase (decrease) in net assets from operations |
$ | 3,294,500 | $ | 10,946,268 | $ | (9,951,176 | ) | $ | 2,128,227 | |||||||
| N/A | – Intermediate Government Bond and Short Term Bond do not offer Class B Shares. Intermediate Term Bond does not offer Class B Shares or Class R3 Shares. |
See accompanying notes to financial statements.
| Nuveen Investments | 123 |
Statement of Changes in Net Assets (Unaudited)
| Global Total Return Bond |
||||||||||||||||||||
| Core Bond | Period 12/02/11 (commencement of operations) through 12/31/11 |
High Income Bond | ||||||||||||||||||
| Six Months |
Year Ended |
Six Months |
Year Ended |
|||||||||||||||||
| Operations |
||||||||||||||||||||
| Net investment income (loss) |
$ | 17,766,158 | $ | 47,739,793 | $ | 15,035 | $ | 20,641,732 | $ | 36,550,090 | ||||||||||
| Net realized gain (loss) from: |
||||||||||||||||||||
| Investments and foreign currency |
12,922,483 | 54,185,668 | (20,826 | ) | (10,763,570 | ) | 24,993,013 | |||||||||||||
| Forward foreign currency exchange contracts |
— | — | — | — | — | |||||||||||||||
| Futures contracts |
(6,034,026 | ) | (8,856,879 | ) | 10,141 | (76,238 | ) | 439,344 | ||||||||||||
| Options purchased |
— | — | (3,281 | ) | — | — | ||||||||||||||
| Options written |
— | — | — | — | — | |||||||||||||||
| Swaps |
(1,140,065 | ) | (2,009,429 | ) | 1,289 | — | — | |||||||||||||
| Change in net unrealized appreciation (depreciation) of: |
||||||||||||||||||||
| Investments and foreign currency |
(3,407,490 | ) | (22,473,175 | ) | (32,096 | ) | (32,894,094 | ) | 12,502,589 | |||||||||||
| Forward foreign currency exchange contracts |
— | — | (28,741 | ) | — | — | ||||||||||||||
| Futures contracts |
(1,146,984 | ) | 3,005,732 | 18,884 | 38,801 | (178,442 | ) | |||||||||||||
| Options purchased |
— | — | (3,294 | ) | — | — | ||||||||||||||
| Options written |
— | — | — | — | — | |||||||||||||||
| Swaps |
(124,532 | ) | 62,340 | (2,191 | ) | — | — | |||||||||||||
| Net increase (decrease) in net assets from operations |
18,835,544 | 71,654,050 | (45,080 | ) | (23,053,369 | ) | 74,306,594 | |||||||||||||
| Distributions to Shareholders |
||||||||||||||||||||
| From net investment income: |
||||||||||||||||||||
| Class A |
(1,544,324 | ) | (3,347,296 | ) | — | (1,943,335 | ) | (2,338,443 | ) | |||||||||||
| Class B |
(23,453 | ) | (75,877 | ) | N/A | (53,593 | ) | (103,717 | ) | |||||||||||
| Class C |
(56,275 | ) | (109,255 | ) | — | (740,956 | ) | (588,496 | ) | |||||||||||
| Class R3(1) |
(6,433 | ) | (17,140 | ) | — | (12,803 | ) | (26,632 | ) | |||||||||||
| Class I(1) |
(17,057,237 | ) | (42,653,198 | ) | — | (17,500,123 | ) | (33,008,236 | ) | |||||||||||
| From accumulated net realized gains: |
||||||||||||||||||||
| Class A |
— | — | — | (298,280 | ) | — | ||||||||||||||
| Class B |
— | — | N/A | (7,773 | ) | — | ||||||||||||||
| Class C |
— | — | — | (148,234 | ) | — | ||||||||||||||
| Class R3(1) |
— | — | — | (1,386 | ) | — | ||||||||||||||
| Class I(1) |
— | — | — | (1,460,981 | ) | — | ||||||||||||||
| Decrease in net assets from distributions to shareholders |
(18,687,722 | ) | (46,202,766 | ) | — | (22,167,464 | ) | (36,065,524 | ) | |||||||||||
| Fund Share Transactions |
||||||||||||||||||||
| Fund reorganization |
— | — | — | 109,635,647 | — | |||||||||||||||
| Proceeds from sale of shares |
76,309,012 | 157,991,764 | 14,000,000 | 104,027,574 | 226,022,874 | |||||||||||||||
| Proceeds from shares issued to shareholders due to reinvestment of distributions |
6,398,823 | 16,255,878 | — | 4,954,160 | 5,754,839 | |||||||||||||||
| 82,707,835 | 174,247,642 | 14,000,000 | 218,617,381 | 231,777,713 | ||||||||||||||||
| Cost of shares redeemed |
(187,663,547 | ) | (462,890,776 | ) | — | (118,518,799 | ) | (155,401,477 | ) | |||||||||||
| Net increase (decrease) in net assets from Fund share transactions |
(104,955,712 | ) | (288,643,134 | ) | 14,000,000 | 100,098,582 | 76,376,236 | |||||||||||||
| Net increase (decrease) in net assets |
(104,807,890 | ) | (263,191,850 | ) | 13,954,920 | 54,877,749 | 114,617,306 | |||||||||||||
| Net assets at the beginning of period |
1,017,417,460 | 1,280,609,310 | — | 503,155,436 | 388,538,130 | |||||||||||||||
| Net assets at the end of period |
$ | 912,609,570 | $ | 1,017,417,460 | $ | 13,954,920 | $ | 558,033,185 | $ | 503,155,436 | ||||||||||
| Undistributed (Over-distribution of) net investment income at the end of period |
$ | 430,778 | $ | 1,352,342 | $ | 15,035 | $ | 896,530 | $ | 505,608 | ||||||||||
| N/A | – Global Total Return Bond does not offer Class B Shares. |
| (1) | – Effective January 18, 2011, Class R Shares and Class Y Shares previously offered by FAF Advisors, Inc. were renamed Class R3 Shares and Class I Shares, respectively. |
See accompanying notes to financial statements.
| 124 | Nuveen Investments |
| Inflation Protected Securities | Intermediate Government Bond |
|||||||||||||||
| Six Months |
Year Ended |
Six Months |
Year Ended |
|||||||||||||
| Operations |
||||||||||||||||
| Net investment income (loss) |
$ | 2,413,294 | $ | 7,901,160 | $ | 1,230,395 | $ | 3,253,134 | ||||||||
| Net realized gain (loss) from: |
||||||||||||||||
| Investments and foreign currency |
3,115,040 | 4,562,822 | 404,905 | 3,114,651 | ||||||||||||
| Forward foreign currency exchange contracts |
(30,640 | ) | (51,127 | ) | — | — | ||||||||||
| Futures contracts |
(221,438 | ) | (213,630 | ) | 519,404 | 76,868 | ||||||||||
| Options purchased |
— | — | — | — | ||||||||||||
| Options written |
— | — | — | — | ||||||||||||
| Swaps |
(582,431 | ) | (205,890 | ) | — | — | ||||||||||
| Change in net unrealized appreciation (depreciation) of: |
||||||||||||||||
| Investments and foreign currency |
15,909,757 | 4,335,598 | 1,038,862 | (1,948,456 | ) | |||||||||||
| Forward foreign currency exchange contracts |
69,753 | — | — | — | ||||||||||||
| Futures contracts |
(61,134 | ) | 210,169 | 100,934 | (68,702 | ) | ||||||||||
| Options purchased |
— | — | — | — | ||||||||||||
| Options written |
— | — | — | — | ||||||||||||
| Swaps |
220,075 | 7,647 | — | — | ||||||||||||
| Net increase (decrease) in net assets from operations |
20,832,276 | 16,546,749 | 3,294,500 | 4,427,495 | ||||||||||||
| Distributions to Shareholders |
||||||||||||||||
| From net investment income: |
||||||||||||||||
| Class A |
(295,655 | ) | (125,517 | ) | (148,438 | ) | (383,252 | ) | ||||||||
| Class B |
N/A | N/A | N/A | N/A | ||||||||||||
| Class C |
(119,057 | ) | (48,340 | ) | (8,417 | ) | (24,042 | ) | ||||||||
| Class R3(1) |
(1,695 | ) | (8,196 | ) | (4,485 | ) | (9,778 | ) | ||||||||
| Class I(1) |
(6,759,943 | ) | (2,852,540 | ) | (1,097,132 | ) | (2,876,058 | ) | ||||||||
| From accumulated net realized gains: |
||||||||||||||||
| Class A |
— | — | — | — | ||||||||||||
| Class B |
N/A | N/A | N/A | N/A | ||||||||||||
| Class C |
— | — | — | — | ||||||||||||
| Class R3(1) |
— | — | — | — | ||||||||||||
| Class I(1) |
— | — | — | — | ||||||||||||
| Decrease in net assets from distributions to shareholders |
(7,176,350 | ) | (3,034,593 | ) | (1,258,472 | ) | (3,293,130 | ) | ||||||||
| Fund Share Transactions |
||||||||||||||||
| Fund reorganization |
— | — | — | — | ||||||||||||
| Proceeds from sale of shares |
80,688,334 | 153,222,275 | 6,829,139 | 33,044,146 | ||||||||||||
| Proceeds from shares issued to shareholders due to reinvestment of distributions |
727,170 | 487,382 | 446,636 | 1,416,540 | ||||||||||||
| 81,415,504 | 153,709,657 | 7,275,775 | 34,460,686 | |||||||||||||
| Cost of shares redeemed |
(55,147,727 | ) | (64,764,465 | ) | (16,223,151 | ) | (94,342,196 | ) | ||||||||
| Net increase (decrease) in net assets from Fund share transactions |
26,267,777 | 88,945,192 | (8,947,376 | ) | (59,881,510 | ) | ||||||||||
| Net increase (decrease) in net assets |
39,923,703 | 102,457,348 | (6,911,348 | ) | (58,747,145 | ) | ||||||||||
| Net assets at the beginning of period |
275,339,061 | 172,881,713 | 114,936,239 | 173,683,384 | ||||||||||||
| Net assets at the end of period |
$ | 315,262,764 | $ | 275,339,061 | $ | 108,024,891 | $ | 114,936,239 | ||||||||
| Undistributed (Over-distribution of) net investment income at the end of period |
$ | 653,845 | $ | 5,416,901 | $ | (28,289 | ) | $ | (212 | ) | ||||||
| N/A | – Inflation Protected Securities and Intermediated Government Bond do not offer Class B Shares. |
| (1) | – Effective January 18, 2011, Class R Shares and Class Y Shares previously offered by FAF Advisors, Inc. were renamed Class R3 Shares and Class I Shares, respectively. |
See accompanying notes to financial statements.
| Nuveen Investments | 125 |
Statement of Changes in Net Assets (Unaudited) (continued)
| Intermediate Term Bond | Short Term Bond | |||||||||||||||
| Six Months |
Year Ended 6/30/11 |
Six Months |
Year Ended 6/30/11 |
|||||||||||||
| Operations |
||||||||||||||||
| Net investment income (loss) |
$ | 10,061,924 | $ | 25,116,673 | $ | 10,248,122 | $ | 20,010,214 | ||||||||
| Net realized gain (loss) from: |
||||||||||||||||
| Investments and foreign currency |
3,709,409 | 21,982,231 | 3,316,781 | 8,061,708 | ||||||||||||
| Forward foreign currency exchange contracts |
— | — | (442,249 | ) | (143,789 | ) | ||||||||||
| Futures contracts |
(604,919 | ) | (971,631 | ) | (6,302,279 | ) | (5,003,707 | ) | ||||||||
| Options purchased |
— | — | — | — | ||||||||||||
| Options written |
— | — | — | — | ||||||||||||
| Swaps |
(477,114 | ) | (1,226,416 | ) | (2,002,014 | ) | 313,057 | |||||||||
| Change in net unrealized appreciation (depreciation) of: |
||||||||||||||||
| Investments and foreign currency |
(1,457,094 | ) | (9,945,282 | ) | (14,585,477 | ) | 390,332 | |||||||||
| Forward foreign currency exchange contracts |
— | — | 132,990 | (92,822 | ) | |||||||||||
| Futures contracts |
(178,927 | ) | (165,227 | ) | 191,389 | 693,795 | ||||||||||
| Options purchased |
— | — | — | — | ||||||||||||
| Options written |
— | — | — | — | ||||||||||||
| Swaps |
(107,011 | ) | 33,658 | (508,439 | ) | 488,181 | ||||||||||
| Net increase (decrease) in net assets from operations |
10,946,268 | 34,824,006 | (9,951,176 | ) | 24,716,969 | |||||||||||
| Distributions to Shareholders |
||||||||||||||||
| From net investment income: |
||||||||||||||||
| Class A |
(345,582 | ) | (786,192 | ) | (1,086,666 | ) | (1,859,321 | ) | ||||||||
| Class B |
N/A | N/A | N/A | N/A | ||||||||||||
| Class C |
(10,298 | ) | (2,096 | ) | (134,940 | ) | (58,239 | ) | ||||||||
| Class R3(1) |
N/A | N/A | (1,398 | ) | N/A | |||||||||||
| Class I(1) |
(10,270,649 | ) | (24,001,414 | ) | (8,754,634 | ) | (16,480,508 | ) | ||||||||
| From accumulated net realized gains: |
||||||||||||||||
| Class A |
— | — | — | — | ||||||||||||
| Class B |
N/A | N/A | N/A | N/A | ||||||||||||
| Class C |
— | — | — | — | ||||||||||||
| Class R3(1) |
N/A | N/A | — | — | ||||||||||||
| Class I(1) |
— | — | — | — | ||||||||||||
| Decrease in net assets from distributions to shareholders |
(10,626,529 | ) | (24,789,702 | ) | (9,977,638 | ) | (18,398,068 | ) | ||||||||
| Fund Share Transactions |
||||||||||||||||
| Fund reorganizations |
— | — | 154,985,307 | — | ||||||||||||
| Proceeds from sale of shares |
86,516,478 | 149,971,859 | 109,276,796 | 524,865,968 | ||||||||||||
| Proceeds from shares issued to shareholders due to reinvestment of distributions |
2,683,778 | 6,310,928 | 2,658,837 | 4,910,267 | ||||||||||||
| 89,200,256 | 156,282,787 | 266,920,940 | 529,776,235 | |||||||||||||
| Cost of shares redeemed |
(110,864,216 | ) | (246,799,023 | ) | (270,852,507 | ) | (427,990,718 | ) | ||||||||
| Net increase (decrease) in net assets from Fund share transactions |
(21,663,960 | ) | (90,516,236 | ) | (3,931,567 | ) | 101,785,517 | |||||||||
| Net increase (decrease) in net assets |
(21,344,221 | ) | (80,481,932 | ) | (23,860,381 | ) | 108,104,418 | |||||||||
| Net assets at the beginning of period |
680,783,094 | 761,265,026 | 827,997,308 | 719,892,890 | ||||||||||||
| Net assets at the end of period |
$ | 659,438,873 | $ | 680,783,094 | $ | 804,136,927 | $ | 827,997,308 | ||||||||
| Undistributed (Over-distribution of) net investment income at the end of period |
$ | (719,854 | ) | $ | (155,249 | ) | $ | 823,159 | $ | 552,675 | ||||||
| N/A | – Intermediate Term Bond does not offer Class B or R3 Shares. Short Term Bond does not offer Class B Shares and did not offer Class R3 Shares prior to September 23, 2011. |
| (1) | – Effective January 18, 2011, Class R Shares and Class Y Shares previously offered by FAF Advisors, Inc. were renamed Class R3 Shares and Class I Shares, respectively. |
See accompanying notes to financial statements.
| 126 | Nuveen Investments |
| Total Return Bond | ||||||||
| Six Months Ended 12/31/11 |
Year Ended 6/30/11 |
|||||||
| Operations |
||||||||
| Net investment income (loss) |
$ | 11,678,441 | $ | 29,514,691 | ||||
| Net realized gain (loss) from: |
||||||||
| Investments and foreign currency |
8,241,702 | 34,568,431 | ||||||
| Forward foreign currency exchange contracts |
(2,232,173 | ) | (70,957 | ) | ||||
| Futures contracts |
(5,524,323 | ) | (7,380,309 | ) | ||||
| Options purchased |
(1,075,687 | ) | — | |||||
| Options written |
(321,084 | ) | (189,057 | ) | ||||
| Swaps |
(1,512,017 | ) | 2,289,011 | |||||
| Change in net unrealized appreciation (depreciation) of: |
||||||||
| Investments and foreign currency |
(6,534,985 | ) | (1,253,606 | ) | ||||
| Forward foreign currency exchange contracts |
466,827 | 13,743 | ||||||
| Futures contracts |
(669,157 | ) | 2,406,651 | |||||
| Options purchased |
(80,275 | ) | — | |||||
| Options written |
(113,961 | ) | 113,961 | |||||
| Swaps |
(195,081 | ) | (715,210 | ) | ||||
| Net increase (decrease) in net assets from operations |
2,128,227 | 59,297,349 | ||||||
| Distributions to Shareholders |
||||||||
| From net investment income: |
||||||||
| Class A |
(671,398 | ) | (1,234,485 | ) | ||||
| Class B |
(23,231 | ) | (43,626 | ) | ||||
| Class C |
(230,303 | ) | (252,970 | ) | ||||
| Class R3(1) |
(20,695 | ) | (36,575 | ) | ||||
| Class I(1) |
(12,412,161 | ) | (27,595,194 | ) | ||||
| From accumulated net realized gains: |
||||||||
| Class A |
— | — | ||||||
| Class B |
— | — | ||||||
| Class C |
— | — | ||||||
| Class R3(1) |
— | — | ||||||
| Class I(1) |
— | — | ||||||
| Decrease in net assets from distributions to shareholders |
(13,357,788 | ) | (29,162,850 | ) | ||||
| Fund Share Transactions |
||||||||
| Fund reorganizations |
79,044,642 | — | ||||||
| Proceeds from sale of shares |
57,705,576 | 141,914,621 | ||||||
| Proceeds from shares issued to shareholders due to reinvestment of distributions |
4,073,198 | 8,495,697 | ||||||
| 140,823,416 | 150,410,318 | |||||||
| Cost of shares redeemed |
(122,281,469 | ) | (222,392,912 | ) | ||||
| Net increase (decrease) in net assets from Fund share transactions |
18,541,947 | (71,982,594 | ) | |||||
| Net increase (decrease) in net assets |
7,312,386 | (41,848,095 | ) | |||||
| Net assets at the beginning of period |
650,380,185 | 692,228,280 | ||||||
| Net assets at the end of period |
$ | 657,692,571 | $ | 650,380,185 | ||||
| Undistributed (Over-distribution of) net investment income at the end of period |
$ | 2,717,716 | $ | 4,397,063 | ||||
| (1) | – Effective January 18, 2011, Class R Shares and Class Y Shares previously offered by FAF Advisors, Inc. were renamed Class R3 Shares and Class I Shares, respectively. |
See accompanying notes to financial statements.
| Nuveen Investments | 127 |
Financial Highlights (Unaudited)
| Selected data for a share outstanding throughout each period: | ||||||||||||||||||||||||||||||||||||
| Class (Commencement Date) | ||||||||||||||||||||||||||||||||||||
| Investment Operations | Less Distributions | |||||||||||||||||||||||||||||||||||
| Core Bond | ||||||||||||||||||||||||||||||||||||
| Year Ended June 30, |
Beginning Net Asset Value |
Net Invest- ment Income (Loss)(a) |
Net Realized/ Unrealized Gain (Loss) |
Total | Net Invest- ment Income |
Capital Gains(b) |
Total | Ending Net Asset Value |
Total Return(c) |
|||||||||||||||||||||||||||
| CLASS A (12/87) |
|
|||||||||||||||||||||||||||||||||||
| 2012(e) |
$ | 11.44 | $ | .20 | $ | .02 | $ | .22 | $ | (.21 | ) | $ | — | $ | (.21 | ) | $ | 11.45 | 1.94 | % | ||||||||||||||||
| 2011 |
11.22 | .43 | .21 | .64 | (.42 | ) | — | (.42 | ) | 11.44 | 5.73 | |||||||||||||||||||||||||
| 2010 |
10.04 | .51 | 1.18 | 1.69 | (.51 | ) | — | (.51 | ) | 11.22 | 17.11 | |||||||||||||||||||||||||
| 2009 |
10.86 | .61 | (.81 | ) | (.20 | ) | (.62 | ) | — | (.62 | ) | 10.04 | (1.37 | ) | ||||||||||||||||||||||
| 2008 |
10.79 | .51 | .05 | .56 | (.49 | ) | — | (.49 | ) | 10.86 | 5.24 | |||||||||||||||||||||||||
| 2007 |
10.71 | .47 | .09 | .56 | (.48 | ) | — | (.48 | ) | 10.79 | 5.26 | |||||||||||||||||||||||||
| CLASS B (8/94) |
|
|||||||||||||||||||||||||||||||||||
| 2012(e) |
11.34 | .16 | .01 | .17 | (.17 | ) | — | (.17 | ) | 11.34 | 1.46 | |||||||||||||||||||||||||
| 2011 |
11.12 | .34 | .21 | .55 | (.33 | ) | — | (.33 | ) | 11.34 | 4.97 | |||||||||||||||||||||||||
| 2010 |
9.95 | .43 | 1.17 | 1.60 | (.43 | ) | — | (.43 | ) | 11.12 | 16.31 | |||||||||||||||||||||||||
| 2009 |
10.77 | .54 | (.81 | ) | (.27 | ) | (.55 | ) | — | (.55 | ) | 9.95 | (2.12 | ) | ||||||||||||||||||||||
| 2008 |
10.70 | .42 | .06 | .48 | (.41 | ) | — | (.41 | ) | 10.77 | 4.50 | |||||||||||||||||||||||||
| 2007 |
10.63 | .38 | .09 | .47 | (.40 | ) | — | (.40 | ) | 10.70 | 4.41 | |||||||||||||||||||||||||
| CLASS C (2/99) |
|
|||||||||||||||||||||||||||||||||||
| 2012(e) |
11.40 | .16 | .01 | .17 | (.17 | ) | — | (.17 | ) | 11.40 | 1.48 | |||||||||||||||||||||||||
| 2011 |
11.18 | .34 | .21 | .55 | (.33 | ) | — | (.33 | ) | 11.40 | 4.97 | |||||||||||||||||||||||||
| 2010 |
10.00 | .42 | 1.19 | 1.61 | (.43 | ) | — | (.43 | ) | 11.18 | 16.32 | |||||||||||||||||||||||||
| 2009 |
10.83 | .54 | (.82 | ) | (.28 | ) | (.55 | ) | — | (.55 | ) | 10.00 | (2.21 | ) | ||||||||||||||||||||||
| 2008 |
10.75 | .43 | .06 | .49 | (.41 | ) | — | (.41 | ) | 10.83 | 4.57 | |||||||||||||||||||||||||
| 2007 |
10.67 | .38 | .10 | .48 | (.40 | ) | — | (.40 | ) | 10.75 | 4.48 | |||||||||||||||||||||||||
| CLASS R3 (9/01)(f) |
|
|||||||||||||||||||||||||||||||||||
| 2012(e) |
11.50 | .19 | .01 | .20 | (.20 | ) | — | (.20 | ) | 11.50 | 1.73 | |||||||||||||||||||||||||
| 2011 |
11.27 | .40 | .22 | .62 | (.39 | ) | — | (.39 | ) | 11.50 | 5.54 | |||||||||||||||||||||||||
| 2010 |
10.09 | .48 | 1.19 | 1.67 | (.49 | ) | — | (.49 | ) | 11.27 | 16.74 | |||||||||||||||||||||||||
| 2009 |
10.89 | .59 | (.79 | ) | (.20 | ) | (.60 | ) | — | (.60 | ) | 10.09 | (1.43 | ) | ||||||||||||||||||||||
| 2008 |
10.81 | .49 | .05 | .54 | (.46 | ) | — | (.46 | ) | 10.89 | 5.06 | |||||||||||||||||||||||||
| 2007 |
10.73 | .44 | .09 | .53 | (.45 | ) | — | (.45 | ) | 10.81 | 4.99 | |||||||||||||||||||||||||
| CLASS I (2/94)(f) |
|
|||||||||||||||||||||||||||||||||||
| 2012(e) |
11.44 | .21 | .02 | .23 | (.23 | ) | — | (.23 | ) | 11.44 | 1.98 | |||||||||||||||||||||||||
| 2011 |
11.21 | .46 | .22 | .68 | (.45 | ) | — | (.45 | ) | 11.44 | 6.09 | |||||||||||||||||||||||||
| 2010 |
10.03 | .54 | 1.18 | 1.72 | (.54 | ) | — | (.54 | ) | 11.21 | 17.42 | |||||||||||||||||||||||||
| 2009 |
10.86 | .64 | (.82 | ) | (.18 | ) | (.65 | ) | — | (.65 | ) | 10.03 | (1.22 | ) | ||||||||||||||||||||||
| 2008 |
10.78 | .54 | .06 | .60 | (.52 | ) | — | (.52 | ) | 10.86 | 5.60 | |||||||||||||||||||||||||
| 2007 |
10.70 | .49 | .10 | .59 | (.51 | ) | — | (.51 | ) | 10.78 | 5.53 | |||||||||||||||||||||||||
| 128 | Nuveen Investments |
| Ratios/Supplemental Data | ||||||||||||||||||||||
| Ratios to Average Net Assets Before Reimbursement |
Ratios to Average Net Assets After Reimbursement(d) |
|||||||||||||||||||||
| Ending Net Assets (000) |
Expenses | Net Invest- ment Income (Loss) |
Expenses | Net Invest- ment Income (Loss) |
Portfolio Turnover Rate(g) |
|||||||||||||||||
| $ | 87,763 | .97 | %* | 3.46 | %* | .95 | %* | 3.47 | %* | 54 | % | |||||||||||
| 85,980 | .99 | 3.72 | .94 | 3.77 | 91 | |||||||||||||||||
| 93,374 | 1.02 | 4.58 | .95 | 4.65 | 83 | |||||||||||||||||
| 82,373 | 1.02 | 6.27 | .95 | 6.34 | 160 | |||||||||||||||||
| 94,571 | 1.01 | 4.57 | .95 | 4.63 | 131 | |||||||||||||||||
| 102,723 | 1.01 | 4.19 | .95 | 4.25 | 137 | |||||||||||||||||
| 1,425 | 1.72 | * | 2.71 | * | 1.70 | * | 2.72 | * | 54 | |||||||||||||
| 1,805 | 1.74 | 2.97 | 1.69 | 3.02 | 91 | |||||||||||||||||
| 3,607 | 1.77 | 3.90 | 1.70 | 3.97 | 83 | |||||||||||||||||
| 5,780 | 1.77 | 5.52 | 1.70 | 5.59 | 160 | |||||||||||||||||
| 7,733 | 1.76 | 3.81 | 1.70 | 3.87 | 131 | |||||||||||||||||
| 9,634 | 1.76 | 3.44 | 1.70 | 3.50 | 137 | |||||||||||||||||
| 4,081 | 1.72 | * | 2.72 | * | 1.70 | * | 2.73 | * | 54 | |||||||||||||
| 3,711 | 1.74 | 2.97 | 1.69 | 3.02 | 91 | |||||||||||||||||
| 3,796 | 1.77 | 3.84 | 1.70 | 3.91 | 83 | |||||||||||||||||
| 3,693 | 1.77 | 5.52 | 1.70 | 5.59 | 160 | |||||||||||||||||
| 4,383 | 1.76 | 3.83 | 1.70 | 3.89 | 131 | |||||||||||||||||
| 4,567 | 1.76 | 3.44 | 1.70 | 3.50 | 137 | |||||||||||||||||
| 373 | 1.21 | * | 3.16 | * | 1.20 | * | 3.16 | * | 54 | |||||||||||||
| 380 | 1.23 | 3.47 | 1.19 | 3.52 | 91 | |||||||||||||||||
| 379 | 1.27 | 4.35 | 1.20 | 4.42 | 83 | |||||||||||||||||
| 406 | 1.27 | 6.04 | 1.20 | 6.11 | 160 | |||||||||||||||||
| 289 | 1.26 | 4.36 | 1.20 | 4.42 | 131 | |||||||||||||||||
| 65 | 1.29 | 3.92 | 1.20 | 4.01 | 137 | |||||||||||||||||
| 823,967 | .71 | * | 3.70 | * | .70 | * | 3.72 | * | 54 | |||||||||||||
| 925,541 | .74 | 3.97 | .69 | 4.02 | 91 | |||||||||||||||||
| 1,179,453 | .77 | 4.86 | .70 | 4.93 | 83 | |||||||||||||||||
| 1,279,489 | .77 | 6.50 | .70 | 6.57 | 160 | |||||||||||||||||
| 1,468,599 | .76 | 4.82 | .70 | 4.88 | 131 | |||||||||||||||||
| 1,530,750 | .76 | 4.44 | .70 | 4.50 | 137 | |||||||||||||||||
| (a) | Per share Net Investment Income (Loss) is calculated using the average daily shares method. |
| (b) | Distributions from Capital Gains include short-term capital gains, if any. |
| (c) | Total return is the combination of changes in net asset value without any sales charge, reinvested dividend income at net asset value and reinvested capital gains distributions at net asset value, if any. Total returns are not annualized. |
| (d) | After expense reimbursement from the Adviser, where applicable. Ratios do not reflect the effect of custodian fee credits earned on the Fund’s net cash on deposit with the custodian bank, where applicable. |
| (e) | For the six months ended December 31, 2011. |
| (f) | Effective January 18, 2011, Class R Shares and Class Y Shares previously offered by FAF Advisors, Inc. were renamed Class R3 Shares and Class I Shares, respectively. |
| (g) | Excluding dollar roll transactions, where applicable. |
| * | Annualized. |
See accompanying notes to financial statements.
| Nuveen Investments | 129 |
Financial Highlights (Unaudited) (continued)
| Selected data for a share outstanding throughout each period: | ||||||||||||||||||||||||||||||||||||
| Class (Commencement Date) | ||||||||||||||||||||||||||||||||||||
| Investment Operations | Less Distributions | |||||||||||||||||||||||||||||||||||
| Global Total Return Bond | ||||||||||||||||||||||||||||||||||||
| Year Ended June 30, |
Beginning Net Asset Value |
Net Invest- ment Income (Loss)(a) |
Net Realized/ Unrealized Gain (Loss) |
Total | Net Invest- ment Income |
Capital Gains(b) |
Total | Ending Net Asset Value |
Total Return(c) |
|||||||||||||||||||||||||||
| CLASS A (12/11) |
|
|||||||||||||||||||||||||||||||||||
| 2012(e) |
$ | 20.00 | $ | .02 | $ | (.09 | ) | $ | (.07 | ) | $ | — | $ | — | $ | — | $ | 19.93 | (.35 | ) | ||||||||||||||||
| CLASS C (12/11) |
|
|||||||||||||||||||||||||||||||||||
| 2012(e) |
20.00 | .01 | (.09 | ) | (.08 | ) | — | — | — | 19.92 | (.40 | ) | ||||||||||||||||||||||||
| CLASS R3 (12/11) |
|
|||||||||||||||||||||||||||||||||||
| 2012(e) |
20.00 | .01 | (.08 | ) | (.07 | ) | — | — | — | 19.93 | (.40 | ) | ||||||||||||||||||||||||
| CLASS I (12/11) |
|
|||||||||||||||||||||||||||||||||||
| 2012(e) |
20.00 | .02 | (.08 | ) | (.06 | ) | — | — | — | 19.94 | (.35 | ) | ||||||||||||||||||||||||
| 130 | Nuveen Investments |
| Ratios/Supplemental Data | ||||||||||||||||||||||
| Ratios to Average Net Assets Before Reimbursement |
Ratios to Average Net Assets After Reimbursement(d) |
|||||||||||||||||||||
| Ending Net Assets (000) |
Expenses | Net Invest- ment Income (Loss) |
Expenses | Net Invest- ment Income (Loss) |
Portfolio Turnover Rate |
|||||||||||||||||
| $ | 50 | 1.33 | %* | .71 | %* | .96 | %* | 1.08 | %* | 13 | % | |||||||||||
| 50 | 2.09 | * | (.05 | )* | 1.71 | * | .32 | * | 13 | |||||||||||||
| 50 | 1.58 | * | .46 | * | 1.21 | * | .84 | * | 13 | |||||||||||||
| 13,805 | 1.10 | * | .94 | * | .71 | * | 1.33 | * | 13 | |||||||||||||
| (a) | Per share Net Investment Income (Loss) is calculated using the average daily shares method. |
| (b) | Distributions from Capital Gains include short-term capital gains, if any. |
| (c) | Total return is the combination of changes in net asset value without any sales charge, reinvested dividend income at net asset value and reinvested capital gains distributions at net asset value, if any. Total returns are not annualized. |
| (d) | After expense reimbursement from the Adviser, where applicable. Ratios do not reflect the effect of custodian fee credits earned on the Fund’s net cash on deposit with the custodian bank, where applicable. |
| (e) | For the period December 2, 2011 (commencement of operations) through December 31, 2011. |
| * | Annualized. |
See accompanying notes to financial statements.
| Nuveen Investments | 131 |
Financial Highlights (Unaudited) (continued)
| Selected data for a share outstanding throughout each period: | ||||||||||||||||||||||||||||||||||||
| Class (Commencement Date) | ||||||||||||||||||||||||||||||||||||
| Investment Operations | Less Distributions | |||||||||||||||||||||||||||||||||||
| High Income Bond | ||||||||||||||||||||||||||||||||||||
| Year Ended June 30, |
Beginning Net Asset Value |
Net Invest- ment Income (Loss)(a) |
Net Realized/ Unrealized Gain (Loss) |
Total | Net Invest- ment Income |
Capital Gains(b) |
Total | Ending Net Asset Value |
Total Return(c) |
|||||||||||||||||||||||||||
| CLASS A (8/01) |
|
|||||||||||||||||||||||||||||||||||
| 2012(e) |
$ | 9.05 | $ | .35 | $ | (.69 | ) | $ | (.34 | ) | $ | (.33 | ) | $ | (.03 | ) | $ | (.36 | ) | $ | 8.35 | (3.71 | )% | |||||||||||||
| 2011 |
8.28 | .67 | .76 | 1.43 | (.66 | ) | — | (.66 | ) | 9.05 | 17.61 | |||||||||||||||||||||||||
| 2010 |
7.15 | .67 | 1.12 | 1.79 | (.66 | ) | — | (.66 | ) | 8.28 | 25.47 | |||||||||||||||||||||||||
| 2009 |
8.65 | .73 | (1.47 | ) | (.74 | ) | (.76 | ) | — | (.76 | ) | 7.15 | (7.26 | ) | ||||||||||||||||||||||
| 2008 |
9.61 | .71 | (.97 | ) | (.26 | ) | (.70 | ) | — | (.70 | ) | 8.65 | (2.84 | ) | ||||||||||||||||||||||
| 2007 |
9.22 | .65 | .38 | 1.03 | (.64 | ) | — | (.64 | ) | 9.61 | 11.46 | |||||||||||||||||||||||||
| CLASS B (8/01) |
|
|||||||||||||||||||||||||||||||||||
| 2012(e) |
8.98 | .31 | (.66 | ) | (.35 | ) | (.30 | ) | (.03 | ) | (.33 | ) | 8.30 | (3.92 | ) | |||||||||||||||||||||
| 2011 |
8.23 | .60 | .74 | 1.34 | (.59 | ) | — | (.59 | ) | 8.98 | 16.59 | |||||||||||||||||||||||||
| 2010 |
7.11 | .60 | 1.12 | 1.72 | (.60 | ) | — | (.60 | ) | 8.23 | 24.56 | |||||||||||||||||||||||||
| 2009 |
8.61 | .68 | (1.47 | ) | (.79 | ) | (.71 | ) | — | (.71 | ) | 7.11 | (7.99 | ) | ||||||||||||||||||||||
| 2008 |
9.57 | .63 | (.96 | ) | (.33 | ) | (.63 | ) | — | (.63 | ) | 8.61 | (3.57 | ) | ||||||||||||||||||||||
| 2007 |
9.18 | .57 | .39 | .96 | (.57 | ) | — | (.57 | ) | 9.57 | 10.67 | |||||||||||||||||||||||||
| CLASS C (8/01) |
|
|||||||||||||||||||||||||||||||||||
| 2012(e) |
9.01 | .32 | (.67 | ) | (.35 | ) | (.30 | ) | (.03 | ) | (.33 | ) | 8.33 | (3.91 | ) | |||||||||||||||||||||
| 2011 |
8.25 | .60 | .75 | 1.35 | (.59 | ) | — | (.59 | ) | 9.01 | 16.67 | |||||||||||||||||||||||||
| 2010 |
7.12 | .60 | 1.13 | 1.73 | (.60 | ) | — | (.60 | ) | 8.25 | 24.67 | |||||||||||||||||||||||||
| 2009 |
8.62 | .68 | (1.47 | ) | (.79 | ) | (.71 | ) | — | (.71 | ) | 7.12 | (7.98 | ) | ||||||||||||||||||||||
| 2008 |
9.58 | .63 | (.96 | ) | (.33 | ) | (.63 | ) | — | (.63 | ) | 8.62 | (3.57 | ) | ||||||||||||||||||||||
| 2007 |
9.19 | .57 | .39 | .96 | (.57 | ) | — | (.57 | ) | 9.58 | 10.66 | |||||||||||||||||||||||||
| CLASS R3 (9/01)(f) |
|
|||||||||||||||||||||||||||||||||||
| 2012(e) |
9.23 | .34 | (.68 | ) | (.34 | ) | (.33 | ) | (.03 | ) | (.36 | ) | 8.53 | (3.70 | ) | |||||||||||||||||||||
| 2011 |
8.44 | .66 | .77 | 1.43 | (.64 | ) | — | (.64 | ) | 9.23 | 17.28 | |||||||||||||||||||||||||
| 2010 |
7.28 | .66 | 1.14 | 1.80 | (.64 | ) | — | (.64 | ) | 8.44 | 25.12 | |||||||||||||||||||||||||
| 2009 |
8.79 | .73 | (1.49 | ) | (.76 | ) | (.75 | ) | — | (.75 | ) | 7.28 | (7.49 | ) | ||||||||||||||||||||||
| 2008 |
9.75 | .69 | (.98 | ) | (.29 | ) | (.67 | ) | — | (.67 | ) | 8.79 | (3.04 | ) | ||||||||||||||||||||||
| 2007 |
9.35 | .62 | .40 | 1.02 | (.62 | ) | — | (.62 | ) | 9.75 | 11.12 | |||||||||||||||||||||||||
| CLASS I (8/01)(f) |
|
|||||||||||||||||||||||||||||||||||
| 2012(e) |
9.05 | .35 | (.66 | ) | (.31 | ) | (.35 | ) | (.03 | ) | (.38 | ) | 8.36 | (3.47 | ) | |||||||||||||||||||||
| 2011 |
8.29 | .69 | .75 | 1.44 | (.68 | ) | — | (.68 | ) | 9.05 | 17.77 | |||||||||||||||||||||||||
| 2010 |
7.16 | .69 | 1.12 | 1.81 | (.68 | ) | — | (.68 | ) | 8.29 | 25.75 | |||||||||||||||||||||||||
| 2009 |
8.66 | .75 | (1.47 | ) | (.72 | ) | (.78 | ) | — | (.78 | ) | 7.16 | (7.01 | ) | ||||||||||||||||||||||
| 2008 |
9.62 | .73 | (.97 | ) | (.24 | ) | (.72 | ) | — | (.72 | ) | 8.66 | (2.59 | ) | ||||||||||||||||||||||
| 2007 |
9.23 | .67 | .39 | 1.06 | (.67 | ) | — | (.67 | ) | 9.62 | 11.73 | |||||||||||||||||||||||||
| 132 | Nuveen Investments |
| Ratios/Supplemental Data | ||||||||||||||||||||||
| Ratios to Average Net Assets Before Reimbursement |
Ratios to Average Net Assets After Reimbursement(d) |
|||||||||||||||||||||
| Ending Net Assets (000) |
Expenses | Net Invest- ment Income (Loss) |
Expenses | Net Invest- ment Income (Loss) |
Portfolio Turnover Rate |
|||||||||||||||||
| $ | 88,977 | 1.14 | %* | 8.13 | %* | 1.10 | %* | 8.17 | %* | 30 | % | |||||||||||
| 30,984 | 1.22 | 7.38 | 1.10 | 7.50 | 130 | |||||||||||||||||
| 29,532 | 1.29 | 7.93 | 1.10 | 8.12 | 132 | |||||||||||||||||
| 25,696 | 1.36 | 10.53 | 1.10 | 10.79 | 108 | |||||||||||||||||
| 24,420 | 1.31 | 7.53 | 1.10 | 7.74 | 100 | |||||||||||||||||
| 28,932 | 1.30 | 6.54 | 1.10 | 6.74 | 101 | |||||||||||||||||
| 2,294 | 1.92 | * | 7.36 | * | 1.87 | * | 7.41 | * | 30 | |||||||||||||
| 1,285 | 1.98 | 6.64 | 1.85 | 6.76 | 130 | |||||||||||||||||
| 1,628 | 2.04 | 7.28 | 1.85 | 7.47 | 132 | |||||||||||||||||
| 2,157 | 2.11 | 9.66 | 1.85 | 9.92 | 108 | |||||||||||||||||
| 3,496 | 2.06 | 6.76 | 1.85 | 6.97 | 100 | |||||||||||||||||
| 4,814 | 2.05 | 5.80 | 1.85 | 6.00 | 101 | |||||||||||||||||
| 43,475 | 1.91 | * | 7.58 | * | 1.89 | * | 7.60 | * | 30 | |||||||||||||
| 9,792 | 1.97 | 6.64 | 1.85 | 6.76 | 130 | |||||||||||||||||
| 6,969 | 2.04 | 7.22 | 1.85 | 7.41 | 132 | |||||||||||||||||
| 5,038 | 2.11 | 9.72 | 1.85 | 9.98 | 108 | |||||||||||||||||
| 6,490 | 2.06 | 6.76 | 1.85 | 6.97 | 100 | |||||||||||||||||
| 8,522 | 2.05 | 5.78 | 1.85 | 5.98 | 101 | |||||||||||||||||
| 428 | 1.41 | * | 7.72 | * | 1.35 | * | 7.77 | * | 30 | |||||||||||||
| 309 | 1.47 | 7.12 | 1.35 | 7.25 | 130 | |||||||||||||||||
| 343 | 1.54 | 7.73 | 1.35 | 7.92 | 132 | |||||||||||||||||
| 265 | 1.61 | 10.46 | 1.35 | 10.72 | 108 | |||||||||||||||||
| 185 | 1.56 | 7.16 | 1.35 | 7.37 | 100 | |||||||||||||||||
| 186 | 1.56 | 6.17 | 1.35 | 6.38 | 101 | |||||||||||||||||
| 422,860 | .92 | * | 8.17 | * | .85 | * | 8.24 | * | 30 | |||||||||||||
| 460,785 | .97 | 7.63 | .85 | 7.75 | 130 | |||||||||||||||||
| 350,066 | 1.04 | 8.19 | .85 | 8.38 | 132 | |||||||||||||||||
| 182,051 | 1.11 | 10.67 | .85 | 10.93 | 108 | |||||||||||||||||
| 204,164 | 1.06 | 7.78 | .85 | 7.99 | 100 | |||||||||||||||||
| 232,998 | 1.05 | 6.78 | .85 | 6.98 | 101 | |||||||||||||||||
| (a) | Per share Net Investment Income (Loss) is calculated using the average daily shares method. |
| (b) | Distributions from Capital Gains include short-term capital gains, if any. |
| (c) | Total return is the combination of changes in net asset value without any sales charge, reinvested dividend income at net asset value and reinvested capital gains distributions at net asset value, if any. Total returns are not annualized. |
| (d) | After expense reimbursement from the Adviser, where applicable. Ratios do not reflect the effect of custodian fee credits earned on the Fund’s net cash on deposit with the custodian bank, where applicable. |
| (e) | For the six months ended December 31, 2011. |
| (f) | Effective January 18, 2011, Class R Shares and Class Y Shares previously offered by FAF Advisors, Inc. were renamed Class R3 Shares and Class I Shares, respectively. |
| * | Annualized. |
See accompanying notes to financial statements.
| Nuveen Investments | 133 |
Financial Highlights (Unaudited) (continued)
| Selected data for a share outstanding throughout each period: | ||||||||||||||||||||||||||||||||||||||||
| Class (Commencement Date) | ||||||||||||||||||||||||||||||||||||||||
| Investment Operations | Less Distributions | |||||||||||||||||||||||||||||||||||||||
| Inflation Protected Securities | ||||||||||||||||||||||||||||||||||||||||
| Year Ended June 30, |
Beginning Net Asset Value |
Net Invest- ment Income (Loss)(a) |
Net Realized/ Unrealized Gain (Loss) |
Total | Net Invest- ment Income |
Capital Gains(b) |
Return of Capital |
Total | Ending Net Asset Value |
Total Return(c) |
||||||||||||||||||||||||||||||
| CLASS A (10/04) |
|
|||||||||||||||||||||||||||||||||||||||
| 2012(e) |
$ | 10.94 | $ | .08 | $ | .71 | $ | .79 | $ | (.25 | ) | $ | — | $ | — | $ | (.25 | ) | $ | 11.48 | 7.23 | % | ||||||||||||||||||
| 2011 |
10.33 | .35 | .40 | .75 | (.14 | ) | — | — | (.14 | ) | 10.94 | 7.30 | ||||||||||||||||||||||||||||
| 2010 |
9.59 | .28 | .73 | 1.01 | (.27 | ) | — | — | (.27 | ) | 10.33 | 10.62 | ||||||||||||||||||||||||||||
| 2009 |
10.20 | .14 | (.37 | ) | (.23 | ) | (.26 | ) | — | (.12 | ) | (.38 | ) | 9.59 | (2.18 | ) | ||||||||||||||||||||||||
| 2008 |
9.43 | .54 | .76 | 1.30 | (.53 | ) | — | — | (.53 | ) | 10.20 | 14.01 | ||||||||||||||||||||||||||||
| 2007 |
9.54 | .39 | (.16 | ) | .23 | (.34 | ) | — | — | (.34 | ) | 9.43 | 2.41 | |||||||||||||||||||||||||||
| CLASS C (10/04) |
|
|||||||||||||||||||||||||||||||||||||||
| 2012(e) |
10.84 | .04 | .70 | .74 | (.18 | ) | — | — | (.18 | ) | 11.40 | 6.82 | ||||||||||||||||||||||||||||
| 2011 |
10.24 | .26 | .41 | .67 | (.07 | ) | — | — | (.07 | ) | 10.84 | 6.59 | ||||||||||||||||||||||||||||
| 2010 |
9.53 | .18 | .75 | .93 | (.22 | ) | — | — | (.22 | ) | 10.24 | 9.76 | ||||||||||||||||||||||||||||
| 2009 |
10.18 | .11 | (.43 | ) | (.32 | ) | (.21 | ) | — | (.12 | ) | (.33 | ) | 9.53 | (3.03 | ) | ||||||||||||||||||||||||
| 2008 |
9.41 | .48 | .75 | 1.23 | (.46 | ) | — | — | (.46 | ) | 10.18 | 13.20 | ||||||||||||||||||||||||||||
| 2007 |
9.53 | .33 | (.18 | ) | .15 | (.27 | ) | — | — | (.27 | ) | 9.41 | 1.53 | |||||||||||||||||||||||||||
| CLASS R3 (10/04)(f) |
|
|||||||||||||||||||||||||||||||||||||||
| 2012(e) |
10.84 | .05 | .72 | .77 | (.18 | ) | — | — | (.18 | ) | 11.43 | 7.10 | ||||||||||||||||||||||||||||
| 2011 |
10.31 | .11 | .54 | .65 | (.12 | ) | — | — | (.12 | ) | 10.84 | 6.31 | ||||||||||||||||||||||||||||
| 2010 |
9.58 | .26 | .72 | .98 | (.25 | ) | — | — | (.25 | ) | 10.31 | 10.32 | ||||||||||||||||||||||||||||
| 2009 |
10.20 | .13 | (.39 | ) | (.26 | ) | (.24 | ) | — | (.12 | ) | (.36 | ) | 9.58 | (2.43 | ) | ||||||||||||||||||||||||
| 2008 |
9.43 | .52 | .75 | 1.27 | (.50 | ) | — | — | (.50 | ) | 10.20 | 13.73 | ||||||||||||||||||||||||||||
| 2007 |
9.55 | .33 | (.13 | ) | .20 | (.32 | ) | — | — | (.32 | ) | 9.43 | 2.09 | |||||||||||||||||||||||||||
| CLASS I (10/04)(f) |
|
|||||||||||||||||||||||||||||||||||||||
| 2012(e) |
10.96 | .09 | .70 | .79 | (.26 | ) | — | — | (.26 | ) | 11.49 | 7.26 | ||||||||||||||||||||||||||||
| 2011 |
10.34 | .40 | .38 | .78 | (.16 | ) | — | — | (.16 | ) | 10.96 | 7.62 | ||||||||||||||||||||||||||||
| 2010 |
9.59 | .33 | .71 | 1.04 | (.29 | ) | — | — | (.29 | ) | 10.34 | 10.92 | ||||||||||||||||||||||||||||
| 2009 |
10.20 | .23 | (.45 | ) | (.22 | ) | (.27 | ) | — | (.12 | ) | (.39 | ) | 9.59 | (2.03 | ) | ||||||||||||||||||||||||
| 2008 |
9.43 | .56 | .76 | 1.32 | (.55 | ) | — | — | (.55 | ) | 10.20 | 14.29 | ||||||||||||||||||||||||||||
| 2007 |
9.55 | .40 | (.16 | ) | .24 | (.36 | ) | — | — | (.36 | ) | 9.43 | 2.56 | |||||||||||||||||||||||||||
| 134 | Nuveen Investments |
| Ratios/Supplemental Data | ||||||||||||||||||||||
| Ratios to Average Net Assets Before Reimbursement |
Ratios to Average Net Assets After Reimbursement(d) |
|||||||||||||||||||||
| Ending Net Assets (000) |
Expenses | Net Invest- ment Income (Loss) |
Expenses | Net Invest- ment Income (Loss) |
Portfolio Turnover Rate |
|||||||||||||||||
| $ | 13,785 | 1.01 | %* | 1.18 | %* | .84 | %* | 1.35 | %* | 19 | % | |||||||||||
| 12,080 | 1.09 | 3.05 | .85 | 3.30 | 45 | |||||||||||||||||
| 7,894 | 1.15 | 2.46 | .84 | 2.77 | 72 | |||||||||||||||||
| 5,439 | 1.10 | 1.27 | .85 | 1.52 | 24 | |||||||||||||||||
| 3,294 | 1.08 | 5.17 | .85 | 5.40 | 71 | |||||||||||||||||
| 2,712 | 1.06 | 3.88 | .85 | 4.09 | 90 | |||||||||||||||||
| 7,950 | 1.76 | * | .49 | * | 1.59 | * | .66 | * | 19 | |||||||||||||
| 8,043 | 1.84 | 2.19 | 1.60 | 2.44 | 45 | |||||||||||||||||
| 6,673 | 1.91 | 1.47 | 1.60 | 1.78 | 72 | |||||||||||||||||
| 1,406 | 1.84 | .94 | 1.59 | 1.19 | 24 | |||||||||||||||||
| 365 | 1.83 | 4.59 | 1.60 | 4.82 | 71 | |||||||||||||||||
| 348 | 1.81 | 3.23 | 1.60 | 3.44 | 90 | |||||||||||||||||
| 118 | 1.25 | * | .70 | * | 1.09 | * | .86 | * | 19 | |||||||||||||
| 33 | 1.38 | .78 | 1.10 | 1.05 | 45 | |||||||||||||||||
| 1,332 | 1.40 | 2.33 | 1.09 | 2.64 | 72 | |||||||||||||||||
| 1,262 | 1.35 | 1.09 | 1.10 | 1.34 | 24 | |||||||||||||||||
| 1,175 | 1.33 | 4.98 | 1.10 | 5.21 | 71 | |||||||||||||||||
| 822 | 1.31 | 3.24 | 1.10 | 3.45 | 90 | |||||||||||||||||
| 293,409 | .76 | * | 1.41 | * | .59 | * | 1.58 | * | 19 | |||||||||||||
| 255,183 | .84 | 3.49 | .60 | 3.74 | 45 | |||||||||||||||||
| 156,983 | .90 | 2.96 | .59 | 3.27 | 72 | |||||||||||||||||
| 167,501 | .85 | 2.23 | .60 | 2.48 | 24 | |||||||||||||||||
| 278,749 | .83 | 5.41 | .60 | 5.64 | 71 | |||||||||||||||||
| 273,312 | .81 | 4.00 | .60 | 4.21 | 90 | |||||||||||||||||
| (a) | Per share Net Investment Income (Loss) is calculated using the average daily shares method. |
| (b) | Distributions from Capital Gains include short-term capital gains, if any. |
| (c) | Total return is the combination of changes in net asset value without any sales charge, reinvested dividend income at net asset value and reinvested capital gains distributions at net asset value, if any. Total returns are not annualized. |
| (d) | After expense reimbursement from the Adviser, where applicable. Ratios do not reflect the effect of custodian fee credits earned on the Fund’s net cash on deposit with the custodian bank, where applicable. |
| (e) | For the six months ended December 31, 2011. |
| (f) | Effective January 18, 2011, Class R Shares and Class Y Shares previously offered by FAF Advisors, Inc. were renamed Class R3 Shares and Class I Shares, respectively. |
| * | Annualized. |
See accompanying notes to financial statements.
| Nuveen Investments | 135 |
Financial Highlights (Unaudited) (continued)
| Selected data for a share outstanding throughout each period: | ||||||||||||||||||||||||||||||||||||||||
| Class (Commencement Date) | ||||||||||||||||||||||||||||||||||||||||
| Investment Operations | Less Distributions | |||||||||||||||||||||||||||||||||||||||
| Intermediate Government Bond | ||||||||||||||||||||||||||||||||||||||||
| Year Ended June 30, |
Beginning Net Asset Value |
Net Invest- ment Income (Loss)(a) |
Net Realized/ Unrealized Gain (Loss) |
Total | Net Invest- ment Income |
Capital Gains(b) |
Return of Capital |
Total | Ending Net Asset Value |
Total Return(c) |
||||||||||||||||||||||||||||||
| CLASS A (10/02) |
|
|||||||||||||||||||||||||||||||||||||||
| 2012(e) |
$ | 8.84 | $ | .09 | $ | .17 | $ | .26 | $ | (.10 | ) | $ | — | $ | — | $ | (.10 | ) | $ | 9.00 | 2.90 | % | ||||||||||||||||||
| 2011 |
8.77 | .20 | .07 | .27 | (.20 | ) | — | — | (.20 | ) | 8.84 | 3.10 | ||||||||||||||||||||||||||||
| 2010 |
8.67 | .20 | .27 | .47 | (.20 | ) | (.17 | ) | — | * | (.37 | ) | 8.77 | 5.50 | ||||||||||||||||||||||||||
| 2009 |
8.42 | .19 | .25 | .44 | (.19 | ) | — | — | (.19 | ) | 8.67 | 5.30 | ||||||||||||||||||||||||||||
| 2008 |
8.00 | .28 | .43 | .71 | (.29 | ) | — | — | (.29 | ) | 8.42 | 8.90 | ||||||||||||||||||||||||||||
| 2007 |
7.99 | .31 | .06 | .37 | (.33 | ) | — | (.03 | ) | (.36 | ) | 8.00 | 4.68 | |||||||||||||||||||||||||||
| CLASS C (10/09) |
|
|||||||||||||||||||||||||||||||||||||||
| 2012(e) |
8.85 | .05 | .17 | .22 | (.06 | ) | — | — | (.06 | ) | 9.01 | 2.46 | ||||||||||||||||||||||||||||
| 2011 |
8.77 | .12 | .08 | .20 | (.12 | ) | — | — | (.12 | ) | 8.85 | 2.32 | ||||||||||||||||||||||||||||
| 2010(f) |
8.76 | .09 | .17 | .26 | (.08 | ) | (.17 | ) | — | * | (.25 | ) | 8.77 | 3.00 | ||||||||||||||||||||||||||
| CLASS R3 (10/09)(g) |
|
|||||||||||||||||||||||||||||||||||||||
| 2012(e) |
8.84 | .08 | .15 | .23 | (.08 | ) | — | — | (.08 | ) | 8.99 | 2.62 | ||||||||||||||||||||||||||||
| 2011 |
8.77 | .16 | .08 | .24 | (.17 | ) | — | — | (.17 | ) | 8.84 | 2.75 | ||||||||||||||||||||||||||||
| 2010(f) |
8.76 | .09 | .20 | .29 | (.11 | ) | (.17 | ) | — | * | (.28 | ) | 8.77 | 3.34 | ||||||||||||||||||||||||||
| CLASS I (10/02)(g) |
|
|||||||||||||||||||||||||||||||||||||||
| 2012(e) |
8.84 | .10 | .16 | .26 | (.10 | ) | — | — | (.10 | ) | 9.00 | 2.97 | ||||||||||||||||||||||||||||
| 2011 |
8.77 | .21 | .07 | .28 | (.21 | ) | — | — | (.21 | ) | 8.84 | 3.25 | ||||||||||||||||||||||||||||
| 2010 |
8.67 | .21 | .27 | .48 | (.21 | ) | (.17 | ) | — | * | (.38 | ) | 8.77 | 5.66 | ||||||||||||||||||||||||||
| 2009 |
8.42 | .21 | .25 | .46 | (.21 | ) | — | — | (.21 | ) | 8.67 | 5.46 | ||||||||||||||||||||||||||||
| 2008 |
8.00 | .30 | .42 | .72 | (.30 | ) | — | — | (.30 | ) | 8.42 | 9.07 | ||||||||||||||||||||||||||||
| 2007 |
7.99 | .32 | .06 | .38 | (.34 | ) | — | (.03 | ) | (.37 | ) | 8.00 | 4.84 | |||||||||||||||||||||||||||
| 136 | Nuveen Investments |
| Ratios/Supplemental Data | ||||||||||||||||||||||
| Ratios to Average Net Assets Before Reimbursement |
Ratios to Average Net Assets After Reimbursement(d) |
|||||||||||||||||||||
| Ending Net Assets (000) |
Expenses | Net Invest- ment Income (Loss) |
Expenses | Net Invest- ment Income (Loss) |
Portfolio Turnover Rate |
|||||||||||||||||
| $ | 13,714 | 1.00 | %** | 1.82 | %** | .75 | %** | 2.07 | %** | 40 | % | |||||||||||
| 14,086 | 1.10 | 1.85 | .73 | 2.22 | 58 | |||||||||||||||||
| 19,003 | 1.19 | 1.89 | .75 | 2.33 | 105 | |||||||||||||||||
| 10,496 | 1.15 | 1.82 | .75 | 2.22 | 133 | |||||||||||||||||
| 6,504 | 1.33 | 2.74 | .75 | 3.32 | 118 | |||||||||||||||||
| 1,619 | 1.46 | 3.09 | .75 | 3.80 | 84 | |||||||||||||||||
| 1,263 | 1.85 | ** | .97 | ** | 1.60 | ** | 1.22 | ** | 40 | |||||||||||||
| 1,417 | 1.89 | 1.05 | 1.58 | 1.37 | 58 | |||||||||||||||||
| 1,940 | 1.94 | ** | 1.16 | ** | 1.60 | ** | 1.50 | ** | 105 | |||||||||||||
| 532 | 1.35 | ** | 1.47 | ** | 1.10 | ** | 1.72 | ** | 40 | |||||||||||||
| 473 | 1.39 | 1.56 | 1.08 | 1.87 | 58 | |||||||||||||||||
| 652 | 1.44 | ** | 1.44 | ** | 1.10 | ** | 1.78 | ** | 105 | |||||||||||||
| 92,516 | .85 | ** | 1.97 | ** | .60 | ** | 2.22 | ** | 40 | |||||||||||||
| 98,960 | .89 | 2.05 | .58 | 2.36 | 58 | |||||||||||||||||
| 152,088 | .94 | 2.05 | .60 | 2.39 | 105 | |||||||||||||||||
| 101,253 | .90 | 2.11 | .60 | 2.41 | 133 | |||||||||||||||||
| 63,784 | 1.08 | 3.12 | .60 | 3.60 | 118 | |||||||||||||||||
| 37,705 | 1.21 | 3.33 | .60 | 3.94 | 84 | |||||||||||||||||
| (a) | Per share Net Investment Income (Loss) is calculated using the average daily shares method. |
| (b) | Distributions from Capital Gains include short-term capital gains, if any. |
| (c) | Total return is the combination of changes in net asset value without any sales charge, reinvested dividend income at net asset value and reinvested capital gains distributions at net asset value, if any. Total returns are not annualized. |
| (d) | After expense reimbursement from the Adviser, where applicable. Ratios do not reflect the effect of custodian fee credits earned on the Fund’s net cash on deposit with the custodian bank, where applicable. |
| (e) | For the six months ended December 31, 2011. |
| (f) | For the period October 28, 2009 (commencement of operations) through June 30, 2010. |
| (g) | Effective January 18, 2011, Class R Shares and Class Y Shares previously offered by FAF Advisors, Inc. were renamed Class R3 Shares and Class I Shares, respectively. |
| * | Rounds to less than $.01 per share. |
| ** | Annualized. |
See accompanying notes to financial statements.
| Nuveen Investments | 137 |
Financial Highlights (Unaudited) (continued)
| Selected data for a share outstanding throughout each period: | ||||||||||||||||||||||||||||||||||||
| Class (Commencement Date) | ||||||||||||||||||||||||||||||||||||
| Investment Operations | Less Distributions | |||||||||||||||||||||||||||||||||||
| Intermediate Term Bond | ||||||||||||||||||||||||||||||||||||
| Year Ended June 30, |
Beginning Net Asset Value |
Net Invest- ment Income (Loss)(a) |
Net Realized/ Unrealized Gain (Loss) |
Total | Net Invest- ment Income |
Capital Gains(b) |
Total | Ending Net Asset Value |
Total Return(c) |
|||||||||||||||||||||||||||
| CLASS A (1/95) |
|
|||||||||||||||||||||||||||||||||||
| 2012(e) |
$ | 10.47 | $ | .15 | $ | .02 | $ | .17 | $ | (.17 | ) | $ | — | $ | (.17 | ) | $ | 10.47 | 1.49 | % | ||||||||||||||||
| 2011 |
10.33 | .33 | .14 | .47 | (.33 | ) | — | (.33 | ) | 10.47 | 4.70 | |||||||||||||||||||||||||
| 2010 |
9.47 | .42 | .86 | 1.28 | (.42 | ) | — | (.42 | ) | 10.33 | 13.64 | |||||||||||||||||||||||||
| 2009 |
9.90 | .48 | (.40 | ) | .08 | (.51 | ) | — | (.51 | ) | 9.47 | 1.21 | ||||||||||||||||||||||||
| 2008 |
9.73 | .44 | .14 | .58 | (.41 | ) | — | (.41 | ) | 9.90 | 6.02 | |||||||||||||||||||||||||
| 2007 |
9.68 | .41 | .05 | .46 | (.41 | ) | — | (.41 | ) | 9.73 | 4.80 | |||||||||||||||||||||||||
| CLASS C (1/11) |
|
|||||||||||||||||||||||||||||||||||
| 2012(e) |
10.44 | .11 | — | .11 | (.12 | ) | — | (.12 | ) | 10.43 | 1.06 | |||||||||||||||||||||||||
| 2011(f) |
10.37 | .12 | .06 | .18 | (.11 | ) | — | (.11 | ) | 10.44 | 1.76 | |||||||||||||||||||||||||
| CLASS I (1/93)(g) |
|
|||||||||||||||||||||||||||||||||||
| 2012(e) |
10.43 | .16 | .01 | .17 | (.17 | ) | — | (.17 | ) | 10.43 | 1.65 | |||||||||||||||||||||||||
| 2011 |
10.29 | .35 | .14 | .49 | (.35 | ) | — | (.35 | ) | 10.43 | 4.76 | |||||||||||||||||||||||||
| 2010 |
9.43 | .43 | .86 | 1.29 | (.43 | ) | — | (.43 | ) | 10.29 | 13.87 | |||||||||||||||||||||||||
| 2009 |
9.87 | .49 | (.40 | ) | .09 | (.53 | ) | — | (.53 | ) | 9.43 | 1.26 | ||||||||||||||||||||||||
| 2008 |
9.70 | .45 | .15 | .60 | (.43 | ) | — | (.43 | ) | 9.87 | 6.20 | |||||||||||||||||||||||||
| 2007 |
9.65 | .42 | .06 | .48 | (.43 | ) | — | (.43 | ) | 9.70 | 4.98 | |||||||||||||||||||||||||
| 138 | Nuveen Investments |
| Ratios/Supplemental Data | ||||||||||||||||||||||
| Ratios to Average Net Assets Before Reimbursement |
Ratios to Average Net Assets After Reimbursement(d) |
|||||||||||||||||||||
| Ending Net Assets (000) |
Expenses | Net ment |
Expenses | Net Invest- ment Income (Loss) |
Portfolio Turnover Rate |
|||||||||||||||||
| $ | 21,177 | .86 | %* | 2.93 | %* | .85 | %* | 2.94 | %* | 19 | % | |||||||||||
| 22,502 | .94 | 3.10 | .85 | 3.20 | 58 | |||||||||||||||||
| 26,341 | 1.01 | 3.96 | .85 | 4.12 | 58 | |||||||||||||||||
| 23,905 | 1.01 | 5.09 | .85 | 5.25 | 41 | |||||||||||||||||
| 28,364 | 1.01 | 4.22 | .85 | 4.38 | 102 | |||||||||||||||||
| 30,655 | 1.01 | 3.91 | .85 | 4.07 | 110 | |||||||||||||||||
| 875 | 1.71 | * | 2.06 | * | 1.70 | * | 2.07 | * | 19 | |||||||||||||
| 1,152 | 1.79 | * | 2.46 | * | 1.70 | * | 2.56 | * | 58 | |||||||||||||
| 637,387 | .71 | * | 3.07 | * | .70 | * | 3.08 | * | 19 | |||||||||||||
| 657,129 | .74 | 3.30 | .70 | 3.35 | 58 | |||||||||||||||||
| 734,924 | .76 | 4.22 | .70 | 4.28 | 58 | |||||||||||||||||
| 724,531 | .76 | 5.33 | .70 | 5.39 | 41 | |||||||||||||||||
| 766,932 | .76 | 4.47 | .70 | 4.53 | 102 | |||||||||||||||||
| 752,984 | .76 | 4.16 | .70 | 4.22 | 110 | |||||||||||||||||
| (a) | Per share Net Investment Income (Loss) is calculated using the average daily shares method. |
| (b) | Distributions from Capital Gains include short-term capital gains, if any. |
| (c) | Total return is the combination of changes in net asset value without any sales charge, reinvested dividend income at net asset value and reinvested capital gains distributions at net asset value, if any. Total returns are not annualized. |
| (d) | After expense reimbursement from the Adviser, where applicable. Ratios do not reflect the effect of custodian fee credits earned on the Fund’s net cash on deposit with the custodian bank, where applicable. |
| (e) | For the six months ended December 31, 2011. |
| (f) | For the period January 18, 2011 (commencement of operations) through June 30, 2011. |
| (g) | Effective January 18, 2011, Class Y Shares previously offered by FAF Advisors, Inc. were renamed Class I Shares. |
| * | Annualized. |
See accompanying notes to financial statements.
| Nuveen Investments | 139 |
Financial Highlights (Unaudited) (continued)
| Selected data for a share outstanding throughout each period: | ||||||||||||||||||||||||||||||||||||
| Class (Commencement Date) | ||||||||||||||||||||||||||||||||||||
| Investment Operations | Less Distributions | |||||||||||||||||||||||||||||||||||
| Short Term Bond | ||||||||||||||||||||||||||||||||||||
| Year Ended June 30, |
Beginning Net Asset Value |
Net Invest- ment Income (Loss)(a) |
Net Realized/ Unrealized Gain (Loss) |
Total | Net Invest- ment Income |
Capital Gains(b) |
Total | Ending Net Asset Value |
Total Return(c) |
|||||||||||||||||||||||||||
| CLASS A (12/92) |
|
|||||||||||||||||||||||||||||||||||
| 2012(e) |
$ | 10.06 | $ | .12 | $ | (.23 | ) | $ | (.11 | ) | $ | (.12 | ) | $ | — | $ | (.12 | ) | $ | 9.83 | (1.02 | )% | ||||||||||||||
| 2011 |
9.98 | .24 | .06 | .30 | (.22 | ) | — | (.22 | ) | 10.06 | 3.00 | |||||||||||||||||||||||||
| 2010 |
9.66 | .31 | .34 | .65 | (.33 | ) | — | (.33 | ) | 9.98 | 6.77 | |||||||||||||||||||||||||
| 2009 |
9.89 | .46 | (.26 | ) | .20 | (.43 | ) | — | (.43 | ) | 9.66 | 2.22 | ||||||||||||||||||||||||
| 2008 |
9.90 | .45 | (.03 | ) | .42 | (.43 | ) | — | (.43 | ) | 9.89 | 4.30 | ||||||||||||||||||||||||
| 2007 |
9.83 | .36 | .09 | .45 | (.38 | ) | — | (.38 | ) | 9.90 | 4.60 | |||||||||||||||||||||||||
| CLASS C (10/09) |
|
|||||||||||||||||||||||||||||||||||
| 2012(e) |
10.09 | .09 | (.24 | ) | (.15 | ) | (.08 | ) | — | (.08 | ) | 9.86 | (1.53 | ) | ||||||||||||||||||||||
| 2011 |
10.00 | .15 | .07 | .22 | (.13 | ) | — | (.13 | ) | 10.09 | 2.22 | |||||||||||||||||||||||||
| 2010(f) |
9.95 | .13 | .06 | .19 | (.14 | ) | — | (.14 | ) | 10.00 | 1.90 | |||||||||||||||||||||||||
| CLASS R3 (9/11) |
|
|||||||||||||||||||||||||||||||||||
| 2012(h) |
9.85 | .06 | (.01 | ) | .05 | (.06 | ) | — | (.06 | ) | 9.84 | .49 | ||||||||||||||||||||||||
| CLASS I (2/94)(g) |
|
|||||||||||||||||||||||||||||||||||
| 2012(e) |
10.07 | .13 | (.23 | ) | (.10 | ) | (.13 | ) | — | (.13 | ) | 9.84 | (1.03 | ) | ||||||||||||||||||||||
| 2011 |
9.99 | .25 | .06 | .31 | (.23 | ) | — | (.23 | ) | 10.07 | 3.16 | |||||||||||||||||||||||||
| 2010 |
9.67 | .32 | .34 | .66 | (.34 | ) | — | (.34 | ) | 9.99 | 6.92 | |||||||||||||||||||||||||
| 2009 |
9.89 | .48 | (.25 | ) | .23 | (.45 | ) | — | (.45 | ) | 9.67 | 2.48 | ||||||||||||||||||||||||
| 2008 |
9.91 | .46 | (.03 | ) | .43 | (.45 | ) | — | (.45 | ) | 9.89 | 4.35 | ||||||||||||||||||||||||
| 2007 |
9.83 | .37 | .10 | .47 | (.39 | ) | — | (.39 | ) | 9.91 | 4.86 | |||||||||||||||||||||||||
| 140 | Nuveen Investments |
| Ratios/Supplemental Data | ||||||||||||||||||||||
| Ratios to Average Net Assets Before Reimbursement |
Ratios to Average Net Assets After Reimbursement(d) |
|||||||||||||||||||||
| Ending Net Assets (000) |
Expenses | Net Invest- ment Income (Loss) |
Expenses | Net Invest- ment Income (Loss) |
Portfolio Turnover Rate |
|||||||||||||||||
| $ | 128,487 | .74 | %* | 2.48 | %* | .72 | %* | 2.49 | %* | 16 | % | |||||||||||
| 80,927 | .87 | 2.22 | .73 | 2.37 | 58 | |||||||||||||||||
| 87,631 | 1.04 | 2.88 | .75 | 3.17 | 44 | |||||||||||||||||
| 65,704 | 1.06 | 4.55 | .74 | 4.87 | 54 | |||||||||||||||||
| 59,933 | 1.05 | 4.17 | .74 | 4.48 | 55 | |||||||||||||||||
| 66,722 | 1.04 | 3.32 | .75 | 3.61 | 47 | |||||||||||||||||
| 47,965 | 1.64 | * | 1.74 | * | 1.63 | * | 1.75 | * | 16 | |||||||||||||
| 5,101 | 1.66 | 1.45 | 1.58 | 1.53 | 58 | |||||||||||||||||
| 3,111 | 1.79 | * | 1.76 | * | 1.60 | * | 1.95 | * | 44 | |||||||||||||
| 478 | 1.14 | * | 2.31 | * | 1.10 | * | 2.34 | * | 16 | |||||||||||||
| 627,206 | .58 | * | 2.59 | * | .57 | * | 2.61 | * | 16 | |||||||||||||
| 741,969 | .67 | 2.43 | .58 | 2.52 | 58 | |||||||||||||||||
| 629,151 | .79 | 3.07 | .60 | 3.26 | 44 | |||||||||||||||||
| 315,024 | .81 | 4.80 | .59 | 5.02 | 54 | |||||||||||||||||
| 257,403 | .80 | 4.41 | .59 | 4.62 | 55 | |||||||||||||||||
| 311,131 | .79 | 3.55 | .60 | 3.74 | 47 | |||||||||||||||||
| (a) | Per share Net Investment Income (Loss) is calculated using the average daily shares method. |
| (b) | Distributions from Capital Gains include short-term capital gains, if any. |
| (c) | Total return is the combination of changes in net asset value without any sales charge, reinvested dividend income at net asset value and reinvested capital gains distributions at net asset value, if any. Total returns are not annualized. |
| (d) | After expense reimbursement from the Adviser, where applicable. Ratios do not reflect the effect of custodian fee credits earned on the Fund’s net cash on deposit with the custodian bank, where applicable. |
| (e) | For the six months ended December 31, 2011. |
| (f) | For the period October 28, 2009 (commencement of operations) through June 30, 2010. |
| (g) | Effective January 18, 2011, Class Y Shares previously offered by FAF Advisors, Inc. were renamed Class I Shares. |
| (h) | For the period September 23, 2011 (commencement of operations) through December 31, 2011. |
| * | Annualized. |
See accompanying notes to financial statements.
| Nuveen Investments | 141 |
Financial Highlights (Unaudited) (continued)
| Selected data for a share outstanding throughout each period: | ||||||||||||||||||||||||||||||||||||
| Class (Commencement Date) | ||||||||||||||||||||||||||||||||||||
| Investment Operations | Less Distributions | |||||||||||||||||||||||||||||||||||
| Total Return Bond | ||||||||||||||||||||||||||||||||||||
| Year Ended June 30, |
Beginning Net Asset Value |
Net Invest- ment Income (Loss)(a) |
Net Realized/ Unrealized Gain (Loss) |
Total | Net Invest- ment Income |
Capital Gains(b) |
Total | Ending Net Asset Value |
Total Return(c) |
|||||||||||||||||||||||||||
| CLASS A (2/00) |
|
|||||||||||||||||||||||||||||||||||
| 2012(e) |
$ | 10.72 | $ | .19 | $ | (.18 | ) | $ | .01 | $ | (.21 | ) | $ | — | $ | (.21 | ) | $ | 10.52 | .10 | % | |||||||||||||||
| 2011 |
10.27 | .43 | .45 | .88 | (.43 | ) | — | (.43 | ) | 10.72 | 8.69 | |||||||||||||||||||||||||
| 2010 |
9.01 | .52 | 1.28 | 1.80 | (.54 | ) | — | (.54 | ) | 10.27 | 20.21 | |||||||||||||||||||||||||
| 2009 |
9.90 | .64 | (.74 | ) | (.10 | ) | (.63 | ) | (.16 | ) | (.79 | ) | 9.01 | .16 | ||||||||||||||||||||||
| 2008 |
9.83 | .49 | .05 | .54 | (.47 | ) | — | (.47 | ) | 9.90 | 5.51 | |||||||||||||||||||||||||
| 2007 |
9.86 | .45 | (.02 | ) | .43 | (.46 | ) | — | (.46 | ) | 9.83 | 4.36 | ||||||||||||||||||||||||
| CLASS B (2/00) |
|
|||||||||||||||||||||||||||||||||||
| 2012(e) |
10.67 | .15 | (.19 | ) | (.04 | ) | (.17 | ) | — | (.17 | ) | 10.46 | (.41 | ) | ||||||||||||||||||||||
| 2011 |
10.22 | .35 | .44 | .79 | (.34 | ) | — | (.34 | ) | 10.67 | 7.84 | |||||||||||||||||||||||||
| 2010 |
8.97 | .45 | 1.26 | 1.71 | (.46 | ) | — | (.46 | ) | 10.22 | 19.22 | |||||||||||||||||||||||||
| 2009 |
9.86 | .58 | (.74 | ) | (.16 | ) | (.57 | ) | (.16 | ) | (.73 | ) | 8.97 | (.58 | ) | |||||||||||||||||||||
| 2008 |
9.80 | .41 | .05 | .46 | (.40 | ) | — | (.40 | ) | 9.86 | 4.65 | |||||||||||||||||||||||||
| 2007 |
9.82 | .38 | (.02 | ) | .36 | (.38 | ) | — | (.38 | ) | 9.80 | 3.69 | ||||||||||||||||||||||||
| CLASS C (2/00) |
|
|||||||||||||||||||||||||||||||||||
| 2012(e) |
10.65 | .15 | (.18 | ) | (.03 | ) | (.17 | ) | — | (.17 | ) | 10.45 | (.32 | ) | ||||||||||||||||||||||
| 2011 |
10.20 | .35 | .44 | .79 | (.34 | ) | — | (.34 | ) | 10.65 | 7.85 | |||||||||||||||||||||||||
| 2010 |
8.96 | .43 | 1.27 | 1.70 | (.46 | ) | — | (.46 | ) | 10.20 | 19.13 | |||||||||||||||||||||||||
| 2009 |
9.84 | .58 | (.73 | ) | (.15 | ) | (.57 | ) | (.16 | ) | (.73 | ) | 8.96 | (.48 | ) | |||||||||||||||||||||
| 2008 |
9.78 | .42 | .04 | .46 | (.40 | ) | — | (.40 | ) | 9.84 | 4.66 | |||||||||||||||||||||||||
| 2007 |
9.80 | .37 | (.01 | ) | .36 | (.38 | ) | — | (.38 | ) | 9.78 | 3.70 | ||||||||||||||||||||||||
| CLASS R3 (9/01)(f) |
|
|||||||||||||||||||||||||||||||||||
| 2012(e) |
10.77 | .17 | (.18 | ) | (.01 | ) | (.20 | ) | — | (.20 | ) | 10.56 | (.13 | ) | ||||||||||||||||||||||
| 2011 |
10.31 | .41 | .45 | .86 | (.40 | ) | — | (.40 | ) | 10.77 | 8.40 | |||||||||||||||||||||||||
| 2010 |
9.07 | .42 | 1.32 | 1.74 | (.50 | ) | — | (.50 | ) | 10.31 | 19.47 | |||||||||||||||||||||||||
| 2009 |
9.95 | .62 | (.73 | ) | (.11 | ) | (.61 | ) | (.16 | ) | (.77 | ) | 9.07 | .02 | ||||||||||||||||||||||
| 2008 |
9.88 | .47 | .05 | .52 | (.45 | ) | — | (.45 | ) | 9.95 | 5.22 | |||||||||||||||||||||||||
| 2007 |
9.90 | .43 | (.02 | ) | .41 | (.43 | ) | — | (.43 | ) | 9.88 | 4.20 | ||||||||||||||||||||||||
| CLASS I (2/00)(f) |
|
|||||||||||||||||||||||||||||||||||
| 2012(e) |
10.71 | .19 | (.17 | ) | .02 | (.22 | ) | — | (.22 | ) | 10.51 | .10 | ||||||||||||||||||||||||
| 2011 |
10.26 | .46 | .44 | .90 | (.45 | ) | — | (.45 | ) | 10.71 | 8.99 | |||||||||||||||||||||||||
| 2010 |
9.01 | .55 | 1.25 | 1.80 | (.55 | ) | — | (.55 | ) | 10.26 | 20.31 | |||||||||||||||||||||||||
| 2009 |
9.89 | .66 | (.73 | ) | (.07 | ) | (.65 | ) | (.16 | ) | (.81 | ) | 9.01 | .52 | ||||||||||||||||||||||
| 2008 |
9.83 | .52 | .04 | .56 | (.50 | ) | — | (.50 | ) | 9.89 | 5.67 | |||||||||||||||||||||||||
| 2007 |
9.85 | .47 | (.01 | ) | .46 | (.48 | ) | — | (.48 | ) | 9.83 | 4.73 | ||||||||||||||||||||||||
| 142 | Nuveen Investments |
| Ratios/Supplemental Data | ||||||||||||||||||||||
| Ratios to Average Net Assets Before Reimbursement |
Ratios to Average Net Assets After Reimbursement(d) |
|||||||||||||||||||||
| Ending Net Assets (000) |
Expenses | Net Invest- ment Income (Loss) |
Expenses | Net Invest- ment Income (Loss) |
Portfolio Turnover Rate(g) |
|||||||||||||||||
| $ | 53,678 | .96 | %* | 3.45 | %* | .87 | %* | 3.55 | %* | 132 | % | |||||||||||
| 25,045 | 1.05 | 3.93 | .88 | 4.10 | 98 | |||||||||||||||||
| 28,165 | 1.13 | 4.98 | .92 | 5.19 | 96 | |||||||||||||||||
| 13,948 | 1.13 | 7.45 | 1.00 | 7.58 | 147 | |||||||||||||||||
| 15,567 | 1.11 | 4.75 | .99 | 4.87 | 124 | |||||||||||||||||
| 13,198 | 1.13 | 4.35 | 1.00 | 4.48 | 180 | |||||||||||||||||
| 2,387 | 1.72 | * | 2.72 | * | 1.68 | * | 2.77 | * | 132 | |||||||||||||
| 1,116 | 1.80 | 3.22 | 1.73 | 3.29 | 98 | |||||||||||||||||
| 1,413 | 1.87 | 4.35 | 1.74 | 4.48 | 96 | |||||||||||||||||
| 1,719 | 1.88 | 6.71 | 1.75 | 6.84 | 147 | |||||||||||||||||
| 2,384 | 1.86 | 4.01 | 1.74 | 4.13 | 124 | |||||||||||||||||
| 2,272 | 1.88 | 3.61 | 1.75 | 3.74 | 180 | |||||||||||||||||
| 29,545 | 1.72 | * | 2.79 | * | 1.68 | * | 2.83 | * | 132 | |||||||||||||
| 8,092 | 1.80 | 3.22 | 1.73 | 3.29 | 98 | |||||||||||||||||
| 6,748 | 1.88 | 4.21 | 1.75 | 4.34 | 96 | |||||||||||||||||
| 2,778 | 1.88 | 6.64 | 1.75 | 6.77 | 147 | |||||||||||||||||
| 3,673 | 1.86 | 4.10 | 1.74 | 4.22 | 124 | |||||||||||||||||
| 1,792 | 1.88 | 3.60 | 1.75 | 3.73 | 180 | |||||||||||||||||
| 1,239 | 1.22 | * | 3.08 | * | 1.18 | * | 3.12 | * | 132 | |||||||||||||
| 1,020 | 1.29 | 3.73 | 1.23 | 3.79 | 98 | |||||||||||||||||
| 601 | 1.37 | 4.06 | 1.24 | 4.19 | 96 | |||||||||||||||||
| 681 | 1.38 | 7.26 | 1.25 | 7.39 | 147 | |||||||||||||||||
| 293 | 1.36 | 4.54 | 1.24 | 4.66 | 124 | |||||||||||||||||
| 219 | 1.44 | 4.03 | 1.25 | 4.22 | 180 | |||||||||||||||||
| 570,844 | .73 | * | 3.57 | * | .68 | * | 3.62 | * | 132 | |||||||||||||
| 615,107 | .80 | 4.22 | .73 | 4.29 | 98 | |||||||||||||||||
| 655,301 | .87 | 5.31 | .74 | 5.44 | 96 | |||||||||||||||||
| 633,108 | .88 | 7.64 | .75 | 7.77 | 147 | |||||||||||||||||
| 1,069,211 | .86 | 5.03 | .74 | 5.15 | 124 | |||||||||||||||||
| 851,513 | .88 | 4.58 | .75 | 4.71 | 180 | |||||||||||||||||
| (a) | Per share Net Investment Income (Loss) is calculated using the average daily shares method. |
| (b) | Distributions from Capital Gains include short-term capital gains, if any. |
| (c) | Total return is the combination of changes in net asset value without any sales charge, reinvested dividend income at net asset value and reinvested capital gains distributions at net asset value, if any. Total returns are not annualized. |
| (d) | After expense reimbursement from the Adviser, where applicable. Ratios do not reflect the effect of custodian fee credits earned on the Fund’s net cash on deposit with the custodian bank, where applicable. |
| (e) | For the six months ended December 31, 2011. |
| (f) | Effective January 18, 2011, Class R Shares and Class Y Shares previously offered by FAF Advisors, Inc. were renamed Class R3 Shares and Class I Shares, respectively. |
| (g) | Excluding dollar roll transactions, where applicable. |
| * | Annualized. |
See accompanying notes to financial statements.
| Nuveen Investments | 143 |
Notes to Financial Statements (Unaudited)
1. General Information and Significant Accounting Policies
General Information
Nuveen Investment Funds, Inc. (the “Trust”), is an open-end investment company registered under the Investment Company Act of 1940, as amended. The Trust is comprised of the Nuveen Core Bond Fund (“Core Bond”), Nuveen Global Total Return Bond Fund (“Global Total Return Bond”), Nuveen High Income Bond Fund (“High Income Bond”), Nuveen Inflation Protected Securities Fund (“Inflation Protected Securities”), Nuveen Intermediate Government Bond Fund (“Intermediate Government Bond”), Nuveen Intermediate Term Bond Fund (“Intermediate Term Bond”), Nuveen Short Term Bond Fund (“Short Term Bond”) and Nuveen Total Return Bond Fund (“Total Return Bond”), (each a “Fund” and collectively, the “Funds”), among others. The Trust was incorporated in the State of Maryland on August 20, 1987.
Core Bond’s investment objective is to provide high current income consistent with limited risk to capital. Under normal market conditions, the Fund invests primarily (at least 80% of its net assets, plus the amount of any borrowings for investment purposes) in bonds such as U.S. government securities (securities issued or guaranteed by the U.S. government or its agencies or instrumentalities), including zero coupon securities, residential and commercial mortgage-backed securities, asset-backed securities and corporate debt obligations, including obligations issued by special-purpose entities that are backed by corporate debt obligations. Up to 10% of the Fund’s total assets may be invested collectively in bonds rated lower than investment grade or unrated securities of comparable quality as determined by Nuveen Asset Management, LLC (the “Sub-Adviser”), a wholly-owned subsidiary of Nuveen Fund Advisors, Inc. (the “Adviser”), a wholly-owned subsidiary of Nuveen Investments, Inc. (“Nuveen”), (securities commonly referred to as “high yield” or “junk bonds”), non-dollar denominated debt obligations of foreign corporations and governments and debt obligations issued by governmental and corporate issuers that are located in emerging market countries. The Fund may invest up to 25% of its total assets in U.S. dollar denominated debt obligations of foreign corporations and governments that are not located in emerging market countries. To generate additional income, the Fund may invest up to 25% of its total assets in dollar roll transactions.
Global Total Return Bond’s investment objective is to seek total return. Under normal market conditions, the Fund invests at least 80% of its net assets, plus the amount of any borrowings for investment purposes in bonds from issuers located around the world. The bonds in which the Fund may invest may be of any maturity and include debt obligations of foreign governments, domestic and foreign corporate debt obligations, including obligations issued by special-purpose entities that are backed by corporate debt obligations; U.S. government securities (securities issued or guaranteed by the U.S. government or its agencies or instrumentalities), residential and commercial mortgage-backed securities, and asset-backed securities. Under normal market conditions, the Fund invests at least 40% of its net assets in non-U.S. issuers and is invested in issuers located in at least three countries (including the U.S.). The Fund may invest in debt obligations issued by governmental and corporate issuers located in emerging markets countries. The Fund may invest in securities that are U.S. dollar-denominated and in securities that are denominated in foreign currencies. The Fund invests primarily in securities rated investment grade at the time of purchase or in unrated securities of comparable quality as determined by the Sub-adviser. Up to 30% of the Fund’s net assets may be invested in securities rated lower than investment grade or in unrated securities of comparable quality as determined by the Sub-Adviser (securities commonly referred to as “high yield” or “junk bonds”).
High Income Bond’s investment objective is to provide a high level of current income. Under normal market conditions, the Fund invests primarily (at least 80% of its net assets, plus the amount of any borrowings for investment purposes) in bonds rated lower than investment grade at the time of purchase or in unrated securities of comparable quality (securities commonly referred to as “high-yield” securities of “junk bonds”). The Fund may invest in exchange-traded funds, closed-end funds, and other investment companies (“investment companies”). The Fund may invest up to 25% of its total assets in dollar denominated debt obligations of foreign corporations and governments. Up to 20% of the Fund’s total assets may be invested in dollar denominated debt obligations issued by governmental and corporate issuers that are located in emerging market countries.
Inflation Protected Securities, investment objective is to provide total return while providing protection against inflation. Under normal market conditions, the Fund invests primarily (at least 80% of its net assets, plus the amount of any borrowings for investment purposes) in inflation protected debt securities. These securities will be issued by the U.S. and non-U.S. governments, their agencies and instrumentalities, and domestic and foreign corporations. Up to 20% of the Fund’s assets may be invested in holdings that are not inflation protected. These holdings may include domestic and foreign corporate debt obligations, securities issued or guaranteed by the U.S. government or its agencies and instrumentalities, debt obligations of foreign governments, residential and commercial mortgage-backed securities and asset-backed securities. Up to 10% of the Fund’s net assets may be invested in securities that are rated lower than investment grade at the time of purchase or that are unrated and of comparable quality (securities commonly referred to as “high-yield” securities or “junk bonds”). The Fund may invest up to 20% of its net assets in non-dollar denominated securities, and may invest without limitation in U.S. dollar denominated securities of foreign corporations and governments.
Intermediate Government Bond’s investment objective is to provide current income to the extent consistent with the preservation of capital. Under normal market conditions, the Fund invests primarily (at least 80% of its net assets, plus the amount of any borrowings for investment purposes) in U.S. government securities. The Fund may invest up to 20% of its total assets, collectively, in non-U.S. government debt obligations, including asset-backed securities, residential and commercial mortgage-backed securities, corporate debt obligations, and municipal securities. To generate additional income, the Fund may invest up to 10% of its total assets in dollar roll transactions.
| 144 | Nuveen Investments |
Intermediate Term Bond’s investment objective is to provide current income to the extent consistent with preservation of capital. Under normal market conditions, the Fund invests primarily (at least 80% of its net assets, plus the amount of any borrowings for investment purposes) in bonds, such as U.S. government securities (securities issued or guaranteed by the U.S. government or its agencies or instrumentalities), including zero coupon securities, residential and commercial mortgage-backed securities, asset-backed securities, and corporate debt obligations, including obligations issued by special-purpose entities that are backed by corporate debt obligations. The Fund may invest up to 25% of its total assets in U.S. dollar denominated debt obligations of foreign corporations and governments. To generate additional income, the Fund may invest up to 25% of its total assets in dollar roll transactions.
Short Term Bond’s investment objective is to provide current income while maintaining a high degree of principal stability. Under normal market conditions, the Fund invests primarily (at least 80% of its net assets, plus the amount of any borrowings for investment purposes) in bonds, such as residential and commercial mortgage-backed securities, asset-backed securities, corporate debt obligations, including obligations issued by special-purpose entities that are backed by corporate debt obligations, U.S. government securities, which are securities issued or guaranteed by the U.S. government or its agencies or instrumentalities and municipal securities. Up to 20% of the Fund’s total assets may be invested in securities that are rated lower than investment grade or unrated securities of comparable quality as determined by the Sub-Adviser (securities commonly referred to as “high yield” or “junk bonds”). The Fund may invest up to 35% of its total assets in debt obligations of foreign corporations and foreign governments. However, no more than 10% of the Fund’s total assets may be invested in debt obligations of corporations and governments that are located in emerging market countries.
Total Return Bond’s investment objective is to provide a high level of current income consistent with prudent risk to capital. While the Fund may realize some capital appreciation, the Fund primarily seeks to achieve total return through preserving capital and generating income. Under normal market conditions, the Fund invests primarily (at least 80% of its net assets, plus the amount of any borrowings for investment purposes) in bonds such as U.S. government securities (securities issued or guaranteed by the U.S. government or its agencies or instrumentalities), residential and commercial mortgage-backed securities, asset-backed securities, domestic and foreign corporate debt obligations, including obligations issued by special-purpose entities that are backed by corporate debt obligations, and debt obligations of foreign governments. Up to 30% of the Fund’s total assets may be invested collectively in debt securities, provided that the Fund will not invest more than 20% of its total assets in any single category such as securities rated lower than investment grade or unrated securities of comparable quality as determined by the Sub-Adviser (securities commonly referred to as “high yield” or “junk bonds”), non-dollar denominated debt obligations of foreign corporations and governments and debt obligations issued by governmental and corporate issuers that are located in emerging market countries. To generate additional income, the Fund may invest up to 25% of its total assets in dollar roll transactions.
The Funds may invest in derivative financial instruments in an attempt to manage market risk, credit risk and yield curve risk, to manage the effective maturity or duration of securities in the Funds’ portfolios or for speculative purposes in an effort to increase the Funds’ yield or to enhance returns. The Funds that may invest in non-dollar denominated securities may also use derivatives to gain exposure to non-dollar denominated securities markets to the extent they do not do so through direct investments.
Each Fund’s most recent prospectus provides further descriptions of each Fund’s investment objective, principal investment strategies and principal risks.
On September 22, 2011, Short Term Bond began offering Class R3 Shares.
Significant Accounting Policies
The following is a summary of significant accounting policies followed by the Funds in the preparation of their financial statements in accordance with accounting principles generally accepted in the United States (“U.S. GAAP”).
Investment Valuation
Common stocks and other equity-type securities are valued at the last sales price on the securities exchange on which such securities are primarily traded and are generally classified as Level 1 for fair value measurement purposes. Securities primarily traded on the NASDAQ National Market (“NASDAQ”) are valued, except as indicated below, at the NASDAQ Official Closing Price and are generally classified as Level 1. However, securities traded on a securities exchange or NASDAQ for which there were no transactions on a given day or securities not listed on a securities exchange or NASDAQ are valued at the quoted bid price and are generally classified as Level 2. Prices of certain American Depositary Receipts (“ADR”) held by the Fund that trade in only limited volume in the United States are valued based on the last traded price, official closing price, or the most recent bid price of the underlying non-U.S.-traded stock, adjusted as appropriate for the underlying-to-ADR conversion ratio and foreign exchange rate, and from time-to-time may also be adjusted further to take into account material events that may take place after the close of the local non-U.S. market but before the close of the NYSE, which generally represents a transfer from a Level 1 to a Level 2 security.
Investments in the investment companies are valued at their respective net asset value on valuation date. These investment vehicles are generally classified Level 1.
Prices of fixed-income securities, forward foreign currency exchange contracts and swap contracts are provided by a pricing service approved by the Funds’ Board of Directors/Trustees. These securities are generally classified as Level 2. When price quotes are not readily available, the pricing service establishes a security’s fair value using methods that may include consideration of the following:
| Nuveen Investments | 145 |
Notes to Financial Statements (Unaudited) (continued)
yields or prices of investments of comparable quality, type of issue, coupon, maturity and rating, market quotes or indications of value from security dealers, evaluations of anticipated cash flows or collateral, general market conditions and other information and analysis, including the obligor’s credit characteristics considered relevant. In pricing certain securities, particularly less liquid and lower quality securities, the pricing service may consider information about a security, its issuer, or market activity provided by the Adviser. These securities are generally classified as Level 2 or Level 3 depending on the priority of the significant inputs.
If significant market events occur between the time of determination of the closing price of a foreign security on an exchange and the time that the Funds’ net asset value (NAV) is determined, or if under the Funds’ procedures, the closing price of a foreign security is not deemed to be reliable, the security would be valued at fair value as determined in accordance with procedures established in good faith by the Funds’ Board of Directors/Trustees. These securities are generally classified as Level 2 or Level 3 depending on the priority of the significant inputs.
The value of exchange-traded options are based on the mean of the closing bid and ask prices. Futures contracts are valued using the closing settlement price or, in the absence of such a price, the last traded price. Exchange-traded options and futures contracts are generally classified as Level 1. Options traded in the over-the counter market are valued using an evaluated mean price and are generally classified as Level 2.
Repurchase agreements are valued at contract amount plus accrued interest, which approximates market value. These securities are generally classified as Level 2.
Certain securities may not be able to be priced by the pre-established pricing methods as described above. Such securities may be valued by the Funds’ Board of Directors/Trustees or its designee at fair value. These securities generally include, but are not limited to, restricted securities (securities which may not be publicly sold without registration under the Securities Act of 1933, as amended) for which a pricing service is unable to provide a market price; securities whose trading has been formally suspended; debt securities that have gone into default and for which there is no current market quotation; a security whose market price is not available from a pre-established pricing source; a security with respect to which an event has occurred that is likely to materially affect the value of the security after the market has closed but before the calculation of a Fund’s net asset value (as may be the case in non-U.S. markets on which the security is primarily traded) or make it difficult or impossible to obtain a reliable market quotation; and a security whose price, as provided by the pricing service, is not deemed to reflect the security’s fair value. As a general principle, the fair value of a security would appear to be the amount that the owner might reasonably expect to receive for it in a current sale. A variety of factors may be considered in determining the fair value of such securities, which may include consideration of the following: yields or prices of investments of comparable quality, type of issue, coupon, maturity and rating, market quotes or indications of value from security dealers, evaluations of anticipated cash flows or collateral, general market conditions and other information and analysis, including the obligor’s credit characteristics considered relevant. These securities are generally classified as Level 2 or Level 3 depending on the priority of the significant inputs. Regardless of the method employed to value a particular security, all valuations are subject to review by the Funds’ Board of Directors/Trustees or its designee.
Refer to Footnote 2 – Fair Value Measurements for further details on the leveling of securities held by the Funds as of the end of the reporting period.
Investment Transactions
Investment transactions are recorded on a trade date basis. Realized gains and losses from investment transactions are determined on the specific identification method, which is the same basis used for federal income tax purposes. Investments purchased on a when-issued/ delayed delivery basis may have extended settlement periods. Any investments so purchased are subject to market fluctuation during this period. The Funds have instructed the custodian to segregate assets with a current value at least equal to the amount of the when-issued/delayed delivery purchase commitments. At December 31, 2011, Core Bond, Global Total Return Bond, Intermediate Government Bond and Total Return Bond had outstanding when issued/delayed delivery purchase commitments of $51,122,050, $2,101,591, $2,351,466 and $82,863,050, respectively. There were no such outstanding purchase commitments in any of the other Funds.
Investment Income
Dividend income is recorded on the ex-dividend date or, for foreign securities, when information is available. Interest income, which reflects the amortization of premiums and includes accretion of discounts for financial reporting purposes, is recorded on an accrual basis. Interest income also reflects pay down gains and losses, if any.
Income Taxes
Each Fund is a separate taxpayer for federal income tax purposes. Each Fund intends to distribute substantially all of its net investment income and net capital gains to shareholders and to otherwise comply with the requirements of Subchapter M of the Internal Revenue Code applicable to regulated investment companies. Therefore, no federal income tax provision is required.
For all open tax years and all major taxing jurisdictions, management of the Funds has concluded that there are no significant uncertain tax positions that would require recognition in the financial statements. Open tax years are those that are open for examination by taxing authorities (i.e., generally the last four tax year ends and the interim tax period since then). Furthermore, management of the Funds is also not aware of any tax positions for which it is reasonably possible that the total amounts of unrecognized tax benefits will significantly change in the next twelve months.
| 146 | Nuveen Investments |
Dividends and Distributions to Shareholders
The Funds declare dividends from their net investment income daily and pay shareholders monthly. Fund shares begin to accrue dividends on the business day after the day when the monies used to purchase Fund shares are collected by the Funds’ transfer agent.
Net realized capital gains from investment transactions, if any, are declared and distributed to shareholders at least annually. Furthermore, capital gains are distributed only to the extent they exceed available capital loss carry forwards.
Distributions to shareholders are recorded on the ex-dividend date. The amount and timing of distributions are determined in accordance with federal income tax regulations, which may differ from U.S. GAAP.
Flexible Sales Charge Program
Class A Shares are generally sold with an up-front sales charge and incur a .25% annual 12b-1 service fee. Class A Share purchases of the Funds, with the exception of Short Term Bond, of $1 million or more are sold at net asset value without an up-front sales charge. Class A Share purchases of Short Term Bond of $250,000 or more are sold at net asset value without an up-front sales charge. Class A Share purchases may be subject to a contingent deferred sales charge (“CDSC”) if redeemed within eighteen months of purchase. Class B Shares are sold without an up-front sales charge but incur a .75% annual 12b-1 distribution fee and a .25% annual 12b-1 service fee. An investor purchasing Class B Shares is subject to a CDSC of up to 5% depending upon the length of time the shares are held by the investor (CDSC is reduced to 0% at the end of six years). Class B Shares automatically convert to Class A Shares eight years after purchase. Class C Shares are sold without an up-front sales charge but incur a .75% annual 12b-1 distribution fee and a .25% annual 12b-1 service fee. Class C Shares are subject to a CDSC of 1% if redeemed within twelve months of purchase. Class R3 Shares are sold without an up-front sales charge but incur a .25% annual 12b-1 distribution fee and a .25% annual 12b-1 service fee. Class I Shares are not subject to any sales charge or 12b-1 distribution or service fees.
Dollar Roll Transactions
A dollar roll (“dollar rolls”) is a transaction in which a Fund purchases or sells mortgage-backed securities (“MBS”) for delivery in the future and simultaneously contracts to sell or repurchase substantially similar (same type, coupon, and maturity) MBS on a different specified future date. Dollar rolls are identified in the Fund’s Portfolio of Investments as “MDR”, when applicable. During the roll period, the Fund foregoes principal and interest paid on the MBS. The Fund is compensated by fee income or the difference between the current sales price and the lower forward price for the future purchase. Such compensation is amortized over the life of the dollar rolls, which is recognized as a component of “Interest income” on the Statement of Operations. Dollar rolls are valued daily. Core Bond and Total Return Bond entered into dollar roll transactions during the six months ended December 31, 2011.
Dollar rolls involve the risk that the market value of the MBS the Fund is obligated to repurchase under an agreement may decline below the repurchase price. These transactions also involve some risk to the Fund if the other party should default on its obligation and the Fund is delayed or prevented from completing the transaction. In the event that the buyer of securities under a dollar roll files for bankruptcy or becomes insolvent, the Fund’s use of proceeds of the dollar roll may be restricted pending a determination by the other party, or its trustee or receiver, whether to enforce the Fund’s obligation to repurchase the securities.
Foreign Currency Transactions
Each Fund with the exception of Intermediate Government Bond is authorized to engage in foreign currency exchange transactions, including foreign currency forwards, futures, options and swap contracts. To the extent that the Fund invests in securities and/or contracts that are denominated in a currency other than U.S. dollars, the Funds will be subject to currency risk, which is the risk that an increase in the U.S. dollar relative to the foreign currency will reduce returns or portfolio value. Generally, when the U.S. dollar rises in value against a foreign currency, the Fund’s investments denominated in that currency will lose value because its currency is worth fewer U.S. dollars; the opposite effect occurs if the U.S. dollar falls in relative value. Investments and other assets and liabilities denominated in foreign currencies are converted into U.S. dollars on a spot (i.e. cash) basis at the spot rate prevailing in the foreign currency exchange market at the time of valuation. Purchases and sales of investments and income denominated in foreign currencies are translated into U.S. dollars on the respective dates of such transactions.
The books and records of the Funds are maintained in U.S. dollars. Foreign currencies, investments and other assets and liabilities are translated into U.S. dollars at 4:00 p.m. Eastern time. Investments, income and expenses are translated on the respective dates of such transactions. Net realized foreign currency gains and losses resulting from changes in exchange rates include foreign currency gains and losses between trade date and settlement date of the transactions, foreign currency transactions, and the difference between the amounts of interest and dividends recorded on the books of the Funds and the amounts actually received.
The realized gains and losses resulting from changes in foreign currency exchange rates and changes in foreign exchange rates associated with other assets and liabilities on investments, forward foreign currency exchange contracts and swaps are recognized as a component of “Net realized gain (loss) from investments and foreign currency” on the Statement of Operations, when applicable.
The unrealized gains and losses resulting from changes in foreign currency exchange rates and changes in foreign exchange rates associated with other assets and liabilities on investments are recognized as a component of “Change in net unrealized appreciation (depreciation) of investments and foreign currency” on the Statement of Operations, when applicable. The unrealized gains and losses resulting from changes in foreign exchange rates associated with forward foreign currency exchange contracts and swaps are recognized as a component of “Change in net unrealized appreciation (deprecation) of forward foreign currency exchange contracts, futures and swaps, respectively” on the Statement of Operations, when applicable.
| Nuveen Investments | 147 |
Notes to Financial Statements (Unaudited) (continued)
Forward Foreign Currency Exchange Contracts
Each Fund that invests in non-dollar denominated securities is subject to foreign currency exchange rate risk in the normal course of pursuing its investment objectives and is authorized to enter into forward foreign currency exchange contracts in an attempt to manage such risk under two circumstances: (i) when a Fund enters into a contract for the purchase or sale of a security denominated in a foreign currency to “lock in” the U.S. exchange rate of the transaction, with such period being a short-dated contract covering the period between transaction date and settlement date; or (ii) when the Adviser, believes that the currency of a particular foreign country may experience a substantial movement against the U.S. dollar or against another foreign currency. Forward foreign currency exchange contracts are valued daily at the forward rate and are recognized as a component of “Unrealized appreciation or depreciation on forward foreign currency exchange contracts” on the Statement of Assets and Liabilities. The change in value of the contracts during the reporting period is recognized as a component of “Change in net unrealized appreciation (depreciation) of forward foreign currency exchange contracts” on the Statement of Operations. When the contract is closed or offset with the same counterparty, the Fund recognizes the difference between the value of the contract at the time it was entered and the value at the time it was closed or offset as a component of “Net realized gain (loss) from forward foreign currency exchange contracts” on the Statement of Operations.
Forward foreign currency exchange contracts will generally not be entered into for terms greater than three months, but may have maturities of up to six months or more. The use of forward foreign currency exchange contracts does not eliminate fluctuations in the underlying prices of a Fund’s investment securities; however, it does establish a rate of exchange that can be achieved in the future. The use of forward foreign currency exchange contracts involves the risk that anticipated currency movements will not be accurately predicted. A forward foreign currency exchange contract would limit the risk of loss due to a decline in the value of a particular currency; however, it also would limit any potential gain that might result should the value of the currency increase instead of decrease. These contracts may involve market risk in excess of the unrealized gain or loss reflected on the Statement of Assets and Liabilities. Forward foreign currency exchange contracts are subject to counterparty risk if the counterparty fails to perform as specified in the contract due to financial impairment or other reason.
During the six months ended December 31, 2011, Global Total Return Bond, Inflation Protected Securities, Short Term Bond and Total Return Bond invested in forward foreign currency exchange contracts to manage foreign currency exposure. To reduce unwanted currency exposure from the Fund’s Portfolio of Investments, each Fund acquired a short foreign currency forward.
The average number of forward foreign currency exchange contracts outstanding during the six months ended December 31, 2011, was as follows:
| Global Total Return Bond |
Inflation Protected Securities |
Short Term Bond |
Total Return Bond |
|||||||||||||
| Average number of forward foreign currency exchange contracts outstanding* |
17 | 1 | 2 | 13 | ||||||||||||
| * | The average number of outstanding contracts is calculated based on the outstanding contracts at the beginning of the fiscal year and at the end of each fiscal quarter within the current fiscal year. |
Refer to Footnote 3 – Derivative Instruments and Hedging Activities for further details on forward foreign currency exchange contract activity.
Futures Contracts
Each Fund is subject to interest rate risk in the normal course of pursuing its investment objectives and is authorized to invest in futures contracts in attempt to manage such risk. Upon entering into a futures contract, a Fund is required to deposit with the broker an amount of cash or liquid securities equal to a specified percentage of the contract amount. This is known as the “initial margin.” Cash held by the broker to cover initial margin requirements on open futures contracts, if any, is recognized as “Deposits with brokers for open futures contracts” on the Statement of Assets and Liabilities. Subsequent payments (“variation margin”) are made or received by a Fund each day, depending on the daily fluctuation of the value of the contract. Variation margin is recognized as a receivable or payable for “Variation margin on futures contracts” on the Statement of Assets and Liabilities, when applicable.
During the period the futures contract is open, changes in the value of the contract are recognized as an unrealized gain or loss by “marking-to-market” on a daily basis to reflect the changes in market value of the contract, which is recognized as “Change in net unrealized appreciation (depreciation) of futures contracts” on the Statement of Operations. When the contract is closed or expired, the Fund records a realized gain or loss equal to the difference between the value of the contract on the closing date and value of the contract when originally entered into, which is recognized as “Net realized gain (loss) from futures contracts” on the Statement of Operations.
Risks of investments in futures contracts include the possible adverse movement in the price of the securities or indices underlying the contracts, the possibility that there may not be a liquid secondary market for the contracts and/or that a change in the value of the contract may not correlate with a change in the value of the underlying securities or indices.
During the six months ended December 31, 2011, all the Funds used long and short U.S. Treasury note and bond futures to manage portfolio duration and yield curve exposure. To increase the duration of the Fund’s Portfolio of Investments, each Fund acquired a long U.S. Treasury note or bond futures position. Global Total Return Bond, Inflation Protected Securities and Total Return Bond entered into foreign currency futures to manage foreign currency exposure. To reduce unwanted currency exposure from the Fund’s Portfolio of Investments, a short foreign currency future would be acquired.
| 148 | Nuveen Investments |
The average number of futures contracts outstanding during the six months ended December 31, 2011, was as follows:
| Core Bond | Global Total Return Bond |
High Income Bond |
Inflation Protected Securities |
|||||||||||||
| Average number of futures contracts outstanding* |
1,346 | 25 | 12 | 126 | ||||||||||||
| Intermediate Government Bond |
Intermediate Term Bond |
Short Term Bond |
Total Return Bond |
|||||||||||||
| Average number of futures contracts outstanding* |
175 | 690 | 925 | 657 | ||||||||||||
| * | The average number of outstanding contracts is calculated based on the outstanding contracts at the beginning of the fiscal year and at the end of each fiscal quarter within the current fiscal year. |
Refer to Footnote 3 – Derivative Instruments and Hedging Activities for further details on futures contract activity.
Options Transactions
Each Fund is subject to interest rate risk and with the exception of Intermediate Government Bond, foreign currency risk in the normal course of pursuing its investment objectives and is authorized to purchase and write (sell) call and put options on securities, futures, swaps (“swaptions”) or with the exception of Intermediate Government Bond, currencies in an attempt to manage such risk. The purchase of options and/or swaptions involves the risk of loss of all or a part of the cash paid for the options (the premium). The market risk associated with purchasing options and/or swaptions is limited to the premium paid. The counterparty credit risk of purchasing options and/or swaptions, however, needs also to take into account the current value of the option, as this is the performance expected from the counterparty. When a Fund purchases an option and/or swaption, an amount equal to the premium paid (the premium plus commission) is recognized as a component of “Options and/or Swaptions purchased, at value” on the Statement of Assets and Liabilities. When a Fund writes an option and/ or swaption, an amount equal to the net premium received (the premium less commission) is recognized as a component of “Options and/or Swaptions written, at value” on the Statement of Assets and Liabilities and is subsequently adjusted to reflect the current value of the written option and/or swaption until the option and/or swaption is exercised or expires or the Fund enters into a closing purchase transaction. The changes in the value of options and/or swaptions purchased during the fiscal period are recognized as a component of “Change in net unrealized appreciation (depreciation) of Options and/or Swaptions purchased” on the Statement of Operations. The changes in the value of options and/or swaptions written during the fiscal period are recognized as a component of “Change in net unrealized appreciation (depreciation) of Options and/or Swaptions written” on the Statement of Operations. When an option and/or swaption is exercised or expires or the Fund enters into a closing purchase transaction, the difference between the net premium received and any amount paid at expiration or on executing a closing purchase transaction, including commission, is recognized as a component of “Net realized gain (loss) from Options and/or Swaptions purchased and/or written” on the Statement of Operations. The Fund, as a writer of an option and/or swaption has no control over whether the underlying instrument may be sold (called) or purchased (put) and as a result bears the risk of an unfavorable change in the market value of the instrument underlying the written option and/or swaption. There is also the risk the Fund may not be able to enter into a closing transaction because of an illiquid market.
During the six months ended December 31, 2011, Global Total Return Bond and Total Return Bond purchased futures options on U.S. Treasury notes as part of an overall portfolio interest rate strategy; hedging the Portfolio of Investments against adverse interest rate movements while limiting downside exposure.
During the six months ended December 31, 2011, Total Return Bond wrote call and put options to express views on volatility, selling out-of-the-money calls and puts when implied volatility was high.
The average number of purchased options contracts outstanding during the six months ended December 31, 2011, was as follows:
| Global Total Return Bond |
Total Return Bond |
|||||||
| Average number of purchased options contracts outstanding* |
17 | 137 | ||||||
| * | The average number of option contracts is calculated based on the outstanding contracts at the beginning of the fiscal year and at the end of each fiscal quarter within the current fiscal year. |
The average number of written options contracts outstanding during the six months ended December 31, 2011, was as follows:
| Total Return Bond |
||||
| Average number of options written contracts outstanding* |
304 | ** | ||
| * | The average number of outstanding contracts is calculated based on the outstanding contracts at the beginning of the fiscal year and at the end of each fiscal quarter within the current fiscal year. |
| ** | Includes both calls and puts. |
| Nuveen Investments | 149 |
Notes to Financial Statements (Unaudited) (continued)
Refer to Footnote 3 – Derivative Instruments and Hedging Activities and Footnote 5 – Investment Transactions for further details on options contract activity.
Swap Contracts
Each Fund is authorized to enter into swap contracts consistent with their investment objectives and policies to reduce, increase or otherwise alter its risk profile or to alter its portfolio characteristics (i.e. duration, yield curve positioning and credit quality).
Interest Rate Swaps
Each Fund is subject to interest rate risk in the normal course of pursuing its investment objectives and policies in an attempt to obtain a desired return at a lower cost than if the Fund had invested directly in the asset that yielded the desired return. In connection with these contracts, securities in the Funds’ portfolios of investments may be identified as collateral in accordance with the terms of the respective swap contract. Interest rate swap contracts involve the exchange by a Fund with another party of their respective commitments to pay or receive interest (i.e., an exchange of floating rate payments for fixed rate payments with respect to a specified notional amount of principal). Interest rate swap contracts are valued daily. The Funds accrue daily the periodic payments expected to be paid and received on each interest rate swap contract and recognize the daily change in the market value of the Funds’ contractual rights and obligations under the contracts. The net amount recorded on these transactions for each counterparty is recognized on the Statement of Assets and Liabilities as a component of “Unrealized appreciation or depreciation on interest rate swaps” with the change during the fiscal period recognized on the Statement of Operations as a component of “Change in net unrealized appreciation (depreciation) of swaps” on the Statement of Operations. Income received or paid by the Funds is recognized as a component of “Net realized gain (loss) from swaps” on the Statement of Operations, in addition to the net realized gains or losses recognized upon the termination of an interest rate swap contract and are equal to the difference between the Funds’ basis in the interest rate swap and the proceeds from (or cost of) the closing transaction. The amount of the payment obligation is based on the notional amount of the interest rate swap contract. Payments received or made at the beginning of the measurement period are recognized as a component of “Interest rate swap premiums paid and/or received” on the Statement of Assets and Liabilities, when applicable. For tax purposes, periodic payments are treated as ordinary income or expense.
During the six months ended December 31, 2011, Core Bond, Inflation Protected Securities, Intermediate Term Bond, Short Term Bond and Total Return Bond invested in interest rate swap contracts to hedge against changes in interest rate spreads by taking a short interest rate swap position. The average number of interest rate swap contracts outstanding during the six months ended December 31, 2011, were as follows:
| Core Bond | Inflation Protected Securities |
Intermediate Term Bond |
Short Term Bond |
Total Return Bond |
||||||||||||||||
| Average number of interest rate swap contracts outstanding* |
5 | 5 | 5 | 5 | 2 | |||||||||||||||
| * | The average number of outstanding contracts is calculated based on the outstanding contracts at the beginning of the fiscal year and at the end of each fiscal quarter within the current fiscal year. |
Credit Default Swaps
Each Fund is subject to credit risk in the normal course of pursuing its investment objectives. A Fund may enter into a credit default swap contract to seek to maintain a total return on a particular investment or portion of its portfolio, or to take an active long or short position with respect to the likelihood of a particular issuer’s default. Credit default swap contracts involve one party making a stream of payments to another party in exchange for the right to receive a specified return if/when there is a credit event by a third party. Generally, a credit event means bankruptcy, failure to pay, or restructuring. The specific credit events applicable for each credit default swap are stated in the terms of the particular swap agreement. As a purchaser of a credit default swap contract, the Fund pays to the counterparty a periodic interest fee based on the notional amount of the credit default swap. This interest fee is accrued daily and recognized with the daily change in the market value of the contract as a component of “Unrealized appreciation or depreciation on credit default swaps” on the Statement of Assets and Liabilities and is recorded as a realized loss upon payment. Upon occurrence of a specific credit event with respect to the underlying referenced entity, the Fund is obligated to deliver that security, or an equivalent amount of cash, to the counterparty in exchange for receipt of the notional amount from the counterparty. The difference between the value of the security delivered and the notional amount received is recorded as a realized gain. Payments received or made at the beginning of the measurement period are recognized as a component of “Credit default swap premiums paid and/or received” on the Statement of Assets and Liabilities, when applicable. As a seller of a credit default swap contract, the Fund generally receives from the counterparty a periodic interest fee based on the notional amount of the credit default swap. This interest fee is accrued daily as a component of unrealized appreciation or depreciation and is recorded as a realized gain upon payment. Upon occurrence of a specific credit event with respect to the underlying referenced entity, the Fund will either receive that security, or an equivalent amount of cash, from the counterparty in exchange for payment of the notional amount to the counterparty, or pay a net settlement amount of the credit default swap contract less the recovery value of the referenced obligation or underlying securities comprising the referenced index. The difference between the value of the security received and the notional amount paid is recorded as a realized loss. Changes in the value of a credit default swap during the fiscal period are recognized as a component of “Change in net unrealized appreciation (depreciation) of swaps”, and realized gains and losses are recognized as a component of “Net realized gain (loss) from swaps” on the Statement of Operations. The maximum potential amount of future payments the Fund could incur as a
| 150 | Nuveen Investments |
seller of protection in a credit default swap contract is limited to the notional amount of the contract. The maximum potential amount would be offset by the recovery value, if any, of the respective referenced entity.
During the six months ended December 31, 2011, Core Bond, Global Total Return Bond, Inflation Protected Securities, Intermediate Term Bond, Short Term Bond and Total Return Bond invested in credit default swap contacts to add diversified exposure to a broad segment of the credit markets, or to express a view on credit as part of an overall portfolio sector management strategy or to add diversified exposure to a broad segment of the credit markets. To increase a Fund’s credit exposure to the investment grade or high yield segment of the market, a long CDX Investment Grade Index swap or long CDX High Yield Index swap, respectively, would be acquired.
The average number of credit default swap contracts outstanding during the six months ended December 31, 2011, was as follows:
| Core Bond | Global Total Return Bond |
Inflation Protected Securities |
Intermediate Term Bond |
Short Term Bond |
Total Return Bond |
|||||||||||||||||||
| Average number of credit default swap contracts outstanding* |
— | ** | 5 | 1 | — | ** | 1 | 3 | ||||||||||||||||
| * | The average notional amount is calculated based on the outstanding contracts at the beginning of the fiscal year and at the end of each fiscal quarter within the current fiscal year. |
| ** | Rounds to less than 1. |
Refer to Footnote 3 – Derivative Instruments and Hedging Activities for further details on swap contract activity.
Market and Counterparty Credit Risk
In the normal course of business each Fund may invest in financial instruments and enter into financial transactions where risk of potential loss exists due to changes in the market (market risk) or failure of the other party to the transaction to perform (counterparty credit risk). The potential loss could exceed the value of the financial assets recorded on the financial statements. Financial assets, which potentially expose each Fund to counterparty credit risk, consist principally of cash due from counterparties on forward, option and swap transactions, when applicable. The extent of each Fund’s exposure to counterparty credit risk in respect to these financial assets approximates their carrying value as recorded on the Statement of Assets and Liabilities. Futures contracts, when applicable, expose a Fund to minimal counterparty credit risk as they are exchange traded and the exchange’s clearinghouse, which is counterparty to all exchange traded futures, guarantees the futures contracts against default.
Each Fund helps manage counterparty credit risk by entering into agreements only with counterparties the Adviser believes have the financial resources to honor their obligations and by having the Adviser monitor the financial stability of the counterparties. Additionally, counterparties may be required to pledge collateral daily (based on the daily valuation of the financial asset) on behalf of each Fund with a value approximately equal to the amount of any unrealized gain above a predetermined threshold. Reciprocally, when each Fund has an unrealized loss, the Funds have instructed the custodian to pledge assets of the Funds as collateral with a value approximately equal to the amount of the unrealized loss above a pre-determined threshold. Collateral pledges are monitored and subsequently adjusted if and when the valuations fluctuate, either up or down, by at least the pre-determined threshold amount.
Inflation-Indexed Bonds
Inflation-indexed bonds are fixed income securities whose principal value is periodically adjusted to the rate of inflation. The interest rate on these bonds is generally fixed at issuance at a rate lower than typical bonds. Over the life of an inflation-indexed bond however, interest will be paid based on a principal value which is adjusted for inflation. Any increase in the principal amount of an inflation-indexed bond will be recognized as a component of “Interest income” on the Statement of Operations, even though investors do not receive their principal until maturity.
Custodian Fee Credit
Each Fund has an arrangement with the custodian bank whereby certain custodian fees and expenses are reduced by net credits earned on each Fund’s cash on deposit with the bank. Such deposit arrangements are an alternative to overnight investments. Credits for cash balances may be offset by charges for any days on which a Fund overdraws its account at the custodian bank.
Zero Coupon Securities
Each Fund is authorized to invest in zero coupon securities. A zero coupon security does not pay a regular interest coupon to its holders during the life of the security. Income to the holder of the security comes from accretion of the difference between the original purchase price of the security at issuance and the par value of the security at maturity and is effectively paid at maturity. The market prices of zero coupon securities generally are more volatile than the market prices of securities that pay interest periodically.
Multiclass Operations and Allocations
Income and expenses of the Funds that are not directly attributable to a specific class of shares are prorated among the classes based on the relative settled shares of each class. Expenses directly attributable to a class of shares, which presently only include 12b-1 distribution and shareholder service fees, are recorded to the specific class.
Income, realized and unrealized capital gains and losses of the Funds are prorated among the classes based on the relative net assets of each class.
| Nuveen Investments | 151 |
Notes to Financial Statements (Unaudited) (continued)
Securities Lending
In order to generate additional income, each Fund, with the exception of Global Total Return Bond, may lend securities representing up to one-third of the value of its total assets (which includes collateral for securities on loan) to broker-dealers, banks, or other institutional borrowers of securities. Each Fund’s policy is to receive collateral from the borrower in the form of cash, U.S. government securities, or other high-grade debt obligations equal to at least 102% of the value of securities loaned, which is recognized as “Collateral from securities lending program” on the Statement of Assets and Liabilites. If the value of the securities on loan increases, such that the level of collateralization falls below 102%, additional collateral is received from the borrower, which is recognized as “Due from broker” on the Statement of Assets and Liabilities. As with other extensions of credit, there may be risks of delay in recovery of the securities or even loss of rights in the collateral should the borrower of the security fail financially.
U.S. Bank National Association (“U.S. Bank”) serves as the securities lending agent for the Funds in transactions involving the lending of portfolio securities on behalf of the Funds. U.S. Bank acts as the securities lending agent pursuant to, and subject to compliance with conditions contained in, an exemptive order issued by the Securities and Exchange Commission (“SEC”).
During the six months ended December 31, 2011, U.S. Bank, as the securities lending agent, received fees that equaled up to 20% of each Fund’s net income from securities lending transactions. U.S. Bank paid half of such fees to U.S. Bancorp Asset Management, Inc. (“USBAM”) for certain securities lending services provided by USBAM. Collateral for securities on loan was invested in a money market fund administered by USBAM. USBAM also received an administration fee equal to .02% of each Fund’s average daily net assets invested in the money market fund.
Income from securities lending, net of fees paid to U.S. Bank, is recognized on the Statement of Operations as “Securities lending income.” Securities lending fees paid to U.S. Bank by each Fund during the six months ended December 31, 2011, were as follows:
| Fund | Securities Lending Fees Paid |
|||
| Core Bond |
$ | 25,134 | ||
| High Income Bond |
53,422 | |||
| Inflation Protected Securities |
16,645 | |||
| Intermediate Government Bond |
2,958 | |||
| Intermediate Term Bond |
17,716 | |||
| Short Term Bond |
14,342 | |||
| Total Return Bond |
13,020 | |||
Indemnifications
Under the Trust’s organizational documents, its officers and directors/trustees are indemnified against certain liabilities arising out of the performance of their duties to the Trust. In addition, in the normal course of business, the Trust enters into contracts that provide general indemnifications to other parties. The Trust’s maximum exposure under these arrangements is unknown as this would involve future claims that may be made against the Trust that have not yet occurred. However, the Trust has not had prior claims or losses pursuant to these contracts and expects the risk of loss to be remote.
Use of Estimates
The preparation of financial statements in conformity with U.S. GAAP requires management to make estimates and assumptions that affect the reported amounts of assets and liabilities at the date of the financial statements and the reported amounts of increases and decreases in net assets from operations during the reporting period. Actual results may differ from those estimates.
2. Fair Value Measurements
Fair value is defined as the price that the Funds would receive upon selling an investment or transferring a liability in an orderly transaction to an independent buyer in the principal or most advantageous market for the investment. A three-tier hierarchy is used to maximize the use of observable market data and minimize the use of unobservable inputs and to establish classification of fair value measurements for disclosure purposes. Observable inputs reflect the assumptions market participants would use in pricing the asset or liability. Observable inputs are based on market data obtained from sources independent of the reporting entity. Unobservable inputs reflect the reporting entity’s own assumptions about the assumptions market participants would use in pricing the asset or liability. Unobservable inputs are based on the best information available in the circumstances. The three-tier hierarchy of inputs is summarized in the three broad levels listed below:
| Level 1 – | Quoted prices in active markets for identical securities. | |
| Level 2 – | Other significant observable inputs (including quoted prices for similar securities, interest rates, prepayment speeds, credit risk, etc.). | |
| Level 3 – | Significant unobservable inputs (including management’s assumptions in determining the fair value of investments). |
| 152 | Nuveen Investments |
The inputs or methodologies used for valuing securities are not an indication of the risk associated with investing in those securities. The following is a summary of each Fund’s fair value measurements as of December 31, 2011:
| Core Bond | Level 1 | Level 2 | Level 3 | Total | ||||||||||||
| Investments: |
||||||||||||||||
| Corporate Bonds |
$ | — | $ | 351,531,941 | $ | — | $ | 351,531,941 | ||||||||
| $25 Par (or similar) Preferred Securities |
2,972,039 | — | — | 2,972,039 | ||||||||||||
| Municipal Bonds |
— | 6,213,517 | — | 6,213,517 | ||||||||||||
| U.S. Government and Agency Obligations |
— | 32,198,108 | — | 32,198,108 | ||||||||||||
| Asset-Backed and Mortgage-Backed Securities |
— | 514,220,886 | — | 514,220,886 | ||||||||||||
| Investments Purchased with Collateral from Securities Lending |
265,290,988 | — | — | 265,290,988 | ||||||||||||
| Short-Term Investments |
51,512,634 | 4,059,443 | — | 55,572,077 | ||||||||||||
| Derivatives: |
||||||||||||||||
| Interest Rate Swaps* |
— | (2,601,017 | ) | — | (2,601,017 | ) | ||||||||||
| Futures Contracts* |
(258,294 | ) | — | — | (258,294 | ) | ||||||||||
| Total |
$ | 319,517,367 | $ | 905,622,878 | $ | — | $ | 1,225,140,245 | ||||||||
| Global Total Return Bond | Level 1 | Level 2 | Level 3 | Total | ||||||||||||
| Investments: |
||||||||||||||||
| Corporate Bonds |
$ | — | $ | 2,837,884 | $ | — | $ | 2,837,884 | ||||||||
| Convertible Bonds |
— | 20,126 | — | 20,126 | ||||||||||||
| U.S. Government and Agency Obligations |
— | 1,002,383 | — | 1,002,383 | ||||||||||||
| Asset-Backed and Mortgage-Backed Securities |
— | 2,111,780 | — | 2,111,780 | ||||||||||||
| Sovereign Debt |
— | 7,468,587 | — | 7,468,587 | ||||||||||||
| Short-Term Investments |
3,134,657 | — | — | 3,134,657 | ||||||||||||
| Derivatives: |
||||||||||||||||
| Forward Foreign Currency Exchange Contracts* |
— | (28,741 | ) | — | (28,741 | ) | ||||||||||
| Credit Default Swaps* |
— | (2,191 | ) | — | (2,191 | ) | ||||||||||
| Futures Contracts* |
18,884 | — | — | 18,884 | ||||||||||||
| Call Options Purchased |
2,922 | — | — | 2,922 | ||||||||||||
| Total |
$ | 3,156,463 | $ | 13,409,828 | $ | — | $ | 16,566,291 | ||||||||
| High Income Bond | Level 1 | Level 2 | Level 3 | Total | ||||||||||||
| Investments: |
||||||||||||||||
| Common Stocks** |
$ | 6,201,985 | $ | 21,393 | $ | 63,745 | $ | 6,287,123 | ||||||||
| Exchanges Traded Funds |
1,387,482 | — | — | 1,387,482 | ||||||||||||
| Corporate Bonds |
— | 497,982,469 | — | 497,982,469 | ||||||||||||
| Convertible Preferred Securities |
2,718,765 | — | — | 2,718,765 | ||||||||||||
| $25 Par (or similar) Preferred Securities |
23,932,873 | 2,508,953 | — | 26,441,826 | ||||||||||||
| U.S. Government and Agency Obligations |
— | 1,187,122 | — | 1,187,122 | ||||||||||||
| Asset-Backed and Mortgage-Backed Securities |
— | 3,952 | — | 3,952 | ||||||||||||
| Investment Companies |
5,460,265 | — | — | 5,460,265 | ||||||||||||
| Sovereign Debt |
— | 4,573,125 | — | 4,573,125 | ||||||||||||
| Warrants |
649 | 90,000 | — | 90,649 | ||||||||||||
| Investments Purchased with Collateral from Securities Lending |
141,911,228 | — | — | 141,911,228 | ||||||||||||
| Short-Term Investments |
1,805,270 | 219,964 | — | 2,025,234 | ||||||||||||
| Derivatives: |
||||||||||||||||
| Futures Contracts* |
38,801 | — | — | 38,801 | ||||||||||||
| Total |
$ | 183,457,318 | $ | 506,586,978 | $ | 63,745 | $ | 690,108,041 | ||||||||
| * | Represents net unrealized appreciation (depreciation) as reported in the Fund’s Portfolio of Investments. |
| ** | Refer to the Fund’s Portfolio of Investments for industry breakdown of Common Stocks classified as Level 2. |
| Nuveen Investments | 153 |
Notes to Financial Statements (Unaudited) (continued)
| Inflation Protected Securities | Level 1 | Level 2 | Level 3 | Total | ||||||||||||
| Investments: |
||||||||||||||||
| Exchange Traded Funds |
$ | 134,145 | $ | — | $ | — | $ | 134,145 | ||||||||
| Corporate Bonds |
— | 7,819,501 | — | 7,819,501 | ||||||||||||
| Convertible Preferred Securities |
166,800 | — | — | 166,800 | ||||||||||||
| $25 Par (or similar) Preferred Securities |
429,920 | — | — | 429,920 | ||||||||||||
| Municipal Bonds |
— | 1,217,914 | — | 1,217,914 | ||||||||||||
| U.S. Government and Agency Obligations |
— | 283,204,516 | — | 283,204,516 | ||||||||||||
| Asset-Backed and Mortgage-Backed Securities |
— | 17,148,555 | — | 17,148,555 | ||||||||||||
| Investment Companies |
241,975 | — | — | 241,975 | ||||||||||||
| Sovereign Debt |
— | 1,893,828 | — | 1,893,828 | ||||||||||||
| Investments Purchased with Collateral from Securities Lending |
110,025,443 | — | — | 110,025,443 | ||||||||||||
| Short-Term Investments |
3,954,290 | 1,044,842 | — | 4,999,132 | ||||||||||||
| Derivatives: |
||||||||||||||||
| Forward Foreign Currency Exchange Contracts* |
69,753 | — | — | 69,753 | ||||||||||||
| Credit Default Swaps* |
— | 249,179 | — | 249,179 | ||||||||||||
| Interest Rate Swaps* |
— | (333,245 | ) | — | (333,245 | ) | ||||||||||
| Futures Contracts* |
15,232 | — | — | 15,232 | ||||||||||||
| Total |
$ | 115,037,558 | $ | 312,245,090 | $ | — | $ | 427,282,648 | ||||||||
| Intermediate Government Bond | Level 1 | Level 2 | Level 3 | Total | ||||||||||||
| Investments: |
||||||||||||||||
| U.S. Government and Agency Obligations |
$ | — | $ | 49,810,739 | $ | — | $ | 49,810,739 | ||||||||
| Asset-Backed and Mortgage-Backed Securities |
— | 56,940,600 | — | 56,940,600 | ||||||||||||
| Investments Purchased with Collateral from Securities Lending |
30,419,777 | — | — | 30,419,777 | ||||||||||||
| Short-Term Investments |
3,007,668 | 209,937 | — | 3,217,605 | ||||||||||||
| Derivatives: |
||||||||||||||||
| Futures Contracts* |
90,610 | — | — | 90,610 | ||||||||||||
| Total |
$ | 33,518,055 | $ | 106,961,276 | $ | — | $ | 140,479,331 | ||||||||
| Intermediate Term Bond | Level 1 | Level 2 | Level 3 | Total | ||||||||||||
| Investments: |
||||||||||||||||
| Corporate Bonds |
$ | — | $ | 312,257,260 | $ | — | $ | 312,257,260 | ||||||||
| Municipal Bonds |
— | 6,560,283 | — | 6,560,283 | ||||||||||||
| U.S. Government and Agency Obligations |
— | 89,717,895 | — | 89,717,895 | ||||||||||||
| Asset-Backed and Mortgage-Backed Securities |
— | 224,586,023 | — | 224,586,023 | ||||||||||||
| Sovereign Debt |
— | 1,610,000 | — | 1,610,000 | ||||||||||||
| Investments Purchased with Collateral from Securities Lending |
145,279,759 | — | — | 145,279,759 | ||||||||||||
| Short-Term Investments |
16,529,647 | 2,249,768 | — | 18,779,415 | ||||||||||||
| Derivatives: |
||||||||||||||||
| Futures Contracts* |
(84,022 | ) | — | — | (84,022 | ) | ||||||||||
| Interest Rate Swaps* |
— | (1,565,071 | ) | — | (1,565,071 | ) | ||||||||||
| Total |
$ | 161,725,384 | $ | 635,416,158 | $ | — | $ | 797,141,542 | ||||||||
| Short Term Bond | Level 1 | Level 2 | Level 3 | Total | ||||||||||||
| Investments: |
||||||||||||||||
| Corporate Bonds |
$ | — | $ | 376,994,079 | $ | — | $ | 376,994,079 | ||||||||
| Municipal Bonds |
— | 30,414,387 | — | 30,414,387 | ||||||||||||
| U.S. Government and Agency Obligations |
— | 17,873,980 | — | 17,873,980 | ||||||||||||
| Asset-Backed and Mortgage-Backed Securities |
— | 346,042,785 | — | 346,042,785 | ||||||||||||
| Sovereign Debt |
— | 17,431,932 | — | 17,431,932 | ||||||||||||
| Investments Purchased with Collateral from Securities Lending |
85,327,821 | — | — | 85,327,821 | ||||||||||||
| Short-Term Investments |
9,772,646 | 3,229,458 | — | 13,002,104 | ||||||||||||
| Derivatives: |
||||||||||||||||
| Interest Rate Swaps* |
— | (1,092,412 | ) | — | (1,092,412 | ) | ||||||||||
| Forward Foreign Currency Exchange Contracts* |
40,168 | — | — | 40,168 | ||||||||||||
| Futures Contracts* |
(434,425 | ) | — | — | (434,425 | ) | ||||||||||
| Total |
$ | 94,706,210 | $ | 790,894,209 | $ | — | $ | 885,600,419 | ||||||||
| * | Represents net unrealized appreciation (depreciation) as reported in the Fund’s Portfolio of Investments. |
| 154 | Nuveen Investments |
| Total Return Bond | Level 1 | Level 2 | Level 3 | Total | ||||||||||||
| Investments: |
||||||||||||||||
| Common Stocks |
$ | — | $ | — | $ | 5,993 | $ | 5,993 | ||||||||
| Corporate Bonds |
— | 330,914,464 | — | 330,914,464 | ||||||||||||
| Convertible Preferred Securities |
608,820 | — | — | 608,820 | ||||||||||||
| $25 Par (or similar) Preferred Securities |
6,273,478 | — | — | 6,273,478 | ||||||||||||
| Municipal Bonds |
— | 4,138,752 | — | 4,138,752 | ||||||||||||
| U.S. Government and Agency Obligations |
— | 1,675,786 | — | 1,675,786 | ||||||||||||
| Asset-Backed and Mortgage-Backed Securities |
— | 269,458,186 | — | 269,458,186 | ||||||||||||
| Sovereign Debt |
— | 22,681,847 | — | 22,681,847 | ||||||||||||
| Investment Companies |
1,536,160 | — | — | 1,536,160 | ||||||||||||
| Investments Purchased with Collateral from Securities Lending |
67,926,716 | — | — | 67,926,716 | ||||||||||||
| Short-Term Investments |
77,144,281 | 5,464,418 | — | 82,608,699 | ||||||||||||
| Derivatives: |
||||||||||||||||
| Forward Foreign Currency Exchange Contracts* |
480,571 | — | — | 480,571 | ||||||||||||
| Credit Default Swaps* |
— | 740,095 | — | 740,095 | ||||||||||||
| Interest Rate Swaps* |
— | (1,970,666 | ) | — | (1,970,666 | ) | ||||||||||
| Futures Contracts* |
(470,692 | ) | — | — | (470,692 | ) | ||||||||||
| Call Options Purchased |
70,641 | — | — | 70,641 | ||||||||||||
| Total |
$ | 153,569,975 | $ | 633,102,882 | $ | 5,993 | $ | 786,678,850 | ||||||||
| * | Represents net unrealized appreciation (depreciation) as reported in the Fund’s Portfolio of Investments. |
The following is a reconciliation of each Fund’s Level 3 investments held at the beginning and end of the measurement period:
| High Income Bond | Level 3 Common Stocks |
Level 3 Corporate |
Level 3 Preferred |
Level 3 Total |
||||||||||||
| Balance at the beginning of period |
$ | — | $ | 2,600 | $ | 1 | $ | 2,601 | ||||||||
| Gains (losses): |
||||||||||||||||
| Net realized gains (losses) |
— | — | — | — | ||||||||||||
| Net change in unrealized appreciation (depreciation) |
(149,818 | ) | (2,500 | ) | 9 | (152,309 | ) | |||||||||
| Purchases at cost |
213,563 | — | — | 213,563 | ||||||||||||
| Sales at proceeds |
— | — | — | — | ||||||||||||
| Net discounts (premiums) |
— | — | — | — | ||||||||||||
| Transfers in to |
— | — | — | — | ||||||||||||
| Transfers out of |
— | (100 | ) | (10 | ) | (110 | ) | |||||||||
| Balance at the end of period |
$ | 63,745 | $ | — | $ | — | $ | 63,745 | ||||||||
| Change in net unrealized appreciation (depreciation) during the period of Level 3 |
$ | (149,818 | ) | $ | — | $ | — | $ | (149,819 | ) | ||||||
| Total Return Bond | Level 3 |
|||
| Balance at the beginning of period |
$ | — | ||
| Gains (losses): |
||||
| Net realized gains (losses) |
— | |||
| Net change in unrealized appreciation (depreciation) |
(14,086 | ) | ||
| Purchases at cost |
20,079 | |||
| Sales at proceeds |
— | |||
| Net discounts (premiums) |
— | |||
| Transfers in to |
— | |||
| Transfers out of |
— | |||
| Balance at the end of period |
$ | 5,993 | ||
| Change in net unrealized appreciation (depreciation) during the period of Level 3 securities held as of December 31, 2011 |
$ | (14,086 | ) | |
During the six months ended December 31, 2011, the Funds recognized no significant transfers to or from Level 1 or Level 2. Transfers in and/or out of Level 3 are shown using end of period values.
3. Derivative Instruments and Hedging Activities
The Funds record derivative instruments at fair value, with changes in fair value recognized on the Statement of Operations, when applicable. Even though the Funds’ investments in derivatives may represent economic hedges, they are not considered to be hedge transactions for financial reporting purposes. For additional information on the derivative instruments in which each Fund was invested during and at the end of the reporting period, refer to the Portfolios of Investments, Financial Statements and Footnote 1 – General Information and Significant Accounting Policies.
| Nuveen Investments | 155 |
Notes to Financial Statements (Unaudited) (continued)
The following tables present the fair value of all derivative instruments held by the Funds as of December 31, 2011, the location of these instruments on the Statement of Assets and Liabilities, and the primary underlying risk exposure.
| Core Bond | ||||||||||||||
| Location on the Statements of Assets and Liabilities | ||||||||||||||
| Underlying Risk Exposure |
Derivative Instrument |
Asset Derivatives | Liability Derivatives | |||||||||||
| Location | Value | Location | Value | |||||||||||
| Interest Rate |
Futures Contracts |
Deposits with brokers for open futures contracts and Payable for variation margin on futures contracts* |
$ | 159,380 | Deposits with brokers for open futures contracts and Payable for variation margin on futures contracts* |
$ | 417,674 | |||||||
| Interest Rate |
Swaps | Unrealized appreciation on interest rate swaps** |
— | Unrealized depreciation on interest rate swaps** |
2,601,017 | |||||||||
| Total |
$ | 159,380 | $ | 3,018,691 | ||||||||||
| Global Total Return Bond | ||||||||||||||
| Location on the Statements of Assets and Liabilities | ||||||||||||||
| Underlying Risk Exposure |
Derivative Instrument |
Asset Derivatives | Liability Derivatives | |||||||||||
| Location | Value | Location | Value | |||||||||||
| Foreign Currency Exchange Rate |
Forward Foreign Currency Exchange Contracts |
Unrealized appreciation on forward foreign currency exchange contracts |
$ | 98,858 | Unrealized depreciation on forward foreign currency exchange contracts |
$ | 127,599 | |||||||
| Foreign Currency Exchange Rate |
Futures Contracts | Deposits with brokers for open futures contracts and Receivable for variation margin on futures contracts* |
18,451 | Deposits with brokers for open futures contracts and Payable for variation margin on futures contracts* |
— | |||||||||
| Interest Rate |
Futures Contracts | Deposits with brokers for open futures contracts and Receivable for variation margin on futures contracts* |
433 | Deposits with brokers for open futures contracts and Payable for variation margin on futures contracts* |
— | |||||||||
| Interest Rate |
Options | Options purchased, at value | 2,922 | — | — | |||||||||
| Credit |
Swaps | Unrealized appreciation on credit default swaps** |
6,008 | Unrealized depreciation on credit default swaps** |
8,199 | |||||||||
| Total |
$ | 126,672 | $ | 135,798 | ||||||||||
| High Income Bond | ||||||||||||||
| Location on the Statements of Assets and Liabilities | ||||||||||||||
| Underlying Risk Exposure |
Derivative Instrument |
Asset Derivatives | Liability Derivatives | |||||||||||
| Location | Value | Location | Value | |||||||||||
| Interest Rate |
Futures Contracts |
Deposits with brokers for open futures contracts and Receivable for variation margin on futures contracts* |
$ | 38,801 | Deposits with brokers for open futures contracts and Payable for variation margin on futures contracts* |
$ | — | |||||||
| Inflation Protected Securities | ||||||||||||||
| Location on the Statements of Assets and Liabilities | ||||||||||||||
| Underlying Risk Exposure |
Derivative Instrument |
Asset Derivatives | Liability Derivatives | |||||||||||
| Location | Value | Location | Value | |||||||||||
| Foreign Currency Exchange Rate |
Forward Foreign Currency Exchange Contracts |
Unrealized appreciation on forward foreign currency exchange contracts |
$ | 69,753 | Unrealized depreciation on forward foreign currency exchange contracts |
$ | — | |||||||
| Interest Rate |
Futures Contracts |
Deposits with brokers for open futures contracts and Receivable for variation margin on futures contracts* |
17,505 | Deposits with brokers for open futures contracts and Receivable for variation margin on futures contracts* |
2,273 | |||||||||
| Credit |
Swaps | Unrealized appreciation on credit default swaps** |
249,179 | Unrealized depreciation on credit default swaps** |
— | |||||||||
| Interest Rate |
Swaps | Unrealized appreciation on interest rate swaps** |
— | Unrealized depreciation on interest rate swaps** |
333,245 | |||||||||
| Total |
$ | 336,438 | $ | 335,518 | ||||||||||
| * | Value represents cumulative gross unrealized appreciation (depreciation) of futures contracts as reported in the Fund’s Portfolio of Investments, and not the deposits with brokers, if any, or the receivable or payable for variation margin presented on the Statement of Assets and Liabilities. |
| ** | Value represents cumulative gross unrealized appreciation (depreciation) of swap contracts as reported in the Fund’s Portfolio of Investments. |
| 156 | Nuveen Investments |
| Intermediate Government Bond | ||||||||||||||
| Location on the Statements of Assets and Liabilities | ||||||||||||||
| Underlying Risk Exposure |
Derivative Instrument |
Asset Derivatives | Liability Derivatives | |||||||||||
| Location | Value | Location | Value | |||||||||||
| Interest Rate |
Futures Contracts |
Deposits with brokers for open futures contracts and Receivable for variation margin on futures contracts* |
$ | 90,610 | Deposits with brokers for open futures contracts and Receivable for variation margin on futures contracts* |
$ | — | |||||||
| Intermediate Term Bond | ||||||||||||||
| Location on the Statements of Assets and Liabilities | ||||||||||||||
| Underlying Risk Exposure |
Derivative Instrument |
Asset Derivatives | Liability Derivatives | |||||||||||
| Location | Value | Location | Value | |||||||||||
| Interest Rate |
Futures Contracts |
Deposits with brokers for open futures contracts and Receivable for variation margin on futures contracts* |
$ | 169,530 | Deposits with brokers for open futures contracts and Payable for variation margin on futures contracts* |
$ | 253,552 | |||||||
| Interest Rate |
Swaps | Unrealized appreciation on interest rate swaps** |
— | Unrealized depreciation on interest rate swaps** |
1,565,071 | |||||||||
| Total |
$ | 169,530 | $ | 1,818,623 | ||||||||||
| Short Term Bond | ||||||||||||||
| Location on the Statements of Assets and Liabilities | ||||||||||||||
| Underlying Risk Exposure |
Derivative Instrument |
Asset Derivatives | Liability Derivatives | |||||||||||
| Location | Value | Location | Value | |||||||||||
| Foreign Currency Exchange Rate |
Forward Foreign Currency Exchange Contracts |
Unrealized appreciation on forward foreign currency exchange contracts |
$ | 146,966 | Unrealized depreciation on forward foreign currency exchange contracts |
$ | 106,798 | |||||||
| Interest Rate |
Futures Contracts |
Deposits with brokers for open futures contracts and Receivable for variation margin on futures contracts* |
— | Deposits with brokers for open futures contracts and Payable for variation margin on futures contracts* |
434,425 | |||||||||
| Interest Rate |
Swaps | Unrealized appreciation on interest rate swaps** |
— | Unrealized depreciation on interest rate swaps** |
1,092,412 | |||||||||
| Total |
$ | 146,966 | $ | 1,633,635 | ||||||||||
| Total Return Bond | ||||||||||||||
| Location on the Statements of Assets Liabilities | ||||||||||||||
| Underlying Risk Exposure |
Derivative Instrument |
Asset Derivatives | Liability Derivatives | |||||||||||
| Location | Value | Location | Value | |||||||||||
| Foreign Currency Exchange Rate |
Forward Foreign Currency Exchange Contracts |
Unrealized appreciation on forward foreign currency exchange contracts |
$ | 915,069 | Unrealized deppreciation on forward foreign currency exchange contracts |
$ | 434,498 | |||||||
| Interest Rate |
Futures Contracts |
Deposits with brokers for open futures contracts and Receivable for variation margin on futures contracts* |
— | Deposits with brokers for open futures contracts and Payable for variation margin on futures contracts* |
470,692 | |||||||||
| Interest Rate |
Options | Options purchased, at value | 70,641 | — | — | |||||||||
| Credit |
Swaps | Unrealized appreciation on credit default swaps** |
740,095 | Unrealized depreciation on credit default swaps** |
— | |||||||||
| Interest Rate |
Swaps | Unrealized appreciation on interest rate swaps** |
60,182 | Unrealized depreciation on interest rate swaps** |
2,030,848 | |||||||||
| Total |
$ | 1,785,987 | $ | 2,936,038 | ||||||||||
| * | Value represents cumulative gross unrealized appreciation (depreciation) of futures contracts as reported in the Fund’s Portfolio of Investments, and not the deposits with brokers, if any, or the receivable or payable for variation margin presented on the Statement of Assets and Liabilities. |
| ** | Value represents cumulative gross unrealized appreciation (depreciation) of swap contracts as reported in the Fund’s Portfolio of Investments. |
| Nuveen Investments | 157 |
Notes to Financial Statements (Unaudited) (continued)
The following tables present the amount of net realized gain (loss) and change in net unrealized appreciation (depreciation) recognized for the six months ended December 31, 2011, on derivative instruments, as well as the primary risk exposure associated with each.
| Net Realized Gain (Loss) from Forward Foreign Currency Exchange Contracts | Inflation Protected Securities |
Short Term Bond |
Total Return Bond |
|||||||||
| Risk Exposure |
||||||||||||
| Foreign Currency Exchange Rate |
$ | (30,640 | ) | $ | (442,249 | ) | $ | (2,232,173 | ) | |||
| Net Realized Gain (Loss) from Futures Contracts |
Core Bond | Global Total Return Bond |
High Income Bond |
Inflation Protected Securities |
Intermediate Government Bond |
Intermediate Term Bond |
Short Term Bond |
Total Return Bond |
||||||||||||||||||||||||
| Risk Exposure |
||||||||||||||||||||||||||||||||
| Interest Rate |
$ | (6,034,026 | ) | $ | (4,429 | ) | $ | (76,238 | ) | $ | (194,721 | ) | $ | 519,404 | $ | (604,919 | ) | $ | (6,302,279 | ) | $ | (5,751,591 | ) | |||||||||
| Foreign Currency Exchange Rate |
— | 14,570 | — | (26,717 | ) | — | — | — | 227,268 | |||||||||||||||||||||||
| Total |
$ | (6,034,026 | ) | $ | 10,141 | $ | (76,238 | ) | $ | (221,438 | ) | $ | 519,404 | $ | (604,919 | ) | $ | (6,302,279 | ) | $ | (5,524,323 | ) | ||||||||||
| Net Realized Gain (Loss) from Options Purchased | Global Total Return Bond |
Total Return Bond |
||||||||
| Risk Exposure |
||||||||||
| Interest Rate |
$ | (3,281 | ) | $ | (1,075,687 | ) | ||||
| Net Realized Gain (Loss) from Options Written | Total Return Bond |
|||||||
| Risk Exposure |
||||||||
| Interest Rate |
$ | (321,084 | ) | |||||
| Net Realized Gain (Loss) from Swaps | Core Bond | Global Total Return Bond |
Inflation Protected Securities |
Intermediate Term Bond |
Short Term Bond |
Total Return Bond |
||||||||||||||||||
| Risk Exposure |
||||||||||||||||||||||||
| Interest Rate |
$ | (973,362 | ) | $ | — | $ | (112,925 | ) | $ | (568,526 | ) | $ | (446,130 | ) | $ | (321,541 | ) | |||||||
| Credit |
(166,703 | ) | 1,289 | (469,506 | ) | 91,412 | (1,555,884 | ) | (1,190,476 | ) | ||||||||||||||
| Total |
$ | (1,140,065 | ) | $ | 1,289 | $ | (582,431 | ) | $ | (477,114 | ) | $ | (2,002,014 | ) | $ | (1,512,017 | ) | |||||||
| Change in Net Unrealized Appreciation (Depreciation) of Forward Foreign Currency Exchange Contracts |
Global Total Return Bond |
Inflation Protected Securities |
Short Term Bond |
Total Return Bond |
||||||||||||
| Risk Exposure |
||||||||||||||||
| Foreign Currency Exchange Rate |
$ | (28,741 | ) | $ | 69,753 | $ | 132,990 | $ | 466,827 | |||||||
| Change in Net Unrealized Appreciation (Depreciation) of Futures Contracts |
Core Bond | Global Total Return Bond |
High Income Bond |
Inflation Protected Securities |
Intermediate Government Bond |
Intermediate Term Bond |
Short Term Bond |
Total Return Bond |
||||||||||||||||||||||||
| Risk Exposure |
||||||||||||||||||||||||||||||||
| Interest Rate |
$ | (1,146,984 | ) | $ | 433 | $ | 38,801 | $ | (54,651 | ) | $ | 100,934 | $ | (178,927 | ) | $ | 191,389 | $ | (624,324 | ) | ||||||||||||
| Foreign Currency Exchange Rate |
— | 18,451 | — | (6,483 | ) | — | — | — | (44,833 | ) | ||||||||||||||||||||||
| Total |
$ | (1,146,984 | ) | 18,884 | $ | 38,801 | $ | (61,134 | ) | $ | 100,934 | $ | (178,927 | ) | $ | 191,389 | $ | (669,157 | ) | |||||||||||||
| Change in Net Unrealized Appreciation (Depreciation) of Options Purchased | Global Total Return Bond |
Total Return Bond |
||||||
| Risk Exposure |
||||||||
| Interest Rate |
$ | (3,294 | ) | $ | (80,275 | ) | ||
| Change in Net Unrealized Appreciation (Depreciation) of Options Written | Total Return Bond |
|||
| Risk Exposure |
||||
| Interest Rate |
$ | (113,961 | ) | |
| 158 | Nuveen Investments |
| Change in Net Unrealized Appreciation (Depreciation) of Swaps |
Core Bond | Global Total Return Bond |
Inflation Protected Securities |
Intermediate Term Bond |
Short Term Bond |
Total Return Bond |
||||||||||||||||||
| Risk Exposure |
||||||||||||||||||||||||
| Interest Rate |
$ | (124,532 | ) | $ | — | $ | 249,347 | $ | (107,011 | ) | $ | (55,129 | ) | $ | (751,497 | ) | ||||||||
| Credit |
— | (2,191 | ) | (29,272 | ) | — | (453,310 | ) | 556,416 | |||||||||||||||
| Total |
$ | (124,532 | ) | $ | (2,191 | ) | $ | 220,075 | $ | (107,011 | ) | $ | (508,439 | ) | $ | (195,081 | ) | |||||||
4. Fund Shares
Transactions in Fund shares were as follows:
| Core Bond | ||||||||||||||||
| Six Months Ended 12/31/11 |
Year Ended 6/30/11 |
|||||||||||||||
| Shares | Amount | Shares | Amount | |||||||||||||
| Shares sold: |
||||||||||||||||
| Class A |
208,328 | $ | 2,383,330 | 739,911 | $ | 8,441,382 | ||||||||||
| Class B |
6,669 | 75,992 | 17,982 | 203,380 | ||||||||||||
| Class C |
67,863 | 771,894 | 86,233 | 978,077 | ||||||||||||
| Class R3(1) |
6,391 | 73,639 | 27,321 | 313,512 | ||||||||||||
| Class I(1) |
6,404,170 | 73,004,157 | 12,988,525 | 148,055,413 | ||||||||||||
| Shares issued to shareholders due to reinvestment of distributions: |
||||||||||||||||
| Class A |
110,020 | 1,258,357 | 225,186 | 2,576,357 | ||||||||||||
| Class B |
1,973 | 22,362 | 6,385 | 72,353 | ||||||||||||
| Class C |
4,012 | 45,689 | 7,578 | 86,359 | ||||||||||||
| Class R3(1) |
558 | 6,420 | 1,436 | 16,511 | ||||||||||||
| Class I(1) |
442,996 | 5,065,995 | 1,180,846 | 13,504,298 | ||||||||||||
| 7,252,980 | 82,707,835 | 15,281,403 | 174,247,642 | |||||||||||||
| Shares redeemed: |
||||||||||||||||
| Class A |
(599,799 | ) | (6,858,923 | ) | (1,775,546 | ) | (20,295,173 | ) | ||||||||
| Class B |
(42,119 | ) | (479,271 | ) | (189,658 | ) | (2,141,012 | ) | ||||||||
| Class C |
(39,386 | ) | (449,515 | ) | (107,908 | ) | (1,228,683 | ) | ||||||||
| Class R3(1) |
(7,532 | ) | (86,568 | ) | (29,374 | ) | (338,082 | ) | ||||||||
| Class I(1) |
(15,723,971 | ) | (179,789,270 | ) | (38,436,240 | ) | (438,887,826 | ) | ||||||||
| (16,412,807 | ) | (187,663,547 | ) | (40,538,726 | ) | (462,890,776 | ) | |||||||||
| Net increase (decrease) |
(9,159,827 | ) | $ | (104,955,712 | ) | (25,257,323 | ) | $ | (288,643,134 | ) | ||||||
| (1) | – Effective January 18, 2011, Class R Shares and Class Y Shares previously offered by FAF Advisors, Inc. were renamed Class R3 Shares and Class I Shares, respectively. |
| Global Total Return Bond | ||||||||||||
| For the period 12/02/11 (commencement of operations) through 12/31/11 |
||||||||||||
| Shares | Amount | |||||||||||
| Shares sold: |
||||||||||||
| Class A |
2,500 | $ | 50,000 | |||||||||
| Class C |
2,500 | 50,000 | ||||||||||
| Class R3 |
2,500 | 50,000 | ||||||||||
| Class I |
692,500 | 13,850,000 | ||||||||||
| Shares issued to shareholders due to reinvestment of distributions: |
||||||||||||
| Class A |
— | — | ||||||||||
| Class C |
— | — | ||||||||||
| Class R3 |
— | — | ||||||||||
| Class I |
— | — | ||||||||||
| 700,000 | 14,000,000 | |||||||||||
| Shares redeemed: |
||||||||||||
| Class A |
— | — | ||||||||||
| Class C |
— | — | ||||||||||
| Class R3 |
— | — | ||||||||||
| Class I |
— | — | ||||||||||
| — | — | |||||||||||
| Net increase (decrease) |
700,000 | $ | 14,000,000 | |||||||||
| Nuveen Investments | 159 |
Notes to Financial Statements (Unaudited) (continued)
| High Income Bond | ||||||||||||||||
| Six Months Ended 12/31/11 |
Year Ended 6/30/11 |
|||||||||||||||
| Shares | Amount | Shares | Amount | |||||||||||||
| Shares issued from merger(2) |
||||||||||||||||
| Class A |
4,133,109 | $ | 36,940,257 | — | $ | — | ||||||||||
| Class B |
163,999 | 1,644,945 | — | — | ||||||||||||
| Class C |
4,108,173 | 36,561,493 | — | — | ||||||||||||
| Class R3(1) |
19,055 | 173,005 | — | — | ||||||||||||
| Class I(1) |
3,904,626 | 34,315,947 | — | — | ||||||||||||
| Shares sold: |
||||||||||||||||
| Class A |
4,583,508 | 38,563,407 | 1,650,992 | 14,838,874 | ||||||||||||
| Class B |
1,383 | 11,776 | 19,049 | 169,668 | ||||||||||||
| Class C |
255,852 | 2,165,138 | 389,589 | 3,433,409 | ||||||||||||
| Class R3 |
3,018 | 25,773 | 13,462 | 120,809 | ||||||||||||
| Class I |
7,405,865 | 63,261,480 | 23,259,633 | 207,460,114 | ||||||||||||
| Shares issued to shareholders due to reinvestment of distributions: |
||||||||||||||||
| Class A |
196,966 | 1,651,141 | 176,972 | 1,585,996 | ||||||||||||
| Class B |
5,551 | 46,353 | 8,949 | 79,362 | ||||||||||||
| Class C |
69,669 | 579,979 | 34,726 | 309,592 | ||||||||||||
| Class R3(1) |
502 | 4,323 | 1,322 | 12,042 | ||||||||||||
| Class I(1) |
317,262 | 2,672,364 | 418,652 | 3,767,847 | ||||||||||||
| 25,168,538 | 218,617,381 | 25,973,346 | 231,777,713 | |||||||||||||
| Shares redeemed: |
||||||||||||||||
| Class A |
(1,676,251 | ) | (14,256,393 | ) | (1,968,596 | ) | (17,662,560 | ) | ||||||||
| Class B |
(37,703 | ) | (318,262 | ) | (82,748 | ) | (738,327 | ) | ||||||||
| Class C |
(299,966 | ) | (2,505,769 | ) | (182,453 | ) | (1,639,458 | ) | ||||||||
| Class R3(1) |
(5,917 | ) | (50,868 | ) | (21,956 | ) | (199,270 | ) | ||||||||
| Class I(1) |
(11,968,190 | ) | (101,387,507 | ) | (15,012,748 | ) | (135,161,862 | ) | ||||||||
| (13,988,027 | ) | (118,518,799 | ) | (17,268,501 | ) | (155,401,477 | ) | |||||||||
| Net increase (decrease) |
11,180,511 | $ | 100,098,582 | 8,704,845 | $ | 76,376,236 | ||||||||||
| Inflation Protected Securities | ||||||||||||||||
| Six Months Ended 12/31/11 |
Year Ended 6/30/11 |
|||||||||||||||
| Shares | Amount | Shares | Amount | |||||||||||||
| Shares sold: |
||||||||||||||||
| Class A |
464,048 | $ | 5,329,653 | 767,899 | $ | 8,151,301 | ||||||||||
| Class C |
114,867 | 1,314,267 | 361,379 | 3,784,383 | ||||||||||||
| Class R3(1) |
7,525 | 85,777 | 11,683 | 120,988 | ||||||||||||
| Class I(1) |
6,447,610 | 73,958,637 | 13,307,322 | 141,165,603 | ||||||||||||
| Shares issued to shareholders due to reinvestment of distributions: |
||||||||||||||||
| Class A |
21,416 | 245,904 | 9,307 | 98,001 | ||||||||||||
| Class C |
7,842 | 89,365 | 3,791 | 39,158 | ||||||||||||
| Class R3(1) |
149 | 1,695 | 787 | 8,126 | ||||||||||||
| Class I(1) |
33,854 | 390,206 | 32,413 | 342,097 | ||||||||||||
| 7,097,311 | 81,415,504 | 14,494,581 | 153,709,657 | |||||||||||||
| Shares redeemed: |
||||||||||||||||
| Class A |
(389,146 | ) | (4,435,242 | ) | (437,134 | ) | (4,664,545 | ) | ||||||||
| Class C |
(167,228 | ) | (1,882,628 | ) | (274,364 | ) | (2,898,304 | ) | ||||||||
| Class R3(1) |
(344 | ) | (3,855 | ) | (138,661 | ) | (1,499,576 | ) | ||||||||
| Class I(1) |
(4,233,856 | ) | (48,826,002 | ) | (5,230,534 | ) | (55,702,040 | ) | ||||||||
| (4,790,574 | ) | (55,147,727 | ) | (6,080,693 | ) | (64,764,465 | ) | |||||||||
| Net increase (decrease) |
2,306,737 | $ | 26,267,777 | 8,413,888 | $ | 88,945,192 | ||||||||||
| (1) | – Effective January 18, 2011, Class R Shares and Class Y Shares previously offered by FAF Advisors, Inc. were renamed Class R3 Shares and Class I Shares, respectively. |
| (2) | – Refer to Footnote 8 – Fund Mergers for further details. |
| 160 | Nuveen Investments |
| Intermediate Government Bond | ||||||||||||||||
| Six Months Ended 12/31/11 |
Year Ended 6/30/11 |
|||||||||||||||
| Shares | Amount | Shares | Amount | |||||||||||||
| Shares sold: |
||||||||||||||||
| Class A |
64,275 | $ | 575,180 | 173,561 | $ | 1,525,111 | ||||||||||
| Class C |
3,433 | 30,823 | 12,516 | 110,627 | ||||||||||||
| Class R3(1) |
11,157 | 100,179 | 19,974 | 176,060 | ||||||||||||
| Class I(1) |
683,028 | 6,122,957 | 3,520,661 | 31,232,348 | ||||||||||||
| Shares issued to shareholders due to reinvestment of distributions: |
||||||||||||||||
| Class A |
13,906 | 124,736 | 36,212 | 319,580 | ||||||||||||
| Class C |
775 | 6,959 | 1,965 | 17,345 | ||||||||||||
| Class R3(1) |
497 | 4,458 | 1,094 | 9,648 | ||||||||||||
| Class I(1) |
34,600 | 310,483 | 120,943 | 1,069,967 | ||||||||||||
| 811,671 | 7,275,775 | 3,886,926 | 34,460,686 | |||||||||||||
| Shares redeemed: |
||||||||||||||||
| Class A |
(147,691 | ) | (1,321,614 | ) | (783,079 | ) | (6,899,469 | ) | ||||||||
| Class C |
(24,259 | ) | (217,333 | ) | (75,320 | ) | (662,950 | ) | ||||||||
| Class R3(1) |
(6,043 | ) | (54,133 | ) | (41,853 | ) | (367,926 | ) | ||||||||
| Class I(1) |
(1,632,302 | ) | (14,630,071 | ) | (9,789,951 | ) | (86,411,851 | ) | ||||||||
| (1,810,295 | ) | (16,223,151 | ) | (10,690,203 | ) | (94,342,196 | ) | |||||||||
| Net increase (decrease) |
(998,624 | ) | $ | (8,947,376 | ) | (6,803,277 | ) | $ | (59,881,510 | ) | ||||||
| Intermediate Term Bond | ||||||||||||||||
| Six Months Ended 12/31/11 |
Year Ended 6/30/11 |
|||||||||||||||
| Shares | Amount | Shares | Amount | |||||||||||||
| Shares sold: |
||||||||||||||||
| Class A |
104,569 | $ | 1,096,015 | 235,816 | $ | 2,473,051 | ||||||||||
| Class C |
40,709 | 425,821 | 110,331 | 1,158,886 | ||||||||||||
| Class I(1) |
8,154,702 | 84,994,642 | 14,005,870 | 146,339,922 | ||||||||||||
| Shares issued to shareholders due to reinvestment of distributions: |
||||||||||||||||
| Class A |
27,638 | 290,370 | 60,797 | 637,739 | ||||||||||||
| Class C |
75 | 785 | 12 | 124 | ||||||||||||
| Class I(1) |
228,886 | 2,392,623 | 542,928 | 5,673,065 | ||||||||||||
| 8,556,579 | 89,200,256 | 14,955,754 | 156,282,787 | |||||||||||||
| Shares redeemed: |
||||||||||||||||
| Class A |
(258,388 | ) | (2,715,767 | ) | (697,452 | ) | (7,294,394 | ) | ||||||||
| Class C |
(67,204 | ) | (711,690 | ) | — | — | ||||||||||
| Class I(1) |
(10,280,599 | ) | (107,436,759 | ) | (22,971,286 | ) | (239,504,629 | ) | ||||||||
| (10,606,191 | ) | (110,864,216 | ) | (23,668,738 | ) | (246,799,023 | ) | |||||||||
| Net increase (decrease) |
(2,049,612 | ) | $ | (21,663,960 | ) | (8,712,984 | ) | $ | (90,516,236 | ) | ||||||
| (1) | – Effective January 18, 2011, Class R Shares and Class Y Shares previously offered by FAF Advisors, Inc. were renamed Class R3 Shares and Class I Shares, respectively. |
| Nuveen Investments | 161 |
Notes to Financial Statements (Unaudited) (continued)
| Short Term Bond | ||||||||||||||||
| Six Months Ended 12/31/11 |
Year Ended 6/30/11 |
|||||||||||||||
| Shares | Amount | Shares | Amount | |||||||||||||
| Shares issued from merger(2) |
||||||||||||||||
| Class A |
6,085,212 | $ | 59,955,688 | — | $ | — | ||||||||||
| Class C |
4,652,151 | 46,466,144 | — | — | ||||||||||||
| Class R3(1) |
50,150 | 480,596 | — | — | ||||||||||||
| Class I(1) |
4,827,535 | 48,082,879 | — | — | ||||||||||||
| Shares sold: |
||||||||||||||||
| Class A |
379,021 | 3,770,282 | 1,655,986 | 16,621,982 | ||||||||||||
| Class C |
216,701 | 2,161,433 | 372,306 | 3,743,761 | ||||||||||||
| Class R3(1) |
3,351 | 32,985 | — | — | ||||||||||||
| Class I(1) |
10,404,187 | 103,312,096 | 50,235,884 | 504,500,225 | ||||||||||||
| Shares issued to shareholders due to reinvestment of distributions: |
||||||||||||||||
| Class A |
89,766 | 887,553 | 146,493 | 1,472,256 | ||||||||||||
| Class C |
10,119 | 99,900 | 4,431 | 44,644 | ||||||||||||
| Class I |
168,922 | 1,671,384 | 337,451 | 3,393,367 | ||||||||||||
| 26,887,115 | 266,920,940 | 52,752,551 | 529,776,235 | |||||||||||||
| Shares redeemed: |
||||||||||||||||
| Class A |
(1,530,809 | ) | (15,149,198 | ) | (2,540,178 | ) | (25,519,931 | ) | ||||||||
| Class C |
(518,333 | ) | (5,118,215 | ) | (181,937 | ) | (1,831,766 | ) | ||||||||
| Class R3(1) |
(4,905 | ) | (48,167 | ) | — | — | ||||||||||
| Class I(1) |
(25,336,978 | ) | (250,536,927 | ) | (39,873,032 | ) | (400,639,021 | ) | ||||||||
| (27,391,025 | ) | (270,852,507 | ) | (42,595,147 | ) | (427,990,718 | ) | |||||||||
| Net increase (decrease) |
(503,910 | ) | $ | (3,931,567 | ) | 10,157,404 | $ | 101,785,517 | ||||||||
| Total Return Bond | ||||||||||||||||
| Six Months Ended 12/31/11 |
Year Ended 6/30/11 |
|||||||||||||||
| Shares | Amount | Shares | Amount | |||||||||||||
| Shares issued from merger(2) |
||||||||||||||||
| Class A |
2,657,808 | $ | 26,954,561 | — | $ | — | ||||||||||
| Class B |
147,656 | 1,393,443 | — | — | ||||||||||||
| Class C |
2,026,122 | 20,633,330 | — | — | ||||||||||||
| Class R3(1) |
7,780 | 71,989 | — | — | ||||||||||||
| Class I(1) |
2,831,674 | 29,991,319 | — | — | ||||||||||||
| Shares sold: |
||||||||||||||||
| Class A |
480,448 | 5,059,928 | 1,109,596 | 11,696,584 | ||||||||||||
| Class B |
12,551 | 133,330 | 10,094 | 106,218 | ||||||||||||
| Class C |
234,124 | 2,440,934 | 254,294 | 2,677,654 | ||||||||||||
| Class R3(1) |
33,662 | 354,432 | 74,411 | 795,061 | ||||||||||||
| Class I(1) |
4,706,308 | 49,716,952 | 11,952,101 | 126,639,104 | ||||||||||||
| Shares issued to shareholders due to reinvestment of distributions: |
||||||||||||||||
| Class A |
47,532 | 500,052 | 81,898 | 871,022 | ||||||||||||
| Class B |
1,927 | 20,149 | 3,730 | 39,447 | ||||||||||||
| Class C |
15,435 | 161,017 | 15,785 | 166,894 | ||||||||||||
| Class R3(1) |
1,942 | 20,543 | 3,372 | 36,067 | ||||||||||||
| Class I(1) |
319,959 | 3,371,437 | 694,381 | 7,382,267 | ||||||||||||
| 13,524,928 | 140,823,416 | 14,199,662 | 150,410,318 | |||||||||||||
| Shares redeemed: |
||||||||||||||||
| Class A |
(418,389 | ) | (4,391,387 | ) | (1,597,754 | ) | (17,009,324 | ) | ||||||||
| Class B |
(38,657 | ) | (407,507 | ) | (47,459 | ) | (502,827 | ) | ||||||||
| Class C |
(208,332 | ) | (2,168,868 | ) | (171,781 | ) | (1,812,198 | ) | ||||||||
| Class R3(1) |
(20,709 | ) | (216,756 | ) | (41,363 | ) | (443,188 | ) | ||||||||
| Class I(1) |
(10,945,794 | ) | (115,096,951 | ) | (19,091,253 | ) | (202,625,375 | ) | ||||||||
| (11,631,881 | ) | (122,281,469 | ) | (20,949,610 | ) | (222,392,912 | ) | |||||||||
| Net increase (decrease) |
1,893,047 | $ | 18,541,947 | (6,749,948 | ) | $ | (71,982,594 | ) | ||||||||
| (1) | – Effective January 18, 2011, Class R Shares and Class Y Shares previously offered by FAF Advisors, Inc. were renamed Class R3 Shares and Class I Shares, respectively. |
| (2) | – Refer to Footnote 8 – Fund Mergers for further details. |
| 162 | Nuveen Investments |
Class B Shares converted to Class A Shares (recognized as a component of as Class A Shares issued and Class B Shares redeemed) during the six months ended December 31, 2011 and fiscal year ended June 30, 2011, were as follows:
| Fund | Year Ended 12/31/11 |
Year Ended 6/30/11 |
||||||
| Core Bond |
29,291 | 134,013 | ||||||
| High Income Bond |
23,611 | 65,846 | ||||||
| Total Return Bond |
14,486 | 35,392 | ||||||
5. Investment Transactions
Purchases and sales (including maturities but excluding short-term investments, derivative and dollar roll transactions, where applicable) during the six months ended December 31, 2011, were as follows:
| Core Bond | Global Total Return Bond |
High Income Bond |
Inflation Protected Securities |
|||||||||||||
| Purchases: |
||||||||||||||||
| Investment securities |
$ | 110,347,655 | $ | 10,398,314 | $ | 243,371,036 | $ | 4,297,953 | ||||||||
| U.S. Government and agency obligations |
409,405,920 | 4,853,502 | 62,479 | 76,838,699 | ||||||||||||
| Sales and maturities: |
||||||||||||||||
| Investment securities |
214,592,960 | 31,253 | 147,828,282 | 8,941,983 | ||||||||||||
| U.S. Government and agency obligations |
451,431,493 | 1,758,830 | 10,106 | 49,801,136 | ||||||||||||
| Intermediate Government Bond |
Intermediate Term Bond |
Short Term Bond |
Total Return Bond |
|||||||||||||
| Purchases: |
||||||||||||||||
| Investment securities |
$ | 3,822,061 | $ | 57,447,384 | $ | 117,903,489 | $ | 177,474,411 | ||||||||
| U.S. Government and agency obligations |
39,475,325 | 60,050,421 | 3,075,037 | 671,958,218 | ||||||||||||
| Sales and maturities: |
||||||||||||||||
| Investment securities |
711,013 | 101,790,207 | 91,731,592 | 139,325,631 | ||||||||||||
| U.S. Government and agency obligations |
45,038,601 | 31,180,889 | 37,156,726 | 714,939,302 | ||||||||||||
Transactions in options written for Total Return Bond during the six months ended December 31, 2011, were as follows:
| Total Return Bond | ||||||||
| Number of Contracts |
Premiums Received |
|||||||
| Outstanding, beginning of period |
911 | $ | 410,821 | |||||
| Options written |
— | — | ||||||
| Options terminated in closing purchase transactions |
(650 | ) | (316,172 | ) | ||||
| Options expired |
(261 | ) | (94,649 | ) | ||||
| Outstanding, end of period |
— | $ | — | |||||
6. Income Tax Information
The following information is presented on an income tax basis. Differences between amounts for financial statement and federal income tax purposes are primarily due to timing differences in recognizing certain gains and losses on investment transactions. To the extent that differences arise that are permanent in nature, such amounts are reclassified within the capital accounts as detailed below. Temporary differences do not require reclassification. Temporary and permanent differences do not impact the net asset values of the Funds.
At December 31, 2011, the cost and unrealized appreciation (depreciation) of investments (excluding investments in derivatives, where applicable), as determined on a federal income tax basis, were as follows:
| Core Bond | Global Total Return Bond |
High Income Bond |
Inflation Protected Securities |
|||||||||||||
| Cost of investments |
$ | 1,201,658,506 | $ | 16,603,802 | $ | 718,669,872 | $ | 402,050,460 | ||||||||
| Gross unrealized: |
||||||||||||||||
| Appreciation |
45,243,647 | 89,560 | 8,799,538 | 26,352,404 | ||||||||||||
| Depreciation |
(18,902,597 | ) | (117,945 | ) | (37,400,170 | ) | (1,121,135 | ) | ||||||||
| Net unrealized appreciation (depreciation) of investments |
$ | 26,341,050 | $ | (28,385 | ) | $ | (28,600,632 | ) | $ | 25,231,269 | ||||||
| Nuveen Investments | 163 |
Notes to Financial Statements (Unaudited) (continued)
| Intermediate Government Bond |
Intermediate Term Bond |
Short Term Bond |
Total Return Bond |
|||||||||||||
| Cost of investments |
$ | 136,633,242 | $ | 776,421,993 | $ | 888,076,727 | $ | 779,815,935 | ||||||||
| Gross unrealized: |
||||||||||||||||
| Appreciation |
4,400,456 | 26,486,664 | 10,816,508 | 29,343,636 | ||||||||||||
| Depreciation |
(644,977 | ) | (4,118,022 | ) | (11,806,147 | ) | (21,330,670 | ) | ||||||||
| Net unrealized appreciation (depreciation) of investments |
$ | 3,755,479 | $ | 22,368,642 | $ | (989,639 | ) | $ | 8,012,966 | |||||||
Permanent differences, primarily due to tax equalization, treatment of notional principal contracts, paydown adjustments and foreign currency reclassifications resulted in reclassifications among the Funds’ components of net assets at June 30, 2011, the Funds’ last tax year-end, as follows:
| Core Bond | High Income Bond |
Inflation Protected Securities |
Intermediate Government Bond |
|||||||||||||
| Capital paid-in |
$ | — | $ | 244,442 | $ | — | $ | — | ||||||||
| Undistributed (Over-distribution of) net investment income |
(1,368,462 | ) | 218 | (63,438 | ) | 225,507 | ||||||||||
| Accumulated net realized gain (loss) |
1,368,462 | (244,660 | ) | 63,438 | (225,507 | ) | ||||||||||
| Intermediate Term Bond |
Short Term Bond |
Total Return Bond |
||||||||||
| Capital paid-in |
$ | 17 | $ | — | $ | — | ||||||
| Undistributed (Over-distribution of) net investment income |
(526,425 | ) | (419,418 | ) | 2,088,541 | |||||||
| Accumulated net realized gain (loss) |
526,408 | 419,418 | (2,088,541 | ) | ||||||||
The tax components of undistributed net ordinary income and net long-term capital gains at June 30, 2011, the Funds’ last tax year end, were as follows:
| Core Bond | High Income Bond |
Inflation Protected Securities |
Intermediate Government Bond |
|||||||||||||
| Undistributed net ordinary income* |
$ | 4,719,687 | $ | 3,614,554 | $ | 5,662,150 | $ | 226,759 | ||||||||
| Undistributed net long-term capital gains |
— | 1,923,108 | — | — | ||||||||||||
| Intermediate Term Bond |
Short Term Bond |
Total Return Bond |
||||||||||
| Undistributed net ordinary income* |
$ | 1,761,699 | $ | 2,756,208 | $ | 7,134,935 | ||||||
| Undistributed net long-term capital gains |
— | — | — | |||||||||
| * | Net ordinary income consists of net taxable income derived from dividends, interest and net short-term capital gains, if any. |
The tax character of distributions paid during the Funds’ last tax year ended June 30, 2011, was designated for purposes of the dividends paid deduction as follows:
| 2011 | Core Bond | High Income Bond |
Inflation Protected Securities |
Intermediate Government Bond |
||||||||||||
| Distributions from net ordinary income* |
$ | 45,495,506 | $ | 35,278,315 | $ | 3,515,936 | $ | 3,252,733 | ||||||||
| Distributions from net long-term capital gains |
— | — | — | — | ||||||||||||
| Return of capital |
— | — | — | — | ||||||||||||
| 2011 | Intermediate Term Bond |
Short Term Bond |
Total Return Bond |
|||||||||
| Distributions from net ordinary income* |
$ | 24,424,866 | $ | 17,805,924 | $ | 28,966,679 | ||||||
| Distributions from net long-term capital gains |
— | — | — | |||||||||
| Return of capital |
— | — | — | |||||||||
| * | Net ordinary income consists of net taxable income derived from dividends, interest and net short-term capital gains, if any. |
| 164 | Nuveen Investments |
At June 30, 2011, the Funds’ last tax year end, the following Funds had unused capital loss carryforwards available for federal income tax purposes to be applied against future capital gains, if any. If not applied, the carryforwards will expire as follows:
| Core Bond | Inflation Protected Securities |
Intermediate Government Bond |
Intermediate Term Bond |
Short Term Bond |
Total Return Bond |
|||||||||||||||||||
| Expiration: |
||||||||||||||||||||||||
| June 30, 2014 |
$ | — | $ | — | $ | — | $ | — | $ | 7,244,909 | $ | — | ||||||||||||
| June 30, 2015 |
— | 1,565,360 | — | — | 7,432,482 | — | ||||||||||||||||||
| June 30, 2016 |
— | 952,769 | — | — | — | — | ||||||||||||||||||
| June 30, 2017 |
— | 4,724,054 | 10,454,040 | — | 839,454 | 20,481,259 | ||||||||||||||||||
| June 30, 2018 |
8,449,828 | 2,806,865 | — | 1,696,796 | 2,980,195 | 37,557,087 | ||||||||||||||||||
| Total |
$ | 8,449,828 | $ | 10,049,048 | $ | 10,454,040 | $ | 1,696,796 | $ | 18,497,040 | $ | 58,038,346 | ||||||||||||
During the Funds’ last tax year ended June 30, 2011, the Funds utilized their capital loss carryforwards as follows:
| Core Bond | High Income Bond |
Inflation Protected Securities |
Intermediate Government Bond |
|||||||||||||
| Utilized capital loss carryforwards |
$ | 34,779,441 | $ | 23,649,613 | $ | 4,618,822 | $ | 1,465,221 | ||||||||
| Intermediate Term Bond |
Short Term Bond |
Total Return Bond |
||||||||||
| Utilized capital loss carryforwards |
$ | 18,350,868 | $ | 2,171,281 | $ | 20,820,521 | ||||||
7. Management Fees and Other Transactions with Affiliates
Each Fund’s management fee consists of two components – a fund-level fee, based only on the amount of assets within each individual Fund, and a complex-level fee, based on the aggregate amount of all eligible fund assets managed by the Adviser. This pricing structure enables Fund shareholders to benefit from growth in the assets within their Fund as well as from growth in the amount of complex-wide assets managed by the Adviser.
The annual fund-level fee for each Fund, payable monthly, is calculated according to the following schedule:
| Average Daily Net Assets | Core Bond Fund-Level Fee Rate |
Global Total Return Bond Fund-Level Fee Rate |
High Income Fund-Level |
Inflation Protected Securities Fund-Level Fee Rate |
Intermediate Government Bond Fund-Level Fee Rate |
Intermediate Term Bond Fund-Level Fee Rate |
Short Term Bond Fund-Level Fee Rate* |
Total Return Bond Fund-Level Fee Rate* |
||||||||||||||||||||||||
| For the first $125 million |
.4500 | % | .4000 | % | .6000 | % | .4500 | % | .4500 | % | .4500 | % | .3000 | % | .4500 | % | ||||||||||||||||
| For the next $125 million |
.4375 | .3875 | .5875 | .4375 | .4375 | .4375 | .2875 | .4375 | ||||||||||||||||||||||||
| For the next $250 million |
.4250 | .3750 | .5750 | .4250 | .4250 | .4250 | .2750 | .4250 | ||||||||||||||||||||||||
| For the next $500 million |
.4125 | .3625 | .5625 | .4125 | .4125 | .4125 | .2625 | .4125 | ||||||||||||||||||||||||
| For the next $1 billion |
.4000 | .3500 | .5500 | .4000 | .4000 | .4000 | .2500 | .4000 | ||||||||||||||||||||||||
| For net assets over $2 billion |
.3750 | .3250 | .5250 | .3750 | .3750 | .3750 | .2250 | .3750 | ||||||||||||||||||||||||
| * | Annual fund-level fee rate effective for the period July 1, 2011 through October 30, 2011. |
Effective October 31, 2011, the annual fund-level for the following Funds, payable monthly, is calculated according to the following schedule:
| Average Daily Net Assets | High Income Fund-Level |
Short Term Bond Fund-Level Fee Rate |
Total Return Fund-Level |
|||||||||
| For the first $125 million |
.5000 | % | .2800 | % | .3600 | % | ||||||
| For the next $125 million |
.4875 | .2675 | .3475 | |||||||||
| For the next $250 million |
.4750 | .2550 | .3350 | |||||||||
| For the next $500 million |
.4625 | .2425 | .3225 | |||||||||
| For the next $1 billion |
.4500 | .2300 | .3100 | |||||||||
| For net assets over $2 billion |
.4250 | .2050 | .2850 | |||||||||
| Nuveen Investments | 165 |
Notes to Financial Statements (Unaudited) (continued)
The annual complex-level fee for each Fund, payable monthly, is determined by taking the complex-level fee rate, which is based on the aggregate amount of “eligible assets” of all Nuveen funds as set forth in the schedule below, and making, as appropriate, an upward adjustment to that rate based upon the percentage of the particular fund’s assets that are not “eligible assets.” The complex-level fee schedule for each Fund is as follows:
| Complex-Level Asset Breakpoint Level* | Effective Rate at Breakpoint Level | |||
| $55 billion |
.2000 | % | ||
| $56 billion |
.1996 | |||
| $57 billion |
.1989 | |||
| $60 billion |
.1961 | |||
| $63 billion |
.1931 | |||
| $66 billion |
.1900 | |||
| $71 billion |
.1851 | |||
| $76 billion |
.1806 | |||
| $80 billion |
.1773 | |||
| $91 billion |
.1691 | |||
| $125 billion |
.1599 | |||
| $200 billion |
.1505 | |||
| $250 billion |
.1469 | |||
| $300 billion |
.1445 | |||
| * | The complex-level fee is calculated based upon the aggregate daily “eligible assets” of all Nuveen Funds. Eligible assets do not include assets attributable to investments in other Nuveen Funds or assets in excess of $2 billion added to the Nuveen Fund complex in connection with the Adviser’s assumption of the management of the former First American Funds effective January 1, 2011. Eligible assets include closed-end fund assets managed by the Adviser that are attributable to financial leverage. For these purposes, financial leverage includes the closed-end funds’ use of preferred stock and borrowings and investments in the residual interest certificates (also called inverse floating rate securities) in tender option bond (TOB) trusts, including the portion of assets held by the TOB trust that has been effectively financed by the trust’s issuance of floating rate securities, subject to an agreement by the Adviser as to certain funds to limit the amount of such assets for determining eligible assets in certain circumstances. |
| As of December 31, 2011, the complex-level fee rate for each Fund was as follows: |
| Fund | Complex-Level Fee Rate |
|||
| Core Bond |
.2000 | % | ||
| Global Total Return Bond |
.1767 | |||
| High Income Bond |
.1949 | |||
| Inflation Protected Securities |
.1898 | |||
| Intermediate Government Bond |
.2000 | |||
| Intermediate Term Bond |
.2000 | |||
| Short Term Bond |
.1978 | |||
| Total Return Bond |
.1982 | |||
The management fee compensates the Adviser for overall investment advisory and administrative services and general office facilities. The Adviser is responsible for each Fund’s overall strategy and asset allocations. The Adviser has entered into sub-advisory agreements with the Sub-Adviser under which the Sub-Adviser manages the investment portfolios of the Funds. The Sub-Adviser is compensated for its services to the Funds from the management fees paid to the Adviser.
During the period July 1, 2011 through October 30, 2011, the Adviser contractually agreed to waive fees and reimburse other Fund expenses of each Fund so that total annual Fund operating expenses, after fee waivers and/or expense reimbursements and excluding acquired Fund fees and expenses, did not exceed the average daily net assets of any class of Fund shares in the amounts and for the time periods stated in the following table:
| Core Bond | High Income Bond |
Inflation Protected Securities |
Intermediate Government Bond |
Intermediate Term Bond |
Short Term Bond |
Total Return Bond |
||||||||||||||||||||||
| Class A(1) |
.95 | % | 1.10 | % | .85 | % | .75 | % | .85 | % | .75 | % | .89 | % | ||||||||||||||
| Class B |
1.70 | 1.85 | N/A | N/A | N/A | N/A | 1.75 | |||||||||||||||||||||
| Class C |
1.70 | 1.85 | 1.60 | 1.60 | 1.70 | 1.60 | 1.75 | |||||||||||||||||||||
| Class R3(2) |
1.20 | 1.35 | 1.10 | 1.10 | N/A | 1.10 | 1.25 | |||||||||||||||||||||
| Class I |
.70 | .85 | .60 | .60 | .70 | .60 | .75 | |||||||||||||||||||||
| Expiration Date |
March 31, 2012 | March 31, 2012 | March 31, 2012 | March 31, 2012 | March 31, 2012 | March 31, 2012 | March 31, 2012 | |||||||||||||||||||||
| N/A |
– Not applicable. | |
| (1) |
– The Funds’ distributor, Nuveen Securities, LLC, contractually agreed to limit Class A Share 12b-1 fees to 0.15% of average daily net assets through March 31, 2012, for Intermediate Government Bond, Intermediate Term Bond and Short Term Bond. | |
| (2) |
– Class R3 Shares of Short Term Bond commenced operations on September 23, 2011. |
| 166 | Nuveen Investments |
Effective October 31, 2011, the Adviser has contractually agreed to waive fees and/or reimburse other Fund expenses of the following Funds so that total annual Fund operating expenses, after fee waivers and/or expense reimbursements and excluding acquired Fund fees and expenses, do not exceed the average daily net assets of any Class of Fund shares in the amounts and for the time periods stated in the following table:
| Core Bond | High Income Bond |
Inflation Protected Securities |
Intermediate Government Bond |
Intermediate Term Bond |
Short Term Bond |
Total Return Bond |
||||||||||||||||||||||
| Class A(1) |
.95 | % | 1.10 | % | .85 | % | .85 | % | .95 | % | .85 | % | .84 | % | ||||||||||||||
| Class B |
1.70 | 1.85 | N/A | N/A | N/A | N/A | 1.59 | |||||||||||||||||||||
| Class C |
1.70 | 1.85 | 1.60 | 1.60 | 1.70 | 1.60 | 1.59 | |||||||||||||||||||||
| Class R3 |
1.20 | 1.35 | 1.10 | 1.10 | N/A | 1.10 | 1.09 | |||||||||||||||||||||
| Class I |
.70 | .85 | .60 | .60 | .70 | .60 | .59 | |||||||||||||||||||||
| Expiration Date |
October 31, 2013 | October 31, 2013 | October 31, 2013 | October 31, 2013 | October 31, 2013 | October 31, 2013 | October 31, 2013 | |||||||||||||||||||||
| N/A |
– Not applicable. | |
| (1) |
– The Funds’ distributor, Nuveen Securities, LLC, contractually agreed to limit Class A Share 12b-1 fees to 0.15% of average daily net assets through March 31, 2012, for Intermediate Government Bond, Intermediate Term Bond and Short Term Bond. |
The Adviser has agreed to waive fees and/or reimburse expenses of Global Total Return Bond through October 31, 2014, so that total annual Fund operating expenses (excluding 12b-1 distribution and/or service fees, interest expenses, taxes, fees incurred in acquiring and disposing of portfolio securities and extraordinary expenses) do not exceed .75% of the average daily net assets of any class of Fund shares.
The Adviser may voluntarily reimburse expenses from time to time in any of the Funds. Voluntarily reimbursements may be terminated at any time at the Adviser’s discretion.
The Trust pays no compensation directly to those of its directors/trustees who are affiliated with the Adviser or to its officers, all of whom receive remuneration for their services to the Trust from the Adviser or its affiliates. The Board of Directors/Trustees has adopted a deferred compensation plan for independent directors/trustees that enable directors/trustees to elect to defer receipt of all or a portion of the annual compensation they are entitled to receive from certain Nuveen-advised funds. Under the plan, deferred amounts are treated as though equal dollar amounts had been invested in shares of select Nuveen-advised funds.
The remaining 12b-1 fees charged to the Funds were paid to compensate financial intermediaries for providing services to shareholders relating to their investments.
During the six months ended December 31, 2011, Nuveen Securities, LLC. (the “Distributor”), a wholly owned subsidiary of Nuveen, collected sales charges on purchases of Class A Shares, the majority of which were paid out as concessions to financial intermediaries as follows:
| Core Bond | Global Total Return Bond |
High Income Bond |
Inflation Protected Securities |
|||||||||||||
| Sales charges collected |
$ | 16,171 | $ | — | $ | 87,012 | $ | 49,787 | ||||||||
| Paid to financial intermediaries |
14,291 | — | 80,065 | 44,202 | ||||||||||||
| Intermediate Government Bond |
Intermediate Term Bond |
Short Term Bond |
Total Return Bond |
|||||||||||||
| Sales charges collected |
$ | 4,357 | $ | 8,466 | $ | 11,562 | $ | 64,007 | ||||||||
| Paid to financial intermediaries |
3,711 | 6,961 | 9,398 | 56,802 | ||||||||||||
The Distributor also received 12b-1 service fees on Class A Shares, substantially all of which were paid to compensate financial intermediaries for providing services to shareholders relating to their investments.
During the six months ended December 31, 2011, the Distributor compensated financial intermediaries directly with commission advances at the time of purchase as follows:
| Core Bond | Global Total Return Bond |
High Income Bond |
Inflation Protected Securities |
|||||||||||||
| Commission advances |
$ | 4,743 | $ | — | $ | 46,229 | $ | 15,719 | ||||||||
| Intermediate Government Bond |
Intermediate Term Bond |
Short Term Bond |
Total Return Bond |
|||||||||||||
| Commission advances |
$ | 941 | $ | 930 | $ | 6,164 | $ | 24,322 | ||||||||
| Nuveen Investments | 167 |
Notes to Financial Statements (Unaudited) (continued)
All 12b-1 service and distribution fees collected on Class B Shares and Class C Shares during the first year following a purchase were retained by the Distributor to compensate for commissions advanced to financial intermediaries. During the six months ended December 31, 2011, the Distributor retained such 12b-1 fees as follows:
| Core Bond | Global Total Return Bond |
High Income Bond |
Inflation Protected Securities |
|||||||||||||
| 12b-1 fees retained |
$ | 8,710 | $ | 41 | $ | 17,786 | $ | 10,074 | ||||||||
| Intermediate Government Bond |
Intermediate Term Bond |
Short Term Bond |
Total Return Bond |
|||||||||||||
| 12b-1 fees retained |
$ | 529 | $ | 2,047 | $ | 27,610 | $ | 15,984 | ||||||||
The Distributor also collected and retained CDSC on share redemptions during the six months ended December 31, 2011, as follows:
| Core Bond | Global Total Return Bond |
High Income Bond |
Inflation Protected Securities |
|||||||||||||
| CDSC retained |
$ | 1,239 | $ | — | $ | 7,687 | $ | 1,541 | ||||||||
| Intermediate Government Bond |
Intermediate Term Bond |
Short Term Bond |
Total Return Bond |
|||||||||||||
| CDSC retained |
$ | 2 | $ | 477 | $ | 5,822 | $ | 1,292 | ||||||||
At December 31, 2011, Nuveen owned all the Shares of Class A, C, R3 and I of Global Total Return Bond and 2,538 Shares of Class R3 of Short Term Bond.
8. Fund Mergers
During the current fiscal period, the following Nuveen open-end funds were reorganized into the following Funds included in this report as follows (each the “Reorganization” and collectively, the “Reorganizations”):
| • | Nuveen High Yield Bond Fund (“High Yield Bond”) into High Income Bond; |
| • | Nuveen Short Duration Bond Fund (“Short Duration Bond”) into Short Term Bond; and |
| • | Nuveen Multi-Strategy Core Bond Fund (“Multi-Strategy Core Bond”) into Total Return Bond. |
High Yield Bond, Short Duration Bond and Multi-Strategy Core Bond are collectively the “Acquired Funds.” High Income Bond, Short Term Bond and Total Return Bond are collectively the “Acquiring Funds.”
In December of 2010, Nuveen and certain of its affiliates completed a strategic combination with U.S. Bank National Association and its wholly-owned subsidiary, FAF Advisors, Inc., the investment adviser to the First American Funds. Pursuant to this transaction, Nuveen acquired a portion of the investment advisory business of FAF Advisors, Inc., including assets related to the non-money market open-end funds in the First American family of funds. Effective January 1, 2011, these former First American Funds became part of the Nuveen family of funds and were re-branded as Nuveen Funds. As part of its efforts to integrate the portfolio management teams and investment products it offers following the closing of the transaction, Nuveen has recommended a number of reorganizations between funds with similar investment objectives and policies. The reorganization of the Acquired Funds into the Acquiring Funds has been proposed as part of this initiative.
The Nuveen Funds Board of Directors/Trustees (the “Board”) believes that the Reorganizations are in the best interests of each Fund. In approving each Reorganization, the Board considered a number of principal factors in reaching its determination, including the following:
| • | the similarities and differences in the Funds’ investment objectives and principal investment strategies; |
| • | the Funds’ relative risks; |
| • | the Funds’ relative sizes; |
| • | the relative investment performance of the Funds and portfolio managers; |
| • | the relative fees and expenses of the Funds, including caps on the Funds’ expenses agreed to by the Adviser; |
| • | the anticipated tax-free nature of the Reorganization; |
| • | the expected costs of the Reorganization and the extent to which the Funds would bear any such costs; |
| 168 | Nuveen Investments |
| • | the terms of the Reorganization and whether the Reorganization would dilute the interests of shareholders of the Funds; |
| • | the effect of the Reorganization on shareholder services and shareholder rights; |
| • | alternatives to the Reorganization; and |
| • | any potential benefits of the Reorganization to the Adviser and its affiliates as a result of the Reorganization. |
A special meeting of the Acquired Funds’ shareholders was held on October 28, 2011, for the purpose of voting on the Reorganizations, at which time, each of the Reorganizations was approved. The Reorganizations were consummated at the close of business on November 4, 2011, for Multi-Strategy Core Bond and High Yield Bond and on November 18, 2011, for Short Duration Bond.
Upon consummation of each Fund’s Reorganization, the Acquired Funds transferred all of their assets and liabilities to the Acquiring Funds in exchange for the Acquiring Funds’ shares of equal value. The Acquiring Funds’ shares were then distributed to the Acquired Funds’ shareholders and the Acquired Funds were terminated. As a result of the Reorganizations, the Acquired Funds’ shareholders become shareholders of the Acquiring Funds and the Acquired Funds’ shareholders received the Acquiring Funds’ shares with a total value equal to the total value of their Acquired Funds’ shares immediately prior to the closing of their Reorganization.
The Reorganizations were structured to qualify as tax-free reorganizations under the Internal Revenue Code for federal income tax purposes, and the Acquired Funds’ shareholders will recognize no gain or loss for federal income tax purposes as a result of the Reorganizations. Prior to the closing of each of the Reorganizations, the Acquired Funds distributed all of their net investment income and capital gains, if any. Such a distribution may be taxable to the Acquired Funds’ shareholders for federal income tax purposes.
The cost, fair value and net unrealized appreciation (depreciation) of the investments of the Acquired Funds as of the date of their respective Reorganization were as follows:
| High Yield Bond |
Short Duration Bond |
Multi-Strategy Core Bond |
||||||||||
| Cost of investments |
$ | 108,028,051 | $ | 153,827,932 | $ | 99,647,095 | ||||||
| Fair value of investments |
103,263,381 | 152,771,723 | 101,725,300 | |||||||||
| Net unrealized appreciation (depreciation) of investments |
(4,764,670 | ) | (1,098,793 | ) | 2,084,055 | |||||||
For financial statement purposes, assets received and shares issued by the Acquiring Funds were recorded at fair value; however, the cost basis of the investments received from the Acquired Funds were carried forward to align ongoing reporting of the Acquiring Funds’ realized and unrealized gains and losses with amounts distributable to shareholders for tax purposes.
For accounting and performance reporting purposes, the Acquiring Funds are the survivors. The shares outstanding, net assets and NAV per share immediately before and after the Reorganizations are as follows:
| Acquired Funds – Prior to Reorganizations | Shares Outstanding |
Net Assets | NAV per Share |
|||||||||
| High Yield Bond |
||||||||||||
| Class A |
2,089,814 | $ | 35,167,855 | $ | 16.83 | |||||||
| Class B |
82,525 | 1,387,561 | 16.81 | |||||||||
| Class C |
2,076,855 | 34,868,833 | 16.79 | |||||||||
| Class R3 |
9,844 | 165,597 | 16.82 | |||||||||
| Class I |
1,979,661 | 33,281,132 | 16.81 | |||||||||
| Short Duration Bond |
||||||||||||
| Class A |
3,128,950 | $ | 59,925,259 | $ | 19.15 | |||||||
| Class C |
2,393,643 | 45,914,917 | 19.18 | |||||||||
| Class R3 |
25,826 | 494,189 | 19.14 | |||||||||
| Class I |
2,488,562 | 47,552,148 | 19.11 | |||||||||
| Multi-Strategy Core Bond |
||||||||||||
| Class A |
1,404,357 | $ | 28,166,954 | $ | 20.06 | |||||||
| Class B |
77,141 | 1,556,581 | 20.18 | |||||||||
| Class C |
1,061,199 | 21,334,881 | 20.10 | |||||||||
| Class R3 |
4,128 | 82,781 | 20.05 | |||||||||
| Class I |
1,497,612 | 29,987,500 | 20.02 | |||||||||
| Nuveen Investments | 169 |
Notes to Financial Statements (Unaudited) (continued)
| Acquiring Funds – Prior to Reorganizations | Shares Outstanding |
Net Assets | NAV per Share |
|||||||||
| High Income Bond |
||||||||||||
| Class A |
6,020,899 | $ | 51,230,447 | $ | 8.51 | |||||||
| Class B |
119,926 | 1,014,664 | 8.46 | |||||||||
| Class C |
1,126,860 | 9,564,452 | 8.49 | |||||||||
| Class R3 |
34,394 | 298,898 | 8.69 | |||||||||
| Class I |
48,800,928 | 415,952,708 | 8.52 | |||||||||
| Short Term Bond |
||||||||||||
| Class A |
7,472,373 | $ | 73,585,597 | $ | 9.85 | |||||||
| Class C |
503,552 | 4,969,869 | 9.87 | |||||||||
| Class R3 |
2,575 | 25,370 | 9.85 | |||||||||
| Class I |
64,885,839 | 639,136,264 | 9.85 | |||||||||
| Total Return Bond |
||||||||||||
| Class A |
2,390,123 | $ | 25,330,066 | $ | 10.60 | |||||||
| Class B |
92,424 | 974,333 | 10.54 | |||||||||
| Class C |
763,287 | 8,037,331 | 10.53 | |||||||||
| Class R3 |
109,533 | 1,165,480 | 10.64 | |||||||||
| Class I |
55,458,511 | 587,303,762 | 10.59 | |||||||||
| Acquiring Funds – Post Reorganizations | Shares Outstanding |
Net Assets | NAV per Share |
|||||||||
| High Income Bond |
||||||||||||
| Class A |
10,154,009 | $ | 86,398,302 | $ | 8.51 | |||||||
| Class B |
283,925 | 2,402,225 | 8.46 | |||||||||
| Class C |
5,235,033 | 44,433,285 | 8.49 | |||||||||
| Class R3 |
53,449 | 464,495 | 8.69 | |||||||||
| Class I |
52,705,553 | 449,233,840 | 8.52 | |||||||||
| Short Term Bond |
||||||||||||
| Class A |
13,557,585 | $ | 133,510,856 | $ | 9.85 | |||||||
| Class C |
5,155,702 | 50,884,786 | 9.87 | |||||||||
| Class R3 |
52,725 | 519,559 | 9.85 | |||||||||
| Class I |
69,713,374 | 686,688,412 | 9.85 | |||||||||
| Total Return Bond |
||||||||||||
| Class A |
5,047,930 | $ | 53,497,020 | $ | 10.60 | |||||||
| Class B |
240,079 | 2,530,914 | 10.54 | |||||||||
| Class C |
2,789,409 | 29,372,212 | 10.53 | |||||||||
| Class R3 |
117,313 | 1,248,261 | 10.64 | |||||||||
| Class I |
58,290,186 | 617,291,262 | 10.59 | |||||||||
Assuming the Reorganizations had been completed on July 1, 2011, the beginning of the Acquiring Funds’ current fiscal period, the pro forma results of operations for the Acquired Funds for the fiscal year ended June 30, 2012, are as follows:
| High Yield Bond |
Short Duration Bond |
Multi-Strategy Core Bond |
||||||||||
| Net investment income (loss) |
$ | 718,537 | $ | 598,060 | $ | 299,051 | ||||||
| Net realized and unrealized gains (losses) |
(5,809,476 | ) | (3,042,240 | ) | (251,390 | ) | ||||||
| Change in net assets resulting from operations |
(5,090,939 | ) | (2,444,180 | ) | 47,660 | |||||||
Because the combined investment portfolios for each Reorganization have been managed as a single integrated portfolio since each Reorganization was completed, it is not practicable to separate the amounts of revenue and earnings of the Acquired Funds that have been included in the Statement of Operations since November 4, 2011, for Multi-Strategy Core Bond and High Yield Bond and since November 18, 2011, for Short Duration Bond.
9. New Accounting Pronouncements
Financial Accounting Standards Board (“FASB”) Transfers and Servicing (Topic 860): Reconsideration of Effective Control for Repurchase Agreements
On April 15, 2011, the FASB issued Accounting Standards Update (“ASU”) No. 2011-03 (“ASU No. 2011 03”). The guidance in ASU No. 2011-03 is intended to improve the accounting for repurchase agreements and other similar agreements. Specifically, ASU No. 2011-03 modifies the criteria for determining when these transactions would be accounted for as financings (secured borrowings/ lending agreements) as opposed to sales (purchases) with commitments to repurchase (resell). The effective date of ASU No. 2011-03 is for interim and annual periods beginning on or after December 15, 2011. At this time, management is evaluating the implications of this guidance and the impact it will have on the financial statement amounts and footnote disclosures, if any.
| 170 | Nuveen Investments |
Fair Value Measurements and Disclosures
On May 12, 2011, the FASB issued ASU No. 2011-04 modifying Topic 820, Fair Value Measurements and Disclosures. At the same time, the International Accounting Standards Board (“IASB”) issued International Financial Reporting Standard (“IFRS”) 13, Fair Value Measurement. The objective of the FASB and IASB is convergence of their guidance on fair value measurements and disclosures. Specifically, ASU No. 2011-04 requires reporting entities to disclose i) the amounts of any transfers between Level 1 and Level 2, and the reasons for the transfers and ii) for Level 3 fair value measurements, a) quantitative information about significant unobservable inputs used, b) a description of the valuation processes used by the reporting entity and c) a narrative description of the sensitivity of the fair value measurement to changes in unobservable inputs if a change in those inputs might result in a significantly higher or lower fair value measurement. The effective date of ASU No. 2011-04 is for interim and annual periods beginning after December 15, 2011. At this time, management is evaluating the implications of this guidance and the impact it will have to the financial statement amounts and footnote disclosures, if any.
| Nuveen Investments | 171 |
Annual Investment Management Agreement Approval Process
(Unaudited)
The Board of Trustees (the “Board,” and each Trustee, a “Board Member”) of the Nuveen Global Total Return Bond Fund (the “Fund”), including the Board Members who are not parties to its advisory or sub-advisory agreements or “interested persons” of any such parties (the “Independent Board Members”), is responsible for approving advisory arrangements for the Fund. At a meeting held on November 14-16, 2011 (the “Meeting”), the Board Members, including the Independent Board Members, considered and approved the investment management agreement (the “Investment Management Agreement”) between the Fund and Nuveen Fund Advisors, Inc. (the “Advisor”) and the investment sub-advisory agreement (the “Sub-Advisory Agreement”) between the Advisor and Nuveen Asset Management, LLC (the “Sub-Adviser”), on behalf of the Fund. The Advisor and the Sub-Adviser are each hereafter a “Fund Adviser.” The Investment Management Agreement and the Sub-Advisory Agreement are each hereafter an “Advisory Agreement.”
The discussion of the most recent approvals of the advisory agreements for the Nuveen Core Bond Fund, the Nuveen High Income Bond Fund, the Nuveen Inflation Protected Securities Fund, the Nuveen Intermediate Government Bond Fund, the Nuveen Intermediate Term Bond Fund, the Nuveen Short Term Bond Fund and the Nuveen Total Return Bond Fund (the “Total Return Fund”) was included in each such fund’s annual report for the period ending June 30, 2011. The discussion below relates only to the Advisory Agreements for the Fund, which is new.
To assist the Board in its evaluation of an Advisory Agreement with a Fund Adviser at the Meeting, the Independent Board Members had received, in adequate time in advance of the Meeting or at prior meetings, materials which outlined, among other things:
| • | the nature, extent and quality of services expected to be provided by the Fund Adviser; |
| • | the organization of the Fund Adviser, including the responsibilities of various departments and key personnel; |
| • | the expertise and background of the Fund Adviser with respect to the Fund’s investment strategy; |
| • | certain performance-related information (as described below); |
| • | the profitability of Nuveen Investments, Inc. (“Nuveen”) (which incorporated Nuveen’s wholly-owned affiliated sub-advisers); |
| • | the proposed management fees of the Fund Adviser, including comparisons of such fees with the management fees of comparable funds; |
| • | the expected expenses of the Fund, including comparisons of the Fund’s expected expense ratio with the expense ratios of comparable funds; and |
| • | the soft dollar practices of the Fund Adviser, if any. |
At the Meeting, the Advisor made a presentation to and responded to questions from the Board. During the Meeting, the Independent Board Members also met privately with their legal counsel to review the Board’s duties under the Investment Company Act of 1940 (the “1940 Act”), the general principles of state law in reviewing and approving advisory contracts, the standards used by courts in determining whether investment company boards of directors have fulfilled their duties, factors to be considered in voting on advisory contracts and an adviser’s fiduciary duty with respect to advisory agreements and compensation. It is with this background that the Independent Board Members considered the Advisory Agreements with the Fund Advisers for the Fund. As outlined in more detail below, the Independent Board Members considered all factors they believed relevant with respect to the Fund, including the following: (a) the nature, extent and quality of the services to be provided by the Fund Adviser; (b) investment performance, as described below; (c) the advisory fees and costs of the services to be provided to the Fund and the profitability of Nuveen and its affiliates; (d) the extent of any economies of scale; and (e) any benefits derived by the Fund Advisers from the relationship with the Fund.
A. Nature, Extent and Quality of Services
The Independent Board Members considered the nature, extent and quality of the respective Fund Adviser’s services, including advisory services and administrative services. As the Advisor and the Sub-Adviser already serve as adviser and sub-adviser, respectively, to other Nuveen funds overseen by the Board Members, the Board has a good understanding of each such Fund Adviser’s organization, operations and personnel. As the Independent Board Members meet regularly throughout the year to oversee the Nuveen funds, including funds currently advised by the Fund Advisers, the Independent Board Members have relied upon their knowledge from their meetings and any other interactions throughout the year of the respective Fund Adviser and its services in evaluating the Advisory Agreements.
At the Meeting and at prior meetings, the Independent Board Members reviewed materials outlining, among other things, the respective Fund Adviser’s organization and business; the types of services that such Fund Adviser or its affiliates provide to the Nuveen funds and are expected to provide to the Fund; and the experience of the respective Fund Adviser with applicable investment strategies. Further, the Independent Board Members have evaluated the background and experience of the Fund Adviser’s investment personnel.
In addition to advisory services, the Independent Board Members considered the quality and extent of administrative or other non-advisory services to be provided. In this regard, the Advisor is expected to provide the Fund with such administrative and other services (exclusive of, and in addition to, any such services provided by others for the Fund) and officers and other personnel as are
| 172 | Nuveen Investments |
necessary for the operations of the Fund. In addition to investment management services, the Advisor and its affiliates will provide the Fund with a wide range of services, including, among other things, product management, investment services (such as oversight of investment policies and procedures, risk management, and pricing), fund administration, oversight of service providers, shareholder services, administration of Board relations, regulatory and portfolio compliance and legal support. The Independent Board Members also recognized that the Advisor would oversee the Sub-Adviser.
In evaluating the services of the Sub-Adviser, the Independent Board Members noted that the Sub-Advisory Agreement was essentially an agreement for portfolio management services only and the Sub-Adviser was not expected to supply other significant administrative services to the Fund. In addition, the Board Members recognized the Sub-Adviser’s experience and established philosophy and process.
Based on their review, the Independent Board Members found that, overall, the nature, extent and quality of services expected to be provided to the Fund under each Advisory Agreement were satisfactory.
B. Investment Performance
The Fund is new and therefore does not have its own performance history. However, the Independent Board Members are familiar with the Sub-Adviser’s track record in managing fixed income strategies as well as with the performance records of other Nuveen funds advised by the Advisor and sub-advised by the Sub-Adviser, including the Total Return Fund, which is a domestic-oriented variation of the Fund. In this regard, the Independent Board Members were provided with performance information for the Total Return Fund, including returns for the one-year, three-year, five-year and ten-year periods, and the period since inception, in each case ending September 30, 2011.
C. Fees, Expenses and Profitability
1. Fees and Expenses
In evaluating the management fees and expenses that the Fund was expected to bear, the Independent Board Members considered, among other things, the Fund’s proposed management fee structure, the rationale for its proposed fee levels, and its expected expense ratios in absolute terms as well as compared with the fees and expense ratios of comparable funds.
The Independent Board Members reviewed, among other things, the management fees and expense ratios of various other unaffiliated funds classified as global income funds. In this regard, the Independent Board Members noted that, for the Fund, the proposed gross management fee is at, and the net expense ratio is slightly below, the medians for this peer set.
In addition, the Independent Board Members considered the fund-level breakpoint schedule and the complex-wide breakpoint schedule (described in further detail below) and any applicable fee waivers and expense reimbursements expected to be provided. Based on their review of the fee and expense information provided, the Independent Board Members determined that the Fund’s management fees were reasonable in light of the nature, extent and quality of services to be provided to the Fund.
2. Comparisons with the Fees of Other Clients
Due to their experience with other Nuveen funds, the Board Members were familiar with the fees the Advisor assesses to other clients, including separately managed accounts (both retail and institutional accounts), foreign investment funds offered by Nuveen and funds that are not offered by Nuveen but are sub-advised by one of Nuveen’s investment management teams. In evaluating the comparisons of fees, the Independent Board Members have noted, at the Meeting or at prior meetings, that the fee rates charged to a fund (such as the Fund) and charged to other clients vary, among other things, because of the different services involved and the additional regulatory and compliance requirements associated with registered investment companies, such as the Fund. Accordingly, the Independent Board Members have considered the differences in the product types, including, but not limited to, the services to be provided, the structure and operations, product distribution and costs thereof, portfolio investment policies, investor profiles, account sizes and regulatory requirements. The Independent Board Members have noted, in particular, that the range of services as described above to be provided to a fund (such as the Fund) is much more extensive than that provided to separately managed accounts. Given the inherent differences in the products, particularly the extensive services to be provided to the Fund, the Independent Board Members believe such facts justify the different levels of fees. In considering the advisory fees of the Sub-Adviser, the Independent Board Members are familiar with the pricing schedule or fees the Sub-Adviser charges for similar investment management services for other Nuveen funds.
3. Profitability of Fund Advisers
In conjunction with its review of fees at prior meetings, the Independent Board Members have considered the profitability of Nuveen for its advisory activities (which incorporated Nuveen’s wholly-owned affiliated sub-advisers) and its financial condition. At the Meeting or prior meetings, the Independent Board Members reviewed the revenues and expenses of Nuveen’s advisory activities, the allocation methodology used in preparing the profitability data and an analysis of the key drivers behind the changes in revenues and expenses that impacted profitability. They also reviewed financial statements as of June 30, 2011 and certain other financial information pertaining to Nuveen. The Independent Board Members have also considered, at the Meeting or at prior meetings, Nuveen’s revenues for advisory activities, expenses, and profit margin compared to that of various unaffiliated management firms with similar amounts of assets under management and relatively comparable asset composition prepared by Nuveen.
| Nuveen Investments | 173 |
Annual Investment Management Agreement Approval Process
(Unaudited) (continued)
In reviewing profitability, the Independent Board Members have recognized the subjective nature of determining profitability, which may be affected by numerous factors, including the allocation of expenses. Further, the Independent Board Members have recognized the difficulties in making comparisons as the profitability of other advisers generally is not publicly available and the profitability information that is available for certain advisers or management firms may not be representative of the industry and may be affected by, among other things, the adviser’s particular business mix, capital costs, types of funds managed and expense allocations. Notwithstanding the foregoing, the Independent Board Members reviewed Nuveen’s methodology and assumptions for allocating expenses across product lines to determine profitability. In reviewing profitability, the Independent Board Members recognized Nuveen’s investment in its fund business. Based on their review, the Independent Board Members concluded that Nuveen’s level of profitability for its advisory activities was reasonable in light of the services to be provided.
In evaluating the reasonableness of the compensation, the Independent Board Members also considered any other amounts expected to be paid to a Fund Adviser as well as any indirect benefits (such as soft dollar arrangements, if any) the respective Fund Adviser and its affiliates are expected to receive that are directly attributable to their management of the Fund, if any. See Section E below for additional information on indirect benefits a Fund Adviser may receive as a result of its relationship with the Fund. Based on their review of the overall fee arrangements of the Fund, the Independent Board Members determined that the advisory fees and expected expenses of the Fund were reasonable.
D. Economies of Scale and Whether Fee Levels Reflect These Economies of Scale
With respect to economies of scale, the Independent Board Members have recognized the potential benefits resulting from the costs of a fund being spread over a larger asset base, although economies of scale are difficult to measure and predict with precision, particularly on a fund-by-fund basis. The Independent Board Members therefore considered whether the Fund could be expected to benefit from any economies of scale. One method to help ensure that shareholders share in these benefits is to include breakpoints in the advisory fee schedule. Generally, management fees for funds in the Nuveen complex are comprised of a fund-level component and a complex-level component. Accordingly, the Independent Board Members received and reviewed the schedule of proposed advisory fees for the Fund, including fund-level breakpoints thereto.
In addition to fund-level advisory fee breakpoints, the Board also considered the Fund’s complex-wide fee arrangement. Pursuant to the complex-wide fee arrangement, the fees of the funds in the Nuveen complex, including the Fund, are generally reduced as the assets in the fund complex reach certain levels. In evaluating the complex-wide fee arrangement, the Independent Board Members have considered that the complex-wide fee arrangement seeks to provide the benefits of economies of scale to fund shareholders when total fund complex assets increase, even if assets of a particular fund are unchanged or have decreased. The approach reflects the notion that some of Nuveen’s costs are attributable to services provided to all its funds in the complex and therefore all funds benefit if these costs are spread over a larger asset base. Based on their review, the Independent Board Members concluded that the breakpoint schedules and complex-wide fee arrangement were acceptable and reflect economies of scale to be shared with the Fund’s shareholders when assets under management increase.
E. Indirect Benefits
In evaluating fees, the Independent Board Members also considered information regarding potential “fall out” or ancillary benefits that a Fund Adviser or its affiliates may receive as a result of its relationship with the Fund. In this regard, the Independent Board Members considered, among other things, any sales charges, distribution fees and shareholder services fees expected to be received and retained by the Fund’s principal underwriter, an affiliate of the Advisor, including fees to be received pursuant to any 12b-1 plan.
In addition to the above, the Independent Board Members considered whether the Fund Advisers will receive any benefits from soft dollar arrangements whereby a portion of the commissions paid by the Fund for brokerage may be used to acquire research that may be useful to a Fund Adviser in managing the assets of the Fund and other clients. The Independent Board Members recognized that each of the Fund Advisers has authority to pay a higher commission in return for brokerage and research services if it determines in good faith that the commission paid is reasonable in relation to the value of the brokerage and research services provided. Nevertheless, the Independent Board Members noted that commissions are generally not paid in connection with fixed income securities transactions which are typically executed on a principal basis.
Based on their review, the Independent Board Members concluded that any indirect benefits received by a Fund Adviser as a result of its relationship with the Fund were reasonable and within acceptable parameters.
F. Approval
The Independent Board Members did not identify any single factor discussed previously as all-important or controlling. The Board Members, including a majority of the Independent Board Members, concluded that the terms of the Investment Management Agreement and Sub-Advisory Agreement were fair and reasonable, that the respective Fund Adviser’s fees are reasonable in light of the services to be provided to the Fund and that the Investment Management Agreement and Sub-Advisory Agreement should be and were approved on behalf of the Fund.
| 174 | Nuveen Investments |
Notes
| Nuveen Investments | 175 |
Notes
| 176 | Nuveen Investments |
Glossary of Terms Used in this Report
Asset-Backed Securities (ABS): Securities whose value and income payments are derived from and collateralized by a specific pool of underlying assets. The pool of assets typically is a group of small and/or illiquid assets that may be difficult to sell individually. The underlying pools of asset-backed securities often include payments from credit cards, auto loans or mortgage loans.
Average Annual Total Return: This is a commonly used method to express an investment’s performance over a particular, usually multi-year time period. It expresses the return that would have been necessary each year to equal the investment’s actual cumulative performance (including change in NAV or offer price and reinvested dividends and capital gains distributions, if any) over the time period being considered.
Barclays Capital Aggregate Bond Index: An unmanaged index that includes all investment-grade, publicly issued, fixed-rate, dollar denominated, nonconvertible debt issues and commercial mortgage backed securities with maturities of at least one year and out-standing par values of $150 million or more. Index returns assume reinvestment of distributions, but do not include the effects of any applicable sales charges or management fees. It is not possible to invest directly in an index.
Barclays Capital Global Aggregate Unhedged Bond Index: An index that provides a broad-based measure of the global investment-grade fixed-rate debt markets. Index returns assume reinvestment of dividends, but do not include the effects of any applicable sales charges or management fees. It is not possible to invest directly in an index.
Barclays Capital High-Yield 2% Issuer Capped Index: An issuer-constrained version of the U.S. Corporate High-Yield Index that covers the U.S. dollar denominated, non-investment grade, fixed-rate, tax-able corporate bond market. Index returns assume reinvestment of distributions, but do not include the effects of any applicable sales charges or management fees. It is not possible to invest directly in an index.
Barclays Capital Intermediate Government Bond Index: An unmanaged index that includes all publicly issued, U.S. Treasury securities that have a remaining maturity of greater than or equal to 1 year and less than 10 years, are rated investment grade, and have $250 million or more of outstanding face value. Index returns assume reinvestment of distributions, but do not include the effects of any applicable sales charges or management fees. It is not possible to invest directly in an index.
Barclays Capital Intermediate Government/Credit Bond Index: An unmanaged index that measures the performance of U.S. dollar denominated U.S. Treasuries, government-rated and investment grade U.S. corporate fixed-rate, non-convertible securities having $250 million or more of outstanding face value and a remaining maturity of greater than or equal to 1 year and less than 10 years. Index returns assume reinvestment of dividends, but do not include the effects of any applicable sales charges or management fees. It is not possible to invest directly in an index.
Barclays Capital U.S. TIPs Index: An unmanaged index that includes all publicly issued, U.S. Treasury inflation-protected securities that have at least one year remaining to maturity, are rated investment grade, and have $250 million or more of outstanding face value. Index returns assume reinvestment of distributions, but do not include the effects of any applicable sales charges or management fees. It is not possible to invest directly in an index.
Barclays Capital 1-3 Year Government/Credit Bond Index: An unmanaged index that includes all medium and larger issues of U.S. government, investment-grade corporate, and investment-grade international dollar-denominated bonds that have maturities of between 1 and 3 years and are publicly issued. Index returns assume reinvestment of distributions, but do not include the effects of any applicable sales charges or management fees. It is not possible to invest directly in an index.
Commercial Mortgage-Backed Securities (CMBS): Commercial mortgage-backed securities are backed by cash flows of a mortgage or pool of mortgages on commercial real estate. CMBS generally are structured to provide protection to the senior class investors against potential losses on the underlying mortgage loans. CMBS are typically characterized by the following: i) loans on multi-family housing, non-residential property, ii) payments based on the amortization schedule of 25 - 30 years with a balloon payment due usually after 10 years, and iii) restrictions on prepayments.
Duration: A measure of the price sensitivity of a security or fund to changes in prevailing interest rates. The longer the duration, the more price sensitivity to interest rate movements in either direction.
Lipper Global Income Funds Classification Average: Represents the average annualized returns for all reporting funds in the Lipper Global Income Funds Classification. The Lipper Global Income Funds Classification Average contained 144, 142, 118 and 75 funds during the 6-month, 1-year, 5-year and 10-year periods, respectively, ended December 31, 2011. Lipper returns account for the effects of management fees and assume reinvestment of dividends, but do not reflect any applicable sales charge. The Lipper average is not available for direct investment.
Lipper High Current Yield Funds Classification Average: Represents the average annualized returns for all reporting funds in the Lipper High Current Yield Funds Classification. The Lipper High Current Yield Funds Classification Average contained 510, 491, 356 and 238 funds during the 6-month, 1-year, 5-year and 10-year periods, respectively, ended December 31, 2011. Lipper returns account for the effects of management fees and assume reinvestment of dividends, but do not reflect any applicable sales charge. The Lipper average is not available for direct investment.
Lipper Intermediate Investment Grade Debt Funds Classification Average: Represents the average annualized returns for all reporting funds in the Lipper Intermediate Investment Grade Debt Funds Classification. The Lipper Intermediate Investment Grade Debt Funds Classification Average contained 609, 597, 434 and 293 funds during the 6-month, 1-year, 5-year and 10-year periods, respectively, ended December 31, 2011. Lipper returns account for the effects of management fees and assume reinvestment of dividends, but do not reflect any applicable sales charge. The Lipper average is not available for direct investment.
Lipper Intermediate U.S. Government Funds Classification Average: Represents the average annualized returns for all reporting funds in the Lipper Intermediate U.S. Government Funds Classification. The Lipper Intermediate U.S. Government Funds Classification Average contained 69, 69, 57 and 48 funds during the 6-month, 1-year, 5-year and since inception periods, respectively, ended December 31, 2011. Lipper returns account for the effects of management fees and assume reinvestment of dividends, but do not reflect any applicable sales charge. The Lipper average is not available for direct investment.
Lipper Short-Intermediate Investment Grade Debt Funds Classification Average: Represents the average annualized returns for all reporting funds in the Lipper Short-Intermediate Investment Grade Debt Funds Classification. The Lipper Short-Intermediate Investment Grade Debt Funds Classification Average contained 144, 142, 118 and 75 funds during the 6-month, 1-year, 5-year and 10-year periods, respectively, ended December 31, 2011. Lipper returns account for the effects of management fees and assume reinvestment of dividends, but do not reflect any applicable sales charge. The Lipper average is not available for direct investment.
Lipper Short Investment Grade Debt Funds Classification Average: Represents the average annualized returns for all reporting funds in the Lipper Short Investment Grade Debt Funds Classification. The Lipper Short Investment Grade Debt Funds Classification Average contained 256, 254, 191 and 102 funds during the 6-month, 1-year, 5-year and 10-year periods, respectively, ended December 31, 2011. Lipper returns account for the effects of management fees and assume reinvestment of dividends, but do not reflect any applicable sales charge. The Lipper average is not available for direct investment.
| Nuveen Investments | 177 |
Glossary of Terms Used in this Report (continued)
Lipper Treasury Inflation Protected Securities Funds Classification Average: Represents the average annualized returns for all reporting funds in the Lipper Treasury Inflation Protected Securities Funds Classification. The Lipper Treasury Inflation Protected Securities Funds Classification Average contained 171, 163, 111 and 64 funds during the 6-month, 1-year, 5-year and since inception periods, respectively, ended December 31, 2011. Lipper returns account for the effects of management fees and assume reinvestment of dividends, but do not reflect any applicable sales charge. The Lipper average is not available for direct investment.
Mortgage-Backed Securities (MBS): Mortgage-backed securities (MBS) are bonds backed by pools of mortgages, usually with similar characteristics, and which return principal and interest in each payment. MBS are composed of residential mortgages (RMBS) or commercial mortgages (CMBS). RMBS are further divided into agency RMBS and non-agency RMBS, depending on the issuer.
Net Asset Value (NAV): The net market value of all securities held in a portfolio.
Net Asset Value (NAV) Per Share: The market value of one share of a mutual fund or closed-end fund. For a Fund, the NAV is calculated daily by taking the Fund’s total assets (securities, cash, and accrued earnings), subtracting the Fund’s liabilities, and dividing by the number of shares outstanding.
Residential Mortgage-Backed Securities (RMBS): Residential mortgage-backed securities are securities the payments on which depend primarily on the cash flow from residential mortgage loans made to borrowers that are secured by residential real estate. RMBS consist of agency and non-agency RMBS. Agency RMBS have agency guarantees that assure investors that they will receive timely payment of interest and principal, regardless of delinquency or default rates on the underlying loans. Agency RMBS include securities issued by the Government National Mortgage Association, the Federal National Mortgage Association and the Federal Home Loan Mortgage Corporation, and other federal agencies, or issues guaranteed by them. Non-agency RMBS do not have agency guarantees. Non-agency RMBS have credit enhancement built into the structure to shield investors from borrower delinquencies. The spectrum of non-agency residential mortgage loans includes traditional jumbo loans (prime), alternative-A loans (Alt-A), and home equity loans (sub-prime).
Tax Equalization: The practice of treating a portion of the distribution made to a redeeming shareholder, which represents his proportionate part of undistributed net investment income and capital gain as a distribution for tax purposes. Such amounts are referred to as the equalization debits (or payments) and will be considered a distribution to the shareholder of net investment income and capital gain for calculation of the Fund’s dividends paid deduction.
| 178 | Nuveen Investments |
Nuveen Funds’ Quarterly Portfolio of Investments and Proxy Voting information: You may obtain (i) each Fund’s quarterly portfolio of investments, (ii) information regarding how the Funds voted proxies relating to portfolio securities held during the most recent twelve-month period ended June 30, and (iii) a description of the policies and procedures that the Funds used to determine how to vote proxies relating to portfolio securities without charge, upon request, by calling Nuveen Investments at (800) 257-8787 or on Nuveen’s website at www.nuveen.com.
You may also obtain this and other Fund information directly from the Securities and Exchange Commission (SEC). The SEC may charge a copying fee for this information. Visit the SEC on-line at http://www.sec.gov or in person at the SEC’s Public Reference Room in Washington, D.C. Call the SEC at (202) 942-8090 for room hours and operation. You may also request Fund information by sending an e-mail request to publicinfo@sec.gov or by writing to the SEC’s Public Reference Section at 100 F Street NE, Washington, D.C. 20549.
The Financial Industry Regulatory Authority (FINRA) provides a Public Disclosure Program which supplies certain information regarding the disciplinary history of FINRA members and their associated persons in response to either telephone inquiries at (800) 289-9999 or written inquiries at www.finra.org. FINRA also provides an investor brochure that includes information describing the Public Disclosure Program.
| Nuveen Investments | 179 |
Nuveen Investments:
Serving Investors for Generations
Since 1898, financial advisors and their clients have relied on Nuveen Investments to provide dependable investment solutions through continued adherence to proven, long-term investing principles. Today, we offer a range of high quality equity and fixed-income solutions designed to be integral components of a well-diversified core portfolio.
Focused on meeting investor needs.
Nuveen Investments provides high-quality investment services designed to help secure the long-term goals of institutional and individual investors as well as the consultants and financial advisors who serve them. Nuveen Investments markets a wide range of specialized investment solutions which provide investors access to capabilities of its high-quality boutique investment affiliates-Nuveen Asset Management, Symphony Asset Management, NWQ Investment Management Company, Santa Barbara Asset Management, Tradewinds Global Investors, Winslow Capital Management, and Gresham Investment Management. In total, Nuveen Investments managed $220 billion as of December 31, 2011.
Find out how we can help you.
To learn more about how the products and services of Nuveen Investments may be able to help you meet your financial goals, talk to your financial advisor, or call us at (800) 257-8787. Please read the information provided carefully before you invest. Investors should consider the investment objective and policies, risk considerations, charges and expenses of any investment carefully. Where applicable, be sure to obtain a prospectus, which contains this and other relevant information. To obtain a prospectus, please contact your securities representative or Nuveen Investments, 333 W. Wacker Dr., Chicago, IL 60606. Please read the prospectus carefully before you invest or send money.
Learn more about Nuveen Funds at: www.nuveen.com/mf
| Distributed by Nuveen Securities, LLC 333 West Wacker Drive Chicago, IL 60606 www.nuveen.com |
MSA-FINC-1211D
Item 2. Code of Ethics.
Not applicable to this filing.
Item 3. Audit Committee Financial Expert.
Not applicable to this filing.
Item 4. Principal Accountant Fees and Services.
Not applicable to this filing.
Item 5. Audit Committee of Listed Registrants.
Not applicable to this registrant.
Item 6. Schedule of Investments.
(a) See Portfolio of Investments in Item 1.
(b) Not applicable.
Item 7. Disclosure of Proxy Voting Policies and Procedures for Closed-End Management Investment Companies.
Not applicable to this registrant.
Item 8. Portfolio Managers of Closed-End Management Investment Companies.
Not applicable to this registrant.
Item 9. Purchases of Equity Securities by Closed-End Management Investment Company and Affiliated Purchasers.
Not applicable to this registrant.
Item 10. Submission of Matters to a Vote of Security Holders.
There have been no material changes to the procedures by which shareholders may recommend nominees to the registrant’s Board implemented after the registrant last provided disclosure in response to this item.
Item 11. Controls and Procedures.
| (a) | The registrant’s principal executive and principal financial officers, or persons performing similar functions, have concluded that the registrant’s disclosure controls and procedures (as defined in Rule 30a-3(c) under the Investment Company Act of 1940, as amended (the “1940 Act”) (17 CFR 270.30a-3(c))) are effective, as of a date within 90 days of the filing date of this report that includes the disclosure required by this paragraph, based on their evaluation of the controls and procedures required by Rule 30a-3(b) under the 1940 Act (17 CFR 270.30a-3(b)) and Rules 13a-15(b) or 15d-15(b) under the Securities Exchange Act of 1934, as amended (the “Exchange Act”) (17 CFR 240.13a-15(b) or 240.15d-15(b)). |
| (b) | There were no changes in the registrant’s internal control over financial reporting (as defined in Rule 30a-3(d) under the 1940 Act (17 CFR 270.30a-3(d)) that occurred during the second fiscal quarter of the period covered by this report that has materially affected, or is reasonably likely to materially affect, the registrant’s internal control over financial reporting. |
Item 12. Exhibits.
File the exhibits listed below as part of this Form.
(a)(1) Any code of ethics, or amendment thereto, that is the subject of the disclosure required by Item 2, to the extent that the registrant intends to satisfy the Item 2 requirements through filing of an exhibit: Not applicable to this filing.
(a)(2) A separate certification for each principal executive officer and principal financial officer of the registrant as required by Rule 30a-2(a) under the 1940 Act (17 CFR 270.30a-2(a)) in the exact form set forth below: See EX-99.CERT attached hereto.
(a)(3) Any written solicitation to purchase securities under Rule 23c-1 under the 1940 Act (17 CFR 270.23c-1) sent or given during the period covered by the report by or on behalf of the registrant to 10 or more persons: Not applicable to this registrant.
(b) If the report is filed under Section 13(a) or 15(d) of the Exchange Act, provide the certifications required by Rule 30a-2(b) under the 1940 Act (17 CFR 270.30a-2(b)), Rule 13a-14(b) or Rule 15d-14(b) under the Exchange Act (17 CFR 240.13a-14(b) or 240.15d-14(b)), and Section 1350 of Chapter 63 of Title 18 of the United States Code (18 U.S.C. 1350) as an Exhibit. A certification furnished pursuant to this paragraph will not be deemed “filed” for purposes of Section 18 of the Exchange Act (15 U.S.C. 78r), or otherwise subject to the liability of that section. Such certification will not be deemed to be incorporated by reference into any filing under the Securities Act of 1933 or the Exchange Act, except to the extent that the registration specifically incorporates it by reference: See EX-99.906 CERT attached hereto.
SIGNATURES
Pursuant to the requirements of the Securities Exchange Act of 1934 and the Investment Company Act of 1940, the registrant has duly caused this report to be signed on its behalf by the undersigned, thereunto duly authorized.
(Registrant) Nuveen Investment Funds, Inc.
| By | (Signature and Title) | /s/ Kevin J. McCarthy | ||||
| Kevin J. McCarthy Vice President and Secretary |
Date March 9, 2012
Pursuant to the requirements of the Securities Exchange Act of 1934 and the Investment Company Act of 1940, this report has been signed below by the following persons on behalf of the registrant and in the capacities and on the dates indicated.
| By | (Signature and Title) | /s/ Gifford R. Zimmerman | ||||
| Gifford R. Zimmerman Chief Administrative Officer (principal executive officer) |
Date March 9, 2012
| By | (Signature and Title) | /s/ Stephen D. Foy | ||||
| Stephen D. Foy Vice President and Controller (principal financial officer) |
Date March 9, 2012