Exhibit 13
Annual Report to Stockholders
SECURITY FEDERAL CORPORATION AND SUBSIDIARIES
Selected Consolidated Financial and Other Data
SECURITY FEDERAL CORPORATION AND SUBSIDIARIES
Selected Consolidated Financial and Other Data
SECURITY FEDERAL CORPORATION AND SUBSIDIARIES
Selected Consolidated Financial and Other Data
SECURITY FEDERAL CORPORATION AND SUBSIDIARIES
Selected Consolidated Financial and Other Data
SECURITY FEDERAL CORPORATION AND SUBSIDIARIES
Selected Consolidated Financial and Other Data
SECURITY FEDERAL CORPORATION AND SUBSIDIARIES
Selected Consolidated Financial and Other Data
SECURITY FEDERAL CORPORATION AND SUBSIDIARIES
Selected Consolidated Financial and Other Data
The following tables provide selected consolidated financial and operating data of Security Federal Corporation at and for the years indicated. In conjunction with the data provided in the following tables and in order to more fully understand our historical consolidated financial and operating data, you should also read our “Management’s Discussion and Analysis of Financial Condition and Results of Operations” and our Consolidated Financial Statements and the accompanying notes included in this report.
| | | | | | | | | | | | | | | | | | | | | | | | | | | | | |
| | At and For the Year Ended December 31, |
| | 2022 | | 2021 | | 2020 | | 2019 | | 2018 |
| Balance Sheet Data at End of Period | (Dollars in Thousands, Except Per Share Data) |
| Total Assets | $ | 1,381,366 | | $ | 1,301,214 | | $ | 1,171,710 | | $ | 963,228 | | $ | 912,614 |
| Cash and Cash Equivalents | 28,502 | | 27,623 | | 18,025 | | 12,536 | | 12,706 |
| Certificates of Deposit with Other Banks | 1,100 | | 1,100 | | 350 | | 950 | | 1,200 |
| Investment Securities | 717,586 | | 706,356 | | 607,579 | | 433,892 | | 409,894 |
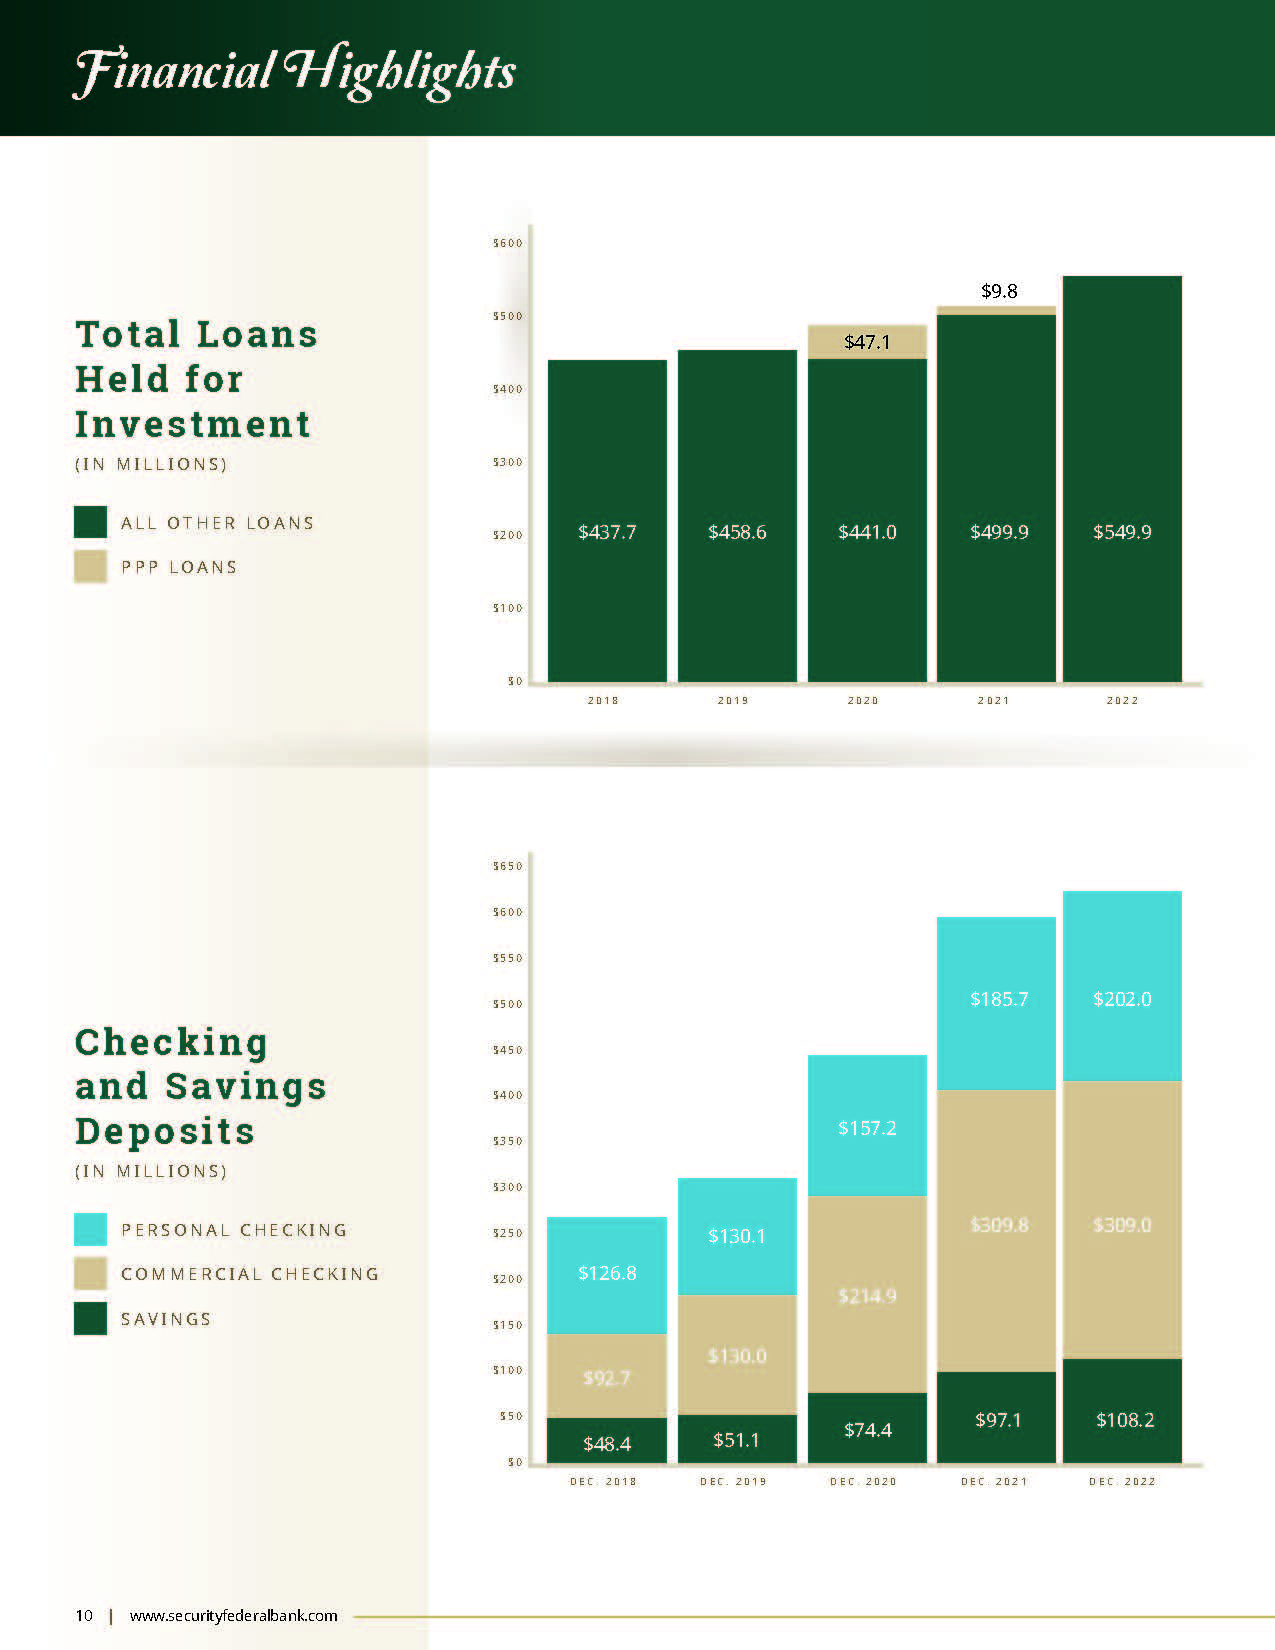
Total Loans Receivable, Net (1) | 549,917 | | 499,497 | | 479,167 | | 452,859 | | 430,054 |
| Deposits | 1,110,085 | | 1,115,963 | | 918,096 | | 771,407 | | 767,497 |
| Advances From Federal Home Loan Bank ("FHLB") | — | | — | | 35,000 | | 38,138 | | 34,030 |
| Borrowings from Federal Reserve Bank ("FRB") | 44,080 | | — | | 48,700 | | — | | — |
| Total Shareholders' Equity | 160,233 | | 115,523 | | 111,906 | | 91,758 | | 80,518 |
| Common Shareholders' Equity | 77,284 | | 115,523 | | 111,906 | | 91,758 | | 80,518 |
| | | | | | | | | |
| Income Data | | | | | | | | | |
| Total Interest Income | $ | 42,578 | | $ | 37,117 | | $ | 37,096 | | $ | 36,934 | | $ | 33,072 |
| Total Interest Expense | 5,028 | | 3,824 | | 6,581 | | 8,311 | | 5,449 |
| Net Interest Income | 37,550 | | 33,293 | | 30,515 | | 28,623 | | 27,623 |
| (Reversal of) Provision for Loan Losses | — | | (2,404) | | 3,600 | | 375 | | 925 |
| Net Interest Income After (Reversal of) Provision for Loan Losses | 37,550 | | 35,697 | | 26,915 | | 28,248 | | 26,698 |
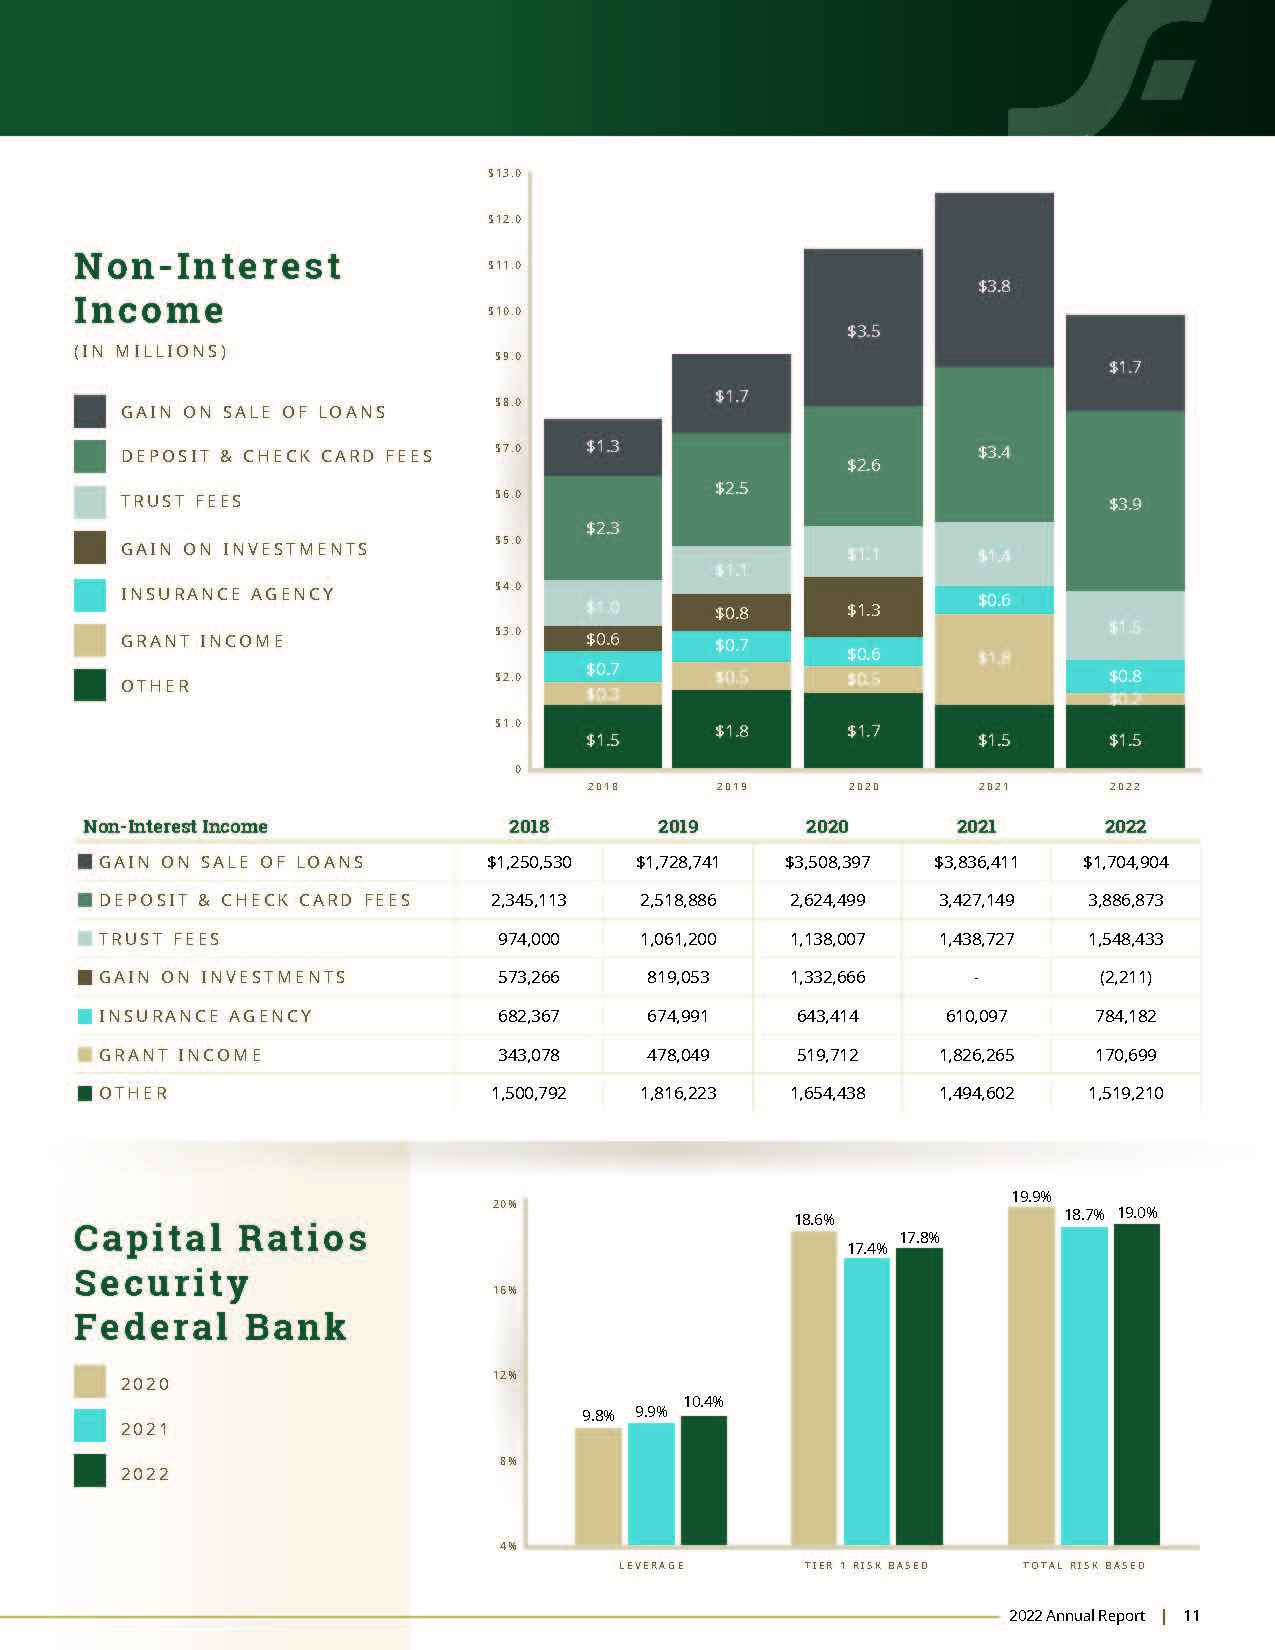
| Non-Interest Income | 9,612 | | 12,633 | | 11,421 | | 9,097 | | 7,669 |
| Non-Interest Expense | 34,225 | | 32,047 | | 29,708 | | 27,871 | | 25,590 |
| Income Taxes | 2,709 | | 3,509 | | 1,577 | | 1,680 | | 1,570 |
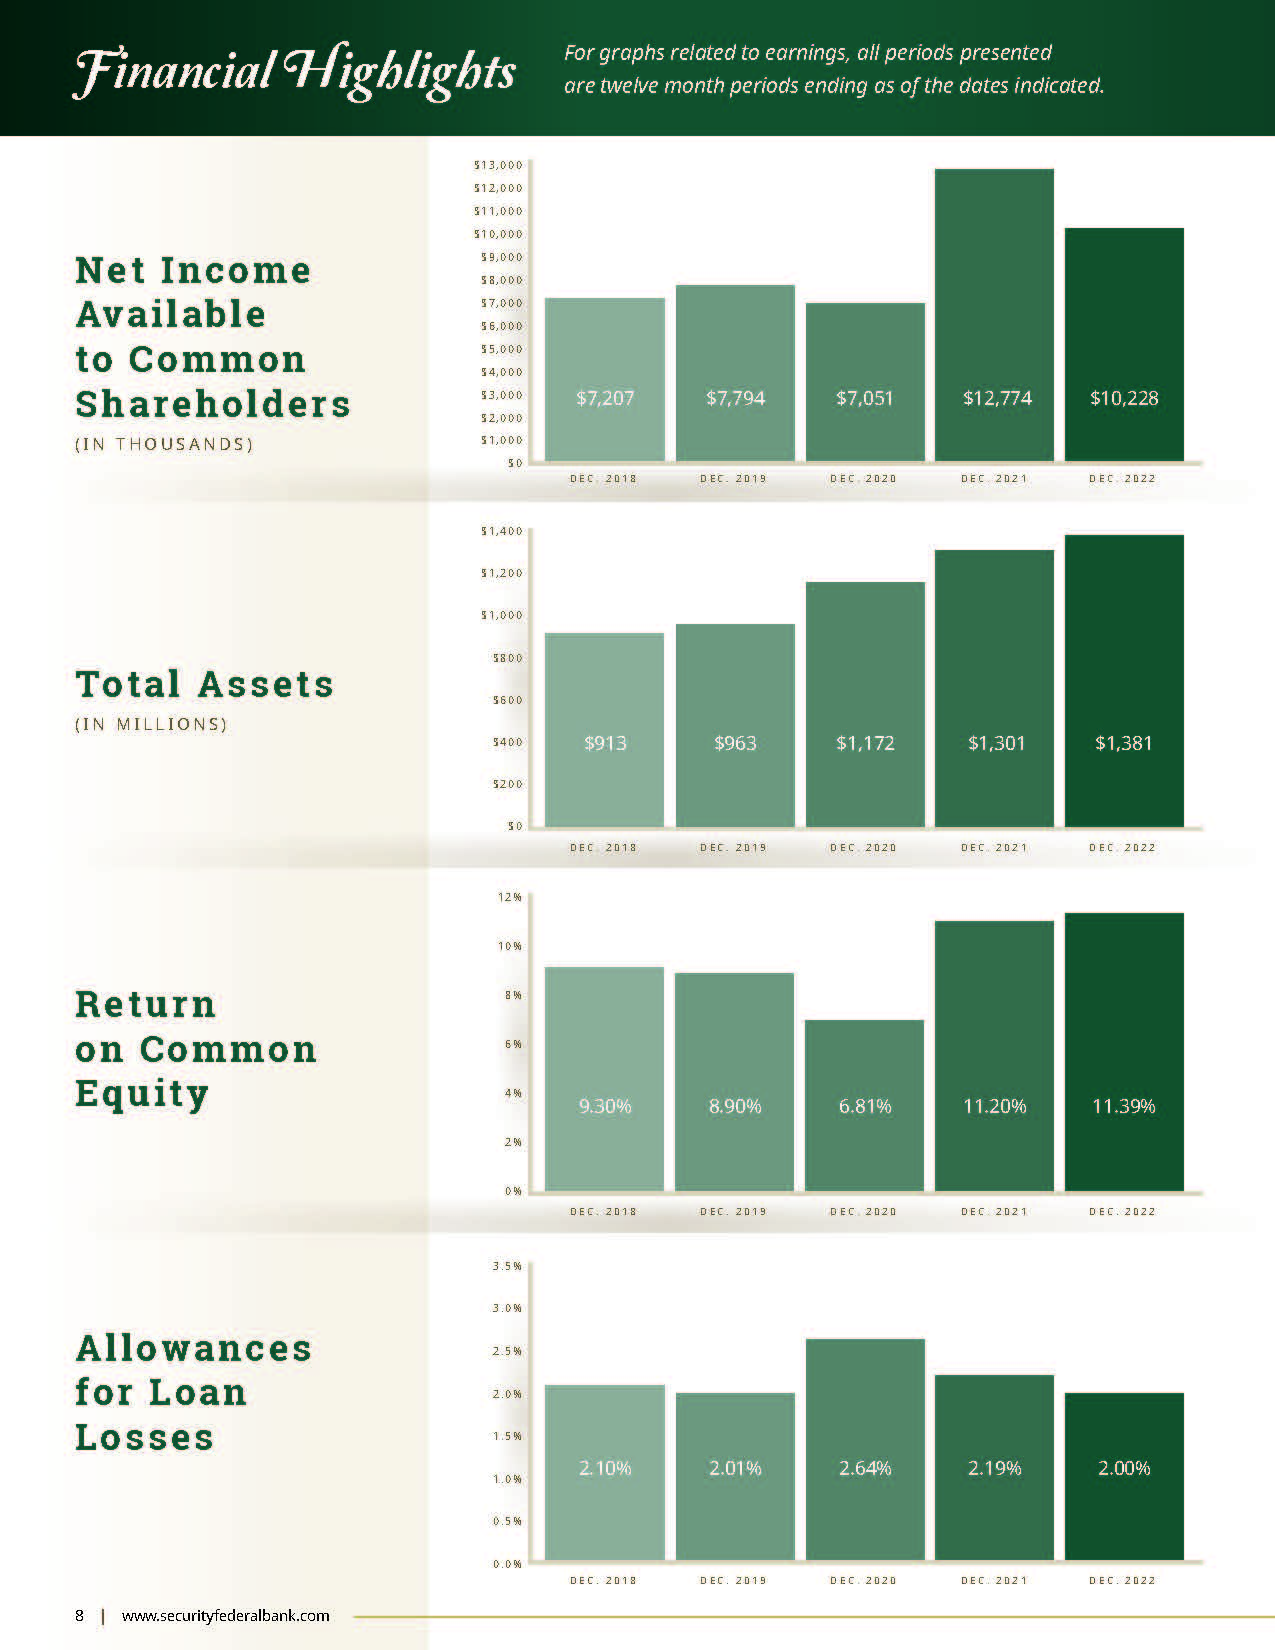
| Net Income | $ | 10,228 | | $ | 12,774 | | $ | 7,051 | | $ | 7,794 | | $ | 7,207 |
| | | | | | | | | |
| Per Common Share Data | | | | | | | | | |
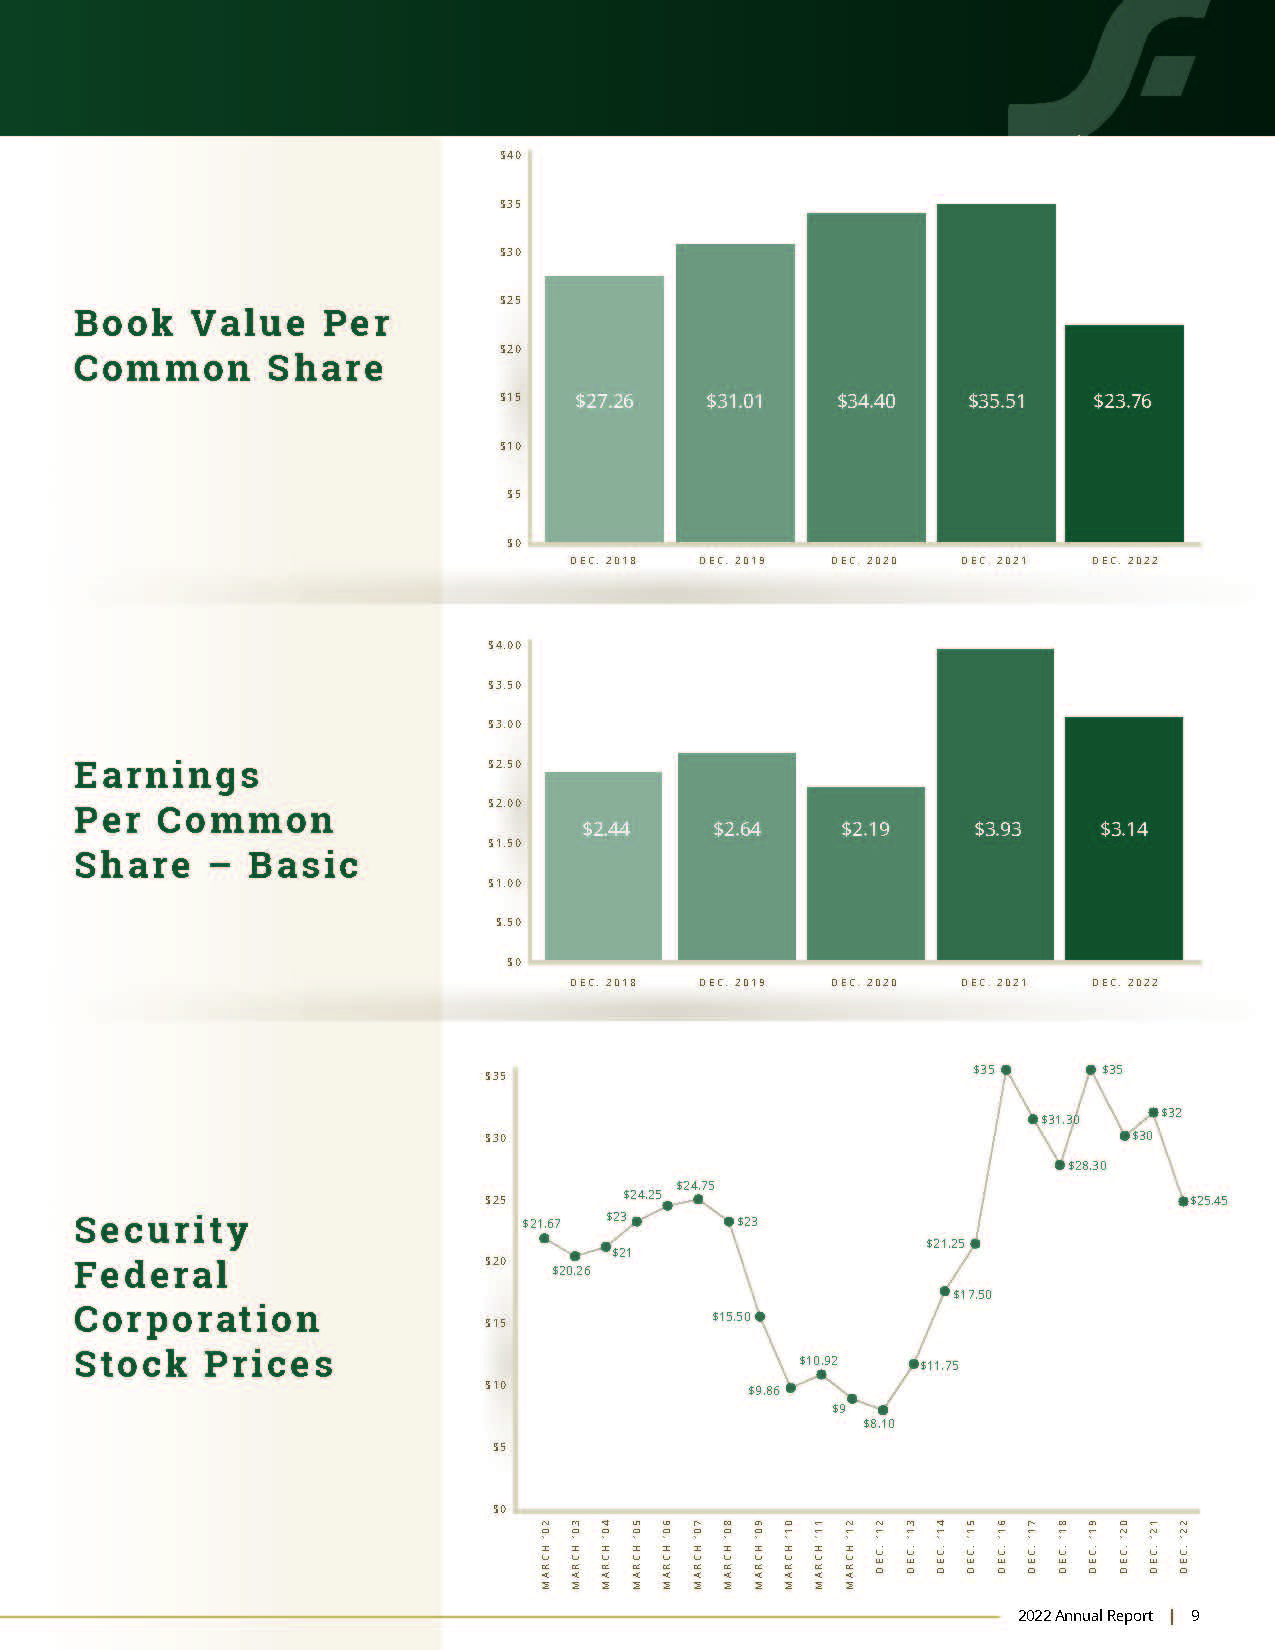
| Net Income Per Common Share (Basic) | $ | 3.14 | | $ | 3.93 | | $ | 2.19 | | $ | 2.64 | | $ | 2.44 |
| Cash Dividends Per Share | $ | 0.76 | | $ | 0.44 | | $ | 0.40 | | $ | 0.40 | | $ | 0.36 |
SECURITY FEDERAL CORPORATION AND SUBSIDIARIES
Selected Consolidated Financial and Other Data
| | | | | | | | | | | | | | | | | | | | | | | | | | | | | |
| | Year Ended December 31, |
| | 2022 | | 2021 | | 2020 | | 2019 | | 2018 |
| Other Data | | | | | | | | | |
| | | | | | | | | |
| Average Interest Rate Spread | 2.89 | % | | 2.87 | % | | 2.91 | % | | 3.10 | % | | 3.27 | % |
| | | | | | | | | |
| Net Interest Margin (Net Interest Income / Average Earning Assets) | 3.03 | % | | 2.97 | % | | 3.04 | % | | 3.26 | % | | 3.38 | % |
| Average Interest-Earning Assets to Average Interest-Bearing Liabilities | 134.63 | % | | 128.62 | % | | 120.99 | % | | 116.83 | % | | 116.01 | % |
| Common Equity to Total Assets | 5.59 | % | | 8.88 | % | | 9.55 | % | | 9.53 | % | | 8.82 | % |
Non-Performing Assets to Total Assets (2) | 0.46 | % | | 0.22 | % | | 0.31 | % | | 0.43 | % | | 0.85 | % |
| Return on Assets | 0.75 | % | | 1.04 | % | | 0.63 | % | | 0.80 | % | | 0.81 | % |
| Return on Common Equity | 11.39 | % | | 11.20 | % | | 6.81 | % | | 8.90 | % | | 9.30 | % |
| Average Common Equity to Average Assets Ratio | 6.63 | % | | 9.27 | % | | 9.32 | % | | 9.05 | % | | 8.69 | % |
Dividend Payout Ratio on Common Shares(3) | 24.17 | % | | 11.20 | % | | 18.46 | % | | 14.41 | % | | 14.76 | % |
| Number of Full-Service Offices | 18 | | | 17 | | | 17 | | | 17 | | | 16 | |
(1) INCLUDES LOANS HELD FOR SALE
(2) NON-PERFORMING ASSETS CONSIST OF NON-ACCRUAL LOANS AND OTHER REAL ESTATE OWNED ("OREO")
(3) RATIO OF DIVIDENDS PAID ON COMMON SHARES TO NET INCOME AVAILABLE TO COMMON SHAREHOLDERS
SECURITY FEDERAL CORPORATION AND SUBSIDIARIES
Management's Discussion and Analysis of Financial Condition and Results of Operations
General
The following discussion and analysis is presented to provide the reader with an understanding of the financial condition and the results of operations of Security Federal Corporation and its subsidiaries. The investment and other activities of the parent company, Security Federal Corporation (the “Company”), have had no significant impact on the results of operations for the periods presented in the Consolidated Financial Statements included herein. Because we conduct all of our material business operations through Security Federal Bank (the "Bank"), a wholly owned subsidiary of the Company, the following discussion of financial results are primarily indicative of the activities of the Bank. The Bank was founded in 1922 as a mutual building and loan association. In 1987, the Bank converted to a federally chartered stock savings bank. On December 28, 2011, the Bank completed a charter conversion from a federally chartered stock savings bank to a South Carolina chartered commercial bank. In connection with this transaction, the Company reorganized from a savings and loan holding company into a bank holding company.
The Bank has three wholly owned subsidiaries: Security Federal Investments, Inc. ("SFINV"), Security Federal Insurance, Inc. (“SFINS”) and Security Financial Services Corporation (“SFSC”). SFINV was formed to hold investment securities and allow for better management of the securities portfolio. SFINS is an insurance agency offering auto, business, and home insurance. Effective April 30, 2022, Collier Jennings Financial Corporation, a wholly owned subsidiary of SFINS, and its subsidiaries, Security Federal Auto Insurance, The Auto Insurance Store Inc., and Security Federal Premium Pay Plans Inc. ("SFPPP") and its wholly owned premium finance subsidiary were dissolved. SFPPP’s ownership interests in four other premium finance subsidiaries were disposed of at an immaterial gain. Additionally, effective April 30, 2022, previously inactive SFSC was dissolved.
In addition to the Bank, the Company has another wholly owned subsidiary, Security Federal Statutory Trust (the “Trust”), which issued and sold fixed and floating rate capital securities of the Trust. Under current accounting guidance, however, the Trust is not consolidated in the Company’s financial statements. Unless the context indicates otherwise, references to the "Company," "we," "us," and "our" shall include Security Federal Corporation, the Bank and the Bank's subsidiaries.
The principal business of the Bank is accepting deposits from the general public and originating consumer and commercial business loans as well as mortgage loans that enable borrowers to purchase or refinance one-to-four family residential real estate. The Bank also originates construction loans on single-family residences, multi-family dwellings, and commercial real estate, as well as loans for the acquisition, development and construction of residential subdivisions, and commercial projects. The Bank also provides trust services and it offers property and casualty insurance products through its subsidiary, SFINS.
The Bank's net income depends primarily on its interest rate spread which is the difference between the average yield earned on its loan and investment portfolios and the average rate paid on its deposits and borrowings. When the rate earned on interest-earning assets equals or exceeds the rate paid on interest-bearing liabilities, this positive interest rate spread will generate net interest income. The Bank’s interest spread is influenced by interest rates, deposit flows, and loan demands. Levels of non-interest income and operating expense are also significant factors in earnings.
Forward-Looking Statements
This document, including information incorporated by reference herein, may contain forward-looking statements within the meaning of the Private Securities Litigation Reform Act of 1995. These statements relate to our financial condition, results of operations, plans, objectives, future performance or business. Forward-looking statements are not statements of historical fact, are based on certain assumptions and are generally identified by use of the words "believes," "expects," "anticipates," "estimates," "forecasts," "intends," "plans," "targets," "potentially," "probably," "projects," "outlook" or similar expressions or future or conditional verbs such as "may," "will," "should," "would" and "could." Forward-looking statements include statements with respect to our beliefs, plans, objectives, goals, expectations, assumptions and statements about, among other things, expectations of the business environment in which we operate, projections of future performance or financial items, perceived opportunities in the market, potential future credit experience, and statements regarding our mission and vision. These forward-looking statements are based upon current management expectations and may, therefore, involve risk and uncertainties.
SECURITY FEDERAL CORPORATION AND SUBSIDIARIES
Management's Discussion and Analysis of Financial Condition and Results of Operations
Our actual results, performance, or achievements may differ materially from those suggested, expressed, or implied by forward-looking statements as a result of a wide variety or range of factors, including, but not limited to:
•potential adverse impacts to economic conditions in our local market areas, other markets where the Company has lending relationships, or other aspects of the Company's business operations or financial markets, generally, resulting from the ongoing novel coronavirus of 2019 (“COVID-19”) and any governmental or societal responses thereto;
•the credit risks of lending activities, including changes in the level and trend of loan delinquencies and write-offs and changes in our allowance for loan losses and provision for loan losses that may be affected by deterioration in the housing and commercial real estate markets which may lead to increased losses and non-performing assets in our loan portfolio, and may result in our allowance for loan losses not being adequate to cover actual losses, and require us to materially increase our allowance for loan losses;
•changes in general economic conditions, either nationally or in our market areas;
•changes in the levels of general interest rates, and the relative differences between short and long term interest rates, deposit interest rates, our net interest margin and funding sources;
•the transition away from London Interbank Offered Rate ("LIBOR") toward new interest rate benchmarks;
•fluctuations in the demand for loans, the number of unsold homes, land and other properties and fluctuations in real estate values in our market areas;
•secondary market conditions for loans and our ability to originate and sell loans in the secondary market;
•results of examinations of the Company by the Board of Governors of the Federal Reserve System ("Federal Reserve") and the Bank by the Federal Deposit Insurance Corporation ("FDIC") and the South Carolina State Board of Financial Institutions, or other regulatory authorities, including the possibility that any such regulatory authority may, among other things, require us to increase our reserve for loan losses, write-down assets, change our regulatory capital position or affect our ability to borrow funds or maintain or increase deposits, or impose additional requirements or restrictions on us, any of which could adversely affect our liquidity and earnings;
•legislative or regulatory changes that adversely affect our business, including changes in banking, securities and tax law, and in regulatory policies and principles, or the interpretation of regulatory capital or other rules, and including changes as a result of COVID-19;
•our ability to attract and retain deposits;
•our ability to control operating costs and expenses;
•our ability to implement our business strategies;
•the use of estimates in determining the fair value of certain of our assets, which estimates may prove to be incorrect and result in significant declines in valuation;
•difficulties in reducing risks associated with the loans on our balance sheet;
•staffing fluctuations in response to product demand or the implementation of corporate strategies that affect our workforce and potential associated charges;
•disruptions, security breaches, or other adverse events, failures or interruptions in, or attacks on, our information technology systems or on the third-party vendors who perform several of our critical processing;
•our ability to retain key members of our senior management team;
•costs and effects of litigation, including settlements and judgments;
•our ability to manage loan delinquency rates;
•increased competitive pressures among financial services companies;
•changes in consumer spending, borrowing and savings habits;
•the availability of resources to address changes in laws, rules, or regulations or to respond to regulatory actions;
•our ability to pay dividends on our common stock;
•adverse changes in the securities markets;
SECURITY FEDERAL CORPORATION AND SUBSIDIARIES
Management's Discussion and Analysis of Financial Condition and Results of Operations
•inability of key third-party providers to perform their obligations to us;
•changes in accounting policies and practices, as may be adopted by the financial institution regulatory agencies or the Financial Accounting Standards Board ("FASB"), including additional guidance and interpretation on accounting issues and details of the implementation of new accounting methods;
•other economic, competitive, governmental, regulatory, and technological factors affecting our operations, pricing, products and services; and
•the other risks described elsewhere in this annual report to shareholders and in the Company's other filings with the Securities and Exchange Commission, including its Annual Report on Form 10-K for the year ended December 31, 2022 ("2022 Form 10-K").
Some of these and other factors are discussed in the 2022 Form 10-K under Item 1A, “Risk Factors.” Such developments could have an adverse impact on our financial condition and results of operations.
Any of the forward-looking statements that we make may turn out to be inaccurate as a result of our beliefs and assumptions we make in connection with the factors set forth above or because of other unidentified and unpredictable factors. Because of these and other uncertainties, our actual future results may be materially different from the results indicated by these forward-looking statements and you should not rely on such statements. The Company undertakes no obligation to publish revised forward-looking statements to reflect the occurrence of unanticipated events or circumstances after the date hereof. These risks could cause our actual results for 2023 and beyond to differ materially from those expressed in any forward-looking statements by or on behalf of us, and could negatively affect the Company’s consolidated financial condition and consolidated results of operations, liquidity and stock price performance.
Critical Accounting Estimates
We prepare our consolidated financial statements in accordance with GAAP. In doing so, we have to make estimates and assumptions. Our critical accounting estimates are those estimates that involve a significant level of uncertainty at the time the estimate was made, and changes in the estimate that are reasonably likely to occur from period to period, or use of different estimates that we reasonably could have used in the current period, would have a material impact on our financial condition or results of operations. Accordingly, actual results could differ materially from our estimates. We base our estimates on past experience and other assumptions that we believe are reasonable under the circumstances, and we evaluate these estimates on an ongoing basis. We have reviewed our critical accounting estimates with the audit committee of our Board of Directors.
The significant accounting policies of the Company are described in Note 1 of the Notes to the Consolidated Financial Statements included herein.
The Company believes the allowance for loan losses is a critical accounting policy that requires the most significant judgments, estimates and assumptions used in preparation of the Consolidated Financial Statements. The impact of an unexpected large loss could deplete the allowance and potentially require increased provisions to replenish the allowance, which would negatively affect earnings. The Company provides for loan losses using the allowance method. Accordingly, all loan losses are charged to the related allowance and all recoveries are credited to the allowance for loan losses. Additions to the allowance for loan losses are provided by charges to operations based on various factors, which, in management’s judgment, deserve current recognition in estimating possible losses. Such factors considered by management include the fair value of the underlying collateral, stated guarantees by the borrower (if applicable), the borrower’s ability to repay from other economic resources, growth and composition of the loan portfolio, the relationship of the allowance for loan losses to the outstanding loans, loss experience, delinquency trends, and general economic conditions. Management evaluates the carrying value of the loan portfolio monthly and adjusts the allowance accordingly. While management uses the best information available to make evaluations, future adjustments may be necessary if economic conditions differ substantially from the assumptions used in making these evaluations. The allowance for loan losses is subject to periodic evaluations by bank regulatory agencies that may require adjustments to the allowance based upon the information that is available at the time of their examination. For a further discussion of the Company’s estimation process and methodology related to the allowance for loan losses, see the discussion under the section entitled “Financial Condition” and “Comparison of the Years Ended December 31, 2022 and 2021-Provision for Loan Losses” included herein.
SECURITY FEDERAL CORPORATION AND SUBSIDIARIES
Management's Discussion and Analysis of Financial Condition and Results of Operations
The Company values an impaired loan at the loan’s fair value if it is probable that the Company will be unable to collect all amounts due according to the contractual terms of the original loan agreement. Impaired loans are measured at the present value of expected cash flows, the market price of the loan, if available, or the value of the underlying collateral. Expected cash flows are required to be discounted at the loan’s effective interest rate. When the ultimate collectability of an impaired loan’s principal is in doubt, wholly or partially, all payments received are applied to principal. Once the recorded principal balance has been reduced to zero, any additional payments received are applied to interest income to the extent that any interest has been foregone. Any additional payments received are recorded as recoveries of any amounts previously charged off. When the repayment of the loan is not in doubt, payments are applied under the contractual terms of the loan agreement first to interest and then to principal.
The Company uses assumptions and estimates in determining income taxes payable or refundable for the current year, deferred income tax liabilities and assets for events recognized differently in its financial statements and income tax returns, and income tax expense. Determining these amounts requires analysis of certain transactions and interpretation of tax laws and regulations.
The Company exercises considerable judgment in evaluating the amount and timing of recognition of the resulting tax liabilities and assets. These judgments and estimates are reevaluated on a continual basis as regulatory and business factors change.
No assurance can be given that either the tax returns submitted by the Company or the income tax reported on the Consolidated Financial Statements will not be adjusted by either adverse rulings by the United States Tax Court, changes in the tax code, or assessments made by the Internal Revenue Service.
Asset and Liability Management
The objective of the Bank’s program of asset and liability management is to limit the Bank’s vulnerability to material and prolonged increases or decreases in interest rates, or "interest rate risk." As a financial institution, interest rate risk is the Bank's most significant market risk. The earnings and economic value of our shareholders’ equity varies in relation to changes in interest rates and the corresponding impact on the market values of our assets and liabilities. The Bank has an Asset Liability Management Committee (“ALCO”) who monitors the Bank’s asset liability strategy.
The asset/liability management process is designed to achieve relatively stable net interest margins and assure liquidity by coordinating the volumes, maturities or re-pricing opportunities of interest-earning assets, deposits and borrowed funds. It is the responsibility of the ALCO to determine and achieve the most appropriate volume and mix of interest-earning assets and interest-bearing liabilities, as well as ensure an adequate level of liquidity and capital, within the context of corporate performance goals. The ALCO meets regularly to review interest rate risk and liquidity in relation to present and potential market conditions and evaluate funding and balance sheet management strategies to ensure the level of risk is consistent with our asset/liability objectives.
Simulation is the principal tool used by the Bank in its ongoing effort to measure interest rate risk. Simulation involves the use of a financial modeling system that provides reports showing the current and future impact of changes in interest rates and our strategies and tactics. The Bank uses two dynamic methods: net interest income (“NII”) simulation and economic value of equity (“EVE”) analysis. The NII simulation models the impact that changes in interest rates will have on our earnings while EVE analysis models the impact those changes will have on the net present value of our asset and liability portfolios. These models take into account our contractual agreements with regard to investments, loans, deposits and borrowings, and also include assumptions surrounding market and customer behavior under different rate scenarios. The assumptions we use are based upon a combination of proprietary and market data that reflect historical results and current market conditions. These assumptions relate to interest rates, prepayments, deposit decay rates and the market value of certain assets and liabilities under the various interest rate scenarios. We use market data to determine prepayments and maturities of loans, investments and borrowings and use our own assumptions on deposit decay rates except for time deposits. Time deposits are modeled to reprice to market rates upon their stated maturities. We also assume that non-maturity deposits can be maintained with rate adjustments not directly proportionate to the change in market interest rates, based upon our historical deposit rates. We have demonstrated in the past that the tiering structure of our deposit accounts during changing rate environments results in relatively lower volatility and less than market rate changes in our interest expense for deposits. These assumptions are based upon our analysis of our customer base, competitive factors and historical experience.
SECURITY FEDERAL CORPORATION AND SUBSIDIARIES
Management's Discussion and Analysis of Financial Condition and Results of Operations
While these models are dependent on the accuracy of the assumptions that underlie the process, we believe that such modeling provides a better illustration of our sensitivity to interest rate risk than does a traditional static gap analysis. These tools provide our ALCO with the capability to estimate and manage the amount of earnings at risk in future periods and in selected interest rate risk environments.
NII Simulation- The Bank’s primary focus is on NII simulation. Using NII simulation, the Bank measures earnings exposure over both a 12 and 24 month period under multiple instantaneous rate shock scenarios. The Bank’s policy provides the maximum acceptable negative impact on net interest income and return on assets ("ROA") over each time horizon associated with each respective change in interest rates. Our ALCO monitors compliance with these policy limits and reports them to the Board of Directors quarterly.
The following table indicates the NII simulation scenarios modeled and the applicable policy parameters.
| | | | | | | | | | | | | | | | | | | | |
| Change in Market Rates | | Maximum Allowable Change in NII Over | | Maximum Allowable Change in ROA Over |
| (in Basis Points) | | 12 Months | 24 Months | | 12 Months | 24 Months |
| 400 | | (20)% | (20)% | | (40)% | (40)% |
| 300 | | (15)% | (15)% | | (30)% | (30)% |
| 200 | | (10)% | (10)% | | (20)% | (20)% |
| 100 | | (7.5)% | (7.5)% | | (10)% | (10)% |
| — | | —% | —% | | —% | —% |
| (100) | | (7.5)% | (7.5)% | | (10)% | (10)% |
| (200) | | (10)% | (10)% | | (20)% | (20)% |
| (300) | | (15)% | (15)% | | (30)% | (30)% |
| (400) | | (20)% | (20)% | | (40)% | (40)% |
The Bank performs a liquidity analysis, a component of managing liquidity risk and monitoring the Bank's asset liability strategy. This analysis compares outstanding sources of liquidity to applicable policy parameters. The Bank was in compliance with policy parameters as of December 31, 2022 and 2021. In addition, the Bank performs a Contingency Funding plan analysis which incorporates various simulations in order to evaluate Bank's funding resources under stressed conditions. Both the liquidity and Contingency Funding plan analysis are performed by the Bank's ALCO and presented to the Board of Directors quarterly.
SECURITY FEDERAL CORPORATION AND SUBSIDIARIES
Management's Discussion and Analysis of Financial Condition and Results of Operations
EVE simulation- The EVE analysis serves as an indicator of the extent to which the present value of our capital could change, given potential changes in interest rates. The difference represented by the present value of assets minus the present value of liabilities is defined as the economic value of equity. This measure assumes a static balance sheet and does not incorporate any growth assumptions, but does assume loan prepayments and certain other cash flows occur. It provides a measure of rate risk extending beyond the 12 or 24 month time horizon contained in the NII simulation analyses.
While an instantaneous and severe shift in interest rates is used in this analysis to provide an estimate of exposure under an extremely adverse scenario, a gradual shift in interest rates would have a much more modest impact. Since EVE measures the discounted present value of cash flows over the estimated lives of instruments, the change in EVE does not directly correlate to the degree that earnings would be impacted over a shorter time horizon, i.e., the next fiscal year. Further, EVE does not take into account factors such as future balance sheet growth, changes in product mix, change in yield curve relationships, and changing product spreads that could mitigate the adverse impact of changes in interest rates.
The following table indicates the EVE simulation scenarios modeled and the applicable policy parameters.
| | | | | | | | |
| Change in Market Rates (In Basis Points) | | Maximum Change in Economic Value of Equity |
| 400 | | (40)% |
| 300 | | (30)% |
| 200 | | (20)% |
| 100 | | (10)% |
| — | | —% |
| (100) | | (10)% |
| (200) | | (20)% |
| (300) | | (30)% |
| (400) | | (40)% |
In evaluating the Bank's exposure to interest rate risk, certain shortcomings inherent in the method of analysis described above are considered. No assurance can be given that changing economic conditions and other relevant factors impacting our net interest income will not cause actual occurrences to differ from underlying assumptions. For example, loan repayment rates and withdrawals of deposits will likely differ substantially from the assumptions used in the simulation models in the event of significant changes in interest rates due to the option of borrowers to prepay their loans and the ability of depositors to withdraw funds prior to maturity. In addition, this analysis does not consider any strategic changes to our balance sheet which management may consider as a result of changes in market conditions.
SECURITY FEDERAL CORPORATION AND SUBSIDIARIES
Management's Discussion and Analysis of Financial Condition and Results of Operations
Financial Condition - Assets
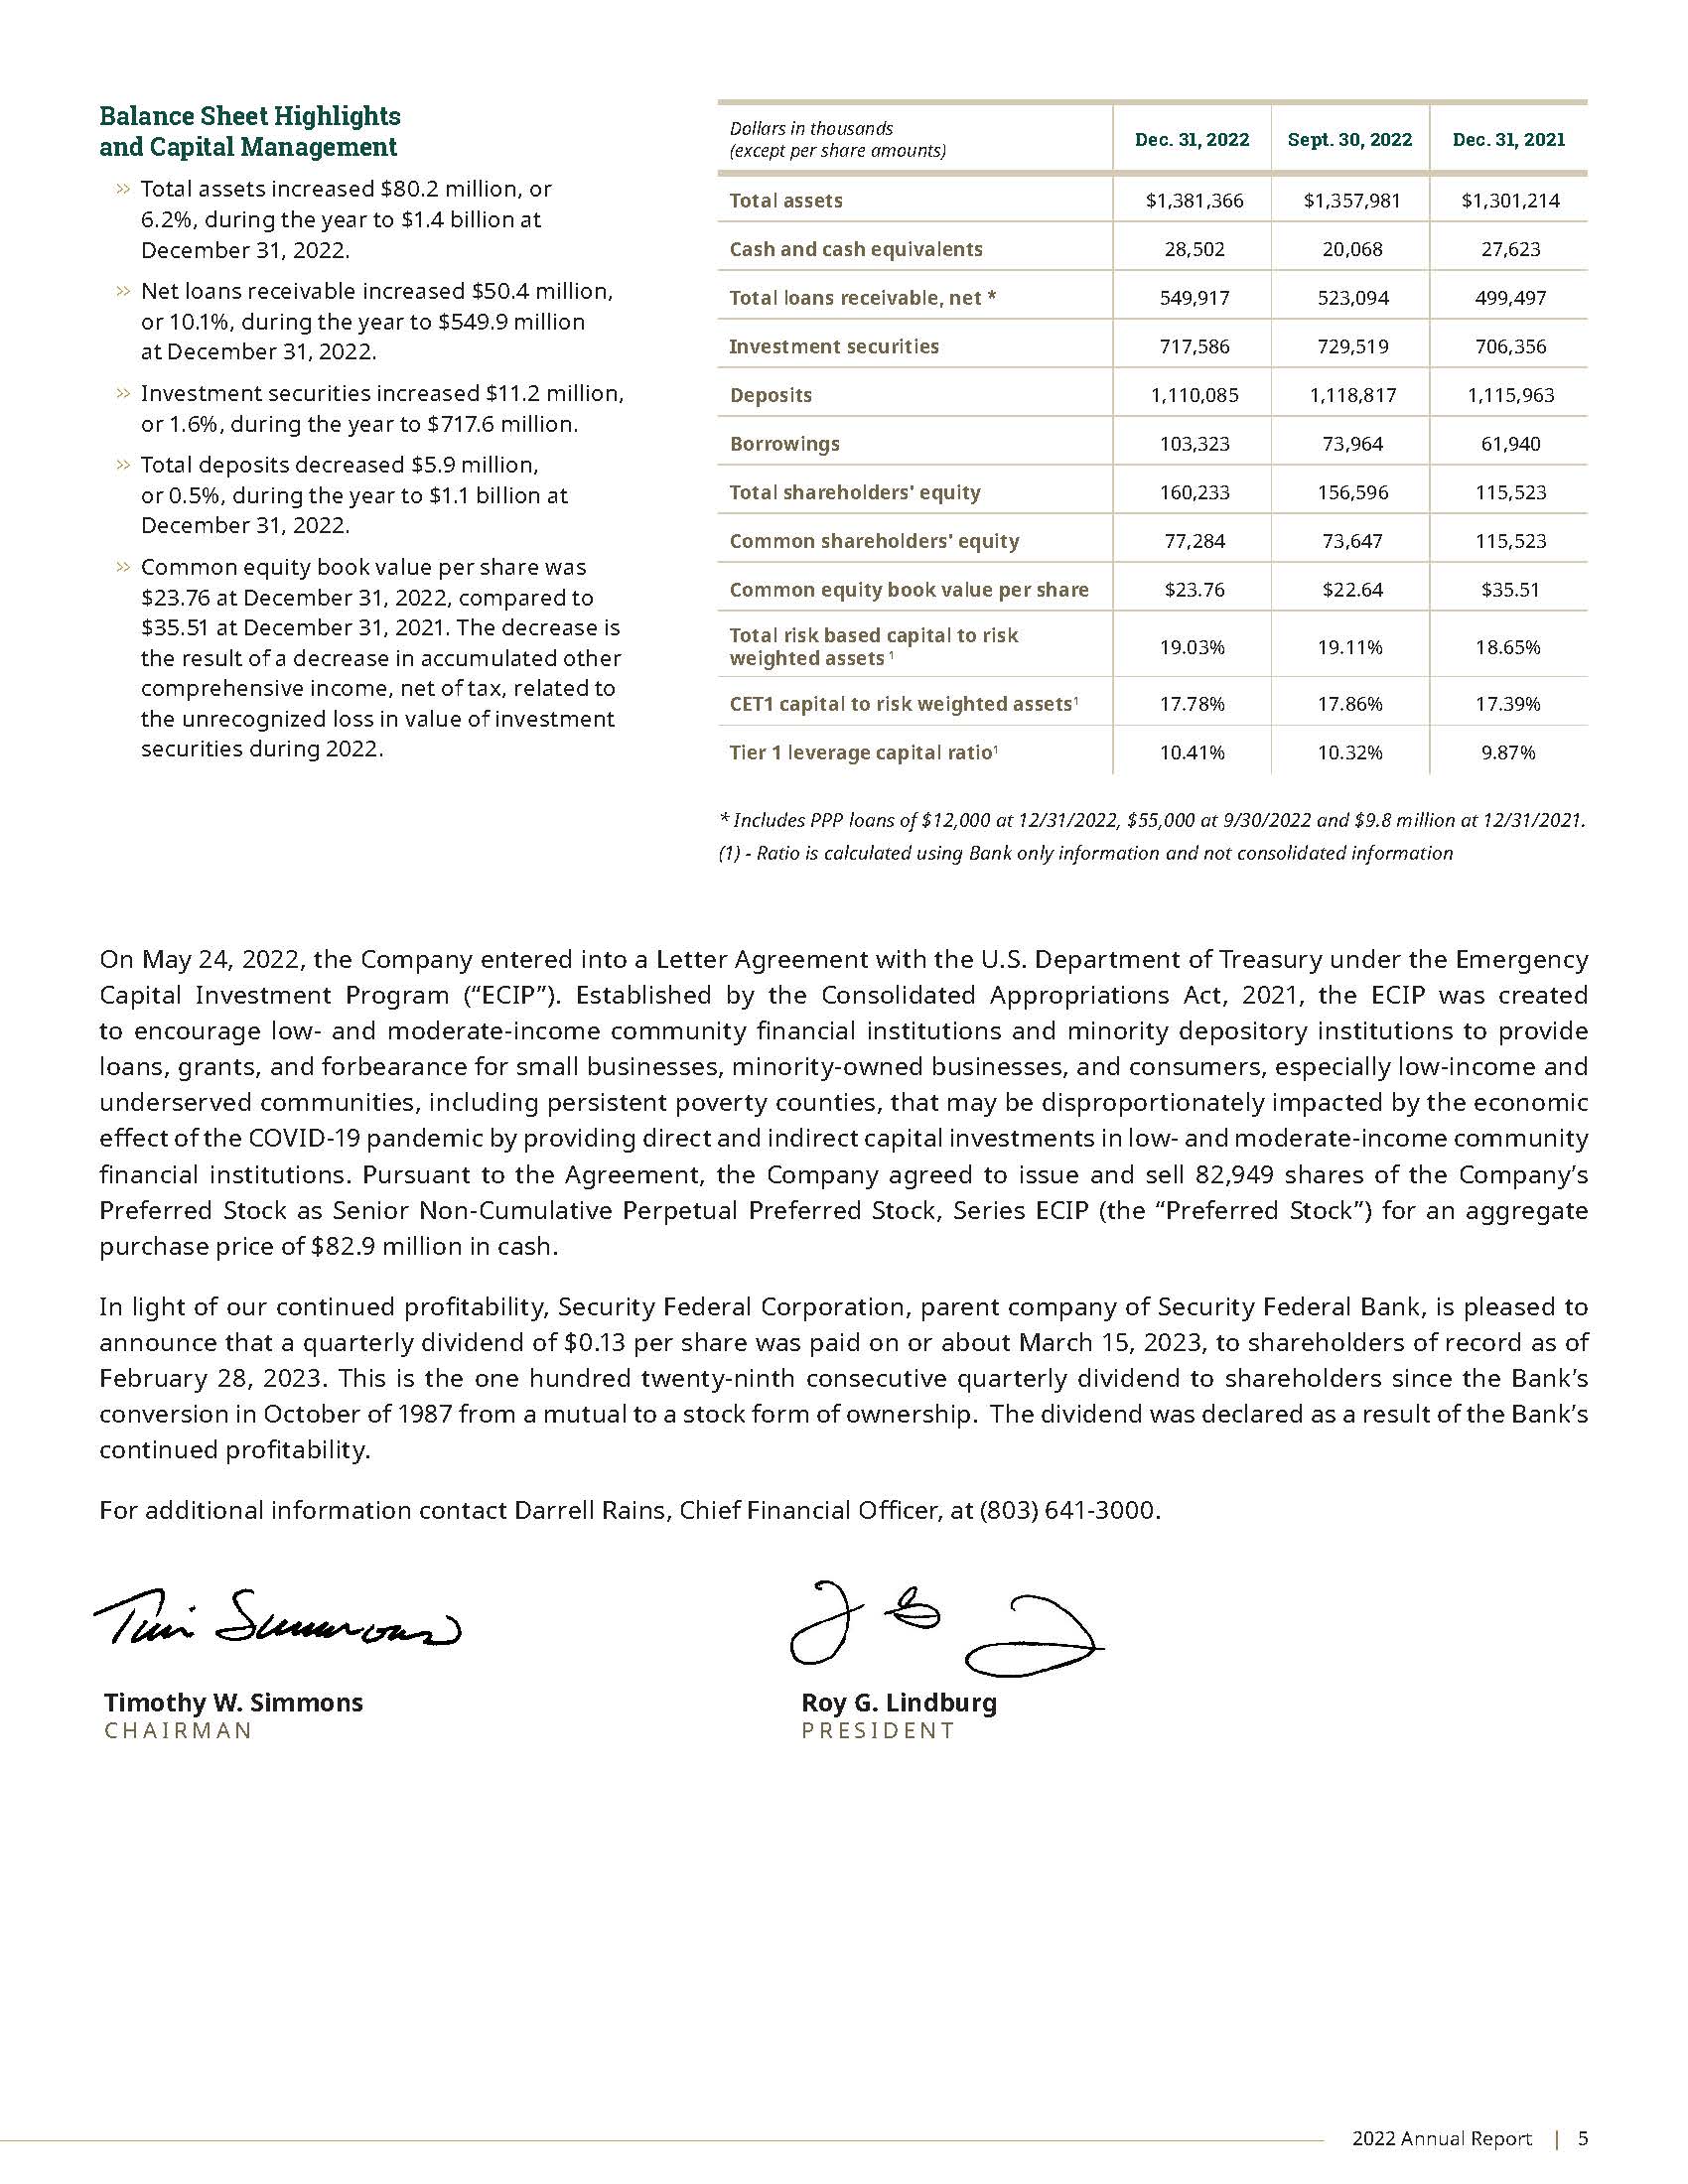
Total assets increased $80.2 million or 6.2% to $1.4 billion at December 31, 2022 from $1.3 billion at December 31, 2021. This increase was primarily due to increases in held to maturity ("HTM") investment securities, net loans receivable and, to a lesser extent other assets, partially offset by a decrease in available for sale ("AFS") investment securities.
Cash and cash equivalents increased $879,000 or 3.2% to $28.5 million at December 31, 2022 compared to $27.6 million at December 31, 2021. Total investment securities increased $11.2 million or 1.6% to $717.6 million at December 31, 2022 from $706.4 million at December 31, 2021 as purchases of investments exceeded maturities, sales and principal paydowns during the year. The Company purchased $210.3 million of investment securities during the year ended December 31, 2022 compared to $217.6 million during the prior year and sold $22.4 million of AFS investment securities during the year ended December 31, 2022 compared to no sales during 2021.
Loans receivable, net, including loans held for sale, increased $50.4 million or 10.1% to $549.9 million at December 31, 2022 from $499.5 million at December 31, 2021 primarily due to increases in construction, residential mortgage and commercial real estate loans. In addition, home equity lines of credit ("HELOCs") and other consumer loans also increased while commercial and agricultural loans decreased during 2022 compared to 2021.
Construction loans increased $12.6 million or 12.6% to $112.8 million at December 31, 2022 from $100.2 million at December 31, 2021. Residential mortgage loans held for investment increased $25.1 million or 29.5% to $110.1 million at December 31, 2022 from $85.0 million at December 31, 2021. Commercial real estate loans increased $24.4 million or 10.7% to $252.2 million at December 31, 2022 from $227.8 million at December 31, 2021.
Commercial and agricultural loans decreased $14.1 million or 31.4% to $30.6 million at December 31, 2022 from $44.7 million at December 31, 2021.
HELOCs increased $3.1 million or 10.9% to $31.7 million at December 31, 2022 from $28.6 million at December 31, 2021. Other consumer loans increased $2.2 million or 10.0% to $23.6 million at December 31, 2022 from $21.4 million at December 31, 2021.
Loans held for sale, comprised of fixed rate residential loans, decreased $3.1 million or 77.4% to $913,000 at December 31, 2022 from $4.0 million at December 31, 2021. Typically, long term, newly originated fixed rate residential real estate loans are not retained in the portfolio but are sold immediately in contrast to adjustable rate mortgage ("ARM") loans, which are generally retained in the portfolio. The Bank sells all its fixed rate residential loans on a service-released basis. Fixed rate residential loans sold to institutional investors, on a service-released basis totaled $48.5 million during the year ended December 31, 2022, $112.9 million during the year ended December 31, 2021 and $111.1 million during the year ended December 31, 2020.
Property and equipment, net increased $2.8 million or 10.8% to $28.0 million at December 31, 2022 from $25.2 million at December 31, 2021 due to capital costs related to branch improvements and construction of the Bank's newest branch.
Other assets increased $14.0 million or 267.2% to $19.2 million at December 31, 2022 from $5.2 million at December 31, 2021. The increase was primarily the result of a $14.6 million increase in net deferred taxes, which was related to increased unrealized losses in the AFS investment securities.
SECURITY FEDERAL CORPORATION AND SUBSIDIARIES
Management's Discussion and Analysis of Financial Condition and Results of Operations
Financial Condition - Non-Performing Assets
The Bank’s non-performing assets, which consist of non-accrual loans and OREO, increased $3.6 million or 127.3% to $6.4 million at December 31, 2022 from $2.8 million at December 31, 2021. Non-performing assets represented 0.5% and 0.2% of total assets at December 31, 2022 and 2021, respectively.
| | | | | | | | | | | | | | | | | | | | | | | | | | | | | | | | | | | |
| | At December 31, 2022 | | At December 31, 2021 | | $ | | % |
| (Dollars in thousands) | Amount | | Percent (1) | | Amount | | Percent (1) | | Change | | Change |
| Non-Performing Loans: | | | | | | | | | | | |
| Construction | $ | 115 | | 0.02 | % | | $ | 21 | | — | % | | $ | 94 | | | 447.6 | % |
| Residential Mortgage | 1,545 | | 0.28 | | | 1,389 | | 0.28 | | | 156 | | | 11.2 | |
| Commercial Real Estate | 4,282 | | 0.76 | | | 1,057 | | 0.21 | | | 3,225 | | | 305.1 | |
| Commercial and Agricultural | 113 | | 0.02 | | | 64 | | 0.01 | | | 49 | | | 76.6 | |
| HELOC | 189 | | 0.03 | | | 142 | | 0.03 | | | 47 | | | 33.1 | |
| Other Consumer | 29 | | 0.01 | | | 9 | | — | | | 20 | | | 222.2 | |
| Total Non-Performing Loans | 6,273 | | 1.12 | % | | 2,682 | | 0.53 | % | | 3,591 | | | 133.9 | % |
| | | | | | | | | | | |
| Other Non-Performing Assets: | | | | | | | | | | | |
| OREO | 120 | | 0.02 | % | | 130 | | 0.03 | % | | (10) | | | (7.7) | % |
| | | | | | | | | | | |
| Total Non-Performing Assets | $ | 6,393 | | 1.14 | % | | $ | 2,812 | | 0.56 | % | | $ | 3,581 | | | 127.3 | % |
| Total Non-Performing Assets as a Percentage of Total Assets | 0.46 | % | | | | 0.22 | % | | | | | | |
(1) PERCENT OF GROSS LOANS RECEIVABLE HELD FOR INVESTMENT, NET OF DEFERRED FEES AND LOANS IN PROCESS.
Non-performing loans increased in all loan categories during 2022 compared to 2021. The largest increase in non-performing loans was in the commercial real estate loan category, which increased $3.2 million or 305.1% to $4.3 million at December 31, 2022 from $1.1 million at December 31, 2021. The balance in non-performing commercial real estate loans consisted of three loans to three borrowers with an average loan balance of $1.1 million at December 31, 2022 compared to eight loans to six borrowers with an average loan balance of $151,000 at December 31, 2021.
Non-performing residential loans, which represented the second largest category of non-performing loans, increased $156,000 or 11.2% to $1.5 million at December 31, 2022 from $1.4 million at December 31, 2021. Non-performing residential mortgage loans at December 31, 2022 consisted of 16 loans to 16 borrowers with an average loan balance of $97,000, the largest of which was $250,000, compared to 12 loans to 12 borrowers with an average loan balance of $116,000, the largest of which was $274,000, at December 31, 2021.
Our strategy is to work with our borrowers to reach acceptable payment plans while protecting our interests in the underlying collateral. In the event an acceptable arrangement cannot be reached, we may have to acquire these properties through foreclosure or other means and subsequently sell, develop, or liquidate them.
The balance of loans classified as troubled debt restructurings ("TDRs") decreased $309,000 or 44.5% during the year ended December 31, 2022. The Bank had two TDRs totaling $385,000 at December 31, 2022 compared to three TDRs totaling $694,000 at December 31, 2021. At both December 31, 2022 and 2021, all TDRs were non-accruing. All TDRs are reviewed for impairment loss and included in impaired loans until paid off. TDR loans can be classified as either accrual or non-accrual. TDR loans are classified as non-accrual loans unless they have been performing in accordance with their modified terms for a period of at least six months in which case they are placed on accrual status. At December 31, 2022, the Bank had $5.6 million of impaired loans, including $385,000 in TDRs, compared to $2.3 million impaired loans, including $694,000 in TDRs, at December 31, 2021.
OREO decreased $10,000 or 7.7% to $120,000 at December 31, 2022 from $130,000 at December 31, 2021. At December 31, 2022, the balance of OREO consisted of five acres of commercial land in Aiken, South Carolina.
SECURITY FEDERAL CORPORATION AND SUBSIDIARIES
Management's Discussion and Analysis of Financial Condition and Results of Operations
The Bank reviews its loan portfolio and allowance for loan losses on a monthly basis. When determining the appropriate allowance for loan losses during the years ended December 31, 2022 and 2021, management took into consideration such factors as the national and state unemployment rates and related trends, national and state unemployment benefit claim levels and related trends, the amount of and timing of financial assistance provided by the government, inflation, consumer spending levels and trends, industries significantly impacted by the COVID-19 pandemic and a review of the Bank's largest commercial loan relationships.
Effective January 1, 2023, the Bank adopted Accounting Standards Update (“ASU”) No. 2016-13, Financial Instruments - Credit Losses (Topic 326): Measurement of Credit Losses on Financial Instruments, also known as CECL. CECL replaces the incurred loss impairment framework in current GAAP. Adoption of this guidance resulted in a $2.0 million increase in the allowance for credit losses, comprised of increases in the allowance for loan losses of $800,000 and the reserve for unfunded commitments of $1.2 million. The cumulative effect adjustment to retained earnings was $1.6 million, net of tax. For additional information, refer to “Recently Issued or Adopted Accounting Standards” in Note 1 of the Notes to Consolidated Financial Statements included herein.
Management will continue to closely monitor economic conditions and will work with borrowers as necessary to assist them through this challenging economic climate. Future additions to the Bank's allowance for loan losses are dependent on, among other things, the performance of the Bank's loan portfolio, the economy, changes in real estate values, and interest rates. There can be no assurance that additions to the allowance will not be required in future periods. The determination of the appropriate level of the allowance for loan losses inherently involves a high degree of subjectivity and requires us to make significant estimates of current credit risks and future trends, all of which may undergo material changes.
Deterioration in economic conditions affecting borrowers, new information regarding existing loans, identification of additional problem loans and other factors, both within and outside of our control, may require an increase in the allowance for loan losses. The ultimate impact will depend on future developments, which are highly uncertain and cannot be predicted. In addition, bank regulatory agencies periodically review our allowance for loan losses and may require an increase in the provision for possible loan losses or the recognition of further loan charge-offs, based on judgments different than those of management. If charge-offs in future periods exceed the allowance for loan losses, we will need additional provisions to increase the allowance for loan losses. Any increases in the allowance for loan losses will result in a decrease in net income and, possibly, capital, and may have a material adverse effect on our financial condition and results of operations. Management continually monitors its loan portfolio for the impact of local economic changes. The ratio of the allowance for loan losses to total loans was 2.09% and 2.19% at December 31, 2022 and 2021, respectively.
SECURITY FEDERAL CORPORATION AND SUBSIDIARIES
Management's Discussion and Analysis of Financial Condition and Results of Operations
Financial Condition - Liabilities and Shareholders' Equity
Total deposits decreased $5.9 million or 0.5% to $1.11 billion at December 31, 2022 from $1.12 billion at December 31, 2021. The majority of the Bank’s deposits are originated within the Bank’s immediate market area. The Bank had brokered time deposits of $6.0 million and $10.0 million at December 31, 2022 and 2021, respectively. The Bank uses brokered time deposits to manage interest rate risk because they are accessible in bulk at rates typically only slightly higher than those in our market areas. A portion of these brokered time deposits give the Bank a call option that allows the Bank the choice to redeem them early should rates change. In addition, the Bank had $5.0 million in other brokered deposits at December 31, 2022. Total deposits at December 31, 2022, excluding brokered deposits, decreased $1.9 million or 0.2%. Brokered deposits were 1.0% and 1.3% of total deposits at December 31, 2022 and 2021, respectively.
Certificate of deposits that met or exceeded the FDIC insurance limit of $250,000 totaled $30.3 million and $39.4 million at December 31, 2022 and 2021, respectively. The following table summarizes the maturity schedule of certificates of deposit with a balance of $250,000 or more at December 31, 2022:
| | | | | |
| |
| | (In Thousands) |
| Within 3 Months | $ | 4,036 | |
| After 3 Months, Within 6 Months | 3,741 | |
| After 6 Months, Within 12 Months | 14,010 | |
| After 12 Months | 8,485 | |
| | $ | 30,272 | |
Total certificates of deposit scheduled to mature in one year or less totaled $96.2 million at December 31, 2022 compared to $118.1 million at December 31, 2021.
Management’s policy is to maintain deposit rates at levels that are competitive with other local financial institutions. Based on historical experience, we believe that a significant portion of maturing certificates of deposit will remain with the Bank.
The Bank had outstanding FHLB advances and borrowings from the "discount window" of the FRB of Atlanta totaling $0 and $44.1 million at December 31, 2022, respectively, compared to no such advances or borrowings at December 31, 2021. Depository institutions may borrow from the discount window for periods as long as 90 days, and borrowings are prepayable and renewable by the borrower on a daily basis.
Other borrowings increased $803,000 or 3.0% to $27.6 million at December 31, 2022 from $26.8 million at December 31, 2021. These borrowings consist of short-term repurchase agreements with certain commercial demand deposit customers for sweep accounts. The repurchase agreements typically mature within one to three days and the interest rate paid on these borrowings floats monthly with money market type rates. The interest rate paid on the repurchase agreements was 0.75% and 0.15% at December 31, 2022 and 2021, respectively. The Bank had pledged as collateral for these repurchase agreements AFS investment securities and HTM investment securities with amortized costs and fair values of $52.3 million and $49.8 million, at December 31, 2022, and $45.3 million and $45.2 million, at December 31, 2021, respectively.
At both December 31, 2022 and 2021, the Company had $5.2 million in junior subordinated debentures outstanding. In addition, the Company had $26.5 million and $30.0 million in subordinated debentures (“Notes”) outstanding at December 31, 2022 and 2021, respectively. During the year ended December 31, 2022, the Company repurchased $3.5 million in principal amount of the Notes. For additional information, refer to Note 12 and Note 14 of the Notes to Consolidated Financial Statements included herein.
Total shareholders' equity increased $44.7 million or 38.7% to $160.2 million at December 31, 2022 from $115.5 million at December 31, 2021. The increase was primarily attributable to an $82.9 million issuance of Senior Non-Cumulative Perpetual Preferred Stock, Series ECIP (the “Preferred Stock”) by the Company and net income of $10.2 million during 2022. These increases were partially offset by $2.5 million in dividends paid to common shareholders and a $46.0 million decrease in accumulated other comprehensive income, net of tax, related to the unrecognized loss in value of AFS investment securities during the year ended December 31, 2022. Book value per common share was $23.76 at December 31, 2022 compared to $35.51 at December 31, 2021.
SECURITY FEDERAL CORPORATION AND SUBSIDIARIES
Management's Discussion and Analysis of Financial Condition and Results of Operations
Results of Operations
The following table presents the dollar amount of changes in interest income and interest expense for major components of interest-earning assets and interest-bearing liabilities. The table also distinguishes between the changes related to higher or lower outstanding balances and the changes related to the volatility of interest rates. For each category of interest-earning assets and interest-bearing liabilities, information is provided on changes attributable to: (1) changes in rate (multiplied by prior year volume); (2) changes in volume (multiplied by prior year rate); and (3) net change (the sum of the prior columns). For purposes of this table, changes attributable to both rate and volume, which cannot be segregated, have been allocated proportionately to the change attributable to volume and the change attributable to rate. Changes in income are calculated on a tax equivalent basis using the effective tax rate for the period.
| | | | | | | | | | | | | | | | | | | | | | | | | | | | | | | | | | | |
| Years Ended December 31, |
| | 2022 vs. 2021 | | 2021 vs. 2020 |
| (Decrease) Increase Due to
Change in | | (Decrease) Increase Due to
Change in |
| (Dollars in Thousands) | Volume | | Rate | | Net | | Volume | | Rate | | Net |
| Interest-Earning Assets: | | | | | | | | | | | |
Loans: (1) | $ | 591 | | | $ | (2,150) | | | $ | (1,559) | | | $ | (2) | | | $ | 924 | | | $ | 922 | |
| Taxable Investment Securities | 1,784 | | | 5,410 | | | 7,194 | | | 2,176 | | | (2,948) | | | (772) | |
Non-taxable Investment Securities (2) | 16 | | | (395) | | | (379) | | | 283 | | | (327) | | | (44) | |
| Deposits in Other Banks | 34 | | | 154 | | | 188 | | | (38) | | | (31) | | | (69) | |
| Total Interest-Earning Assets | $ | 2,425 | | | $ | 3,019 | | | $ | 5,444 | | | $ | 2,419 | | | $ | (2,382) | | | $ | 37 | |
| Interest-Bearing Liabilities: | | | | | | | | | | | |
| Deposits: | | | | | | | | | | | |
| Certificate Accounts | $ | (133) | | | $ | (139) | | | $ | (272) | | | $ | (474) | | | $ | (1,414) | | | $ | (1,888) | |
| Other Interest Bearing Deposits | 103 | | | 1,449 | | | 1,552 | | | 209 | | | (616) | | | (407) | |
| Total Deposits | (30) | | | 1,310 | | | 1,280 | | | (265) | | | (2,030) | | | (2,295) | |
| Borrowings | (252) | | | 176 | | | (76) | | | (125) | | | (337) | | | (462) | |
| Total Interest-Bearing Liabilities | (282) | | | 1,486 | | | 1,204 | | | (390) | | | (2,367) | | | (2,757) | |
Effect on Net Tax Equivalent Interest Income (2) | $ | 2,707 | | | $ | 1,533 | | | $ | 4,240 | | | $ | 2,809 | | | $ | (15) | | | $ | 2,794 | |
(1) INTEREST ON NON-ACCRUAL LOANS IS NOT INCLUDED IN INCOME, ALTHOUGH THEIR LOAN BALANCES ARE INCLUDED IN AVERAGE LOANS OUTSTANDING.
(2)THE TAX-EQUIVALENT INTEREST INCOME ADJUSTMENT RELATES TO THE TAX EXEMPT MUNICIPAL BONDS
SECURITY FEDERAL CORPORATION AND SUBSIDIARIES
Management's Discussion and Analysis of Financial Condition and Results of Operations
Average Balances, Interest Income and Expenses, and Average Yields and Rates
The following table compares detailed average balances, average yields on interest earning assets, and average costs of interest bearing liabilities at December 31, 2022 and 2021. The average balances were derived from the daily balances throughout the periods indicated. The average yields or costs were calculated by dividing the income or expense by the average balance of the corresponding assets or liabilities. Nonaccrual loans are included in earning assets in the following tables. Loan yields have been reduced to reflect the negative impact on our earnings of loans on nonaccrual status.
| | | | | | | | | | | | | | | | | | | | | | | | | | | | | | | | | | | | |
| | | For the Year Ended December 31, |
| | | 2022 | | 2021 |
| (Dollars in thousands) | | Average Balance | | Interest | | Yield/Rate | | Average Balance | | Interest | | Yield/Rate |
| Interest-Earning Assets: | | | | | | | | | | | | |
| | | | | | | | | | | | |
| | | | | | | | | | | | |
Loans (1) | | $ | 525,396 | | | $ | 25,637 | | | 4.88 | % | | $ | 513,987 | | | $ | 27,196 | | | 5.29 | % |
Taxable Investment Securities | | 695,960 | | | 16,145 | | | 2.32 | % | | 591,387 | | | 8,952 | | | 1.51 | % |
Non-taxable Investments (2) | | 23,651 | | | 846 | | | 3.58 | % | | 23,351 | | | 1,225 | | | 5.25 | % |
| Deposits in Other Banks | | 3,649 | | | 203 | | | 5.56 | % | | 1,639 | | | 14 | | | 0.85 | % |
| Total Interest-Earning Assets | | $ | 1,248,656 | | | $ | 42,831 | | | 3.43 | % | | $ | 1,130,364 | | | $ | 37,387 | | | 3.31 | % |
| Interest-Bearing Liabilities: | | | | | | | | | | | | |
| | | | | | | | | | | | |
| | | | | | | | | | | | |
| | | | | | | | | | | | |
| | | | | | | | | | | | |
| Checking, Savings and Money Market Accounts | | $ | 703,914 | | | $ | 2,304 | | | 0.33 | % | | $ | 616,098 | | | $ | 752 | | | 0.12 | % |
| Certificate Accounts | | 143,619 | | | 607 | | | 0.42 | % | | 172,995 | | | 879 | | | 0.51 | % |
| Total Interest-Bearing Deposits | | 847,533 | | | 2,911 | | | 0.34 | % | | 789,093 | | | 1,631 | | | 0.21 | % |
| | | | | | | | | | | | |
| Junior Subordinated Debt | | 5,155 | | | 180 | | | 3.49 | % | | 5,155 | | | 97 | | | 1.88 | % |
| Subordinated Debt | | 29,332 | | | 1,548 | | | 5.28 | % | | 30,000 | | | 1,575 | | | 5.25 | % |
FHLB Advances and Other Borrowings (3) | | 45,477 | | | 389 | | | 0.86 | % | | 54,593 | | | 521 | | | 0.95 | % |
| Total Interest-Bearing Liabilities | | $ | 927,497 | | | $ | 5,028 | | | 0.54 | % | | $ | 878,841 | | | $ | 3,824 | | | 0.44 | % |
| Net Interest Rate Spread | | | | | | 2.89 | % | | | | | | 2.87 | % |
Tax Equivalent Net Interest Income/Margin (2) | | | | $ | 37,803 | | | 3.03 | % | | | | $ | 33,563 | | | 2.97 | % |
Less: tax equivalent adjustment (2) | | | | 253 | | | | | | | 270 | | | |
| Net Interest Income | | | | $ | 37,550 | | | | | | | $ | 33,293 | | | |
(1) INTEREST INCOME FROM OTHER LOANS INCLUDED IN THE TABLES ABOVE AND BELOW INCLUDES DEFERRED PPP LOAN FEES OF $441,000 AND $4.7 MILLION RECOGNIZED DURING THE YEARS ENDED DECEMBER 31, 2022 AND 2021, RESPECTIVELY.
(2)TAX EQUIVALENT BASIS RECOGNIZES THE INCOME TAX SAVINGS WHEN COMPARING TAXABLE AND TAX-EXEMPT ASSETS AND WAS CALCULATED USING THE EFFECTIVE TAX RATE IN PLACE FOR THE YEARS ENDED DECEMBER 31, 2022 AND 2021. THE TAX-EQUIVALENT INTEREST INCOME ADJUSTMENT RELATES TO THE TAX EXEMPT MUNICIPAL BONDS INCLUDED IN OUR INVESTMENT PORTFOLIO DURING THE PERIODS INDICATED.
(3)INCLUDES FHLB ADVANCES, BORROWINGS FROM THE FRB AND REPURCHASE AGREEMENTS.
.
.
SECURITY FEDERAL CORPORATION AND SUBSIDIARIES
Management's Discussion and Analysis of Financial Condition and Results of Operations
Comparison of the Years Ended December 31, 2022 and 2021
Net Income
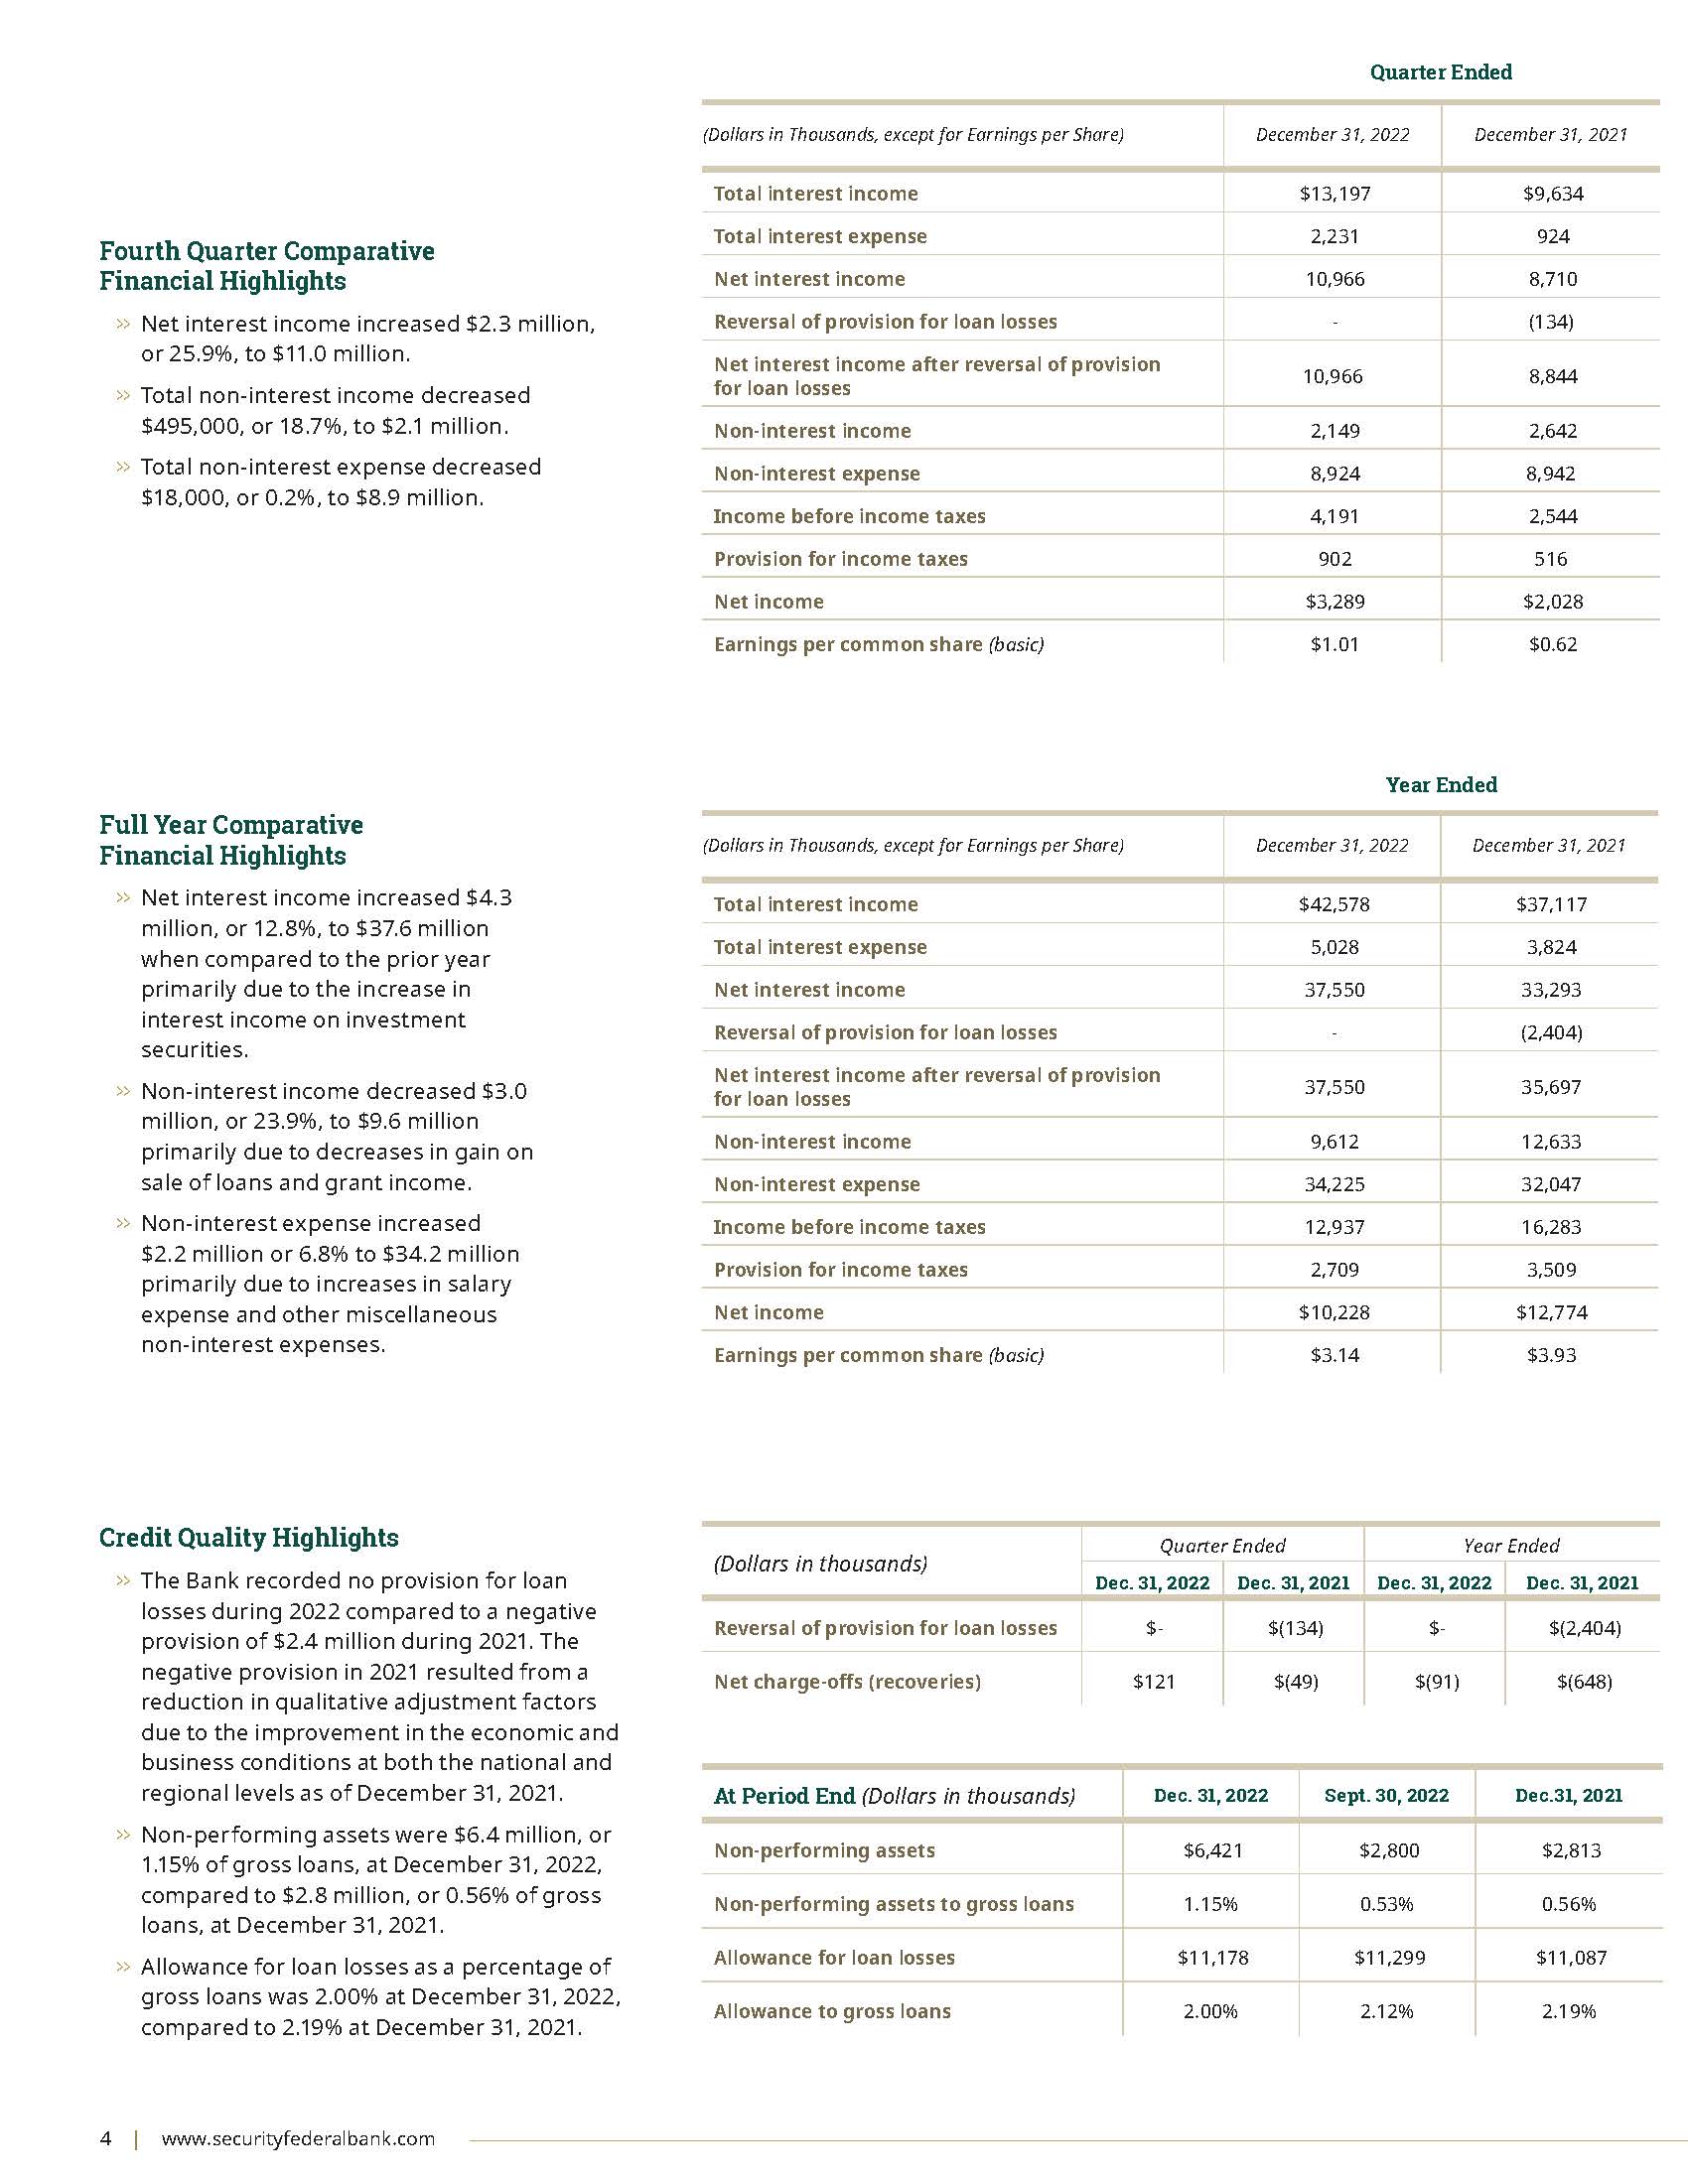
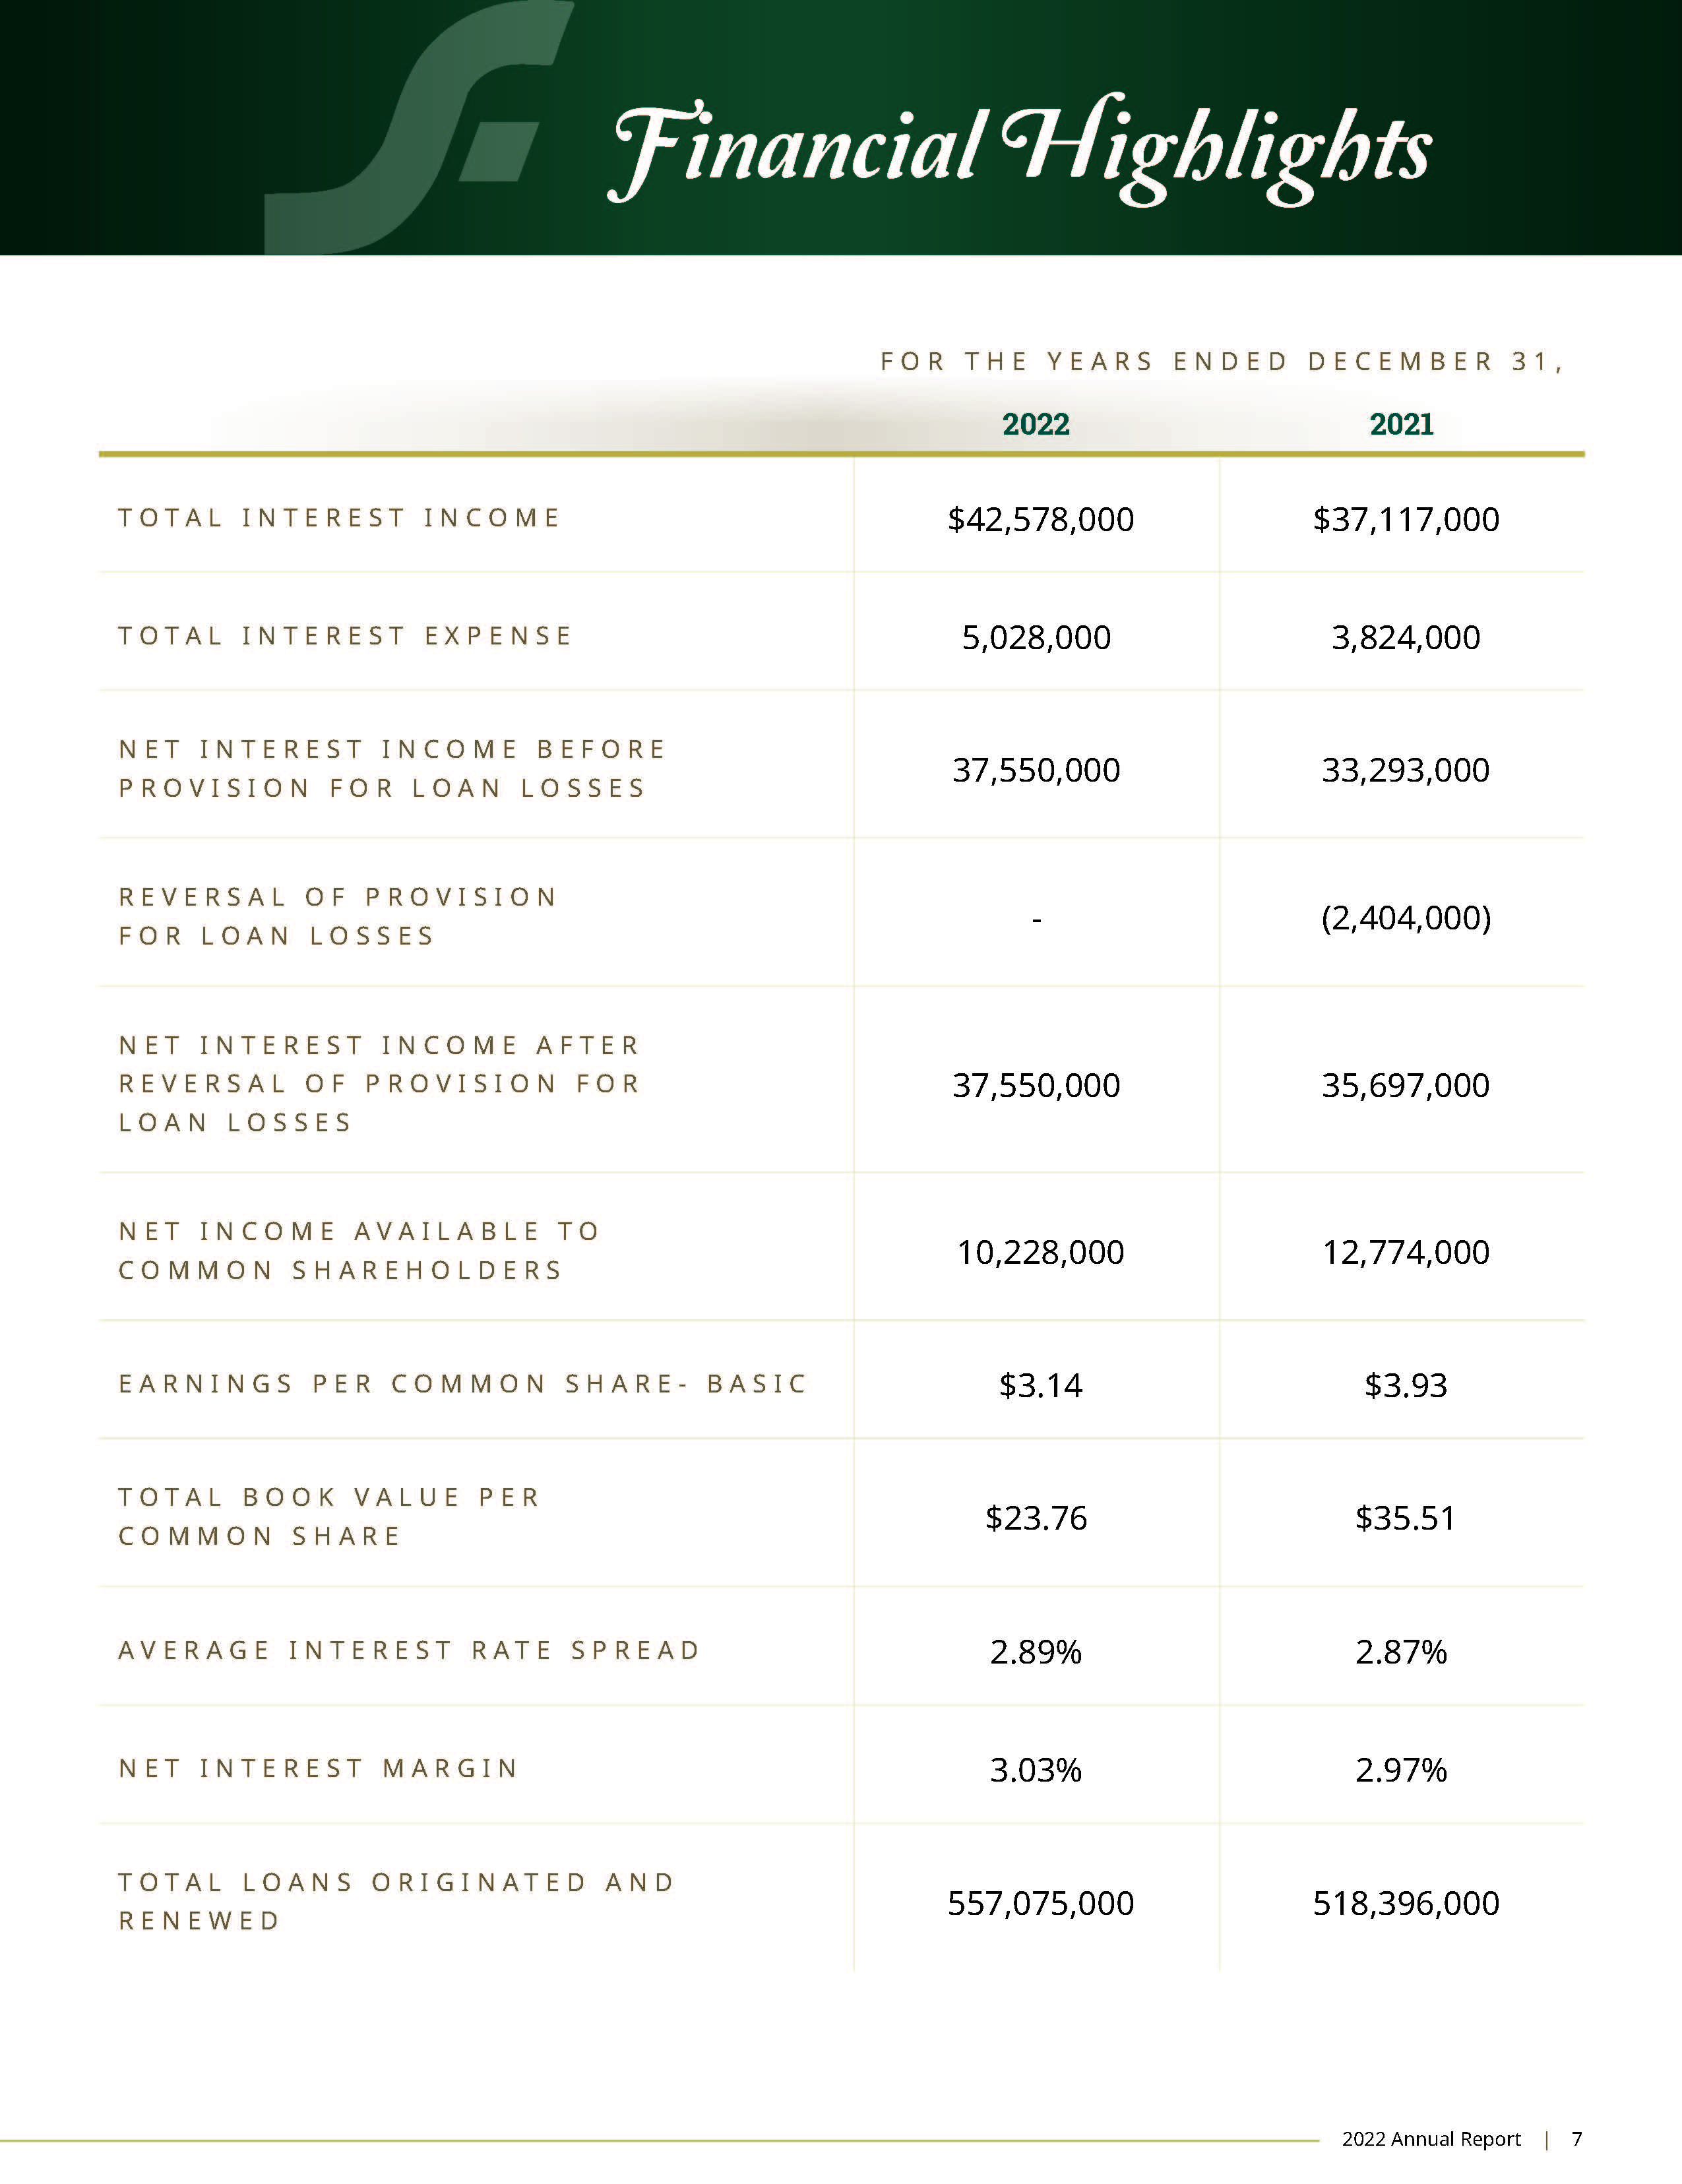
Net income decreased $2.6 million or 19.9% to $10.2 million or $3.14 per basic and diluted common share for the year ended December 31, 2022, compared to $12.8 million or $3.93 per basic and diluted common share for the year ended December 31, 2021. The decrease in net income during 2022 compared to the prior year was due to a decline in non-interest income and an increase in non-interest expense, partially offset by an increase in net interest income. Also contributing to the decrease in net income was a $2.4 million reversal of loan loss reserves during 2021 following significantly higher loan loss provisions recorded in 2020 in response to the potential and unknown economic impact of the ongoing COVID-19 pandemic compared to no provision for loan losses in 2022.
Net Interest Income
Net interest income increased $4.3 million or 12.8% to $37.6 million for the year ended December 31, 2022, compared to $33.3 million in 2021. The increase in net interest income was primarily due to higher interest income from investments, which was partially offset by an increase in interest expense. The net interest margin on a tax-equivalent basis increased six basis points to 3.03% for the year ended December 31, 2022 from 2.97% for the year ended December 31, 2021.
Total average interest-earning assets increased $118.3 million or 10.5% to $1.25 billion for the year ended December 31, 2022 from $1.13 billion for the year ended December 31, 2021 with a 12 basis point increase in the average yield earned on these assets. Average interest-bearing liabilities increased $48.7 million or 5.5% to $927.5 million for the year ended December 31, 2022 from $878.8 million for the year ended December 31, 2021 with an increase of 10 basis points in the average cost. The interest rate spread on a tax-equivalent basis increased two basis points to 2.89% for the year ended December 31, 2022 from 2.87% in 2021.
Total interest income increased $5.5 million or 14.7% to $42.6 million for the year ended December 31, 2022, compared to $37.1 million for the year ended December 31, 2021 as a result of increased interest income from taxable investments which was partially offset by lower interest income from loans and tax-exempt investments.
Total tax-equivalent interest income on investments increased $6.8 million, or 67.0%, due to a $104.9 million, or 17.1%, increase in the aggregate average balance of these interest-earning assets combined with an increase of 70 basis points in the average yield earned on these assets during 2022 when compared to 2021.
Interest income from loans decreased $1.6 million or 5.7% to $25.6 million for the year ended December 31, 2022 compared to $27.2 million for the year ended December 31, 2021. The decrease was primarily attributable to a decrease in deferred loan fees on PPP loans recognized in 2022. The Bank recognized $441,000 and $4.7 million in deferred loan fees on PPP loans during the years ended December 31, 2022 and 2021, respectively. There was no unamortized net deferred fees on PPP loans remaining at December 31, 2022. This decrease was partially offset by an increase of $11.4 million in the average balance of loans outstanding during the year ended December 31, 2022.
Total interest expense increased $1.2 million or 31.5% to $5.0 million for the year ended December 31, 2022, compared to $3.8 million for the year ended December 31, 2021 due to a 10 basis point increase in the average cost of interest-bearing liabilities combined with an increase of $48.7 million, or 5.5%, in the average balance of these liabilities.
The largest increase was in interest expense on deposits, which increased $1.3 million or 78.4% to $2.9 million in 2022 compared to $1.6 million in 2021. Average interest-bearing deposits increased $58.4 million or 7.4% to $847.5 million during the year ended December 31, 2022 compared to $789.1 million during 2021, while the average cost of those deposits increased 13 basis points to 0.34% during 2022 from 0.21% in 2021.
Interest expense on borrowings from the FRB and other borrowings decreased $132,000 or 25.3% to $389,000 during the year ended December 31, 2022 from $521,000 during the prior year. The decrease was attributable to a $9.1 million, or 16.7% decrease in the average balance of these liabilities combined with a decrease of nine basis points in the average cost to 0.86% in 2022 from 0.95% during 2021.
SECURITY FEDERAL CORPORATION AND SUBSIDIARIES
Management's Discussion and Analysis of Financial Condition and Results of Operations
Provision for Loan Losses
The Company recorded no provision for loan losses for the year ended December 31, 2022 compared to a $2.4 million reversal of the provision for loan losses for the year ended December 31, 2021. The reversal of loan loss provision during 2021 was the result of a reduction in historical loss and qualitative adjustment factors related to improvement in the economic and business conditions at both the national and regional levels as of December 31, 2021. Non-performing assets increased $3.6 million, or 127.3%, to $6.4 million at December 31, 2022 from $2.8 million at December 31, 2021. Non-performing assets represented 0.46% and 0.22% of total assets at December 31, 2022 and 2021, respectively.
The amount of the provision is determined by management’s on-going monthly analysis of the loan portfolio and the adequacy of the allowance for loan losses. The Company has established policies and procedures for evaluating and monitoring the credit quality of the loan portfolio and for the timely identification of potential problem loans including internal and external loan reviews. The adequacy of the allowance for loan losses is reviewed monthly by the Asset Classification Committee and quarterly by the Board of Directors.
Management’s monthly review of the adequacy of the allowance includes three main components. The first component is an analysis of loss potential in various homogeneous segments of the portfolio based on historical trends and the risk inherent in each category. The historical loss periods used to calculate these ratios can range from one to ten years depending on which period is deemed a more relevant indicator of future losses. Currently, management applies a ten-year historical loss ratio to each loan category to estimate the inherent loss in these pooled loans.
The second component of management’s monthly analysis is the specific review and evaluation of significant problem credits identified through the Company’s internal monitoring system, including but not limited to classified loans, non-accrual loans and TDRs. These loans are evaluated for impairment and recorded in accordance with accounting guidance. All TDRs and substantially all non-accrual loans are individually evaluated for impairment. In accordance with our policy, non-accrual commercial loans with a balance less than $200,000 and non-accrual non-commercial (consumer, HELOC, residential mortgage) loans with a balance less than $100,000 are deemed immaterial and therefore excluded from the individual impairment review. For each loan deemed impaired, management calculates a specific reserve for the amount in which the recorded investment in the loan exceeds the fair value. This estimate is based on a thorough analysis of the most probable source of repayment, which is typically liquidation of the collateral.
The third component is an analysis of changes in qualitative factors that may affect the portfolio, including but not limited to: relevant economic trends that could impact borrowers’ ability to repay, industry trends, changes in the volume and composition of the portfolio, credit concentrations, or lending policies and the experience and ability of the staff and Board of Directors. Management also reviews and incorporates certain ratios such as percentage of classified loans, average historical loan losses by loan category, delinquency percentages, and the assignment of percentage targets of reserves in each loan category when evaluating the allowance. Once the analysis is completed, the three components are combined and compared to the allowance amount. Based on this, charges are made to the provision as needed.
Management believes the allowance for loan losses at December 31, 2022 is adequate based on its best estimates of the losses inherent in the loan portfolio, although there can be no guarantee as to these estimates. In addition, bank regulatory agencies may require additional provisions to the allowance for loan losses based on their judgments and estimates as part of their examination process. Because the allowance for loan losses is an estimate, there can be no guarantee that actual loan losses will not exceed the allowance for loan losses, or that additional increases in the allowance for loan losses will not be required in the future. A further decline in national and local economic conditions as a result of inflation, a recession, unemployment, money supply fluctuations or other factors could result in a material increase in the allowance for loan losses and may adversely affect the Company’s financial condition and results of operations.
SECURITY FEDERAL CORPORATION AND SUBSIDIARIES
Management's Discussion and Analysis of Financial Condition and Results of Operations
Non-Interest Income
Non-interest income decreased $3.0 million or 23.9% to $9.6 million for the year ended December 31, 2022 from $12.6 million for the year ended December 31, 2021. The decrease in non-interest income was primarily attributable to decreases in gain on sales of loans and grant income. These decreases in non-interest income were partially offset by increases in service fees on deposit accounts, insurance commissions, trust income, and ATM and check card fee income.
Gain on sales of loans decreased $2.1 million or 55.6% to $1.7 million for the year ended December 31, 2022 compared to $3.8 million in 2021 as the dollar volume of loans sold to investors decreased. The Bank sold $48.5 million of loans in 2022 compared to $112.9 million during 2021.
Insurance commissions increased $174,000 or 28.5% to $784,000 for the year ended December 31, 2022 compared to $610,000 in 2021 due to an increase in the number of insurance policies sold. Trust income increased $110,000 or 7.6% to $1.5 million during the year ended December 31, 2022 compared to $1.4 million in 2021 due to an increase in assets under management. ATM and check card fee income increased $346,000 or 14.0% to $2.8 million for the year ended December 31, 2022 compared to $2.5 million in 2021 reflecting higher transaction volume.
The Bank received $171,000 and $1.8 million in grant income during the years ended December 31, 2022 and 2021, respectively. During 2022, the Bank was awarded a $171,000 grant by the Community Development Financial Institutions ("CDFI") Fund Bank Enterprise Award ("BEA") program for the Bank's continued community development financing and service activities in the most economically distressed communities. During 2021, the Bank was awarded a $1.8 million grant by the CDFI Fund Rapid Response Program ("RRP") created to provide certified CDFIs with resources to help counter the economic impact of COVID-19 in distressed and underserved communities. The grant proceeds were used to fund qualified loans within the Bank’s target market areas, which satisfied the performance obligation of the grant.
Non-Interest Expense
Non-interest expense increased $2.2 million or 6.8% to $34.2 million during the year ended December 31, 2022 compared to $32.0 million during 2021. The increase in non-interest expense was primarily due to increases in compensation and employee benefits, a write-down of the value of land held for sale and other non-interest expenses, partially offset by a decrease in consulting expenses.
Compensation and employee benefits increased $890,000 or 4.6% to $20.1 million during the year ended December 31, 2022 from $19.2 million for the year ended December 31, 2021 primarily due to annual cost of living increases and an increase in the number of full time equivalent employees as a result of our newest branch added during the first quarter of 2022. Occupancy expense also increased by $190,000 primarily due to the addition of our newest branch located in Columbia, South Carolina.
A write-down of the fair value of land held for sale during the year ended December 31, 2022 based on an updated appraisal resulted in a $433,000 increase in non-interest expense.
Consulting expense decreased $497,000 or 41.4% to $705,000 for the year ended December 31, 2022 compared to $1.2 million during the prior year. The decrease was primarily due to a one-time expense of $605,000 for IT related consulting expenses incurred in 2021.
The Company incurred costs of $10,000 from the operation of OREO properties during the year ended December 31, 2022, compared to a net recovery of $116,000 during the prior year during which OREO sales exceeded write-downs and other costs. There were no sales of OREO properties during 2022 and therefore, no gain on OREO sales during 2022 compared to $105,000 in 2021.
Other non-interest expense increased $1.3 million or 35.8% to $4.7 million for the year ended December 31, 2022 compared to $3.4 million during 2021 due to increased operations and the addition of our newest branch added in 2022. As a result of the COVID-19 pandemic, some branch locations were not open during all twelve months of 2021. As of May 2021, all branches had reopened and resumed normal business hours.
SECURITY FEDERAL CORPORATION AND SUBSIDIARIES
Management's Discussion and Analysis of Financial Condition and Results of Operations
Provision for Income Taxes
The provision for income taxes decreased $800,000 or 22.8% to $2.7 million during the year ended December 31, 2022 compared to $3.5 million for the year ended December 31, 2021 due to higher pre-tax income in 2021. The Company's combined federal and state effective tax rate was 20.9% for 2022 compared to 21.6% for 2021.
Comparison of the Years Ended December 31, 2021 and 2020
A comparison of our operating results for the 2021 and 2020 fiscal years may be found under the heading “Comparison of Operating Results for the Years Ended December 31, 2021 and 2020” in our Annual Report to Shareholders which was filed as Exhibit 13 to our Annual Report on Form 10-K for the year ended December 31, 2021.
Net cost of operation of OREO includes all expenses associated with OREO properties, including write-downs in value and
SECURITY FEDERAL CORPORATION AND SUBSIDIARIES
Management's Discussion and Analysis of Financial Condition and Results of Operations
Regulatory Capital
The following table reconciles the Bank's shareholders' equity to its various regulatory capital positions.
| | | | | | | | | | | |
| | December 31, |
| 2022 | | 2021 |
| | (In Thousands) |
Bank’s Shareholders’ Equity (1) | $ | 142,652 | | | $ | 124,983 | |
| Reduction for Goodwill | 1,200 | | | 1,200 | |
| Tangible Capital | 141,452 | | | 123,783 | |
| Core Capital | 141,452 | | | 123,783 | |
| Supplemental Capital | 9,956 | | | 8,923 | |
| Total Risk-Based Capital | $ | 151,408 | | | $ | 132,706 | |
(1)EXCLUDES UNREALIZED (LOSSES) GAINS ON INVESTMENT SECURITIES OF $(40.8) MILLION and $5.2 MILLION AT DECEMBER 31, 2022 AND 2021, RESPECTIVELY.
The Bank is subject to minimum capital requirements imposed by the FDIC. Based on capital levels at December 31, 2022, the Bank was considered to be well capitalized. At December 31, 2022, the Bank exceeded all regulatory capital requirements with Tier 1 leverage-based capital, Tier 1 risk-based capital, total risk-based capital, and common equity Tier 1 (CET1) capital ratios of 10.4%, 17.8%, 19.0%, and 17.8%, respectively.
CET1 consists of Tier 1 capital less all capital components that are not considered common equity. In addition to the FDIC’s minimum capital ratios, the Bank is required to maintain a capital conservation buffer consisting of additional CET1 capital greater than 2.5% of risk-weighted assets above the required minimum levels in order to avoid limitations on paying dividends, engaging in share repurchases, and paying discretionary bonuses. At December 31, 2022, the Bank’s capital conservation buffer was 11.0%.
For additional information regarding the Bank's and Company's regulatory capital compliance, see the discussion included in Note 16 of the Notes to Consolidated Financial Statements included herein.
SECURITY FEDERAL CORPORATION AND SUBSIDIARIES
Management's Discussion and Analysis of Financial Condition and Results of Operations
Liquidity and Capital Resources
Liquidity refers to the ability to generate sufficient cash flows to fund current loan demand, repay maturing borrowings, fund maturing deposit withdrawals, and meet operating expenses. The Bank's primary sources of funds include deposits, scheduled loan and investment security repayments, including interest payments, maturities and sales of loans and investment securities, borrowings from the FRB, advances from the FHLB and cash flow generated from operations. The need for funds varies among periods depending on funding needs as well as the rate of amortization and prepayment on loans. The use of borrowings from the FRB, FHLB advances and other borrowings varies depending on loan demand, deposit inflows, and the use of investment leverage strategies that we might employee to increase net interest income.
The principal use of the Bank's funds is the origination of mortgages and other loans and the purchase of investment securities. Originations of new loans and renewals of previously funded loans on loans held for investment were $557.1 million during the year ended December 31, 2022 compared to $438.4 million during the year ended December 31, 2021. Purchases of investment securities totaled $210.3 million during 2022 compared to $217.6 million during 2021. Other uses of the Bank's funds during the year ended December 31, 2022 included repurchases of subordinated debentures and dividend payments to shareholders.
In the normal course of business, the Company makes off-balance sheet arrangements, including credit commitments to its customers to meet their financial needs. These arrangements involve, to varying degrees, elements of credit and interest rate risk not recognized in the consolidated statement of financial condition. The Bank makes personal, commercial, and real estate lines of credit available to customers and does issue standby letters of credit.
Commitments to extend credit to customers are subject to the Bank’s normal credit policies and are essentially the same as those involved in extending loans to customers. Unused lines of credit on HELOCs, credit cards, and commercial loans amounted to $173.3 million at December 31, 2022. HELOCs are made on a floating rate basis with final maturities of 15 to 20 years. The Bank issues fixed rate credit cards, currently at 9.99%, and variable rate rewards credit cards with a floating rate equal to prime plus 9.99%. Credit cards are renewed every three years. The Bank had undisbursed loans-in-process of $22.7 million at December 31, 2022, which will be disbursed over an average of 90 days, and are included in the total unused commitments above. These commitments to originate loans and future advances of lines of credit are expected to be funded from loan amortizations and prepayments, deposit inflows, maturing investments, and short-term borrowing capacity. See Note 19 of the Notes to the Consolidated Financial Statements included herein for additional information regarding our commitments and off-balance sheet arrangements.
We incur capital expenditures on an ongoing basis to expand and improve our product offerings, enhance and modernize our technology infrastructure, and to introduce new technology-based products to compete effectively in our markets. We evaluate capital expenditure projects based on a variety of factors, including expected strategic impacts (such as forecasted impact on revenue growth, productivity, expenses, service levels and customer retention) and our expected return on investment. The amount of capital investment is influenced by, among other things, current and projected demand for our services and products, cash flow generated by operating activities, cash required for other purposes and regulatory considerations. Based on current capital allocation objectives, there are no projects scheduled for capital investments in premises and equipment during 2023 that would materially impact liquidity. We also have purchase obligations, generally with remaining terms of less than three years and contracts with various vendors to provide services, including information processing, for periods generally ranging from one to five years, for which our financial obligations are dependent upon acceptable performance by the vendor. For the year ending December 31, 2023, we project that fixed commitments will include $518,000 of operating lease payments. See Note 5 of the Notes to the Consolidated Financial Statements included herein for additional information regarding our operating leases.
The Bank’s liquidity has been positively impacted by increases in deposit levels in recent years. During the year ended December 31, 2022, deposits decreased by $5.9 million after increasing by $197.9 million during the year ended December 31, 2021. Our liquid assets in the form of cash and cash equivalents, certificates of deposit at other banks and investments increased to $747.2 million at December 31, 2022 from $735.1 million at December 31, 2021. Total certificates of deposit scheduled to mature in one year or less totaled $96.2 million at December 31, 2022 compared to $118.1 million at December 31, 2021. Management’s policy is to maintain deposit rates at levels that are competitive with other local financial institutions. Based on historical experience, we believe that a significant portion of maturing certificates of deposit will remain with the Bank.
SECURITY FEDERAL CORPORATION AND SUBSIDIARIES
Management's Discussion and Analysis of Financial Condition and Results of Operations
Primary sources of short-term liquidity for the Bank include the Federal Reserve Bank discount window and a $50.0 million line of credit with the Pacific Coast Bankers Bank. In addition, at December 31, 2022, the Bank had $388.3 million in unused borrowing capacity at the FHLB. Management believes that future liquidity can be met through the Bank's deposit base, which had a balance of $1.11 billion at December 31, 2022, sales and maturities of investment securities, and loans sold to investors. During the years ended December 31, 2022 and 2021, the Bank sold $53.3 million and $118.4 million in loans, respectively.
Historically the Bank’s cash flow from operating activities has been relatively stable. The cash flows from investing activities vary with sales of investment securities and with the need to invest excess funds or utilize leverage strategies with the purchase of investment securities. The cash flows from financing activities vary depending on the need for borrowings from the FRB, FHLB advances and other borrowings. The Bank's management believes that the liquid assets combined with the available lines of credit provide adequate liquidity to meet current financial obligations for at least the next 12 months.
Security Federal Corporation is a separate legal entity from the Bank and must provide for its own liquidity and pay its own operating expenses. Sources of capital and liquidity for Security Federal Corporation include distributions from the Bank and the issuance of debt or equity securities, although there are regulatory restrictions on the ability of the Bank to pay dividends. At December 31, 2022, Security Federal Corporation (on an unconsolidated basis) had liquid assets of $28.8 million. The Company currently expects to continue the current practice of paying quarterly cash dividends on common stock subject to the Board of Directors' discretion to modify or terminate this practice at any time and for any reason without prior notice. Our current quarterly common stock dividend rate is $0.13 per share, as approved by our Board of Directors, which we believe is a dividend rate per share which enables us to balance our multiple objectives of managing and investing in the Bank, and returning a substantial portion of our cash to our shareholders. In addition to the quarterly dividends paid in 2022, the Company also paid a special cash dividend of $0.28 per share in 2022 to all shareholders of record as of March 31, 2022. Assuming continued payment during 2023 at this rate of $0.13 per share, our average total dividends paid each quarter would be approximately $422,875 based on the number of our current outstanding shares at December 31, 2022.
[Letterhead of Elliot Davis, LLP]
Report of Independent Registered Public Accounting Firm (PCAOB ID 149)
To the Shareholders and the Board of Directors of Security Federal Corporation:
Opinion on the Financial Statements
We have audited the accompanying consolidated balance sheets of Security Federal Corporation and its Subsidiaries (the Company) as of December 31, 2022 and 2021, the related consolidated statements of income, comprehensive income (loss), shareholders' equity and cash flows for each of the three years in the period ended December 31, 2022, and the related notes to the consolidated financial statements (collectively, the “financial statements”). In our opinion, the financial statements present fairly, in all material respects, the financial position of the Company as of December 31, 2022 and 2021 and the results of its operations and its cash flows for each of the three years in the period ended December 31, 2022, in conformity with accounting principles generally accepted in the United States of America.
Basis for Opinion
These financial statements are the responsibility of the Company’s management. Our responsibility is to express an opinion on the Company’s financial statements based on our audits. We are a public accounting firm registered with the Public Company Accounting Oversight Board (United States) (PCAOB) and are required to be independent with respect to the Company in accordance with U.S. federal securities laws and the applicable rules and regulations of the Securities and Exchange Commission and the PCAOB.
We conducted our audits in accordance with the standards of the PCAOB. Those standards require that we plan and perform the audit to obtain reasonable assurance about whether the financial statements are free of material misstatement, whether due to error or fraud. The Company is not required to have, nor were we engaged to perform, an audit of its internal control over financial reporting. As part of our audits we are required to obtain an understanding of internal control over financial reporting but not for the purpose of expressing an opinion on the effectiveness of the Company's internal control over financial reporting. Accordingly, we express no such opinion.
Our audits included performing procedures to assess the risks of material misstatement of the financial statements, whether due to error or fraud, and performing procedures that respond to those risks. Such procedures included examining, on a test basis, evidence regarding the amounts and disclosures in the financial statements. Our audits also included evaluating the accounting principles used and significant estimates made by management, as well as evaluating the overall presentation of the financial statements. We believe that our audits provide a reasonable basis for our opinion.
Critical Audit Matters
The critical audit matters communicated below are matters arising from the current period audit of the financial statements that were communicated or required to be communicated to the audit committee and that: (1) relate to accounts or disclosures that are material to the financial statements and (2) involved our especially challenging, subjective, or complex judgments. The communication of critical audit matters does not alter in any way our opinion on the financial statements, taken as a whole, and we are not, by communicating the critical audit matters below, providing separate opinions on the critical audit matters or on the accounts or disclosures to which they relate.
Allowance for Loan Losses
As described in Note 4 to the Company’s financial statements, the Company has a gross loan portfolio of approximately $561.0 million and related allowance for loan losses of approximately $11.2 million as of December 31, 2022. As described by the Company in Note 1, the evaluation of the allowance for loan losses is inherently subjective as it requires estimates that are susceptible to significant revision as more information becomes available. The allowance for loan losses is evaluated on a regular basis and is based upon the Company’s review of the fair value of the underlying collateral, stated guarantees by the borrower (if applicable), the borrower’s ability to repay from other economic resources, growth and composition of the loan portfolio, the relationship of the allowance for loan losses to the outstanding loans, loss experience, delinquency trends, and general economic conditions.
We identified the Company’s estimate of the allowance for loan losses as a critical audit matter. The principal considerations for our determination of the allowance for loan losses as a critical audit matter related to the high degree of subjectivity in the Company’s judgments in determining the qualitative factors for collectively evaluated loans. Auditing these complex judgments and assumptions by the Company involves especially challenging auditor judgment due to the nature and extent of audit evidence and effort required to address these matters, including the extent of specialized skill or knowledge needed.
The primary procedures we performed to address this critical audit matter included the following:
•We evaluated the relevance and the reasonableness of assumptions related to evaluation of the loan portfolio, current economic conditions, and other risk factors used in development of the qualitative factors for collectively evaluated loans.
•We evaluated the reasonableness of assumptions and data used by the Company in developing the qualitative factors by comparing these data points to internally developed and third-party sources, and other audit evidence gathered.
•We performed analytical procedures to evaluate the directional consistency of changes that occurred in the qualitative factors for collectively evaluated loans.
•We validated the mathematical accuracy of the calculation.
We have served as the Company's auditor since 1998.
/s/ Elliott Davis, LLC
Columbia, South Carolina
March 24, 2023
SECURITY FEDERAL CORPORATION AND SUBSIDIARIES
CONSOLIDATED BALANCE SHEETS
| | | | | | | | | | | |
| December 31, |
| (Dollars in thousands) | 2022 | | 2021 |
| Assets: | | | |
| Cash and Cash Equivalents | $ | 28,502 | | | $ | 27,623 | |
| Certificates of Deposit with Other Banks | 1,100 | | | 1,100 | |
| Investment Securities: | | | |
| Available For Sale ("AFS") | 550,148 | | | 682,849 | |
Held To Maturity ("HTM") (Fair Value of $161,464 and $23,721 at December 31, 2022 and December 31, 2021, Respectively) | 167,438 | | | 23,507 | |
| Total Investments | 717,586 | | | 706,356 | |
| Loans Receivable, Net: | | | |
| Held For Sale | 913 | | | 4,038 | |
Held For Investment (Net of Allowance of $11,178 and $11,087 at December 31, 2022 and December 31, 2021, Respectively) | 549,004 | | | 495,459 | |
| Total Loans Receivable, Net | 549,917 | | | 499,497 | |
| Accrued Interest Receivable | 4,811 | | | 3,752 | |
| Operating Lease Right-of-Use Assets | 1,861 | | | 2,252 | |
| Land Held for Sale | 1,097 | | | 1,530 | |
| Premises and Equipment, Net | 27,960 | | | 25,237 | |
| Federal Home Loan Bank ("FHLB") Stock, at Cost | 651 | | | 586 | |
| Other Real Estate Owned ("OREO") | 120 | | | 130 | |
| Bank Owned Life Insurance ("BOLI") | 27,318 | | | 26,710 | |
| Goodwill | 1,200 | | | 1,200 | |
| Other Assets | 19,243 | | | 5,241 | |
| Total Assets | $ | 1,381,366 | | | $ | 1,301,214 | |
| Liabilities: | | | |
| Deposit Accounts | $ | 1,110,085 | | | $ | 1,115,963 | |
| | | |
| Borrowings from Federal Reserve Bank ("FRB") | 44,080 | | | — | |
| Other Borrowings | 27,588 | | | 26,785 | |
| Junior Subordinated Debentures | 5,155 | | | 5,155 | |
| Subordinated Debentures | 26,500 | | | 30,000 | |
| Operating Lease Liabilities | 1,904 | | | 2,293 | |
| Other Liabilities | 5,821 | | | 5,495 | |
| Total Liabilities | 1,221,133 | | | 1,185,691 | |
| Commitments (Note 19) | | | |
| Shareholders' Equity: | | | |
Senior Non-Cumulative Perpetual Preferred Stock, Series ECIP, $1,000 Par Value; 82,949 and 0 Shares Authorized, Issued and Outstanding at December 31, 2022 and 2021, Respectively | $ | 82,949 | | | $ | — | |
Common Stock, $0.01 Par Value; 5,000,000 Shares Authorized; 3,453,817 Shares Issued and 3,252,884 Shares Outstanding at December 31, 2022 and 2021 | 35 | | | 35 | |
| Additional Paid-In Capital ("APIC") | 18,230 | | | 18,230 | |
Treasury Stock, at Cost (200,933 Shares) | (4,331) | | | (4,331) | |
| Accumulated Other Comprehensive (Loss) Income ("AOCI") | (40,779) | | | 5,216 | |
| Retained Earnings | 104,129 | | | 96,373 | |
| Total Shareholders' Equity | 160,233 | | | 115,523 | |
| Total Liabilities and Shareholders' Equity | $ | 1,381,366 | | | $ | 1,301,214 | |
SEE ACCOMPANYING NOTES TO CONSOLIDATED FINANCIAL STATEMENTS.
SECURITY FEDERAL CORPORATION AND SUBSIDIARIES
CONSOLIDATED STATEMENTS OF INCOME
| | | | | | | | | | | |
| | | |
| Years Ended December 31, |
| (Dollars in thousands, except per share amounts) | 2022 | | 2021 |
| Interest Income: | | | |
| Loans | $ | 25,637 | | | $ | 27,196 | |
| Investment Securities | 16,738 | | | 9,907 | |
| Other | 203 | | | 14 | |
| Total Interest Income | 42,578 | | | 37,117 | |
| Interest Expense: | | | |
| Deposits | 2,911 | | | 1,631 | |
| FHLB Advances and Other Borrowings | 389 | | | 521 | |
| Subordinated Debentures | 1,548 | | | 1,575 | |
| Junior Subordinated Debentures | 180 | | | 97 | |
| Total Interest Expense | 5,028 | | | 3,824 | |
| Net Interest Income | 37,550 | | | 33,293 | |
| (Reversal of) Provision for Loan Losses | — | | | (2,404) | |
| Net Interest Income after Provision for Loan Losses | 37,550 | | | 35,697 | |
| Non-Interest Income: | | | |
| (Loss) Gain on Sales of Investment Securities | (2) | | | — | |
| Gain on Sale of Loans | 1,705 | | | 3,836 | |
| Service Fees on Deposit Accounts | 1,071 | | | 957 | |
| Commissions From Insurance Agency | 784 | | | 610 | |
| Trust Income | 1,548 | | | 1,439 | |
| BOLI Income | 608 | | | 635 | |
| ATM and Check Card Fee Income | 2,816 | | | 2,470 | |
| Grant Income | 171 | | | 1,826 | |
| Other | 911 | | | 860 | |
| Total Non-Interest Income | 9,612 | | | 12,633 | |
| Non-Interest Expense: | | | |
| Compensation and Employee Benefits | 20,050 | | | 19,160 | |
| Occupancy | 2,811 | | | 2,622 | |
| Advertising | 988 | | | 1,120 | |
| Depreciation and Maintenance of Equipment | 2,925 | | | 3,137 | |
| FDIC Insurance Premiums | 375 | | | 291 | |
| Net (Recovery) Expense from Operation of OREO | 10 | | | (116) | |
| Write Down of Land Held for Sale | 433 | | | — | |
| Consulting | 705 | | | 1,202 | |
| Debit Card Expenses | 1,267 | | | 1,198 | |
| Other | 4,661 | | | 3,433 | |
| Total Non-Interest Expense | 34,225 | | | 32,047 | |
| Income Before Income Taxes | 12,937 | | | 16,283 | |
| Provision For Income Taxes | 2,709 | | | 3,509 | |
| Net Income | $ | 10,228 | | | $ | 12,774 | |
| | | |
| Net Income Per Common Share (Basic) | $ | 3.14 | | | $ | 3.93 | |
| | | |
| Cash Dividend Per Share On Common Stock | $ | 0.76 | | | $ | 0.44 | |
| Weighted Average Shares Outstanding (Basic) | 3,252,884 | | | 3,252,884 | |
| | | |
SEE ACCOMPANYING NOTES TO CONSOLIDATED FINANCIAL STATEMENTS.
SECURITY FEDERAL CORPORATION AND SUBSIDIARIES
CONSOLIDATED STATEMENTS OF COMPREHENSIVE (LOSS) INCOME
| | | | | | | | | | | |
|
| Years Ended December 31, |
| (Dollars in thousands) | 2022 | | 2021 |
| Net Income | $ | 10,228 | | | $ | 12,774 | |
| Other Comprehensive Loss | | | |
| Unrealized Losses on Securities: | | | |
Unrealized Holding Losses on AFS Securities, Net of Taxes of $(14.9) million and $(2.5) million at December 31, 2022 and 2021, Respectively | (46,003) | | | (7,726) | |
Reclassification Adjustment for Losses (Gains) Included in Net Income, Net of Taxes of $(1) thousand and $0 at December 31, 2022 and 2021, Respectively | 2 | | | — | |
Amortization of Unrealized Gains (Losses) on AFS Securities Transferred to HTM, Net of Taxes of $2.0 thousand and $0 at December 31, 2022 and 2021, Respectively | 6 | | | — | |
| Other Comprehensive Loss | (45,995) | | | (7,726) | |
| Comprehensive (Loss) Income | $ | (35,767) | | | $ | 5,048 | |
SEE ACCOMPANYING NOTES TO CONSOLIDATED FINANCIAL STATEMENTS.
SECURITY FEDERAL CORPORATION AND SUBSIDIARIES
CONSOLIDATED STATEMENTS OF CHANGES IN SHAREHOLDERS' EQUITY
| | | | | | | | | | | | | | | | | | | | | | | | | | | | | | | | | | | | | | | | | | | | | | | | | | |
| Preferred Stock | | Common Stock | | Treasury Stock | | | | | | | | |
| (Shares and Dollars in thousands) | Shares | Amount | | Shares | Amount | | Shares | Amount | | APIC | | AOCI (Loss) | | Retained Earnings | | Total |
| December 31, 2020 | — | | $ | — | | | 3,454 | | $ | 35 | | | 201 | | $ | (4,331) | | | $ | 18,230 | | | $ | 12,942 | | | $ | 85,030 | | | $ | 111,906 | |
| Net Income | — | | — | | | — | | — | | | — | | — | | | — | | | — | | | 12,774 | | | 12,774 | |
| Other Comprehensive Loss, Net of Tax | — | | — | | | — | | — | | | — | | — | | | — | | | (7,726) | | | — | | | (7,726) | |
| Cash Dividends on Common Stock | — | | — | | | — | | — | | | — | | — | | | — | | | — | | | (1,431) | | | (1,431) | |
| December 31, 2021 | — | | $ | — | | | 3,454 | | $ | 35 | | | 201 | | $ | (4,331) | | | $ | 18,230 | | | $ | 5,216 | | | $ | 96,373 | | | $ | 115,523 | |
| Net Income | — | | — | | | — | | — | | | — | | — | | | — | | | — | | | 10,228 | | | 10,228 | |
| Other Comprehensive Loss, Net of Tax | — | | — | | | — | | — | | | — | | — | | | — | | | (45,995) | | | — | | | (45,995) | |
| Preferred Stock Issuance | 83 | | 82,949 | | | — | | — | | | — | | — | | | — | | | — | | | — | | | 82,949 | |
| Cash Dividends on Common Stock | — | | — | | | — | | — | | | — | | — | | | — | | | — | | | (2,472) | | | (2,472) | |
| December 31, 2022 | 83 | | $ | 82,949 | | | 3,454 | | $ | 35 | | | 201 | | $ | (4,331) | | | $ | 18,230 | | | $ | (40,779) | | | $ | 104,129 | | | $ | 160,233 | |
SEE ACCOMPANYING NOTES TO CONSOLIDATED FINANCIAL STATEMENTS.
SECURITY FEDERAL CORPORATION AND SUBSIDIARIES
CONSOLIDATED STATEMENTS OF CASH FLOWS
| | | | | | | | | | | |
| For the Years Ended December 31, |
| (Dollars in thousands) | 2022 | | 2021 |
| CASH FLOWS FROM OPERATING ACTIVITIES: | | | |
| Net Income | $ | 10,228 | | | $ | 12,774 | |
| Adjustments to Reconcile Net Income to Net Cash Provided By Operating Activities: | | | |
| Depreciation Expense | 1,966 | | | 1,958 | |
| Discount Accretion and Premium Amortization, Net | 6,498 | | | 6,800 | |
| (Reversal of) Provisions for Loan Losses | — | | | (2,404) | |
Earnings on BOLI | (608) | | | (635) | |
Gain on Sales of Loans | (1,705) | | | (3,836) | |
| Loss (Gain) on Sales of Investments AFS | 2 | | | — | |
Gain on Sales of OREO | — | | | (105) | |
Write Down on OREO | 10 | | | 20 | |
| Write Down of Land Held For Sale ("HFS") | 433 | | | — | |
| Proceeds From Sale of Loans HFS | 53,315 | | | 118,371 | |
| Origination of Loans HFS | (48,485) | | | (112,880) | |
| Increase in Accrued Interest Receivable | (1,059) | | | (254) | |
Amortization of Operating Lease Right-of-Use ("ROU") Assets | 391 | | | 382 | |
Other, Net | 886 | | | (910) | |
| Net Cash Provided By Operating Activities | 21,872 | | | 19,281 | |
| CASH FLOWS FROM INVESTING ACTIVITIES: | | | |
| Purchase of Investments AFS | (59,675) | | | (207,177) | |
| Proceeds from Payments and Maturities of Investments AFS | 102,463 | | | 96,748 | |
| Proceeds from Sale of Investments AFS | 22,375 | | | — | |
| Purchase of Investments HTM | (150,633) | | | (10,456) | |
| Proceeds from Payments and Maturities of Investments HTM | 6,794 | | | 5,056 | |
| Investment in Certificates of Deposits with Other Banks | — | | | (750) | |
| Purchase of FHLB Stock | (65) | | | (2) | |
| Redemption of FHLB Stock | — | | | 1,770 | |
| | | |
| | | |
| Net Increase in Loans Receivable | (53,546) | | | (19,580) | |
| Proceeds from Sale of OREO | — | | | 454 | |
| Purchase and Improvement of Premises and Equipment | (4,688) | | | (2,150) | |
| Net Cash Used By Investing Activities | (136,975) | | | (136,087) | |
| CASH FLOWS FROM FINANCING ACTIVITIES: | | | |
| (Decrease) Increase in Deposit Accounts | (5,878) | | | 197,867 | |
| | | |
| Repayment of FHLB Advances | — | | | (35,000) | |
| Proceeds from Other Borrowings, Net | 803 | | | 13,668 | |
| Repurchase of Subordinated Debentures | (3,500) | | | — | |
| Proceeds from Issuance of Preferred Stock | 82,949 | | | — | |
| Proceeds from FRB Borrowings | 400,880 | | | 274,265 | |
| Repayment of FRB Borrowings | (356,800) | | | (322,965) | |
| | | |
| Dividends to Common Stock Shareholders | (2,472) | | | (1,431) | |
| Net Cash Provided By Financing Activities | 115,982 | | | 126,404 | |
| Net Increase in Cash and Cash Equivalents | 879 | | | 9,598 | |
| Cash and Cash Equivalents at Beginning of Year | 27,623 | | | 18,025 | |
| Cash and Cash Equivalents at End of Year | $ | 28,502 | | | $ | 27,623 | |
| | | |
| | | |
| | | |
| | | |
SECURITY FEDERAL CORPORATION AND SUBSIDIARIES
CONSOLIDATED STATEMENTS OF CASH FLOWS
| | | | | | | | | | | |
| For the Years Ended December 31, |
| 2022 | | 2021 |
| SUPPLEMENTAL DISCLOSURE OF CASH FLOW INFORMATION: | | |
| Cash Paid During the Period For: | | | |
| Interest | $ | 4,670 | | | $ | 3,895 | |
| Income Taxes | $ | 2,159 | | | $ | 4,226 | |
| Supplemental Schedule of Non Cash Transactions: | | | |
| | | |
| Transfers From Premises and Equipment, Net to Land HFS | $ | — | | | $ | 1,530 | |
| Decrease in Unrealized Gains on Securities AFS, Net of Taxes | $ | (45,995) | | | $ | (7,726) | |
| Initial Recognition of Lease ROU Assets | $ | — | | | $ | 282 | |
| Initial Recognition of Lease Liability | $ | — | | | $ | 282 | |
| | | |
| | | |
SEE ACCOMPANYING NOTES TO CONSOLIDATED FINANCIAL STATEMENTS.
SECURITY FEDERAL CORPORATION AND SUBSIDIARIES
Notes to Consolidated Financial Statements
NOTE 1 - SIGNIFICANT ACCOUNTING POLICIES
The following is a description of the more significant accounting and reporting policies used in the preparation and presentation of the accompanying consolidated financial statements. All significant intercompany transactions have been eliminated in consolidation.
Basis of Consolidation and Nature of Operations
The accompanying consolidated financial statements include the accounts of Security Federal Corporation (the “Company”) and its wholly owned subsidiary, Security Federal Bank (the “Bank”) and the Bank’s wholly owned subsidiaries, Security Federal Investments, Inc. ("SFINV"), Security Federal Insurance, Inc. (“SFINS”), and Security Financial Services Corporation (“SFSC”). SFINV was formed to hold investment securities and allow for better management of the securities portfolio. SFINS is an insurance agency offering auto, business, and home insurance. Effective April 30, 2022, Collier Jennings Financial Corporation, a wholly owned subsidiary of SFINS, and its subsidiaries, Security Federal Auto Insurance, The Auto Insurance Store Inc., and Security Federal Premium Pay Plans Inc. ("SFPPP") and its wholly owned premium finance subsidiary were dissolved. SFPPP’s ownership interests in four other premium finance subsidiaries were disposed of at an immaterial gain. Additionally, effective April 30, 2022, previously inactive SFSC was dissolved. All significant intercompany transactions and balances have been eliminated in consolidation.
The Company also has a wholly owned subsidiary, Security Federal Statutory Trust (the “Trust”), which issued and sold fixed and floating rate capital securities of the Trust. However, under current accounting guidance, the Trust is not consolidated in the financial statements. The Bank is primarily engaged in the business of accepting savings and demand deposits and originating mortgage loans and other loans to individuals and small businesses for various personal and commercial purposes.
Cash and Cash Equivalents
For purposes of reporting cash flows, cash and cash equivalents include cash and due from banks, interest-bearing balances in other banks, and federal funds sold. Cash equivalents have original maturities of three months or less.
Investment Securities
Investment securities are classified in one of three categories: HTM, AFS, or trading. Management determines the appropriate classification of debt securities at the time of purchase. Investment securities are classified as HTM when the Company has the positive intent and ability to hold the securities to maturity. These securities are recorded at cost and adjusted for amortization of premiums and accretion of discounts over a level yield basis. Callable debt securities held at a premium are amortized until the earliest call date. Prepayment assumptions on mortgage-backed securities are anticipated.
Management classifies investment securities that are not considered to be HTM as AFS. This type of investment is stated at fair value with unrealized gains and losses, net of tax, reported in a separate component of shareholders' equity (“accumulated other comprehensive income (loss)”). Gains and losses from sales of AFS investment securities are determined using the specific identification method. The Company had no investment securities classified as trading.
Loans Receivable Held for Investment
Loans receivable that management has the intent and ability to hold for the foreseeable future or until maturity or pay-off are reported at their outstanding principal balance adjusted for any charge-offs, the allowance for loan losses, and any deferred fees or costs on originated loans. Interest is recognized over the term of the loan based on the outstanding loan balance. Fees charged for originating loans, if any, are deferred and offset by the deferral of certain direct expenses associated with loans originated. The net deferred fees are recognized as yield adjustments by applying the interest method.
Allowance for Loan Losses
The Company provides for loan losses using the allowance method. Accordingly, all loan losses are charged to the related allowance and all recoveries are credited to the allowance for loan losses. Additions to the allowance for loan losses are provided by charges to operations based on various factors, which, in management’s judgment, deserve current recognition in estimating possible losses. Such factors considered by management include the fair value of the underlying collateral, stated guarantees by the borrower (if applicable), the borrower’s ability to repay from other economic resources, growth and composition of the loan portfolio, the relationship of the allowance for loan losses to the outstanding loans, loss experience, delinquency trends, and general economic conditions. Management evaluates the carrying value of the loans periodically and the allowance is adjusted accordingly.
SECURITY FEDERAL CORPORATION AND SUBSIDIARIES
Notes to Consolidated Financial Statements
The Company regularly re-evaluates its practices in determining the allowance for loan losses. During the year ended December 31, 2020, the Company increased its look-back period to incorporate the effects of at least one economic downturn in its loss history. The Company believes the extension of its look-back period is appropriate due to the risks inherent in the loan portfolio. Absent this extension, the early cycle periods in which the Company experienced significant losses would be excluded from the determination of the allowance for loan losses and its balance would decrease. For the year ended December 31, 2020, the Company increased its look-back period to 10 years to continue to include losses incurred by the Company beginning with the first quarter of 2011. The Company continued to use a look-back period of 10 years for the year ended December 31, 2022.
While management uses the best information available to make evaluations, future adjustments may be necessary if economic conditions differ substantially from the assumptions used in making these evaluations. The allowance for loan losses is subject to periodic evaluations by bank regulatory agencies that may require adjustments to be made to the allowance based upon the information that is available at the time of their examination.
The Company values impaired loans at the loan’s fair value if it is probable that the Company will be unable to collect all amounts due according to the terms of the loan agreement at the present value of expected cash flows, the market price of the loan, if available, or the value of the underlying collateral less estimated selling costs. In accordance with our policy, non-accrual loans for commercial purposes which have a balance less than $200,000 and non-accrual non-commercial loans (HELOCs, consumer residential mortgage and other consumer loans) with a balance less than $100,000 are deemed immaterial and therefore excluded from the individual impairment review. Expected cash flows are required to be discounted at the loan’s effective interest rate. When the ultimate collectability of an impaired loan’s principal is in doubt, wholly or partially, all cash receipts are applied to principal. When this doubt does not exist, cash receipts are applied under the contractual terms of the loan agreement first to interest and then to principal. Once the recorded principal balance has been reduced to zero, future cash receipts are applied to interest income to the extent that any interest has been foregone. Further cash receipts are recorded as recoveries of any amounts previously charged off.
The Company did not designate loans with payment deferrals granted due to the novel coronavirus of 2019 (“COVID-19’) pandemic as delinquent or impaired in accordance with provisions of The Coronavirus Aid, Relief, and Economic Security Act of 2020 (the “CARES Act”) and the Consolidated Appropriations Act, 2021 (the “CAA, 2021”) and related regulatory guidance. Additional analysis was also completed on the allowance for loan losses during 2021 and 2020 based on the significance of loan modifications in accordance with the CARES Act and regulatory guidance and loan risk rating downgrades as well as additional risk factors related to COVID-19.
Loans Receivable Held for Sale
The Company originates fixed rate residential loans on a servicing released basis in the secondary market. Loans closed but not yet settled with institutional investors are carried in the Company’s loans held for sale portfolio. These loans are fixed rate residential loans that have been originated in the Company’s name and have closed. Virtually all of these loans have commitments to be purchased by investors and the majority of these loans were locked in by price with the investors on the same day or shortly thereafter that the loan was locked in with the Company’s customers. Therefore, these loans present very little market risk for the Company.
The Company usually delivers to, and receives funding from, the investor within 30 days. Commitments to sell these loans to the investor are considered derivative contracts and are sold to investors on a “best efforts" basis. The Company is not obligated to deliver a loan or pay a penalty if a loan is not delivered to the investor. As a result of the short-term nature of these derivative contracts, the fair value of the mortgage loans held for sale in most cases is the same as the value of the loan amount at its origination.
Other Real Estate Owned
Other real estate owned represents real estate and other assets acquired through foreclosure or repossession and are initially recorded at the estimated fair value less costs to sell. Subsequent improvements are capitalized. Costs of holding real estate, such as property taxes, insurance, general maintenance and interest expense, are expensed as a period cost. Fair values are reviewed regularly and allowances for possible losses are established when the carrying value of the asset owned exceeds the fair value less estimated costs to sell. Fair values are generally determined by reference to an outside appraisal.
SECURITY FEDERAL CORPORATION AND SUBSIDIARIES
Notes to Consolidated Financial Statements
Premises and Equipment
Premises and equipment are carried at cost, net of accumulated depreciation. Depreciation of premises and equipment is amortized on a straight-line method over the estimated useful life of the related asset. Estimated lives are 7 to 40 years for buildings and improvements and generally 3 to 10 years for furniture, fixtures and equipment. Maintenance and repairs are charged to current expense. The cost of major renewals and improvements are capitalized.
Land Held for Sale
During the year ended December 31, 2021, the Company transferred three parcels of land with a combined book balance of $1.5 million from premises and equipment to land held for sale. Land held for sale is reported at the lower of the carrying amount and fair value less costs to sell. During the year ended December 31, 2022, the Company recorded a write down on land for sale totaling $433 thousand due to a reduction in fair value less costs to sell. No write down was recorded during 2021.
Goodwill
The Company's goodwill is a result of the excess of the cost over the fair value of net assets resulting from the acquisition of Collier Jennings Financial Corporation in July 2006. Goodwill is reviewed for impairment annually or whenever events or changes in circumstances indicate the carrying amount of an asset may not be recoverable.
Income Taxes
Income tax expense or benefit is recognized for the net change in the deferred tax liability or asset during the year. That amount together with income taxes currently payable is the total amount of income tax expense or benefit for the year. Deferred taxes are provided for by the differences in financial reporting bases for assets and liabilities compared with their tax bases. Generally, a current tax liability or asset is established for taxes presently payable or refundable and a deferred tax liability or asset is established for future tax items. A valuation allowance, if applicable, is established for deferred tax assets that may not be realized. Deferred income taxes are provided for differences between the provision for loan losses for financial statement purposes and those allowed for income tax purposes.
The Company adopted accounting guidance which prescribes a threshold and measurement attribute for the financial statement recognition and measurement of a tax position taken or expected to be taken in a tax return and also provides guidance on derecognition, classification, interest and penalties, accounting in interim periods and disclosures. There have been no gross amounts of unrecognized tax benefits or interest or penalties related to uncertain tax positions since adoption. There are no unrecognized tax benefits that would, if recognized, affect the effective tax rate. There are no positions for which it is reasonably possible that the total amounts of unrecognized tax benefits will significantly increase or decrease within the next 12 months.
Loan Fees and Costs Associated with Originating Loans
Loan fees received, net of direct incremental costs of originating loans, are deferred and amortized over the contractual life of the related loan. The net fees are recognized as yield adjustments by applying the interest method. Prepayments are not anticipated.
Interest Income
Interest on loans is accrued and credited to income monthly based on the principal balance outstanding and the contractual rate on the loan. The Company places loans on non-accrual status when they become greater than 90 days delinquent or when, in the opinion of management, full collection of principal or interest is unlikely. When interest accrual is discontinued, all unpaid accrued interest is reversed. Interest income is subsequently recognized only to the extent cash payments are received first to principal and then to interest income. The loans are returned to an accrual status when full collection of principal and interest appears likely.
Advertising Expense
Advertising and public relations costs are generally expensed as incurred. External costs relating to direct mailing are expensed in the period in which the direct mailings are sent. Advertising and public relations costs of $1.0 million and $1.1 million were included in the Company’s results of operations for the years ended December 31, 2022 and 2021, respectively.
SECURITY FEDERAL CORPORATION AND SUBSIDIARIES
Notes to Consolidated Financial Statements
Stock-Based Compensation
The Company accounts for compensation costs under its stock option plans using the fair value method. This method requires the measurement of the cost of employee services received in exchange for an award of equity instruments based upon the fair value of the award on the grant date. The cost of the award is recognized in the income statement over the vesting period of the award.
Net Income Per Common Share
Accounting guidance specifies the computation, presentation and disclosure requirements for earnings per share (“EPS”) for entities with publicly held common stock or potential common stock such as options, warrants, convertible securities or contingent stock agreements if those securities trade in a public market. Basic EPS is computed by dividing net income by the weighted average number of common shares outstanding. Diluted EPS is similar to the computation of basic EPS except that the denominator is increased to include the number of additional common shares that would have been outstanding if the dilutive common shares had been issued. The dilutive effect of options outstanding under the Company’s stock option plan is reflected in diluted EPS by application of the treasury stock method.
There were no stock options outstanding as of December 31, 2022 and 2021; and therefore, no dilutive options in the calculation of diluted EPS for those periods. The following tables show the Company’s net income per common share for the years indicated.
| | | | | | | | | | | | | | | | | | | | | | | |
| Year Ended December 31, |
| | 2022 | | 2021 |
| (Dollars in thousands, except EPS) | Income | Shares | EPS | | Income | Shares | EPS |
| Basic EPS | $ | 10,228 | | 3,252,884 | $ | 3.14 | | | $ | 12,774 | | 3,252,884 | $ | 3.93 | |
Use of Estimates
The preparation of financial statements in conformity with U.S. generally accepted accounting principles (“GAAP”) requires management to make estimates and assumptions that affect the reported amounts of assets and liabilities and the disclosure of contingent assets and liabilities at the dates of the financial statements and the reported amounts of income and expenses during the reporting periods. Actual results could differ from those estimates. Material estimates that are particularly susceptible to significant changes include:
• Determination of the allowance for loan losses and provision for credit losses
• Valuation of real estate acquired in conjunction with foreclosures or in satisfaction of loans
• Income taxes, including tax provisions and realization of deferred tax assets
• Fair value of assets and liabilities
Operating Segments
Accounting standards require that information be reported about a company’s operating segments using a “management approach.” Reportable segments are identified in these standards as those revenue producing components for which separate financial information is produced internally and which are subject to evaluation by the chief operating decision maker. While the chief operating decision maker monitors the revenue streams of the various products and services, operations are managed, and financial performance is evaluated on a Company-wide basis. Accordingly, all of the financial service operations are considered by management to be aggregated in one reportable segment.
Reclassifications
Certain amounts in prior years’ consolidated financial statements have been reclassified to conform to current period classifications.
SECURITY FEDERAL CORPORATION AND SUBSIDIARIES
Notes to Consolidated Financial Statements
Recently Issued or Adopted Accounting Standards
The following is a summary of recent authoritative pronouncements that could affect accounting, reporting, and disclosure of financial information by the Company:
In June 2016, the Financial Accounting Standards Board (“FASB”) issued Accounting Standards Update (“ASU”) No. 2016-13, Financial Instruments - Credit Losses (Topic 326): Measurement of Credit Losses on Financial Instruments. The new guidance, which was further modified by subsequent related updates, replaces the incurred loss impairment framework in current GAAP with a current expected credit loss (“CECL”) framework, which requires an estimate of credit losses for the remaining estimated life of the financial asset using historical experience, current conditions, and reasonable and supportable forecasts and generally applies to financial assets measured at amortized cost and some off-balance sheet credit exposures. Financial assets measured at amortized cost will be presented at the net amount expected to be collected by using an allowance for credit losses. Credit losses relating to available-for-sale debt securities will be recorded through an allowance for credit losses prospectively, with such allowance limited to the amount by which fair value is below amortized cost.
The Company adopted Accounting Standards Codification (“ASC”) 326 as of January 1, 2023 using the modified retrospective method for loans, leases and off-balance sheet credit exposures. Adoption of this guidance resulted in a $2.0 million increase in the allowance for credit losses, comprised of increases in the allowance for loan losses of $800,000 and the reserve for unfunded commitments of $1.2 million. The cumulative effect adjustment to retained earnings was $1.6 million, net of tax. Calculated credit losses on held-to-maturity debt securities were not material and there was no impact to the available-for-sale portfolio or other financial instruments. The allowance for loan losses for the majority of loans was calculated using a remaining life loss methodology applied to fourteen portfolios with a two quarter reasonable and supportable forecast period and an immediate reversion period. In connection with the adoption, management has implemented changes to relevant systems, processes and controls where necessary. Model validation was completed during the fourth quarter of 2022. In addition, management is in the final stages of implementing the accounting, reporting and governance processes to comply with the new guidance. The Company's expected credit loss will fluctuate over time due to macroeconomic conditions and forecasts as well as the size and composition of the loan portfolios.
In March 2022, the FASB amended the Receivables–Troubled Debt Restructuring by Creditors subtopic and Financial Instruments–Credit Losses subtopic to the Accounting Standards Codification. The amendments eliminate the accounting guidance for TDRs by creditors while enhancing disclosure requirements for certain loan refinancings and restructurings by creditors when a borrower is experiencing financial difficulty. In addition, for public business entities, the amendments require disclosure of current-period gross write-offs by year of origination for financing receivables and net investments in leases within the scope of Subtopic 326-20. The amendments are effective as of January 1, 2023 and will not have a material effect on the Company’s financial statements.
In December 2022, the FASB issued amendments to extend the period of time preparers can use the reference rate reform relief guidance under ASC Topic 848 from December 31, 2022, to December 31, 2024, to address the fact that all London Interbank Offered Rate ("LIBOR") tenors were not discontinued as of December 31, 2021, and some tenors will be published until June 2023. The amendments are effective immediately for all entities and are applied prospectively. The Company does not expect these amendments to have a material effect on its financial statements.
Other accounting standards that have been issued or proposed by the FASB or other standards-setting authorities are not expected to have a material impact on the Company’s consolidated financial position, results of operations or cash flows.
Risks and Uncertainties
In the normal course of its business, the Company encounters two significant types of risk: economic and regulatory. There are three main components of economic risk: interest rate risk, credit risk, and market risk. The Company is subject to interest rate risk to the degree that its interest-bearing liabilities mature or reprice at different speeds, or on different bases, than its interest-earning assets. Credit risk is the risk of default on the Company’s loan portfolio that results from borrowers’ inability or unwillingness to make contractually required payments. Market risk reflects changes in the value of collateral underlying loans receivable, the valuation of real estate held by the Company, and the valuation of loans held for sale and securities available for sale. The Company is subject to the regulations of various government agencies. These regulations can and do change significantly from period to period. The Company also undergoes periodic examinations by the bank regulatory agencies, which may subject it to further changes with respect to asset valuations, amounts of required loss allowances, and operating restrictions, resulting from the regulators’ judgments based on information available to them at the time of their examination.
SECURITY FEDERAL CORPORATION AND SUBSIDIARIES
Notes to Consolidated Financial Statements
NOTE 2 - INVESTMENTS, AVAILABLE FOR SALE
AFS securities are recorded at fair market value. The amortized cost, gross unrealized gains, gross unrealized losses, and fair values of AFS securities at the dates indicated were as follows:
| | | | | | | | | | | | | | | | | | | | | | | |
| | December 31, 2022 |
| (Dollars in thousands) | Amortized Cost | | Gross Unrealized
Gains | | Gross
Unrealized Losses | | Fair value |
| | | | | | | |
| | | | | | | |
| | | | | | | |
| Student Loan Pools | $ | 60,855 | | | $ | 12 | | | $ | 1,709 | | | $ | 59,158 | |
| Small Business Administration (“SBA”) Bonds | 102,293 | | | 584 | | | 3,247 | | | 99,630 | |
| Tax Exempt Municipal Bonds | 22,537 | | | 405 | | | 1,632 | | | 21,310 | |
| Taxable Municipal Bonds | 65,250 | | | — | | | 14,480 | | | 50,770 | |
| Mortgage-Backed Securities ("MBS") | 353,222 | | | 30 | | | 33,972 | | | 319,280 | |
| | $ | 604,157 | | | $ | 1,031 | | | $ | 55,040 | | | $ | 550,148 | |
| | December 31, 2021 |
| (Dollars in thousands) | Amortized Cost | | Gross
Unrealized
Gains | | Gross
Unrealized
Losses | | Fair value |
| Student Loan Pools | $ | 71,950 | | | $ | 318 | | | $ | 256 | | | $ | 72,012 | |
| SBA Bonds | 139,855 | | | 1,018 | | | 1,080 | | | 139,793 | |
| Tax Exempt Municipal Bonds | 44,758 | | | 5,227 | | | — | | | 49,985 | |
| Taxable Municipal Bonds | 65,834 | | | 734 | | | 599 | | | 65,969 | |
| MBS | 353,517 | | | 5,294 | | | 3,721 | | | 355,090 | |
| | $ | 675,914 | | | $ | 12,591 | | | $ | 5,656 | | | $ | 682,849 | |
Student Loan Pools are typically 97% guaranteed by the United States government while SBA bonds are 100% backed by the full faith and credit of the United States government. The majority of the Bank's MBS are issued or guaranteed by an agency of the United States government such as Ginnie Mae, or by Government Sponsored Entities ("GSEs"), including Fannie Mae and Freddie Mac. Ginnie Mae MBS are backed by the full faith and credit of the United States government, while those issued by GSEs are not. Also included in MBS are private label collateralized mortgage obligation ("CMO") securities, which are issued by non-governmental real estate mortgage investment conduits and are not backed by the full faith and credit of the United States government. At December 31, 2022 the Bank held an amortized cost and fair value of $60.1 million and $53.8 million in private label CMO securities, compared to an amortized cost and fair value of $41.8 million and $41.7 million at December 31, 2021, respectively.
The amortized cost and fair value of investments AFS at December 31, 2022 are shown below by contractual maturity. Expected maturities will differ from contractual maturities because borrowers have the right to prepay obligations with or without call or prepayment penalties. Since MBS are not due at a single maturity date, they are disclosed separately, rather than allocated over the maturity groupings below.
| | | | | | | | | | | |
| (Dollars in thousands) | Amortized Cost | | Fair Value |
| Due in less than one year | $ | 509 | | | $ | 508 | |
| Due in one year to five years | 5,279 | | | 5,215 | |
| Due in five to ten years | 77,271 | | | 73,201 | |
| Due in ten years or more | 167,876 | | | 151,944 | |
| MBS | 353,222 | | | 319,280 | |
| | $ | 604,157 | | | $ | 550,148 | |
SECURITY FEDERAL CORPORATION AND SUBSIDIARIES
Notes to Consolidated Financial Statements
The amortized cost and fair value of AFS investments pledged as collateral for certain deposit accounts, FHLB advances and other borrowings were $318.0 million and $297.0 million at December 31, 2022, and $335.6 million and $342.6 million at December 31, 2021, respectively.
The Bank received $22.4 million in gross proceeds from sales of AFS securities and recognized gross gains of $159,000 and gross losses of $161,000 during the year ended December 31, 2022. There were no sales of AFS securities during the year ended December 31, 2021, and therefore, no proceeds from sales, gross gains or gross losses were recorded during that year.
The following tables summarize gross unrealized losses and the related fair value, aggregated by investment category and length of time that individual AFS securities have been in a continuous unrealized loss position at the dates indicated.
| | | | | | | | | | | | | | | | | | | | | | | | | | | | | | | | | | | |
| | December 31, 2022 |
| | Less than 12 Months | | 12 Months or More | | Total |
| (Dollars in thousands) | Fair
Value | | Unrealized
Losses | | Fair
Value | | Unrealized
Losses | | Fair
Value | | Unrealized
Losses |
| Student Loan Pools | $ | 24,768 | | | $ | 638 | | | $ | 30,684 | | | $ | 1,071 | | | $ | 55,452 | | | $ | 1,709 | |
| SBA Bonds | 8,404 | | | 121 | | | 45,969 | | | 3,126 | | | 54,373 | | | 3,247 | |
| Tax Exempt Municipal Bonds | 8,051 | | | 719 | | | 4,929 | | | 913 | | | 12,980 | | | 1,632 | |
| Taxable Municipal Bonds | 14,428 | | | 3,197 | | | 36,342 | | | 11,283 | | | 50,770 | | | 14,480 | |
| MBS | 146,016 | | | 11,133 | | | 170,578 | | | 22,839 | | | 316,594 | | | 33,972 | |
| | | | | | | | | | | |
| | $ | 201,667 | | | $ | 15,808 | | | $ | 288,502 | | | $ | 39,232 | | | $ | 490,169 | | | $ | 55,040 | |
| | | | | | | | | | | | | | | | | | | | | | | | | | | | | | | | | | | |
| | December 31, 2021 |
| | Less than 12 Months | | 12 Months or More | | Total |
| (Dollars in thousands) | Fair
Value | | Unrealized
Losses | | Fair
Value | | Unrealized
Losses | | Fair
Value | | Unrealized
Losses |
| Student Loan Pools | $ | 36,817 | | | $ | 216 | | | $ | 8,827 | | | $ | 40 | | | $ | 45,644 | | | $ | 256 | |
| SBA Bonds | 15,916 | | | 360 | | | 48,791 | | | 720 | | | 64,707 | | | 1,080 | |
| | | | | | | | | | | |
| Taxable Municipal Bonds | 28,032 | | | 413 | | | 4,343 | | | 186 | | | 32,375 | | | 599 | |
| MBS | 160,098 | | | 2,866 | | | 22,952 | | | 855 | | | 183,050 | | | 3,721 | |
| | $ | 240,863 | | | $ | 3,855 | | | $ | 84,913 | | | $ | 1,801 | | | $ | 325,776 | | | $ | 5,656 | |
At December 31, 2022 and 2021, there were 416 and 199 individual AFS securities in a loss position, including 211 and 83 securities that were in a loss position for greater than 12 months, respectively. The Company has the ability and intent to hold these securities until such time as the value recovers or the securities mature. The Company believes, based on industry analyst reports and credit ratings, that the deterioration in value is attributable to changes in market interest rates and is not in the credit quality of the issuer and therefore, these losses are not considered other-than-temporary. The Company reviews its investment securities portfolio at least quarterly and more frequently when economic conditions warrant, assessing whether there is any indication of other-than-temporary impairment (“OTTI”).
Factors considered in the Company's review of its investment securities portfolio include estimated future cash flows, length of time and extent to which market value has been less than cost, the financial condition and near term prospects of the issuer, and our intent and ability to retain the security to allow for an anticipated recovery in market value. If the review determines that there is OTTI, then an impairment loss is recognized in earnings equal to the entire difference between the investment’s cost and its fair value at the balance sheet date of the reporting period for which the assessment is made, or the Company may recognize a portion of the impairment in other comprehensive income. The fair value of investments on which OTTI is recognized then becomes the new cost basis of the investment. There was no OTTI recognized during the years ended December 31, 2022 and 2021.
SECURITY FEDERAL CORPORATION AND SUBSIDIARIES
Notes to Consolidated Financial Statements
NOTE 3 - INVESTMENTS, HELD TO MATURITY
HTM securities are recorded at amortized cost. The amortized cost, gross unrealized gains, gross unrealized losses, and fair values of HTM securities at the dates indicated were as follows:
| | | | | | | | | | | | | | | | | | | | | | | |
| | December 31, 2022 |
| (Dollars in thousands) | Amortized Cost | | Gross Unrealized Gains | | Gross
Unrealized Losses | | Fair Value |
| US Treasury Bonds | $ | 34,512 | | | $ | — | | | $ | 682 | | | $ | 33,830 | |
| FHLB Bond | 1,000 | | | — | | | 1 | | | 999 | |
| Student Loan Pools | 16,388 | | | 88 | | | 59 | | | 16,417 | |
| SBA Bonds | 3,521 | | | 162 | | | — | | | 3,683 | |
| Taxable Municipal Bonds | 952 | | | — | | | 60 | | | 892 | |
| MBS | 111,065 | | | 29 | | | 5,451 | | | 105,643 | |
| Total HTM | $ | 167,438 | | | $ | 279 | | | $ | 6,253 | | | $ | 161,464 | |
|
| | December 31, 2021 |
| (Dollars in thousands) | Amortized Cost | | Gross
Unrealized Gains | | Gross
Unrealized Losses | | Fair Value |
| MBS | $ | 23,507 | | | $ | 577 | | | $ | 363 | | | $ | 23,721 | |
| Total HTM | $ | 23,507 | | | $ | 577 | | | $ | 363 | | | $ | 23,721 | |
At December 31, 2022, the amortized cost and fair value of HTM securities that were pledged as collateral for certain deposit accounts, FHLB advances and other borrowings were $25.3 million and $24.5 million compared to an amortized cost and fair value of $9.0 million and $9.5 million at December 31, 2021, respectively.
The following tables summarize gross unrealized losses and the related fair value, aggregated by investment category and length of time that individual HTM securities have been in a continuous unrealized loss position at the dates indicated.
| | | | | | | | | | | | | | | | | | | | | | | | | | | | | | | | | | | |
| | December 31, 2022 |
| | Less than 12 Months | | 12 Months or More | | Total |
| (Dollars in thousands) | Fair
Value | | Unrealized
Losses | | Fair
Value | | Unrealized
Losses | | Fair
Value | | Unrealized
Losses |
| US Treasury Bonds | $ | 33,830 | | | $ | 682 | | | $ | — | | | $ | — | | | $ | 33,830 | | | $ | 682 | |
| FHLB Bond | 999 | | | 1 | | | — | | | — | | | 999 | | | 1 | |
| Student Loan Pools | 6,520 | | | 59 | | | — | | | — | | | 6,520 | | | 59 | |
| Taxable Municipal Bonds | 892 | | | 60 | | | — | | | — | | | 892 | | | 60 | |
| MBS | 88,351 | | | 3,145 | | | 9,334 | | | 2,306 | | | 97,685 | | | 5,451 | |
| | $ | 130,592 | | | $ | 3,947 | | | $ | 9,334 | | | $ | 2,306 | | | $ | 139,926 | | | $ | 6,253 | |
|
| | December 31, 2021 |
| | Less than 12 Months | | 12 Months or More | | Total |
| (Dollars in thousands) | Fair
Value | | Unrealized
Losses | | Fair
Value | | Unrealized
Losses | | Fair
Value | | Unrealized
Losses |
| | | | | | | | | | | |
| | | | | | | | | | | |
| MBS | $ | 9,970 | | | $ | 206 | | | $ | 3,442 | | | $ | 157 | | | $ | 13,412 | | | $ | 363 | |
| | $ | 9,970 | | | $ | 206 | | | $ | 3,442 | | | $ | 157 | | | $ | 13,412 | | | $ | 363 | |
At December 31, 2022 and 2021, 54 and six individual HTM securities were in a loss position, including six and two securities that were in a loss position for greater than 12 months, respectively. The Company believes, based on industry analyst reports and credit ratings, that the deterioration in value was attributable to changes in market interest rates and was not in the credit quality of the issuer and therefore, the loss was not considered other-than-temporary. The Company has the ability and intent to hold these securities to maturity.
SECURITY FEDERAL CORPORATION AND SUBSIDIARIES
Notes to Consolidated Financial Statements
NOTE 4 - LOANS RECEIVABLE, NET
Loans receivable, net, at the dates indicated are summarized as follows:
| | | | | | | | | | | | | | | | | | | | | | | |
| December 31, |
| 2022 | | 2021 |
| (Dollars in thousands) | Balance | | % of Total Gross Loans | | Balance | | % of Total Gross Loans |
| Real Estate Loans: | | | | | | | |
| Construction | $ | 112,794 | | | 20.1 | % | | $ | 100,162 | | | 19.7 | % |
| Residential Mortgage | 110,057 | | | 19.6 | % | | 84,966 | | | 16.8 | % |
| Commercial | 252,154 | | | 44.9 | % | | 227,752 | | | 44.9 | % |
| Other Commercial and Agricultural Loans | 30,648 | | | 5.5 | % | | 44,689 | | | 8.8 | % |
| Consumer Loans: | | | | | | | |
| Home Equity Lines of Credit ("HELOC") | 31,737 | | | 5.7 | % | | 28,612 | | | 5.6 | % |
| Other Consumer Loans | 23,598 | | | 4.2 | % | | 21,450 | | | 4.2 | % |
| Total Loans Held For Investment, Gross | 560,988 | | | 100.0 | % | | 507,631 | | | 100.0 | % |
| Less: | | | | | | | |
| Allowance For Loan Losses | 11,178 | | | | | 11,087 | | | |
| Deferred Loan Fees | 806 | | | | | 1,085 | | | |
| | 11,984 | | | | | 12,172 | | | |
| Loans Receivable Held For Investment, Net | $ | 549,004 | | | | | $ | 495,459 | | | |
| | | | | | | |
| | | | | | | |
During 2022, the Bank continued its participation in the SBA's Paycheck Protection Program (“PPP”) by processing applications for PPP loan forgiveness. PPP loans are included in Commercial and Agricultural loans in the tables above and below and had a total balance of $12,000 at December 31, 2022 compared to $9.8 million at December 31, 2021. There were no remaining unamortized net deferred fees on PPP loans at December 31, 2022 compared to $441,000 at December 31, 2021.
Credit Quality Indicators
The Bank categorizes loans into risk categories based on relevant information regarding the borrowers' ability to payoff their loan in accordance with its terms. This information includes; but is not limited to, current financial and credit documentation, payment history, public information and current economic trends, among other factors. Risk ratings are used to rate the credit quality of loans for the purposes of determining the Bank’s allowance for loan losses. The following definitions are used for credit quality risk ratings:
Pass - loans that are performing and are deemed adequately protected by the net worth of the borrower or the underlying collateral value. These loans are considered to have the least amount of risk in terms of determining the allowance for loan losses.
Caution - loans that do not currently expose the Bank to sufficient risk to warrant adverse classification but possess weaknesses.
Special Mention - loans that do not currently expose the Bank to sufficient risk to warrant adverse classification but possess more weaknesses than Caution loans.
Substandard - loans that are graded as substandard are considered to have the most risk. These loans typically have an identified weakness or weaknesses and are inadequately protected by the net worth of the borrower or collateral value. All loans 90 days or more past due are automatically classified in this category.
SECURITY FEDERAL CORPORATION AND SUBSIDIARIES
Notes to Consolidated Financial Statements
The following tables summarize the loan grades used by the Bank to measure the credit quality of gross loans receivable, excluding those held for sale, by loan segment at the dates indicated.
| | | | | | | | | | | | | | | | | | | | | | | | | | | | | |
| December 31, 2022 |
| (Dollars in thousands) | Pass | | Caution | | Special
Mention | | Substandard | | Total Loans |
| Construction Real Estate | $ | 91,564 | | | $ | 18,838 | | | $ | 2,014 | | | $ | 378 | | | $ | 112,794 | |
| Residential Real Estate | 84,028 | | | 22,373 | | | 888 | | | 2,768 | | | 110,057 | |
| Commercial Real Estate | 196,063 | | | 47,821 | | | 3,271 | | | 4,999 | | | 252,154 | |
| Commercial and Agricultural | 25,384 | | | 4,593 | | | 371 | | | 300 | | | 30,648 | |
| Consumer HELOC | 25,694 | | | 5,018 | | | 402 | | | 623 | | | 31,737 | |
| Other Consumer | 16,515 | | | 6,725 | | | 179 | | | 179 | | | 23,598 | |
| Total | $ | 439,248 | | | $ | 105,368 | | | $ | 7,125 | | | $ | 9,247 | | | $ | 560,988 | |
| | | | | | | | | | | | | | | | | | | | | | | | | | | | | |
| December 31, 2021 |
| (Dollars in thousands) |
Pass | |
Caution | | Special
Mention | |
Substandard | |
Total Loans |
| Construction Real Estate | $ | 67,206 | | | $ | 25,867 | | | $ | 6,566 | | | $ | 523 | | | $ | 100,162 | |
| Residential Real Estate | 65,651 | | | 14,507 | | | 2,062 | | | 2,746 | | | 84,966 | |
| Commercial Real Estate | 185,118 | | | 34,263 | | | 5,670 | | | 2,701 | | | 227,752 | |
| Commercial and Agricultural | 40,018 | | | 4,297 | | | 54 | | | 320 | | | 44,689 | |
| Consumer HELOC | 23,417 | | | 3,988 | | | 624 | | | 583 | | | 28,612 | |
| Other Consumer | 15,060 | | | 6,244 | | | 86 | | | 60 | | | 21,450 | |
| Total | $ | 396,470 | | | $ | 89,166 | | | $ | 15,062 | | | $ | 6,933 | | | $ | 507,631 | |
Past Due and Non-accrual Loans
The following tables present an age analysis of past due balances by category at the dates indicated.
| | | | | | | | | | | | | | | | | | | | | | | | | | | | | | | | | | | |
| December 31, 2022 |
| (Dollars in thousands) | 30-59 Days
Past Due | | 60-89 Days
Past Due | | 90 Days or
More Past Due | | Total Past Due | | Current | | Total Loans
Receivable |
| Construction Real Estate | $ | — | | | $ | — | | | $ | 100 | | | $ | 100 | | | $ | 112,694 | | | $ | 112,794 | |
| Residential Real Estate | 1,557 | | | — | | | 472 | | | 2,029 | | | 108,028 | | | 110,057 | |
| Commercial Real Estate | 2,671 | | | 89 | | | 354 | | | 3,114 | | | 249,040 | | | 252,154 | |
| Commercial and Agricultural | 6 | | | 2 | | | 55 | | | 63 | | | 30,585 | | | 30,648 | |
| Consumer HELOC | 199 | | | — | | | 74 | | | 273 | | | 31,464 | | | 31,737 | |
| Other Consumer | 272 | | | 79 | | | 17 | | | 368 | | | 23,230 | | | 23,598 | |
| Total | $ | 4,705 | | | $ | 170 | | | $ | 1,072 | | | $ | 5,947 | | | $ | 555,041 | | | $ | 560,988 | |
| | | | | | | | | | | | | | | | | | | | | | | | | | | | | | | | | | | |
| December 31, 2021 |
| (Dollars in thousands) | 30-59 Days
Past Due | | 60-89 Days
Past Due | | 90 Days or
More Past Due | | Total Past Due | | Current | | Total Loans
Receivable |
| Construction Real Estate | $ | 4 | | | $ | 114 | | | $ | — | | | $ | 118 | | | $ | 100,044 | | | $ | 100,162 | |
| Residential Real Estate | 297 | | | 544 | | | 206 | | | 1,047 | | | 83,919 | | | 84,966 | |
| Commercial Real Estate | 195 | | | — | | | 373 | | | 568 | | | 227,184 | | | 227,752 | |
| Commercial and Agricultural | 79 | | | 134 | | | — | | | 213 | | | 44,476 | | | 44,689 | |
| Consumer HELOC | 52 | | | — | | | 44 | | | 96 | | | 28,516 | | | 28,612 | |
| Other Consumer | 93 | | | 4 | | | 9 | | | 106 | | | 21,344 | | | 21,450 | |
| Total | $ | 720 | | | $ | 796 | | | $ | 632 | | | $ | 2,148 | | | $ | 505,483 | | | $ | 507,631 | |
SECURITY FEDERAL CORPORATION AND SUBSIDIARIES
Notes to Consolidated Financial Statements
At December 31, 2022 and 2021, the Bank did not have any loans that were 90 days or more past due and still accruing interest. Our strategy is to work with our borrowers to reach acceptable payment plans while protecting our interests in the existing collateral. In the event an acceptable arrangement cannot be reached, we may have to acquire these properties through foreclosure or other means and subsequently sell, develop, or liquidate them.
The following table shows non-accrual loans by category at the dates indicated.
| | | | | | | | | | | | | | | | | | | | | | | | | | | | | | | | | | | |
| | December 31, 2022 | | December 31, 2021 | | Increase (Decrease) |
| (Dollars in thousands) | Amount | | Percent (1) | Amount | | Percent (1) | $ | | % |
| Non-accrual Loans: | | | | | | | | | | | |
| Construction Real Estate | $ | 115 | | | 0.02 | % | | $ | 21 | | | — | % | | $ | 94 | | | 447.6 | % |
| Residential Real Estate | 1,545 | | | 0.28 | | | 1,389 | | | 0.28 | | | 156 | | | 11.2 | |
| Commercial Real Estate | 4,282 | | | 0.76 | | | 1,057 | | | 0.21 | | | 3,225 | | | 305.1 | |
| Commercial and Agricultural | 113 | | | 0.02 | | | 64 | | | 0.01 | | | 49 | | | 76.6 | |
| Consumer HELOC | 189 | | | 0.03 | | | 142 | | | 0.03 | | | 47 | | | 33.1 | |
| Other Consumer | 29 | | | 0.01 | | | 9 | | | — | | | 20 | | | 222.2 | |
| Total Non-accrual Loans | $ | 6,273 | | | 1.12 | % | | $ | 2,682 | | | 0.53 | % | | $ | 3,591 | | | 133.9 | % |
(1) PERCENT OF GROSS LOANS RECEIVABLE HELD FOR INVESTMENT, NET OF DEFERRED FEES
Allowance for Loan Losses
The tables below show the allowance for loan losses by loan category for the years indicated.
| | | | | | | | | | | | | | | | | | | | | | | | | | | | | | | | | | | | | | | | | | | | |
| | | For the Year Ended December 31, 2022 |
| | Real Estate | | | | Consumer | | |
| (Dollars in thousands) | | Construction | | Residential | | Commercial | | Commercial and Agricultural | | HELOC | | Other | |
Total |
| Beginning Balance | | $ | 2,401 | | | $ | 1,663 | | | $ | 4,832 | | | $ | 1,242 | | | $ | 518 | | | $ | 431 | | | $ | 11,087 | |
| (Provision for) Reversal of loan losses | | (113) | | | 415 | | | (160) | | | (305) | | | 30 | | | 133 | | | — | |
| Charge-Offs | | — | | | — | | | — | | | (105) | | | — | | | (162) | | | (267) | |
| Recoveries | | 35 | | | 46 | | | 133 | | | 43 | | | 51 | | | 50 | | | 358 | |
| Ending Balance | | $ | 2,323 | | | $ | 2,124 | | | $ | 4,805 | | | $ | 875 | | | $ | 599 | | | $ | 452 | | | $ | 11,178 | |
| | | | | | | | | | | | | | |
| | For the Year Ended December 31, 2021 |
| | Real Estate | | | | Consumer | | |
| (Dollars in thousands) | | Construction | | Residential | | Commercial | | Commercial and Agricultural | | HELOC | | Other | | Total |
| Beginning Balance | | $ | 2,487 | | | $ | 2,264 | | | $ | 5,754 | | | $ | 1,113 | | | $ | 657 | | | $ | 568 | | | $ | 12,843 | |
| (Provision for) Reversal of loan losses | | (274) | | | (666) | | | (1,342) | | | 133 | | | (154) | | | (101) | | | (2,404) | |
| Charge-Offs | | (20) | | | — | | | — | | | (7) | | | — | | | (110) | | | (137) | |
| Recoveries | | 208 | | | 65 | | | 420 | | | 3 | | | 15 | | | 74 | | | 785 | |
| Ending Balance | | $ | 2,401 | | | $ | 1,663 | | | $ | 4,832 | | | $ | 1,242 | | | $ | 518 | | | $ | 431 | | | $ | 11,087 | |
SECURITY FEDERAL CORPORATION AND SUBSIDIARIES
Notes to Consolidated Financial Statements
Allowance for Loan Losses and Loans Receivable Evaluated for Impairment
The following tables summarize the impaired loans evaluated individually and collectively for impairment within the allowance for loan losses and loans receivable balances at the dates indicated.
| | | | | | | | | | | | | | | | | | | | | | | | | | | | | | | | | | | |
| December 31, 2022 |
| | Allowance For Loan Losses | | Loans Receivable |
| (Dollars in thousands) | Individually Evaluated For Impairment | | Collectively Evaluated For Impairment | | Total | | Individually Evaluated For Impairment | | Collectively Evaluated For Impairment | | Total |
| Construction Real Estate | $ | — | | | $ | 2,323 | | | $ | 2,323 | | | $ | 115 | | | $ | 112,679 | | | $ | 112,794 | |
| Residential Real Estate | — | | | 2,124 | | | 2,124 | | | 1,089 | | | 108,968 | | | 110,057 | |
| Commercial Real Estate | — | | | 4,805 | | | 4,805 | | | 4,282 | | | 247,872 | | | 252,154 | |
| Commercial and Agricultural | — | | | 875 | | | 875 | | | 31 | | | 30,617 | | | 30,648 | |
| Consumer HELOC | — | | | 599 | | | 599 | | | 49 | | | 31,688 | | | 31,737 | |
| Other Consumer | — | | | 452 | | | 452 | | | — | | | 23,598 | | | 23,598 | |
| Total | $ | — | | | $ | 11,178 | | | $ | 11,178 | | | $ | 5,566 | | | $ | 555,422 | | | $ | 560,988 | |
| | | | | | | | | | | |
| December 31, 2021 |
| Allowance For Loan Losses | | Loans Receivable |
| (Dollars in thousands) | Individually Evaluated For Impairment | | Collectively Evaluated For Impairment | | Total | | Individually Evaluated For Impairment | | Collectively Evaluated For Impairment | | Total |
| Construction Real Estate | $ | — | | | $ | 2,401 | | | $ | 2,401 | | | $ | 19 | | | $ | 100,143 | | | $ | 100,162 | |
| Residential Real Estate | — | | | 1,663 | | | 1,663 | | | 1,128 | | | 83,838 | | | 84,966 | |
| Commercial Real Estate | — | | | 4,832 | | | 4,832 | | | 1,047 | | | 226,705 | | | 227,752 | |
| Commercial and Agricultural | — | | | 1,242 | | | 1,242 | | | 31 | | | 44,658 | | | 44,689 | |
| Consumer HELOC | — | | | 518 | | | 518 | | | 97 | | | 28,515 | | | 28,612 | |
| Other Consumer | — | | | 431 | | | 431 | | | — | | | 21,450 | | | 21,450 | |
| Total | $ | — | | | $ | 11,087 | | | $ | 11,087 | | | $ | 2,322 | | | $ | 505,309 | | | $ | 507,631 | |
Loans for which it is probable that payment of interest and principal will not be made in accordance with the contractual terms of the loan agreement are considered impaired. Once a loan is identified as individually impaired, management measures impairment and records the loan at fair value. Fair value is estimated using one of the following methods: fair value of the collateral less estimated costs to sell, discounted cash flows, or market value of the loan based on similar debt. The fair value of the collateral less estimated costs to sell is the most frequently used method. Typically, the Company reviews the most recent appraisal and, if it is over 24 months old, will request a new third party appraisal. Depending on the particular circumstances surrounding the loan, including the location of the collateral, the date of the most recent appraisal and the value of the collateral relative to the recorded investment in the loan, management may order an independent appraisal immediately or, in some instances, may elect to perform an internal analysis.
SECURITY FEDERAL CORPORATION AND SUBSIDIARIES
Notes to Consolidated Financial Statements
The following tables present information related to impaired loans by loan category as of and for the years indicated.
| | | | | | | | | | | | | | | | | | | | | | | | | | | | | |
| December 31, 2022 |
Impaired Loans (Dollars in thousands) | Recorded
Investment | | Unpaid
Principal
Balance | | Related
Allowance | | Average
Recorded
Investment | | Interest
Income
Recognized |
| | | | | | | | | |
| | | | | | | | | |
| | | | | | | | | |
| | | | | | | | | |
| | | | | | | | | |
| | | | | | | | | |
| | | | | | | | | |
| | | | | | | | | |
| | | | | | | | | |
| | | | | | | | | |
| | | | | | | | | |
| | | | | | | | | |
| | | | | | | | | |
| | | | | | | | | |
| | | | | | | | | |
| Construction Real Estate | $ | 115 | | | $ | 115 | | | $ | — | | | $ | 117 | | | $ | — | |
| Residential Real Estate | 1,089 | | | 1,626 | | | — | | | 1,133 | | | — | |
| Commercial Real Estate | 4,282 | | | 4,282 | | | — | | | 4,382 | | | — | |
| Commercial and Agricultural | 31 | | | 926 | | | — | | | 31 | | | — | |
| Consumer HELOC | 49 | | | 49 | | | — | | | 52 | | | — | |
| Other Consumer | — | | | — | | | — | | | — | | | — | |
| Total | $ | 5,566 | | | $ | 6,998 | | | $ | — | | | $ | 5,715 | | | $ | — | |
| | | | | | | | | | | | | | | | | | | | | | | | | | | | | |
| December 31, 2021 |
Impaired Loans (Dollars in thousands) | Recorded
Investment | | Unpaid
Principal
Balance | | Related Allowance | | Average
Recorded
Investment | | Interest
Income
Recognized |
| | | | | | | | | |
| | | | | | | | | |
| | | | | | | | | |
| | | | | | | | | |
| | | | | | | | | |
| | | | | | | | | |
| | | | | | | | | |
| | | | | | | | | |
| | | | | | | | | |
| | | | | | | | | |
| | | | | | | | | |
| | | | | | | | | |
| | | | | | | | | |
| | | | | | | | | |
| | | | | | | | | |
| Construction Real Estate | $ | 19 | | | $ | 19 | | | $ | — | | | $ | 22 | | | $ | 2 | |
| Residential Real Estate | 1,128 | | | 1,647 | | | — | | | 1,179 | | | 4 | |
| Commercial Real Estate | 1,047 | | | 1,047 | | | — | | | 1,078 | | | — | |
| Commercial and Agricultural | 31 | | | 926 | | | — | | | 46 | | | 16 | |
| Consumer HELOC | 97 | | | 97 | | | — | | | 101 | | | — | |
| Other Consumer | — | | — | | — | | | — | | | — | | | — | |
| Total | $ | 2,322 | | | $ | 3,736 | | | $ | — | | | $ | 2,426 | | | $ | 22 | |
Troubled Debt Restructurings and Loan Modifications
In the course of resolving delinquent loans, the Bank may choose to restructure the contractual terms of certain loans. A troubled debt restructuring ("TDR") is a restructuring in which the Bank, for economic or legal reasons related to a borrower’s financial difficulties, grants a concession to a borrower that it would not otherwise consider (ASC Topic 310-40). The concessions granted on TDRs generally include terms to reduce the interest rate, extend the term of the debt obligation, or modify the payment structure on the debt obligation. The Bank grants such concessions to reassess the borrower’s financial status and develop a plan for repayment.
At the date of modification, TDRs are initially classified as nonaccrual TDRs. They are returned to accruing status when there is economic substance to the restructuring, there is documented credit evaluation of the borrower's financial condition, the remaining balance is reasonably assured of repayment in accordance with its modified terms, and the borrower has demonstrated sustained repayment performance in accordance with the modified terms for a reasonable period of time (generally a minimum of six months).
The Bank had two TDRs with a total balance of $385,000 included in impaired loans at December 31, 2022 compared to three TDRs totaling $694,000 at December 31, 2021. There were no loans restructured as TDRs during 2022 compared to one commercial real estate loan restructured as a TDR during 2021 with a balance of $412,000 at the time of restructure and immediately thereafter. At December 31, 2022 and 2021, there were no TDRs in default. The Bank considers any loan 30 days or more past due to be in default. At December 31, 2022 and 2021, the Bank had no commitments to extend additional credit to borrowers whose loan terms have been modified in a TDR. All TDRs are also classified as impaired loans and are included in the loans individually evaluated for impairment.
SECURITY FEDERAL CORPORATION AND SUBSIDIARIES
Notes to Consolidated Financial Statements
Our policy with respect to accrual of interest on loans restructured as a TDR follows relevant supervisory guidance. That is, if a borrower has demonstrated performance under the previous loan terms and shows capacity to perform under the restructured loan terms, continued accrual of interest at the restructured interest rate is probable. If a borrower was materially delinquent on payments prior to the restructuring but shows capacity to meet the restructured loan terms, the loan will likely continue as nonaccrual going forward. Lastly, if the borrower does not perform under the restructured terms, the loan is placed on nonaccrual status.
The Bank will continue to closely monitor these loans and will cease accruing interest on them if management believes that the borrowers may not continue performing based on the restructured note terms. If, after previously being classified as a TDR, a loan is restructured a second time, then that loan is automatically placed on nonaccrual status. The Bank's policy with respect to nonperforming loans requires the borrower to become current and then make a minimum of six consecutive payments in accordance with the loan terms before that loan can be placed back on accrual status. Further, the borrower must show capacity to continue performing into the future prior to restoration of accrual status.
NOTE 5 - PREMISES AND EQUIPMENT, NET AND LEASES
Premises and equipment, net, at the dates indicated are summarized as follows:
| | | | | | | | | | | |
| December 31, |
| (Dollars in thousands) | 2022 | | 2021 |
| Land | $ | 6,179 | | | $ | 6,179 | |
| Buildings and Improvements | 28,592 | | | 25,911 | |
| Furniture and Equipment | 13,848 | | | 12,943 | |
| Construction in Progress | 3,045 | | | 2,297 | |
| Total Premises and Equipment | 51,664 | | | 47,330 | |
| Less: Accumulated Depreciation | (23,704) | | | (22,093) | |
| Total Premises and Equipment, Net | $ | 27,960 | | | $ | 25,237 | |
Construction in progress of $3.0 million at December 31, 2022 primarily included building and construction costs associated with our newest branch, which is scheduled for opening in 2023. At December 31, 2022 the estimated additional costs to complete and equip the branch was approximately $1.9 million. Depreciation expense on premises and equipment was $2.0 million and $2.0 million for the years ended December 31, 2022 and 2021, respectively.
The Bank has operating leases on six of its branches. During the year ended December 31, 2022, the Company made cash payments in the amount of $499,000 for operating leases. The lease expense recognized during this period was $512,000 recorded in occupancy expense within the Consolidated Statements of Income. The lease liability had a net decrease of $389,000. At December 31, 2022, the Bank had ROU assets of $1.9 million and a lease liability of $1.9 million recorded on its consolidated balance sheet compared to ROU assets of $2.3 million and a lease liability of $2.3 million at December 31, 2021. The lease agreements have maturity dates ranging from 2023 through 2027, some of which include options for multiple five or ten year extensions. At December 31, 2022, the remaining weighted average lease term was 4.17 years and the weighted average discount rate used was 3.3%.
SECURITY FEDERAL CORPORATION AND SUBSIDIARIES
Notes to Consolidated Financial Statements
At December 31, 2022, future undiscounted lease payments for operating leases with initial terms of one year or more were as follows:
| | | | | |
| Year ended December 31, | (Dollars in thousands) |
| 2023 | $ | 518 | |
| 2024 | 522 | |
| 2025 | 475 | |
| 2026 | 364 | |
| 2027 | 147 | |
| Thereafter | 9 | |
| Total undiscounted lease payments | 2,035 | |
| Less: effect of discounting | 131 | |
| Present value of estimated lease payments (lease liability) | $ | 1,904 | |
NOTE 6 - GOODWILL
The goodwill balance of $1.2 million remained unchanged at both December 31, 2022 and 2021. In accordance with accounting guidance, the Bank evaluates its goodwill on an annual basis. The evaluations were performed as of December 31, 2022 and December 31, 2021 for the years ended December 31, 2022 and 2021, respectively. At the time of the evaluations the Company determined that no impairment existed. Therefore, there was no write-down of goodwill for the years ended December 31, 2022 and 2021.
NOTE 7 - FHLB STOCK
The Bank, as a member of the FHLB of Atlanta, is required to acquire and hold shares of capital stock in the FHLB of Atlanta in an amount equal to a membership component, which was equal to 0.05% of total Bank assets at both December 31, 2022 and 2021, plus a transaction component equal to 4.25% and 3.75% of outstanding advances (borrowings) from the FHLB of Atlanta at December 31, 2022 and 2021, respectively. The Bank was in compliance with this requirement with an investment in FHLB of Atlanta stock of $651,000 and $586,000 at December 31, 2022 and 2021, respectively. No readily available market exists for this stock and it has no quoted fair value. However, because redemption of this stock has historically been at par, it is carried at cost.
NOTE 8 - OTHER REAL ESTATE OWNED
The Bank owned $120,000 and $130,000 in OREO at December 31, 2022 and 2021, respectively. Transactions in OREO for the years indicated are summarized as follows:
| | | | | | | | | | | | | |
| | | |
| (Dollars in thousands) | 2022 | | 2021 | | |
| Balance, beginning of year | $ | 130 | | | $ | 499 | | | |
| Additions | — | | | — | | | |
| Sales | — | | | (349) | | | |
| Write-downs | (10) | | | (20) | | | |
| Balance, end of year | $ | 120 | | | $ | 130 | | | |
There were no sales of OREO properties during the year ended December 31, 2022 compared to two OREO properties sold during the year ended December 31, 2021 for gross proceeds of $454,000, which resulted in a related gain on sale of OREO in the amount of $105,000.
SECURITY FEDERAL CORPORATION AND SUBSIDIARIES
Notes to Consolidated Financial Statements
NOTE 9 - DEPOSITS
Deposits outstanding at the dates indicated are summarized below by account type as follows:
| | | | | | | | | | | | | | |
Deposit Type (Dollars in thousands) | | December 31, 2022 | | December 31, 2021 |
| Checking | | $ | 510,984 | | | $ | 495,467 | |
| Money Market | | 348,833 | | | 366,065 | |
| Savings | | 108,237 | | | 97,069 | |
| Certificates of Deposit | | 142,031 | | | 157,362 | |
| Total Deposits | | $ | 1,110,085 | | | $ | 1,115,963 | |
The Bank had $5.0 million in brokered deposits which are included in checking and money market deposits above at December 31, 2022 and 2021. In addition, the Bank had $6.0 million and $10.0 million in brokered time deposits at December 31, 2022 and 2021, with a weighted average interest rate of 0.30% and 0.26%, respectively. Brokered time deposits are included in certificates of deposit above and below. The $6.0 million balance at December 31, 2022 will mature within one year. At December 31, 2022 and 2021, the Bank had $98,000 and $68,000, respectively, in overdrafts that were reclassified to loans.
Certificate of deposits that met or exceeded the FDIC insurance limit of $250,000 were $30.3 million and $39.4 million at December 31, 2022 and 2021, respectively.
The amounts and scheduled maturities of all certificates of deposit at the dates indicated were as follows:
| | | | | | | | | | | |
| | December 31, |
| (Dollars in thousands) | 2022 | | 2021 |
| Within 1 Year | $ | 97,163 | | | $ | 118,119 | |
| After 1 Year, Within 2 Years | 31,551 | | | 26,189 | |
| After 2 Years, Within 3 Years | 6,465 | | | 7,148 | |
| After 3 Years, Within 4 Years | 3,178 | | | 2,816 | |
| After 4 Years, Within 5 Years | 3,674 | | | 3,090 | |
| | | |
| Total Certificates of Deposits | $ | 142,031 | | | $ | 157,362 | |
SECURITY FEDERAL CORPORATION AND SUBSIDIARIES
Notes to Consolidated Financial Statements
NOTE 10 - FHLB ADVANCES AND FRB BORROWINGS
There were no outstanding FHLB advances at December 31, 2022 and 2021. FHLB advances are secured by a blanket collateral agreement with the FHLB by pledging the Bank’s portfolio of residential first mortgage loans and investment securities. The Bank's pledged collateral for FHLB advances had an amortized cost and fair value of $70.1 million and $61.1 million at December 31, 2022 and $94.3 million and $94.3 million at December 31, 2021, respectively.
FHLB advances are subject to prepayment penalties. During the year ended December 31, 2022, the Bank prepaid no FHLB advances. During the year ended December 31, 2021, the Bank prepaid one FHLB advance in the amount of $10.0 million, which resulted in a prepayment fee of approximately $90,000, which is included in FHLB interest expense. The Bank did not prepay any FHLB advances during the year ended December 31, 2020. Callable advances are callable at the option of the FHLB. If an advance is called, the Bank has the option to pay off the advance without penalty, re-borrow funds on different terms, or convert the advance to a three-month floating rate advance tied to LIBOR. The Bank did not have any callable FHLB advances at December 31, 2022. At December 31, 2022 and 2021, the Bank had $388.3 million and $369.0 million, respectively, in additional borrowing capacity at the FHLB.
The Bank had $44.1 million of outstanding borrowings from the "discount window" of the FRB of Atlanta at December 31, 2022 compared to none at December 31, 2021. Depository institutions may borrow from the discount window for periods as long as 90 days, and borrowings are prepayable and renewable by the borrower on a daily basis. At December 31, 2022 the borrowing rate was 4.50% compared to 0.25% at December 31, 2021. At December 31, 2022, the Bank had pledged as collateral for these borrowings investment securities with an amortized cost and fair value of $72.6 million and $69.2 million compared to an amortized cost and fair value of $79.2 million and $82.6 million at December 31, 2021, respectively.
NOTE 11 - OTHER BORROWINGS
The Bank had $27.6 million and $26.8 million in other borrowings at December 31, 2022 and 2021, respectively. These borrowings consist of short-term repurchase agreements with certain commercial demand deposit customers for sweep accounts. The repurchase agreements typically mature within one to three days and the interest rate paid on these borrowings floats monthly with money market type rates. At December 31, 2022 and 2021, the interest rate paid on the repurchase agreements was 0.75% and 0.15%, respectively. The maximum amount outstanding at any month end during the year ended December 31, 2022 was $42.4 million compared to $36.5 million during the year ended December 31, 2021. The Bank had pledged as collateral for these repurchase agreements investment securities with amortized costs and fair values of $52.3 million and $49.8 million at December 31, 2022 and $45.3 million and $45.2 million at December 31, 2021, respectively.
NOTE 12 - JUNIOR SUBORDINATED DEBENTURES
On September 21, 2006, Security Federal Statutory Trust (the “Trust”), a wholly-owned subsidiary of the Company, issued and sold fixed and floating rate capital securities of the Trust (the “Capital Securities”), which are reported on the consolidated balance sheet as junior subordinated debentures, generating proceeds of $5.2 million. The Trust loaned these proceeds to the Company to use for general corporate purposes, primarily to provide capital to the Bank. The Capital Securities accrue and pay distributions quarterly at a floating rate of three month LIBOR plus 170 basis points which was a rate per annum equal to 6.47% and 1.90% at December 31, 2022 and 2021, respectively. The distribution rate payable on the Capital Securities is cumulative and payable quarterly in arrears. The Company has the right, subject to events of default, to defer payments of interest on the Capital Securities for a period not to exceed 20 consecutive quarterly periods, provided that no extension period may extend beyond the maturity date of December 15, 2036. The Company has no current intention to exercise its right to defer payments of interest on the Capital Securities. The Capital Securities mature or are mandatorily redeemable upon maturity on December 15, 2036, or upon earlier optional redemption as provided in the indenture. The Company has had the right to redeem the Capital Securities in whole or in part since September 15, 2011.
As of a result of the discontinuation of LIBOR, effective June 30, 2023, the Capital Securities will transition from its floating rate of three month LIBOR plus 170 basis points to a replacement rate which is expected to be the floating rate of three month Secured Overnight Financing Rate ("SOFR") as adjusted by the relevant spread adjustment of 0.26161 plus 170 basis points.
SECURITY FEDERAL CORPORATION AND SUBSIDIARIES
Notes to Consolidated Financial Statements
NOTE 13 - SENIOR CONVERTIBLE DEBENTURES
In December 2009, the Company issued $6.1 million of 8.0% Senior Convertible Debentures with a maturity date of December 1, 2029. The debentures were convertible into the Company’s common stock at a conversion price of $20 per share at the option of the holder at any time prior to maturity.
In January 2020, the Company announced its intention to redeem all of the Senior Convertible Debentures on March 2, 2020. Subsequent to the announcement, $5.9 million of Senior Convertible Debentures were converted into 295,600 common shares by holders of the debt. The Company redeemed the remaining $132,000 of outstanding debentures for cash on March 2, 2020.
NOTE 14 - SUBORDINATED DEBENTURES
In November 2019, the Company sold and issued to certain institutional investors $17.5 million in aggregate principal amount of 5.25% fixed-to-floating rate subordinated notes due 2029 (the “10-Year Notes”) and $12.5 million in aggregate principal amount of 5.25% fixed-to-floating rate subordinated notes due 2034 (the “15-Year Notes”, and together with the 10-Year Notes, the “Notes”). The 10-Year Notes have a stated maturity of November 22, 2029, and bear interest at a fixed rate of 5.25% per year, from and including November 22, 2019 but excluding November 22, 2024. From and including November 22, 2024 to but excluding the maturity date or early redemption date, the interest rate shall reset semi-annually to an interest rate equal to the then-current three-month LIBOR rate plus 369 basis points. The 15-Year Notes have a stated maturity of November 22, 2034, and bear interest at a fixed rate of 5.25% per year, from and including November 22, 2019 but excluding November 22, 2029. From and including November 22, 2029 to but excluding the maturity date or early redemption date, the interest rate for the 15-Year Notes shall reset semi-annually to an interest rate equal to the then-current three-month LIBOR rate plus 357 basis points. The Notes are payable semi-annually in arrears on June 1 and December 1 of each year commencing June 1, 2020.
Both the 10-Year and 15-Note Year subordinated notes include remedies in the event that LIBOR is discontinued. The Company is currently determining an appropriate benchmark replacement for LIBOR. The Company expects the replacement benchmark to be materially consistent with the three-month LIBOR.
The Notes are not subject to redemption at the option of the holder and may be redeemed by the Company only under certain limited circumstances prior to November 22, 2024, with respect to the 10-Year Notes, and November 22, 2029, with respect to the 15-Year Notes. The Company may redeem the 10-Year Notes and the 15-Year Notes at its option, in whole at any time, or in part from time to time, after November 22, 2024 and November 22, 2029, respectively. The Notes are unsecured, subordinated obligations of the Company and rank junior in right to payment to the Company’s current and future senior indebtedness, and each Note is equal in right to payment with respect to the other Notes.
The Notes have been structured to qualify as Tier 2 capital for the Company under applicable regulatory guidelines. The Company used the net proceeds from the sale of the Notes to fund the redemption of the convertible senior debentures and for general corporate purposes to support future growth.
During the year ended December 31, 2022 the Company repurchased $1.0 million in principal of the 10-Year Notes and $2.5 million in principal of the 15-Year Notes, leaving an aggregate remaining principal balance of $16.5 million and $10.0 million, respectively.
SECURITY FEDERAL CORPORATION AND SUBSIDIARIES
Notes to Consolidated Financial Statements
NOTE 15 - INCOME TAXES
Income tax expense was comprised of the following for the years indicated below:
| | | | | | | | | | | |
| | Year Ended December 31, |
| (Dollars in thousands) | 2022 | | 2021 |
| Current: | | | |
| Federal | $ | 2,321 | | | $ | 2,663 | |
| State | 444 | | | 630 | |
| Total Current Tax Expense | 2,765 | | | 3,293 | |
| Deferred: | | | |
| Federal | (59) | | | 212 | |
| State | 3 | | | 4 | |
| Total Deferred Tax (Benefit) Expense | (56) | | | 216 | |
| Total Income Tax Expense | $ | 2,709 | | | $ | 3,509 | |
The Company's income taxes differ from those computed at the statutory federal income tax rate for the years indicated, as follows:
| | | | | | | | | | | |
| | Year Ended December 31, |
| (Dollars in thousands) | 2022 | | 2021 |
| Tax at Statutory Income Tax Rate | $ | 2,717 | | | $ | 3,419 | |
| State Tax and Other | 377 | | | 451 | |
| Tax Exempt Interest | (253) | | | (285) | |
| Life Insurance | (128) | | | (133) | |
| Valuation Allowance | (4) | | | 57 | |
| | | |
| Total Income Tax Expense | $ | 2,709 | | | $ | 3,509 | |
SECURITY FEDERAL CORPORATION AND SUBSIDIARIES
Notes to Consolidated Financial Statements
The tax effects of temporary differences that give rise to significant portions of the deferred tax assets and liabilities at December 31, 2022 and 2021 are presented below. Net deferred tax assets or liabilities were included in other assets or other liabilities at December 31, 2022 and 2021.
| | | | | | | | | | | |
| | December 31, |
| (Dollars in thousands) | 2022 | | 2021 |
| Deferred Tax Assets: | | | |
| Deferred Compensation | $ | 838 | | | $ | 762 | |
| Provision for Loan Losses | 2,420 | | | 2,408 | |
| Other Real Estate Owned | 10 | | | 8 | |
| Net Fees Deferred for Financial Reporting | 66 | | | 79 | |
| Net Operating Losses | 464 | | | 468 | |
| PPP Loan Fees | — | | | 96 | |
| Unrealized Loss on Securities AFS | 13,230 | | | — | |
| Other | 41 | | | 53 | |
| Total Gross Deferred Tax Assets | 17,069 | | | 3,874 | |
| Less: Valuation Allowance | (464) | | | (468) | |
| Net Deferred Tax Assets | 16,605 | | | 3,406 | |
| | | |
| Deferred Tax Liabilities: | | | |
| FHLB Stock Basis Over Tax Basis | 72 | | | 72 | |
| Depreciation | 812 | | | 914 | |
| Prepaid Expenses | 169 | | | 154 | |
| | | |
| Unrealized Gain on Securities AFS | — | | | 1,683 | |
| Total Gross Deferred Tax Liability | 1,053 | | | 2,823 | |
| Net Deferred Tax Asset | $ | 15,552 | | | $ | 583 | |
The Company measures deferred tax assets and liabilities using enacted tax rates that will apply in the years in which the temporary differences are expected to be recovered or paid. Deferred tax assets represent the future tax benefit of deductible differences and, if it is more likely than not that a tax asset will not be realized, a valuation allowance is required to reduce the recorded deferred tax assets to net realizable value. As of December 31, 2022, management has determined that it is more likely than not that the total deferred tax asset will be realized except for the deferred tax asset associated with state net operating loss carryforwards, and, accordingly, has established a valuation allowance only for this item. The change in the valuation allowance was approximately $(4,000). The Company had state net operating losses attributable to the non-bank entities of $11.7 million and $11.8 million for the years ended December 31, 2022 and 2021, respectively.
Retained earnings at December 31, 2022 included tax bad debt reserves of $2.1 million, for which no provision for federal income tax has been made. If, in the future, these amounts are used for any purpose other than to absorb bad debt losses, including dividends, stock redemptions, or distributions in liquidation, or the Company ceases to be qualified as a bank holding company, they may be subject to federal income tax at the prevailing corporate tax rate. At December 31, 2022, the Company had no material unrecognized tax benefits or accrued interest and penalties. It is the Company's policy to account for interest and penalties accrued relative to unrecognized tax benefits as a component of income tax expense. Tax returns for 2019 and subsequent years are subject to examination by taxing authorities.
SECURITY FEDERAL CORPORATION AND SUBSIDIARIES
Notes to Consolidated Financial Statements
NOTE 16 - REGULATORY MATTERS
The Bank, as a state-chartered, federally insured savings bank, is subject to the capital requirements established by the FDIC. Under the FDIC's capital adequacy guidelines and the regulatory framework for prompt corrective action, the Bank must meet specific capital guidelines that involve quantitative measures of the Bank's assets, liabilities and certain off-balance-sheet items as calculated under regulatory accounting practices. The Bank's capital amounts and classification are also subject to qualitative judgments by the regulators about components, risk weighting and other factors.
The Company is a bank holding company registered with the Board of Governors of the Federal Reserve System (the "Federal Reserve"). Bank holding companies are subject to capital adequacy requirements of the Federal Reserve under the Bank Holding Company Act of 1956, as amended, and the regulations of the Federal Reserve. For a bank holding company with less than $3.0 billion in assets, the capital guidelines apply on a bank only basis and the Federal Reserve expects the holding company's subsidiary banks to be well-capitalized under the prompt corrective action regulations.
Based on its capital levels at December 31, 2022, the Bank exceeded all regulatory capital requirements as of that date. Consistent with the Bank's goals to operate a sound and profitable organization, it is the Bank's policy to maintain a "well-capitalized" status under the regulatory capital categories of the FDIC. Based on capital levels at December 31, 2022, the Bank was considered to be "well-capitalized" under applicable regulatory requirements. Management monitors the capital levels to provide for current and future business opportunities and to maintain the Bank's "well-capitalized" status.
The tables below provide the Bank’s regulatory capital requirements and actual results at December 31, 2022 and 2021.
| | | | | | | | | | | | | | | | | | | | | | | | | | | | | | | | | | | |
| | Actual | | For Capital Adequacy | | To Be Well Capitalized |
| (Dollars in Thousands) | Amount | | Ratio | | Amount | | Ratio | | Amount | | Ratio |
| December 31, 2022 | |
| | | | | | | | | | | |
| | | | | | | | | | | |
| | | | | | | | | | | |
| | | | | | | | | | | |
| | | | | | | | | | | |
| | | | | | | | | | | |
| | | | | | | | | | | |
Tier 1 Risk-Based Core Capital
(To Risk Weighted Assets) | $ | 141,452 | | | 17.8 | % | | $ | 47,714 | | | 6.0 | % | | $ | 63,619 | | | 8.0 | % |
Total Risk-Based Capital
(To Risk Weighted Assets) | 151,408 | | | 19.0 | % | | 63,619 | | | 8.0 | % | | 79,523 | | | 10.0 | % |
| Common Equity Tier 1 Capital (To Risk Weighted Assets) | 141,452 | | | 17.8 | % | | 35,785 | | | 4.5 | % | | 51,690 | | | 6.5 | % |
Tier 1 Leverage (Core) Capital
(To Adjusted Tangible Assets) | 141,452 | | | 10.4 | % | | 54,372 | | | 4.0 | % | | 67,965 | | | 5.0 | % |
| December 31, 2021 | |
| | | | | | | | | | | |
| | | | | | | | | | | |
| | | | | | | | | | | |
| | | | | | | | | | | |
| | | | | | | | | | | |
| | | | | | | | | | | |
| | | | | | | | | | | |
Tier 1 Risk-Based Core Capital
(To Risk Weighted Assets) | $ | 123,783 | | | 17.4 | % | | $ | 42,701 | | | 6.0 | % | | $ | 56,934 | | | 8.0 | % |
Total Risk-Based Capital
(To Risk Weighted Assets) | 132,706 | | | 18.6 | % | | 56,934 | | | 8.0 | % | | 71,168 | | | 10.0 | % |
| Common Equity Tier 1 Capital (To Risk Weighted Assets) | 123,783 | | | 17.4 | % | | 32,025 | | | 4.5 | % | | 46,259 | | | 6.5 | % |
Tier 1 Leverage (Core) Capital
(To Adjusted Tangible Assets) | 123,783 | | | 9.9 | % | | 50,169 | | | 4.0 | % | | 62,711 | | | 5.0 | % |
In addition to the minimum capital requirements, the Bank must maintain a capital conservation buffer, which consists of additional Common Equity Tier 1 capital greater than 2.5% of risk-weighted assets above the required minimum levels in order to avoid limitations on paying dividends, repurchasing shares, and paying discretionary bonuses. At December 31, 2022 the Bank’s conservation buffer was 11.0%.
SECURITY FEDERAL CORPORATION AND SUBSIDIARIES
Notes to Consolidated Financial Statements
NOTE 17 - EMPLOYEE BENEFIT PLANS
The Company participates in a multiple employer defined contribution employee benefit plan covering substantially all employees with six months or more of service. The Company matches a portion of the employees’ contributions and the plan has a discretionary profit sharing provision. Total employer contributions were $357,000 and $328,000 for the years ended December 31, 2022 and 2021, respectively, which are included within Compensation and Employee Benefits within the Company's Consolidated Statements of Income.
The Company has an Employee Stock Purchase Plan (“ESPP”). The ESPP allows employees of the Company to purchase stock quarterly through a payroll deduction at a discount calculated as 15% of the market value with a floor equal to the Company’s book value. The ESPP, which was approved by stockholders in April 2018, became effective July 1, 2018. Participation in the ESPP is voluntary. Employees are limited to investing $25,000 or 5% of their annual salary, whichever is lower, during the year. There were no employee stock purchases during the year ended December 31, 2022.
In 2014, the Company implemented an Incentive Compensation Plan (the "Plan"). Incentive awards are based on the financial and operating performance of the Company as well as other participant specific objectives. The Plan allows employees of the Company to earn up to 7.5 days of their annual salary for successfully completing specific goals established by the participants and their respective supervisors plus an additional 2.5 days of their annual salary if the Company meets an annual predetermined net operating income amount determined by the Board of Directors.
In 2016, the Company implemented a Quarterly Branch Incentive Compensation Plan (the "Branch Incentive Plan"), and all branch employees were moved from the Plan to the Branch Incentive Plan. This plan is for retail branch employees only and pays incentive on a quarterly basis based on specific performance goals established for each branch location.
The Company also implemented an Incentive Compensation Plan for executive level officers (the "Executive Plan"). Under this plan, incentive awards are based on contributions to performance as measured by critical operating and financial ratios, and other participant specific objectives. The Company has to meet the annual predetermined net operating income amount determined by the Board of Directors for any incentive awards to be paid under the Executive Plan. If the Company does not meet the required net income amount, no incentives are paid regardless of the executive's performance on individual objectives or entity wide objectives.
Participation in the ESPP, the Plan, the Branch Incentive Plan and the Executive Plan is voluntary. During the years ended December 31, 2022 and 2021, the Company incurred expenses of $501,000 and $597,000, respectively, related to these incentive plans, which are included in Compensation and Employee Benefits within the Company's Consolidated Statements of Income.
Certain officers of the Company participate in a supplemental retirement plan. These benefits are not qualified under the Internal Revenue Code and they are not funded. During the years ended December 31, 2022 and 2021, the Company incurred expenses of $490,000 and $551,000, respectively, for this plan, which are included in Compensation and Employee Benefits within the Company's Consolidated Statements of Income.
NOTE 18 - BANK OWNED LIFE INSURANCE
BOLI provides key person life insurance on certain officers of the Company. The cash value of the life insurance policies is recorded as a separate line item in the accompanying balance sheets at $27.3 million and $26.7 million at December 31, 2022 and 2021, respectively. The earnings portion of the insurance policies grows tax deferred and helps offset the cost of the Company’s benefits programs. The Company recorded earnings of $608,000 and $635,000 for the growth in the cash surrender value of life insurance during the years ended December 31, 2022 and 2021, respectively. The Company received no death benefits during the years ended December 31, 2022 and 2021.
SECURITY FEDERAL CORPORATION AND SUBSIDIARIES
Notes to Consolidated Financial Statements
NOTE 19 - COMMITMENTS AND CONTINGENCIES
In the ordinary course of business, the Bank has various outstanding commitments and contingent liabilities that are not reflected in the accompanying consolidated financial statements. In addition, the Bank is a defendant in certain claims and legal actions arising in the ordinary course of business. In the opinion of management, after consultation with legal counsel, the ultimate disposition of these matters is not expected to have a material adverse effect on the consolidated financial condition of the Company.
In conjunction with its lending activities, the Bank enters into various commitments to extend credit. The Bank also issues letters of credit. Loan commitments (unfunded loans and unused lines of credit) and letters of credit are issued to accommodate the financing needs of the Bank's customers. Loan commitments are agreements by the Bank to lend at a future date, so long as there are no violations of any conditions established in the agreement. Letters of credit commit the Bank to make payments on behalf of customers when certain specified events occur.
Financial instruments where the contract amount represents the Bank's credit risk include commitments under pre-approved but unused lines of credit of $173.3 million and $163.8 million and letters of credit of $4.5 million and $3.0 million at December 31, 2022 and 2021, respectively. These loan and letter of credit commitments are subject to the same credit policies and reviews as loans on the balance sheet. Collateral, both the amount and nature, is obtained based upon management's assessment of the credit risk. Since many of the extensions of credit are expected to expire without being drawn, the total commitment amounts do not necessarily represent future cash requirements.
Included in the loan commitments noted above were unused credit card loan commitments of $10.7 million and $8.0 million and undisbursed loans in process of $22.7 million and $21.4 million at December 31, 2022 and 2021, respectively. The Bank also had $970,000 in outstanding commitments on mortgage loans approved but not yet closed at December 31, 2022 compared to $3.3 million at December 31, 2021. These commitments, which are funded subject to certain limitations, extend over varying periods of time with the majority being funded within 45 days.
At December 31, 2022 and 2021, the Bank had outstanding commitments to sell approximately $913,000 and $4.0 million of loans, respectively, which encompassed the Bank’s held for sale loans. The Bank also has commitments to sell mortgage loans not yet closed, on a best efforts basis. Best efforts means the Bank suffers no penalty if they are unable to deliver the loans to the potential buyers. The fair value of the Bank’s commitment to originate mortgage loans at committed interest rates and to sell such loans to permanent investors is insignificant.
SECURITY FEDERAL CORPORATION AND SUBSIDIARIES
Notes to Consolidated Financial Statements
NOTE 20 - RELATED PARTY TRANSACTIONS
Certain directors, executive officers and companies with which they are affiliated are customers of, and have banking transactions with, the Bank in the ordinary course of business. Loans to directors, executive officers and their affiliates are made on substantially the same terms, including interest rates and collateral, as those prevailing at the time for comparable arms-length transactions. A summary of loan transactions with directors, executive officers and their affiliates for the years indicated, is as follows:
| | | | | | | | | | | | | |
| | Years Ended December 31, |
| (Dollars in thousands) | 2022 | | 2021 | | |
| Balance, Beginning of Period | $ | 466 | | | $ | 492 | | | |
| New Loans | 252 | | | — | | | |
| Less Loan Payments | (35) | | | (26) | | | |
| Balance, End of Period | $ | 683 | | | $ | 466 | | | |
Loans to all employees, officers, and directors of the Company constituted approximately 2.10% and 2.13% of the Company’s total shareholders' equity at December 31, 2022 and 2021, respectively. Deposits from executive officers and directors of the Company and their related interests were approximately $19.6 million and $18.3 million at December 31, 2022 and 2021 and have substantially the same terms, including interest rates, as those prevailing at the time with other non-related depositors.
The Company leased office space from a related party during the years ended December 31, 2022 and 2021. The lease is with a company in which the related party, who is a director of the Company, has an ownership interest. The Company incurred rent expense of $96,500 and $89,800 for the years ended December 31, 2022 and 2021, respectively, related to this lease. Management is of the opinion that the transactions with respect to office rent were made on terms that are comparable to those which would be made with unaffiliated persons.
SECURITY FEDERAL CORPORATION AND SUBSIDIARIES
Notes to Consolidated Financial Statements
NOTE 21 - PARENT COMPANY ONLY CONDENSED FINANCIAL STATEMENTS
The following is condensed financial information of Security Federal Corporation (Parent Company only). The primary asset is its investment in the Bank subsidiary and the principal source of income for the Company is equity in undistributed earnings from the Bank.
Condensed Balance Sheet Data
| | | | | | | | | | | |
| | December 31, |
| (In Thousands) | 2022 | | 2021 |
| Assets: | | | |
| Cash | $ | 28,813 | | | $ | 20,177 | |
| Investments, HTM | 60,819 | | | — | |
| Investment in Security Federal Statutory Trust | 155 | | | 155 | |
| Investment in Security Federal Bank | 101,871 | | | 130,198 | |
| Accrued Interest Receivable | 190 | | | — | |
| Accounts Receivable and Other Assets | 194 | | | 283 | |
| Total Assets | $ | 192,042 | | | $ | 150,813 | |
| Liabilities and Shareholders’ Equity: | | | |
| Accounts Payable and Other Liabilities | $ | 153 | | | $ | 135 | |
| Long-term Debt | 31,655 | | | 35,155 | |
| | | |
| Shareholders’ Equity | 160,234 | | | 115,523 | |
| Total Liabilities and Shareholders’ Equity | $ | 192,042 | | | $ | 150,813 | |
Condensed Statements of Income Data
| | | | | | | | | | | | | |
| | Years Ended December 31, |
| (In Thousands) | 2022 | | 2021 | | |
| Income: | | | | | |
| Equity in Earnings of Security Federal Bank | $ | 10,668 | | | $ | 14,110 | | | |
| | | | | |
| Investment Securities Interest Income | 1,226 | | | — | | | |
| Miscellaneous Income | 16 | | | 46 | | | |
| Total Income | 11,910 | | | 14,156 | | | |
| Expenses: | | | | | |
| Interest Expense | 1,732 | | | 1,672 | | | |
| Other Expenses | 65 | | | 65 | | | |
| Total Expenses | 1,797 | | | 1,737 | | | |
| Income Before Income Taxes | 10,113 | | | 12,419 | | | |
| Income Tax Benefit | (115) | | | (355) | | | |
| Net Income | $ | 10,228 | | | $ | 12,774 | | | |
| | | | | |
| | | | | |
| | | | | |
SECURITY FEDERAL CORPORATION AND SUBSIDIARIES
Notes to Consolidated Financial Statements
Condensed Statements of Cash Flow Data
| | | | | | | | | | | |
| | Years Ended December 31, |
| (In Thousands) | 2022 | | 2021 |
| Operating Activities: | | | |
| Net Income | $ | 10,228 | | | $ | 12,774 | |
| Adjustments to Reconcile Net Income to Net Cash Used in Operating Activities: | | | |
| Equity in Earnings of Security Federal Bank | (10,668) | | | (14,110) | |
| Discount Accretion and Premium Amortization, Net | (125) | | | — | |
| Increase in Accrued Interest Receivable | (190) | | | — | |
| Decrease in Accounts Receivable and Other Assets | 89 | | | 59 | |
| Increase (Decrease) in Accounts Payable and Other Liabilities | 19 | | | — | |
| Net Cash Used By Operating Activities | (647) | | | (1,277) | |
| Investing Activities: | | | |
| Purchase of Investment Securities HTM | (62,512) | | | — | |
| Proceeds from Principal Paydowns of HTM Securities | 1,818 | | | — | |
| Investment in Subsidiary | (7,000) | | | — | |
| Net Cash Used By Investing Activities | (67,694) | | | — | |
| Financing Activities: | | | |
| Repurchase of Subordinated Debentures | (3,500) | | | — | |
| Proceeds from Issuance of Preferred Stock | 82,949 | | | — | |
| Dividends Paid to Shareholders-Common Stock | (2,472) | | | (1,431) | |
| Net Cash Provided (Used) By Financing Activities | 76,977 | | | (1,431) | |
| Net Increase (Decrease) in Cash | 8,636 | | | (2,708) | |
| Cash at Beginning of Period | 20,177 | | | 22,885 | |
| Cash at End of Period | $ | 28,813 | | | $ | 20,177 | |
SECURITY FEDERAL CORPORATION AND SUBSIDIARIES
Notes to Consolidated Financial Statements
NOTE 22 - CARRYING AMOUNTS AND FAIR VALUE OF FINANCIAL INSTRUMENTS
GAAP requires the Company to disclose fair value of financial instruments measured at amortized cost on the balance sheet and to measure that fair value using an exit price notion, the price that would be received for an asset or paid to transfer a liability, in the principal or most advantageous market for the asset or liability in an orderly transaction between market participants on the measurement date under current market conditions.
Accounting guidance emphasizes that fair value is a market-based measurement, not an entity-specific measurement. Therefore, a fair value measurement should be determined based on the assumptions that market participants would use in pricing the asset or liability. As a basis for considering market participant assumptions in fair value measurements, the guidance establishes a fair value hierarchy that distinguishes between market participant assumptions based on market data obtained from sources independent of the reporting entity (observable inputs that are classified within Levels 1 and 2 of the hierarchy) and the reporting entity’s own assumptions about market participant assumptions (unobservable inputs classified within Level 3 of the hierarchy).
The following three levels of inputs may be used to measure fair value:
Level 1
Valuation is based upon quoted prices (unadjusted) in active markets for identical assets or liabilities that the Company has the ability to access. Level 1 assets and liabilities include debt and equity securities and derivative contracts that are traded in an active exchange market, as well as U.S. Treasuries and money market funds.
Level 2
Valuation is based upon quoted prices for similar assets and liabilities in active markets, as well as inputs that are observable for the asset or liability (other than quoted prices), such as interest rates, foreign exchange rates, and yield curves that are observable at commonly quoted intervals. Level 2 assets and liabilities include debt securities with quoted prices that are traded less frequently than exchange-traded instruments, mortgage-backed securities, municipal bonds, corporate debt securities and derivative contracts whose value is determined using a pricing model with inputs that are observable in the market or can be derived principally from or corroborated by observable market data. This category generally includes certain derivative contracts.
Level 3
Valuation is generated from model-based techniques that use at least one significant assumption based on unobservable inputs for the asset or liability, which are typically based on an entity’s own assumptions, as there is little, if any, related market activity. In instances where the determination of the fair value measurement is based on inputs from different levels of the fair value hierarchy, the level in the fair value hierarchy within which the entire fair value measurement falls is based on the lowest level input that is significant to the fair value measurement in its entirety. The assessment of the significance of a particular input to the fair value measurement in its entirety requires judgment, and considers factors specific to the asset or liability.
The following is a description of the valuation methodologies used for assets and liabilities recorded at fair value.
Investment Securities AFS
Investment securities AFS are recorded at fair value on a recurring basis. At December 31, 2022, the Company’s investment portfolio was comprised of student loan pools, government and agency bonds, MBS issued by government sponsored agencies or GSEs, private label CMO securities and municipal securities. Fair value measurement is based upon prices obtained from third party pricing services that use independent pricing models which rely on a variety of factors including reported trades, broker/dealer quotes, benchmark yields, economic and industry events and other relevant market information. As such, these securities are classified as Level 2.
SECURITY FEDERAL CORPORATION AND SUBSIDIARIES
Notes to Consolidated Financial Statements
Mortgage Loans Held for Sale
The Company originates fixed rate residential loans on a servicing released basis in the secondary market. Loans closed but not yet settled with institutional investors are carried in the Company’s loans held for sale portfolio. These loans are fixed rate residential loans that have been originated in the Company’s name and have closed. Virtually all of these loans have commitments to be purchased by investors and the majority of these loans were locked in by price with the investors on the same day or shortly thereafter that the loan was locked in with the Company’s customers. Therefore, these loans present very little market risk for the Company.
The Company usually delivers to, and receives funding from, the investor within 30 days. Commitments to sell these loans to the investor are considered derivative contracts and are sold to investors on a “best efforts" basis. The Company is not obligated to deliver a loan or pay a penalty if a loan is not delivered to the investor. As a result of the short-term nature of these derivative contracts, the fair value of the mortgage loans held for sale in most cases is the same as the value of the loan amount at its origination. These loans are classified as Level 2.
Land Held for Sale
Land held for sale is reported at the lower of the carrying amount or fair value less costs to sell. Fair value is based upon independent market prices, appraised values of the collateral or management’s estimation of the value of the collateral less estimated selling costs. The Company records land held for sale as nonrecurring level 3.
Impaired Loans
The Company does not record loans held for investment at fair value on a recurring basis. However, from time to time, a loan is considered impaired and an allowance for loan losses is established as necessary. Loans for which it is probable that payment of interest and principal will not be made in accordance with the contractual terms of the loan agreement are considered impaired. Once a loan is identified as individually impaired, management measures impairment.
Fair value is estimated using one of the following methods: fair value of the collateral less estimated costs to sell, discounted cash flows, or market value of the loan based on similar debt. The fair value of the collateral less estimated costs to sell is the most frequently used method. Typically, the Company reviews the most recent appraisal and if it is over 24 months old will request a new third party appraisal. Depending on the particular circumstances surrounding the loan, including the location of the collateral, the date of the most recent appraisal and the value of the collateral relative to the recorded investment in the loan, management may order an independent appraisal immediately or, in some instances, may elect to perform an internal analysis. Specifically as an example, in situations where the collateral on a nonperforming commercial real estate loan is out of the Company’s primary market area, management would typically order an independent appraisal immediately, at the earlier of the date the loan becomes nonperforming or immediately following the determination that the loan is impaired. However, as a second example, on a nonperforming commercial real estate loan where management is familiar with the property and surrounding areas and where the original appraisal value far exceeds the recorded investment in the loan, management may perform an internal analysis whereby the previous appraisal value would be reviewed and adjusted for current conditions including recent sales of similar properties in the area and any other relevant economic trends. These valuations are reviewed at a minimum on a quarterly basis.
Those impaired loans not requiring an allowance represent loans for which the fair value of the expected repayments or collateral exceed the recorded investments in such loans. At December 31, 2022, all impaired loans were evaluated based on the fair value of the collateral. Impaired loans where an allowance is established based on the fair value of collateral require classification in the fair value hierarchy. The Company records impaired loans as nonrecurring Level 3.
Foreclosed Assets
Foreclosed assets are adjusted to fair value upon transfer of the loans to foreclosed assets. Subsequently, they are carried at the lower of carrying value or fair value. Fair value is based upon independent market prices, appraised values of the collateral or management’s estimation of the value of the collateral less estimated selling costs. The Company records all foreclosed assets as nonrecurring level 3.
SECURITY FEDERAL CORPORATION AND SUBSIDIARIES
Notes to Consolidated Financial Statements
The tables below present the balances of assets measured at fair value on a recurring basis at the dates indicated.
| | | | | | | | | | | | | | | | | | | | | | | | | | | | | | | | | | | |
| December 31, 2022 | | December 31, 2021 |
| (Dollars in thousands) | Level 1 | | Level 2 | | Level 3 | | Level 1 | | Level 2 | | Level 3 |
| Student Loan Pools | $ | — | | | $ | 59,158 | | | $ | — | | | $ | — | | | $ | 72,012 | | | $ | — | |
| SBA Bonds | — | | | 99,630 | | | — | | | — | | | 139,793 | | | — | |
| Tax Exempt Municipal Bonds | — | | | 21,310 | | | — | | | — | | | 49,985 | | | — | |
| Taxable Municipal Bonds | — | | | 50,770 | | | — | | | — | | | 65,969 | | | — | |
| Mortgage-Backed Securities | — | | | 319,280 | | | — | | | — | | | 355,090 | | | — | |
| Total | $ | — | | | $ | 550,148 | | | $ | — | | | $ | — | | | $ | 682,849 | | | $ | — | |
There were no liabilities measured at fair value on a recurring basis as of December 31, 2022 and 2021.
The Company may be required, from time to time, to measure certain assets at fair value on a nonrecurring basis. These include assets that are measured at the lower of cost or market that were recognized at fair value below cost at the end of the period. The table below presents assets measured at fair value on a nonrecurring basis at the dates indicated, aggregated by the level in the fair value hierarchy within which those measurements fall. There were no liabilities measured at fair value on a nonrecurring basis as of December 31, 2022 and 2021.
| | | | | | | | | | | | | | | | | | | | | | | |
| December 31, 2022 |
| Assets (in thousands): | Level 1 | | Level 2 | | Level 3 | | Total |
| Mortgage Loans Held For Sale | $ | — | | | $ | 913 | | | $ | — | | | $ | 913 | |
| Land Held For Sale | — | | | — | | | 1,097 | | | 1,097 | |
Collateral Dependent Impaired Loans (1) | — | | | — | | | 5,566 | | | 5,566 | |
| Foreclosed Assets | — | | | — | | | 120 | | | 120 | |
| Total | $ | — | | | $ | 913 | | | $ | 6,783 | | | $ | 7,696 | |
| | | | | | | |
| December 31, 2021 |
| Assets (in thousands): | Level 1 | | Level 2 | | Level 3 | | Total |
| Mortgage Loans Held For Sale | $ | — | | | $ | 4,038 | | | $ | — | | | $ | 4,038 | |
| Land Held For Sale | — | | | — | | | 1,530 | | | 1,530 | |
Collateral Dependent Impaired Loans (1) | — | | | — | | | 2,323 | | | 2,323 | |
| Foreclosed Assets | — | | | — | | | 130 | | | 130 | |
| Total | $ | — | | | $ | 4,038 | | | $ | 3,983 | | | $ | 8,021 | |
(1) Reported net of specific reserves. There were no specific reserves at December 31, 2022 and 2021.
For Level 3 assets and liabilities measured at fair value on a recurring or non-recurring basis, the significant unobservable inputs used in the fair value measurements at the dates indicated were as follows:
| | | | | | | | | | | | | | | | | | | | | | | | | | | |
| | | Valuation | | Significant | | 2022 | | 2021 |
| Level 3 Assets | | | Technique | | Unobservable Inputs | | Range | | Range |
| Land Held for Sale | | | Appraised Value/Comparable Sales | | Discounts to appraised values for estimated holding or selling costs | | 10% | | 10% |
| Collateral Dependent Impaired Loans | | | Appraised Value | | Discounts to appraised values or cash flows for estimated holding and/or selling costs or age of appraisal | | 8% - 13% | | 8% - 13% |
| Foreclosed Assets | | | Appraised Value/Comparable Sales | | Discounts to appraised values for estimated holding or selling costs | | 30% | | 30% |
SECURITY FEDERAL CORPORATION AND SUBSIDIARIES
Notes to Consolidated Financial Statements
For assets and liabilities not presented on the balance sheet at fair value, the following methods are used to determine fair value:
Cash and cash equivalents—The carrying amount of these financial instruments approximates fair value. All mature within 90 days and do not present unanticipated credit concerns.
Certificates of deposits with other banks—Fair value is based on market prices for similar assets.
Investment securities held to maturity—Securities held to maturity are valued at quoted market prices or dealer quotes.
Loans Receivable, Net—The fair value of loans are estimated using an exit price notion. The exit price notion uses a discounted cash flows technique to calculate the present value of expected future cash flows for a financial instrument and also incorporates other factors, such as enhanced credit risk, illiquidity risk and market factors that sometimes exist in exit prices in dislocated markets. The credit risk assumption is intended to approximate the fair value that a market participant would realize in a hypothetical orderly transaction. The Company’s loan portfolio is initially fair valued using a segmented approach. The Company divides its loan portfolio into the following categories: commercial real estate, other commercial, residential real estate, consumer and all other loans. The results are then adjusted to account for credit risk as described above. A further credit risk discount must be applied through the use of a discounted cash flow model to compensate for illiquidity risk, based on certain assumptions included within the discounted cash flow model, primarily the use of discount rates that better capture inherent credit risk over the lifetime of a loan. This consideration of enhanced credit risk provides an estimated exit price for the Company’s loan portfolio. For variable-rate loans that reprice frequently and have no significant change in credit risk, fair values approximate carrying values.
FHLB Stock—The fair value approximates the carrying value.
Deposits—The fair value of demand deposits, savings accounts, and money market accounts is the amount payable on demand at the reporting date. The fair value of fixed-maturity certificates of deposits is estimated by discounting the future cash flows using rates currently offered for deposits of similar remaining maturities.
FHLB Advances and Borrowings from the FRB—Fair value is estimated using discounted cash flows with current market rates for borrowings with similar terms.
Other Borrowed Money—The carrying value of these short term borrowings approximates fair value.
Note Payable—The carrying value of the note payable approximates fair value.
Senior Convertible Debentures— The fair value is estimated by discounting the future cash flows using the current rates at which similar debenture offerings with similar terms and maturities would be issued by similar institutions. As discount rates are based on current debenture rates as well as management estimates, the fair values presented may not be indicative of the value negotiated in an actual sale.
Subordinated Debentures—The fair value is estimated by discounting the future cash flows using the current rates at which similar debenture offerings with similar terms and maturities would be issued by similar institutions. As discount rates are based on current debenture rates as well as management estimates, the fair values presented may not be indicative of the value negotiated in an actual sale.
Junior Subordinated Debentures—The carrying value of junior subordinated debentures approximates fair value.
SECURITY FEDERAL CORPORATION AND SUBSIDIARIES
Notes to Consolidated Financial Statements
The following tables summarize the carrying value and estimated fair value of the Company’s financial instruments at the dates indicated, presented in accordance with the applicable accounting guidance.
| | | | | | | | | | | | | | | | | | | | | | | | | | | | | |
| December 31, 2022 |
| Carrying | | Fair Value |
| (In Thousands) | Amount | | Total | | Level 1 | | Level 2 | | Level 3 |
| Financial Assets: | | | | | | | | | |
| Cash and Cash Equivalents | $ | 28,502 | | | $ | 28,502 | | | $ | 28,502 | | | $ | — | | | $ | — | |
| Certificates of Deposits with Other Banks | 1,100 | | | 1,100 | | | — | | | 1,100 | | | — | |
| Investment Securities | 717,586 | | | 711,612 | | | — | | | 711,612 | | | — | |
| Loans Receivable, Net | 549,917 | | | 528,174 | | | — | | | — | | | 528,174 | |
| FHLB Stock | 651 | | | 651 | | | 651 | | | — | | | — | |
| Land Held for Sale | 1,097 | | | 1,097 | | | — | | | — | | | 1,097 | |
| Financial Liabilities: | | | | | | | | | |
| Deposits: | | | | | | | | | |
| Checking, Savings and Money Market Accounts | $ | 968,054 | | | $ | 968,054 | | | $ | 968,054 | | | $ | — | | | $ | — | |
| Certificate Accounts | 142,031 | | | 138,382 | | | — | | | 138,382 | | | — | |
| | | | | | | | | |
| Borrowings from FRB | 44,080 | | | 44,071 | | | 44,071 | | | — | | | — | |
| Other Borrowed Money | 27,588 | | | 27,588 | | | 27,588 | | | — | | | — | |
| Subordinated Debentures | 26,500 | | | 24,435 | | | — | | | 24,435 | | | — | |
| Junior Subordinated Debentures | 5,155 | | | 5,155 | | | — | | | 5,155 | | | — | |
| | | | | | | | | | | | | | | | | | | | | | | | | | | | | |
| December 31, 2021 |
| Carrying | | Fair Value |
| (In Thousands) | Amount | | Total | | Level 1 | | Level 2 | | Level 3 |
| Financial Assets: | | | | | | | | | |
| Cash and Cash Equivalents | $ | 27,623 | | | $ | 27,623 | | | $ | 27,623 | | | $ | — | | | $ | — | |
| Certificates of Deposits with Other Banks | 1,100 | | | 1,100 | | | — | | | 1,100 | | | — | |
| Investment Securities | 706,356 | | | 706,569 | | | — | | | 706,569 | | | — | |
| Loans Receivable, Net | 499,497 | | | 508,024 | | | — | | | — | | | 508,024 | |
| FHLB Stock | 586 | | | 586 | | | 586 | | | — | | | — | |
| Land Held for Sale | 1,530 | | | 1,530 | | | — | | | — | | | 1,530 | |
| Financial Liabilities: | | | | | | | | | |
| Deposits: | | | | | | | | | |
| Checking, Savings and Money Market Accounts | $ | 958,601 | | | $ | 958,601 | | | $ | 958,601 | | | $ | — | | | $ | — | |
| Certificate Accounts | 157,362 | | | 157,201 | | | — | | | 157,201 | | | — | |
| | | | | | | | | |
| | | | | | | | | |
| Other Borrowed Money | 26,785 | | | 26,785 | | | 26,785 | | | — | | | — | |
| Subordinated Debentures | 30,000 | | | 30,154 | | | — | | | 30,154 | | | — | |
| Junior Subordinated Debentures | 5,155 | | | 5,155 | | | — | | | 5,155 | | | — | |
At December 31, 2022, the Company had $177.8 million of off-balance sheet financial commitments. These commitments are to originate loans and unused consumer lines of credit and credit card lines. Because these obligations are based on current market rates, if funded, the original principal is considered to be a reasonable estimate of fair value.
Fair value estimates are made on a specific date, based on relevant market data and information about the financial instrument. These estimates do not reflect any premium or discount that could result from offering for sale the Bank’s entire holdings of a particular financial instrument.
SECURITY FEDERAL CORPORATION AND SUBSIDIARIES
Notes to Consolidated Financial Statements
Because no active market exists for a significant portion of the Company's financial instruments, fair value estimates are based on judgments regarding future expected loss experience, current economic conditions, current interest rates and prepayment trends, risk characteristics of various financial instruments, and other factors. These estimates are subjective in nature and involve uncertainties and matters of significant judgment and therefore cannot be determined with precision. Changes in any of these assumptions used in calculating fair value would also significantly affect the estimates. Fair value estimates are based on existing on- and off-balance sheet financial instruments without attempting to estimate the value of anticipated future business and the value of assets and liabilities that are not considered financial instruments. For example, the Bank has significant assets and liabilities that are not considered financial assets or liabilities including deposit franchise values, loan servicing portfolios, deferred tax liabilities, and premises and equipment.
In addition, the tax ramifications related to the realization of the unrealized gains and losses can have a significant effect on fair value estimates and have not been considered in any of these estimates. The Company has used management’s best estimate of fair value on the above assumptions. Thus, the fair values presented may not be the amounts, which could be realized, in an immediate sale or settlement of the instrument. In addition, any income taxes or other expenses that would be incurred in an actual sale or settlement are not taken into consideration in the fair value presented.
SECURITY FEDERAL CORPORATION AND SUBSIDIARIES
Notes to Consolidated Financial Statements
NOTE 23 - QUARTERLY FINANCIAL DATA (UNAUDITED)
Unaudited condensed financial data by quarter for the years ended December 31, 2022 and 2021 is as follows (dollars, except per share data, in thousands):
| | | | | | | | | | | | | | | | | | | | | | | |
| | Quarter ended |
| 3/31/2022 | | 6/30/2022 | | 9/30/2022 | | 12/31/2022 |
| Interest Income | $ | 8,700 | | | $ | 9,388 | | | $ | 11,293 | | | $ | 13,197 | |
| Interest Expense | 795 | | | 844 | | | 1,159 | | | 2,231 | |
| Net Interest Income | 7,905 | | | 8,544 | | | 10,134 | | | 10,966 | |
| Provision for Loan Losses | — | | | — | | | — | | | — | |
Net Interest Income After Provision for Loan Losses | 7,905 | | | 8,544 | | | 10,134 | | | 10,966 | |
| Non-interest Income | 2,603 | | | 2,638 | | | 2,224 | | | 2,149 | |
| Non-interest Expense | 8,595 | | | 8,429 | | | 8,278 | | | 8,924 | |
| Income Before Income Tax | 1,913 | | | 2,753 | | | 4,080 | | | 4,191 | |
| Provision for Income Taxes | 364 | | | 589 | | | 854 | | | 902 | |
| Net Income | $ | 1,549 | | | $ | 2,164 | | | $ | 3,226 | | | $ | 3,289 | |
| Basic Net Income Per Common Share | $ | 0.48 | | | $ | 0.67 | | | $ | 0.99 | | | $ | 1.01 | |
| | | | | | | |
| Basic Weighted Average Shares Outstanding | 3,252,884 | | | 3,252,884 | | | 3,252,884 | | | 3,252,884 | |
| | | | | | | |
| | | | | | | | | | | | | | | | | | | | | | | |
| | Quarter ended |
| 3/31/2021 | | 6/30/2021 | | 9/30/2021 | | 12/31/2021 |
| Interest Income | $ | 9,098 | | | $ | 8,717 | | | $ | 9,668 | | | $ | 9,634 | |
| Interest Expense | 1,078 | | | 978 | | | 845 | | | 924 | |
| Net Interest Income | 8,020 | | | 7,739 | | | 8,823 | | | 8,710 | |
| Reversal of Provision For Loan Losses | (870) | | | (735) | | | (665) | | | (134) | |
Net Interest Income After Provision for Loan Losses | 8,890 | | | 8,474 | | | 9,488 | | | 8,844 | |
| Non-interest Income | 2,774 | | | 2,687 | | | 4,530 | | | 2,642 | |
| Non-interest Expense | 7,610 | | | 7,446 | | | 8,049 | | | 8,942 | |
| Income Before Income Tax | 4,054 | | | 3,715 | | | 5,969 | | | 2,544 | |
| Provision for Income Taxes | 875 | | | 791 | | | 1,327 | | | 516 | |
| Net Income | $ | 3,179 | | | $ | 2,924 | | | $ | 4,642 | | | $ | 2,028 | |
| Basic Net Income Per Common Share | $ | 0.98 | | | $ | 0.90 | | | $ | 1.43 | | | $ | 0.62 | |
| | | | | | | |
| Basic Weighted Average Shares Outstanding | 3,252,884 | | | 3,252,884 | | | 3,252,884 | | | 3,252,884 | |
| | | | | | | |
SECURITY FEDERAL CORPORATION AND SUBSIDIARIES
Notes to Consolidated Financial Statements
NOTE 24 - NON-INTEREST INCOME
The following table presents non-interest income for the years indicated. All revenue from contracts with customers within the scope of ASU No. 2014-09, Revenue from Contracts with Customers (Topic 606) is recognized in non-interest income, with the exception of gains on the sale of OREO, which are included in non-interest expense when applicable.
| | | | | | | | | | | |
| Year Ended December 31, |
| 2022 | | 2021 |
| Non-interest income (in thousands): | | | |
(Loss) Gain on Sale of Investments, net (1) | $ | (2) | | | $ | — | |
Gain on Sale of Loans (1) | 1,705 | | | 3,836 | |
| Service Fees on Deposit Accounts | 1,071 | | | 957 | |
Commissions From Insurance Agency (1) | 784 | | | 610 | |
| Trust Income | 1,548 | | | 1,439 | |
BOLI Income (1) | 608 | | | 635 | |
| ATM and Check Card Fee Income | 2,816 | | | 2,470 | |
Grant Income (1) | 171 | | | 1,826 | |
Other (1) | 911 | | | 860 | |
| Total non-interest income | $ | 9,612 | | | $ | 12,633 | |
(1) Not within the scope of ASC 606 | | | |
Revenue Recognition
The following is a discussion of key revenues within the scope of the current revenue guidance.
In accordance with Topic 606, revenues are recognized when control of promised goods or services is transferred to customers in an amount that reflects the consideration the Bank expects to be entitled to in exchange for those goods or services. To determine revenue recognition for arrangements that an entity determines are within the scope of Topic 606, management performs the following five steps: (i) identify the contract(s) with a customer; (ii) identify the performance obligations in the contract; (iii) determine the transaction price; (iv) allocate the transaction price to the performance obligations in the contract; and (v) recognize revenue when (or as) the performance obligation is satisfied.
The five-step model is only applied to contracts when it is probable that the entity will collect the consideration it is entitled to in exchange for the goods or services it transfers to the customer. At contract inception, once the contract is determined to be within the scope of Topic 606, the Bank assesses the goods or services that are promised within each contract and identifies those that contain performance obligations, and assesses whether each promised good or service is distinct. The amount of the transaction price that is allocated to the respective performance obligation is recognized as revenue when (or as) the performance obligation is satisfied.
Service Fees on Deposit Accounts
The Bank earns fees from its deposit customers for account maintenance, transaction-based and overdraft services. Account maintenance fees consist primarily of account fees and analyzed account fees charged on deposit accounts on a monthly basis. The performance obligation is satisfied and the fees are recognized on a monthly basis as the service period is completed. Transaction-based fees on deposits accounts are charged to deposit customers for specific services provided to the customer, such as non-sufficient funds fees, overdraft fees, and wire fees. The performance obligation is completed as the transaction occurs and the fees are recognized at the time each specific service is provided to the customer.
Trust Income
Trust income includes monthly advisory fees that are based on assets under management and certain transaction fees that are assessed and earned monthly, concurrently with the investment management services provided to the customer. The Bank does not charge performance based fees for its trust services and does not currently have any institutional clients, hedge funds or mutual funds. Although trust income is included within the scope of Topic 606, based on the fees charged by the Bank, we do not anticipate any changes in the accounting for trust income at this time.
SECURITY FEDERAL CORPORATION AND SUBSIDIARIES
Notes to Consolidated Financial Statements
ATM and Check Card Fee Income
Check card fee income represents fees earned when a debit card issued by the Bank is used. The Bank earns interchange fees from debit cardholder transactions through the Mastercard payment network. Interchange fees from cardholder transactions represent a percentage of the underlying transaction value and are recognized daily, concurrently with the transaction processing services provided to the cardholder. The performance obligation is satisfied and the fees are earned when the cost of the transaction is charged to the card. Certain expenses directly associated with the debit card are recorded on a net basis with the fee income.
Gains/Losses on OREO Sales
Gains/losses on the sale of OREO are included in non-interest expense and are generally recognized when the performance obligation is complete. This is typically at delivery of control over the property to the buyer at the time of each real estate closing.
NOTE 25 - PREFERRED STOCK
On May 24, 2022, the Company entered into a Letter Agreement (“Agreement”) with the U.S. Department of Treasury under the Emergency Capital Investment Program (“ECIP”). Established by the Consolidated Appropriations Act, 2021, the ECIP was created to encourage low- and moderate-income community financial institutions and minority depository institutions to provide loans, grants, and forbearance for small businesses, minority-owned businesses, and consumers, especially low-income and underserved communities, including counties with persistent poverty, that may be disproportionately impacted by the economic effect of the COVID-19 pandemic by providing direct and indirect capital investments in low- and moderate-income community financial institutions.
Pursuant to the Agreement, the Company agreed to issue and sell 82,949 shares of Preferred Stock for an aggregate purchase price of $82.9 million in cash. This ECIP investment is treated as tier 1 capital. The Preferred Stock bears no dividend for the first 24 months following the investment date. Thereafter, the dividend rate will be adjusted, not higher than 2%, based on the lending growth criteria listed in the Agreement. After the tenth anniversary of the investment date, the dividend rate will be fixed based on the average annual amount of lending in years 2 through 10. Dividends will be payable quarterly in arrears on March 15, June 15, September 15, and December 15.
The Preferred Stock may be redeemed at the option of the Company on or after the fifth anniversary of issuance (or earlier in the event of loss of regulatory capital treatment), subject to the approval of the appropriate federal banking regulator and in accordance with the federal banking agencies’ regulatory capital regulations. The Preferred Stock is reported on the Consolidated Balance Sheets as Senior Non-Cumulative Perpetual Preferred Stock, Series ECIP.
NOTE 26 - SUBSEQUENT EVENTS
Subsequent events are events or transactions that occur after the balance sheet date but before financial statements are issued. Recognized subsequent events are events or transactions that provide additional evidence about conditions that existed at the date of the balance sheet, including the estimates inherent in the process of preparing financial statements. Non-recognized subsequent events are events that provide evidence about conditions that did not exist at the date of the balance sheet but arose after that date.
The Company has disclosed deposit concentrations in Note 9 of the Notes to Consolidated Financial Statements included herein. In relation to current economic conditions, management has monitored deposit concentrations through the date the financial statements were issued noting no significant changes to concentrations. In addition, there has been no significant deposit deterioration through the date the financial statements were issued.
The Company has disclosed its investment portfolio position in Notes 2 and 3 of the Notes to Consolidated Financial Statements included herein. There has been no significant deterioration in the investment portfolio through the date the consolidated financial statements were issued.
Management has reviewed the events occurring through the date the financial statements were issued and no additional subsequent events occurred requiring accrual or disclosure.
SHAREHOLDERS INFORMATION
ANNUAL MEETING
The annual meeting of shareholders will be held at 11:00 a.m. on Thursday, May 11, 2023.
STOCK LISTING
The Company’s stock is traded on the Pink Open Market under the symbol “SFDL.” The stock began trading in October 2003.
PRICE RANGE OF COMMON STOCK
The table below shows the range of high and low bid prices. These prices represent actual transactions and do not include retail markups, markdowns or commissions.
| | | | | | | | | | | | | | |
| | High | | Low |
| Year Ended December 31, 2022 | | | | |
| 03/31/2022 | | $35.00 | | $31.36 |
| 06/30/2022 | | $34.87 | | $27.10 |
| 09/30/2022 | | $29.00 | | $26.00 |
| 12/31/2022 | | $37.75 | | $25.30 |
| | | | |
| Year Ended December 31, 2021 | | | | |
| 03/31/2021 | | $34.52 | | $25.31 |
| 06/30/2021 | | $36.49 | | $31.56 |
| 09/30/2021 | | $34.63 | | $30.98 |
| 12/31/2021 | | $32.96 | | $30.98 |
As of December 31, 2022, the Company had approximately 279 shareholders of record, not including shares held in street name, and 3,252,884 outstanding shares of common stock.
DIVIDENDS
The first quarterly dividend on the stock was paid to shareholders on March 15, 1991. Dividends will be paid upon the determination of the Board of Directors that such payment is consistent with the long-term interest of the Company. The factors affecting this determination include the Company’s current and projected earnings, operating results, financial condition, regulatory restrictions, future growth plans, and other relevant factors. During 2021 and 2022, the Company paid quarterly cash dividends per share of $0.11 and $0.12, respectively. In addition to the quarterly dividends paid in 2022, the Company also paid a special cash dividend of $0.28 per share in 2022 to all shareholders of record as of March 31, 2022. During 2023, the Company expects to pay a quarterly cash dividend of $0.13 per share.
The ability of the Company to pay dividends depends primarily on the ability of the Bank to pay dividends to the Company. The Bank may not declare or pay a cash dividend on its stock or repurchase shares of its stock if the offset thereof would be to cause its regulatory capital to be reduced below the amount required to meet applicable regulatory capital requirements. South Carolina banking regulations restrict the amount of dividends that the Bank can pay to the Company, and may require prior approval before declaration and payment of any excess dividend. Unlike the Bank, there is no regulatory restriction on the payment of dividends by the Company; however, it is subject to the requirements of South Carolina law. South Carolina law generally prohibits the Company from paying dividends if, after giving effect to a proposed dividend: (1) the Company would be unable to pay its debts as they become due in the normal course of business, or (2) the Company’s total assets would be less than its total liabilities plus the sum that would be needed to satisfy the preferential rights upon dissolution of shareholders whose preferential rights are superior to those receiving the dividend. The Federal Reserve also has the authority to prohibit the Company from paying a dividend on its common stock.
CODE OF ETHICS
A copy of the Company’s Code of Ethics may be obtained at the Company’s Internet website at www.securityfederalbank.com.