UNITED STATES
SECURITIES AND EXCHANGE COMMISSION
Washington, D.C. 20549
______________________________
FORM 10-K
______________________________
(Mark One)
þ | ANNUAL REPORT PURSUANT TO SECTION 13 OR 15(d) OF THE SECURITIES EXCHANGE ACT OF 1934 |
For the fiscal year ended November 30, 2016 or
¨ | TRANSITION REPORT PURSUANT TO SECTION 13 OR 15(d) OF THE SECURITIES EXCHANGE ACT OF 1934 |
For the transition period from ______________ to ________________
Commission file number: 001-9610 |  | Commission file number: 001-15136 |
Carnival Corporation | Carnival plc | |
(Exact name of registrant as specified in its charter) | (Exact name of registrant as specified in its charter) | |
Republic of Panama | England and Wales | |
(State or other jurisdiction of incorporation or organization) | (State or other jurisdiction of incorporation or organization) | |
59-1562976 | 98-0357772 | |
(I.R.S. Employer Identification No.) | (I.R.S. Employer Identification No.) | |
3655 N.W. 87th Avenue Miami, Florida 33178-2428 | Carnival House, 100 Harbour Parade, Southampton SO15 1ST, United Kingdom | |
(Address of principal executive offices and zip code) | (Address of principal executive offices and zip code) | |
(305) 599-2600 | 011 44 23 8065 5000 | |
(Registrant’s telephone number, including area code) | (Registrant’s telephone number, including area code) | |
Securities registered pursuant to Section 12(b) of the Act: | Securities registered pursuant to Section 12(b) of the Act: | |
Title of each class | Title of each class | |
Common Stock ($0.01 par value) | Ordinary Shares each represented by American Depositary Shares ($1.66 par value), Special Voting Share, GBP 1.00 par value and Trust Shares of beneficial interest in the P&O Princess Special Voting Trust | |
Name of each exchange on which registered | Name of each exchange on which registered | |
New York Stock Exchange, Inc. | New York Stock Exchange, Inc. | |
Securities registered pursuant to Section 12(g) of the Act: None
Indicate by check mark if the registrants are well-known seasoned issuers, as defined in Rule 405 of the Securities Act.
Yes þ No ¨
Indicate by check mark if the registrants are not required to file reports pursuant to Section 13 or Section 15(d) of the Act.
Yes ¨ No þ
Indicate by check mark whether the registrants (1) have filed all reports required to be filed by Section 13 or 15(d) of the Securities Exchange Act of 1934 during the preceding 12 months (or for such shorter period that the registrants were required to file such reports), and (2) have been subject to such filing requirements for the past 90 days. Yes þ No ¨
Indicate by check mark whether the registrants have submitted electronically and posted on their corporate Web site, if any, every Interactive Data File required to be submitted and posted pursuant to Rule 405 of Regulation S-T (§ 232.405 of this chapter) during the preceding 12 months (or for such shorter period that the registrants were required to submit and post such files). Yes þ No ¨
Indicate by check mark if disclosure of delinquent filers pursuant to Item 405 of Regulation S-K (§ 229.405 of this chapter) is not contained herein, and will not be contained, to the best of registrants’ knowledge, in definitive proxy or information statements incorporated by reference in Part III of this Form 10-K or any amendment to this Form 10-K. þ
Indicate by check mark whether the registrants are large accelerated filers, accelerated filers, non-accelerated filers, or small reporting companies. See the definitions of "large accelerated filer,” “accelerated filer” and “smaller reporting company” in Rule 12b-2 of the Exchange Act.
Large Accelerated Filers | þ | Accelerated Filers | ¨ |
Non-Accelerated Filers | ¨ | Smaller Reporting Companies | ¨ |
Indicate by check mark whether the registrants are shell companies (as defined in Rule 12b-2 of the Act). Yes ¨ No þ
The aggregate market value of the voting and non-voting common equity held by non-affiliates computed by reference to the price at which the common equity was last sold was $19.0 billion as of the last business day of the registrant’s most recently completed second fiscal quarter. | The aggregate market value of the voting and non-voting common equity held by non-affiliates computed by reference to the price at which the common equity was last sold was $9.1 billion as of the last business day of the registrant’s most recently completed second fiscal quarter. | |
At January 19, 2017, Carnival Corporation had outstanding 535,835,649 shares of its Common Stock, $0.01 par value. | At January 19, 2017, Carnival plc had outstanding 216,038,487 Ordinary Shares $1.66 par value, one Special Voting Share, GBP 1.00 par value and 535,835,649 Trust Shares of beneficial interest in the P&O Princess Special Voting Trust. | |
CARNIVAL CORPORATION & PLC
FORM 10-K
FOR THE FISCAL YEAR ENDED NOVEMBER 30, 2016
TABLE OF CONTENTS
PART I | ||
Item 1. | ||
Item 1A. | ||
Item 1B. | ||
1
Item 2. | |||
Item 3. | |||
Item 4. | |||
PART II | |||
Item 5. | |||
Item 6. | |||
Item 7. | |||
Item 7A. | |||
Item 8. | |||
Item 9. | |||
Item 9A. | |||
PART III | |||
Item 10. | |||
Item 11. | |||
Item 12. | |||
Item 13. | |||
Item 14. | |||
PART IV | |||
Item 15. | |||
2
DOCUMENTS INCORPORATED BY REFERENCE
The information described below and contained in the Registrants’ 2016 annual report to shareholders to be furnished to the U.S. Securities and Exchange Commission pursuant to Rule 14a-3(b) of the Securities Exchange Act of 1934 is shown in Exhibit 13 and is incorporated by reference into this joint 2016 Annual Report on Form 10-K (“Form 10-K”).
Part and Item of the Form 10-K
Part II
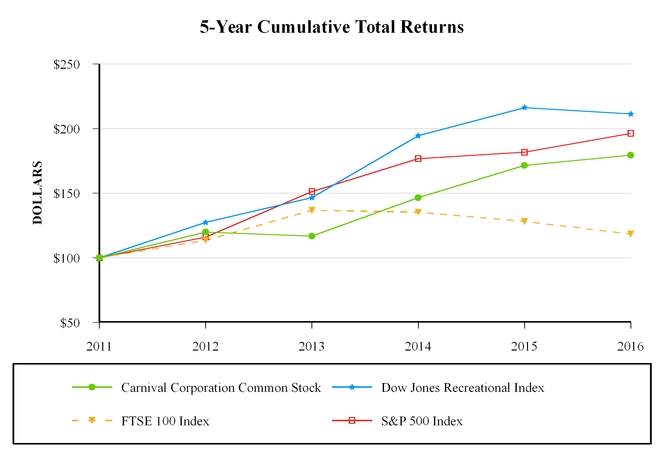
Item 5(a). Market for Registrants’ Common Equity, Related Stockholder Matters and Issuer Purchases of Equity Securities –
Market Information, Holders and Performance Graph.
Item 6. Selected Financial Data.
Item 7. Management’s Discussion and Analysis of Financial Condition and Results of Operations.
Item 7A. Quantitative and Qualitative Disclosures About Market Risk.
Item 8. Financial Statements and Supplementary Data.
Portions of the Registrants’ 2017 joint definitive Proxy Statement, to be filed with the U.S. Securities and Exchange Commission, are incorporated by reference into this Form 10-K under the items described below.
Part and Item of the Form 10-K
Part III
Item 10. Directors, Executive Officers and Corporate Governance.
Item 11. Executive Compensation.
Item 12. Security Ownership of Certain Beneficial Owners and Management and Related Stockholder Matters.
Item 13. Certain Relationships and Related Transactions, and Director Independence.
Item 14. Principal Accountant Fees and Services.
3
PART I
Item 1. Business.
A. Overview
I. | Summary |
Carnival Corporation was incorporated in Panama in 1972 and Carnival plc was incorporated in England and Wales in 2000. Carnival Corporation and Carnival plc operate a dual listed company (“DLC”), whereby the businesses of Carnival Corporation and Carnival plc are combined through a number of contracts and through provisions in Carnival Corporation’s Articles of Incorporation and By-Laws and Carnival plc’s Articles of Association. The two companies operate as if they are a single economic enterprise with a single senior executive management team and identical Boards of Directors, but each has retained its separate legal identity. Carnival Corporation and Carnival plc are both public companies with separate stock exchange listings and their own shareholders. Together with their consolidated subsidiaries, Carnival Corporation and Carnival plc are referred to collectively in this Form 10-K as “Carnival Corporation & plc,” “our,” “us” and “we.”
We are among the largest, most profitable and financially strong leisure travel companies in the world with a market capitalization of over $38 billion at January 19, 2017. We are also the largest cruise company, carrying 48% of global cruise guests, and a leading provider of vacations to all major cruise destinations throughout the world. We operate over 100 cruise ships within a portfolio of leading global, regional and national cruise brands that sell tailored cruise products, services and vacation experiences in all the world’s most important vacation geographic areas. We believe having global and regional brands serving multiple countries and national brands tailored to serve individual countries provides us with a unique advantage when competing for consumers' discretionary vacation spending.
II. | Vision, Goals and Related Strategies |
Our vision is "Together we deliver unmatched joyful vacation experiences and breakthrough shareholder returns by exceeding guest expectations and leveraging our scale." We believe our portfolio of brands is instrumental to achieving our vision and maintaining our cruise industry leadership positions. Our primary financial goals are to profitably grow our cruise business and increase our return on invested capital, while maintaining our strong investment grade credit ratings and balance sheet.
To reach our primary financial goals, we continue to implement initiatives to create additional demand for our brands in excess of measured capacity, ultimately leading to higher revenue yields. We will continue to identify opportunities to enhance our cruise products and services and optimize our cost structure while preserving the unique identities of our individual brands. We have made significant investments in performing customer segmentation analyses and evaluating data included in our global database of guests to gain insight into their decision-making process and vacation needs enabling us to identify new marketing opportunities and further grow our share of their vacation spend. We have also implemented strategies to grow demand by increasing consumer awareness and consideration of our cruise brands and the global cruise industry through ongoing public relations efforts and advertising.
We continue to identify and implement new strategies and tactics to strengthen our cruise ticket revenue management processes and systems across our portfolio of brands, such as optimizing our pricing methodologies and improving our pricing models. We are currently rolling-out our state-of-the-art revenue management system across six brands and expect the roll-out to be completed by early 2018. We also continue to implement initiatives to better coordinate and optimize our brands' global deployment strategies to maximize guest satisfaction and profits. Furthermore, we are implementing initiatives to strengthen our onboard revenue programs.
We are building new, innovative, purpose-built ships that are larger, more fuel efficient, have a greater number of balconies and present a wider range of onboard amenities and features. These ships further enhance the attractiveness of a cruise vacation while achieving greater economies of scale and resulting in improved returns on invested capital. As of January 19, 2017, we have a total of 19 cruise ships scheduled to be delivered between 2017 and 2022. Some of these ships will replace existing capacity as less efficient ships exit our fleet. Since 2006, we have removed 18 ships from our fleet, and our newbuild program has been designed to consider an expected acceleration in our fleet replacement cycle over time. Furthermore, we continue to make substantial investments in our existing ship enhancement programs to improve our onboard product offerings and enrich our guests’ vacation experiences.
At the forefront of innovation and our continuous efforts to enhance our cruise products and services, we recently unveiled an interactive guest experience platform developed to enable elevated service levels through enhanced guest interactions before,
4
during and after cruise vacations. The Ocean MedallionTM and its ecosystem will enable personalized and customized guest experience on a level not previously considered possible by interacting with thousands of sensors, kiosks, interactive surfaces and smart devices. With this innovation, from the moment our guests first engage with us, their experiences will seamlessly be powered by their preferences. The new guest experience platform will debut on Regal Princess in November 2017, followed by Royal Princess and Caribbean Princess in early 2018.
We continue to grow our presence in established markets and increase our penetration in developing markets, such as Asia. We believe that we have significant opportunities to continue to profitably grow our presence in China due to its large and growing middle-class population, expansion of its international tourism and the government's plan to support the cruise industry. Including the introduction of a Princess Cruises ship built specifically for Chinese guests in 2017, 6% of our total capacity will be deployed in China.
With over 100 ships and more than 11.5 million guests in 2016, we have the scale to optimize our structure by utilizing our combined purchasing volumes and common technologies as well as implementing cross-brand initiatives aimed at cost containment. We have and continue to integrate certain back office functions to achieve the full benefits of our scale. Having global leaders in communications, innovation, maritime, procurement, revenue management and strategy supports collaboration and communication across our brands and helps coordinate our global efforts.
Our ability to generate significant operating cash flow allows us to internally fund our capital investments. This allows us to manage our debt level in a manner consistent with maintaining our strong credit metrics and strong investment grade credit ratings while returning free cash flow and more to our shareholders in the form of dividends and/or share buybacks. In 2016, we increased our quarterly dividend by 17% to $0.35 per share from $0.30 per share. Since resuming our stock repurchase program in late 2015, we repurchased approximately 54 million shares for $2.6 billion.
Our vision is based on four key pillars:
• | Health, environment, safety, security and sustainability |
• | Guests |
• | Employees |
• | Shareholders and other stakeholders |
Health, Environment, Safety, Security and Sustainability
We consider health, environment, safety, security and sustainability matters to be our core guiding principles. Our uncompromising commitment to the safety and comfort of our guests and crew is paramount to the success of our business. We are committed to operating a safe and reliable fleet and protecting the health, safety and security of our guests, employees and all others working on our behalf. We continue to focus on further enhancing the safety measures onboard all of our ships. As a result of the environmental issues found on certain Princess ships, our entire fleet has re-focused and increased efforts to protect the environment in which our vessels sail and the communities in which we operate. We are dedicated to fully complying with, or exceeding, all legal and statutory requirements related to health, environment, safety, security and sustainability throughout our business.
Guests
Our goal is to consistently exceed our guests’ expectations while providing them with a wide variety of exceptional vacation experiences. We believe that we can achieve this goal by continually focusing our efforts on helping our guests choose the cruise brand that will meet their unique needs and desires, improving their overall vacation experiences and building state-of-the-art ships with innovative onboard offerings and unequaled guest services.
5
Employees
Our goal is to recruit, develop and retain the finest shipboard and shoreside employees. A team of highly motivated and engaged employees is key to delivering vacation experiences that exceed our guests’ expectations. Understanding the critical skills that are needed for outstanding performance is crucial in order to hire and train our crew and shoreside personnel. We believe in listening to and acting upon our employees’ perspectives and ideas and use employee feedback tools to monitor and improve our progress in this area. We are a diverse organization and value and support our talented and diverse employee base. We are committed to employing people from around the world and hiring them based on the quality of their experience, skills, education and character, without regard for their identification with any group or classification of people.
Shareholders and Other Stakeholders
We value the relationships we have with our shareholders and other stakeholders, including travel agents, communities, regulatory bodies, media, creditors, insurers, shipbuilders, governments and suppliers. We believe that engaging stakeholders in a mutually beneficial manner is critical to our long-term success. As part of this effort, we believe we must continue to be an outstanding corporate citizen in the communities in which we operate. Our brands work to meet or exceed their economic, environmental, ethical and legal responsibilities.
Strong relationships with our travel agents are especially vital to our success. We continue to strengthen our relationship with the travel agent community by increasing our communication and outreach, implementing changes based on travel agent feedback and improving our educational programs to assist agents in stimulating cruise demand.
B. Global Cruise Industry
I. Overview
The multi-night global cruise industry has grown significantly but still remains a relatively small part of the wider global vacation industry, which includes a large variety of land-based vacation alternatives around the world. Within the global vacation industry, cruise companies compete for the discretionary income spent by vacationers. A 2016 Nielsen Global Consumer Confidence Survey found that after providing for savings and living expenses, the number one global spending priority is for vacations. As a result of these and other favorable cruise industry characteristics, we believe that the global cruise industry has the opportunity to capture a greater share of consumers’ spending.
Cruising offers a broad range of products and services to suit vacationing guests of many ages, backgrounds and interests. Cruise brands can be broadly classified as offering contemporary, premium and luxury cruise experiences. The contemporary experience typically includes cruises that last seven days or less, have a more casual ambiance and are less expensive than premium or luxury cruises. The premium experience typically includes cruises that last from seven to 14 days and appeal to those who are more affluent and older. Premium cruises emphasize quality, comfort, style and more destination-focused itineraries, and the average pricing is normally higher than contemporary cruises. The luxury experience is usually characterized by smaller vessel size, very high standards of accommodation and service, higher prices and exotic itineraries to ports that are inaccessible to larger ships. We have product and service offerings in each of these three broad classifications. Notwithstanding these classifications, there is generally overlap and competition among all cruise products and services.
II. Favorable Characteristics of the Global Cruise Industry
a. Exceptional Value Proposition
We believe the cost of a cruise vacation represents an exceptional value in comparison to alternative land-based vacations. Cruising delivers many relatively unique benefits, such as transportation to various destinations while also providing accommodations, a generous diversity of food choices and a selection of daily entertainment options for one all-inclusive, competitive price. To make cruising even more cost effective and more easily accessible to vacationers, the cruise industry typically offers a number of drive-to home ports, which enables many cruise guests to reduce their overall vacation costs by eliminating or reducing air and other transportation costs.
b. High Guest Satisfaction Rates
Cruise guests tend to rate their overall satisfaction with a cruise vacation higher than comparable land-based hotel and resort vacations. According to industry surveys, the cruise experience consistently exceeds expectations of repeat and first-time cruisers on a wide range of important vacation attributes, such as value and service levels. Cruising continues to receive high
6
guest satisfaction rates because of the unique vacation experiences it offers, including visiting multiple destinations without having to pack and unpack, all-inclusive product offerings and state-of-the-art cruise ships with entertainment, relaxation and fun, all at an outstanding value.
c. Wide Appeal
Cruising appeals to a broad range of ages and income levels. Cruising provides something for every generation, from kids’ clubs to an array of onboard entertainment designed to appeal to teens and adults. Cruising also offers transportation to a variety of destinations and a diverse range of ship types and sizes, as well as price points, to attract guests with varying tastes and income levels. To encourage first-time and repeat cruisers and better compete with other vacation alternatives the cruise industry has in the recent years refocused its marketing efforts, enhanced training of travel agents and collaborated with well-known brands and offers the following:
• Expanded entertainment options and shipboard activities | • Enhanced internet and communication capabilities |
• Flexible dining options including open-seating dining | • Beverage package options |
• Branded specialty restaurants, bars and cafés | • Money-back guarantees |
d. Positive Demand Trends
Social media has a powerful impact on consumer behavior. Technology allows people to instantly share travel experiences within their social networks. Seeing others embrace travel and experience the world in new ways inspires people to plan and book their own travel. Hence, consumers are demanding more enriched lives and personal fulfillment through experience and learning and prefer to spend money on experiences rather than on material things. While desired experiences may differ across age groups, travel spans all sectors of the population. According to TripBarometer Travel Trends 2016 published by TripAdvisor, seven in ten travelers are planning to try new travel experiences, with cruising being a popular option across all age groups. Overall, today's travelers are looking to travel in ways that are immersive, meaningful and memorable. While it is useful for the cruise industry to consider travel markets across demographic groups, the ability to identify and address target markets based on "psychographics" or attitudes that cut across demographics is even more meaningful. We believe the cruise industry is well positioned to meet the travelers' desires and has the ability to tailor experiences for each guest based on their unique wants and needs, which should foster growth for the cruise industry.
From a demographic perspective, two age groups, the Baby Boomers and the Millennial generation, have in recent years experienced trends that positively affect demand for cruising. The Baby Boomer generation, or those born between 1946 and 1964, likes to pursue an active lifestyle and has the desire and the means to travel and enjoys multi-generational cruising. The Millennial generation, or those born between 1980 and 2000, has now surpassed the size of the Baby Boomer generation and represents the fastest growing demographic segment of the vacation industry. This group expresses a strong desire to travel and share new experiences, a mindset that should continue to foster growth for the industry.
These changes in consumer behavior and demographics, along with economic growth and rise of the middle class in many emerging international markets and accompanying increase in their earning power and disposable income, will continue to drive demand for travel and the global cruise industry. These groups of consumers are becoming eager to experience the world through travel, which provides significant growth opportunity for the cruise industry within and beyond the established markets, such as North America.
7
e. Relatively Low Penetration Levels
We believe there are large, addressable markets with low penetration rates. The 2016 annual penetration rates below were computed based on the historical number of cruise guests carried as a percentage of the total population from G.P. Wild (International Limited) (“G.P. Wild”), an independent cruise research company and internal estimates:
• | 5.2% for Australia and New Zealand |
• | 3.4% for North America (United States of America (“U.S.”) and Canada) |
• | 2.7% for the United Kingdom (“UK”) |
• | 1.8% for continental Europe (Germany, Italy, France, Spain and Portugal) |
We believe there are also markets, such as Asia, where economic growth has raised discretionary income levels, fueling an increasing demand for cruise vacations.
f. Ship Mobility
The mobility of cruise ships enables cruise companies to move their vessels between regions in order to maximize profitability and to meet changing demand. For example, brands can change itineraries over time in order to cater to guest tastes or as general economic or geopolitical conditions warrant. In addition, cruise companies have the flexibility to reposition capacity to areas with growing demand. We believe that this unique ability to move ships provides the cruise industry with a competitive advantage compared to other land-based vacation alternatives.
III. Passenger Capacity and Cruise Guests Carried
Weighted Average Passenger (Lower Berth) Capacity for Ocean Going Vessels | |||
Year | Global Cruise Industry (a) (b) | Carnival Corporation & plc (a) | |
2014 | 428,000 | 210,000 | |
2015 | 445,000 | 215,000 | |
2016 | 466,000 | 221,000 | |
(a) | In accordance with cruise industry practice, passenger capacity is calculated based on the assumption of two passengers per cabin even though some cabins can accommodate three or more passengers. |
(b) | Global Cruise Industry amounts were obtained from internal estimates. |
The global cruise industry and our compound annual passenger capacity growth rates are estimated to be 6.4% and 4.8%, respectively from 2016 to 2020. Our estimates of future passenger capacity only include assumptions related to announced ship withdrawals and, accordingly, our estimates likely indicate a higher growth rate than will actually occur.
Cruise Guests Carried by Ocean Going Vessels | ||||||||
Global Cruise Industry (a) (b) | Carnival Corporation & plc | |||||||
Year | North America | Europe, Australia, Asia and Other | Total | Total | ||||
2014 | 12,281,000 | 9,759,000 | 22,040,000 | 10,566,000 | ||||
2015 | 12,229,000 | 10,971,000 | 23,200,000 | 10,837,000 | ||||
2016 | 12,414,000 | 11,836,000 | 24,250,000 | 11,522,000 | ||||
(a) | The global cruise guests carried for 2014 and 2015 were obtained from G.P. Wild and are based upon where the guests were sourced. |
(b) | The estimates for global cruise guests carried for 2016 are based on internally developed growth rates. |
8
C. Our Global Cruise Business
I. Segment Information
Passenger Capacity (a) | Percentage of Total Capacity (a) | Number of Cruise Ships (a) | |||
North America Segment | |||||
Carnival Cruise Line | 66,310 | 29% | 25 | ||
Princess Cruises ("Princess") | 43,670 | 19 | 17 | ||
Holland America Line | 23,770 | 11 | 14 | ||
Seabourn | 1,970 | 1 | 4 | ||
135,720 | 60 | 60 | |||
EAA Segment | |||||
Costa Cruises ("Costa") | 35,920 | 16 | 15 | ||
AIDA Cruises ("AIDA") | 21,960 | 10 | 11 | ||
P&O Cruises (UK) | 18,380 | 8 | 8 | ||
P&O Cruises (Australia) | 7,330 | 3 | 5 | ||
Cunard | 6,770 | 3 | 3 | ||
90,360 | 40 | 42 | |||
226,080 | 100% | 102 | |||
(a) | As of January 19, 2017. |
We also have a Cruise Support segment that represents our portfolio of leading port destinations and private islands, which are operated for the benefit of our cruise brands. Cruise Support also includes other services that are provided for the benefit of all our cruise brands.
In addition to our cruise operations, we own Holland America Princess Alaska Tours, the leading tour company in Alaska and the Canadian Yukon, which complements our Alaska cruise operations. Our tour company owns and operates hotels, lodges, glass-domed railcars and motorcoaches. This tour company and cruise ships, which we charter-out under long-term leases, comprise our Tour and Other segment as of January 19, 2017.
9
II. Ships Under Contract for Construction
Scheduled Delivery Date (a) | Passenger Capacity (a) | ||
North America Segment (b) | |||
Carnival Cruise Line | |||
Carnival Horizon | March 2018 | 3,900 | |
Newbuild | November 2019 | 3,900 | |
Newbuild | August 2020 | 5,250 | |
Newbuild | October 2022 | 5,250 | |
Princess | |||
Majestic Princess (c) | March 2017 | 3,560 | |
Newbuild | October 2019 | 3,660 | |
Newbuild | July 2020 | 3,660 | |
Newbuild | February 2022 | 3,660 | |
Holland America Line | |||
Nieuw Statendam | November 2018 | 2,670 | |
Newbuild | May 2021 | 2,670 | |
Seabourn | |||
Seabourn Ovation | April 2018 | 600 | |
EAA Segment (b) | |||
Costa | |||
Newbuild (c) | February 2019 | 4,180 | |
Newbuild | October 2019 | 5,220 | |
Newbuild (c) | September 2020 | 4,180 | |
Newbuild | May 2021 | 5,220 | |
AIDA | |||
AIDAperla (d) | July 2017 | 3,290 | |
Newbuild | November 2018 | 5,230 | |
Newbuild | May 2021 | 5,230 | |
P&O Cruises (UK) | |||
Newbuild | May 2020 | 5,190 | |
(a) | As of January 19, 2017. |
(b) | Our ship construction agreements cannot be canceled by either party without cause, and such cancellation will subject the defaulting party to contractual liquidated damages. Our ship construction contracts are with Fincantieri in Italy, Meyer Werft in Germany and Finland and Mitsubishi Heavy Industries in Japan. |
(c) Intended for Asia.
(d) Represents the expected in service date.
10
III. Cruise Brands
a. North America

Carnival Cruise Line is a leader in contemporary cruising and operates 25 ships designed to provide fun and exceptional vacation experiences that appeal to a wide variety of consumers at an outstanding value. Founded in 1972, Carnival Cruise Line is one of the most recognizable brands in the cruise industry and carried over 4.7 million guests in 2016, the most of any individual cruise brand. Carnival Cruise Line identifies their target customers as those who like to live life to the fullest, look at the glass as half full, feel comfortable in their own skin and make their own fun. Carnival Cruise Line’s cruises have a broad appeal to families, couples, singles, and seniors and carried more than 730,000 children in 2016. In 2016, Carnival Cruise Line was voted "Best Ocean Cruise Line" in USA Today's 10 Best Readers' Choice Awards. In addition, Carnival Cruise Line also earned "Best-Value-For-Money" in the Cruise Critic's Editors' Pick Awards for the third consecutive year. The brand's newest ship, Carnival Vista, was named by Cruise Critic as the Best New Ship for 2016. Carnival Cruise Line is scheduled to take delivery of two 3,900-passenger capacity ships, Carnival Horizon and her sister ship, in 2018 and 2019, respectively, and two 5,250-passenger capacity ships in 2020 and 2022, which will be the largest in its fleet.
Carnival Cruise Line offers cruises generally from three to eight days with almost all of its ships departing from 16 convenient U.S. home ports located along the East, Gulf and West coasts, Puerto Rico and Hawaii. Carnival Cruise Line is the leading provider of year-round cruises in The Bahamas, the Caribbean and Mexico and also operates seasonal cruises in Canada, Alaska, Hawaii and Europe. In addition, Carnival Cruise Line deploys two ships in Australia, one on a year-round basis and one seasonally-based. These ships offer cruises tailored to the Australian market.
The brand’s focus continues to be on enhancing its products and services with innovations that appeal to new consumers, as well as past guests. In April 2016, Carnival Cruise line took delivery of the Carnival Vista and introduced a variety of new innovations. The launch of Carnival Horizon in 2018 will continue the expansion of the line's Fun Ship® 2.0 enhancement program with many of the same ground-breaking features, such as:
• A Thrill Theater, a multi-dimensional experience where seats move in multiple directions and viewers are sprayed with water and bubbles | • Expanded water park featuring the colorful Kaleid-O-Slide, a raft-riding water tube slide | |
• The world's first IMAX Theater at Sea, with a three-deck-high-screen | • Seafood Shack, a delectable New England-inspired eatery | |
• An onboard brewery | • SkyRide, a breakthrough suspended open-air cycling experience | |

Princess Cruises began operations in 1965. Currently operating a fleet of 17 ships visiting more than 350 ports around the globe, it is the world’s largest premium cruise line. Awarded Best Cruise Itineraries 11 times by Recommend magazine, Princess sails to nearly every corner of the earth, from Alaska to Asia and Australia, the Caribbean and Mexico, Europe, the Panama Canal, South America and more. The line offers cruises ranging from three to 20 days with longer exotic sailings from 25 to 111 days, including two world cruises. When sailing in the Caribbean, most of Princess' ships visit its award-winning private island in The Bahamas, Princess Cays ®. Princess has four ships scheduled to be delivered: 3,560-passenger capacity Majestic Princess in March 2017 and three 3,660-passenger capacity newbuilds from 2019 through 2022.
11
Princess Cruises Come Back NewTM has enhanced the onboard experience by providing guests with lifelong memories and meaningful stories to share from their cruise vacation. The program features several products and services, such as:
• | Personal Choice Dining, offering guests three dining options, including traditional dining, anytime dining and specialty dining at venues, such as the award winning restaurant SHARE by international chef & TV host Curtis Stone, and culinary experiences, such as our "Chocolate Journeys" dessert experience featuring specialties from master chocolatier Norman Love |
• | Onboard entertainment featuring Voice of the Ocean, an interactive show modeled after the wildly popular international singing competition, as well as four original musical productions created by the award-winning composer, Steven Schwartz |
• | Interactive onboard activities and shore excursions designed in collaboration with Discovery Channel and local experts in key regional cruise destinations to provide guests with authentic and exclusive experience onboard and ashore and to entertain and delight them about the nature, wildlife, history and culture of the regions they visit |
In addition, Princess guests can now choose a new premium stateroom category featuring VIP amenities and exclusive dining. The new Club Class Mini-Suite featuring priority embarkation and disembarkation as well as Club Class Dining, a reserved dining area with expedited seating and expanded menu options. Club Class guests will be among the first to sleep on the new Princess Luxury Bed, specially designed by Dr. Michael Breus, "The Sleep Doctor," and highly acclaimed designer, Candice Olson, to deliver the ultimate night of sleep at sea. More than 44,000 new beds will be rolled out to every stateroom across the fleet through 2018.
Furthermore, our newly developed guest experience platform, designed to elevate service levels through enhanced guest interactions before, during and after cruise vacations, will debut on Regal Princess in November 2017, followed by Royal Princess and Caribbean Princess in early 2018. At the center of the platform is the Ocean Medallion™, a first-of-its-kind wearable device designed to enable a personal concierge, Ocean Compass, to deliver a personalized service not previously considered possible by interacting with thousands of sensors, kiosks, interactive surfaces and smart devices. With this innovation, from the moment our guests first engage with us, their experiences will be powered by their preferences. Services they desire will be delivered seamlessly, in real time, often without asking where and when they want them.

Holland America Line has been providing cruises since 1873 and currently operates a fleet of 14 premium mid-sized ships. Its ships visit over 400 ports of call in almost 100 countries and territories on all seven continents. Holland America Line's cruises range from three to 35 days with longer, exotic Grand Voyages from 55 to 116 days, including an annual Grand World Voyage. Holland America Line ships generally sail in Alaska, Europe, the Caribbean and Australia. When sailing in the Caribbean, most of Holland America Line's ships visit its award-winning private island in The Bahamas, Half Moon Cay, known for its pristine beaches, diverse shore excursions, exclusive beach cabanas and family-friendly activities.
Koningsdam, the line's newest 2,650-passenger capacity ship, entered service in April 2016 and two 2,670-passenger capacity ships, Nieuw Statendam and her sister ship, are scheduled to be delivered in 2018 and 2021. In addition, Holland America Line is continuing its brand enhancement efforts across the fleet, with more than $100 million invested in 2016 and approximately $200 million remaining to be invested over the next two years. The upgrades include new furnishing, decor and amenities in its suites, retail space renovations and enhanced ship entertainment areas.
Holland America guests are avid, engaged world travelers, and value authentic, unique experiences wherever they go. To enhance the guest experience and further differentiate from other cruise brands, Holland America Line has entered into several marquee partnerships, including:
• | America's Test Kitchen, the most popular cooking show on American television, is producing several live cooking shows and hands-on workshops for fleet-wide roll-out in 2017 |
• | In 2016, Billboard Onboard and Lincoln Center were introduced simultaneously as additions to the B.B. King's Blues Clubs to create Music Walk, an unforgettable music experience |
• | BBC Earth brings enriching and entertaining programming such as Frozen Planet Live to guests while onboard |
12
• | The brand's website was enhanced with comprehensive new Destination Guides covering nearly 400 Holland America Line ports around the globe to help guests dream, plan and prepare for journeys; this authoritative content can be personalized to guests' special interests |

Seabourn, which began operations in 1988, provides the world's finest ultra-luxury cruising vacations on smaller ships that focus on highly personalized service and guest recognition. The line’s fleet of three 460-passenger and one 600-passenger ships, the youngest in the ultra-luxury segment of the cruise industry, offer spacious all-suite accommodations, award-winning gourmet dining, complimentary drinks and fine wines, unique experiences such as the Officer on Deck culinary event and shopping with the Chef excursions. Seabourn launched its newest ship, Seabourn Encore, in November 2016 and has a 600-passenger capacity ship, Seabourn Ovation, scheduled for delivery in 2018.
Seven out of the last ten years, Seabourn has been voted the “Best Small-Ship Cruise Line” by readers of Travel + Leisure. In addition, Saveur named Seabourn "Best Culinary Cruise Line" three out of the last four years by its panel of travel experts and editors. Seabourn has partnered with world-renowned American chef and restaurateur Thomas Keller to develop a selection of menu items for multiple dining venues aboard Seabourn's fleet and has introduced a new signature restaurant, The Grill by Thomas Keller. Seabourn pampers its guests with complimentary value-added extras such as Massage MomentsSM on deck and Caviar in the SurfSM beach parties. All of the Seabourn ships have a high service ratio of staff members to guest and an intimate, sociable atmosphere that has been the hallmark of the Seabourn lifestyle.
Seabourn’s ships cruise to destinations throughout the world, including Europe, Asia, the South Pacific Islands, Australia and New Zealand, the Americas and Antarctica, with cruises generally from seven to 14 days, along with a number of longer voyages. Seabourn has a multi-year agreement with the United Nations Educational Scientific and Cultural Organization (UNESCO) to support its mission of safeguarding unique cultural and natural features around the world and promote sustainable tourism, thus providing its guests with unique access to more than 150 World Heritage Sites.
b. Europe, Australia & Asia

Costa has been providing cruises since 1948 and today visits more than 260 ports around the world. In 2016, its ships carried over 2 million guests. The brand operates a fleet of 15 contemporary ships and has two 5,220-passenger capacity newbuilds and two 4,180-passenger capacity newbuilds scheduled to be delivered between 2019 and 2021.
Costa is a leading cruise line in Italy, France and Spain where it boasts a tradition spanning close to seven decades. Its ships are deployed in the Mediterranean Sea, Northern Europe, the Caribbean, Brazil, Argentina, the Arabian Gulf and the Indian Ocean. The line offers a wide range of unique itineraries, with cruises generally ranging from seven to 20 days and also has longer exotic sailings from 20 to 30 days and one world cruise. Costa is also a leading cruise line in China. Most of its cruises sailing in China are four or five days and cater to Chinese guests.
Costa considers itself the world's ambassador of Italy’s finest. Its ships represent the best of Italy by offering beautiful Italian art, unique interior decorations with superb Italian mosaics and precious Murano chandeliers, fine Italian wines, excellent Mediterranean food selections and unique shops that carry well-known Italian fashion brands. Costa attracts international guests due to its multi-lingual service and is considered to be a top vacation provider in Europe. Costa is also known for offering innovative itineraries that combine the excitement of new destinations with pampering onboard service and ambiance.
In 2016, Costa Diadema, the line's flagship, introduced a variety of innovations, some of which are being replicated fleet-wide, that make the guests' onboard experience exclusive and unforgettable. The new features include dining options created by Bruno Barbieri, who has earned multiple Michelin Stars, and enriched entertainment including the Voice of the Sea shows and Peppa Pig-branded kids games and educational activities. Lastly, in January 2017, Costa launched a new advertising campaign.
13
This campaign further builds on the successful collaboration with worldwide music star, Shakira, that began in 2016 and further strengthened the brands' positioning as "Italy's finest."

AIDA, which began operating in 1996, is the leader and most recognized cruise brand in the German cruise industry. Since 2007, AIDA has been our fastest growing cruise brand taking delivery of eight ships in the past ten years. Currently, AIDA operates 11 premium ships featuring a resort casual atmosphere and has three more ships scheduled for delivery through 2021. AIDAperla, a 3,290-passenger capacity ship, is scheduled to begin sailing in July 2017 and two 5,230-passenger capacity ships are scheduled to be delivered in 2018 and 2021.
AIDA is tailored for German-speaking guests and includes a German-speaking crew as well as German-style food and entertainment. AIDA’s ships include a variety of dining options, including buffets, grills and exclusive restaurants. AIDA offers an exceptionally relaxed, yet active, cruising experience for all generations with an emphasis on a healthy and youthful lifestyle, choice, informality, family friendliness and activity.
AIDA offers its guests cruises generally from three to 21 days, while visiting over 230 ports. AIDA ships generally sail in the North Sea, the Baltic Sea, the Atlantic Isles, the Mediterranean Sea, the Caribbean, Southeast Asia, the Arabian Gulf, Central America and the Indian Ocean. In February 2017, the three smallest AIDA vessels will operate under the premium tagline “AIDA selection” offering cruises to more exclusive and exotic destinations.

P&O Cruises (UK), which began operations back in 1837, is the leading and most recognized cruise brand in the UK. P&O Cruises (UK) operates a fleet of eight premium ships and has one 5,190-passenger capacity newbuild scheduled to be delivered in 2020. Three of its ships offer holidays exclusively for adults while the balance of its ships are perfect for families. P&O Cruises (UK)’s ships visit over 200 destinations worldwide, with cruises generally from seven to 17 days and a number of longer voyages, including two world cruises of over 100 days in 2017. P&O Cruises (UK)’s ships generally sail to the Mediterranean Sea, Scandinavia, the Baltic Sea, New England, Canada, the Atlantic Isles, the Caribbean and the Canary Islands.
P&O Cruises (UK) delivers exceptional service, dining, exploration and entertainment uniquely tailored to British tastes. This is enhanced through partnerships with its Food Heroes, a line-up of British celebrity chefs including Marco Pierre White and James Martin. In March 2016, the line's newest ship Britannia was the location for the series finale of the award-winning UK prime time show, Saturday Night Takeaway. The 90-minute live broadcast was shot on location from Barcelona on the top deck of the ship and showcased the brand to an audience of eight million people.

Founded in 1840, Cunard is globally renowned as operating the most famous ocean liners in the world and for offering legendary travel experiences with a heritage of iconic ships and outstanding service. Cunard has a unique and distinct position within the luxury travel market and received the coveted Travel + Leisure 2016 World's Best Award. The line operates three premium/luxury ships, Queen Elizabeth, Queen Mary 2 and Queen Victoria. Cunard offers cruises to destinations in Northern Europe, the Mediterranean Sea, New England and Canada, as well as their iconic transatlantic voyages on Queen Mary 2. Most of Cunard’s cruises are from seven to 14 days with three world cruises of over 100 days.
14
Cunard’s appeal is a combination of British elegance, exemplary service and sophistication and attracts an international mix of guests with nearly 50% of guests expected to be sourced from markets outside the UK. The brand sits in a unique space offering something no one else can; luxury on a grand scale. Guests enjoy a unique experience that celebrates the line’s British heritage including an enviable association with the British Royal Family. Her Majesty the Queen is Godmother to both Queen Elizabeth and Queen Mary 2.
In 2016, Queen Mary 2 underwent one of the most significant remasterings in Cunard's modern history, with an investment of over $130 million. The remastering of the ship included the addition of new dining and lounge areas, and new and refurbished staterooms throughout and the introduction of cabins for solo travelers. The designs, whilst contemporary in feel, took inspiration from the great Cunard liners of the past, particularly the original Queen Mary.

P&O Cruises (Australia), which began cruising from Australia in 1932, is the leading cruise operator in the Australia and South Pacific region. For the fourth consecutive year, P&O Cruises (Australia) was voted Australia’s "Most Trusted Cruise Operators" by Readers Digest in 2016. The onboard atmosphere is relaxed with a focus on contemporary design, great food, friendly service and a variety of exciting activities and entertainment. The line currently operates a fleet of five ships. In May 2017, the 2,000-passenger capacity Dawn Princess will be transferred from Princess to P&O Cruises (Australia) and renamed Pacific Explorer.
P&O Cruises (Australia) sails to more destinations in Australia and the South Pacific than any other cruise line and offers cruises, generally from three to 16 days, from multiple home ports in Australia and New Zealand. In addition, the line's itineraries include remote idyllic ports of Papua New Guinea and Solomon Islands as well as a "taste" of Asia. P&O Cruises (Australia) offers itineraries based around prominent Australian events including Melbourne Cup, Australian Open Tennis and Rugby League State of Origin.
P&O Cruises (Australia) recently partnered with leading restaurateur and celebrity chef, Luke Mangan, and created a signature fine-dining restaurant, Salt Grill. In addition, recent refurbishments have replaced the traditional cruise ship buffet with an international market place of fresh food outlets reflecting the many flavors Australians love to eat.
15
IV. Principal Source Geographic Areas
Global Cruise Guests Carried by Ocean Going Vessels | |||||||
2016 (a) | 2015 (b) | 2014 (b) | Brands Mainly Serving | ||||
North America | 12,414,000 | 12,229,000 | 12,281,000 | Carnival Cruise Line, Holland America Line, Princess, Seabourn and Cunard | |||
Continental Europe | AIDA and Costa | ||||||
Germany | 1,825,000 | 1,813,000 | 1,771,000 | ||||
Italy | 816,000 | 810,000 | 842,000 | ||||
France | 619,000 | 615,000 | 593,000 | ||||
Spain | 469,000 | 466,000 | 454,000 | ||||
Rest of Continental Europe | 1,148,000 | 1,141,000 | 1,115,000 | ||||
4,877,000 | 4,845,000 | 4,775,000 | |||||
United Kingdom | 1,765,000 | 1,753,000 | 1,612,000 | P&O (UK) and Cunard | |||
Australia | 1,440,000 | 1,090,000 | 980,000 | P&O (Australia), Princess and Carnival Cruise Line | |||
Asia | 1,780,000 | 1,350,000 | 1,060,000 | Costa and Princess | |||
Rest of World | 1,974,000 | 1,933,000 | 1,332,000 | ||||
World Total | 24,250,000 | 23,200,000 | 22,040,000 | ||||
(a) | The estimates for 2016 are based on internally developed growth rates. |
(b) | The global cruise guests carried for 2015 and 2014 were obtained from G.P. Wild and are based upon where the guests were sourced. |
V. Cruise Programs
Our ships sail to all of the world’s major cruise destinations and the percentage of our passenger capacity deployed in each of these regions is as follows:
2017 | 2016 | 2015 | |||||||
Caribbean | 33 | % | 32 | % | 34 | % | |||
Mediterranean | 13 | 15 | 16 | ||||||
Europe without Mediterranean | 13 | 13 | 13 | ||||||
Australia and New Zealand | 9 | 8 | 7 | ||||||
Asia | 9 | 9 | 6 | ||||||
Alaska | 5 | 5 | 5 | ||||||
Other | 18 | 18 | 19 | ||||||
100 | % | 100 | % | 100 | % | ||||
16
VI. Cruise Pricing and Payment Terms
Each of our cruise brands publishes prices for the upcoming seasons primarily through the internet, although published materials such as brochures and direct mailings are also used. Our brands have multiple pricing levels that vary by cruise line, category of cabin, ship, season, duration and itinerary. Cruise prices frequently change in a dynamic pricing environment and are impacted by a number of factors, including the number of available cabins for sale in the marketplace and the level of guest demand. Some cruise prices are increased due to higher demand. Conversely, some cruise prices are reduced through special promotions and early booking, past guest recognition and other programs. We continue to identify and implement new strategies and tactics to strengthen our cruise ticket revenue management processes and systems across our portfolio of brands, such as optimizing our pricing methodologies and improving our pricing models. We are currently rolling-out our state-of-the-art revenue management system across six brands and expect the roll-out to be completed by early 2018. We also continue to implement initiatives to better coordinate and optimize our brands' global deployment strategies to maximize guest satisfaction and profits.
Our bookings are generally taken several months in advance of the cruise departure date. Typically, the longer the cruise itinerary the further in advance the bookings are made. This lead time allows us to manage our prices in relation to demand for available cabins through the use of advanced revenue management capabilities and other initiatives, with the typical strategy of marketing our ships to fill them while achieving the highest possible overall net revenue yields.
The cruise ticket price typically includes the following:
• | Accommodations |
• | Most meals, including snacks at numerous venues |
• | Access to amenities such as swimming pools, water slides, water parks, whirlpools, a health club, and sun decks |
• | Child care and supervised youth programs |
• | Entertainment, such as theatrical and comedy shows, live music and nightclubs |
• | Access to exclusive private islands and destinations |
At times, we offer value added packages to induce ticket sales to guests and groups and to encourage advance purchase of certain onboard items. These packages are bundled with cruise tickets and sold to guests for a single price rather than as a separate package and include:
• Alcoholic/non-alcoholic beverage packages | • Internet packages |
• Shore excursions• Air packages | • Photo packages• Parking |
• Specialty restaurants | • Gratuities |
Our brands’ payment terms generally require that a guest pay a deposit to confirm their reservation and then pay the balance due before the departure date. Our guests are subject to a cancellation fee if they cancel their cruise within a pre-defined period before sailing, unless they purchase a vacation protection package for the ability to obtain a refund.
As a convenience to our guests, we offer to arrange air transportation to and from airports near the home ports of our ships. In 2016, approximately 11% of our guests purchased air transportation from us. In addition, we charter aircraft to facilitate our guests’ travel to distant locations for some of our European brands’ cruise itineraries. We also offer ground transfers from and to the airport near the ship’s home port as part of our transfer programs.
VII. Seasonality
Our revenues from the sale of passenger tickets are seasonal. Historically, demand for cruises has been greatest during our third quarter, which includes the Northern Hemisphere summer months. This higher demand during the third quarter results in higher ticket prices and occupancy levels and, accordingly, the largest share of our operating income is earned during this period. The seasonality of our results also increases due to ships being taken out-of-service for maintenance, which we schedule during non-peak demand periods. In addition, substantially all of Holland America Princess Alaska Tours’ revenue and net income is generated from May through September in conjunction with the Alaska cruise season.
17
VIII. Onboard and Other Revenues
Onboard and other activities are provided either directly by us or by independent concessionaires, from which we receive either a percentage of their revenues or a fee. In 2016, we earned 25% of our revenues from onboard and other revenue activities and services not included in the cruise ticket price including the following:
• Substantially all liquor and some non-alcoholic beverage sales • Casino gaming | • Internet and communication services • Full service spas |
• Shore excursions • Gift shop sales | • Specialty restaurants • Art sales |
• Photo sales | • Laundry and dry cleaning services |
We enhance our guests’ onboard experiences and increase our onboard revenues by offering all-inclusive beverage packages, spa packages and specialty restaurants. We are also implementing initiatives to strengthen our onboard revenue programs, such as bar and casino programs. We use various marketing and promotional tools and are supported by point-of-sale systems permitting “cashless” transactions for the sale of these onboard and other products and services. As a convenience to our guests, all our brands allow their guests to pre-book, and in most cases, pre-pay certain of their onboard and other revenue-producing activities in advance of the cruise.
We offer a variety of shore excursions at each ship’s ports-of-call that include beach experiences, general sightseeing, cultural tours, adventure outings and local boat rides. We typically utilize local operators who provide shore excursions with guides who speak the same languages as most of our shore excursion guests. For our sailings to destinations in Alaska, shore excursions are operated by our wholly-owned company, Holland America Princess Alaska Tours, or provided by local independent operators. Fathom, the company's social impact brand, offers cruisers the option of entering the heart of a destination with residents from destination countries like the Dominican Republic on initiatives such as producing much-needed water filters, pouring concrete floors for houses, supporting a women's collective with the production of organic chocolate or teaching English to children and adults. We also offer revenue-producing activities on the private islands and port destinations that we operate that include beach bars and restaurants, water sports, cabana rentals and chair lift and surf rider attractions.
Our casinos are all owned and operated directly by us and are equipped according to the unique requirements of our brands and their guests. We offer a wide variety of slot machines and a diverse mix of both traditional and specialty table games all designed to meet the desires of our guests. We have also developed marketing and promotional arrangements with land-based casino companies in order to increase the number of casino players onboard several of our brands. The casinos are only open when our ships are at sea in international waters or when otherwise permitted by law.
In conjunction with our cruise vacations, many of our cruise brands sell pre-and post-cruise land packages of one to four days that include guided tours, hotel accommodations and related transportation services. In Alaska and the Canadian Yukon, we utilize, to a large extent, our own hotel and transportation assets. Additionally, we earn revenues from various promotional and other programs with destination retailers, parking facilities, credit card providers and other destination-based incentives.
IX. Marketing Activities
Guest feedback and research support the development of our overall marketing and business strategies to drive demand for cruises and increase the number of first-time cruisers. Our goal is to increase the portion of consumer’s vacations targeted on cruises and grow “share of suitcaseTM” for cruising on our brands. We measure and evaluate key drivers of guest loyalty and their satisfaction with our products and services that provide valuable insights about guests’ cruise experiences. We closely monitor our net promoter scores, which reflect the likelihood that our guests will recommend our brands’ cruise products and services to friends and family. We also regularly initiate customer research studies among guests, travel agents, tour operators and others for input on business decisions that enhance our cruise products and services for our guests.
With increasing collaboration between our brands and access to vast databases of past guest information, we continue to perform psychographic segmentation studies that allow us to better understand our guests’ needs, wants and expectations. The results of these studies shape how we communicate and market, as well as refine the booking process, overall onboard experience and post-cruise interactions. Our ability to identify the psychographic segments is a powerful differentiator, which allows us to guide guests to the right experiences with the appropriate brands and build advocates for life. In addition, we have tools and are implementing big data analytic solutions that will identify new market growth opportunities to expand our customer base.
18
We have implemented strategies to generate new demand by targeting new cruisers who typically vacation at land-based destinations. Our multi-brand marketing initiatives continue to drive increased consideration with print, TV, digital, social and field marketing elements with the goal of inspiring consumers to purchase a cruise vacation with us. We recently created original TV programs that are airing on major networks, reaching viewers during the large family-oriented programming blocks, and are designed to educate, entertain and engage viewers by showcasing exciting adventures, exotic cultures and popular global destinations. With at least 80 original episodes, the new experiential series uses compelling and authentic storytelling to share the powerful way travel by sea connects people, places and cultures around the world. Each of our brands is featured during the inaugural season.
Our brands have comprehensive marketing and advertising programs across diverse mediums to promote their products and services to vacationers and travel agents in their source areas. Each brand’s marketing activities are generally designed to reach a local region in the local language. We continue to expand our marketing efforts to attract new guests online by leveraging the reach and impact of digital marketing and social media. This helps us cultivate guests as advocates of our brands, ships, itineraries and onboard products and services. We also have blogs hosted by ship captains, cruise and entertainment directors, executive pursers and special guests.
All of our cruise brands offer past guest recognition programs that reward repeat guests with special incentives such as reduced fares, gifts, onboard activity discounts, complimentary laundry and internet services, expedited ship embarkation and disembarkation and special onboard activities.
X. Sales Relationships
We sell our cruises mainly through travel agents and tour operators that serve our guests in their local regions. Our individual cruise brands’ relationships with their travel agents are generally independent of each of our other brands. Our travel agent relationships are generally not exclusive and travel agents generally receive a base commission, plus the potential of additional commissions, including complimentary tour conductor cabins, based on the achievement of pre-defined sales volumes.
Travel agents are an integral part of our long-term cruise distribution network and are critical to our success. We utilize local sales teams to motivate travel agents to support our products and services with competitive sales and pricing policies and joint marketing and advertising programs. During fiscal 2016, no controlled group of travel agencies accounted for 10% or more of our revenues. We also employ a wide variety of educational programs, including websites, seminars and videos, to train agents on our cruise brands and their products and services.
For cruises that are home ported in China, we sell cruises to our Chinese-sourced guests by chartering our ships and packaging groups of cabins to travel distributors with licenses to sell outbound travel products in China. These distributors resell the cabins to their clients and other travel agents.
All of our brands have internet booking engines to allow travel agents to book our cruises. We also support travel agent booking capabilities through global distribution systems. All of our cruise brands have their own consumer websites that provide access to information about their products and services to users and enable their guests to quickly and easily book cruises and other products and services online. These sites interface with brands’ social networks, blogs and other social media sites, which allow them to develop greater contact and interaction with their guests before, during and after their cruise. We also employ vacation planners who support our sales initiatives by offering our guests one-on-one cruise planning expertise and other services.
We are a customer service driven company and continue to invest in our service organization to assist travel agents and guests before, during and after their cruise. We believe that our support systems and infrastructure are among the strongest in the vacation industry. Our investment in customer service includes the development of employees, processes and systems. We continually improve our systems within the reservations and customer relationship management functions, emphasizing the continuing support and training of the travel agency community.
19
XI. Employees
Our shipboard and shoreside employees are sourced from over 100 countries. We employ an average of 84,600 crew members, including officers, onboard the 102 ships we currently operate, which excludes employees who are on leave. Our shoreside operations have an average of 10,500 full-time and 2,100 part-time/seasonal employees, including seasonal employees of Holland America Princess Alaska Tours which significantly increases its work force during the late spring and summer months in connection with the Alaskan cruise season. We have entered into agreements with unions covering certain employees on our ships and in our shoreside hotel and transportation operations. The percentages of our shipboard and shoreside employees that are represented by collective bargaining agreements are 55% and 24%, respectively. We consider our employee and union relationships to be strong.
We source our shipboard officers primarily from Italy, the UK, the Netherlands, Germany and Norway. The remaining crew positions are sourced from around the world, with the largest contingent from the Philippines, Indonesia and India. We utilize a limited number of manning agencies to help locate and hire most of our shipboard employees.
XII. Training
Our cruise brands are committed to providing appropriate hotel and marine-related training to ensure that our shipboard crew, including officers, have the knowledge and skills to properly perform their jobs. We provide a diverse range of shoreside and shipboard training for our hotel staff before and after they join our ships to further enhance their skills. Specifically, we provide bar, entertainment, guest service, housekeeping, leadership, management and restaurant training. Depending on the brand, we will also provide our hotel staff with in-depth English, German and Italian language training. All our hotel staff also undergo extensive safety training and, depending on their position, will pursue advanced safety certifications. We partner closely with manning agencies to help provide this training in Manila, Philippines; Jakarta, Indonesia; and Mumbai, India.
Our goal is to be a leader in delivering high quality professional maritime training. In July 2016, we opened our new seven-acre Arison Maritime Center in Almere, Netherlands, with more than double the training capacity of our original facility. The centerpiece of the new campus is the CSMART Academy, the Center for Simulator Maritime Training. The CSMART Academy features the most advanced bridge and engine room simulator technology and equipment available with the capacity to provide annual professional training for all our deck and engineering officers. CSMART participants receive a maritime training experience that fosters critical thinking, problem solving, ethical decision making and skill development. We expect to train over 6,500 deck and engineering officers at CSMART every year.
XIII. Information Technology
With the increasing size and sophistication of cruise ships, the technologies employed to create guest experiences and operate ships have grown ever more complex and integrated. Our global information technology model is designed to contribute to exceeding expectations of our guests, crew, shoreside employees and other stakeholders. This model is focused on supporting exceptional guest experiences while increasingly leveraging common technologies to drive process efficiency and effectiveness across our portfolio of brands. In order to achieve our goals, we are focusing on applications, connectivity, cybersecurity, infrastructure and innovation. In response to the increasing threat of continually evolving cybersecurity risks, we are striving to provide consistent protection of guest, employee and company data and develop best practices and tools to combat threats and malicious activity.
All of our brands are actively collaborating on our global information technology solutions, standards and processes. By aligning technology planning, infrastructure and applications, we continue to maximize the business value of our information technology investments by eliminating redundancies and driving synergies across the brands while identifying and leveraging best practices and establishing common standards.
XIV. Innovation
We have successfully delivered innovation to our guests for more than four decades. Our continuous innovation with ship design allows our guests to enjoy carefully crafted experiences while effortlessly en-route to their next port-of-call. Our leading port development has opened new locations and experiences to our guests.
Our pursuit of innovation focused on delighting our guests is also the inspiration for our newly developed “Experience Platform.” The Experience Platform leverages multiple technologies that work together to transform guest experience and includes the following key elements:
20
• | Ocean Medallion - a revolutionary wearable device that enables a highly personalized vacation experience |
• | Ocean Compass - a digital concierge that works in conjunction with Ocean Medallion to create the ultimate vacation experience |
• | xiOS - an invisible network of interactive intelligent sensors and embedded devices mounted throughout the ship, home ports and destinations that uses a guest-centric, Internet of Things approach to enable a seamless guest experience |
This year, we also launched the initial phase of our state-of-the-art revenue management system, which will help us drive incremental revenue yield over time. We are currently rolling-out the system across six brands and expect the roll-out to be completed by early 2018.
We are developing and implementing cutting-edge proprietary technology to enhance our ability to monitor and track ship nautical and technical performance in real time, including fuel consumption and emissions.
XV. Supply Chain
We incur expenses to deliver exceptional cruise experiences to our guests. In addition, we incur significant capital expenditures for materials to support the refurbishment and enhancements of our vessels. We approach our spend strategically and look for suppliers who demonstrate the ability to help us leverage our scale in terms of cost, quality and innovation. Our largest capital investments are for the construction of new ships. We currently have agreements in place for the construction of 19 cruise ships with three shipyards.
XVI. Insurance
a. | General |
We maintain insurance to cover a number of risks associated with owning and operating our vessels and other non-ship related risks. All such insurance policies are subject to coverage limits, exclusions and deductible levels. Insurance premiums are dependent on our own loss experience and the general premium requirements of our insurers. We maintain certain levels of deductibles for substantially all the below-mentioned coverages. We may increase our deductibles to mitigate future premium increases. We do not carry coverage related to loss of earnings or revenues from our ships or other operations.
b. | Protection and Indemnity (“P&I”) Coverages |
Liabilities, costs and expenses for illness and injury to crew, guest injury, pollution and other third party claims in connection with our cruise activities are covered by our P&I clubs, which are mutual indemnity associations owned by ship owners.
We are members of three P&I clubs, which are part of a worldwide group of 13 P&I clubs, known as the International Group of P&I Clubs (the “IG”). The IG insures directly, and through broad and established reinsurance markets, a large portion of the world’s shipping fleets. Coverage is subject to the P&I clubs’ rules and the limits of coverage are determined by the IG.
c. | Hull and Machinery Insurance |
We maintain insurance on the hull and machinery of each of our ships for reasonable amounts as determined by management. The coverage for hull and machinery is provided by large and well-established international marine insurers. Insurers make it a condition for insurance coverage that a ship be certified as “in class” by a classification society that is a member of the International Association of Classification Societies (“IACS”). All of our ships are routinely inspected and certified to be in class by an IACS member.
d. | War Risk Insurance |
We maintain war risk insurance for legal liability to crew, guests and other third parties as well as loss or damage to our vessels arising from war or war-like actions, including terrorist incidents. Items excluded from this coverage are claims arising from chemical, nuclear and biological attacks. Our primary war risk insurance coverage is provided by international marine insurers and our excess war risk insurance is provided by our two P&I clubs. Under the terms of our war risk insurance coverage, which are typical for war risk policies in the marine industry, insurers can give us seven days’ notice that the insurance policies will be cancelled. However, the policies can be reinstated at different premium rates. This gives insurers the ability to increase our premiums following events that they determine have increased their risk.
21
e. | Other Insurance |
We maintain property insurance covering our shoreside assets and casualty insurance covering liabilities to third parties arising from our hotel and transportation business, shore excursion operations and shoreside operations, including our port and related commercial facilities. We also maintain workers compensation, directors and officer’s liability and other insurance coverages.
XVII. Port Destinations and Private Islands
In select geographies around the world we operate a portfolio of leading port destinations and private islands to grow demand and create relative scarcity. This enables us to offer exceptional guest experiences. In late 2015, we opened Amber Cove in the Dominican Republic, a new destination strategically located in the central Caribbean. We also opened a third berth in late 2015 in Cozumel’s Puerta Maya to accommodate increasing demand. In addition, to secure preferential berth access to third party ports, we coordinate across brands to negotiate berthing agreements and to ‘lock-in’ preferred access through shared agreements and commitments.
XVIII. Sustainability
Our reputation and success depend on having sustainable and transparent operations. Our commitment and actions to keep our guests and crew members safe and comfortable, protect the environment, develop and provide opportunities for our workforce, strengthen stakeholder relations and enhance both the communities where we work as well as the port communities that our ships visit are vital to our success as a business enterprise and reflective of our core values. We strive to be a company that people want to work for and to be an exemplary global corporate citizen.
We voluntarily publish Sustainability Reports that address governance, stakeholder engagement, environmental, labor, human rights, society, product responsibility, economic and other sustainability-related issues and performance indicators. These reports, which are not incorporated in this Form 10-K but can be viewed at www.carnivalcorp.com and www.carnivalplc.com, were developed in accordance with the Sustainability Reporting Guidelines established by the Global Reporting Initiative, the global standard for reporting on environmental, social and governance policies, practices and performance. We have been publishing Sustainability Reports since 2011.
In order to support our environmental strategy, all of our brands' environmental management systems are certified in accordance with ISO 14001. We have also developed a set of 2020 sustainability goals reinforcing our commitment to the environment, our guests, our employees and the communities in which we operate. Our ten goals listed below are aimed at reducing our environmental footprint while enhancing the health, safety and security of our guests and crew members and ensuring sustainable business practices across our brands and business partners:
Environmental Goals
• | Reduce intensity of carbon dioxide equivalent ("CO2e") emissions from operations by 25% by 2020 relative to our 2005 baseline |
• | Continue to improve the quality of our emissions into the air by developing, deploying and operating exhaust gas cleaning systems ("EGCS") across our fleet |
• | Increase usage of ship-to-shore power connection capabilities |
• | Increase Advanced Wastewater Purification Systems coverage of our fleet capacity by 10 percentage points by 2020 relative to our 2014 baseline |
• | Continue to improve our shipboard operations' water use efficiency by 5% by 2020 relative to our 2010 baseline |
• | Continue to reduce waste generated by our shipboard operations by 5% by 2020 relative to our 2010 baseline |
Health, Safety and Security Goals
• | Continue to build on our commitment to protect the health, safety and security of guests, employees and all others working on our behalf |
22
Sustainable Workforce and Community Goals
• | Continue to build a diverse and inclusive workforce and provide all employees with a positive work environment and opportunities to build a rewarding career to further drive employee engagement |
• | Further develop and implement vendor assurance procedures ensuring compliance with Carnival Corporation & plc's Business Partner Code of Conduct and Ethics |
• | Continue to work on initiatives and partnerships that support and sponsor a broad range of organizations for the benefit of the communities where we operate |
We continue our partnership with The Nature Conservancy, one of the world’s leading conservation organizations. They are leveraging our partnership in their efforts to restore coral reefs, protect marine ecosystems and promote natural habitats for marine environments to help reduce the impact of storms and rising sea levels in coastal communities.
XIX. Governmental Regulations
a. Maritime Regulations
1. General
Our ships are regulated by numerous international, national, state and local laws, regulations, treaties and other legal requirements that govern health, environmental, safety and security matters in relation to our guests, crew and ships. These requirements change regularly, sometimes on a daily basis, depending on the itineraries of our ships and the ports and countries visited. If we violate or fail to comply with any of these laws, regulations, treaties and other requirements we could be fined or otherwise sanctioned by regulators. We are committed to complying with, or exceeding, all relevant maritime requirements.
The primary regulatory bodies that establish maritime laws and requirements applicable to our ships include:
The International Maritime Organization ("IMO"): All of our ships, and the maritime industry as a whole, are subject to the maritime safety and security regulations established by the IMO, a specialized agency of the United Nations', and its principal set of requirements as mandated through its International Convention for the Safety of Life at Sea (“SOLAS”).
Flag States: Our ships are registered, or flagged, in The Bahamas, Bermuda, Italy, Malta, the Netherlands, Panama and the UK, which are also referred to as Flag States. Our ships are regulated by these Flag States through international conventions that govern health, environmental, safety and security matters in relation to our guests, crew and ships. Representatives of each Flag State conduct periodic inspections, surveys and audits to verify compliance with these requirements.
Ship classification societies: Class certification is one of the necessary documents required for our cruise ships to be flagged in a specific country, obtain liability insurance and legally operate as passenger cruise ships. Our ships are subject to periodic class surveys, including dry-docking inspections, by ship classification societies to verify that our ships have been maintained in accordance with the rules of the classification societies and that recommended repairs have been satisfactorily completed. Dry-dock frequency is a statutory requirement mandated by SOLAS. Our ships dry-dock once or twice every five years, depending on the age of the ship.
National, regional, state and local authorities: We are subject to the decrees, directives, regulations and requirements of the European Union ("EU"), the U.S., U.S. states and more than 400 other international ports that our ships visit every year.
Port regulatory authorities (Port State Control): Our ships are also subject to inspection by the port regulatory authorities, which are also referred to as Port State Control, in the various countries that they visit. Such inspections include verification of compliance with the maritime safety, security, environmental, customs, immigration, health and labor requirements applicable to each port, as well as with regional, national and international requirements. Many countries have joined together to form regional port regulatory authorities.
As members of CLIA, we helped to develop and have implemented policies that are intended to enhance shipboard safety throughout the cruise industry. In some cases this calls for implementing best practices, which are in excess of existing legal requirements. Further details on these and other policies can be found on www.cruising.org.
23
Our Boards of Directors have HESS Committees, which are currently each comprised of four independent directors. The principal function of the HESS Committees is to assist the boards in fulfilling their responsibility to supervise and monitor our health, environment, safety, security and sustainability related policies, programs and initiatives at sea and ashore and compliance with related legal and regulatory requirements. The HESS Committees and our management team review all significant relevant risks or exposures and associated mitigating actions.
We are committed to implementing appropriate measures to manage identified risks effectively. As part of our commitment, we have a Chief Maritime Officer, who is a retired Vice Admiral from the U.S. Navy, to oversee our global maritime operations, including maritime quality assurance and policy, environmental compliance, shipbuilding, ship refits and research and development. To ensure that we are compliant with the legal and regulatory requirements and that these areas of our business operate in an efficient manner we:
• | Provide regular health, environmental, safety and security support, training, guidance and information to guests, employees and others working on our behalf |
• | Develop and implement effective and verifiable management systems to fulfill our health, environmental, safety, sustainability and security commitments |
• | Perform regular shoreside and shipboard audits and take appropriate action when deficiencies are identified |
• | Report and investigate all health, environmental, safety and security incidents and take appropriate action to prevent recurrence |
• | Identify those employees responsible for managing health, safety, environment, security and sustainability programs and ensure that there are clear lines of accountability |
• | Identify the aspects of our business that impact the environment and continue to take appropriate action to minimize that impact |
2. Maritime Safety Regulations
The IMO has adopted safety standards as part of SOLAS. To help ensure guest and crew safety, SOLAS establishes requirements for the following:
• Vessel design | • Life-saving and other equipment |
• Structural features | • Fire protection and detection |
• Construction and materials | • Safe management and operation |
• Refurbishment standards | • Musters |
• Radio communications | |
All of our crew undergo regular safety training that meets or exceeds all international maritime regulations, including SOLAS requirements which are periodically revised.
SOLAS requires implementation of the International Safety Management Code (“ISM Code”), which provides an international standard for the safe management and operation of ships and for pollution prevention. The ISM Code is mandatory for passenger vessel operators. Under the ISM Code, vessel operators are required to:
• | Develop a Safety Management System (“SMS”) that includes, among other things, the adoption of safety and environmental protection policies setting forth instructions and procedures for operating vessels safely and describing procedures for responding to emergencies and protecting the environment |
• | Obtain a Document of Compliance (“DOC”) for the vessel operator, as well as a Safety Management Certificate (“SMC”) for each vessel they operate. These documents are issued by the vessel’s Flag State and evidence compliance with the SMS |
• | Verify or renew DOCs and SMCs periodically in accordance with the ISM Code |
We have implemented and continue to enhance policies and procedures that demonstrate our commitment to the safety of our guests and crew. These policies and procedures include the following:
• | Expansion and acceleration of the training of our bridge and engine room officers in maritime related best practices at our new CSMART Academy, the Center for Simulator Maritime Training located within our Arison Maritime Center in Almere, Netherlands |
• | Further standardization of our detailed bridge and engine resource management procedures on all of our ships |
• | Expansion of our existing oversight function to monitor bridge and engine room operations |
24
• | Identifying and standardizing best-practice policies and procedures in health, environment, safety and security disciplines across the entire organization including on all our ships |
• | Further enhancement of our processes for auditing our HESS performance throughout our operations |
3. Maritime Security Regulations
Our ships are subject to numerous security requirements. These requirements include the International Ship and Port Facility Security Code, which is part of SOLAS, the U.S. Maritime Transportation Security Act of 2002, which addresses U.S. port and waterway security and the U.S. Cruise Vessel Security and Safety Act of 2010, which applies to all of our ships that embark or disembark passengers in the U.S. These regulations include requirements as to the following:
• | Implementation of specific security measures, including onboard installation of a ship security alert system |
• | Assessment of vessel security |
• | Efforts to identify and deter security threats |
• | Training, drills and exercises |
• | Security plans that may include guest, vehicle and baggage screening procedures, security patrols, establishment of restricted areas, personnel identification procedures, access control measures and installation of surveillance equipment |
• | Establishment of procedures and policies for reporting and managing allegations of crimes |
4. Maritime Environmental Regulations
We are subject to numerous international, national, state and local environmental laws, regulations and treaties that govern air emissions, waste discharges, water management and disposal, and the storage, handling, use and disposal of hazardous substances such as chemicals, solvents and paints.
As a means of managing and improving our environmental performance and compliance, we adhere to standards set by ISO, an international standard-setting body, which produces worldwide industrial and commercial standards. The environmental management systems of our brands and ships are certified in accordance with ISO 14001, the environmental management standard that was developed to help organizations manage the environmental impacts of their processes, products and services. ISO 14001 defines an approach to setting and achieving environmental objectives and targets, within a structured management framework.
i. International Regulations
The principal international convention governing marine pollution prevention and response is the IMO’s International Convention for the Prevention of Pollution from Ships (“MARPOL”).
a. Preventing and Minimizing Pollution
MARPOL includes four annexes containing requirements designed to prevent and minimize both accidental and operational pollution by oil, sewage, garbage and air emissions and sets forth specific requirements related to vessel operations, equipment, recordkeeping and reporting that are designed to prevent and minimize pollution. All of our ships must carry an International Oil Pollution Prevention Certificate, an International Sewage Pollution Prevention Certificate, an International Air Pollution Prevention Certificate and a Garbage Management Plan. The ship’s Flag State issues these certificates, which evidence their compliance with the MARPOL regulations regarding prevention of pollution by oil, sewage, garbage and air emissions. Certain jurisdictions have not adopted all of these MARPOL annexes but have established various national, regional or local laws and regulations to apply to these areas.
As noted above, MARPOL governs the prevention of pollution by oil from operational measures, as well as from accidental discharges. MARPOL requires that discharges of machinery space bilge water pass through pollution prevention equipment that separates oil from the water and monitors the discharged water to ensure that the effluent does not exceed 15 parts per million oil content. Our ships must have oily water separators with oil content monitors installed and must maintain a record of certain engine room operations in an Oil Record Book. In addition, we have voluntarily installed redundant systems on all of our ships that monitor processed bilge water prior to discharge to ensure that it contains no more than 15 parts per million oil content. This voluntary system provides additional control to prevent improper bilge water discharges. MARPOL also requires that our ships have Shipboard Oil Pollution Emergency Plans.
25
MARPOL also governs the discharge of sewage from ships and contains regulations regarding the ships’ equipment and systems for the control of sewage discharge, the provision of facilities at ports and terminals for the reception of sewage and requirements for survey and certification.
MARPOL also governs the discharge of garbage from ships and requires the implementation of Garbage Management Plan and the maintenance of a Garbage Record Book.
Furthermore, MARPOL addresses air emissions from vessels, establishes requirements for the prevention of air pollution from ships to reduce emissions of sulfur and nitrogen (SOx, NOx), and particulate matter. It also contains restrictions on the use of ozone depleting substances (“ODS”) and requires the recording of ODS use, equipment containing ODS and the emission of ODS.
b. Sulfur Emissions
MARPOL Annex VI addresses air emissions from vessels in both auxiliary and main propulsion diesel engines on ships. Annex VI also specifies requirements for Emission Control Areas (“ECAs”) with stricter limitations on sulfur emissions in these areas. Since January 2015, ships operating in a number of regions throughout the world have been required to use fuel with a sulfur content of no more than 0.1% or 0.5% (depending on the ECA), or to use alternative emission reduction methods, such as Exhaust Gas Cleaning Systems ("EGCS"). Additional local and regional ECAs have come into force in 2016 and several more will take effect in 2017.
The International Maritime Organization's Marine Environment Protection Committee has agreed to implement a global 0.5% sulfur cap for marine fuel beginning in January 2020. The EU Parliament and Council have also set a January 2020 implementation date for their 0.5% sulfur content fuel requirement (the "EU Sulfur Directive"). The options to comply with both the global 0.5% sulfur cap and the EU Sulfur Directive include the use of low sulfur fuel, installation of EGCS, or the use of alternative fuels.
In conjunction with an affiliate, we have been installing EGCSs on our ships. These efforts are mitigating much of the impact from the 2015 ECA requirements. However, we have, and will, incur additional EGCS operating expenses as we benefit from the use of this technology.
c. Other Ship Emission Abatement Methods
In the long-term, the cost impacts of meeting progressively lower sulfur emission requirements may be further mitigated by the favorable impact of future changes in the supply and demand balance for marine and other types of fuel, future developments of and investments in improved sulfur emission abatement technologies, the use of alternative lower cost and lower emission fuels and our continued efforts to improve the overall fuel efficiency across our fleet. Since 2007, we have achieved approximately 28% cumulative reduction in unit fuel consumption by focusing on more efficient itineraries, a wide variety of ships' system hardware and software, energy-efficiency upgrades (including hull coatings, air conditioning and engine performance improvement), creating and linking energy-savings groups across operating lines and ship's staff energy use awareness and training.
As part of our emission abatement program, we have continued our work with several local port authorities to utilize cruise ship shore power connections and have equipped 28 ships with the capability to utilize shore power technology. This technology enables our ships to use power from the local electricity provider rather than running their engines while in port to power their onboard services, and thus reducing our ship air emissions.
26
Similarly, in an effort to extend our commitment to sustainability and to play a leading role in matters of environmental protection in the cruise industry, we are expanding our investment in the use of low carbon fuels, in particular, liquefied natural gas (“LNG”):
• | AIDA now uses an LNG hybrid barge as an ecologically friendly and flexible power supply and an alternative to shore power, while its ships are moored in the port of Hamburg, Germany |
• | AIDAprima is the first cruise ship in the world that regularly uses dual-fuel engines for an energy supply with LNG while in ports on her Northern European deployment. Her sister ship AIDAperla is scheduled to be delivered in 2017 with the same technology |
• | We have seven next-generation cruise ships on order that will be the first in the industry to be powered at sea by LNG. Pioneering a new era in the use of low carbon fuels, these new ships will use LNG to generate 100 percent of their power both in port and on the open sea - an innovation that will reduce exhaust emissions to help protect the environment |
d. Greenhouse Gas Emissions ("GHG")
In January 2013, the IMO approved measures to improve energy efficiency and reduce emissions of GHGs from international shipping by adopting technical and operational measures for all ships. The technical measures apply to the design of new vessels, and the operational reduction measures apply to all vessels. Operational reduction measures have been implemented through a variety of means, including a Ship Energy Efficiency Management Plan, improved voyage planning and more frequent propeller and hull cleanings. We have established objectives within the ISO 14001 environmental management systems of each of our brands to further reduce fuel consumption rates and the resulting GHG emissions.
In October 2016, the IMO approved the implementation of a mandatory data collection system for fuel oil consumption. This amendment will require ships of 5,000 gross tons and above to provide fuel oil consumption data to their respective flag State at the end of each calendar year, formally beginning in 2019. Flag States will then validate the data and transfer it to an IMO database. The IMO will produce an annual report with anonymous data. This is the first step taken by the IMO toward a more formal analysis of international shipping's contribution to global GHG emissions.
e. Ballast Water
As of September 8, 2017, MARPOL will also govern the discharge of ballast water from ships through the MARPOL Ballast Water Management Convention. Ballast water is seawater used to stabilize ships at sea and maintain safe operating conditions throughout a voyage. Ballast can carry a multitude of marine species. The Convention is designed to regulate the treatment of ballast water prior to discharging overboard in order to avoid the transfer of marine species to new environments.
ii. U.S. Federal and State Regulations
The Act to Prevent Pollution from Ships authorizes the implementation of MARPOL in the U.S. and imposes numerous requirements on our ships, as discussed above. Administrative, civil and criminal penalties may be assessed for violations.
The Oil Pollution Act of 1990 (“OPA 90”) established a comprehensive federal liability regime, as well as prevention and response requirements, relating to discharges of oil in U.S. waters. The major requirements include demonstrating financial responsibility up to the liability limits and having oil spill response plans in place. We have Certificates of Financial Responsibility that demonstrate our ability to meet the maximum amount of OPA 90 related liability that our ships could be subject to for removal costs and damages, such as from an oil spill or a release of a hazardous substance. Under OPA 90, owners or operators of vessels operating in U.S. waters must file Vessel Response Plans with the U.S. Coast Guard and must operate in compliance with these plans. As OPA 90 expressly allows coastal states to impose liabilities and requirements beyond those imposed under federal law, many U.S. states have enacted laws more stringent than OPA 90. Some of these state laws impose unlimited liability for oil spills and contain more stringent financial responsibility and contingency planning requirements.
The Clean Water Act (“CWA”) provides the U.S. Environmental Protection Agency (“EPA”) with the authority to regulate commercial vessels’ incidental discharges of ballast water, bilge water, gray water, anti-fouling paints and other substances during normal operations within the U.S. three mile territorial sea and inland waters. Pursuant to the CWA authority, the U.S. National Pollutant Discharge Elimination System was designed to minimize pollution within U.S. territorial waters. For our
27
affected ships, all of the requirements are laid out in EPA's Vessel General Permit (“VGP”) for discharges incidental to the normal operations of vessels. The VGP establishes effluent limits for 27 specific discharges incidental to the normal operation of a vessel. In addition to these discharge and vessel specific requirements, the VGP includes requirements for inspections, monitoring, reporting and record-keeping.
We are subject to the requirements of the U.S. Resource Conservation and Recovery Act for the transportation and disposal of both hazardous and non-hazardous solid wastes that are generated by our ships. In general, vessel owners are required to determine if their wastes are hazardous, comply with certain standards for the proper management of hazardous wastes and use hazardous waste manifests for shipments to approved disposal facilities.
The U.S. National Invasive Species Act (“NISA”) was enacted in response to growing reports of harmful organisms being released into U.S. waters through ballast water taken on by vessels in foreign waters. The U.S. Coast Guard adopted regulations under NISA that impose mandatory ballast water management practices for all vessels equipped with ballast water tanks entering U.S. waters. These requirements can be met by performing mid-ocean ballast exchange, by retaining ballast water onboard the vessel or by using environmentally sound ballast water treatment methods approved by the U.S. Coast Guard.
Most U.S. states that border navigable waterways or sea coasts have also enacted environmental regulations that impose strict liability for removal costs and damages resulting from a discharge of oil or a release of a hazardous substance.
The state of Alaska has enacted legislation that prohibits certain discharges in designated Alaskan waters and sets effluent limits on others. Further, the state requires that certain discharges be reported and monitored to verify compliance with the standards established by the legislation. Environmental regimes in Alaska are more stringent than the U.S. federal requirements with regard to discharges from vessels. The legislation also provides that repeat violators of the regulations could be prohibited from operating in Alaskan waters. The state of California also has environmental requirements significantly more stringent than federal requirements for water discharges and air emissions.
iii. EU Regulations
The EU has adopted a broad range of substantial environmental measures aimed at improving the quality of the environment for European citizens. To support the implementation and enforcement of European environmental legislation, the EU has adopted directives on environmental liability and enforcement and a recommendation providing for minimum criteria for environmental inspections.
The European Commission’s (“EC”) strategy is to reduce atmospheric emissions from ships. The EC strategy seeks to implement SOx Emission Control Areas set out in MARPOL, as discussed above.
The European Commission has also implemented regulations aimed at reducing GHG emissions from maritime shipping through a Monitoring, Reporting and Verification (MRV) regulation, which will collect emissions data from ships over 5,000 gross tons to monitor and report their carbon emissions on all voyages to, from and between European Union ports, beginning in 2018.
5. Maritime Health Regulations
We are committed to providing a healthy environment for all of our guests and crew. We collaborate with public health inspection programs throughout the world, such as the Centers for Disease Control and Prevention in the U.S. (“CDC”) and the SHIPSAN Project in the EU to ensure that development of these programs leads to enhanced health and hygiene onboard our ships. Through our collaborative efforts, we work with the authorities to develop and revise guidelines, review plans and conduct on-site inspections for all newbuilds and significant ship renovations. In addition, we continue to maintain our ships by meeting, and often exceeding, applicable public health guidelines and requirements, complying with inspections, reporting communicable illnesses and conducting regular crew training and guest education programs.
In 2015, nearly 11 million passengers embarked on CLIA member cruise ships from U.S. ports. That year, there were ten reportable norovirus outbreaks on cruise ships departing from U.S. ports involving a total of 1,263 passengers, which represents only 0.012% of cruise passengers on CLIA member cruise ships. By contrast, the CDC reported there are approximately 20 million norovirus cases in a typical year in the U.S., or 6.3% of the U.S. population. It is estimated that one in fifteen Americans contract the norovirus on land each year, compared to an estimated one in 12,000 cruise guests globally who report that they have contracted the norovirus on a cruise ship during an outbreak each year. Although outbreaks of gastrointestinal
28
illnesses on ships represent a small percentage of all outbreaks, the cruise industry has developed and implemented policies and practices to limit gastrointestinal illness onboard ships.
6. Maritime Labor Regulations
In 2006, the International Labor Organization, an agency of the United Nations that develops and oversees international labor
standards, adopted a Consolidated Maritime Labor Convention (“MLC 2006”). MLC 2006 contains a comprehensive set of global standards and includes a broad range of requirements, such as the definition of a seafarer, minimum age of seafarers, medical certificates, recruitment practices, training, repatriation, food, recreational facilities, health and welfare, hours of work and rest, accommodations, wages and entitlements. In August 2013, MLC 2006 became effective in certain countries in which we operate.
The International Convention on Standards of Training, Certification and Watchkeeping for Seafarers, as amended, establishes minimum standards relating to training, including security training, certification and watchkeeping for our seafarers.
b. Consumer Regulations
In most major countries where we source our guests, we are required to establish financial responsibility, such as obtaining a guarantee from a reputable insurance company to ensure that, in case of insolvency, our guests will be refunded their deposits and repatriated without additional cost if insolvency occurs after a cruise starts.
In Australia and most of Europe, we are also obligated to honor our guests’ cruise payments made by them to their travel agents and tour operators regardless of whether we receive these payments.
XX. Taxation
A summary of our principal taxes and exemptions in the jurisdictions where our significant operations are located is as follows:
a. | U.S. Income Tax |
We are primarily foreign corporations engaged in the business of operating cruise ships in international transportation. We also own and operate, among other businesses, the U.S. hotel and transportation business of Holland America Princess Alaska Tours through U.S. corporations.
Our North American cruise ship businesses and certain ship-owning subsidiaries are engaged in a trade or business within the U.S. Depending on its itinerary, any particular ship may generate income from sources within the U.S. We believe that our U.S. source income and the income of our ship-owning subsidiaries, to the extent derived from, or incidental to, the international operation of a ship or ships, is currently exempt from U.S. federal income and branch profit taxes.
Our domestic U.S. operations, principally the hotel and transportation business of Holland America Princess Alaska Tours, are subject to federal and state income taxation in the U.S.
1. | Application of Section 883 of the Internal Revenue Code |
In general, under Section 883 of the Internal Revenue Code, certain non-U.S. corporations (such as our North American cruise ship businesses) are not subject to U.S. federal income tax or branch profits tax on U.S. source income derived from, or incidental to, the international operation of a ship or ships. Applicable U.S. Treasury regulations provide in general that a foreign corporation will qualify for the benefits of Section 883 if, in relevant part, (i) the foreign country in which the foreign corporation is organized grants an equivalent exemption to corporations organized in the U.S. in respect of each category of shipping income for which an exemption is being claimed under Section 883 (an “equivalent exemption jurisdiction”) and (ii) the foreign corporation meets a defined publicly-traded corporation stock ownership test (the “publicly-traded test”). Subsidiaries of foreign corporations that are organized in an equivalent exemption jurisdiction and meet the publicly-traded test also benefit from Section 883. We believe that Panama is an equivalent exemption jurisdiction and that Carnival Corporation currently satisfies the publicly-traded test under the regulations. Accordingly, substantially all of Carnival Corporation’s income is exempt from U.S. federal income and branch profit taxes.
Regulations under Section 883 list certain activities that the Internal Revenue Service (“IRS”) does not consider to be incidental to the international operation of ships and, therefore, the income attributable to such activities, to the extent such income is U.S. source, does not qualify for the Section 883 exemption. Among the activities identified as not incidental are income from the
29
sale of air transportation, transfers, shore excursions and pre- and post-cruise land packages to the extent earned from sources within the U.S.
2. | Exemption Under Applicable Income Tax Treaties |
We believe that the U.S. source transportation income earned by Carnival plc and its Italian resident subsidiary currently qualifies for exemption from U.S. federal income tax under applicable bilateral U.S. income tax treaties.
3. | U.S. State Income Tax |
Carnival Corporation and Carnival plc and certain of their subsidiaries are subject to various U.S. state income taxes generally imposed on each state’s portion of the U.S. source income subject to U.S. federal income taxes. However, the state of Alaska imposes an income tax on its allocated portion of the total income of our companies doing business in Alaska and certain of their subsidiaries.
b. | UK and Australian Income Tax |
Cunard, P&O Cruises (UK) and P&O Cruises (Australia) are divisions of Carnival plc and have elected to enter the UK tonnage tax under a rolling ten-year term and, accordingly, reapply every year. Companies to which the tonnage tax regime applies pay corporation taxes on profits calculated by reference to the net tonnage of qualifying ships. UK corporation tax is not chargeable under the normal UK tax rules on these brands’ relevant shipping income. Relevant shipping income includes income from the operation of qualifying ships and from shipping related activities.
For a company to be eligible for the regime, it must be subject to UK corporation tax and, among other matters, operate qualifying ships that are strategically and commercially managed in the UK. Companies within UK tonnage tax are also subject to a seafarer training requirement.
Our UK non-shipping activities that do not qualify under the UK tonnage tax regime remain subject to normal UK corporation tax. Dividends received from subsidiaries of Carnival plc doing business outside the UK are generally exempt from UK corporation tax.
P&O Cruises (Australia) and all of the other cruise ships operated internationally by Carnival plc for the cruise segment of the Australian vacation region are exempt from Australian corporation tax by virtue of the UK/Australian income tax treaty.
c. | Italian and German Income Tax |
In early 2015, Costa and AIDA re-elected to enter the Italian tonnage tax regime through 2024 and can reapply for an additional ten-year period beginning in early 2025. Companies to which the tonnage tax regime applies pay corporation taxes on shipping profits calculated by reference to the net tonnage of qualifying ships.
Most of Costa’s and AIDA’s earnings that are not eligible for taxation under the Italian tonnage tax regime will be taxed at an effective tax rate of 5.5%.
Substantially all of AIDA’s earnings are exempt from German income taxes by virtue of the Germany/Italy income tax treaty.
d. | Income and Other Taxes in Asian Countries |
Substantially all of our brands’ income from their international operation in Asian countries is exempt from local corporation tax by virtue of relevant income tax treaties.
e. | Other |
In addition to or in place of income taxes, virtually all jurisdictions where our ships call impose taxes, fees and other charges based on guest counts, ship tonnage, passenger capacity or some other measure.
30
XXI. Trademarks and Other Intellectual Property
We own, use and/or have registered or licensed numerous trademarks, copyrights and domain names, which we believe are widely recognized and have considerable value. These intangible assets enable us to distinguish our cruise products and services, ships and programs from those of our competitors. We own the trademarks for the trade names of our cruise brands, each of which we believe is a widely-recognized brand in the cruise industry, as well as our ship names and a wide variety of cruise products and services.
XXII. Competition
We compete with land-based vacation alternatives throughout the world, such as hotels, resorts (including all-inclusive resorts), theme parks, organized tours, casinos, vacation ownership properties, and other internet-based alternative lodging sites. Based on the most recent G.P. Wild Cruise Industry Statistical Review, we, along with our principal cruise competitors Royal Caribbean Cruises Ltd., Norwegian Cruise Line Holdings, Ltd. and MSC Cruises, carry approximately 87% of all global cruise guests.
D. Website Access to Carnival Corporation & plc SEC Reports
Our Form 10-K, joint Quarterly Reports on Form 10-Q, joint Current Reports on Form 8-K, joint Proxy Statement related to our annual shareholders meeting, Section 16 filings and all amendments to those reports are available free of charge on our home pages at www.carnivalcorp.com and www.carnivalplc.com and on the SEC’s home page at www.sec.gov as soon as reasonably practicable after we have electronically filed or furnished these reports with the SEC. The content of any website referred to in this Form 10-K is not incorporated by reference into this Form 10-K.
E. Industry and Market Data
This Form 10-K includes market share and industry data and forecasts that we obtained from industry publications, third-party surveys and internal company surveys. Industry publications, including those from CLIA, G.P. Wild, and surveys and forecasts, including those from TripAdvisor and Nielsen Global, generally state that the information contained therein has been obtained from sources believed to be reliable. CLIA is a non-profit marketing and training organization formed in 1975 to promote cruising and offer support and training for the travel agent community in North America. CLIA participates in the regulatory and policy development process while supporting measures that foster a safe, secure and healthy cruise ship environment. In addition, CLIA facilitates strategic relationships between cruise industry suppliers and organizations, cruise lines, ports and shipyards and provides a forum for interaction with governmental agencies. All CLIA information, obtained from the CLIA website www.cruising.org, relates to the CLIA member cruise lines. In 2016, CLIA represents 60 cruise brands that operate more than 95% of cruise industry capacity. G.P Wild is an authoritative source of cruise industry statistics and publishes a number of reports and industry reviews. All G.P. Wild information is obtained from their annual Cruise Industry Statistical Review. All other references to third party information are publicly available at nominal or no cost. We use the most currently available industry and market data to support statements as to our market positions. Although we believe that the industry publications and third-party sources are reliable, we have not independently verified any of the data. Similarly, while we believe our internal estimates with respect to our industry are reliable, they have not been verified by any independent sources. While we are not aware of any misstatements regarding any industry data presented herein, our estimates, in particular as they relate to market share and our general expectations, involve risks and uncertainties and are subject to change based on various factors, including those discussed under Part I, Item 1A. Risk Factors and Exhibit 13, Management’s Discussion and Analysis of Financial Condition and Results of Operations, in this Form 10-K.
31
Item 1A. Risk Factors.
You should carefully consider the specific risk factors set forth below and the other information contained or incorporated by reference in this Form 10-K, as these are important factors that could cause our actual results, performance or achievements to differ materially from our expected or historical results. The ordering and lettering of the risk factors set forth below is not intended to reflect any Company indication of priority or likelihood. Some of the statements in this item and elsewhere in this Form 10-K are “forward-looking statements.” For a discussion of those statements and of other factors to consider see the “Cautionary Note Concerning Factors That May Affect Future Results” section below.
a. Incidents, such as ship incidents, security incidents, the spread of contagious diseases and threats thereof, adverse weather conditions or other natural disasters and the related adverse publicity affecting our reputation and the health, safety, security and satisfaction of guests and crew could have an adverse effect on our sales and profitability.
The operation of cruise ships, hotels, land tours, port and related commercial facilities and shore excursions involve the risk of incidents, including those caused by the improper operation or maintenance of ships, motorcoaches and trains; guest and crew illnesses, such as from the spread of contagious diseases; mechanical failures, fires and collisions and the resulting costs incurred on emergency ship repairs; repair delays; groundings; navigational errors; oil spills and other maritime and environmental mishaps; missing passengers and other incidents at sea or while in port or on land, which may cause injury and death, guest and crew discomfort, alteration of itineraries or cancellation of a cruise or series of cruises or tours. Although our uncompromising commitment to the safety and comfort of our guests and crew is paramount to the success of our business, our ships have been involved in accidents and other incidents in the past. We may experience similar or other incidents in the future. These types of incidents may bring into question guest and crew health, safety, security and satisfaction and may adversely affect our brands’ reputations and the demand for our brands and cruising in general, which may affect our sales and profitability, may result in additional costs to our business, and may result in litigation against us and increasing government or other regulatory oversight.
Our ability to effectively and efficiently operate shipboard and shoreside activities may be impacted by widespread public health issues/illnesses or health warnings resulting in, among other things, reduced demand for cruises and cruise and ship charter cancellations and employee absenteeism that could have an adverse effect on our sales and profitability. For example, a severe outbreak of the influenza virus or some other pandemic could, among other things, disrupt our ability to embark/disembark passengers and crew, require changes to cruise itinerary, disrupt air and ground travel to and from ports, increase costs for prevention and treatment and adversely affect our supply chain and distribution systems. This could also adversely impact cruise demand in areas unaffected by such an outbreak.
In addition, as mentioned above, our ships are subject to the risks of mechanical failures and accidents, for which we have had to incur repair and equipment replacement expenditures. If these occur in the future, we may be unable to procure spare parts or new equipment when needed or make repairs without incurring significant expenditures or suspension of service. A significant performance deficiency or problem on any one or more of our ships could have an adverse effect on our financial condition and results of operations.
Our cruise ships, hotels, land tours, port and related commercial facilities, shore excursions and other service providers may be impacted by adverse weather patterns or other natural disasters, such as hurricanes, earthquakes, floods, fires, tornados, tsunamis, typhoons and volcanic eruptions. These events could result in, among other things, increased port related and other costs. It is possible that we could be forced to alter itineraries or cancel a cruise or a series of cruises or tours due to these or other factors, which would have an adverse effect on our sales and profitability.
The frequency of extreme weather events such as hurricanes, floods and typhoons may not only cause disruption, alteration, or cancellation of cruises but may also adversely impact commercial airline flights, other transport and shore excursion activities or prevent our guests from electing to cruise altogether. Such extreme weather events may also disrupt the supply of provisions, fuel and shore power, and may limit our ability to safely embark and disembark our guests. In addition, these extreme weather conditions could result in increased wave and wind activity, which would make it more challenging to sail and dock our ships and could cause sea/motion sickness among guests and crew. These events could have an adverse impact on the safety and satisfaction of cruising and could have an adverse impact on our sales and profitability. Additionally, these extreme weather conditions could cause property damage to our ships, port and related commercial and business facilities and other assets and impact our ability to provide our cruise products and services as well as to obtain insurance coverage for operations in such areas at reasonable rates.
32
Incidents involving cruise ships, in particular our cruise ships, and media coverage thereof, as well as adverse media publicity concerning the cruise vacation industry in general, or unusual weather patterns or other natural disasters or disruptions, such as hurricanes and earthquakes, could impact demand for our cruises. In addition, any incidents which impact the travel industry more generally may negatively impact guests’ ability or desire to travel to or from our ships or interrupt our ability to obtain services and goods from key vendors in our supply chain. Any of the foregoing could have an adverse impact on our sales and profitability.
Maintaining a good reputation is critical to our business. Reports and media coverage of ship incidents at sea or while in port, including missing guests, improper conduct by our employees, guests or agents, crimes, dissatisfied guests, crew and guest illnesses, such as incidents of stomach flu and other contagious diseases, security breaches, terrorist threats and attacks and other adverse events can result in negative publicity, which could lead to a negative perception regarding the safety of our ships and the satisfaction of our guests. In addition, negative publicity regarding adverse environmental impacts of cruising, such as climate change and oil spills, could diminish our reputation. The considerable expansion in the use of social media over recent years has increased the ways in which our reputation can be impacted, and the speed with which it can occur. Anything that damages our reputation, whether or not justified, could have an adverse impact on demand, which could lead to price reductions and a reduction in our sales and profitability.
b. | Economic conditions and adverse world events affecting the safety and security of travel, such as civil unrest, armed conflicts and terrorist attacks, may adversely impact the demand for cruises and, consequently, reduce our cruise brands’ net revenue yields and profitability. |
Demand for cruises is in part dependent on the underlying perceived or actual economic condition of the countries from which cruise companies source their guests. Adverse changes in the perceived or actual economic climate, such as global or regional recessions, higher unemployment and underemployment rates; declines in income levels; securities, real estate and other market declines and volatility; increasing taxation; higher fuel prices and healthcare costs; more restrictive credit markets; higher interest rates and changes in governmental regulations, could reduce our potential vacationers’ discretionary incomes, net worth or their consumer confidence. Consequently, this may negatively affect demand for vacations, including cruise vacations, which are a discretionary purchase. Decreases in demand could lead to price reductions which, in turn, could reduce the profitability of our business.
Demand for cruises and other vacation options has been and is expected to continue to be affected by the public’s attitude towards the safety and security of travel. Factors including, but not limited to, past acts of terrorism, threats of additional terrorist attacks, drug-related violence in Mexico, pirate attacks and vessel seizures off the east and west coasts of Africa, national government travel advisories, political instability and civil unrest in North Africa, the Middle East, the Balkans and elsewhere, geopolitical issues between China and Japan and general concerns over the safety and security aspects of traveling have had a significant adverse impact on demand and pricing in the travel and vacation industry in the past and may have an adverse impact in the future. Decreases in demand may lead to price reductions, which in turn would reduce our profitability, especially in regions with popular ports-of-call.
c. | Changes in and compliance with laws and regulations relating to environment, health, safety, security, tax and anti-corruption under which we operate could adversely impact our profitability. |
We are subject to numerous international, national, state and local laws, regulations and treaties covering many areas, including social issues, health, safety and security. Failure to comply with these laws, regulations, treaties and agreements could lead to enforcement actions, fines, civil or criminal penalties or the assertion of litigation claims and damages. These issues are, and we believe will continue to be, an area of focus by the relevant authorities throughout the world. Accordingly, new legislation, regulations or treaties, or changes thereto, could impact our operations and would likely subject us to increased compliance costs in the future. In addition, training of crew may become more time consuming and may increase our operating costs due to increasing regulatory and other requirements. Various agencies and regulatory organizations have enacted or are considering new regulations or policies, such as stricter emission limits to reduce GHG effects, which could adversely impact the cruise industry.
The IMO has amended the MARPOL regulations to reduce emissions from ships. As described in “Maritime Environmental Regulations” as referenced below, these changes will result in reductions in ship SOx emissions by requiring progressive reductions in the sulfur content in fuel or the use of abatement technologies. These limits will be further reduced in designated ECAs, including ECAs that have been or could be proposed in other significant cruising areas, such as around Japan, the Mediterranean Sea and Mexico. As a result of these amendments, we have elected to install EGCSs on certain of our ships, which enable our SOx emissions to meet the ECA requirements and the 2020 global standard without the use of low sulfur fuel,
33
in all material respects. However, if this type of technology is not widely used within the shipping industry it is possible that there could be limited availability of high sulfur fuels because of low demand and the cost of such fuel may increase. The increase in fuel prices caused by these regulations may impact our other expenses including, but not limited to, freight and commodity prices and may have an adverse impact on our profitability.
Initiatives to limit GHG emissions are being introduced around the world with more frequency. For example, numerous bills related to climate change have been introduced in the U.S. Congress, and active discussions on GHG reduction are taking place in the EU and IMO. Legislation limiting or otherwise taxing GHG emissions could adversely impact our business. While not all are likely to become law, there are indications that additional climate change related mandates could be forthcoming, and they may significantly impact our operational costs, including, among other things, increase in fuel prices, new taxes on bunker fuel and establishment of costly emissions trading schemes.
Environmental laws and regulations or liabilities arising from past or future releases of, or exposure to, hazardous substances or vessel discharges, including ballast water and waste disposal, could materially increase our cost of compliance or otherwise adversely affect our business, results of operations and financial condition. Some environmental groups have lobbied for more stringent regulation of cruise ships. Some groups have also generated negative publicity about the cruise business and its environmental impact. See Part I, Item 1. Business. C. “Our Global Cruise Business - Governmental Regulations - Maritime Regulations” for additional information regarding these regulations.
We are also subject to compliance with income tax laws and regulations and income tax treaties in the jurisdictions where we operate. We believe that substantially all of the income earned by Carnival Corporation, Carnival plc and their ship owning or operating subsidiaries qualifies for taxation based on ship tonnage, is exempt from taxation or is otherwise subject to minimal taxes in the jurisdictions where the entities are incorporated or do business.
We believe that Panama and the jurisdictions where the ship owning and operating subsidiaries of Carnival Corporation are formed are equivalent exemption jurisdictions for purposes of Section 883 of the Internal Revenue Code. The laws of Panama and the other jurisdictions where our ships are owned or operated are subject to change and, in the future, may no longer qualify as equivalent exemption jurisdictions. Moreover, changes could occur in the future with respect to the trading volume or trading frequency of Carnival Corporation shares, affecting Carnival Corporation’s status as a publicly-traded corporation for purposes of Section 883.
The IRS interpretation of Section 883 could also differ materially from ours. In addition, provisions of the Internal Revenue Code, including Section 883, are subject to legislative change at any time. Accordingly, it is possible that Carnival Corporation and its ship-owning or operating subsidiaries whose tax exemption is based on Section 883 could lose this exemption.
There is no authority that directly addresses the effect, if any, of a DLC arrangement on the availability of benefits under treaties and, accordingly, their application to our operations is not free from doubt. The applicable treaties may be revoked by either applicable country, replaced or modified with new agreements that treat income from international operation of ships differently than the agreements currently in force or may be interpreted by one of its countries differently from us.
If we did not qualify for tonnage tax, exemption, treaties or minimal taxes, or if the laws that provide for these tax systems were changed, we would have significantly higher income tax expense. In many jurisdictions, the benefit of tonnage tax or preferential tax regimes would be replaced with taxation at normal statutory rates. In the absence of Section 883 or an applicable income tax treaty in the U.S., we would be subject to the net income and branch profits tax regimes of Section 882 and Section 884 of the Internal Revenue Code. In combination, these provisions would result in the taxation of our U.S. source shipping income, net of applicable deductions, at a current federal corporate income tax rate of up to 35%, state income tax rates would vary and our net after-tax income would be potentially subject to a further branch profits tax of 30%, unless a lower treaty rate applies.
We are subject to the examination of our income tax returns by tax authorities in the jurisdictions where we operate. There can be no assurance that the outcome from these examinations will not adversely affect our net income.
As budgetary constraints continue to adversely impact the jurisdictions in which we operate, increases in income or other taxes affecting our operations may be imposed. Some social activist groups have lobbied for more taxation on income generated by cruise companies. Certain groups have also generated negative publicity for us. In recent years, certain members of the U.S. Congress have proposed various forms of legislation that would result in higher taxation on income generated by cruise companies.
34
Our global operations subject us to potential liability under anti-corruption, economic sanctions, and other laws and regulations. The Foreign Corrupt Practices Act, the UK Bribery Act and other anti-corruption laws and regulations (“Anti-Corruption Laws”) prohibit corrupt payments by our employees, vendors, or agents. While we devote substantial resources to our global compliance programs and have implemented policies, training, and internal controls designed to reduce the risk of corrupt payments, our employees, vendors, or agents may violate our policies. Our failure to comply with Anti-Corruption Laws could result in significant fines and penalties, criminal sanctions against us, our officers, or our employees, prohibitions or limitations on the conduct of our business, and damage to our reputation. Operations outside the U.S. may also be affected by changes in economic sanctions, trade protection laws, policies, and measures, and other regulatory requirements affecting trade and investment. We may be subject to legal liability and reputational damage if we improperly sell goods or in areas subject to economic sanctions such as Crimea, Iran, North Korea, Cuba, Sudan, and Syria or if we improperly engage in business transactions with persons subject to economic sanctions.
d. | Disruptions and other damages to our information technology and other networks and operations, and breaches in data security could result in decreases in our net income. |
Our ability to increase revenues and control costs, as well as our ability to serve guests most effectively depends in part on the reliability of our sophisticated technologies and system networks. We use communication applications, information technology and other systems to manage our inventory of cabins held for sale and set pricing in order to maximize our revenue yields and to optimize the effectiveness and efficiency of our shoreside and shipboard operations. Possible system outages and the resulting downtime could have adverse consequences on our ability to run and manage our business. In addition, gaining unauthorized access to digital systems and networks for purposes of misappropriating assets or sensitive financial, medical or other personal or business information, corrupting data, causing shoreside or shipboard operational disruptions and other cyber-attack risks could adversely impact our reputation, guest services and satisfaction, employee relationships, business plans, ship safety and costs. Global companies are repeatedly being targeted to gain access to critical company, guest and other information. Because the techniques and sophistication used to conduct cyber-attacks and breaches of information technology systems, as well as the sources and targets of these attacks, change frequently and are often not recognized until such attacks are launched or have been in place for a period of time, we may be unable to anticipate these techniques or implement adequate preventative measures. In addition, the operation and maintenance of our systems is in some cases dependent on third-party technologies, systems and service providers for which there is no certainty of uninterrupted availability or through which hackers could gain access to sensitive information. These potential disruptions and cyber-attacks could negatively affect our reputation, customer demand, costs, system availability and pricing for our cruises. Significant capital investments and other expenditures could be required to remedy cyber-attacks and breaches of information technology, including costs associated with additional security technologies, personnel, experts and credit monitoring services for those whose data has been breached.
In addition, as the use of the internet expands, regulators are working on addressing the risks related to these new technologies, globalization and cybersecurity with enhanced regulations. We have initiated a global program to meet the compliance requirements for the General Data Protection Regulation. For example, the European Union's General Data Protection Regulation promotes an increased level of protection of personal data and will provide for enhanced regulatory requirements supervision. If we or our vendors experience significant data security breaches or fail to detect and appropriately respond to significant data security breaches, we could be exposed to government enforcement actions and private litigation.
Our principal offices are located in Australia, Germany, Italy, the UK and the U.S. Although we have developed disaster recovery and similar business contingency plans, actual or threatened natural disasters (for example, hurricanes, earthquakes, floods, fires, tornados, tsunamis, typhoons and volcanic eruptions) or similar events in these locations may have a material impact on our business continuity, reputation and results of operations.
e. | Ability to recruit, develop and retain qualified personnel could adversely affect our results of operations. |
Our success is dependent upon our personnel and our ability to recruit and train high quality employees. We hire a significant number of new crew each year and, thus, our ability to adequately recruit, develop and retain them is critical to our cruise business. We also rely upon the ability, expertise, judgment, discretion, integrity and good faith of our senior management team. We must continue to recruit, develop, retain and motivate management and other employees to enable us to maintain our current business and support our projected growth.
We believe that incidents involving cruise ships and the related adverse media publicity, adverse economic conditions that negatively affect our profitability and overcapacity in the vacation region could also impact our ability to recruit qualified personnel.
35
f. | Increases in fuel prices may adversely affect our operations, financial condition and liquidity. |
Economic, market and political conditions around the world, such as fuel demand, regulatory requirements, supply disruptions and related infrastructure needs, make it difficult to predict the future price and availability of fuel. Future increases in the global price of fuel would increase the cost of our cruise ship operations as well as some of our other expenses, such as crew travel, freight and commodity prices. Furthermore, volatility in fuel prices could have a material adverse effect on our operations, financial condition and liquidity. We may be unable to implement additional fuel conservation initiatives, increase ticket prices or collect fuel supplements to help fully or partially offset these fuel price increases. See risks relating to environmental laws and regulations, continuing financial viability of air service providers and failures to keep pace with technology below for additional information regarding our fuel risks.
We have Brent crude oil (“Brent”) call options and Brent put options, collectively referred to as zero cost collars, that establish ceiling and floor prices. These zero cost collars are based on Brent prices whereas the actual fuel used on our ships is marine fuel. Changes in the Brent prices may not show a high degree of correlation with changes in our underlying marine fuel prices. In addition, there can be no assurance that these zero cost collars will provide a sufficient level of protection against increases in fuel prices or that our counterparties will be able to perform, such as in the case of a counterparty bankruptcy. Assuming the Brent prices remain below the floors of our zero cost collars in 2017 and 2018, realized losses on these zero cost collars will reduce the benefit we would have obtained from lower fuel prices. Also, the zero cost collar contracts may create significant volatility in our U.S. GAAP earnings due to volatility in fuel prices over the contracts’ terms.
Certain of our newbuilds entering service in 2018 and thereafter are designed to use LNG as a fuel source. At this time, there is not a spot market for LNG like there is for bunker or marine gas oil and purchasing LNG is usually made through long-term contracts. Further, the LNG distribution infrastructure is in the early stages of development and there are a limited number of suppliers. In addition, we may be subject to new regulations covering the use and storage of LNG onboard our ships and we may experience difficulties in operating and maintaining new LNG-based engine technology.
g. | Fluctuations in foreign currency exchange rates could adversely affect our financial results. |
We earn revenues, pay expenses, purchase and own assets and incur liabilities in currencies other than the U.S. dollar, resulting in translational and transactional currency risks ("currency risk").
We report currency transactions in the functional currencies of our reporting units. Because our consolidated financial statements are presented in U.S. dollars, we translate revenues and expenses, as well as assets and liabilities, into U.S. dollars at exchange rates in effect during or at the end of each reporting period, which subjects us to "foreign currency translational" risk. The strengthening of the U.S. dollar against the functional currencies of our foreign operations will adversely affect our U.S. dollar financial results.
Substantially all of our operations also have non-functional currency risk related to their international sales. In addition, we have a portion of our operating expenses denominated in non-functional currencies. Accordingly, we have "foreign currency transactional" risk related to changes in the exchange rates for our revenues and expenses that are in a currency other than the entity's functional currency. The strengthening of the functional currency against other currencies will reduce the functional currency revenues and expenses and will generally adversely affect our financial results.
h. | Misallocation of capital among our ship, joint venture and other strategic investments could adversely affect our financial results. |
We believe that having the right number and type of cruise ships for our brands is critical to our success in existing and developing regions. In the event that we build too many ships or build or refurbish ships that are not accepted by our guests, our pricing, profitability and liquidity may be negatively impacted. Furthermore, we have made and may continue to make joint venture and other strategic investments that may not develop as we expect, which could also adversely affect our profitability and liquidity.
i. | Future operating cash flow may not be sufficient to fund future obligations and we may be unable to obtain acceptable financing to enable us to continue to be a viable company. |
Our forecasted cash flows from future operations may be adversely affected by various factors, including, but not limited to, incidents, a weakening economy, adverse changes in laws and regulations, and other factors noted under these “Risk Factors.” To the extent that we are required, or choose, to fund future cash requirements, including current and future shipbuilding
36
commitments and debt repayments, from sources other than cash flow from operations, available cash and committed external sources of liquidity, including committed ship and other financings, we will have to secure such financing from export credit agencies or banks or through the offering of debt and equity securities in the public or private markets. There is no guarantee that such financings will be available in the future to fund our future obligations, or that they will be available on terms consistent with our expectations.
Our access to and the cost of financing will depend on, among other things, conditions in the global financing markets, the availability of sufficient amounts of financing and our long-term senior unsecured credit ratings. If our investment grade long-term senior unsecured credit ratings were to be downgraded or assigned a negative outlook, or general market conditions ascribe higher risk to our rating levels, our industry, or us, our access to and cost of debt financing may be negatively impacted. Further, the terms of future debt agreements could include more restrictive covenants, or require that our debt be secured by our ship assets, which may restrict our business operations.
Our ability to maintain our credit facilities may also be impacted by material changes in our ownership. More specifically, we may be required to prepay our debt facilities if a person or group of persons acting in concert gain control of Carnival Corporation & plc, other than the Arison family, including Micky Arison, our Chairman of the Boards of Directors.
j. | Overcapacity in the cruise ship and land-based vacation industry could have a negative impact on our net revenue yields and increase operating costs. |
Although cruising capacity in most of the established regions has grown at a slower pace in recent years, we expect it to continue to increase in both the established and emerging regions. Since the cruise industry relies on long-lived ships, we face the risk that our industry’s capacity will grow beyond its demand. The wider vacation industry may also face increases in land-based vacation capacity, which may impact us as well. We typically aim to fill our new capacity at favorable revenue yields despite the new competing cruise and land-based capacity growth. Also, to the extent that we or our competitors deploy ships to a particular itinerary and the resulting capacity in that region exceeds the demand, we may lower pricing and profitability may be lower than initially anticipated. Furthermore, the used cruise ship market is small and as new cruise ships enter the industry, older ships become less competitive. Accordingly, if we need to dispose of a ship, we cannot be assured of finding a viable buyer to purchase it at a price that meets our expectations, which could result in ship impairment charges and losses on ship disposals.
Should net revenue yields be negatively impacted, our results of operations and financial condition could be adversely affected. In addition, increased cruise capacity could impact our ability to recruit, develop and retain qualified crew, including officers, at competitive rates and, therefore, increase our shipboard employee costs.
k. | Deterioration of our cruise brands' strengths and our inability to implement our strategies could adversely impact our business and profitability. |
If we are not successful in implementing our strategies and exceeding guests' expectations, our results of operations and financial condition could be adversely affected. We believe that our cruise branding has contributed significantly to the success of our business and enhancing and maintaining our branding is critical to expanding our brands’ customer bases. The ability of our brands to successfully target different segments of the vacation source areas in which they operate enables us to strengthen our business.
We believe that our ability to effectively use our scale and extend best practices and technologies across our brands is critical for implementing our strategic initiatives, such as maximizing our revenue management processes, improving our overall fleet management and optimizing our cost structure and, therefore, achieving our vision and reaching our primary financial goals.
l. | Continuing financial viability of our travel agent distribution system, air service providers and other key vendors in our supply chain is essential to allowing us to profitably operate our business. In addition, reductions in the availability of, and increases in the prices for, the services and products provided by these vendors can adversely impact our net income. |
Our guests primarily book their cruises through independent travel agents and tour operators. These parties generally sell and market our cruises on a nonexclusive basis. Our competitors may offer higher commissions and incentives and thus adversely impact our business. Significant disruptions, contractions or consolidations to our travel agent distribution system, such as those caused by a reduction in travel and related commission income as a result of an economic slowdown could have an adverse effect on our sales and profitability. In addition, we currently extend credit to and/or enter into large group contracts
37
with some of our European travel agents and tour operators and Chinese travel distributors and, accordingly, if such agents and operators cannot repay their debts to us, it will adversely impact our cash flows and operations.
Many of our guests and substantially all our crew depend on scheduled or chartered commercial airline services to transport them to or from the airports near the ports where our cruises embark and disembark. Changes or disruptions in commercial or chartered airline services as a result of strikes, labor unrest, financial instability or viability, adverse weather conditions, airport delays, consolidation of carriers, or other events or the lack of availability due to schedule changes or a high level of airline bookings could adversely affect our ability to deliver guests and crew to or from our cruise ships and increase our costs which would, in turn, have an adverse effect on our results of operations. In addition, increases in the prices of airfares due to, among other things, rising fuel prices and airline consolidations would increase the overall vacation price to our guests and may adversely affect demand for our cruises, as well as increase our airfare for our crew.
Travel agents may face increased pressure from our competitors to sell and market these competitor cruises exclusively. If such exclusive arrangements were introduced, there can be no assurance that we will be able to find alternative distribution channels to ensure our customer base would not be affected.
Economic downturns may impact the financial viability of other key vendors in our supply chain and the interruption in the services or goods we purchase from them could adversely impact our operations and profitability.
m. | Inability to implement our shipbuilding programs and ship repairs, maintenance and refurbishments on terms that are favorable or consistent with our expectations could reduce our profitability. In addition, we expect increases to our repairs and maintenance expenses and refurbishment costs as our fleet ages. |
The construction, repair, maintenance and refurbishment of cruise ships are complex processes and involve risks similar to those encountered in other large and sophisticated construction, repair, maintenance and refurbishment projects. We could experience delays and cost overruns in completing such work. As our fleet ages, our repair and maintenance expenses will increase. In addition, other events, such as work stoppages, other labor actions, insolvencies, “force majeure” events or other financial difficulties experienced at the shipyards and their subcontractors and suppliers who build, repair, maintain or refurbish our ships could also delay or prevent the delivery of our ships under construction and prevent or delay the completion of the refurbishment, repair and maintenance of existing ships in our fleet. These events could adversely affect our profitability, including delays or cancellations of cruises or unscheduled dry-docks and repairs. In addition, the consolidation of the control of certain cruise shipyards or cruise shipyard voluntary capacity reductions or insolvencies could result in less shipyard availability thus reducing competition and increasing prices. Furthermore, the lack of qualified shipyard repair facilities could result in the inability to repair and maintain our ships on a timely basis, which could also result in reduced profitability.
As of January 19, 2017, we had entered into foreign currency zero cost collars for four of our euro-denominated shipbuilding contracts. However, if the shipyard with which we have contracted is unable to perform under the related contracts, the foreign currency zero cost collars related to the shipyard’s shipbuilding contract payments would still have to be honored. This might require us to realize a loss on existing foreign currency zero cost collars without an offsetting gain on our foreign currency denominated shipbuilding contract payments, thus resulting in an adverse effect on our financial results.
The cost of shipbuilding orders that we may place in the future that is denominated in a different currency than our cruise brands’ or the shipyards’ functional currency is expected to be affected by foreign currency exchange rate fluctuations. These foreign currency exchange rate fluctuations may affect our decisions to order new cruise ships. In addition, the prices of various commodities that are used in the construction of ships, such as steel, can be subject to volatile price changes and, accordingly, the cost of future newbuilds may increase, which could have an adverse impact on our profitability.
In connection with our shipbuilding contracts, we do not anticipate any contractual breakage or cancellations on our part. However, if any were to occur, it could result in, among other things, the forfeiture of our payments and the imposition of contractual liquidated damages.
n. | Failure to keep pace with developments in technology could impair our operations or competitive position. |
Our business continues to demand the use of sophisticated systems and technology. These systems and technologies may require refinement, updating and replacement with more advanced systems. If we are unable to do so on a timely basis or within reasonable cost parameters, our business could suffer. We also may not achieve the benefits that we anticipate from any new system or technology, and a failure to do so could result in materially higher than anticipated costs and could materially impair our operating results.
38
o. | Geographic regions in which we try to expand our business may be slow to develop and ultimately not develop how we expect and our international operations are subject to additional risks not generally applicable to our U.S. operations, thus resulting in the slower growth, increased costs and adversely affecting our profitability. |
As we continue to expand our global presence, it requires, among other things, significant levels of management resources, capital and other investments. For example, we may be required to localize our cruise products and services to conform to local cultures, standards, policies and regulations. As a result, it may be more difficult for us to replicate our successful North American, European and Australian business models and we may not be able to recover our investments in these markets. In addition, we cannot be certain that these markets will ultimately develop as we expect, which could also adversely impact the growth and profitability of our business.
Furthermore, our international operations are subject to additional risks including adverse changes in foreign countries’ political systems, social unrest, restrictions and taxes on the withdrawal of foreign investments and earnings and other payments by subsidiaries, adverse changes in foreign currency exchange restrictions, government policies against the vacation or maritime industries, limitations on issuing international travel visas, local cabotage requirements, investment restrictions or requirements, changes in or application of our foreign taxation structures, including duties and value added taxes, diminished ability to legally enforce our intellectual property and contractual rights in foreign countries and commercial instability caused by corruption.
p. | Competition from the cruise ship and land-based vacation industry could result in a loss of business and adversely affect our operations and financial condition. |
We face significant competition from other cruise brands on the basis of cruise pricing, travel agent preference and the types and sizes of ships and cabins, services and destinations being offered by them to cruise guests. In addition, new cruise competitors with existing brand appeal may choose to enter the cruise industry or there may be other new cruise competitors that may choose to enter the established or emerging regions. We try to differentiate ourselves from our cruise competitors by offering a wide variety of brands, itineraries, products and services to our guests, but the acceptance of each offering is not certain and consumers’ preferences are always subject to change. It is possible that our programs to motivate previous guests to cruise with us again may not be successful and they may elect not to cruise with us again.
In addition, we operate in the wider vacation industry and cruising is only one of many alternatives for people choosing a vacation. We therefore risk losing business not only to other cruise lines, but also to land-based vacation operators. In the event that we do not compete effectively with other cruise companies and other vacation alternatives, our results of operations and financial condition could be adversely affected.
q. | Economic, market and political factors that are beyond our control, which could increase our operating, financing and other costs and could harm sales and profitability. |
Some of our operating costs including, but not limited to, food, payroll, port costs, repairs and maintenance, security and other commodity-based items are subject to increases because of market forces, economic or political instability or other circumstances beyond our control. In addition, interest rates, currency exchange rate fluctuations and our ability to obtain debt or equity financing are dependent on many economic, market and political factors. Increases in operating or financing costs could adversely affect our results because we may not be able to recover these increased costs through price increases charged to our guests and such increases may adversely impact our liquidity and credit ratings.
It is possible that jurisdictions or ports-of-call that we regularly visit may also decide to assess new, or change existing, taxes, fees and other charges specifically targeted to the cruise industry, its employees and guests, including, but not limited to, value added taxes on cruise tickets and onboard revenues, which could increase our operating costs and could decrease the demand for cruises and ultimately decrease our net revenue yields and net income.
r. | Litigation, enforcement actions, fines or penalties could adversely impact our financial condition or results of operations and damage our reputation. |
Our business is subject to various international laws and regulations that could lead to enforcement actions, fines, civil or criminal penalties or the assertion of litigation claims and damages. In addition, improper conduct by our employees or agents could damage our reputation and lead to litigation or legal proceedings that could result in significant awards or settlements to plaintiffs and civil or criminal penalties, including substantial monetary fines. Such events could lead to an adverse impact on our financial condition or results of operations, even if the monetary damage is mitigated by our insurance coverage.
39
As a result of our ship or other incidents, litigation claims, enforcement actions and regulatory actions and investigations, including, but not limited to, those arising from personal injury, loss of life, loss of or damage to personal property, business interruption losses or environmental damage to any affected coastal waters and the surrounding areas, may be asserted or brought against various parties including us. The time and attention of our management may also be diverted in defending such claims, actions and investigations. We may also incur costs both in defending against any claims, actions and investigations and for any judgments, fines, civil or criminal penalties if such claims, actions or investigations are adversely determined and not covered by our insurance policies.
s. | Lack of continuing availability of attractive, convenient and safe port destinations on terms that are favorable or consistent with our expectations could adversely affect our net revenue yields and net income. |
We believe that attractive, convenient and safe port destinations, including ports that are not overly congested with tourists, are major reasons why our guests choose a cruise versus an alternative vacation option. The continuing availability of these types of ports on terms that are favorable or consistent with our expectations, including the port facilities where our guests embark and disembark, is affected by a number of factors including, but not limited to, existing capacity constraints (particularly during the Caribbean winter months and Mediterranean summer months), security, safety and environmental concerns, adverse weather conditions and other natural disasters, financial and other limitations on port development in established or emerging markets, political instability, exclusivity arrangements that ports may have with our competitors, port operator consolidation, local governmental regulations and local community concerns about both port development and other adverse impacts on their communities from additional tourists. The inability to continue to utilize, maintain, rebuild, if necessary, and increase the number of ports that our ships call on could adversely affect our net revenue yields and net income.
t. | Union disputes and other employee relationship issues could adversely affect our financial results. |
A large number of our employees are represented by labor unions in a number of countries under various collective bargaining agreements with varying durations and expiration dates. We may not be able to satisfactorily renegotiate these collective bargaining agreements when they expire. In addition, existing collective bargaining agreements may not prevent a strike or work stoppage on our ships. We may also be subject to or affected by work stoppages unrelated to our business or collective bargaining agreements. Any such work stoppages or potential work stoppages could have a material adverse effect on our financial results.
u. | Decisions to self-insure against various risks or the inability to obtain insurance for certain risks at reasonable rates could result in higher expenses or lower revenues. |
We seek to maintain comprehensive insurance coverage at commercially reasonable rates. We believe that our current coverage is adequate to protect us against most of the significant risks involved in the conduct of our business, although we do elect to self-insure or use substantial deductibles for the insurable risks we face in order to minimize the cost of our insurance policies. Accordingly, we are not protected against all risks, such as loss of use of a ship or a cyber-security breach, both of which could result in an unexpected decrease in our revenue in the event of an incident. Further, significant incidents could result in higher insurance premiums commencing on the policy renewal dates or the inability to obtain coverage.
We may also be subject to additional premium costs based not only on our own claims record but also on the claims records of all other members of the P&I associations that provide us with indemnity coverage for third-party liability. We are also subject to additional P&I premium assessments for various reasons including, but not limited to, investment or underwriting shortfalls experienced by our P&I clubs. In addition, if we or other ship-owners sustain significant losses, our ability to obtain future insurance coverage at commercially reasonable rates could be materially adversely affected.
Finally, we cannot be certain that affordable and viable direct insurance and reinsurance markets will be available to us in the future.
v. | Reliance on third-party providers of various services integral to the operations of our business. These third parties may act in ways that could harm our business. |
In order to achieve cost and operational efficiencies, we outsource to third-party vendors certain services that are integral to the operations of our global business, such as our onboard concessionaires. We are subject to the risk that certain decisions are subject to the control of our third-party service providers and that these decisions may adversely affect our activities. A failure to adequately monitor a third-party service provider’s compliance with a service level agreement or regulatory or legal
40
requirements could result in significant economic and reputational harm to us. There is also a risk the confidentiality, privacy and/or security of data held by third parties or communicated over third-party networks or platforms could become compromised.
w. | Business activities that involve our co-investment with third parties may subject us to additional risks that could adversely impact our operations. |
Partnerships, joint ventures and other business structures involving our co-investment with third parties generally include some form of shared control over the operations of the business and create additional risks, including the possibility that other investors in such ventures could become bankrupt or otherwise lack the financial resources to meet their obligations, or could have or develop business interests, policies or objectives that are inconsistent with ours. In addition, actions by another investor may present additional risks of operational difficulties or reputational or legal concerns. These or other issues related to our co-investment with third parties could adversely impact our operations.
x. | Disruptions in the global financial markets or other events may negatively affect the ability of our counterparties and others to perform their obligations to us and thus, adversely affect our financial position and results of operations. |
The ability of our counterparties to perform, primarily with respect to our cash and cash equivalents, investments, committed financing facilities, contingent obligations, derivative instruments, insurance contracts, new ship progress payment guarantees and ship charter agreements may adversely impact us if any of their financial positions weaken materially or they suffer other financial disruptions.
For example, the last severe economic downturn, including failures of banks and financial service companies and the related liquidity crisis, disrupted the capital and credit markets. Additional economic concerns from some countries continue to strain the financial markets both in the U.S. and internationally. A recurrence of these or other disruptions could cause our counterparties and others to breach their obligations to us under our contracts with them, which may have a negative impact on our cash flows, including our ability to meet our obligations, results of operations and financial condition.
y. | Our shareholders may be subject to the uncertainties of a foreign legal system in protecting their interests since Carnival Corporation and Carnival plc are not U.S. corporations. |
Carnival Corporation’s corporate affairs are governed by its Third Amended and Restated Articles of Incorporation (“Articles”) and Third Amended and Restated By-Laws (“By-Laws”) and by the laws of Panama. Carnival plc is governed by its Articles of Association and by the laws of England and Wales. The contracts that control the relationship between Carnival Corporation and Carnival plc under the DLC arrangement are governed by the laws of Panama, the Isle of Man and the Cayman Islands. The laws of Panama, England and Wales, the Isle of Man and the Cayman Islands may differ in some respects from the laws in the U.S. Thus, our public shareholders may have more difficulty in protecting their interest with respect to actions by management, directors and controlling shareholders than would otherwise be the case for a U.S. shareholder in a U.S. Corporation or a UK shareholder in a UK Corporation.
z. | Small group of shareholders owns a significant portion of the total combined voting power of our outstanding shares and may be able to effectively control the outcome of shareholder voting. |
As of January 19, 2017, a small group of shareholders consisting of some members of the Arison family, including Micky Arison, the Chairman of the Board of Directors, beneficially owned approximately 18% of the total combined voting power of Carnival Corporation & plc. Depending upon the nature and extent of the shareholder vote, this group of shareholders may have the power to effectively control, or at least significantly influence, the outcome of certain shareholder votes and, therefore, the corporate actions requiring such votes.
aa. | Provisions in Carnival Corporation’s and Carnival plc’s constitutional documents may prevent or discourage takeovers and business combinations that our shareholders might consider to be in their best interests. |
Carnival Corporation’s Articles and By-Laws and Carnival plc’s Articles of Association contain provisions that may delay, defer, prevent or render more difficult a takeover attempt that our shareholders consider to be in their best interests. As a result, these provisions may prevent our shareholders from receiving a premium to the market price of our shares offered by a bidder in a takeover context. Even in the absence of a takeover attempt, the existence of these provisions may adversely affect the prevailing market price of our shares if they are viewed as discouraging takeover attempts in the future.
41
Specifically, Carnival Corporation’s Articles contain provisions that prevent third parties, other than the Arison family and trusts established for their benefit, from acquiring beneficial ownership of more than 4.9% of outstanding Carnival Corporation shares without the consent of its Board of Directors and provide for the lapse of rights, and sale, of any shares acquired in excess of that limit. The effect of these provisions may preclude third parties from seeking to acquire a controlling interest in us in transactions that shareholders might consider to be in their best interests and may prevent them from receiving a premium above market price for their shares.
ab. | The DLC arrangement involves risks not associated with the more common ways of combining the operations of two companies and these risks may have an adverse effect on the economic performance of the companies and their respective share prices. |
The DLC arrangement is a relatively uncommon way of combining the management and operations of two companies and it involves different issues and risks from those associated with the other more common ways of forming a business combination, such as a merger or exchange offer to create a wholly-owned subsidiary. In our DLC arrangement, the combination is effected primarily by means of contracts between Carnival Corporation and Carnival plc and not by operation of a statute or court order. The legal effect of these contractual rights may be different from the legal effect of a merger or amalgamation under statute or court order, and there may be difficulties in enforcing these contractual rights. Shareholders and creditors of either company might challenge the validity of the contracts or their lack of standing to enforce rights under these contracts, and courts may interpret or enforce these contracts in a manner inconsistent with the express provisions and intentions we included in such contracts. In addition, shareholders and creditors of other companies might successfully challenge other DLC arrangements and establish legal precedents that could increase the risk of a successful challenge to our DLC arrangement.
Cautionary Note Concerning Factors That May Affect Future Results
Some of the statements, estimates or projections contained in this Form 10-K are “forward-looking statements” that involve risks, uncertainties and assumptions with respect to us, including some statements concerning future results, outlooks, plans, goals and other events which have not yet occurred. These statements are intended to qualify for the safe harbors from liability provided by Section 27A of the Securities Act of 1933 and Section 21E of the Securities Exchange Act of 1934. All statements other than statements of historical facts are statements that could be deemed forward-looking. These statements are based on current expectations, estimates, forecasts and projections about our business and the industry in which we operate and the beliefs and assumptions of our management. We have tried, whenever possible, to identify these statements by using words like “will,” “may,” “could,” “should,” “would,” “believe,” “depends,” “expect,” “goal,” “anticipate,” “forecast,” “project,” “future,” “intend,” “plan,” “estimate,” “target,” “indicate” and similar expressions of future intent or the negative of such terms.
Forward-looking statements include those statements that may impact our outlook including, but not limited to, the forecasting of our:
• Net revenue yields | • Net cruise costs, excluding fuel per available lower berth day |
• Booking levels | • Estimates of ship depreciable lives and residual values |
• Pricing and occupancy | • Goodwill, ship and trademark fair values |
• Interest, tax and fuel expenses | • Liquidity |
• Currency exchange rates | • Adjusted earnings per share |
Certain of the risks we are exposed to are identified in this Item 1A. “Risk Factors.” This item contains important cautionary statements and a discussion of the known factors that we consider could materially affect the accuracy of our forward-looking statements and adversely affect our business, results of operations and financial position. It is not possible to predict or identify all such risks. There may be additional risks that we consider immaterial or which are unknown.
Forward-looking statements should not be relied upon as a prediction of actual results. Subject to any continuing obligations under applicable law or any relevant stock exchange rules, we expressly disclaim any obligation to disseminate, after the date of this Form 10-K, any updates or revisions to any such forward-looking statements to reflect any change in expectations or events, conditions or circumstances on which any such statements are based.
Item 1B. Unresolved Staff Comments.
None.
42
Item 2. Properties.
As of January 19, 2017, the Carnival Corporation and Carnival plc headquarters and our larger shoreside locations are as follows:
Location | Square Footage | Own/Lease | Operations | |||
Miami, FL U.S.A. | 463,000/62,000 | Own/Lease | Carnival Corporation and Carnival Cruise Line | |||
Genoa, Italy | 246,000/66,000 | Own/Lease | Costa Group (a) | |||
Santa Clarita, CA U.S.A. | 311,000 | Lease | Holland America Group (b) | |||
Almere, Netherlands | 253,000/22,000 | Own/Lease | Arison Maritime Center | |||
Rostock, Germany | 224,000 | Own | Costa Group (a) | |||
Seattle, WA U.S.A. | 175,000 | Lease | Holland America Group (b) | |||
Southampton, England | 150,000 | Lease | Carnival plc and Carnival UK (c) | |||
Hamburg, Germany | 137,000 | Lease | Costa Group (b) | |||
Sydney, NSW Australia | 58,000 | Lease | P&O Cruises (Australia) | |||
(a) | Costa Group includes AIDA and Costa |
(b) | Holland America Group includes Holland America Line, Princess, Seabourn and Holland America Princess Alaska Tours |
(c) | Carnival UK includes P&O Cruises (UK) and Cunard |
Information about our cruise ships, including the number each of our cruise brands operate, as well as information regarding our cruise ships under construction may be found under Part I. Item 1. Business. C. “Our Global Cruise Business.” In addition, we own, lease or have controlling interests in port destinations and private islands.
Our cruise ships in operation, headquarters, port destinations and private islands and other shoreside facilities are all well maintained and in good condition. We evaluate our needs periodically and obtain additional facilities when deemed necessary. We believe that our facilities are adequate for our current needs.
Item 3. Legal Proceedings.
As previously disclosed, in 2013 the U.S. Department of Justice and the UK Maritime & Coast Guard Agency commenced an investigation of allegations that Caribbean Princess breached international pollution laws. On December 1, 2016, Princess entered into a plea agreement with the U.S. Department of Justice with respect to violations of federal laws by the Caribbean Princess. As part of the plea agreement, which is under review by the United States District Court for the Southern District of Florida, Princess will pay a $40 million penalty, plead guilty to charges related to illegal discharges of oily bilge water, and Princess and Carnival Corporation will adopt a five-year court-supervised environmental compliance program. The plea agreement also will resolve any enforcement issues with the UK Maritime & Coast Guard Agency.
As previously disclosed, in 2014 the Egyptian Environmental Affairs Agency began an investigation into allegations that the Costa neoClassica breached Egyptian environmental laws. The Safaga (Egypt) Court of Misdemeanors issued a ruling quantifying the alleged damages caused to the environment in an amount not material to our consolidated financial statements.
As previously disclosed, in 2015, the Alaska Department of Environmental Conservation issued Notices of Violations to all of the major cruise lines who had operated in the state of Alaska, including Carnival Cruise Line, Holland America Line and Princess Cruises, for alleged violations of the Alaska Marine Vessel Visible Emission Standards that occurred over the last several years. We are cooperating with the state of Alaska and conducting our own internal investigation into these matters. However, we do not believe the ultimate outcome will have a significant impact on our results of operations. On August 6, 2016, Carnival Cruise Line entered into a Settlement Agreement with the Alaska Department of Environmental Conservation to pay an amount not material to our consolidated financial statements as settlement of all claims related to Carnival Cruise Line.
43
Item 4. Mine Safety Disclosures.
None.
Executive Officers of the Registrants
The table below sets forth the name, age, years of service and title of each of our executive officers. Titles listed relate to positions within Carnival Corporation and Carnival plc unless otherwise noted.
Age | Years of Service (a) | Title | |||
Micky Arison | 67 | 45 | Chairman of the Boards of Directors | ||
David Bernstein | 59 | 18 | Chief Financial Officer and Chief Accounting Officer | ||
Alan B. Buckelew | 68 | 39 | Chief Information Officer | ||
Arnold W. Donald | 62 | 16 | President and Chief Executive Officer and Director | ||
Stein Kruse | 58 | 17 | Chief Executive Officer of Holland America Group | ||
David Noyes | 54 | 5 | Chief Executive Officer of Carnival UK | ||
Arnaldo Perez | 56 | 24 | General Counsel and Secretary | ||
Michael Thamm | 53 | 23 | Group Chief Executive Officer of Costa Group and Carnival Asia | ||
(a) | Years of service with us or Carnival plc predecessor companies. |
Business Experience of Executive Officers
Micky Arison has been Chairman of the Boards of Directors since 1990 and a Director since 1987. He was Chief Executive Officer from 1979 to 2013.
David Bernstein has been Chief Financial Officer since 2007 and Chief Accounting Officer since 2016. From 2003 to 2007, he was Treasurer. From 1998 to 2003, he was Chief Financial Officer of Cunard and Seabourn.
Alan B. Buckelew has been Chief Information Officer since December 2016. From 2013 to December 2016, he was Chief Operations Officer. From 2007 to 2013, he was Chief Executive Officer of Princess. He was President of Princess from 2004 to 2013. From 2004 to 2007, he was also Chief Operating Officer of Cunard.
Arnold W. Donald has been President and Chief Executive Officer since 2013. He has been a Director since 2001. He is also a Principal of AWDPLC LLC, a private investment company. From 2010 to 2012, he was President and Chief Executive Officer of The Executive Leadership Counsel, a professional network of African-American executives of major U.S. companies.
Stein Kruse has been the Chief Executive Officer of Holland America Group since 2013. In this capacity, he is responsible for Holland America Line, Princess, Seabourn and Holland America Princess Alaska Tours. From 2004 to 2013, he was President and Chief Executive Officer of Holland America Line.
David Noyes has been Chief Executive Officer of Carnival UK since October 2014. In this capacity, he is responsible for P&O Cruises (UK) and Cunard. From 2011 to September 2014, he was Executive Vice President of Operations for Carnival UK.
Arnaldo Perez has been General Counsel and Secretary since 1995.
Michael Thamm has been Group Chief Executive Officer of Costa Group since 2012 and of Carnival Asia since December 2016. In this capacity, he is responsible for Costa and AIDA and management oversight of all Asia operations. From 2004 to 2012, he was President of AIDA.
44
PART II
Item 5. Market for Registrants’ Common Equity, Related Stockholder Matters and Issuer Purchases of Equity Securities.
A. Market Information
The information required by Item 201(a) of Regulation S-K, Market Information, is shown in Exhibit 13 and is incorporated by reference into this Form 10-K.
B. Holders
The information required by Item 201(b) of Regulation S-K, Holders, is shown in Exhibit 13 and is incorporated by reference into this Form 10-K.
C. Dividends
Carnival Corporation and Carnival plc declared quarterly cash dividends on all of their common stock and ordinary shares as follows:
Quarters Ended | |||||||
February 29/28 | May 31 | August 31 | November 30 | ||||
2016 | $0.30 | $0.35 | $0.35 | $0.35 | |||
2015 | $0.25 | $0.25 | $0.30 | $0.30 | |||
2014 | $0.25 | $0.25 | $0.25 | $0.25 | |||
All dividends for both Carnival Corporation and Carnival plc are declared in U.S. dollars. If declared, holders of Carnival Corporation common stock and Carnival plc American Depository Shares receive a dividend payable in U.S. dollars. The dividends payable for Carnival plc ordinary shares are payable in sterling, unless the shareholders elect to receive the dividends in U.S. dollars. Dividends payable in sterling will be converted from U.S. dollars into sterling at the U.S. dollar to sterling exchange rate quoted by the Bank of England in London at 12:00 p.m. on the next combined U.S. and UK business day that follows the quarter end.
The payment and amount of any future dividend is within the discretion of the Boards of Directors. Our dividends were and will be based on a number of factors, including our earnings, liquidity position, financial condition, tone of business, capital requirements, credit ratings and the availability and cost of obtaining new debt. We cannot be certain that Carnival Corporation and Carnival plc will continue their dividend in the future, and if so, the amount and timing of such future dividends are not determinable and may be different than the levels and have a different timing than are disclosed above.
D. Securities Authorized for Issuance under Equity Compensation Plans
The information required by Item 201(d) of Regulation S-K is incorporated by reference to Part III. Item 12 of this Form 10-K.
E. Performance Graph
The information required by Item 201(e) of Regulation S-K, Performance Graph, is shown in Exhibit 13 and is incorporated by reference into this Form 10-K.
F. Issuer Purchases of Equity Securities; Use of Proceeds from Registered Securities
I. Repurchase Authorizations
Our Boards of Directors have authorized, subject to certain restrictions, the repurchase of up to an aggregate of $1.0 billion of Carnival Corporation common stock and/or Carnival plc ordinary shares (the “Repurchase Program”). On January 28, 2016 and on June 27, 2016, the Boards of Directors approved modifications of the Repurchase Program authorization that increased the remaining authorized repurchases at the time of each approval by $1.0 billion. The Repurchase Program does not have an expiration date and may be discontinued by our Boards of Directors at any time.
45
During the three months ended November 30, 2016, purchases of Carnival Corporation common stock pursuant to the Repurchase Program were as follows:
Period | Total Number of Shares of Carnival Corporation Common Stock Purchased (a) | Average Price Paid per Share of Carnival Corporation Common Stock | Maximum Dollar Value of Shares That May Yet Be Purchased Under the Repurchase Program (b) | ||||
(in millions) | (in millions) | ||||||
September 1, 2016 through September 30, 2016 | 2.5 | $45.94 | $514 | ||||
October 1, 2016 through October 31, 2016 | 1.7 | $47.06 | $432 | ||||
November 1, 2016 through November 30, 2016 | — | — | $399 | ||||
Total | 4.2 | $46.39 | |||||
(a) No shares of Carnival Corporation common stock were purchased outside of publicly announced plans or programs.
(b) During the fourth quarter of 2016, we repurchased 0.7 million ordinary shares of Carnival plc at an average price of $48.87 under the Repurchase Program. Carnival plc ordinary shares are listed on the London Stock Exchange.
During 2016 and 2015, our repurchases under the Repurchase Program were as follows (in millions):
Carnival Corporation | Carnival plc | |||||||||
Total Number of Shares Repurchased | Dollar Amount Paid for Shares Repurchased | Total Number of Shares Repurchased | Dollar Amount Paid for Shares Repurchased | |||||||
2016 | 47.8 | $2,264 | 0.7 | $35 | ||||||
2015 | 5.3 | $276 | — | — | ||||||
From December 1, 2016 through January 19, 2017, we repurchased 0.2 million shares of Carnival plc ordinary shares for approximately $10 million under the Repurchase Program. At January 19, 2017, the remaining availability under the Repurchase Program was $389 million.
In addition to the Repurchase Program, the Boards of Directors authorized, in January 2017, the repurchase of up to 22.0 million Carnival plc ordinary shares and, in February 2016, the repurchase of up to 26.9 million shares of Carnival Corporation common stock under the Stock Swap programs described below. At January 19, 2017, the remaining availability under the Stock Swap programs was 22.0 million Carnival plc ordinary shares and 26.0 million shares of Carnival Corporation common stock.
Carnival plc ordinary share repurchases under both the Repurchase Program and the Stock Swap programs require annual shareholder approval. The existing shareholder approval is limited to a maximum of 21.5 million ordinary shares and is valid until the earlier of the conclusion of the Carnival plc 2017 annual general meeting or July 13, 2017. At January 19, 2017, the remaining Carnival plc availability under the Repurchase Program was 20.6 million ordinary shares.
II. Stock Swap Programs
We use the Stock Swap programs in situations where we can obtain an economic benefit because either Carnival Corporation common stock or Carnival plc ordinary shares are trading at a price that is at a premium or discount to the price of Carnival plc ordinary shares or Carnival Corporation common stock, as the case may be. Any realized economic benefit under the Stock Swap programs is used for general corporate purposes, which could include repurchasing additional stock under the Repurchase Program.
In the event Carnival Corporation common stock trades at a premium to Carnival plc ordinary shares, we may elect to issue and sell shares of Carnival Corporation common stock through a sales agent, from time to time at prevailing market prices in ordinary brokers’ transactions, and use the sale proceeds to repurchase Carnival plc ordinary shares in the UK market on at least an equivalent basis. Based on an authorization provided by the Board of Directors in January 2017, Carnival Corporation was authorized to issue and sell up to 22.0 million shares of its common stock in the U.S. market and had 22.0 million shares remaining at January 19, 2017. Any sales of Carnival Corporation shares have been or will be registered under the Securities Act.
In the event Carnival Corporation common stock trades at a discount to Carnival plc ordinary shares, we may elect to sell existing ordinary shares of Carnival plc, with such sales made by Carnival Corporation or Carnival Investments Limited
46
through its sales agent from time to time at prevailing market prices in ordinary brokers’ transactions, and use the sale proceeds to repurchase shares of Carnival Corporation common stock in the U.S. market on at least an equivalent basis. Based on an authorization provided by the Board of Directors in February 2016, Carnival Corporation or Carnival Investments Limited was authorized to sell up to 26.9 million Carnival plc ordinary shares in the UK market and had 26.0 million shares remaining at January 19, 2017. Any sales of Carnival plc ordinary shares have been or will be registered under the Securities Act.
During 2016 and 2015 respectively, under the Stock Swap programs, Carnival Investments Limited sold 0.9 million and 5.1 million Carnival plc ordinary shares through its sales agents, Merrill Lynch International ("MLI") in 2016 and Goldman Sachs International ("Goldman") in 2015, for total gross proceeds of $40 million and $266 million and paid commission fees to MLI and Goldman of $260 thousand and $1.9 million and other governmental and regulatory transaction fees of $46 thousand and $0.4 million resulting in total net proceeds of $40 million and $264 million. Substantially all of the net proceeds from these sales were used to purchase 0.9 million shares in 2016 and 5.1 million shares in 2015 of Carnival Corporation common stock. During 2016, no Carnival Corporation common stock was sold or Carnival plc ordinary shares were repurchased under the “Stock Swap” program. During the three months ended November 30, 2016, there were no repurchases of Carnival Corporation Common Stock pursuant to the Stock Swap program.
Item 6. Selected Financial Data.
The information required by Item 6. Selected Financial Data, is shown in Exhibit 13 and is incorporated by reference into this Form 10-K.
Item 7. Management’s Discussion and Analysis of Financial Condition and Results of Operations.
The information required by Item 7. Management’s Discussion and Analysis of Financial Condition and Results of Operations, is shown in Exhibit 13 and is incorporated by reference into this Form 10-K.
Item 7A. Quantitative and Qualitative Disclosures About Market Risk.
The information required by Item 7A. Quantitative and Qualitative Disclosures About Market Risk, is shown in Management’s Discussion and Analysis of Financial Condition and Results of Operations in Exhibit 13 and is incorporated by reference into this Form 10-K.
Item 8. Financial Statements and Supplementary Data.
The financial statements, together with the report thereon of PricewaterhouseCoopers LLP, dated January 30, 2017, and the Selected Quarterly Financial Data (Unaudited) are shown in Exhibit 13 and are incorporated by reference into this Form 10-K.
Item 9. Changes in and Disagreements with Accountants on Accounting and Financial Disclosure.
None.
Item 9A. Controls and Procedures.
A. Evaluation of Disclosure Controls and Procedures
Disclosure controls and procedures are designed to provide reasonable assurance that information required to be disclosed by us in the reports that we file or submit under the Securities Exchange Act of 1934, is recorded, processed, summarized and reported, within the time periods specified in the U.S. Securities and Exchange Commission’s rules and forms. Disclosure controls and procedures include, without limitation, controls and procedures designed to ensure that information required to be disclosed by us in our reports that we file or submit under the Securities Exchange Act of 1934 is accumulated and communicated to our management, including our principal executive and principal financial officers, or persons performing similar functions, as appropriate, to allow timely decisions regarding required disclosure.
Our President and Chief Executive Officer and our Chief Financial Officer and Chief Accounting Officer have evaluated our disclosure controls and procedures and have concluded, as of November 30, 2016, that they are effective as described above.
B. Management’s Annual Report on Internal Control over Financial Reporting
47
Our management is responsible for establishing and maintaining adequate internal control over financial reporting, as such term is defined in the Securities Exchange Act of 1934 Rule 13a-15(f). Under the supervision and with the participation of our management, including our President and Chief Executive Officer and our Chief Financial Officer and Chief Accounting Officer, we conducted an evaluation of the effectiveness of our internal control over financial reporting based on the 2013 Internal Control – Integrated Framework, issued by the Committee of Sponsoring Organizations of the Treadway Commission (“COSO Framework”). Based on our evaluation under the COSO Framework, our management concluded that our internal control over financial reporting was effective as of November 30, 2016.
PricewaterhouseCoopers LLP, the independent registered certified public accounting firm that audited our consolidated financial statements incorporated in this Form 10-K, has also audited the effectiveness of our internal control over financial reporting as of November 30, 2016 as stated in their report, which is shown in Exhibit 13 and is incorporated by reference into this Form 10-K.
C. Changes in Internal Control over Financial Reporting
There have been no changes in our internal control over financial reporting during the quarter ended November 30, 2016 that have materially affected or are reasonably likely to materially affect our internal control over financial reporting.
PART III
Item 10. Directors, Executive Officers and Corporate Governance.
We have adopted a code of ethics that applies to our President and Chief Executive Officer and senior financial officers, including the Chief Financial Officer and Chief Accounting Officer and other persons performing similar functions. Our code of ethics applies to all our other employees as well. This code of ethics is posted on our website, which is located at www.carnivalcorp.com and www.carnivalplc.com. We intend to satisfy the disclosure requirement under Item 10 of Form 8-K regarding any amendments to, or waivers from, any provisions of this code of ethics by posting such information on our website, at the addresses specified above.
The additional information required by Item 10 is incorporated herein by reference to the Carnival Corporation and Carnival plc joint definitive Proxy Statement to be filed with the U.S. Securities and Exchange Commission not later than 120 days after the close of the 2016 fiscal year, except that the information concerning the Carnival Corporation and Carnival plc executive officers called for by Item 401(b) of Regulation S-K is included in Part I of this Form 10-K.
Item 11. Executive Compensation.
The information required by Item 11 is incorporated herein by reference to the Carnival Corporation and Carnival plc joint definitive Proxy Statement to be filed with the U.S. Securities and Exchange Commission not later than 120 days after the close of the 2016 fiscal year.
Item 12. Security Ownership of Certain Beneficial Owners and Management and Related Stockholder Matters.
A. Securities Authorized for Issuance under Equity Compensation Plans
I. Carnival Corporation
Set forth below is a table that summarizes compensation plans (including individual compensation arrangements) under which Carnival Corporation equity securities are authorized for issuance as of November 30, 2016.
48
Plan category | Number of securities to be issued upon exercise of warrants and rights (in millions) | Weighted-average exercise price of outstanding warrants and rights | Number of securities remaining available for future issuance under equity compensation plans (excluding securities reflected in column (1)) (in millions) | ||||
(1) | |||||||
Equity compensation plans approved by security holders | 2.2 | (a) | - | 11.3 | (b) | ||
Equity compensation plans not approved by security holders | - | - | - | ||||
2.2 | - | 11.3 | |||||
(a) | Represents 2.2 million of restricted share units outstanding under the Carnival Corporation 2011 Stock Plan. |
(b) | Includes Carnival Corporation common stock available for issuance as of November 30, 2016 as follows: 2.1 million under the Carnival Corporation Employee Stock Purchase Plan, which includes 35,923 shares subject to purchase during the current purchase period and 9.2 million under the Carnival Corporation 2011 Stock Plan. |
II. Carnival plc
Set forth below is a table that summarizes compensation plans (including individual compensation arrangements) under which Carnival plc equity securities are authorized for issuance as of November 30, 2016.
Plan category | Number of securities to be issued upon exercise of warrants and rights (in millions) | Weighted-average exercise price of outstanding warrants and rights | Number of securities remaining available for future issuance under equity compensation plans (excluding securities reflected in column (1)) (in millions) | |||
(1) | ||||||
Equity compensation plans approved by security holders | 0.7 | (a) | - | 8.1 | ||
Equity compensation plans not approved by security holders | - | - | - | |||
0.7 | - | 8.1 | ||||
(a) | Represents 0.7 million restricted share units outstanding under the Carnival plc 2005 Employee Share Plan and Carnival plc 2014 Employee Share Plan. |
The additional information required by Item 12 is incorporated herein by reference to the Carnival Corporation and Carnival plc joint definitive Proxy Statement to be filed with the U.S. Securities and Exchange Commission not later than 120 days after the close of the 2016 fiscal year.
Items 13 and 14. Certain Relationships and Related Transactions, and Director Independence and Principal Accountant Fees and Services.
The information required by Items 13 and 14 is incorporated herein by reference to the Carnival Corporation and Carnival plc joint definitive Proxy Statement to be filed with the U.S. Securities and Exchange Commission not later than 120 days after the close of the 2016 fiscal year.
PART IV
Item 15. Exhibits and Financial Statement Schedules.
(a) (1) Financial Statements
The financial statements shown in Exhibit 13 are incorporated herein by reference into this Form 10-K.
(2) Financial Statement Schedules
49
All schedules for which provision is made in the applicable accounting regulations of the SEC are not required under the related instruction or are inapplicable and, therefore, have been omitted.
(3) Exhibits
The exhibits listed on the accompanying Index to Exhibits are filed or incorporated by reference as part of this Form 10-K and such Index to Exhibits is hereby incorporated herein by reference.
50
SIGNATURES
Pursuant to the requirements of Section 13 or 15(d) of the Securities Exchange Act of 1934, each of the registrants has duly caused this report to be signed on its behalf by the undersigned thereunto duly authorized.
CARNIVAL CORPORATION | CARNIVAL PLC |
/s/ Arnold W. Donald | /s/ Arnold W. Donald |
President and Chief Executive Officer and | President and Chief Executive Officer and |
Director | Director |
January 30, 2017 | January 30, 2017 |
Pursuant to the requirements of the Securities Exchange Act of 1934, this report has been signed below by the following persons on behalf of each of the registrants and in the capacities and on the dates indicated.
CARNIVAL CORPORATION | CARNIVAL PLC |
/s/ Arnold W. Donald | /s/ Arnold W. Donald |
President and Chief Executive Officer and | President and Chief Executive Officer and |
Director | Director |
January 30, 2017 | January 30, 2017 |
/s/ David Bernstein | /s/ David Bernstein |
David Bernstein | David Bernstein |
Chief Financial Officer and Chief Accounting Officer | Chief Financial Officer and Chief Accounting Officer |
January 30, 2017 | January 30, 2017 |
/s/* Micky Arison | /s/* Micky Arison |
Micky Arison | Micky Arison |
Chairman of the Board of | Chairman of the Board of |
Directors | Directors |
January 30, 2017 | January 30, 2017 |
/s/*Sir Jonathon Band | /s/*Sir Jonathon Band |
Sir Jonathon Band | Sir Jonathon Band |
Director | Director |
January 30, 2017 | January 30, 2017 |
/s/*Helen Deeble | /s/*Helen Deeble |
Helen Deeble | Helen Deeble |
Director | Director |
January 30, 2017 | January 30, 2017 |
/s/*Richard J. Glasier | /s/*Richard J. Glasier |
Richard J. Glasier | Richard J. Glasier |
Director | Director |
January 30, 2017 | January 30, 2017 |
/s/*Debra Kelly-Ennis | /s/*Debra Kelly-Ennis |
Debra Kelly-Ennis | Debra Kelly-Ennis |
Director | Director |
51
January 30, 2017 | January 30, 2017 |
s/*Sir John Parker | s/*Sir John Parker |
Sir John Parker | Sir John Parker |
Director | Director |
January 30, 2017 | January 30, 2017 |
/s/*Stuart Subotnick | /s/*Stuart Subotnick |
Stuart Subotnick | Stuart Subotnick |
Director | Director |
January 30, 2017 | January 30, 2017 |
/s/*Laura Weil | /s/*Laura Weil |
Laura Weil | Laura Weil |
Director | Director |
January 30, 2017 | January 30, 2017 |
/s/*Randall J. Weisenburger | /s/*Randall J. Weisenburger |
Randall J. Weisenburger | Randall J. Weisenburger |
Director | Director |
January 30, 2017 | January 30, 2017 |
*By: /s/ Arnaldo Perez | *By: /s/ Arnaldo Perez |
Arnaldo Perez | Arnaldo Perez |
(Attorney-in-fact) | (Attorney-in-fact) |
January 30, 2017 | January 30, 2017 |
52
INDEX TO EXHIBITS | ||||||||
Incorporated by Reference | ||||||||
Exhibit Number | Exhibit Description | Form | Exhibit | Filing Date | Filed Herewith | |||
Articles of incorporation and by-laws | ||||||||
3.1 | Third Amended and Restated Articles of Incorporation of Carnival Corporation. | 8-K | 3.1 | 4/17/03 | ||||
3.2 | Third Amended and Restated By-Laws of Carnival Corporation. | 8-K | 3.1 | 4/20/09 | ||||
3.3 | Articles of Association of Carnival plc. | 8-K | 3.3 | 4/20/09 | ||||
Instruments defining the rights of security holders, including indenture | ||||||||
4.1 | Agreement of Carnival Corporation and Carnival plc, dated January 22, 2016 to furnish certain debt instruments to the Securities and Exchange Commission. | X | ||||||
4.2 | Carnival Corporation Deed, dated April 17, 2003, between Carnival Corporation and P&O Princess Cruises plc for the benefit of the P&O Princess Shareholders. | 10-Q | 4.1 | 10/15/03 | ||||
4.3 | Equalization and Governance Agreement, dated April 17, 2003, between Carnival Corporation and P&O Princess Cruises plc. | 10-Q | 4.2 | 10/15/03 | ||||
4.4 | Carnival Corporation Deed of Guarantee, dated as of April 17, 2003, between Carnival Corporation and Carnival plc. | S-4 | 4.3 | 5/30/03 | ||||
4.5 | Carnival plc Deed of Guarantee, dated as of April 17, 2003, between Carnival Corporation and Carnival plc. | S-3 & F-3 | 4.10 | 6/19/03 | ||||
4.6 | Specimen Common Stock Certificate. | S-3 & F-3 | 4.16 | 6/19/03 | ||||
4.7 | Pairing Agreement, dated as of April 17, 2003, between Carnival Corporation, The Law Debenture Trust Corporation (Cayman) Limited, as trustee, and Computershare Investor Services (formerly SunTrust Bank), as transfer agent. | 8-K | 4.1 | 4/17/03 | ||||
4.8 | Voting Trust Deed, dated as of April 17, 2003, between Carnival Corporation and The Law Debenture Trust Corporation (Cayman) Limited, as trustee. | 8-K | 4.2 | 4/17/03 | ||||
4.9 | SVE Special Voting Deed, dated as of April 17, 2003, between Carnival Corporation, DLS SVC Limited, P&O Princess Cruises plc, The Law Debenture Trust Corporation (Cayman) Limited, as trustee, and The Law Debenture Trust Corporation, P.L.C. | 8-K | 4.3 | 4/17/03 | ||||
53
INDEX TO EXHIBITS | ||||||||
4.10 | Form of Amended and Restated Deposit Agreement and holders from time to time of receipts issued thereunder. | Post Amend- ment to Form F-6 | 99-a | 4/15/03 | ||||
4.11 | Specimen Ordinary Share Certificate. | S-3 | 4.1 | 7/2/09 | ||||
Material contracts | ||||||||
10.1* | Carnival Corporation Nonqualified Retirement Plan for Highly Compensated Employees. | 10-Q | 10.1 | 9/28/07 | ||||
10.2 | Amendment and Restatement Agreement dated June 16, 2014 in respect of the Multicurrency Revolving Facilities Agreement dated May 18, 2011, among Carnival Corporation, Carnival plc and certain of Carnival Corporation and Carnival plc subsidiaries, Bank of America Merrill Lynch International Limited as facilities agent and a syndicate of financial institutions. | 10-Q | 10.1 | 10/3/14 | ||||
10.3* | Carnival Corporation “Fun Ship” Nonqualified Savings Plan. | 10-K | 10.6 | 2/27/98 | ||||
10.4* | Amendment to the Carnival Corporation Nonqualified Retirement Plan for Highly Compensated Employees. | 10-Q | 10.1 | 3/30/07 | ||||
10.5* | Carnival Cruise Lines, Inc. Non-Qualified Retirement Plan. | 10-K | 10.4 | 2/22/91 | ||||
10.6* | Consulting Agreement/ Registration Rights Agreement, dated June 14, 1991, between Carnival Corporation and Ted Arison. | S-3A | 4.3 | 7/16/91 | ||||
10.7* | First Amendment to Consulting Agreement/ Registration Rights Agreement between Carnival Corporation and Ted Arison. | 10-K | 10.40 | 2/25/93 | ||||
10.8* | Form of Appointment Letter for Non-Executive Directors. | 10-Q | 10.1 | 6/27/08 | ||||
10.9* | Form of Appointment Letter for Executive Directors. | 10-Q | 10.2 | 6/27/08 | ||||
10.10* | Amended and Restated Carnival plc 2005 Employee Share Plan. | 10-Q | 10.1 | 4/2/09 | ||||
10.11* | Amendment to the Carnival Corporation “Fun Ship” Nonqualified Savings Plan. | 10-K | 10.33 | 2/28/00 | ||||
10.12* | Amendment to the Carnival Corporation “Fun Ship” Nonqualified Savings Plan. | 10-Q | 10.2 | 3/30/07 | ||||
10.13* | Amendment to the Carnival Corporation “Fun Ship” Nonqualified Savings Plan. | 10-K | 10.34 | 2/28/01 | ||||
54
INDEX TO EXHIBITS | ||||||||
10.14* | Amendment to the Carnival Corporation “Fun Ship” Nonqualified Savings Plan. | 10-K | 10.37 | 2/28/02 | ||||
10.15 | Succession Agreement, dated as of May 28, 2002, to Registration Rights Agreement, dated June 14, 1991, between Carnival Corporation and Ted Arison. | 10-Q | 10.2 | 7/12/02 | ||||
10.16* | Amendment to the Carnival Corporation Nonqualified Retirement Plan For Highly Compensated Employees. | 10-Q | 10.1 | 3/28/06 | ||||
10.17* | Amendment of the Carnival Corporation “Fun Ship” Nonqualified Savings Plan. | 10-Q | 10.1 | 4/14/03 | ||||
10.18* | Amendment of the Carnival Corporation Nonqualified Retirement Plan For Highly Compensated Employees. | 10-Q | 10.2 | 4/14/03 | ||||
10.19* | Amendment to the Carnival Corporation Nonqualified Retirement Plan for Highly Compensated Employees. | 10-Q | 10.2 | 4/8/04 | ||||
10.20* | Amendment to the Carnival Corporation “Fun Ship” Nonqualified Savings Plan. | 10-Q | 10.3 | 4/8/04 | ||||
10.21* | Amendment to the Carnival Corporation “Fun Ship” Nonqualified Savings Plan. | 10-Q | 10.1 | 4/7/05 | ||||
10.22* | Carnival Corporation 2011 Stock Plan Non-Employee Director Restricted Stock Award Agreement. | 10-Q | 10.3 | 7/1/11 | ||||
10.23* | Amended and Restated Carnival Corporation 2011 Stock Plan. | X | ||||||
10.24* | Amended and Restated Executive Long-term Compensation Agreement, dated January 15, 2008, between Carnival Corporation and Micky Arison. | 10-Q | 10.2 | 3/28/08 | ||||
10.25* | Amendment to the Carnival Corporation Nonqualified Retirement Plan for Highly Compensated Employees. | 10-Q | 10.7 | 4/2/09 | ||||
10.26* | Amendment to the Carnival Corporation “Fun Ship” Nonqualified Savings Plan. | 10-Q | 10.8 | 4/2/09 | ||||
10.27* | Amendment to the Carnival Corporation “Fun Ship” Nonqualified Savings Plan. | 10-Q | 10.1 | 4/1/10 | ||||
10.28* | Amendment to the Carnival Corporation “Fun Ship” Nonqualified Savings Plan. | 10-Q | 10.3 | 4/1/10 | ||||
10.29* | Amendment to the Carnival Corporation “Fun Ship” Nonqualified Savings Plan. | 10-Q | 10.1 | 7/1/10 | ||||
10.30* | Form of Executive Restricted Stock Agreement for Executives with Executive Long-term Compensation Agreements for Carnival Corporation 2011 Stock Plan. | 10-Q | 10.1 | 3/30/12 | ||||
55
INDEX TO EXHIBITS | ||||||||
10.31* | Form of Executive Restricted Stock Agreement for the Carnival Corporation 2011 Stock Plan. | 10-Q | 10.2 | 3/30/12 | ||||
10.32* | Employment Agreement dated as of October 14, 2013 between Carnival Corporation, Carnival plc and Arnold W. Donald. | 10-Q | 10.2 | 10/3/14 | ||||
10.33* | Employment Contract between Costa Crociere S.p.A and Michael Olaf Thamm effective June 30, 2012. | 10-Q | 10.1 | 4/2/14 | ||||
10.34* | Addendum to Employment Contract between Costa Crociere S.p.A and Michael Olaf Thamm effective January 24, 2013. | 10-Q | 10.2 | 4/2/14 | ||||
10.35* | Form of Performance-Based Restricted Stock Unit Agreement for Special Executive Award for the Carnival Corporation 2011 Stock Plan. | 10-Q | 10.3 | 4/2/14 | ||||
10.36* | Form of Performance-Based Restricted Stock Unit Agreement for Special Executive Award for the Carnival plc 2005 Employee Share Plan. | 10-Q | 10.4 | 4/2/14 | ||||
10.37* | Form of Performance-Based Restricted Stock Unit Agreement for the Carnival Corporation 2011 Stock Plan. | 10-Q | 10.1 | 7/2/14 | ||||
10.38* | Form of Performance-Based Restricted Stock Unit Agreement for the Carnival plc 2005 Employee Share Plan. | 10-Q | 10.2 | 7/2/14 | ||||
10.39* | Amended and Restated Carnival plc 2014 Employee Share Plan. | X | ||||||
10.40* | Form of Performance-Based Restricted Stock Unit Agreement for the Carnival Corporation 2011 Stock Plan. | 10-Q | 10.1 | 7/1/15 | ||||
10.41* | Form of Performance-Based Restricted Stock Unit Agreement for the Carnival plc 2014 Employee Share Plan. | 10-Q | 10.2 | 7/1/15 | ||||
10.42* | Carnival Corporation & plc Management Incentive Plan (adopted in 2015). | 10-Q | 10.3 | 7/1/15 | ||||
10.43* | Addendum to Employment Contract between Costa Crociere S.p.A and Michael Olaf Thamm effective November 24, 2014. | 10-Q | 10.1 | 10/2/2015 | ||||
56
INDEX TO EXHIBITS | ||||||||
10.44* | Amendment to Facilities Agreement dated May 18, 2016 among Carnival Corporation, Carnival plc and certain of Carnival Corporation and Carnival plc subsidiaries, Bank of America Merrill Lynch International Limited, as facilities agent, and KfW IPEX-Bank GmbH, Bayerische Landesbank, New York Branch and DZ BANK AG, Deutsche Zentral Genossenschaftsbank, Frankfurt am Main, New York Branch, as new lenders. | 10-Q | 10.1 | 7/1/16 | ||||
10.45* | Form of Executive Restricted Share Unit Award Certificate for the Carnival plc 2005 Employee Share Plan. | 10-Q | 10.2 | 7/1/16 | ||||
10.46* | Form of Executive Restricted Share Unit Award Certificate for the Carnival plc 2014 Employee Share Plan. | 10-Q | 10.3 | 7/1/16 | ||||
10.47* | Form of Executive Restricted Stock Agreement for the Carnival Corporation 2011 Stock Plan. | 10-Q | 10.4 | 7/1/16 | ||||
10.48* | Amendment dated October 18, 2016 to Employment Agreement dated October 14, 2016 between Carnival Corporation, Carnival plc and Arnold W. Donald. | 8-K | 99.1 | 10/21/16 | ||||
Statements regarding computations of ratios | ||||||||
12 | Ratio of Earnings to Fixed Charges. | X | ||||||
Annual report to security holders | ||||||||
13 | Portions of 2016 Annual Report. | X | ||||||
Subsidiaries of the registrants | ||||||||
21 | Subsidiaries of Carnival Corporation and Carnival plc. | X | ||||||
Consents of experts and counsel | ||||||||
23 | Consent of Independent Registered Certified Public Accounting Firm. | X | ||||||
Power of attorney | ||||||||
24 | Powers of Attorney given by certain Directors of Carnival Corporation and Carnival plc to Arnold W. Donald, David Bernstein and Arnaldo Perez authorizing such persons to sign this 2016 joint Annual Report on Form 10-K and any future amendments on their behalf. | X | ||||||
57
INDEX TO EXHIBITS | ||||||||
Rule 13a-14(a)/15d-14(a) certifications | ||||||||
31.1 | Certification of President and Chief Executive Officer of Carnival Corporation pursuant to Rule 13a-14(a), as adopted pursuant to Section 302 of the Sarbanes-Oxley Act of 2002. | X | ||||||
31.2 | Certification of Chief Financial Officer and Chief Accounting Officer of Carnival Corporation pursuant to Rule 13a-14(a), as adopted pursuant to Section 302 of the Sarbanes-Oxley Act of 2002. | X | ||||||
31.3 | Certification of President and Chief Executive Officer of Carnival plc pursuant to Rule 13a-14(a), as adopted pursuant to Section 302 of the Sarbanes-Oxley Act of 2002. | X | ||||||
31.4 | Certification of Chief Financial Officer and Chief Accounting Officer of Carnival plc pursuant to Rule 13a-14(a), as adopted pursuant to Section 302 of the Sarbanes-Oxley Act of 2002. | X | ||||||
Section 1350 certifications | ||||||||
32.1** | Certification of President and Chief Executive Officer of Carnival Corporation pursuant to 18 U.S.C. Section 1350, as adopted pursuant to Section 906 of the Sarbanes-Oxley Act of 2002. | X | ||||||
32.2** | Certification of Chief Financial Officer and Chief Accounting Officer of Carnival Corporation pursuant to 18 U.S.C. Section 1350, as adopted pursuant to Section 906 of the Sarbanes-Oxley Act of 2002. | X | ||||||
32.3** | Certification of President and Chief Executive Officer of Carnival plc pursuant to 18 U.S.C. Section 1350, as adopted pursuant to Section 906 of the Sarbanes-Oxley Act of 2002. | X | ||||||
32.4** | Certification of Chief Financial Officer and Chief Accounting Officer of Carnival plc pursuant to 18 U.S.C. Section 1350, as adopted pursuant to Section 906 of the Sarbanes-Oxley Act of 2002. | X | ||||||
Interactive data file | ||||||||
101 | The consolidated financial statements from Carnival Corporation & plc’s Form 10-K for the year ended November 30, 2016, as filed with the SEC on January 30, 2017 formatted in XBRL, are as follows: | |||||||
(i) the Consolidated Statements of Income for the years ended November 30, 2016, 2015 and 2014; | X | |||||||
(ii) the Consolidated Statements of Comprehensive Income for the years ended November 30, 2016, 2015 and 2014; | X | |||||||
(iii) the Consolidated Balance Sheets at November 30, 2016 and 2015; | X | |||||||
58
INDEX TO EXHIBITS | ||||||||
(iv) the Consolidated Statements of Cash Flows for the years ended November 30, 2016, 2015 and 2014; | X | |||||||
(v) the Consolidated Statements of Shareholders’ Equity for the years ended November 30, 2016, 2015 and 2014 and | X | |||||||
(vi) the notes to the consolidated financial statements, tagged in summary and detail. | X | |||||||
*Indicates a management contract or compensation plan or arrangement.
**These items are furnished and not filed.
59